Introduction
In the realm of data analytics, Power BI emerges as a transformative tool, empowering organizations to harness the full potential of their data. With its diverse range of data sources—from file-based imports to robust cloud integrations—Power BI not only facilitates seamless data management but also addresses the common challenges faced by businesses in today’s data-driven landscape.
Understanding the various types of data sources available is essential for unlocking deeper insights and driving operational efficiency. This article delves into the intricacies of connecting and integrating data within Power BI, offering practical guidance and strategies for maximizing its capabilities.
By exploring the distinctions between Power BI Desktop and Service, the advantages of cloud data integration, and the process of combining multiple data sources, organizations can pave the way for informed decision-making and sustainable growth.
Exploring the Types of Data Sources in Power BI
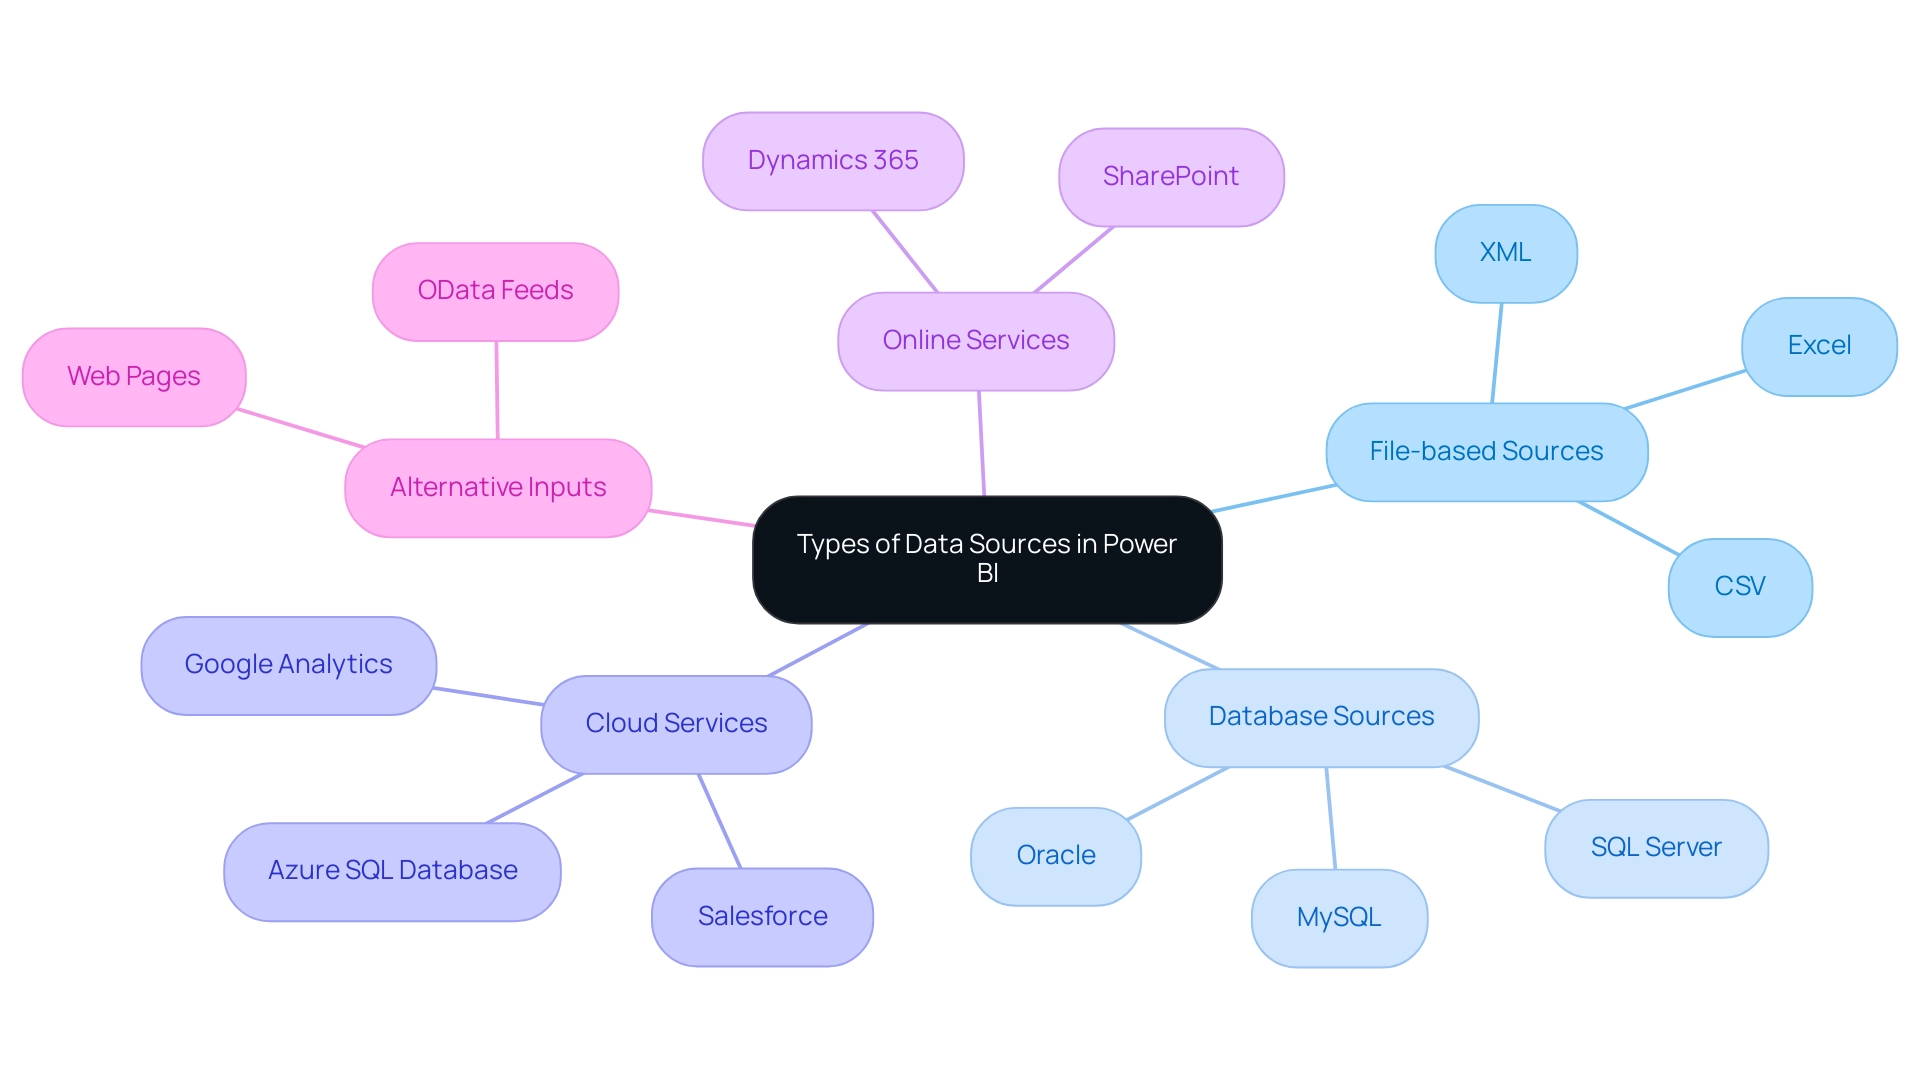
BI provides a varied selection of sources that can be categorized into separate groups, each fulfilling unique analytical requirements while tackling common issues encountered in management:
-
File-based Sources: Users can effortlessly import information from formats such as Excel, CSV, and XML files, allowing for quick integration and analysis of familiar datasets, thereby reducing the time spent on report creation.
-
Database Sources: Power BI seamlessly connects to major databases including SQL Server, Oracle, and MySQL. This capability allows individuals to retrieve information directly from their current database systems, facilitating real-time analysis and reporting.
The effectiveness of this connection is emphasized by the usual report opening time, which aligns with the 50th percentile of the duration required to open the report, showcasing the rapidity at which individuals can access their information and minimizing discrepancies across different reports.
-
Cloud Services: Integration with cloud-based platforms like Azure SQL Database, Salesforce, and Google Analytics enables individuals to leverage the capabilities of cloud information, improving accessibility and collaboration, while also offering clear, actionable insights that promote informed decision-making.
-
Online Services: The tool connects to multiple online services, such as SharePoint and Dynamics 365, thereby offering individuals extensive access to their organizational information stored in these platforms.
-
Alternative Inputs: The adaptability of BI extends to extra inputs such as OData feeds and web pages, expanding the range of integration choices accessible to users. As organizations increasingly embrace BI, understanding the range of data sources for Power BI is crucial for maximizing its full potential in analytics. However, organizations utilizing Private Links may encounter restrictions with report usage metrics, as these metrics will contain no information due to challenges in transferring client details, illustrating the real-world implications of source limitations.
Moreover, the effectiveness of BI reporting can be impacted by governance issues, which can lead to inconsistencies and confusion among stakeholders. By implementing robust governance strategies, organizations can ensure information integrity and reliability in their reports.
By embracing Business Intelligence and RPA solutions, such as EMMA RPA and Microsoft’s Automate, organizations can automate repetitive tasks, improve efficiency, and specifically address challenges like report creation and information inconsistencies. These tools not only streamline operations but also improve the overall quality of insights obtained from information, ultimately leading to enhanced operational effectiveness and growth.
Understanding Data Source Differences: Power BI Desktop vs. Service
BI functions within two separate environments: BI Desktop and BI Service, both providing unique features for handling information crucial for generating insights and enhancing operational efficiency.
-
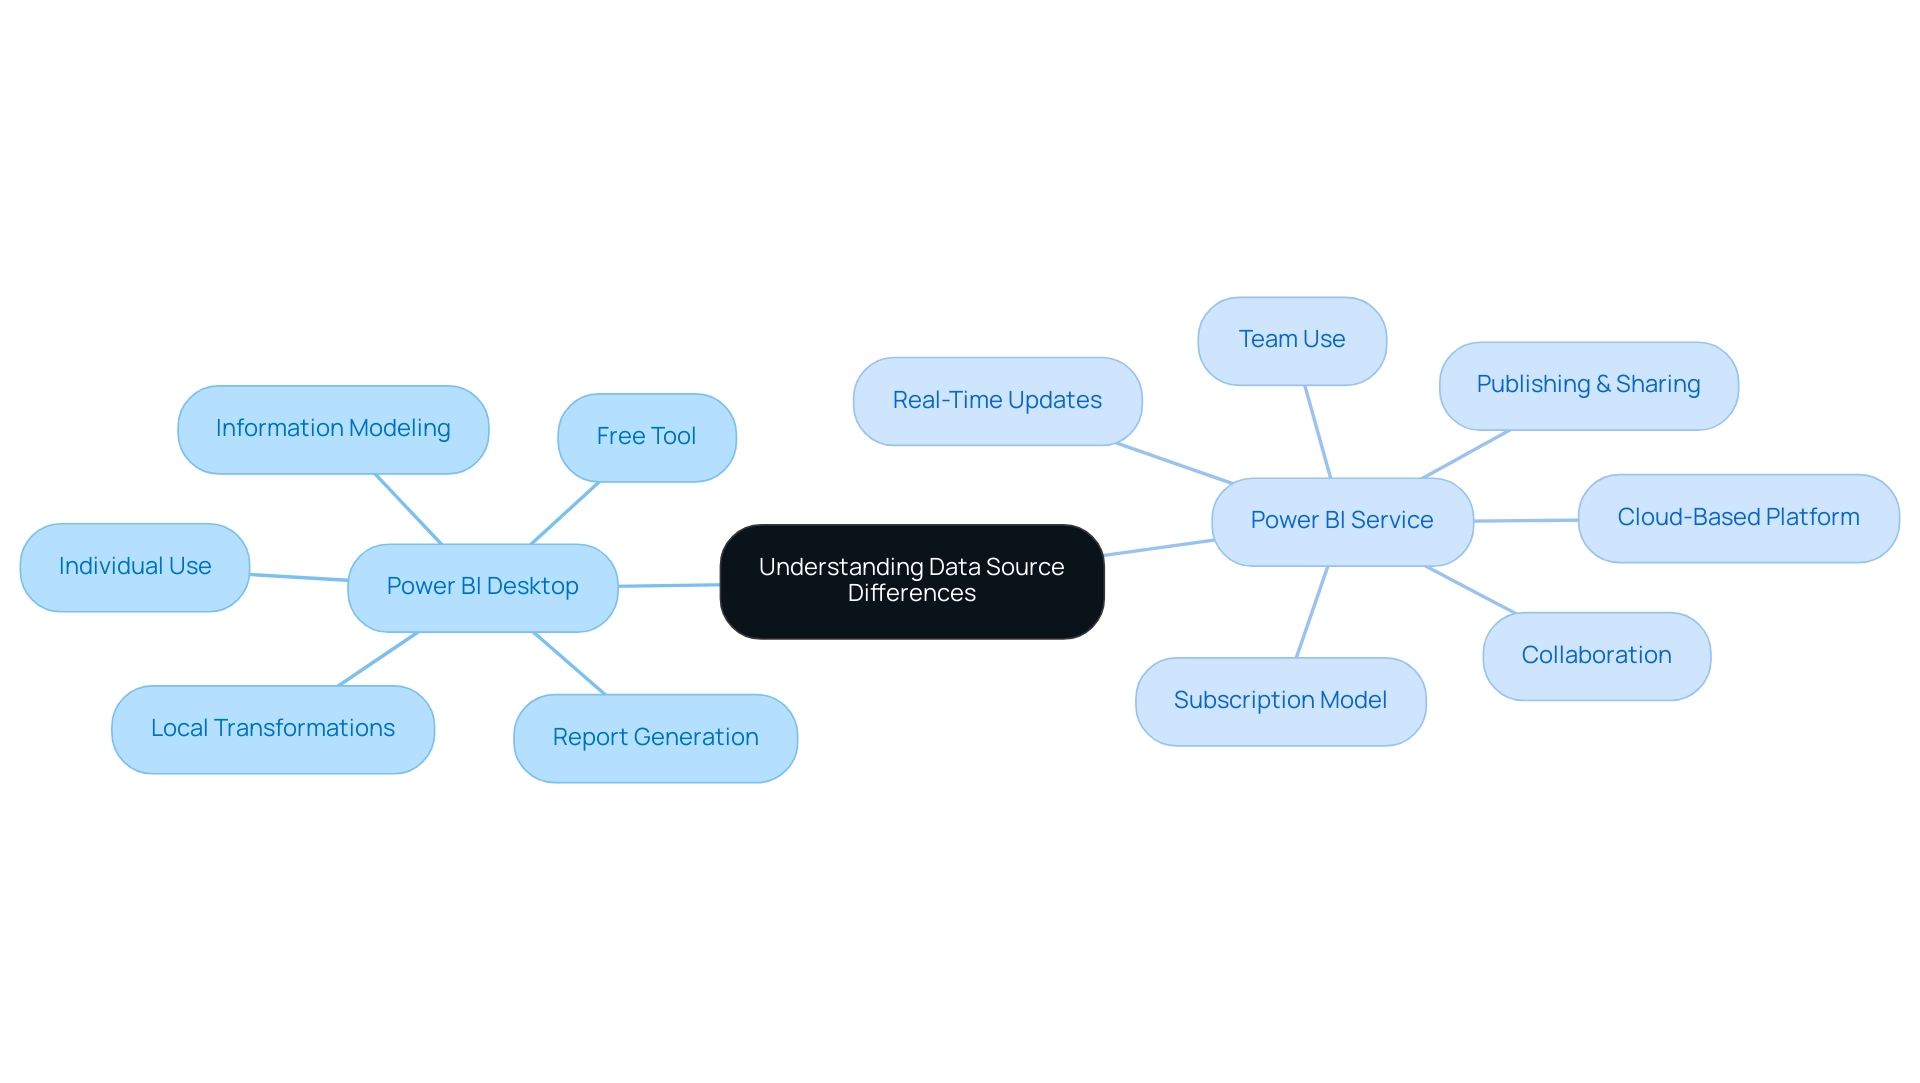
BI Desktop acts as a robust tool for information modeling and report generation. It enables individuals to connect to a diverse array of data sources for Power BI, perform transformations, and construct detailed visual reports locally.
This environment excels in development and testing phases, providing the flexibility needed for in-depth analysis. Importantly, BI Desktop is a free tool, making it accessible for individual users and small teams looking to overcome challenges such as time-consuming report creation and the lack of actionable insights. -
Power BI Service, on the other hand, is a robust cloud-based platform designed for publishing and sharing reports and dashboards.
While it also supports a variety of data sources for Power BI, its primary focus is on enhancing collaboration and facilitating real-time updates. Users can seamlessly connect to cloud-based sources, ensuring that teams have access to the most current data, addressing issues like data inconsistencies. However, the BI Service has a free version with limitations, while advanced features are available in Pro and Premium versions for a subscription fee.
Understanding the distinctions between these two environments is crucial. As Bhakti Shete aptly puts it,
In conclusion, Power BI Desktop and Power BI Service are two sides of the same coin, each with its unique strengths. Comprehending when to utilize which tool is essential for unlocking the full potential of your journey.
Additionally, integrating RPA solutions can further enhance operational efficiency by automating repetitive tasks associated with information management. The case study titled ‘Difference between BI Desktop and Service’ highlights these core differences, emphasizing that BI Desktop is designed for detailed report creation and individual use, while BI Service is built for online collaboration and sharing within teams. By utilizing the unique characteristics of each platform and incorporating RPA, individuals can optimize their analytics workflows, drive informed decision-making, and ultimately enhance business growth.
Integrating Cloud Data Sources with Power BI
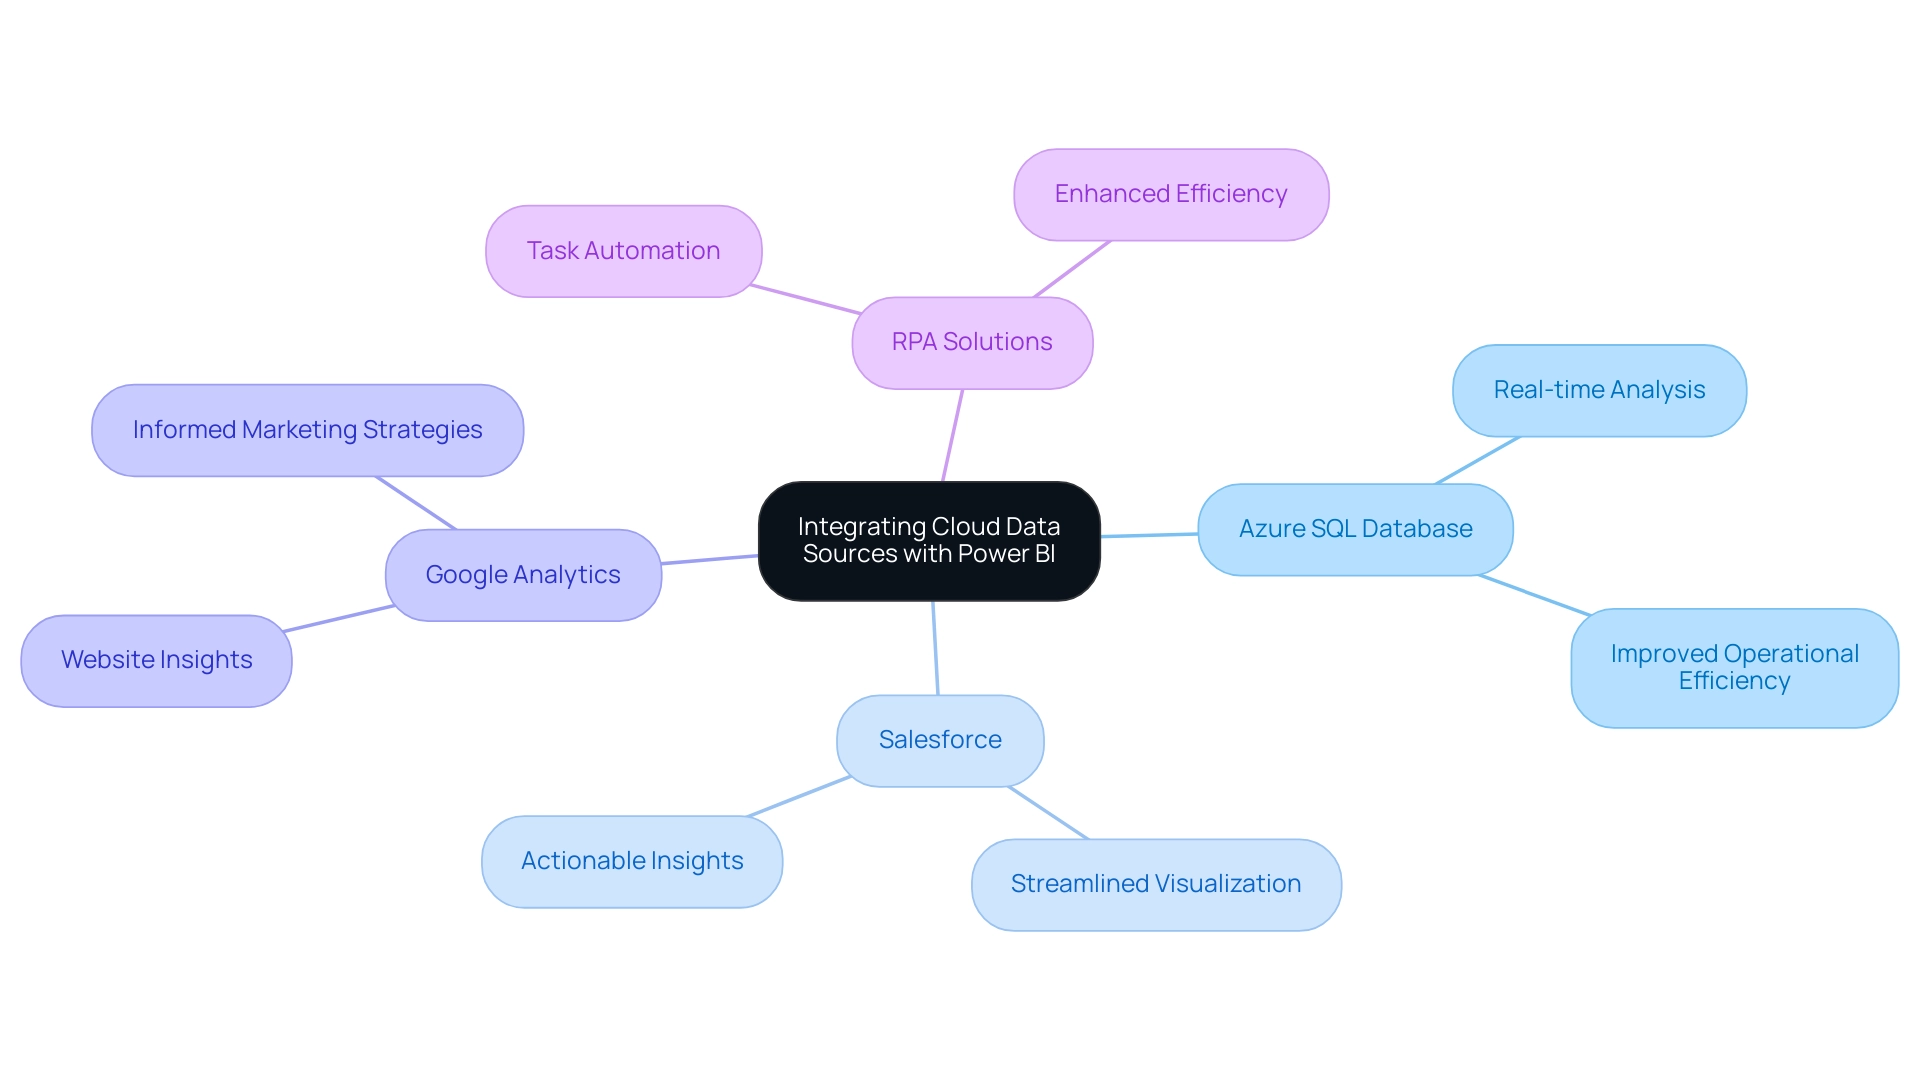
Integrating cloud data sources for Power BI offers numerous benefits, especially regarding scalability and accessibility. With popular cloud platforms such as Azure SQL Database, Salesforce, and Google Analytics, individuals can effortlessly connect and utilize their information for enhanced analytics. Significantly, SwiftCart announced a 20% rise in customer satisfaction following the incorporation of these cloud solutions, emphasizing the concrete advantages of such integrations.
- Connecting to Azure SQL Database: Creating direct queries to Azure databases enables real-time information analysis, ensuring that decision-makers have access to the most current insights at their fingertips. This capability greatly improves operational efficiency by enabling timely insights, which are vital for driving growth.
- Salesforce Integration: Power BI’s built-in connectors for Salesforce streamline the visualization of CRM information, empowering individuals to transform complex datasets into clear, actionable insights, thus addressing common challenges in report creation and information inconsistencies.
- Google Analytics: By integrating Google Analytics, individuals gain valuable insights into website performance and behavior, information that can inform marketing and operational strategies, optimizing workflows further.
The synergistic approach to integrating these cloud sources not only simplifies access but also enriches the overall analytics experience. As noted by Himanshu Gautam, the self-service features of BI democratize analysis, enabling business users to swiftly access, explore, and uncover insights without relying heavily on IT or analysts. This quote underscores the importance of self-service in leveraging data effectively.
Moreover, the integration of RPA solutions, such as EMMA RPA and Automate, addresses task repetition fatigue and outdated systems, streamlining operations and enhancing efficiency. Automate complements this by providing a risk-free ROI assessment and ensuring professional execution. The compatibility of Power BI with various data sources for Power BI and its cloud integration capabilities enable it to scale with business requirements, as demonstrated in the case study titled ‘Integration and Scalability.’
This integration ultimately enhances decision-making processes, allowing businesses to adapt and thrive in a dynamic market landscape. The absence of effective data-driven insights can place a business at a competitive disadvantage, making the integration of BI and RPA not just beneficial but essential for sustained growth.
Connecting Data Sources to Power BI: A Step-by-Step Guide
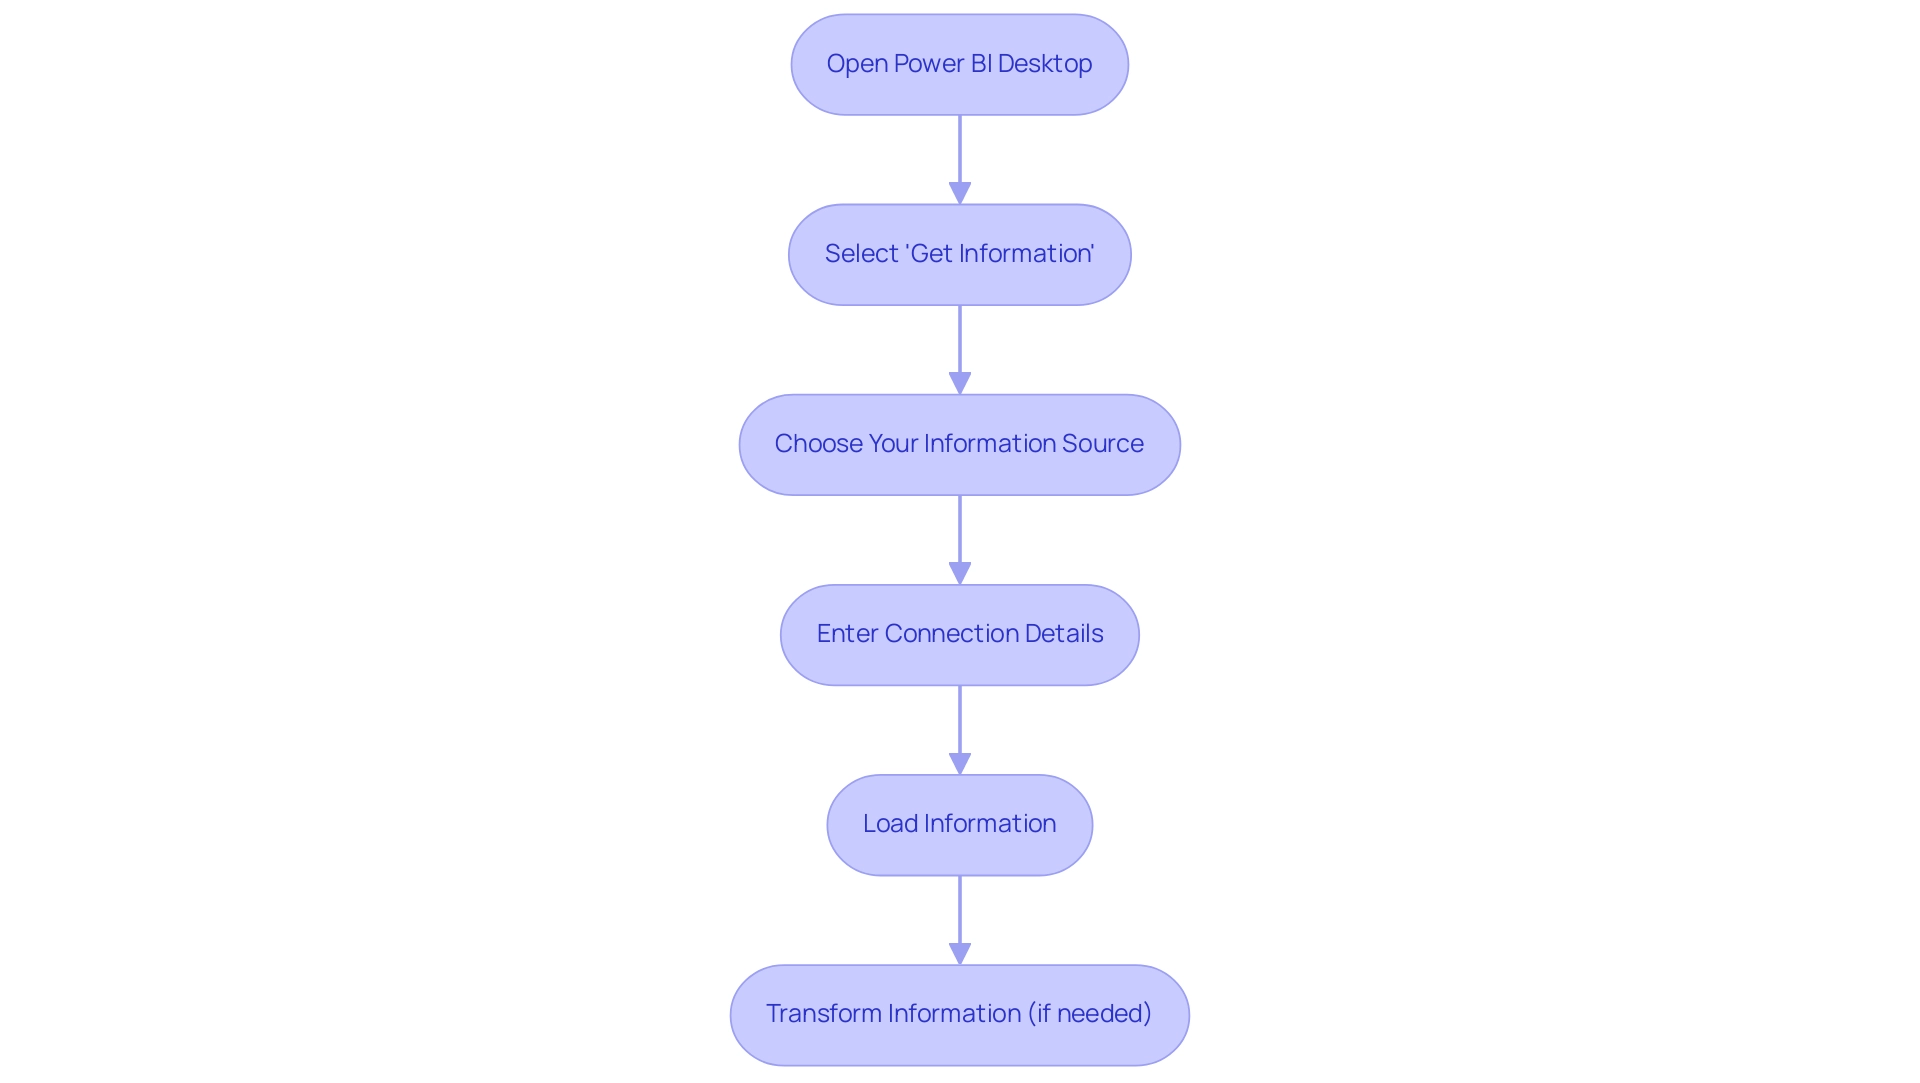
Linking information repositories to Business Intelligence is a simplified procedure that enables users to utilize their information efficiently, essential for fostering informed decision-making and operational effectiveness. Here’s a step-by-step guide to get you started:
- Open Power BI Desktop: Begin by launching Power BI Desktop on your device.
- Select ‘Get Information’: Navigate to the ‘Home’ tab and click on ‘Get Information’ to explore the variety of available information options.
- Choose Your Information Source: Select the appropriate source type from the options provided, whether it’s Excel, SQL Server, or another compatible format.
- Enter Connection Details: For database connections, input the required server name and database credentials to establish the link.
- Load Information: Once the connection is established, select the specific tables or datasets you wish to import and click ‘Load’ to bring the information into BI.
- Transform Information (if needed): Utilize the Query Editor for any necessary transformations before finalizing the load.
Following these steps allows you to effectively connect your data sources for Power BI, enabling meaningful analytics through BI. The user-friendly interface is designed to generate reports with minimal technical expertise, addressing usability concerns effectively. As highlighted by the DataCamp Team,
Learn the basics of BI and how to create a basic report with this step-by-step tutorial.
Furthermore, utilizing BI effectively can contribute to achieving a profit margin target of 0.15, demonstrating its value in business analytics. This approach fosters confidence among users and encourages experimentation with datasets, as illustrated in the case study titled “Realize the Potential of BI,” which emphasizes mastering the tool for impactful reporting.
Alongside utilizing BI, incorporating Robotic Process Automation (RPA) solutions can significantly improve operational efficiency by automating repetitive tasks and tackling issues such as task repetition fatigue and staffing shortages. Tailored AI solutions can also help navigate the overwhelming landscape of AI options, ensuring that businesses can identify technologies that align with their specific goals. Embracing BI and RPA can mitigate common challenges, transforming raw information into actionable insights that drive growth and innovation.
Combining Data from Multiple Sources in Power BI
This tool distinguishes itself as a robust resource for combining information from various sources, an essential capability for attaining thorough analysis. Users can seamlessly integrate information from different databases, cloud services, and file formats to construct a unified dataset that enhances their analytical capabilities.
-
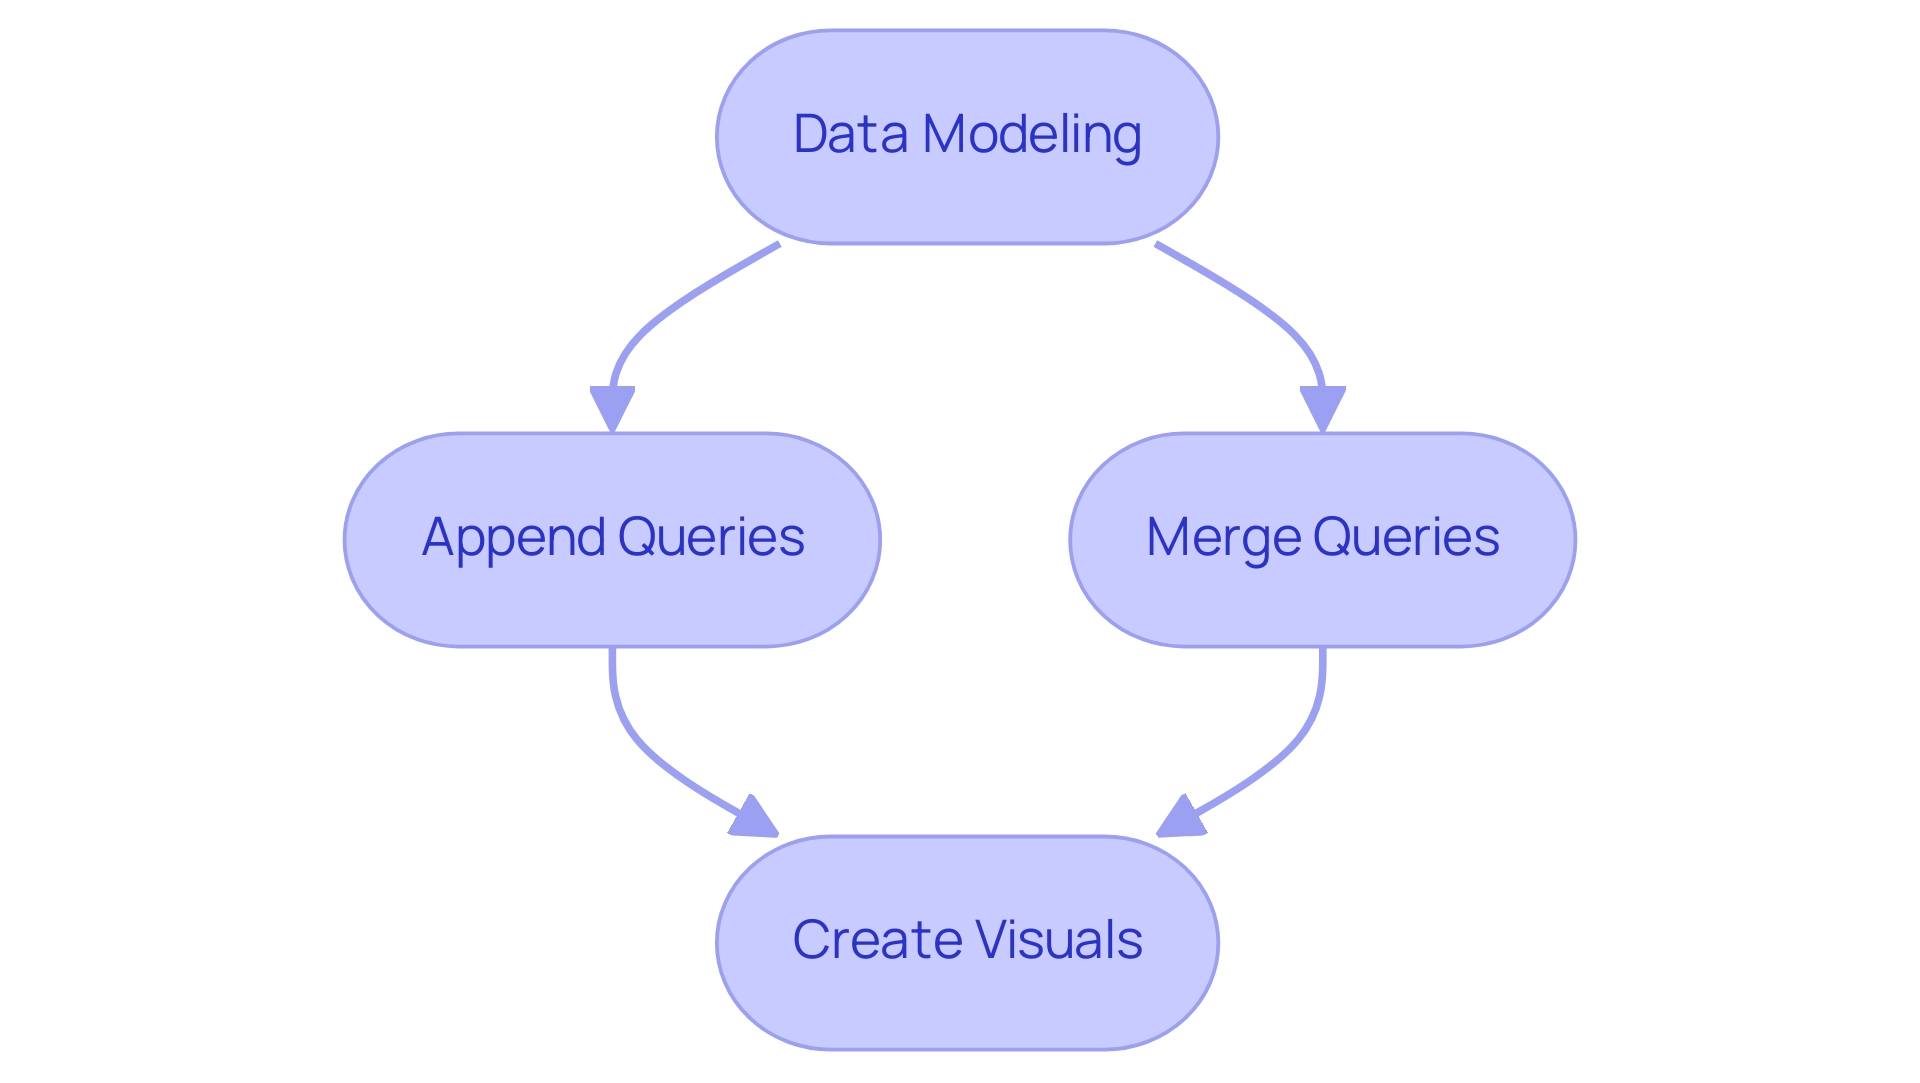
Data Modeling: Within Power BI, individuals can create relationships between disparate tables, enabling intricate queries and dynamic visualizations that reveal nuanced insights.
-
Append Queries: This feature enables individuals to merge information from similar origins, such as various Excel files, leading to a thorough overview that enhances information integrity.
-
Merge Queries: By utilizing this functionality, individuals can combine information from distinct sources based on shared fields, enhancing their datasets for deeper analysis. The capacity to effectively amalgamate data from diverse origins empowers individuals to unearth profound insights and make more informed decisions.
Eyelyn Qin from Community Support highlights a practical approach:
One way to work around, creating dashboard could combine different visuals from different reports.
This capability not only streamlines reporting but also enhances the overall analytical experience. Additionally, users can create visuals in three different workspaces and save copies to a fourth workspace, showcasing the flexibility of BI in managing complex datasets.
Recent advancements, including the incorporation of Python and R scripts into Power BI, further augment its analytics potential. These scripts enable advanced analytics for predictive decision-making and comprehensive risk assessments, allowing organizations to utilize information more effectively. As demonstrated by a Fortune 500 company that utilized Match Enterprise to expedite its merger process—completing it two months ahead of schedule—effective information management is paramount for organizational success.
Furthermore, after importing and shaping the information, users can create a new custom score column by averaging various factors such as quality of life, cost of housing, and public health, illustrating a specific application of modeling that enhances decision-making.
For those looking to enhance their data reporting capabilities, our Power BI services, including the 3-Day Power BI Sprint for rapid report creation and the General Management App for comprehensive management, are designed to provide clear, actionable insights that drive growth and operational efficiency. Additionally, explore our Actions portfolio and book a free consultation to discover how we can further support your data-driven initiatives.
Addressing the challenges of data-driven insights is crucial, and our RPA solutions can help automate repetitive tasks, improving operational efficiency and employee morale.
Conclusion
Power BI is a vital tool for organizations aiming to leverage their data effectively, offering diverse data sources that enhance operational efficiency and decision-making.
Recognizing the distinct roles of Power BI Desktop and Power BI Service is essential. Power BI Desktop is ideal for detailed analysis and report creation, while Power BI Service facilitates collaboration and real-time data access. Utilizing both environments allows organizations to optimize their data strategies and provide teams with timely insights.
Integrating cloud data sources such as Azure SQL Database, Salesforce, and Google Analytics further enhances Power BI’s capabilities, providing essential scalability and accessibility. This integration leads to actionable insights that can drive improvements in customer satisfaction and overall business performance.
The straightforward process of connecting data sources to Power BI empowers users of all technical levels, while the ability to merge data from multiple sources creates a comprehensive view that informs strategic decisions.
In conclusion, embracing Power BI not only streamlines data management but also equips organizations to excel in a competitive landscape. By leveraging its features and incorporating RPA solutions, businesses can transform raw data into valuable insights, fostering growth and operational effectiveness. Adopting Power BI is a strategic move toward achieving data mastery in today’s data-driven world.

