Overview:
To effectively sort by month in Power BI, users should prepare their data by creating a month column and a corresponding period number column, then utilize these for accurate sorting in visualizations. The article outlines a step-by-step process, emphasizing the importance of proper data formatting and DAX formulas to ensure that the month names are displayed in the correct chronological order, thereby enhancing clarity and operational efficiency in reports.
Introduction
In the world of data analysis, mastering the art of sorting by month in Power BI is not just a technical skill; it is a strategic advantage that can transform the way organizations interpret and utilize their data.
As businesses increasingly rely on timely insights to inform decision-making, the ability to effectively organize data chronologically becomes paramount.
This article delves into essential steps, innovative techniques, and best practices that empower users to navigate month sorting challenges with confidence.
By implementing these strategies, organizations can enhance their reporting capabilities, streamline operations, and ultimately drive better outcomes in an ever-evolving data landscape.
Essential Steps for Sorting by Month in Power BI
A crucial skill for effective analysis in Power BI is the ability to sort by month, especially considering that it can take up to 24 hours for new usage statistics to be imported. This emphasizes the critical need for timely information analysis when sorting and reporting. Here are the steps you need to follow to implement this technique seamlessly:
-
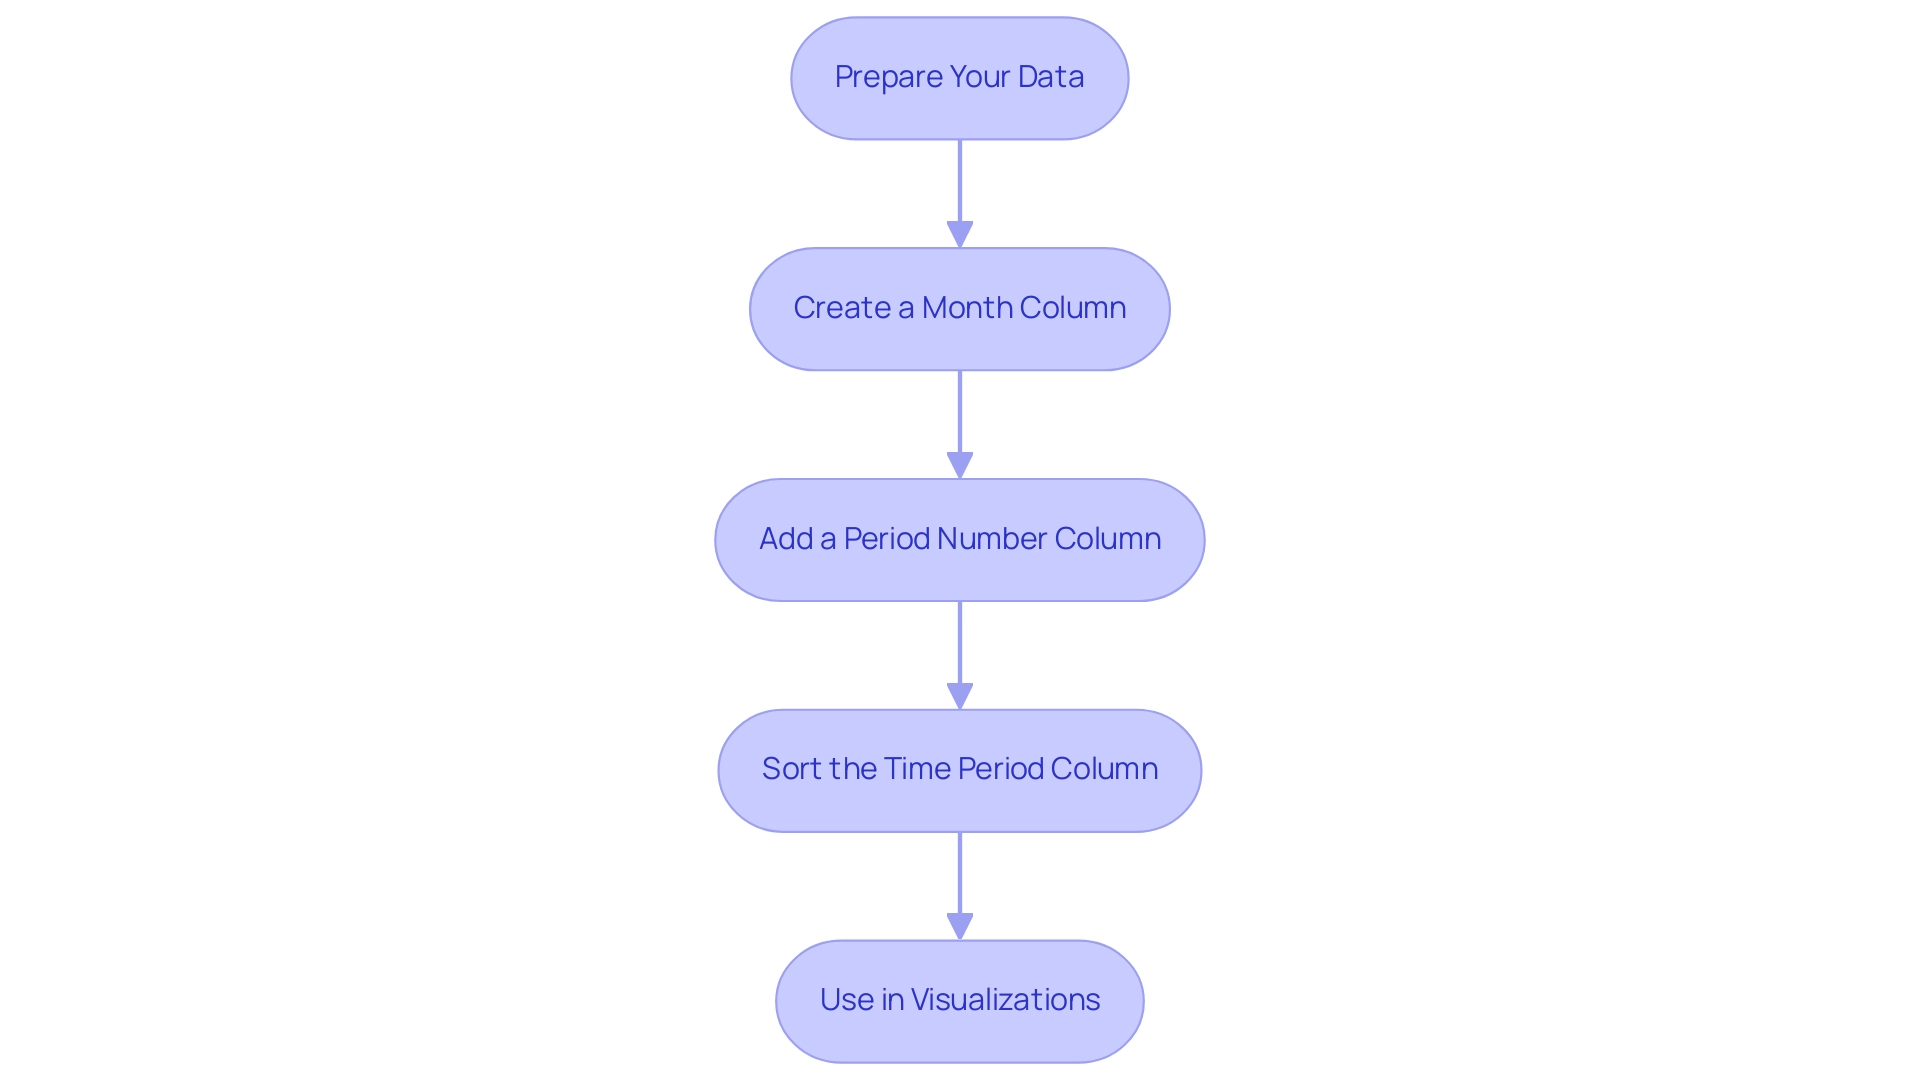
Prepare Your Data: Start by ensuring that your dataset includes a date column. If your data isn’t already formatted as a date, you can convert it using Power Query for optimal compatibility.
-
Create a Month Column: In Power BI, extract the month from your date by creating a new column with the DAX formula:
Month = FORMAT([Your Date Column], "MMMM"). This will produce complete names for each period, enhancing report readability. -
Add a Period Number Column: Establish a period number column for correct sorting with the DAX formula:
PeriodNumber = MONTH([YourDateColumn]). This assigns numerical values to each month—1 for January, 2 for February, and so on. -
Sort the Time Period Column: Select your time period column, navigate to the ‘Modeling’ tab, and click on ‘Sort by Column’. Select the number column for the period to guarantee your names are properly ordered.
-
Use in Visualizations: Finally, include the month column in your documents and visualizations. By utilizing this arrangement technique in Power BI sort by month, your information will present in sequential order, greatly improving the clarity and efficiency of your documents. As Nikola insightfully remarked,
Therefore, I believe that having documents similar to this one can help you better understand who, when, and how to run your analysis.
This highlights the significance of precise information representation, especially regarding Jerry Brown’s question about obtaining logs for establishing queries, which can be essential for diagnosing issues and enhancing information organization procedures.
Additionally, consider the case study on unused documents, which counts items that have not been opened over a specified time period. Recognizing unused documents can guide decisions on maintenance and relevance, further demonstrating the practical implications of efficient information sorting. By mastering these techniques, you not only enhance your analysis capabilities but also drive better decision-making within your team, leveraging the full potential of Business Intelligence to support your operational efficiency.
Additionally, incorporating RPA solutions can automate repetitive tasks in report generation, tackling the challenges of time-consuming report creation and inconsistencies, thereby improving overall operational efficiency.

Techniques and Code Snippets for Month Sorting in Power BI
Improving time categorization features in Power BI sort by month is essential for enhancing your analysis and reporting procedures, especially in an environment where insight-driven knowledge is critical for operational efficiency and business expansion. By implementing the following techniques, you can not only enhance your reporting but also address the competitive disadvantages that arise from a lack of actionable insights:
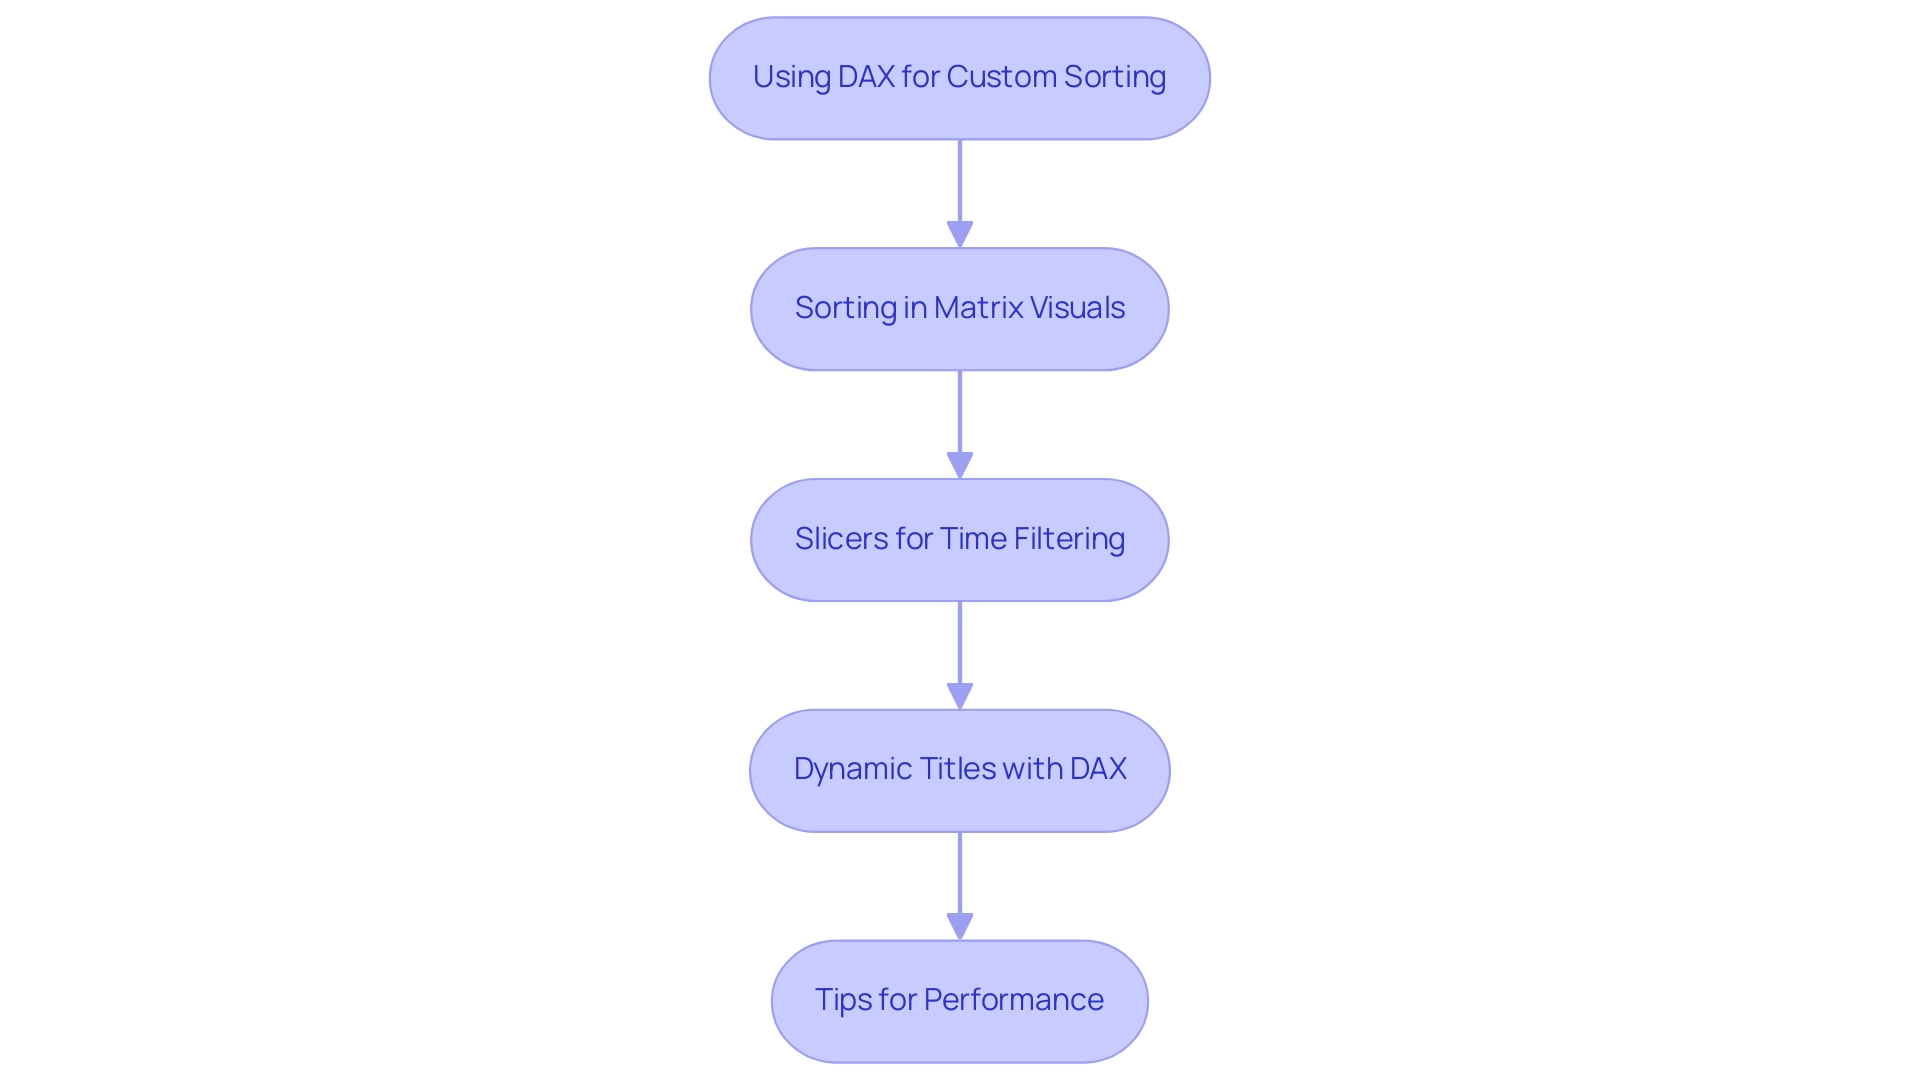
- Using DAX for Custom Sorting: To create a custom sorting column using DAX, consider the following approach. If you need to sort data by both month and year, implement this DAX formula:
DAX

   SortOrder = YEAR([YourDateColumn]) * 100 + MONTH([YourDateColumn])
This formula generates a unique sort order for each month of each year, ensuring that your visuals reflect the correct chronological order. As Joleen Bothma states, “Learn what DAX is and discover the fundamental DAX syntax and functions you’ll need to take your Power BI skills to the next level.”
-
Sorting in Matrix Visuals: When using a matrix visual, it’s essential to set your time period column to arrange by the month number. This method guarantees that your information displays in the intended order by utilizing power bi sort by month, providing clarity in your analysis and reports, which is essential given the challenges of inconsistencies.
-
Slicers for Time Filtering: To improve user experience and aid in information exploration, implement slicers that filter content by time period, utilizing the power bi sort by month feature. Use names of the calendar periods as slicer values, ensuring they are sorted correctly by their numerical order.
This strategy allows users to navigate through data intuitively using Power BI sort by month, fostering a more engaging analysis experience and addressing the need for actionable guidance.
- Dynamic Titles with DAX: Consider creating dynamic titles for your visuals that reflect the chosen period. By using DAX, you can develop a measure such as:
DAX

   SelectedMonth = SELECTEDVALUE(Month[Month])
This measure can be integrated into your titles, providing contextual insights that enhance user understanding and engagement.
- Tips for Performance: To maximize performance, especially with large datasets, ensure your date columns are indexed appropriately. Proper indexing not only enhances organization and filtering efficiency but also results in quicker loading times and a more responsive experience overall, which is crucial in overcoming time-consuming report creation.
In a case study on KPIs, it was demonstrated that effective month organization through Power BI sort by month can enhance the assessment of performance metrics, serving as visual cues for growth and performance in business contexts. Moreover, recent statistics suggest that user adoption of DAX for custom sorting in Power BI sort by month has significantly increased, emphasizing its growing significance in analysis.
By adopting these techniques, you will empower your organization to leverage Power BI’s capabilities more effectively, transforming unrefined information into actionable insights that facilitate clearer decision-making and enhanced operational efficiency, thereby addressing the competitive disadvantages that arise from a lack of insights driven by information.

Common Issues and Troubleshooting Month Sorting in Power BI
The challenges of sorting data can be exacerbated when using Power BI sort by month, especially if manual, repetitive tasks slow down your operations, leading to wasted time and resources. However, with a few troubleshooting tips, you can navigate these issues effectively while also leveraging RPA and Business Intelligence for greater operational efficiency:
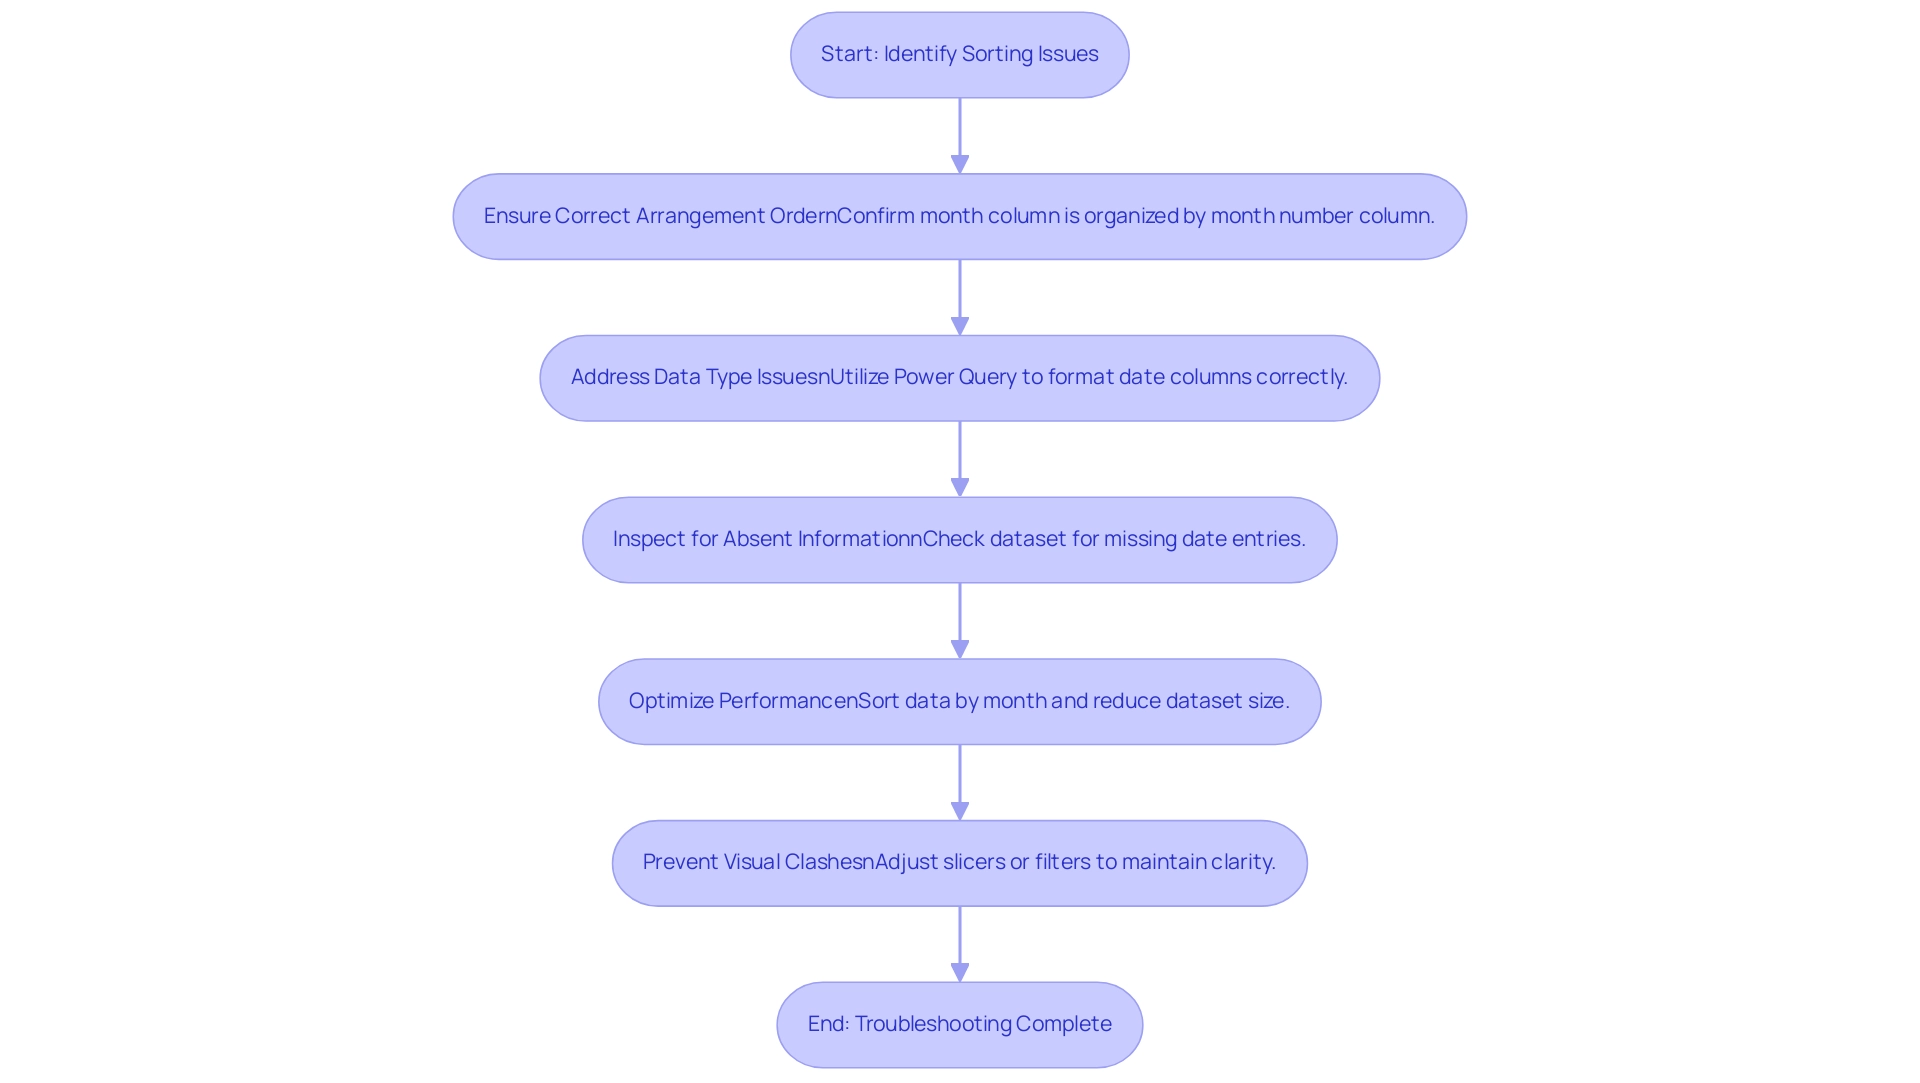
- Ensure Correct Arrangement Order: To resolve incorrect month arrangement, confirm that your month column is set to organize by the corresponding month number column.
It’s essential to verify that both columns are properly configured to reflect precise organization. As mentioned by user ‘galaamri’, arranging the column by Month Number or creating a separate calendar table can significantly aid in this process. This method not only enhances organization but also aligns with RPA principles by automating accuracy verifications.
- Address Data Type Issues: One common pitfall is having date columns that are not formatted correctly. If Power BI fails to identify your information as dates, arrangement will be affected. Utilize Power Query to adjust the type to the appropriate format, ensuring seamless sorting.
Proper information formatting is crucial in overcoming implementation challenges in Business Intelligence systems.
- Inspect for Absent Information: If particular periods are missing from your documents, assess your dataset for any voids in date entries. Including all periods in your information is essential for preventing incomplete visual representations.
Filling in any gaps ensures comprehensive analysis, thus enhancing your ability to derive actionable insights and avoid the competitive disadvantages of incomplete data.
- Optimize Performance: Slow data performance when sorting by month can hinder productivity. To enhance efficiency, consider optimizing your model in Power BI by sorting the data by month, removing unnecessary columns, and reducing the overall dataset size.
This approach can significantly speed up your reports and is a critical step in leveraging Business Intelligence for effective decision-making. Grasping the pricing framework for Power BI, especially between Pro and Premium versions, can also affect how you handle your model effectively.
- Prevent Visual Clashes: Conflicts with other visual components can interfere with time organization. Ensure that slicers or filters applied to different fields do not obscure your monthly information. Adjusting these settings will help maintain clarity and improve the effectiveness of your reports.
By implementing these strategies, you can overcome common organization challenges and make the most of Power BI’s robust capabilities, including how to use Power BI sort by month. For example, the Time-Tracking Dashboard for Harvest in Power BI illustrates how efficient organization can result in enhanced analysis of time allocation, team performance, and profit margins, ultimately improving business results. Embracing RPA and Business Intelligence not only addresses the challenges of information management but also propels your organization towards a more insight-driven future, mitigating the risks associated with manual tasks.

Best Practices for Month Sorting in Power BI
To achieve effective month organization in Power BI while overcoming common challenges, implementing the following best practices is essential:
-
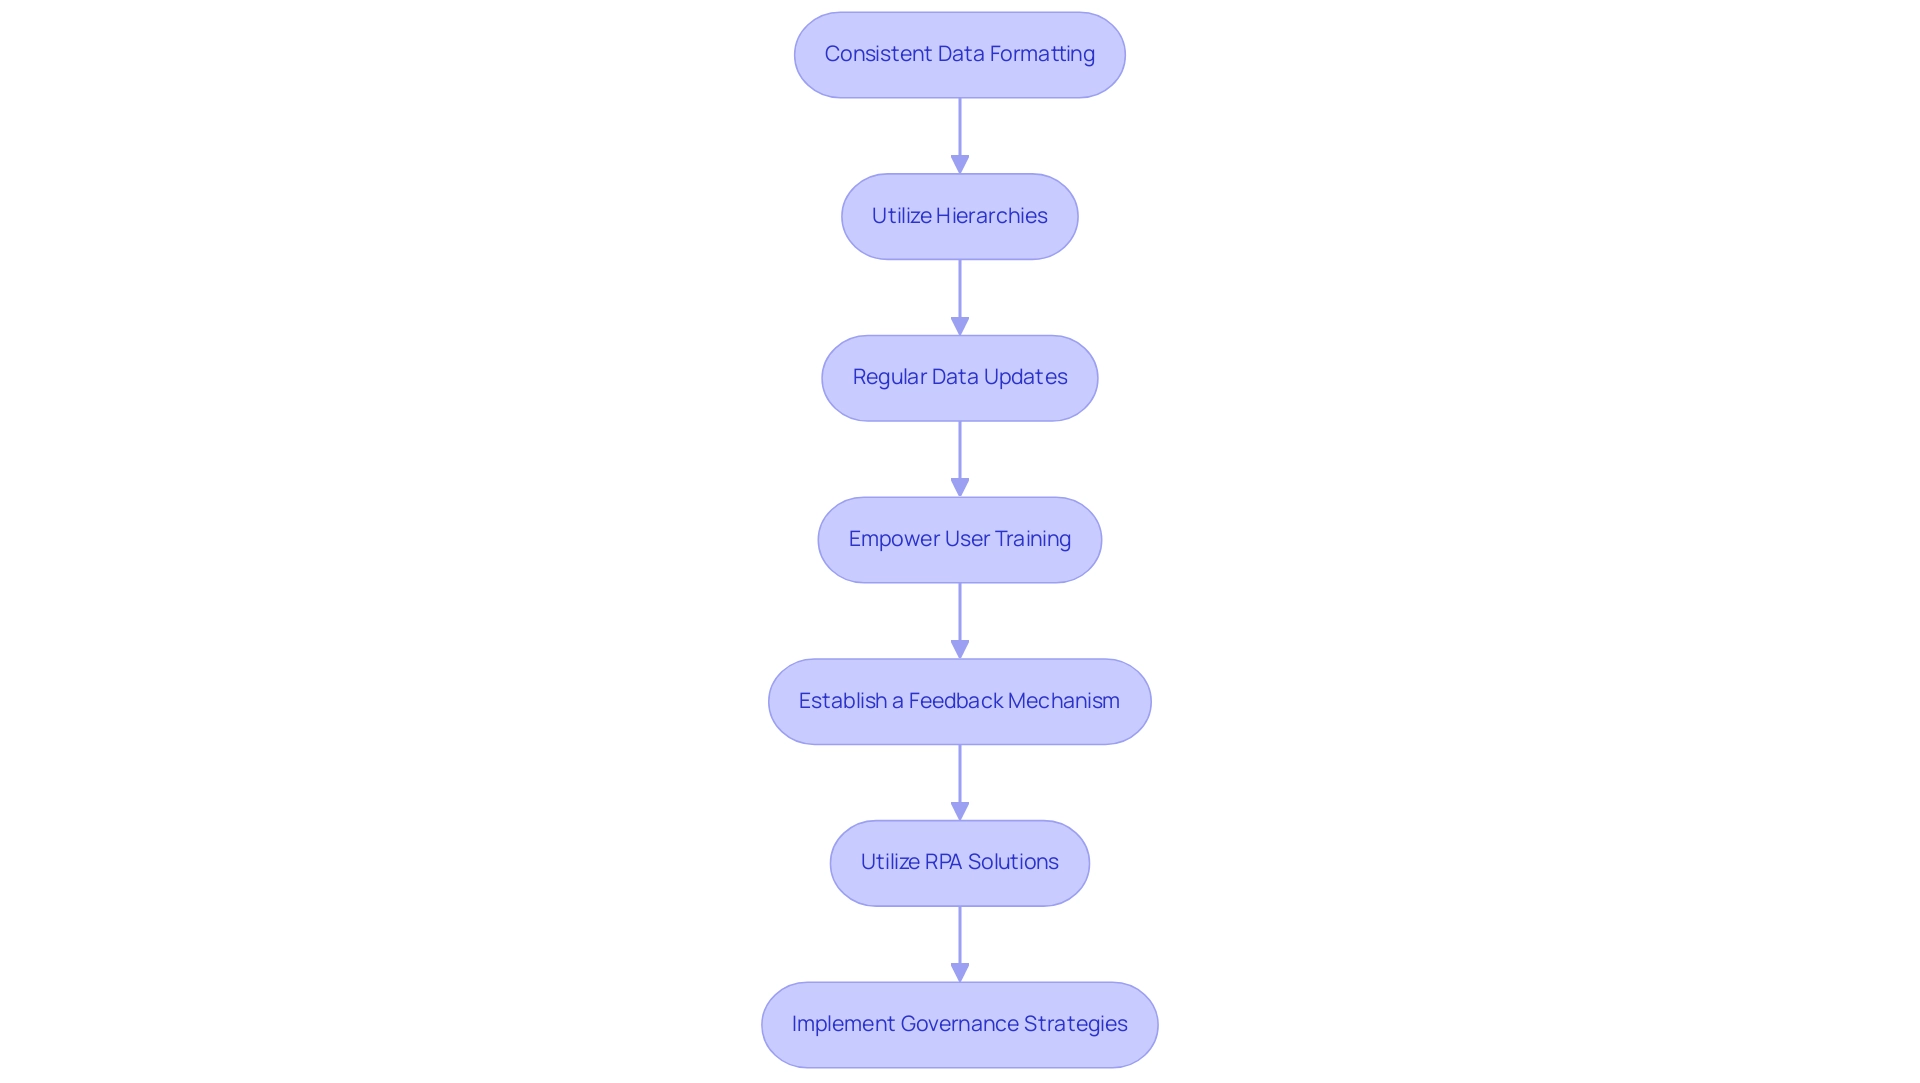
Consistent Data Formatting: Maintaining uniform date formatting throughout your dataset is crucial. This practice minimizes confusion and guarantees that sorting functions operate smoothly, leading to more reliable data analysis. Additionally, employing report backgrounds for static images instead of multiple visuals can reduce performance costs, ensuring your reports run efficiently.
-
Utilize Hierarchies: Establishing date hierarchies enables users to seamlessly drill down from year to month and then to day. This structured method enhances the user experience by displaying information in an organized manner, facilitating better insights. As emphasized in case studies, verifying settings like Assume Referential Integrity can enhance query performance, crucial for effective information analysis.
-
Regular Data Updates: It is vital to keep your datasets regularly updated to ensure they reflect the most current information. Consistent updates not only maintain the relevance and accuracy of your reports but also support informed decision-making. Consistently reviewing types and DAX measures can help prevent issues with conditional formatting, as noted by Joleen Bothma, a Data Science Consultant.
-
Empower User Training: Offering thorough instruction for users on Power BI functionalities, especially time organization, boosts productivity. Informed users can utilize the software’s features more efficiently, resulting in optimized workflows and improved information utilization. Training sessions should include troubleshooting techniques for common issues, fostering a deeper understanding of the tool.
-
Establish a Feedback Mechanism: Implementing a structured feedback system enables users to communicate issues or suggest enhancements regarding the Power BI sort by month functionalities. This practice promotes a culture of ongoing enhancement in information management, ensuring that user needs are consistently addressed.
-
Utilize RPA Solutions: Integrating Robotic Process Automation (RPA) can greatly enhance the document creation process, decreasing the time spent on repetitive tasks and minimizing information inconsistencies. RPA tools can automate information gathering and reporting, allowing analysts to concentrate on deriving insights rather than getting bogged down in manual processes.
-
Implement Governance Strategies: Establishing a strong governance approach is vital to uphold information integrity and consistency throughout documentation. This includes defining clear ownership, standardizing definitions, and regularly auditing sources to prevent discrepancies.
By adhering to these best practices, organizations can significantly enhance their analysis capabilities in Power BI. Addressing challenges related to report creation and data inconsistencies drives more informed decision-making and operational efficiency, ultimately empowering your organization to thrive in a data-driven environment.

Conclusion
Mastering the art of sorting by month in Power BI is essential for organizations striving to enhance their data analysis and reporting capabilities. By following the essential steps outlined, such as:
- Preparing data
- Creating month columns
- Implementing effective sorting techniques
users can significantly improve the clarity and effectiveness of their reports. Integrating DAX for custom sorting and utilizing slicers can further streamline the data exploration process, allowing for a more intuitive user experience.
Addressing common challenges, from ensuring correct data formatting to optimizing performance, is crucial for overcoming potential roadblocks in the sorting process. By implementing best practices such as:
- Consistent data formatting
- User training
- Leveraging RPA solutions
organizations can not only enhance their operational efficiency but also foster a culture of continuous improvement in data management.
Ultimately, the ability to sort data by month effectively empowers organizations to derive actionable insights, streamline decision-making, and maintain a competitive edge in an increasingly data-driven landscape. Embracing these strategies will transform raw data into valuable intelligence, driving better outcomes and supporting overall operational success.

