Overview
Changing the date format in Power BI visualizations is crucial for accurate data representation and can be achieved through methods such as using the Modeling Tab, Power Query, DAX expressions, and the DATE() function. The article emphasizes that these techniques not only enhance clarity and consistency in reporting but also mitigate common errors stemming from regional settings and incorrect interpretations, thus improving the overall operational efficiency of data analysis.
Introduction
In the realm of data analysis, the significance of date formatting in Power BI cannot be overstated. As organizations strive to make sense of vast amounts of information, the way dates are presented can greatly influence the clarity and accuracy of insights derived from data. With various formats like ‘MM/DD/YYYY’, ‘DD/MM/YYYY’, and ‘YYYY-MM-DD’ in play, understanding these nuances becomes essential to avoid costly misinterpretations that can lead to operational inefficiencies.
This article delves into the intricacies of date formats, explores effective methods for changing them, and highlights best practices that ensure data integrity and enhance decision-making capabilities. By mastering date formatting in Power BI, professionals can transform their reports into powerful tools that drive actionable insights and foster trust in the data presented.
Understanding Date Formats in Power BI
In Power BI, the option to change date format in visualization is essential as it influences how dates are displayed in dashboards, directly affecting operational efficiency. Among the most common styles are ‘MM/DD/YYYY’, ‘DD/MM/YYYY’, and ‘YYYY-MM-DD’. A comprehensive understanding of these formats is crucial; misinterpretations can result in significant errors in data analysis, adding to the difficulties of time-consuming documentation creation and data inconsistencies that many organizations encounter.
This issue is often exacerbated by a lack of governance strategy, which can result in discrepancies across reports. For instance, a format like ’01/02/2023′ could be interpreted as either January 2nd or February 1st, depending on the viewer’s regional settings. This ambiguity highlights the significance of clear communication in information visualization and actionable insights.
A recent study indicates that the error rate for the suggested approach to managing temporal representations was considerably lower than baseline methods, emphasizing the essential nature of precise temporal depiction. Furthermore, the correlation matrix case study demonstrates how format issues can impact the analysis of relationships between various information points in business contexts, ultimately resulting in confusion and mistrust in the information presented.
As Zixuan Liang from the Department of Computer and Information Sciences at Harrisburg University of Science & Technology states,
We present a second Normal Language Handling (NLP) strategy for creating a similar temporal design space language with comparable exactness, stretching out the calculation to deal with syntax variations and imperatives extraordinary to temporal structures.
This emphasizes the need for actionable insights derived from precise information representation. By identifying various temporal representations and their implications, you can ensure that your visualizations in Power BI change date format in visualization to convey precise information and offer clear, actionable guidance. Comprehending these subtleties is crucial for improving the reliability of your analysis and ensuring that documents, while filled with information, also provide clear guidance on the next steps.
Methods to Change Date Format in Power BI
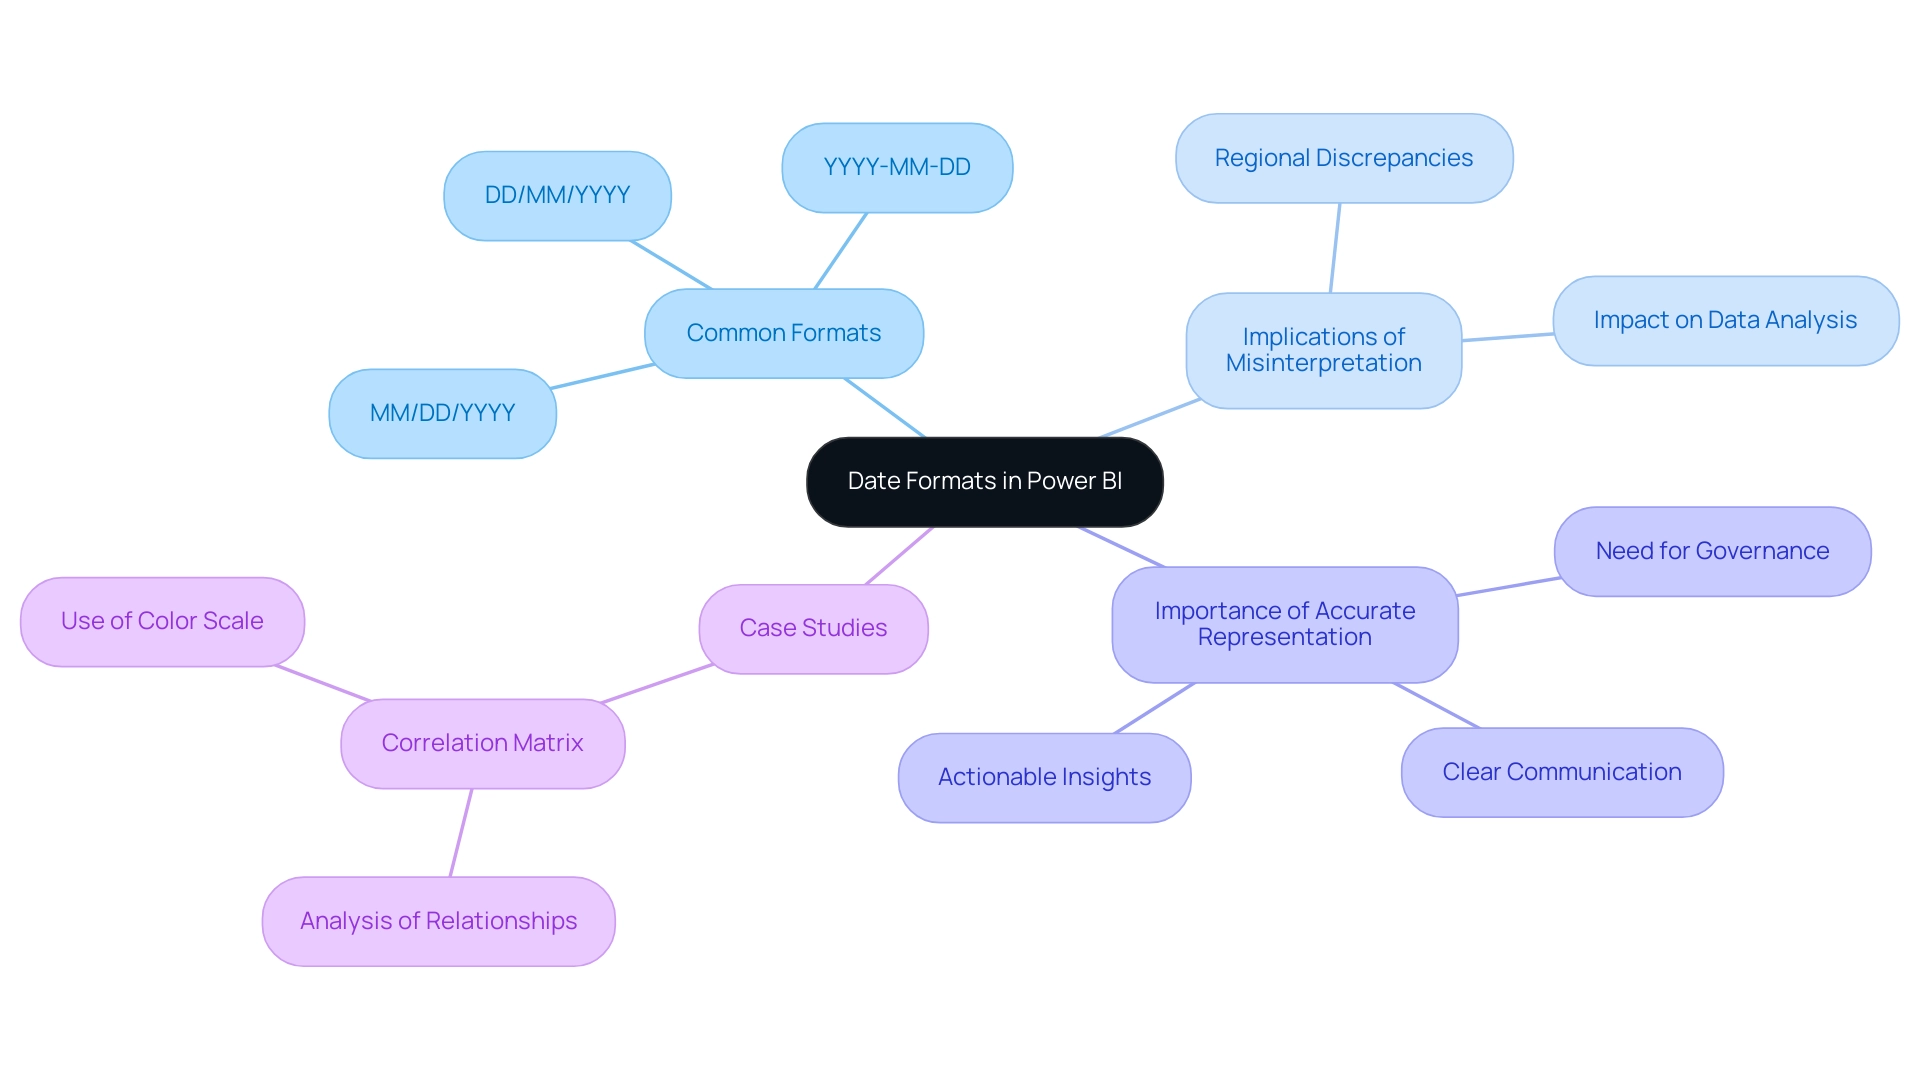
Changing date formats in Power BI can be accomplished through several effective methods, which not only enhance data presentation but also address common challenges faced by operations directors regarding report efficiency and clarity:
-
Using the Modeling Tab: Begin by choosing your time field in the Fields pane. Navigate to the Modeling tab, where you can choose your desired format from the ‘Format’ dropdown menu, ensuring that your data aligns with reporting standards and minimizes inconsistencies.
This method also offers clear guidance on how to present time effectively. -
Using Power Query: Open the Power Query Editor, select the date column, right-click, and choose ‘Change Type’ followed by ‘Using Locale.’
This permits you to define the format based on your regional or organizational requirements, improving consistency and trust in your documents, which directly tackles the confusion that may result from inconsistent information presentation. -
Custom Format with DAX: For unique formatting requirements, DAX expressions provide a powerful solution.
For instance, utilizingFORMAT([YourDateColumn], 'MMMM DD, YYYY')will transform the display to ‘January 01, 2023.’ This flexibility guarantees your documents are actionable and pertinent, offering stakeholders with clear next steps based on the information presented. -
Utilizing the DATE() Function: To generate specific timestamps, you can employ the DATE() function, such as
DATE(2024, 9, 11), which guarantees that the timestamp is correctly depicted in your documents, minimizing the time allocated for adjustments and reinforcing the dependability of your information. -
Transform Option: By selecting the Transform option, users can extract specific time components, such as the year, which can be particularly useful for analysis and reporting purposes.
These methods not only provide flexibility in how timestamps are presented in your reports but also ensure clarity and relevance in your visual representations.
Moreover, frequent problems with time formatting in Power BI, such as incorrect settings or invalid formats, can be resolved by verifying settings and ensuring consistency when attempting to change date format in visualization. This is emphasized in the case study ‘Troubleshooting Date Formatting Issues,’ which demonstrates how proper formatting of time can reduce confusion and mistrust in information.
By effectively employing these techniques, you can enhance your reporting capabilities in Power BI, transforming the way you leverage insights and make decisions.
Utilizing DAX for Advanced Date Formatting
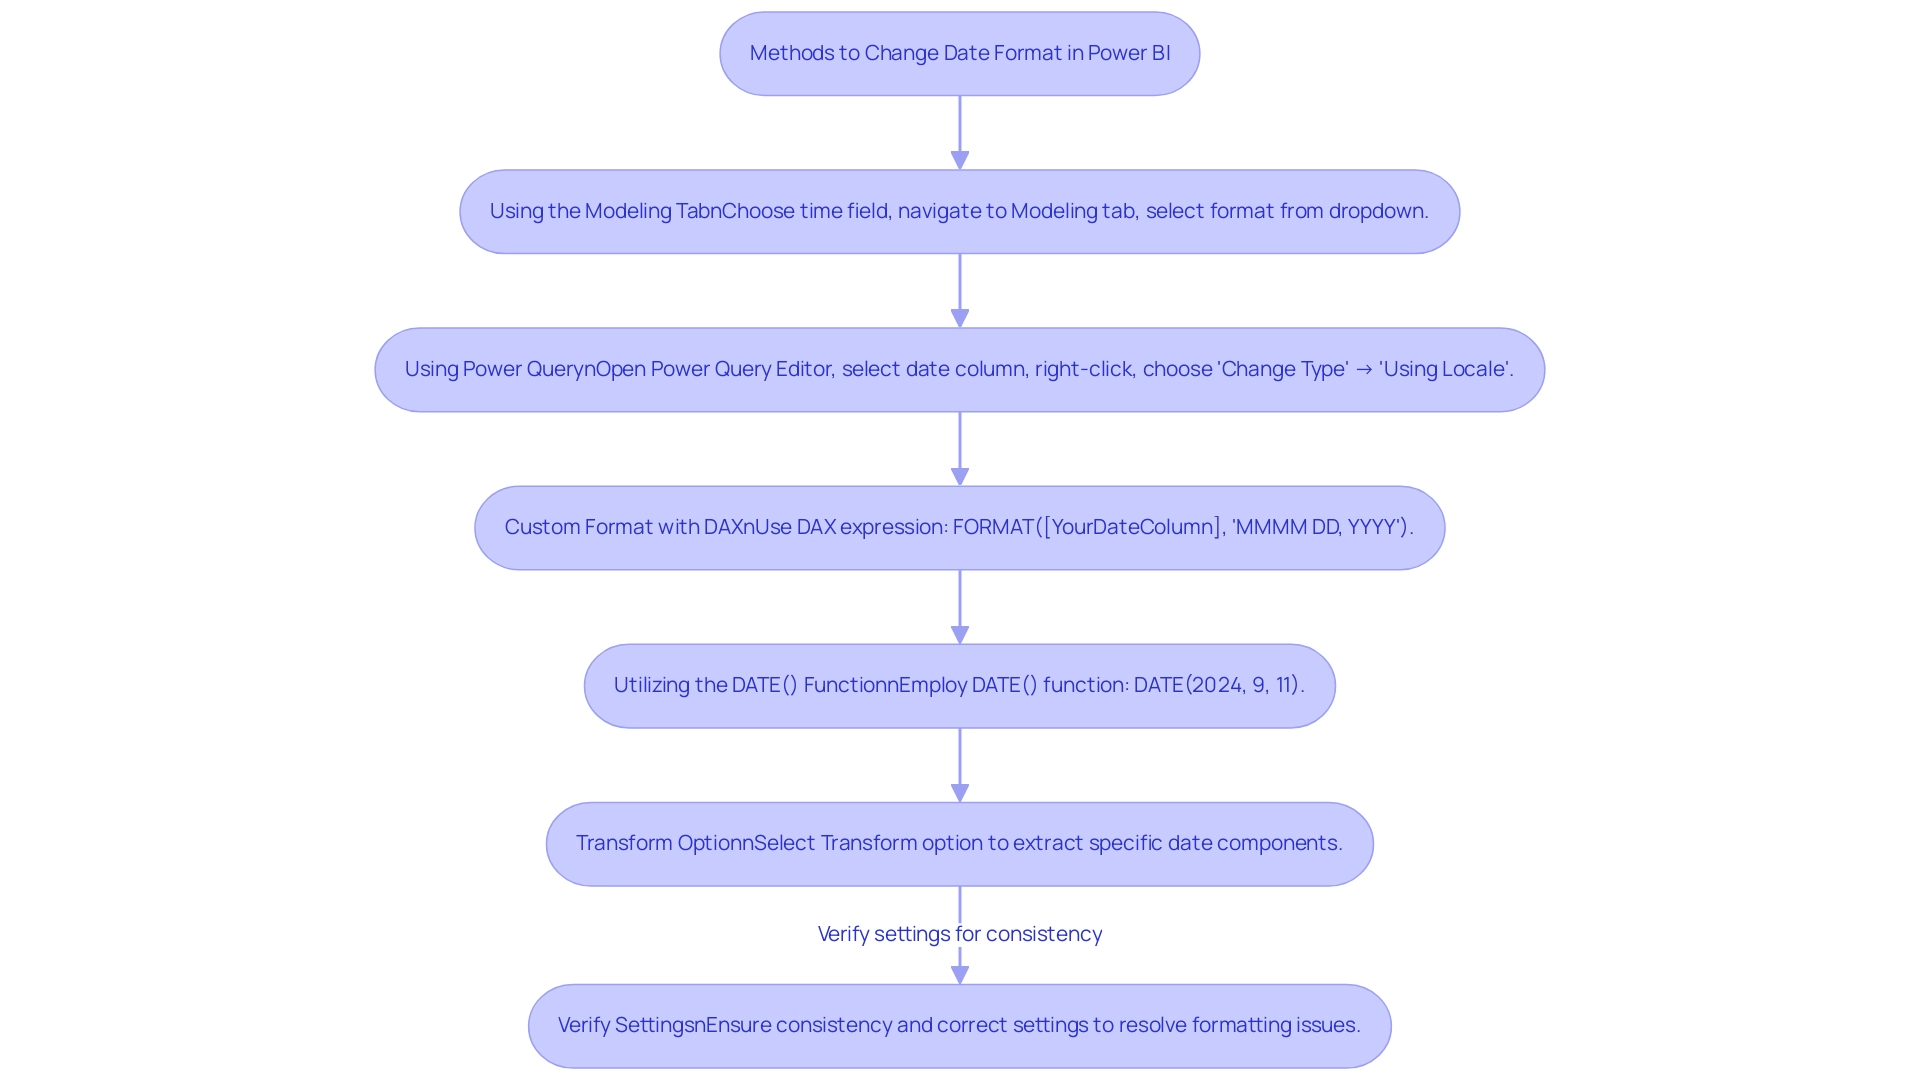
DAX (Data Analysis Expressions) functions as a powerful formula language within Power BI, allowing users to conduct complex calculations and custom formatting that can mitigate typical obstacles such as time-consuming documentation creation and information inconsistencies. For example, the following DAX formula exemplifies how to create a formatted date string:
FormattedDate = FORMAT([DateColumn], 'DD-MMM-YYYY')
This formula converts dates into a standardized format, resulting in outputs like ’01-Jan-2023′. By utilizing DAX, users can not only automate tedious report tasks but also ensure consistency across various reports, which is crucial for maintaining trust in the information presented.
Additionally, establishing a governance strategy is essential to prevent inconsistencies and confusion in reporting. DAX’s versatility encompasses its use in calculated columns and measures, enabling dynamic formatting that reacts to user interactions or filters, thus offering actionable insights instead of merely raw data. For instance, using DAX to create measures that summarize key performance indicators can guide stakeholders in decision-making processes.
Predefined date/time formats available in DAX include:
- ‘General Format’
- ‘Long Format’
- ‘Medium Format’
- ‘Short Format’
- ‘Long Time’
- ‘Medium Time’
- ‘Short Time’
This variety offers users options for presenting information clearly. Furthermore, the Fiscal Day of Year Number statistic, such as 201, can be utilized in DAX calculations for fiscal reporting, illustrating the practical application of temporal functions in a business context. As mentioned in professional circles,
You should utilize the ‘Date/Time’ information type for information that requires both temporal and chronological details,
highlighting the importance of appropriate information types for effective temporal manipulation.
Moreover, the case study on Power BI Admin Controls for Usage Metrics demonstrates how DAX can be employed to manage visibility and reporting, showcasing its real-world applications. Mastering DAX not only enhances your ability to adapt time formats for various reporting contexts but also empowers you to power bi change date format in visualization, allowing you to leverage advanced temporal formatting techniques that can significantly improve the clarity and efficacy of your information presentation.
Troubleshooting Common Date Formatting Issues
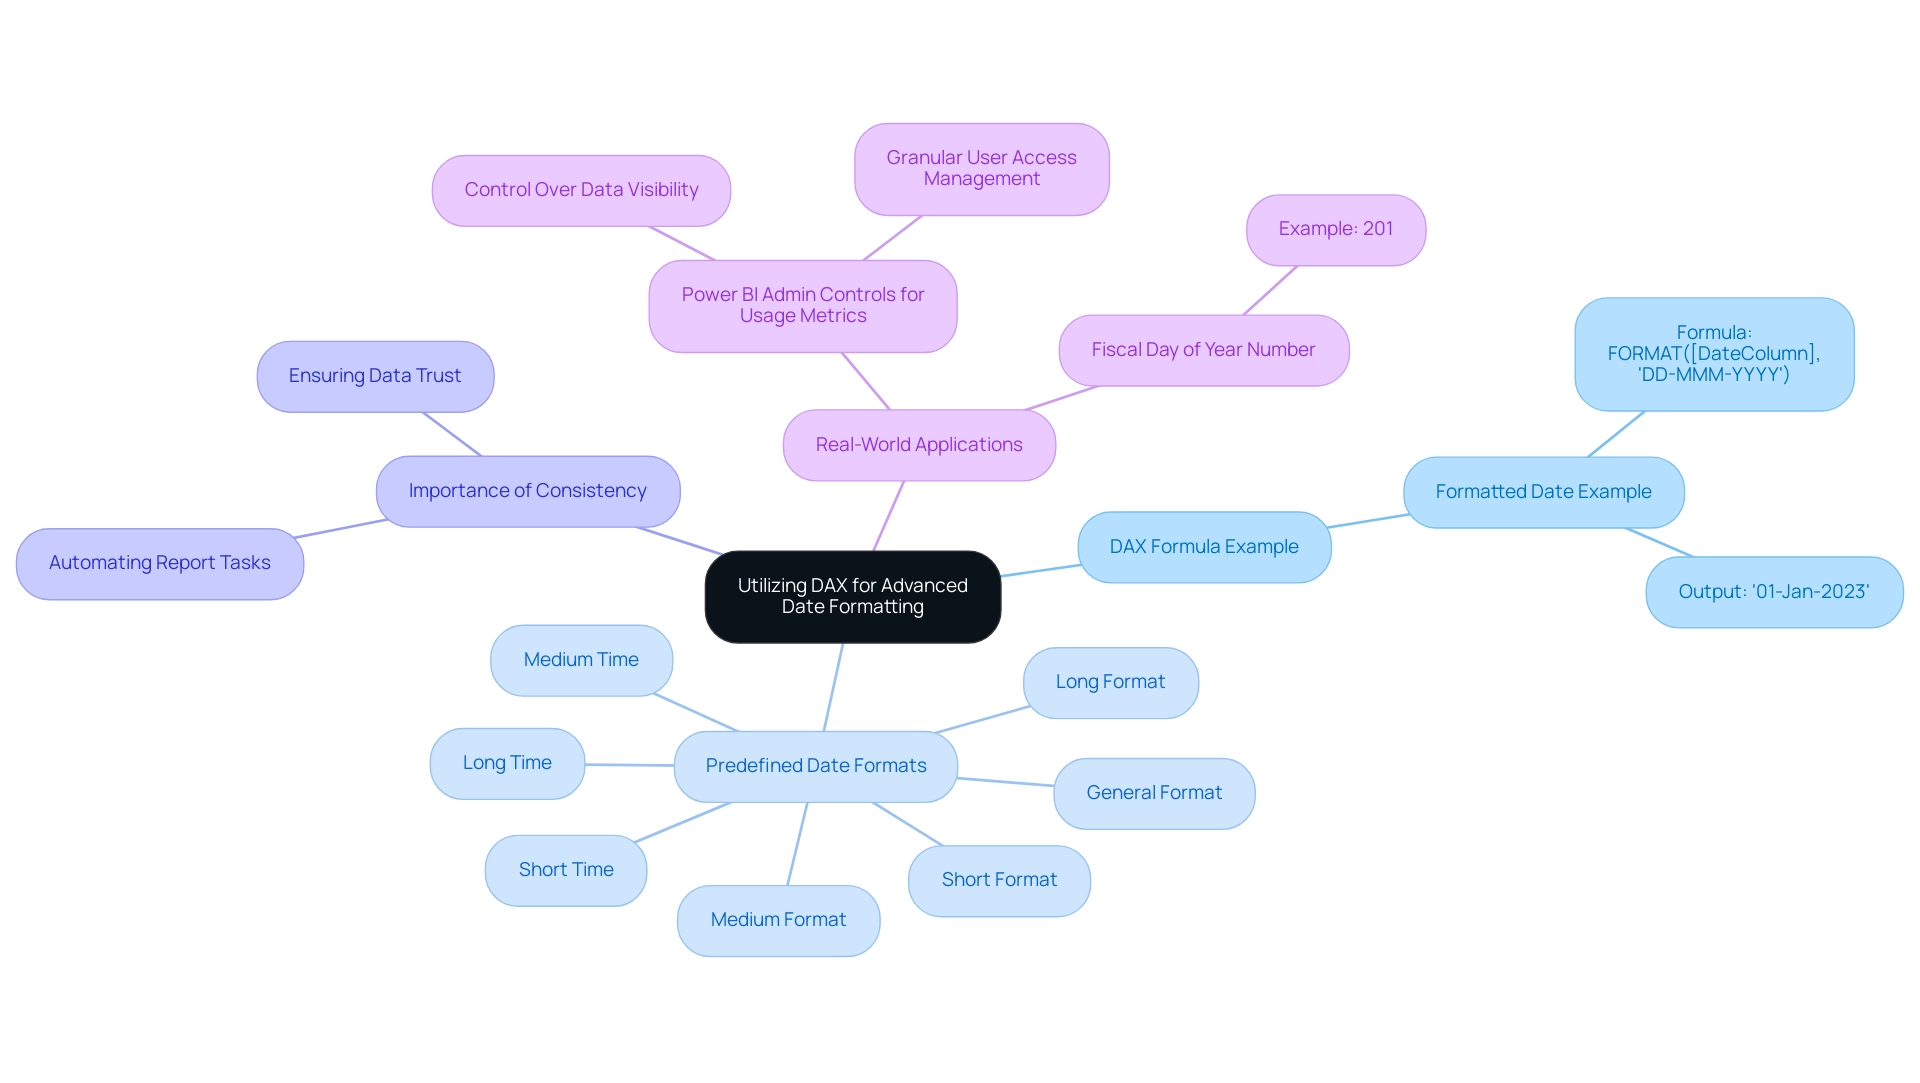
Users must navigate a variety of challenges when they need to power bi change date format in visualization, which impacts operational efficiency and the quality of data-driven insights. Understanding these common issues and their solutions can significantly enhance the accuracy and presentation of your visualizations, particularly when you need to power bi change date format in visualization. Here are some key problems and recommended fixes:
-
Incorrect Time Interpretation: When times seem incorrect, it’s crucial to check the data type of the relevant column. Ensure that it is set to ‘Date’ in Power BI to avoid misinterpretation, which can hinder informed decision-making.
-
Regional Settings Conflicts: If your temporal representation does not match your expectations, check the regional settings within Power BI.
Navigate to ‘File’ > ‘Options and settings’ > ‘Options’ > ‘Regional Settings’ to adjust these as necessary, ensuring consistency across your reports. -
DAX Errors: Encountering errors in DAX formulas can be frustrating. Ensure that any referenced column exists and that your syntax is correct.
It’s advisable to meticulously review your DAX expressions for typographical errors to maintain report integrity.
Additionally, user feedback highlights that recent Power BI releases have lacked styling options, prompting some to create calculated columns with a ‘Short Date’ setting to power bi change date format in visualization, as noted by Dharman:
However, the below solution works for me: Create a Calculated Column ref.
To troubleshoot date formatting issues effectively, users can power bi change date format in visualization by applying the ‘Short Date’ format to the original Date column. Additionally, a case study titled ‘Troubleshooting Date Formatting Issues in Power BI’ highlights the significance of checking formatting settings, verifying formats, and ensuring consistency across sources to resolve common formatting problems, particularly focusing on how to power bi change date format in visualization.
Implementing these strategies not only enhances accuracy but also ensures that your reports maintain their integrity and clarity, thereby driving better operational outcomes. To further streamline these processes, Robotic Process Automation (RPA) can be utilized to automate repetitive tasks associated with preparation and formatting in Power BI. By integrating RPA, businesses can reduce the time spent on manual adjustments, allowing teams to focus on analyzing insights rather than fixing formatting errors.
The importance of precise information representation is emphasized by current events, such as the low approval rating of President Zelensky, highlighting the need for trustworthy information in analysis. Lastly, it is worth noting that other governments provide open data repositories similar to Statistics Canada, which can serve as valuable resources for your data analysis and further reinforce the importance of maintaining data integrity.
Best Practices for Effective Date Formatting in Visualizations
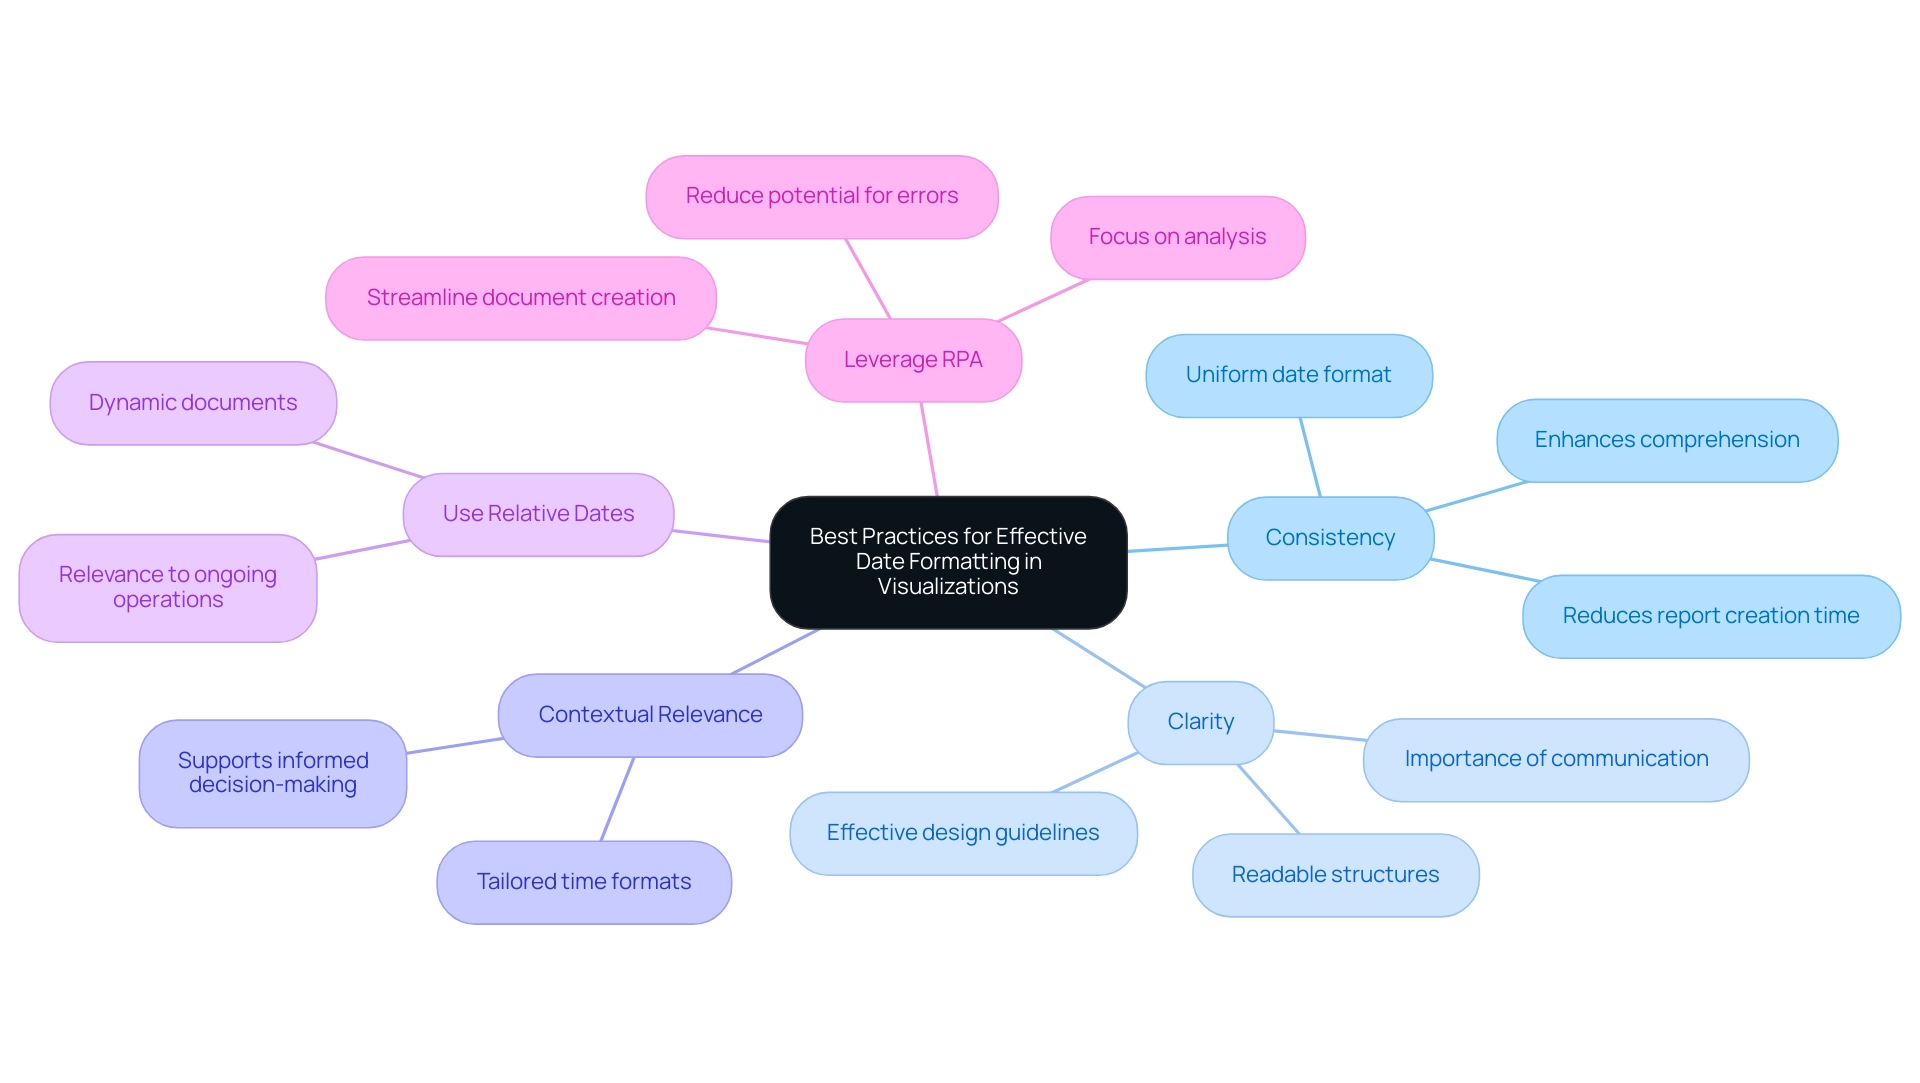
To achieve effective time formatting in your Power BI visualizations while addressing common challenges in leveraging insights, adhere to these best practices:
- Consistency: Maintain a uniform date format across your documents to eliminate confusion and enhance comprehension. This consistency is essential, as 65% of businesses report a boost in client engagement when information is clearly visualized, thus reducing the time spent on report creation. Inconsistent information can lead to confusion and mistrust, making clarity essential.
- Clarity: Choose structures that are easily readable and straightforward, particularly for stakeholders who may not be intimately familiar with the underlying data. Effective design guidelines can help prevent common pitfalls, ensuring that your visuals convey the intended message. As Krzywinski and Altman remind us, clarity in communication is essential for ensuring the significance of the information presented.
- Contextual Relevance: Modify time formats to conform with the document’s context. For example, financial reports may be more effective when presented using fiscal year formatting, while operational reports would benefit from standard calendar references. This tailored approach not only enhances clarity but also supports informed decision-making based on accurate data insights, especially when using Power BI to change date format in visualization.
- Use Relative Dates: Incorporate relative date filters, such as ‘Last 30 Days’, when appropriate. This approach not only enhances the dynamism of your documents but also keeps them relevant to ongoing operations, addressing the challenge of providing actionable guidance.
- Leverage RPA: Consider using Robotic Process Automation to streamline the document creation process. By automating repetitive tasks, you can focus more on analysis and less on manual report generation, further enhancing productivity and reducing the potential for errors.
By implementing these best practices, you can significantly improve the clarity and effectiveness of your Power BI visualizations, particularly when you learn how to power bi change date format in visualization, fostering more informed decision-making based on your data. Remember, following guidelines for effective figure design can help avoid common pitfalls, improve information dissemination, and ultimately enhance business productivity.
Conclusion
Mastering date formatting in Power BI is essential for transforming data into actionable insights. Throughout the article, the critical importance of understanding various date formats, including:
- ‘MM/DD/YYYY’
- ‘DD/MM/YYYY’
- ‘YYYY-MM-DD’
has been emphasized. Misinterpretations of these formats can lead to significant errors, affecting operational efficiency and the clarity of reports. By employing effective methods to change date formats, such as using the Modeling Tab, Power Query, and DAX, users can enhance the presentation of their data while ensuring consistency and trustworthiness.
Furthermore, troubleshooting common date formatting issues plays a vital role in maintaining the integrity of data visualizations. By addressing problems like incorrect date interpretation and regional settings conflicts, users can significantly improve the overall quality of their reports. Best practices, including maintaining consistency, ensuring clarity, and adapting formats to context, are crucial for effective communication of insights derived from data.
Ultimately, the ability to accurately format dates in Power BI not only enhances reporting capabilities but also fosters better decision-making processes. By prioritizing clear and consistent date representation, organizations can build trust in their data and drive operational success. Embracing these strategies will empower professionals to leverage the full potential of their data analysis efforts, ensuring that insights derived from Power BI are both impactful and reliable.

