Overview
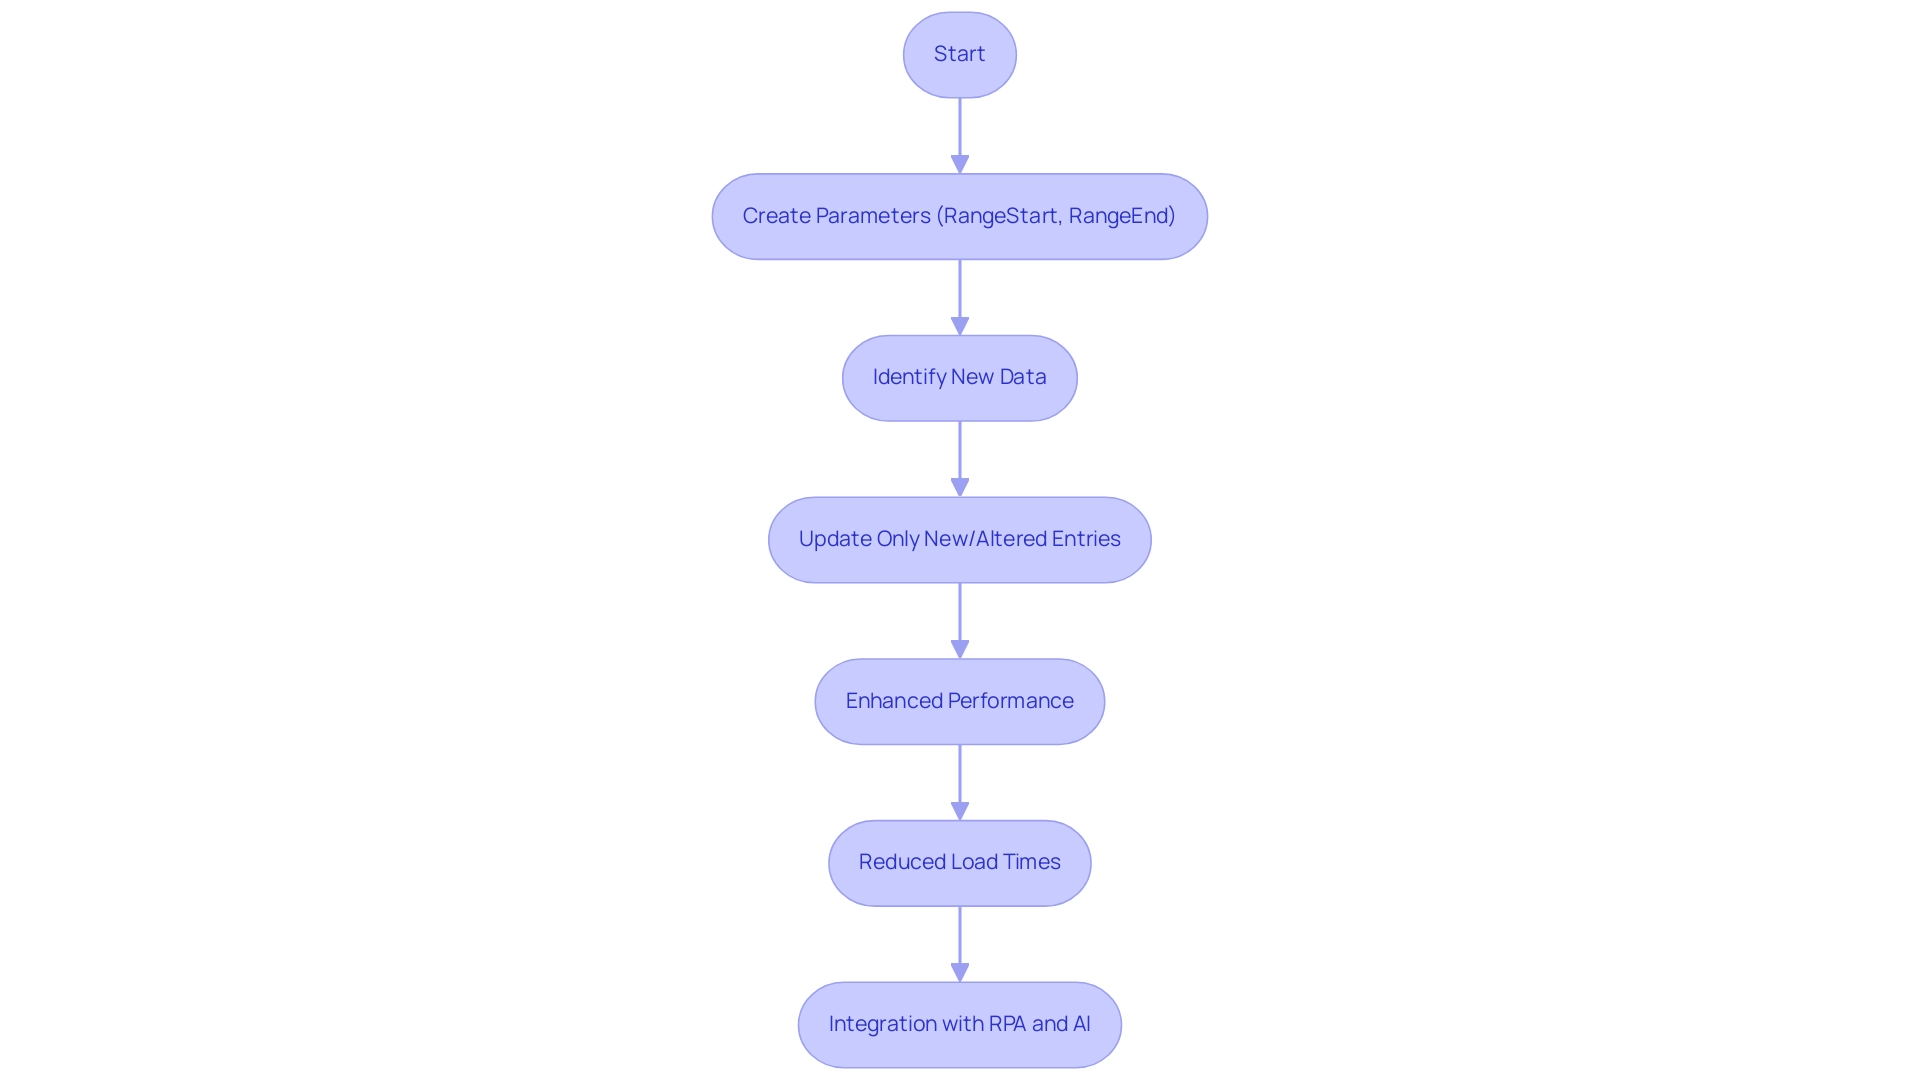
To configure Power Query to refresh only new data, users should establish parameters like RangeStart and RangeEnd to filter the dataset effectively, enabling incremental updates that enhance performance and reduce load times. The article outlines a step-by-step guide emphasizing the importance of these parameters and the integration of Robotic Process Automation (RPA) to automate and streamline the refresh process, ultimately improving operational efficiency and decision-making.
Introduction
In the fast-evolving landscape of data management, organizations are increasingly turning to incremental refresh in Power Query as a game-changing solution for optimizing their data workflows. This approach allows businesses to refresh only new or modified data, dramatically improving performance and reducing load times, especially when dealing with extensive datasets.
By harnessing the power of incremental refresh, organizations can not only streamline their data processes but also enhance their decision-making capabilities with timely access to relevant information. As the article explores, implementing this technique alongside Robotic Process Automation (RPA) can further elevate operational efficiency, enabling teams to focus on strategic initiatives rather than getting bogged down in repetitive tasks.
With practical guidance, troubleshooting tips, and best practices, this comprehensive guide equips organizations with the knowledge needed to leverage incremental refresh effectively and drive business growth.
Understanding Incremental Refresh in Power Query
Incremental updating in Power Query transforms how organizations manage information updates by allowing users to perform a power query refresh only on new data or altered entries instead of updating the entire dataset. This is particularly advantageous for large datasets, as it significantly reduces load times and enhances overall performance. For instance, a case study titled ‘How to Set Up Incremental Refresh in Power BI’ illustrates the process of partitioning data tables, where the quality of each cell is contingent on the settings applied during setup.
This practical guidance illustrates the advantages of applying gradual updates in real-world situations. To harness the full potential of incremental updates, it’s crucial to understand its operational mechanics, which involve creating two key parameters: RangeStart and RangeEnd. These parameters determine the extent of historical information retained and facilitate the identification of new entries.
As pointed out by Marina Pigol, Content Manager at Alpha Serve,
Having fewer records to update decreases the overall memory and other database resources utilized in Power BI to finish the update.
This not only streamlines processing efficiency but also allows users to utilize a power query refresh only on new data to consistently access the most current information without unnecessary delays. Recent statistics reveal that organizations applying gradual updates have experienced up to a 70% decrease in update durations, highlighting its effectiveness for large datasets and demonstrating how RPA can reduce errors and free up team resources for more strategic tasks.
Furthermore, recent advancements enable automatic page refresh capabilities for reports utilizing models with incremental refresh, enhancing the immediacy of visibility. By integrating these strategies with Robotic Process Automation (RPA) and tailored AI solutions, organizations can optimize their workflows, drive greater operational efficiency, and leverage Business Intelligence to make informed decisions. Customized AI solutions can particularly aid in examining patterns and forecasting future trends, ultimately overcoming technology implementation challenges and promoting business growth.
Step-by-Step Guide to Configuring Incremental Refresh
Setting up gradual updates in Power Query can greatly improve your information management strategy and align with wider operational efficiency objectives supported by Robotic Process Automation (RPA). Follow these steps to establish an efficient update process:
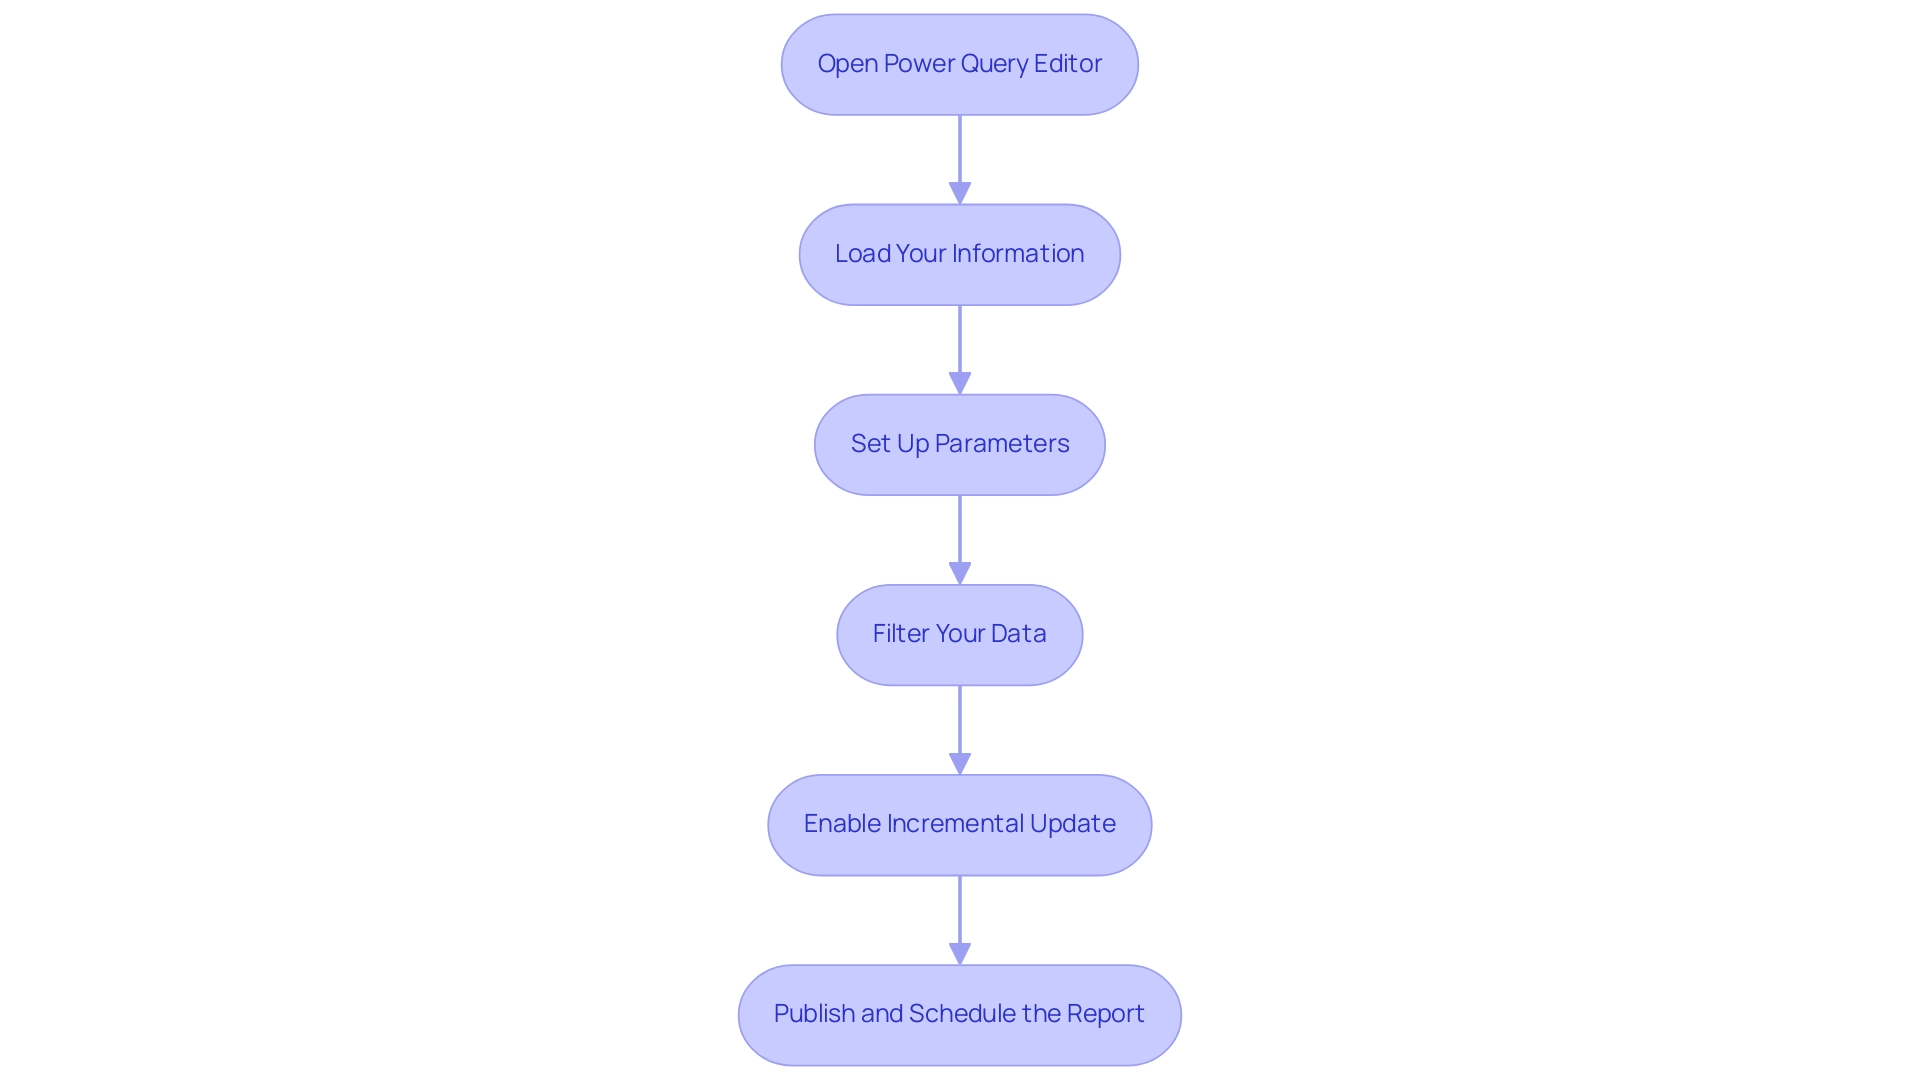
- Open Power Query Editor: Launch Power Query by navigating to the ‘Data’ tab in Excel or Power BI, then select ‘Get Data’ to access the Power Query Editor.
- Load Your Information: Import the desired source that you intend to configure for gradual refresh.
- Set Up Parameters: Establish two essential parameters:
- RangeStart: This parameter should denote the start date for the dataset you wish to load.
- RangeEnd: This parameter indicates the end date, guiding Power Query in identifying which records require refreshing.
- Filter Your Data: Utilize these parameters to filter your dataset. For example, set a filter to include records where the date falls between RangeStart and RangeEnd.
- Enable Incremental Update: Within the Power Query Editor, navigate to the ‘Manage Parameters’ section and activate the incremental update option by selecting the appropriate settings. This is vital because, as observed by analyst Manikanta Gudivaka, it minimizes the volume of information transferred and processed, enhancing performance and lowering resource usage. Additionally, it is important to note that subsequent refreshes load the dataset incrementally for the last 10 days, which enhances the efficiency of the process. By incorporating RPA into this step, you can automate the update scheduling, further decreasing manual effort and the potential for errors.
- Publish and Schedule the Report: After configuring your settings, publish your report to the Power BI Service or save your Excel workbook. It is crucial to arrange the update in Power BI Service to guarantee that your progressive update is active, which allows the Power Query to refresh only new data in subsequent updates. Utilizing RPA here can assist in automating the scheduling process, guaranteeing prompt updates without human involvement.
By adopting these measures, you can simplify your information update processes, incorporate RPA to automate manual tasks, and concentrate on the most pertinent details while enhancing performance. Moreover, utilizing query folding—where information transformation steps are pushed back to the source—reduces transfer and processing during gradual updates, emphasizing its significance in the setup. This method not only improves efficiency but also conforms to best practices for information management in Power BI, ensuring that your operations stay agile and responsive in a rapidly evolving AI landscape.
By utilizing RPA, you not only reduce errors but also free up your team to focus on strategic tasks that drive business growth.
Best Practices for Using Incremental Refresh
To maximize the benefits of incremental refresh in Power Query and enhance operational efficiency through automation, consider the following best practices:
-
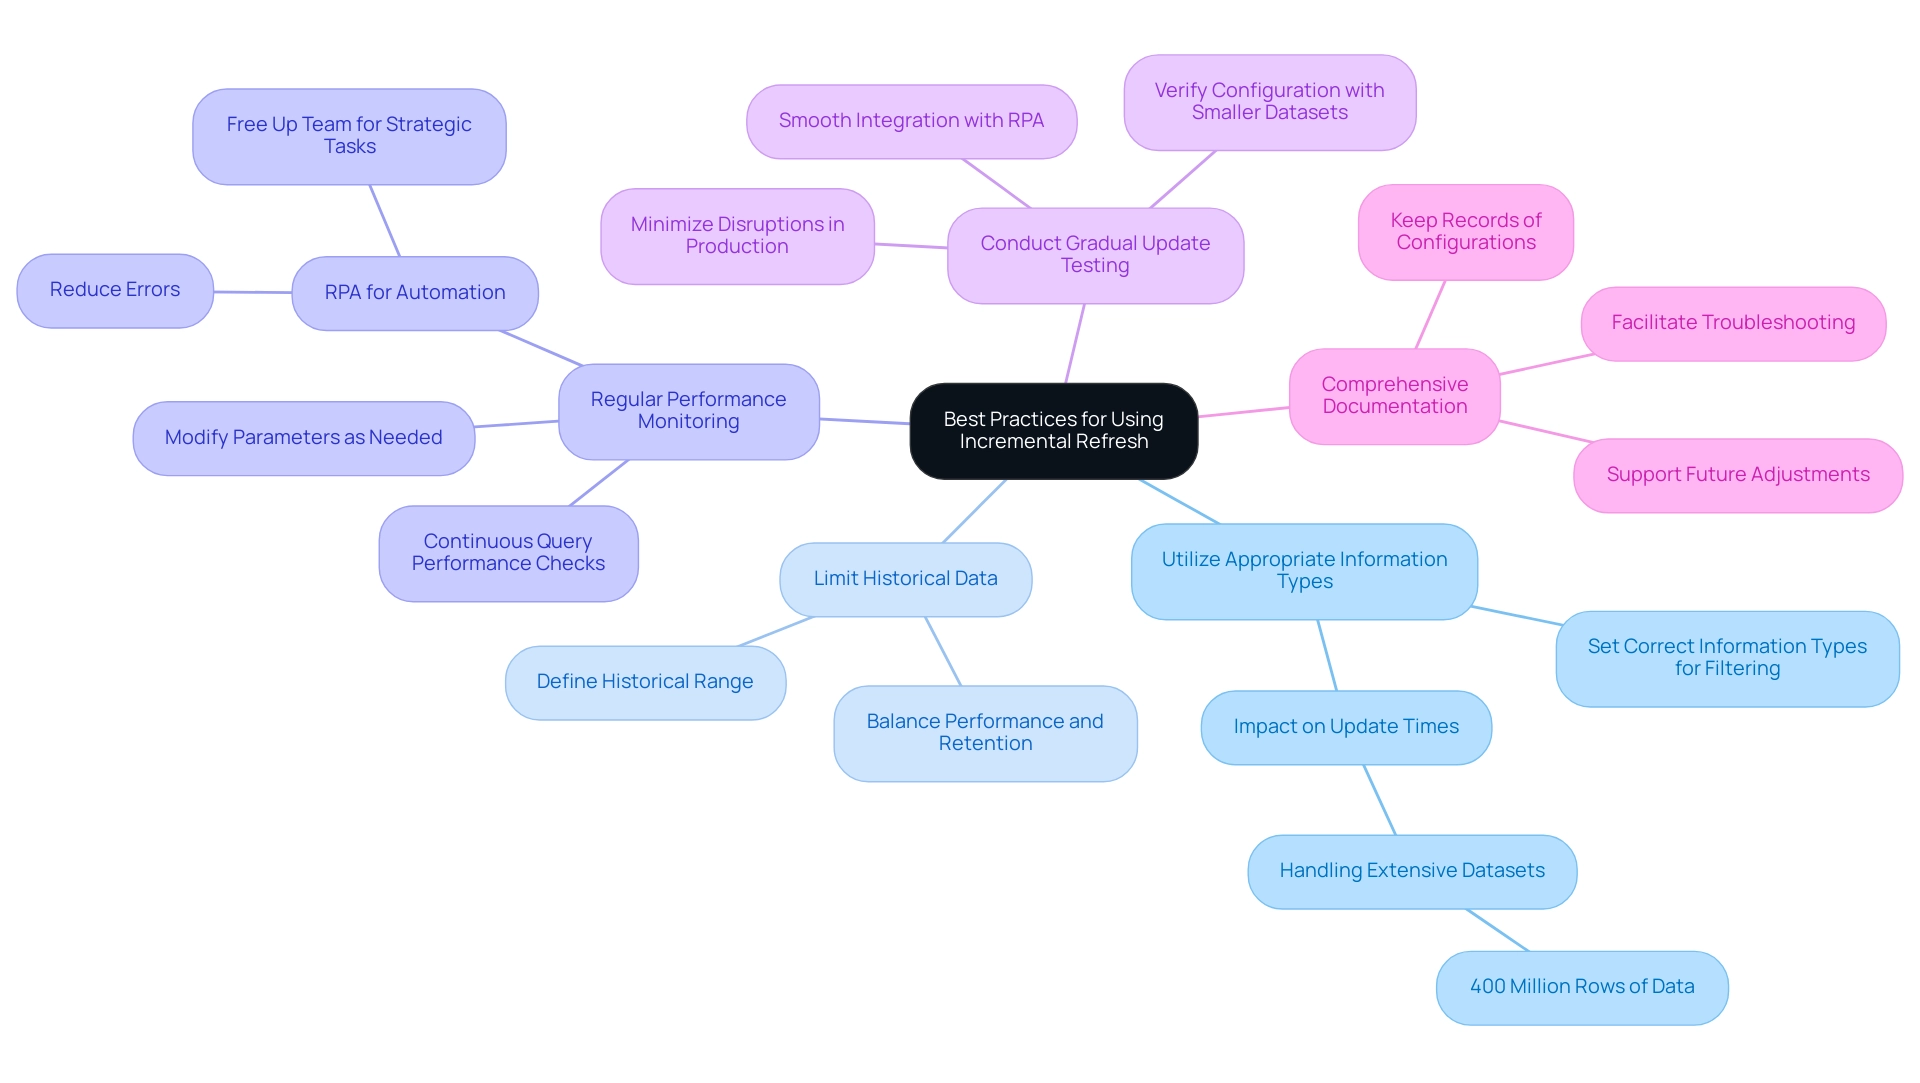
Utilize Appropriate Information Types: Ensure that filtering fields, especially date fields, are accurately set to the correct information types. This step is essential for optimal filtering effectiveness, greatly affecting update times when handling extensive datasets, such as a source table containing 400 million rows of information for the past 2 years.
-
Limit Historical Data: Define a judicious historical range when configuring incremental refresh parameters. Balancing performance with information retention needs is essential, as excessive historical information can hinder overall performance.
-
Regular Performance Monitoring: Continuously monitor the performance of your queries. If you experience slowdowns, modify your parameters or enhance your information sources accordingly. This proactive approach ensures sustained efficiency in data retrieval and highlights how RPA can help automate monitoring processes, reducing the risk of errors and freeing up your team for more strategic tasks.
-
Conduct Gradual Update Testing: Before implementing gradual updates in a production environment, verify your configuration using a smaller dataset. This practice confirms that the setup functions as intended, minimizing disruptions when fully implemented and allows for smoother integration with RPA solutions.
-
Comprehensive Documentation: Keep thorough records of your gradual update configurations and any changes implemented. This resource is invaluable for troubleshooting and making future adjustments with confidence, facilitating RPA integration for streamlined updates.
By following these best practices, you can greatly improve your incremental update experience with Power Query refresh only new data, ensuring that your management processes remain both efficient and effective. As Soheil Bakhshi noted, “I hope you enjoyed reading this long blog and find it helpful,” emphasizing the importance of thorough guidance in information management.
Furthermore, utilizing the latest advancements, such as the Detect alterations feature, enables you to concentrate refresh efforts on specific partitions that have changed, further enhancing performance. It’s also important to note the limitations of using Incremental Refresh with REST API information sources, as highlighted in a case study discussing potential challenges in query folding, which is crucial for efficient information retrieval. This awareness will help you navigate the complexities of data management more effectively, particularly in a rapidly evolving AI landscape where manual, repetitive tasks can significantly slow down operations.
By implementing RPA, you can streamline these workflows, enhance accuracy, and ultimately drive better business outcomes.
Troubleshooting Common Issues with Incremental Refresh
When setting up incremental updates in Power BI, users may encounter several common challenges that can hinder their efficiency. Here are some actionable troubleshooting tips to enhance your refresh experience while overcoming these obstacles:
-
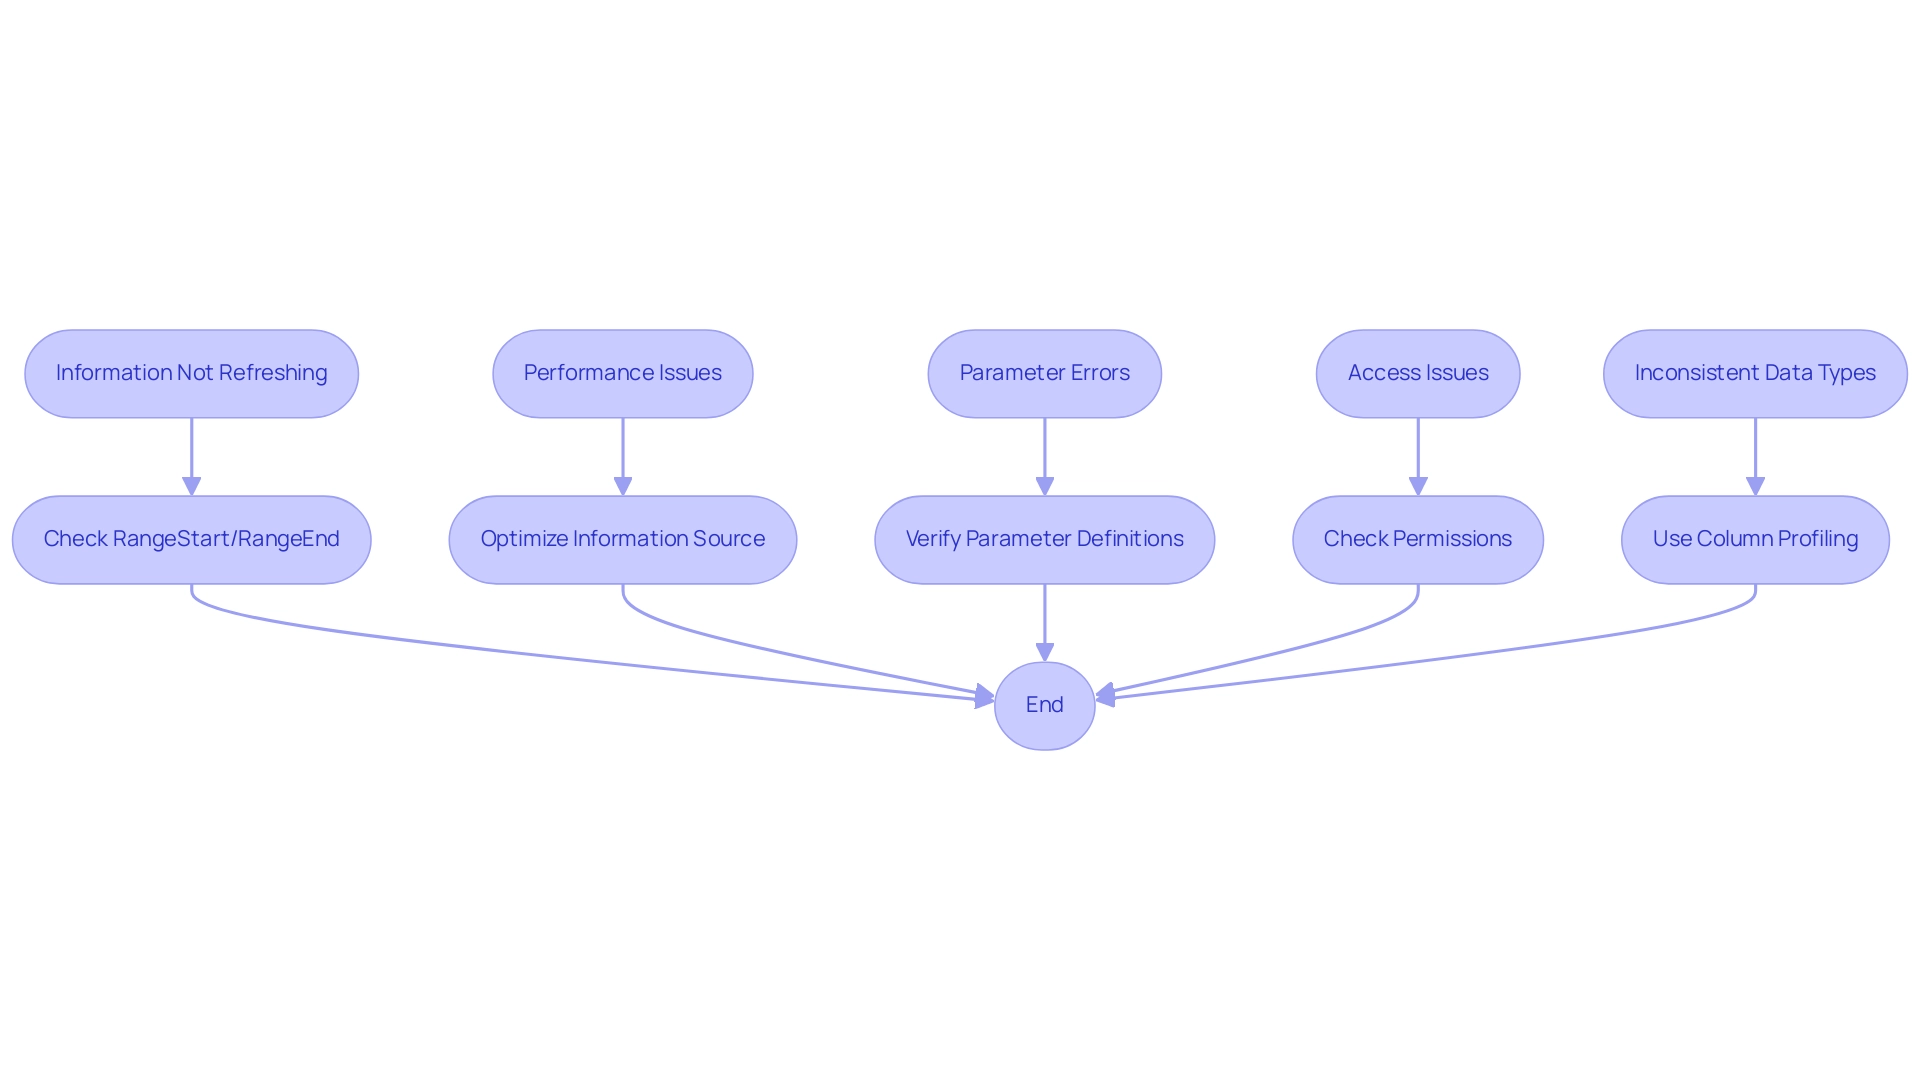
Information Not Refreshing as Expected: If new information fails to appear post-refresh, it’s crucial to verify the RangeStart and RangeEnd parameters.
Misconfiguration here can easily lead to missing updates. Additionally, ensure that the information source itself is current and accessible, as outdated information can impede your ability to leverage insights effectively. -
Performance Issues: Slow update rates can be frustrating, especially in a data-rich environment where timely insights are vital.
Consider optimizing your information source or reducing the volume of historical records retained. This is especially vital for users handling large datasets, like the 25 million records that have caused some to encounter time-out errors during updates. By improving information sources, you can greatly enhance update performance and ensure your team can concentrate on more strategic, value-adding tasks. -
Parameter Errors: Pay close attention to how parameters are defined and referenced in your filters.
Even minor typos or misconfigurations can lead to substantial errors during updates, derailing your efforts and wasting valuable time. Implementing RPA solutions can help automate these checks, reducing the likelihood of human error and streamlining the process of managing parameters. -
Access Issues: Permission problems can hinder information updates.
Ensure that your Power BI Service account has the necessary access rights to the data sources involved. Without appropriate permissions, update attempts may fail, highlighting the importance of streamlined access management in your operations. -
Inconsistent Data Types: Data type mismatches across your dataset can disrupt filtering and prevent the incremental update from executing properly.
As Selina Zhu from the Community Support Team advises,In my experience, the information shown consists of only the first 1000 rows, while errors may lurk in subsequent rows. Using ‘Column profiling based on the entire dataset‘ can help identify any discrepancies, particularly with date formats.
This method is crucial for handling inconsistent information types that could disrupt your update process.
Additionally, consider the proactive measure of enabling Large Model Storage Format for models exceeding 1 GB published to Premium capacities.
This can improve update performance and prevent size limit challenges, ensuring smoother update operations for larger models.
By proactively addressing these common issues and leveraging RPA to automate repetitive tasks, users can troubleshoot effectively, ensuring a smoother gradual update process.
This not only enhances operational efficiency but also empowers teams to extract meaningful insights from Power BI dashboards, driving data-driven decision-making that fosters business growth. Furthermore, integrating customized AI solutions can offer extra assistance in optimizing information handling and analysis, further alleviating the competitive disadvantage of struggling to extract insights.
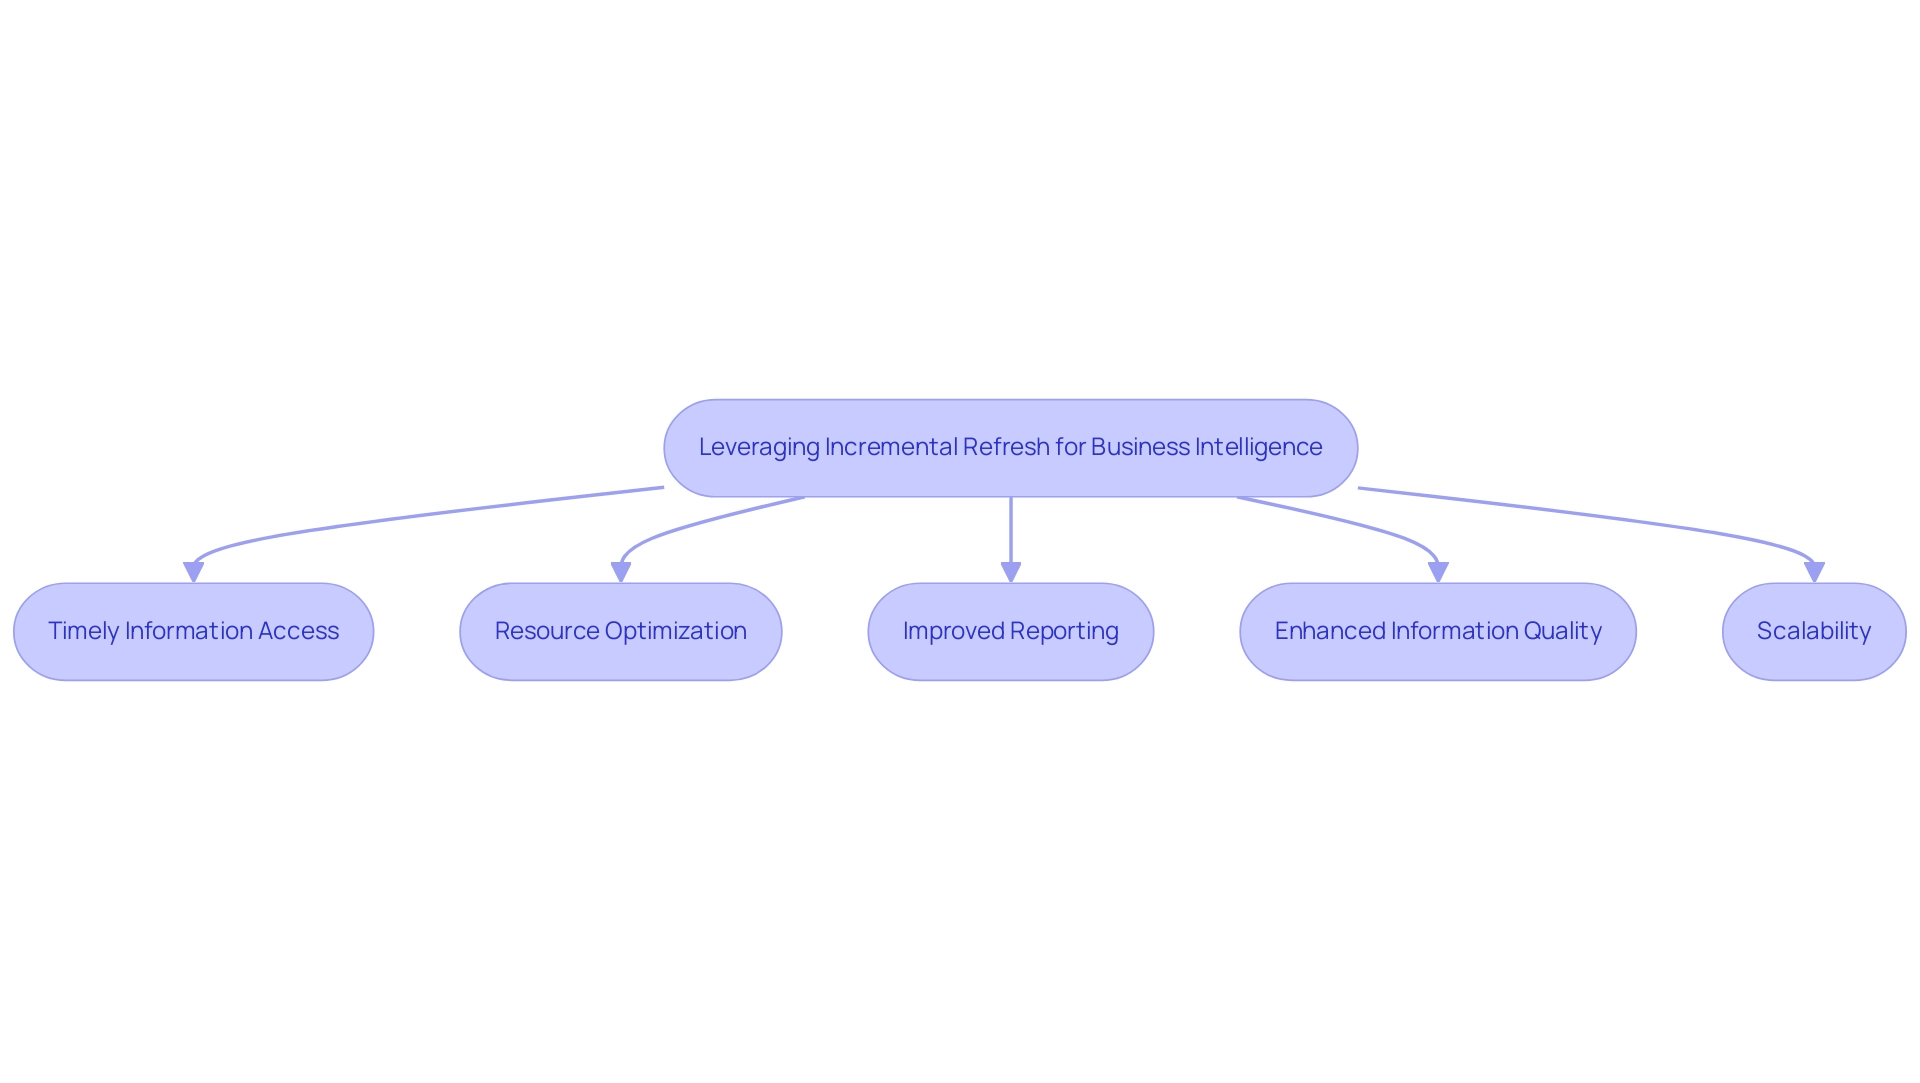
Leveraging Incremental Refresh for Business Intelligence
Applying gradual updates is an effective approach that can greatly enhance your organization’s business intelligence abilities, particularly when combined with Robotic Process Automation (RPA) to streamline manual workflows. Here’s how:
- Timely Information Access: Organizations can utilize power query to refresh only new data, providing decision-makers with the most current insights and fostering informed choices that drive success.
This is especially advantageous when utilizing large quantities of information obtained from ServiceNow, as incremental updates can conserve time and resources in the information update process. Moreover, RPA can automate these update tasks, ensuring timely updates without manual intervention, thereby reducing the potential for errors.
- Resource Optimization: Gradual updating reduces the pressure on information sources and processing resources.
This efficiency allows teams to concentrate on analysis and deriving insights rather than getting bogged down in data management tasks. Significantly, during each update operation, the model processes approximately 30,000 rows, highlighting the substantial resource savings achievable. Moreover, RPA can simplify the scheduling process, enhancing resource utilization even more.
Enabling the large semantic model storage format setting can also improve refresh performance for models exceeding 1 GB, ensuring that organizations can handle larger datasets effectively.
- Improved Reporting: The speed of refreshes associated with incremental updates enables quicker report generation, equipping stakeholders with timely insights to influence business strategies effectively.
By integrating RPA, organizations can automate report generation, ensuring that the most recent information is always available for decision-making, thus freeing up team members to focus on strategic initiatives.
- Enhanced Information Quality: By prioritizing new information, organizations can implement robust validation processes, ensuring that the details used for decision-making are both accurate and reliable.
RPA can aid in overseeing information quality during update processes, further boosting confidence in the information. This proactive approach helps mitigate the risks associated with manual information handling, which often leads to errors and inconsistencies.
- Scalability: As organizations grow, gradual updates enable scalable information management practices that can effortlessly adjust to rising quantities without compromising performance.
Continuous learning, as highlighted by The Knowledge Academy, is essential here; whether you are a beginner or looking to advance your Business Intelligence Reporting skills, their diverse courses have you covered. RPA facilitates scalability by automating repetitive tasks, enabling teams to concentrate on strategic initiatives.
By utilizing gradual update techniques alongside RPA, organizations can revolutionize their data management processes, allowing for a power query refresh only new data, which results in improved operational efficiency and better-informed business decisions.
For instance, after setting up an incremental update policy, successful publication of the model to the service ensures compliance with size limits, particularly for models anticipated to exceed 1 GB. This results in initial refresh operations that optimize performance and resource use, marking a significant step forward in business intelligence for 2024 and beyond.
Furthermore, integrating tailored AI solutions can further enhance RPA’s capabilities, ensuring that organizations stay ahead in the rapidly evolving AI landscape.
Conclusion
Implementing incremental refresh in Power Query undeniably transforms data management practices, allowing organizations to optimize performance and streamline workflows. By refreshing only the new or modified data, businesses can significantly reduce load times and resource consumption, which is particularly beneficial when handling large datasets. The incorporation of Robotic Process Automation (RPA) amplifies these advantages, automating repetitive tasks and providing teams with the freedom to focus on strategic initiatives that drive growth.
The step-by-step guide offered herein equips organizations with the necessary tools to configure incremental refresh effectively, ensuring timely access to the most relevant data. Adopting best practices, such as maintaining accurate data types and conducting regular performance monitoring, further enhances the efficiency of data refresh processes. Moreover, by proactively addressing common troubleshooting issues, teams can maintain smooth operations and foster a data-driven culture.
Ultimately, leveraging incremental refresh alongside RPA not only enhances operational efficiency but also empowers organizations to make informed decisions based on timely insights. As businesses continue to evolve in an increasingly data-centric world, adopting these innovative approaches will be crucial for maintaining a competitive edge. Embracing these strategies today positions organizations for success tomorrow, ensuring they can navigate the complexities of data management with agility and confidence.
Overview
To create and manage Power Query relationships effectively, one must understand the types of connections (one-to-one, one-to-many, and many-to-many) and follow a structured approach in the Query Editor to establish and maintain these relationships. The article provides a comprehensive guide that includes step-by-step instructions for creating relationships, troubleshooting common issues, and implementing best practices, emphasizing the importance of automation and documentation to enhance operational efficiency and data integrity.
Introduction
In the realm of data management, mastering relationships within Power Query is not just a technical necessity but a strategic advantage that can elevate operational efficiency. Understanding how different tables interact is fundamental to crafting a robust data model that can drive insightful business decisions. This article delves into the intricacies of establishing and managing these relationships, providing a comprehensive guide that encompasses everything from basic configurations to advanced troubleshooting techniques.
By embracing best practices and leveraging automation tools like Robotic Process Automation (RPA), organizations can streamline their data processes, mitigate common issues, and ultimately empower their teams to focus on strategic initiatives rather than repetitive tasks.
As the data landscape continues to evolve, equipping oneself with these skills will be crucial for harnessing the full potential of data analytics and fostering sustainable business growth.
Understanding Relationships in Power Query: A Foundation for Data Management
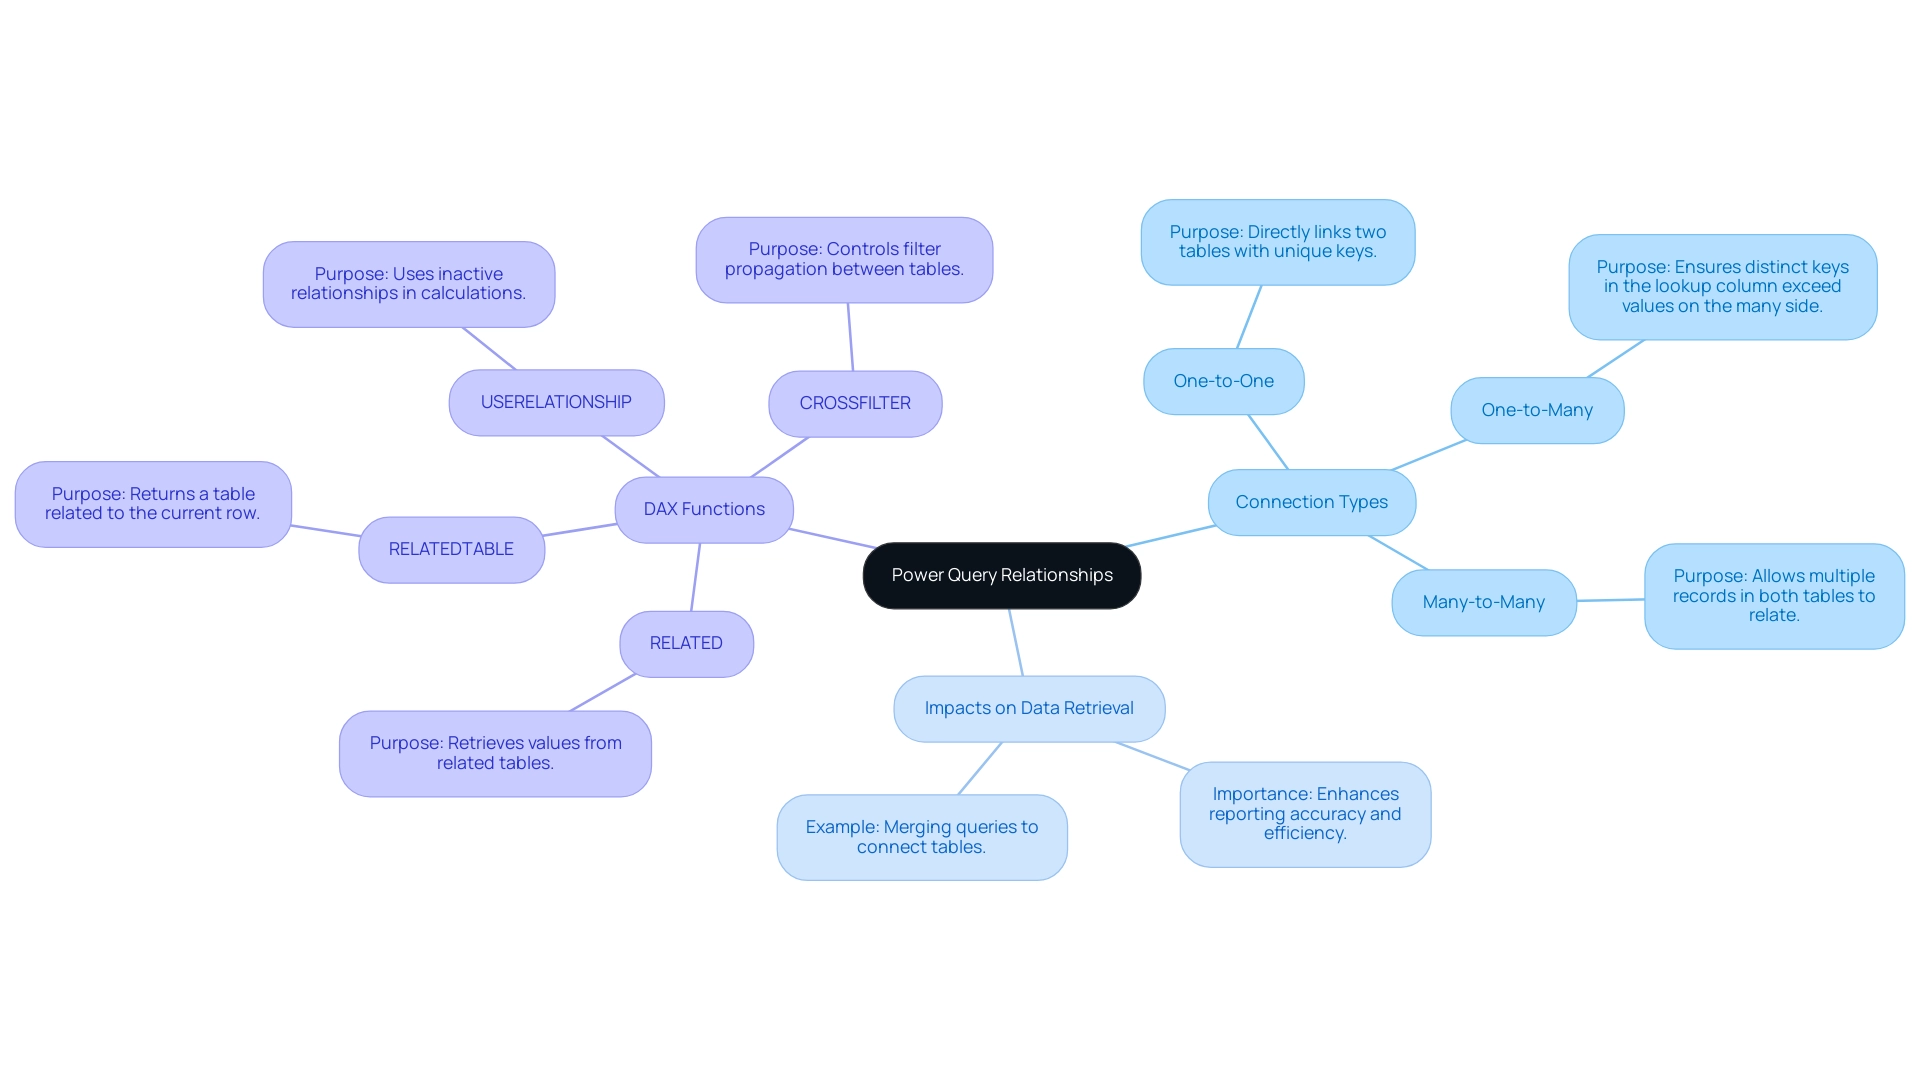
In Power Query, grasping power query relationships is crucial for how information from various tables interacts, allowing a thorough approach to analysis that enhances operational efficiency. A strong understanding of power query relationships is essential for building a sturdy information model that efficiently utilizes Business Intelligence. There are three primary types of connections: one-to-one, one-to-many, and many-to-many.
Each connection type serves a distinct purpose and significantly impacts how information is retrieved and presented in reports. For example, a one-to-many association guarantees that the number of distinct keys in the lookup column surpasses the values on the many side, resulting in precise information retrieval. Jorge Pinho, a recognized Solution Sage, emphasizes practical application by stating,
It is possible!
In Query Editor, go to the Sales table and use ‘Merge Queries’ to connect to the Dimension table by the Location Key column. This will bring the columns from the Dimension Table to the Sales table. This capability exemplifies how effectively utilizing power query relationships can enhance your inquiries and address challenges such as time-consuming report creation and information inconsistencies.
Furthermore, integrating Robotic Process Automation (RPA) solutions can significantly alleviate task repetition fatigue and staffing shortages, enhancing overall operational efficiency. Moreover, various DAX functions aid in handling connections in BI, including:
- RELATED
- RELATEDTABLE
- USERELATIONSHIP
- CROSSFILTER
These functions help in managing power query relationships, assisting you in obtaining values and managing filter propagation. This tool offers three connection types:
- Import
- DirectQuery
- Live Connection
These are essential for enhancing access in relation to power query relationships.
As you become acquainted with these concepts, you will be well-prepared to create effective queries that harness the full potential of your information, driving informed decision-making and ultimately fostering business growth.
Step-by-Step Guide to Creating and Managing Power Query Relationships
-
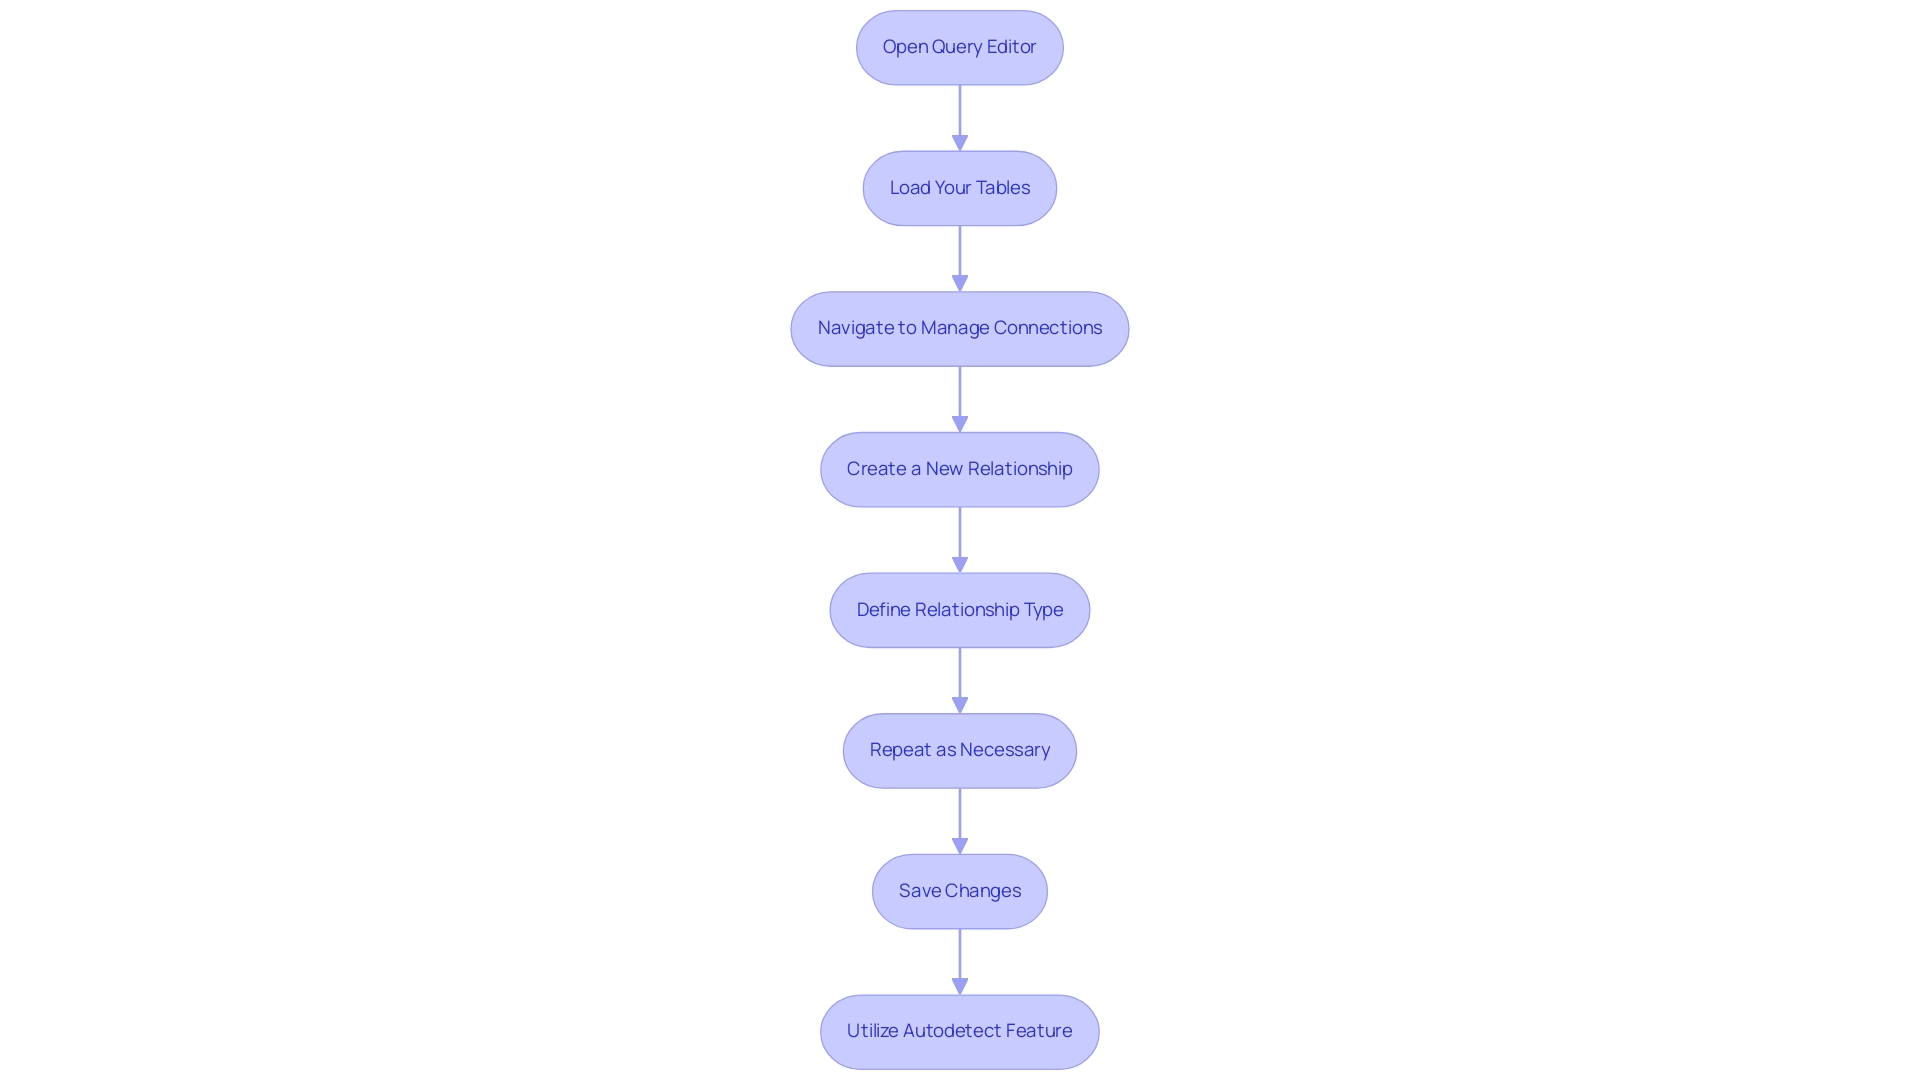
Open Query Editor: Begin by launching Excel and navigating to the Data tab. Select ‘Get Data’ to open the Power Query Editor, a powerful tool for managing your information efficiently through power query relationships in a landscape where manual workflows can bog down operations. Automating this process with Robotic Process Automation (RPA) can significantly reduce the time spent on data preparation.
-
Load Your Tables: Import the tables that you plan to establish connections between. For instance, consider the ProjectTickets table, which contains connections such as Submitted By and opened By. This foundational step is crucial for effective modeling and aligns with the need to streamline workflows through automation, particularly in managing power query relationships, allowing your team to focus on strategic tasks instead of repetitive handling.
Navigate to the ‘Manage Connections’ Option: In the Power Query Editor, click on the ‘Home’ tab and select ‘Manage Connections’ to access the power query relationships management features, thereby enhancing your information’s integrity and usefulness. RPA can streamline the management of these connections, ensuring consistency and precision in your models.
Create a New Relationship: Click on ‘New’ to start establishing relationships. Choose the tables you want to link and select the columns that will function as primary and foreign keys. This step is crucial for ensuring precise connections using power query relationships that drive actionable insights. Automating this process can minimize errors and save valuable time.
- Define Relationship Type: Specify the type of relationship—either one-to-one or one-to-many—based on the nature of your information. Once specified, click ‘OK’ to execute the connection, ensuring that your power query relationships are strong and ready for analysis. RPA tools can help in automatically identifying and recommending connection types based on your information patterns.
Repeat as Necessary: Continue the process by incorporating further connections as needed for your information model, ensuring a comprehensive structure that can support advanced analytics. Automating this step can help maintain a consistent approach across your power query relationships.
Save Changes: After establishing all necessary connections, click ‘Close & Load’ to save your changes and return to Excel. RPA can also automate the saving and loading processes, ensuring that your information is always up-to-date without manual intervention.
Utilizing the Autodetect feature can streamline this process, especially when both columns share the same name, making relationship creation even more efficient. As emphasized in the case study titled ‘Building a Model in Power BI,’ understanding power query relationships between tables is crucial to avoiding mistakes and achieving effective modeling. The insights gained will empower you to leverage DAX expressions for intricate metrics, enhancing your overall analytical capabilities in conjunction with RPA.
However, be mindful of potential pitfalls, as noted by analyst Ricardo: ‘At first I did what you suggested, and it worked for creating the summary table, but broke the visualizations I already had in the report, because the fields they used were no longer present.’ This highlights the significance of careful management of power query relationships to maintain the integrity of your reports, thereby enhancing operational efficiency. In the context of the rapidly evolving AI landscape, leveraging RPA not only simplifies these processes but also helps navigate the complexities of information management, allowing you to focus on deriving insights that drive business growth.
Configuring Advanced Relationship Properties in Power Query
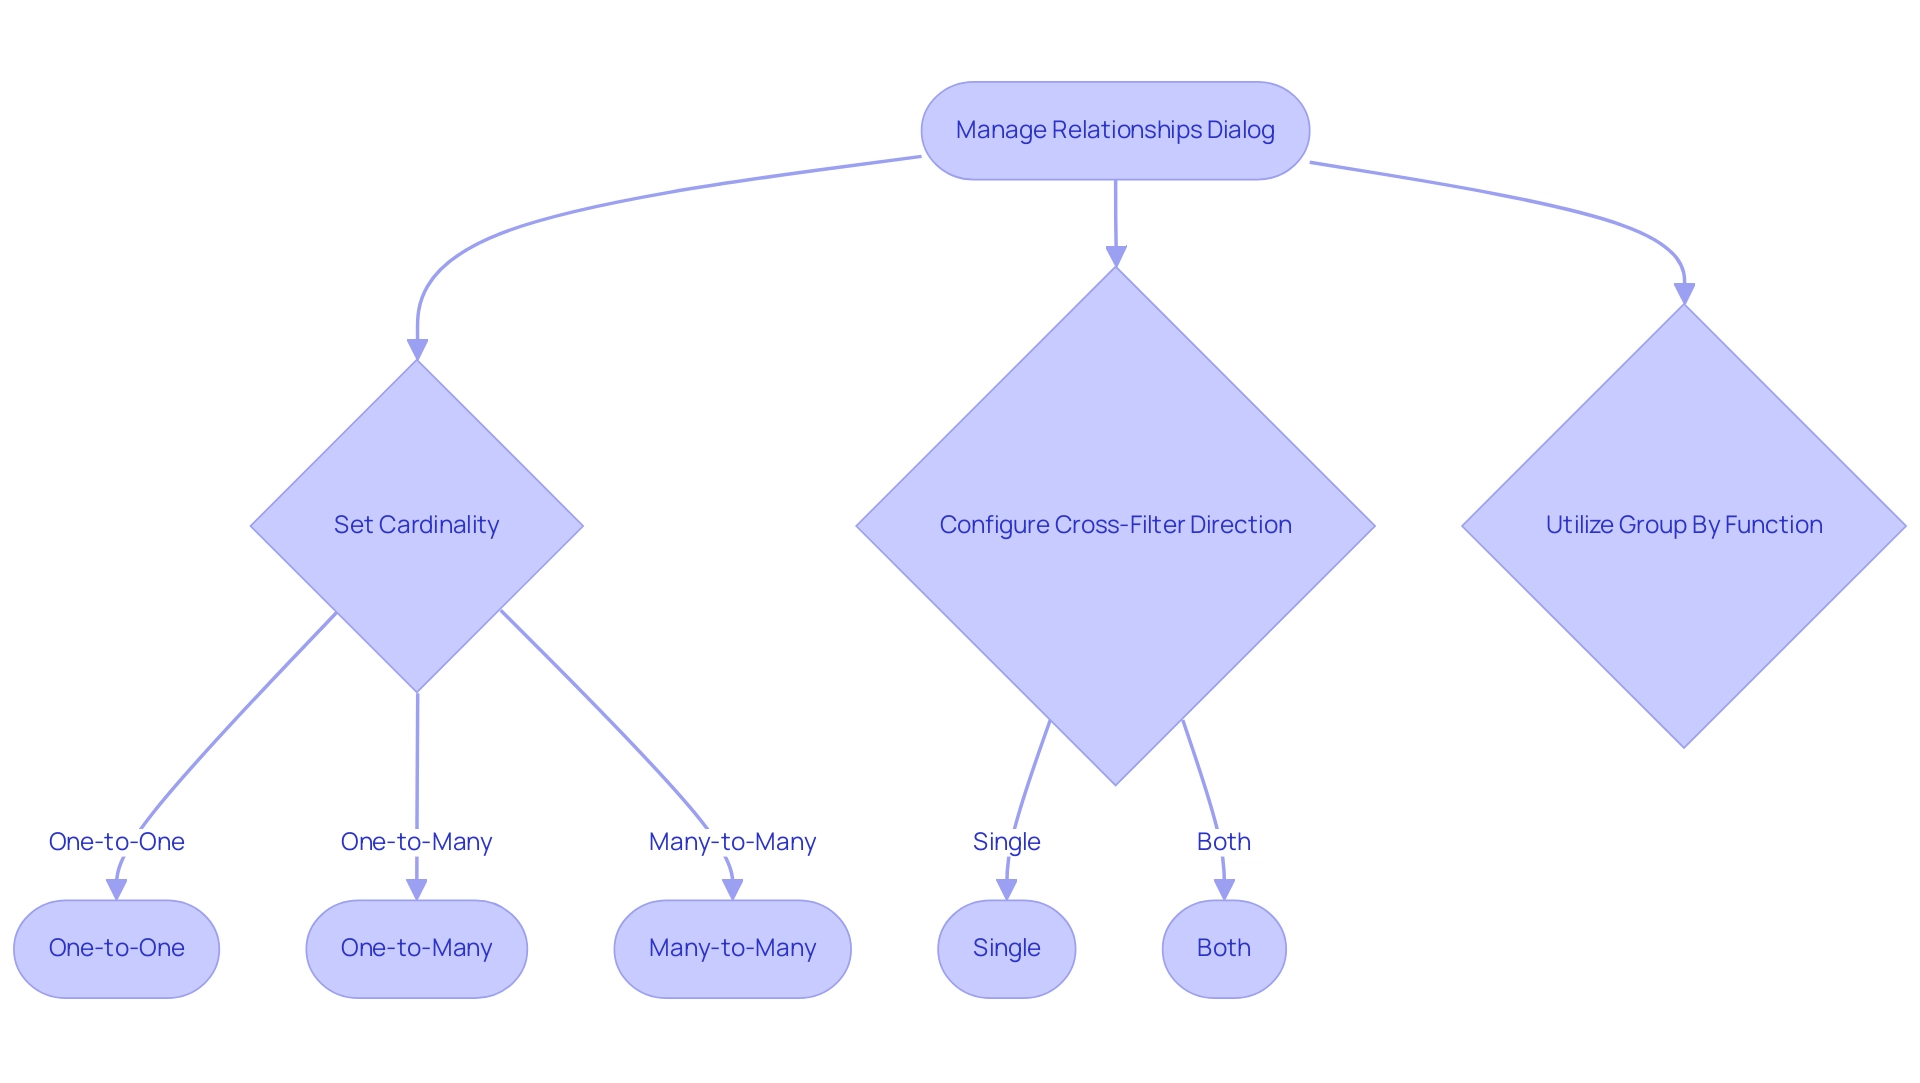
To effectively configure advanced relationship properties in Power BI, begin by managing power query relationships in the ‘Manage Relationships’ dialog. This feature allows you to define cardinality settings—one-to-one, one-to-many, or many-to-many—based on your tables’ structure. Comprehending these cardinality settings is essential, particularly with 100 different categories included in your fact table, as they determine power query relationships and affect report outcomes.
Failing to understand these settings can leave your business at a competitive disadvantage when trying to extract meaningful insights from your information.
Moreover, the cross-filter direction setting in power query relationships significantly impacts how filters propagate across related tables. By selecting ‘Both’ for cross-filter direction in power query relationships, you enable filters to flow in both directions, which is particularly advantageous for complex models with interdependencies. Adjusting these settings can enhance your analysis accuracy and improve query performance.
For example, in a case study named ‘Configuring Connection Options,’ it was noted that BI Desktop automatically sets up connection options based on column information. This automatic configuration empowers users to adjust additional settings for their specific information needs, ensuring connections accurately reflect the material being analyzed. Moreover, employing the Group by function enables users to arrange and handle connections more efficiently, further improving BI’s analytical capabilities.
Rob Miles observes, ‘Begin to Code: Building apps and games in the Cloud,’ highlighting the significance of comprehending how information values connect in BI. In summary, by concentrating on cardinality, cross-filter direction, and utilizing features like Group by, you can enhance your power query relationships, which leads to improved accuracy and more insightful analytics. Moreover, combining strong BI with RPA solutions like EMMA RPA and Automate can enhance operational efficiency, facilitating informed decision-making that promotes business growth and innovation.
Consider exploring these RPA tools to enhance your information management processes and overcome the challenges of time-consuming report creation and inconsistencies.
Troubleshooting Common Issues in Power Query Relationships
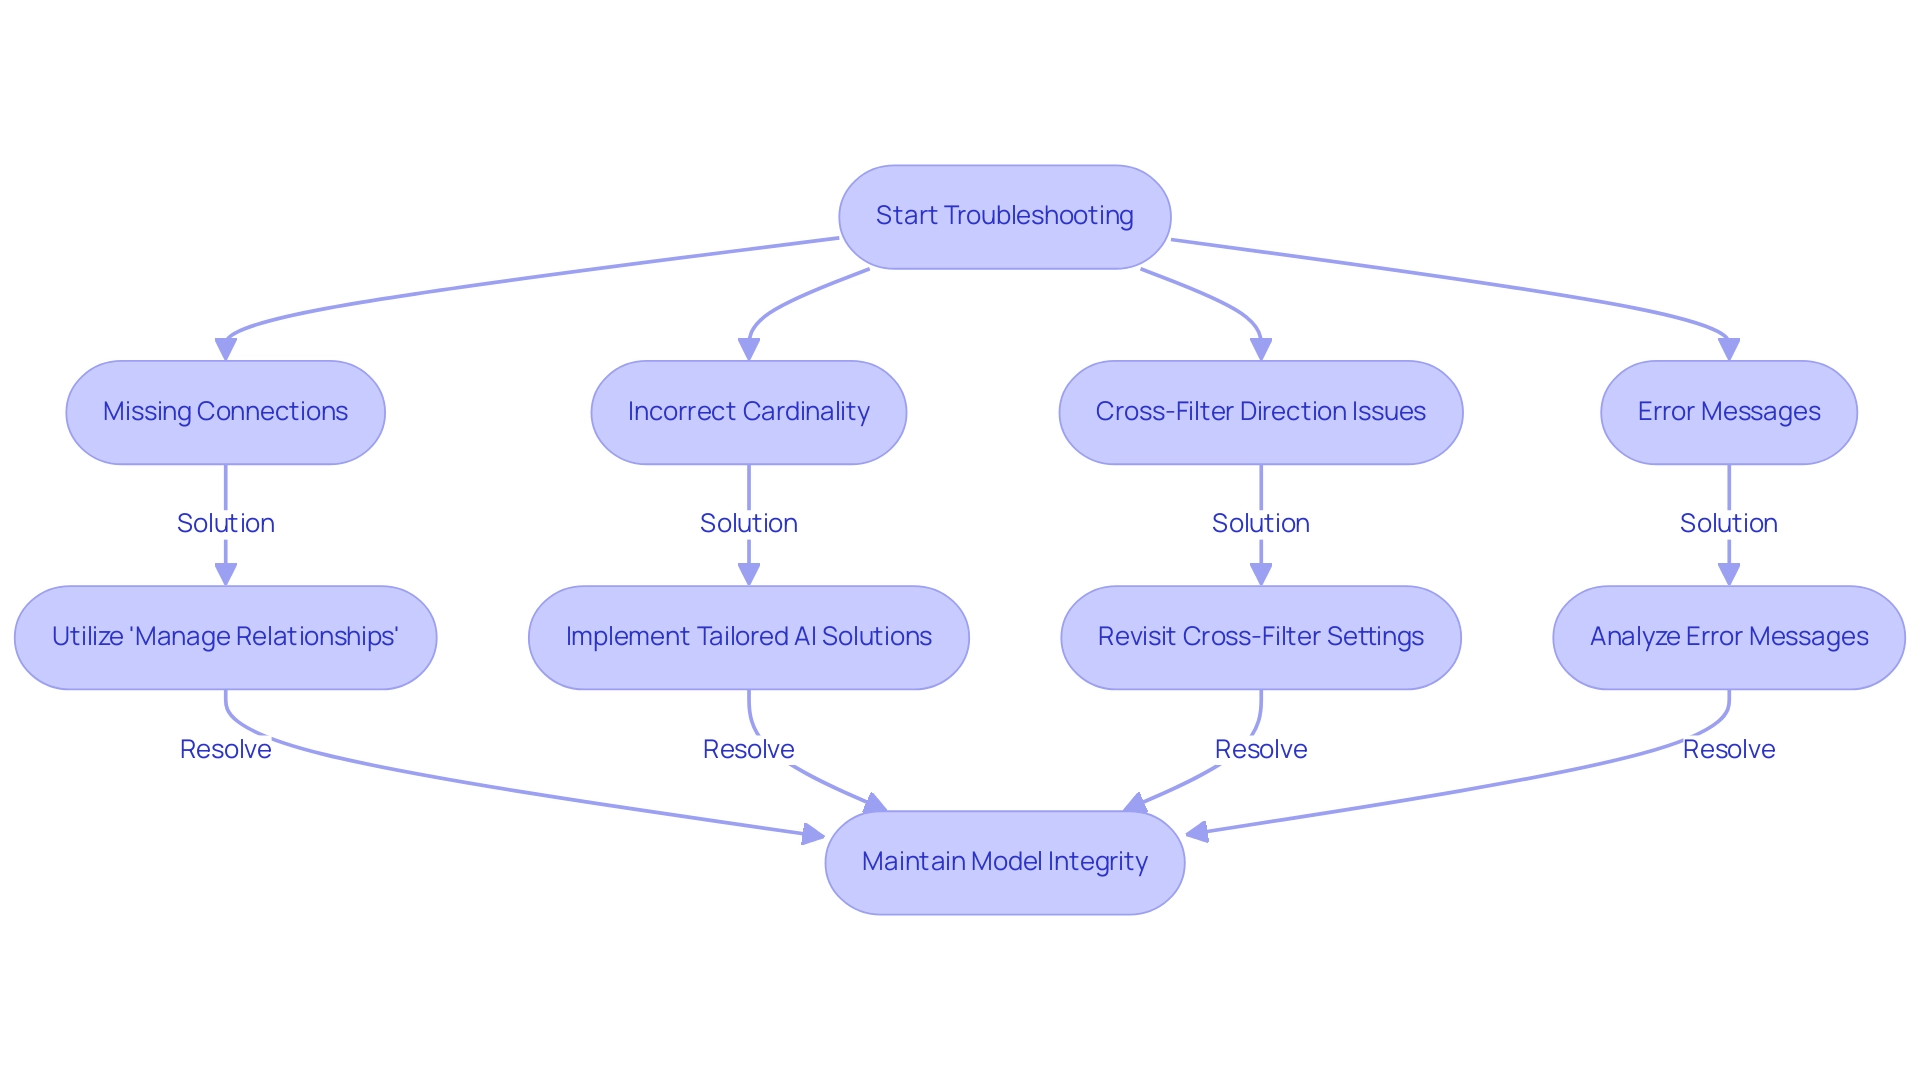
Navigating power query relationships can present several challenges, but effectively addressing these can enhance your information management capabilities and operational efficiency. Here are some typical problems you may face:
- Missing Connections: If your information is not showing as expected, ensure that connections are properly established. Utilize the ‘Manage Relationships’ feature to confirm that all necessary connections in your power query relationships are in place. This proactive step can be complemented by Robotic Process Automation (RPA) to automate routine checks, ensuring information integrity and saving valuable time through effective power query relationships.
- Incorrect Cardinality: The cardinality of a relationship dictates how information from one table relates to information from another. Ensuring the correct cardinality in power query relationships is vital; incorrect configurations in these relationships can lead to missing or duplicated information, compromising your analysis. Tailored AI solutions can assist in identifying patterns and anomalies in your information, helping you rectify these issues swiftly.
- Cross-Filter Direction Issues: Filters may not behave as expected if the cross-filter direction isn’t correctly configured. Revisiting these settings and making necessary adjustments can effectively resolve filtering problems, empowering you to make informed decisions based on precise information.
- Error Messages: Pay close attention to any error messages that arise during information loading. These messages often provide valuable insights into underlying issues that need addressing. Employing Business Intelligence tools can assist you in converting these insights into practical strategies, especially in addressing difficulties related to inadequate master information quality.
Furthermore, Query can face challenges with collections that feature diverse types, such as text, numbers, and nested tables within a single column, complicating relationship management and information integrity. Moreover, the lack of built-in password protection for query code presents a potential threat to security when handling power query relationships.
To improve collaboration and information management through power query relationships, consider strategies such as using OneDrive or SharePoint, adopting Power BI dataflows, and documenting changes, as emphasized in the case study titled ‘Solutions for Better Collaboration.’ These methods can centralize transformation processes and enhance version control, facilitating better teamwork and ensuring that your operational strategies are aligned with your business objectives.
By implementing these troubleshooting strategies and best practices, you can significantly maintain the integrity of your model through power query relationships. As noted by Paul D. Brown, a Community Champion, > Thanks for that very comprehensive explanation. It all makes sense of course.
This reflects the importance of understanding and applying best practices in your power query relationships to ensure optimal performance and drive innovation.
Best Practices for Maintaining Relationships During Data Source Changes
-
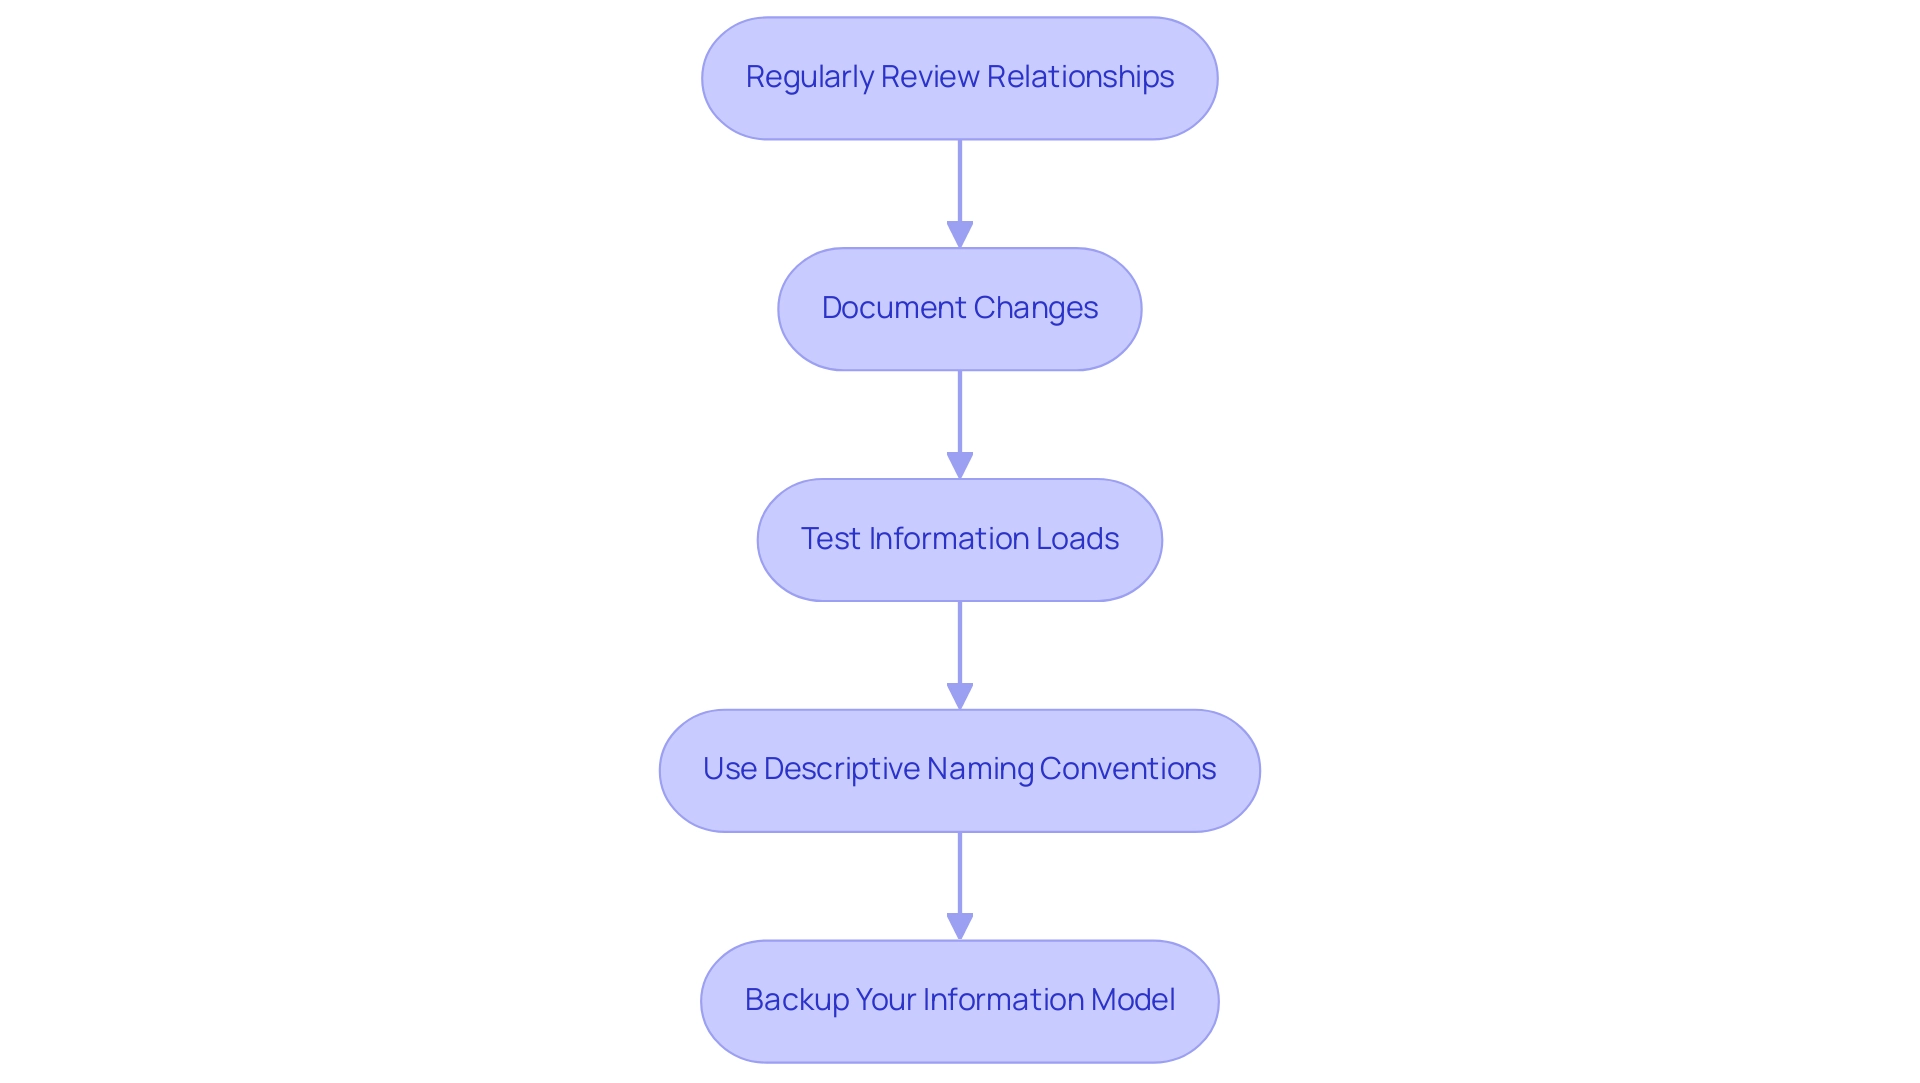
Regularly Review Relationships: Following any change to a source, it is crucial to revisit the ‘Manage Relationships’ dialog. This step ensures that all connections remain valid and functional, preventing potential disruptions in your analysis. By incorporating Robotic Process Automation (RPA), you can automate this review process, such as scheduling regular checks to confirm that connections are intact, boosting efficiency and allowing your team to focus on strategic tasks. As indicated in statistical practices, larger effect sizes necessitate smaller sample sizes to attain the same power, emphasizing the significance of preserving precise relationships.
-
Document Changes: Maintaining a thorough record of alterations made to information sources and relationships is crucial. This documentation enhances transparency and facilitates troubleshooting. Utilizing Business Intelligence tools can assist this process by offering insightful analytics on changes over time, as highlighted by the National Institutes of Health‘s emphasis on preserving information integrity and reproducibility. RPA can also be used to automate the documentation process, ensuring that all changes are recorded promptly and accurately.
-
Test Information Loads: After implementing changes, perform loads to identify any discrepancies or issues that may arise. This testing phase is essential for confirming that your updates have not compromised the integrity of the information. Employing RPA can automate this testing, ensuring consistent validation of your workflows. For instance, RPA can run predefined tests that check for consistency and accuracy after each update.
-
Use Descriptive Naming Conventions: Adopting clear and descriptive naming conventions for tables and relationships simplifies the identification of elements during updates, reducing the likelihood of errors. This practice supports a more organized information environment, further enhanced by tailored AI solutions that can suggest optimal naming practices based on your context, ensuring that names are intuitive and consistent.
-
Backup Your Information Model: Prior to executing significant changes, always create a backup of your information model. This precautionary measure safeguards against data loss, ensuring you can revert to a stable version if necessary. Implementing automated backup processes through RPA can enhance your operational efficiency, allowing backups to occur at scheduled intervals without manual intervention.
By adhering to these best practices, you can significantly enhance the integrity and effectiveness of your relationships in Power Query. This approach aligns with current trends in statistical tools, as highlighted in the case study ‘Trends in Statistical Tools and Analysis,’ where organizations increasingly rely on advanced statistical analysis and automation to improve operational efficiency.
Conclusion
Understanding and managing relationships in Power Query is a pivotal element in optimizing data management and enhancing operational efficiency. By mastering the types of relationships—one-to-one, one-to-many, and many-to-many—organizations can construct solid data models that facilitate insightful analysis and informed decision-making. Implementing best practices such as:
- Regular reviews
- Thorough documentation
- Utilizing automation tools like Robotic Process Automation (RPA)
can streamline these processes, allowing teams to focus on strategic initiatives rather than repetitive tasks.
Moreover, configuring advanced relationship properties and troubleshooting common issues is essential for maintaining data integrity and performance. By addressing challenges such as:
- Incorrect cardinality
- Cross-filter direction
businesses can ensure their data remains accurate and reliable. The integration of RPA not only alleviates the burden of manual oversight but also enhances the ability to adapt to changes in data sources seamlessly.
In a rapidly evolving data landscape, equipping teams with the knowledge and tools to effectively manage relationships within Power Query will empower them to harness the full potential of data analytics. Ultimately, this strategic focus on data relationships will drive sustainable business growth, ensuring that organizations remain competitive and capable of making data-driven decisions that foster innovation and operational excellence.
Overview:
Navigating the Power BI Visual Marketplace involves a straightforward process that allows users to enhance their data visualizations with custom visuals tailored for various reporting needs. The article outlines a step-by-step guide for accessing, installing, and customizing these visuals, emphasizing their role in transforming complex data into clear insights that facilitate effective decision-making and storytelling.
Introduction
In the realm of data visualization, the Power BI Visual Marketplace stands out as an invaluable resource for organizations seeking to elevate their reporting capabilities. This vibrant hub is filled with custom visuals that not only enhance the presentation of data but also tackle common operational challenges such as time-consuming report creation and data inconsistencies.
With offerings from both Microsoft and innovative third-party developers, users can access a diverse range of tools designed to transform complex datasets into clear, actionable insights. As the demand for personalized data solutions continues to rise, understanding how to navigate this marketplace is essential for unlocking the full potential of Power BI, ensuring that data storytelling resonates with stakeholders and drives informed decision-making.
Introduction to the Power BI Visual Marketplace
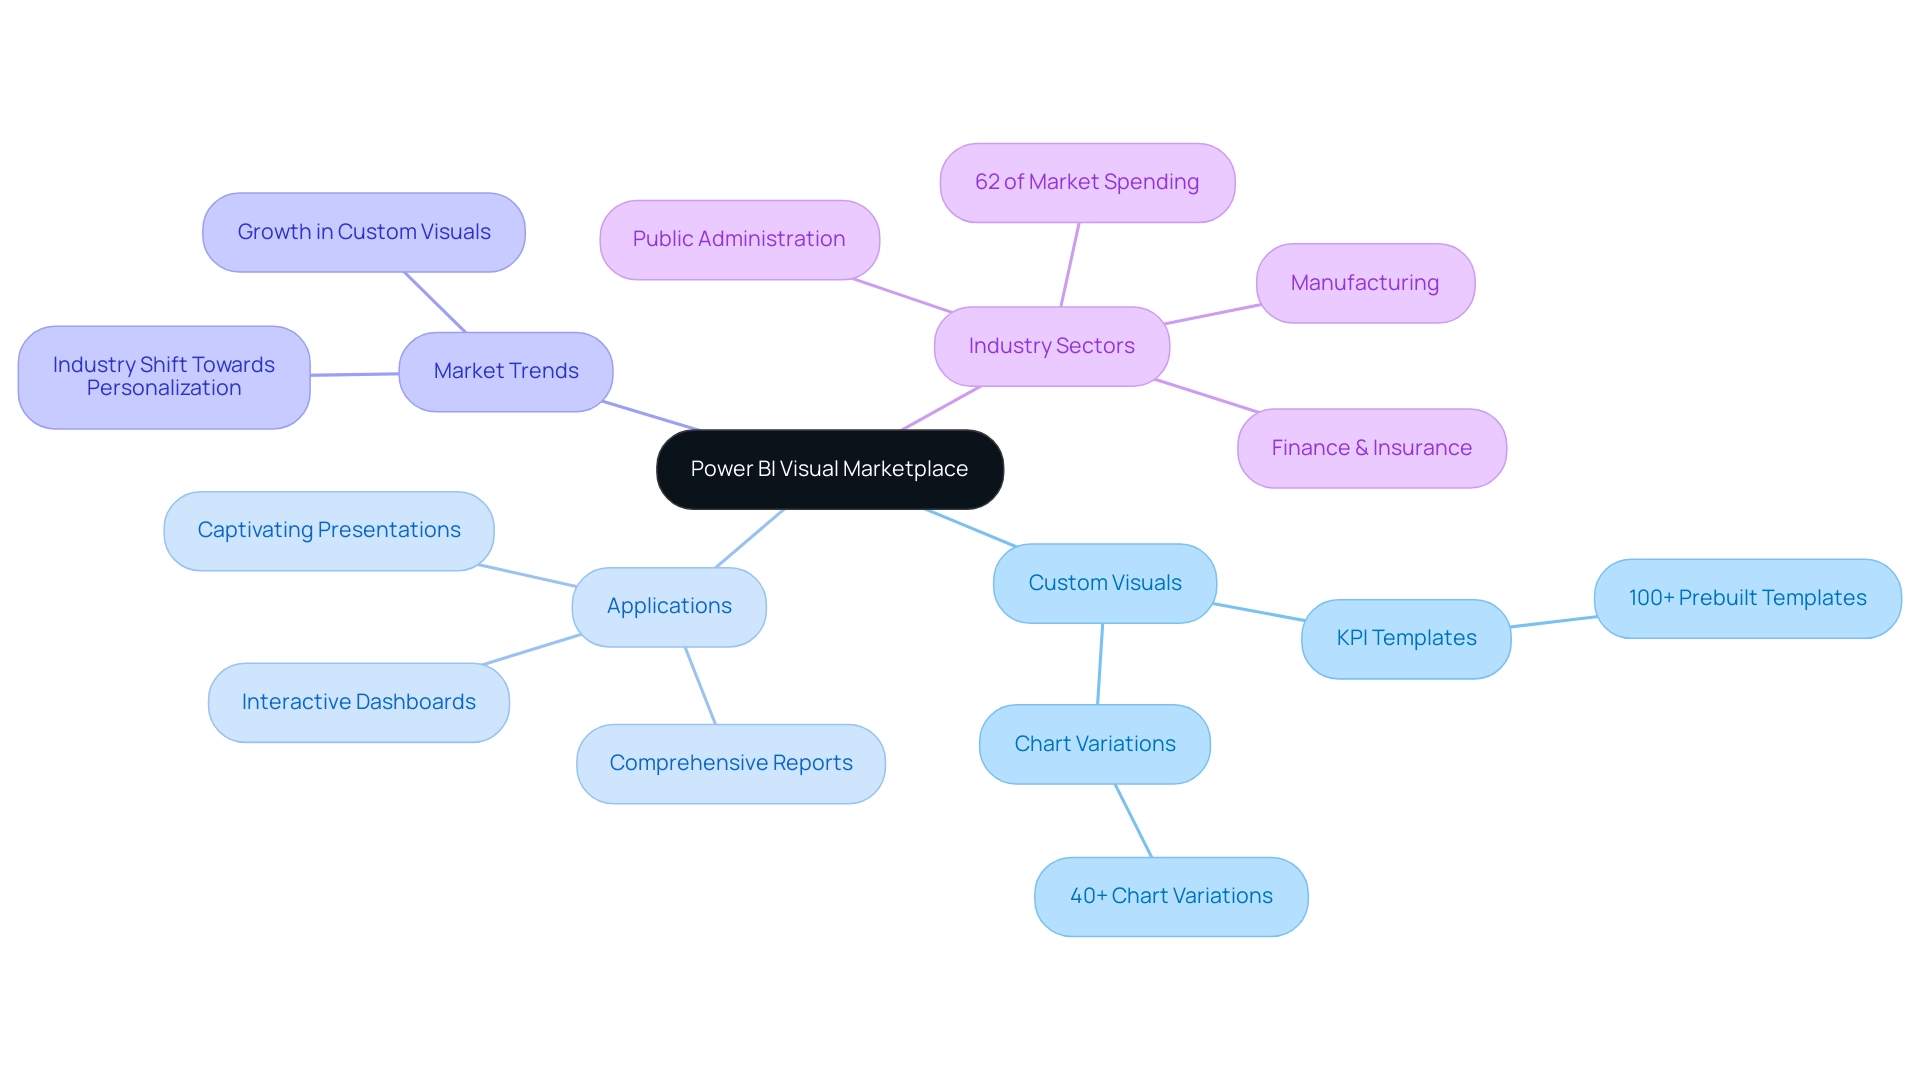
The Power BI Visual Marketplace serves as a dynamic hub for custom representations designed to enhance your information visualization capabilities. This extensive repository showcases a collection of images crafted by Microsoft, alongside innovative offerings from third-party developers, such as KPI by Powerviz, which boasts over 100 prebuilt KPI templates and 40 chart variations. Users can greatly enhance functionality beyond standard visualizations, tackling common challenges such as time-consuming documentation creation and inconsistencies in information.
Importantly, these visuals also offer actionable guidance, transforming complex information into clear insights that drive decision-making. Each visual is tailored to enhance specific aspects of information presentation, whether for interactive dashboards, comprehensive reports, or captivating presentations. By learning to navigate the Power BI Visual Marketplace efficiently, you can unlock the full potential of your Business Intelligence experience, ensuring that your storytelling through information resonates with your audience.
Enterprise Account Director Kevin Scott emphasizes this potential, stating, ‘In this step-by-step video, I showcase how one of my customers leveraged HG Insights’ Technology Intelligence to uncover a $200M opportunity in the Business Intelligence market.’ Recent trends indicate remarkable growth in custom visuals within the Power BI Visual Marketplace, reflecting a broader industry shift towards personalized and impactful visualization solutions. Additionally, the Finance & Insurance, Manufacturing, and Public Administration sectors collectively account for 62% of the overall market spending on BI software, highlighting the significant demand and opportunity for BI solutions.
Embracing these tools not only enhances your reporting capabilities but also fosters a data-driven culture that drives business growth.
Step-by-Step Guide to Navigating the Marketplace
Navigating the power bi visual marketplace is a straightforward process that opens up a world of interactive information presentation and storytelling. By leveraging Business Intelligence tools, you can combat challenges such as time-consuming document creation and data inconsistencies, which often hinder operational efficiency. Furthermore, incorporating RPA solutions such as EMMA and Automation can further streamline these processes.
Follow these steps to enhance your reports:
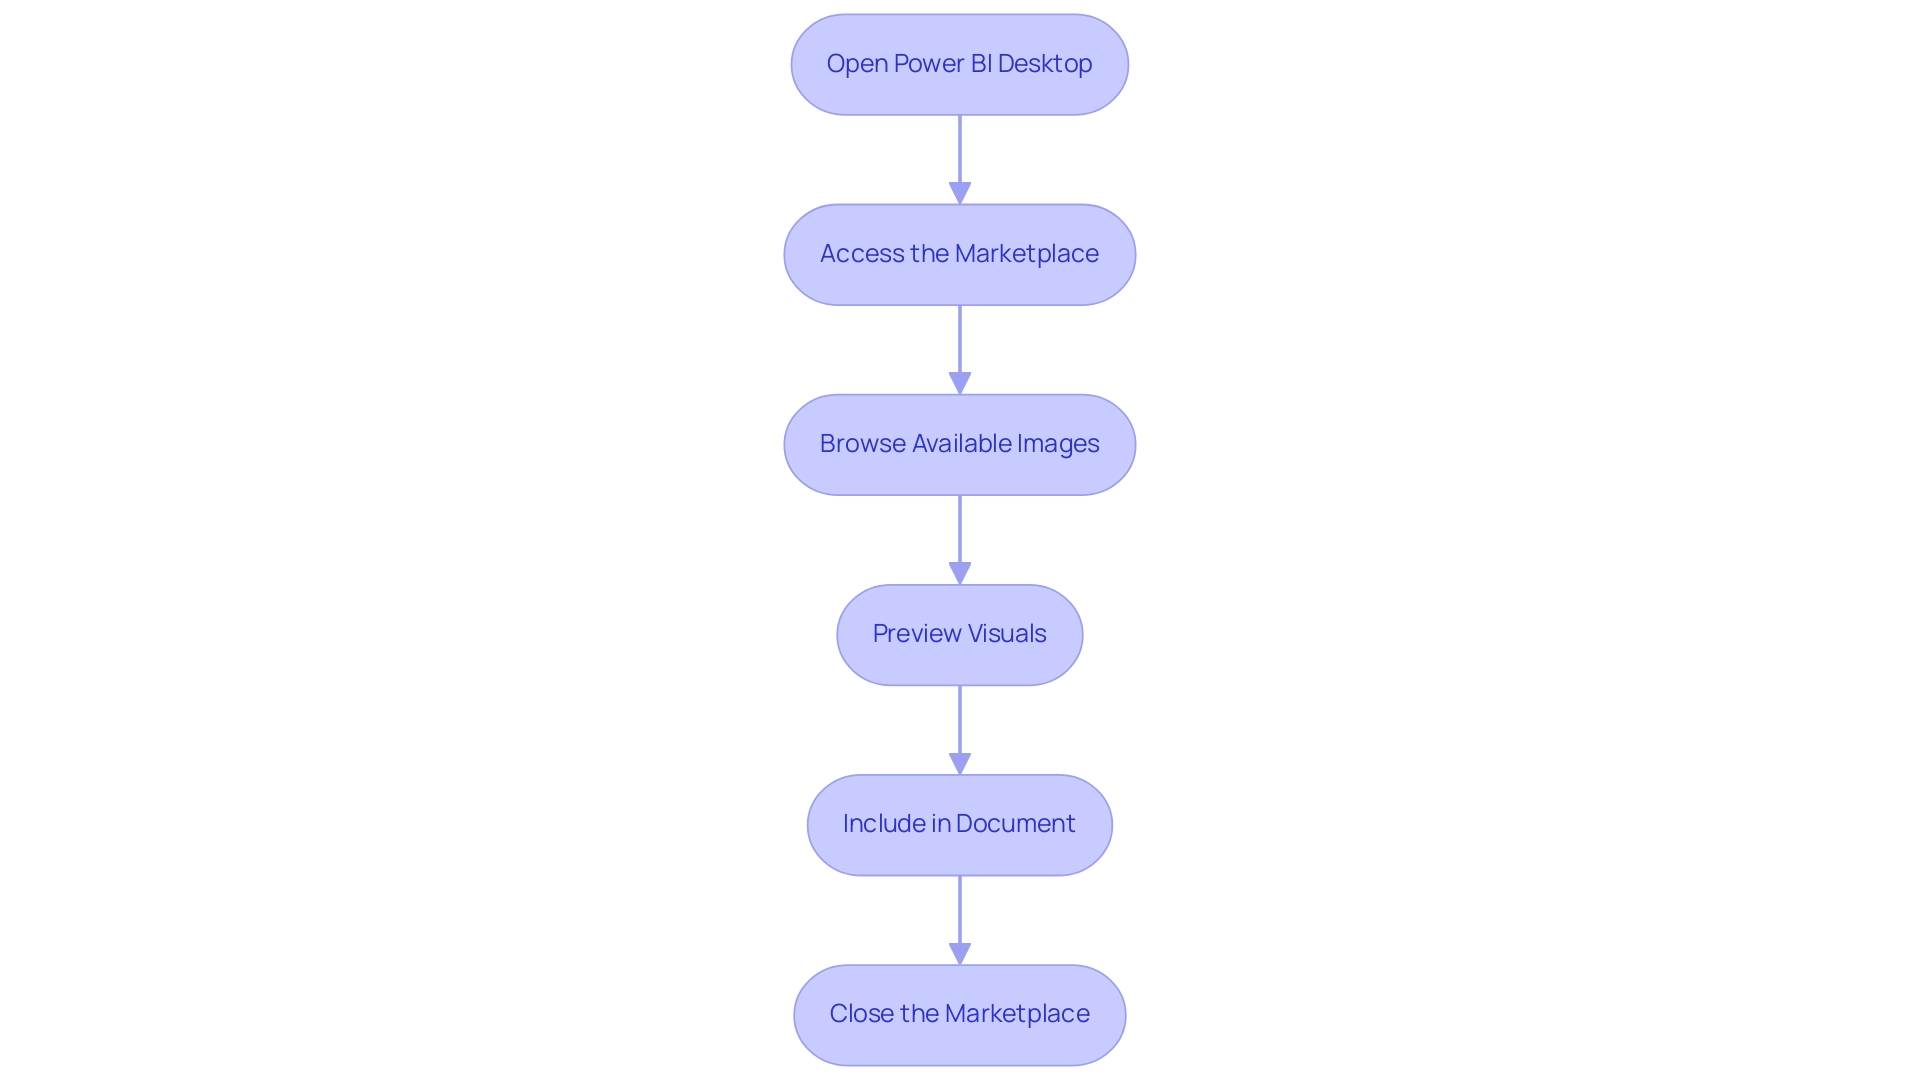
- Open Power BI Desktop: Begin by launching the application on your computer, setting the stage for your data exploration.
- Access the Marketplace: In the ‘Visualizations’ pane on the right-hand side, click the three dots (ellipsis) at the bottom; this action will lead you straight into the marketplace, brimming with possibilities.
- Browse Available Images: Take your time to explore various categories or use the search bar to pinpoint specific images tailored to your objectives. The wealth of options available will empower you to find exactly what you need.
- Preview Visuals: Click on any visual that catches your interest to view detailed information, including screenshots, descriptions, and user ratings.
This insight will assist you in making informed choices about which images best fit your narrative.
Include in Document: Once you find a visual that aligns with your vision, just click ‘Add’ to effortlessly integrate it into your document, improving your storytelling abilities.
Close the Marketplace: After adding your selected visuals, close the marketplace to return to your report, prepared to present your information in a compelling manner.
By effectively utilizing the power bi visual marketplace, along with RPA solutions, you can transform raw information into impactful narratives that drive meaningful action and address common challenges in information management. Remember the insightful words of Darya Yatchenko, Lead Technical Writer:
Remember, data visualization is not just about presenting information, but also about telling a story and driving meaningful action.
Furthermore, consider the value proposition of acquiring BI Pro with Microsoft 365 applications for one low price per user, ensuring you have access to industry-leading security.
Should you need assistance, technical support for BI can be accessed through Microsoft Fabric, providing essential resources for your navigation. Embrace these tools to elevate your operational efficiency and lead your organization toward data-driven decision-making.
Installing Visuals from the Power BI Marketplace
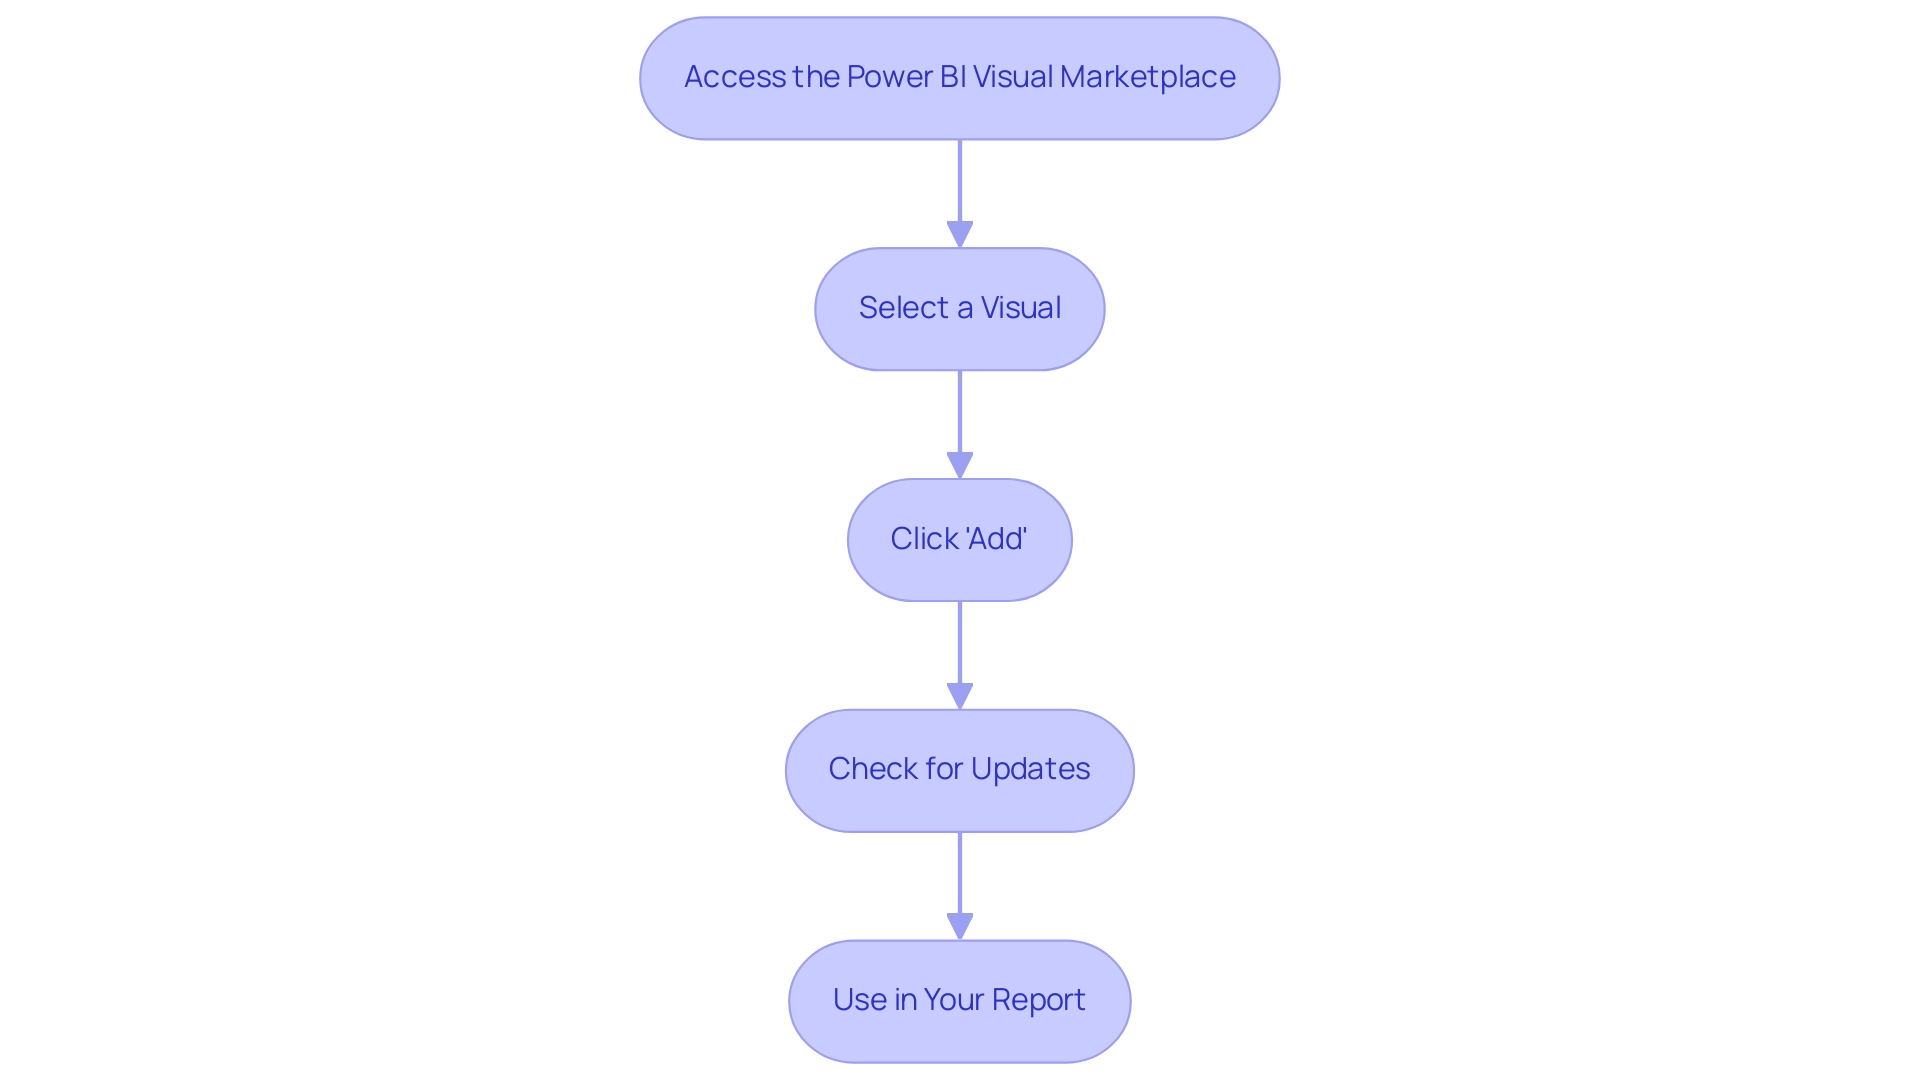
Installing visuals from the Power BI Marketplace can be a straightforward process when following these essential steps:
- Access the Power BI visual marketplace: Begin by navigating to the Visualizations pane to open the Power BI visual marketplace, where a variety of powerful tools await your exploration.
- Select a Visual: Browse through the diverse selection and click on any visual that piques your interest to view its detailed features and functionalities.
- Click ‘Add’: Once you’ve reviewed the visual, simply click the ‘Add’ button to seamlessly integrate it into your Power BI workspace.
- Check for Updates: Keeping your graphics current is crucial; check for updates regularly through the ‘Manage graphics’ option in the Visualizations pane to ensure optimal performance and access to new features.
- Use in Your Report: After installation, your new visual will appear in the Visualizations pane, ready to enhance your reports and engage your audience.
By utilizing these images from the Power BI visual marketplace, organizations like the Red Cross have transformed their fundraising strategies and gained deeper insights into donor behavior. The Red Cross encountered difficulties in handling donor information and evaluating the success of their fundraising campaigns, but with the integration of BI, they enhanced campaign performance and support efficiency through improved donor insights.
Additionally, the ‘Drill Down Timeline PRO’ feature allows users to conduct detailed examinations of timelines with customizable interactions, showcasing the versatility of BI visuals. As Ryan Majidimehr emphasizes, “We hope that these exciting new capabilities enable you to create and migrate even more BI semantic models to Direct Lake mode…” This highlights the significant potential for real-time analytics and AI integration that can drive effective decision-making and storytelling in your presentations.
Additionally, our BI services provide a 3-Day BI Sprint, which enables quick development of professionally crafted documents, and the General Management App, which offers thorough management and intelligent evaluations. With tools like RPA optimizing your processes and customized AI solutions improving information quality, you can overcome implementation challenges and utilize Business Intelligence effectively for informed decision-making.
Customizing Your Power BI Visuals
Customizing your Power BI visuals from the power bi visual marketplace is essential for creating impactful reports that drive actionable insights. With 2,501 users currently online, there’s a vibrant community engaged in improving their presentation skills. Here’s a streamlined approach to enhance your information presentations:
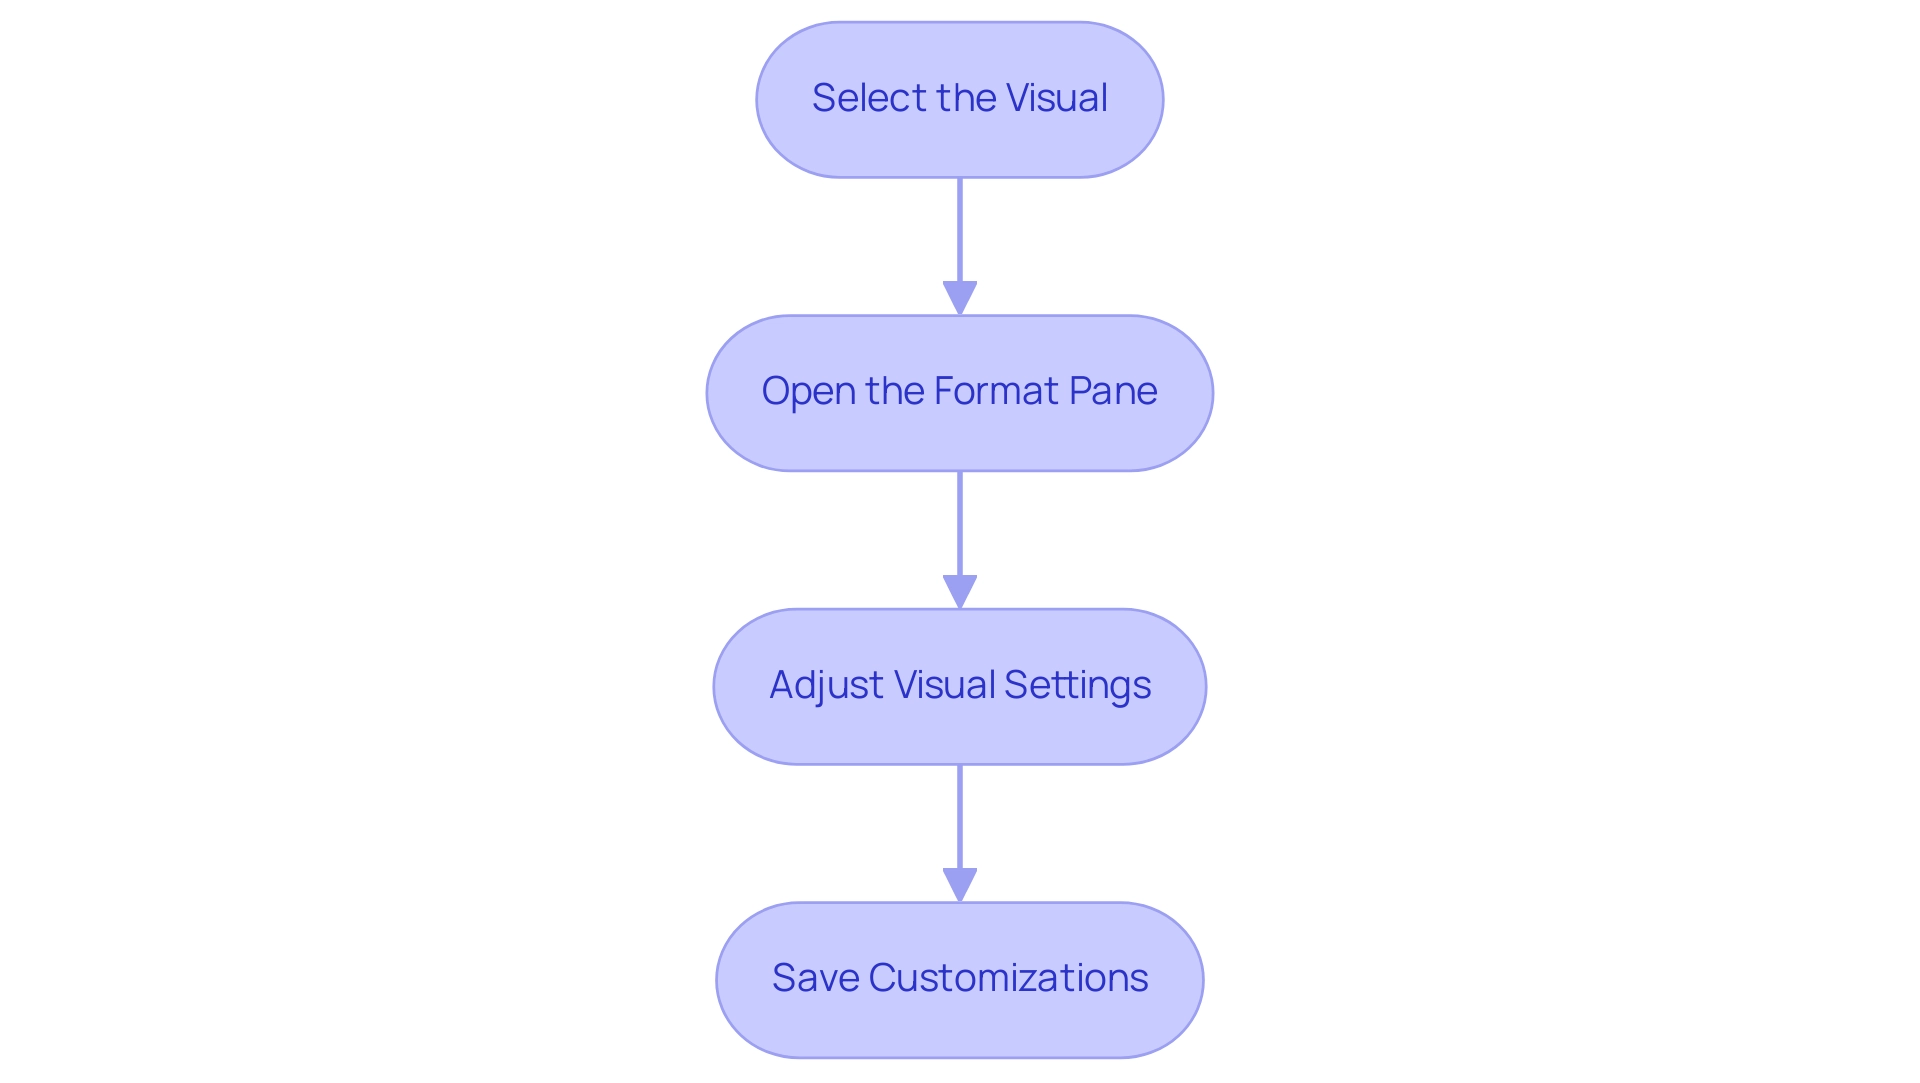
- Select the Visual: Start by clicking on the visual you want to customize within your document. This foundational step allows you to focus your modifications where they matter most.
- Open the Format Pane: Navigate to the Visualizations pane and click the paint roller icon. This action opens a range of formatting options, providing you with the tools needed to personalize your visual effectively.
- Adjust Visual Settings: Dive into the settings to modify aspects like colors, labels, titles, and data fields. This is your opportunity to tailor the visual to meet your specific reporting requirements. For example, the customization of visuals is facilitated in BI mobile applications for iOS and Android tablets, ensuring your documents are accessible on various devices. Don’t hesitate to experiment with various styles to discover which combinations yield the best results for your audience.
- Save Customizations: After making your desired changes, remember to save your document. This step is crucial to ensure that all customizations are retained and will be available for future presentations in the Power BI visual marketplace.
To illustrate the impact of customization, consider the case study of the Chiclet Slicer, which can be found in the Power BI visual marketplace. This tool acts as an interactive filter that enhances the visual appeal of documents. By using chiclet slicers, users can filter information with different colors, layouts, and images, effectively streamlining exploration and analysis. However, numerous organizations encounter obstacles like information inconsistencies across documents and a deficiency of actionable direction, which can diminish the effectiveness of their insights.
Utilizing our 3-Day BI Sprint can speed up your document creation process, while the General Management App offers thorough management and intelligent reviews to tackle these challenges. By adhering to these steps and employing these powerful tools, you can significantly improve the impact of your documents, making information storytelling more captivating and informative.
Benefits and Limitations of Power BI Visuals
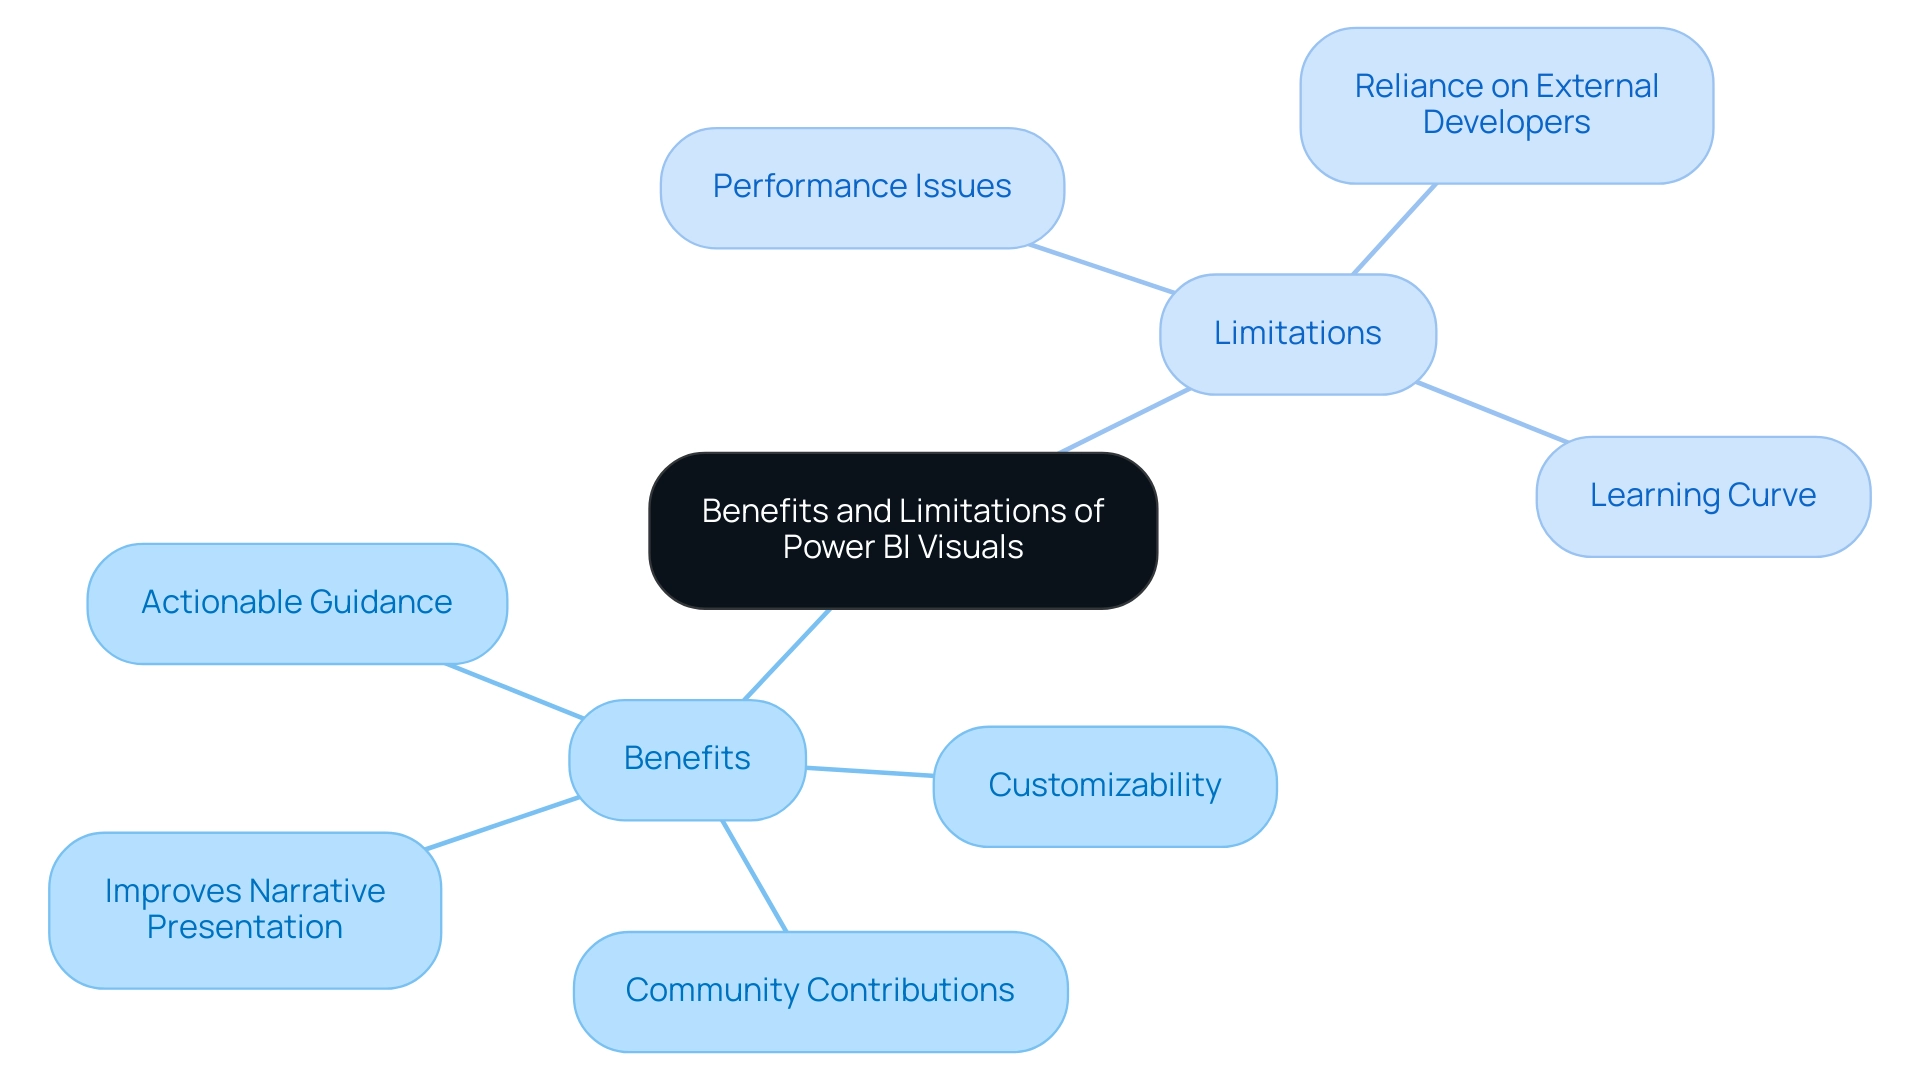
Utilizing graphics from the power bi visual marketplace can greatly improve narrative presentation while tackling typical issues encountered in operational efficiency. Custom visuals can transform information into engaging narratives, making it easier for stakeholders to grasp key insights quickly—an essential need given the often time-consuming nature of report creation. Furthermore, the range of options accessible enables customized presentations that connect with varied audiences, addressing the problem of inconsistencies effectively.
Community contributions bring innovative solutions to the table, fostering a dynamic ecosystem that continuously evolves to meet users’ needs.
A case study titled Benefits of Custom Charts in Power BI highlights that while Power BI’s default charts are versatile, custom charts enhance storytelling, providing specialized visualizations that improve engagement and brand consistency. Importantly, these custom representations can also provide actionable guidance, assisting stakeholders in understanding the next steps based on the data presented. This addresses the frequent issue where documents are filled with numbers and graphs yet lack clear direction.
However, there are limitations to consider. Some custom graphics, particularly complex ones, may impact report performance, leading to slower load times and a less responsive user experience. Additionally, reliance on external developers poses risks, especially if support ceases or updates are not provided, potentially leaving organizations with outdated tools.
The adoption of new visuals may also require users to invest time in learning how to effectively use and customize them, which could temporarily hinder productivity.
Recent updates to BI in April 2024 have introduced new features that may address some of these limitations, providing advanced functionalities to enhance visualizations. Daniel, a BI Super User, shared insights on the limitations of using these offerings:
“Regarding both questions, unfortunately not. I’d love to see both also… Not ideal outcomes but might give you some ideas.”
This emphasizes the significance of tackling specific issues through updates and enhancements to the visual listings in the power bi visual marketplace, including governance strategies that can reduce inconsistencies.
In summary, while personalized graphics in Business Intelligence offer thrilling opportunities for improved information presentation and actionable insights, it is essential to navigate their limitations carefully to ensure optimal performance and user satisfaction, while also implementing governance strategies to maintain information integrity.
Troubleshooting Common Issues with Power BI Visuals
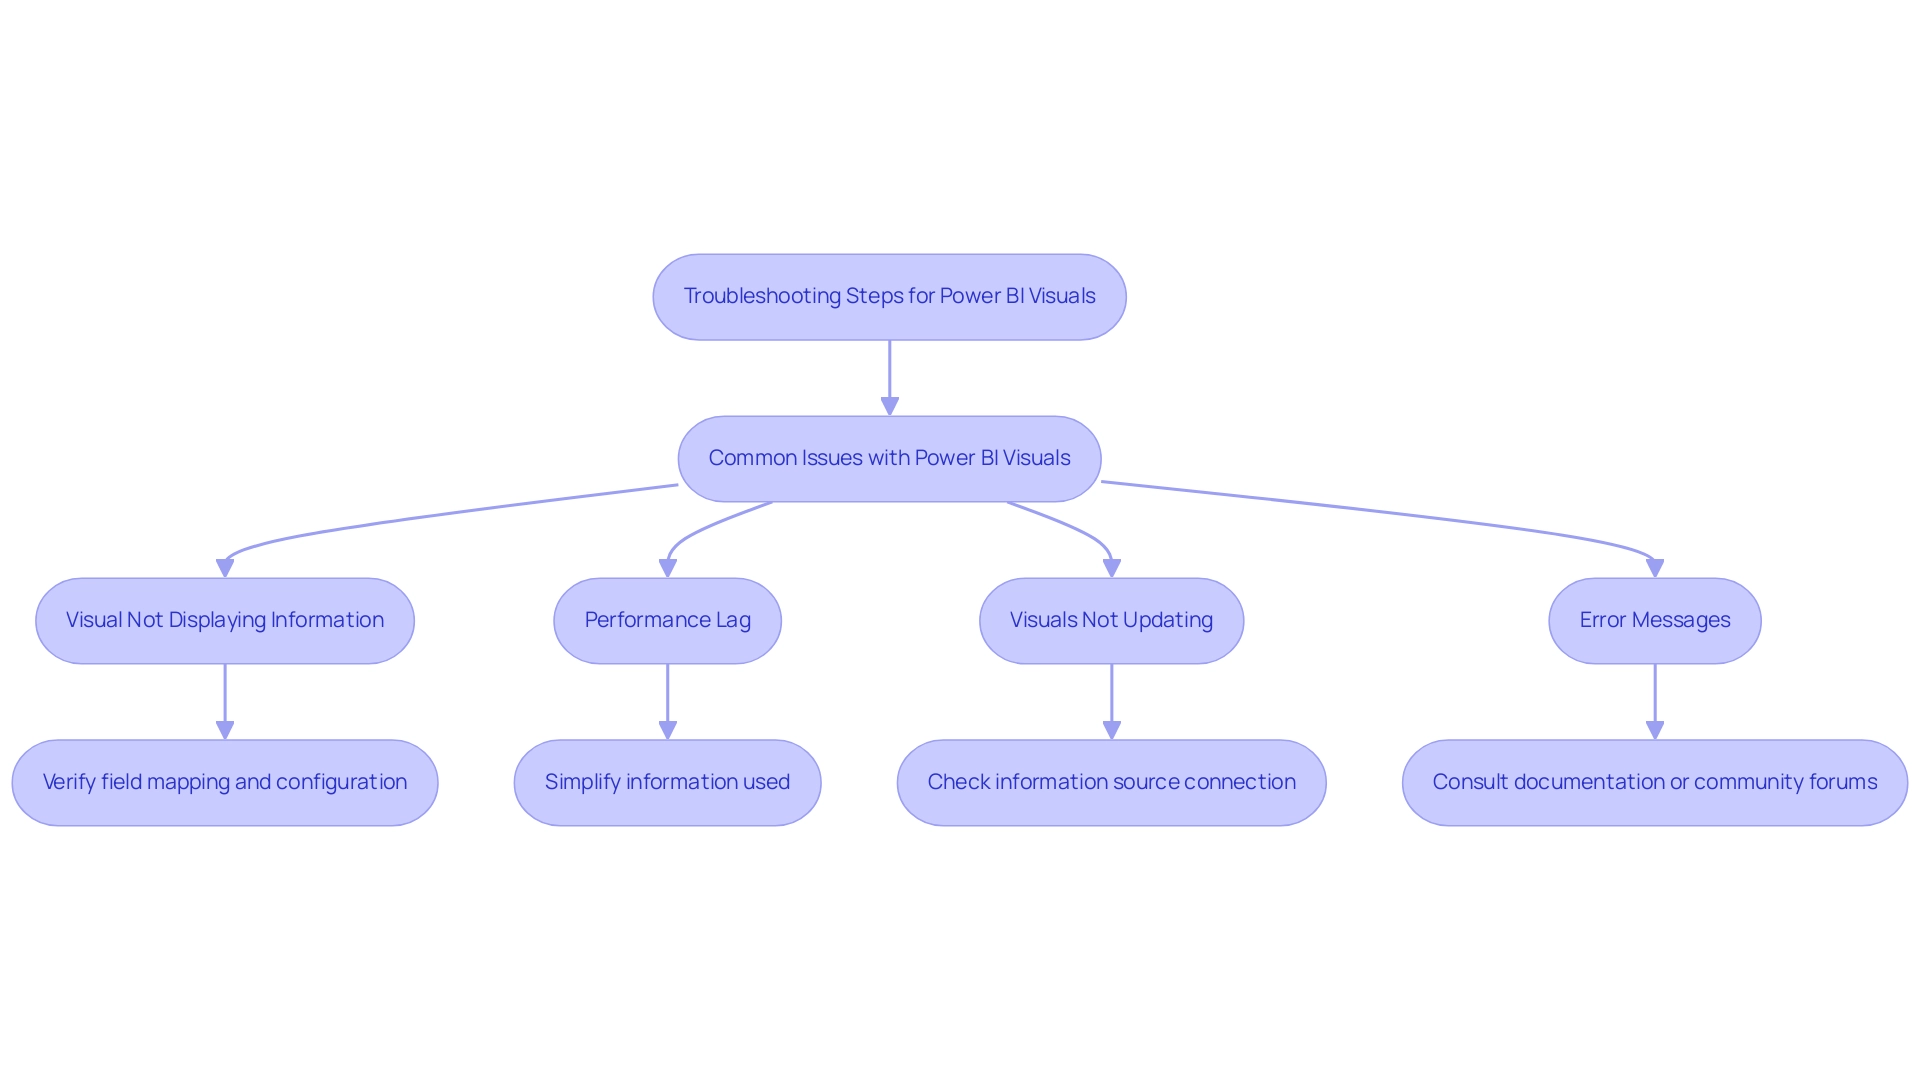
When utilizing Power BI visuals, you may encounter several common issues that can hinder your operational efficiency. Here’s how to effectively troubleshoot them, enhancing your data presentation and storytelling capabilities while considering the role of Robotic Process Automation (RPA) and tailored AI solutions in streamlining these processes:
-
Visual Not Displaying Information:
Start by verifying that the fields are accurately mapped within the visual settings. Ensure your information model is properly configured to avoid discrepancies. With over 15,000 related questions on StackOverflow about Power BI, it’s evident that many users face similar challenges. Implementing RPA can automate information preparation tasks, reducing the risk of mistakes in mapping. -
Performance Lag:
If you experience delays in visual loading, consider simplifying the information being utilized. Decreasing the quantity of points shown can significantly improve performance, making visuals more responsive. This is particularly important as Power BI is recognized for its user-friendliness compared to Tableau, impacting performance positively for less skilled users. Tailored AI solutions can also enhance queries, further improving loading times. -
Visuals Not Updating:
If your visuals fail to refresh, double-check that your information source is correctly connected. Remember to refresh your dataset within Power BI to reflect any changes. As Rico Zhou, a Community Support expert, advises, “To configure data refresh, you may need to install a gateway.” Automating this process through RPA can ensure that your visuals are always up-to-date without manual intervention. -
Error Messages:
Pay attention to any error messages that arise, as they often contain valuable insights into the underlying issues. For specific troubleshooting tips, consult the visual’s documentation or engage with community forums, where shared experiences can guide you through solutions. Leveraging AI can help in analyzing error patterns and suggesting potential fixes, enhancing your troubleshooting efficiency.
By addressing these common challenges and integrating RPA and AI solutions, you can not only optimize your experience with the Power BI visual marketplace but also enhance your organization’s ability to extract actionable insights, ultimately driving growth and innovation.
Conclusion
Unlocking the full potential of the Power BI Visual Marketplace can transform the way organizations approach data visualization and reporting. By leveraging custom visuals, users can enhance their storytelling capabilities, turning complex datasets into clear and actionable insights that resonate with stakeholders. The marketplace offers a diverse range of options, allowing for tailored presentations that address common challenges such as time-consuming report creation and data inconsistencies.
Navigating this vibrant hub is straightforward, empowering users to easily install, customize, and integrate visuals into their reports. With clear steps and practical guidance, organizations can overcome hurdles and streamline their data management processes. Moreover, the integration of Robotic Process Automation and tailored AI solutions can further enhance operational efficiency, ensuring that data remains accurate and up-to-date.
While the benefits of utilizing custom visuals are significant, it is essential to remain aware of potential limitations and challenges. By implementing effective governance strategies and troubleshooting common issues, organizations can maximize the performance of their Power BI experience. Ultimately, embracing the Power BI Visual Marketplace is not just about improving reporting capabilities; it is about fostering a data-driven culture that drives informed decision-making and fuels business growth. The time to elevate data storytelling is now—unlock the power of visualization and lead your organization toward a more insightful future.
Overview:
The article focuses on how to effectively use Power Query to compare two tables and return differences, emphasizing the importance of this process for data analysis and decision-making. It outlines a step-by-step guide that includes accessing data transformation, merging queries, and applying various techniques to identify discrepancies, thereby enhancing operational efficiency and ensuring information accuracy.
Introduction
In the realm of data analysis, the ability to compare tables effectively is not just a skill; it’s a necessity for organizations striving for accuracy and informed decision-making. Power Query emerges as a powerful ally in this endeavor, enabling users to seamlessly connect, combine, and transform data from diverse sources.
As businesses grapple with the complexities of maintaining data integrity amidst an ever-expanding array of datasets, the integration of Robotic Process Automation (RPA) becomes a game-changer, minimizing manual tasks and enhancing operational efficiency.
This guide will explore the intricacies of utilizing Power Query to:
- Identify discrepancies
- Streamline workflows
- Foster a culture of accuracy
Ultimately empowering organizations to transform raw data into actionable insights that drive innovation and growth.
Introduction to Comparing Tables with Power Query
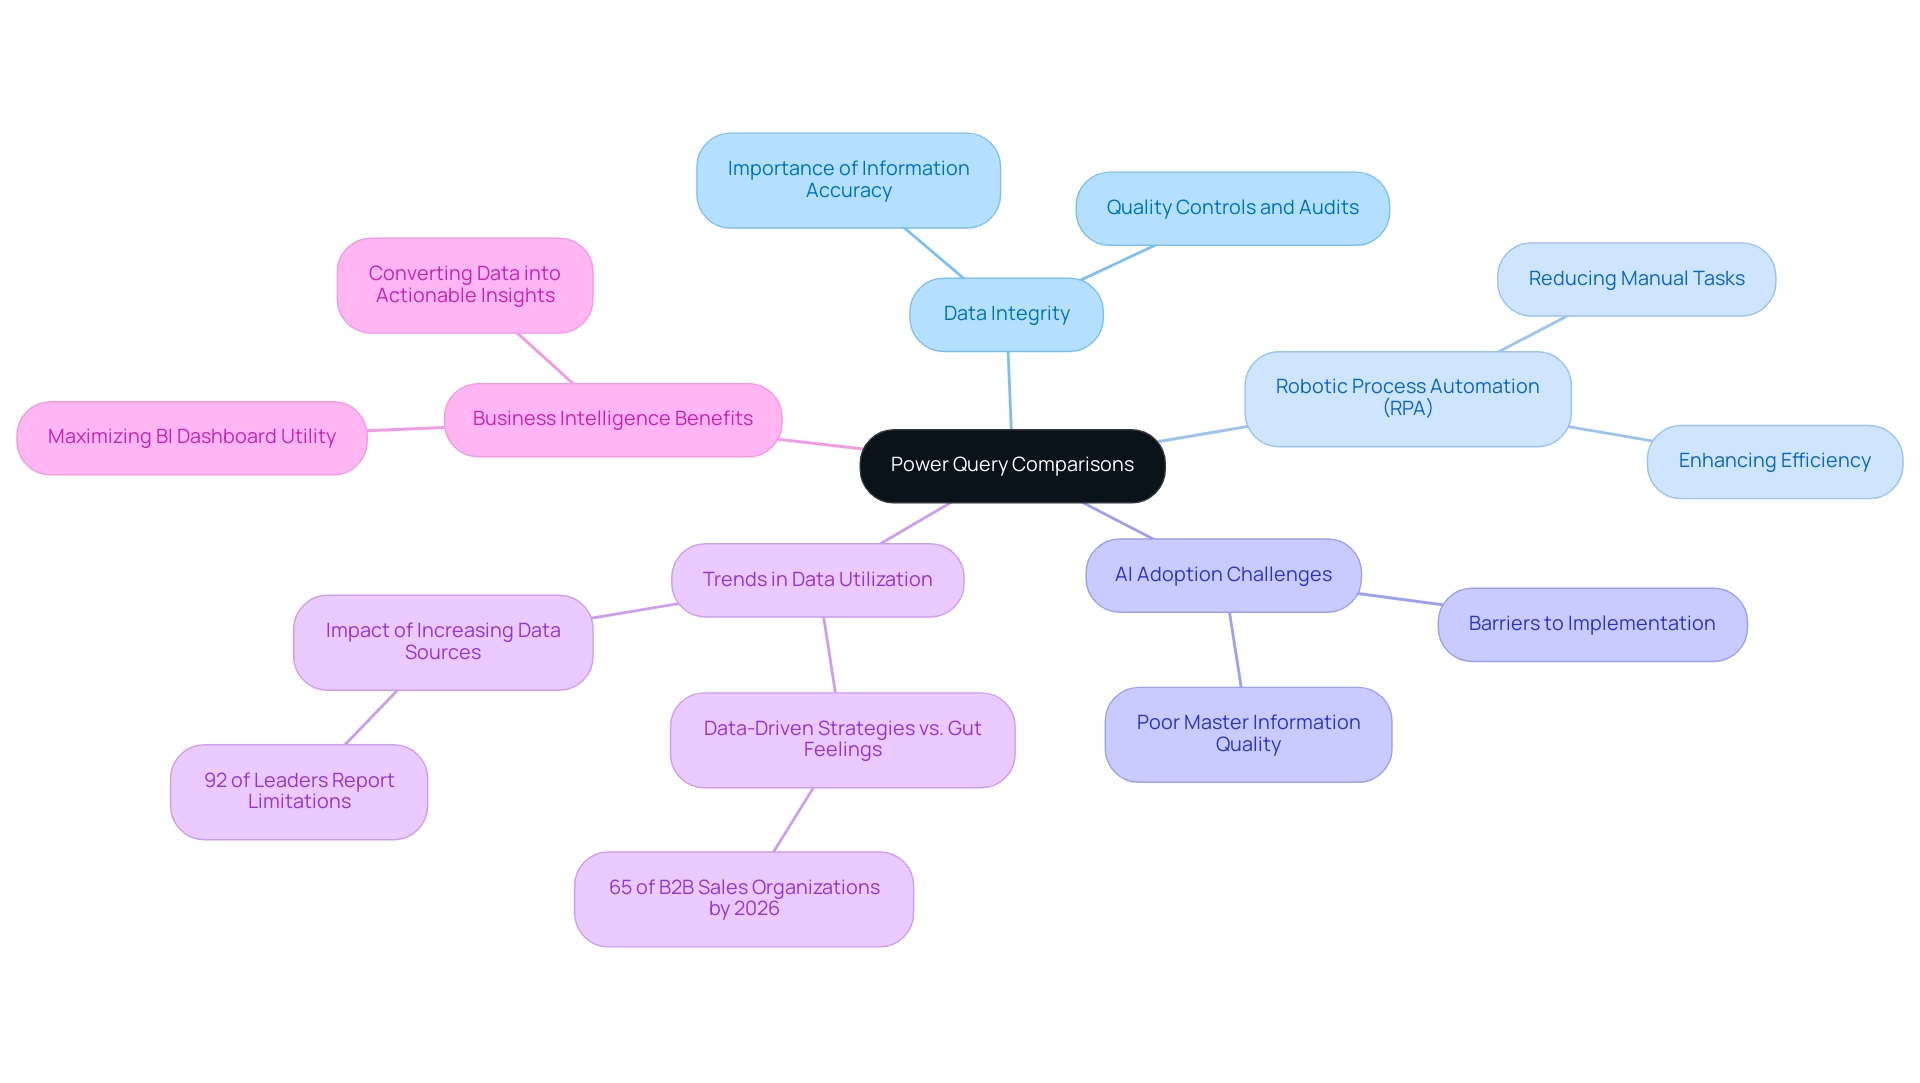
Power Query stands out as an invaluable asset within Microsoft Excel and Power BI, enabling users to connect, combine, and transform information from a multitude of sources effectively. The ability to power query compare two tables and return differences is essential in analyzing information, particularly for identifying discrepancies, changes, or updates between datasets. This process is crucial for safeguarding information accuracy and integrity, which directly influences effective decision-making and bolsters operational efficiency.
By incorporating Robotic Process Automation (RPA) into your workflows, you can reduce manual, repetitive tasks, thereby enhancing efficiency and enabling your team to focus on high-value analysis tasks. Supporting those involved in misconduct investigations is vital, as it emphasizes the importance of information integrity in maintaining trust and accountability within organizations. Moreover, ethical considerations in information reliability, such as responsible use and privacy protection, are critical to ensuring fair decision-making.
It is also essential to address challenges related to poor master information quality and barriers to AI adoption, as these factors can hinder effective implementation and utilization of information-driven strategies. As a testament to the increasing importance of evidence-based strategies, it is anticipated that by 2026, 65% of B2B sales organizations will surpass choices based on instinct with those grounded in information evaluation. Furthermore, a remarkable 92% of business leaders indicate that the growing number of information sources has obstructed their organizations’ advancement.
This guide will explore how to use Power Query to compare two tables and return differences effectively, enabling you to improve your analysis capabilities. For instance, a case study on maintaining information accuracy highlights the implementation of quality controls and regular audits, supporting ongoing employee training and real-time validation. Moreover, tackling the challenges of time-consuming report creation and the absence of actionable guidance from BI dashboards is essential for maximizing the benefits of Business Intelligence.
By promoting a culture of precision and dependability in your operations, you can manage the intricacies of information examination with assurance, utilizing customized AI solutions and Business Intelligence to convert unrefined information into actionable insights that propel growth and innovation.
Step-by-Step Guide to Comparing Two Tables in Power Query
-
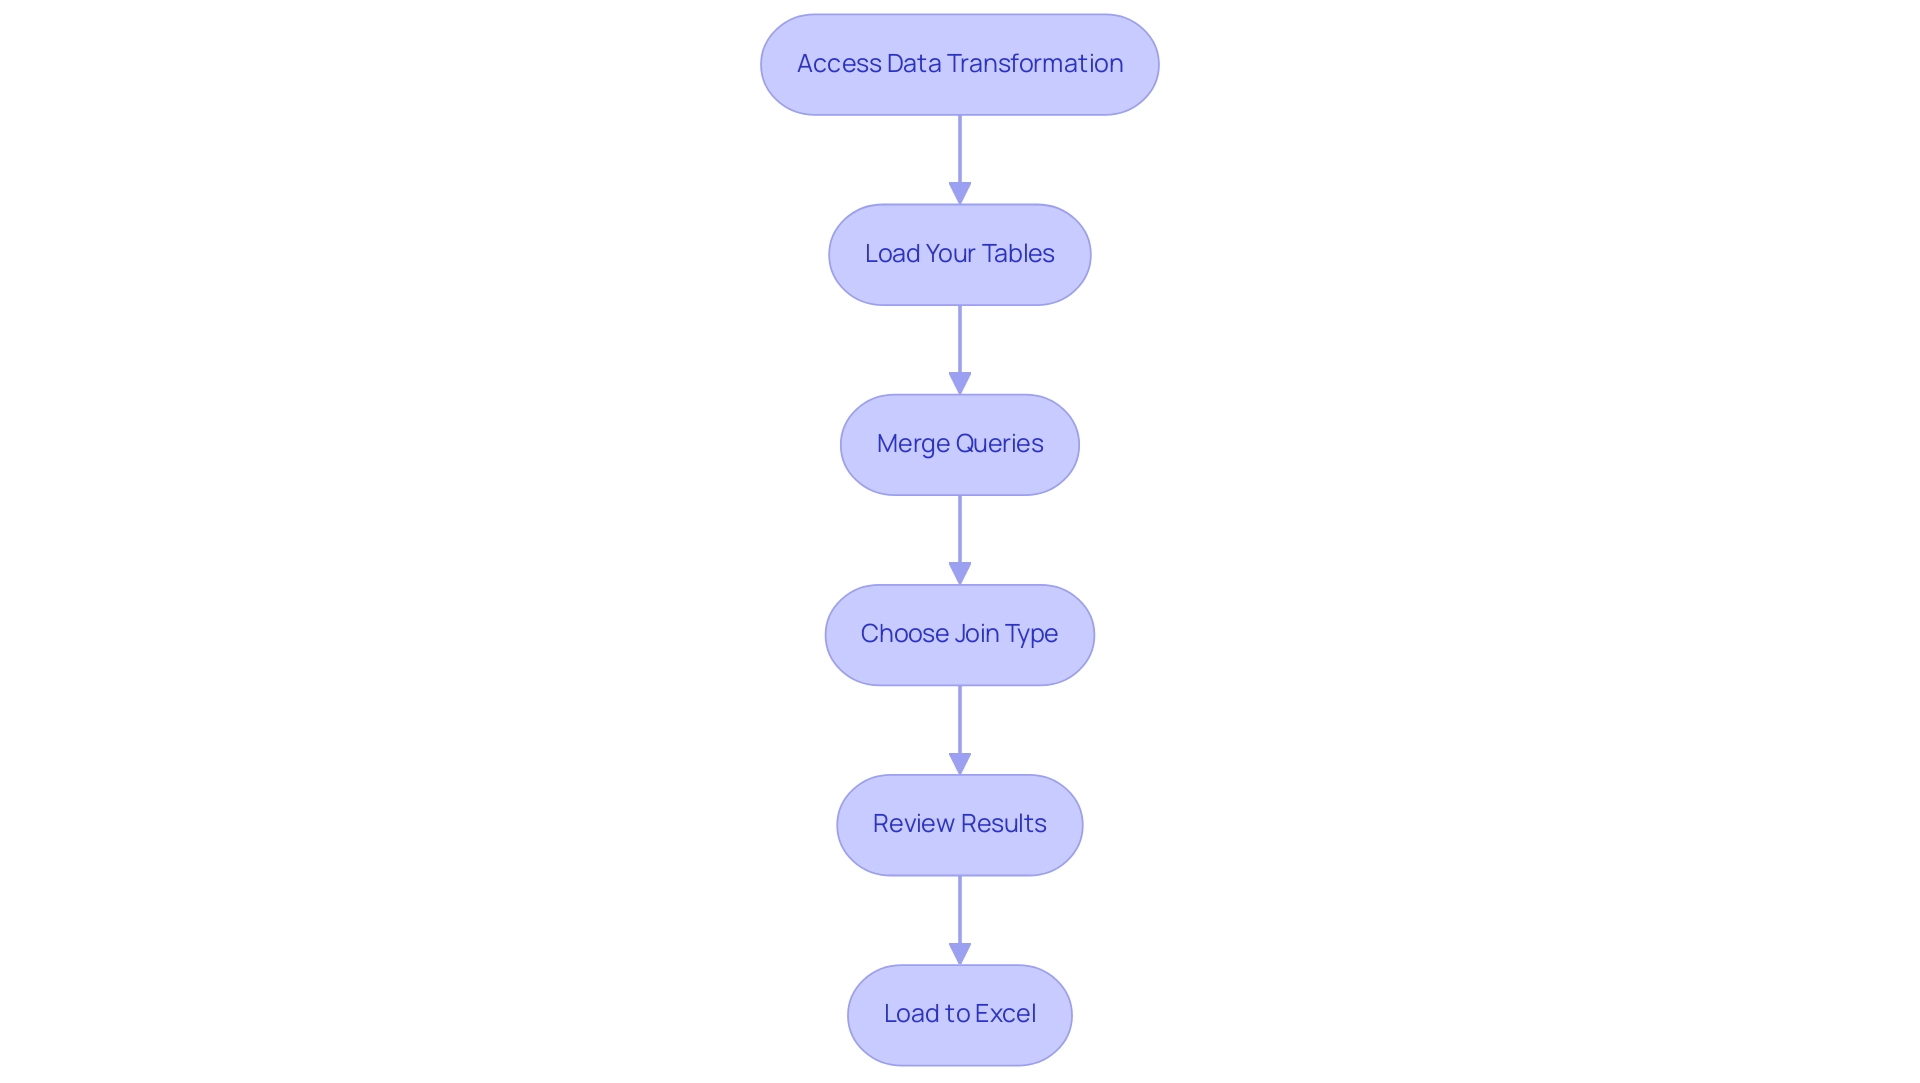
Access Data Transformation: Start by going to the ‘Data’ tab in Excel and choosing ‘Get Data’ to open Data Transformation. This powerful tool enables seamless manipulation and analysis, saving users valuable time in the process. By combining data transformation with Robotic Process Automation (RPA), you can further streamline your workflows, reducing manual tasks and improving operational efficiency. Manual, repetitive tasks can significantly slow down your operations, leading to wasted time and resources, which RPA can effectively mitigate.
-
Load Your Tables: Import the two tables you wish to power query compare two tables and return differences. The tool facilitates importing from multiple origins, including Excel files, databases, and external information sources. This flexibility not only streamlines your information preparation process but can also save HOURS when importing content from the web, especially when automated through RPA.
-
Merge Queries: In the Power Query interface, select one of your tables. Head to the ‘Home’ tab and click ‘Merge Queries.’ Here, you will select the second table and specify the matching columns to align your sets effectively. Leveraging RPA can automate this merging process, ensuring accuracy and speed, which is crucial in overcoming technology implementation challenges.
-
Choose Join Type: Opt for the join type that best satisfies your evaluation needs. For instance, selecting ‘Left Anti Join’ will allow you to identify records present in the first table but absent in the second, enhancing your data comparison capability. This method of analysis is crucial for extracting actionable insights, which is a key aspect of Business Intelligence, especially when you use power query to compare two tables and return differences.
-
Review Results: After merging, it’s crucial to review the results in the Power Query editor. Utilize filtering and sorting features in power query to compare two tables and return differences, gaining a clearer understanding of the discrepancies between your tables. This process is essential for identifying missing data and understanding data distribution, ultimately driving informed decision-making.
-
Load to Excel: Once your comparison meets your expectations, load the results back into Excel, choosing to either append them to an existing worksheet or create a new one. This feature, which permits defining the destination range, significantly improves your reporting and evaluation workflow. As mentioned by engineer and enthusiast Shruti M., utilizing the data transformation tool, you are saving a significant amount of time by executing many functions with just a few clicks!
By adhering to these steps and incorporating RPA and Business Intelligence principles, you can revolutionize your information evaluation process, save hours, and enable informed decision-making. In the context of the rapidly evolving AI landscape, these tailored solutions are essential for addressing specific business needs and challenges.
Methods for Identifying Differences Between Tables
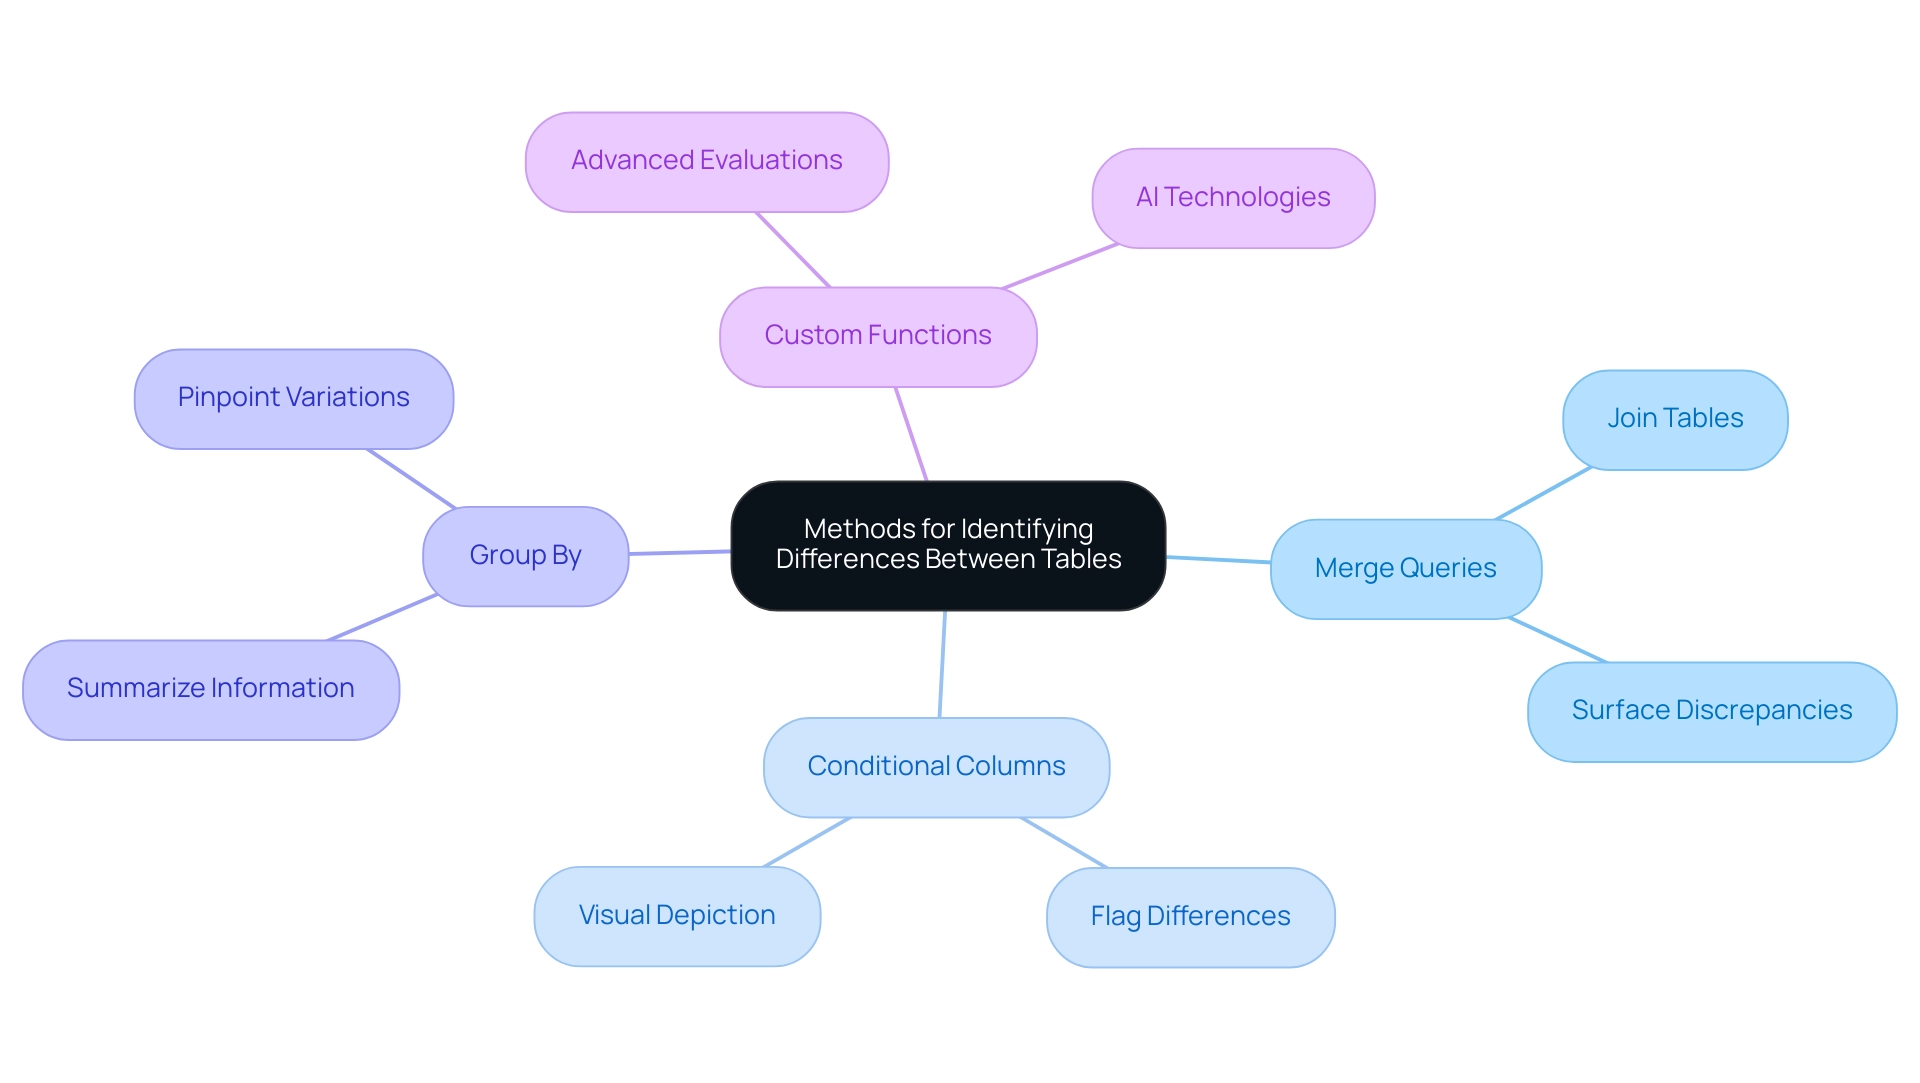
Power Query equips users with several powerful techniques for identifying discrepancies between tables, enabling efficient data analysis and accuracy in reporting:
-
Merge Queries: This feature allows you to join tables based on shared columns, effectively surfacing discrepancies in the merged output. This method streamlines the process to power query compare two tables and return differences, ensuring that any inconsistencies are readily apparent. As Amy Gilmour, Content Marketing Manager, notes, “Mobile measurement for app marketing can seem overwhelming with multiple platforms, channels, ad networks, campaigns, and now next-generation tools and solutions to manage.” This complexity is mirrored in the challenges of analysis, highlighting the need for robust tools like Power Query and our Power BI services, which enhance reporting and provide actionable insights.
-
Power Query Compare Two Tables and Return Differences: By utilizing this feature, you can create conditional columns to flag differences according to specific criteria. This visual depiction simplifies the identification of changes, which is essential when you want to power query compare two tables and return differences.
-
Group By: Utilizing the ‘Group By’ option allows you to summarize information and pinpoint variations in aggregated results, especially when you use power query to compare two tables and return differences. This method is especially beneficial for grasping trends and irregularities within your datasets, akin to how the recent case study ‘The Flow of Time: India Budget 2025’ examines the Union Budget introduced by Finance Minister Nirmala Sitharaman for FY 2025-26, concentrating on key areas and consequences that necessitate accurate evaluation, in line with the significance of business intelligence in fostering growth.
-
Custom Functions: For those more experienced with Power Query, writing custom M functions can assist in scenarios where you need to power query compare two tables and return differences for unique comparison challenges. This flexibility enables more advanced evaluations that meet particular operational requirements, further improved by utilizing AI technologies, including customized Small Language Models for effective information examination and increased privacy, along with GenAI Workshops for practical training.
These methods not only enhance your ability to analyze information effectively but also ensure accuracy in your findings, fostering a more robust decision-making process. In the context of the recent Union Budget statistics, precise information examination is crucial for understanding financial implications and making informed decisions, while automation through RPA can streamline manual workflows by reducing repetitive tasks and errors, thereby enhancing overall operational efficiency.
Troubleshooting Common Issues in Table Comparisons
When utilizing Power Query to compare tables, several common challenges may arise that require attention:
-
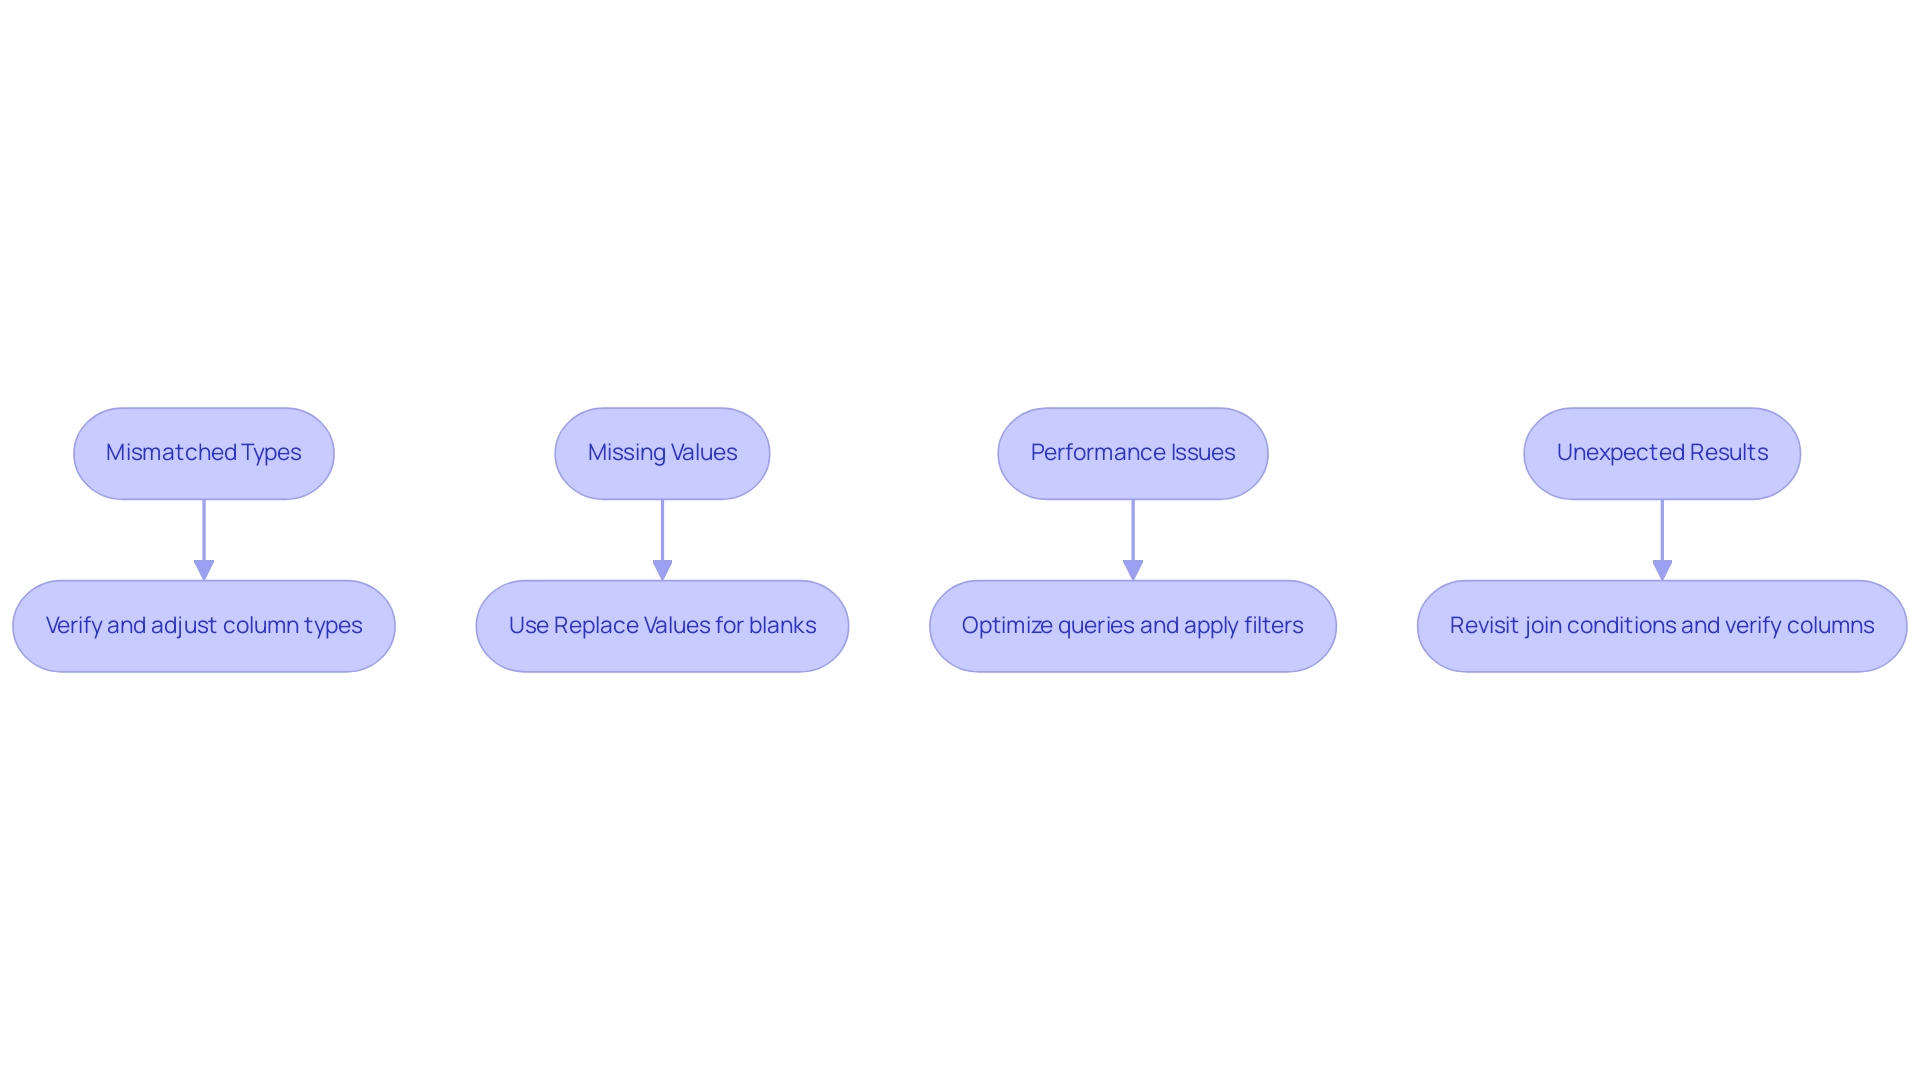
Mismatched Types: One of the most frequent issues is encountering mismatched types between columns. According to recent statistics, nearly 30% of information analysis projects experience setbacks due to type mismatches. To ensure accurate comparisons when using Power Query to compare two tables and return differences, it’s essential to verify that the information types match. In Power Query, you can easily adjust types by selecting the relevant column and choosing the appropriate type from the ‘Transform’ tab. Additionally, Robotic Process Automation (RPA) can be employed to automate the correction of mismatched data types, significantly reducing the time spent on manual adjustments. This proactive step helps prevent errors that could distort evaluation outcomes, enhancing overall operational efficiency.
-
Missing Values: Missing values in one of the tables can significantly impact the comparison results. To address this, utilize the ‘Replace Values’ feature to manage blanks or null entries effectively. This ensures that your analysis reflects the complete dataset, minimizing discrepancies and aligning with the goal of informed decision-making through Business Intelligence. Moreover, customized AI solutions can help in forecasting and completing absent values based on historical information trends, while using Power Query to compare two tables and return differences, additionally improving information integrity.
-
Performance Issues: Handling extensive datasets can result in performance bottlenecks in the tool. As noted in recent news, out-of-memory errors can result from memory-intensive operations on large tables. To enhance efficiency and avoid these errors, consider applying filters to your information before loading it into Power Query, or optimize your queries to streamline processing times. These adjustments not only alleviate performance issues but also demonstrate the significance of utilizing RPA to automate manual workflows, thus enhancing overall information handling.
-
Unexpected Results: If Power Query compares two tables and returns differences that yield surprising outcomes, it’s vital to revisit your join conditions and verify that you have selected the correct columns for comparison. Ensuring that the join logic is sound is vital for achieving accurate and meaningful outcomes.
Incorporating these strategies not only improves the reliability of your comparisons but also supports the use of Power Query to compare two tables and return differences according to expert insights. As Mark Smallcombe observes, the application is intended to operate effortlessly within the Microsoft ecosystem, especially with Excel and Power BI. Moreover, a case study on instruments to improve productivity for financial analysts emphasizes how mastering data manipulation tools, along with SQL and Power Pivot, greatly enhances information handling abilities.
By utilizing these tools effectively alongside RPA and customized AI solutions, users can overcome common challenges in information evaluation and improve their operational efficiency.
Best Practices for Effective Table Comparisons in Power Query
To achieve effective table comparisons in Power Query, it’s essential to adhere to several best practices that enhance the accuracy and reliability of your analysis:
-
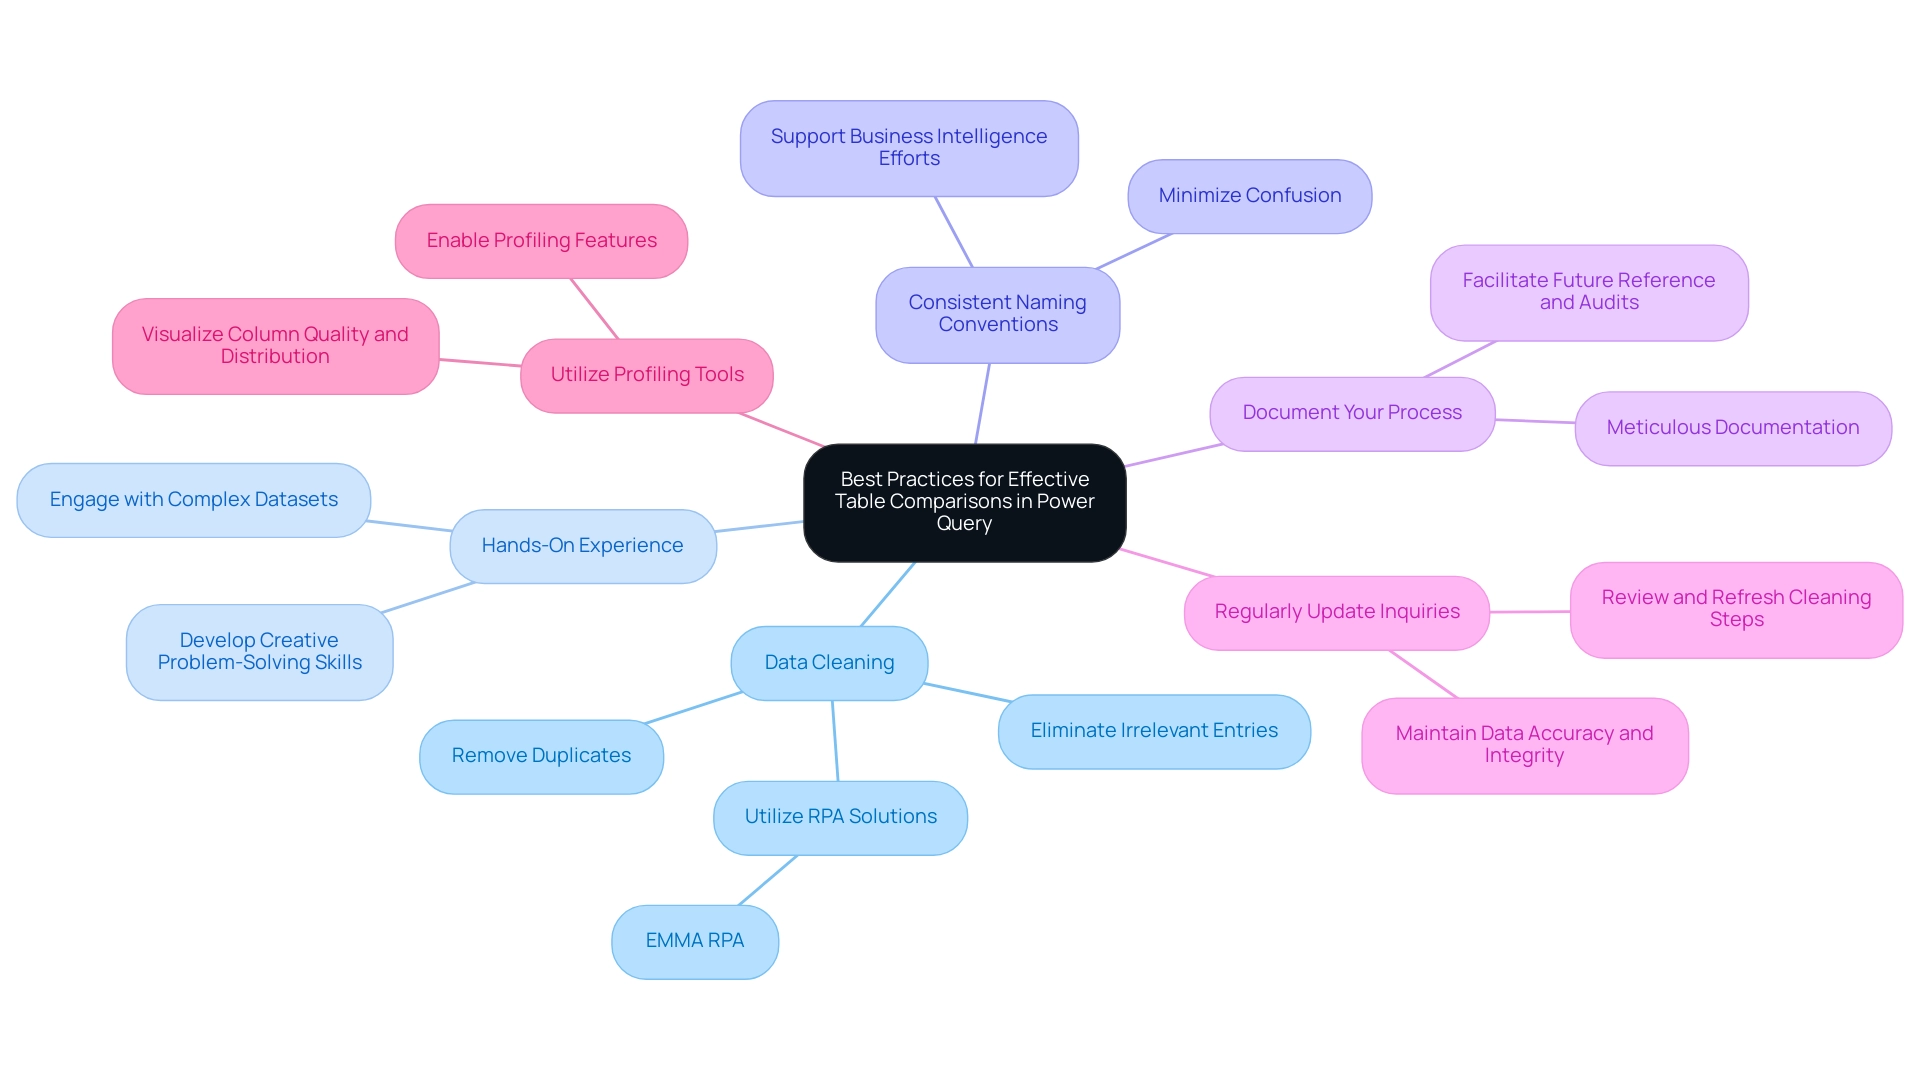
Data Cleaning: Prior to any comparisons, ensure your information is thoroughly cleaned. This includes removing duplicates and irrelevant entries, which significantly enhances the accuracy of your results. As Neeraj Sharma wisely states,
Remember, clean information is the foundation of accurate and reliable insights.
Poor master information quality can impede your ability to derive meaningful insights, making this step critical. Consider utilizing RPA solutions like EMMA RPA to automate cleaning processes, ensuring efficiency and accuracy. -
Hands-On Experience: Mastering Power Query involves hands-on experience with messy datasets. Engaging with complex information challenges can develop your creative problem-solving skills, crucial for effective manipulation and comparison, and overcoming barriers to AI adoption. RPA tools can assist in managing these datasets more effectively.
-
Consistent Naming Conventions: Establish and maintain consistent naming conventions for columns across all tables. This practice minimizes confusion and ensures that comparisons are straightforward and reliable, supporting Business Intelligence efforts.
-
Document Your Process: Meticulously document every step you take and all transformations applied during your information manipulation. This documentation is advantageous for future reference and necessary for audits, offering clear insight into your processes, which is essential in tackling operational challenges.
-
Regularly Update Inquiries: Information sources can often change, so it is important to routinely review and refresh your information cleaning steps in the tool. This ensures that your comparisons remain precise and reflect the most current information, thereby maintaining accuracy and integrity, both of which are essential for driving growth and innovation. RPA solutions can simplify this updating process.
-
Utilize Profiling Tools: Before altering information in the tool, enabling profiling features can offer valuable insights into your dataset. These tools offer visualizations that help you understand column quality, distribution, and profile statistics, guiding your cleaning and comparison processes. This aligns with the goal of transforming raw data into actionable insights.
By implementing these best practices and leveraging RPA technologies, you can significantly improve your data comparison process to power query compare two tables and return differences, effectively utilize Business Intelligence, and gain more accurate insights from your analysis to foster operational efficiency and growth.
Conclusion
The ability to compare tables effectively using Power Query is a fundamental skill that empowers organizations to enhance data integrity and drive informed decision-making. By leveraging this powerful tool, users can seamlessly identify discrepancies, streamline workflows, and foster a culture of accuracy within their operations. The integration of Robotic Process Automation (RPA) further amplifies these benefits, minimizing manual tasks and allowing teams to focus on high-value analyses.
Throughout the guide, various methods for identifying differences between tables have been explored, including:
1. Merging queries
2. Utilizing conditional columns
3. Employing custom functions
These techniques not only simplify the process of data comparison but also ensure accuracy in reporting, which is critical for effective business intelligence. Additionally, troubleshooting common challenges such as mismatched data types and missing values is essential for maintaining the reliability of data analysis outcomes.
By adhering to best practices such as:
– Data cleaning
– Maintaining consistent naming conventions
– Regularly updating queries
organizations can significantly enhance their data comparison processes. Implementing these strategies, alongside tailored AI solutions and RPA, will not only improve operational efficiency but also transform raw data into actionable insights that fuel innovation and growth.
In a data-driven landscape, the ability to effectively compare and analyze datasets is no longer just an advantage; it is a necessity for organizations seeking to thrive. Embracing Power Query and its capabilities positions businesses to navigate complexities with confidence, ultimately leading to better decision-making and sustained success.
Overview:
The article focuses on mastering the Power Query date functions, which are essential tools for effectively managing and analyzing temporal data within business intelligence contexts. It supports this by detailing various functions like Date.From and Date.AddDays, illustrating their practical applications in transforming datasets for insightful analysis, thus enhancing operational efficiency and informed decision-making.
Introduction
In a world where data reigns supreme, the ability to transform raw information into actionable insights is crucial for businesses striving for operational excellence. Power Query emerges as a powerful ally in this endeavor, offering users the tools to seamlessly connect, clean, and prepare data for analysis without the need for extensive programming skills.
As organizations grapple with the complexities of data management amidst an ever-evolving technological landscape, understanding how to leverage Power Query becomes essential.
This article delves into the multifaceted capabilities of Power Query, particularly its date functions, and explores practical applications that enhance business intelligence. By mastering these techniques, users can navigate the intricacies of data analysis, enabling informed decision-making and strategic growth in a data-driven environment.
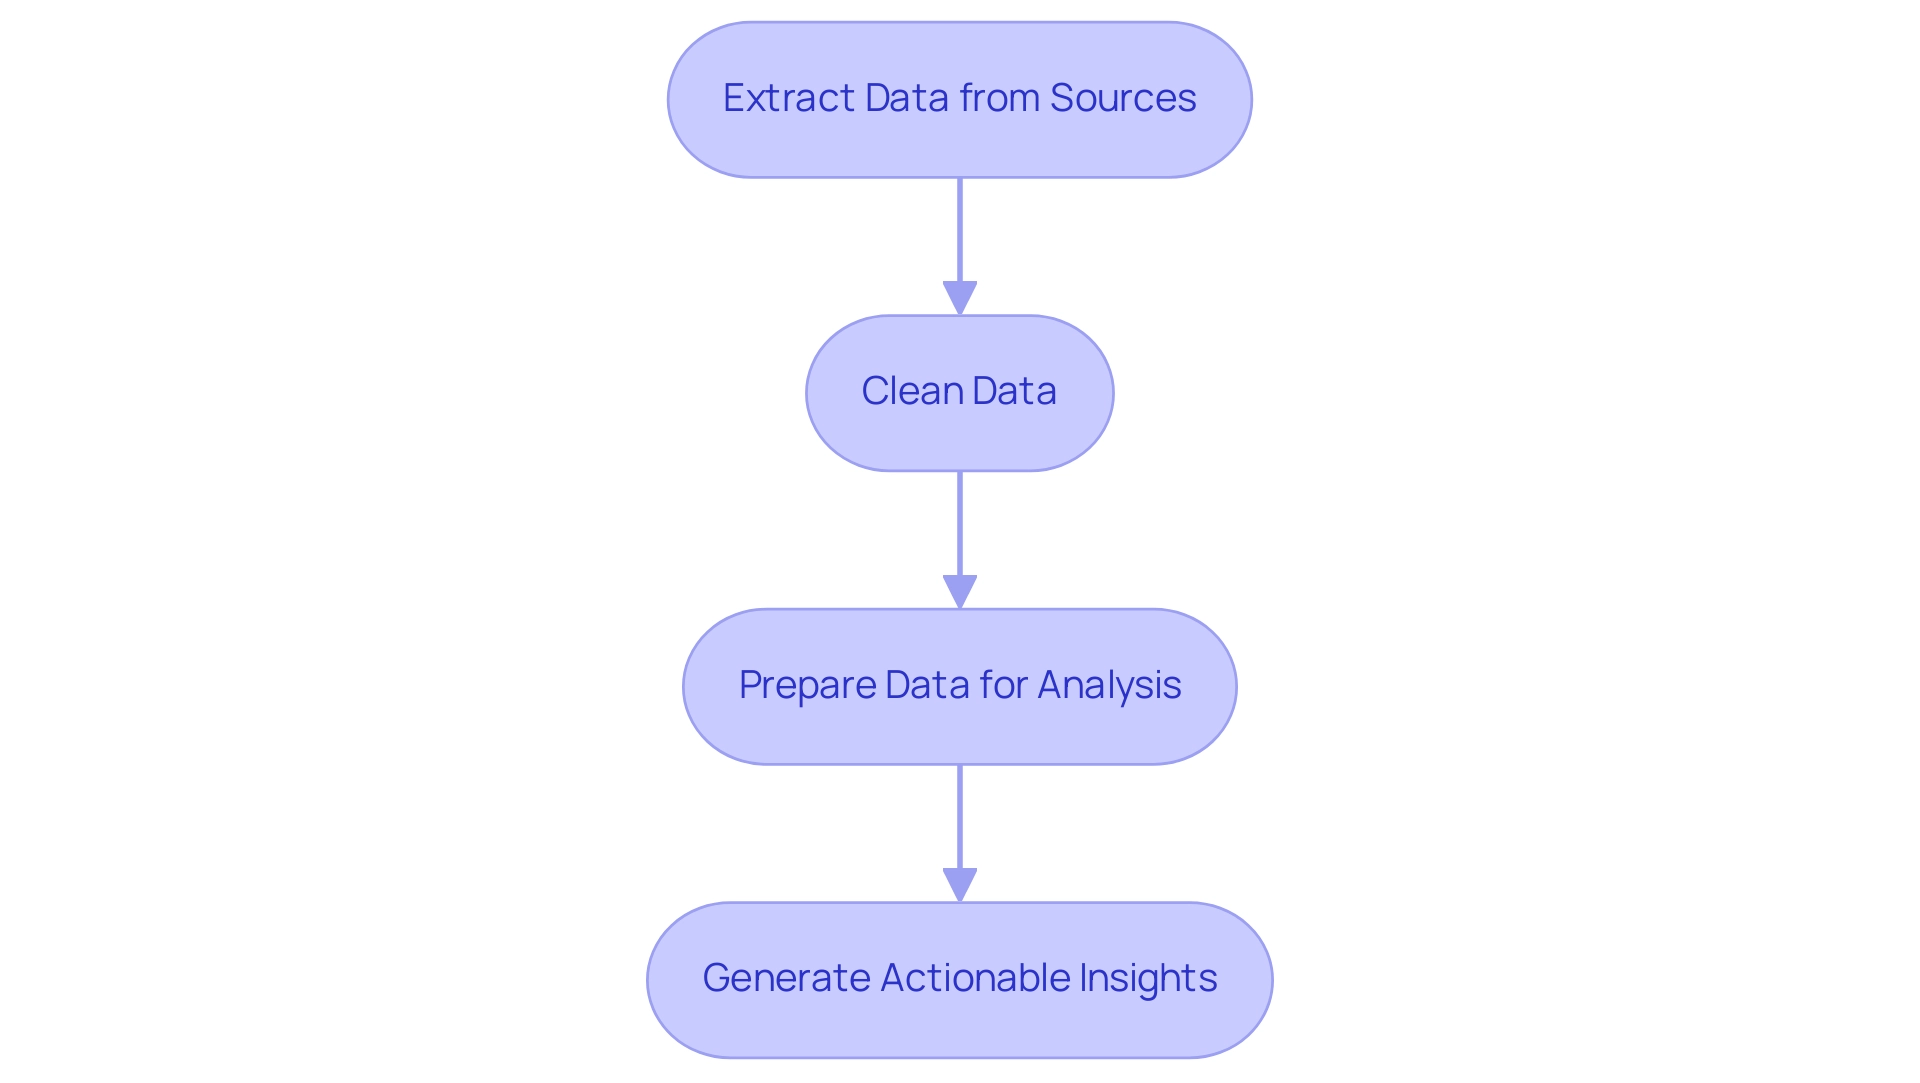
Introduction to Power Query: Unlocking Data Transformation
This tool stands out as a strong solution for information connection, transformation, and preparation, enabling users to effortlessly extract content from various sources, clean it, and ready it for analysis without extensive coding expertise. In the context of today’s overwhelming AI landscape, businesses often struggle to identify the right tools to extract meaningful insights from their data. The data transformation tool, along with BI services, offers a means to tackle these challenges efficiently.
For example, consider the monthly revenues recorded: 50000, 70000, 62000, 71000, 75000, 73000, 78000, 75000, 60000, 62000, 55000, and 50000. By employing data transformation tools, businesses can examine these figures to gain insights into financial performance and trends, which is essential in today’s information-abundant environment. The integration of BI services enhances this process, offering efficient reporting and actionable insights through features like:
- The 3-Day BI Sprint for rapid report creation
- The General Management App for comprehensive management
A strong understanding of the tool is crucial for anyone keen to improve their information processes and boost operational efficiency. As Salvatore Cagliari, a specialist in Data Analytics and Business Intelligence, highlights, ‘On the Business side, the tool is essential for converting information into actionable insights.’ In this segment, we will explore the foundational aspects of data transformation, focusing on its intuitive user interface and key features, while also referencing a case study on calculating total annual profit in BI.
This will illustrate how users can total profit columns from datasets generated in SQL Server to effectively analyze financial information. By mastering this tool, you will harness the ability to transform unrefined information into actionable insights, paving the way for informed decision-making and strategic planning, ultimately driving business growth.
Exploring Power Query Date Functions: A Comprehensive Guide
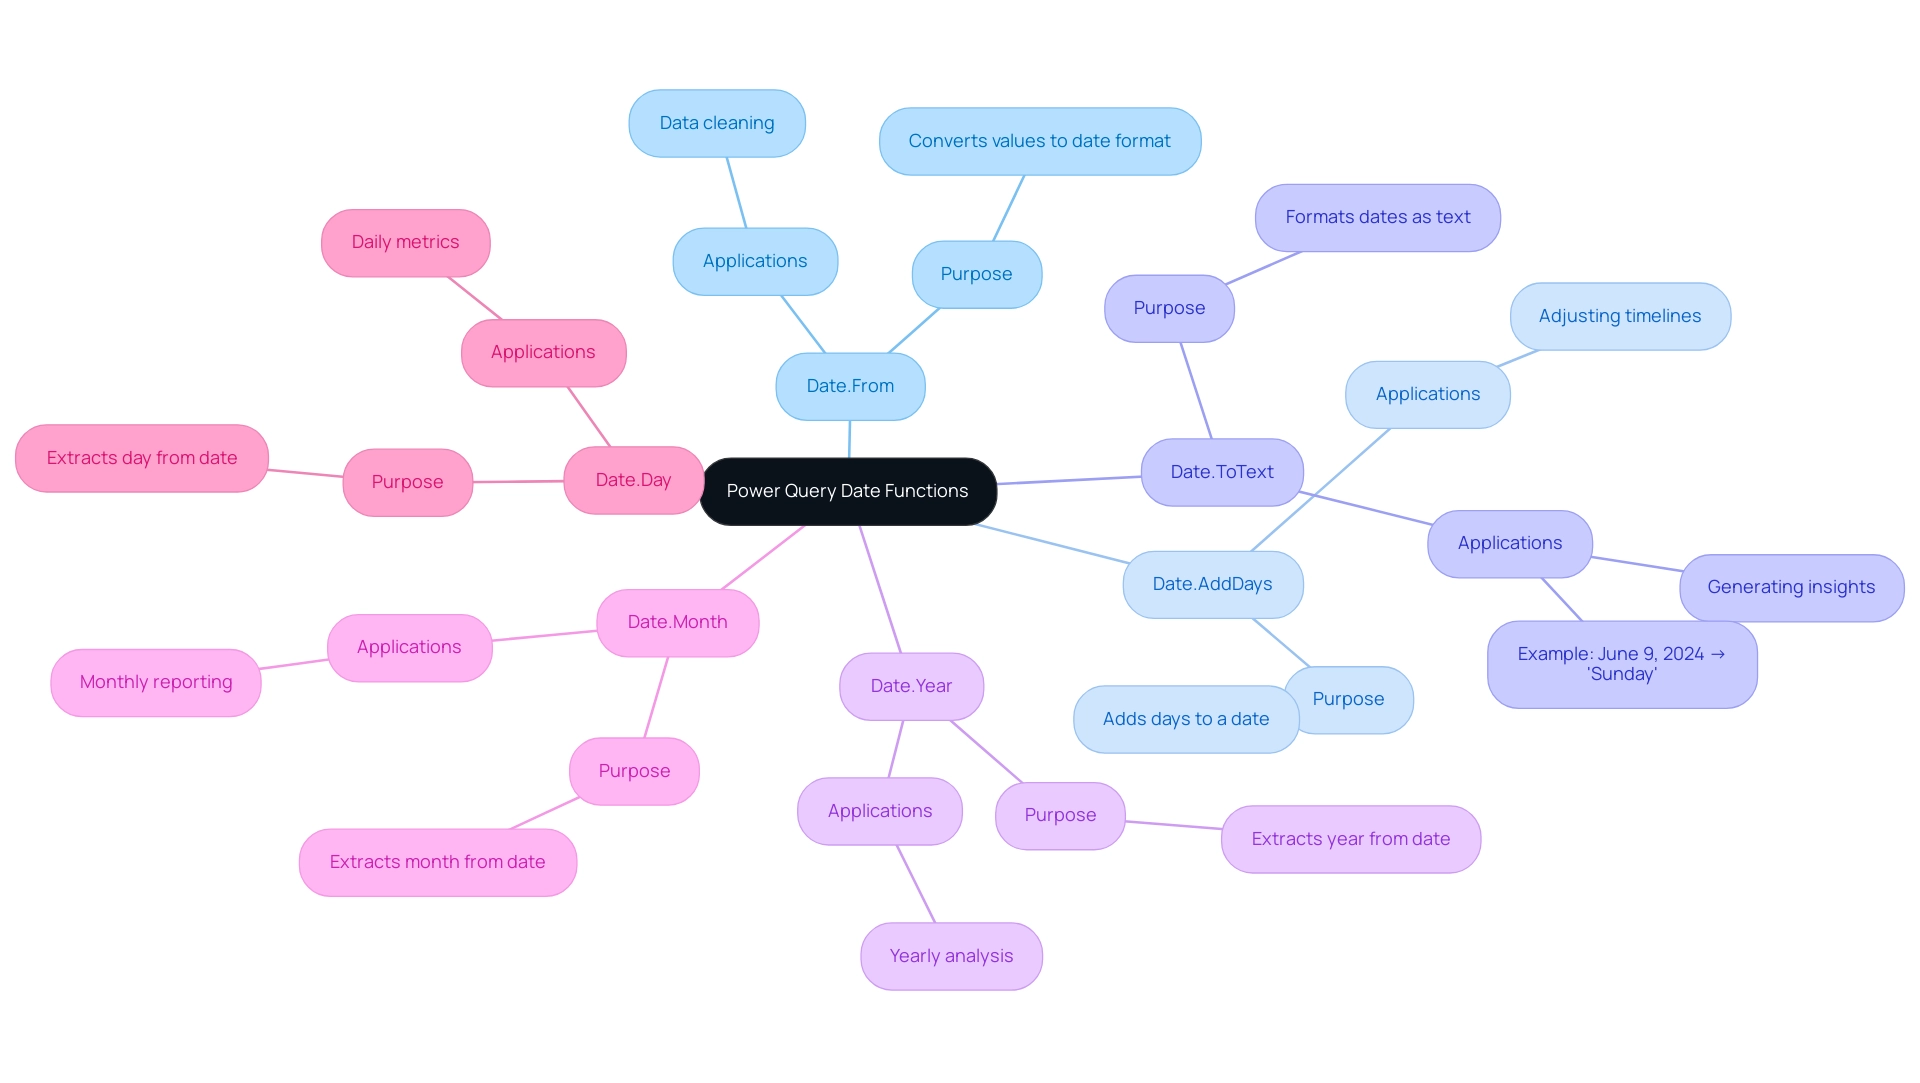
The power query date function offers an extensive array of time functions that are essential for managing temporal information effectively, supporting the broader objective of improving Business Intelligence (BI) and operational efficiency. Among the most significant power query date functions are Date.From, which converts a value into a temporal format, and Date.AddDays, which allows users to add a specific number of days to any given temporal point. These functions directly contribute to enhancing the analysis process by enabling quick adjustments to date-related information through the power query date function.
For instance, the Date.ToText function formats June 9, 2024, as a full day name, returning ‘Sunday’, illustrating its practical utility in generating insights quickly. Additional essential functions include Date.Year, Date.Month, and Date.Day, which facilitate the extraction of individual date components, utilizing the power query date function to empower analysts to tailor their datasets for precise analysis. As Rick de Groot of BI Gorilla points out, ‘BI Gorilla is a blog about DAX, Query and BI… to help you advance,’ emphasizing the importance of these tools in improving analysis capabilities.
Comprehending the power query date function not only assists in cleaning and filtering date-related information but also improves the overall handling of datasets to meet various analytical needs. This is particularly significant in tackling the challenges of lengthy report generation and inconsistencies frequently encountered when utilizing insights from BI dashboards. A practical illustration can be observed in the case study titled ‘Conclusion on Statistical Measures,’ which showcases the significance of fundamental statistical measures in analysis through the creation of a dataset in SQL Server and its subsequent examination in Business Intelligence.
By exploring these functions further, we will highlight their practical applications in streamlining information transformation workflows, ultimately leading to more insightful analysis and decision-making.
Practical Applications: Using Date Functions in Power Query
Exploring the practical applications of the Power Query date function reveals its potential to significantly transform data analysis, particularly in the context of navigating the overwhelming AI landscape. For example, consider a dataset containing sales transactions with a timestamp column. By utilizing Date.AddDays, you can create a new column that calculates the sales date plus 30 days, instrumental in forecasting future sales trends and aligning with your business goals.
This proactive approach not only enhances planning and stock management but also exemplifies how tailored AI solutions, such as predictive analytics tools, can cut through complexity to deliver targeted technologies for operational efficiency. Moreover, the power query date function, specifically the Date.Year function, allows you to filter records by specific years, streamlining the generation of year-over-year comparisons. Such comparisons are crucial for evaluating sales performance and recognizing growth patterns, highlighting the significance of Business Intelligence in transforming raw information into actionable insights. As Omid Motamedisedeh aptly states,
Anyone who wants to learn how to use functions in Power Query to transform and analyze information,
which underscores the value of mastering these techniques in the face of overwhelming options.
By mastering these techniques, you empower yourself to manipulate information effectively, leading to improved decision-making within your organization.
This aligns with the structured process for analysis in Excel, which includes collection, cleaning, exploration, analysis, and visualization. For example, utilizing insights from datasets such as the US Crime Rates, where variables like the percentage of males aged 14–24 and police expenditure can be analyzed over time, illustrates the impact of time manipulation on trends. Furthermore, the recent conversation on Excel Tables compared to Access Database underscores the changing environment of information management techniques, stressing the importance of mastering tools such as Data Transformation for improved operational efficiency.
The capacity to examine sales trends using functions not only improves your analytical skills but also enables you to utilize information for strategic benefit, fostering business expansion in an information-rich setting.
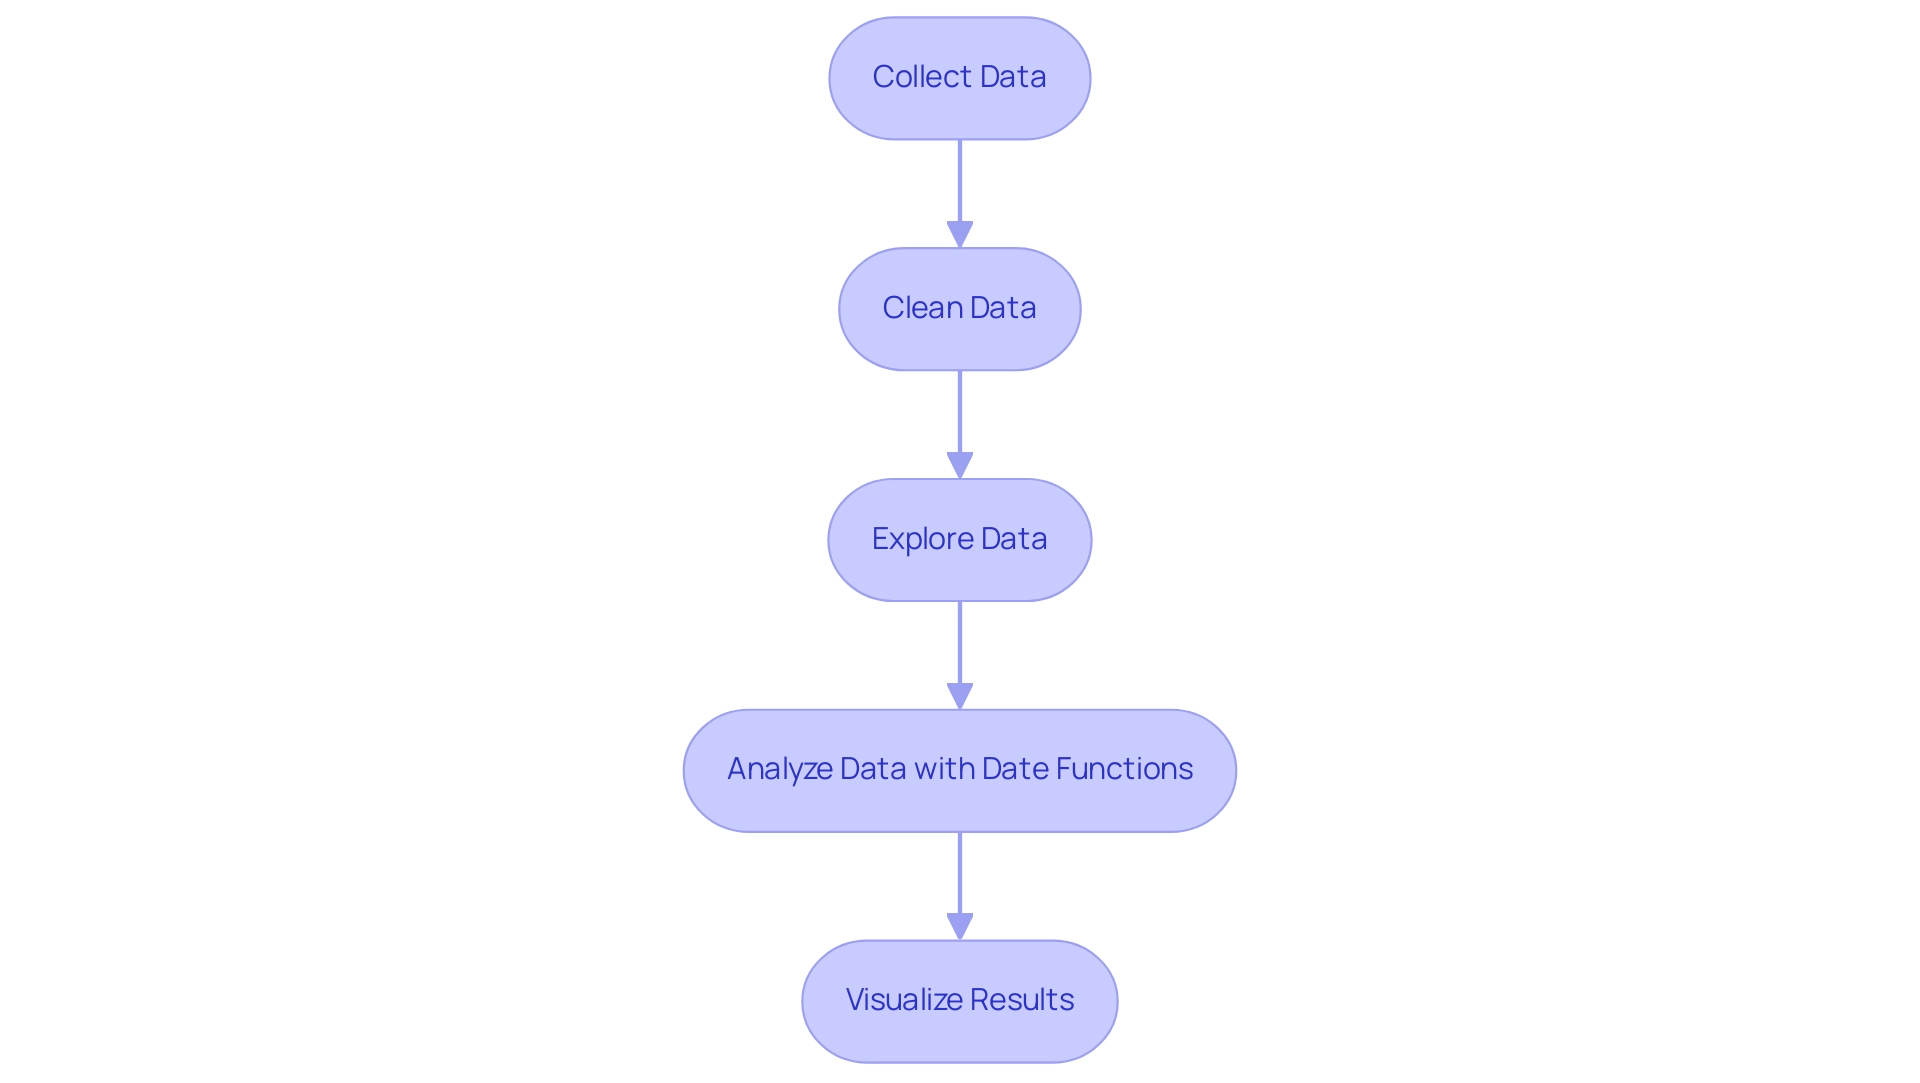
Advanced Techniques for Mastering Date Functions in Power Query
To truly master the power query date function, it’s essential to implement several advanced techniques that can significantly enhance your data analysis capabilities. Start by utilizing custom columns that allow dynamic time calculations tailored to user-defined parameters. For example, you can create a custom column that modifies timelines according to fiscal year considerations, allowing for more precise reporting.
Additionally, employing the power query date function Date.IsInCurrentMonth can dynamically filter records, ensuring that your analysis remains relevant and timely by focusing solely on the current month’s data. A practical application of list functions in time calculations can be illustrated by the statistic: List.Difference({1, 3, 6, 10, 15}, {21, 15, 9, 3}) returns {1, 6, 10}. Moreover, it’s crucial to maintain data integrity during transformations; utilizing the power query date function to convert datetime values into data-only formats helps prevent errors in your calculations.
These strategies not only streamline your workflow but also enhance the precision of your analysis, echoing the best practices highlighted in recent case studies that emphasize resilience in query design, particularly in the case study titled ‘Future-proofing Queries.’ By incorporating these advanced techniques, you can future-proof your queries against potential changes during refreshes, ensuring that your operations remain efficient and effective. As mentioned in a recent article on linking to Spotify using a data transformation tool, the application of these techniques can significantly improve your information management capabilities.
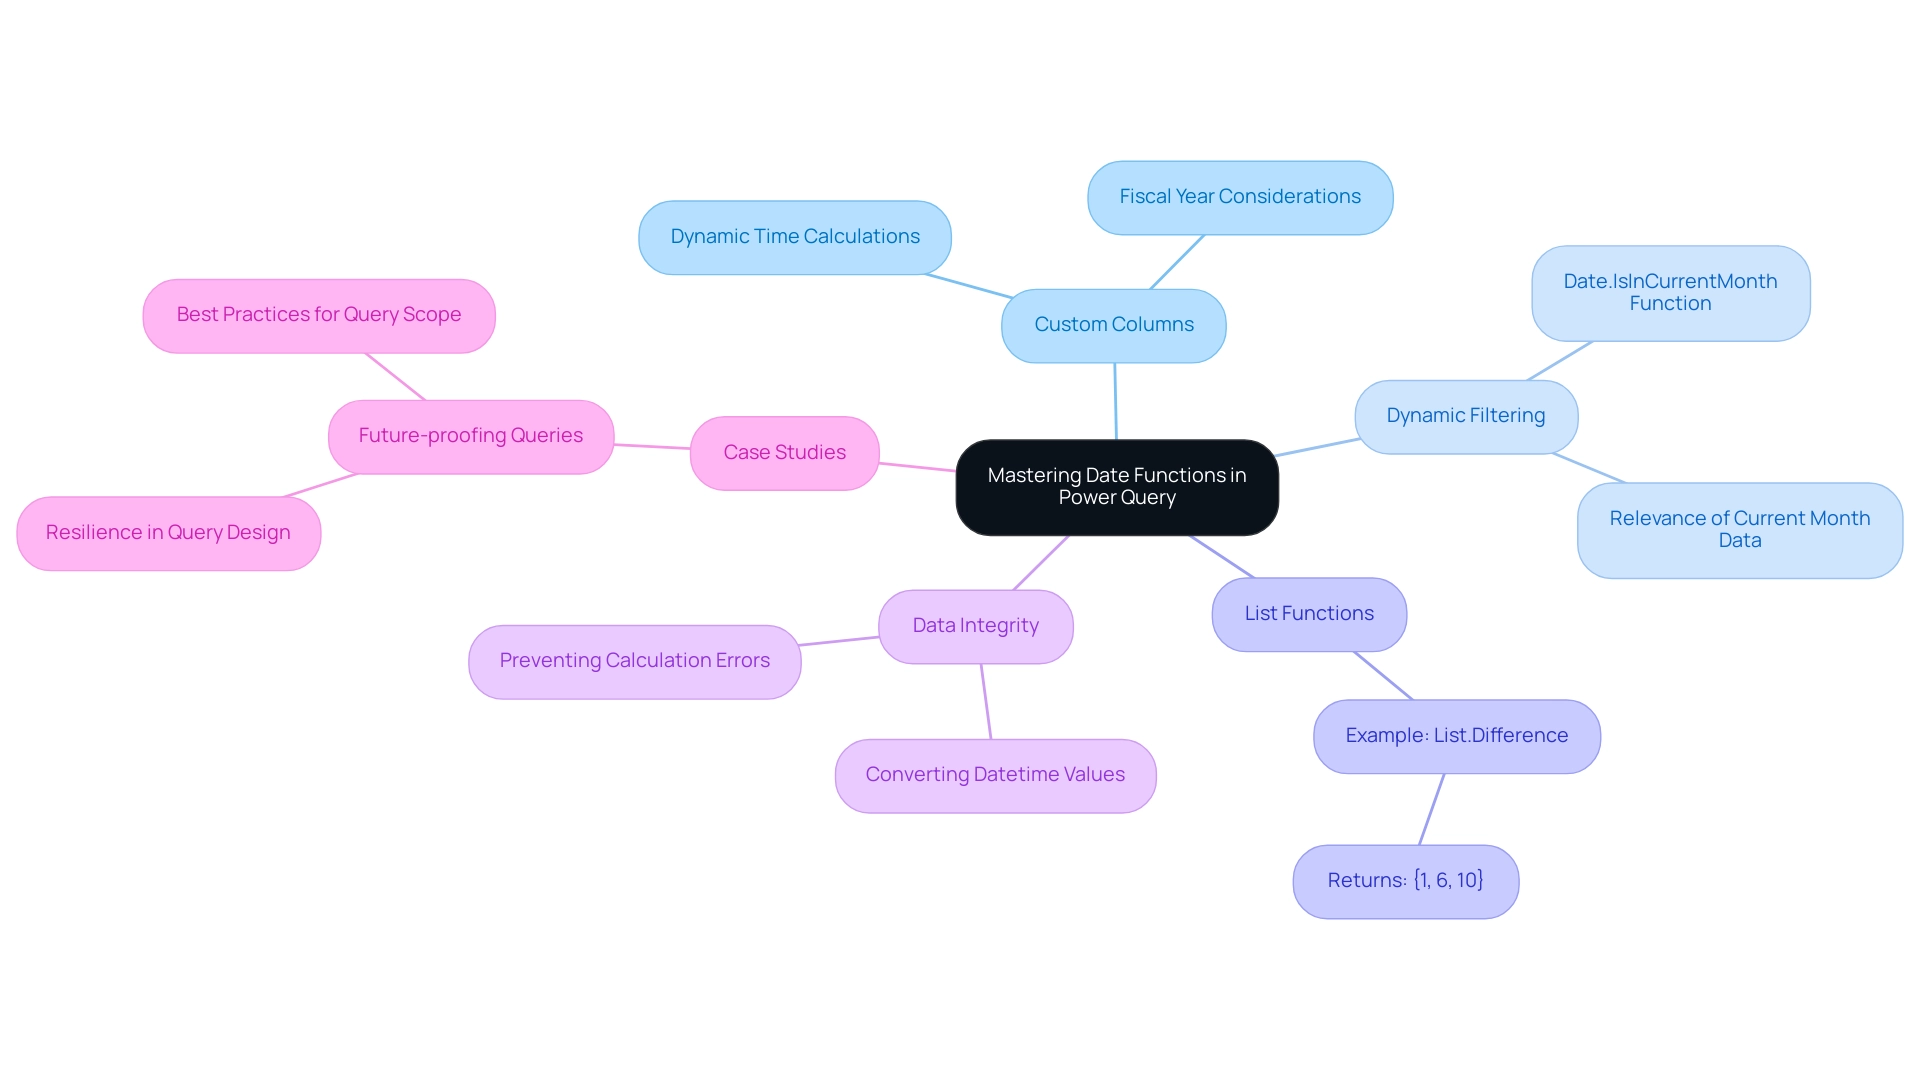
The Future of Power Query: Evolving Date Functions and Features
As the tool progresses, thrilling improvements in the power query date function and features are approaching, promising to simplify information manipulation even more. Manual, repetitive tasks can significantly slow down operations, leading to wasted time and resources. The tool’s ability to connect to various data sources, including:
- Excel tables
- CSV files
- Databases
- Web pages
underscores its versatility in handling diverse datasets.
In a swiftly changing AI environment, utilizing Robotic Process Automation (RPA) within data transformation can streamline these manual workflows, enhancing efficiency and minimizing mistakes, while allowing your team to focus on more strategic, value-enhancing tasks. Anticipated updates may include:
- User-friendly interfaces that simplify date calculations with the power query date function
- Expanded functions catering to different time zones
- Improved integration with machine learning models for more accurate predictive analysis
A practical example of Power’s functionalities can be observed in the Decomposition Tree by JTA, which divides information into Positive, Neutral, and Negative categories, demonstrating effectiveness for sentiment analysis and improving information visualization.
By keeping abreast of these developments, you can enhance your analytical capabilities and tap into new functionalities that can significantly optimize your data transformation workflows. Users can monitor business performance and access rich dashboards on any device, further emphasizing the importance of staying informed about updates. Regularly monitoring updates, engaging in community forums, and exploring fresh resources will empower you to make the most of Power Query’s evolving capabilities while integrating RPA to drive data-driven insights and operational efficiency.
As Patrick LeBlanc, Principal Program Manager, aptly stated,
We’re excited to see what you create with this new path layer.
Embrace these innovations to elevate your operational efficiency.
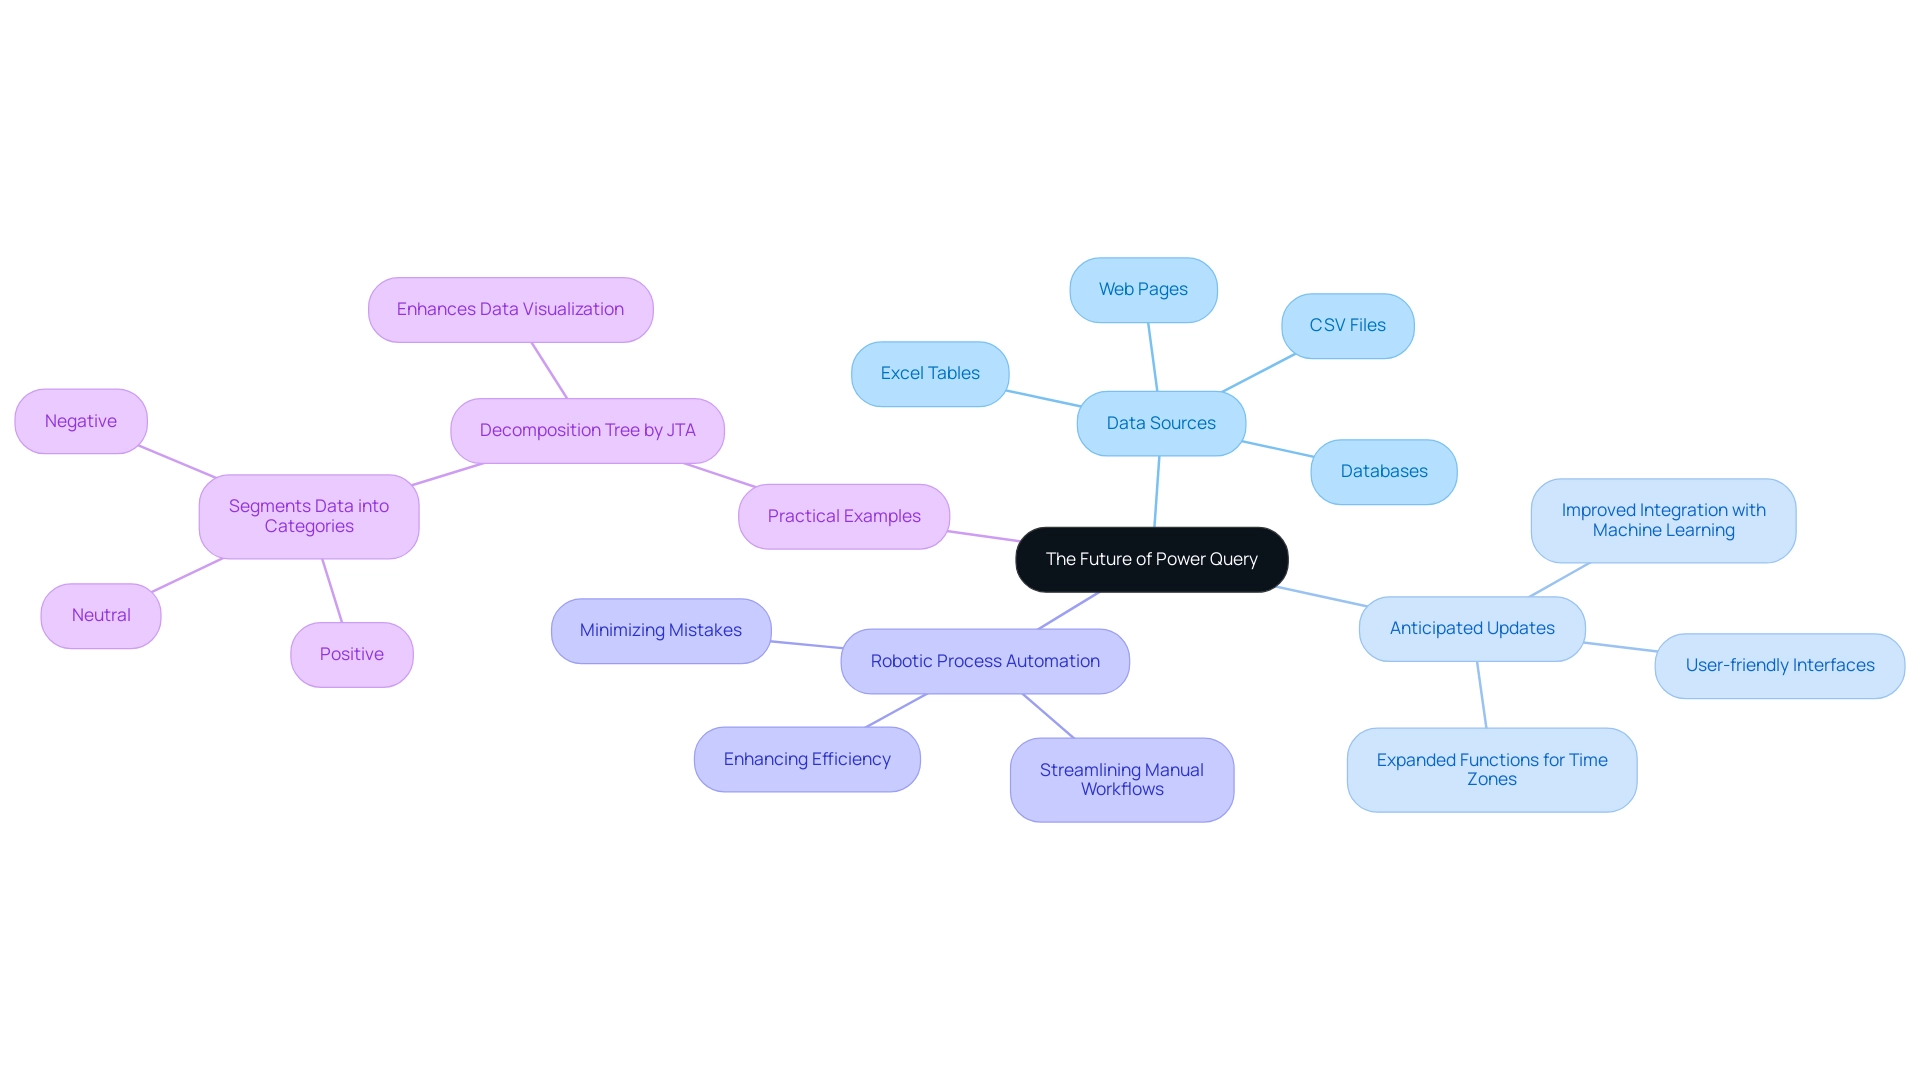
Conclusion
Harnessing the power of Power Query is essential for any organization aiming to thrive in today’s data-driven landscape. This article has explored the invaluable capabilities of Power Query, particularly its date functions, which serve as foundational tools for transforming raw data into actionable insights. By leveraging these techniques, businesses can enhance their data processes, streamline operations, and ultimately drive strategic growth.
Understanding and mastering date functions such as Date.AddDays, Date.Year, and Date.IsInCurrentMonth equips users with the ability to manipulate and analyze data effectively. These skills not only simplify complex data tasks but also enable organizations to make informed decisions based on precise, timely insights. As demonstrated through practical applications, the integration of these functions into data workflows significantly enhances operational efficiency and business intelligence.
Looking ahead, the future of Power Query holds exciting advancements that promise to further refine data transformation capabilities. By embracing these evolving features and techniques, organizations can stay ahead of the curve, ensuring that they are well-equipped to navigate the complexities of data management. The commitment to mastering Power Query empowers businesses to unlock their full potential, turning data into a strategic asset that fosters innovation and drives success in an increasingly competitive environment.
Overview:
The article focuses on mastering Power BI themes through the use of JSON, providing a comprehensive guide to creating and applying customized themes that enhance visual consistency and branding. It emphasizes the importance of structured JSON files for defining color palettes and font styles, supported by examples and best practices that help users overcome common challenges in data visualization and reporting.
Introduction
In the world of data visualization, the ability to present information clearly and consistently is paramount. Power BI themes emerge as powerful tools that not only enhance the visual appeal of reports but also ensure alignment with organizational branding standards. As companies strive to make informed decisions based on accurate data insights, understanding how to effectively utilize these themes becomes crucial.
This article delves into the essential aspects of Power BI themes, guiding readers through the creation and application of custom JSON themes, advanced customization techniques, and strategies for overcoming common challenges.
By harnessing the potential of Power BI themes, organizations can significantly improve their reporting processes, foster brand consistency, and ultimately drive operational efficiency.
Understanding Power BI Themes: The Basics
BI styles are crucial groups of formatting options that determine how visuals and dashboards display data. These concepts govern essential aspects like color palettes, font selections, and overall visual styles, allowing users to uphold a uniform and professional look throughout all documents. Currently, there are 2,652 users online, highlighting the active engagement with Power BI and its topics.
By effectively utilizing these concepts, organizations can significantly improve the clarity of their visual representations, ensuring that documents not only communicate information clearly but also conform to corporate branding standards. As Mahmood, an advocate in the community, noted, ‘It would be great if an Admin could confirm this is only in reference to the Admin report,’ emphasizing the importance of clarity in reporting. Comprehending the basics of Power BI themes JSON is essential as it establishes the foundation for developing personalized themes using Power BI themes JSON, which is a lightweight interchange format that is both human-readable and writable.
This customization capability allows directors of operations efficiency to tailor reporting tools to their unique organizational needs, ultimately improving the user experience and decision-making processes. Furthermore, organizations that struggle to extract meaningful insights from their information face a competitive disadvantage. Acknowledging the challenges in utilizing insights from BI dashboards, such as time-consuming report creation, inconsistencies in information, and absence of actionable guidance, is essential.
A case study on ‘Challenges in Self-Service Business Intelligence’ identifies data integration and data security as primary challenges, accounting for 20% and 14% respectively, underscoring critical areas for improvement in self-service BI adoption. Furthermore, incorporating RPA solutions can enhance BI designs, simplifying the reporting process and tackling these challenges efficiently, thus improving operational effectiveness.
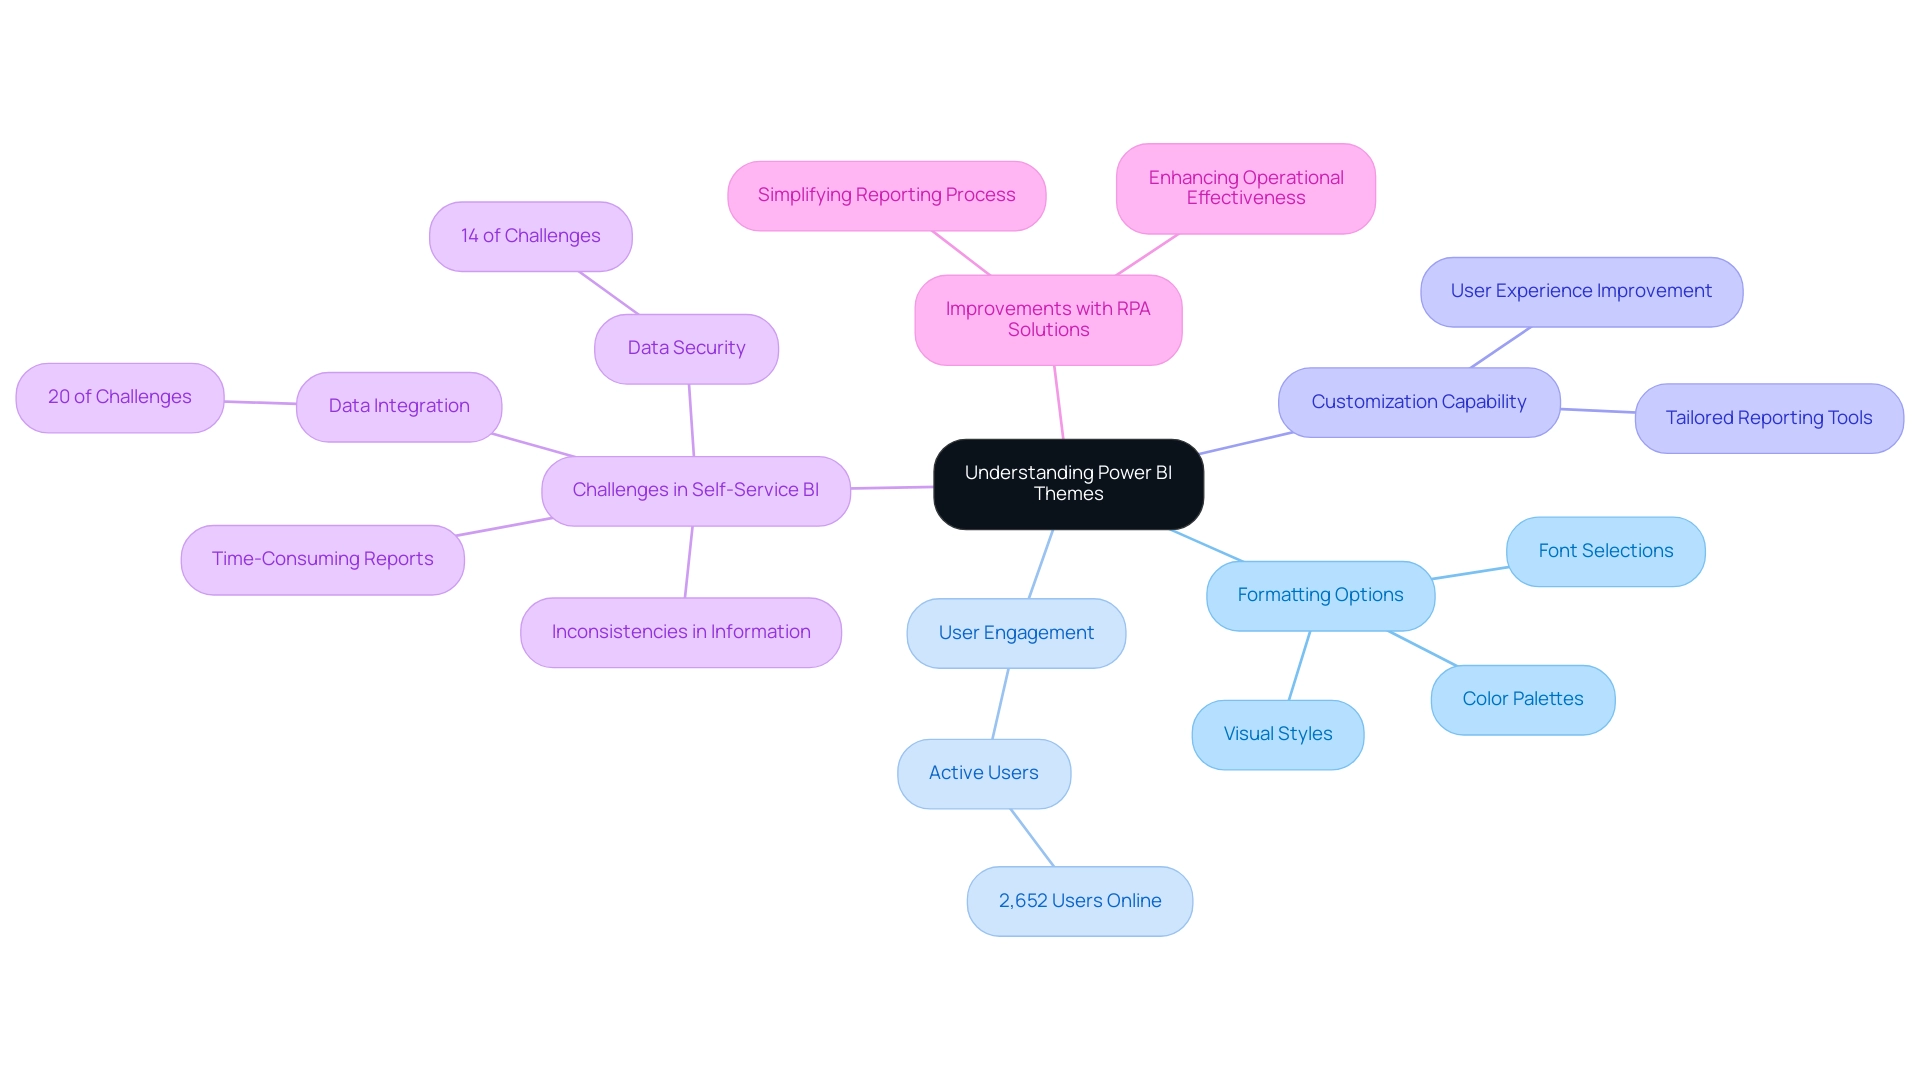
Creating and Applying JSON Themes in Power BI
Creating a power bi themes json for BI begins with defining your preferred color palette and font styles in a structured JSON file. This process helps streamline report creation, ensuring consistency and clarity across your dashboards. An illustrative example is as follows:
json

{

  "visualStyles": {

    "*": {

      "general": {

        "wordWrap": true,

        "guidelines": {

          "show gridlines": true

        }

      }

    }

  }

}
As Ruth Pozuelo aptly states, “Hopefully you will find this template as useful as I have and start creating Power BI templates in no time.” By employing organized concepts, you can alleviate the challenges of data inconsistencies, often arising from a lack of governance strategy, and provide clear, actionable insights that guide stakeholders effectively. To further assist you, a video tutorial has been embedded to guide you through the process of using the power bi themes json file for business intelligence designs.
You can access the latest version of the power bi themes json through the provided link. Furthermore, by utilizing code MSCUST, you can improve your operational efficiency with a $150 discount on applicable resources, facilitating your exploration and implementation of customized designs in BI.
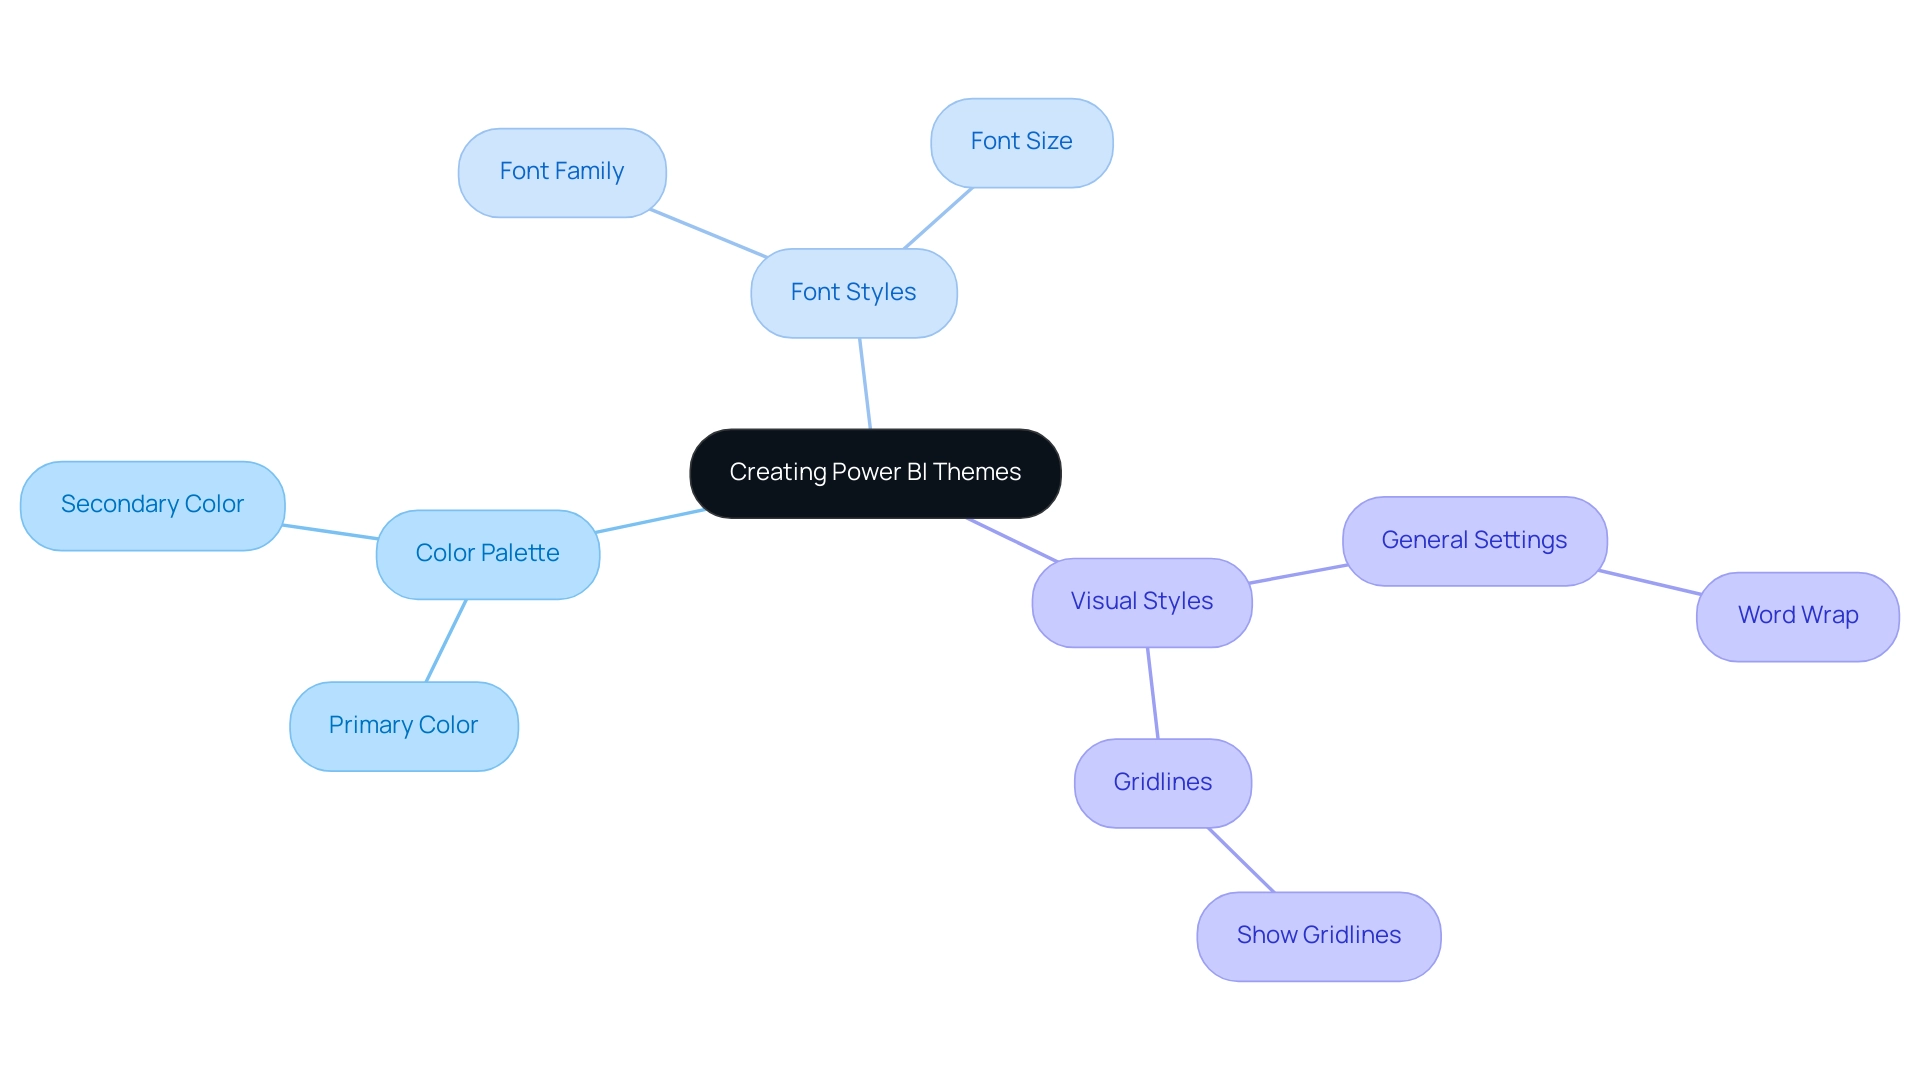
Advanced Customization Techniques for Power BI Themes
To elevate your Power BI themes JSON and overcome common challenges in leveraging insights, delve deeper into the customization of individual visual elements by incorporating custom fonts and colors. For instance, specifying font families directly in your Power BI themes JSON file enhances readability and aesthetics, allowing you to focus on analysis rather than time-consuming document creation. Here’s a sample structure to guide you, which includes properties for first, second, third, and fourth level elements, providing a comprehensive understanding of customization options:
json

{

  "visualStyles": {

    "*": {

      "color": {

        "solid": {

          "color": "#FFBB78"

        }

      },

      "fontFamily": "Arial"

    }

  }

}
It’s also important to note that the applied filter card background is set to gray (#E5E9ED), which can be an integral part of your color customization strategy. Moving beyond simple color adjustments, experimenting with gradient colors and shadows can create a more dynamic visual experience. Such techniques not only enhance the overall appeal of your documents but also contribute to a more engaging user experience.
As Paul Waller, a designer, aptly puts it,
It’s very satisfying writing a few lines of code then watching those style changes take effect when updating the report theme.
This satisfaction resonates with many users who embrace customization, as reflected in the case study titled ‘Satisfaction in Coding for Custom Themes.’ Here, overcoming initial coding challenges led to immediate visual enhancements, reinforcing how user preferences for visually appealing representations drive the demand for advanced customization techniques.
However, to fully address the challenges of inconsistencies and the lack of actionable guidance, it’s crucial to implement a robust governance strategy. This guarantees that the data utilized in your documents is accurate and dependable. Additionally, integrating Robotic Process Automation (RPA) and AI solutions can streamline your reporting processes, enhancing operational efficiency and enabling informed decision-making.
By adopting these strategies, you position yourself at the forefront of BI innovation while ensuring your documents provide clear, actionable guidance.
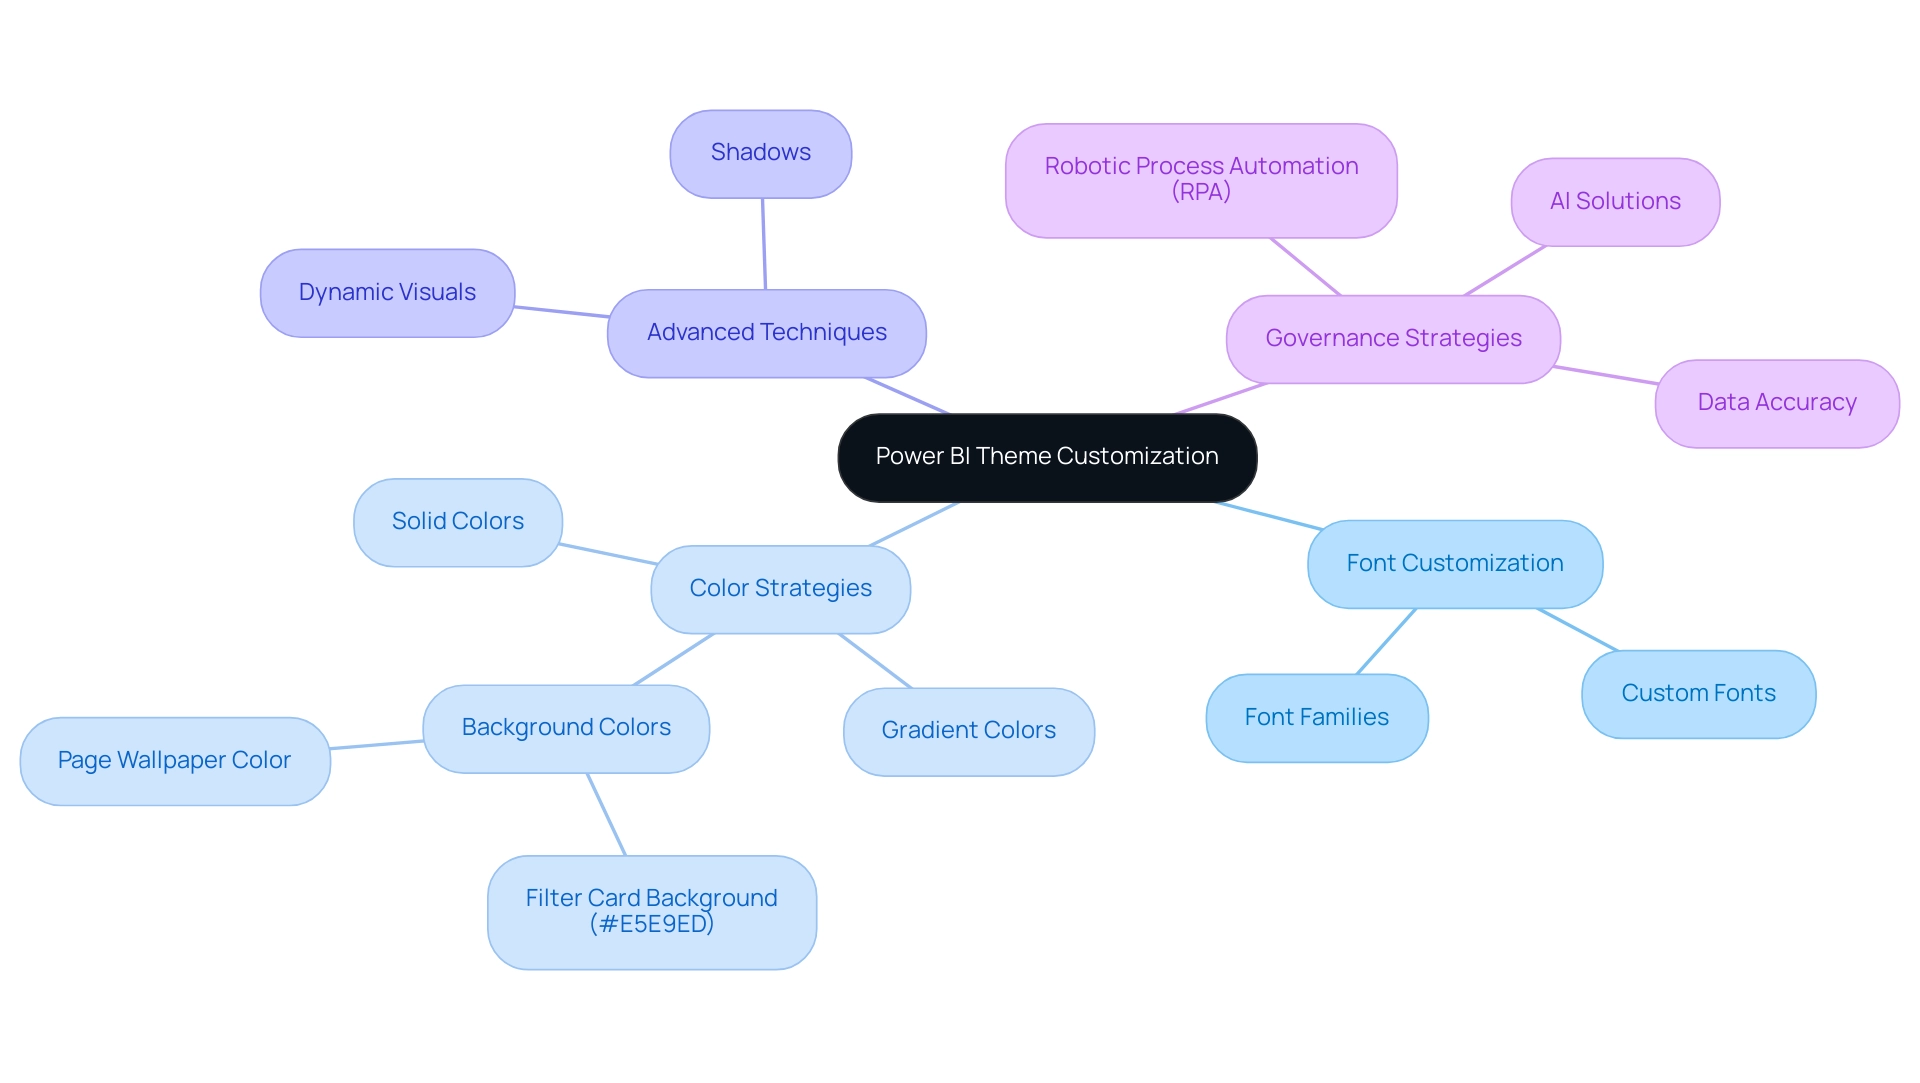
Leveraging JSON Themes for Branding and Consistency
Utilizing power bi themes json in BI can significantly enhance your brand’s visibility within analyses, particularly when combined with strong Business Intelligence practices. It is crucial to ensure that your color palette resonates with your organization’s branding guidelines, while visual elements distinctly reflect the company’s identity. However, obstacles like time-consuming document generation and information inconsistencies often impede effective use of BI dashboards.
By systematically implementing power bi themes json throughout all documents, you not only create a unified experience for users but also enhance operational efficiency and confidence in your information. RPA solutions such as EMMA RPA and Automate can streamline the report creation process, helping to mitigate these challenges. This approach allows stakeholders to swiftly identify and connect with your organization’s materials.
In fact, 81% of consumers consider information transparency vital for trusting a brand, indicating that a consistent visual identity can foster trust and familiarity. Additionally, 64% of consumers make a purchase after viewing a branded social video, underscoring the effectiveness of visual branding in driving consumer behavior. Strong brand loyalty is also evident, as 59% of consumers are willing to wait for their favorite products rather than shop elsewhere, showcasing the powerful impact of cohesive branding strategies.
Furthermore, as Yotpo notes, many shoppers need to buy from a brand five or more times before they consider themselves loyal, reinforcing the importance of consistent branding. Finally, with 72% of people wanting brands to positively contribute to society, a strong brand identity can align not only with consumer preferences but also with broader social values.
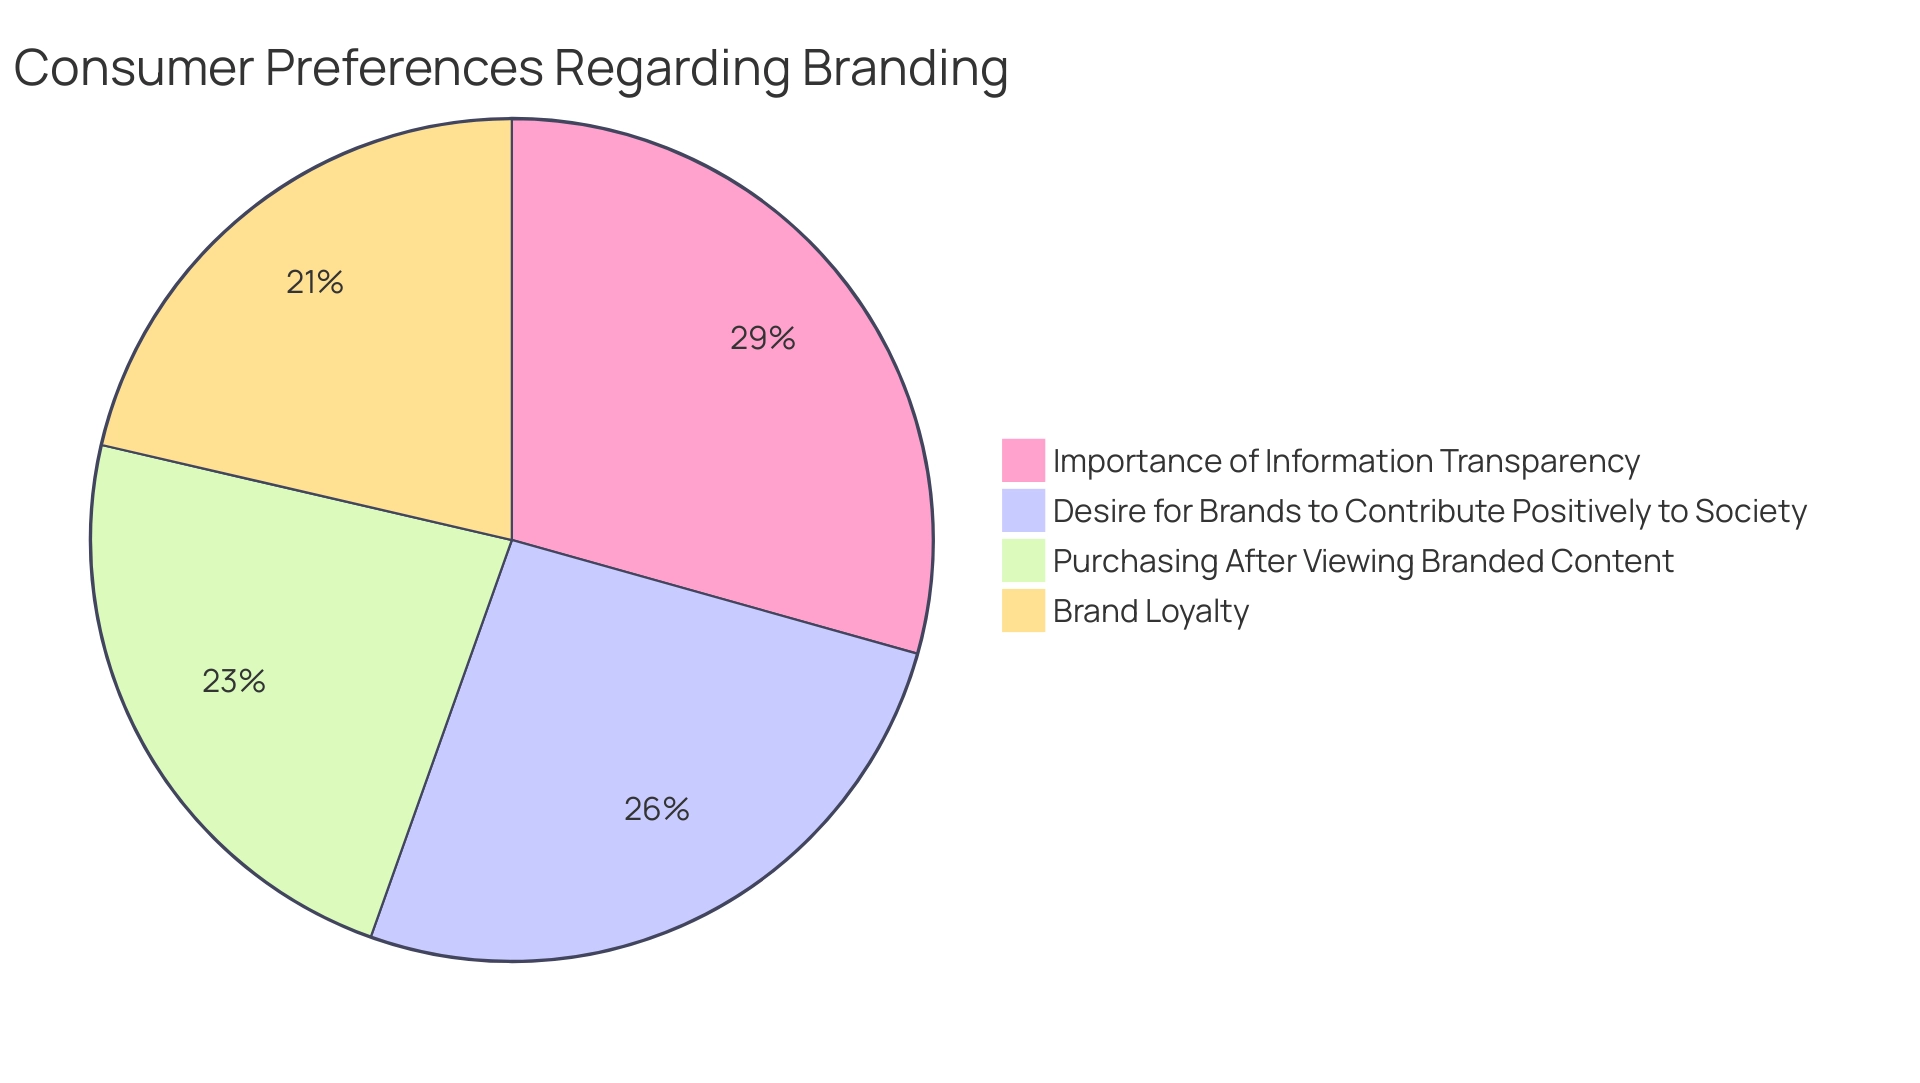
Troubleshooting Common Issues with Power BI JSON Themes
When navigating the complexities of Power BI themes JSON styles, users often encounter common issues such as file format errors and inconsistencies in the application of Power BI themes JSON, which can hinder effective data analysis and reporting. Many users express frustration over the default styling of BI dashboards, complicating the customization process and diverting focus from leveraging actionable insights. To enhance efficiency, it is crucial to ensure your Power BI themes JSON file is correctly formatted; utilize an online JSON validator to catch any potential syntax errors prior to import.
If your design isn’t working as anticipated, an important first step is to verify that your BI version is up to date, as earlier versions may not support newer features. Additionally, verifying that the color codes and font names specified in your Power BI themes JSON file align with those available in Power BI can save time and reduce inconsistencies. As Zoe Zhi from Community Support observed, ‘I test this in my environment (July 2019 desktop), and I get below result when I import JSON by clicking switch appearance -> import appearance.’
This highlights the significance of ensuring compatibility when applying custom designs. By proactively tackling these typical obstacles, including the difficulties of lengthy documentation generation and data discrepancies, you can optimize your application process and improve your team’s capacity to extract valuable insights from BI. Furthermore, integrating Robotic Process Automation (RPA) can significantly reduce manual tasks associated with report generation, allowing your team to focus on analysis rather than creation.
The case study titled ‘Amending Your Visuals‘ discusses limitations in the Power BI customize theme framework and offers workarounds using Power BI themes JSON, providing valuable insights into how users can override default formatting options to maintain visual consistency when changing themes. This approach not only empowers your operations but also fosters a culture of informed decision-making, ensuring that data governance strategies are in place to guide stakeholders on actionable next steps.
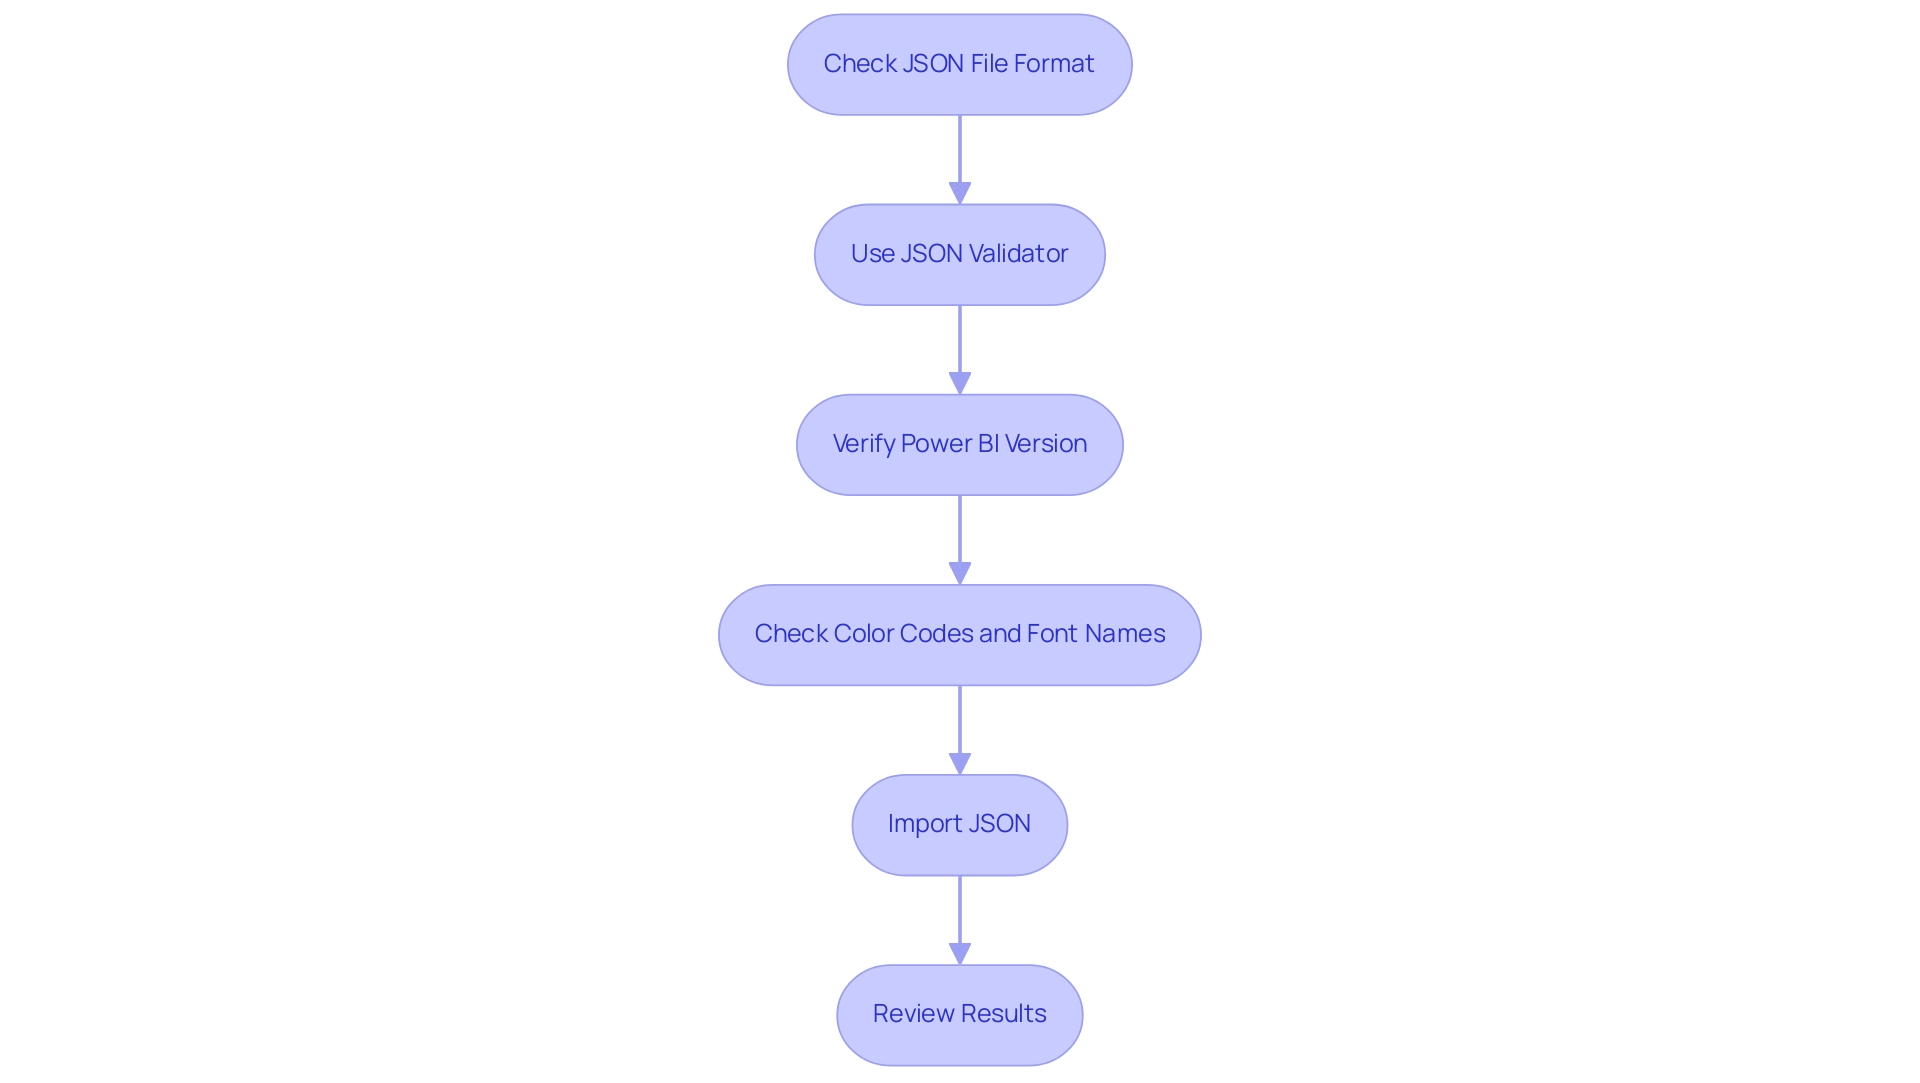
Conclusion
Power BI themes are more than just aesthetic enhancements; they are essential tools that drive clarity, brand consistency, and operational efficiency in data reporting. By understanding the fundamentals of Power BI themes, creating customized JSON themes, and employing advanced customization techniques, organizations can significantly improve their data visualization processes. These practices not only streamline report creation but also align visual presentations with corporate branding standards, fostering trust and engagement among stakeholders.
Moreover, overcoming common challenges such as data inconsistencies and time-consuming report generation is crucial to maximizing the benefits of Power BI. Implementing a robust governance strategy, integrating RPA solutions, and ensuring proper formatting of JSON files are key steps in this journey. By addressing these issues proactively, organizations can enhance their reporting capabilities and derive actionable insights that inform decision-making.
Ultimately, leveraging Power BI themes is a strategic advantage that empowers organizations to present data in a visually appealing and coherent manner. As businesses continue to prioritize data-driven strategies, embracing these tools will not only improve reporting efficiency but also strengthen the connection between data insights and organizational goals. Now is the time to harness the full potential of Power BI themes to elevate your reporting processes and drive operational success.
Overview:
Pending changes in Power BI queries can be resolved by applying or discarding modifications in the Power Query Editor, refreshing data sources, and ensuring proper dependency relationships among queries. The article emphasizes that timely application of changes is crucial to maintaining data integrity and operational efficiency, as unresolved pending changes can hinder performance and lead to inaccurate reporting.
Introduction
In the realm of data-driven decision-making, Power BI stands out as a powerful tool that can transform raw data into actionable insights. However, many users encounter the frustrating issue of pending changes, which can stall report creation and hinder effective data analysis. Understanding the nuances of managing these changes is crucial for optimizing the Power BI experience.
This article delves into practical solutions for addressing pending changes, ensuring query integrity, and implementing best practices that empower organizations to leverage their data effectively. By embracing these strategies, users can navigate the complexities of Power BI with confidence, ultimately enhancing their operational efficiency and decision-making capabilities.
Understanding Pending Changes in Power BI Queries
In Power BI, there are pending changes in your queries that frequently occur when users modify requests that have not yet been applied or committed. This common event, especially during tasks such as modifying a query in the Power Query Editor or changing information sources, can result in time-consuming creation processes, as users face alerts that hinder essential actions like refreshing or publishing documents. The concern surrounding pending changes became prominent following the September 2020 update, a shift that many users reported after its installation.
Re-installing the August 2020 version has been found to resolve these issues, which tend to reappear with the October 2020 version. Furthermore, to guarantee information is correlated in the Usage Metrics Document, users must access the content from within the workspace at least once; otherwise, no information will be processed for the document, limiting actionable insights into usage. In Power BI, there are pending changes in your queries that not only streamline operations but also enhance the overall quality of insights, reinforcing the necessity of applying changes promptly to avoid adverse effects on execution.
Moreover, establishing a robust governance strategy is crucial to reduce inconsistencies, ensuring that all documents are precise and trustworthy. Clear, actionable guidance in documents is also crucial, as it empowers stakeholders to make informed decisions based on the data presented. As one frequent visitor aptly stated,
‘This works for me.
I’ve been working for this for the past 3 days. Very simple solution. Thank you Matbau.’
By concentrating on addressing these challenges and highlighting governance and guidance, you can change the way your organization utilizes BI dashboards, shifting from mere report creation to actionable insights that drive operational efficiency.
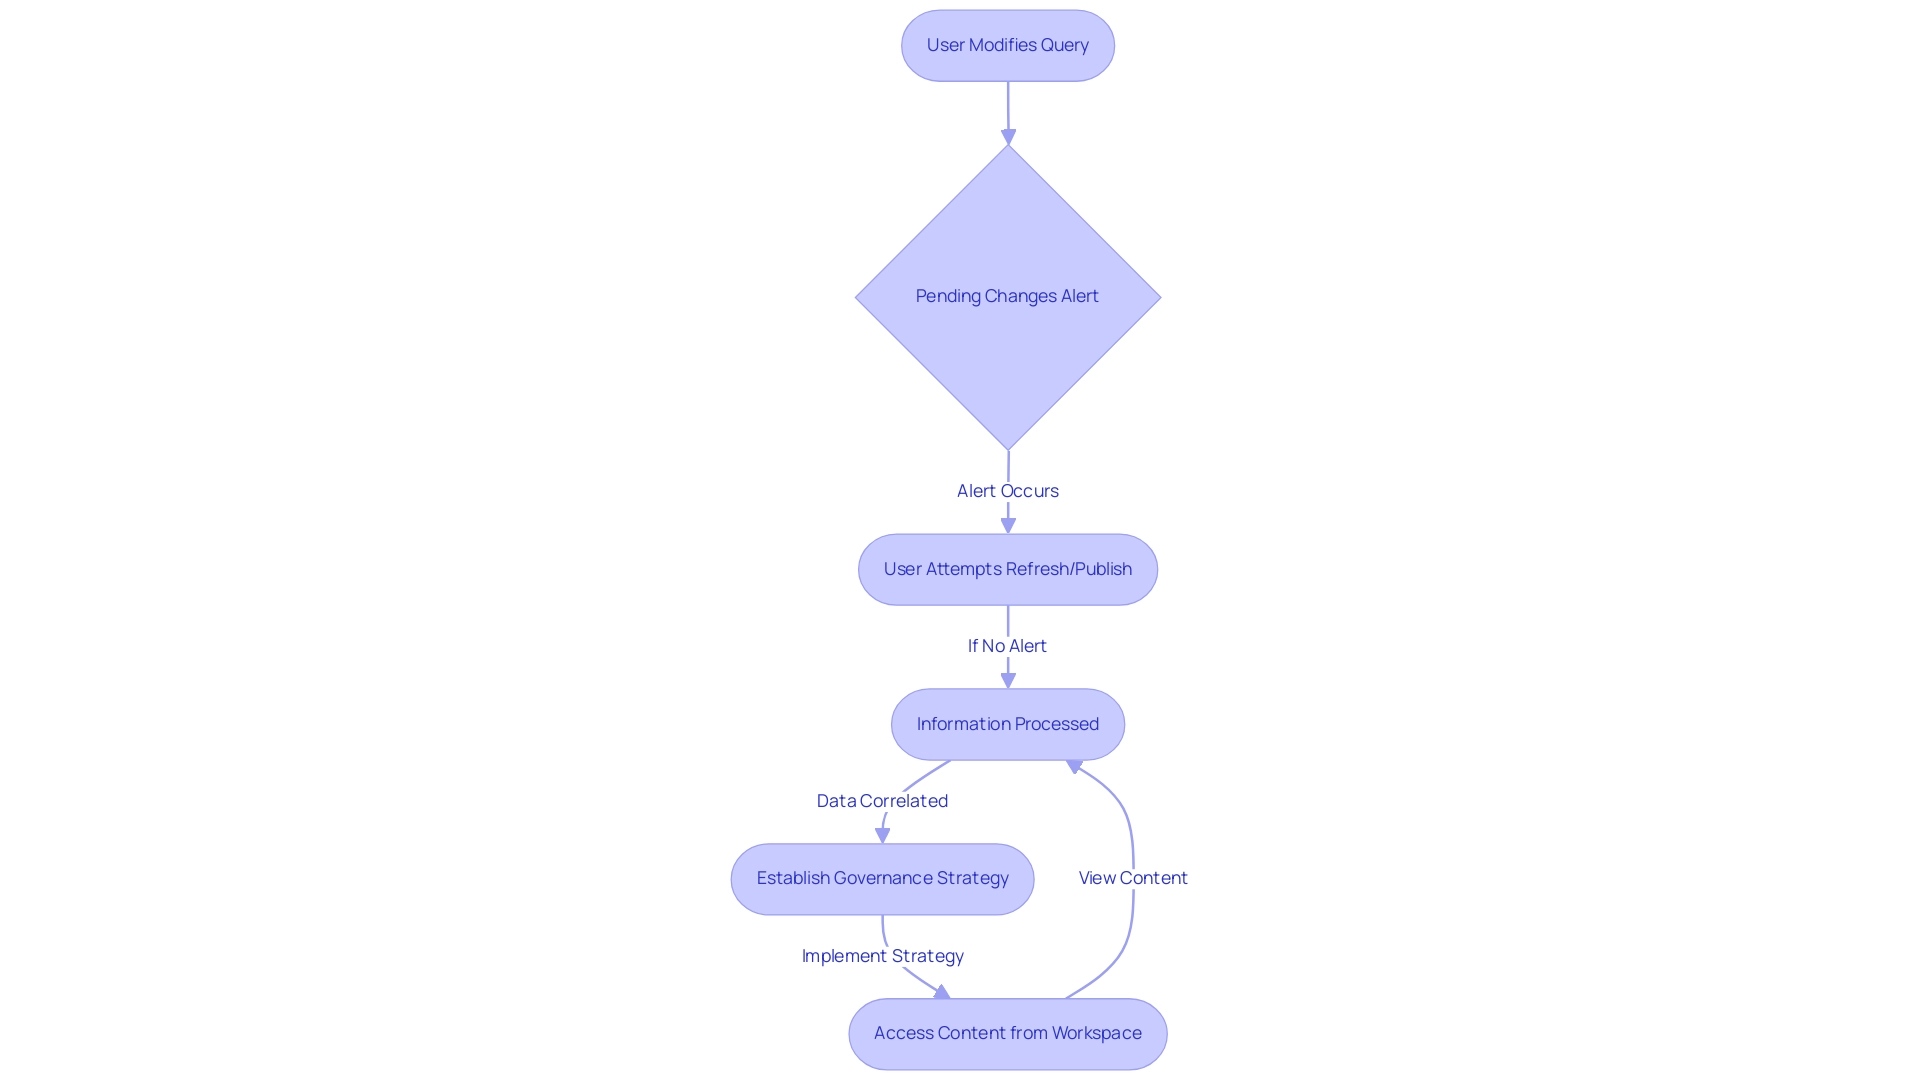
Step-by-Step Solutions to Resolve Pending Changes
-
Check for Unapplied Changes: Start by opening the Query Editor in Power BI, where there are pending changes in your queries, to identify any queries marked with a pending status. Highlighted changes indicate that actions are necessary. To apply these changes, simply click on ‘Close & Apply’.
-
Revert Changes: If you opt not to retain certain modifications, you can easily revert them by selecting ‘Discard Changes’ within the Power Query Editor. This functionality allows for flexibility and control over your information adjustments.
-
Refresh the Data Source: Often, refreshing the data source can effectively resolve pending changes. To do this, right-click on the relevant item in the Queries pane and choose ‘Refresh’. This simple step can often eliminate minor issues and enhance operational efficiency.
-
Check Dependency Relationships: It’s crucial to ensure that all dependencies are correctly configured. If a query relies on another, and in Power BI there are pending changes in your queries, it could lead to complications. Utilize the ‘Manage Relationships’ feature to inspect and adjust any dependencies as needed to maintain data integrity and streamline your workflow.
-
Restart BI: If the issue continues to persist despite the above steps, save your work, close BI completely, and then restart the application. This action can assist in resolving temporary glitches that may be adding to the issue.
Furthermore, remember that in Power BI there are pending changes in your queries, and user error rates concerning this issue are significant, with a considerable number of documents remaining unopened over time, emphasizing the necessity for awareness and diligence in handling your queries. As highlighted by Mike, a new member with firsthand experience, issues often arise from the ‘Enable load’ function being hiddenly activated. To address this, ensure that stale functions are correctly managed—deactivating their load when necessary can prevent future complications.
A practical example of this is demonstrated in the case study titled Creating a Fresh Usage Metrics Document, where users learned to refresh their browser after removing the semantic model, enabling them to generate a new usage metrics document in the BI service, thus ensuring they work with the most recent information. This process also emphasizes the limitation that while users can add new tables, they may face challenges in applying changes to existing ones. Employing RPA alongside Business Intelligence tools such as BI can further improve your operational efficiency and decision-making abilities by automating repetitive tasks, allowing your team to concentrate on deriving actionable insights from your data.
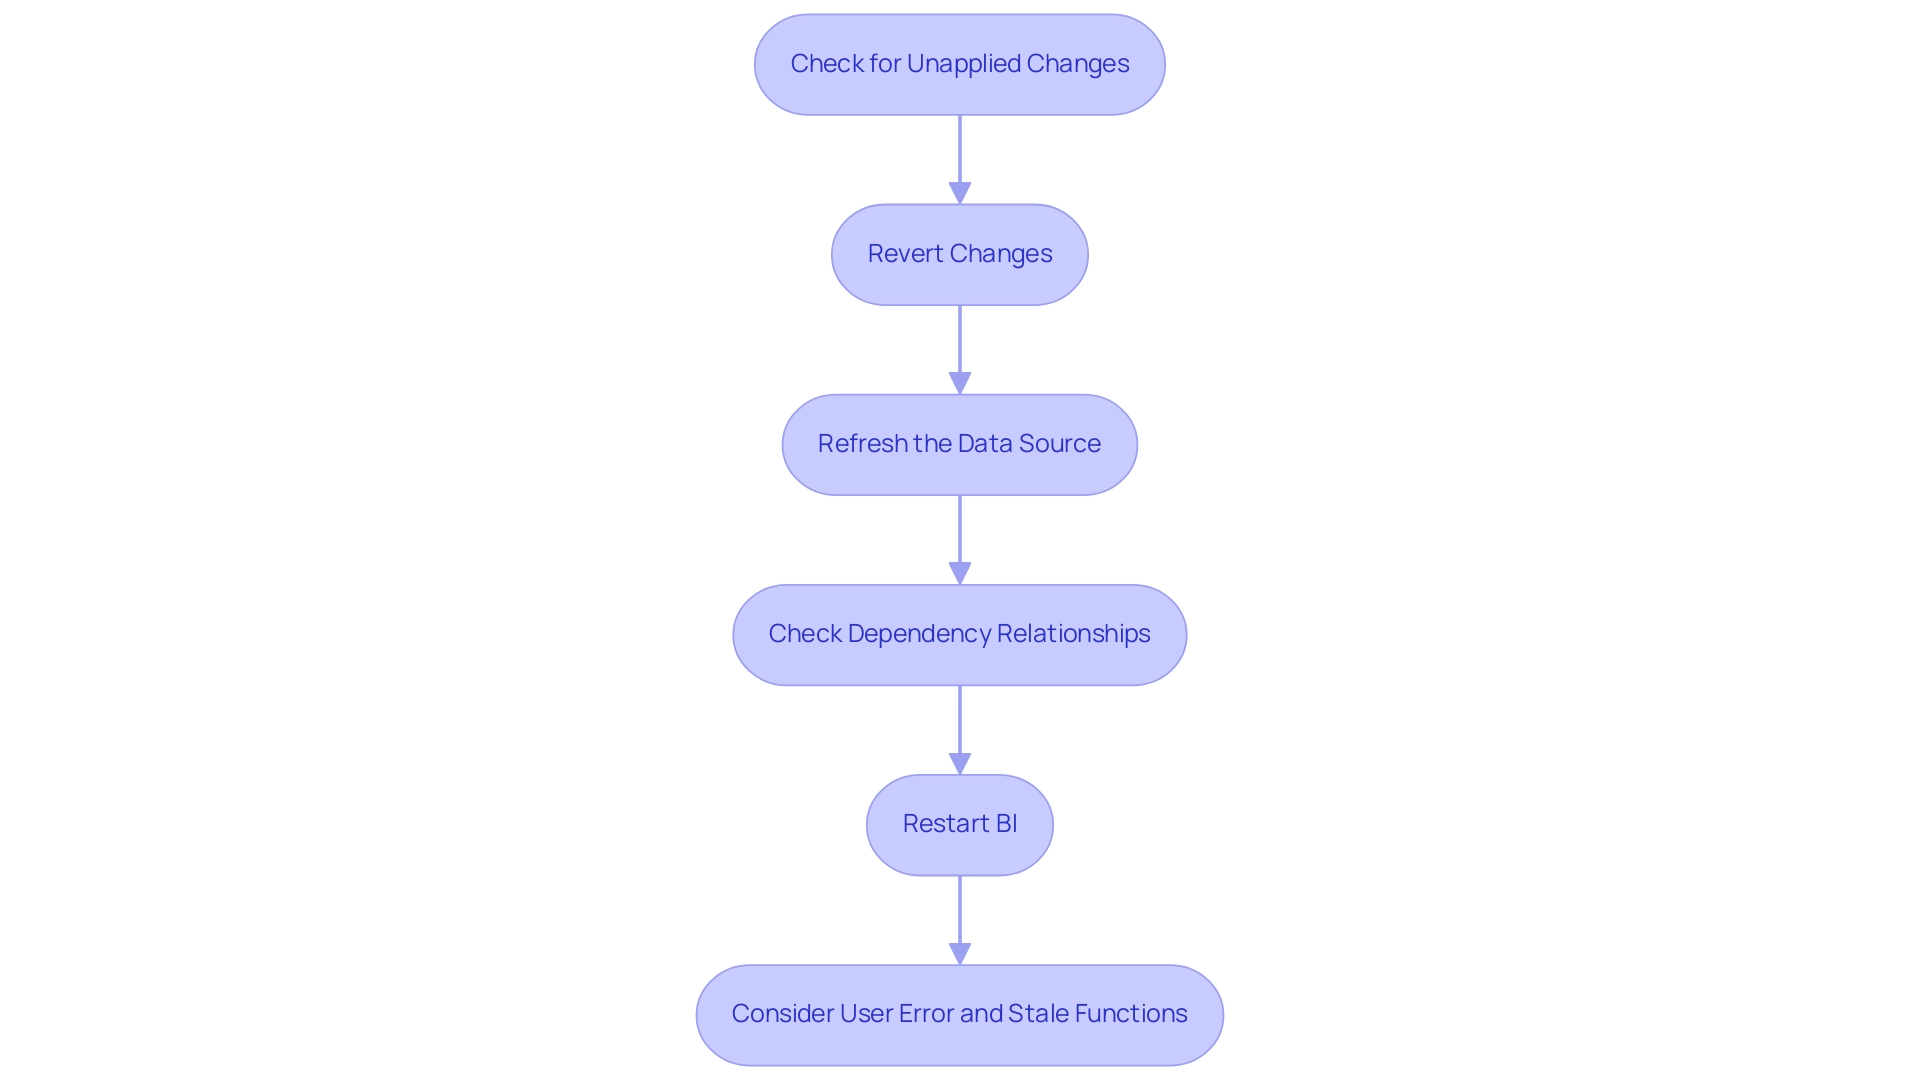
The Importance of Query Integrity in Power BI
Ensuring data integrity in Power BI is essential for producing reports that are both accurate and reliable. In Power BI, there are pending changes in your queries that can introduce discrepancies, significantly impacting decision-making processes. As noted by Pyke et al. (2010),
‘independent evaluations of information creates a strong incentive for honest behavior and raises the quality of analysis and interpretation.’
This emphasizes the critical need for accountability, as the responsibility for ensuring independent review of analysis lies with the investigator. Furthermore, in Power BI there are pending changes in your queries that can hinder performance and increase the risk of mistakes in analysis.
By recognizing the importance of query integrity statistics in Power BI, there are pending changes in your queries that users are empowered to address proactively. This method not only improves efficiency and productivity in BI but also strengthens the integrity of the analyzed information, ultimately resulting in more informed decision-making. With tools like Power Automate and EMMA RPA, which provide user-friendly applications and AI-driven features, operations can become more efficient, easing the challenges of time-consuming documentation creation and minimizing inconsistencies.
Case studies have demonstrated that maintaining information integrity can significantly reduce discrepancies in reports, thereby enhancing overall data accuracy and enabling directors to leverage insights more effectively. To learn more about how these tools can enhance your operations, book a free consultation today and discover the potential for increased transparency and actionable insights.
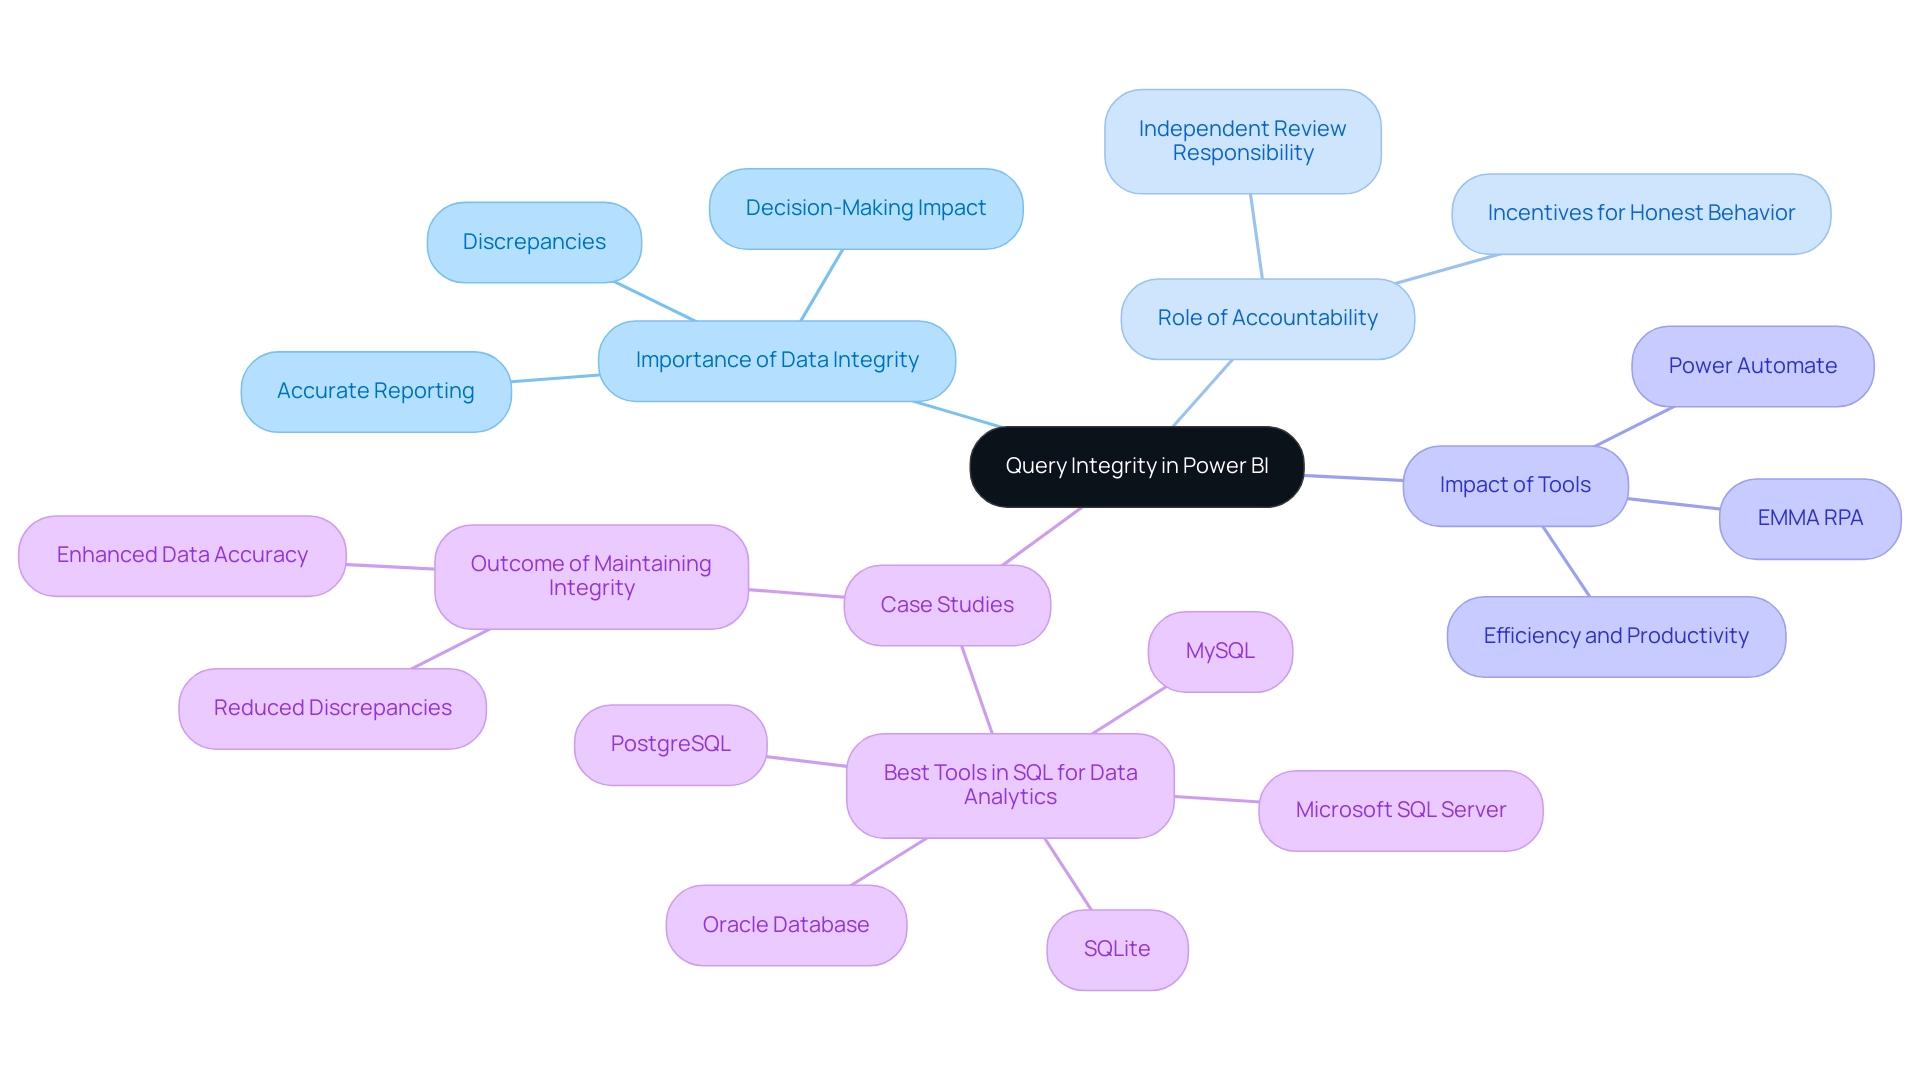
Best Practices for Managing Power BI Queries
- Regularly Review Requests: Establish a routine for reviewing your requests to confirm their proper functioning and to implement necessary updates. This practice not only guarantees optimal performance but also aligns with the latest trends in Power BI management, which promote proactive data monitoring and the transformative power of Business Intelligence.
Document Changes: Maintain a comprehensive log of any modifications made to your requests. This log should include the reasons behind each change, which helps in tracking the evolution of your data processes and streamlines troubleshooting. As Harris Amjad aptly puts it,
Hopefully, the reader is comfortable with and confident in the concepts discussed and outlined in this tip, making documentation an essential part of the process.
-
Use Descriptive Naming Conventions: Opt for clear and descriptive names for your requests. This approach facilitates easy identification of their purpose and interdependencies, significantly reducing the likelihood of confusion and errors in your reports.
-
Test Changes in a Safe Environment: Before implementing major modifications to your requests, perform tests in a controlled development setting. This precaution reduces the risk of introducing mistakes into your live documents, ensuring a smoother transition and improved information integrity.
Leverage Version Control: Implement version control systems to effectively track alterations made to your queries. This strategy not only enhances accountability but also allows you to revert to previous versions if any issues arise, thereby safeguarding against unnoticed errors.
- Utilize Live Connections for Real-Time Data Updates: When applicable, use live connections to ensure that your reports reflect the most current data. This practice is crucial for effective BI management and enhances decision-making capabilities, enabling your organization to leverage real-time insights for growth.
Adopt Best Practices for Performance Optimization: Referencing the case study on best practices for BI performance, consider implementing strategies such as star schema design and reducing column cardinality. These practices not only enhance query performance but also optimize the overall efficiency of your analyses, contributing to a data-driven culture that fosters innovation.
Integrate RPA Solutions: Incorporate RPA tools like EMMA RPA and Automate to automate repetitive tasks related to information processing and reporting. This integration can help mitigate challenges such as time-consuming report creation and data inconsistencies, ultimately enhancing operational efficiency.
By adopting these best practices, including the use of optimized visuals, live connections, and RPA solutions, you position your Power BI operations for greater efficiency and reliability, ultimately driving business growth and operational excellence.
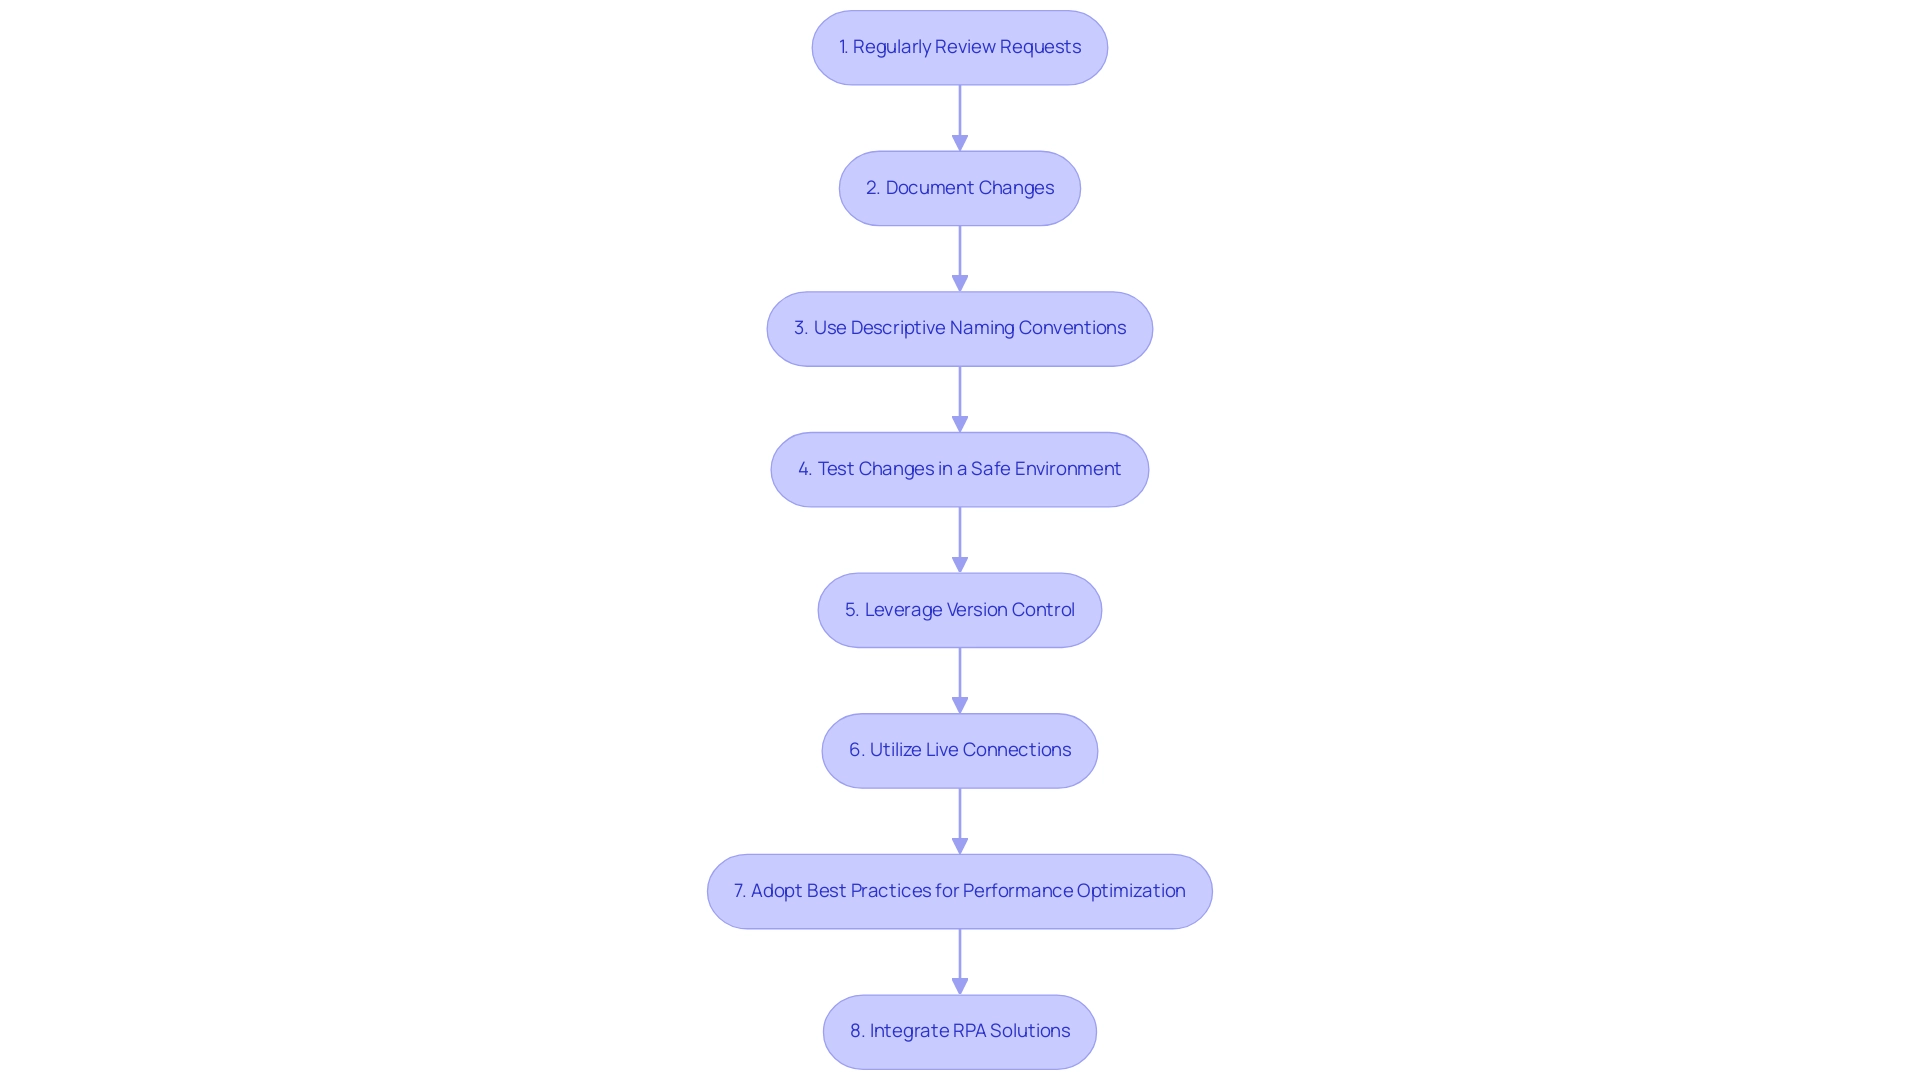
Conclusion
Navigating the complexities of pending changes in Power BI is essential for maximizing its potential as a data analysis tool. This article has outlined practical solutions for addressing these challenges, including:
- Checking for unapplied changes
- Refreshing data sources
- Managing query dependencies
By implementing these straightforward strategies, users can significantly reduce the time spent on report creation and enhance the overall quality of their data insights.
Furthermore, prioritizing query integrity is crucial for producing accurate reports that support informed decision-making. Embracing best practices such as:
- Regular query reviews
- Thorough documentation
- The use of live connections
can help organizations maintain high standards of data reliability. These practices not only streamline operations but also empower stakeholders to act on actionable insights with confidence.
Ultimately, by addressing pending changes and adopting a proactive approach to managing Power BI queries, organizations can transform their data processes. This shift not only enhances operational efficiency but also fosters a data-driven culture that drives growth and innovation. The time to optimize Power BI for your organization is now; embracing these strategies will pave the way for a more effective and insightful data analysis experience.
Overview:
To implement timezone settings in Power BI, users should follow a structured process that includes creating timezone parameters, converting queries, building a timezone table, binding parameters to data, and adding a slicer for user selection. The article outlines these steps clearly, emphasizing the importance of accurate timezone management for enhancing data analysis and ensuring that reports are relevant and actionable for stakeholders across different regions.
Introduction
In the realm of data analytics, the importance of accurate timezone management cannot be overstated. As organizations increasingly operate across multiple regions, the need to ensure that data is presented in the correct local context becomes essential for effective decision-making.
Power BI offers robust tools to help users navigate the complexities of timezone settings, transforming raw data into meaningful insights. By implementing straightforward strategies for timezone configuration, organizations can enhance their reporting accuracy, improve operational efficiency, and empower stakeholders with timely information.
This article delves into practical steps for mastering timezone management in Power BI, ensuring that businesses can harness the full potential of their data, regardless of geographical boundaries.
Overview of Timezone Implementation in Power BI
Setting up the Power BI timezone is essential to making sure that your information reflects the accurate local time for users or the dataset’s source. Correctly established time settings enable accurate information representation, vital for efficient analysis and reporting. This is particularly important in the context of Business Intelligence, as it aids in transforming raw data into actionable insights, thereby driving operational efficiency and business growth.
However, without effective management of time zones, businesses may struggle with a lack of data-driven insights, leading to missed opportunities and uninformed decision-making. To modify the time settings in your analysis in Power BI timezone, navigate to the top menu, select ‘Edit’, then ‘Analysis settings’, and toggle ‘Convert time zone’ to ON. From there, select your preferred time zone.
This straightforward process enhances the usability of your reports, making them more relevant and actionable for stakeholders operating across various regions. For instance, in the America/Los_Angeles time zone, the wall time of 2:34 a.m. on March 10, 2024, is a ‘ghost time’ because the clock skips from 1:59 a.m. directly to 3:00 a.m. This demonstrates the practical implications of incorrect time settings.
Furthermore, only twenty countries have more than one observed time zone, often due to geographical diversity or overseas possessions. Countries like France and Chile have additional time zones due to their maritime territories, complicating time zone identification and management. As the saying goes, ‘Data is only as good as the context it is viewed in.’
Understanding the current context of your information is vital for informed decision-making. By mastering the Power BI timezone management in Business Intelligence, you can significantly enhance user engagement with time zone-aware analyses, ensuring your insights are timely and actionable. This mastery not only streamlines creation, reducing the time spent on generating outputs but also mitigates inconsistencies that can lead to confusion and mistrust in the data, empowering you to leverage insights effectively.
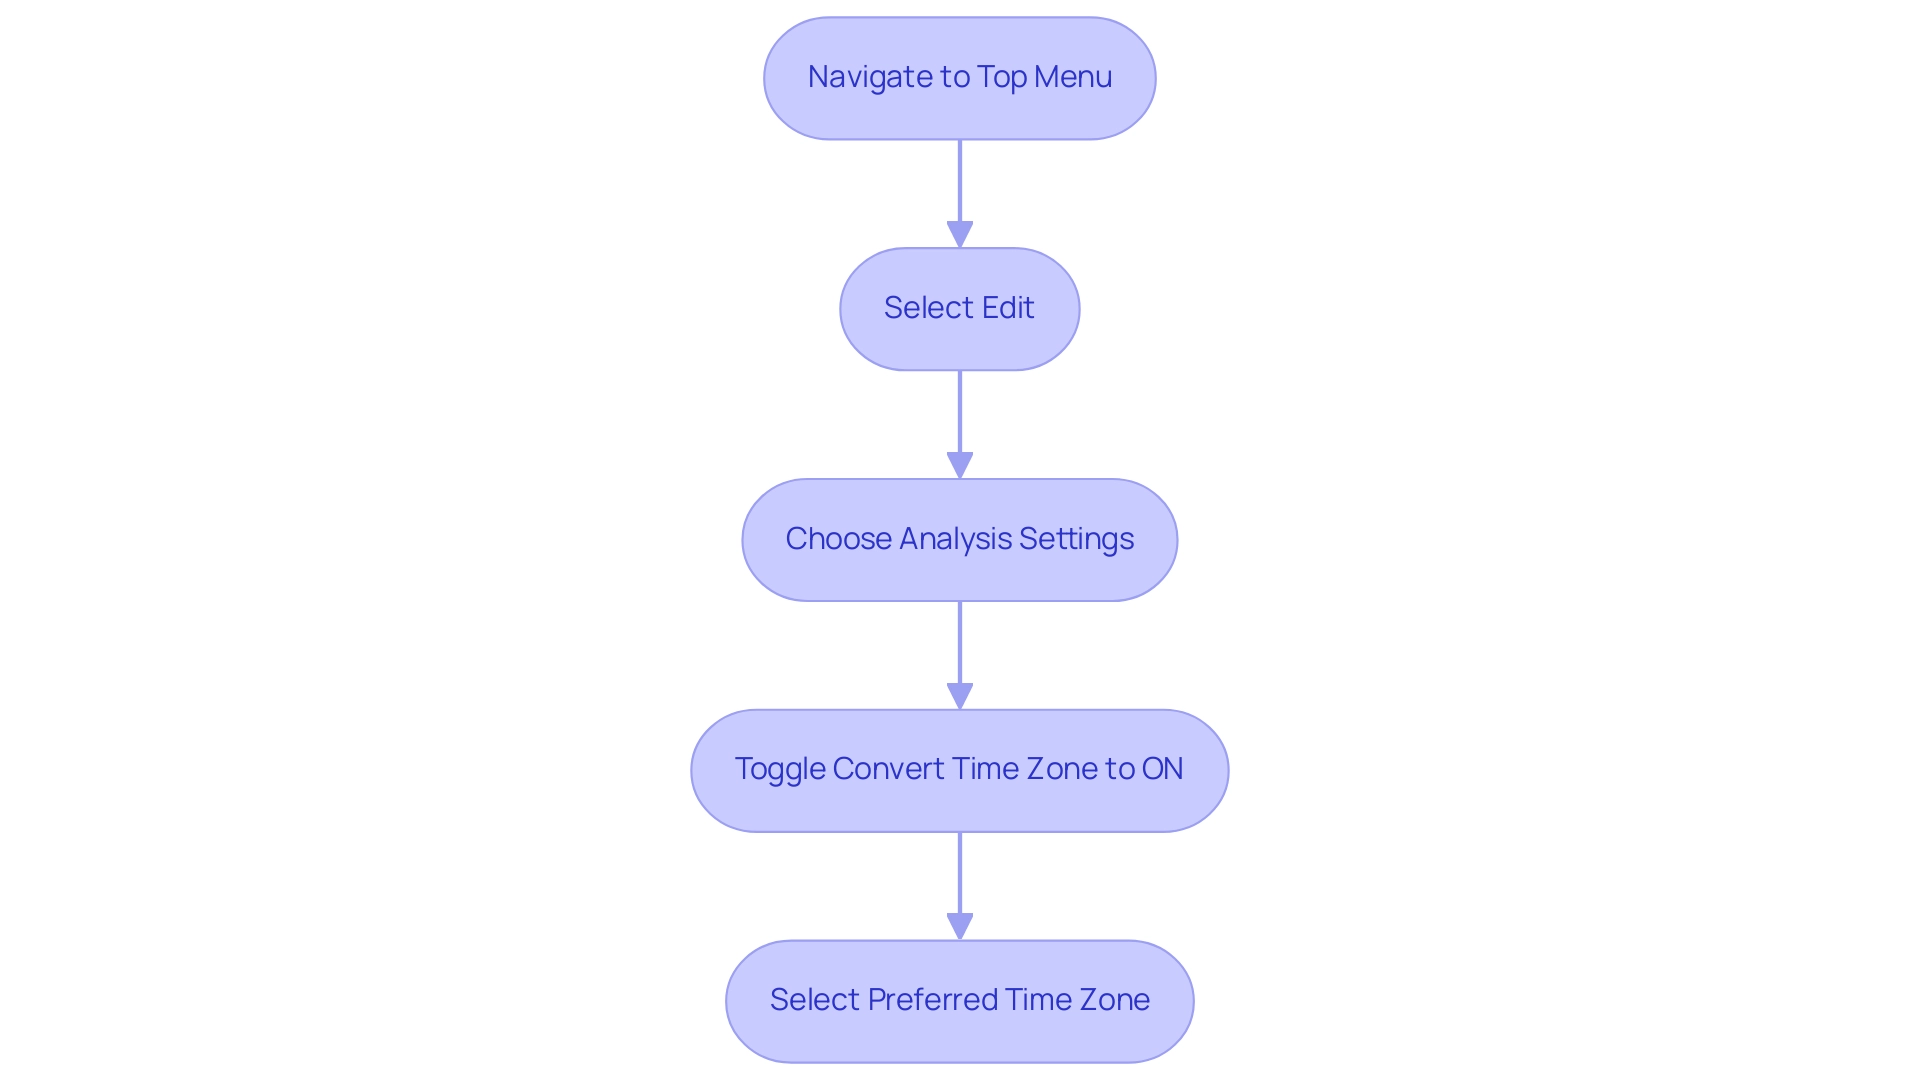
Step 1: Creating and Configuring Timezone Parameters
To efficiently handle time zone conversions in Power BI timezone while addressing typical challenges in creation, start by establishing parameters to store your time zone details. As Garth Jones observes, ‘I hope you find that this post about BI parameters assists you in creating more effective reports and dashboards.’ Follow these straightforward steps:
- Launch Power BI Desktop and navigate to the ‘Modeling’ tab.
- Click on ‘New Parameter’ and choose ‘What If Parameter’.
- Assign a name to the parameter (e.g., ‘Timezone’) and select ‘Text’ as the type.
- In the ‘Values’ section, input the time zones you wish to incorporate, such as ‘UTC’, ‘PST’, and ‘EST’.
- Click ‘OK’ to create the parameter.
This newly created parameter will be instrumental in managing conversions related to the Power BI timezone throughout your document, not only facilitating more effective data analysis but also addressing the prevalent issues of data inconsistencies and lack of actionable guidance. Incorporating Robotic Process Automation (RPA) can further streamline this process by automating repetitive tasks related to document creation, ensuring that your team can concentrate on strategic analysis instead. It’s worth noting that parameters can hold up to 1,000 unique values, which allows for flexibility in your configurations.
Furthermore, created parameters are conveniently listed in the Queries pane, enabling you to view, update values, and reconfigure settings as needed. For practical insights, consider the case study on editing your field parameters, which demonstrates how to add the Color field from the Products table, enhancing the usability of your analyses. This not only enhances consistency but also offers stakeholders clearer, actionable insights.
Additionally, many users have expressed appreciation for the best practices and workflows shared in this series, reinforcing the significance of these steps in creating effective BI reports that drive growth and informed decision-making.
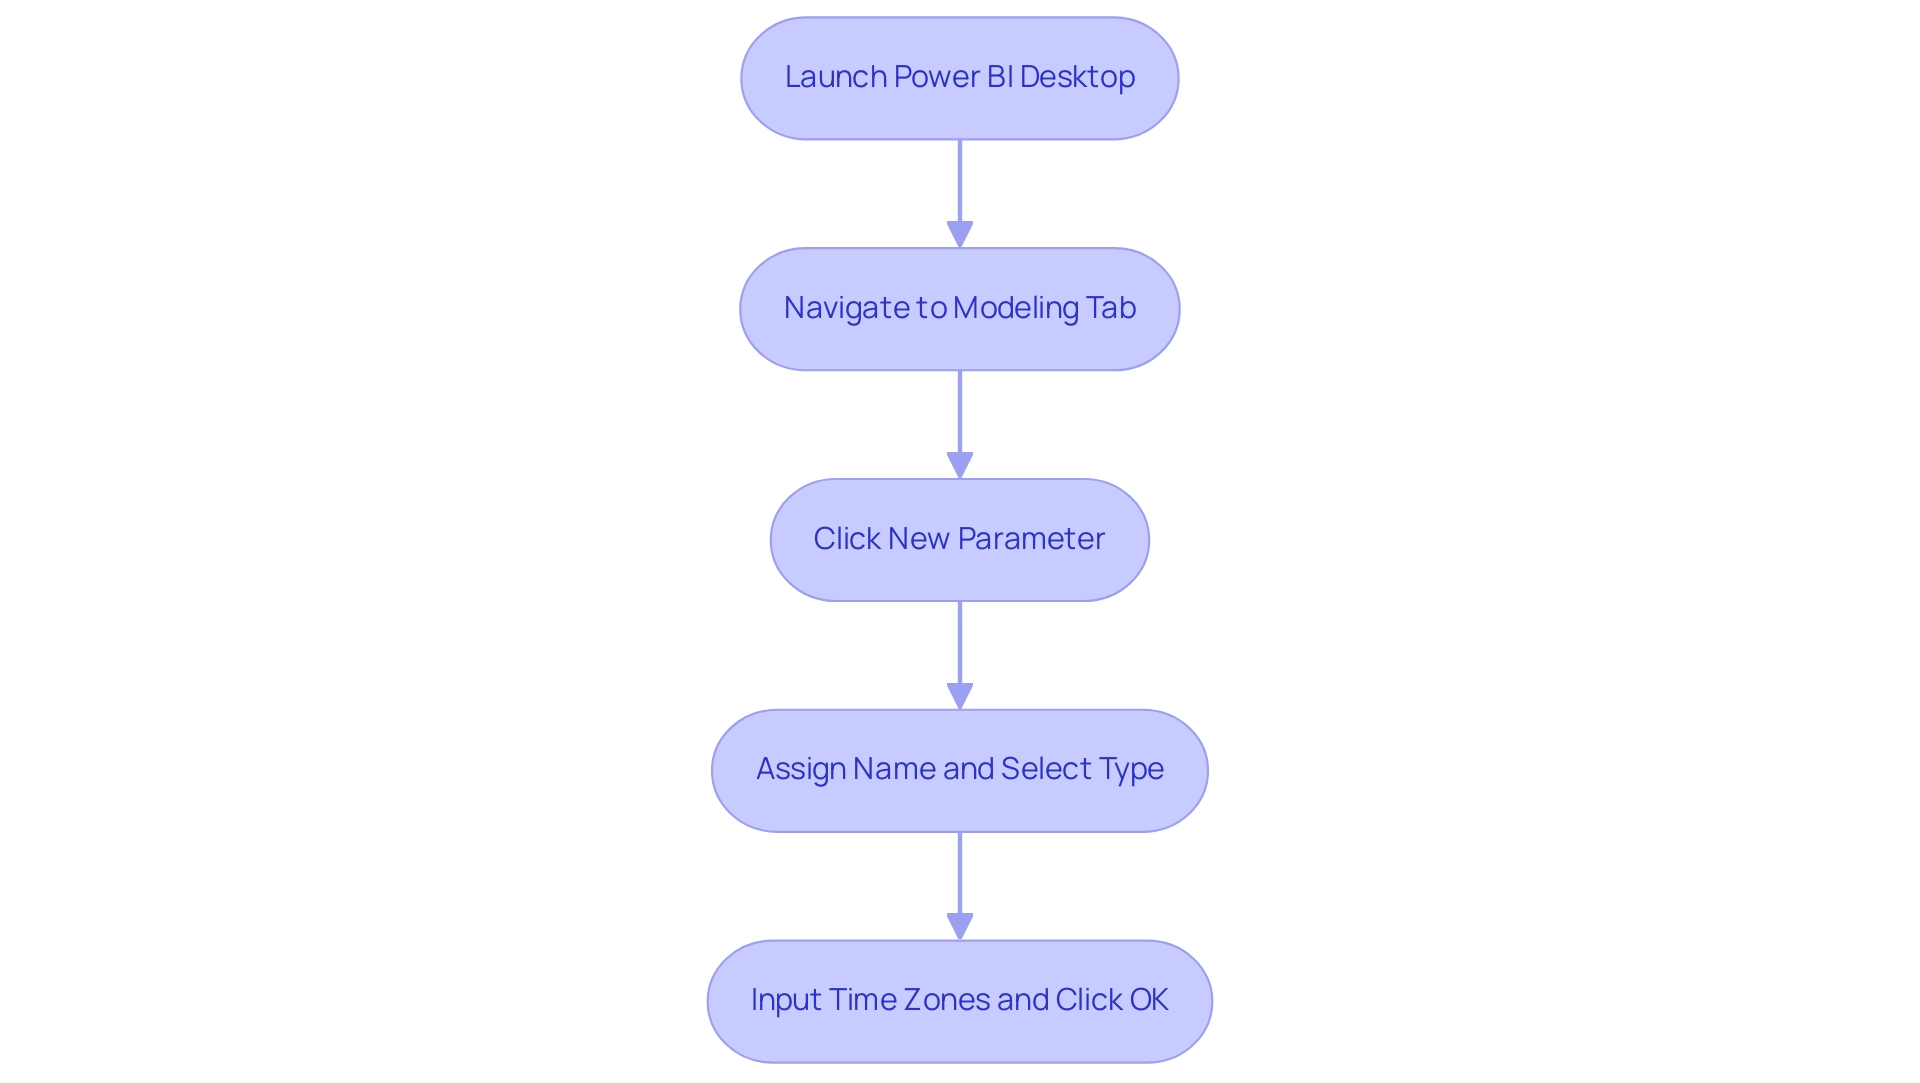
Step 2: Converting Queries for Timezone Compatibility
Transforming your queries to Direct Query mode in Power BI timezone is a straightforward process that enhances your ability to handle live data and make necessary time zone adjustments, which are crucial for operational efficiency. However, manual, repetitive tasks can significantly slow down your operations, leading to wasted time and resources. This is where Robotic Process Automation (RPA) can streamline your workflow, boosting efficiency, reducing errors, and freeing up your team for more strategic, value-adding work.
Follow these steps for a seamless transition:
- Launch BI Desktop and navigate to the ‘Home’ tab, then select ‘Transform Data’. In the Power Query Editor, locate and select the query you want to convert.
- Right-click on the chosen query and opt for ‘Advanced Editor’.
- Adjust the connection string to transition from Import mode to Direct Query mode, ensuring it accurately points to your live information source. Click ‘Done’, followed by ‘Close & Apply’.
This conversion is essential as it ensures that all information reflects any modifications you implement in the Power BI timezone in subsequent steps, thereby enhancing the relevance of your insights. The advantages of utilizing Direct Query mode are considerable; for example, dashboard tiles can be updated as often as every 15 minutes, giving you the most up-to-date information available. In contrast, Import mode has limitations, such as information freshness being reliant on the last refresh, which can hinder timely decision-making.
As community support expert Stephen Tao highlights,
If you want to know more about the advantages and disadvantages and differences between the three connection modes, you can refer to this article, which is introduced in detail.
Furthermore, with 2,305 users online in the Fabric community, you can find robust support and shared experiences regarding these connection modes. The case study titled ‘Understanding Connection Modes in BI’ also illustrates how various connection modes influence information handling, reinforcing the significance of selecting the suitable method for your requirements.
By utilizing Direct Query mode with RPA solutions such as EMMA RPA and Automate, you not only optimize updates but also tackle task repetition fatigue, enhance adaptability to the Power BI timezone, and improve operational efficiency, enabling a more precise analysis of your operations and propelling your business growth through effective use of Business Intelligence tools.
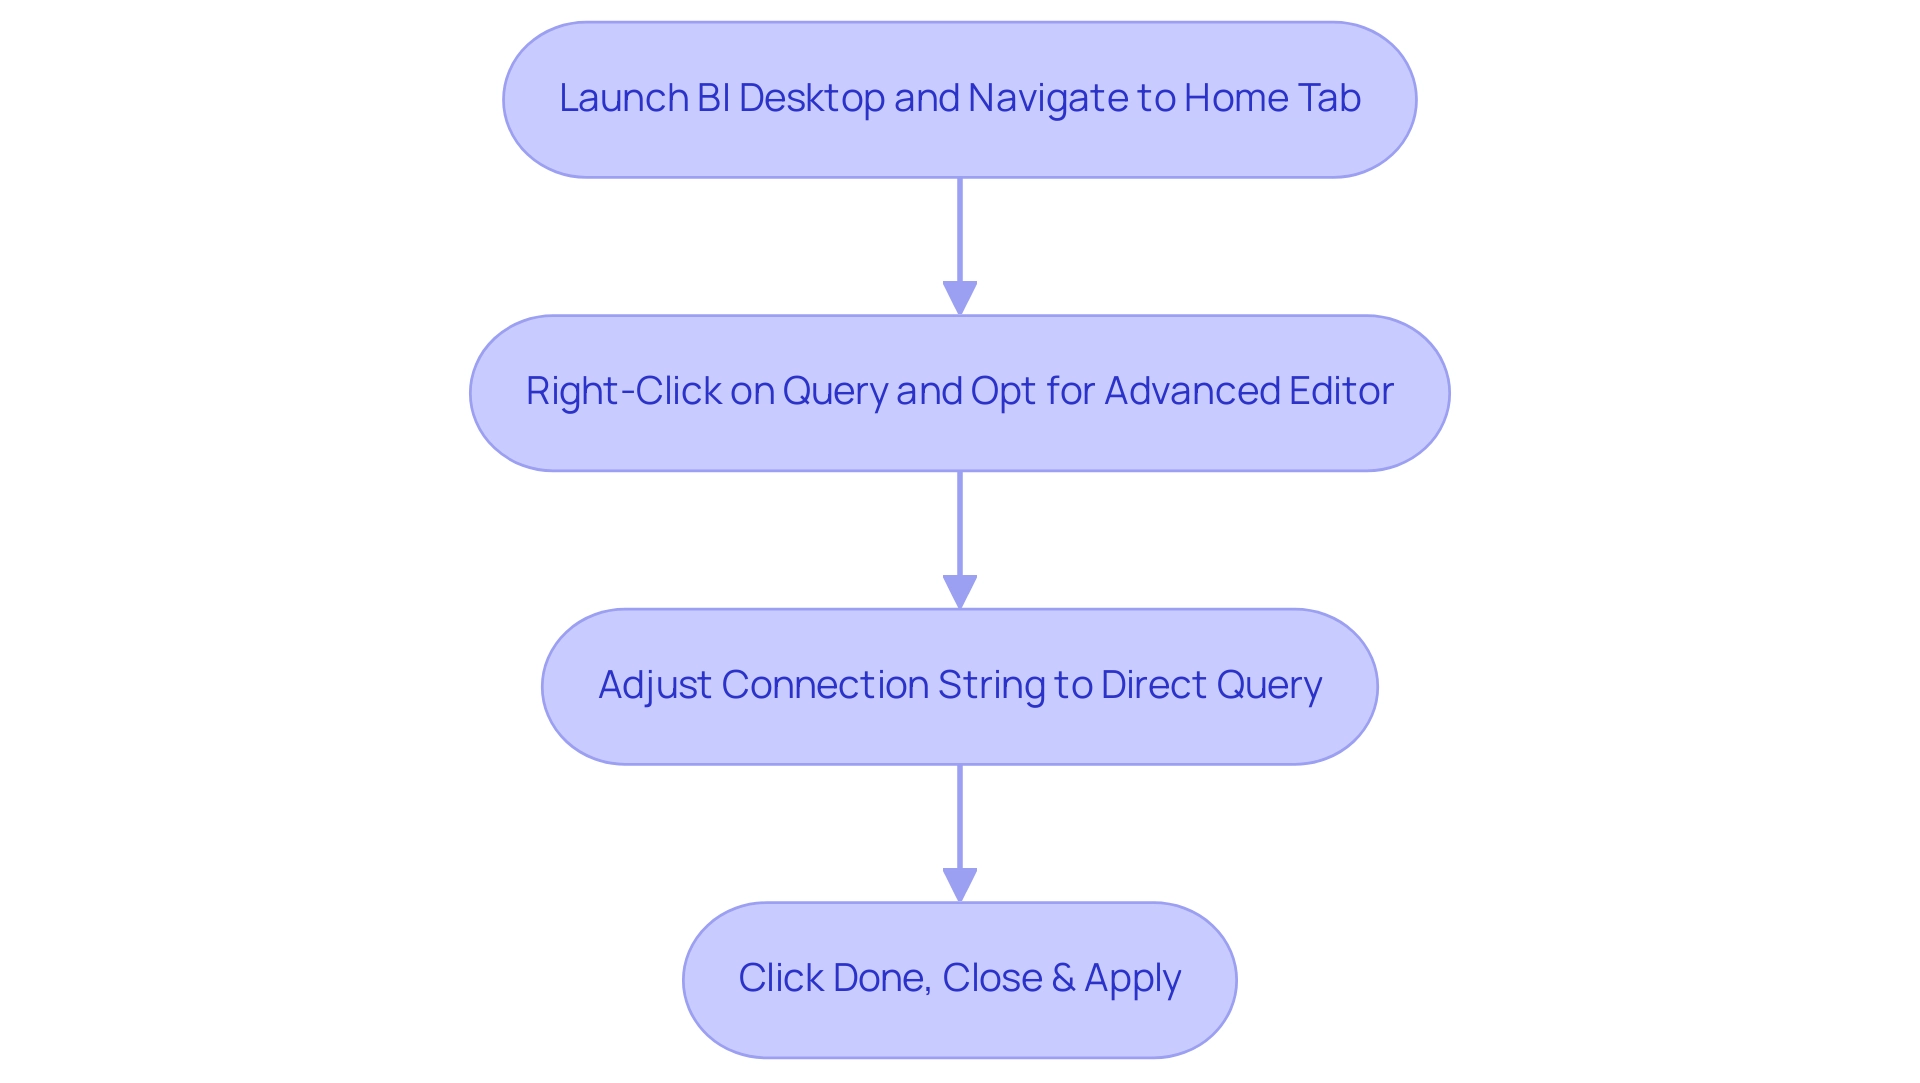
Step 3: Building a Timezone Table for Data Management
Creating a power bi timezone table is an essential step towards efficient information management, especially for organizations functioning across multiple time zones. According to a survey by MicroStrategy, 88% of organizations utilizing cloud-based BI reported increased flexibility in accessing and analyzing information from anywhere, anytime. This flexibility emphasizes the necessity of having a power bi timezone table to improve data accessibility and analysis.
Here’s how to create one effortlessly:
- Open Power BI Desktop and navigate to the ‘Modeling’ tab. Select ‘New Table’.
- Implement the following DAX formula to establish your timezone table:
time zone table = DATATABLE(

       "Timezone", STRING,

       "Offset", INTEGER,

       {

           {"UTC", 0},

           {"PST", -8},

           {"EST", -5}

       }

   )
- Explanation of the Code: This code snippet generates a table featuring various time zones along with their corresponding offsets. Feel free to adjust these values to suit your specific requirements. Once this table is established, it will serve as a vital component for linking your datasets with the appropriate power bi timezone, ensuring that your reporting and analysis are globally synchronized.
Utilizing a timezone table not only streamlines your operations but also enhances collaboration among distributed teams, mitigating communication delays and information silos. As highlighted in our BI services, including the 3-Day Sprint for rapid report creation and the General Management App for comprehensive management and smart reviews, managing teams across various time zones presents challenges that hinder real-time collaboration. Business Intelligence dashboards have transformed reporting and analysis, facilitating synchronized and efficient decision-making for geographically dispersed teams.
In today’s fast-paced, interconnected business environment, having this capability at your fingertips is indispensable. Schedule a complimentary consultation to discover how our BI services can improve your reporting.
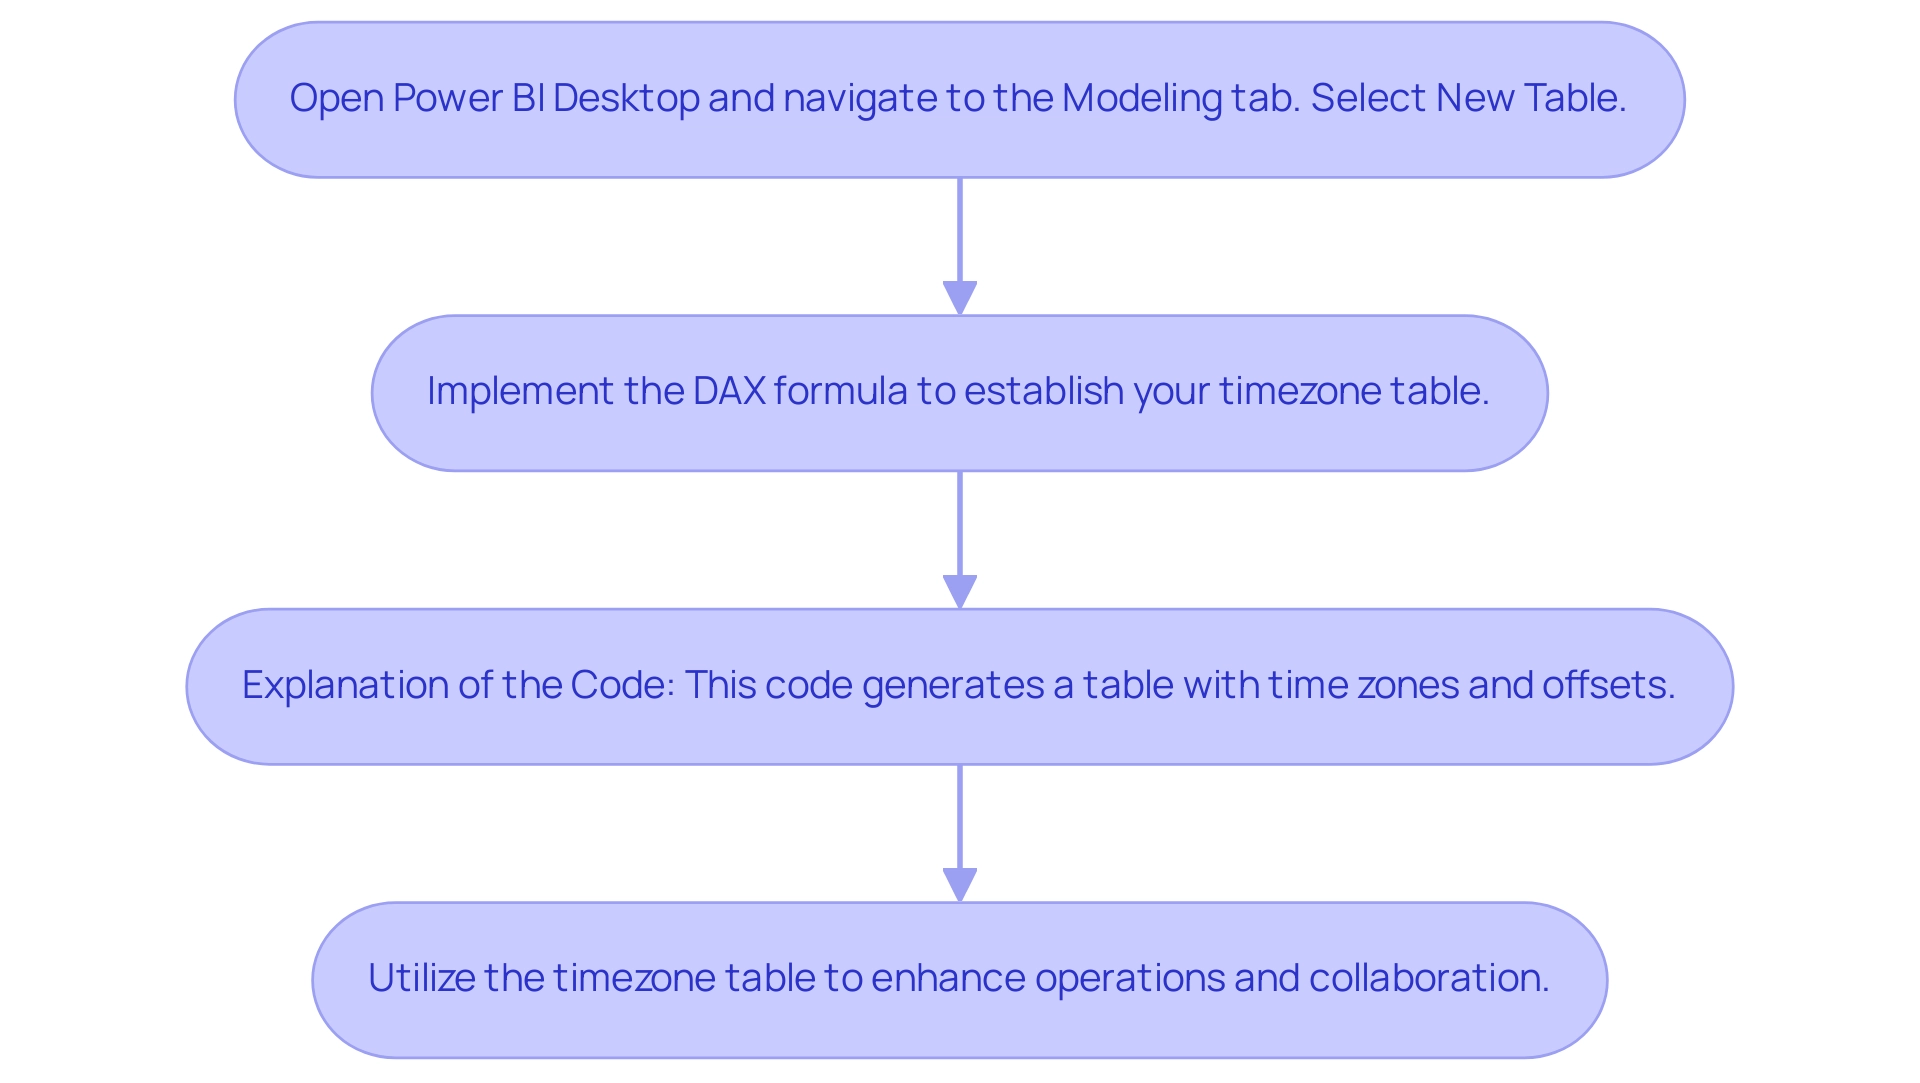
Step 4: Binding Timezone Parameters to Your Data
To effectively bind your timezone parameters to your data in Power BI, follow these systematic steps:
- Navigate to the ‘Modeling’ tab and select ‘Manage Relationships’. This is where you can supervise the links between various information tables, a crucial step in tackling the common issues of inconsistencies and ensuring precise output generation, especially in the absence of a strong governance strategy.
- Establish a connection between your main record table and the time zone table you set up earlier. This step is crucial for ensuring precise information representation, helping to mitigate the confusion often caused by time-consuming report creation.
- Ensure that the binding is set up to link the time zone column in your information table with its matching entry in the time zone table. This alignment is crucial for precise time conversions, offering stakeholders with clear and actionable insights instead of merely unprocessed information.
- Click ‘OK’ to apply the changes. By finalizing this binding, you allow BI to apply the correct Power BI timezone configurations across your reports, thus guaranteeing that information is shown precisely based on the chosen timezone.
Understanding the nuances of relationship management is key, especially considering that for one-to-many relationships, the cross filter direction is always from the ‘one’ side, and optionally from the ‘many’ side. This understanding not only improves your information accuracy but also empowers you to make informed decisions based on reliable insights. As one user noted, “Thank you.
To update, I did just switch the ‘relationships’ around which seems to have worked,” highlighting the practical importance of managing relationships effectively. Additionally, consider the implications of limited relationships in Power BI, which occur when there is no guaranteed ‘one’ side, often due to many-to-many cardinality or cross-source group relationships. These limitations can complicate information management and further emphasize the need for a governance strategy to prevent inconsistencies.
These insights can guide you in navigating the complexities of data management while unlocking the full potential of Business Intelligence in driving operational efficiency.
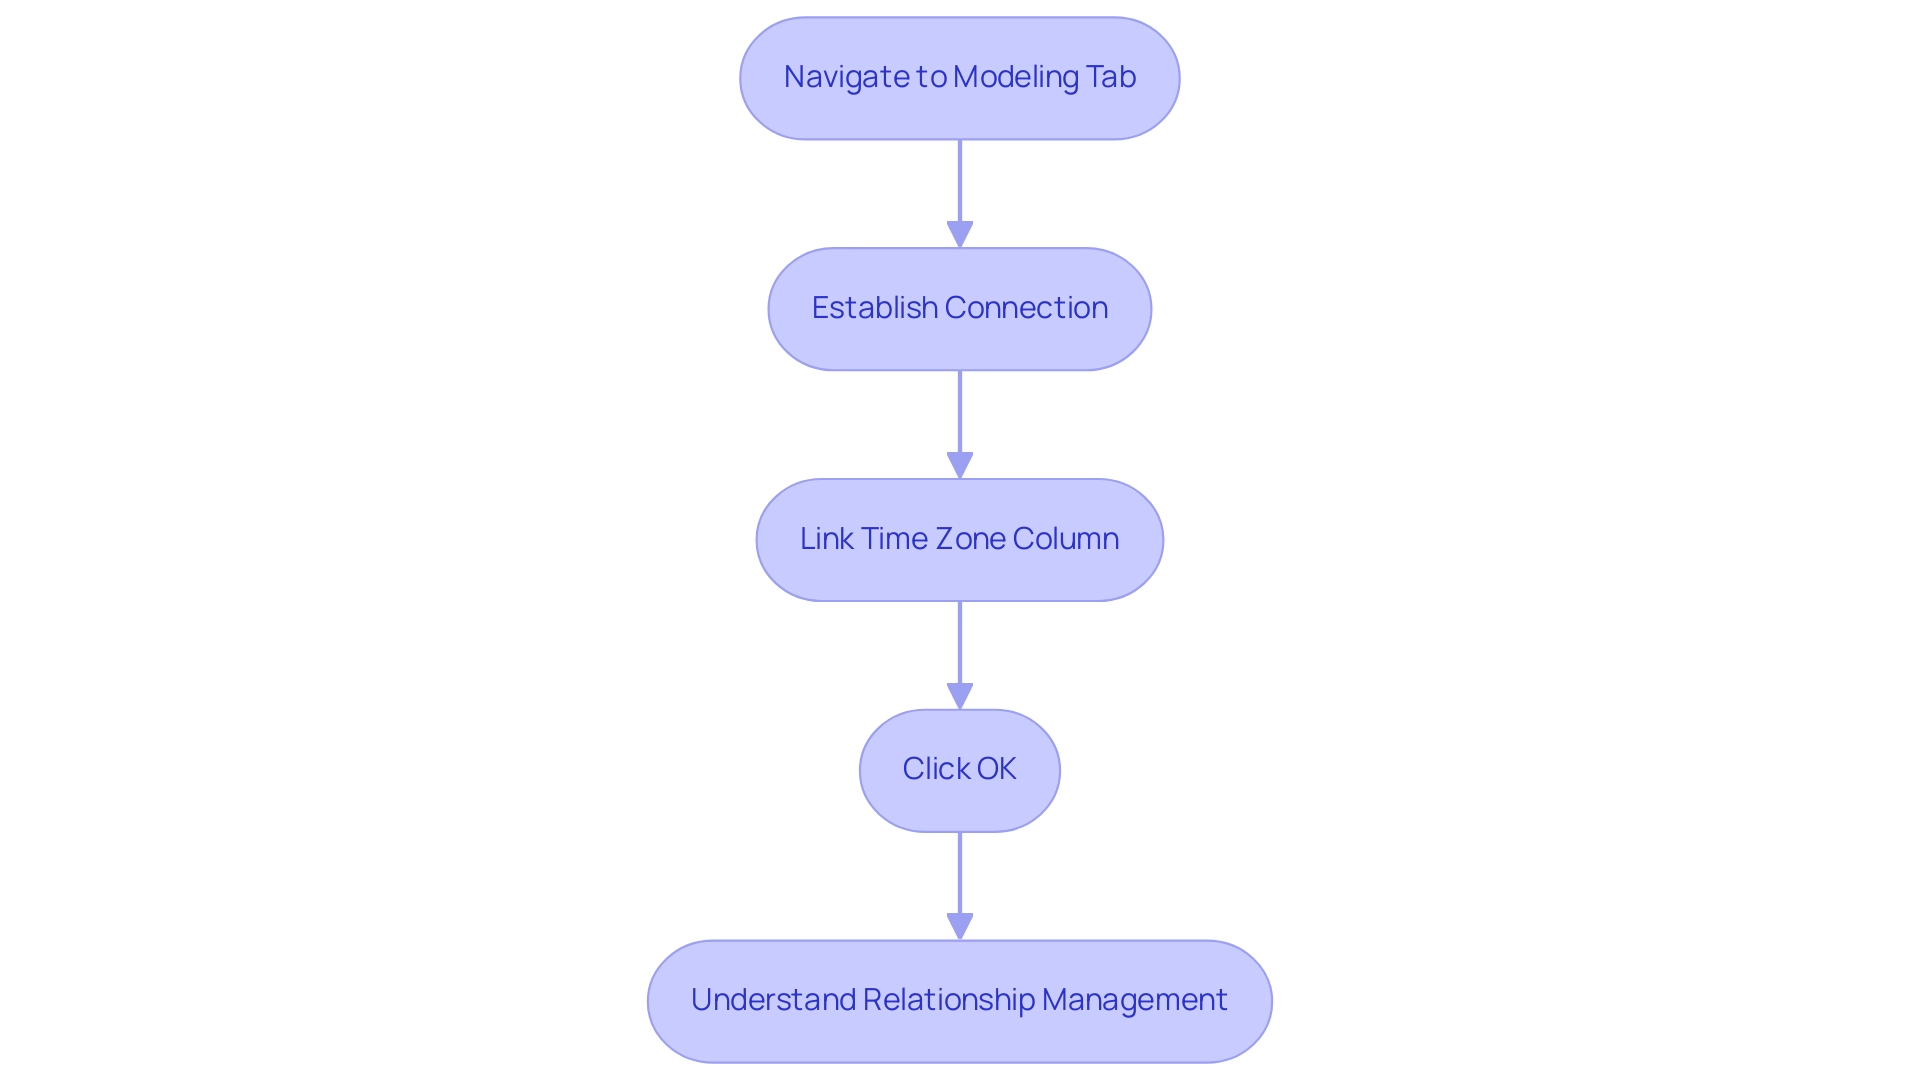
Step 5: Adding a Slicer for Timezone Selection
To effectively add a slicer for timezone selection in Power BI and boost user engagement, follow these streamlined steps:
- Open Power BI Desktop and navigate to the ‘Visualizations’ pane, then select the ‘Slicer’ visual to create an interactive element.
- Drag the ‘Timezone’ field from your designated timezone table into the slicer visual in Power BI timezone, ensuring users can choose from an array of timezones.
- Format the slicer in Power BI timezone to enhance usability, allowing for a clear list of available timezones that promotes user interaction.
- Link the slicer to the visuals on your page in the Power BI timezone to enable dynamic updates based on user choices, enhancing the interactive experience.
- Finally, rigorously test the slicer by selecting various options within the Power BI timezone and confirming that the information reflects these changes accurately. This feature not only boosts user involvement but also greatly enhances the utility of your documents, tackling the frequent issues of time-consuming document creation and inconsistencies.
Furthermore, consider the insights from the case study on viewing all workspace usage metrics, which emphasizes the value of removing filters for a comprehensive overview of performance across dashboards. By allowing users to make a copy of the usage metrics report or connect to the underlying semantic model, BI fosters flexibility and deeper insights. As Statfusionai, a seasoned Data Scientist, aptly states, “I’m a Data Scientist with a passion for solving real-world problems through data-driven insights.”
This sentiment underscores the transformative potential of embracing tools like slicers in BI, not only to enhance user engagement but also to drive meaningful outcomes in your data visualization efforts.
In light of the challenges posed by a lack of data-driven insights, leveraging Business Intelligence and RPA solutions like EMMA RPA and Power Automate can empower your organization to unlock actionable insights, ultimately driving growth and operational efficiency.
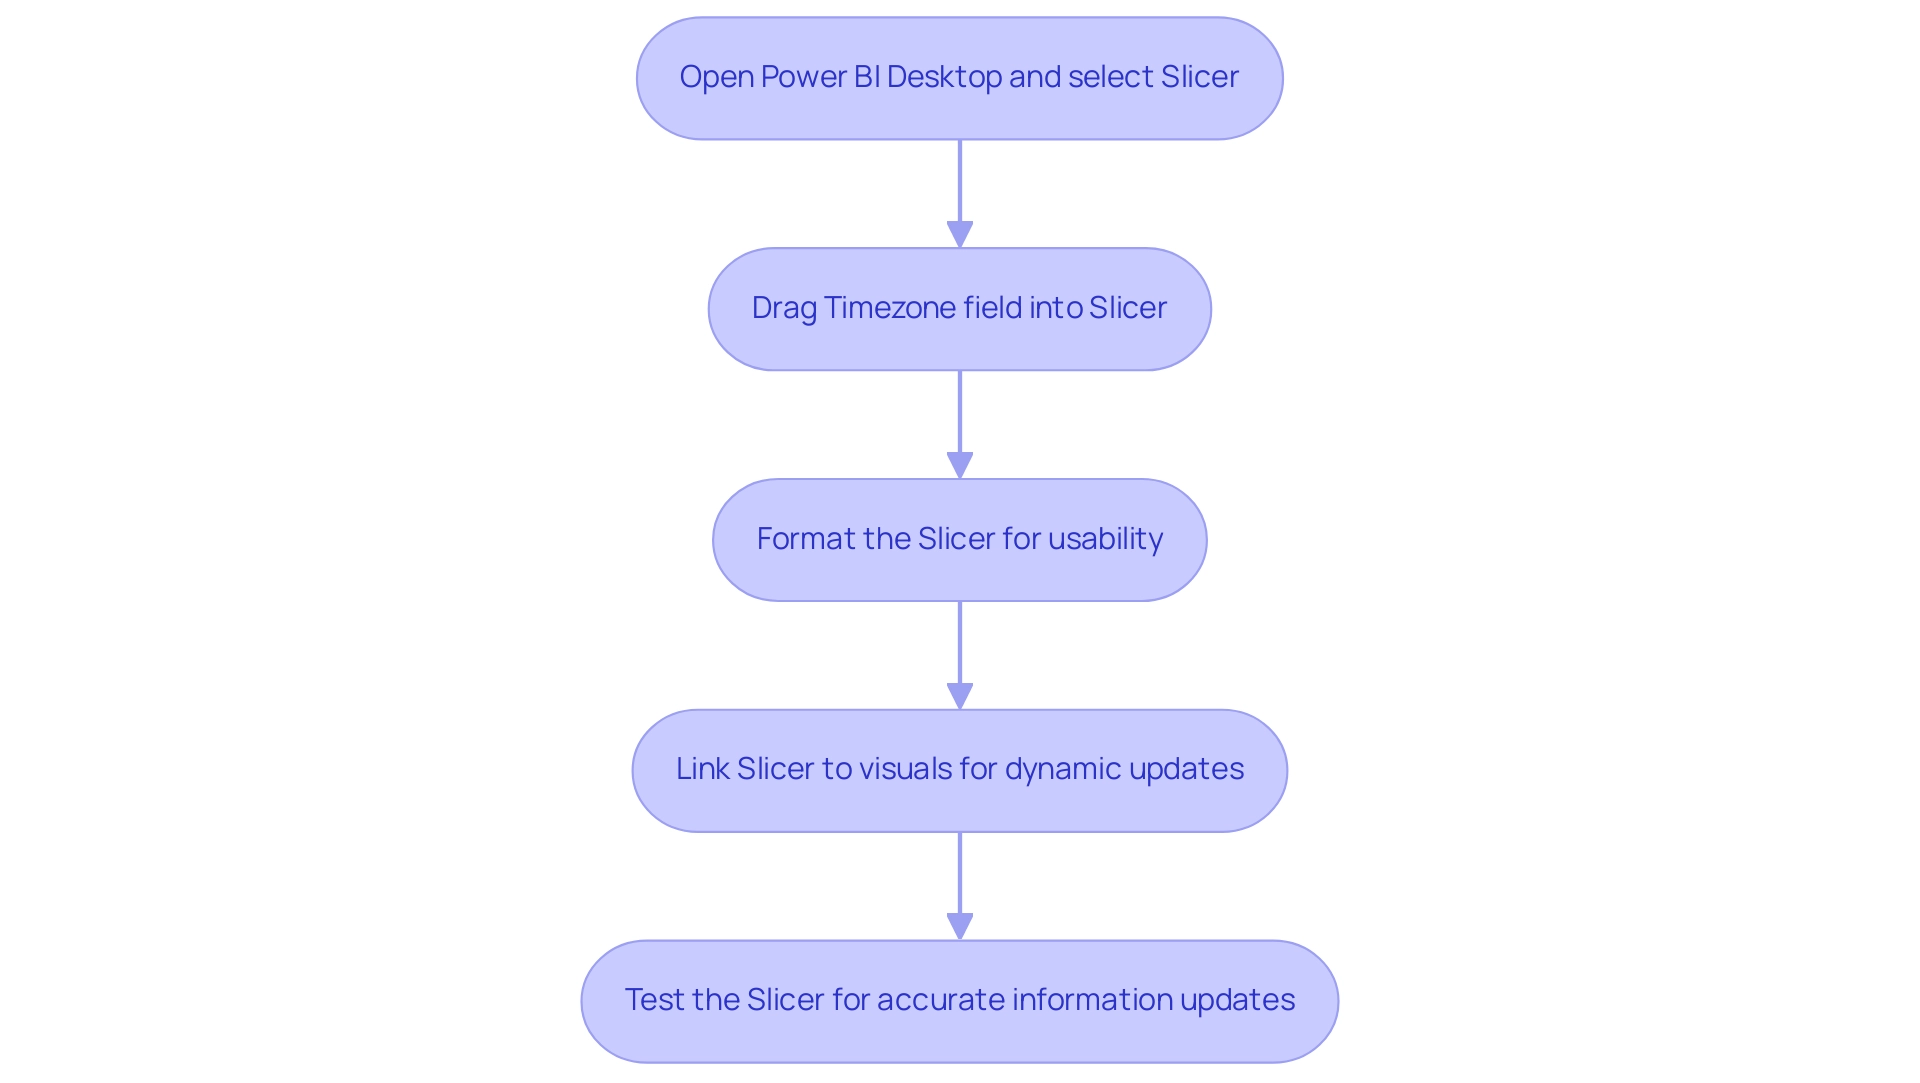
Conclusion
Mastering timezone management in Power BI is essential for organizations operating across multiple regions. By implementing effective timezone settings, businesses can ensure that data is accurately represented, leading to informed decision-making and enhanced operational efficiency. The article outlined practical steps, including:
- Creating and configuring timezone parameters
- Converting queries for timezone compatibility
- Building a timezone table
- Binding these parameters to data
- Adding slicers for user-friendly timezone selection
These strategies not only streamline the reporting process but also empower stakeholders with timely and relevant insights. By overcoming the common challenges associated with timezone discrepancies, organizations can transform their data into actionable intelligence, driving business growth and improving overall performance. The integration of tools like Robotic Process Automation further enhances efficiency, allowing teams to focus on strategic analysis rather than repetitive tasks.
In today’s interconnected business environment, accurate timezone management in Power BI is not just a technical necessity; it is a cornerstone of effective Business Intelligence. By harnessing these capabilities, organizations can unlock the full potential of their data, ensuring that every decision is made with the right context in mind. Embracing these practices is a significant step towards achieving operational excellence and fostering a culture of data-driven decision-making.
Overview:
The article provides a comprehensive step-by-step guide on how to store historical data in Power BI, emphasizing the importance of effective data management for tracking trends and enhancing decision-making. It outlines practical methods for importing, appending, and managing historical data, while also addressing challenges such as information volume and quality, and offers solutions like incremental refresh and RPA tools to optimize performance and streamline workflows.
Introduction
In the dynamic landscape of data analytics, the ability to effectively store and manage historical data in Power BI is becoming increasingly vital for organizations striving to enhance their decision-making processes.
By harnessing the power of historical insights, businesses can not only track trends and measure performance over time but also unlock the potential for predictive analytics that drive operational efficiency.
As the global market shifts towards prioritizing data governance and historical analysis, understanding how to import, append, and refresh data effectively is crucial.
This article delves into practical strategies for leveraging historical data in Power BI, offering step-by-step guidance and innovative methods to overcome common challenges.
With the right approach, organizations can transform their data management practices, ensuring they remain competitive in an ever-evolving technological landscape.
Understanding Historical Data Storage in Power BI
To effectively track trends, analyze performance over time, and make informed decisions based on past insights, organizations need to understand how Power BI can store historical data. This information encompasses a wide array of metrics, including sales figures, customer interactions, and operational statistics. By retaining this valuable information, businesses can use Power BI to store historical data and generate comprehensive reports that unveil long-term trends instead of merely offering snapshot views.
Current industry trends suggest that a substantial portion of the worldwide warehouse management software market is expected to transition towards solutions emphasizing information governance and past analysis by 2024, highlighting the increasing acknowledgment of past information’s importance in enhancing operational efficiency. Significantly, Germany dominates the business intelligence field in Europe, highlighting the significance of efficient information governance practices in this area.
Furthermore, firms that skillfully handle their past information can leverage Power BI to store historical data, which not only boosts their reporting abilities but also enhances their decision-making processes. For example, institutions that utilize predictive analytics—like the roughly 1,400 universities tackling low graduation rates—show how using past information can result in significant results; Georgia State has remarkably increased its graduation rate by 23% since 2003. As Josh Howarth aptly states, ‘Only 12% reported losing money on their Big Information initiatives,’ underscoring the financial advantages of investing in robust historical information management practices.
Embracing these strategies, alongside the integration of RPA solutions like EMMA RPA and Power Automate to automate manual workflows, is not just advantageous—it’s critical for businesses seeking to harness the full capability of business intelligence and analytics, driving operational efficiency and fostering growth in today’s rapidly evolving AI landscape. Failing to extract meaningful insights from information can leave organizations at a competitive disadvantage, making it imperative to adopt these technologies.
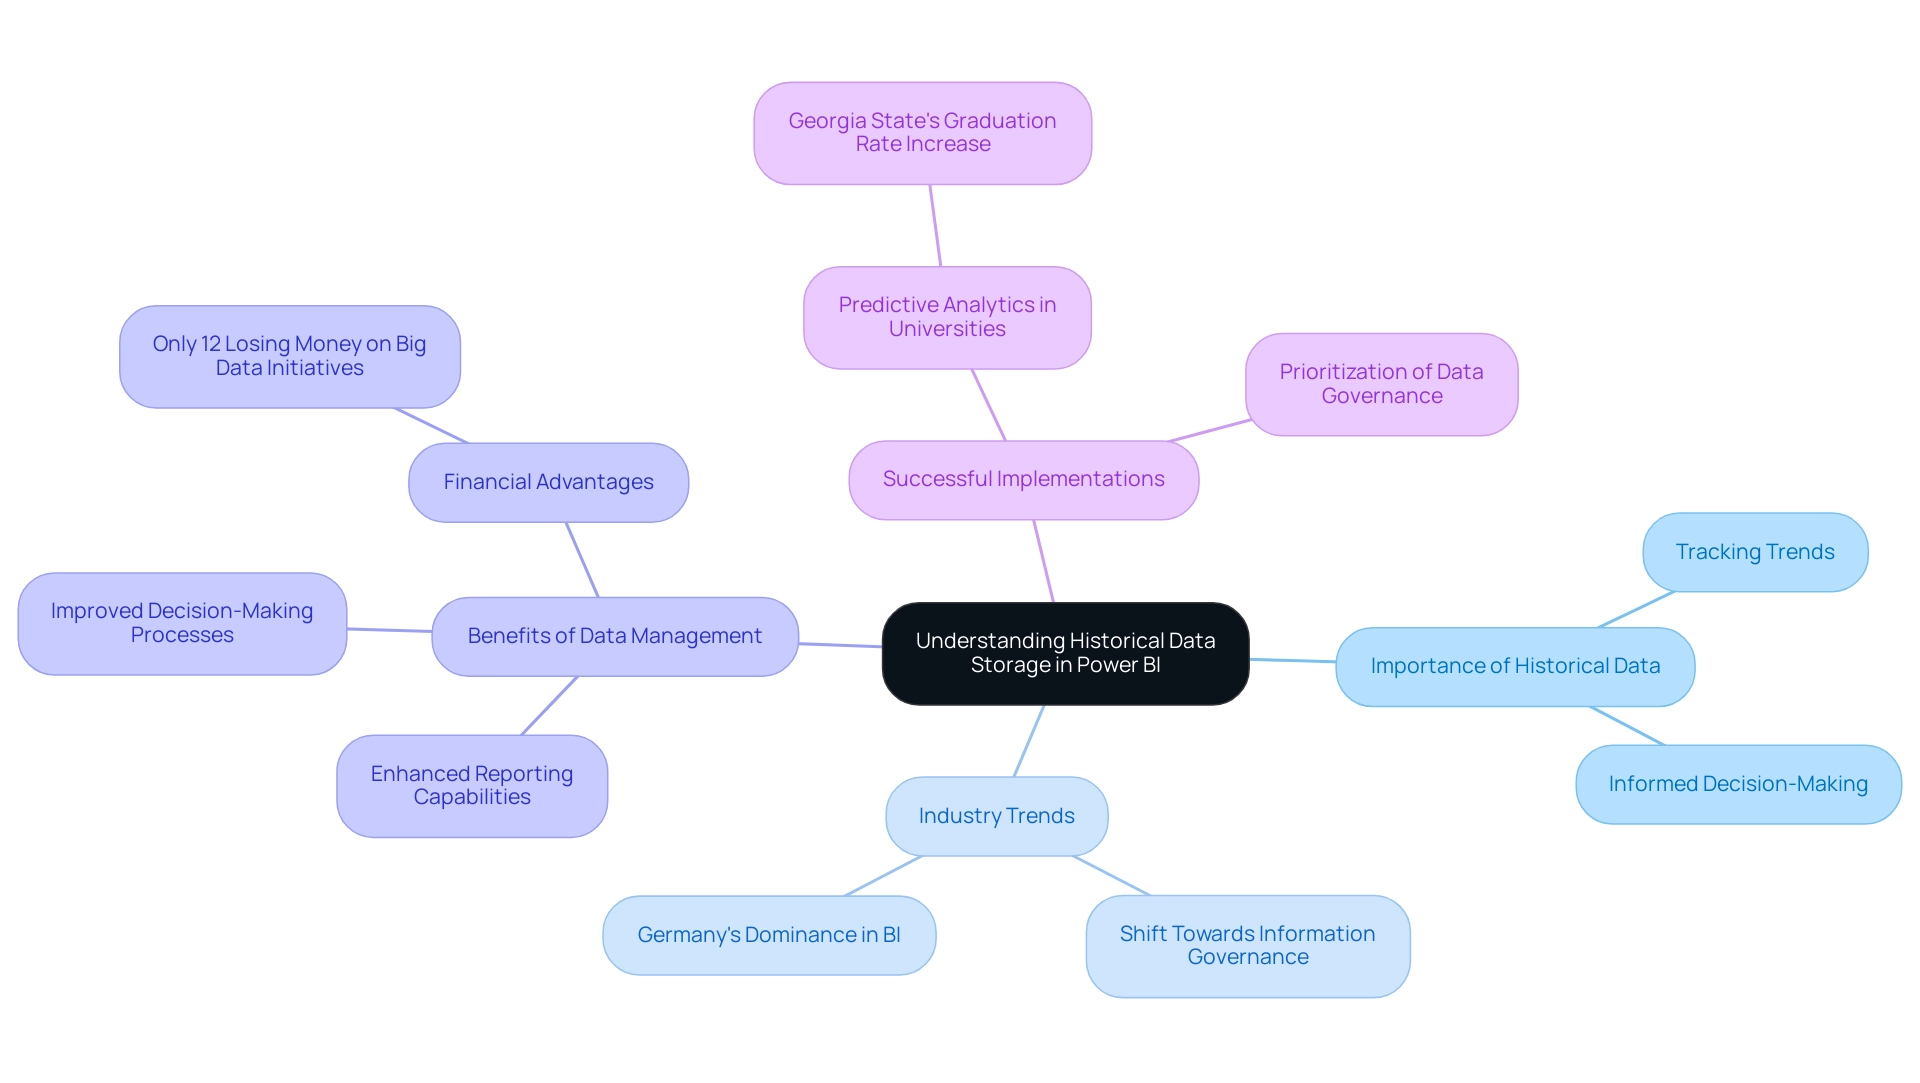
Step-by-Step Guide to Importing Historical Data into Power BI
-
Launch BI Desktop: Begin by opening the BI Desktop application and initiate a new report to set the stage for your information journey. Mastering BI enables organizations with information analysis and visual representations that guide decision-making and promote growth. In a data-rich environment, leveraging Business Intelligence is crucial to avoid being at a competitive disadvantage.
-
Access Data Options: Navigate to the ‘Home’ tab and click on ‘Get Data’. Here, choose the kind of source that contains your past information, as Power BI stores historical data from sources like Excel, SQL Server, or another format. Recent statistics suggest that organizations that utilize Power BI to store historical data achieve a success rate exceeding 85% when importing past information. This data-driven approach is essential for overcoming challenges like time-consuming report creation.
-
Establish Connection: Input the required connection details, such as file path or server name, and confirm by clicking ‘OK’.
-
Choose Your Information: In the Navigator window, identify and select the tables or sheets that contain your historical information to ensure Power BI can store historical data, then proceed by clicking ‘Load’.
-
Refine Your Information: Utilize the Query Editor to clean and transform your information as needed before integration into your model. This step significantly enhances the quality of your analysis, helping to address inconsistencies. As Iason Prassides notes, “Learn to use DAX in Business Intelligence to customize and optimize your KPIs,” which is crucial during this phase.
-
Utilize RPA Tools: Think about incorporating RPA solutions such as EMMA RPA and Automate to streamline repetitive tasks associated with information management. These tools can streamline your reporting processes, reducing the time spent on manual information handling and improving operational efficiency.
-
Preserve Your Progress: Once your information has been successfully loaded, ensure you save your BI report to keep your work secure and accessible for future use. Regularly updating your source credentials, as illustrated in the case study about updating Usage Metrics Report credentials, ensures continued access to vital usage information and supports operational efficiency.
-
User Testimonials: Organizations utilizing BI have reported significant enhancements in their management processes. For instance, a recent case study revealed that a leading retail company reduced report generation time by 40% after implementing BI alongside RPA solutions, showcasing the transformative influence of these technologies.
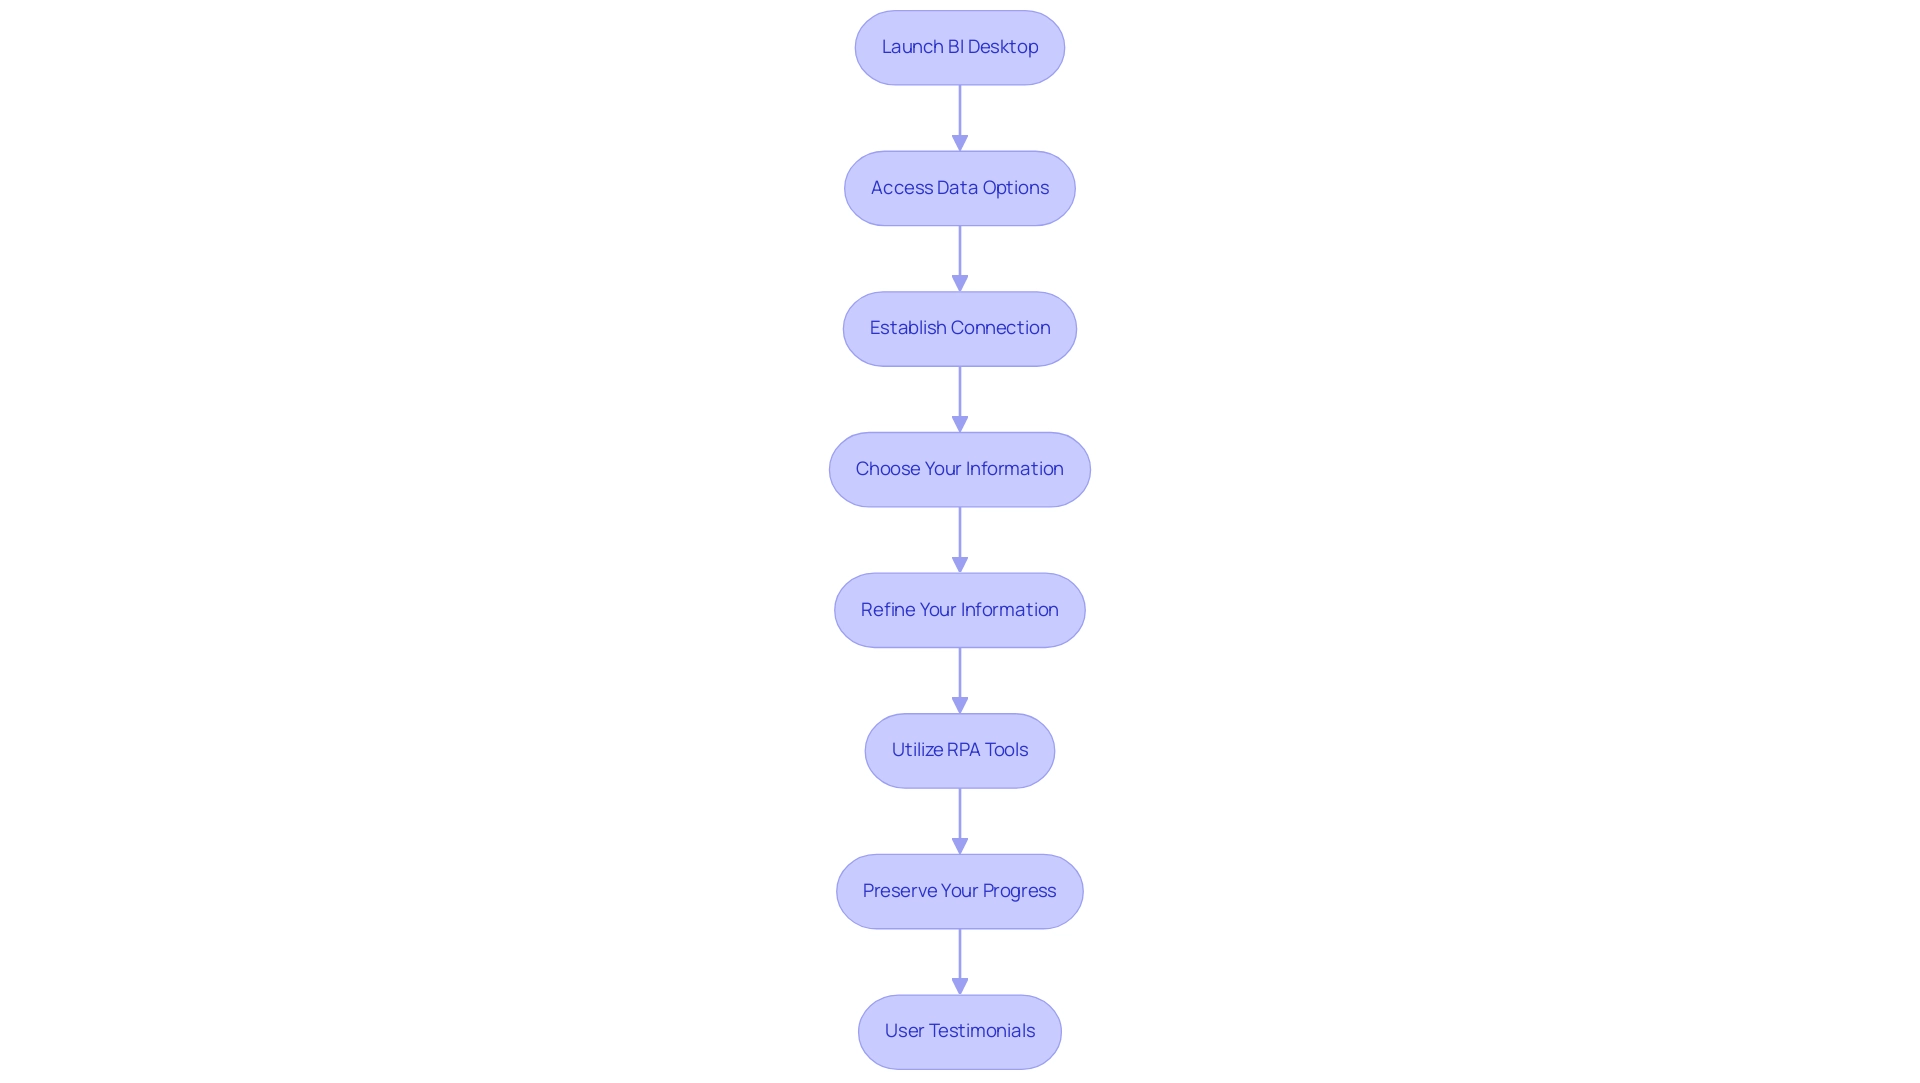
Methods for Appending New Data to Historical Records
Appending new information to existing historical records in Business Intelligence can be accomplished through several effective methods that enhance integration and management:
- Manual Uploads: This approach involves periodically importing new files just as you would with historical records. While straightforward, it requires regular attention to ensure information is up-to-date.
- Dataflows: Utilizing BI Dataflows enables automation in the extraction and transformation of new information. This method streamlines the integration process and enhances consistency, ensuring that your datasets are regularly updated without manual intervention. Considering that the utilization of information flows in BI is expected to rise considerably in 2024, embracing this method can enable your operations to manage information more effectively. Wisdom Wu notes, ‘@MCBPBI Based on my learning, you can use a Power BI semantic model to build a dataflow monitoring document.’. First, create a new streaming dataset. Then, enter the following values. This practical insight emphasizes the importance of utilizing dataflows effectively.
- Direct Query: For scenarios requiring real-time information access, employing Direct Query enables you to connect directly to live information sources. This guarantees that your documents are consistently aligned with the most current information, enhancing decision-making capabilities.
- Scheduled Refresh: Implementing a scheduled refresh within the BI Service automates the update process, allowing your datasets to refresh with new information at predetermined intervals. This method minimizes the risk of outdated information, keeping your insights relevant and timely.
Alongside these approaches, our 3-Day BI Sprint can assist you in rapidly producing professionally crafted documents that utilize these information management techniques, while the General Management App offers extensive oversight and intelligent evaluations to improve your operational efficiency. Furthermore, a recent statistic shows that a related post received 2,841 views, highlighting the growing interest in BI dataflows. By utilizing these methods, you can ensure that your Business Intelligence reports maintain historical context while allowing Power BI to store historical data and seamlessly integrate new data, effectively enhancing your data management strategies.
A case study revealed that the BI Dataflow Connector performs significantly better than the Platform Dataflow Connector, with performance differences noted to be as much as 80%. This real-world example reinforces the efficiency of BI Dataflows, making a compelling case for their adoption.
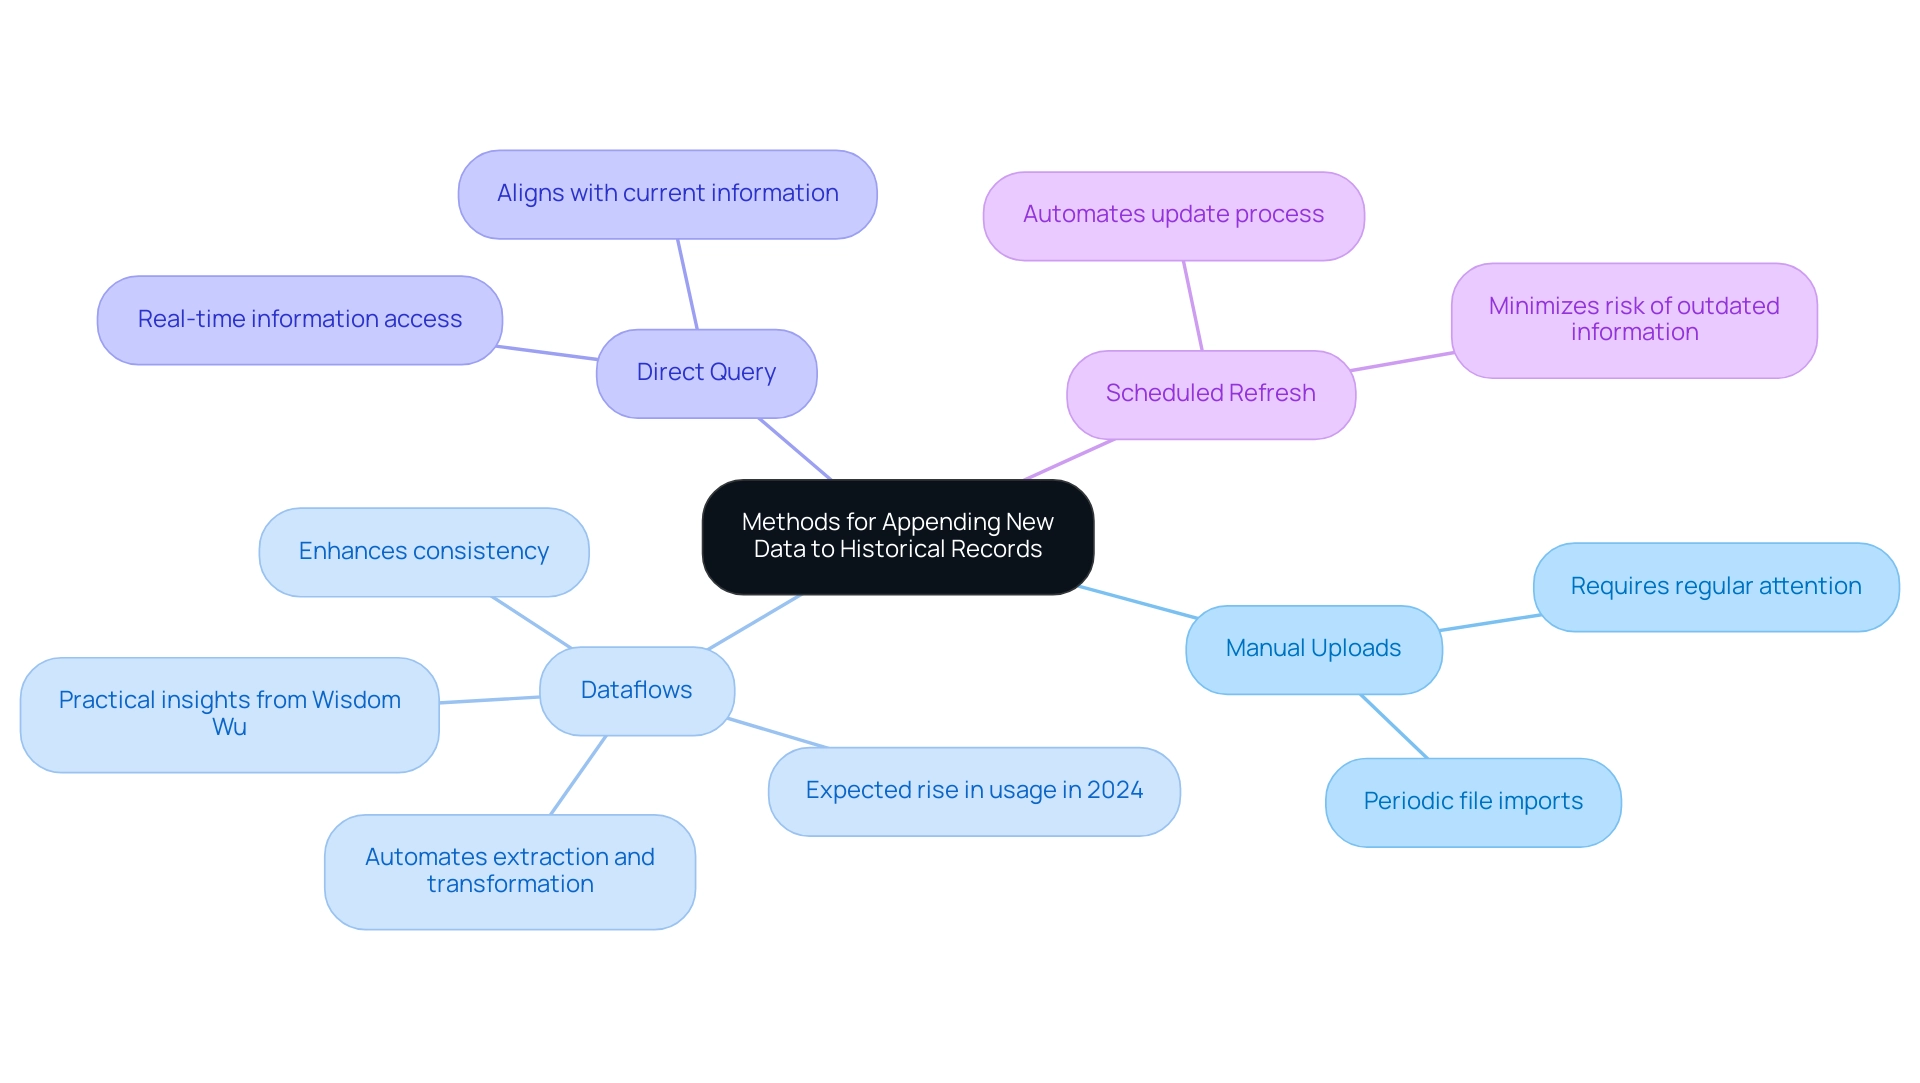
Leveraging Incremental Refresh for Efficient Data Management
To effectively harness incremental refresh in Power BI and streamline your reporting process, follow these essential steps:
-
Prepare Your Information: Ensure your dataset includes a DateTime column, which is crucial for filtering content effectively during the incremental refresh process. This setup enhances precise data management.
-
Publish to BI Service: Upload your report to the BI Service, activating the incremental refresh feature that enhances performance and allows for quicker access to insights.
-
Configure Incremental Refresh: Navigate to ‘Datasets’ in the Power BI Service, select your dataset, and configure the incremental refresh settings found under ‘Dataflow settings’. This step is essential for enhancing your refresh capabilities.
-
Set Refresh Policy: Establish a refresh policy by determining how much historical information to retain and the frequency of your dataset’s refresh to effectively use Power BI to store historical data. This optimizes loading and minimizes resource consumption, empowering your team to focus on leveraging insights rather than getting bogged down with management.
-
Apply Changes: Save your configuration, allowing your dataset to refresh only the newly added information.
This approach significantly boosts efficiency, reduces refresh times, and enhances overall operational effectiveness.
By implementing these steps, your organization can greatly enhance its data management capabilities while reaping the advantages of efficient data processing. Furthermore, as part of our 3-Day Business Intelligence Sprint, we guarantee to produce a fully operational, professionally crafted document on a subject of your preference within three days. This document can serve as a template for future projects, ensuring a professional design from the start.
The vibrant BI community also provides a wealth of resources where experts share knowledge through discussion groups, videos, and blogs, offering support for those looking to deepen their understanding of incremental refresh and its application in driving business intelligence.
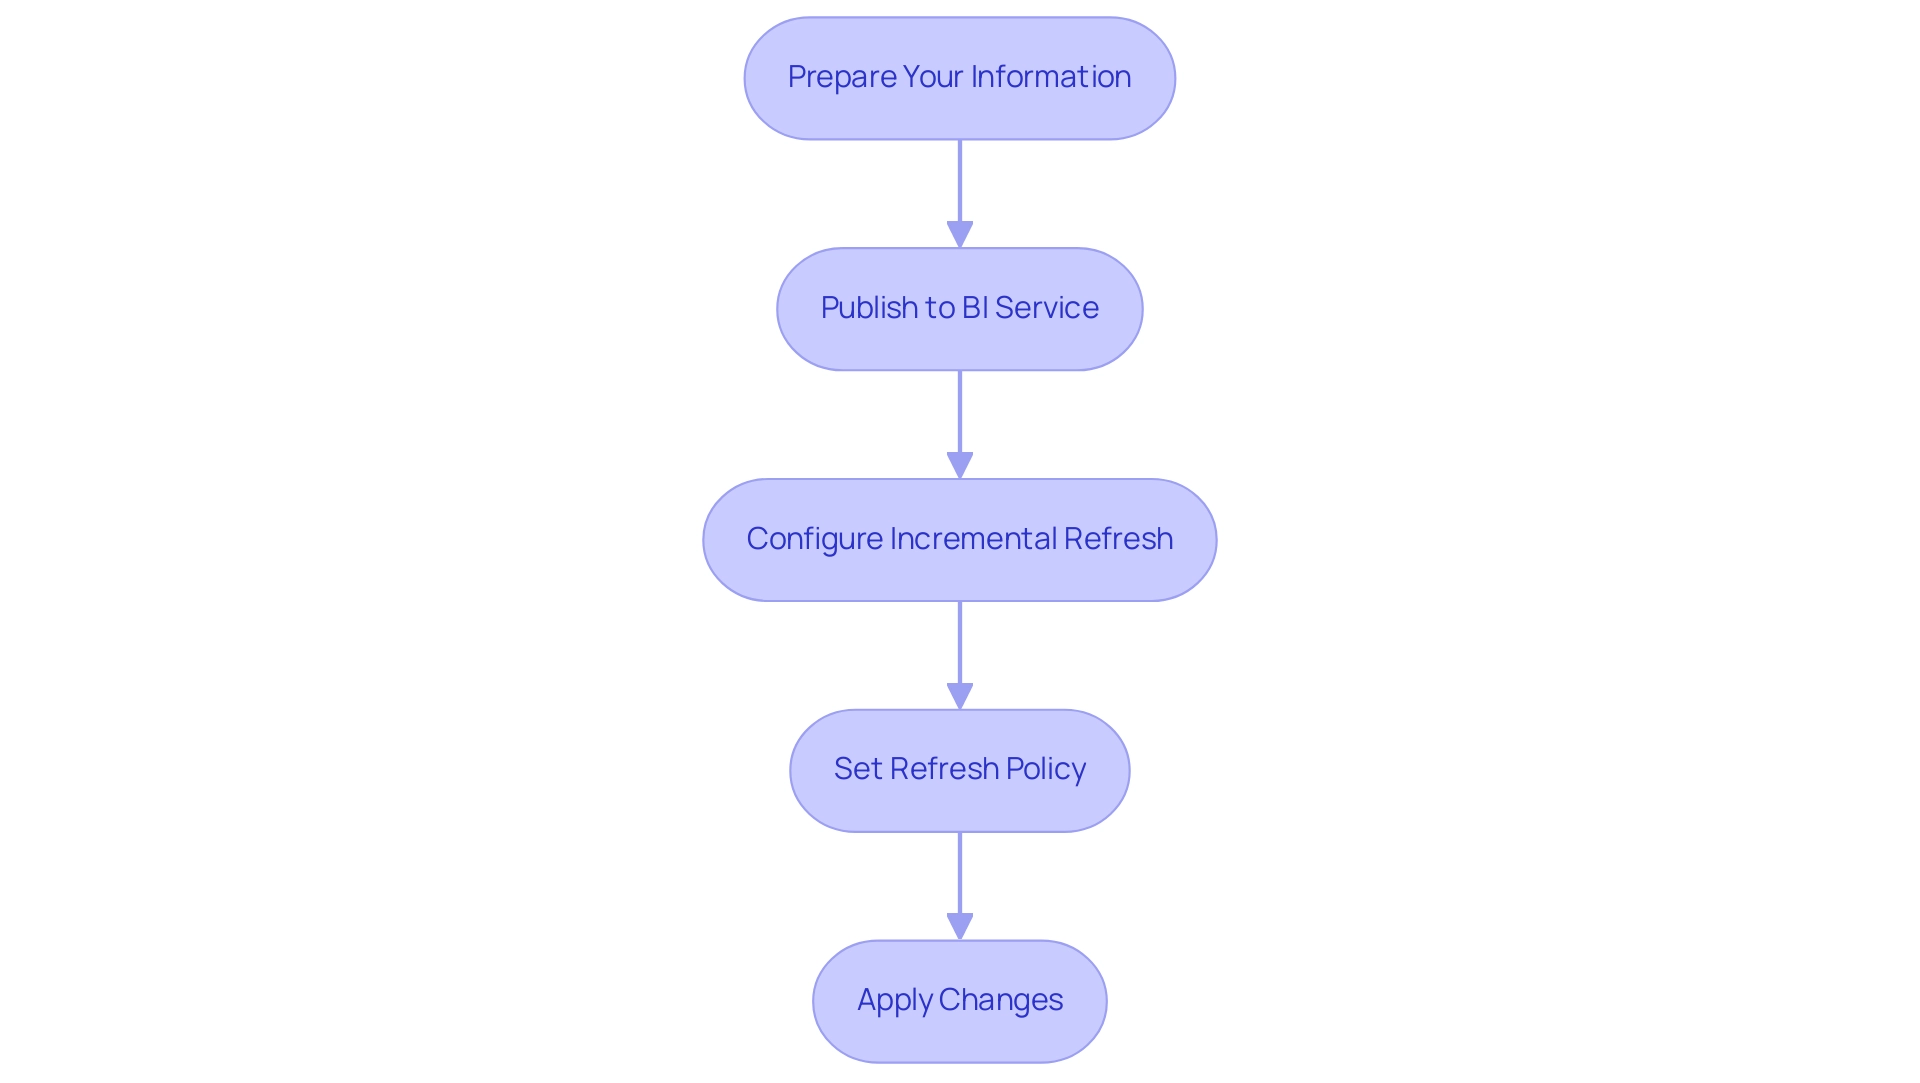
Challenges and Solutions in Storing Historical Data in Power BI
The challenges associated with how Power BI store historical data can impact performance and report reliability. Here are some key issues and their corresponding solutions:
-
Information Volume Management: As the quantity of information increases, performance can deteriorate, especially with large datasets. By 2025, the number of IoT connections is anticipated to rise to 20.3 billion, generating 79.4 zettabytes of information, highlighting the necessity for effective information management strategies. To enhance efficiency, consider employing incremental refresh and aggregation techniques. These methods enable you to optimize performance by loading only the most essential information incrementally, rather than all at once.
-
Information Quality Issues: Inconsistent or incomplete information can significantly undermine the reliability of reports. To address this, it is essential to implement validation and cleansing processes during the import phase. Ensuring that information is accurate and complete from the outset can lead to more dependable insights, especially when leveraging Business Intelligence tools.
-
Integration Difficulties: Combining information from various sources can prove complex. Utilize Query to efficiently change and combine information prior to importing it into BI. This tool enables streamlined information integration, ensuring a smoother transition into your analytics environment. Recent updates, including the Certified Connector updates, have improved connectivity options for BI users, offering expanded capabilities for information integration.
-
User Access and Security: Balancing information accessibility with security poses a challenge. Establishing role-based access controls and utilizing data sensitivity labels in BI helps manage user permissions effectively. This ensures that sensitive information remains secure while allowing authorized users the access they need.
In light of the challenges highlighted, implementing Robotic Process Automation (RPA) can significantly streamline your workflow. Solutions like EMMA RPA and Automate can automate repetitive tasks, reducing errors and freeing up your team for more strategic, value-adding work. As noted by an expert from AnalyticPulse, managing large datasets in Power BI, which can store historical data, requires careful attention to performance factors. They recommend examining elements such as table relationships, indexing, and types, particularly if your information includes time-series records, as this will help in understanding how Power BI can store historical data. Solutions such as partitioning your information source can significantly enhance query performance, particularly for specific timeframes. Additionally, utilizing visualization tools such as the Sunburst Chart can help in effectively presenting hierarchical information, making insights more accessible. By implementing these strategies alongside RPA and tailored AI solutions, you can transform your approach to data management in Power BI, driving informed decision-making and business growth while overcoming technology implementation challenges.
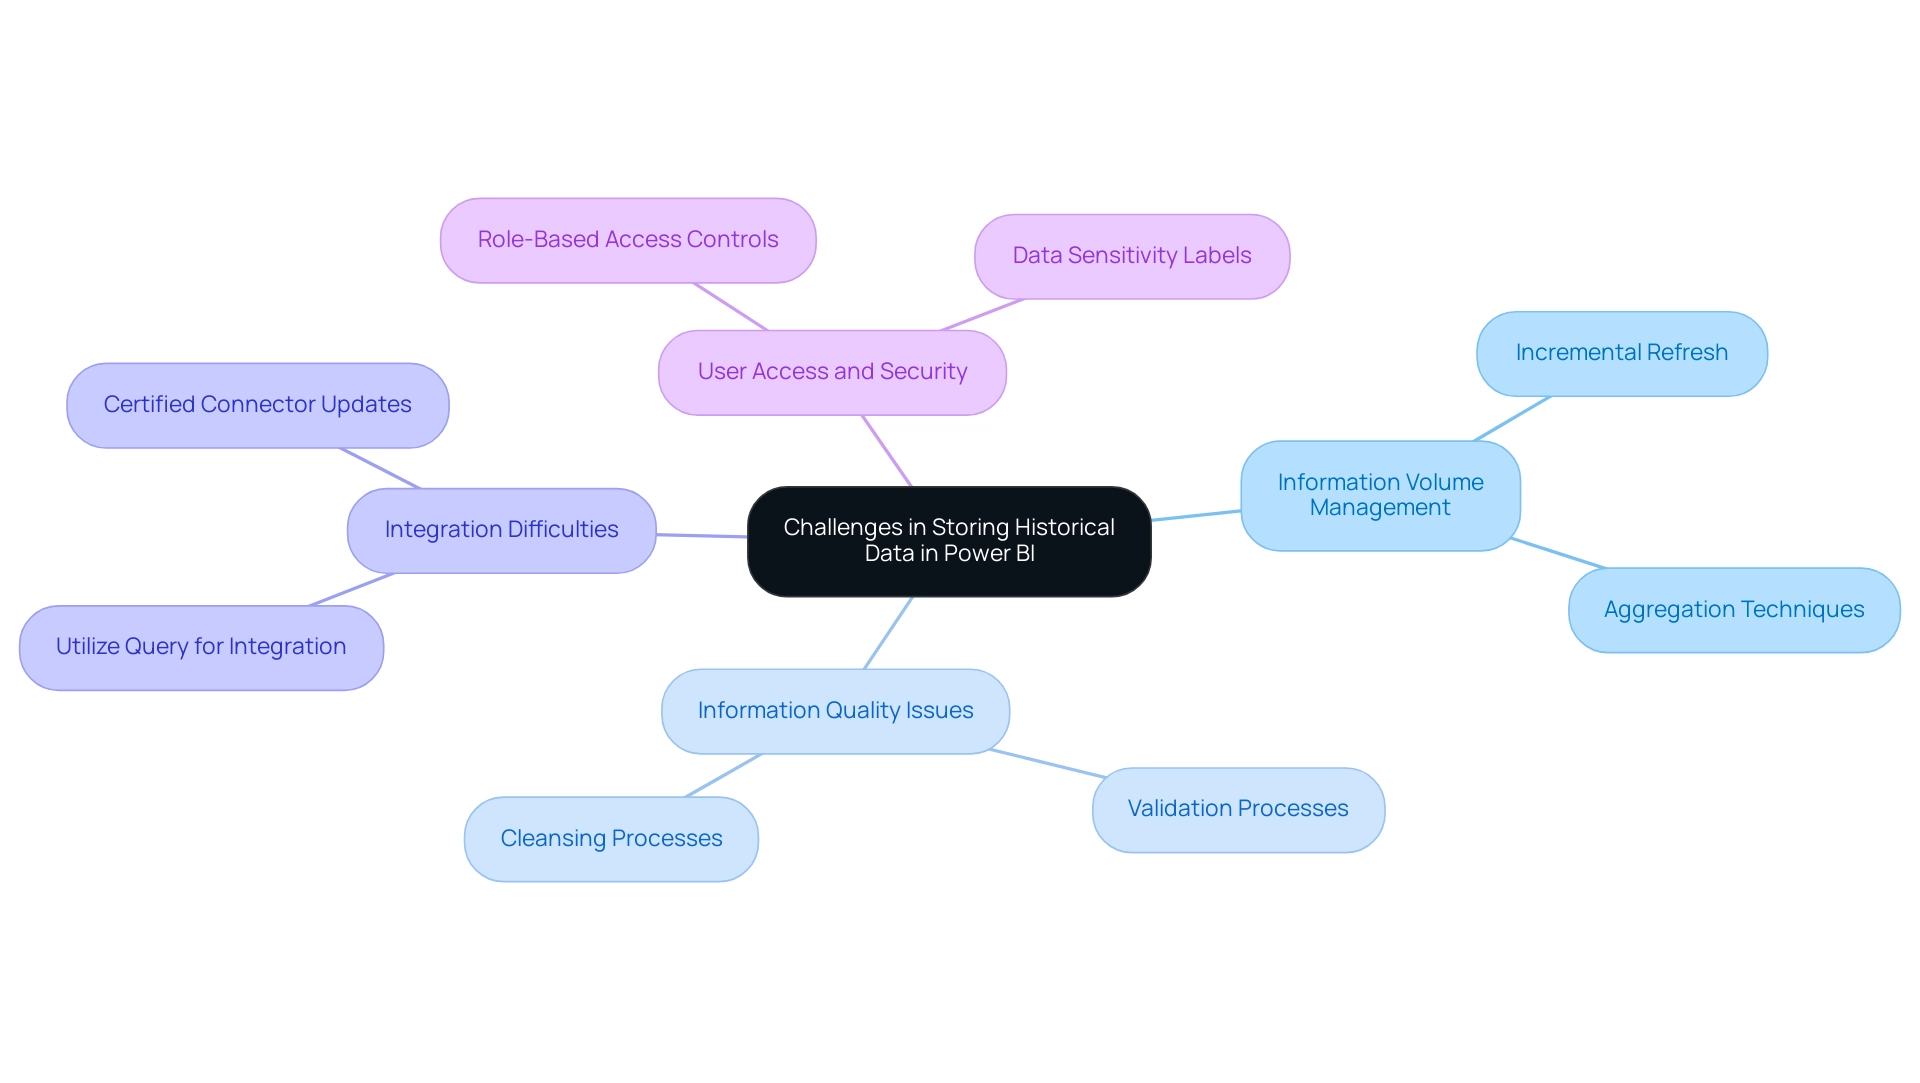
Conclusion
Effectively managing historical data in Power BI is not just a strategic advantage; it is a crucial necessity for organizations looking to enhance their operational efficiency and decision-making capabilities. By understanding the importance of historical data storage, businesses can track trends and generate insights that inform both short-term and long-term strategies. Utilizing methods such as importing, appending, and leveraging incremental refresh, organizations can ensure their data remains relevant and actionable.
The various techniques discussed, including the use of dataflows and RPA tools, demonstrate how to streamline data integration and automate repetitive tasks. These solutions not only improve data quality and accessibility but also empower teams to focus on high-value analysis rather than spending time on manual data management. The challenges associated with data volume, quality, and integration can be effectively addressed through proactive strategies, ensuring that businesses remain competitive in a data-driven world.
Ultimately, the adoption of robust data management practices in Power BI paves the way for organizations to unlock the full potential of their data assets. By embracing these innovative approaches, businesses can transform their analytics capabilities, leading to enhanced performance and informed decision-making that drives sustainable growth in an ever-evolving market landscape. Now is the time to take action and leverage historical data as a cornerstone of operational excellence.
Overview:
The article addresses how to fix issues with Power BI table visuals not displaying data, highlighting common causes such as source connectivity problems, applied filters, and information model relationships. It provides a systematic troubleshooting guide that includes checking data source connections, reviewing filters, and ensuring data type compatibility, thereby equipping users with actionable steps to resolve these visualization challenges effectively.
Introduction
In the dynamic landscape of data analytics, Power BI stands out as a powerful tool for visualizing and interpreting data. However, users often encounter frustrating moments when their table visuals fail to display the expected data. Understanding the common culprits behind these issues is essential for harnessing the full potential of Power BI.
From connectivity problems and filter configurations to data type mismatches, the journey to effective data visualization can be fraught with challenges. This article delves into practical troubleshooting steps and solutions, empowering users to overcome these obstacles and elevate their reporting capabilities.
By following a structured approach, organizations can ensure that their data-driven insights are not only visible but also actionable, driving informed decision-making and operational efficiency.
Common Reasons for Power BI Table Visuals Not Displaying Data
The issue of a Power BI table visual not showing data can arise from several typical challenges that obstruct your ability to utilize insights effectively. Here are key causes to consider, along with actionable guidance to address them:
- Source Connectivity Issues: Confirm that your Power BI is effectively connected to the source. Ensure it is online and accessible to prevent disruption. If issues persist, consider establishing a governance strategy to monitor source connections regularly.
- Filters Applied: Filters applied to the visual or report can inadvertently restrict the information shown. It’s essential to review these filters to confirm they are not unintentionally excluding necessary information. Documenting filter settings can provide clarity and guidance for future reference.
- Information Model Relationships: Incorrectly configured relationships within your information model can block visibility. Take the time to verify that relationships between tables are accurately defined, as this can greatly impact visual outcomes. For example, a user encountered a visibility challenge where a specific product group from the PRODUCTS table was visible during transformation but not in the final visualization. Troubleshooting revealed that checking and adjusting table relationships was crucial, hinting at the potential impact of granularity on visibility. Establishing a governance framework can help maintain these relationships over time.
- Information Type Mismatch: Mismatched information types within the fields used in your table can lead to display issues. Ensure all fields are compatible in terms of type to avoid complications. Regular audits can assist in maintaining information integrity.
- Empty Information: If the underlying content lacks substance or fails to meet the visual criteria, it will not display any information. A thorough check of the source information for completeness is vital. Implementing checks within your information governance strategy can help identify gaps in information.
- Visual Level Filters: Lastly, inspect any visual-level filters that may be applied, as these can prevent information from appearing in the visual. Providing clear documentation on filter applications can guide users in troubleshooting.
By recognizing these frequent concerns and adhering to the recommended measures, you can take the initial step toward resolving the issue of Power BI table visual not showing data. In today’s analytics environment, addressing these concerns effectively is essential for optimizing reporting capabilities. As Xiaoxin Sheng from the Community Support Team notes, “please provide more detail information to help us clarify these?”
This highlights the significance of comprehensive troubleshooting and understanding the context of your information sources. The broad interest in these subjects, with over 277,761 views on associated discussions, clearly shows that these matters resonate widely within the BI user community.
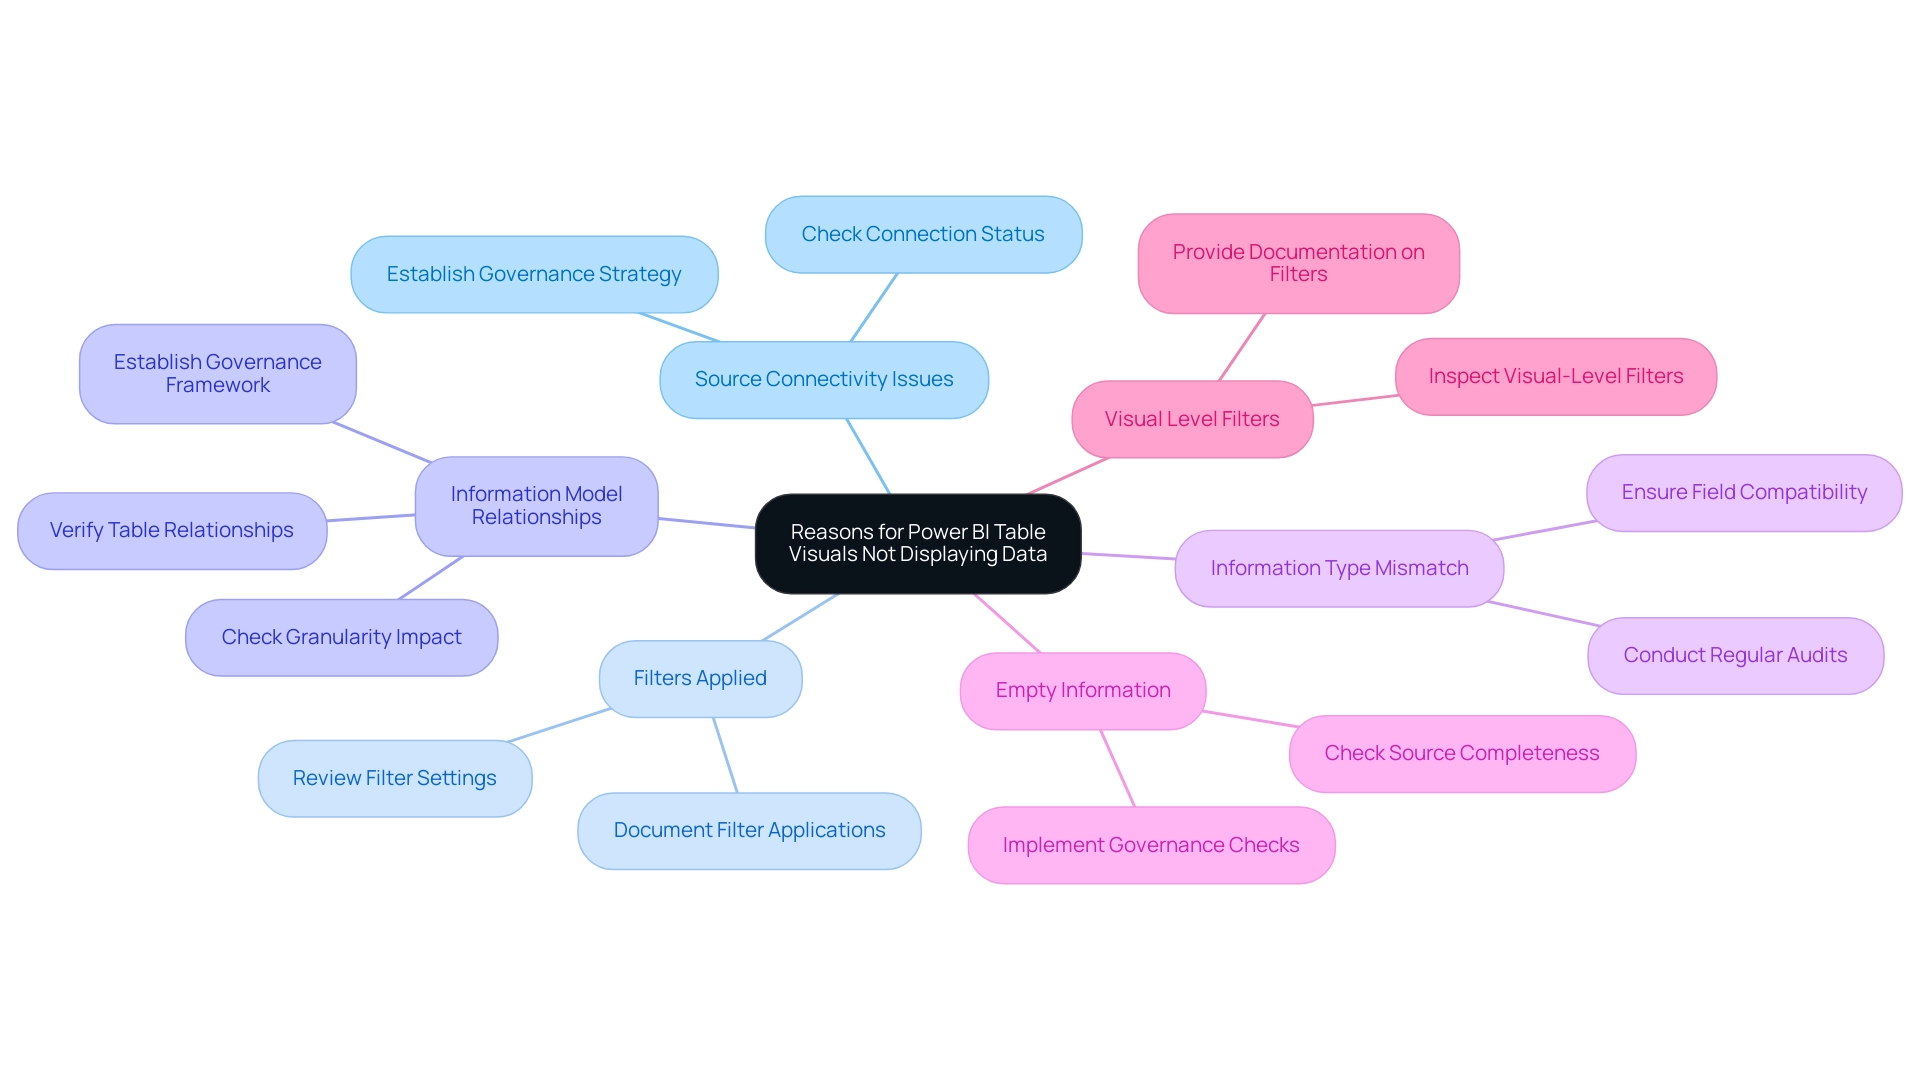
Step-by-Step Troubleshooting Guide for Power BI Table Visuals
To troubleshoot issues with Power BI table visuals not displaying data, follow this systematic approach, which addresses common challenges such as time-consuming report creation and data inconsistencies due to a lack of governance strategy:
- Check Data Source Connection:
- Launch Power BI Desktop and navigate to the ‘Home’ tab.
- Click on ‘Transform Data’ to open the Power Query Editor.
-
Verify that your information source is properly connected, and refresh the connection if needed.
-
Review Filters:
- In the report view, select the table visual.
-
Examine the ‘Filters’ pane located on the right side of the screen. Adjust or remove any filters that may exclude important information.
-
Inspect Data Model Relationships:
- Switch to the ‘Model’ view within Power BI.
-
Scrutinize the relationships between tables to ensure they are correctly established. Look for any broken or inactive relationships that might disrupt information display.
-
Confirm Data Types:
- Within the Power Query Editor, verify the data types of the columns utilized in the table visual.
-
Ensure that these types align with the expected formats (e.g., text, number) and make adjustments as necessary to avoid discrepancies.
-
Examine Source Data:
- Access the original data source (such as Excel or SQL database) to confirm it contains the anticipated data.
-
Investigate for any empty fields or rows that could disrupt the visual’s output.
-
Adjust Visual-Level Filters:
- With the table visual selected, inspect the ‘Visual Level Filters’ in the ‘Filters’ pane.
-
Remove any filters that may limit the information being shown in the visual.
-
Refresh the Visual:
- After making the necessary adjustments, click on the ‘Refresh’ button in the ‘Home’ tab to update the visual with the current data.
By carefully following these troubleshooting steps, individuals can effectively recognize and correct issues that cause the Power BI table visual not showing data, thus improving their analytical abilities and tackling frequent challenges. As emphasized by BI Super User Amit Chanda, ‘You have to create those measures and later split them for visual table’ to achieve accurate representations in your visuals. This highlights the importance of actionable guidance in report creation.
Furthermore, maintaining information visibility and user engagement is essential, as indicated by the count of dashboards or reports in the organization that had at least one view in the past 90 days. Comprehending the importance of examining content from the workspace at least once guarantees that information is linked accurately in the Usage Metrics Report, thus enhancing the overall performance of your BI dashboards.
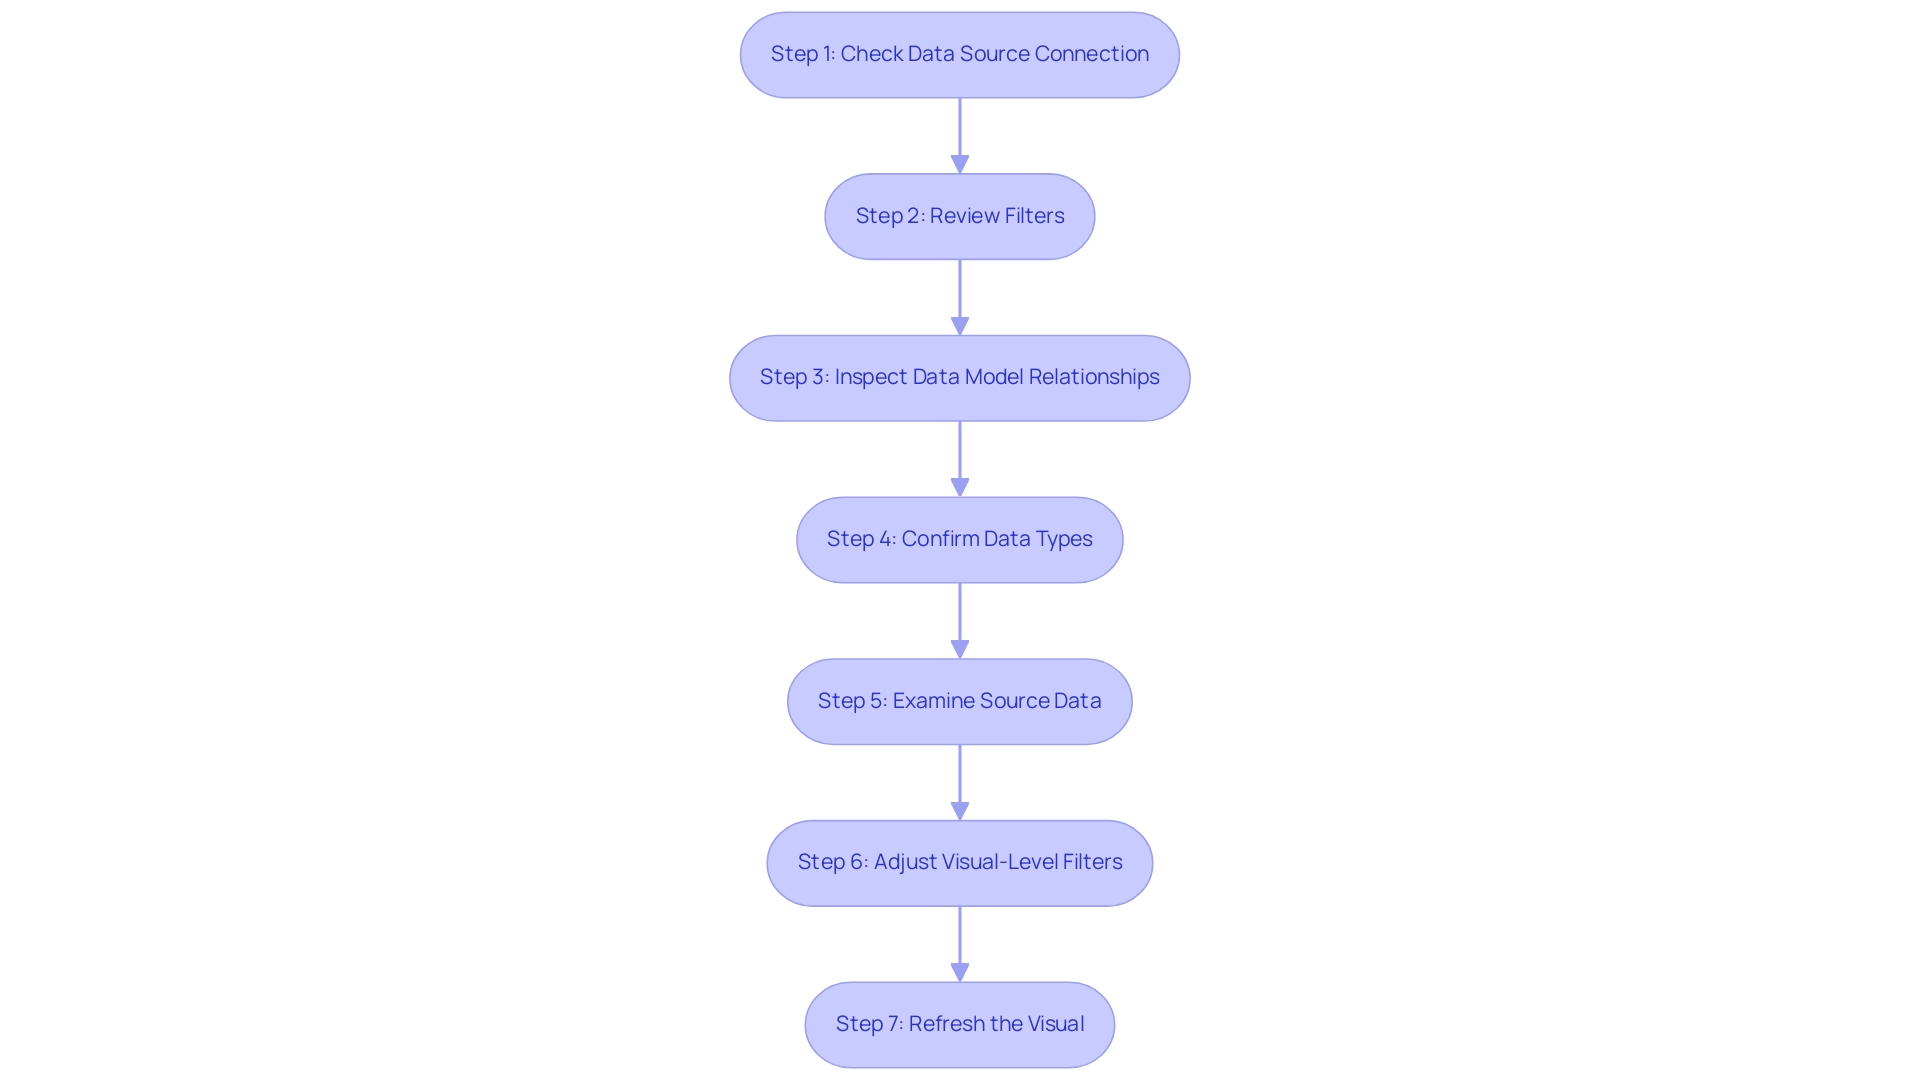
Verifying Permissions and Access Rights
-
Verify User Permissions: Ensure that you possess the necessary permissions to access the information within BI. If there’s any uncertainty regarding your access levels, don’t hesitate to reach out to your administrator for clarification. Proper permissions are crucial for effective information visibility and operational efficiency. By implementing Robotic Process Automation (RPA), you can streamline these permission checks, significantly reducing the time spent on manual verifications and enhancing overall efficiency in your operations. With over 2,911 views on this topic, it’s clear that many are seeking clarity on permissions in Power BI.
-
Assess Access Rights to Information Sources: Confirm that you have the appropriate access rights to the underlying information sources. Whether your information is stored in a database or a cloud service, it’s essential to verify that your user account has been granted the necessary permissions. This step is fundamental to preventing issues that could lead to a Power BI table visual not showing data and impede performance. Tailoring AI solutions can help automate the verification of access rights, ensuring that your team has the insights they need without unnecessary delays. Addressing these access rights can also mitigate common challenges such as inconsistencies and time-consuming report creation.
-
Examine Row-Level Security (RLS): If Row-Level Security is in place, it’s vital to review the RLS settings to ensure they permit access to the information you need. As mentioned by individual ‘jimmyfromus’, comprehending who has access to dashboards and reports, particularly those who may have departed the company, is crucial for preserving information integrity. Should adjustments be required, do not hesitate to modify the RLS settings, or seek assistance from your administrator. Addressing RLS properly can significantly improve your information visibility and resolve issues such as the Power BI table visual not showing data, which many organizations encounter. Additionally, IT leaders utilize tools like Syskit Point’s templates for managing Teams and Microsoft 365 Groups, ensuring security within the M365 environment, which can serve as a practical example of effective user permission management. Leveraging Business Intelligence tools can further transform these insights into actionable guidance, driving operational efficiency and growth while overcoming the challenges of report creation and data visibility.
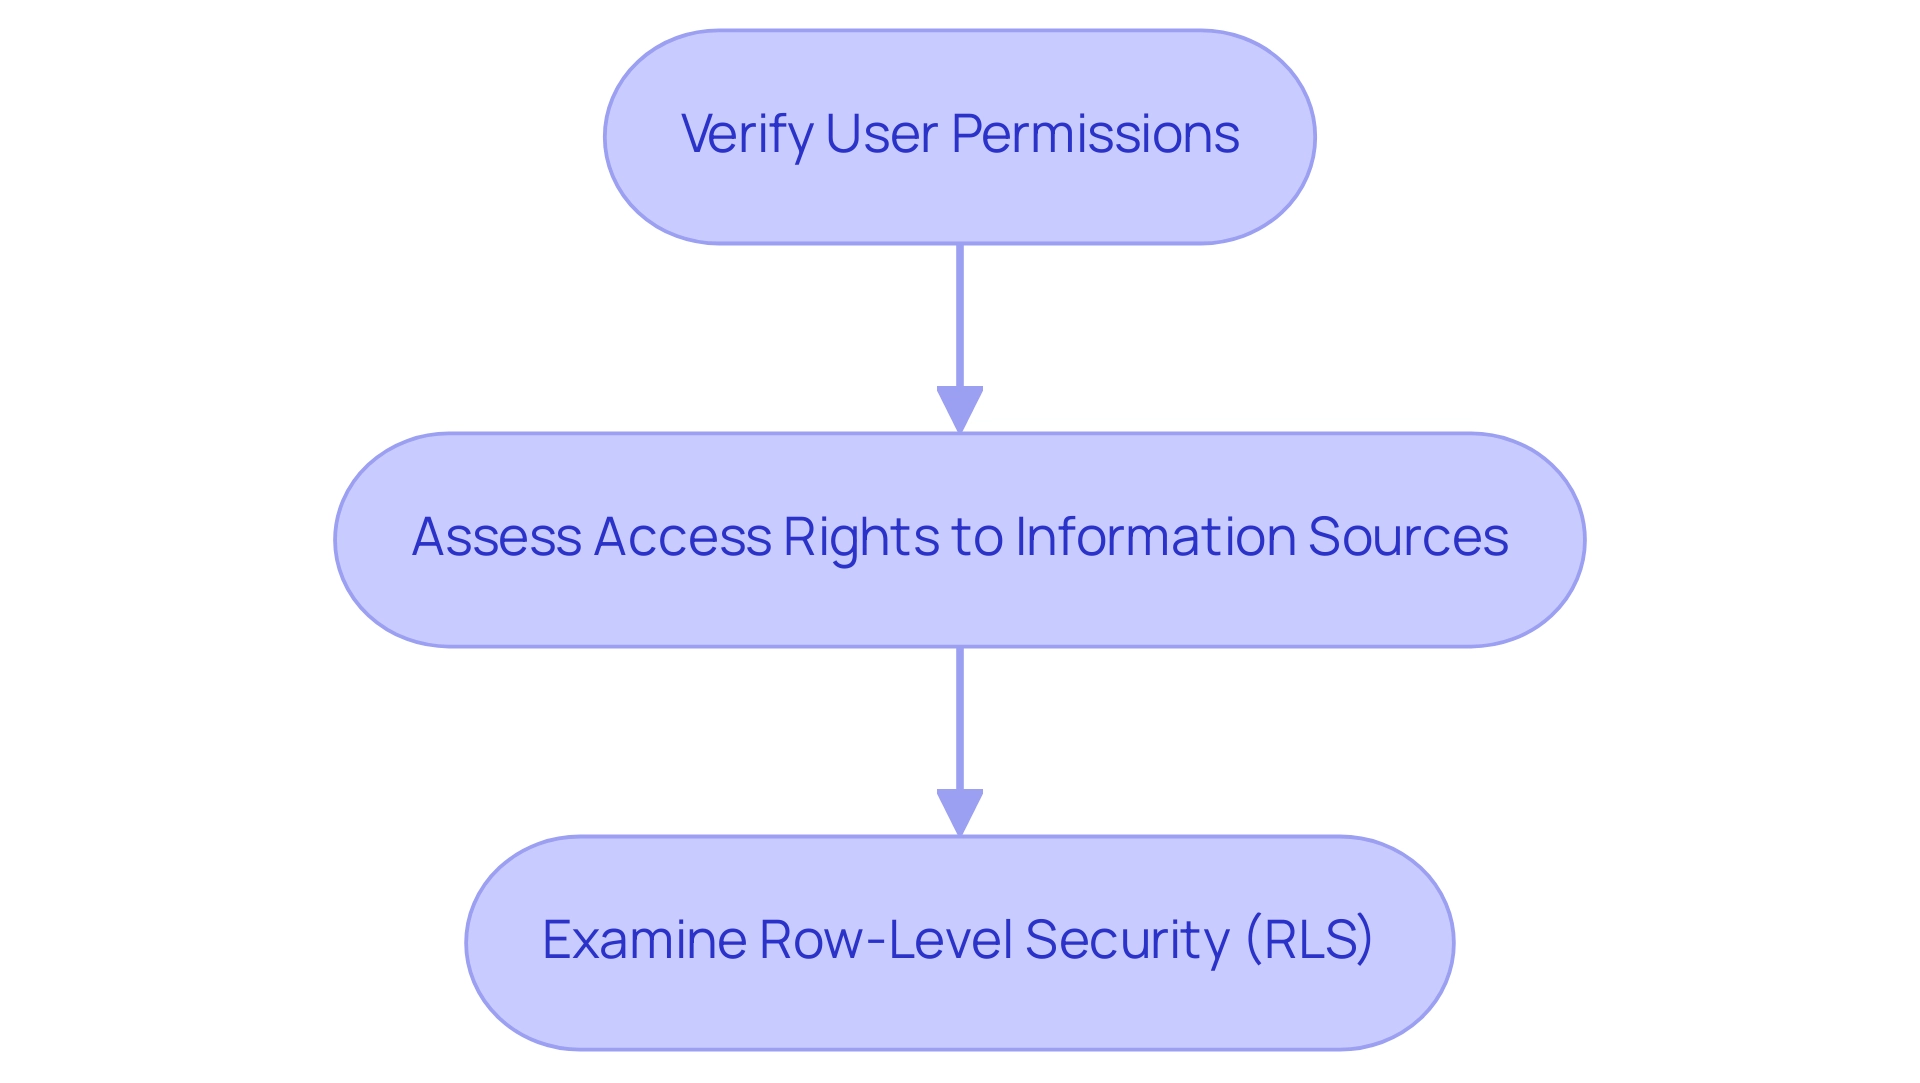
Checking for Updates and Version Compatibility
- Check for Power BI Updates:
-
Regularly verifying updates for Power BI Desktop is crucial for maintaining optimal functionality and leveraging the latest Business Intelligence features. To do this, navigate to the ‘File’ menu, select ‘Options and settings,’ and click on ‘Options.’ Under the ‘Updates’ section, review any available updates to ensure you are utilizing the most effective tools for informed decision-making that drives growth. Keeping your software current not only enhances performance but also aligns with best practices for compliance. Additionally, users can make a copy of the usage metrics report in the Power BI service, providing valuable insights into report usage and performance.
-
Update Data Connectors:
- It is essential to ensure that all data connectors in use are updated regularly. Outdated connectors can lead to significant compatibility issues, negatively impacting visibility and analysis. Regular updates help mitigate risks associated with data retrieval, enhance the overall efficiency of your BI reports, and align with the goal of unlocking actionable insights for your organization.
Compatibility with Power BI Service:
– For those utilizing Power BI Service, it is vital to confirm that your version of Power BI Desktop is compatible with the service. Incompatible versions can cause issues like a Power BI table visual not showing data, which can impede the experience for individuals. As highlighted in a recent experience testing case study, ensuring continuous availability of Power BI content is fundamental to maximizing satisfaction and driving consumption. This case study demonstrated that addressing compatibility issues directly impacts participant engagement and operational efficiency. Moreover, Tom notes,
> Maybe there is some kind of tracking application that can be ingested to the device of the individual, so make sure that you are compliant with any existing regulations of your clients.
Keeping abreast of version compatibility can significantly enhance your operational efficiency and empower your team to leverage data effectively, particularly to resolve issues such as Power BI table visual not showing data. As a reminder, prices for the upcoming conference will rise on February 11th, highlighting the significance of staying informed on BI updates and user compliance, which are essential to maintaining operational efficiency and maximizing the value of data-driven insights.
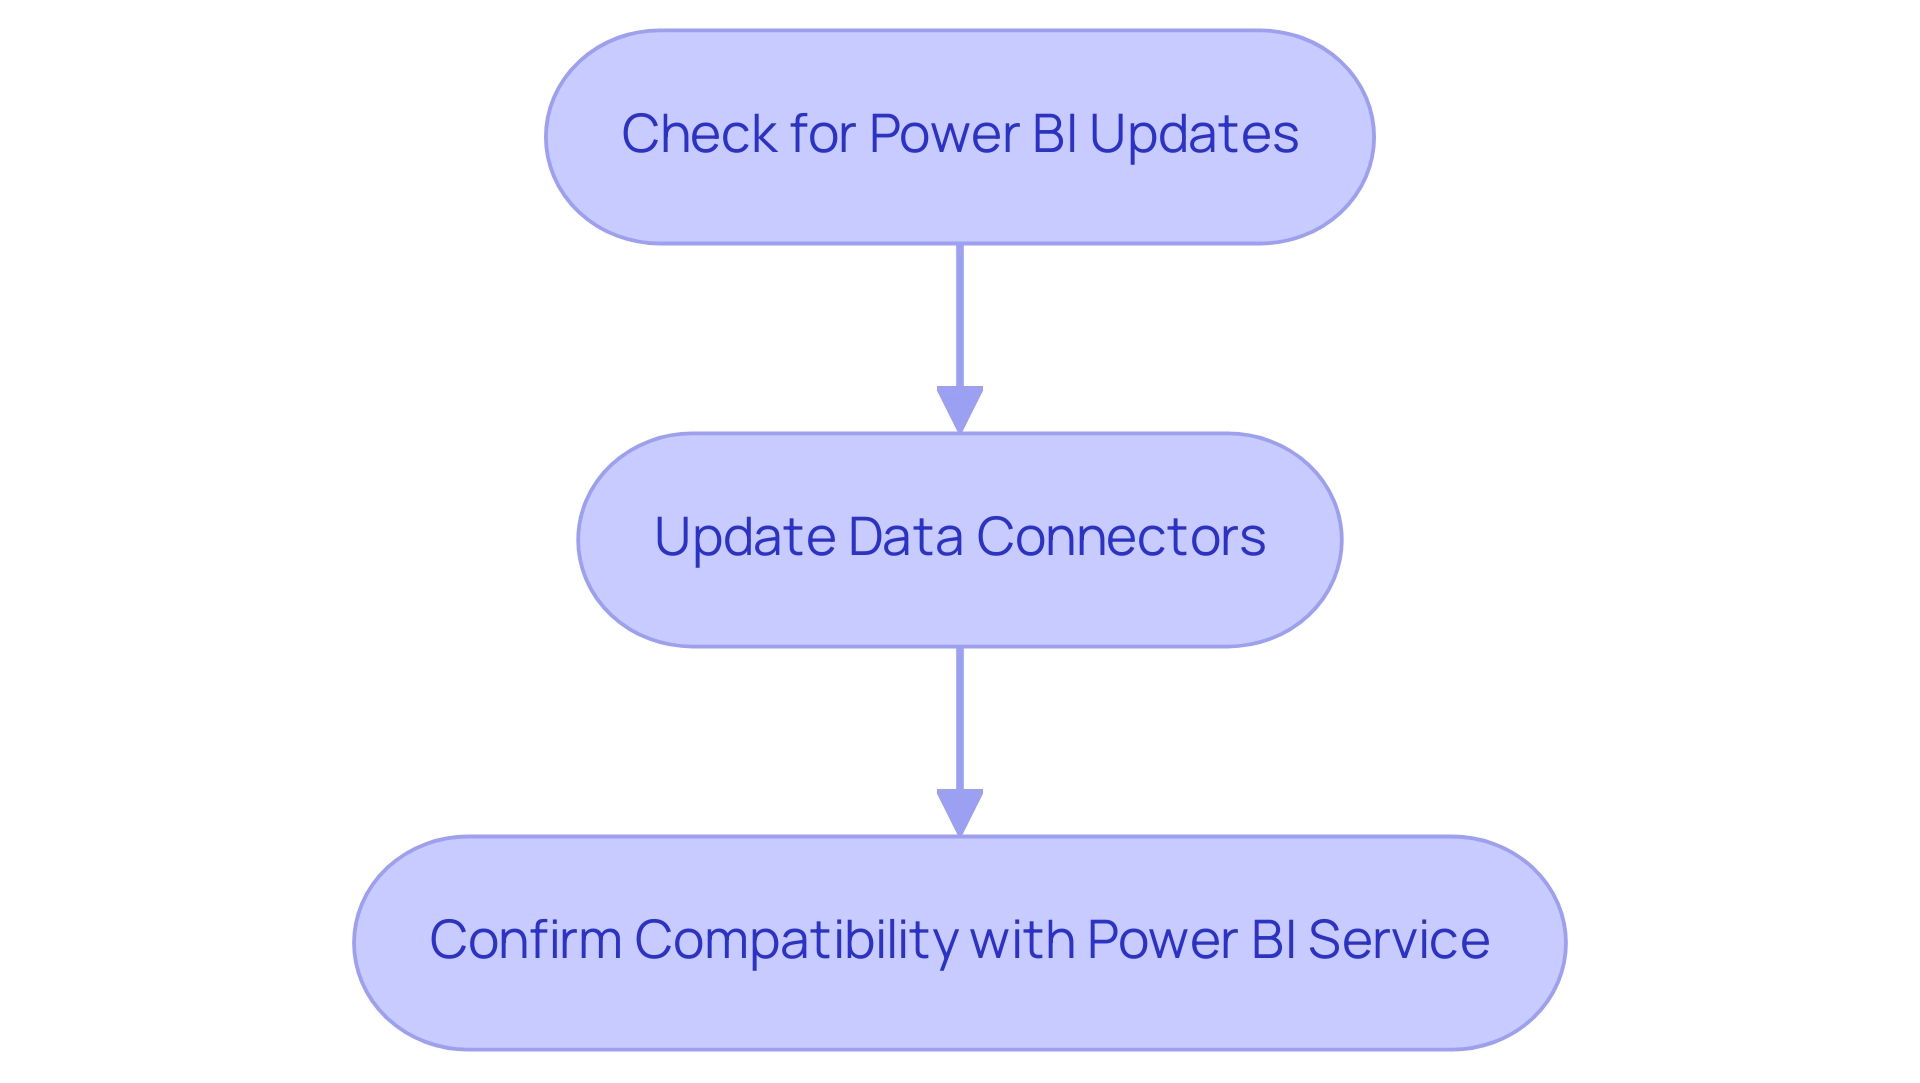
Testing with a New Report
-
Create a New Report: Open Power BI Desktop and initiate a new report by selecting ‘New Report’ from the ‘File’ menu. This foundational step prepares the ground for effective analysis and emphasizes the significance of Business Intelligence in generating insights that promote business growth, particularly in a landscape where extracting meaningful information is essential to avoid competitive disadvantages.
-
Import Sample Information: Utilize sample information to populate your new report. You can either access sample datasets directly within Power BI or choose a straightforward Excel file containing familiar information. Working with sample information allows for a more controlled environment when troubleshooting, addressing common challenges such as inconsistencies that can impede effective insights.
-
Add a Table Visual: Integrate a table visual into your report, populating it with the imported sample information. This visual depiction is crucial for evaluating whether the information presents accurately and aids in recognizing any possible challenges in your setup, facilitating operational efficiency through streamlined reporting procedures. Incorporating RPA solutions at this stage can further automate information handling and enhance the reporting process.
-
Evaluate Results: Carefully assess the results in the table visual. If the information appears correctly, the underlying issue may reside in the original report. However, if the Power BI table visual is not showing data, it indicates a need for further investigation into the broader Power BI configuration. Recent statistics show that, as of September 14, 2020, with 23 test cases, only 9 tests passed, yielding a success rate of 39.13%. Such insights underline the importance of thorough testing in ensuring that your reports function as intended. To illustrate this, consider the DAX measure used to calculate the passed percentage:
DAX

   Passed Percentage = DIVIDE(COUNTROWS(FILTER(SampleData, SampleData[Status] = "Passed")), COUNTROWS(SampleData), 0)
This measure highlights the significance of accurately defining test statuses. Additionally, an individual named Jere shared, “Now everything works. Thank you very much!” reinforcing the value of addressing and resolving issues systematically. Furthermore, the case study on modifying DAX for multiple statuses demonstrates the need for flexibility in analysis, as users may require adjustments to include additional statuses like ‘N/A’. Lastly, remember to explore the option of connecting Power BI with OData queries for enhanced data integration and reporting capabilities, which can further bolster your decision-making processes and mitigate the risks associated with insufficient insights.
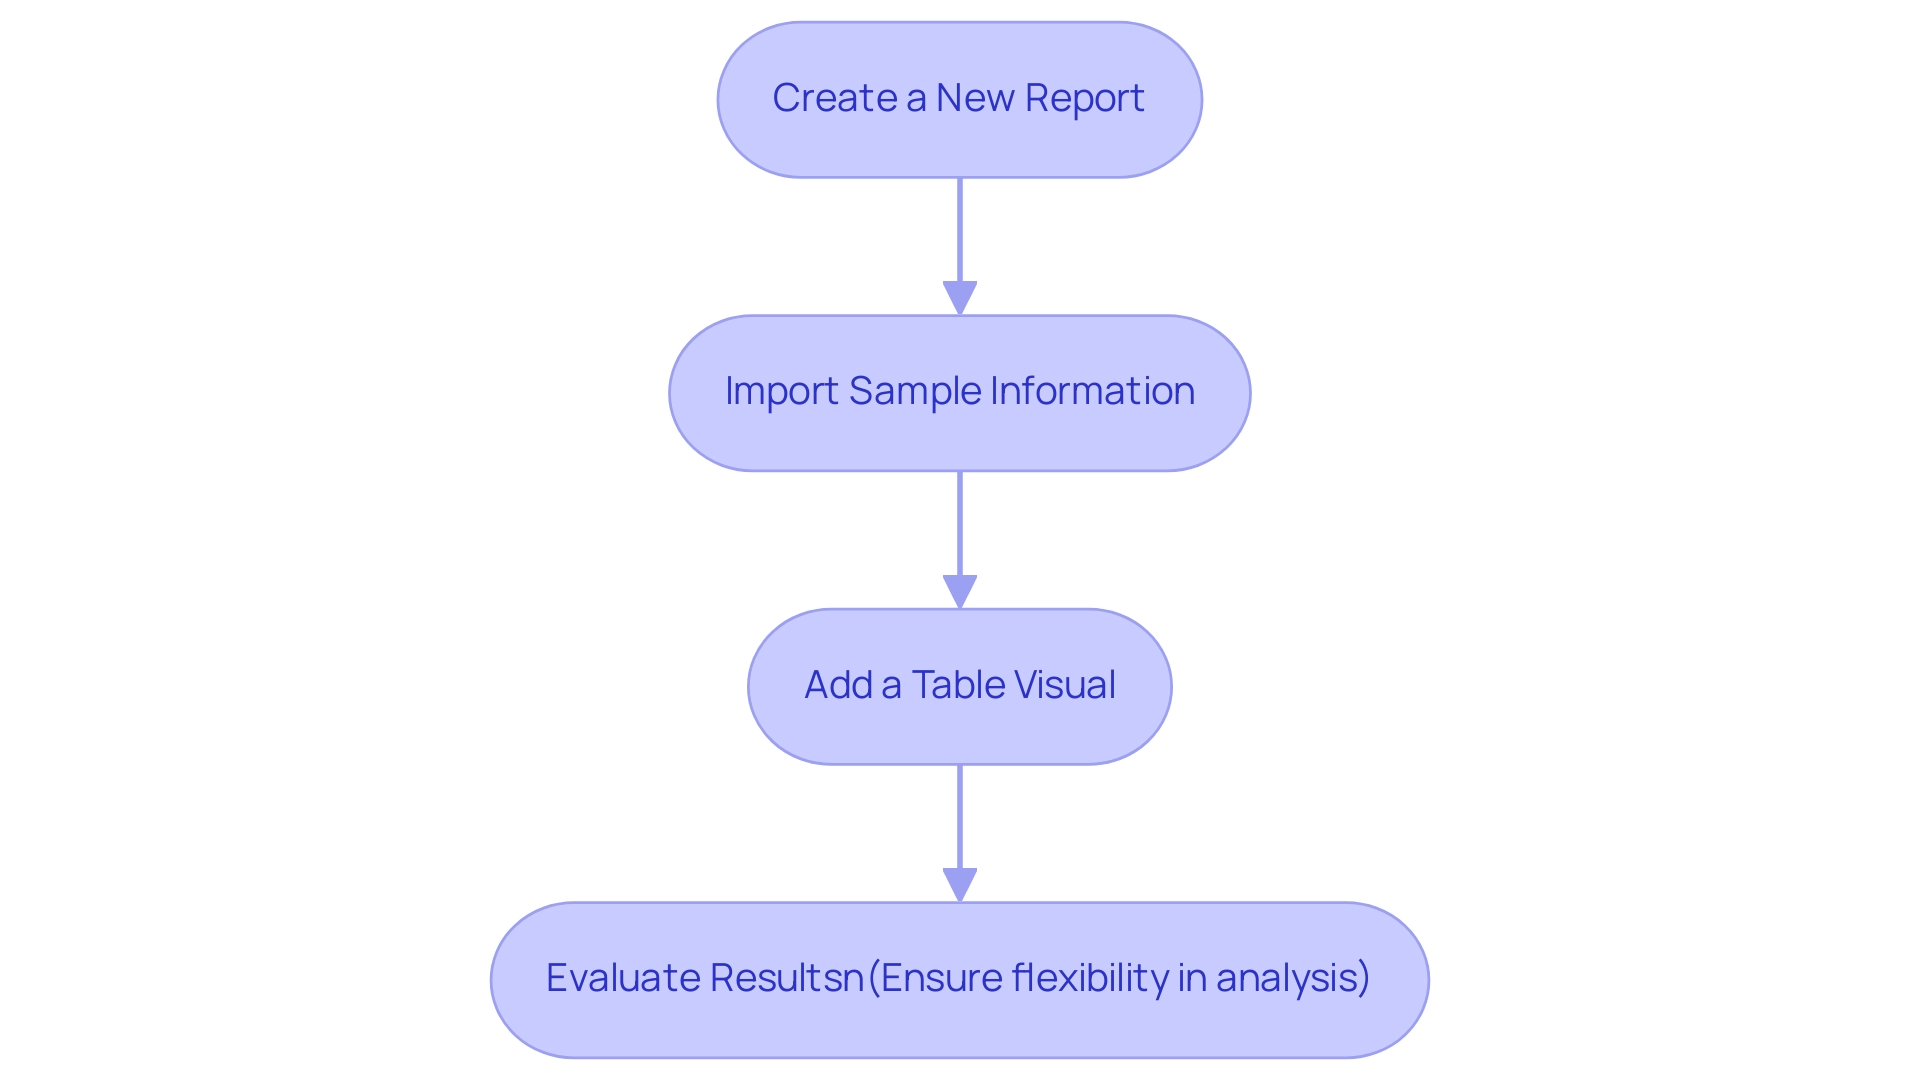
Conclusion
Navigating the complexities of Power BI can often present challenges, especially when table visuals do not display the expected data. By understanding the common reasons behind these issues—such as:
- Connectivity problems
- Filter configurations
- Data type mismatches
- User permissions
users can take proactive steps to ensure their data is visible and actionable.
Implementing a structured troubleshooting approach is crucial. From:
- Verifying data source connections
- Reviewing filters
- Confirming data types
- Examining user permissions
each step plays a vital role in enhancing data visibility. Moreover, keeping Power BI updated and testing with new reports using sample data can further streamline the process and identify underlying issues efficiently.
Ultimately, overcoming these obstacles is essential for leveraging the full potential of Power BI. By applying the insights and solutions outlined in this article, users can transform their data analytics experience, driving informed decision-making and fostering operational efficiency. Embracing these practices not only enhances reporting capabilities but also empowers organizations to navigate the data-driven landscape with confidence and clarity.