Overview
The three primary areas of analytics—descriptive, diagnostic, and predictive—play distinct roles in understanding and leveraging data for organizational decision-making.
- Descriptive analytics summarizes historical data, providing a foundation for insight.
- Diagnostic analytics delves into the reasons behind past outcomes, uncovering valuable lessons.
- Predictive analytics, on the other hand, forecasts future trends, allowing organizations to anticipate shifts in the market.
Together, these analytics enhance operational efficiency and inform strategic initiatives, ultimately driving better decision-making.
Consider how these analytics can be integrated into your current practices to elevate your organization’s performance.
Introduction
In a world increasingly driven by data, harnessing analytics stands as a cornerstone of operational success for organizations across all sectors. Understanding historical trends and predicting future outcomes, various forms of analytics—descriptive, diagnostic, predictive, and prescriptive—provide powerful tools that empower businesses to make informed decisions. As the landscape evolves, integrating these analytics types not only enhances efficiency but also fosters a culture of continuous improvement.
With the rise of AI and automation, organizations are now better equipped to navigate the complexities of vast data landscapes, driving innovation and strategic growth. This article delves into the multifaceted role of analytics in shaping operational efficiency and explores the trends that are redefining how businesses leverage data for competitive advantage.
Understanding Analytics: An Overview
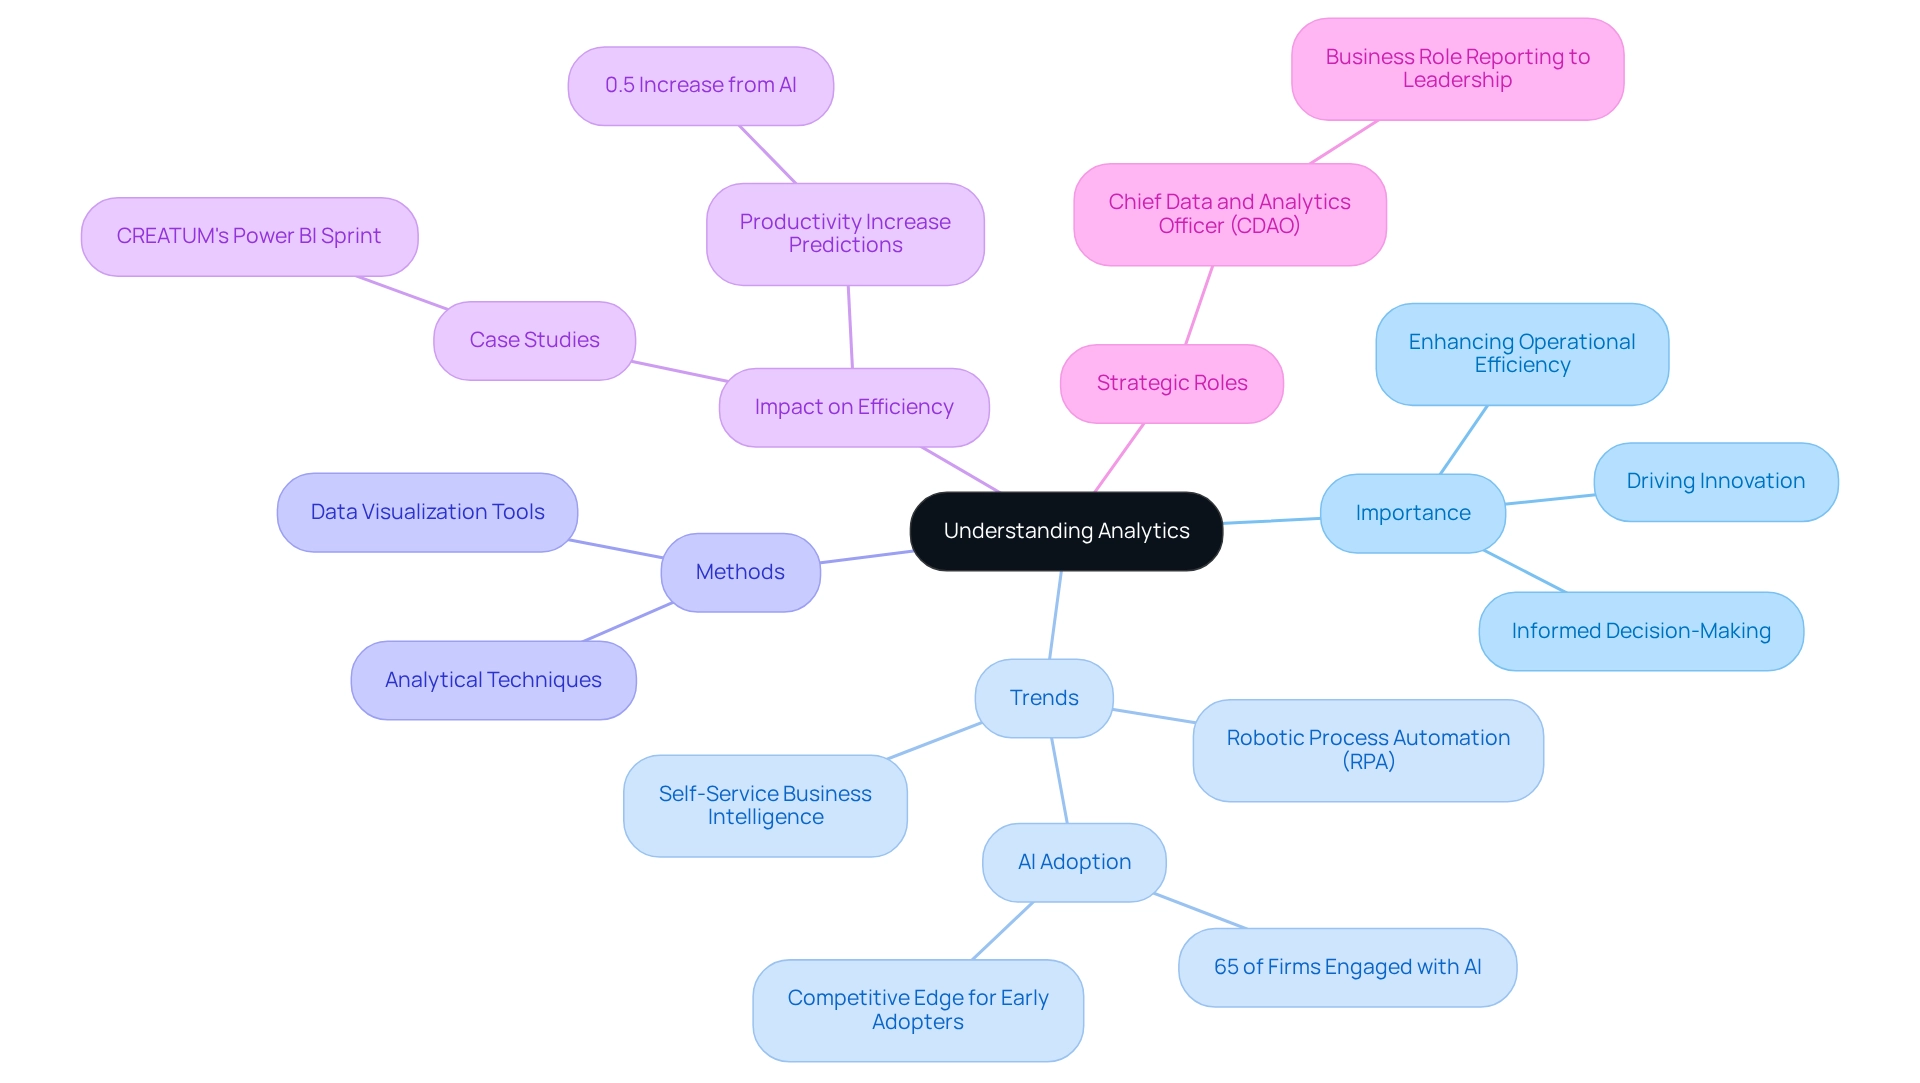
Analytics encompasses the systematic computational examination of information and statistics, serving as a crucial process for entities aiming to navigate the complexities of extensive information landscapes. By employing various analytical methods, organizations can identify patterns, trends, and connections within their data, facilitating informed decision-making. In 2025, the importance of data analysis in enhancing operational efficiency is paramount; it stands as a key driver of innovation and strategic goal achievement.
Current trends reveal a significant shift towards self-service business intelligence tools, which simplify performance tracking and empower organizations to swiftly monitor relevant performance indicators. This evolution allows teams to focus on strategic initiatives rather than being bogged down by manual data analysis. Moreover, the integration of Robotic Process Automation (RPA) can further enhance operational efficiency by automating manual workflows, thereby freeing valuable resources for more strategic tasks.
The impact of data analysis on operational efficiency is evident in numerous case studies. For instance, a notable 65% of firms are currently engaged with AI in data and analytics, with early adopters reporting a competitive edge. This trend underscores the necessity for businesses to adapt rapidly to the evolving data landscape to thrive in an increasingly data-driven environment.
As MIT’s Daron Acemoglu predicts, AI may lead to a 0.5% increase in productivity over the next decade, further highlighting the importance of integrating AI into analytical strategies. Real-world examples illustrate how organizations are transforming raw data into actionable insights. For example, ‘CREATUM’s Power BI Sprint has significantly bolstered analytical capabilities for clients like PALFINGER, enabling them to generate professional reports and leverage insights effectively.
By establishing robust assessment frameworks, companies can enhance data quality and optimize operations, ultimately fostering growth and innovation. As Randy emphasizes, the role of Chief Data and Analytics Officer (CDAO) should be a commercial position reporting to organizational leadership, reflecting the growing importance of data management in achieving strategic objectives. As the landscape continues to evolve, the role of data analysis in operational efficiency will remain vital, empowering organizations to make informed decisions that align with their strategic goals.
Descriptive Analytics: Summarizing Historical Data
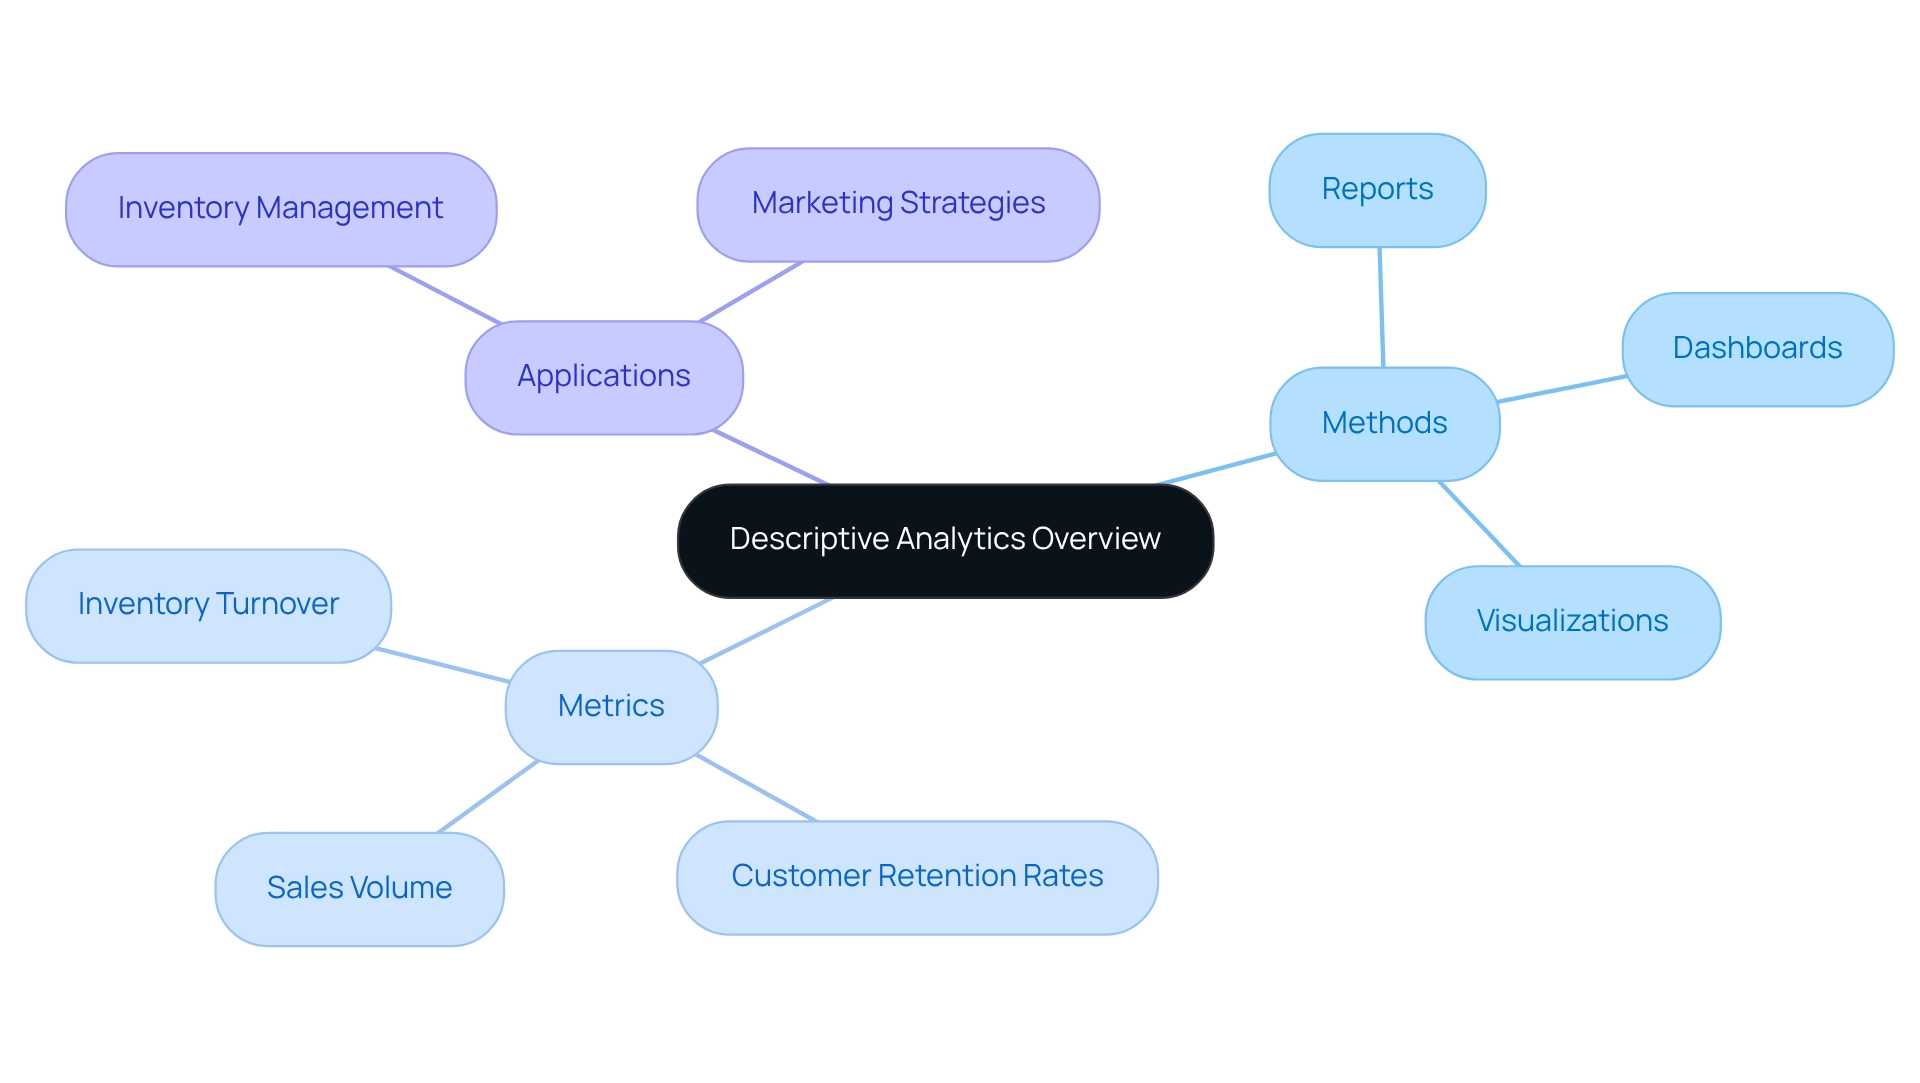
Descriptive analysis plays a vital role in interpreting historical information, enabling companies to summarize past occurrences and obtain actionable insights. This analytical method employs various metrics and visual representations, including reports, dashboards, and visualizations, to present information in an accessible manner. For instance, a retail firm may utilize descriptive analysis to examine sales data from prior years, uncovering seasonal patterns and consumer buying behaviors.
Such insights empower organizations to make informed decisions regarding inventory management and marketing strategies.
In 2025, the average metrics used in descriptive analysis will include key performance indicators (KPIs) such as sales volume, customer retention rates, and inventory turnover. The precision of market trend assessments has significantly enhanced by almost 20% through the use of descriptive analysis, enabling companies to modify their strategies and capitalize on new opportunities.
Catherine Cote, Marketing Coordinator at Harvard Business School Online, states, “Data analysis is a valuable tool for businesses aiming to increase revenue, enhance products, and retain customers.” This underscores the significance of descriptive analysis in addressing operational efficiency challenges, as it provides the insights necessary for optimizing processes and improving decision-making.
A notable case study highlighting the effectiveness of descriptive analytics is the adoption of analytics dashboards, which have surged by over 45% among leading firms. These dashboards, particularly those created through Power BI services, offer a centralized platform for data visualization, streamlining decision-making and enhancing oversight of market dynamics. The 3-Day Power BI Sprint enables organizations to swiftly create professionally designed reports that facilitate this process.
Additionally, the General Management App enhances comprehensive management and smart reviews, further supporting effective decision-making.
Companies employing descriptive data analysis for inventory management have reported substantial benefits. For example, retailers can analyze previous sales information to optimize stock levels, ensuring that popular items are readily available while minimizing excess inventory. This strategic approach not only enhances operational efficiency but also contributes to improved customer satisfaction.
As the Internet of Things (IoT) continues to expand, with projections indicating 20.3 billion connected devices generating 79.4 zettabytes of information by 2025, the significance of descriptive analytics will only increase. Businesses that effectively harness these insights, alongside leveraging Robotic Process Automation (RPA) to automate manual workflows, will be better positioned to navigate the complexities of the market and drive growth, particularly in managing the vast amounts of data generated by IoT devices. To explore how our actions portfolio can assist your organization, we invite you to book a free consultation.
Diagnostic Analytics: Uncovering the ‘Why’ Behind Data
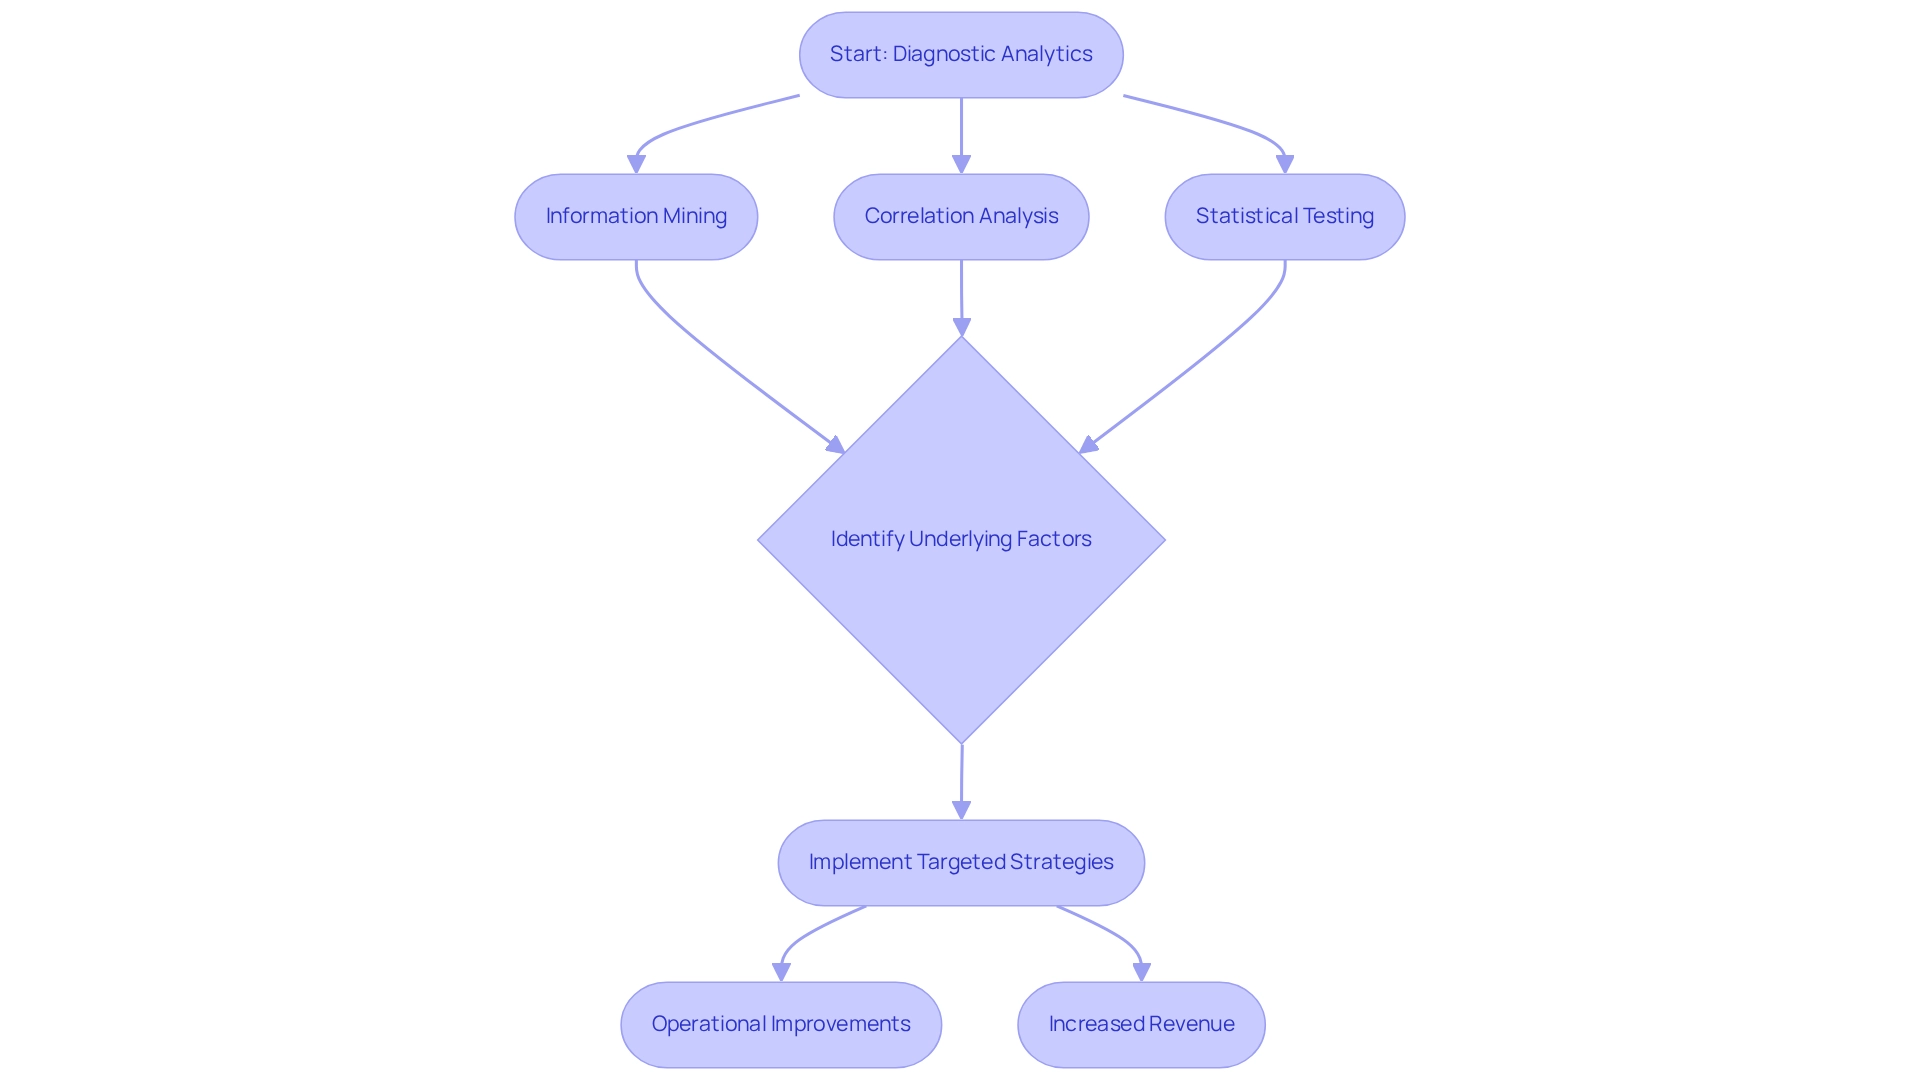
Diagnostic analysis transcends descriptive analysis by delving into the reasons behind previous results, effectively addressing critical inquiries such as ‘Why did this occur?’ and ‘What factors contributed to this result?’ This analytical approach employs a variety of techniques, including information mining, correlation analysis, and statistical testing, to unveil actionable insights.
For example, when a company experiences a sudden decline in sales, diagnostic evaluations can pinpoint whether the downturn stems from shifts in consumer behavior, heightened competition, or operational inefficiencies.
The significance of diagnostic evaluations in 2025 is paramount. It plays a vital role in enhancing operational efficiency, with studies indicating potential revenue boosts of up to 20% in marketing and sales processes. Organizations leveraging diagnostic analytics can identify common factors that lead to performance issues, such as customer dissatisfaction or supply chain disruptions, allowing them to implement targeted strategies to address these challenges.
A compelling case study illustrates this point: a mid-sized firm faced challenges like manual entry errors, sluggish software testing, and difficulties in integrating legacy systems without APIs. By adopting GUI automation, the company significantly improved efficiency by automating data entry, software testing, and legacy system integration. This initiative resulted in a 70% reduction in data entry errors, a 50% acceleration in testing processes, and an 80% enhancement in workflow efficiency, achieving ROI within six months.
Such examples underscore the capacity of diagnostic analysis to deliver substantial business outcomes.
Expert opinions further affirm the importance of this analytical method. Industry experts assert that diagnostic analysis is essential for uncovering insights that facilitate informed decision-making and operational improvements. Techniques like root cause analysis are crucial for understanding the underlying issues affecting performance, empowering organizations to devise effective solutions.
In an environment abundant with data, the ability to extract meaningful insights through diagnostic analysis is critical for enterprises aiming to thrive in a competitive landscape.
Additionally, the Analytics & Insights team at Seer employs both diagnostic and predictive analysis to enhance marketing strategies for clients, showcasing how diagnostic analysis fits within a broader analytical framework. Furthermore, AI platforms in healthcare enhance physicians’ access to the latest research and treatment methods, demonstrating the extensive impact of data analysis across various sectors. In 2025, the common elements identified through diagnostic analysis will continue to play a vital role in addressing operational inefficiencies, ensuring companies maintain their competitive edge.
Moreover, the implementation of Robotic Process Automation (RPA) can further streamline these processes, enabling organizations to automate repetitive tasks and focus on strategic initiatives.
Predictive Analytics: Forecasting Future Trends
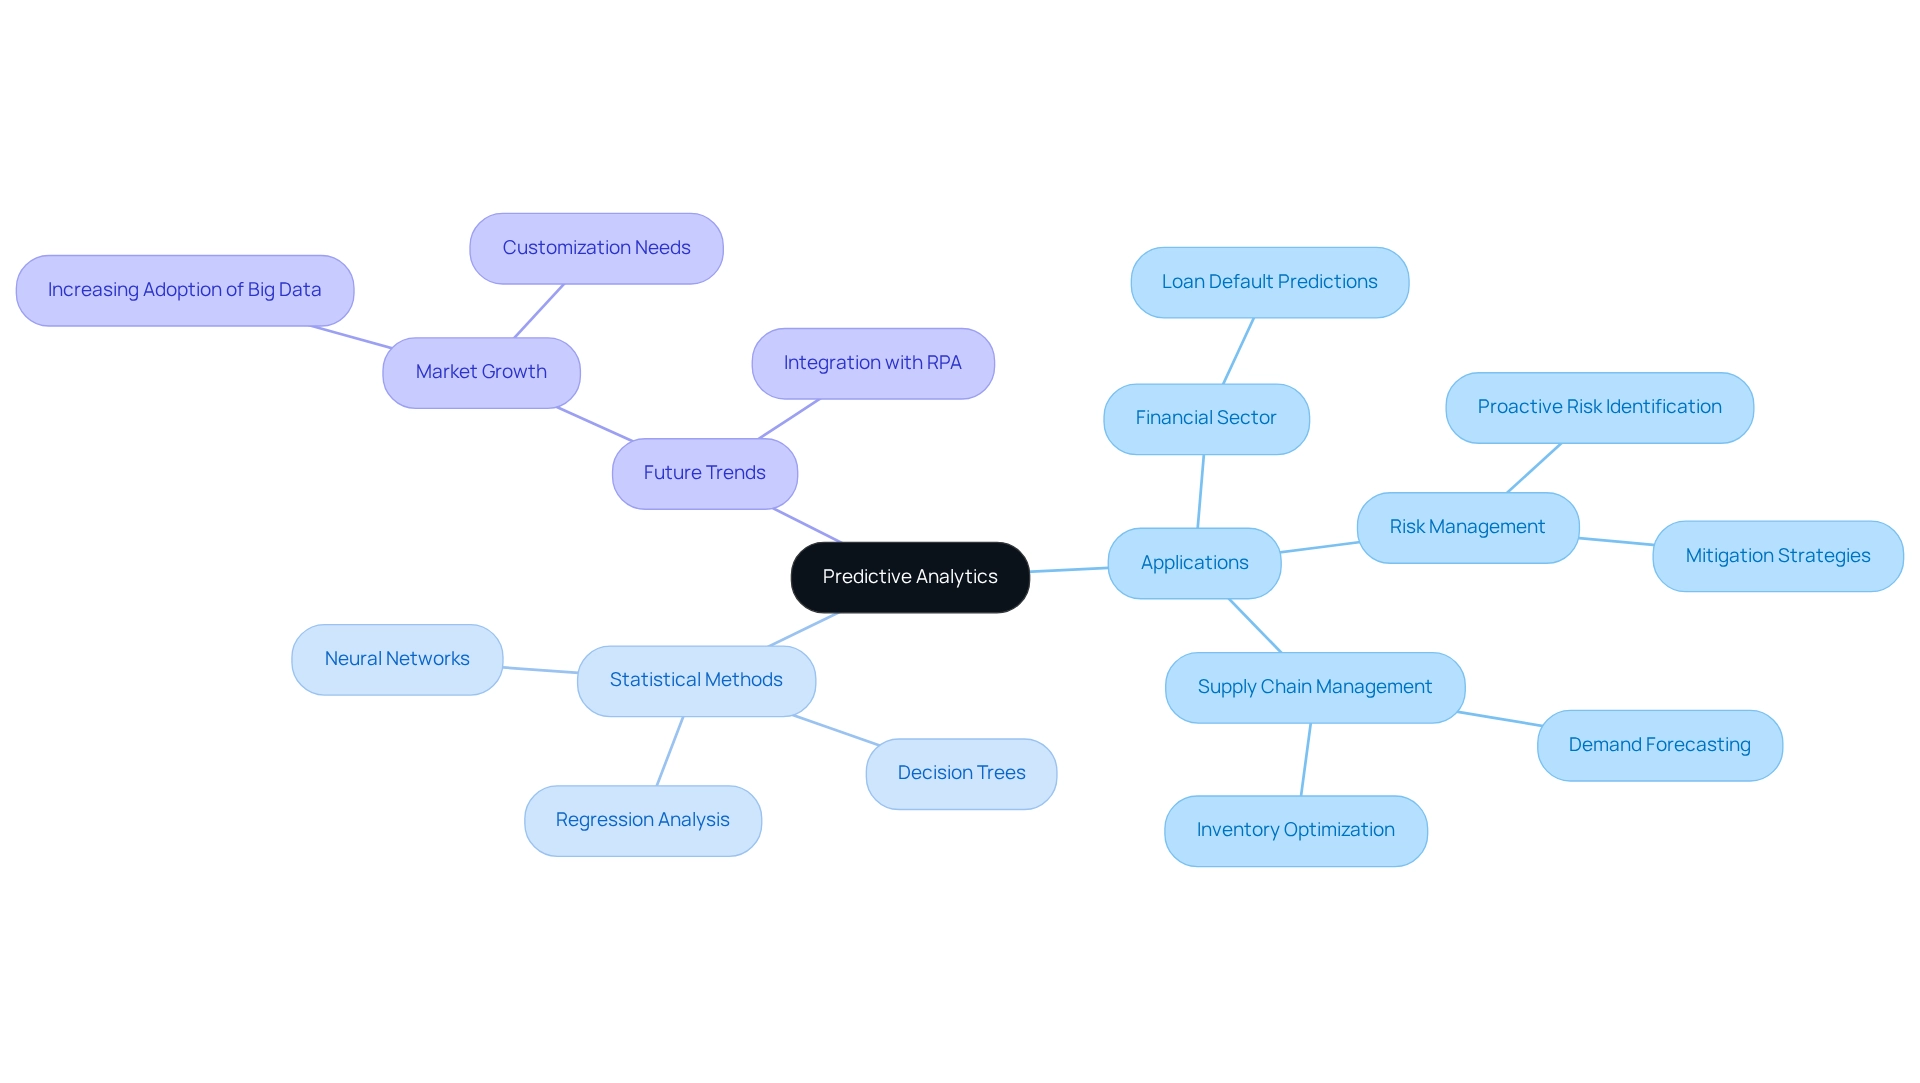
Predictive analysis harnesses historical information, statistical algorithms, and machine learning methods to forecast future results, playing a pivotal role in shaping business strategies. By meticulously examining patterns and trends from past data, organizations can make informed predictions about upcoming events. For example, financial institutions increasingly rely on predictive modeling to evaluate the likelihood of loan defaults, leveraging historical borrower behavior to refine decision-making processes.
By 2025, the adoption of predictive data analysis across various sectors has surged, with an impressive 76% of organizations integrating these technologies into their operations. This growth is primarily fueled by the escalating reliance on big data technologies and the demand for tailored solutions that tackle specific business challenges. The accuracy rates of predictive modeling systems have also improved significantly, with many organizations reporting precision levels exceeding 85% in their forecasts.
Expert insights underscore the importance of predictive analysis in risk management, where organizations can proactively identify potential risks and implement mitigation strategies. For instance, companies in the finance sector are utilizing predictive analysis to enhance their risk assessment frameworks, enabling them to navigate uncertainties more effectively.
Current trends indicate that predictive analysis is not only revolutionizing financial institutions but also extending its impact into supply chain management, empowering manufacturers to anticipate demand and optimize inventory levels. Organizations like Planet Fitness have recently partnered with Coherent Solutions to leverage advanced data analysis for enhancing customer insights, showcasing the flexibility of predictive modeling across diverse industries.
Common statistical algorithms employed in predictive modeling include:
- Regression analysis
- Decision trees
- Neural networks
Each contributing to the robustness of predictive models. As companies continue to embrace these technologies, the potential for predictive analysis to forecast future trends and shape strategic decision-making will only expand. As Coherent Solutions states, “Coherent Solutions is your reliable tech partner providing sophisticated information analysis services to reveal historical insights, patterns, and relationships that guide strategic decision-making.”
Moreover, the predictive insights market is expected to grow substantially, driven by increasing adoption of large-scale information technologies and customization needs, highlighting the dynamic nature of this sector. By integrating predictive insights with Robotic Process Automation (RPA) and customized AI solutions, enterprises can enhance their operational efficiency and make data-driven decisions that propel business growth.
Prescriptive Analytics: Guiding Decision-Making
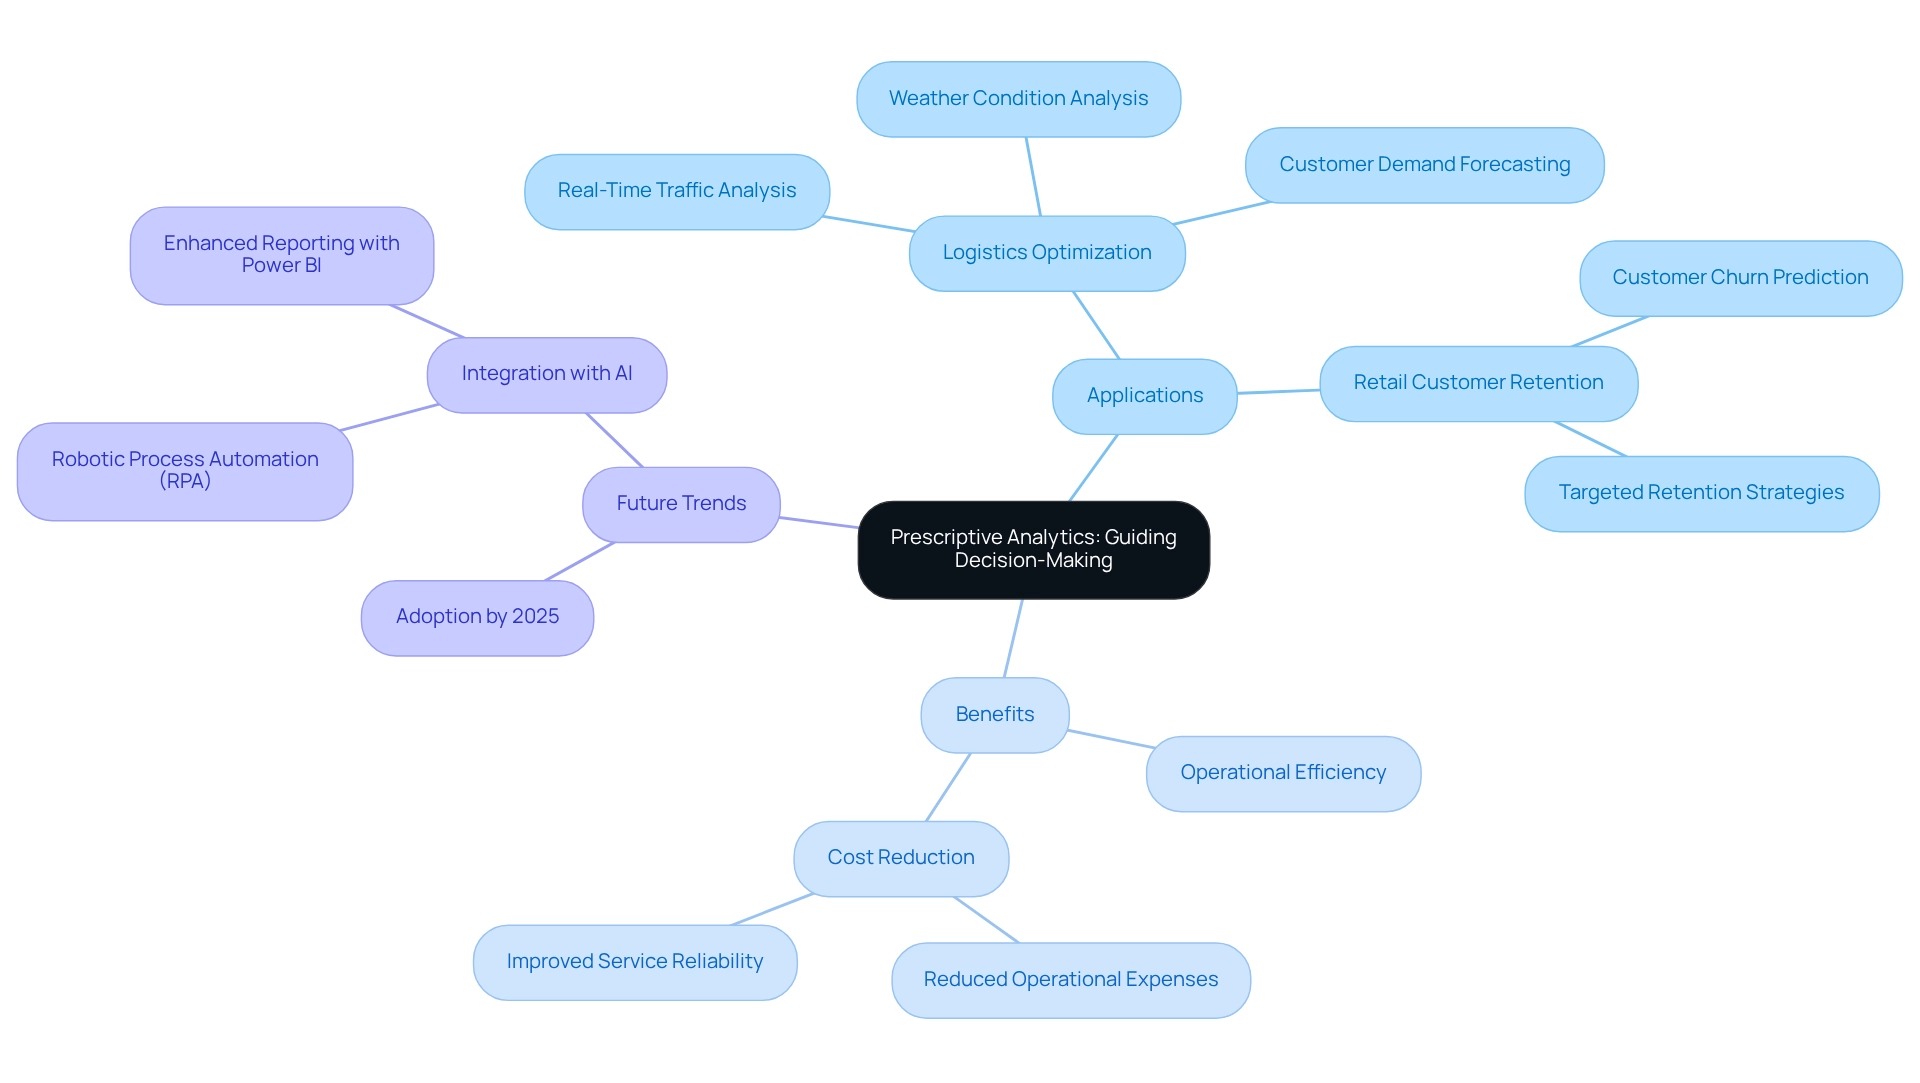
Prescriptive analysis represents the pinnacle of analytical capabilities, delivering actionable recommendations derived from comprehensive data examination. By leveraging insights from the three primary areas of analytics—descriptive, diagnostic, and predictive—organizations can identify the most effective courses of action. For example, in the logistics sector, prescriptive methods can optimize delivery routes by analyzing real-time traffic patterns, weather conditions, and customer demand.
This sophisticated analytical approach not only streamlines operations but also significantly enhances decision-making processes.
Looking ahead to 2025, the adoption of prescriptive data analysis in logistics is anticipated to increase. Studies indicate that firms utilizing these insights can reduce operational expenses by up to 15% while improving service reliability. This is particularly vital as businesses strive to maintain competitiveness in a data-driven environment. Additionally, organizations can track supplier performance and adjust procurement strategies through data analysis, further decreasing costs and enhancing service reliability.
Moreover, prescriptive data analysis empowers organizations to make informed decisions by providing tailored recommendations. For instance, it can propose inventory adjustments based on predictive models of customer behavior, ensuring that supply aligns with demand efficiently. A notable case study involves a retail company that successfully implemented prescriptive analytics to anticipate customer churn.
By identifying at-risk clients and recommending customized retention strategies, the firm significantly reduced churn rates, illustrating the tangible benefits of this analytical approach.
To enhance reporting and derive actionable insights, integrating Power BI services can be crucial. The 3-Day Power BI Sprint enables organizations to swiftly generate professionally designed reports, while the General Management App facilitates comprehensive management and intelligent reviews. Additionally, employing AI through Small Language Models and GenAI Workshops can improve information quality and provide practical training, ensuring that teams are equipped to effectively utilize these advanced insights.
Expert opinions underscore the necessity of integrating information science, domain expertise, and business acumen for the successful implementation of prescriptive insights. Davenport emphasizes that the effective execution and utilization of prescriptive analysis require this unique skill set. Continuous improvement of prescriptive models is essential, as maintaining information quality enhances their accuracy and relevance, ultimately driving operational efficiency and strategic decision-making in 2025 and beyond.
Furthermore, adopting Robotic Process Automation (RPA) can automate manual workflows, further boosting operational efficiency in an ever-evolving AI landscape, allowing teams to concentrate on more strategic, value-adding tasks.
Integrating Analytics for Operational Efficiency
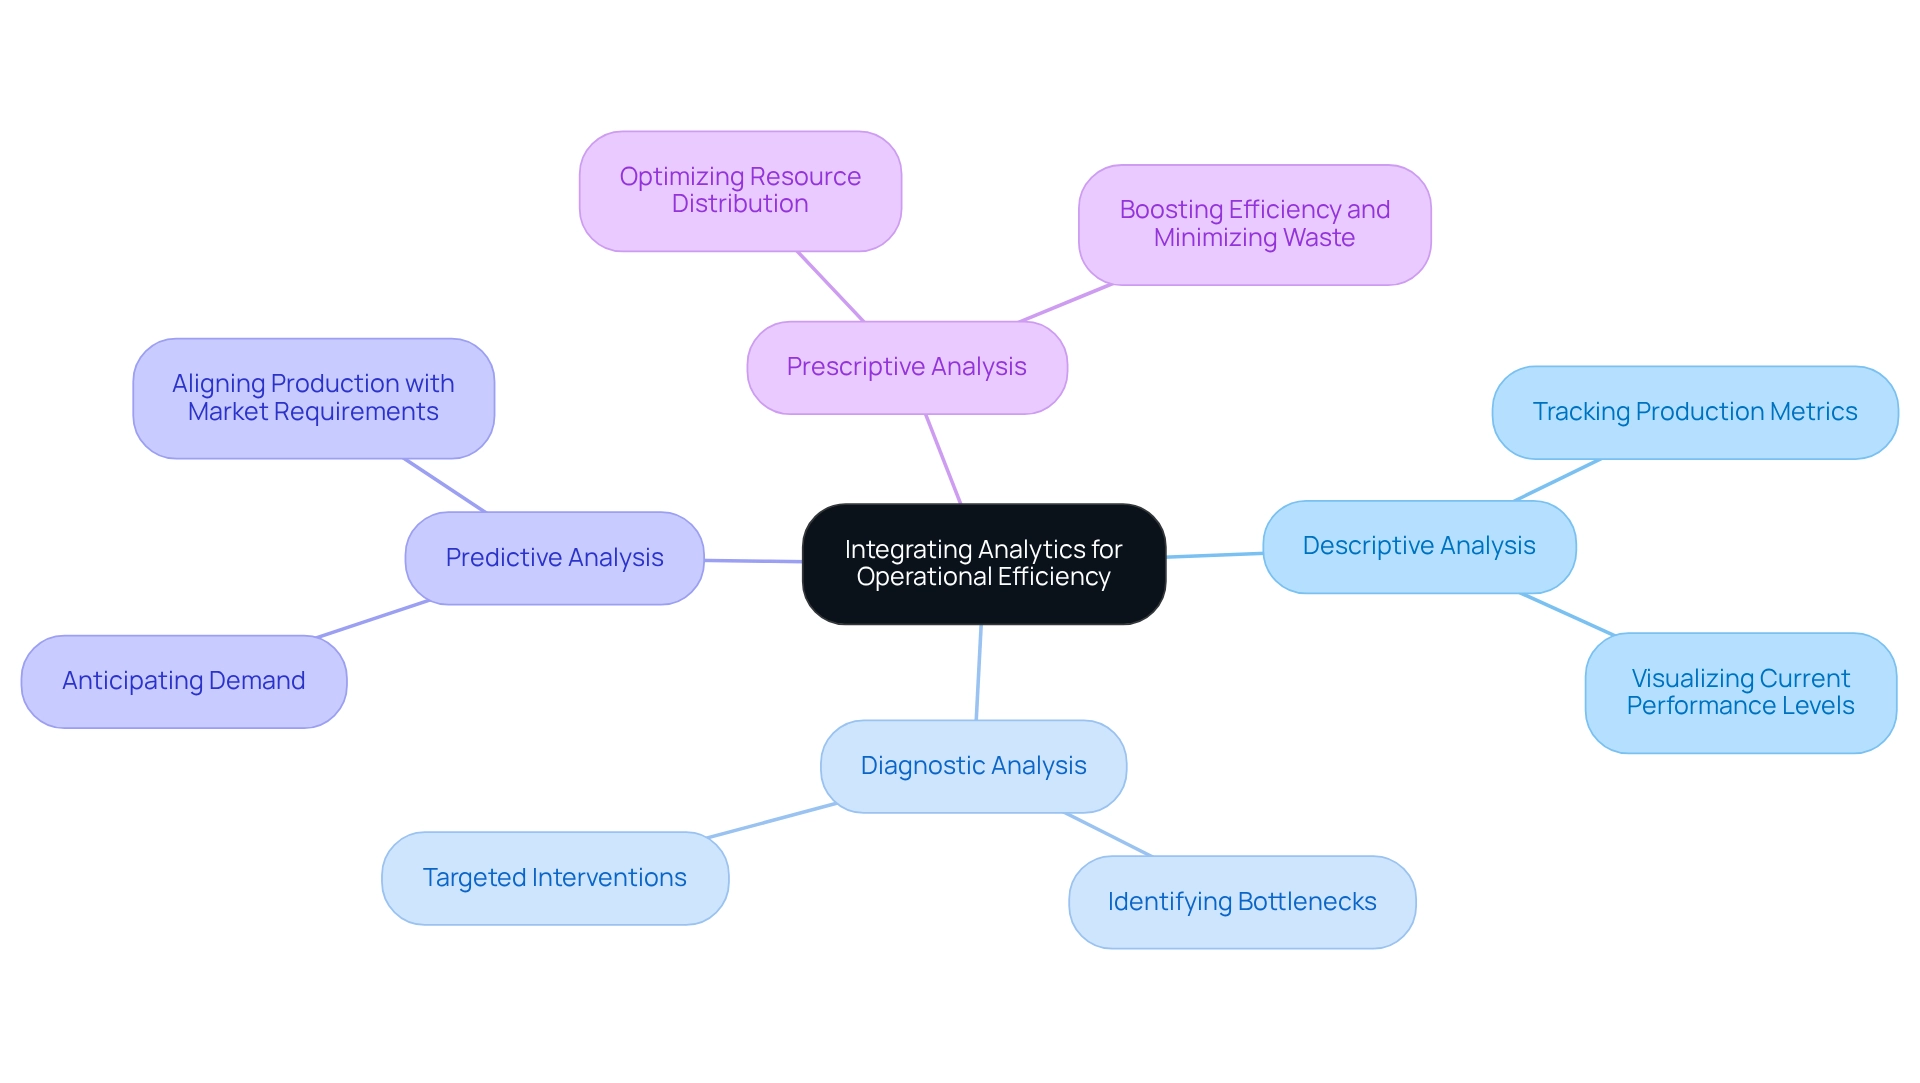
Integrating different types of analytics—descriptive, diagnostic, predictive, and prescriptive—forms the backbone of a comprehensive analytics framework. This prompts an essential question: what are the three primary areas of analytics that empower organizations to unlock deeper insights into their operations? This method not only aids in recognizing inefficiencies but also promotes the execution of evidence-based strategies that can significantly enhance operational effectiveness.
Consider a mid-sized company grappling with challenges such as manual information entry mistakes, slow software testing, and difficulties integrating outdated systems. By automating data entry, software testing, and legacy system integration through GUI automation, the company enhanced its operational efficiency. Utilizing descriptive analysis, it tracked production metrics, enabling visualization of current performance levels.
Employing diagnostic analysis allowed the identification of specific bottlenecks, leading to targeted interventions. Predictive analysis enabled the company to anticipate demand accurately, ensuring production aligned with market requirements. Ultimately, prescriptive analytics provided practical recommendations for optimizing resource distribution, effectively boosting efficiency and minimizing waste.
The combination of these analytics forms is increasingly crucial, especially as the number of Internet of Things (IoT) devices is projected to rise from 16 billion in 2023 to 20.3 billion by 2025, generating an impressive 79.4 zettabytes of data. This surge presents both opportunities and challenges for businesses, which must effectively manage and analyze the complex information generated to remain competitive. Organizations that adeptly navigate this information landscape will be better positioned to leverage insights for operational improvements.
However, a report indicates that 61% of employees perceive their organization’s information analysis approach as siloed, potentially leading to missed collaboration opportunities. Customized solutions, such as Robotic Process Automation (RPA), can help dismantle these barriers, ensuring information flows seamlessly between departments and enhancing overall efficiency.
Practical examples illustrate the success of a comprehensive analytical framework. Companies that have effectively integrated various forms of analysis report improved decision-making processes and enhanced operational efficiency. For instance, the aforementioned mid-sized firm reduced entry mistakes by 70%, accelerated testing procedures by 50%, and increased workflow productivity by 80% through automation.
Aligning data initiatives with broader objectives can mitigate the risk of failure—evident in studies showing that 70% of data projects do not achieve their intended outcomes due to misalignment. This alignment is vital for ensuring that analytical efforts contribute significant value to strategic goals.
In conclusion, incorporating diverse forms of analysis not only enhances operational efficiency but also fosters a culture of continuous improvement, enabling organizations to adapt swiftly to evolving market conditions and promote sustainable growth.
Leveraging Analytics for Business Intelligence
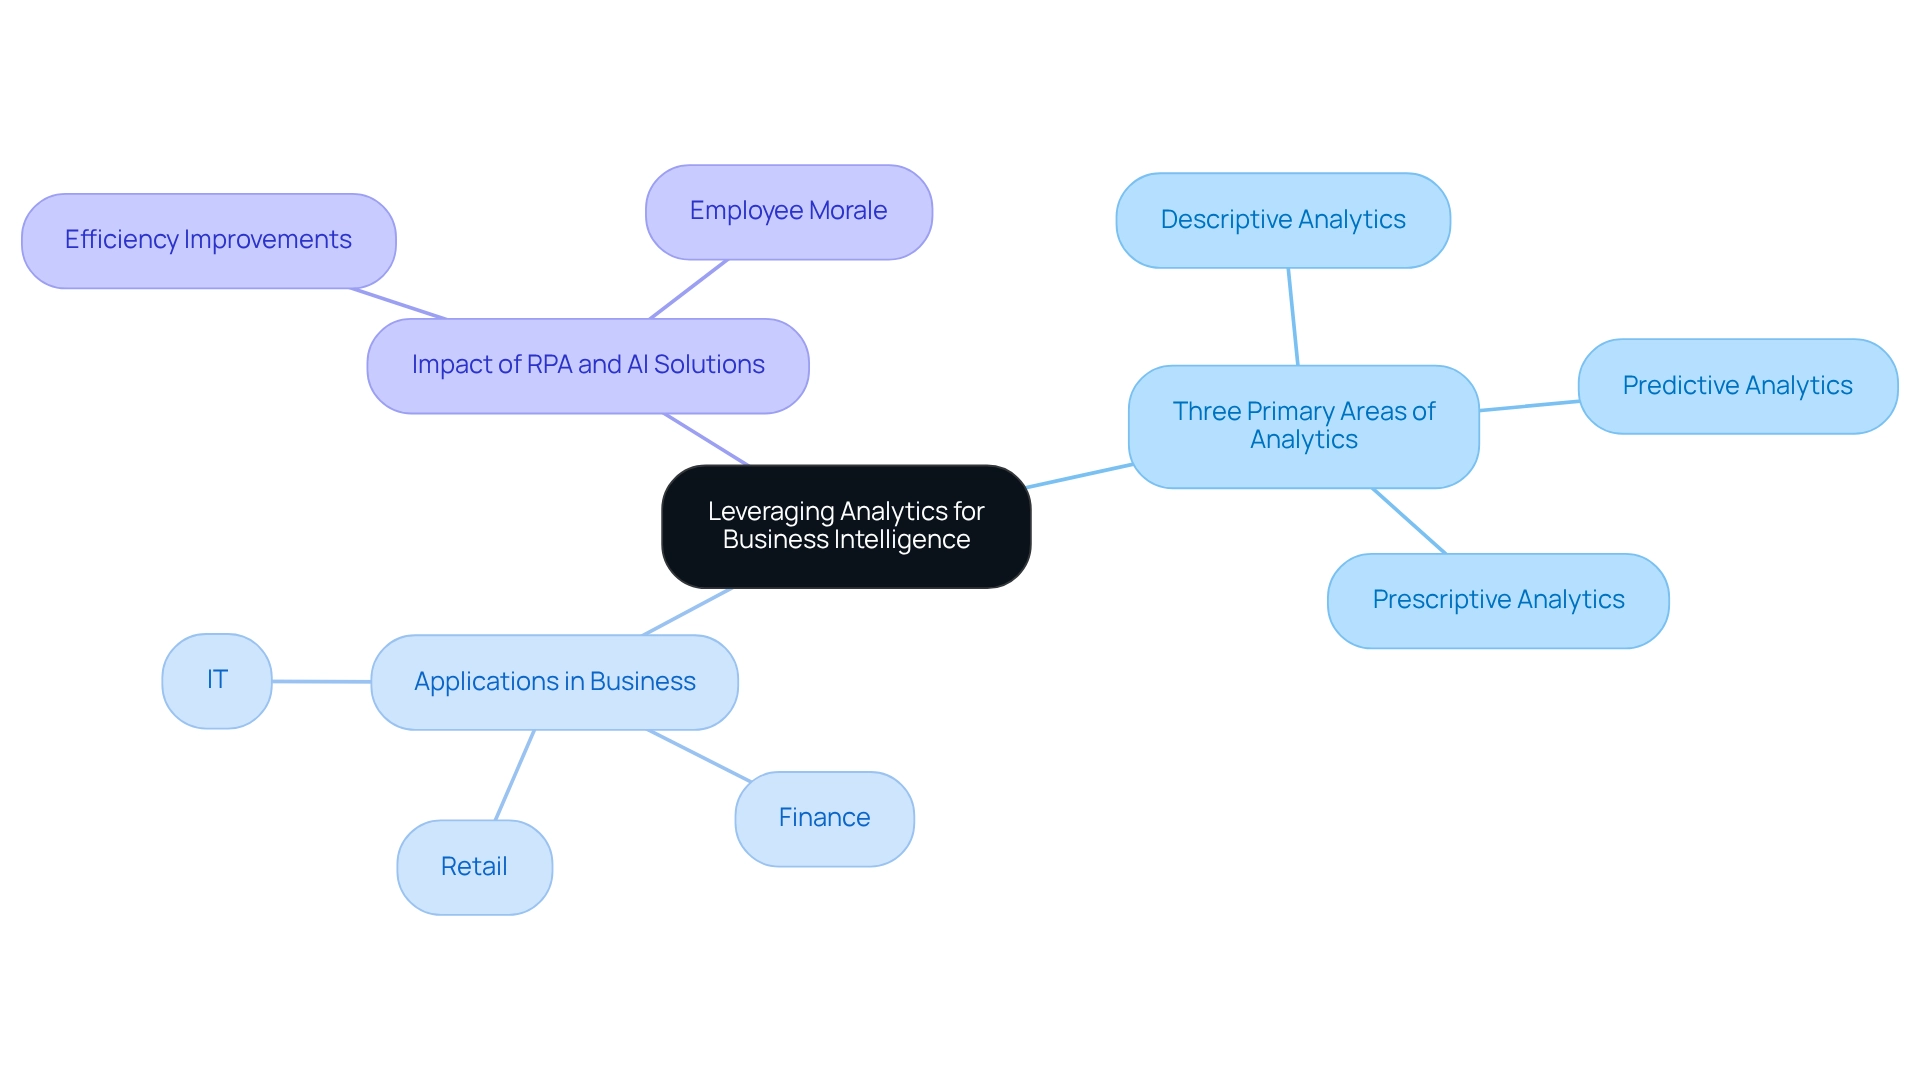
Analytics serves as a fundamental pillar of organizational intelligence (BI), offering essential insights that empower entities to understand the three primary areas of analytics and make informed choices. Data analysis enables businesses to reveal trends, evaluate performance, and direct strategic initiatives. For instance, retail chains utilize data analysis to scrutinize customer purchasing behaviors, directly influencing inventory management and marketing strategies.
This analytical approach not only enhances operational efficiency but also fosters a competitive advantage in the marketplace. It raises the question of what the three primary areas of analytics should be considered, especially with the integration of Robotic Process Automation (RPA) solutions like EMMA RPA and Microsoft Power Automate. These tools significantly enhance efficiency and employee morale by automating repetitive tasks. EMMA RPA specifically tackles task repetition fatigue, while Microsoft Power Automate alleviates staffing shortages, enabling organizations to concentrate on strategic initiatives.
Furthermore, edge computing plays a vital role in monitoring safety risks and enhancing project management, prompting further reflection on the three primary areas of analytics that can improve operational processes. As the demand for information engineers is expected to expand at an impressive rate of 50% each year, this highlights the significance of understanding the three primary areas of analytics in the sector. According to IBM, finance and insurance, professional services, and IT sectors represent 59% of job demand for science and analysis, emphasizing the importance of these analytics areas.
Organizations are increasingly embracing cloud-based BI solutions, such as the Power BI services provided by Creatum, which offer scalability and adaptability. A recent testimonial from Sascha Rudloff, Team Leader of IT and Process Management at PALFINGER Tail Lifts GMBH, emphasizes the transformative influence of Creatum’s Power BI Sprint. This solution not only provided a readily usable Power BI report but also accelerated their analysis strategy. This success narrative illustrates how sophisticated analysis and customized AI solutions, including Small Language Models and GenAI Workshops, can enhance information quality and address governance challenges in business reporting, ultimately improving decision-making.
As entities increasingly embrace sophisticated analysis, they become better equipped to react to market dynamics and promote sustainable growth. This aligns with the entity’s emphasis on implementing robotic process automation (RPA) and customized AI solutions. To explore how these solutions can benefit your company, book a free consultation today.
Overcoming Challenges in Analytics Implementation
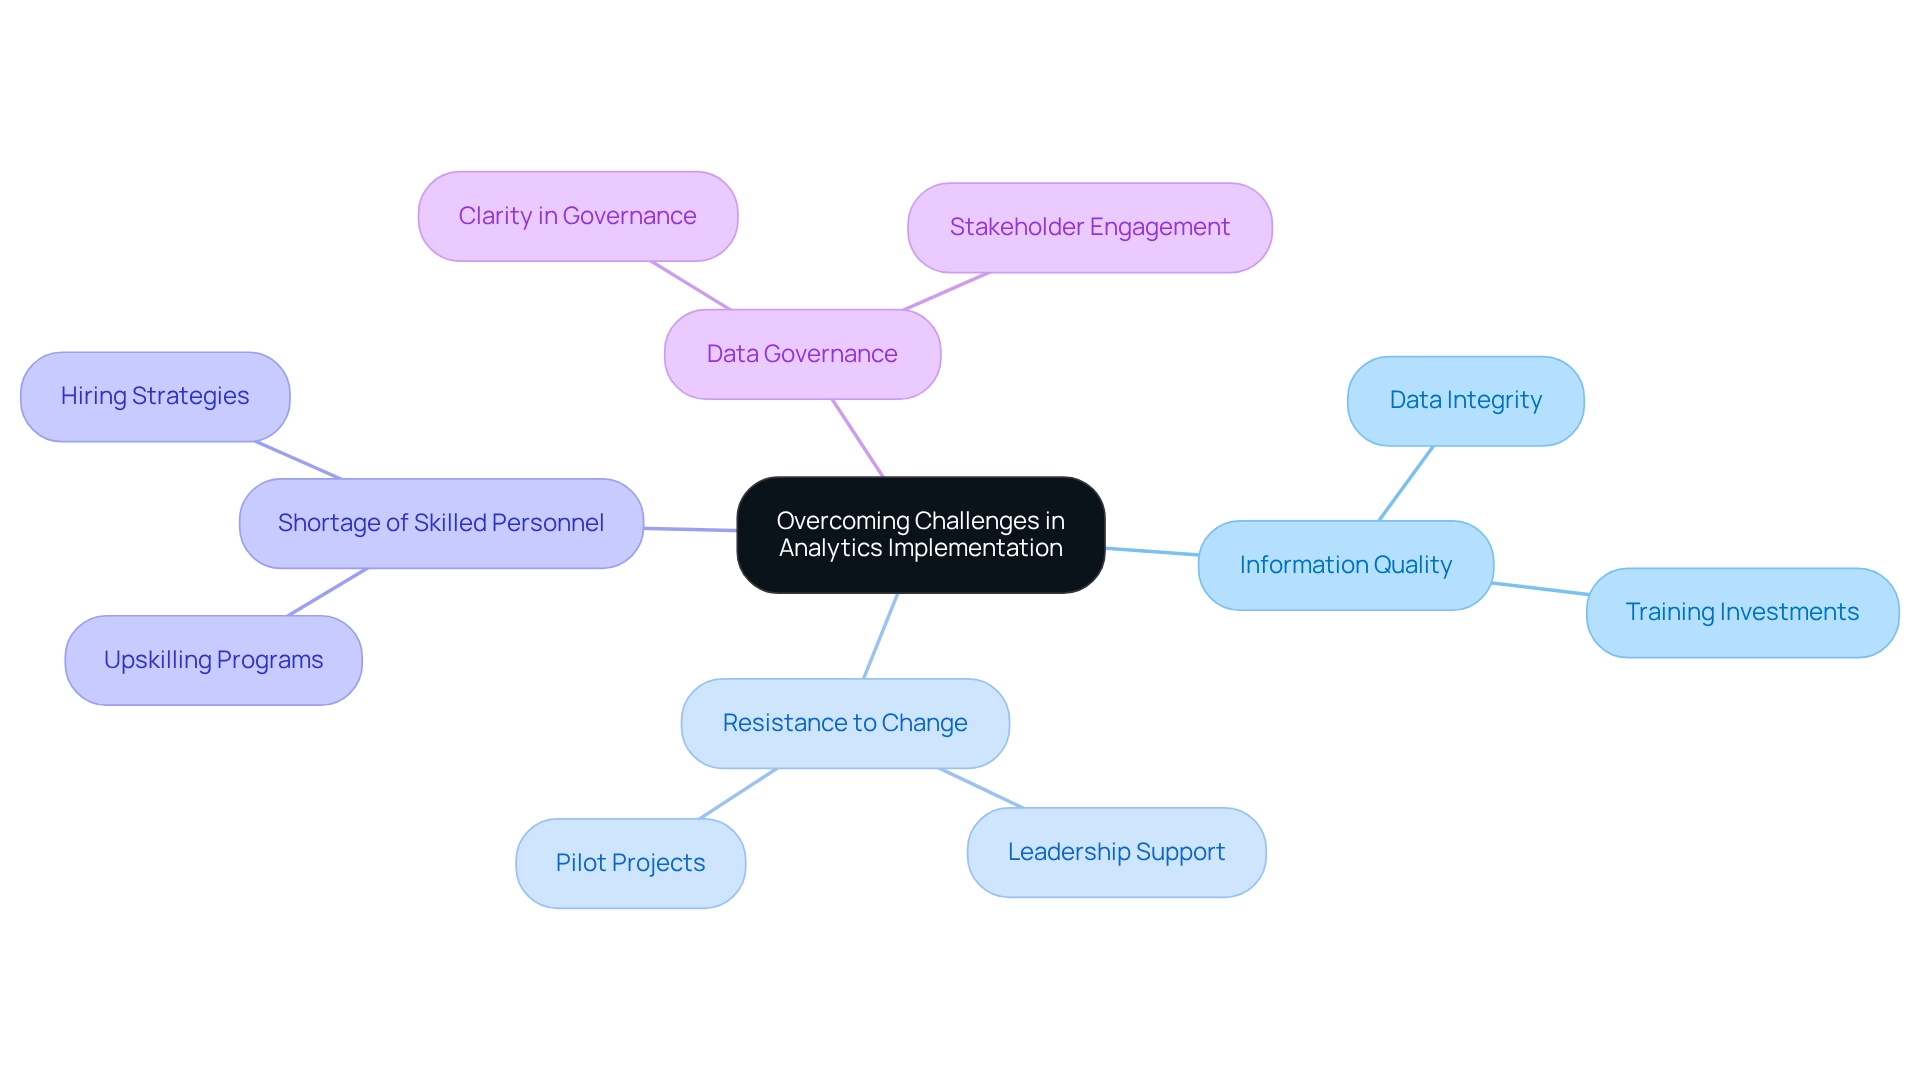
Integrating analysis within a company often encounters significant challenges, particularly concerning information quality, resistance to change, and a shortage of skilled personnel. As we approach 2025, the impact of information quality on analytics success is increasingly critical; disorganized information can undermine even the most well-intentioned AI implementation strategies. To overcome these challenges, organizations must foster a strong culture of data-driven decision-making.
This necessitates not only investing in training to bolster skills but also ensuring data integrity at every level of the organization. Leadership is pivotal in this transformation. By championing analytics adoption through pilot projects and highlighting success stories, leaders can effectively illustrate the tangible benefits of data-driven strategies. For instance, organizations that have successfully cultivated a data-driven culture often report enhanced operational efficiency and improved decision-making capabilities.
The integration of generative AI technologies, such as multi-agent AI systems and graphical neural networks, has the potential to revolutionize operational processes, offering practical applications that strengthen core competencies. Statistics reveal that by 2026, over three-quarters of businesses’ standard information architectures will incorporate streaming information and event processing, underscoring the urgency for organizations to adapt. However, many initiatives falter due to an internal focus that fails to deliver substantial value, as highlighted in recent discussions about the challenges surrounding information products. This reassessment of effectiveness calls for a renewed commitment to aligning data initiatives with broader business objectives.
As Amani Undru, a BI & Data Strategist at ThoughtSpot, observed, “In contrast, just 11% of planners feel they are ahead of the competition, emphasizing the urgency for them to take action.”
Common obstacles in data implementation include a lack of clarity in data governance and insufficient stakeholder engagement. By addressing these issues head-on and leveraging expert insights, organizations can overcome barriers and unlock the full potential of their analytics initiatives. The adoption of Robotic Process Automation (RPA) can streamline workflows, enhancing efficiency and minimizing errors, while customized AI solutions can assist organizations in identifying the right technologies that align with their specific business goals.
Ultimately, fostering a culture that prioritizes data-driven decision-making is essential for driving growth and innovation in today’s data-rich landscape. Tailored solutions that enhance information quality and facilitate AI implementation are crucial in this endeavor.
The Future of Analytics: Trends and Innovations
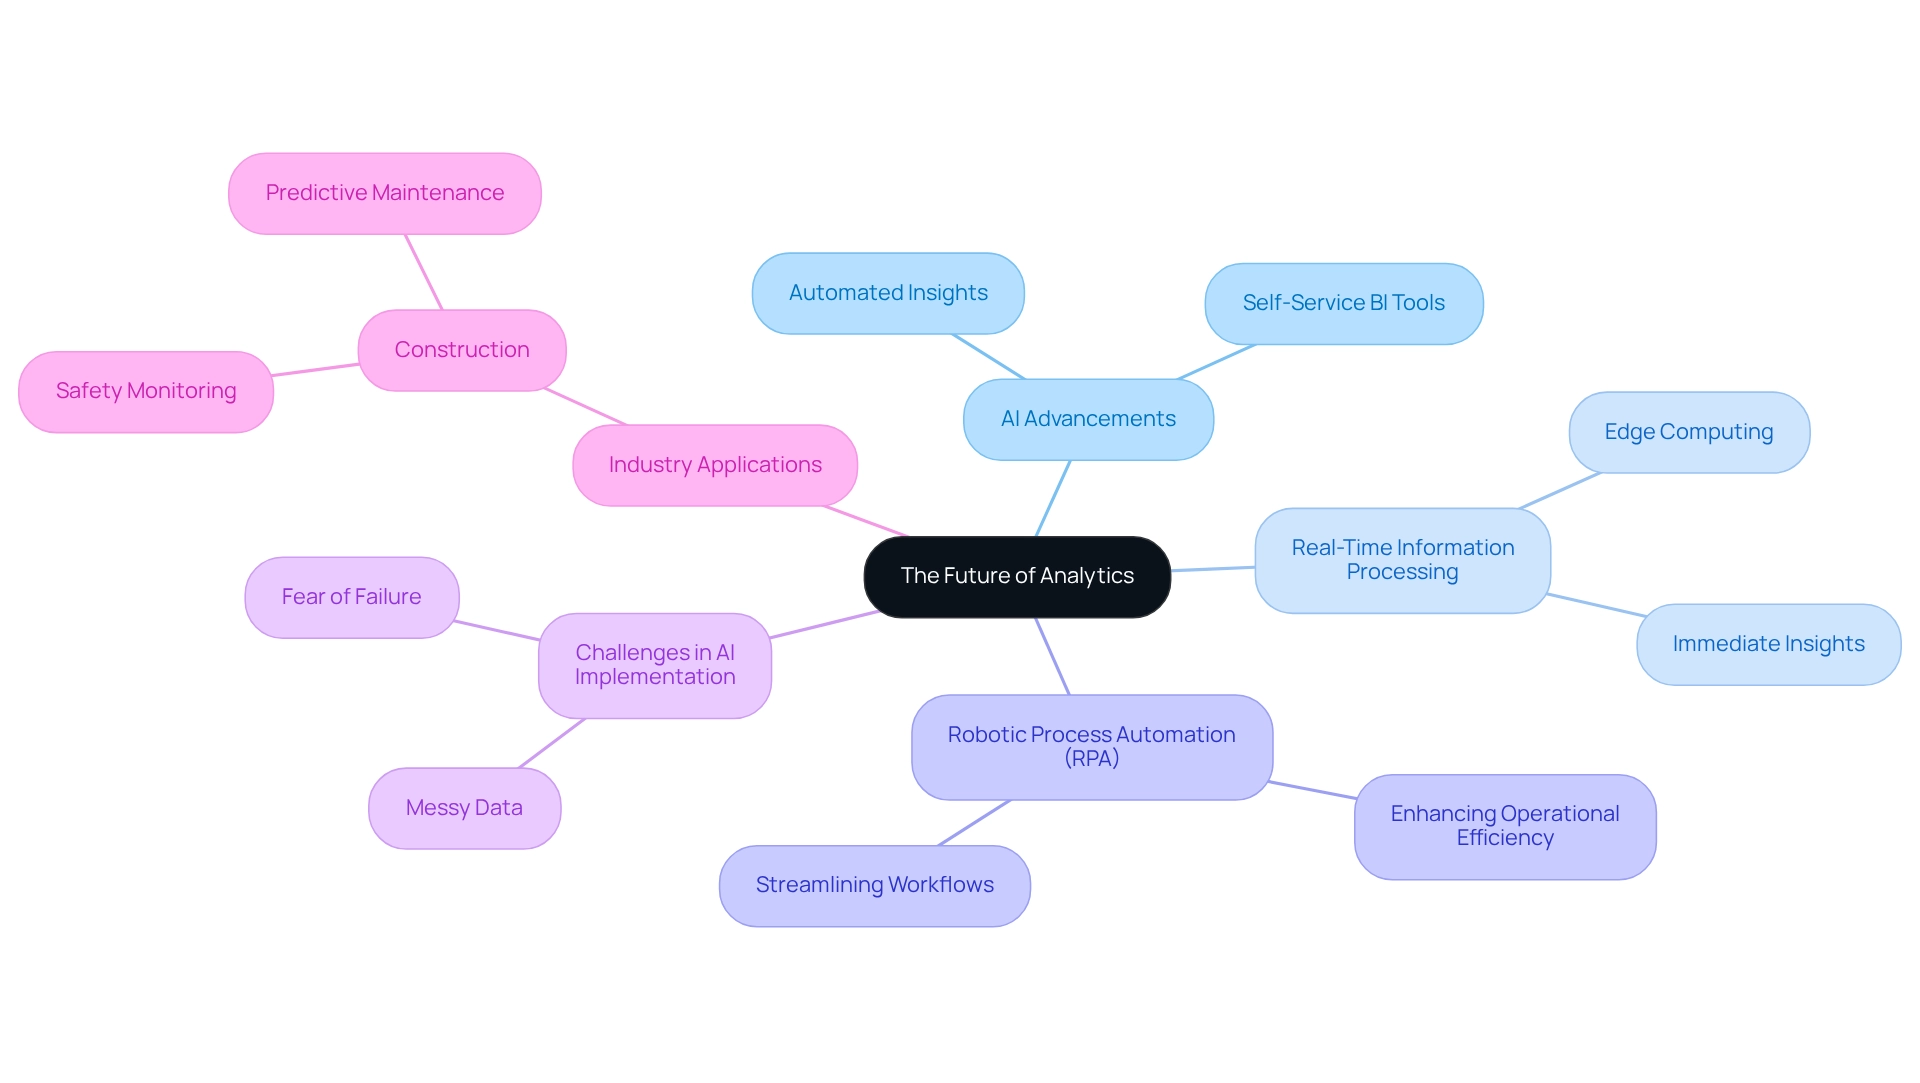
The terrain of analysis is on the verge of a significant transformation, primarily driven by advancements in artificial intelligence, machine learning, and large-scale information technologies. Key trends such as enhanced analysis and real-time information processing are emerging as crucial influences that will reshape how companies employ information. However, obstacles such as messy data and fear of failure can derail AI implementation plans, making it crucial for companies to tackle these challenges.
For instance, Robotic Process Automation (RPA) from Creatum GmbH can significantly streamline manual workflows, enhancing operational efficiency by reducing errors and freeing up teams for more strategic tasks. The incorporation of AI into data analysis tools is allowing companies to automate insights, greatly improving their decision-making abilities. As companies embrace these innovations, they can anticipate enhanced operational efficiency and a stronger competitive stance in their sectors.
In 2025, the influence of AI on data analysis will be significant, with a remarkable transition towards self-service business intelligence (BI) tools that streamline performance monitoring. This evolution is underscored by the fact that 48% of early adopters in the U.S. and Canada cite increased data-analyst efficiency as their primary motivation for embracing generative AI. Additionally, contemporary self-service BI tools enhance performance monitoring by elucidating the distinctions between KPIs and metrics, enabling entities to assess success more efficiently.
Real-time information processing will also play a vital role in forming the future of analysis, especially in industries that require immediate insights, such as construction. For example, edge computing enables the processing of user information close to its origin, facilitating quicker decision-making and improving project management through better safety oversight and predictive maintenance.
As organizations keep utilizing augmented analytics for innovation, they will not only improve their information quality but also ease the complexities related to AI implementation. By embracing these emerging trends, including tailored AI solutions and RPA from Creatum GmbH, businesses can transform raw data into actionable insights, driving growth and fostering a culture of informed decision-making. To see how these technologies can be applied in real-world scenarios, explore our case studies that highlight successful implementations.
Conclusion
Integrating various forms of analytics—descriptive, diagnostic, predictive, and prescriptive—profoundly enhances operational efficiency and fosters a culture of continuous improvement within organizations. Leveraging these diverse analytical approaches enables businesses to identify inefficiencies and implement data-driven strategies that propel growth and innovation. As organizations increasingly adopt self-service BI tools and embrace AI technologies, the transformation of raw data into actionable insights becomes more accessible, allowing teams to make informed decisions swiftly.
Moreover, the importance of cultivating a data-driven culture cannot be overstated. Leadership plays a critical role in championing analytics adoption, ensuring that data integrity and quality are prioritized across all levels. By addressing common challenges—such as data governance and stakeholder engagement—organizations can unlock the full potential of their analytics initiatives. This enables them to navigate the complexities of a rapidly evolving data landscape and remain competitive.
Looking ahead, the future of analytics is poised for significant advancements driven by innovations in AI and machine learning. The emergence of augmented analytics and real-time data processing will redefine how organizations utilize data, enhancing decision-making capabilities and operational efficiency. By embracing these trends and leveraging tailored solutions, businesses can improve their analytics frameworks and drive sustainable growth in an increasingly data-centric world. In this evolving landscape, the ability to harness analytics effectively will be a key differentiator for organizations aiming to thrive in the years to come.
Frequently Asked Questions
What is analytics and why is it important for organizations?
Analytics involves the systematic examination of information and statistics, helping organizations navigate complex data landscapes. It is crucial for informed decision-making, enhancing operational efficiency, driving innovation, and achieving strategic goals.
What are the current trends in data analysis for businesses?
There is a significant shift towards self-service business intelligence tools that simplify performance tracking. Additionally, the integration of Robotic Process Automation (RPA) helps automate manual workflows, allowing teams to focus on strategic tasks.
How does data analysis impact operational efficiency?
Data analysis improves operational efficiency by identifying patterns and trends, which helps organizations make informed decisions. Case studies show that companies using AI in data analytics gain a competitive edge, with potential productivity increases predicted by experts.
What role does descriptive analysis play in business decision-making?
Descriptive analysis interprets historical data to summarize past occurrences and provide actionable insights. It uses metrics and visual representations to help organizations understand trends, such as sales patterns, which can inform inventory management and marketing strategies.
What are the key metrics used in descriptive analysis?
Common metrics in descriptive analysis include key performance indicators (KPIs) such as sales volume, customer retention rates, and inventory turnover.
How has the adoption of analytics dashboards impacted firms?
The use of analytics dashboards has surged by over 45% among leading firms, providing a centralized platform for data visualization that streamlines decision-making and enhances oversight of market dynamics.
What is diagnostic analysis and how does it differ from descriptive analysis?
Diagnostic analysis goes beyond descriptive analysis by exploring the reasons behind past results. It employs techniques like information mining and correlation analysis to answer questions about performance issues, such as declines in sales.
What benefits can organizations gain from diagnostic analysis?
Organizations can potentially boost revenue by up to 20% in marketing and sales processes through diagnostic analysis. It helps identify common factors leading to performance issues, allowing targeted strategies to be implemented.
Can you provide an example of how diagnostic analysis has improved efficiency?
A mid-sized firm improved efficiency by adopting GUI automation to address manual entry errors and sluggish processes, resulting in a 70% reduction in data entry errors and a 50% acceleration in testing processes.
What is the future significance of data analysis in business?
As data continues to grow, the importance of data analysis will increase, enabling organizations to extract meaningful insights and maintain a competitive edge. The integration of RPA will further streamline processes, allowing a focus on strategic initiatives.
Overview
This article delves into best practices for effectively handling null values in DAX. Understanding and managing ‘BLANK’ entries is crucial for ensuring accurate data analysis. Essential DAX functions such as ISBLANK and COALESCE are detailed to provide clarity on their application. Additionally, strategic approaches like proactive checks and effective visualization methods are discussed, collectively enhancing data quality and informing decision-making processes.
Introduction
In the realm of data analysis, managing null values is a critical yet often overlooked aspect that can significantly influence the integrity and accuracy of insights derived from datasets. Represented as ‘BLANK’ in DAX, these null values demand careful handling to avoid pitfalls that distort calculations and mislead decision-makers. As organizations increasingly rely on data-driven strategies, understanding the nuances of null values becomes essential for data professionals aiming to enhance their analytical capabilities.
This article delves into the complexities surrounding null values in DAX, exploring best practices, key functions, and advanced techniques that empower analysts to effectively manage these challenges. By mastering these concepts, professionals can ensure their analyses remain robust and reliable. Ultimately, this drives informed decision-making and fosters growth in today’s competitive landscape.
Understanding Null Values in DAX: A Primer
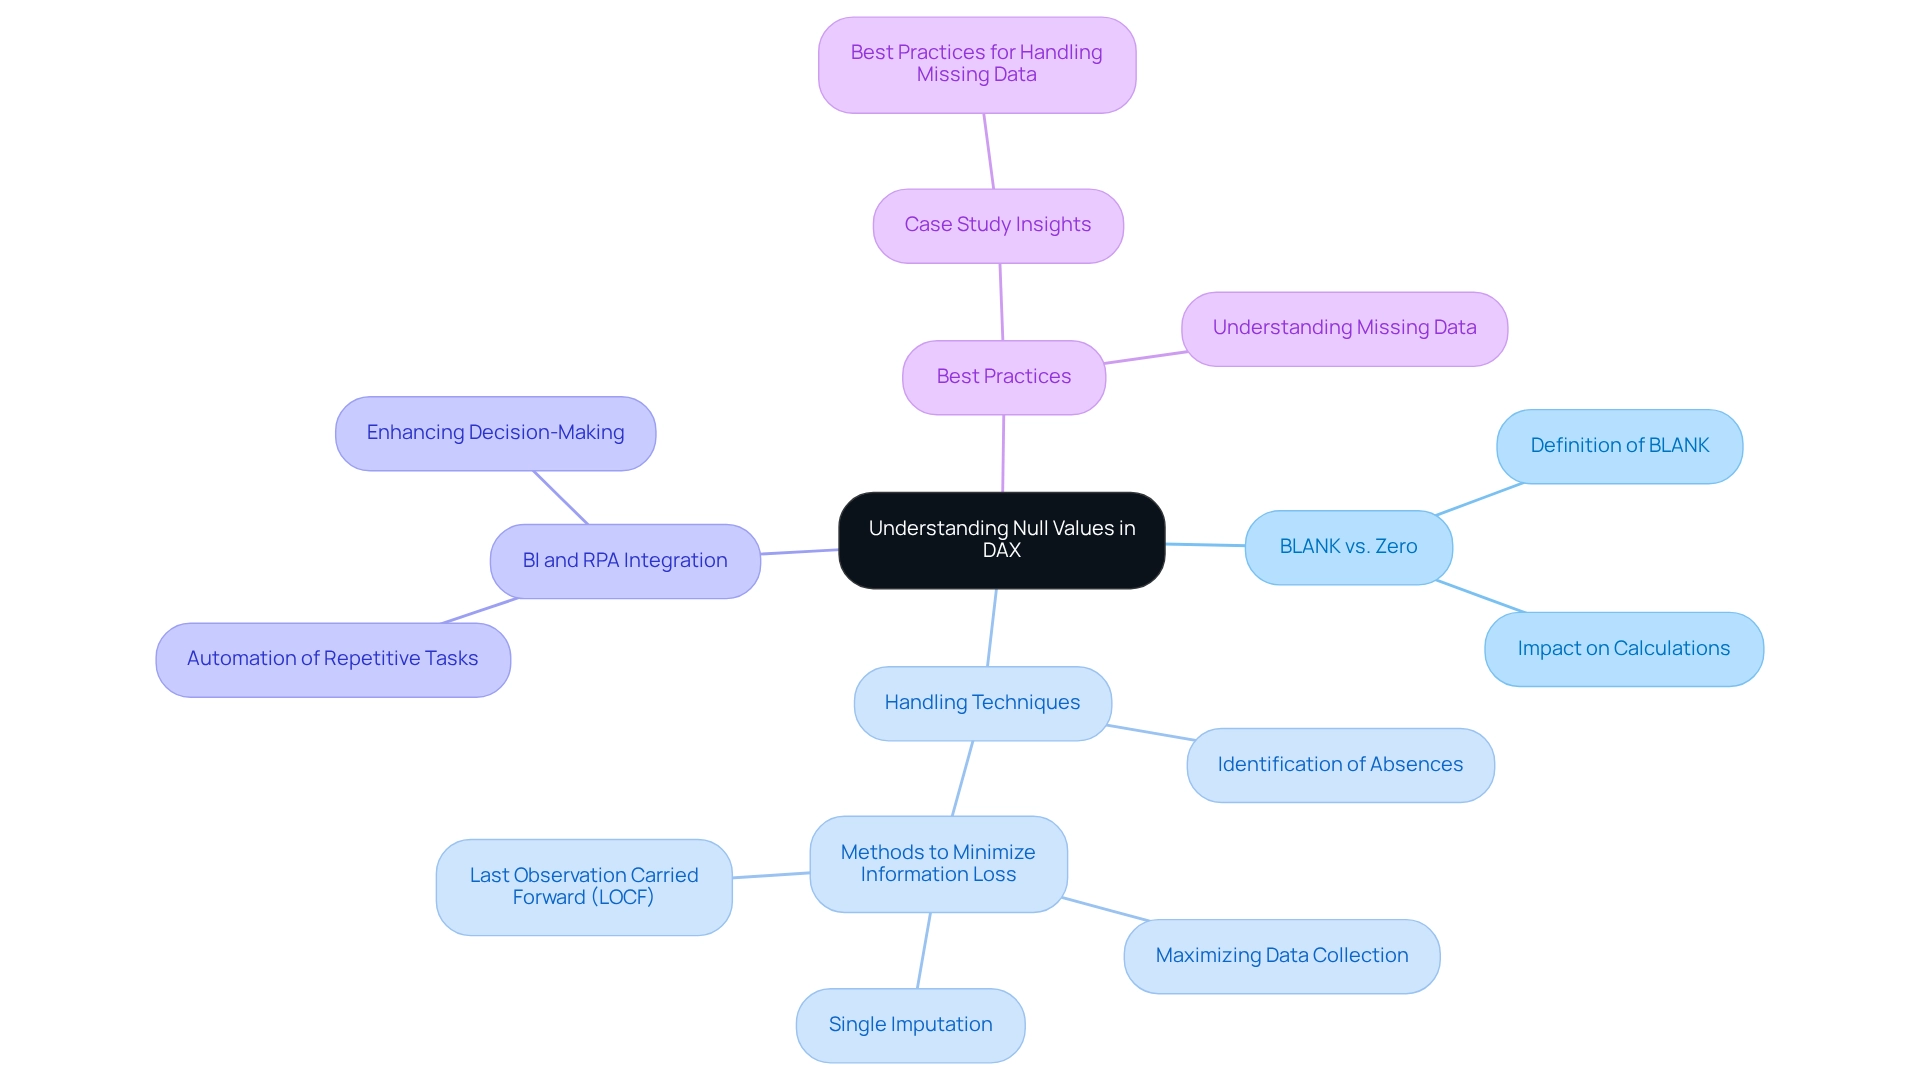
In DAX, null entries are represented as ‘BLANK,’ a crucial distinction that significantly influences analysis. DAX treats BLANK distinctly compared to other data types, making it imperative for data professionals to grasp how these elements are interpreted. Mismanagement of BLANK principles can lead to unexpected outcomes in calculations, underscoring the importance of appropriate handling techniques.
Familiarity with the concept of BLANK is essential to avoid common pitfalls in analyses. Moreover, understanding the difference between an empty entry and a zero is vital, as they convey different meanings within information contexts. A null signifies the absence of information, while zero represents a numeric value that can affect calculations and aggregations in unique ways. Recognizing these distinctions ensures that evaluations are accurate and reliable, ultimately enhancing the quality of insights derived from information.
In today’s information-rich environment, leveraging Business Intelligence tools can help organizations tackle challenges related to poor master information quality and barriers to AI adoption. By implementing RPA solutions, companies can automate repetitive tasks, thereby increasing efficiency and allowing professionals to focus on extracting actionable insights from their evaluations. This synergy between BI and RPA not only drives operational efficiency but also supports informed decision-making that promotes growth and innovation.
According to a case study titled ‘Best Practices for Handling Missing Information,’ it is crucial to identify the type of absence and select appropriate handling methods to minimize information loss. This understanding is vital, as mishandling absent information can significantly reduce the effectiveness of evaluations, particularly in trials. Recent discussions emphasize that maximizing information collection during study design is the best approach to address absent values, as single imputation and Last Observation Carried Forward (LOCF) methods may introduce bias.
As Nasima Tamboli, a Freelance Software Engineer and Data Science Enthusiast, notes, “Consider the potential biases and implications of the selected method on your evaluation.” This perspective highlights the importance of understanding principles related to null in DAX and the broader implications of absent information in data evaluation, especially when supported by robust BI and RPA frameworks.
Common Challenges with Null Values in Data Analysis
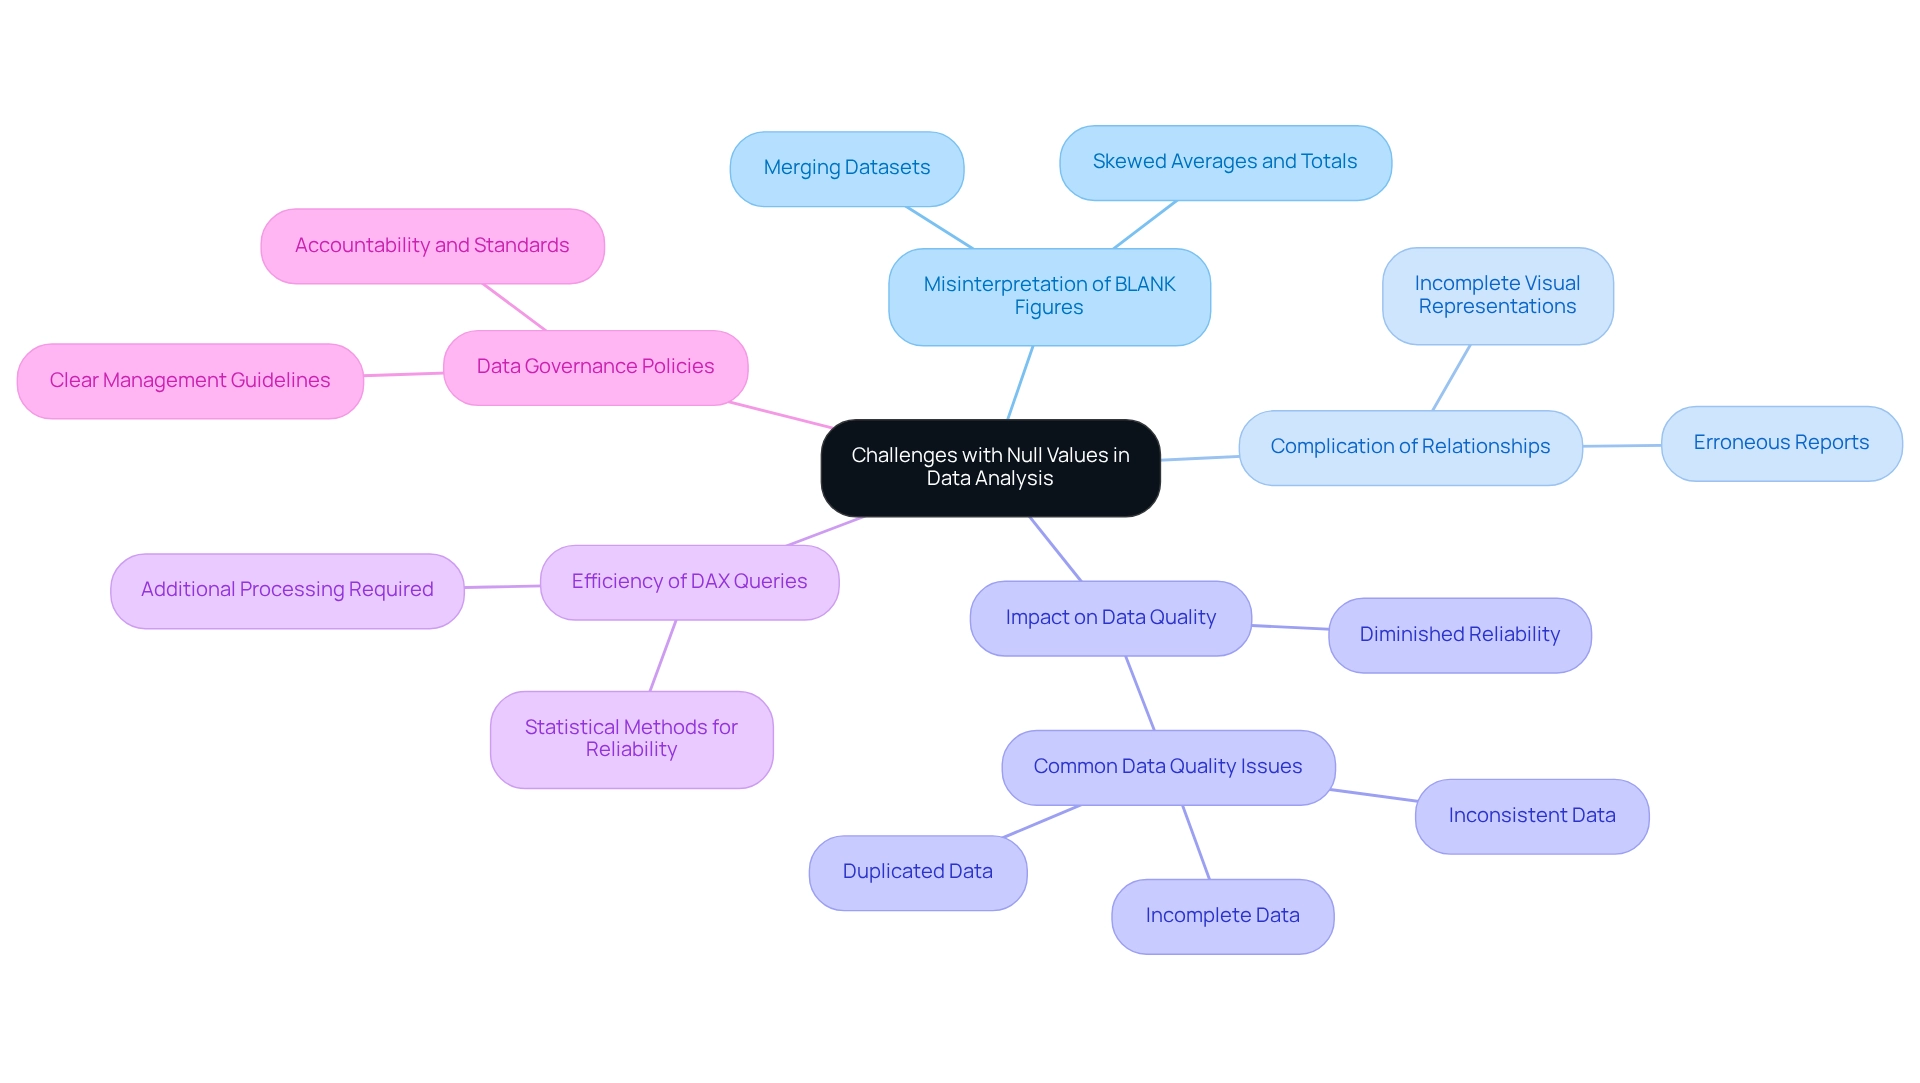
Data experts frequently encounter significant challenges when managing null values in DAX entries during their analyses. A common issue is the misinterpretation of BLANK figures during calculations, which can lead to distorted results. For instance, merging datasets that contain BLANK entries can produce misleading averages or totals, ultimately skewing insights.
Moreover, absent entries complicate relationships among data, particularly in models where certain fields are expected to contain information. This complexity can result in incomplete visual representations and erroneous reports, undermining the reliability of the analysis.
The implications of missing entries extend beyond mere misinterpretation; they can also adversely affect the precision of data. Statistics indicate that a considerable percentage of information professionals report difficulties associated with null values in DAX, with many noting that these challenges diminish the quality and reliability of data. This concern is especially critical in an information-rich environment where organizations rely on Business Intelligence (BI) to transform raw data into actionable insights that drive growth and innovation.
Employing robust statistical methods can enhance the reliability of results, making it imperative for professionals to address these challenges effectively. Furthermore, the presence of missing entries can impede the efficiency of DAX queries, necessitating additional processing to manage these situations.
As Diego Vallarino, PhD, aptly notes, ‘Comprehending entropy is crucial for revealing the potential of information assessment,’ underscoring the importance of grasping the complexities introduced by absent elements. Organizations that have established clear information governance policies have successfully navigated these challenges. By defining how data should be managed and ensuring adherence to standards, they have improved their handling of null values in DAX, leading to more accurate and reliable analyses.
This enhancement is essential for leveraging RPA solutions, such as EMMA RPA and Power Automate, which aim to automate repetitive tasks and boost operational efficiency.
For example, implementing these guidelines has empowered organizations to directly confront prevalent quality issues, such as incomplete and inconsistent data, which obstruct successful AI adoption. Understanding these challenges is crucial for professionals striving to implement effective solutions and elevate the overall quality of their data-driven insights. Additionally, clarity in reporting how absent data was managed is vital for building trust in findings and comprehending the methodologies behind results.
Creatum GmbH recognizes that difficulties in extracting valuable insights can position companies at a competitive disadvantage, making it essential to address these quality challenges.
Key DAX Functions for Identifying Null Values
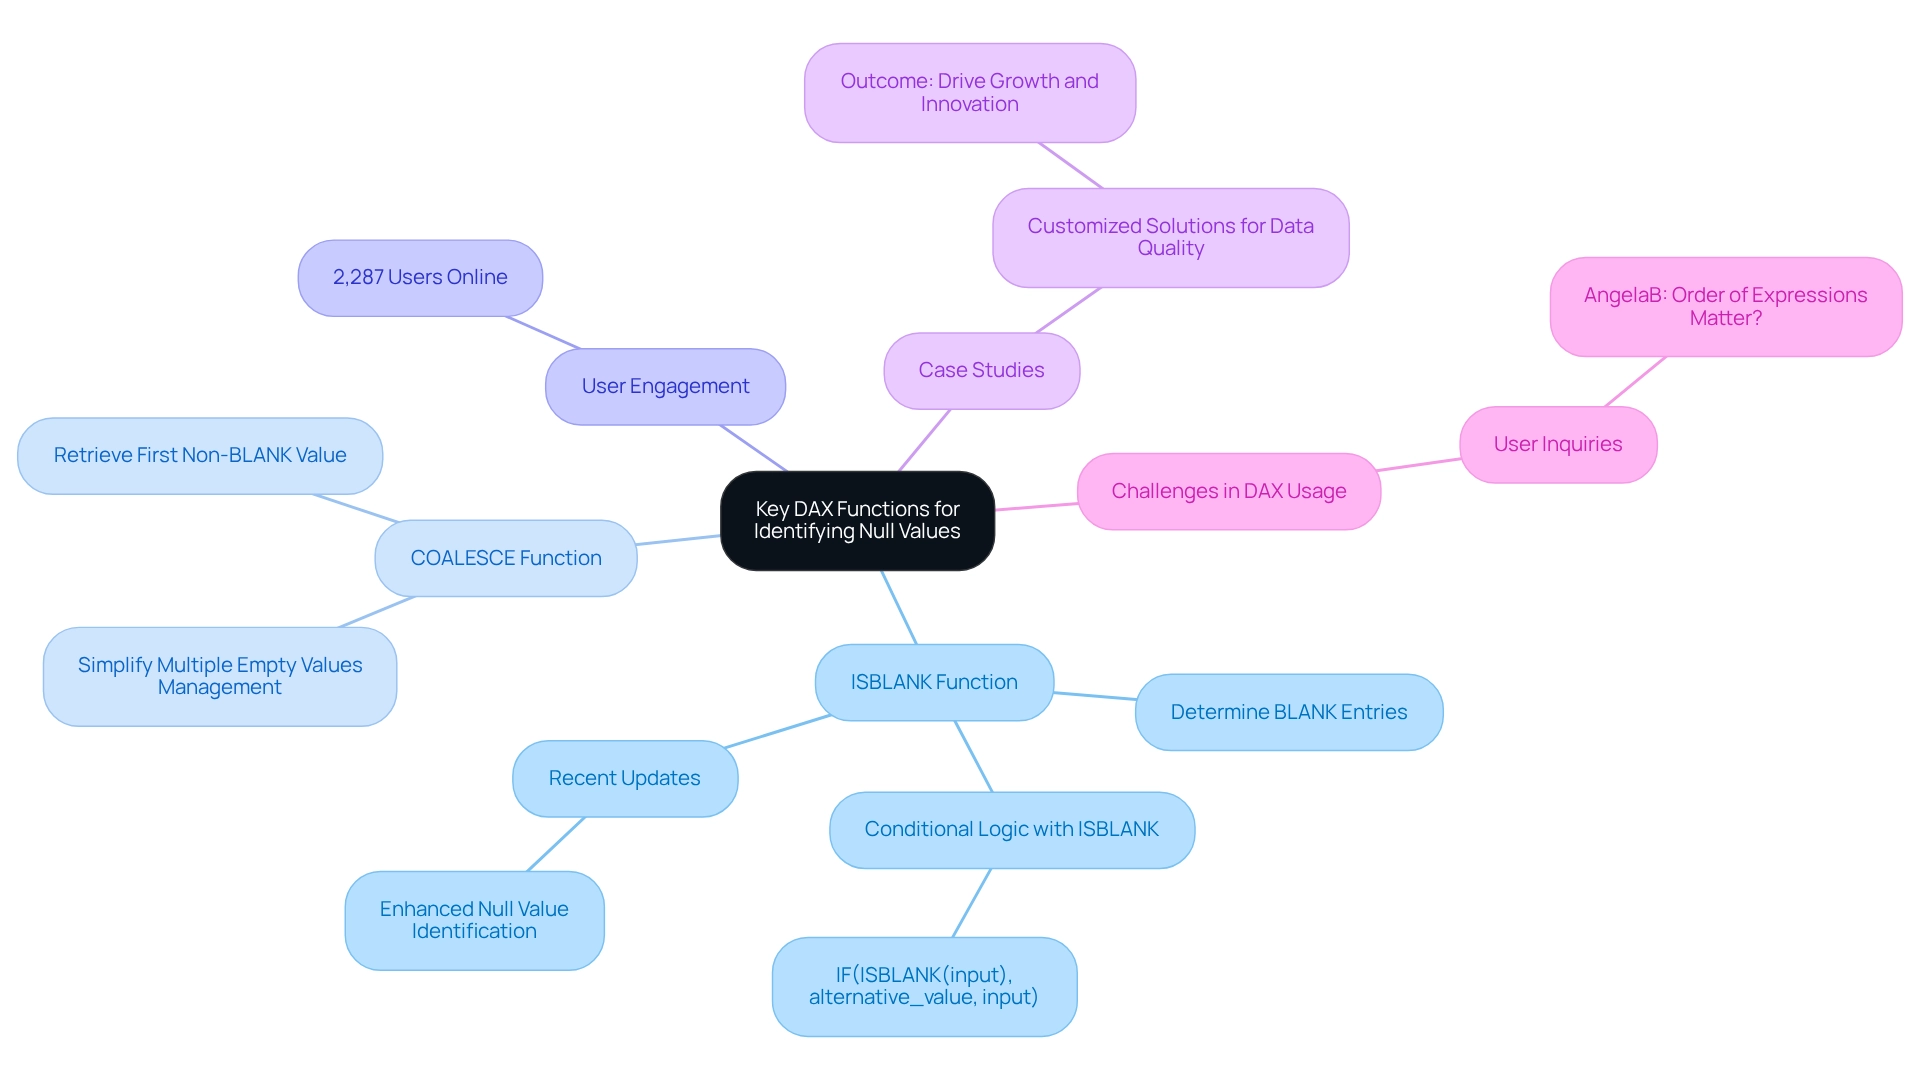
DAX functions play a crucial role in efficiently identifying and addressing missing entries, or null values, within datasets—an essential aspect of enhancing data quality, particularly in Business Intelligence and RPA implementation at Creatum GmbH. The ISBLANK function serves as a fundamental tool, enabling users to determine if an entry is BLANK, returning TRUE or FALSE as needed. This function proves especially useful in conditional statements, facilitating the removal or substitution of empty entries in calculations.
For example, a common application involves using IF in conjunction with ISBLANK to formulate more intricate logic for managing empty values. A typical structure is IF(ISBLANK(input), alternative_value, input), which provides a default option when an empty entry is encountered, ensuring that computations remain robust and meaningful.
In addition to ISBLANK, the COALESCE function is invaluable for retrieving the first non-BLANK value from a list of arguments. This function simplifies the management of multiple potential empty values in calculations, streamlining the process and enhancing information quality. The effectiveness of these functions is underscored by their extensive usage; statistics reveal that 2,287 users are currently online in the Fabric community, actively employing these DAX functions to improve their information handling practices.
Moreover, recent discussions within the community underscore the importance of grasping the nuances of these functions, particularly the recent updates to the ISBLANK function that augment its capability in identifying null values in DAX. As Angela, a frequent visitor, noted, “Thank you for continuing to help with this. I tried that edit but same result, it’s returning all as ‘null’. Does the order of expressions matter?” This inquiry reflects the real-world challenges users encounter when navigating DAX functions. Case studies illustrate how organizations, including Creatum GmbH, have successfully leveraged the ISBLANK function to enhance information quality, ultimately driving growth and innovation.
By mastering these DAX functions, analytics professionals can significantly elevate their analytical capabilities and ensure more precise decision-making, directly contributing to their organization’s success. Furthermore, addressing the challenges associated with poor master data quality is vital for unlocking data-driven insights that enhance operational efficiency.
Best Practices for Managing Null Values in DAX
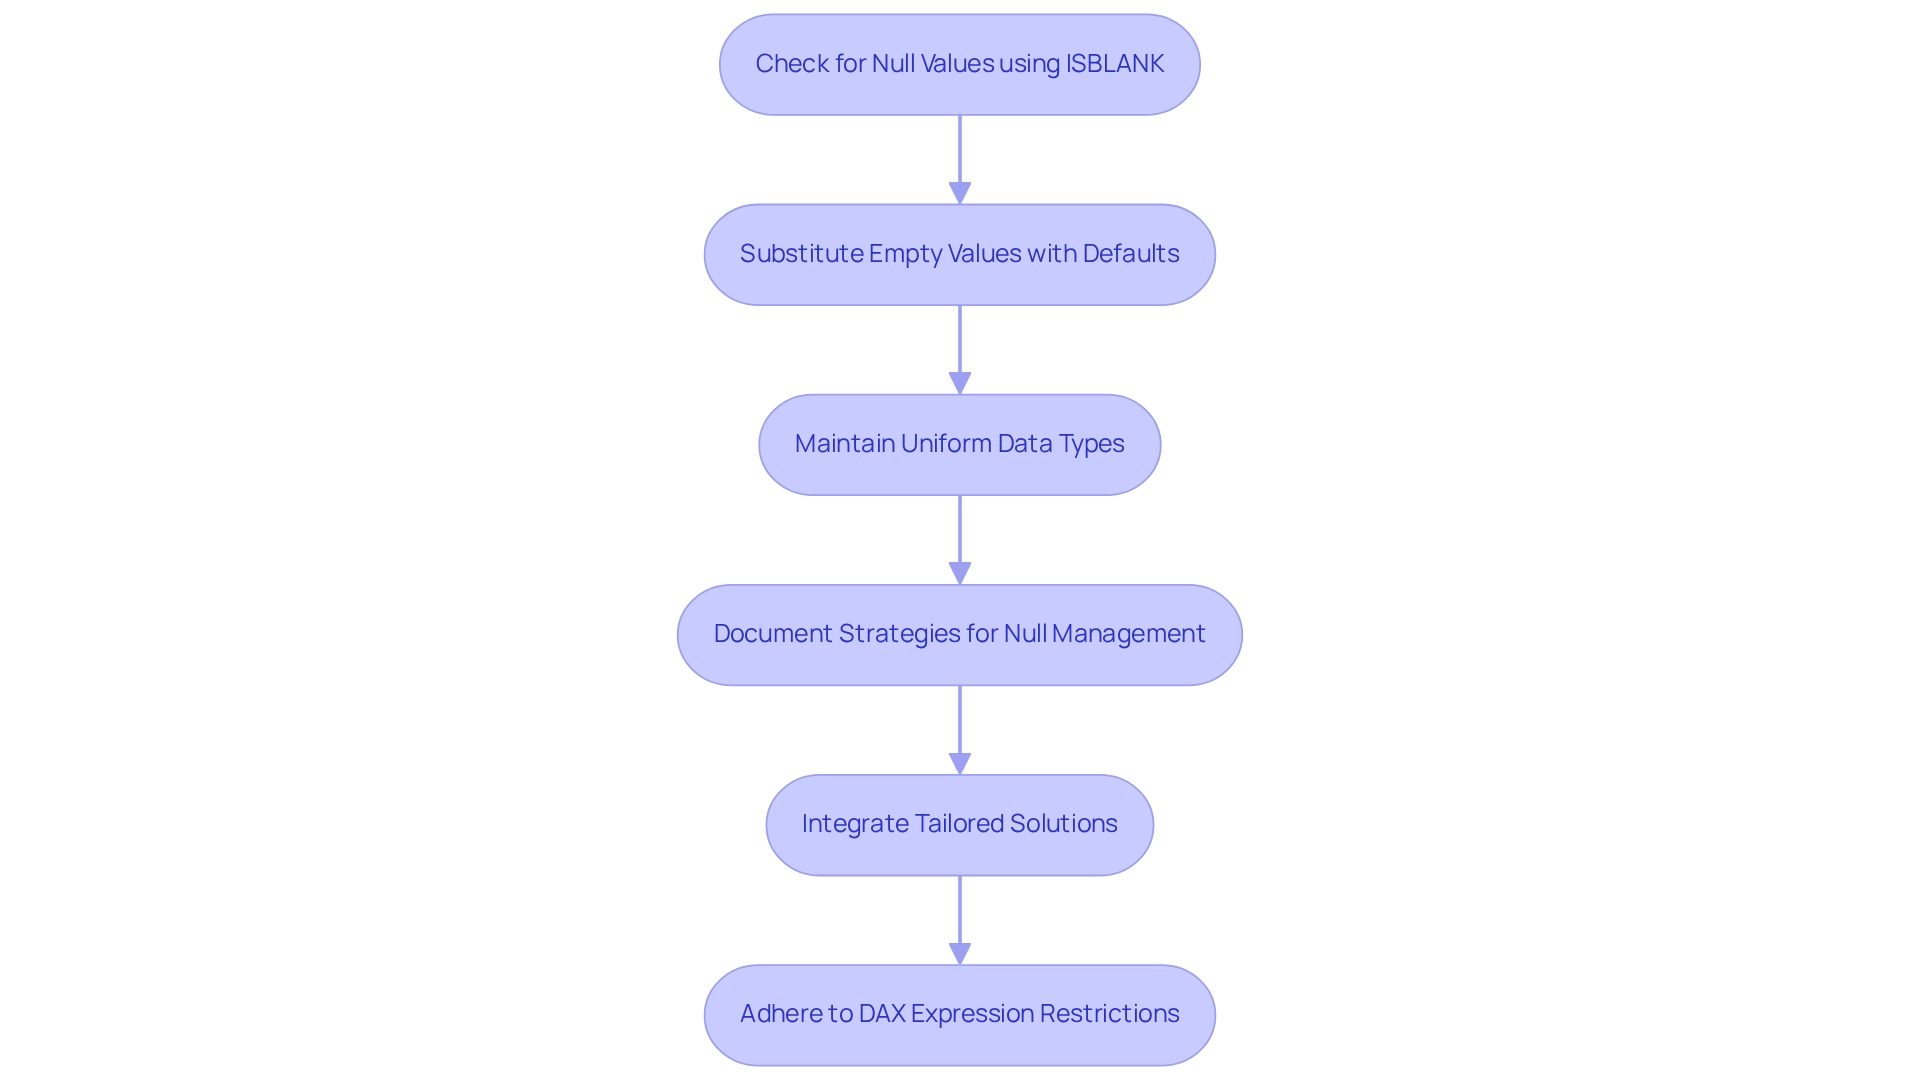
Effectively managing empty entries, or null values in DAX, requires a strategic approach grounded in best practices. Begin by leveraging the ISBLANK function to check for empty entries before executing calculations. This proactive measure not only prevents errors but also guarantees the accuracy of your analysis—an essential aspect in a data-rich environment where extracting meaningful insights can be particularly challenging.
Moreover, consider substituting empty values with meaningful defaults using the IF function or COALESCE. Such practices enhance the interpretability of your reports, rendering the information more accessible to stakeholders and promoting informed decision-making that drives growth and innovation.
Maintaining uniform data types across your model is crucial for minimizing empty values. For example, ensure that numeric fields do not contain text entries that could inadvertently result in BLANK outputs. Additionally, documenting your strategies for managing null values within your DAX code significantly enhances readability and maintainability.
This transparency facilitates comprehension of your logic by others, fostering collaboration and knowledge sharing—key elements for overcoming barriers to AI adoption in organizations.
Integrating these best practices not only streamlines your DAX procedures but also aligns with the broader goal of enhancing information quality and fostering innovation within your organization. Tailored solutions, such as EMMA RPA and Power Automate from Creatum GmbH, play a pivotal role in this context, as they enhance information quality and streamline AI implementation, ultimately nurturing growth and innovation.
As Yogana S. aptly states, “Viewing information validation as the sentinel of analytical integrity, it’s akin to fortifying the foundations of a building.” This perspective underscores the importance of efficiently managing empty entries. Furthermore, the case study titled ‘Enhancing Data Validation Abilities’ illustrates the significance of data validation methods for data analysts, demonstrating how addressing missing entries contributes to generating reliable analytical outcomes.
It is also important to note that restrictions exist on DAX expressions permitted in measures and calculated columns, making the handling of null values essential in DAX calculations. By adhering to these best practices, you can ensure the reliability of your analyses and cultivate a culture of continuous improvement, ultimately positioning your organization for success in a competitive landscape. To discover how Creatum GmbH can assist you in enhancing your Business Intelligence and RPA capabilities, schedule a free consultation today.
Visualizing Null Values: Techniques for Clear Reporting
Effectively representing absent data, such as null in DAX, is essential for clear and informative reporting, particularly when utilizing Business Intelligence to enhance decision-making. One effective method involves using conditional formatting in Power BI, which highlights cells containing empty entries, making them easily identifiable. As noted by Marlous Hall from the Leeds Institute of Cardiovascular & Metabolic Medicine, ‘Conditional formatting is vital for highlighting important metrics, such as missing entries, which can greatly influence decision-making.’
This aligns with our Power BI offerings at Creatum GmbH, ensuring effective reporting and information consistency. Our 3-Day Power BI Sprint facilitates swift report generation, while the General Management App provides thorough management solutions.
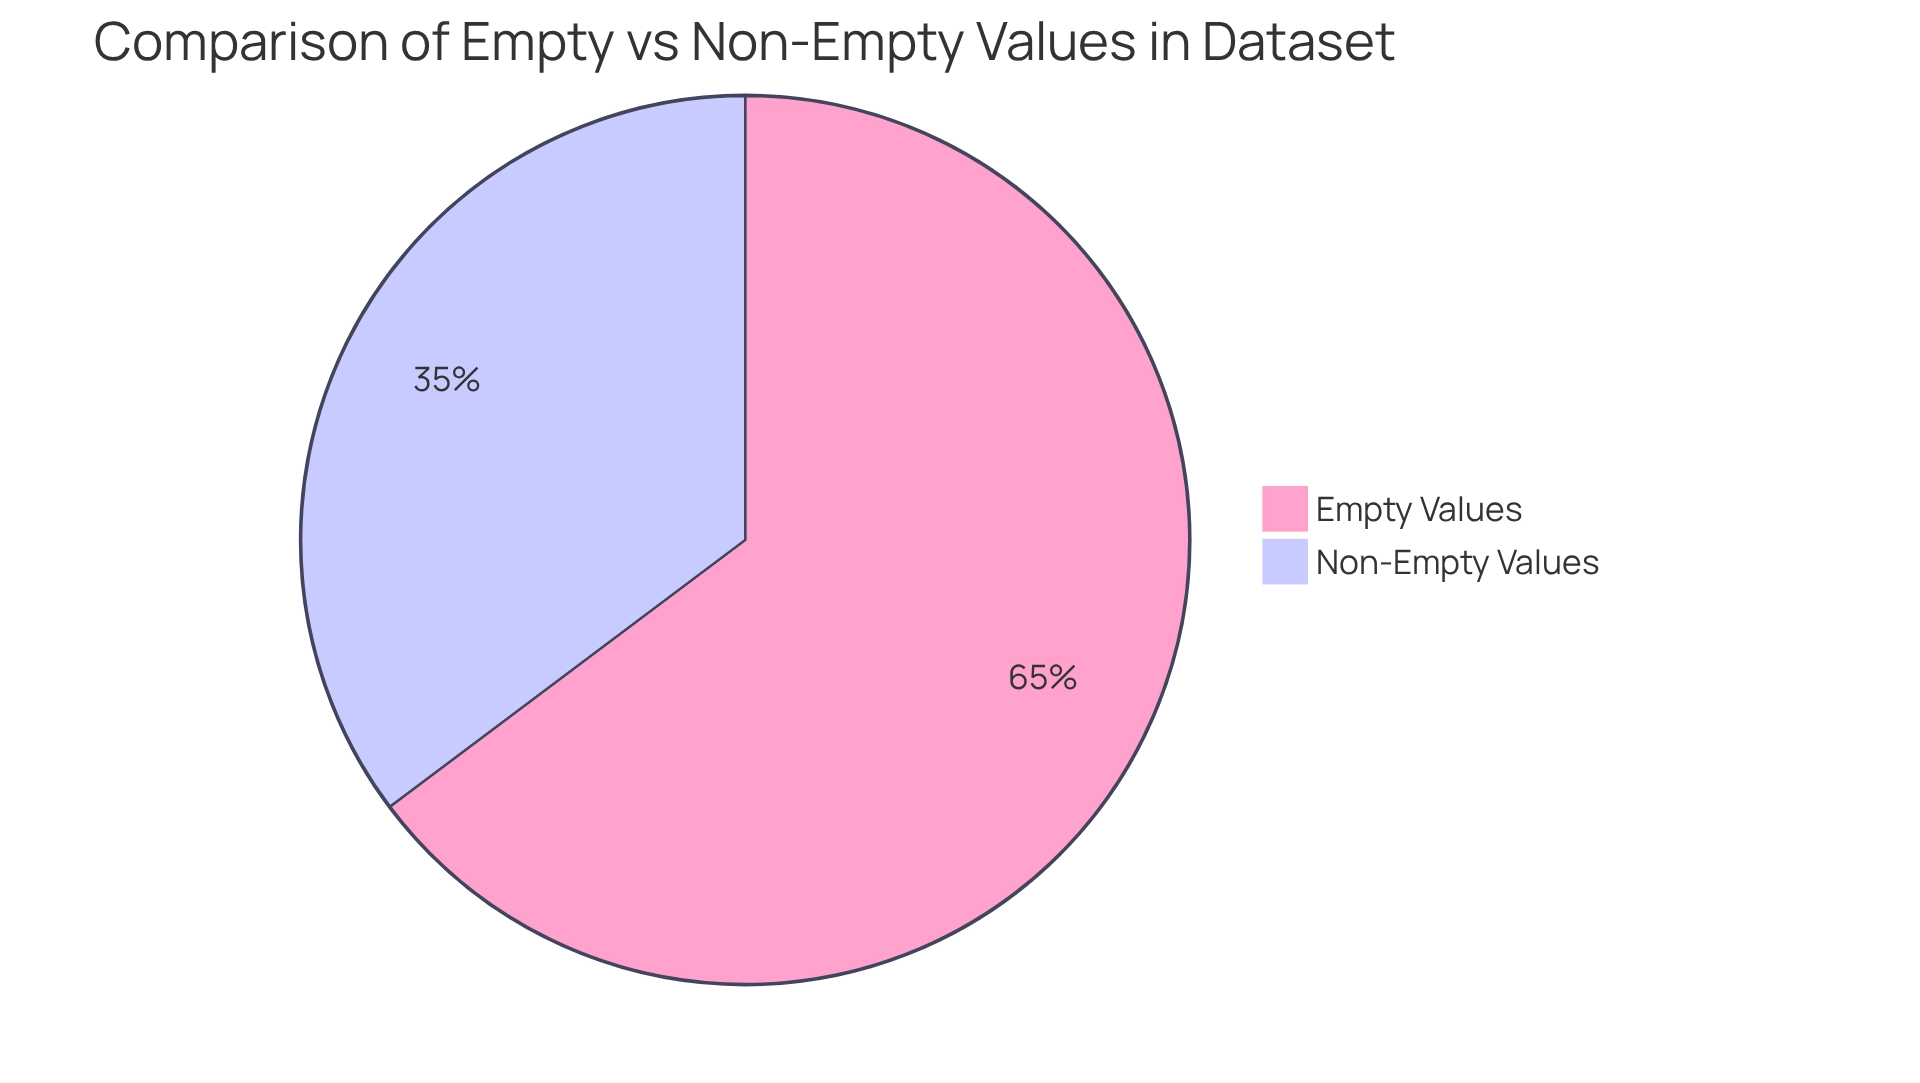
Moreover, adding labels or annotations in charts offers context regarding the presence of absent entries, assisting stakeholders in grasping their significance. Developing specialized visualizations that specifically address the issue of null in DAX values is another crucial method. For instance, bar charts that contrast the number of empty values against non-empty ones can vividly demonstrate the impact of missing information on overall trends.
This approach emphasizes the magnitude of the problem and enables a deeper examination of data reliability, particularly concerning null in DAX, which is vital for informed decision-making. In a dataset containing 86 fields, addressing missing entries becomes even more critical, as unforeseen gaps can lead to significant insights being overlooked. Recent discoveries revealed a total of 158 intersections indicating null in DAX codes in diagnostic fields, underscoring the importance of accurately reporting empty entries.
Furthermore, incorporating legends or descriptive notes in visualizations to explain how missing data is managed is essential. This level of transparency enhances the audience’s understanding of the information and fosters trust in the insights presented. By applying these methods, information specialists can significantly improve the transparency and impact of their reporting on missing entries, ultimately enabling companies to derive meaningful insights from their data and foster growth.
Advanced DAX Techniques for Transforming Null Values
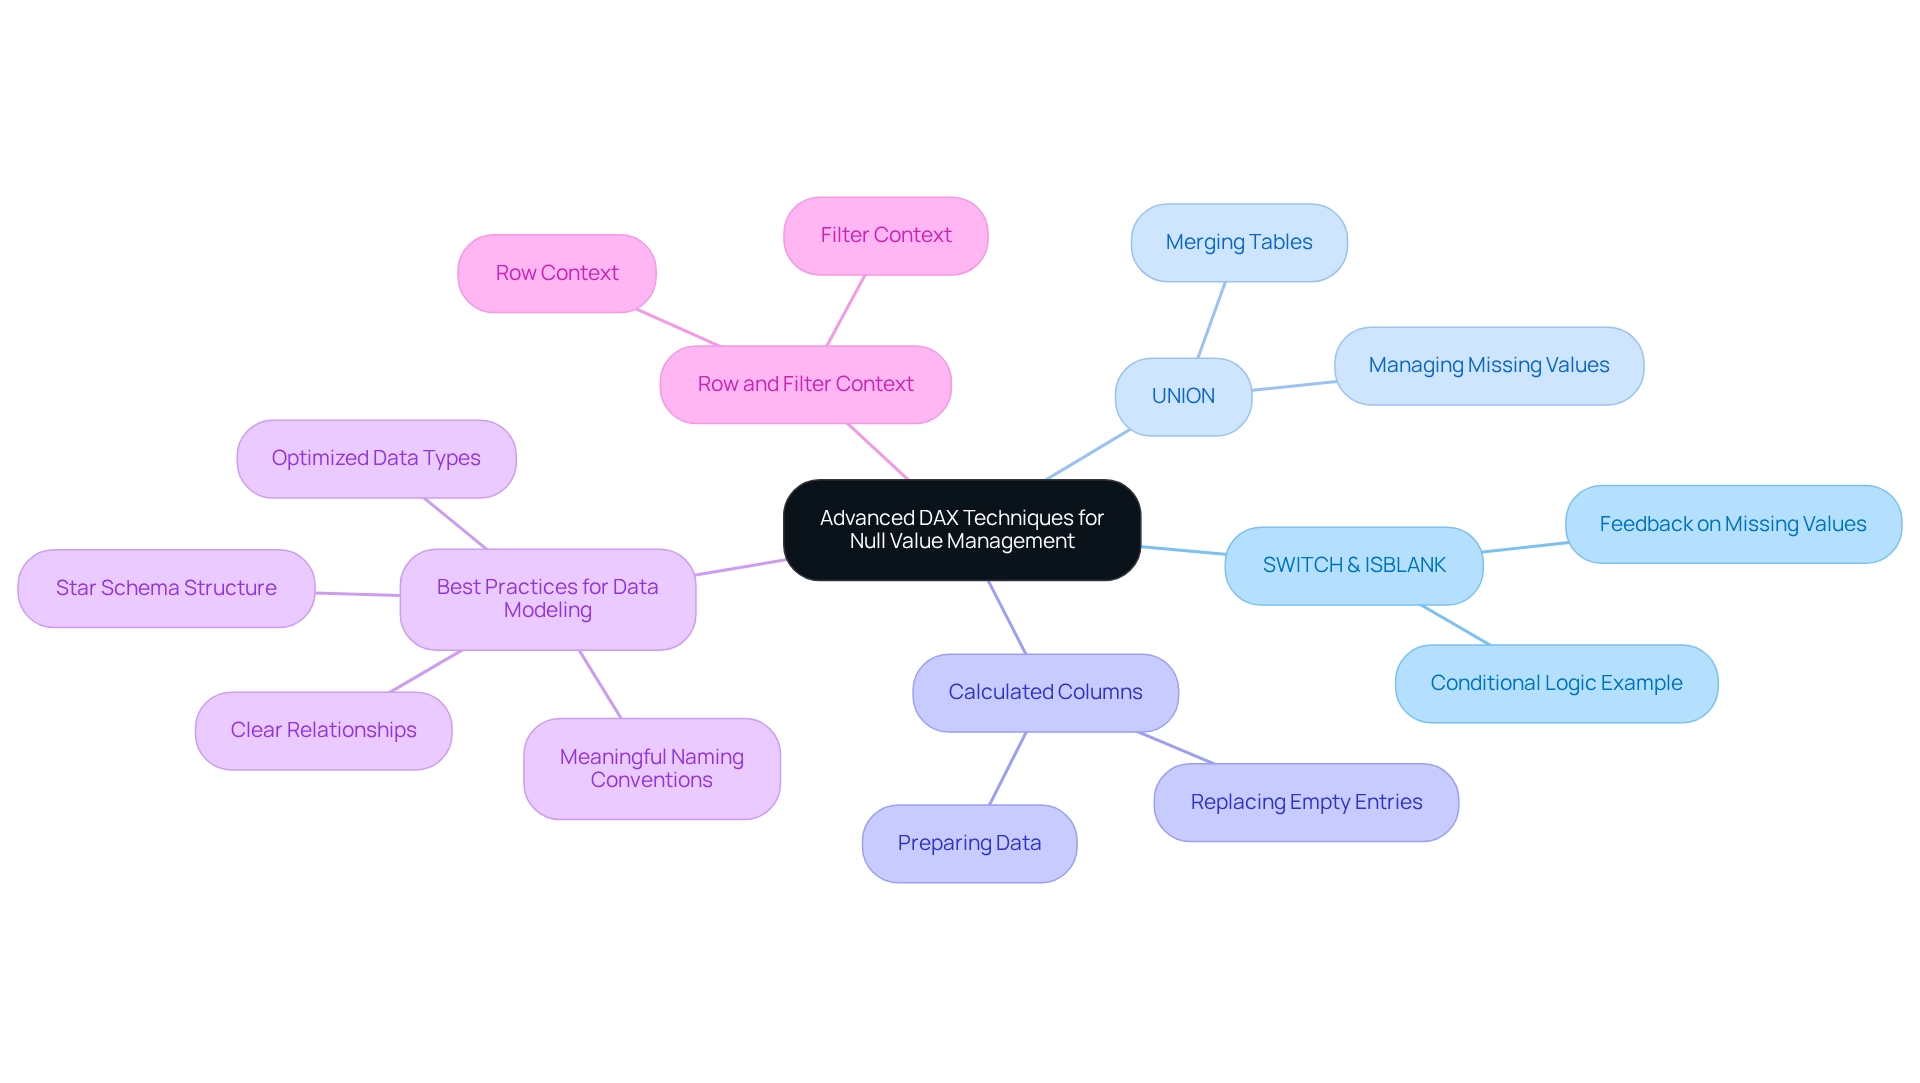
For experienced users, a range of DAX methods can be employed to effectively modify empty entries, a critical aspect in leveraging Business Intelligence for operational efficiency. A powerful approach involves utilizing the SWITCH function alongside ISBLANK, which enables the creation of intricate conditional logic. For instance, the expression SWITCH(TRUE(), ISBLANK(value1), 'Value is missing', ISBLANK(value2), 'Another value is missing', 'All values present') offers comprehensive feedback on which specific values are absent, thereby enhancing the clarity of your analysis and addressing issues such as inconsistencies.
Moreover, the UNION function can be utilized to merge tables while adeptly managing missing values, allowing for more flexible information modeling. This is particularly advantageous in scenarios where information integrity is paramount, especially when aiming to extract significant insights from Power BI dashboards. Additionally, employing calculated columns to prepare data facilitates the replacement of empty entries with meaningful values before their integration into measures.
This practice ensures that analyses are grounded in reliable information, ultimately leading to more accurate insights that drive growth and innovation.
Integrating these advanced DAX techniques not only streamlines the management of absent entries but also aligns with best practices for data modeling. Case studies underscore the importance of meaningful naming conventions, clear relationships, and optimized types. The star schema, consisting of a central fact table linked to various dimension tables, provides a structured framework that enhances the management of empty values within data models. Understanding row context, which pertains to the current row in a calculated column, and filter context, which relates to filters in reports, is crucial for effectively addressing null values in DAX.
As Amitabh Saxena notes, “Power Query M is straightforward and efficient in addressing issues with the coalesce operator,” highlighting the value of employing simple yet powerful tools in data transformation. By adopting these strategies, professionals can significantly boost the performance and maintainability of their Power BI models, effectively overcoming the challenges of time-consuming report creation and ensuring actionable insights for informed decision-making.
To further enhance operational efficiency, consider exploring our RPA solutions, including EMMA RPA and Power Automate, which can automate repetitive tasks and improve overall productivity. Don’t let the competitive disadvantage of not utilizing Business Intelligence impede your business—schedule a free consultation today to discover how we can assist you in transforming your data into actionable insights.
Impact of Null Values on Data Integrity and Analysis
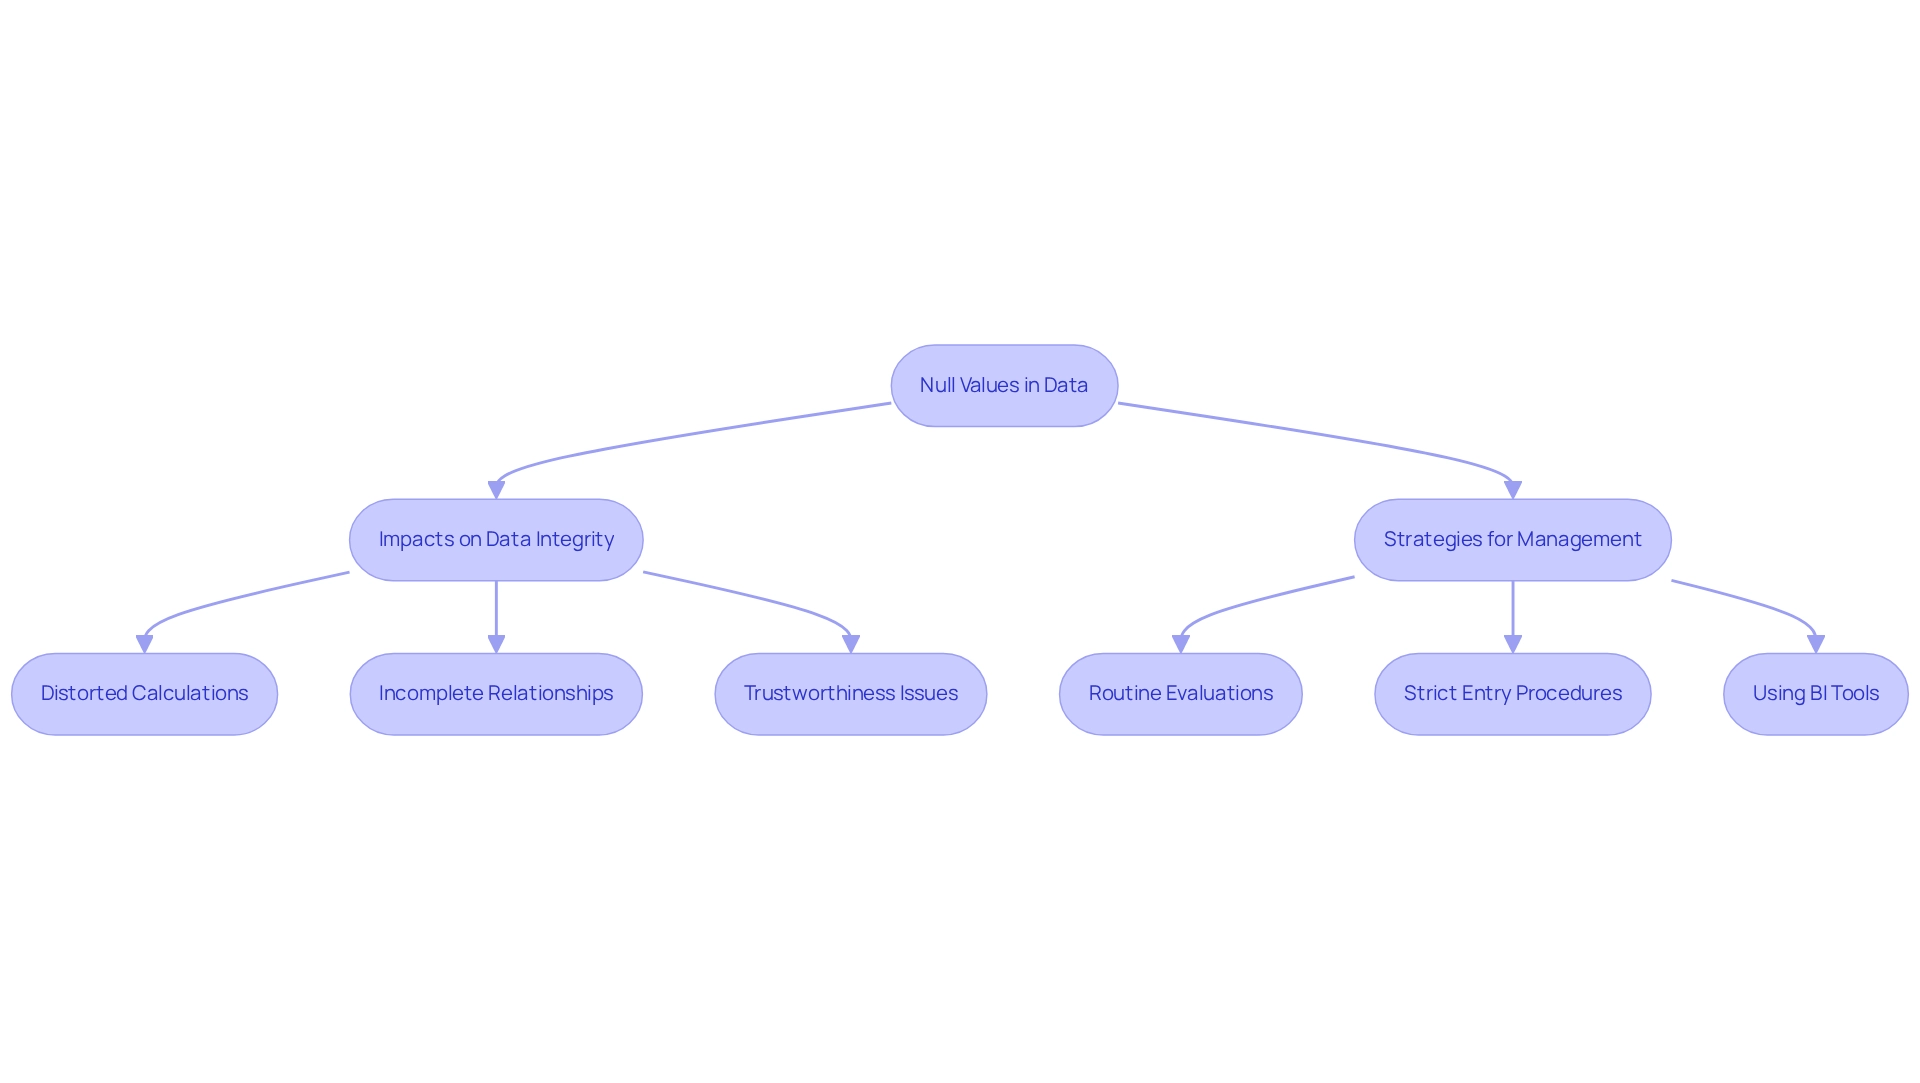
Null entries, often referred to as null in DAX, pose a significant threat to data integrity and can severely distort analysis outcomes. If left unaddressed, these principles can lead to biased results, as calculations may overlook or misinterpret them. For instance, combining datasets that include gaps can distort averages and totals, leading to deceptive insights that mislead decision-making.
Moreover, empty entries complicate relationships among information, resulting in incomplete or flawed visual representations that fail to accurately depict the underlying data.
To maintain information integrity, it is essential to implement robust strategies for recognizing and handling missing entries throughout the information lifecycle. This involves conducting routine evaluations of information quality to proactively identify and manage omissions. Additionally, establishing strict information entry procedures can significantly decrease the occurrence of empty values, ensuring that the information remains trustworthy and usable.
Utilizing Business Intelligence tools enhances these processes by providing insights into information quality and facilitating better management practices.
Experts emphasize that mishandling absent values can undermine the trustworthiness of evaluations, underscoring the necessity for clarity in managing incomplete information. As Taran Kaur states, “Being open not only aids in establishing confidence in your results, but it also demonstrates that you’ve carefully reflected on how absent information might influence your evaluation.” By categorizing absent information into Missing Completely at Random (MCAR), Missing at Random (MAR), and Missing Not at Random (MNAR), specialists can gain clearer insights into the effects of null in DAX values and select appropriate techniques for examination and imputation.
This classification not only helps mitigate potential biases but also enhances the overall quality of insights derived from the data. Furthermore, conducting sensitivity evaluations to assess the robustness of results related to the MAR assumption is crucial, as suggested by the National Research Council. Care must also be taken with single imputation techniques such as EM, which can underestimate standard errors and overestimate precision, creating a misleading sense of power in evaluations. Recent studies focus on the handling of absent values in ordinal data, emphasizing ongoing research and its significance to current methods in information evaluation.
By incorporating these factors and employing RPA solutions like EMMA RPA and Power Automate from Creatum GmbH to streamline information management tasks, professionals can significantly enhance the integrity and reliability of their analyses, ultimately fostering business growth and innovation. Companies that fail to effectively extract valuable insights from their information risk falling behind their competitors in today’s data-driven environment.
Key Takeaways: Enhancing Data Quality with Null Management
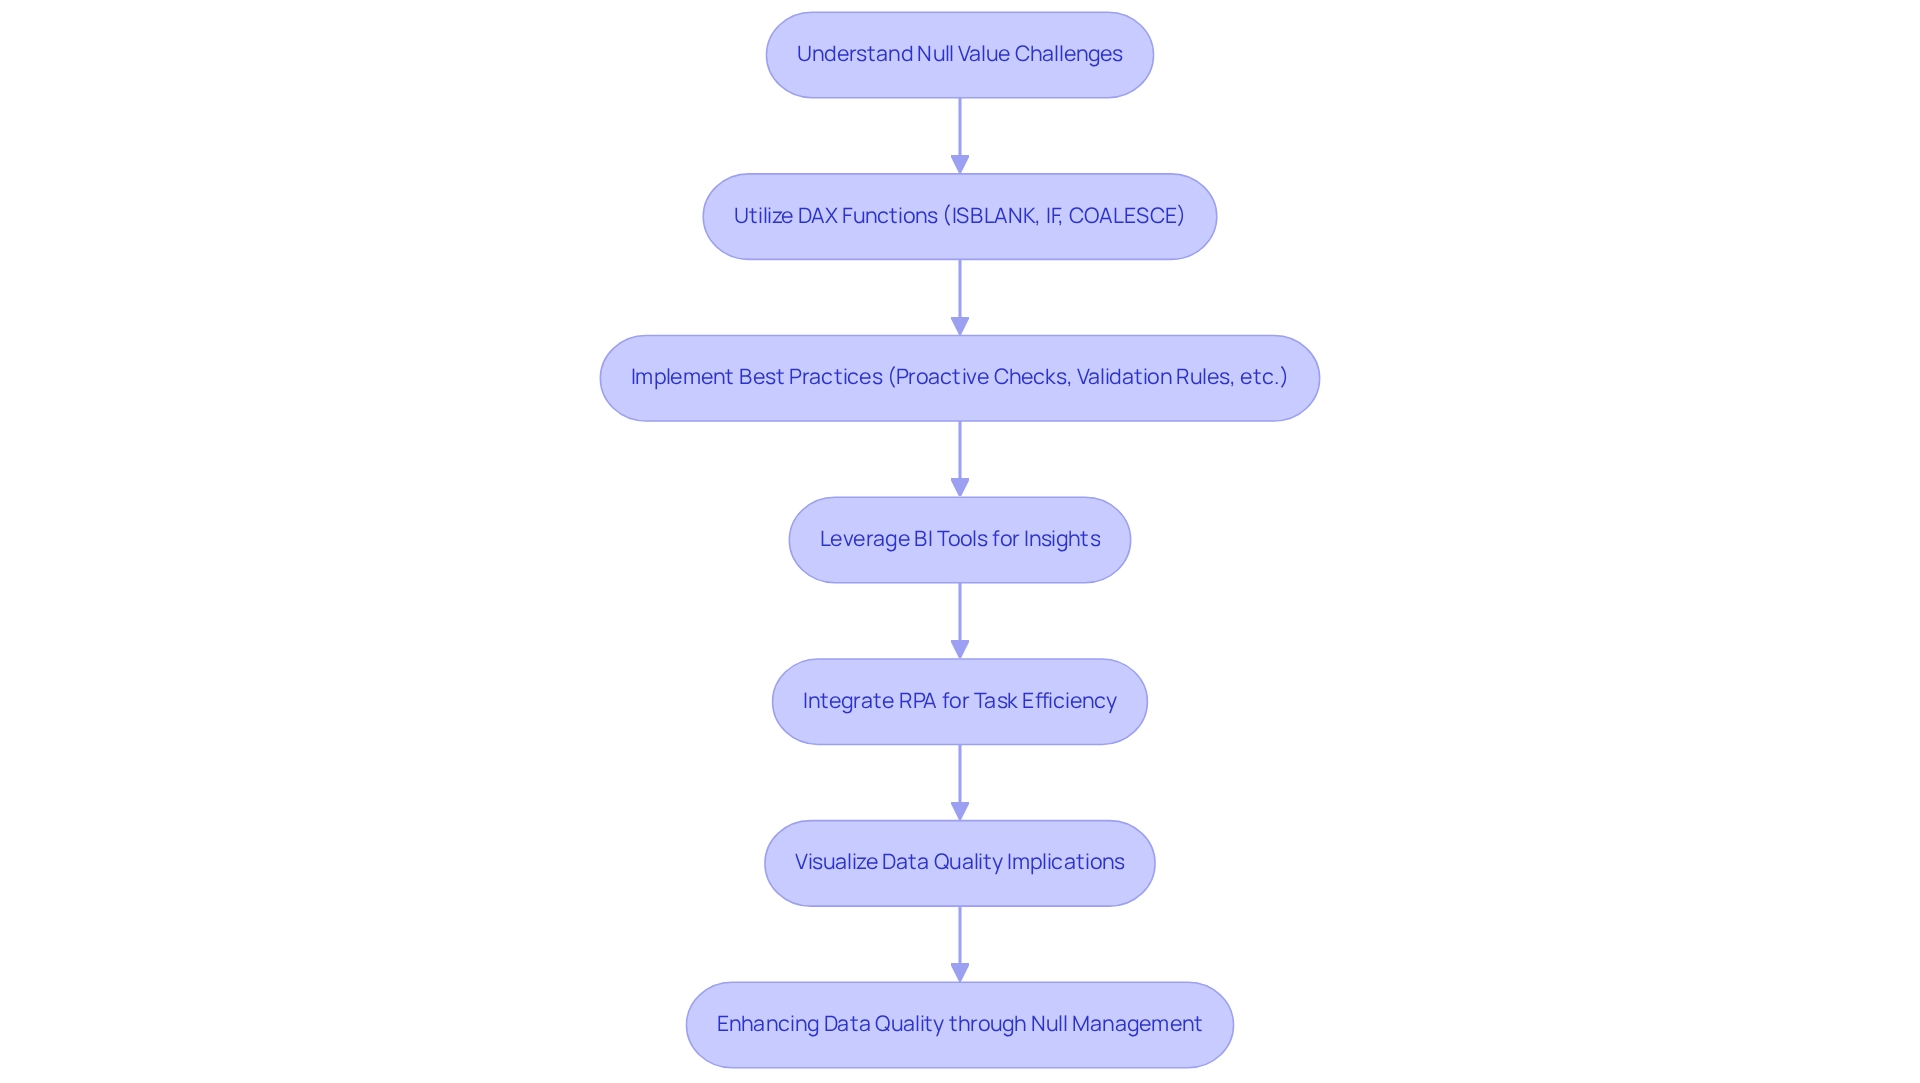
To enhance information quality through efficient absence management, information specialists must first grasp the complexities of handling null values in DAX and the challenges they present. Essential DAX functions like ISBLANK, IF, and COALESCE serve as vital tools for effectively identifying and managing nulls in DAX. By applying best practices—such as proactive checks, equality checks, validation rules, profiling, and completeness checks—organizations can not only improve the accuracy of their analyses but also mitigate the risks associated with poor information, which IBM estimated cost the U.S. economy $3.1 trillion in 2016.
Furthermore, the integration of Business Intelligence (BI) and Robotic Process Automation (RPA) is pivotal in fostering data-driven insights and enhancing operational efficiency. Leveraging BI tools enables organizations to convert raw data into actionable insights that inform decision-making and promote growth. RPA solutions, including EMMA RPA and Power Automate, streamline repetitive tasks, thereby improving information quality and freeing up resources for more strategic initiatives.
Effective visualization methods are equally crucial in communicating the implications of absent entries to stakeholders, ensuring that the significance of information quality is acknowledged across the organization. As Chien remarked, “It is not only important to have the board’s attention in DQ improvement, but also for it to be a sustainable practice.” A case study focusing on trend monitoring illustrates how organizations can utilize time series evaluation to detect anomalies and oversee information quality over time, specifically addressing issues related to null values in DAX while distinguishing between normal fluctuations and genuine problems.
By embracing these strategies, data professionals can substantially enhance the integrity and reliability of their analyses, ultimately driving improved decision-making and operational efficiency.
Conclusion
Managing null values in DAX is essential for ensuring data integrity and accuracy in analysis. This article highlights the critical distinctions between null values and other data types, emphasizing the unique handling required for ‘BLANK’ values to prevent misleading insights. By utilizing key DAX functions such as ISBLANK, IF, and COALESCE, data professionals can effectively identify and manage nulls, thereby enhancing the quality of their analyses.
Moreover, integrating best practices and advanced techniques, including conditional formatting in reporting and the SWITCH function for conditional logic, empowers analysts to visualize and address null values transparently. This proactive approach mitigates the risks associated with data quality issues and fosters trust in the insights derived from data.
Ultimately, effective null management is not merely a technical necessity; it is a strategic imperative that drives informed decision-making and operational efficiency. As organizations increasingly rely on data to guide their strategies, mastering the complexities of null values is crucial for data professionals aiming to deliver reliable and actionable insights. By prioritizing data quality and utilizing appropriate tools, businesses can position themselves for success in today’s competitive landscape, ensuring they harness the full potential of their data assets.
Frequently Asked Questions
What does ‘BLANK’ represent in DAX?
In DAX, ‘BLANK’ represents null entries, which are treated distinctly compared to other data types. Understanding how BLANK is interpreted is crucial for accurate data analysis.
Why is it important to understand the difference between an empty entry and zero in DAX?
An empty entry signifies the absence of information, while zero represents a numeric value. Misinterpreting these can lead to inaccuracies in calculations and aggregations.
How can poor handling of BLANK values affect data analysis?
Mismanagement of BLANK values can lead to unexpected outcomes in calculations, distorted results, misleading averages, and ultimately undermine the reliability of the analysis.
What are the challenges associated with managing null values in DAX?
Data experts often face difficulties with the misinterpretation of BLANK figures, complications in data relationships, and the overall precision of analyses, which can diminish data quality and reliability.
What role do Business Intelligence (BI) tools play in addressing information quality challenges?
BI tools help organizations tackle issues related to poor master information quality, enabling them to transform raw data into actionable insights that drive growth and innovation.
What methods can be employed to handle missing information effectively?
Identifying the type of absence and selecting appropriate handling methods, such as maximizing information collection during study design, can minimize information loss and bias.
Why is clarity in reporting how absent data was managed important?
Clarity in reporting is vital for building trust in findings and understanding the methodologies behind results, which enhances the credibility of the analysis.
How can organizations improve their handling of null values in DAX?
Establishing clear information governance policies and adhering to defined data management standards can improve the handling of null values, leading to more accurate and reliable analyses.
Overview
Diagnostic analytics addresses essential questions about the underlying causes of past events and trends. For instance, it seeks to understand why sales have declined or what factors have influenced customer churn. Analyzing historical data is crucial for uncovering these root causes, ultimately enhancing decision-making processes.
A compelling illustration of this can be seen in the successful case study of Canadian Tire, which effectively utilized AI-driven insights to boost sales. This example underscores the value of diagnostic analytics in driving informed business strategies.
Introduction
In the rapidly evolving landscape of data analytics, diagnostic analytics stands out as an essential tool for organizations aiming to grasp the complexities of their operations. By investigating the reasons behind historical events, this analytical approach not only addresses the crucial question of ‘why’ but also empowers businesses to enhance decision-making and operational efficiency. As industries contend with an ever-growing volume of data—projected to reach an astonishing 79.4 zettabytes by 2025—leveraging diagnostic analytics becomes vital for pinpointing root causes of issues and uncovering actionable insights.
The applications of diagnostic analytics are extensive and transformative, ranging from optimizing sales strategies to improving patient care in healthcare settings. This article delves into the core aspects of diagnostic analytics, exploring its methodologies, real-world applications, and the challenges organizations encounter during implementation. Ultimately, it underscores the pivotal role of diagnostic analytics in driving growth and innovation across various sectors.
Understanding Diagnostic Analytics: Definition and Purpose
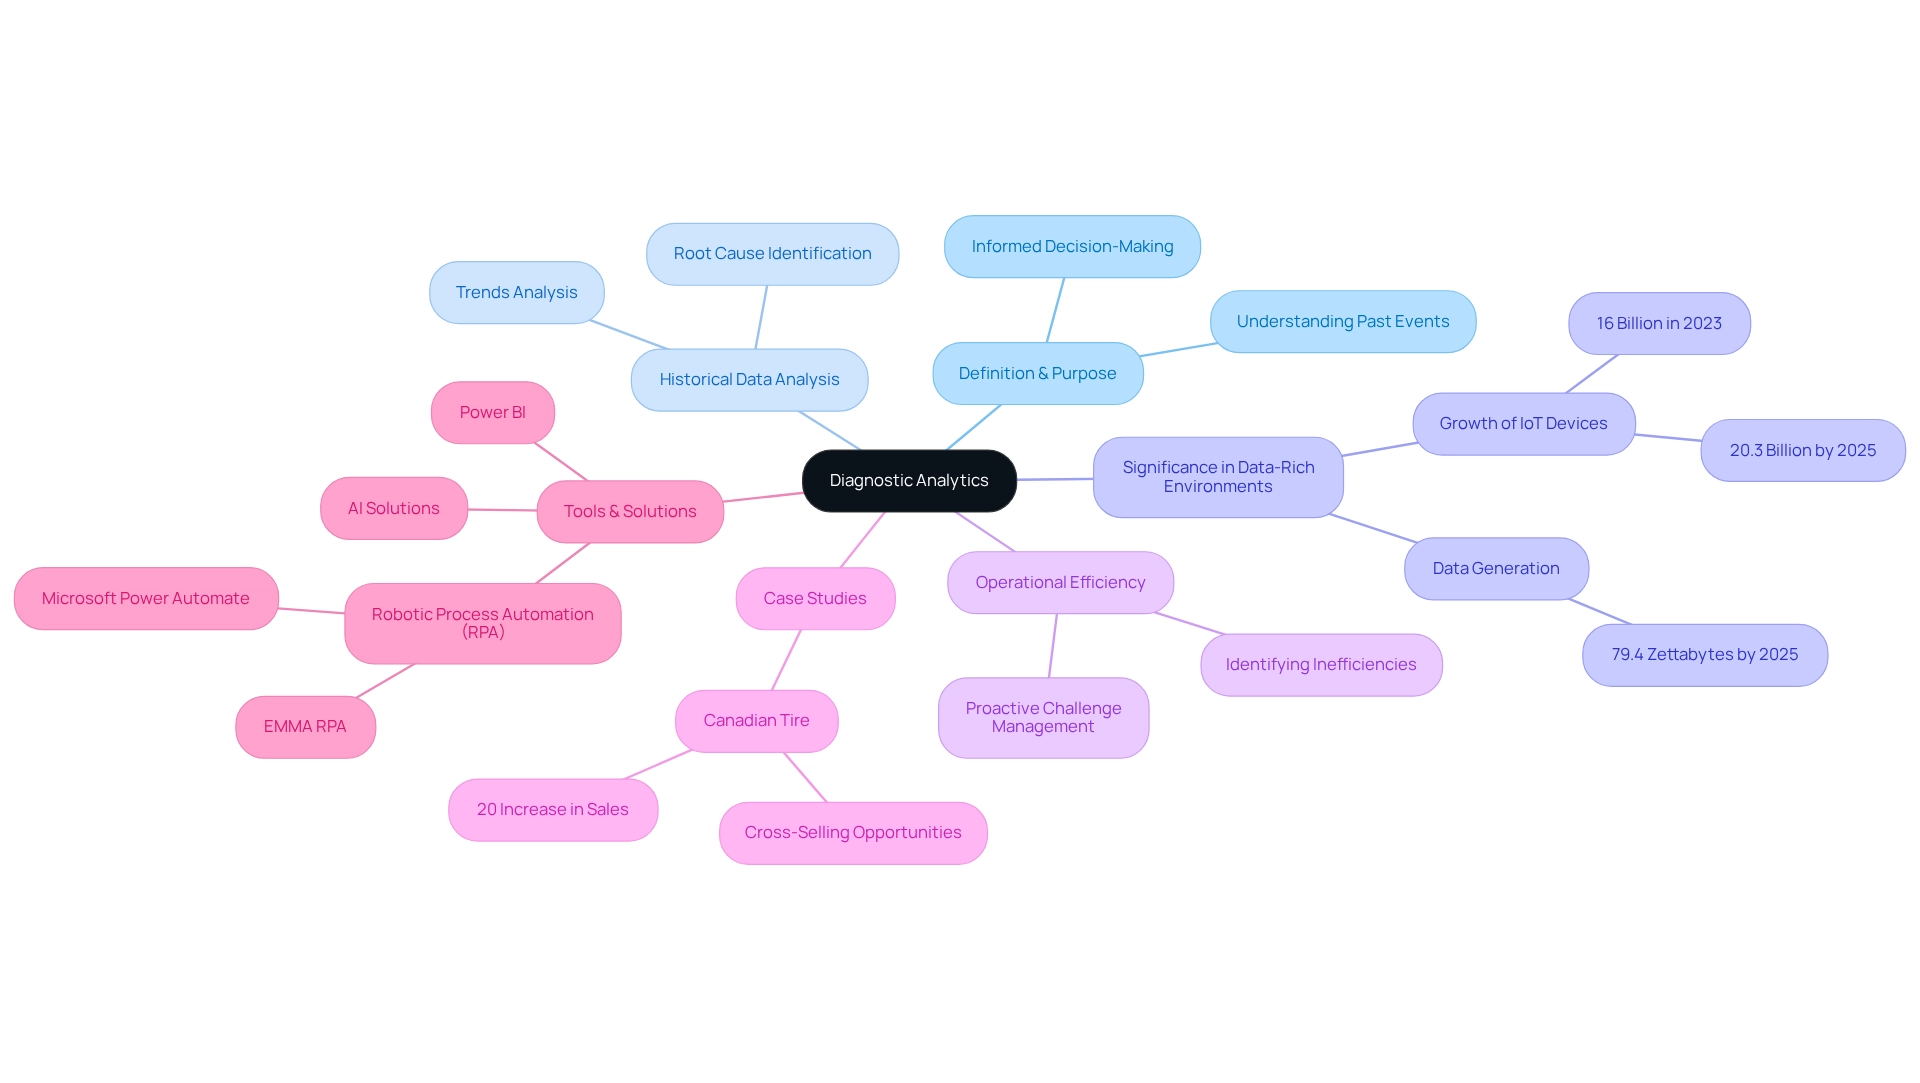
Diagnostic analytics represents a vital branch of analytical study, delving into the reasons behind past occurrences or trends. It specifically addresses the question: what does diagnostic analytics answer? By scrutinizing historical data, organizations can reveal the root causes of issues, a necessity for informed decision-making and improving future outcomes. This analytical approach gains particular significance in today’s data-rich landscape, where the number of connected devices is projected to surge from 16 billion in 2023 to 20.3 billion by 2025, generating an astonishing 79.4 zettabytes of data.
Such vast amounts of information necessitate robust analytical frameworks to extract practical insights, underscoring the critical need for effective evaluative analysis. The importance of evaluative analysis in enhancing operational efficiency cannot be overstated. It enables organizations to pinpoint inefficiencies and tackle challenges proactively. For instance, Canadian Tire effectively harnessed AI-driven insights to analyze the purchasing behaviors of new pet owners, achieving nearly a 20% increase in sales by identifying cross-selling opportunities.
This case illustrates how diagnostic analytics can convert raw data into strategic insights that propel revenue growth. Experts assert that leveraging Robotic Process Automation (RPA) solutions, such as EMMA RPA and Microsoft Power Automate from Creatum GmbH, can significantly boost efficiency and employee morale by automating manual workflows. Furthermore, understanding past events through diagnostic analytics addresses the fundamental question of what diagnostic analytics answers, essential for organizations striving to refine their operations. By integrating tailored AI solutions and Business Intelligence tools, organizations can enhance their decision-making processes, ensuring strategies are informed by historical performance and trends.
The use of Power BI services, including the 3-Day Sprint for rapid report generation, further enhances information reporting and actionable insights, addressing inconsistencies and governance challenges in organizational reporting. Expert opinions emphasize that comprehending the reasons behind past events is crucial in commercial analysis, as it helps answer what diagnostic analytics addresses, laying the groundwork for future achievements and innovation. In summary, analytical assessment serves as a cornerstone for organizations aiming to bolster operational efficiency and navigate the complexities of their data environments.
Key Questions Addressed by Diagnostic Analytics
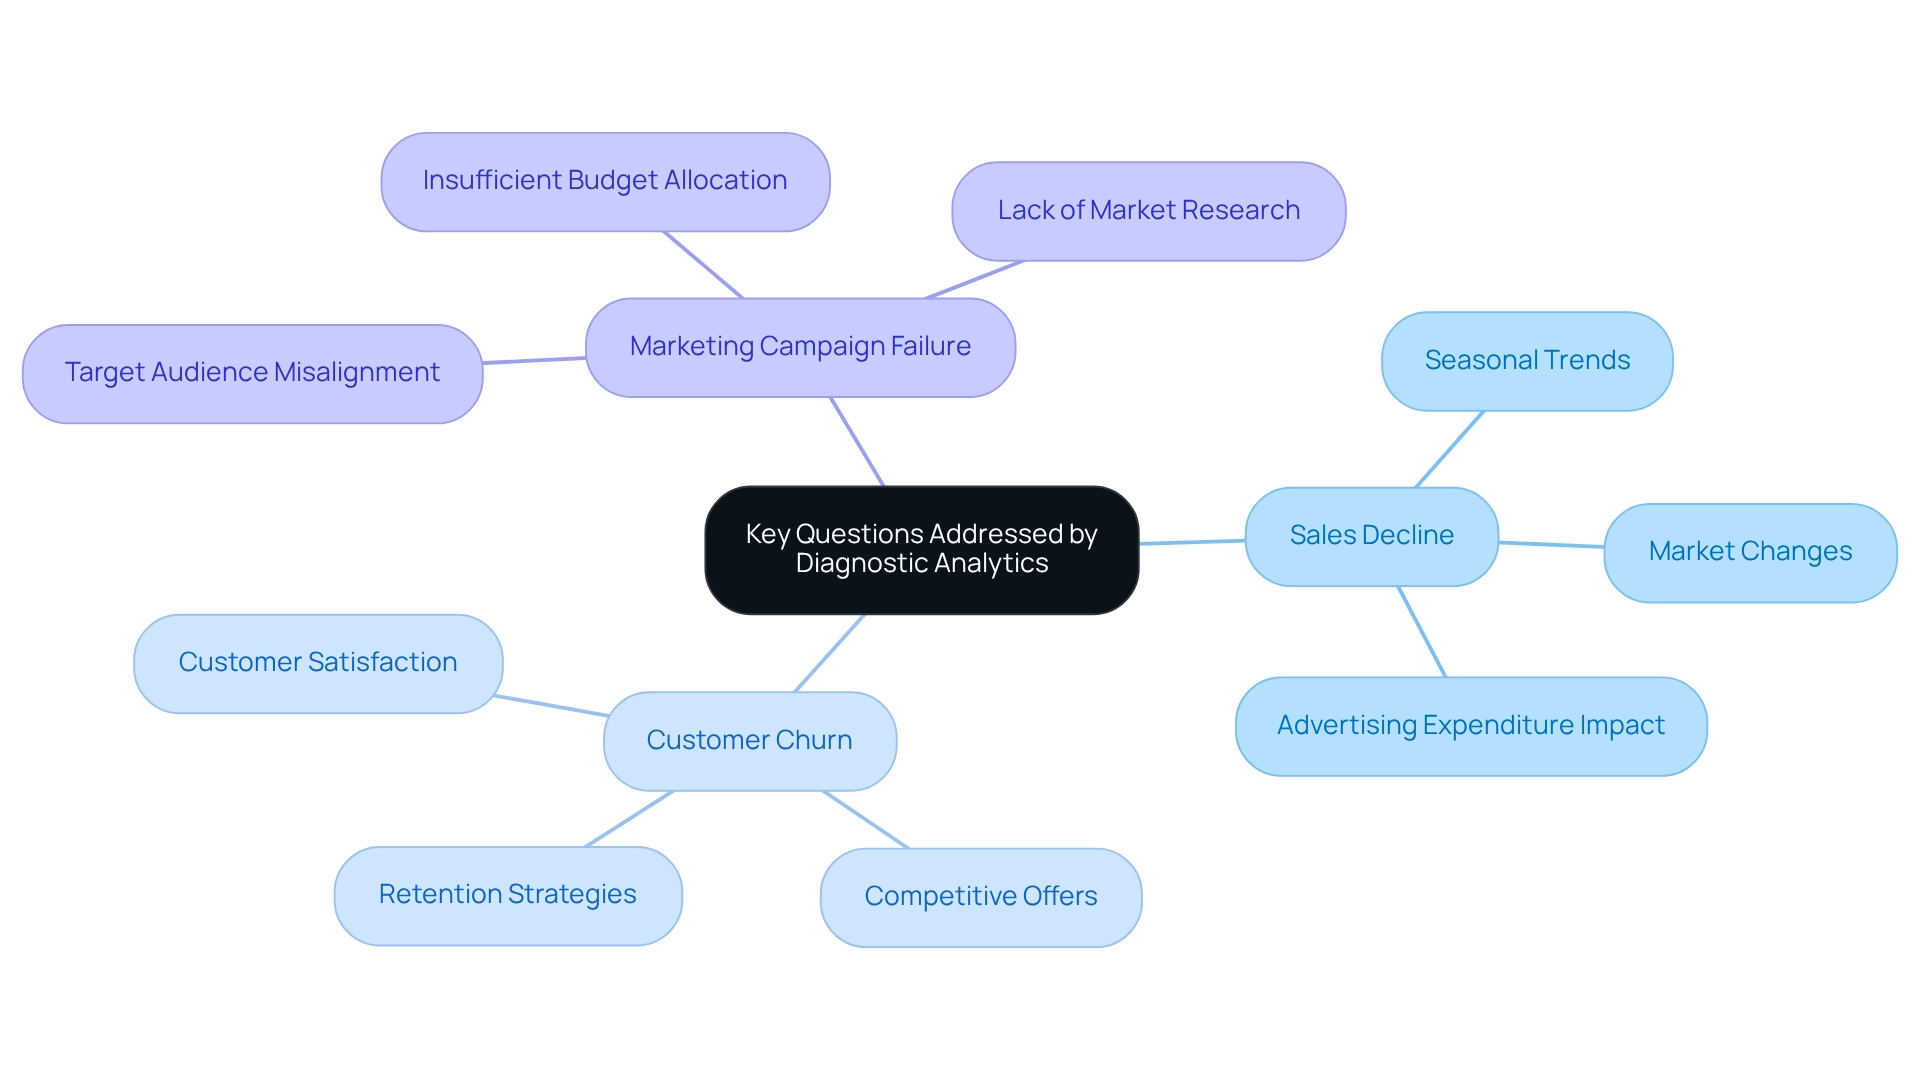
Diagnostic analysis is pivotal in addressing the question of what diagnostic analytics reveals about organizational performance. Key inquiries include:
- ‘Why did sales decline during a specific period?’
- ‘What factors contributed to increased customer churn?’
- ‘Why did a marketing campaign fail to generate expected results?’
By systematically addressing these questions, organizations can uncover underlying issues and formulate targeted strategies to prevent recurrence.
For instance, companies often utilize regression analysis to pinpoint outliers that may skew the relationship between variables, such as the correlation between advertising expenditure and sales results. This analytical approach not only clarifies these relationships but also enhances decision-making processes.
The impact of evaluative analysis on organizational performance is significant. Organizations that effectively harness these insights, particularly through the integration of Business Intelligence tools, can improve customer retention rates, as retaining existing customers is generally more cost-effective than acquiring new ones. This principle underscores the importance of understanding customer behavior through analytical evaluation, which can be further enhanced by Robotic Process Automation (RPA) to streamline information gathering and examination procedures.
Moreover, case studies indicate that companies facing sales declines have successfully employed analytical assessments to identify root causes, yielding actionable insights that bolster performance. However, it is crucial to address challenges such as differentiating correlation from causation and ensuring data quality to derive accurate insights. The demand for advanced analytical skills further complicates the effective application of assessment techniques.
As Catherine Cote, Marketing Coordinator, states, “Do you want to become a data-driven professional? Explore our eight-week course and our three-course Credential of Readiness (Core) program to deepen your analytical skills and apply them to real-world business problems.” By overcoming these obstacles, organizations can unlock the full potential of diagnostic data analysis, ultimately fostering growth and innovation in their operations.
Techniques and Methodologies in Diagnostic Analytics
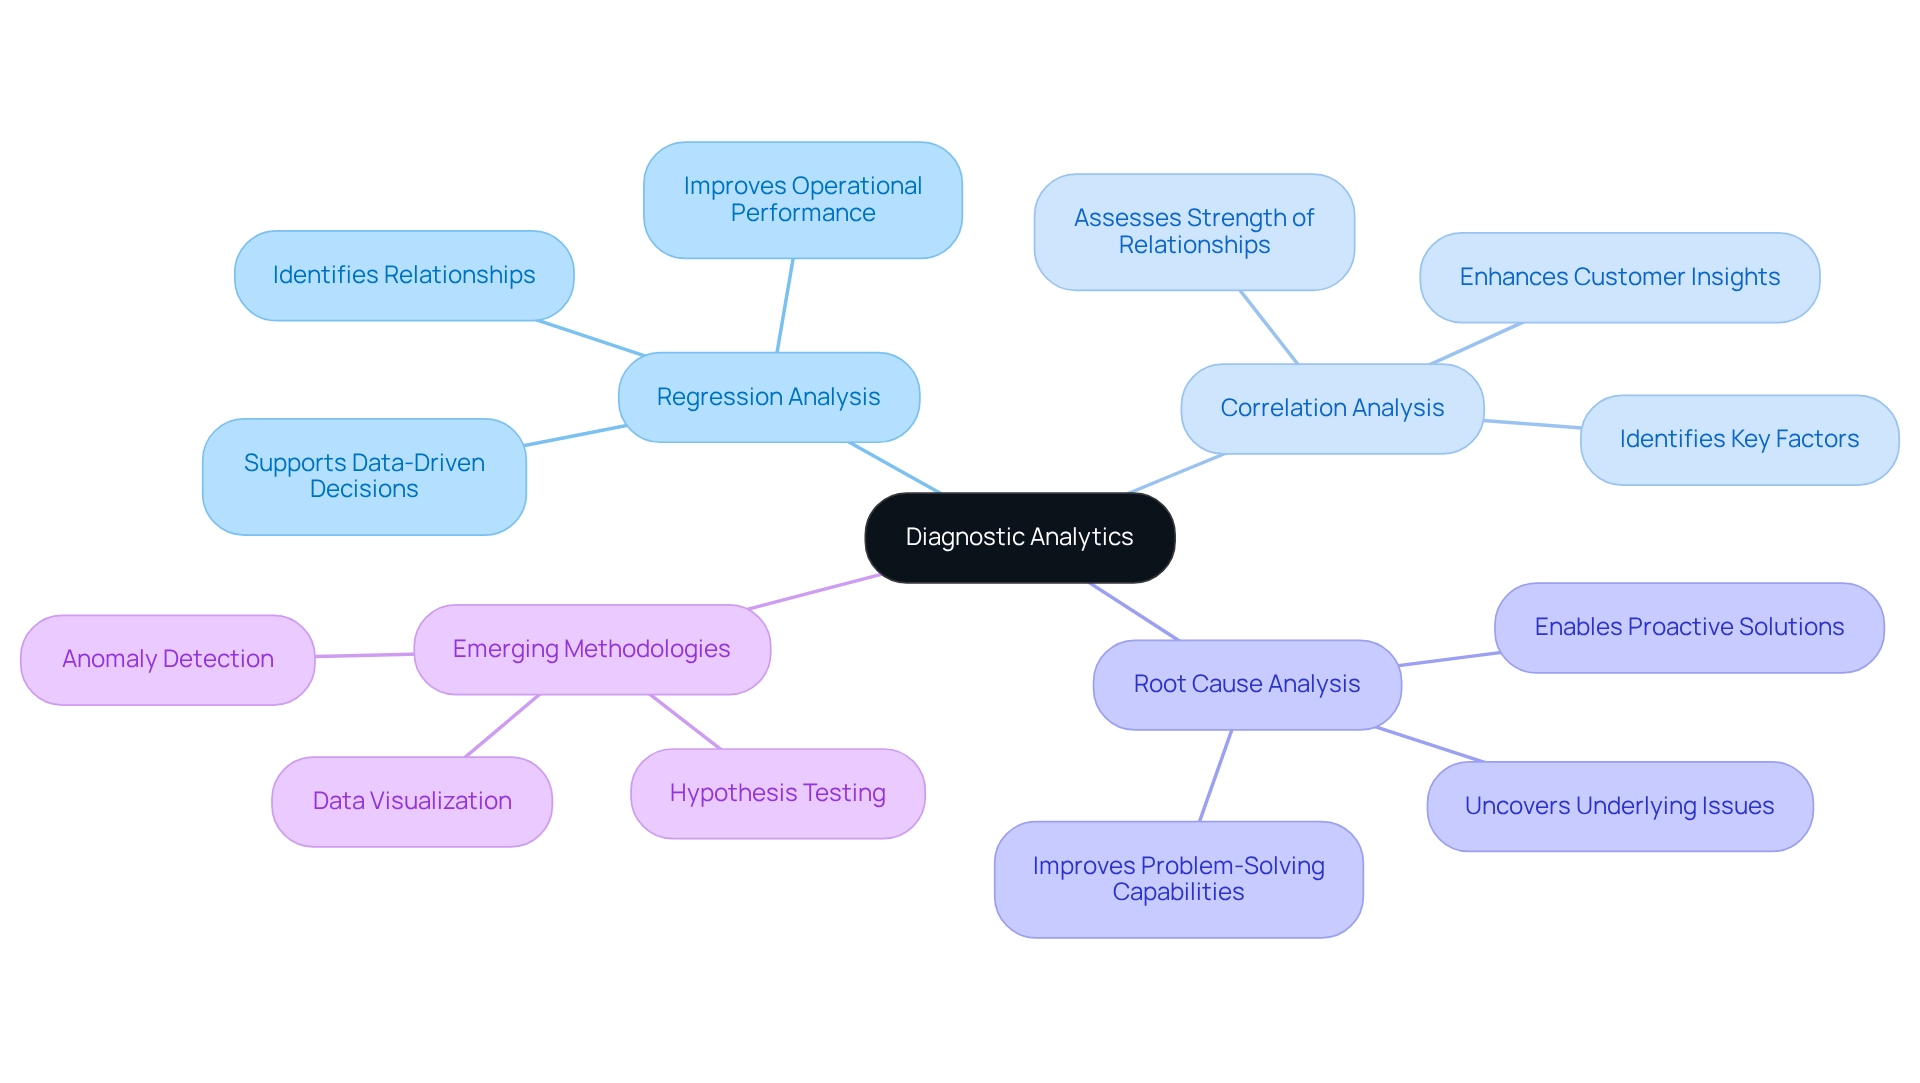
In today’s overwhelming AI landscape, one might wonder: what question does diagnostic analytics answer? This field employs a range of techniques crucial for revealing insights from information. Among the most prominent methodologies are:
- Regression analysis
- Correlation analysis
- Root cause analysis
These can be enhanced through tailored AI solutions from Creatum GmbH, aligning with specific business goals.
Regression analysis is a powerful tool that identifies relationships between variables, allowing organizations to understand how changes in one factor can influence another. This technique has gained traction in recent years, reflecting a growing reliance on data-driven decision-making. As Jan Hammond, a Harvard Business School Professor, states, “Regression enables us to obtain insights into the structure of that relationship and offers measures of how well the information aligns with that relationship.”
Organizations employing regression analysis can substitute intuition with empirical information, leading to more informed decisions and improved operational performance.
Correlation analysis complements regression by assessing the strength and direction of relationships between variables. This technique is particularly valuable for organizations seeking actionable insights, as it helps identify which factors are most closely linked to desired outcomes. Numerous enterprises have effectively utilized correlation analysis to enhance their strategies and deepen customer insight, ultimately fostering innovation.
Root cause analysis delves deeper into information, aiming to uncover the underlying reasons for specific outcomes. This technique is crucial for identifying business problems and implementing effective solutions. Current statistics indicate that organizations employing root cause analysis experience marked improvements in problem-solving capabilities, enabling them to address issues proactively rather than reactively.
As we approach 2025, the landscape of diagnostic analytics continues to evolve, with methodologies such as hypothesis testing, anomaly detection, and visualization becoming increasingly common. Data representation plays a crucial role in simplifying intricate relationships, making it easier for stakeholders to grasp insights swiftly. The past decade has seen companies becoming more reliant than ever on information, underscoring the significance of these developing methodologies in enhancing operational efficiency and organizational growth.
However, companies struggling to extract meaningful insights may find themselves at a competitive disadvantage.
Case studies illustrate the effectiveness of these techniques. For instance, the case study titled ‘Improving Business Decisions through Information Analysis’ emphasizes how information analysis enhances decision-making by offering insights that substitute intuition with factual evidence. Organizations that have leveraged regression and correlation analysis have reported significant improvements in their decision-making processes, leading to a competitive advantage in their respective markets.
By utilizing these diagnostic evaluation methods and the strength of Business Intelligence, companies can convert raw information into actionable insights, promoting growth and innovation.
Real-World Applications of Diagnostic Analytics Across Industries
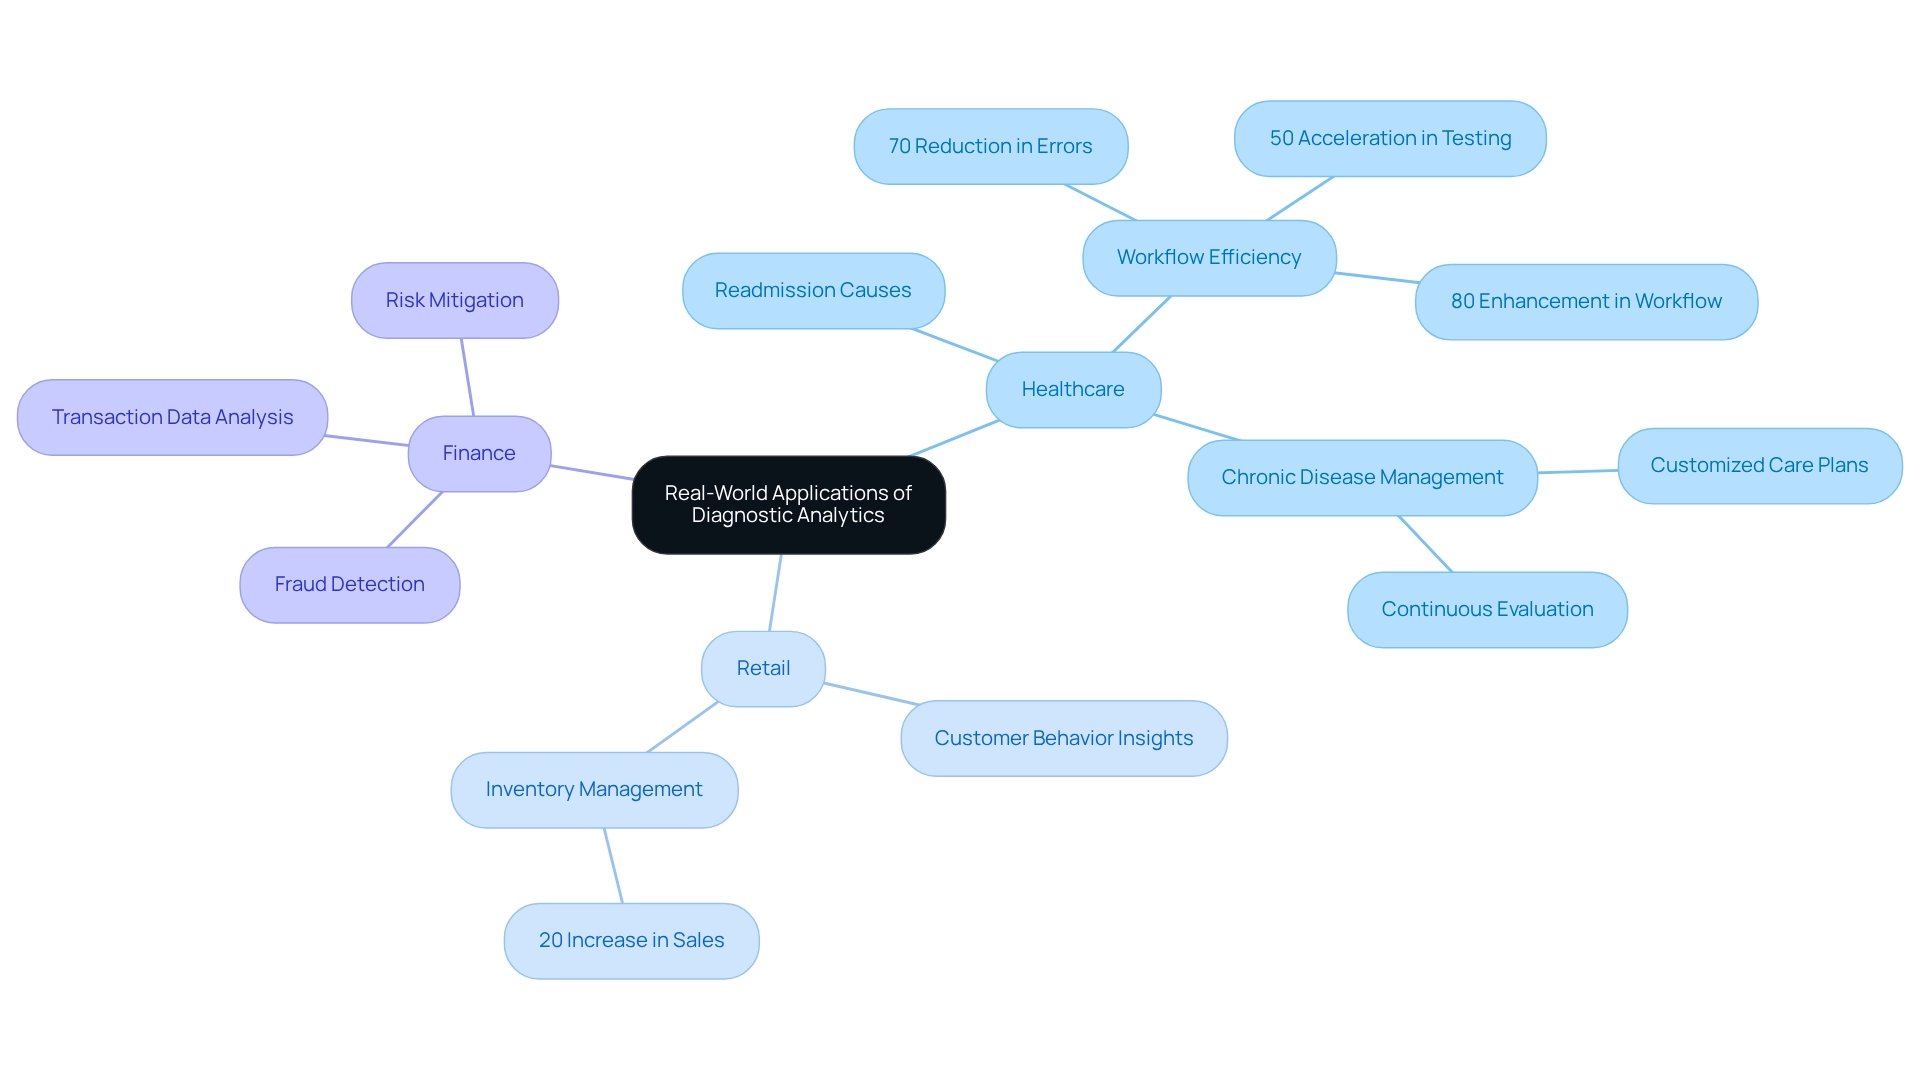
Understanding the role of diagnostic analytics across various industries reveals its capacity to answer critical questions that drive significant improvements in operational efficiency and decision-making. In healthcare, for example, diagnostic analytics is instrumental in identifying the underlying causes of patient readmissions. By thoroughly examining patient information, hospitals can uncover specific factors contributing to readmissions, enabling them to implement targeted interventions that enhance care quality and patient outcomes.
A noteworthy case study from Creatum GmbH illustrates how a mid-sized healthcare firm achieved remarkable efficiency by automating information entry and software testing through GUI automation. This implementation not only reduced information entry errors by 70% but also accelerated testing processes by 50%, culminating in an impressive 80% enhancement in workflow efficiency. Such measurable outcomes underscore the transformative impact of Creatum’s technology solutions on operational efficiency within healthcare services.
Moreover, personalized chronic disease management is significantly improved through the analysis of patient information, facilitating the development of customized care plans tailored to individual needs. Continuous evaluation, driven by patient feedback data, fosters a culture of excellence in healthcare delivery, ultimately elevating patient care standards.
In the retail sector, data analysis proves equally revolutionary. Businesses harness these techniques to gain insights into customer behavior, addressing pivotal questions that diagnostic analytics can answer, which informs inventory management strategies. For instance, Canadian Tire utilized AI-driven analysis to scrutinize purchasing behavior, leading to an impressive 20% increase in sales.
This demonstrates how understanding customer preferences through analytical assessments can effectively address what diagnostic analytics answers, ultimately optimizing stock levels and minimizing surplus inventory to enhance profitability.
Furthermore, diagnostic analysis plays a crucial role in finance, addressing key questions by enabling organizations to examine transaction data and reveal fraud patterns. By leveraging these analyses, financial institutions can identify anomalies and mitigate risks, thereby protecting their operations and maintaining customer confidence. As Trinity Cyrus, Marketing Coordinator, states, ‘Prescriptive analysis is used to recommend actions to optimize outcomes,’ illustrating the broader spectrum of data analysis that supports informed decision-making.
These examples highlight the versatility of analytical methods, showcasing their ability to drive enhancements and improve operational efficiency across diverse sectors, from healthcare to retail and finance. The distinctive value offering of organizations lies in delivering tailored solutions that enhance data quality and streamline AI implementation, ensuring businesses can effectively leverage these insights for growth and innovation.
Benefits and Challenges of Implementing Diagnostic Analytics
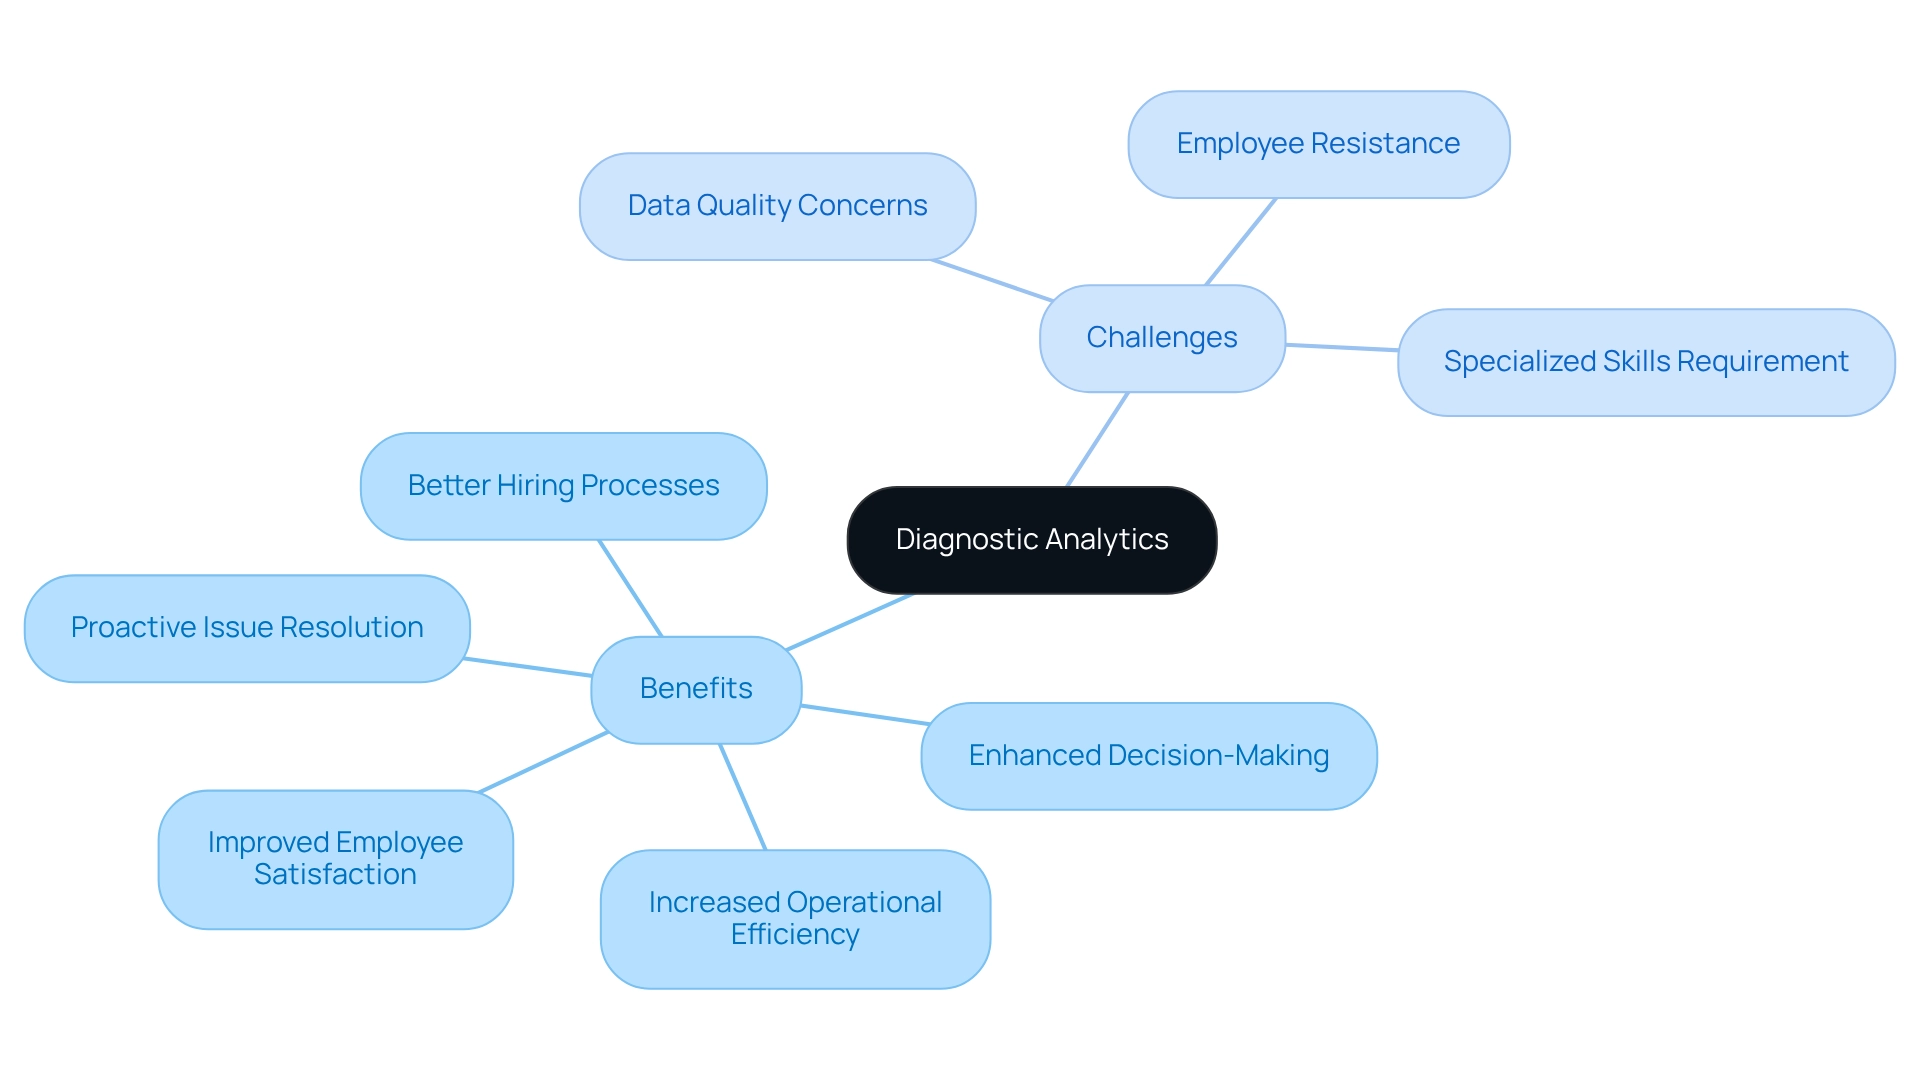
Applying assessment analysis offers numerous advantages, including enhanced decision-making capabilities, increased operational efficiency, and the proactive identification and resolution of issues. Organizations that leverage data analysis gain a deeper understanding of their performance, empowering them to make informed, timely decisions that promote growth. As one expert noted, “Data analysis allows business leaders to make informed, timely decisions and gain greater insights into their operations and clients.”
A pivotal aspect of analytical diagnosis is its ability to uncover the root causes of performance issues by addressing the essential inquiries of diagnostic analytics. However, the path to effective implementation is fraught with challenges. Quality concerns often emerge as a significant barrier, as inaccurate or incomplete data can lead to misleading conclusions.
Moreover, employee resistance to change can hinder the adoption of new analytical processes, as staff may be reluctant to abandon familiar practices. The requirement for specialized skills to analyze data effectively further complicates the landscape, as organizations may struggle to find or develop talent proficient in analytical evaluation. To fully harness the benefits of diagnostic analytics, it is crucial to grasp the fundamental questions that diagnostic analytics seeks to answer.
To navigate these challenges, organizations can employ Robotic Process Automation (RPA) to streamline data collection and processing, thereby enhancing quality and minimizing the time spent on manual tasks. Additionally, customized AI solutions can assist businesses in navigating the rapidly evolving technological landscape, ensuring they adopt the appropriate tools aligned with their specific requirements. The integration of Business Intelligence can transform raw data into actionable insights, facilitating informed decision-making that drives growth and innovation.
For example, Canadian Tire’s experience exemplifies the transformative potential of these strategies. By utilizing ThoughtSpot AI-Powered Analytics to examine the purchasing behavior of new pet owners, the company identified cross-selling opportunities, resulting in an impressive 20% increase in sales within their pets department. This case underscores the importance of addressing data quality issues and fostering a culture open to change, as these factors are vital for realizing the full benefits of data analysis.
Furthermore, organizations that effectively implement analytical assessments can expect improvements in employee satisfaction and retention, as these evaluations enhance hiring processes by identifying the traits of successful candidates. As companies navigate the complexities of implementing diagnostic data analysis, focusing on these advantages while addressing the associated challenges will be essential to unlocking their full potential.
Diagnostic Analytics vs. Other Analytics Types: A Comparative Analysis
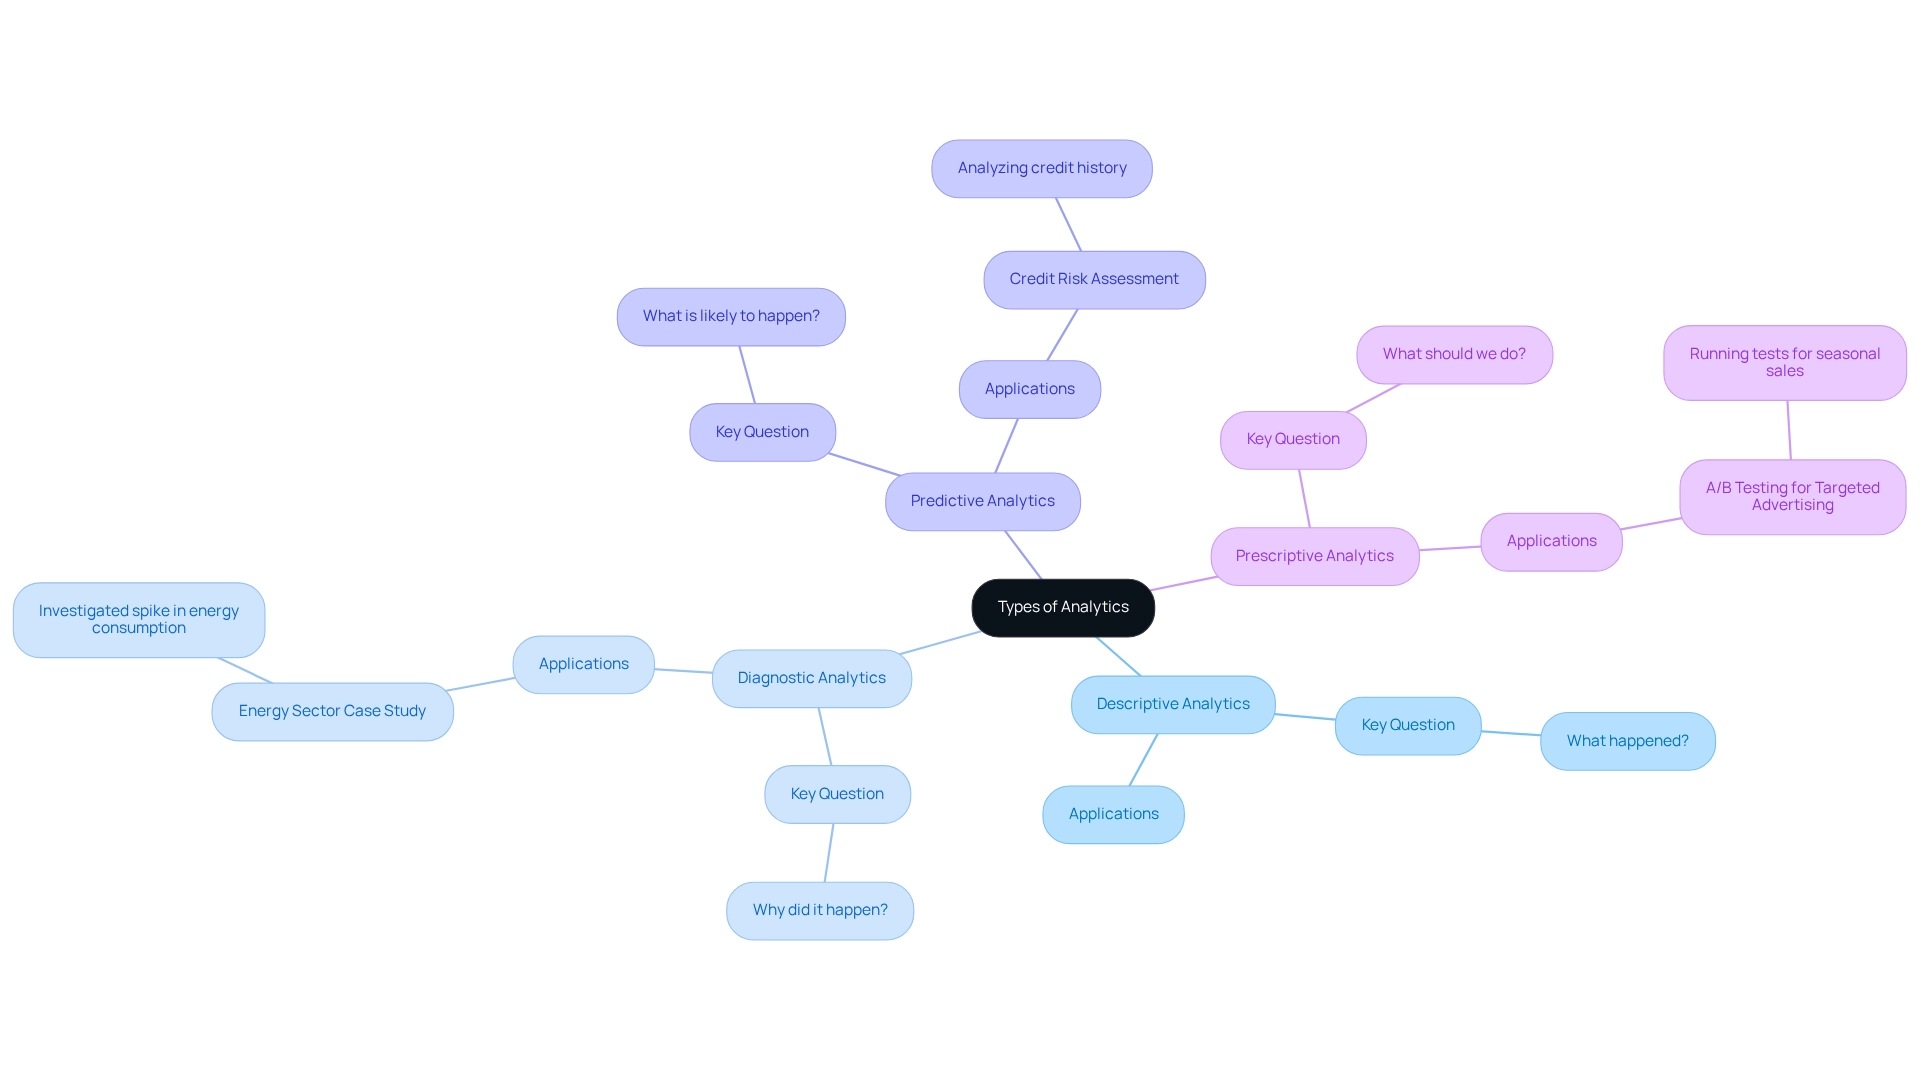
In the analytical landscape, diagnostic analysis is pivotal, as it addresses the question: what does diagnostic analytics answer? This form of analysis distinguishes itself from descriptive, predictive, and prescriptive analytics. While descriptive analysis answers ‘What happened?’, diagnostic analytics delves deeper, exploring ‘Why did it happen?’.
This deeper analysis is essential for organizations seeking to understand the underlying causes of trends and anomalies in their data. In today’s overwhelming AI landscape, identifying the right solutions can be daunting. The challenges of navigating this environment can hinder companies from making informed choices, highlighting the need for customized solutions from Creatum GmbH.
As Akash Jha observes, “By utilizing the correct kind of analysis at the suitable phase, companies can obtain valuable insights, make informed decisions, and ultimately propel success in an increasingly competitive and data-driven environment.” Predictive analysis, on the other hand, uses historical information to forecast future results, assisting businesses in anticipating potential challenges and opportunities. Meanwhile, prescriptive analysis advances this approach by recommending specific actions to achieve desired outcomes based on data examination and various scenarios.
Understanding these distinctions is crucial for organizations aiming to select the most appropriate analytical approach for their specific needs. For instance, a financial organization efficiently employs predictive analysis to assess credit risk by examining applicants’ credit histories, forecasting the probability of loan defaults. In contrast, an energy company utilized diagnostic analysis to investigate a sudden rise in energy usage.
By analyzing consumption data and customer behavior, they determined whether the increase stemmed from seasonal changes or inefficiencies in their distribution system.
Furthermore, statistics indicate that prescriptive analysis can provide actionable insights, such as recommending A/B tests for targeted advertising, significantly enhancing marketing effectiveness. This comparative study underscores how analytical evaluations not only improve predictive and prescriptive methods but also serve as a fundamental component in the decision-making process. By integrating tailored AI solutions from Creatum GmbH and leveraging the power of Business Intelligence, organizations can drive informed decisions and foster growth in an increasingly competitive landscape.
The Future of Diagnostic Analytics: Trends and Innovations
The future of diagnostic assessment is on the brink of significant transformation, driven by advancements in artificial intelligence (AI) and machine learning (ML). These technologies are set to enhance information processing capabilities, resulting in improved accuracy in insights and decision-making. For instance, organizations utilizing accessible large-scale information assessment tools have reported enhanced analysis and decision-making, ultimately improving patient outcomes in healthcare environments.
A study titled ‘Perceived Ease of Use in Big Data Analytics Adoption’ underscores the necessity for intuitive and user-friendly systems. Such tools facilitate superior information analysis and decision-making, thereby enhancing patient outcomes and healthcare delivery.
Moreover, the integration of real-time information analysis is becoming increasingly vital. This capability allows organizations to respond swiftly to emerging trends and issues, thus enhancing operational efficiency. As companies progressively adopt data-driven decision-making, the importance of diagnostic analysis will continue to grow, particularly in addressing the question of what diagnostic analytics can answer, influencing strategic initiatives across various industries.
Additionally, leveraging Robotic Process Automation (RPA) can streamline these processes by automating manual workflows, reducing errors, and enabling teams to focus on strategic tasks that drive growth.
Current trends indicate that the management of electronic health records (EHRs) is significantly enhanced through large-scale information analysis, improving the quality of care. Statistics reveal that big data analytics can optimize EHR management, leading to superior patient care. Looking ahead to 2025, we can anticipate innovations that further simplify assessment processes, making them more intuitive and accessible.
Expert insights suggest that organizations investing in the development of essential capabilities, including RPA and Business Intelligence, are better positioned to leverage these advancements. This results in improved healthcare delivery, enhanced diagnostic accuracy, and personalized treatment strategies. As noted by Alshareef et al., organizations that invest in these capabilities are poised to achieve better patient outcomes.
In summary, the interplay between AI, ML, and real-time data analysis, alongside the strategic implementation of RPA, prompts us to consider what diagnostic analytics can answer. This evolution is set to redefine the landscape of evaluation, making it an essential component of strategic planning and operational success. The demographic profile of the 288 respondents in the Jordanian healthcare sector, showing a balanced gender distribution and diversity in experience, further emphasizes the relevance of these findings in understanding trends in diagnostic analytics.
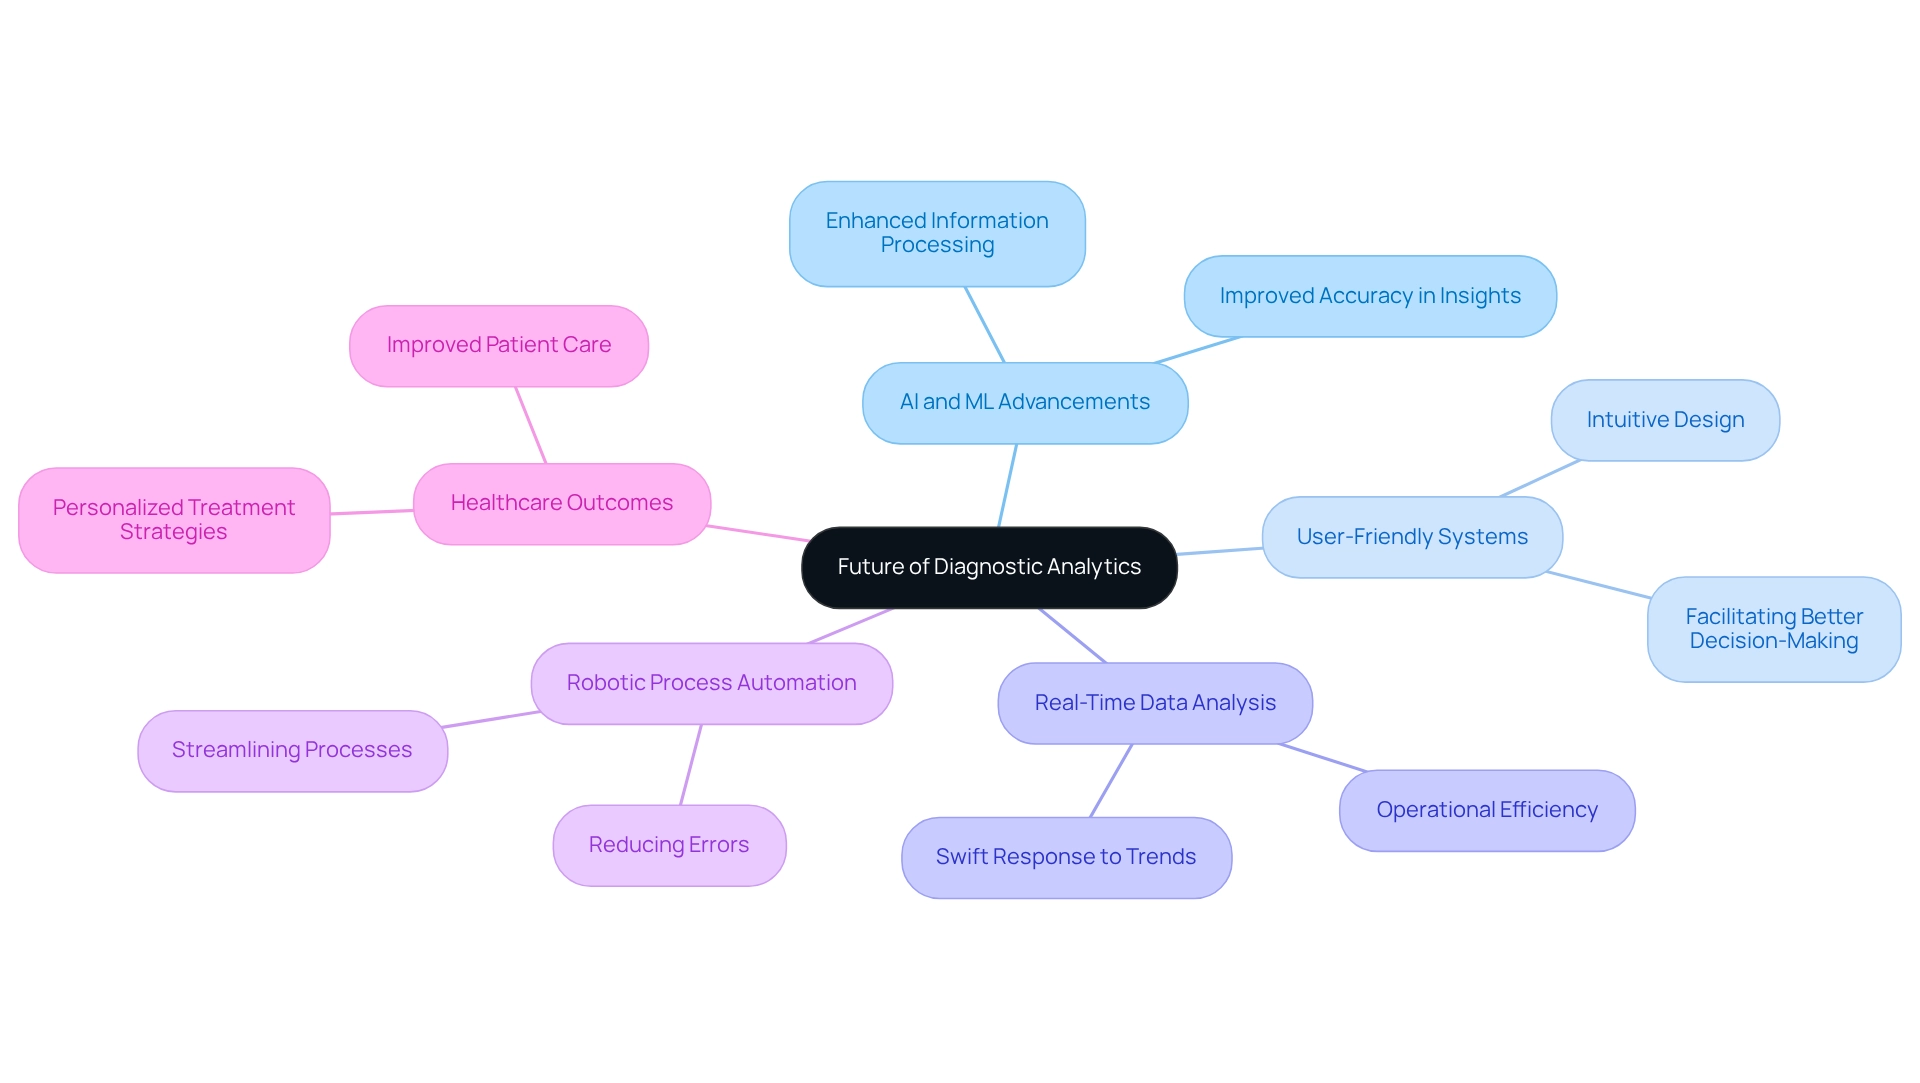
Conclusion
The exploration of diagnostic analytics underscores its vital role in enhancing organizational decision-making and operational efficiency across diverse sectors. By addressing the fundamental question of ‘why,’ diagnostic analytics empowers businesses to uncover the root causes of past events, facilitating informed strategies that drive growth. Methodologies such as regression analysis and root cause analysis illustrate how organizations can transform raw data into actionable insights, ultimately leading to more effective problem-solving and performance improvements.
Real-world applications of diagnostic analytics across industries—from healthcare to retail—demonstrate its versatility and transformative potential. The ability to analyze customer behavior, optimize inventory, and improve patient care not only enhances operational efficiency but also fosters innovation. However, organizations must navigate challenges such as data quality and employee resistance to fully harness these benefits. By adopting advanced analytical techniques and integrating solutions like Robotic Process Automation, businesses can streamline processes and enhance data quality, paving the way for successful implementation.
Looking ahead, the future of diagnostic analytics is poised for significant advancement, driven by artificial intelligence and machine learning, promising to further refine data processing capabilities. As organizations increasingly embrace data-driven decision-making, the importance of diagnostic analytics will continue to escalate. By investing in the right tools and methodologies, businesses can position themselves at the forefront of their industries, leveraging diagnostic analytics as a cornerstone for strategic planning and operational success. In an ever-evolving data landscape, the power of diagnostic analytics emerges as an indispensable asset for driving growth and fostering innovation.
Frequently Asked Questions
What is diagnostic analytics?
Diagnostic analytics is a branch of analytical study that investigates the reasons behind past occurrences or trends by analyzing historical data to reveal root causes of issues, which aids in informed decision-making and improving future outcomes.
What questions does diagnostic analytics answer?
Diagnostic analytics addresses key inquiries such as: 1. Why did sales decline during a specific period? 2. What factors contributed to increased customer churn? 3. Why did a marketing campaign fail to generate expected results?
How does diagnostic analytics improve organizational performance?
By systematically addressing questions about past performance, organizations can uncover underlying issues and develop targeted strategies to prevent recurrence, ultimately enhancing operational efficiency and decision-making processes.
What role does evaluative analysis play in organizations?
Evaluative analysis helps organizations identify inefficiencies and proactively tackle challenges, improving customer retention rates and overall performance through insights derived from historical data.
What tools can enhance diagnostic analytics?
Integrating tailored AI solutions, Business Intelligence tools, and Robotic Process Automation (RPA) solutions can significantly enhance diagnostic analytics by streamlining data gathering and analysis, leading to more effective decision-making.
Can you provide an example of diagnostic analytics in action?
Canadian Tire utilized AI-driven insights to analyze the purchasing behaviors of new pet owners, resulting in a nearly 20% increase in sales by identifying cross-selling opportunities.
What challenges do organizations face when using diagnostic analytics?
Organizations may struggle with differentiating correlation from causation, ensuring data quality, and the demand for advanced analytical skills, which can complicate the effective application of assessment techniques.
Why is understanding past events important in commercial analysis?
Understanding past events is crucial as it helps organizations answer fundamental questions about performance, laying the groundwork for future achievements and innovations.
Overview
This article delves into the distinctions between calculated columns and measures in Power BI, highlighting their unique functionalities and applications in data analysis.
- Calculated columns operate on a row-by-row basis, stored in the data model for static calculations.
- In contrast, measures are dynamic, calculated at query time, facilitating real-time data analysis based on user interactions.
This distinction is crucial for effective business intelligence, as it allows organizations to leverage data more efficiently. Understanding these differences empowers professionals to enhance their data analysis strategies and make informed decisions.
Introduction
In the realm of data analysis, Power BI emerges as a formidable tool that empowers organizations to convert raw data into actionable insights. At the heart of its functionality lie calculated columns and measures—two essential features serving distinct purposes in data modeling.
- Calculated columns enable users to create new data fields based on existing information, while measures offer dynamic calculations that adapt to user interactions, significantly enhancing the analytical prowess of reports.
Understanding the nuances between these two elements is vital for maximizing efficiency and effectiveness in data visualization. As businesses endeavor to harness their data for strategic decision-making, mastering calculated columns and measures becomes imperative for navigating the complexities of modern data landscapes.
This article explores the definitions, applications, performance considerations, and best practices associated with calculated columns and measures in Power BI, equipping users with the knowledge to optimize their data analysis processes.
Defining Calculated Columns and Measures in Power BI
In Power BI, a calculated field represents a new entry created within a table using DAX (Data Analysis Expressions) formulas. Each value in this calculated section is computed on a row-by-row basis, evaluating the expression for every individual row in the table. This process mirrors the addition of a new column in Excel, where each entry is determined independently.
Conversely, a metric signifies a computation assessed across the entire framework, primarily utilized for aggregation. Measures are dynamic; they are calculated at query time and adapt to the filters applied in reports. This characteristic enables actions to provide insights that reflect the current context of the information being examined, which is crucial for companies aiming to leverage data efficiently in a competitive landscape.
Recent statistics indicate that a significant percentage of BI users employ calculated columns; however, metrics remain the preferred choice for dynamic analysis due to their ability to respond to real-time interactions. For instance, in the case study titled “Using Statistical Techniques in Power BI,” Douglas Rocha explores the application of statistical techniques in Power BI, underscoring their importance in analysis. He utilizes a Car Sales dataset to demonstrate how to evaluate sale values using statistical methods, including the mean, median, and mode.
The mode can be calculated using the expression:
Mode = MINX ( TOPN( ADDCOLUMNS( VALUES (CarSales[Sale Value]), 'Frequency', CALCULATE(COUNT(CarSales[Sale Value])) [Frequency], CarSales[Sale Value]) )
This example illustrates how strategies can enhance data analysis, providing actionable insights for decision-making and addressing challenges such as inconsistencies and the need for practical guidance.
Furthermore, the latest updates in BI 2025 have introduced features that allow users to classify metrics, design dedicated tables for them, and customize their visual presentation using dynamic format strings. This evolution highlights the growing significance of metrics in data analysis, as emphasized by Kevin, a BI Consultant, who states, “BI enables organizations to transform their data into valuable insights.” It is also essential to note that for binary-typed fields, Min and Max statistics will yield BLANK values.
A thorough understanding of the distinction between calculated columns and measures is vital for effectively utilizing BI, particularly in enhancing operational efficiency through RPA and BI solutions offered by Creatum GmbH, such as EMMA RPA and Automate, which tackle task repetition fatigue and staffing shortages.
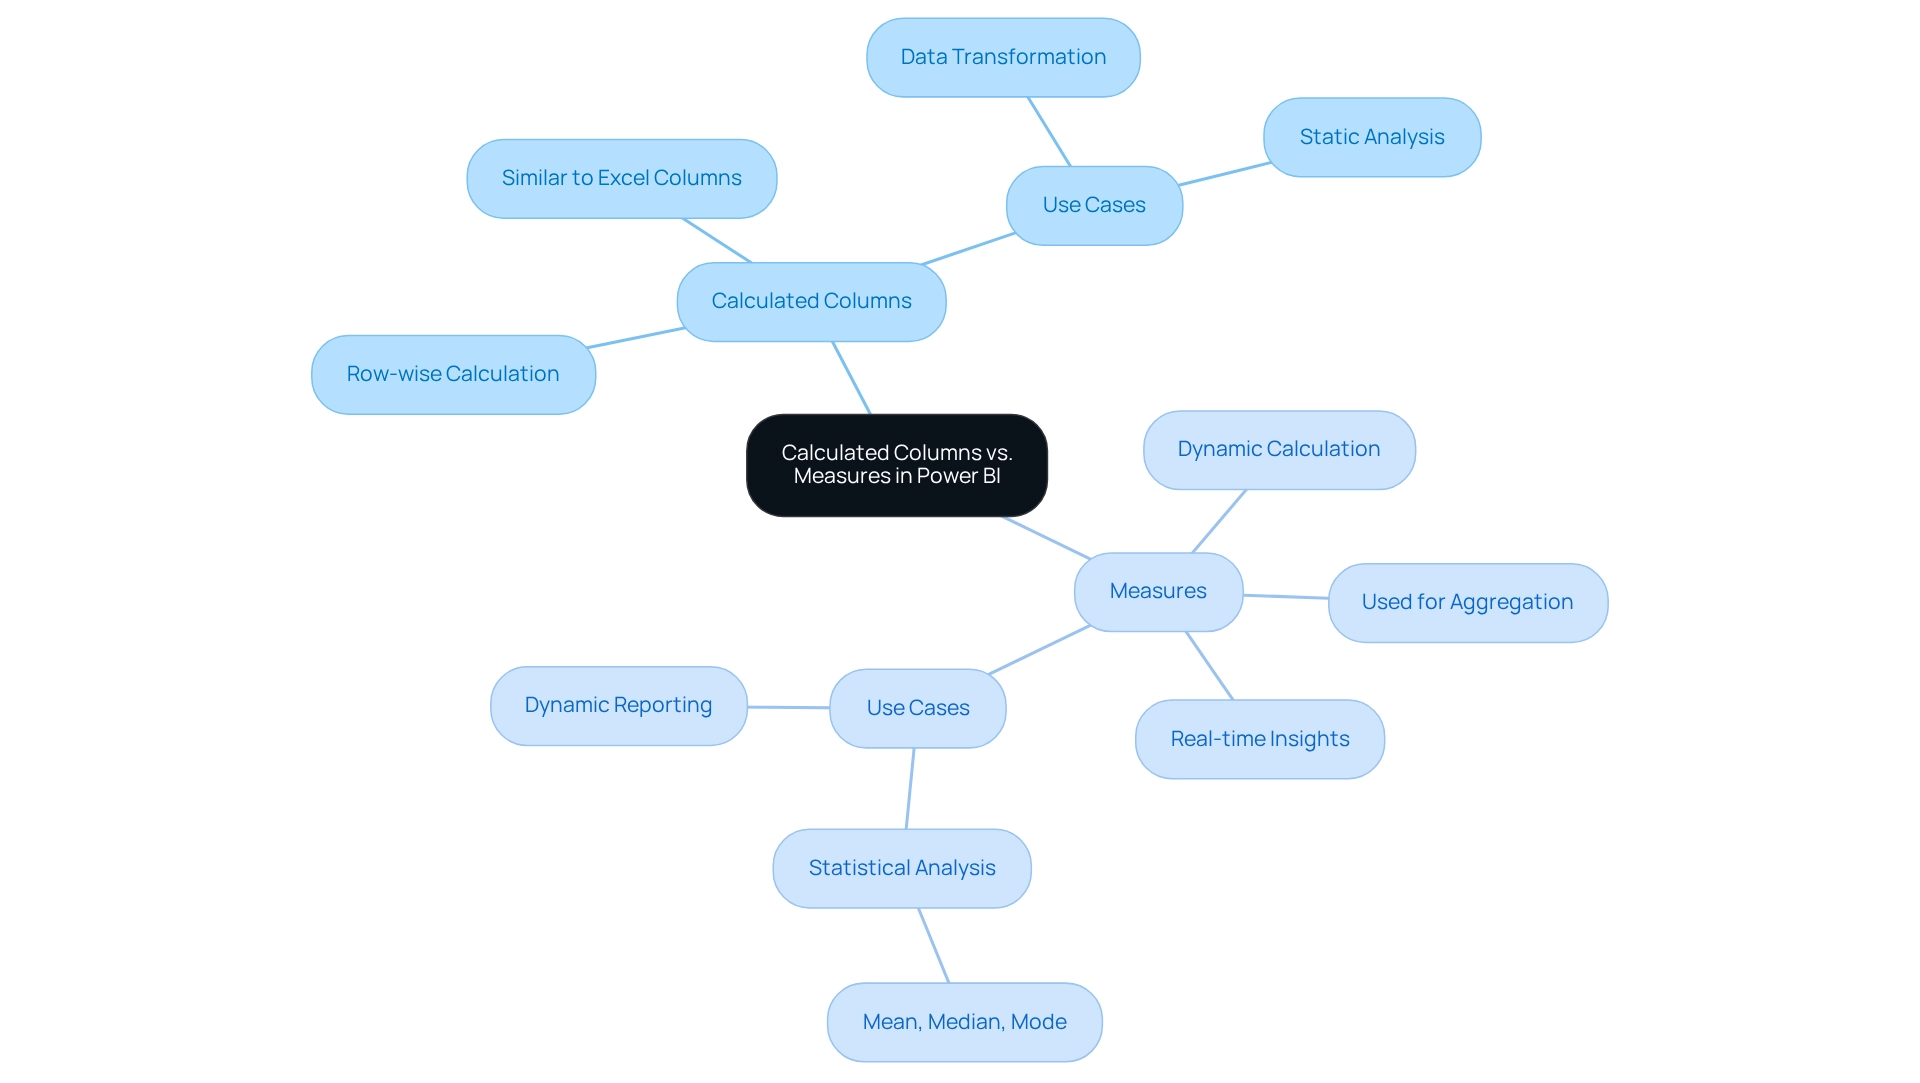
Key Differences Between Calculated Columns and Measures
In Power BI, calculated columns operate within a row context, meaning each row is processed independently. This functionality allows for the creation of new information fields based on existing row values. Conversely, measures are assessed in a filter context, enabling them to compile information dynamically based on the filters implemented in reports.
Understanding the difference between calculated columns and measures is essential for comprehending how information is manipulated and presented in your visualizations. However, many users find themselves spending more time creating reports than utilizing insights from BI dashboards. This often results in inconsistencies in information and a lack of actionable guidance. With 2,986 users online, the significance and popularity of Power BI as a tool for data visualization are evident, underscoring the necessity of mastering these concepts to address these frequent challenges.
Calculated attributes are stored directly in the data model, which can lead to an increase in the model’s size and potentially affect performance adversely. In contrast, metrics are not saved; they are calculated as needed, typically leading to more efficient memory utilization. This efficiency is particularly advantageous when managing large datasets, as it helps sustain optimal performance and facilitates the pursuit of operational effectiveness critical for business expansion.
The decision regarding the difference between calculated columns and measures primarily hinges on the distinct needs of your analysis. Calculated columns are especially beneficial when creating new fields for filtering or grouping information, such as categorizing sales figures by region. Measures, on the other hand, are ideal for calculations that must adapt dynamically based on user interactions with the report, such as calculating total sales or average revenue per user.
As noted by Matt Snively, despite numerous new challengers over the years in the realm of information visualization, the right tools remain crucial for effective analysis. Understanding these use cases can significantly enhance your reporting capabilities in Power BI, empowering you to unlock the power of Business Intelligence and drive informed decision-making. Furthermore, establishing a robust governance strategy can help mitigate inconsistencies, while leveraging the General Management App and Microsoft Copilot Integration can further elevate your operational efficiency.
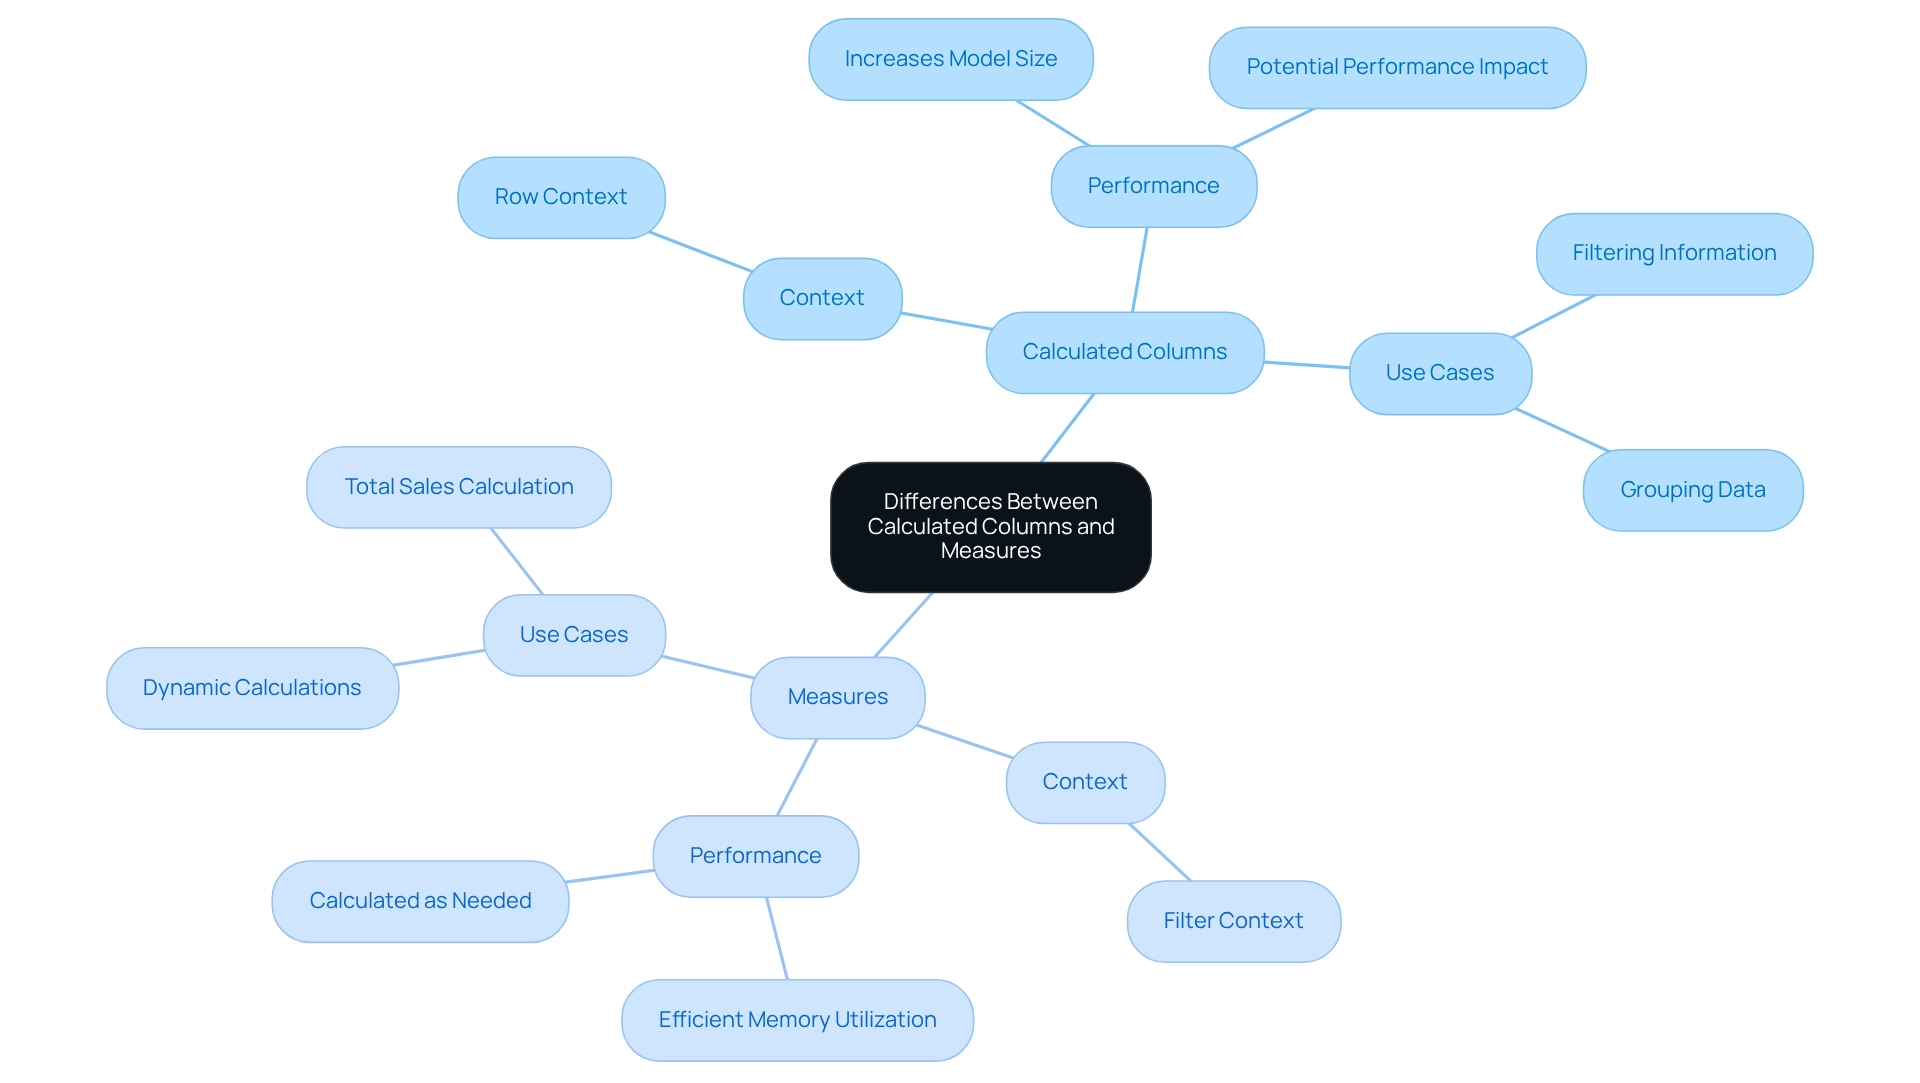
When to Use Calculated Columns vs. Measures
Utilize calculated columns in the following scenarios:
- When you need to create a new field for filtering or grouping data. For example, if you wish to classify sales information by region, a computed field can assist you in accomplishing this.
- When the calculation is static and does not require adjustments based on user interactions. An example would be a section that calculates a fixed tax rate applied to sales, which remains constant regardless of the report context.
Guideline for Writing Calculated Column Formulas: The convention for writing calculated column formulas includes the table name and column name followed by the DAX expression.
On the other hand, employ measures when:
- You need dynamic calculations that adapt to filters and slicers within your reports. For instance, if you wish to compute total sales that vary according to chosen time frames or product categories, metrics are vital.
- You are executing aggregations, such as sums or averages, that rely on the present context of the information. For example, if Janice, a sales manager at Contoso, wishes to forecast future sales based on the information from the previous year with a six percent rise, she would develop a formula to dynamically compute these forecasts as filters are applied. This practical application demonstrates how techniques can improve information analysis.
Practical Guidance: To use a metric in a visualization, select the visualization and drag the metric from the Fields pane to the appropriate field well.
Understanding the difference between calculated column and measure is vital for efficient analysis in Power BI. As Douglas Rocha, a statistics enthusiast, observes, “Even though one can assume it is the simpler of all statistical measures since it is only the most common value in the dataset, there isn’t a native DAX function to calculate it.” Adhering to these guidelines will assist in guaranteeing that your reports are both effective and informative, tackling issues such as information inconsistencies and improving decision-making abilities, ultimately fostering business growth.
At Creatum GmbH, we provide BI services that include a 3-Day Sprint for quick report generation and the General Management App for thorough oversight and intelligent evaluations.
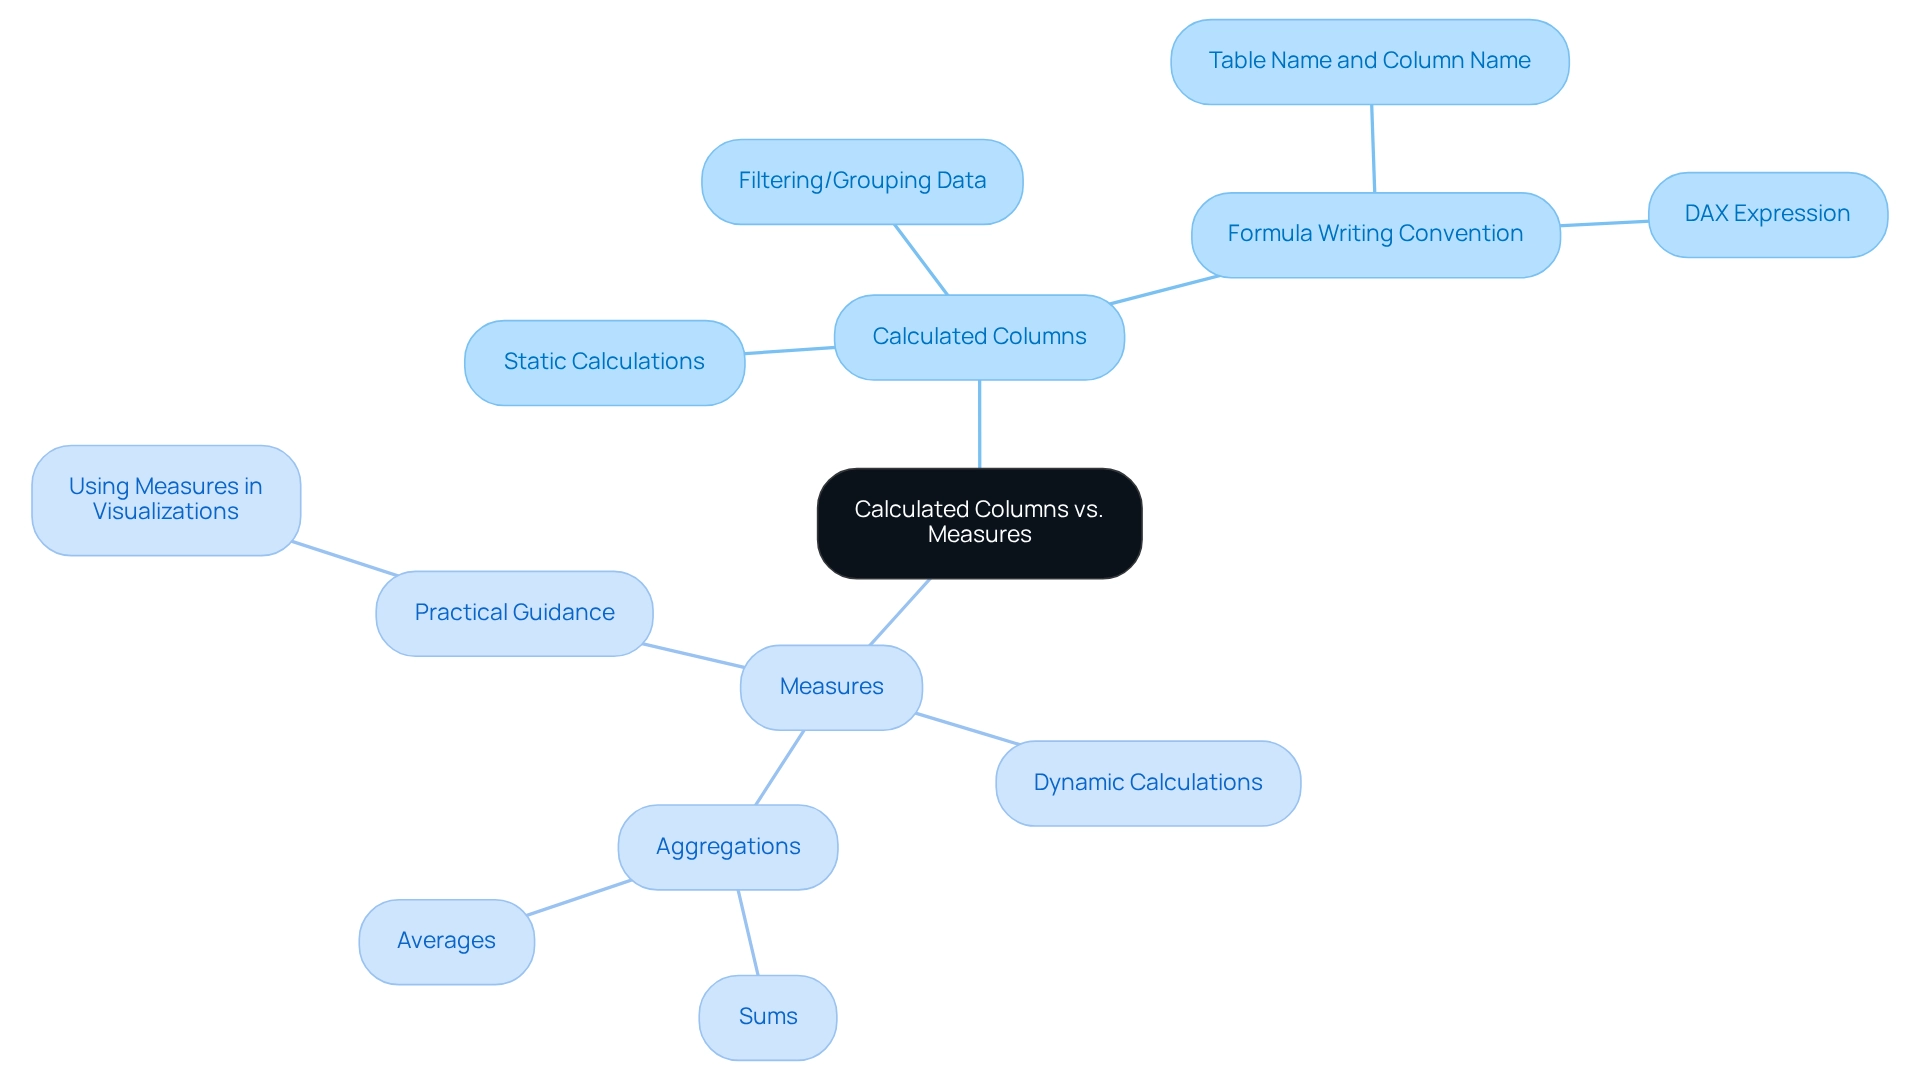
Performance Considerations: Calculated Columns vs. Measures
When assessing performance in Power BI, understanding the difference between calculated columns and measures is essential. This distinction addresses frequent challenges such as time-consuming report generation, inconsistencies in information, and the absence of actionable advice.
-
Calculated Columns: These are stored directly in the data model, which can lead to increased model size and longer refresh times. Since calculated fields are pre-calculated, they occupy memory, presenting a significant concern when working with large datasets. A recent analysis indicated that models utilizing computed fields experienced refresh times that were, on average, 30% longer compared to those using measures. This performance decline is especially noticeable in large tables where numerous calculated fields are utilized. The challenge of overseeing these sections is heightened by the possibility of discrepancies in data across different reports, leading to confusion and distrust among stakeholders. Notably, this topic has garnered significant interest, as evidenced by 5,001 views on related discussions.
-
Metrics: Conversely, metrics are computed at query time, indicating they do not utilize memory in the same way as calculated columns. This characteristic allows for more efficient memory usage, especially in scenarios involving large datasets. However, it is essential to note that intricate actions can still adversely affect performance. Measures involving complex calculations or aggregating large volumes of data may lead to slower query responses. As Mike Honey, a notable member of the BI community, remarked, “I lean towards them for that reason but mainly because they are much easier to write, debug and test.”
To illustrate the significance of enhancing performance, consider the case study on query folding in Business Intelligence. Query folding enables efficient information retrieval by sending a single request to the source, significantly improving performance. However, if complex transformations are applied within Power BI, it can disrupt query folding, leading to slower refresh times.
This situation often arises when reports are filled with numbers and graphs yet lack clear, actionable guidance, leaving stakeholders without a clear direction on the next steps. Therefore, it is advisable to execute transformations at the source level whenever feasible to maintain query folding and ensure quicker, more efficient processing.
In summary, while the difference between calculated columns and measures can streamline model construction, careful thought is required regarding their effect on model size and refresh durations. Measures, while more efficient in terms of memory usage, require optimization to prevent performance bottlenecks. Balancing the use of both features is essential for achieving optimal performance in Business Intelligence.
Furthermore, tackling issues related to evaluating computed fields performance is essential for users aiming to improve their BI experience and navigate the difficulties of report generation and data management. At Creatum GmbH, we encourage you to explore these insights further to optimize your reporting processes.
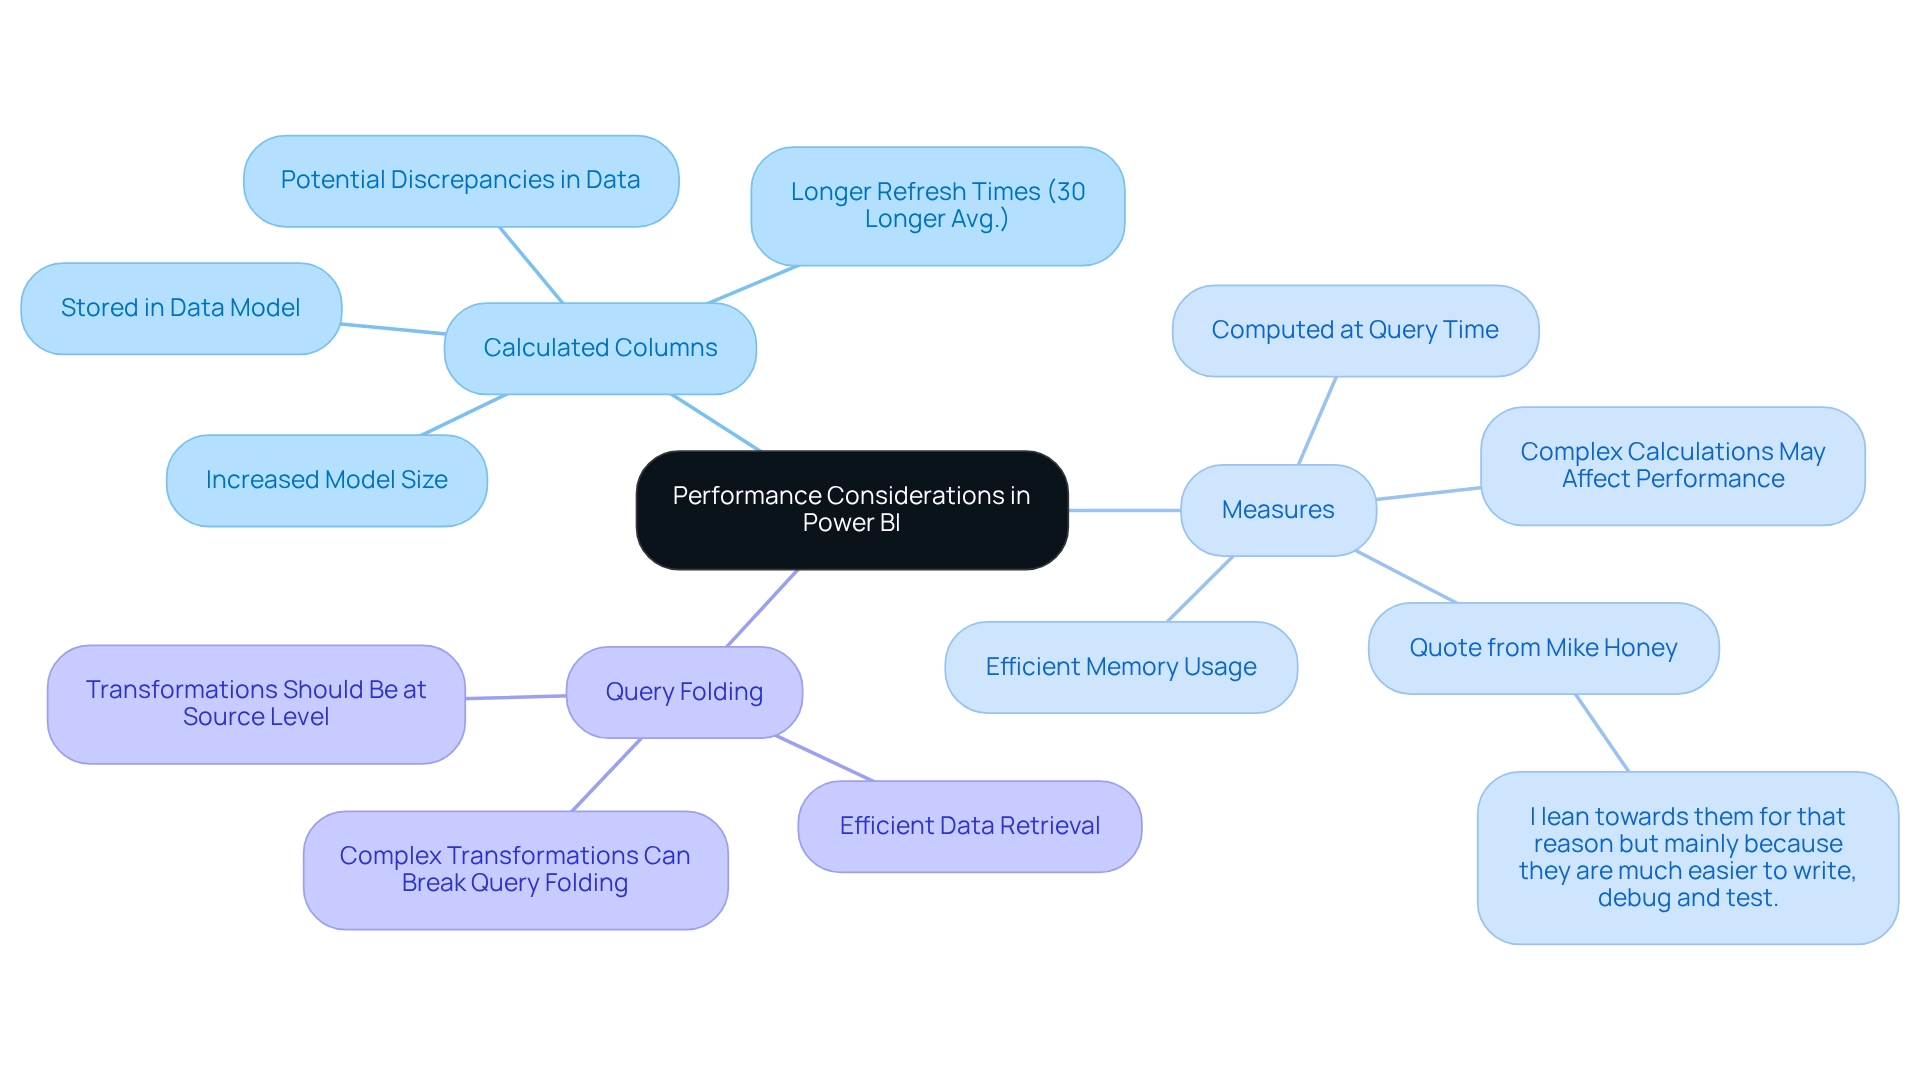
Common Pitfalls and Solutions in Using Calculated Columns and Measures
Common pitfalls in using calculated columns and measures in Power BI include:
-
Overusing Calculated Fields: A prevalent error among users is the excessive creation of calculated fields for every required calculation. This practice can lead to bloated data models, ultimately hampering performance and complicating report creation. Instead, utilizing methods for dynamic calculations is often more efficient, as these do not consume memory resources like calculated fields do. As Rico Zhou explains, “When we complete the DAX code of a computed field, it will consume resources like memory.” However, an action won’t consume resources when it is completed.
-
Ignoring context is another critical mistake. Understanding the evaluation context is essential when discerning the difference between a calculated column and a measure. Misjudging this can lead to incorrect calculations and misleading insights, further complicating the reporting process. It is vital to assess the specific requirements of your analysis to determine the most suitable approach.
-
Performance Issues: Users frequently overlook the performance effects of calculated columns, which can significantly hinder report generation and exacerbate inconsistencies. Utilizing the Performance Analyzer tool in Power BI can assist in pinpointing bottlenecks and enhancing performance. For instance, a case study on optimizing Power Query showcased a 27% decrease in refresh time by reducing transformation steps, underscoring the importance of efficient information processing in enhancing overall performance in Power BI.
-
User Error Rates: Statistics indicate that user error rates associated with calculated fields and measures can be elevated, particularly among those unfamiliar with DAX functions. Studies reveal that nearly 30% of users encounter issues due to misunderstandings of these concepts. This not only impacts the accuracy of reports but also contributes to confusion and mistrust in the information presented. Training and resources can mitigate these errors, ensuring users make informed decisions when implementing calculations.
-
Expert Insights: Power BI specialists emphasize the importance of avoiding excessive use of calculated fields. As highlighted by industry experts, the distinction between a calculated column and a measure should depend on specific analytical requirements, as each serves a distinct role in modeling. This strategic choice can enhance information quality and simplify AI implementation, ultimately driving growth and innovation in analytics.
By recognizing these typical traps and applying strategic solutions, users can enhance their BI experience, resulting in improved information quality, more efficient decision-making, and a streamlined reporting process.
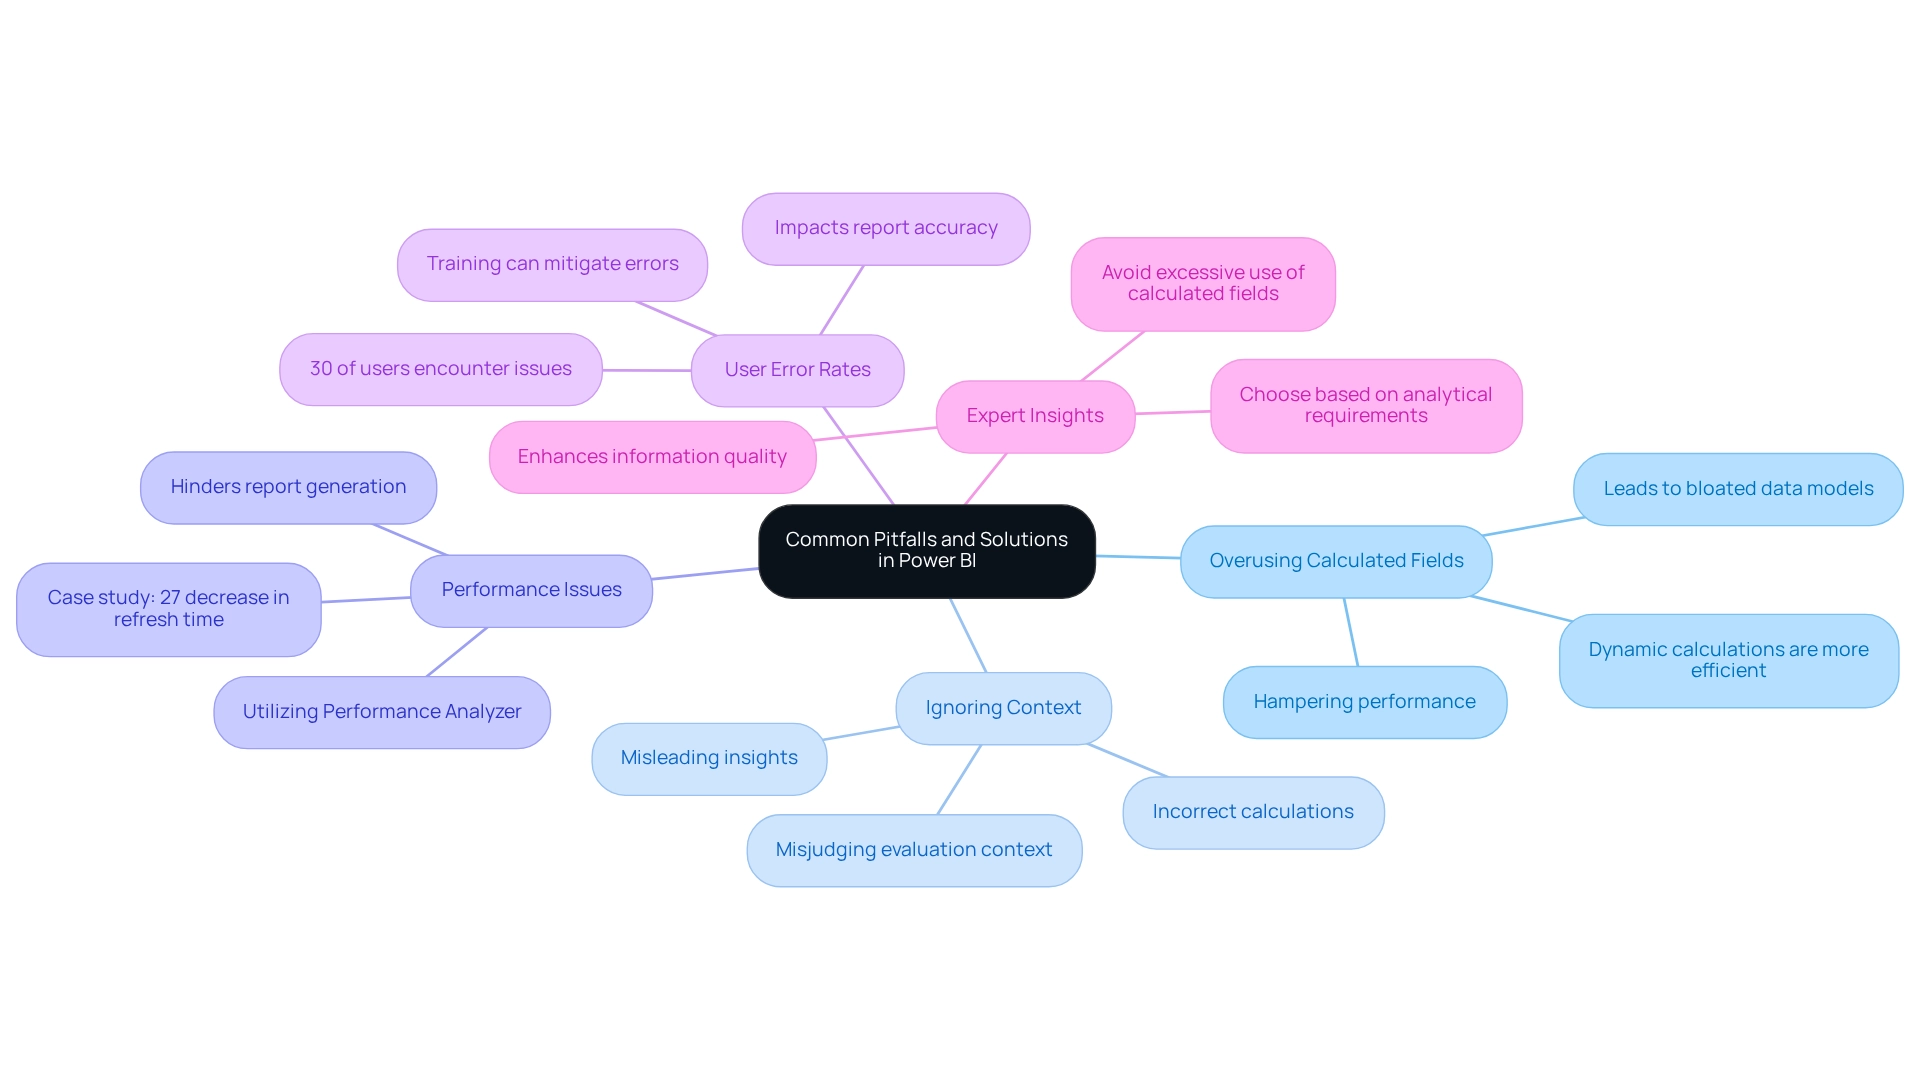
Practical Examples: Using Calculated Columns and Measures in Power BI
Example of a Calculated Column
In Power BI, calculated columns serve as a powerful tool for creating new attributes derived from existing data. For instance, when analyzing a sales table, you may want to compute the total price for each transaction. By defining a calculated field with the formula: Total Price = Quantity * Unit Price, you can derive static values that are instrumental in further analysis or reporting.
Calculated columns excel in generating static values, creating new attributes, and executing calculations at the row level. This capability is essential for addressing challenges like data inconsistencies in reporting.
Example of a Measure
On the other hand, measures are crafted for dynamic calculations that adapt to user interactions within reports. For example, to calculate total sales that adjust based on filters applied by users, you would use the formula: Total Sales = SUM(Sales[Total Price]). This method provides a versatile approach to examining sales information, ensuring that the results reflect the current context of the report. Consequently, this enhances the actionable insights derived from your BI dashboards.
Practical Applications and Case Studies
Grasping the distinction between calculated columns and measures is vital for effective data modeling in Power BI. A significant case study revolves around calculating the Average Order Value (AOV). If one incorrectly utilizes a calculated field, they might sum individual order values, resulting in inaccurate outcomes.
Instead, employing a method that accurately combines total sales and total orders will yield a true average. This reinforces the principle that summing ratios does not equate to averaging. This case study underscores the necessity of utilizing measures over calculated columns for precise data analysis, which is crucial for leveraging insights effectively and propelling business growth.
Expert Insights
Experts highlight the importance of mastering DAX (Data Analysis Expressions) to optimize formula results in Power BI. As noted by Elisenda Gascon, ‘Explore DAX query language in Business Intelligence: learn about Evaluation Contexts and their impact on code for improved formula results.’ A deep understanding of evaluation contexts can significantly enhance the effectiveness of your calculations, leading to more insightful data analysis.
Moreover, the continuous sharing of insights through blogs and thought leadership in the Power BI domain fosters a culture of ongoing learning and improvement. This culture is essential for overcoming the challenges associated with time-consuming report creation.
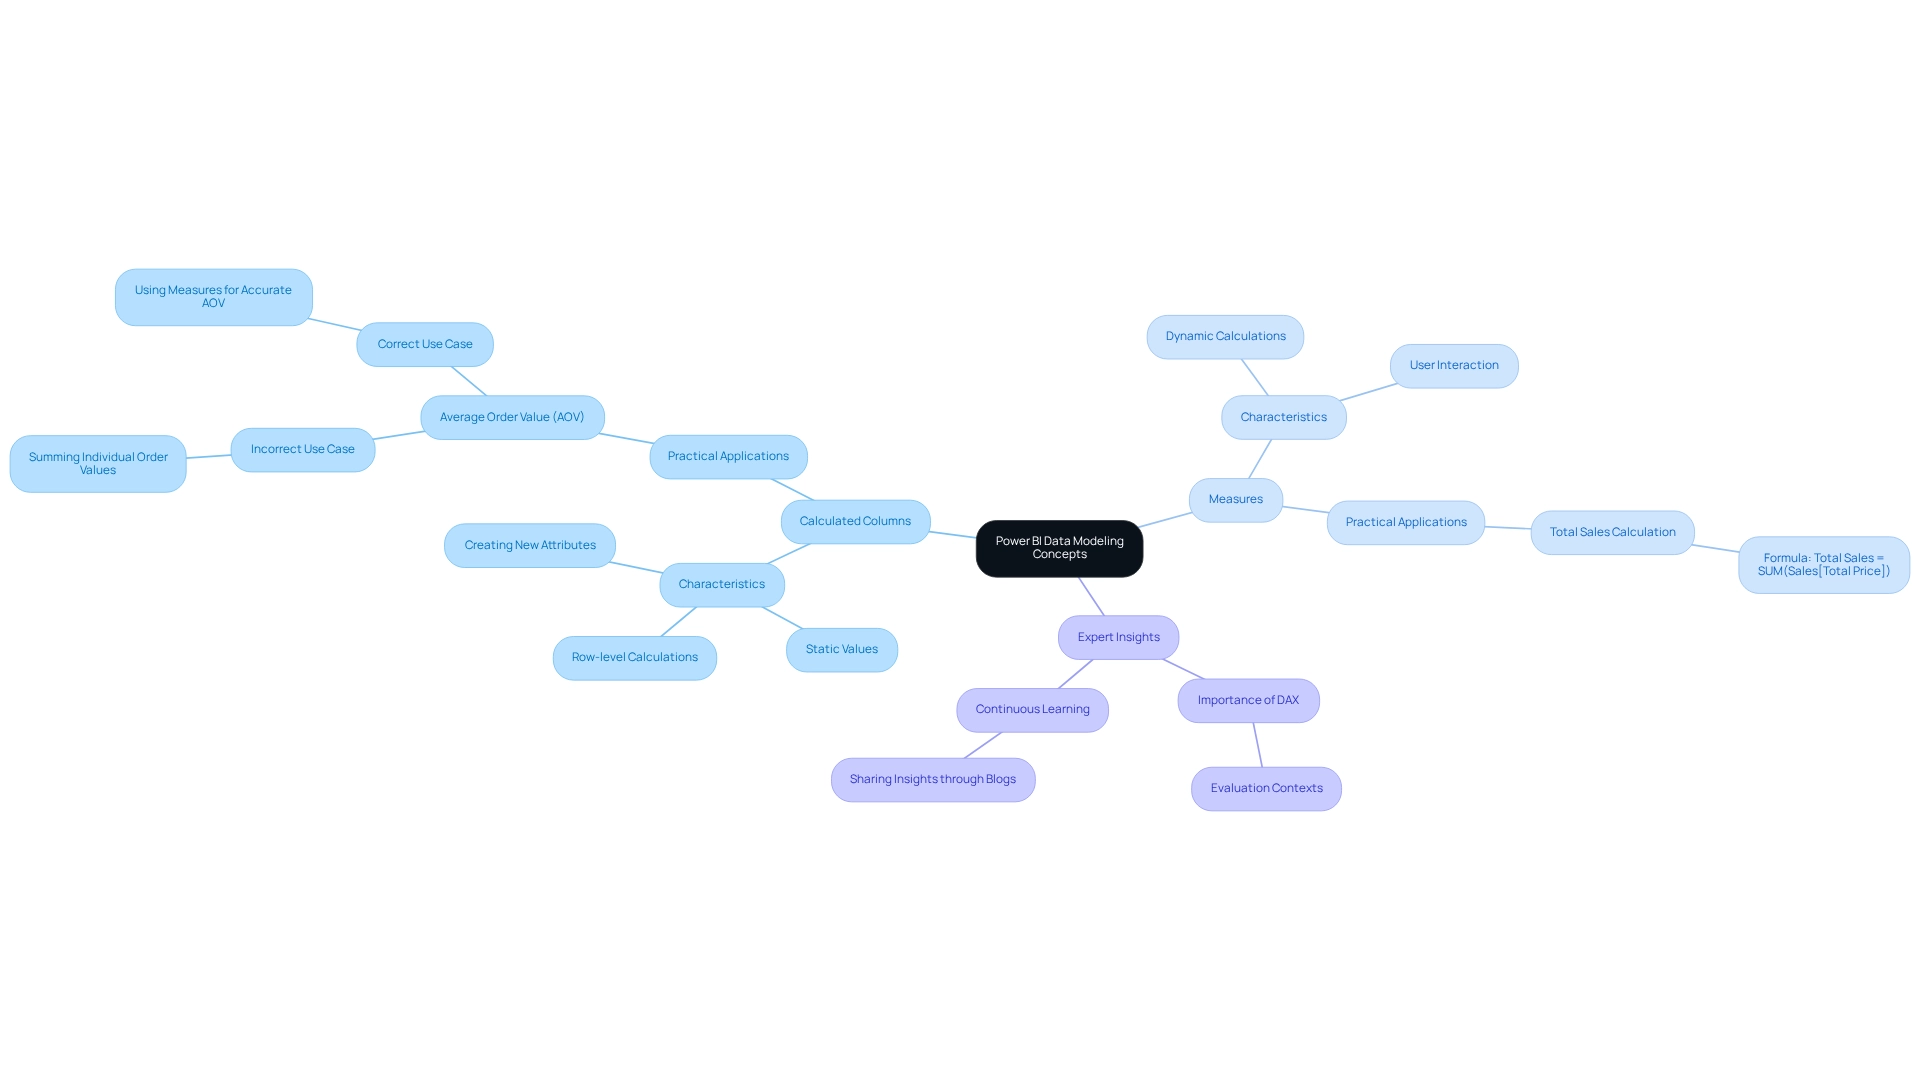
Best Practices for Using Calculated Columns and Measures
-
Prioritize Measures: Leverage measures for dynamic calculations whenever possible. Calculated at query time, measures optimize performance and minimize memory usage, making them ideal for real-time data analysis. By effectively utilizing the CALCULATE function, users can perform complex calculations and create insightful visualizations that aid in decision-making processes. This ultimately drives growth and innovation through actionable insights.
-
Limit Calculated Fields: Reserve calculated fields for scenarios where a static value is essential for filtering or grouping. Excessive use can lead to unnecessary memory usage and reduced performance, so they should be employed judiciously. Utilizing report backgrounds for static images can significantly reduce performance costs compared to multiple visuals, which is crucial for optimizing reports and enhancing operational efficiency.
-
Monitor Performance: Regularly use the Performance Analyzer tool to identify and address performance issues related to computed fields and metrics. This proactive approach helps maintain optimal performance, ensuring your reports run efficiently. Additionally, organizing report data by business impact through sensitivity labels enhances data security awareness, essential for effective data management and leveraging insights from BI dashboards.
-
Document Your Work: Maintain comprehensive documentation of your calculated columns and measures. Clear documentation not only aids in the maintainability of your Power BI reports but also clarifies the distinction between calculated columns and measures for future users, facilitating smoother collaboration and knowledge transfer. As highlighted in case studies on initiating AI projects, strategic planning and documentation are pivotal to achieving impactful outcomes, especially in navigating the complex AI landscape with tailored solutions.
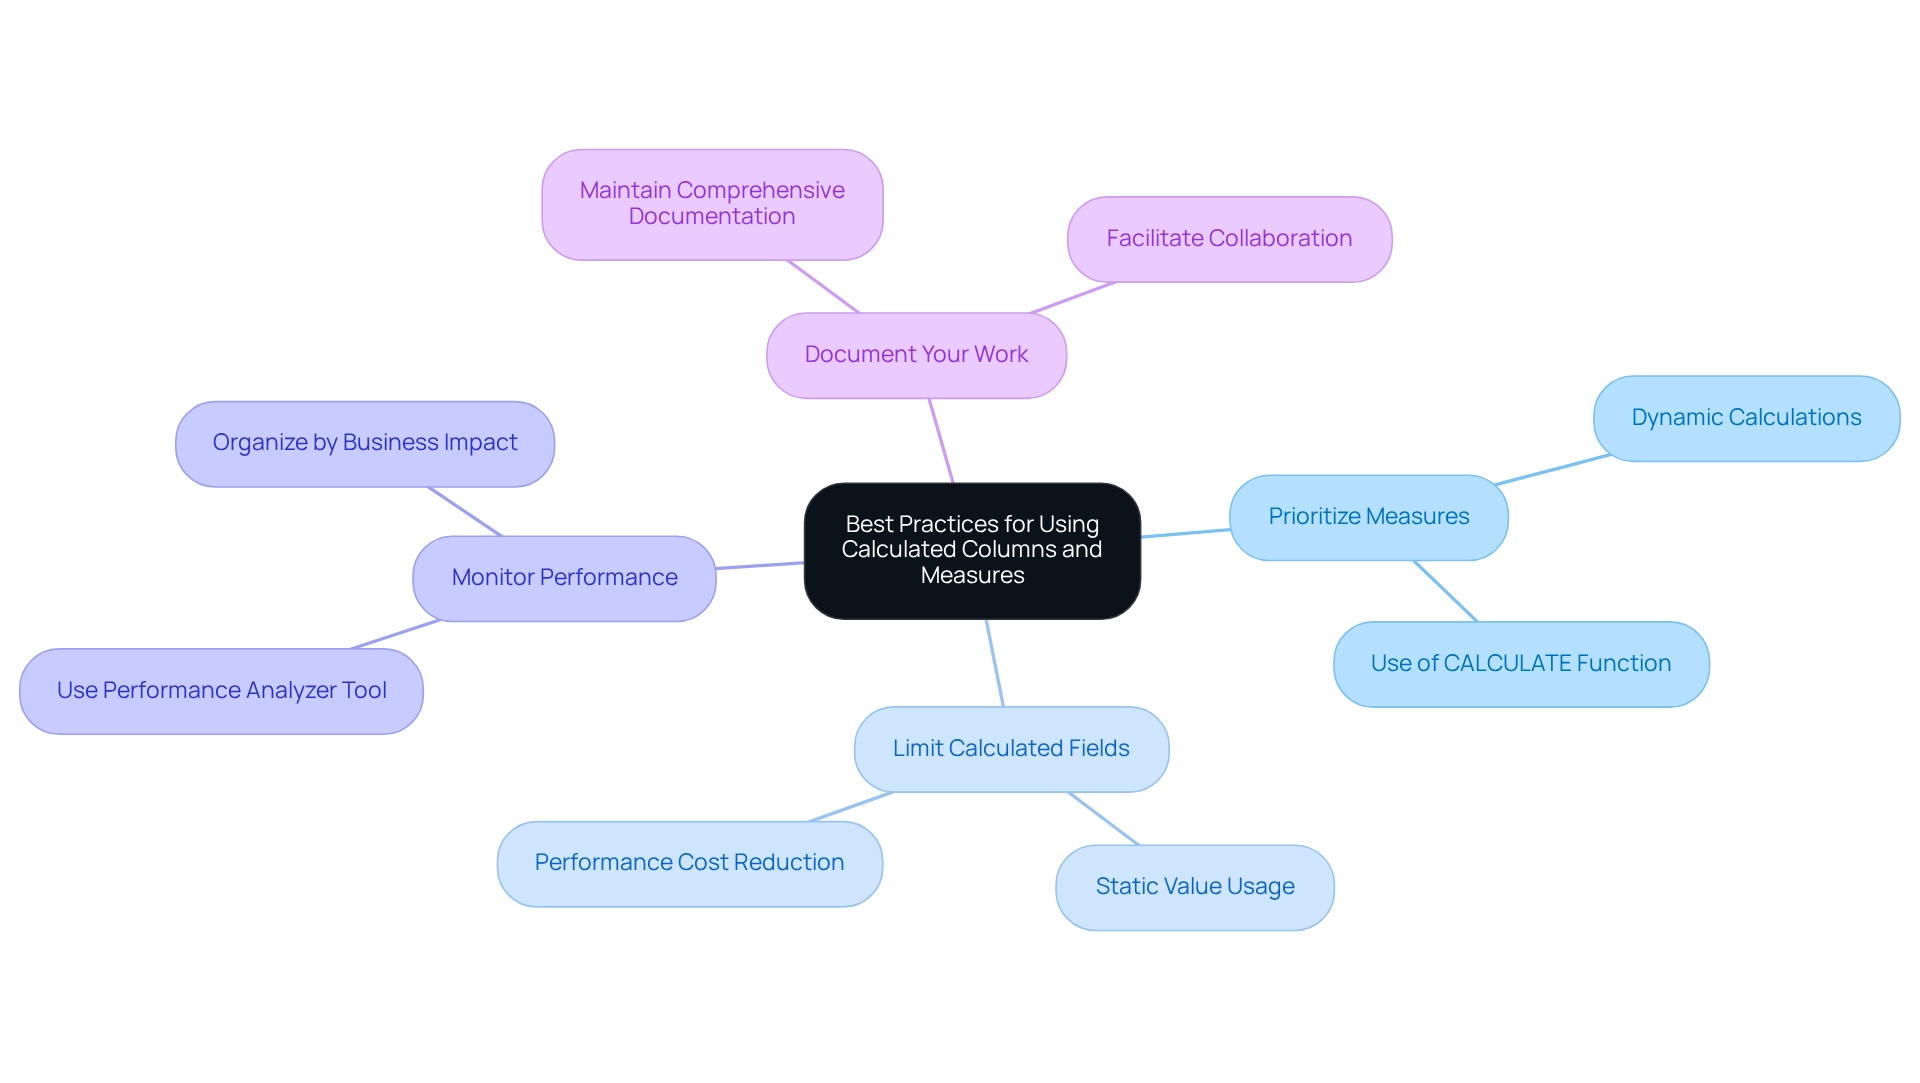
Key Takeaways: Mastering Calculated Columns and Measures
-
Calculated Columns are evaluated on a row-by-row basis and retained within the model, making them particularly effective for static calculations. They empower users to create new data fields for filtering and grouping, thereby enhancing the dataset’s structure. This capability is crucial for users aiming to extract basic statistics from their dataset using BI. As highlighted by Sascha Rudloff, Teamleader of IT- and Processmanagement at PALFINGER Tail Lifts GMBH, the implementation of Creatum’s Power BI Sprint not only delivered an immediately usable Power BI report but also significantly expedited their own Power BI development, showcasing the transformative impact of such services on business intelligence.
-
In contrast, Measures are dynamic and assessed in the context of the entire data model. This feature makes them ideal for performing aggregations and calculations that must adapt based on user interactions with reports. For example, tools can dynamically compute the percentage of calls per wait time bin, providing prompt insights based on user input. Practically, wait times can be categorized as ‘Low’ for waitTime < 20, ‘Average’ for waitTime < 100, and ‘High’ otherwise, illustrating how criteria can be applied in real scenarios.
-
When deciding between the two, understanding the distinction between calculated columns and measures is vital; calculated columns are best suited for filtering or grouping information, while measures should be employed for calculations requiring real-time responsiveness to user-selected filters. The case study titled “Measures in Business Intelligence” underscores that measures are utilized for calculations needing adjustment based on user interaction with reports, reinforcing their dynamic nature. However, many organizations face challenges in leveraging insights from Power BI dashboards due to time-consuming report generation and inconsistencies across various reports, which can lead to confusion and mistrust in the information presented.
-
Performance implications must be considered when using calculated columns. Since they are stored in the data model, excessive use can result in increased memory consumption. Therefore, it is advisable to favor methods for dynamic calculations, as they are computed on-the-fly and do not occupy additional storage space in the model. As noted by Douglas Rocha, although one might assume it is the simplest of all statistical measures, being merely the most common value in the dataset, there is no native DAX function to calculate it. This further emphasizes the importance of understanding the difference between calculated columns and measures.
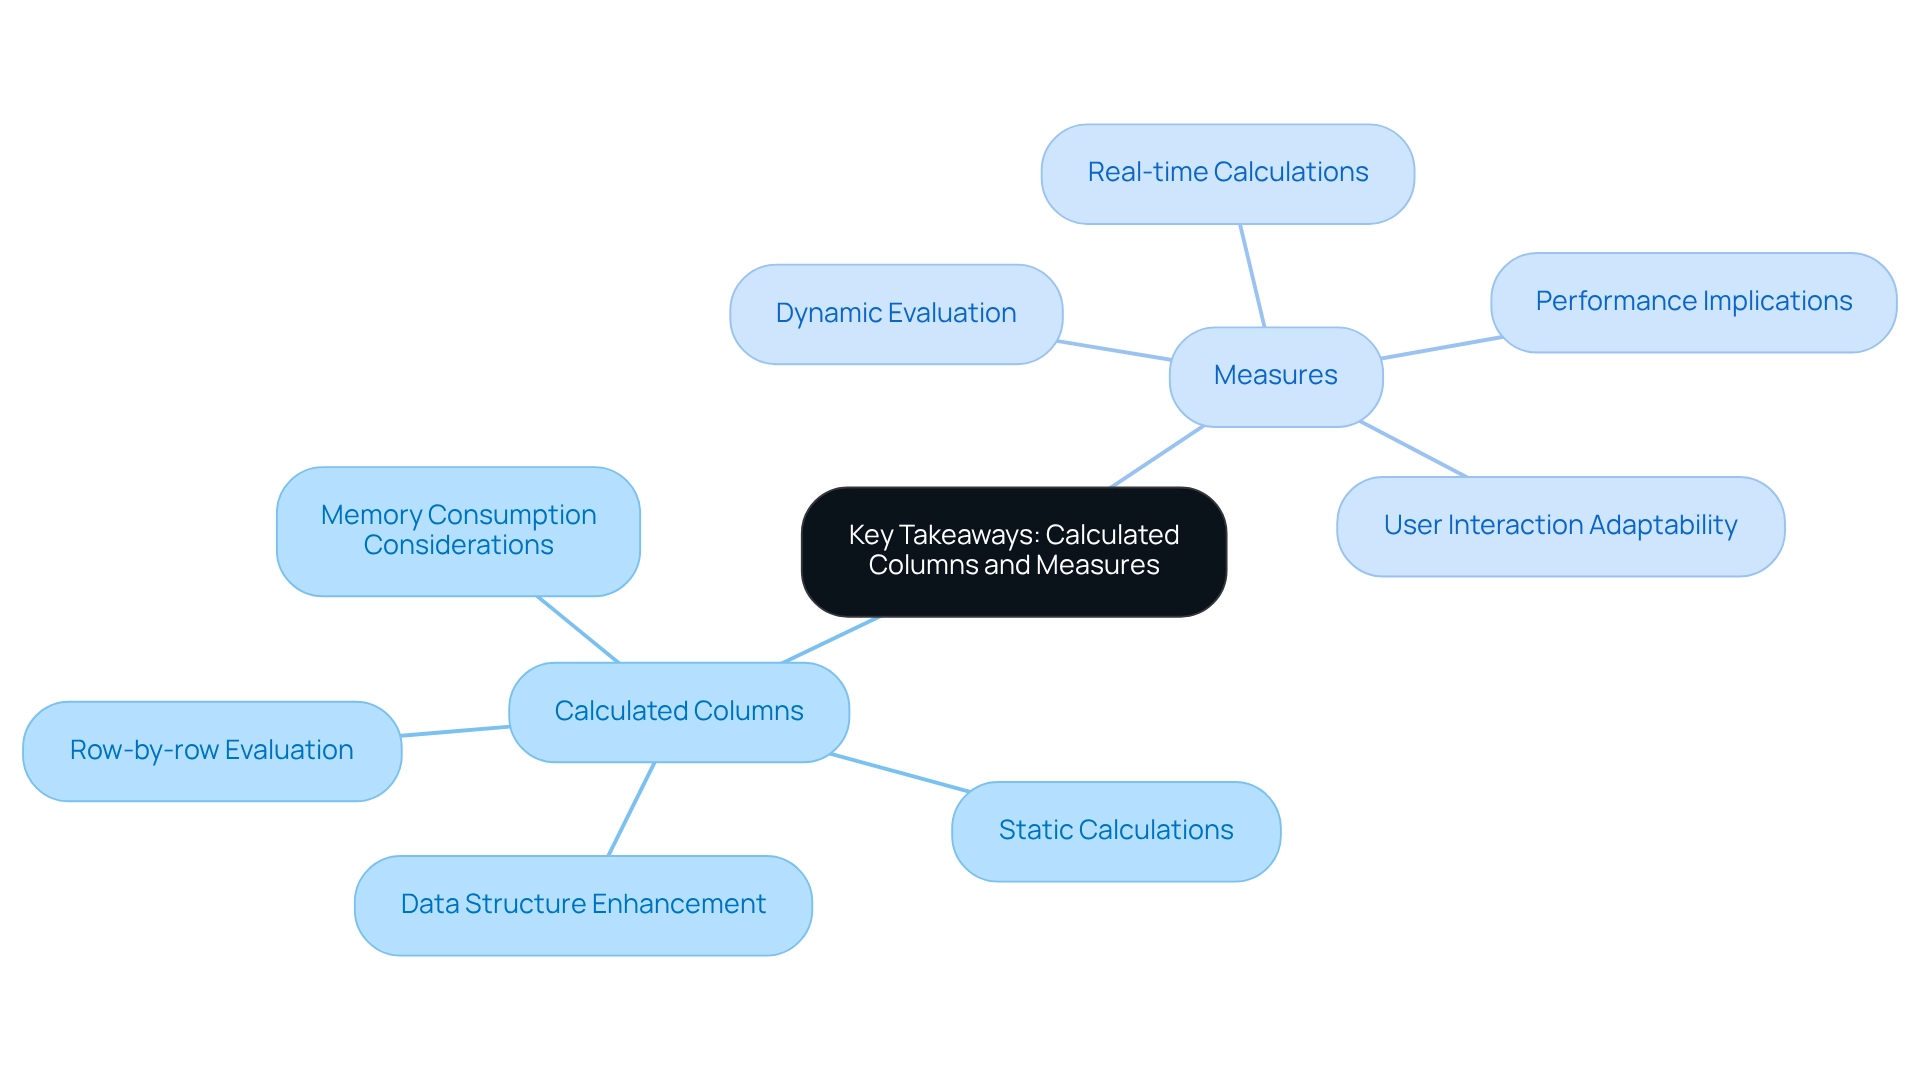
Conclusion
Understanding the differences between calculated columns and measures in Power BI is essential for optimizing data analysis and enhancing reporting capabilities.
- Calculated columns facilitate the creation of new fields based on existing data, making them ideal for static calculations and filtering.
- In contrast, measures provide dynamic calculations that adapt to user interactions, rendering them invaluable for real-time data analysis.
The decision between these two features should be guided by specific analytical needs, with a strong emphasis on utilizing measures whenever feasible to enhance performance and minimize memory consumption.
Performance considerations are pivotal in effective data modeling.
- Overuse of calculated columns can lead to increased model size and extended refresh times, while measures are calculated at query time, offering a more efficient strategy for managing large datasets.
- Being aware of common pitfalls—such as over-reliance on calculated columns and misinterpretation of evaluation contexts—can significantly enhance the effectiveness of Power BI reports.
Ultimately, mastering the use of calculated columns and measures is crucial for leveraging Power BI’s full potential.
By implementing best practices—such as prioritizing measures, monitoring performance, and maintaining clear documentation—users can enhance data quality and streamline reporting processes. This strategic approach not only fosters informed decision-making but also propels business growth in an increasingly data-driven landscape.
Frequently Asked Questions
What is a calculated field in Power BI?
A calculated field in Power BI is a new entry created within a table using DAX (Data Analysis Expressions) formulas, where each value is computed on a row-by-row basis, similar to adding a new column in Excel.
How does a metric differ from a calculated field in Power BI?
A metric represents a computation assessed across the entire framework and is primarily used for aggregation. Metrics are dynamic, calculated at query time, and adapt to filters applied in reports, providing insights based on the current context.
Why are metrics preferred for dynamic analysis in Power BI?
Metrics are preferred for dynamic analysis because they respond to real-time interactions, making them more suitable for providing insights that reflect the current data context, which is essential for efficient data utilization in a competitive landscape.
What is the significance of the case study “Using Statistical Techniques in Power BI” by Douglas Rocha?
The case study emphasizes the application of statistical techniques in Power BI using a Car Sales dataset to demonstrate how to evaluate sale values through methods like the mean, median, and mode, highlighting the importance of these techniques in data analysis.
Can you provide an example of how to calculate the mode in Power BI?
The mode can be calculated using the expression: Mode = MINX ( TOPN( ADDCOLUMNS( VALUES (CarSales[Sale Value]), 'Frequency', CALCULATE(COUNT(CarSales[Sale Value])) [Frequency], CarSales[Sale Value]) ).
What recent updates in BI 2025 enhance the functionality of metrics?
Recent updates in BI 2025 allow users to classify metrics, design dedicated tables for them, and customize their visual presentation using dynamic format strings, highlighting the growing significance of metrics in data analysis.
How do calculated columns and measures operate differently in Power BI?
Calculated columns operate within a row context, processing each row independently, while measures are assessed in a filter context, compiling information dynamically based on report filters.
What are the implications of storing calculated attributes in the data model?
Storing calculated attributes directly in the data model can increase the model’s size and potentially affect performance adversely, while metrics are calculated as needed, leading to more efficient memory utilization.
When should you use calculated columns versus measures in Power BI?
Calculated columns are beneficial for creating new fields for filtering or grouping information, while measures are ideal for calculations that must adapt dynamically based on user interactions with the report.
How can understanding the differences between calculated columns and measures improve reporting capabilities in Power BI?
Mastering the distinctions helps users create more effective reports, enhances data analysis, and empowers informed decision-making, ultimately driving operational efficiency and business expansion.
Overview
In Excel, the primary function for comparing all other rows with the first row is the IF function. This powerful tool evaluates whether values in subsequent rows align with those in the first row. By employing the IF function, professionals can significantly enhance data accuracy and operational efficiency.
Furthermore, integrating tools like conditional formatting allows for the swift identification of discrepancies, ensuring consistency across datasets. This approach not only streamlines data management but also empowers users to maintain high standards in their analytical processes.
Introduction
In the realm of data management, the ability to compare rows in Excel is a pivotal skill for ensuring accuracy and consistency across datasets. As organizations grapple with the challenges posed by unstructured data and inconsistencies, mastering row comparison techniques becomes essential. This article delves into the intricacies of row comparison, highlighting its significance in data validation, error detection, and operational efficiency.
By leveraging advanced Excel functions like IF, COUNTIF, and VLOOKUP, alongside integrating Robotic Process Automation (RPA) for streamlined workflows, users can enhance their data management practices. Practical examples and common challenges will be explored, providing readers with a comprehensive understanding of how to effectively utilize row comparison techniques. This knowledge will drive informed decision-making and foster a culture of data integrity within organizations.
Understanding Row Comparison in Excel
Row comparison in Excel is an essential technique that evaluates information in one row against another to reveal similarities or discrepancies. Specifically, it addresses the function needed to compare all other rows with the first row. This process is crucial for information validation, error checking, and maintaining consistency across datasets. Organizations often face substantial inconsistencies due to a lack of governance strategies, leading to confusion and distrust in the presented details.
Given that approximately 80% of current information is unstructured, effective row comparison techniques are increasingly vital for ensuring information integrity and enhancing decision-making.
In environments where precise information is critical for informed decisions, users can quickly identify inconsistencies by systematically comparing rows. This raises the question of what function would be used for comparing all other rows with the first row. For instance, a company that utilized the Astera Pipeline Builder from Creatum GmbH to verify and purify customer information found that correcting errors in their Excel files significantly improved their email marketing initiatives, resulting in higher revenue and more strategic insights. This underscores how effective row comparison techniques can directly contribute to operational success and drive data-driven insights.
Moreover, leveraging Robotic Process Automation (RPA) can streamline these manual workflows, reducing errors and allowing teams to focus on more strategic tasks. As organizations navigate the rapidly evolving AI landscape, combining RPA with traditional information management practices can enhance operational efficiency and support continuous improvement in validation processes. It is essential that reports provide clear, actionable guidance to stakeholders, ensuring that information is not only presented but also accompanied by next steps for decision-making.
Experts recommend routine assessments and updates to validation guidelines in spreadsheets to maintain their relevance and efficiency, emphasizing the importance of upholding information integrity. As noted by a researcher, “Excel is a highly trusted and user-friendly tool for information visualization, offering an intuitive interface, visually appealing graphics, and strong functionality that make it a preferred choice for students and professionals alike.”
Information analysts have observed that enhancing productivity through row evaluation prompts the question of what function would be used to compare all other rows with the first row. This not only streamlines workflows but also fosters a culture of precision and reliability in information management. Incorporating row comparison techniques into daily operations, alongside RPA, can lead to significant improvements in operational efficiency. As organizations increasingly rely on information-based insights, mastering this skill in a spreadsheet program is not just beneficial but essential for anyone involved in information management.
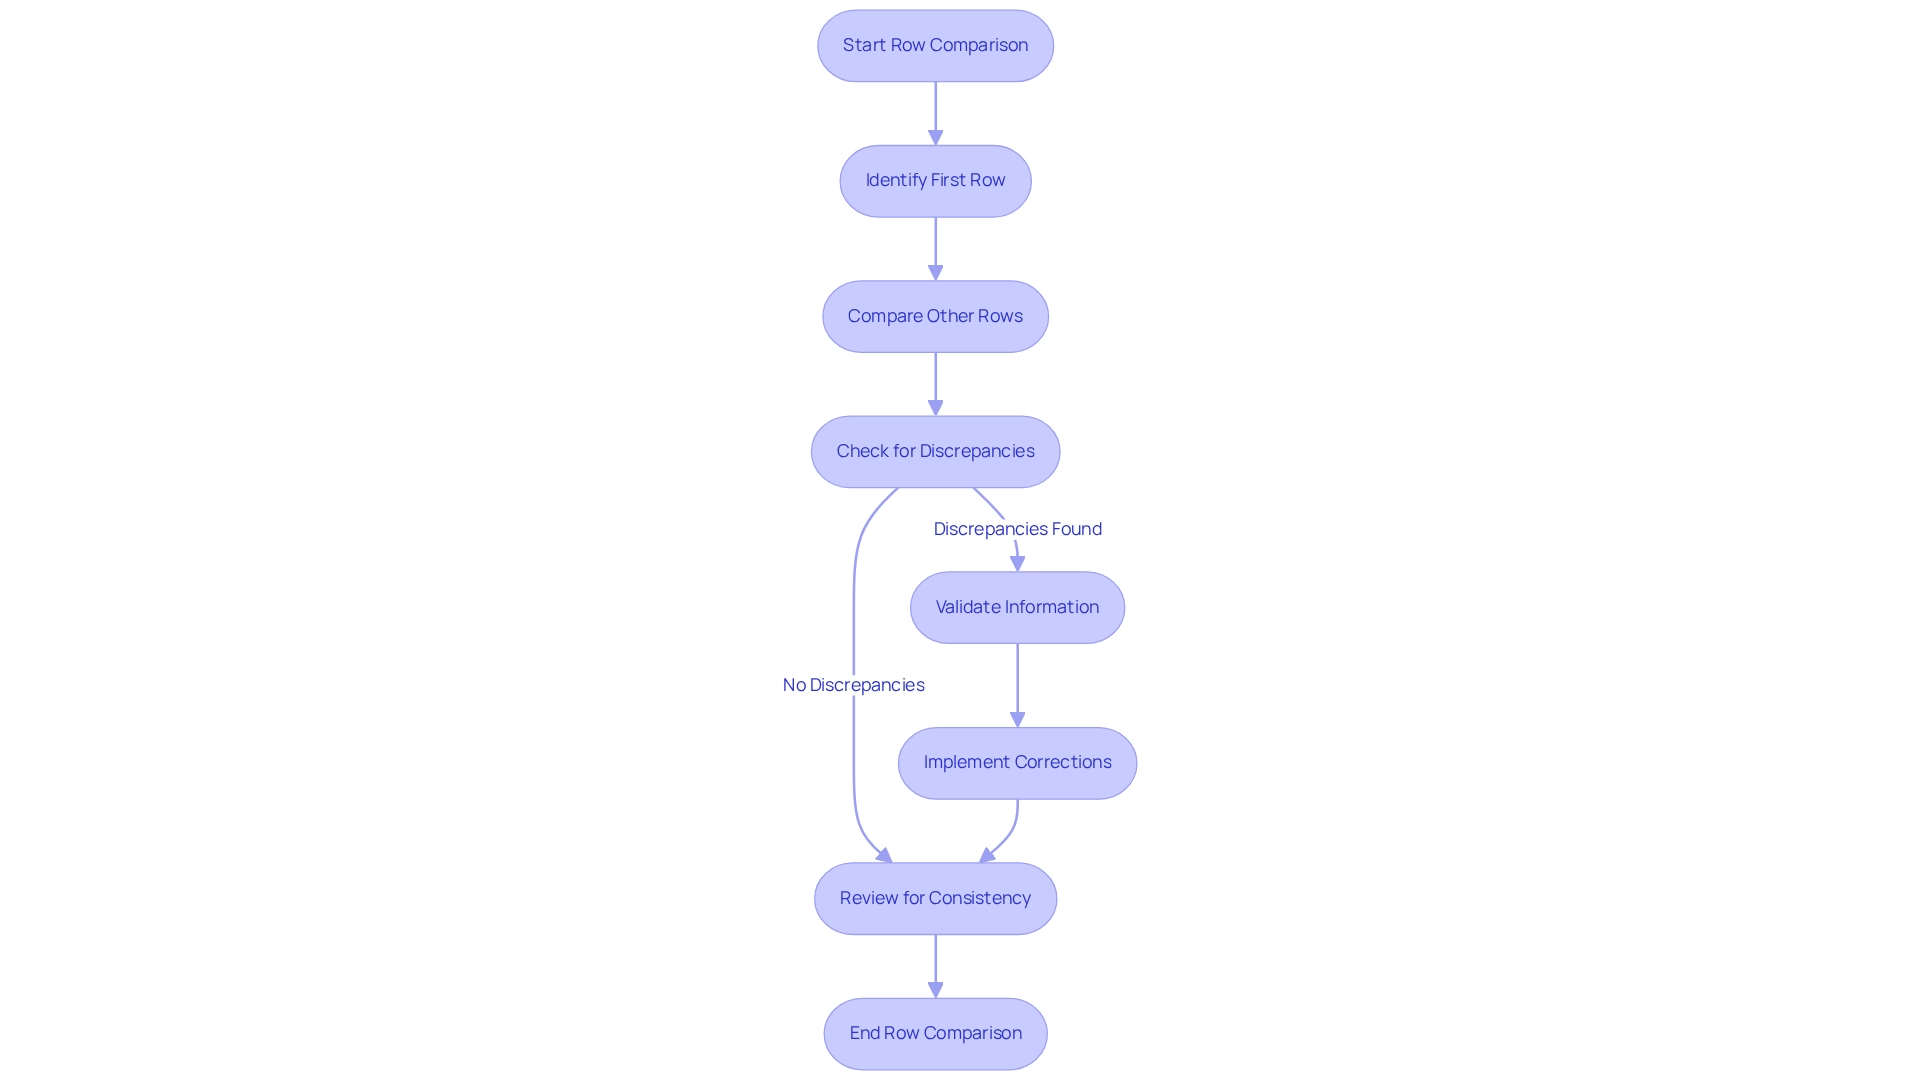
Why Compare Rows with the First Row?
A fundamental practice in Excel involves contrasting rows with the initial row, particularly when determining the appropriate function to compare all other rows against the first row, which often serves as a header or standard for subsequent entries. This contrast is vital for swiftly identifying irregularities or deviations from expected values, crucial for maintaining information integrity. Statistics reveal that anomalies occur in approximately 20% of datasets, emphasizing the necessity for rigorous validation methods.
By establishing the first row as a reference point, users can effectively ascertain the function required to compare all other rows with it, ensuring accuracy and reliability.
In quality control processes, this method proves invaluable. Organizations that routinely apply row comparisons frequently report significant improvements in information accuracy, leading to enhanced decision-making outcomes. A case study involving a financial institution demonstrated how they employed the function to detect discrepancies early, resulting in a 30% reduction in reporting errors.
This aligns with the capabilities of AI-powered models, such as those offered by Creatum GmbH, which enhance traditional methods through machine learning to minimize false positives and reveal hidden risks.
Experts emphasize that this practice not only elevates information quality but also streamlines workflows. As one quality control expert noted, “Ensuring information integrity through row evaluation is crucial for efficient analysis and reporting.” This approach allows teams to focus on strategic initiatives rather than being bogged down by inaccuracies. Furthermore, leveraging Robotic Process Automation (RPA) can automate these manual validation tasks, boosting operational efficiency in an increasingly dynamic AI landscape.
Creatum GmbH also delivers near real-time anomaly detection in financial workflows, enabling organizations to respond proactively to risks.
Current trends in quality assurance increasingly utilize Excel’s row evaluation features, with companies embracing automated solutions for real-time information validation. This shift towards automation reflects a broader movement in information management, where efficiency and accuracy are paramount. By prioritizing evaluations with the first row, businesses can ensure that their data remains a reliable foundation for informed decision-making.
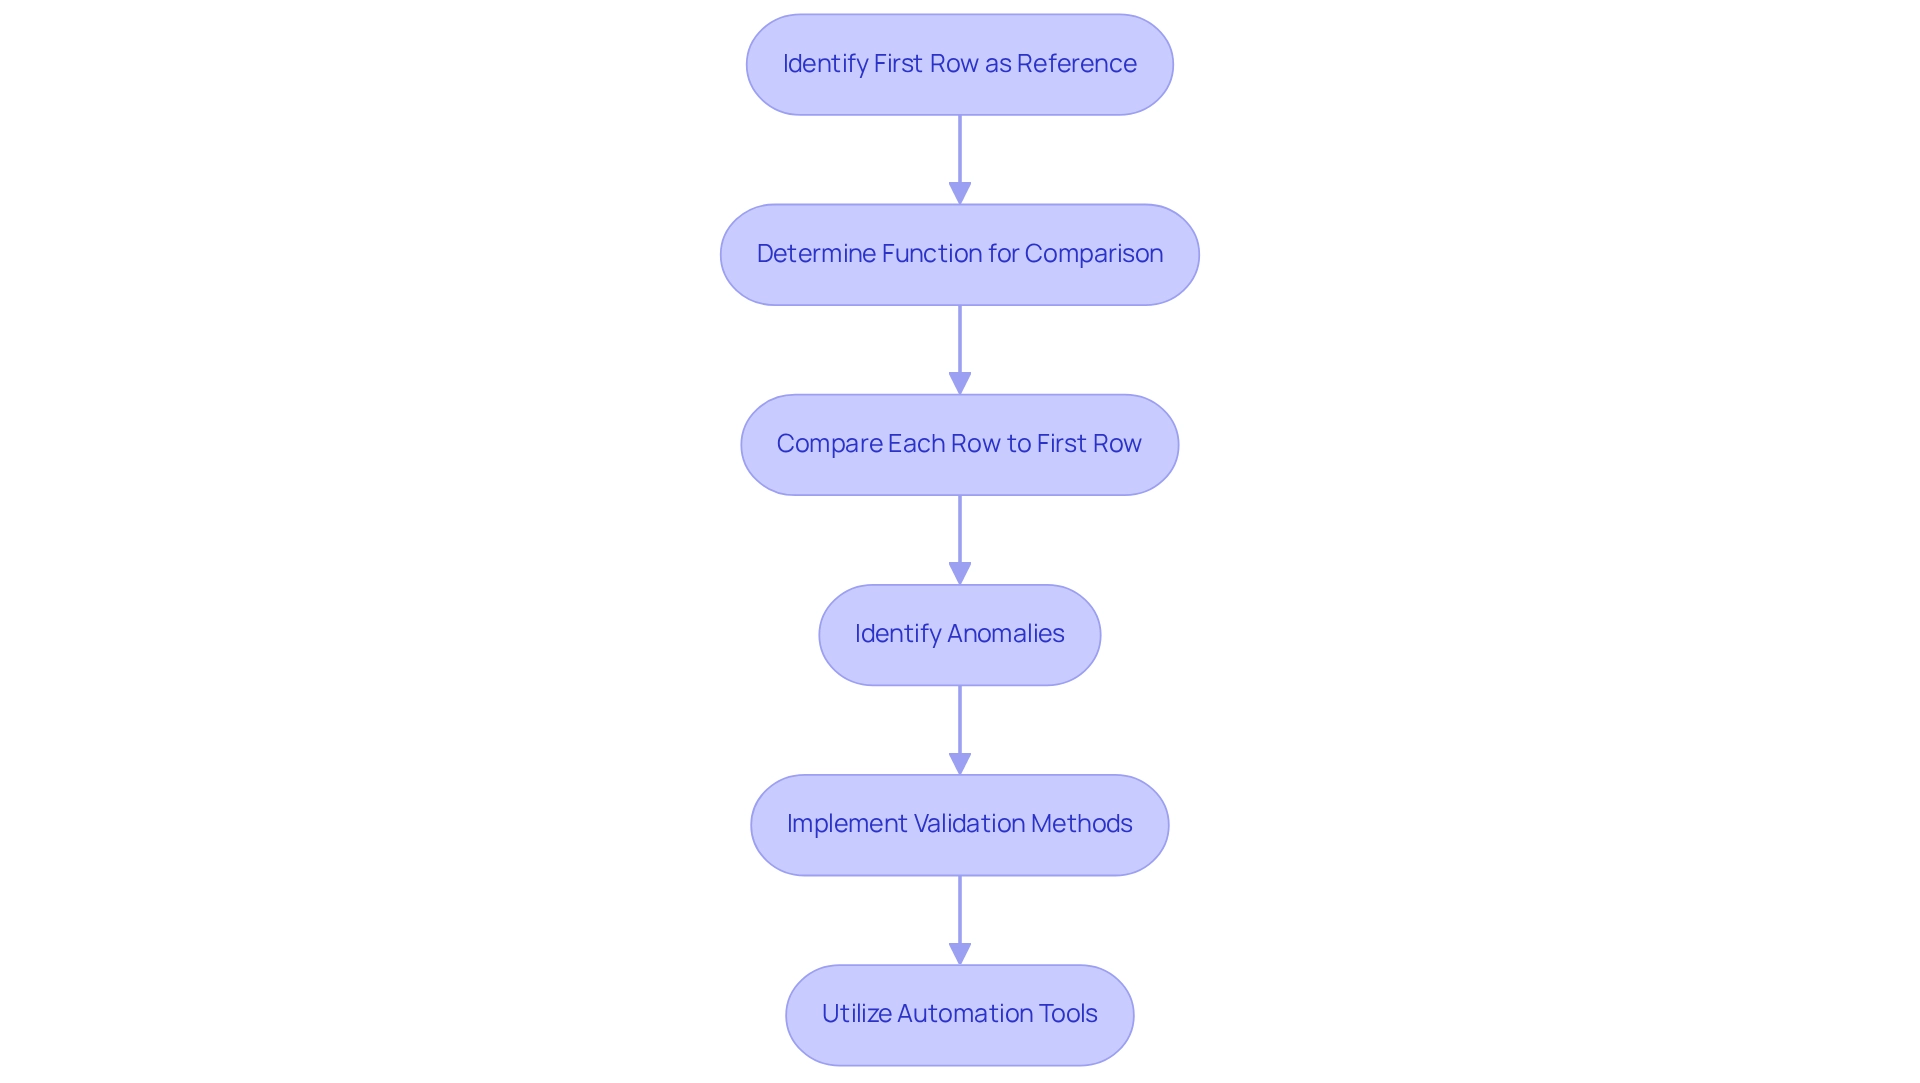
Key Excel Functions for Row Comparison
In Excel, several essential functions play a pivotal role in effective row evaluation, notably IF, COUNTIF, and VLOOKUP. The IF function enables users to perform logical evaluations between cells, returning designated values based on whether specific conditions are met. COUNTIF counts instances of particular values across horizontal arrangements, providing insights into data distribution.
For instance, in a dataset containing the numbers 2, 3, 3, 5, 7, and 10, the mode is 3, demonstrating how COUNTIF can identify the most frequently occurring value. VLOOKUP is crucial for locating related values across various datasets, thereby simplifying the evaluation process. Additionally, the MATCH function identifies the position of a value within a row, further enhancing comparisons across multiple rows.
Mastering these functions is vital for enhancing analytical capabilities in spreadsheet software. As Zach Bobbitt, creator of Statology, states, “My goal with this site is to help you learn statistics through using simple terms, plenty of real-world examples, and helpful illustrations.” Companies have reported significant improvements in their analytical abilities through targeted training in these functions.
A case study involving law enforcement officers revealed that proficiency in spreadsheet formulas such as IF, COUNTIF, and VLOOKUP not only boosted productivity but also enriched the officers’ contributions within their departments.
As we look toward 2025, the latest trends indicate an increasing reliance on these functions for information analysis, with experts advocating for their mastery. Spreadsheet instructors stress that understanding which function to use when comparing all other rows with the first row is essential for improved decision-making and operational efficiency. Moreover, integrating tools like Power Automate can streamline workflows and automate repetitive tasks, enabling teams to concentrate on strategic initiatives.
Furthermore, mastering additional spreadsheet tools like Power Query and Power Pivot is becoming increasingly important for advanced analysis. By leveraging these powerful tools and RPA, organizations can revolutionize their data analysis processes, fostering growth and innovation.
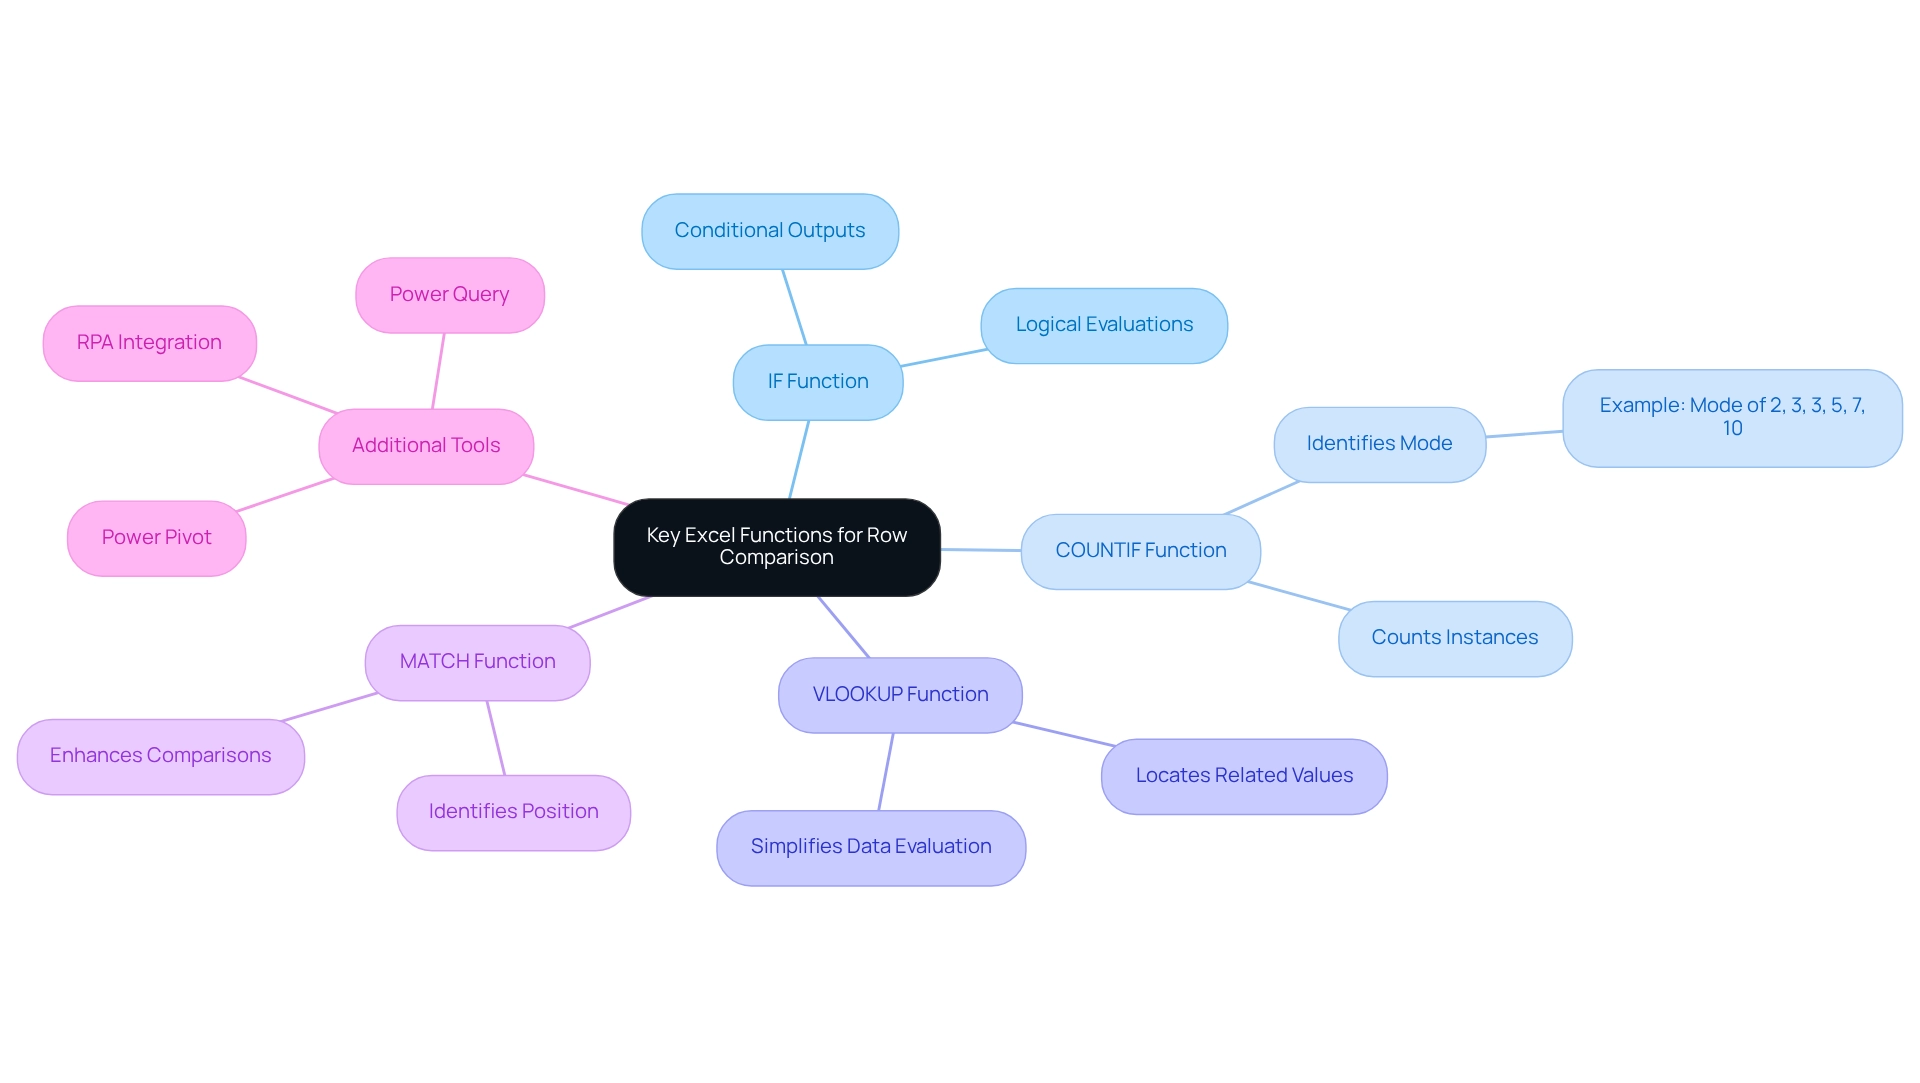
Practical Examples: Comparing Rows with Excel Functions
To effectively compare entries in Excel, one might wonder about the appropriate function for comparing all rows with the first row. A straightforward option is the formula =IF(A2=A1, "Match", "No Match"), which checks if the value in cell A2 matches that of cell A1. This simple contrast can be applied down the column to further lines. For more intricate comparisons, conditional formatting serves as a powerful tool to visually highlight differences between rows.
By selecting a range and applying specific conditional formatting rules, users can quickly identify which cells deviate from the first row. This raises the question: what function would be used to compare all other rows with the first row?
The efficiency of conditional formatting in analysis simplifies the detection of discrepancies, conserving time and enhancing precision. Research indicates that applying best practices in spreadsheet software—such as minimizing the used range and avoiding volatile functions—can significantly improve calculation speed, particularly when handling large datasets. In a case study titled “Handling Large Data Sets in Excel,” users reported a notable enhancement in performance after adopting these strategies, enabling them to work more effectively with extensive information.
Moreover, incorporating AI solutions, such as Small Language Models and GenAI Workshops from Creatum GmbH, can further enhance information quality and governance. These AI-driven methods address issues like inadequate master information quality, ensuring that your information is not only precise but also usable for decision-making. The characteristics of Small Language Models can enhance analysis processes, while GenAI Workshops provide practical training for users to effectively utilize AI within spreadsheet software.
Statistics reveal that there are thirty-two 30-minute periods between 07:00 and 23:00, illustrating the potential time savings when utilizing spreadsheet functions for row comparison. Practical illustrations from analysts demonstrate that using spreadsheet conditional formatting, along with AI tools from Creatum GmbH, not only aids in spotting inconsistencies but also supports more informed decision-making. Additionally, resources like Ablebit’s Date & Time Formula Wizard for spreadsheets can simplify adding and subtracting time and dates, offering further learning opportunities for users.
As Abigail Sims, a technology author, notes, “The software’s capabilities in information management are crucial for operational efficiency.” By integrating these techniques and utilizing AI from Creatum GmbH, organizations can enhance their information management processes, ultimately boosting operational efficiency.
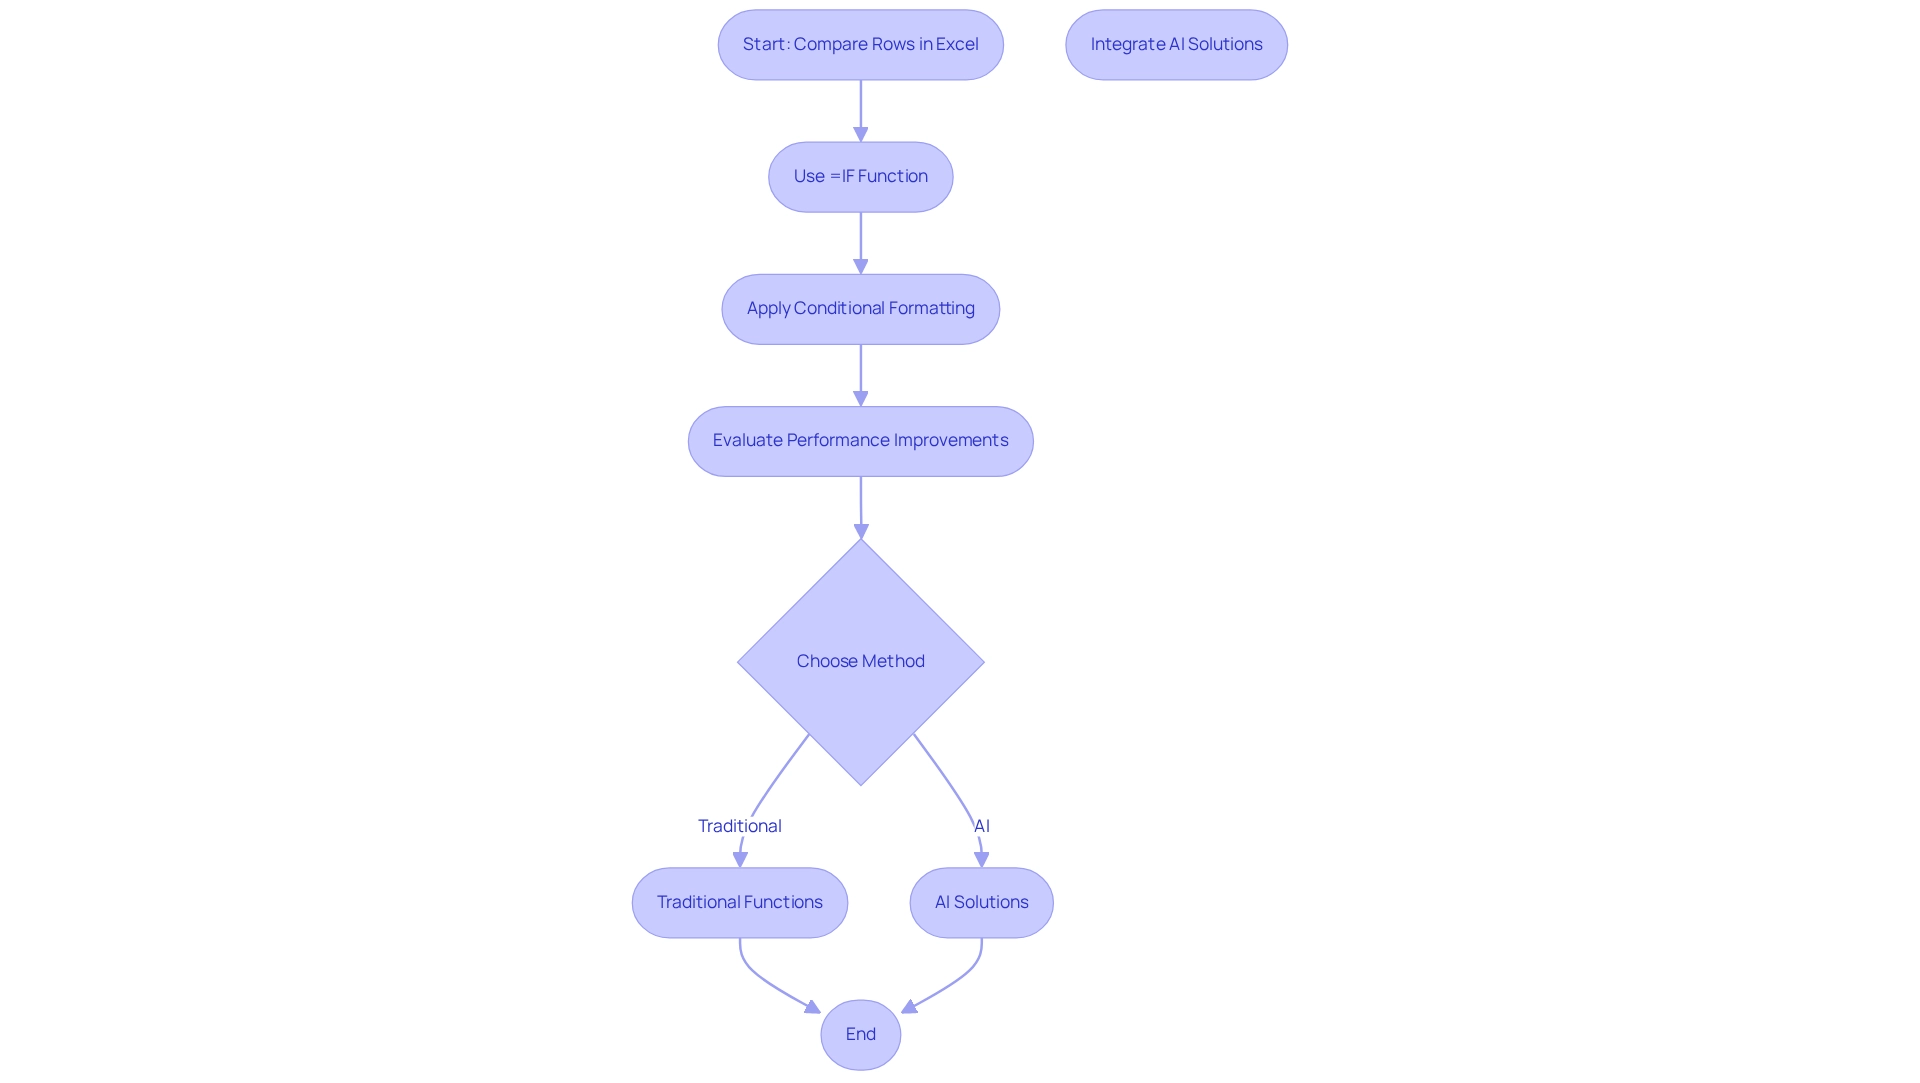
Common Challenges in Row Comparison and How to Overcome Them
One common issue in row evaluation within Excel is the inconsistency of formats, which can lead to misleading results, such as false negatives. For instance, if one row has dates formatted as text while another uses actual date values, the evaluation may yield incorrect results. To alleviate this issue, standardizing information formatting across all rows is essential, ensuring consistency in how details are represented.
Furthermore, combined cells can hinder data analysis and should be avoided to preserve clarity in evaluations.
Another major challenge emerges when managing large datasets, which can significantly affect the software’s performance. In these situations, using Excel’s built-in tools, like ‘Go To Special,’ can effectively highlight differences between rows, simplifying the analysis process. Additionally, implementing helper columns can streamline complex comparisons, enhancing overall efficiency.
Best practices also involve avoiding multiple tables within one spreadsheet and recording zeros as information to ensure consistency.
Organizations that prioritize consistent information formatting in Excel have reported enhanced accuracy in their analyses. A case study on metadata documentation highlights the necessity of maintaining clear and separate documentation for metadata, which provides essential context for datasets. This practice not only supports transparency but also guarantees that information can be reused effectively, thereby improving the reproducibility of research findings.
Incorporating Robotic Process Automation (RPA) can further streamline these processes by automating repetitive tasks linked with information formatting and comparison, which often slow down operations. This allows teams to focus on strategic decision-making. As Ravikiran A S., a Research Analyst, states, “Now that you know the fundamentals of Data Formatting in a spreadsheet, you will learn how to implement formatting in real-time.”
This highlights the significance of mastering information formatting techniques. Moreover, statistics suggest that frequent formatting problems in Excel can result in considerable performance decline, especially in extensive datasets. By tackling these formatting challenges proactively and utilizing RPA, organizations can enhance their information management processes, reduce errors, and improve operational efficiency.
Furthermore, establishing a governance strategy is crucial to ensure information consistency and reliability across reports.
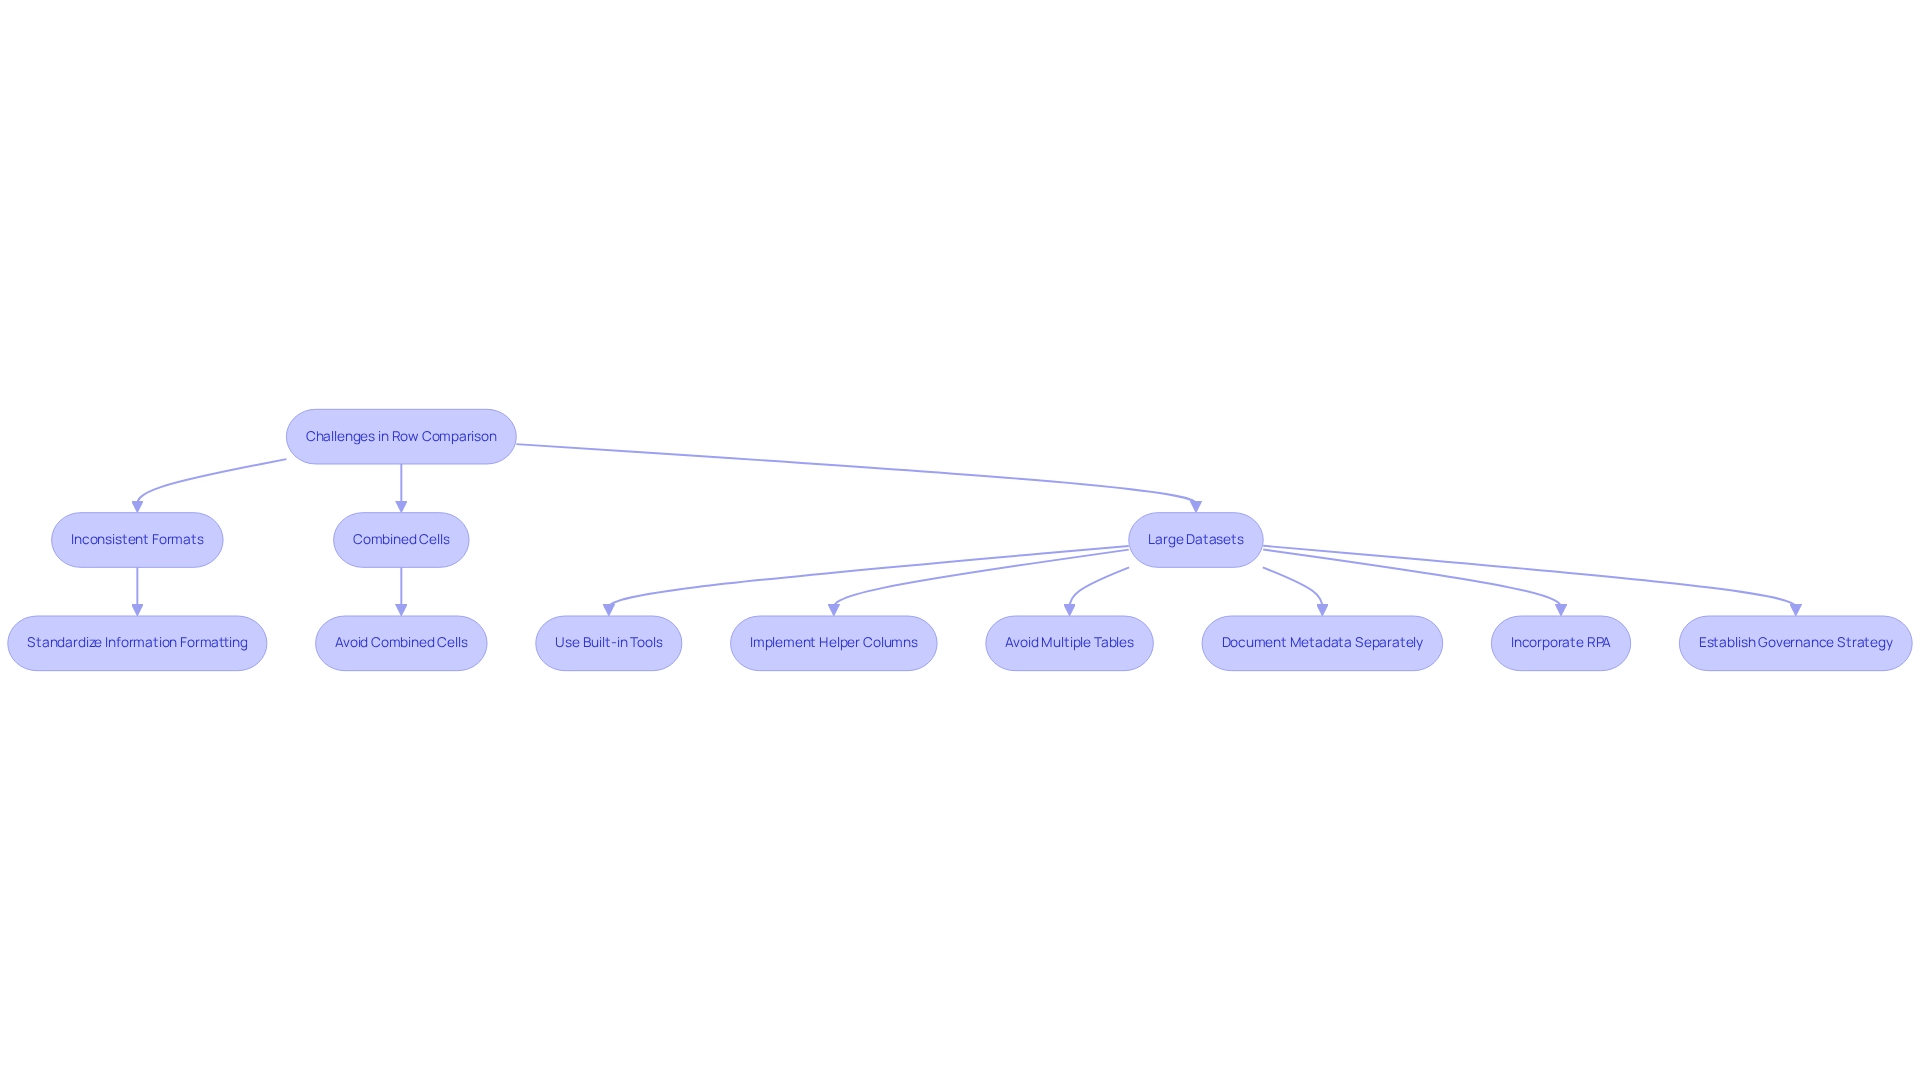
Advanced Techniques for Comparing Rows in Excel
Sophisticated methods for contrasting entries in Excel leverage the features of array formulas and conditional formatting to enhance analysis. Array formulas empower users to evaluate discrepancies across datasets, prompting the question: what function would be employed to compare all other rows with the first row? For instance, utilizing an array formula allows for the effective identification of variations between rows, streamlining the validation process.
A practical illustration of data management in Excel is evident in the statistic that the total number of characters counted in the range A2:A6 is 66. This showcases how array formulas can adeptly manage and analyze information.
Conditional formatting further elevates this process by automatically highlighting cells that differ from a designated reference row. This visual cue simplifies error identification, enabling users to swiftly address discrepancies. As Charley Kyd noted, “information could be smoothed by calculating a centered trendline through neighboring values,” underscoring the importance of accurate analytical methods.
Moreover, pivot tables serve as a powerful resource for summarizing and comparing information across multiple rows. They facilitate deeper insights into trends and patterns, allowing analysts to derive meaningful conclusions from complex datasets. A case study titled “Practical Applications of Array Constants” exemplifies how users can apply array constants in various scenarios, such as multiplying items in an array or transposing arrays.
This equips users with essential skills to enhance their analytical capabilities in spreadsheets, ultimately fostering growth and innovation within their operations.
In 2025, the effectiveness of these advanced spreadsheet techniques is underscored by statistics indicating a significant rise in the adoption of array formulas for information analysis. This highlights their role in boosting operational efficiency. Furthermore, leveraging Robotic Process Automation (RPA) can further refine these processes by automating repetitive tasks related to spreadsheet reporting. This allows teams to concentrate on strategic analysis and decision-making. Such alignment with RPA’s capabilities not only minimizes time-consuming tasks and errors but also supports the overarching objective of enhancing operational efficiency and driving data-driven insights for business growth.
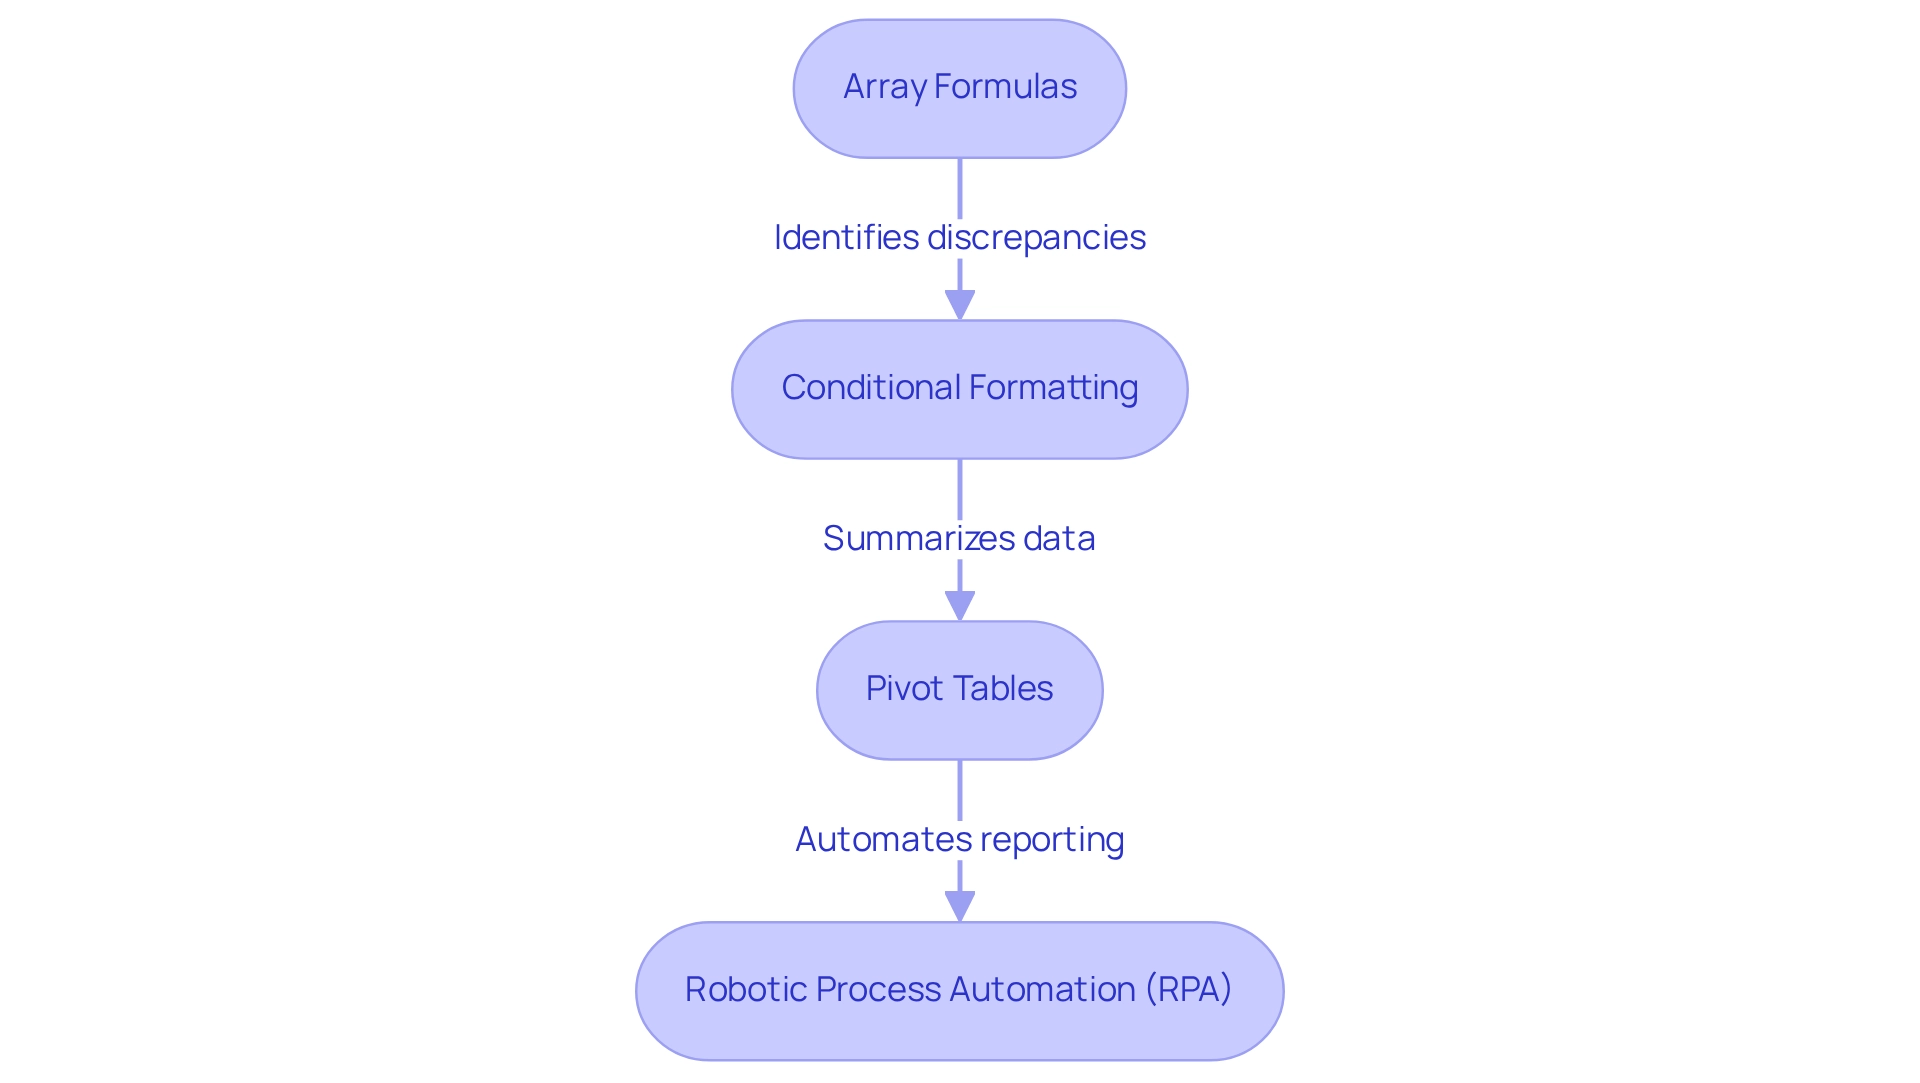
Key Takeaways: Mastering Row Comparison in Excel
Mastering row analysis in spreadsheet software is essential for ensuring information precision and enhancing operational effectiveness. Key functions such as IF, COUNTIF, and VLOOKUP serve as indispensable tools for effective data comparisons. By utilizing these functions, users can swiftly identify discrepancies and maintain consistency across datasets, a crucial aspect for informed decision-making.
Incorporating Robotic Process Automation (RPA) from Creatum GmbH into these processes can significantly streamline workflows, reducing the time spent on manual tasks and minimizing errors. For instance, a small retail business improved its inventory management through a detailed tracking system. This system not only categorized products but also calculated total inventory value, resulting in notable enhancements in efficiency and profitability.
By automating inventory checks with functions like IF and tracking stock levels using COUNTIF, the business effectively combined spreadsheet functionalities with RPA, leading to increased operational productivity.
Statistics reveal that organizations proficient in Excel can reduce management errors by as much as 30%, underscoring the importance of precise analysis. Furthermore, in histograms, the heights of rectangles must be proportional to the frequency density, which is the frequency divided by the amplitude of the class, highlighting the necessity for accurate representation.
Professional insights emphasize that efficient row comparison is vital for operational effectiveness, enabling teams to focus on strategic initiatives rather than rectifying inaccuracies. Daniel Raymond, a Project Manager, notes, “With a strong background in managing complex projects, efficient information management tools are essential for streamlining processes and enhancing productivity.”
Advanced techniques, including array formulas and conditional formatting, empower users to analyze information comprehensively. These skills not only optimize information management processes but also enhance the ability to derive actionable insights from complex datasets. Key takeaways for mastering row comparison in spreadsheets include understanding the nuances of these functions and being able to determine which function to use for comparing all other rows with the first row, ultimately driving better decision-making and operational success.
Moreover, incorporating Business Intelligence tools can transform unrefined information into actionable insights, facilitating informed decision-making that fosters growth and innovation. RPA can help navigate the complexities of the evolving AI landscape, ensuring that businesses can concentrate on what truly matters. Tutorial videos covering a range of Excel topics serve as valuable resources for those looking to enhance their skills in data management.
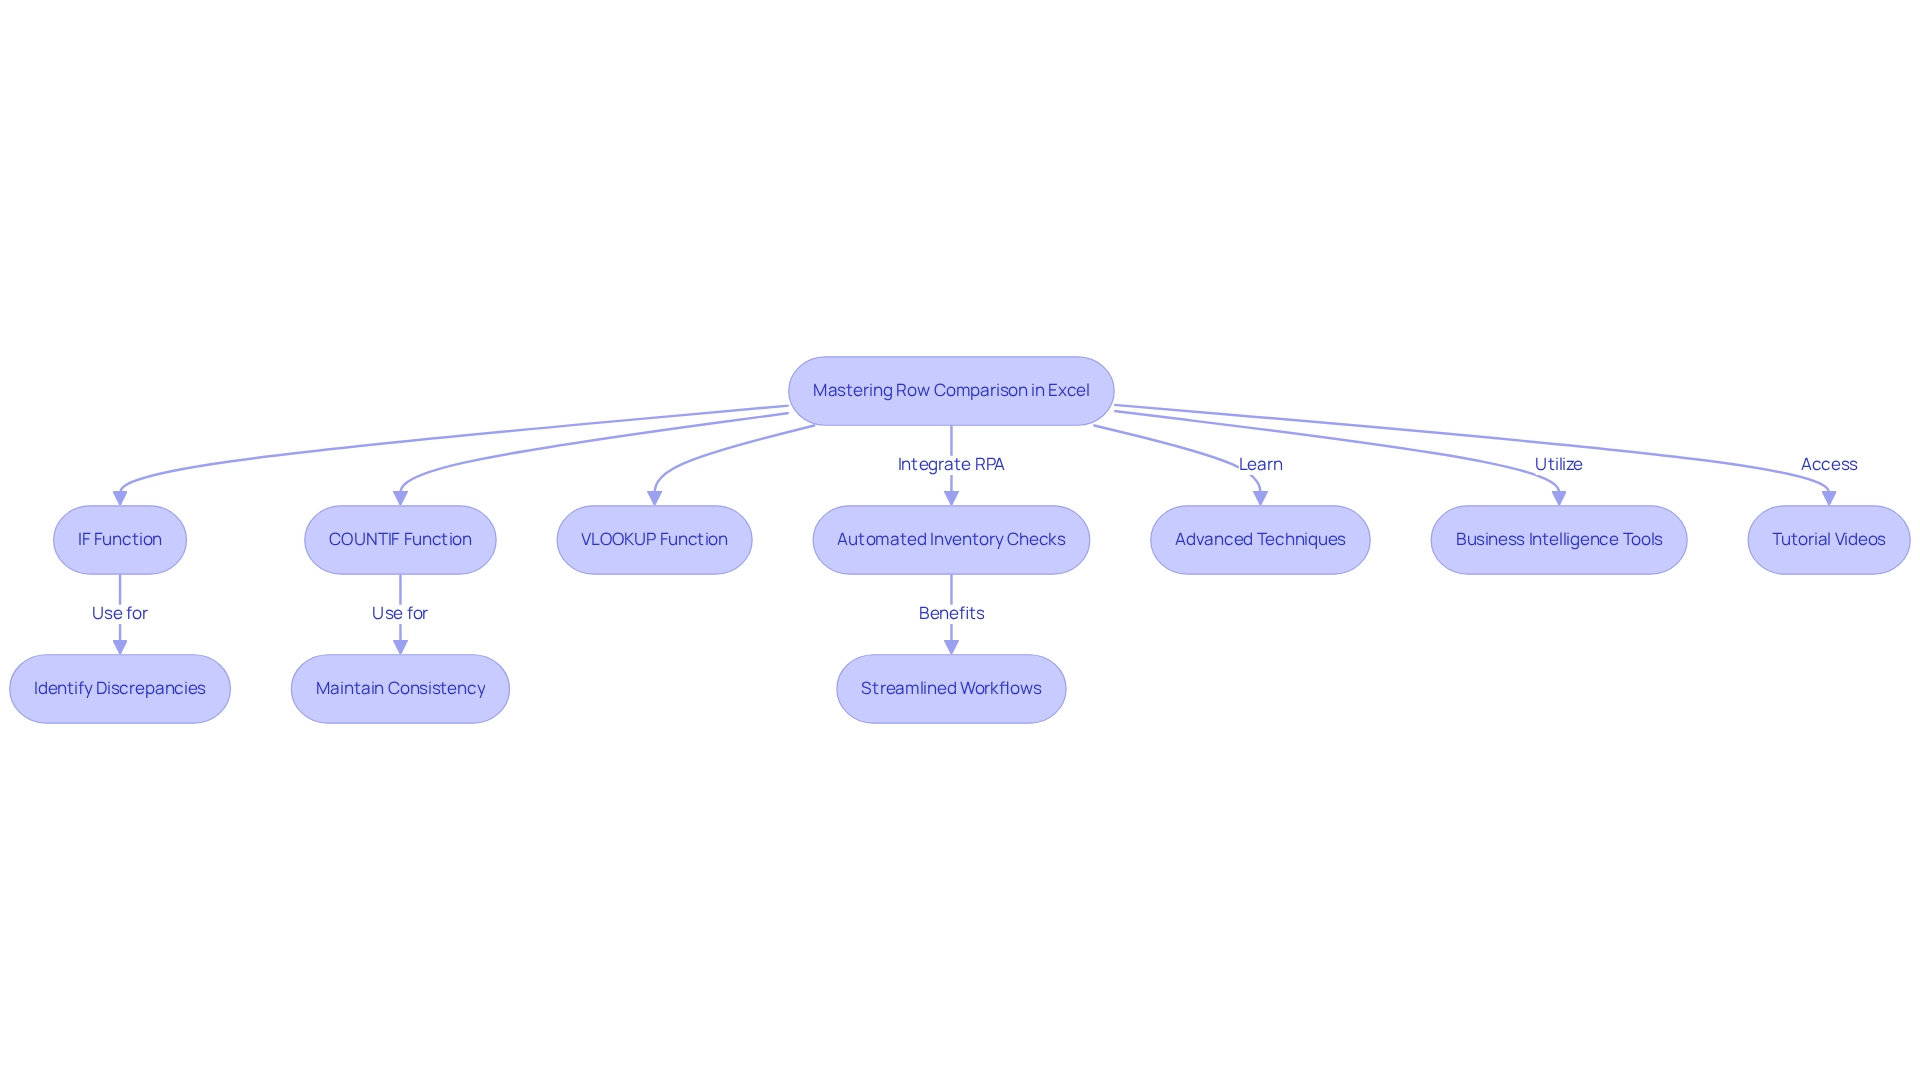
Conclusion
Mastering row comparison techniques in Excel is not just beneficial; it is essential for achieving data accuracy and operational efficiency. Functions like IF, COUNTIF, and VLOOKUP are indispensable tools that empower users to swiftly identify discrepancies and maintain consistency across datasets. This proficiency is vital for informed decision-making, especially in environments where data integrity is paramount.
Integrating Robotic Process Automation (RPA) further enhances these processes by streamlining workflows, reducing the time spent on manual tasks, and minimizing errors. Consider the example of a retail business optimizing its inventory management through Excel; it highlights the tangible benefits that arise from combining Excel’s capabilities with automation. Statistics show a potential reduction in data management errors by up to 30%, underscoring the importance of accurate data analysis in fostering operational success.
Advanced techniques, such as array formulas and conditional formatting, empower users to conduct comprehensive data analyses, ensuring organizations can extract actionable insights from complex datasets. By understanding and applying these functions in real-world scenarios, businesses can drive better decision-making and enhance productivity. Ultimately, effective row comparison transcends a mere technical skill; it is a foundational practice that supports strategic initiatives, allowing teams to concentrate on what truly matters in a data-driven landscape.
Frequently Asked Questions
What is row comparison in Excel?
Row comparison in Excel is a technique that evaluates information in one row against another to identify similarities or discrepancies, particularly comparing all other rows with the first row.
Why is row comparison important?
It is crucial for information validation, error checking, and maintaining consistency across datasets, helping organizations avoid confusion and distrust in their data.
What percentage of current information is unstructured, and why is this significant?
Approximately 80% of current information is unstructured, making effective row comparison techniques vital for ensuring information integrity and enhancing decision-making.
How can row comparison improve operational success?
By systematically comparing rows, users can quickly identify inconsistencies, leading to improved accuracy in data, which can enhance operational success and drive data-driven insights.
What role does Robotic Process Automation (RPA) play in row comparison?
RPA can streamline manual workflows involved in row comparison, reducing errors and allowing teams to focus on more strategic tasks.
What is the recommended practice for maintaining validation guidelines in spreadsheets?
Experts recommend routine assessments and updates to validation guidelines to ensure their relevance and efficiency in maintaining information integrity.
How does row comparison contribute to quality control?
It allows organizations to detect discrepancies early, which can lead to significant improvements in information accuracy and decision-making outcomes.
What is the impact of using AI-powered models in conjunction with row comparison?
AI-powered models can enhance traditional row comparison methods by minimizing false positives and revealing hidden risks, thus improving information quality and operational efficiency.
How can organizations benefit from embracing automated solutions for real-time information validation?
Automated solutions can facilitate real-time validation, reflecting a broader trend in information management that prioritizes efficiency and accuracy in data handling.
Overview
Communicating with data is crucial for professionals, as it empowers informed decision-making and enhances operational efficiency by converting complex information into actionable insights. This article underscores the significance of tailored messaging, effective visualization, and ethical practices. Organizations that prioritize data communication can notably improve collaboration, minimize errors, and cultivate a data-driven culture. By focusing on these elements, professionals can foster a more effective work environment, ultimately leading to better outcomes.
Introduction
In an age where data reigns supreme, the ability to communicate insights clearly and effectively has become a vital skill for organizations striving to thrive in a competitive landscape. Effective data communication not only informs decision-making but also fosters collaboration, enhances operational efficiency, and drives strategic initiatives. With many businesses still grappling with communication challenges, the need for innovative strategies has never been more critical.
From leveraging advanced statistical tools to employing data storytelling techniques, organizations have a wealth of resources at their disposal to transform raw data into compelling narratives that resonate with diverse audiences. This article delves into the multifaceted world of data communication, exploring its importance, strategies for tailoring messages, and the ethical considerations that underpin successful practices.
Understanding the Importance of Data Communication
Communicating with data is essential in today’s information-driven environment, involving the clear and effective sharing of insights derived from analysis. This skill not only facilitates informed decision-making but also fosters collaboration among teams, ultimately driving strategic initiatives and enhancing operational efficiency. Organizations that prioritize communicating with data often experience significant advantages, such as reduced errors and increased productivity.
A striking statistic reveals that 45% of individuals reported no progress in their organizations’ interaction practices, underscoring the urgent need for improved strategies in this area.
Employing statistical tools like visualization, regression analysis, and hypothesis testing can significantly enhance the accuracy of predictions and the development of effective strategies. For instance, Power BI services improve reporting and provide actionable insights through features like the 3-Day Power BI Sprint, which allows for the rapid creation of professionally designed reports. Additionally, the General Management App offers comprehensive oversight and intelligent evaluations, vital for addressing information inconsistency and governance challenges in business reporting, ultimately leading to better decision-making.
Moreover, expert insights affirm that effective communicating with data is crucial for operational efficiency. A case study showcasing enhancements in operational efficiency through GUI automation in a mid-sized company exemplifies this point. By automating data entry and software testing, the company achieved a 70% reduction in input errors and an 80% increase in workflow efficiency.
When teams can easily comprehend and act on findings through effective data communication, they are better equipped to optimize processes and enhance overall performance. The impact of efficient information exchange extends beyond immediate operational benefits; it plays a critical role in shaping long-term strategic direction. By transforming raw data into actionable knowledge, organizations empower their teams to make decisions aligned with their objectives, ultimately promoting growth and innovation.
Furthermore, integrating Robotic Process Automation (RPA) can further boost productivity by automating repetitive tasks, enabling teams to concentrate on more strategic initiatives.
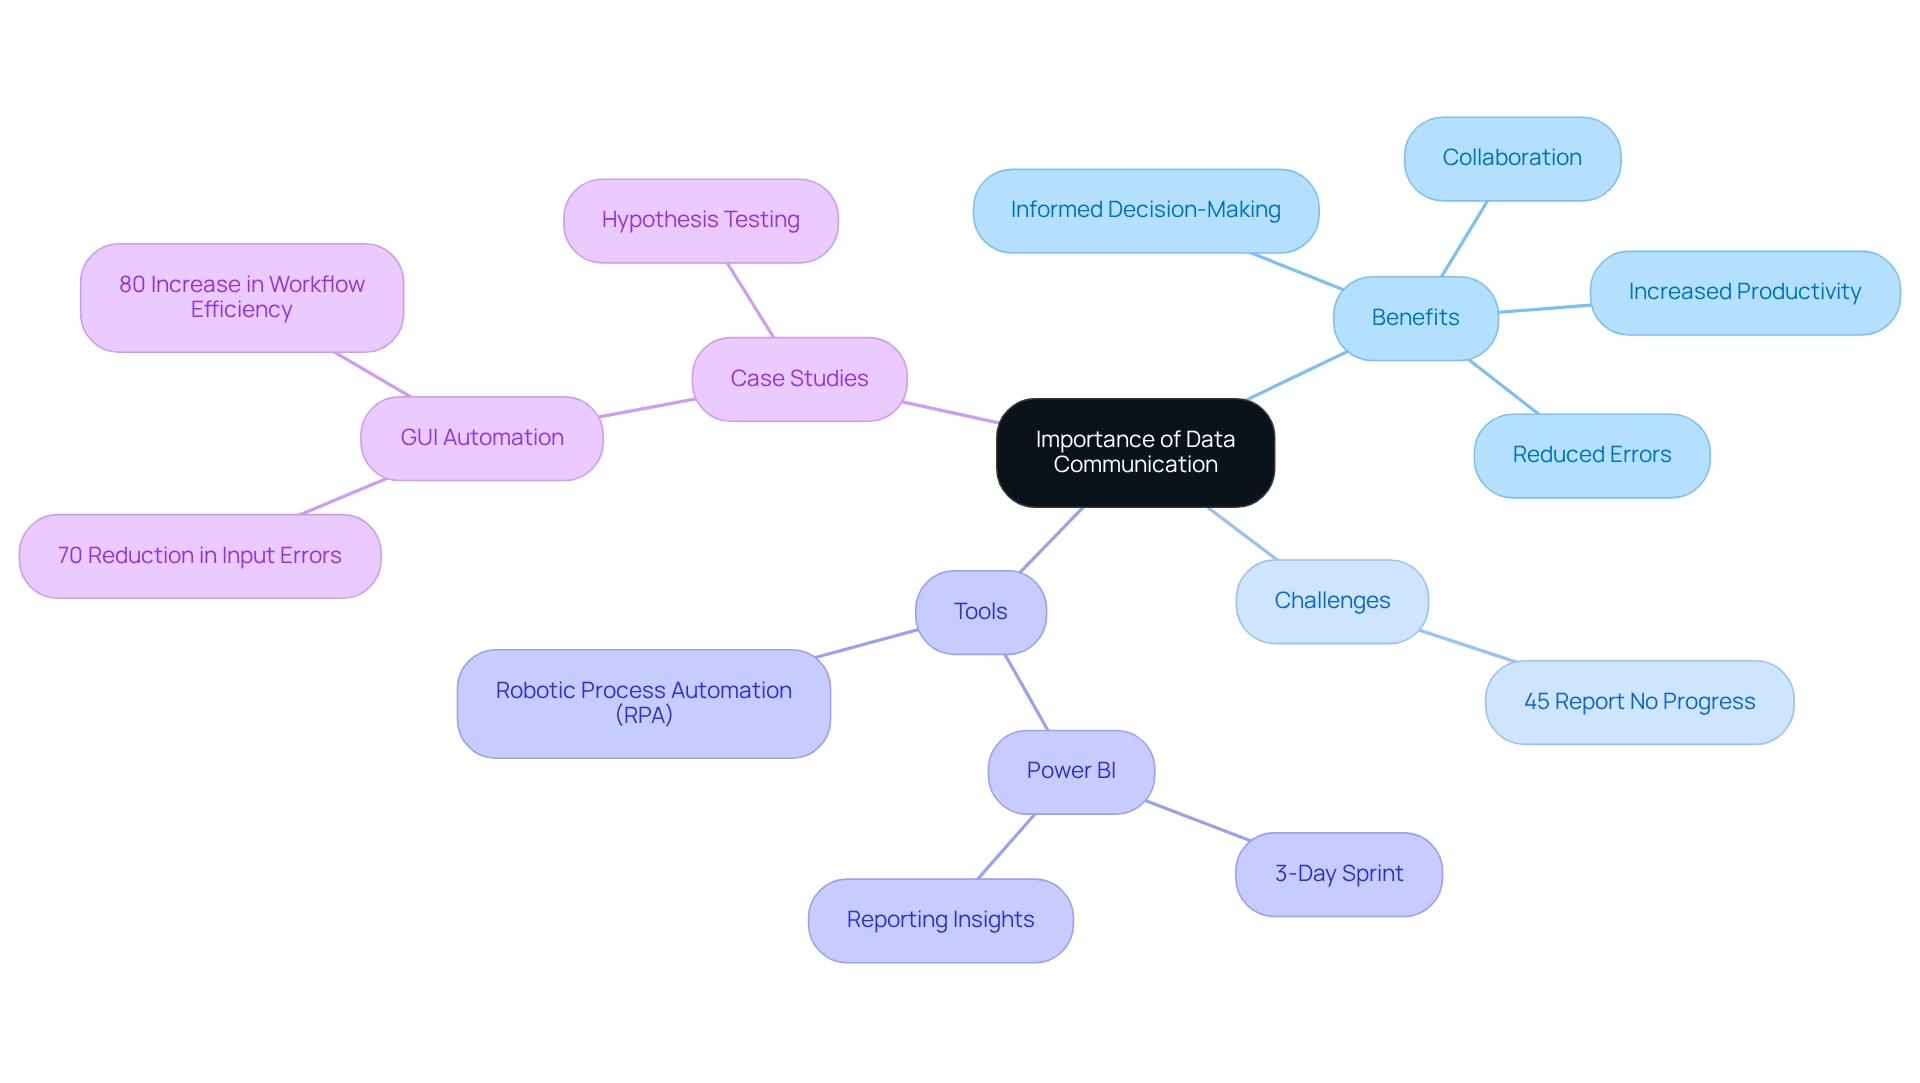
Identifying Your Audience: Tailoring Your Message
Effective communication with data begins with a thorough understanding of your listeners. Analyzing demographics, professional backgrounds, and familiarity with the subject matter is essential. This can be accomplished through surveys or interviews, offering valuable insights into viewer preferences and expectations.
Once you have a comprehensive profile of your listeners, you can tailor your message to resonate with them.
In the context of the rapidly evolving AI landscape, navigating the overwhelming options available is crucial. Tailored AI solutions from Creatum GmbH can help cut through the noise, providing targeted technologies that align with your specific business goals and challenges. For instance, when addressing technical experts, incorporating industry-specific terminology and detailed data analysis can enhance engagement.
In contrast, when engaging with a non-technical group, simplifying your language and emphasizing high-level insights is crucial. This customized approach not only enhances understanding but also fortifies the bond with your listeners, making your message more powerful.
The significance of audience evaluation is underscored by the reality that conducting such an assessment can require three to four weeks, depending on the accessibility of existing information and the necessity for further stakeholder feedback. As Geoff Ainscow, Leader of the Beyond War movement, observed, “He wanted to demonstrate that the U.S. and the USSR had weapons capable of obliterating the planet multiple times,” emphasizing the vital importance of clear expression in conveying intricate information.
Moreover, a significant shift towards a data-first culture has been observed, with over 80% of companies focusing on communicating with data through analytics across various departments. This trend highlights the importance of communicating with data to utilize Business Intelligence for converting raw information into actionable insights, facilitating informed decision-making that propels growth and innovation. By applying customized messaging approaches and utilizing BI, organizations can greatly improve engagement with their target group and promote more efficient information exchange.
Additionally, failing to utilize BI effectively can leave your business at a competitive disadvantage, making it imperative to adopt these strategies.
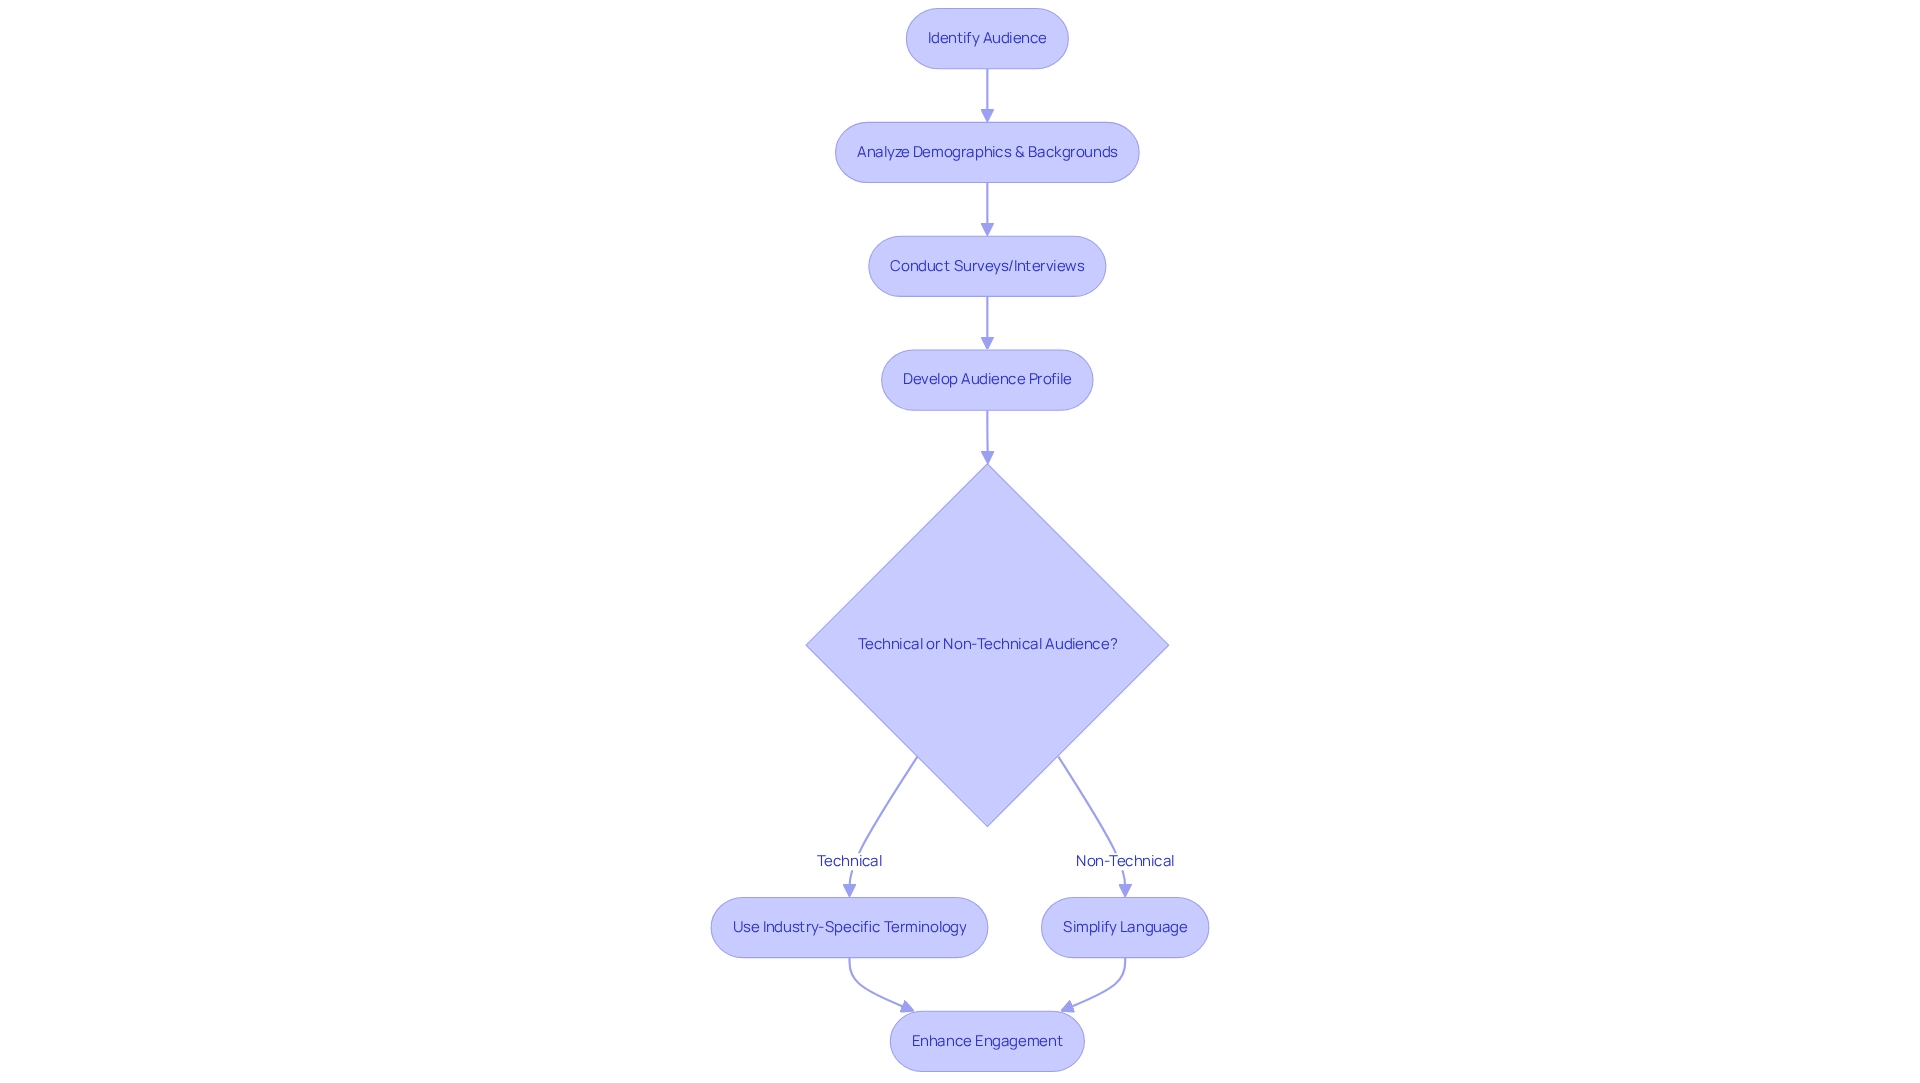
Simplifying Complex Data for Clarity
Complex information can often overwhelm audiences, leading to confusion and misinterpretation. To effectively simplify this complexity, begin by pinpointing the key messages you wish to convey. Utilize information aggregation methods for communicating with data to distill large datasets into actionable insights, making the information more digestible.
For instance, firms utilizing advanced analytics and AI are 2.5 times more likely to outshine their counterparts in innovation, highlighting the importance of clear information communication.
Visual aids, such as charts and graphs, play a crucial role in illustrating trends and patterns. Instead of presenting raw numbers, consider using a bar chart to depict sales growth over time, significantly enhancing comprehension. A case study from the healthcare sector demonstrates this approach: by merging patient records, laboratory results, and demographic data, healthcare providers achieved more accurate diagnoses and personalized treatment plans, ultimately improving patient outcomes and reducing treatment costs by approximately 15%.
Moreover, it is essential to avoid jargon and overly technical terms that may distance your viewers. By prioritizing clarity and simplicity, you can ensure that your audience grasps the essential insights without getting lost in the details. As Sarah Lee, a Market Research Enthusiast and Data Analytics Professional, states, “Embrace this revolution in market research, and let information aggregation be your guide in unlocking unprecedented potential in your organizational strategies!”
Additionally, using tools such as Power BI from Creatum GmbH can enhance your reporting capabilities by effectively communicating with data, ensuring efficient reporting and consistency. The 3-Day Power BI Sprint allows for the rapid creation of professionally designed reports, while the General Management App provides comprehensive management and smart reviews. Embracing these strategies not only facilitates better understanding but also empowers organizations to unlock unprecedented potential in their strategies.
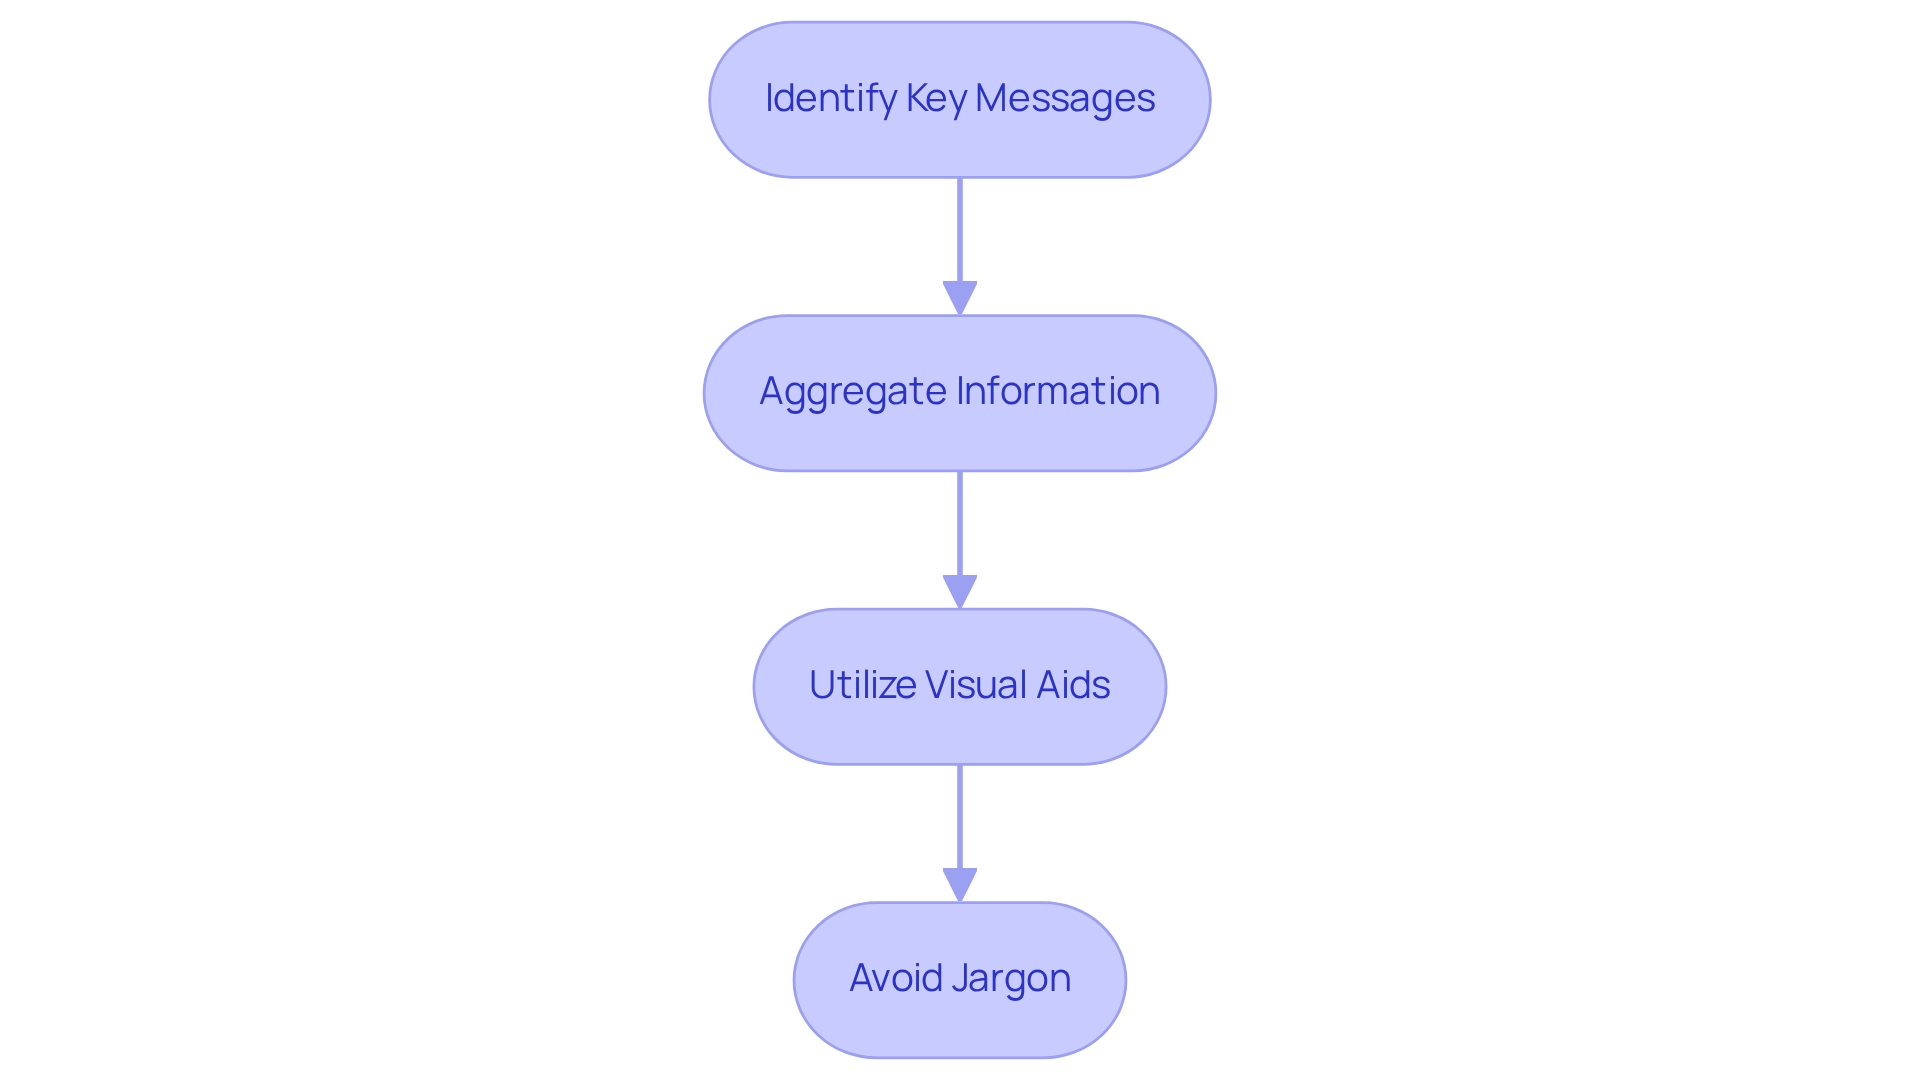
The Art of Data Storytelling: Engaging Your Audience
Information storytelling transforms unprocessed data into compelling narratives that resonate with audiences. To begin, identify the core message you wish to convey and the insights that underpin this message. Employ a narrative framework comprising a beginning (context), a middle (insights), and an end (conclusion or call to action). This structure not only organizes your presentation but also boosts audience engagement.
Incorporating anecdotes or real-life examples significantly enriches your narrative. For instance, when presenting sales information, consider sharing a success story that illustrates how a specific strategy led to increased revenue. This approach not only renders the data relatable but also fortifies the insights you communicate.
The impact of effective storytelling with information is underscored by statistics indicating that fundraising campaigns utilizing video garner 114% more funding than those that do not. This statistic emphasizes the power of visual and narrative elements in enhancing engagement. Furthermore, improving information literacy within your workforce is essential for overcoming challenges in adopting storytelling techniques, equipping team members with the skills necessary to analyze and convey information effectively.
A notable example of transformative information communication is PALFINGER Tail Lifts GMBH’s experience with Creatum GmbH’s Power BI Sprint service. They received not only a ready-to-use Power BI report and gateway setup but also witnessed a remarkable acceleration in their Power BI development. The results exceeded their expectations and provided a crucial enhancement to their analytical strategy, demonstrating the effectiveness of Creatum’s approach in elevating business intelligence.
Creatum GmbH is committed to developing solutions that foster behavioral transformation through collaboration, creativity, and a focus on excellence. By addressing inconsistencies and governance challenges, our services empower businesses to make informed decisions based on reliable information.
Additionally, a significant 75% of marketers prefer Microsoft Office for visualizations, underscoring the importance of familiar tools in enhancing information communication.
In conclusion, integrating a narrative into your presentations not only captures your audience’s attention but also amplifies the impact of the information shared. Successful examples of information storytelling, such as Arab News’s ‘Jews of Lebanon’ and ThoughtSpot’s ‘Are Hurricanes Getting Worse?’, illustrate how visual representations can effectively convey complex information, further emphasizing the importance of storytelling in delivering insights.
Discover how Creatum GmbH can assist you in transforming your storytelling and driving meaningful change within your organization.
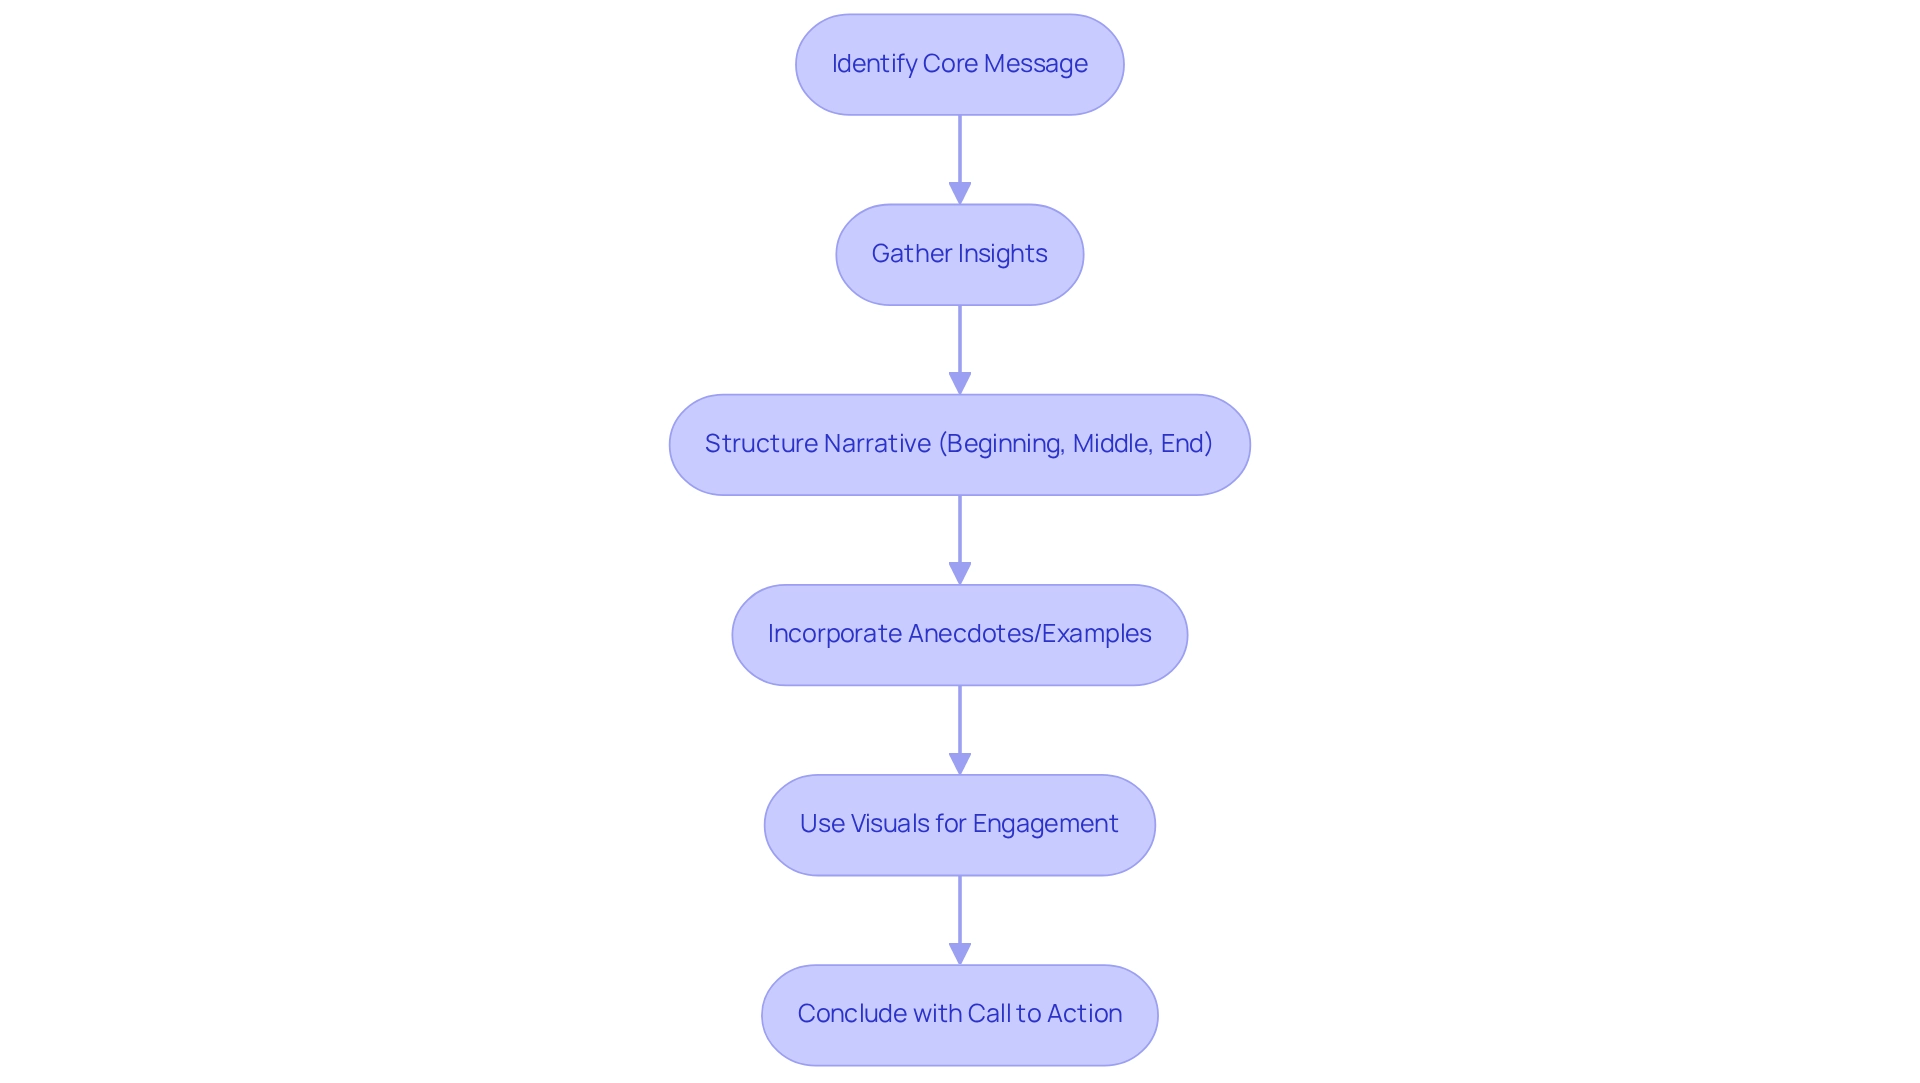
Choosing the Right Format: Reports, Dashboards, and More
Choosing the suitable format for information presentation is crucial for effective data communication. Common formats include reports, dashboards, and presentations, each serving distinct purposes. Reports are ideal for thorough analysis, providing extensive information and insights that address detailed inquiries.
In contrast, dashboards offer a concise overview of key performance indicators (KPIs), making them ideal for swift decision-making and real-time monitoring.
When deciding on the appropriate format, it is essential to consider the viewers’ requirements and the context in which the information will be presented. For instance, when conveying complex data to individuals without technical expertise, a visually engaging dashboard that highlights key metrics can be significantly more effective than an extensive report filled with intricate details. This approach not only enhances comprehension but also fosters involvement, as viewers are more likely to connect with visual narratives.
As Ashish Arora aptly puts it, “Imagine standing before a group, waiting to deliver a presentation for which you have been working for months.” This underscores the importance of preparation and the right format in ensuring a successful presentation.
Recent trends emphasize the significance of narrative storytelling in presentations, which can greatly enhance audience engagement. By anticipating potential questions and preparing insightful answers, presenters can cultivate constructive dialogues that further clarify the implications of the information.
Statistics indicate a growing preference for mobile-first design in presentations, reflecting the increasing number of users accessing content via mobile devices. This shift necessitates that information presentations be adaptable and visually appealing across various platforms.
To address challenges in leveraging insights from Power BI dashboards, such as time-consuming report creation and inconsistencies, our Power BI services at Creatum GmbH provide enhanced reporting and actionable insights. Notably, the 3-Day Power BI Sprint facilitates the rapid creation of professionally designed reports, while the General Management App ensures comprehensive management and smart reviews. Additionally, our RPA solutions complement these services by automating repetitive tasks and improving operational efficiency.
This integration of effective tools highlights the importance of selecting the appropriate information presentation format, ultimately resulting in improved strategies for communicating with data and better decision-making outcomes.
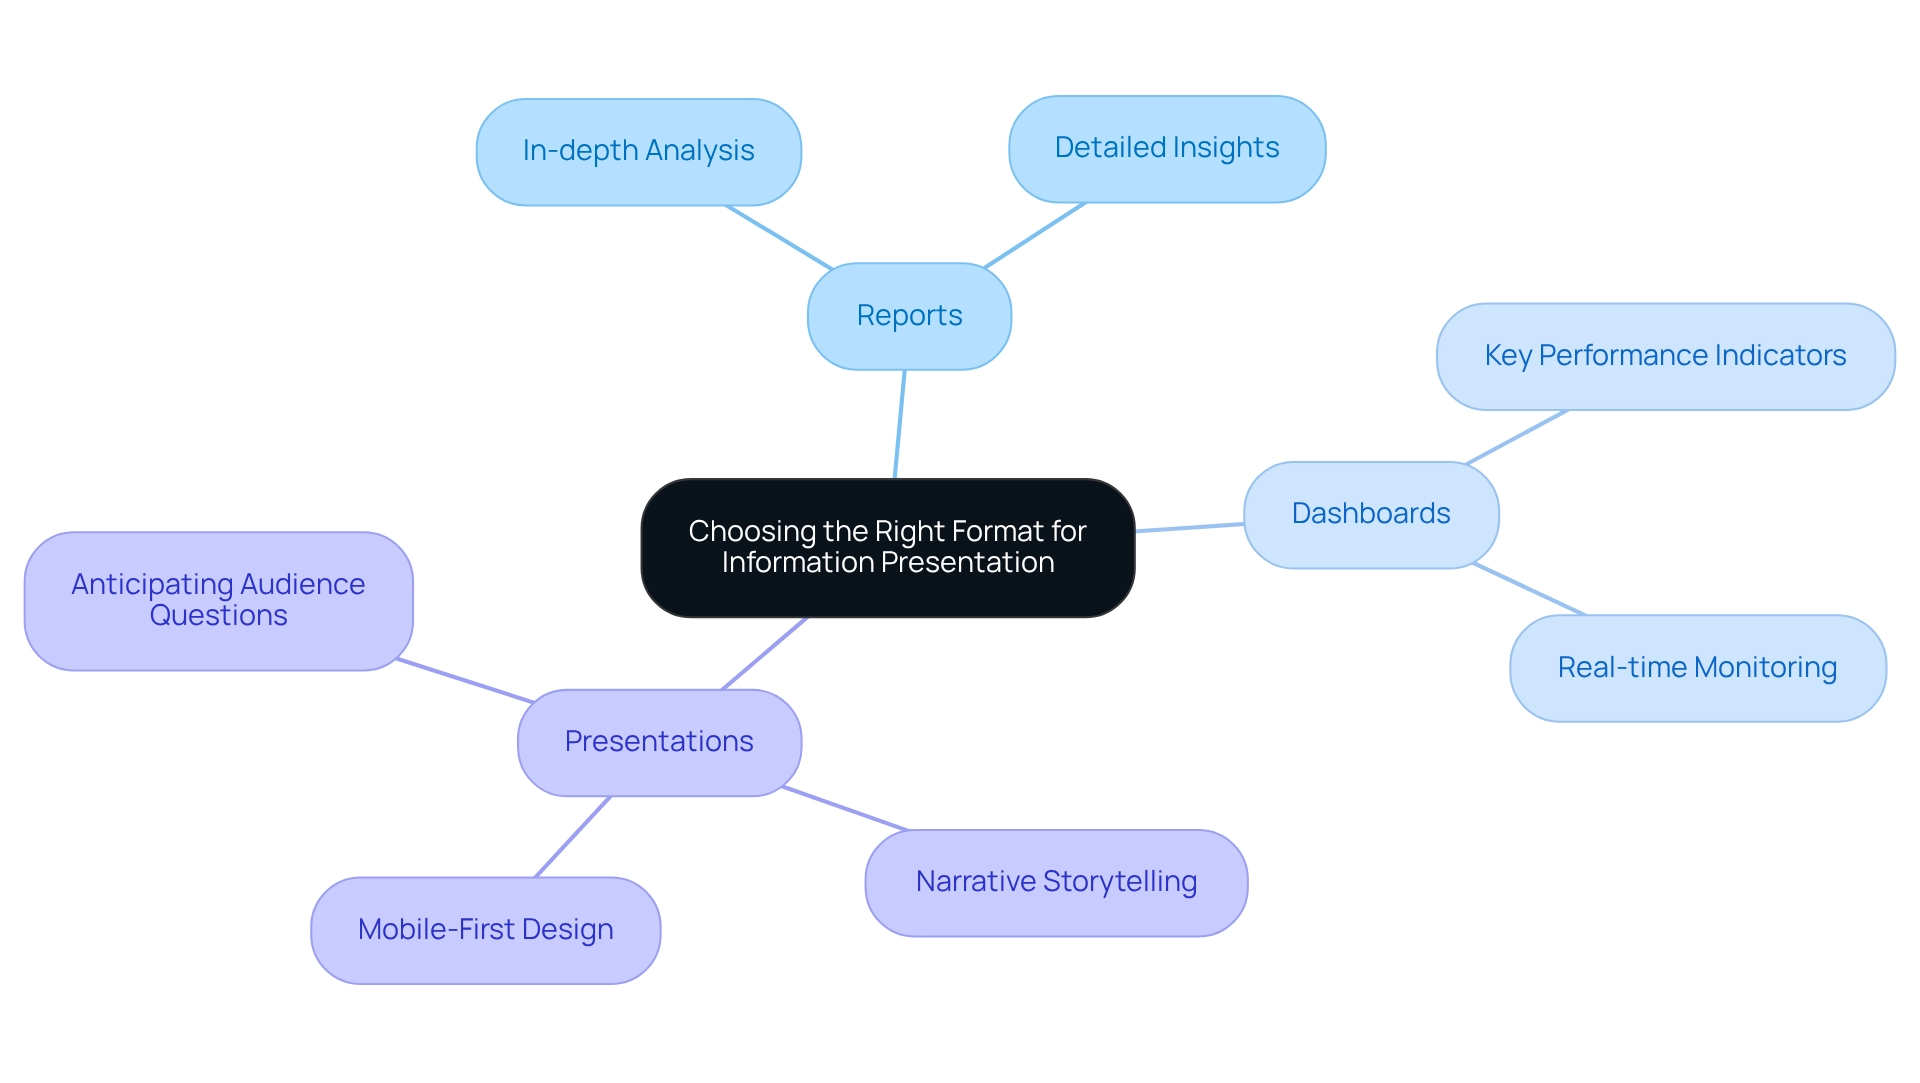
Visualizing Data: Enhancing Understanding Through Graphics
Data visualization is crucial for effective communication with data, significantly enhancing both comprehension and retention of information, especially in the context of the overwhelming AI landscape. By employing charts, graphs, and infographics, organizations can dramatically improve how information is presented. This is particularly true when customized solutions from Creatum GmbH are utilized to align with specific business objectives. Choosing the appropriate type of visual representation based on the characteristics of the information is essential.
For example:
- Line graphs excel at illustrating trends over time.
- Pie charts effectively convey proportions within a dataset.
To maximize clarity, visuals should be straightforward and uncluttered, using colors and labels strategically to direct the audience’s focus.
Moreover, incorporating interactive visualizations allows users to engage directly with the information, fostering a deeper understanding. This is increasingly important as companies seek to harness the power of Business Intelligence (BI) to transform raw data into actionable insights, facilitating informed decision-making that drives growth and innovation. Research indicates that effective information visualization can yield an impressive return on investment, with business intelligence tools showing an ROI of $13.01 for every dollar invested.
This underscores the importance of investing in quality visualization methods, particularly since effective communication with data can also enhance search engine rankings, as noted by content specialists such as Raja Antony Mandal.
Recent studies highlight the need for advancements in visual representation methods, particularly in developing guidelines for selecting appropriate visuals and improving the integration of various representations. The case study titled “Future Research Opportunities in Data Visualization” identifies several areas for future research that could lead to more effective practices in conveying complex information clearly and accurately. By adopting these effective information visualization techniques and prioritizing communication with data, professionals can transform complex content into accessible and engaging formats, ultimately driving better decision-making and operational efficiency.
Furthermore, addressing information inconsistency and governance challenges in business reporting is vital for improved decision-making, ensuring stakeholders receive clear, actionable guidance from their information. Engaging with impactful information-sharing methods early on is essential, as studies show that 80% of the brain’s ability to adapt occurs before the age of 5. This early engagement establishes a foundation for enhanced understanding and retention of information.
Additionally, Creatum GmbH’s Robotic Process Automation (RPA) solutions can significantly enhance operational efficiency by automating repetitive tasks. This approach tackles issues of information inconsistency and allows organizations to focus on strategic decision-making.
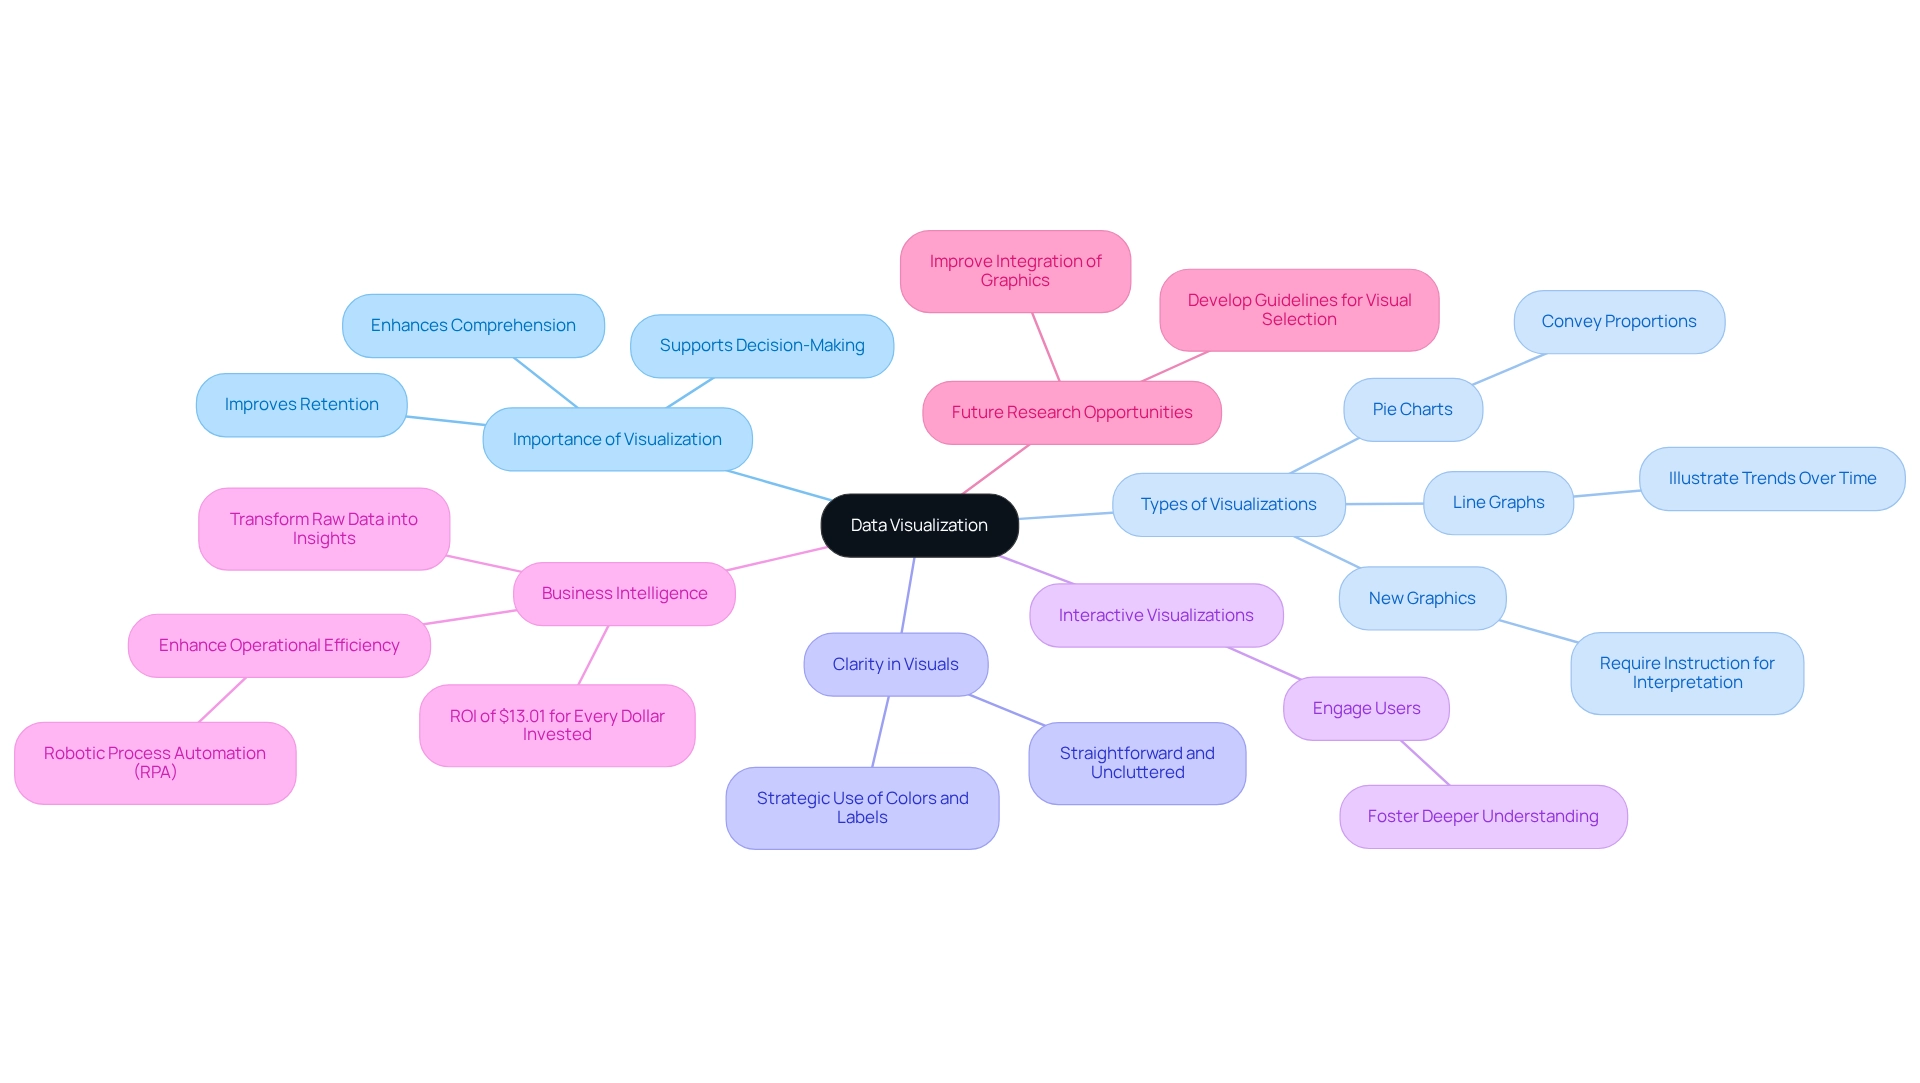
The Role of Feedback: Iterating for Better Communication
Feedback is crucial for enhancing the effectiveness of communicating with data, especially within Business Intelligence (BI) and Robotic Process Automation (RPA) solutions like EMMA RPA and Power Automate. After delivering a presentation, actively seek feedback from your audience to assess their understanding and pinpoint areas for improvement. Utilize various methods—surveys, informal discussions, or follow-up meetings—to gather valuable insights.
Analyzing this feedback can reveal common themes that inform adjustments to your messaging strategies. This is particularly relevant when using BI tools like Power BI, which can sometimes present challenges such as time-consuming report generation, inconsistencies in information, and issues stemming from insufficient master information quality.
As Gallup states, “In a development-focused work culture, feedback isn’t a one-way, top-down event.” This highlights the collaborative nature of feedback, essential for enhancing interaction. For instance, if audience members express confusion over specific data points, revising your presentation to clarify those aspects may be beneficial.
This iterative process not only sharpens your communication skills but also ensures your messages resonate clearly and effectively.
Statistics underscore the importance of feedback in fostering creativity and collaboration; studies indicate that 40% of employees believe consistent interaction enhances team creativity. This statistic supports the argument that feedback is vital for effective data communication. Furthermore, organizations utilizing internal messaging platforms like Slack or Microsoft Teams have reported significant improvements in employee interaction and collaboration.
These platforms facilitate instant messaging and real-time collaboration, streamlining workflows and enhancing interaction efficiency.
Incorporating feedback mechanisms into your data presentations is essential. Consider implementing digital signage to display real-time feedback, which can enhance internal interactions based on employee responses. This integration not only offers immediate insights but also cultivates a culture of continuous improvement.
By prioritizing feedback and leveraging BI and RPA solutions such as EMMA RPA and Power Automate, you can create a more dynamic and responsive strategy focused on data communication, improve information presentation, and boost overall organizational efficiency. Additionally, addressing barriers to AI adoption will further reinforce your approach to utilizing tailored AI solutions in your operations.
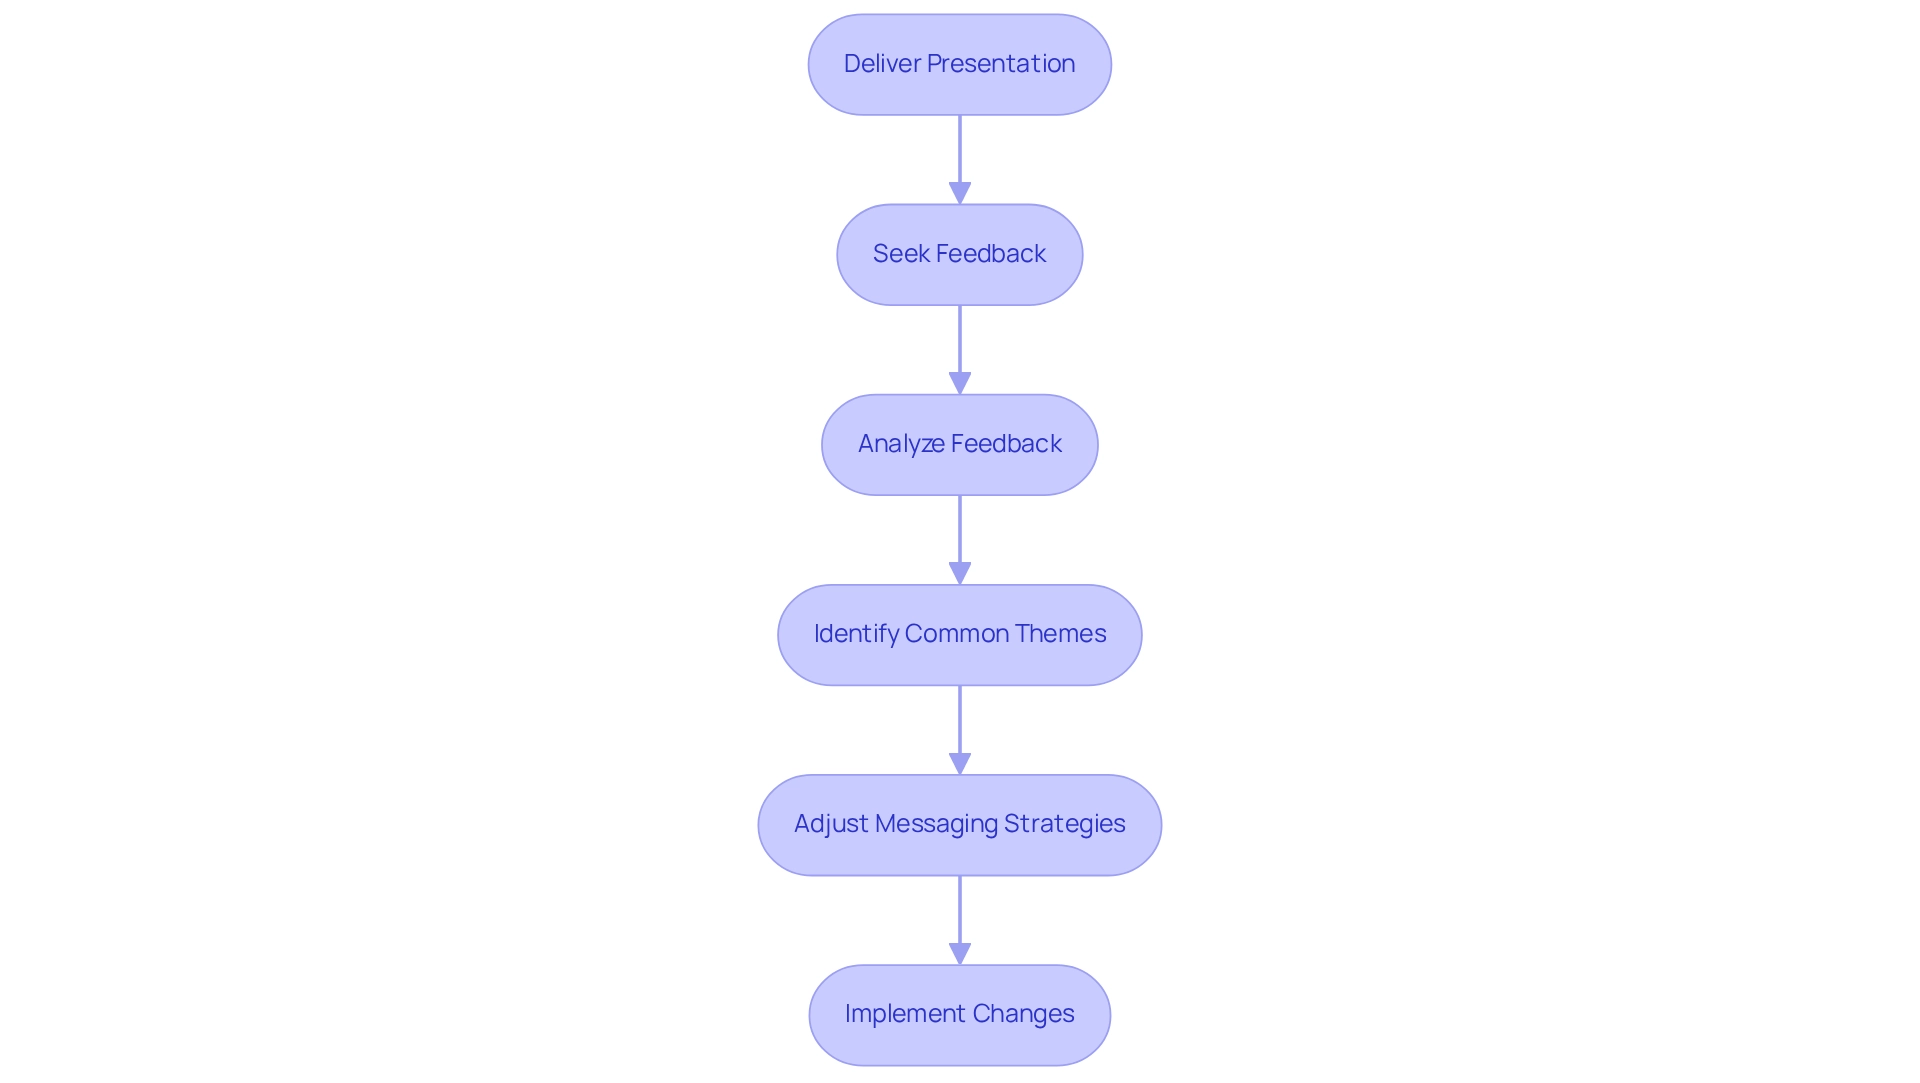
Ethical Considerations in Data Communication
Ethical considerations in communicating with data are essential for fostering trust and integrity within any organization. Openness regarding sources and methodologies is crucial, as it guarantees that stakeholders can evaluate the trustworthiness of the information provided. Manipulating information to mislead audiences undermines credibility and can lead to significant repercussions, as demonstrated in high-profile cases like the Facebook-Cambridge Analytica scandal, which highlighted the dangers of unethical information practices.
In contrast, organizations like Apple and IBM exemplify positive practices in information ethics, demonstrating how transparency enhances trust and accountability.
Organizations must remain vigilant about privacy concerns when sharing sensitive information. The 2016 Uber security incident, which revealed the personal information of 57 million users and drivers, serves as a stark reminder of the potential consequences of ignoring ethical standards. Uber’s choice to compensate hackers $100,000 to erase the information and maintain the breach’s secrecy illustrates the severe consequences of failing to prioritize ethical practices.
As Uber stated, “In 2016, we experienced a breach that exposed the personal information of 57 million users and drivers,” emphasizing the critical need for robust protection measures.
Furthermore, the impact of communicating with data extends beyond mere figures; it influences perceptions and choices among various stakeholders. When guests post remarks on a website, organizations such as Creatum GmbH gather information like the visitor’s IP address and browser user agent string to assist with spam detection. Anonymized strings created from email addresses may be shared with services like Gravatar, raising additional privacy considerations.
The Gravatar service privacy policy is available here: https://automattic.com/privacy/. Following the endorsement of remarks, profile images become accessible to the public, emphasizing the significance of handling user information responsibly. Privacy issues also emerge when images containing embedded location information (EXIF GPS) are uploaded, necessitating careful management of such information.
When presenting information related to employee performance, it is vital to ensure that it is conveyed fairly and without bias. This approach upholds ethical standards and cultivates a culture of accountability and trust within the organization.
Training programs centered on information ethics are crucial for integrating these principles into the organizational culture. Such initiatives enable employees to comprehend and apply ethical practices regarding information, ensuring that ethical considerations are prioritized in all aspects of information management. The case study on ‘Training and Awareness in Ethical Practices’ emphasizes the necessity for formal training programs to guarantee that all employees understand and can apply ethical practices regarding information.
Moreover, statistical practitioners must manage participant data carefully to ensure confidentiality, reinforcing the overall theme of ethical data exchange. By committing to transparency and ethical communication, organizations can enhance their reputation and foster stronger relationships with their stakeholders through effective communication with data.
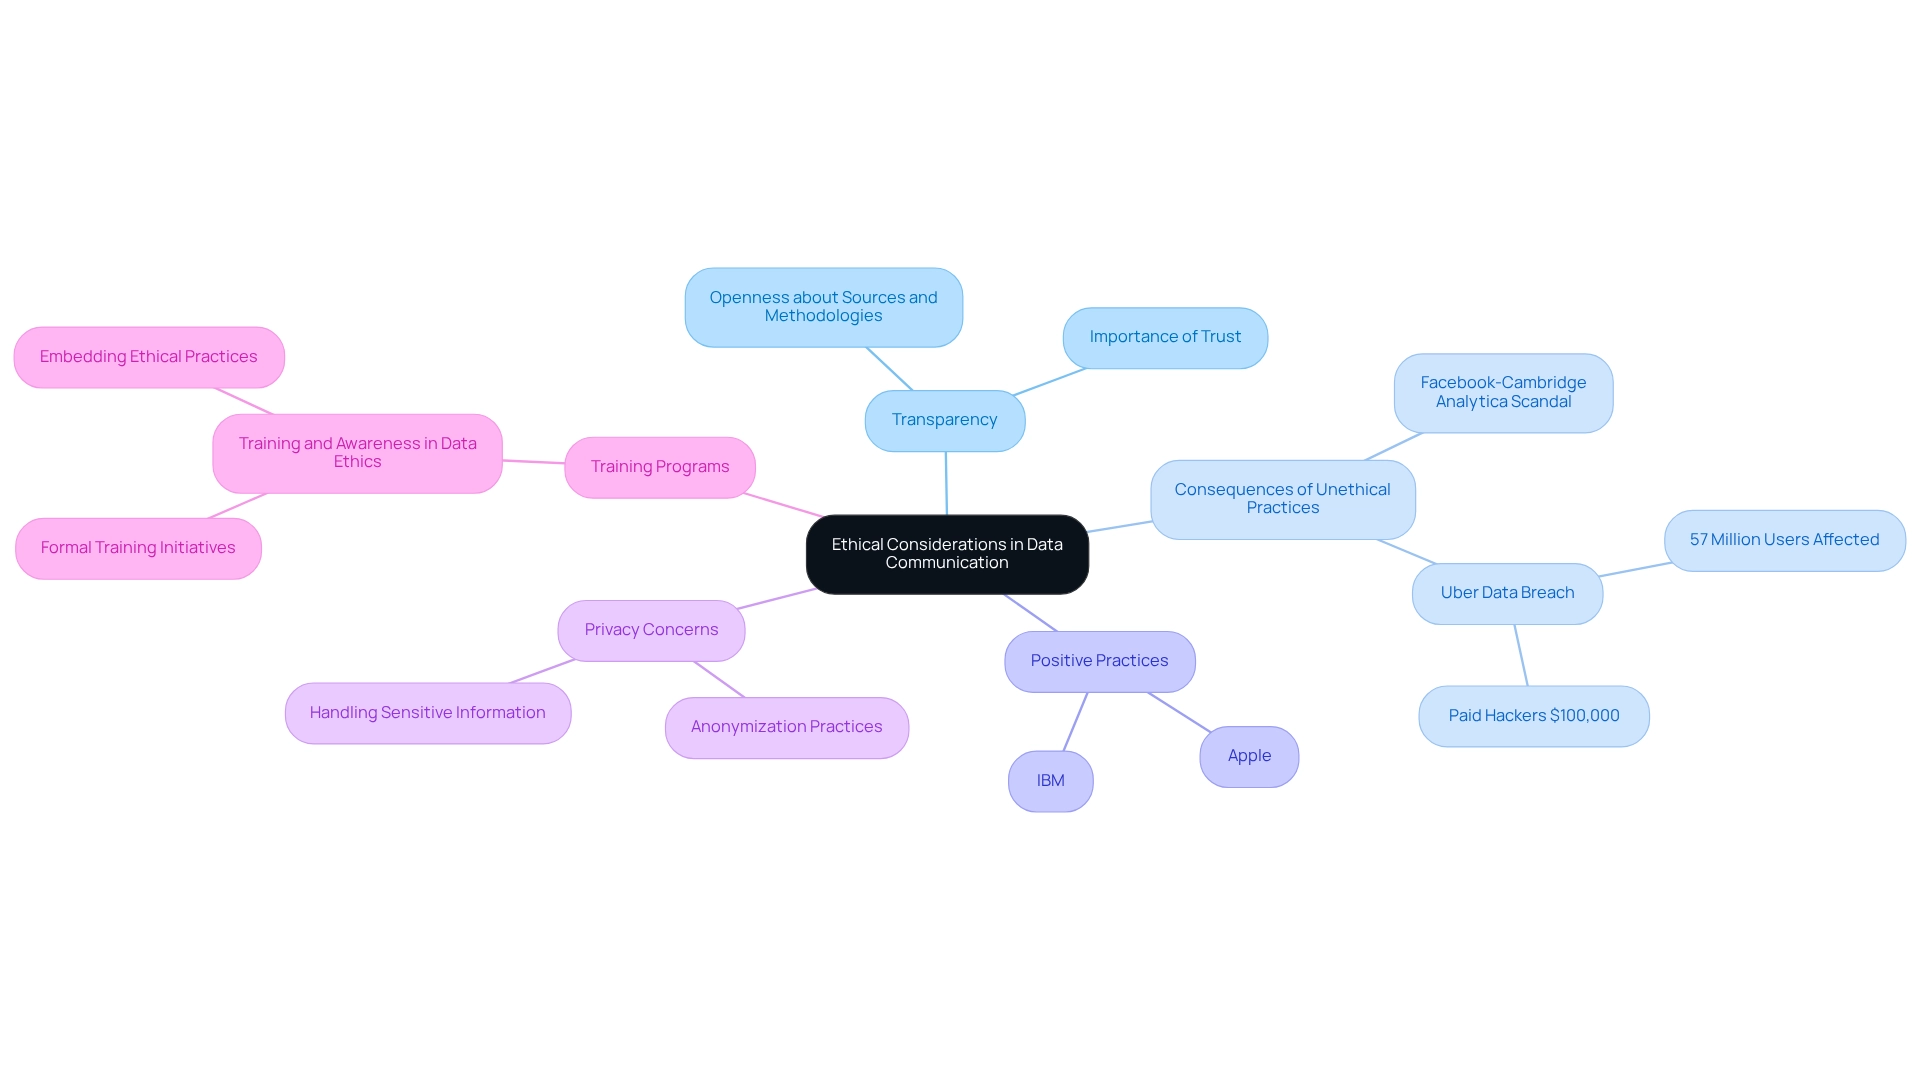
Conclusion
Effective data communication is paramount in today’s rapidly evolving landscape. The ability to convey insights clearly can significantly impact organizational success. This article highlights several key aspects of this discipline: from understanding the importance of data communication to the ethical considerations that must be upheld. Organizations that prioritize effective communication can enhance decision-making, foster collaboration, and drive strategic initiatives, ultimately leading to improved operational efficiency.
Tailoring messages to the audience is crucial. This approach ensures that insights resonate and are easily understood. By employing techniques such as data storytelling and visualization, complex information can be transformed into compelling narratives that engage and inform. The choice of format—whether reports, dashboards, or presentations—also plays a significant role in how effectively data is communicated.
Moreover, the importance of feedback in refining communication strategies cannot be overstated. Actively seeking audience input can lead to iterative improvements that enhance clarity and engagement. Ethical considerations in data communication are critical; transparency and integrity are essential for building trust and credibility with stakeholders.
In conclusion, mastering the art of data communication equips organizations with the tools to convey information effectively and cultivate a culture of informed decision-making. By embracing innovative strategies and ethical practices, organizations can unlock the full potential of their data, driving growth and fostering a competitive edge in an increasingly data-driven world.
Frequently Asked Questions
Why is communicating with data important in today’s environment?
Communicating with data is essential as it facilitates informed decision-making, fosters collaboration among teams, drives strategic initiatives, and enhances operational efficiency.
What advantages do organizations gain by prioritizing data communication?
Organizations that prioritize communicating with data often experience reduced errors and increased productivity.
What percentage of individuals reported no progress in their organizations’ interaction practices?
A striking 45% of individuals reported no progress in their organizations’ interaction practices, highlighting the need for improved strategies.
What statistical tools can enhance data communication and analysis?
Statistical tools such as visualization, regression analysis, and hypothesis testing can significantly enhance the accuracy of predictions and the development of effective strategies.
How does Power BI contribute to data communication?
Power BI services improve reporting and provide actionable insights through features like the 3-Day Power BI Sprint, which allows for the rapid creation of professionally designed reports.
What role does the General Management App play in data communication?
The General Management App offers comprehensive oversight and intelligent evaluations, addressing information inconsistency and governance challenges in business reporting, ultimately leading to better decision-making.
Can you provide an example of improved operational efficiency through data communication?
A case study showed that a mid-sized company achieved a 70% reduction in input errors and an 80% increase in workflow efficiency by automating data entry and software testing.
How does effective data communication impact team performance?
When teams can easily comprehend and act on findings, they are better equipped to optimize processes and enhance overall performance, which also influences long-term strategic direction.
What is the benefit of integrating Robotic Process Automation (RPA) in data communication?
Integrating RPA can boost productivity by automating repetitive tasks, allowing teams to focus on more strategic initiatives.
What is the first step in effective communication with data?
The first step is to thoroughly understand your listeners by analyzing their demographics, professional backgrounds, and familiarity with the subject matter.
How can audience evaluation improve data communication?
Tailoring messages based on audience evaluation enhances understanding and engagement, making the communication more powerful.
What trend has been observed regarding the use of data in organizations?
Over 80% of companies are focusing on communicating with data through analytics across various departments, indicating a significant shift towards a data-first culture.
What can happen if a business fails to utilize Business Intelligence (BI) effectively?
Failing to utilize BI effectively can leave a business at a competitive disadvantage, making it imperative to adopt data communication strategies.
Overview
This article serves as a comprehensive guide for operations leaders, detailing effective communication of data. It underscores the importance of audience understanding, clarity, and engagement strategies. By outlining practical steps—such as audience segmentation, storytelling techniques, and the careful selection of visualizations—it aims to enhance comprehension. Ultimately, these strategies foster informed decision-making in today’s data-driven environment.
Introduction
In an era characterized by information overload, the capacity to communicate data effectively has become paramount. Organizations face an overwhelming influx of data, yet many find it challenging to articulate insights in ways that resonate with their audiences.
By understanding audience preferences, leveraging storytelling techniques, and utilizing clear visualizations, data can be transformed from mere numbers into compelling narratives that drive decision-making. As businesses navigate the complexities of the digital landscape, mastering these communication strategies is essential—not only for engagement but also for cultivating a culture of data-driven innovation.
This article delves into the key elements of effective data communication, providing actionable insights designed to enhance clarity, engagement, and, ultimately, organizational success.
Understanding Your Audience: The Key to Effective Data Communication
Successful information exchange begins with the ability to communicate data effectively to your audience. Identifying their roles, expertise, and interests is crucial for this purpose. Leaders, for instance, often prefer brief, high-level overviews that emphasize essential information, while technical groups may require comprehensive figures and analyses to inform their decisions.
To gather valuable insights about your audience’s preferences and knowledge levels, consider utilizing tools like surveys or interviews. This approach is fundamental to understanding how to communicate data effectively.
Segmentation of your audience plays a vital role in enhancing your presentations. By categorizing groups based on their information literacy and specific interests, you can tailor your communication strategies to resonate with each segment. This method not only makes your message more relevant but also boosts engagement and comprehension, illustrating the importance of effective data communication in today’s rapidly evolving AI landscape, where tailored solutions must align with specific business goals.
Creatum GmbH provides customized AI solutions designed to assist businesses in navigating the overwhelming array of available options. By leveraging Business Intelligence (BI), organizations can transform raw data into actionable insights, facilitating informed decision-making that drives growth and innovation. For example, a multinational company successfully optimized its digital ad placements by employing predictive models to forecast conversion rates, significantly reducing marketing waste.
This strategic analysis of the target group resulted in a remarkable 30% reduction in unnecessary expenditures while simultaneously enhancing overall ad performance. This case exemplifies how effective target group analysis, combined with BI and tailored solutions from Creatum GmbH, directly contributes to achieving substantial results.
To effectively evaluate preferences for information communication, follow these action steps:
- Conduct an analysis of your audience through surveys or interviews to gather insights. Segment your audience based on their data literacy and interests.
- Adjust your communication approach to suit each segment, which is essential for understanding how to communicate data effectively while ensuring clarity and relevance.
As the environment evolves, remaining knowledgeable and adaptable is crucial for enhancing strategies through data-informed understanding. With over 80% of companies embracing a data-first culture, leveraging data-driven insights has never been more critical. Embrace the power of numbers and let information guide your path to success.
By converting raw data into actionable insights, organizations can inform strategic decisions and propel their journey toward success.
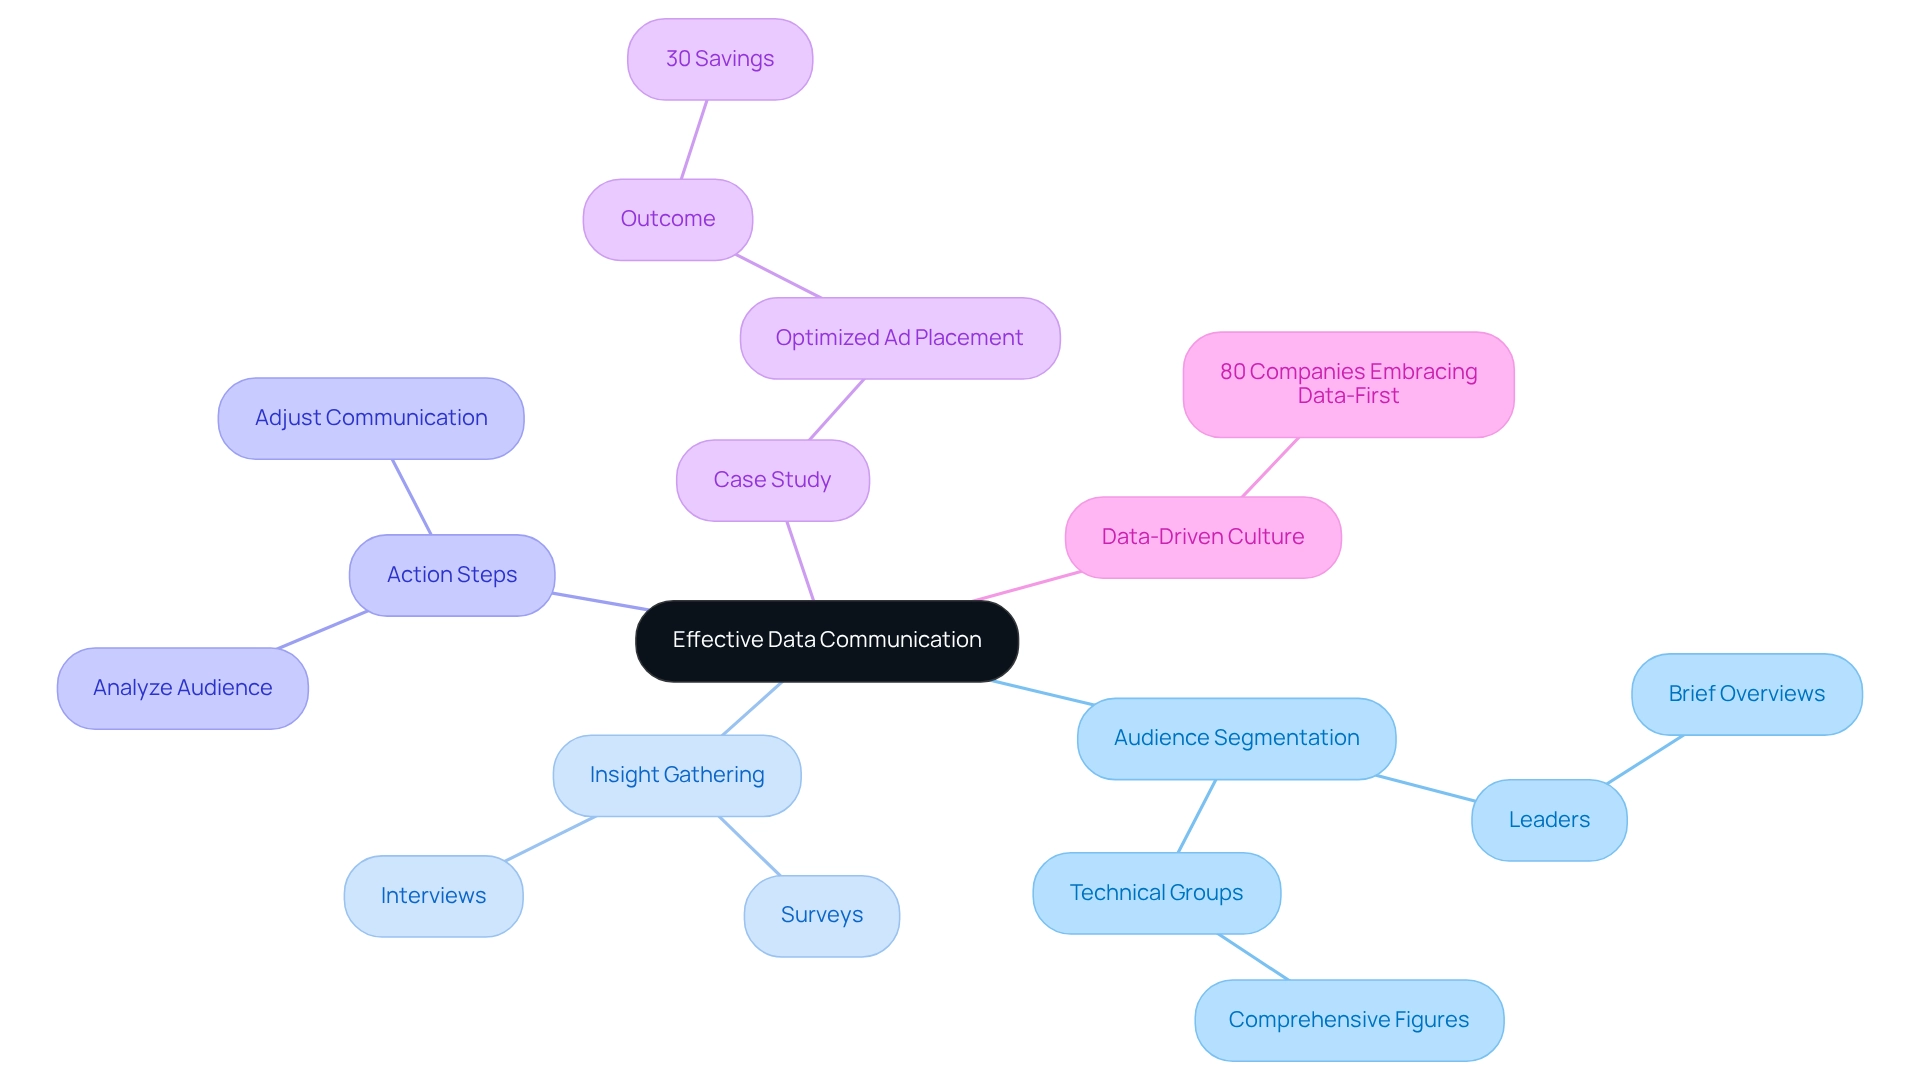
The Power of Storytelling: Engaging Stakeholders with Data Narratives
Integrating storytelling methods into your presentations can significantly enhance engagement and understanding, particularly when communicating data effectively in the overwhelming AI landscape. Start by embedding your information within a narrative that clearly outlines the issue, the resolution, and the resulting effect. For example, when showcasing sales figures, narrate a story that illustrates how a specific strategy led to increased revenue, thereby making the statistics more relatable and impactful.
To effectively convey your message, follow these action steps:
- Identify the Key Message: Determine the core insight you wish to convey to your listeners, ensuring it aligns with their interests and needs, especially in the realm of Business Intelligence and AI solutions.
- Create a Narrative Arc: Organize your presentation by introducing the challenge, presenting the pertinent information, and concluding with the implications of your findings. This logical progression helps maintain audience engagement and facilitates understanding, particularly when discussing the transformative impact of tailored solutions like Creatum’s Power BI Sprint.
- Utilize Visuals: Support your narrative with compelling visuals, such as infographics or charts, which can help clarify complex information and reinforce your message.
Statistics reveal that branded narratives can lead to a 4% increase in trust, often translating into improved conversion rates. Furthermore, a substantial 73.67% of individuals employ narrative techniques to convey sales information effectively, according to Venngage. This underscores the growing acknowledgment of narrative techniques as an essential proficiency in analysis, particularly regarding effective data communication, where the ability to convey findings persuasively is as crucial as the examination itself.
Real-world instances demonstrate that impactful narratives can significantly enhance stakeholder involvement. For instance, a case study titled ‘Data Storytelling: How to Effectively Tell a Story with Data’ illustrated how a company addressed a sales decline by weaving a narrative around environmental concerns, ultimately inspiring action and fostering a deeper connection with stakeholders. By mastering how to communicate data effectively through narrative, operations leaders can transform raw figures into memorable insights that drive informed decision-making and strategic initiatives.
Effective corporate storytelling should be simple, structured, and considerate of the audience’s perspective, reinforcing the importance of these elements in your narrative. Moreover, leveraging insights from Creatum’s Power BI Sprint can expedite your information analysis and reporting success, further enhancing your operational efficiency. As Sascha Rudloff, Teamleader of IT and Process Management at PALFINGER Tail Lifts GMBH, stated, ‘The outcomes of the Power BI Sprint have surpassed our expectations and were a significant enhancement for our analysis strategy.’
This testimonial highlights the real-world impact of Creatum’s solutions in addressing the challenges businesses face in the AI landscape.
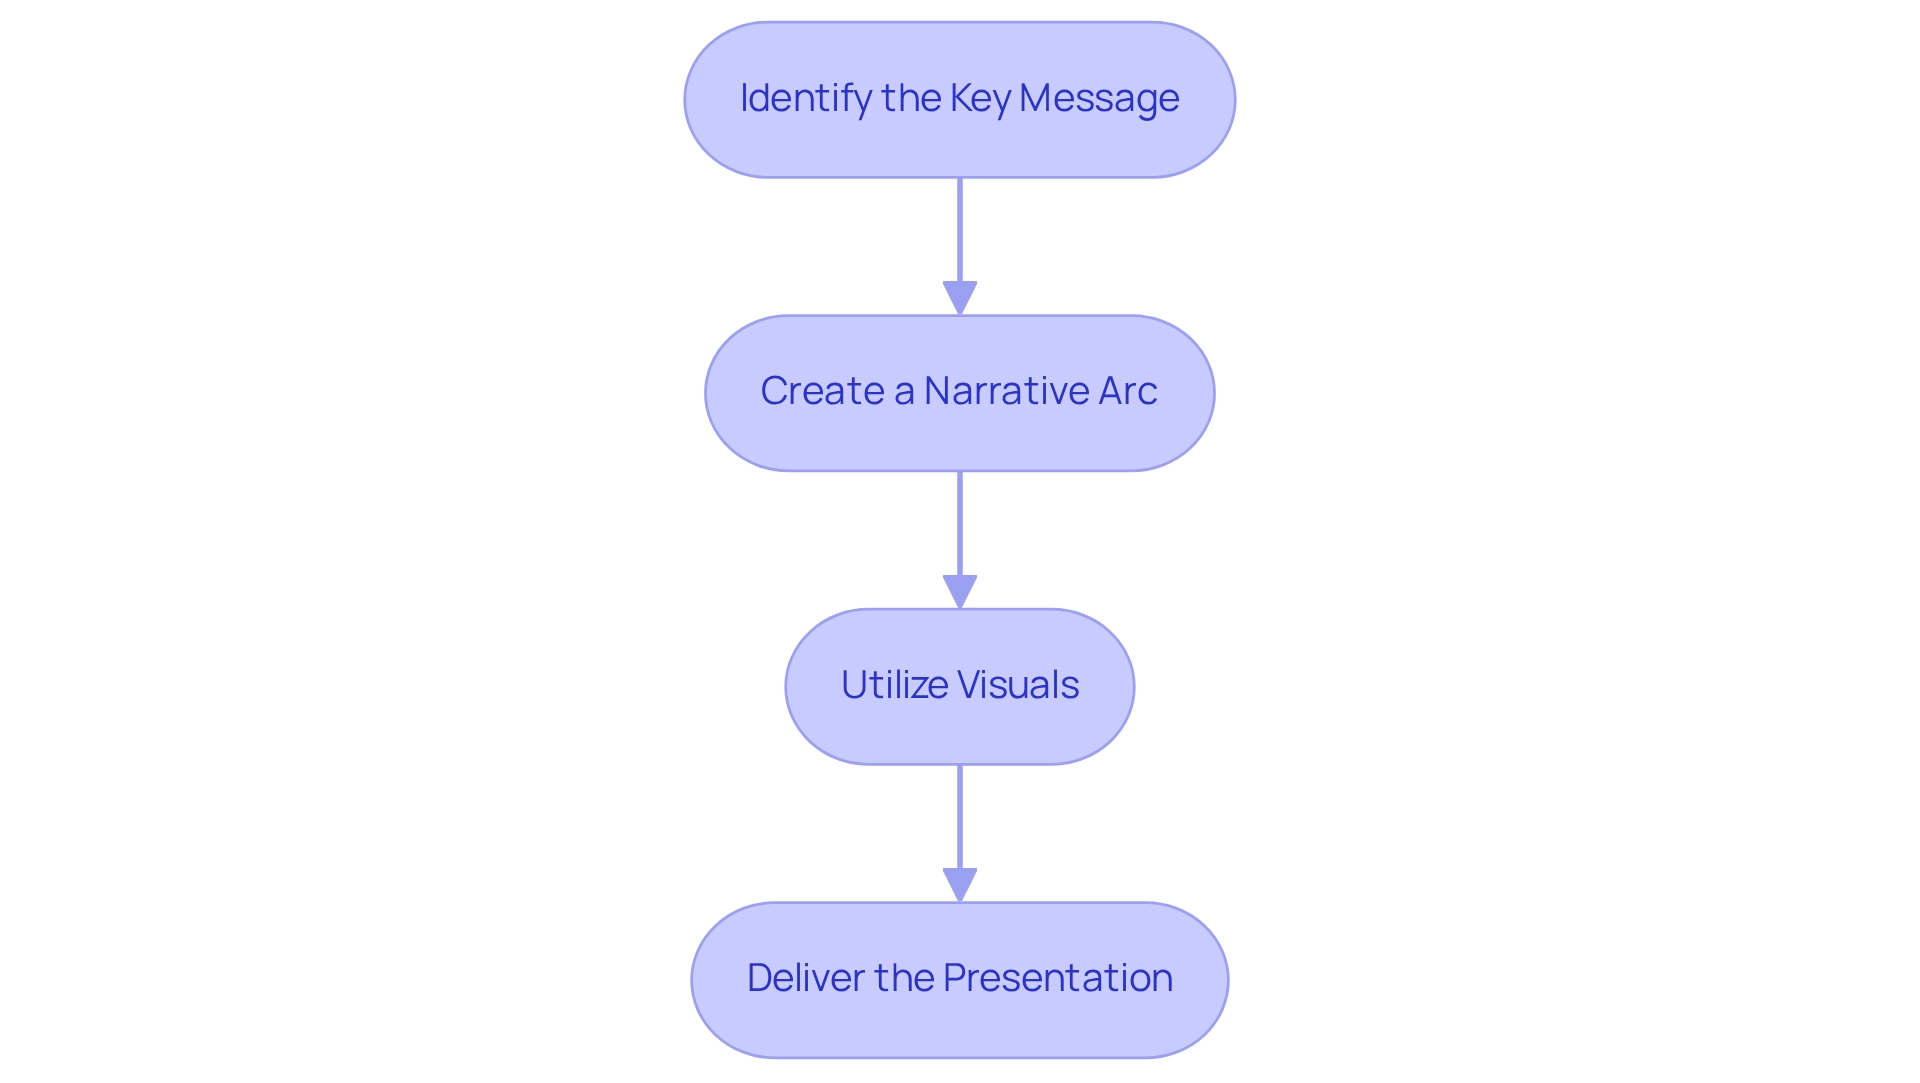
Clarity and Simplicity: Making Data Accessible to All
To enhance clarity in data communication, it is crucial to understand how to communicate data effectively by eliminating jargon and overly technical language. Utilizing simple, direct language is essential when learning to convey data among diverse audiences. Instead of presenting dense tables filled with numbers, consider summarizing key findings using bullet points or straightforward charts.
This approach not only makes the information more accessible but also demonstrates effective data communication by highlighting the most critical insights.
Research indicates that the use of jargon can significantly hinder understanding; a recent study found that 65% of respondents with higher education levels still struggled with complex terminology in data presentations. Furthermore, a case study conducted during the early COVID-19 lockdown revealed that jargon negatively impacted persuasion, particularly for non-urgent topics. This underscores the necessity of context in messaging strategies, especially in understanding how to communicate data effectively, as clarity can enhance engagement and decision-making.
As Thomas Holtgraves, an Academic Editor, remarked, ‘We look forward to receiving your revised manuscript,’ emphasizing the significance of clear interaction in academic and professional environments.
The jargon score of the examined paper was 89.6, aligning with the average of 2019 documents, suggesting a notable occurrence of jargon in information presentations. Additionally, the vocabulary of articles from 1999/2000 may not align well with current standards, potentially overestimating the percentage of rare words compared to more recent publications. This evolution emphasizes how to communicate data effectively by simplifying language in information communication.
To simplify complex data presentations and leverage Business Intelligence effectively, follow these strategies:
- Break down information into digestible parts, using bullet points to emphasize key insights.
- Offer background to assist your audience in comprehending the importance of the information, ensuring they recognize its relevance to their operations and how it can be improved through RPA.
- Utilize visual aids, like charts and infographics, to illustrate information visually, facilitating easier interpretation.
By prioritizing clarity and simplicity in how to communicate data effectively, operations leaders can foster better understanding and facilitate informed decision-making across their teams, ultimately driving operational efficiency and business growth. Furthermore, integrating Robotic Process Automation (RPA) into these strategies can streamline processes, reduce errors, and allow teams to focus on more strategic tasks. Customized AI solutions can also improve information analysis, offering deeper insights that assist in effective decision-making.
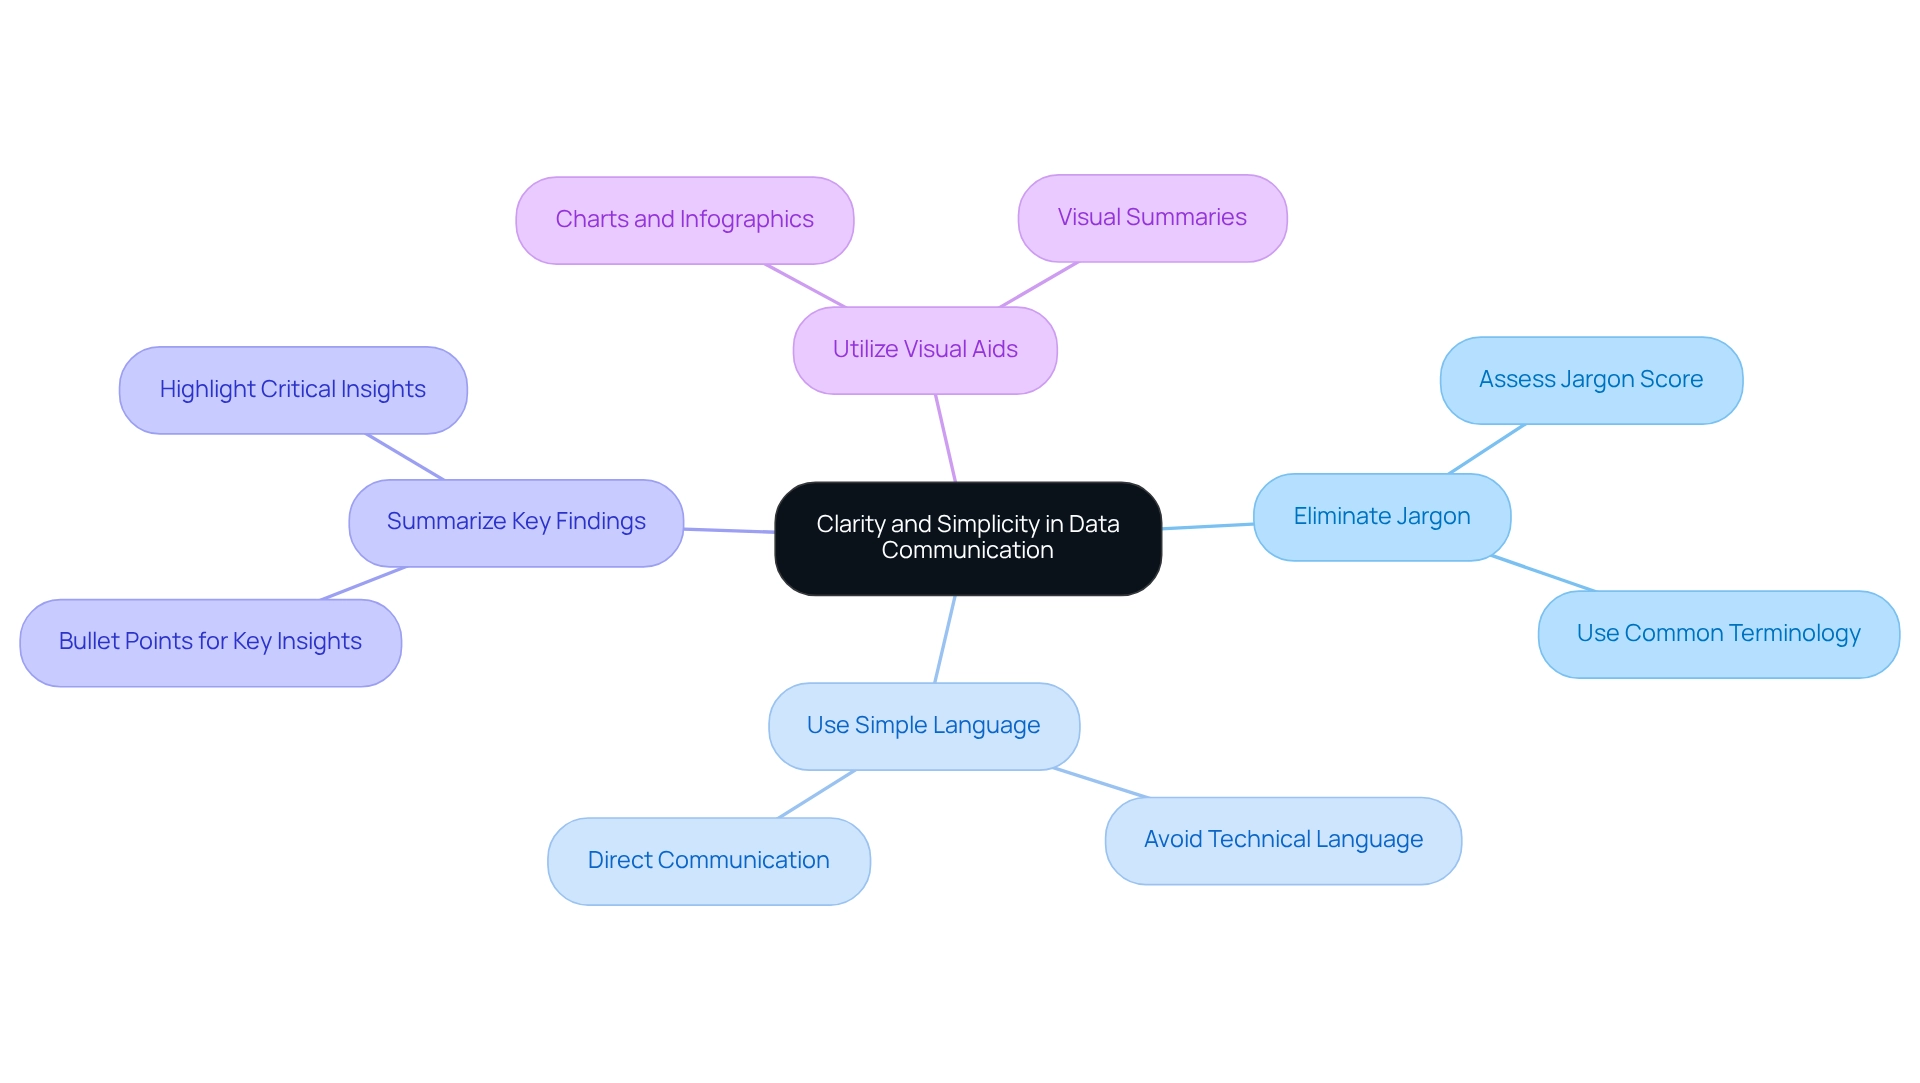
Choosing Effective Visualizations: Enhancing Data Comprehension
Choosing the appropriate visualizations is essential for effectively communicating data and enhancing your narrative, especially when navigating inconsistencies and governance issues. Different types of visualizations serve unique purposes: bar charts excel in comparisons, line graphs illustrate trends over time, and pie charts convey proportions effectively. However, reports plagued by inconsistent information due to a lack of governance strategy can lead to confusion and mistrust in the presented content.
To enhance clarity, avoid clutter in your visuals and utilize color strategically to emphasize key points. For instance, contrasting colors can help distinguish between sets of information, facilitating comprehension for your audience.
- Identify the Type of Information: Begin by understanding the nature of the information you are working with. This foundational step will guide your choice of visualization and ensure that you are addressing any inconsistencies.
- Choose an Appropriate Visualization Type: Select a visualization that corresponds with your information type and the message you wish to convey. For example, if monitoring changes over time, a line graph might be the most efficient option, provided that the foundational information is consistent and trustworthy.
- Maintain Simplicity: Keep your visuals straightforward and focused on the most critical insights. Excessively intricate visuals can obscure the message and confuse the audience, particularly when the information lacks clear, actionable guidance.
Current trends in information visualization underscore the importance of clarity and memorability. Research indicates that diagrams significantly outperform traditional formats like points, bars, and tables in terms of retention. As Bang Wong, Creative Director of MIT’s Broad Institute, observes, ‘Plotting the information enables us to perceive the underlying structure that you wouldn’t otherwise notice if you’re examining a table.’
This highlights the transformative power of effective visual communication, particularly in conveying data when it is based on consistent information.
Incorporating best practices, such as displaying information alongside geometries, can provide essential context and enhance the overall message. For instance, geographical information can be effectively represented using choropleth maps and cartograms, which allow for a deeper understanding of spatial relationships and distributions. By adhering to these guidelines and ensuring consistency, you can guarantee that your visualizations not only convey information but also demonstrate how to communicate data effectively, enhancing understanding and promoting informed decision-making.
At Creatum GmbH, we provide solutions that specifically address these governance challenges, ensuring that your data is not only consistent but also actionable, empowering you to make informed decisions.
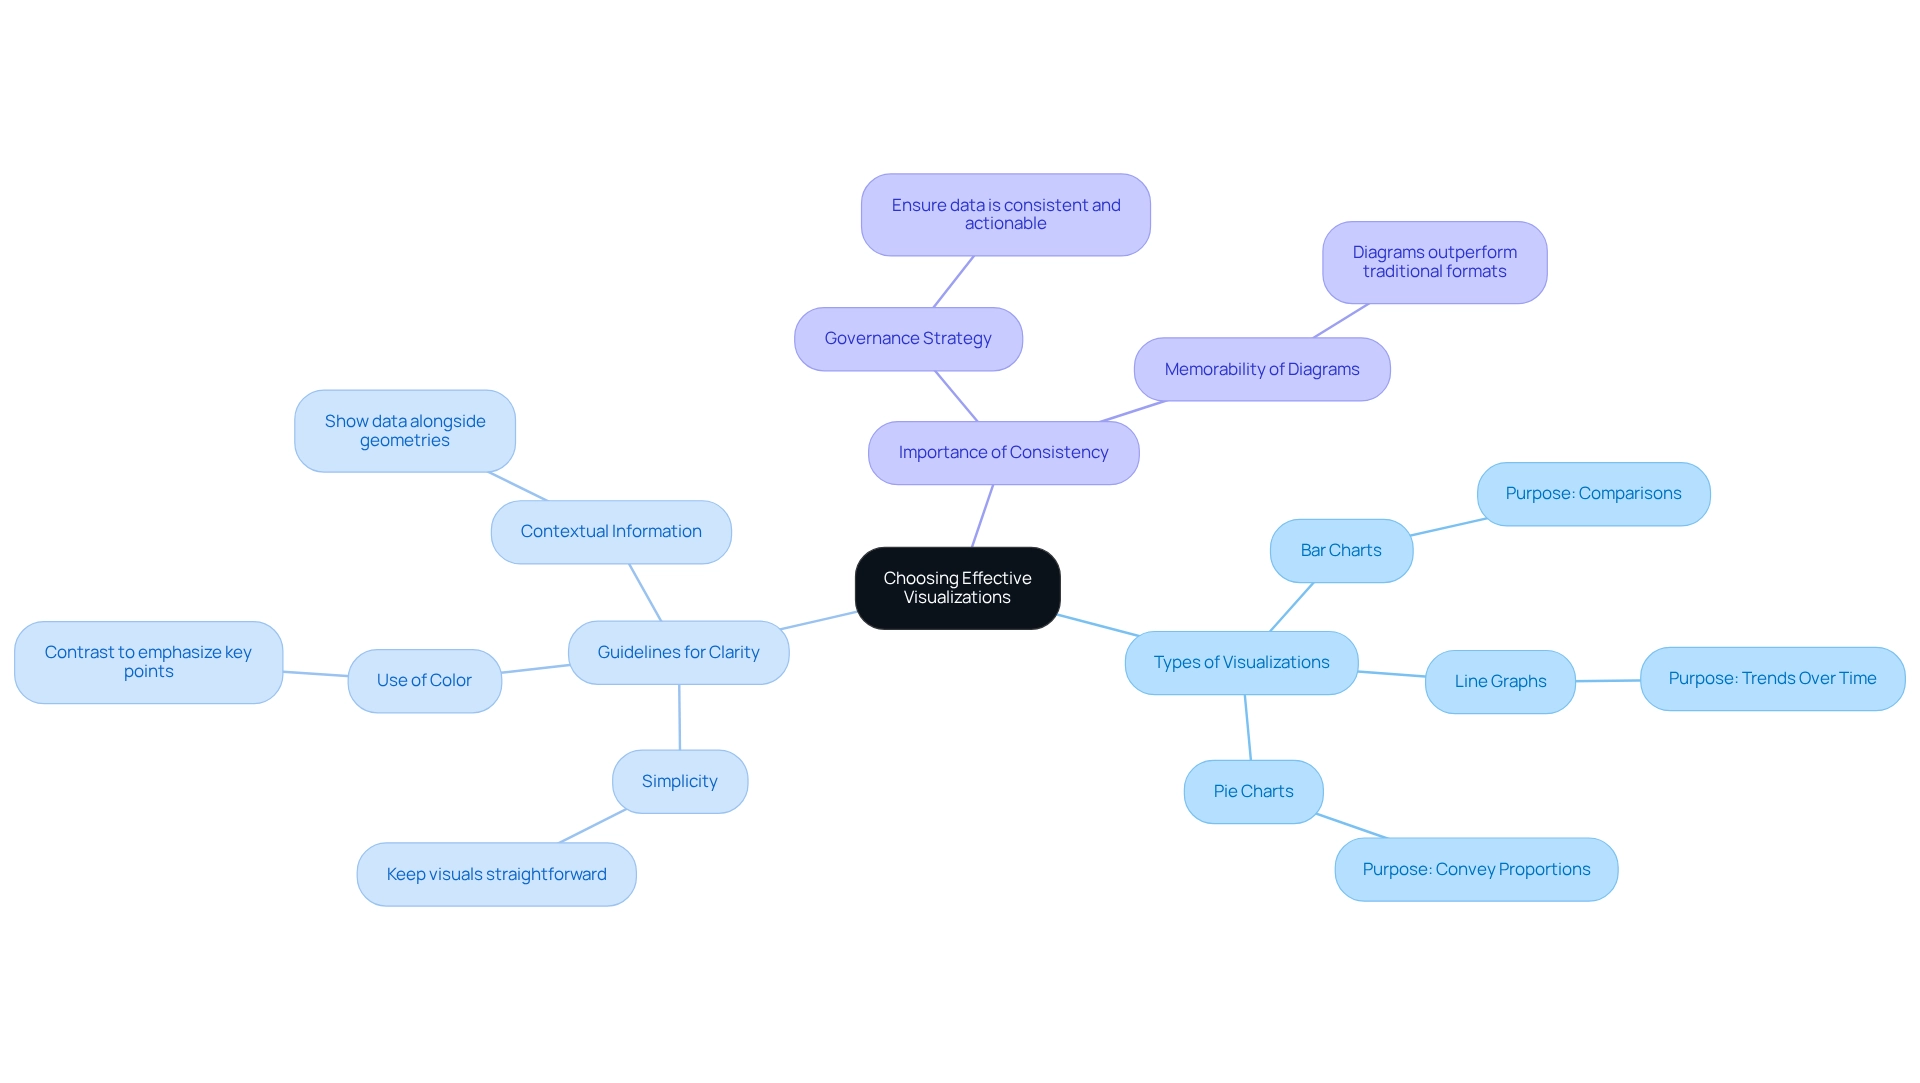
Creating Feedback Loops: Ensuring Understanding and Engagement
To effectively gauge audience understanding and engagement, establishing robust feedback mechanisms is essential. This can be achieved through various methods such as follow-up surveys, interactive Q&A sessions, or informal discussions following presentations. Motivating stakeholders to express their opinions and inquiries not only promotes a culture of transparency but also yields valuable perspectives for enhancing future communications.
For instance, after presenting information, encouraging participants to summarize their main takeaways can highlight areas of clarity and confusion.
- Implement feedback tools: Utilize surveys or polls to collect immediate reactions and insights from your audience. Statistics indicate that organizations employing structured feedback mechanisms see a significant improvement in engagement and retention of information.
- Schedule follow-up discussions: Arrange sessions to address any lingering questions or concerns. This not only reinforces the material presented but also demonstrates a commitment to stakeholder input, reflecting the open-minded approach that is essential for effective leadership.
- Leverage RPA for efficiency: Consider how Robotic Process Automation (RPA) can streamline manual workflows, allowing your team to focus on strategic discussions that arise from feedback. This aligns with Creatum GmbH’s commitment to enhancing operational efficiency in a rapidly evolving AI landscape.
- Refine future presentations: Use the feedback gathered to enhance the quality and effectiveness of subsequent presentations. A case study from Celadon Trucking illustrates that by actively listening to employee feedback, they reduced attrition by 68%, highlighting the power of feedback in fostering a supportive environment. Furthermore, as Denise McLain, Senior Strategic Consultant at Gallup, states, “Build a development-focused culture that values feedback,” which is crucial for creating an environment where employees feel recognized and engaged. Additionally, the relationship between employee recognition and feedback is evident, as employees who feel unrecognized are more likely to seek new opportunities.
Integrating these strategies will not only enhance how to communicate data effectively but also reinforce connections with stakeholders, ensuring that their opinions are acknowledged and appreciated in the decision-making process. For further collaboration or inquiries, please feel free to reach out through our structured contact form. At Creatum GmbH, we are committed to hiring passionate technology professionals in a dynamic, supportive environment that offers competitive salaries and flexible schedules.
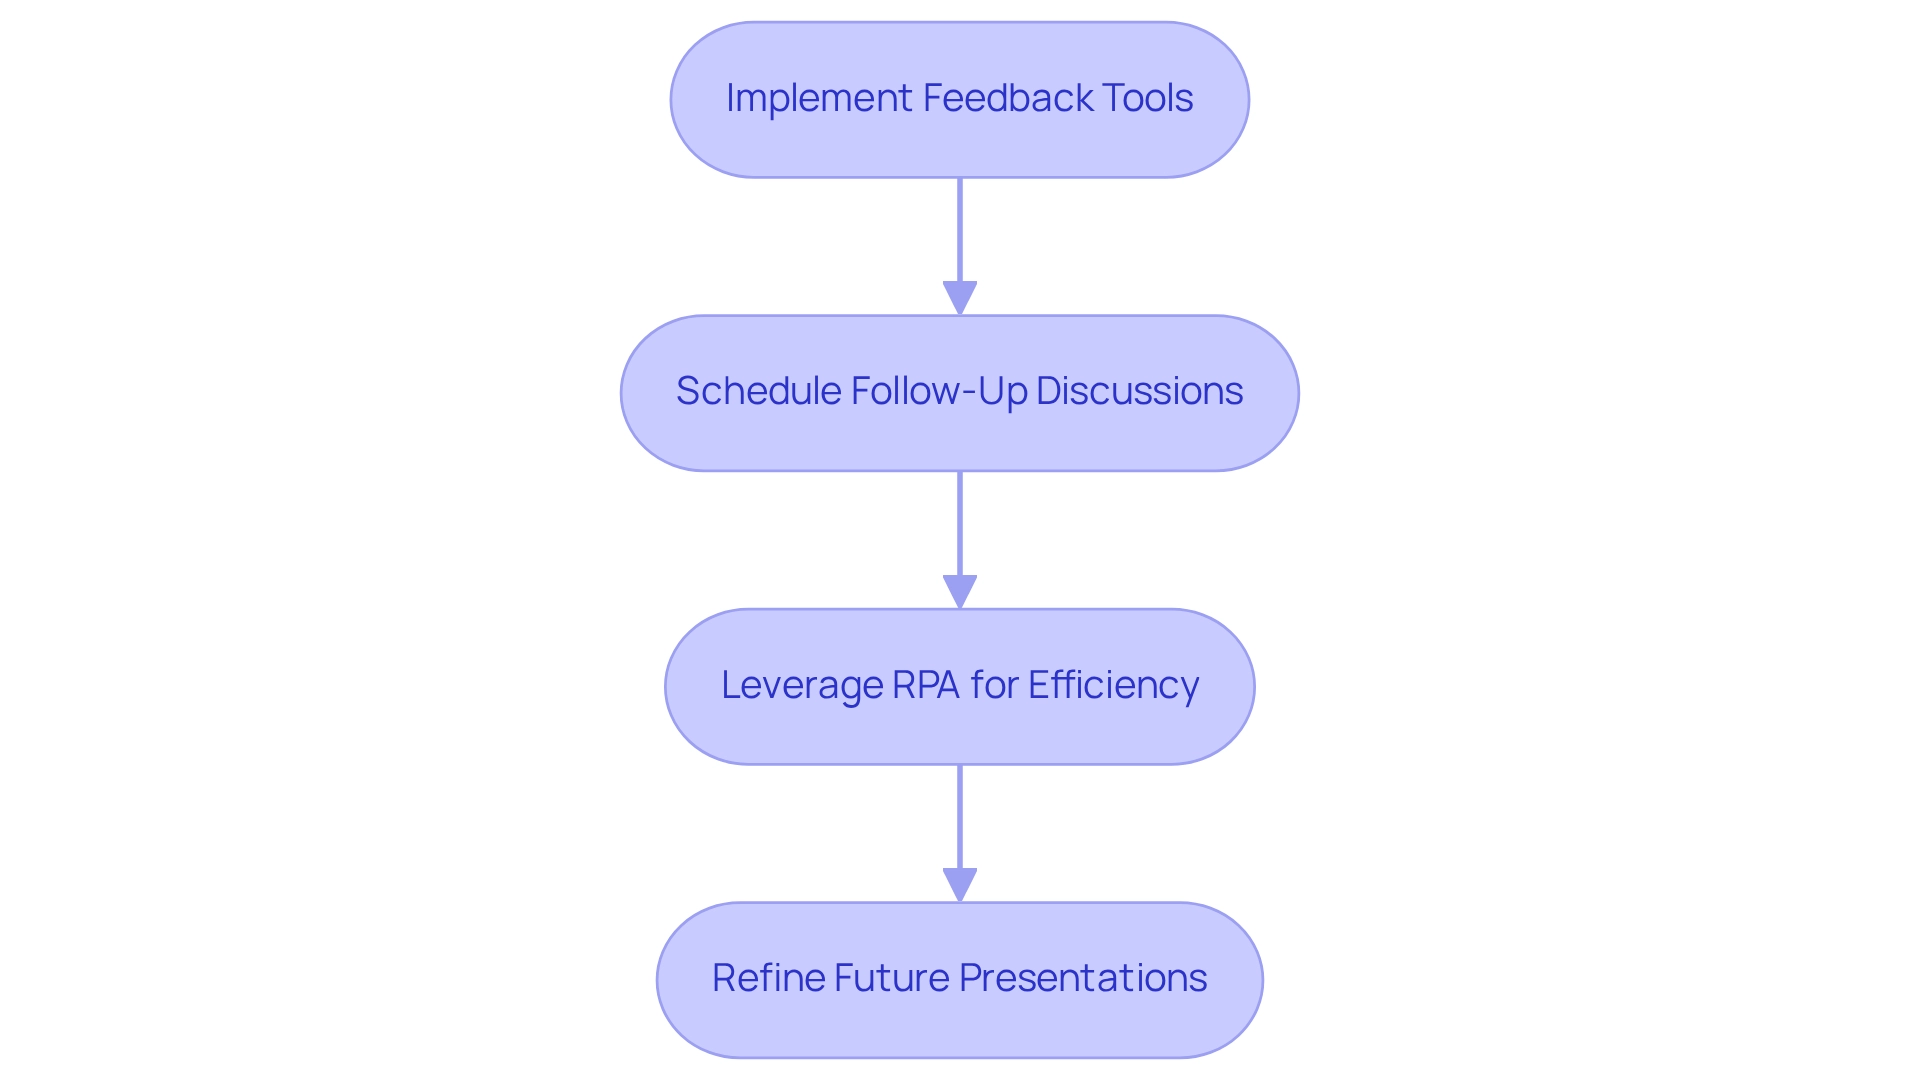
Measuring Communication Effectiveness: Metrics for Success
To measure the success of your data exchange, understanding how to communicate data effectively is essential. This begins with defining key performance indicators (KPIs) that align with your organizational goals. These KPIs may include metrics such as audience engagement levels, feedback scores, and clarity of understanding, which can be evaluated through follow-up surveys. For instance, organizations frequently employ tools like employee feedback surveys and internal messaging channel evaluations to assess the effectiveness of their messaging.
Such assessments provide valuable insights into employee perceptions and assist in enhancing interaction channels, ultimately leading to increased engagement and productivity. Regularly reviewing these metrics is crucial for learning how to communicate data effectively, identifying areas that require improvement. By analyzing audience engagement data, you can refine your communication strategies to assess how well your messages resonate with your team and make necessary adjustments. A recent study emphasized that highly engaged teams are more likely to attract top talent, underscoring the significance of effective interaction in nurturing a motivated workforce.
Furthermore, targeted messages can significantly boost engagement. As one expert remarked, “We can send specific messages solely to pilots, or in-flight tech ops, or airports, and also focus by city or region—slice and dice the content so it’s suitable for the team member.”
Additionally, the case study titled ‘Tools for Evaluating Interaction Effectiveness’ discusses various tools utilized by internal communicators to assess interaction effectiveness, including employee feedback surveys and internal messaging channel audits. Employing these tools enables organizations to gain insights into employee perceptions and enhance their interaction methods, resulting in greater engagement and productivity.
Action Steps:
- Set KPIs for your messaging efforts, concentrating on metrics that indicate engagement and comprehension.
- Gather information on audience engagement and feedback through surveys and audits.
- Examine results to guide future messaging strategies, ensuring they align with organizational priorities and improve overall business outcomes.
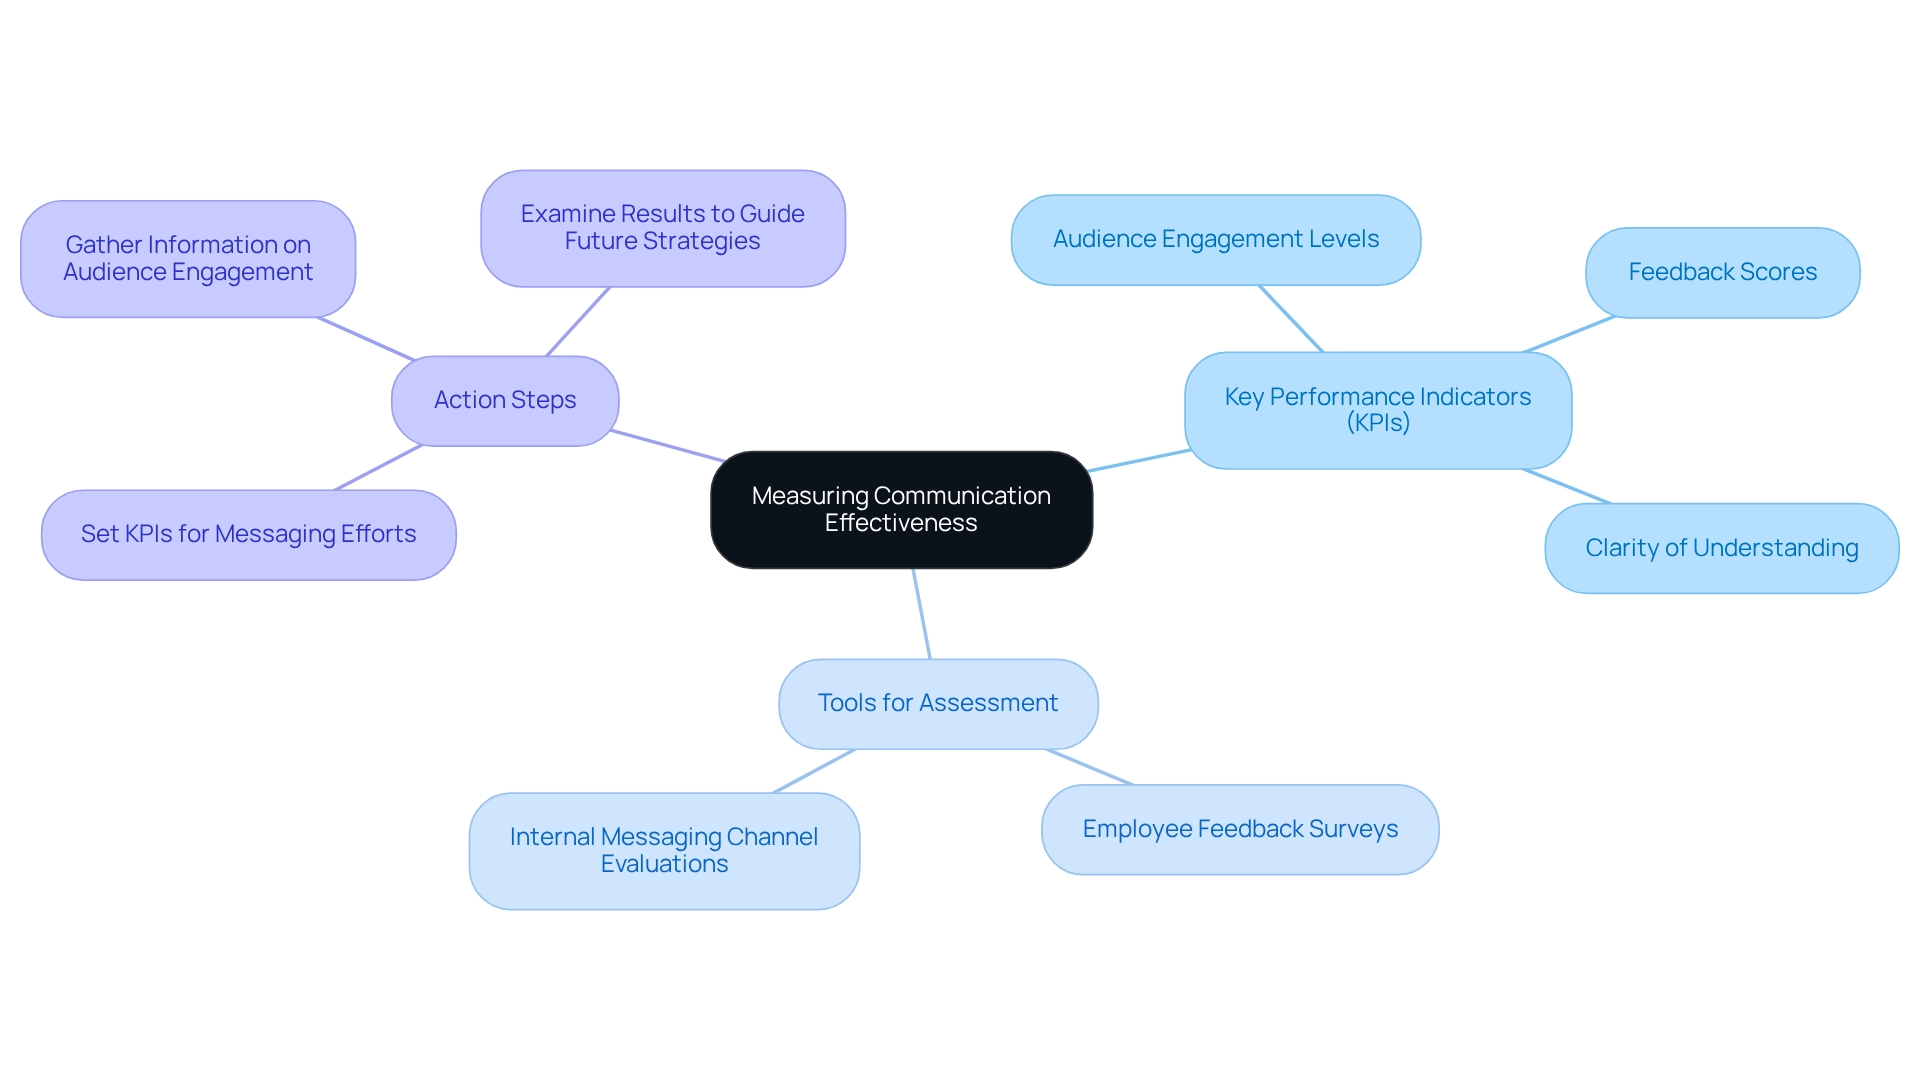
Overcoming Challenges: Strategies for Effective Data Communication
Recognizing common challenges in communicating data effectively is essential for improving operational efficiency. Stakeholders often resist new information initiatives due to a lack of understanding or fear of change. Additionally, misinterpretation of information leads to misguided choices and wasted resources.
To effectively address these challenges, organizations can implement targeted strategies, such as leveraging Robotic Process Automation (RPA) to automate manual workflows and enhance operational efficiency. RPA streamlines processes, reduces errors, and frees up teams for more strategic work, ultimately driving data-driven insights and operational efficiency for business growth.
Studies show that 40% of workers believe that understanding how to communicate data effectively greatly enhances team creativity and innovation, highlighting the significance of efficient information presentation. For instance, if stakeholders are reluctant to adopt new information initiatives, arranging workshops proves to be a useful strategy. These sessions illustrate the concrete advantages of information-driven decision-making and highlight user-friendly tools that ease interaction with information.
Moreover, developing captivating presentations that emphasize important findings can aid in understanding how to communicate data effectively, making intricate information sets more approachable and useful.
As noted by Spaulding Ridge, ‘99% of the clients Spaulding Ridge collaborates with struggle with isolated information,’ emphasizing the prevalent nature of communication challenges. Case studies reveal that organizations lacking dedicated information teams face significant hurdles in extracting actionable insights. The case study titled ‘Challenge 6: No Information Team‘ emphasizes the essential roles required for an information team and recommends collaboration with consulting firms.
By doing so, businesses can quickly assemble skilled professionals who enable smoother information exchange and implementation processes. This approach not only accelerates information initiatives but also alleviates the challenge of building an internal team from scratch.
To ensure the success of these strategies, it is essential to continuously monitor their effectiveness. Leveraging website analytics, email click-through rates, and intranet information can assist organizations in comprehending staff interactions and collecting feedback from stakeholders. Examining engagement metrics offers vital insights regarding the effects of training programs and outreach initiatives.
By cultivating a culture of information literacy and transparent communication, organizations can learn how to communicate data effectively, overcome resistance, and enhance their overall information communication strategies. At Creatum GmbH, we emphasize the importance of Business Intelligence in transforming raw data into actionable insights, enabling informed decision-making that drives growth and innovation.
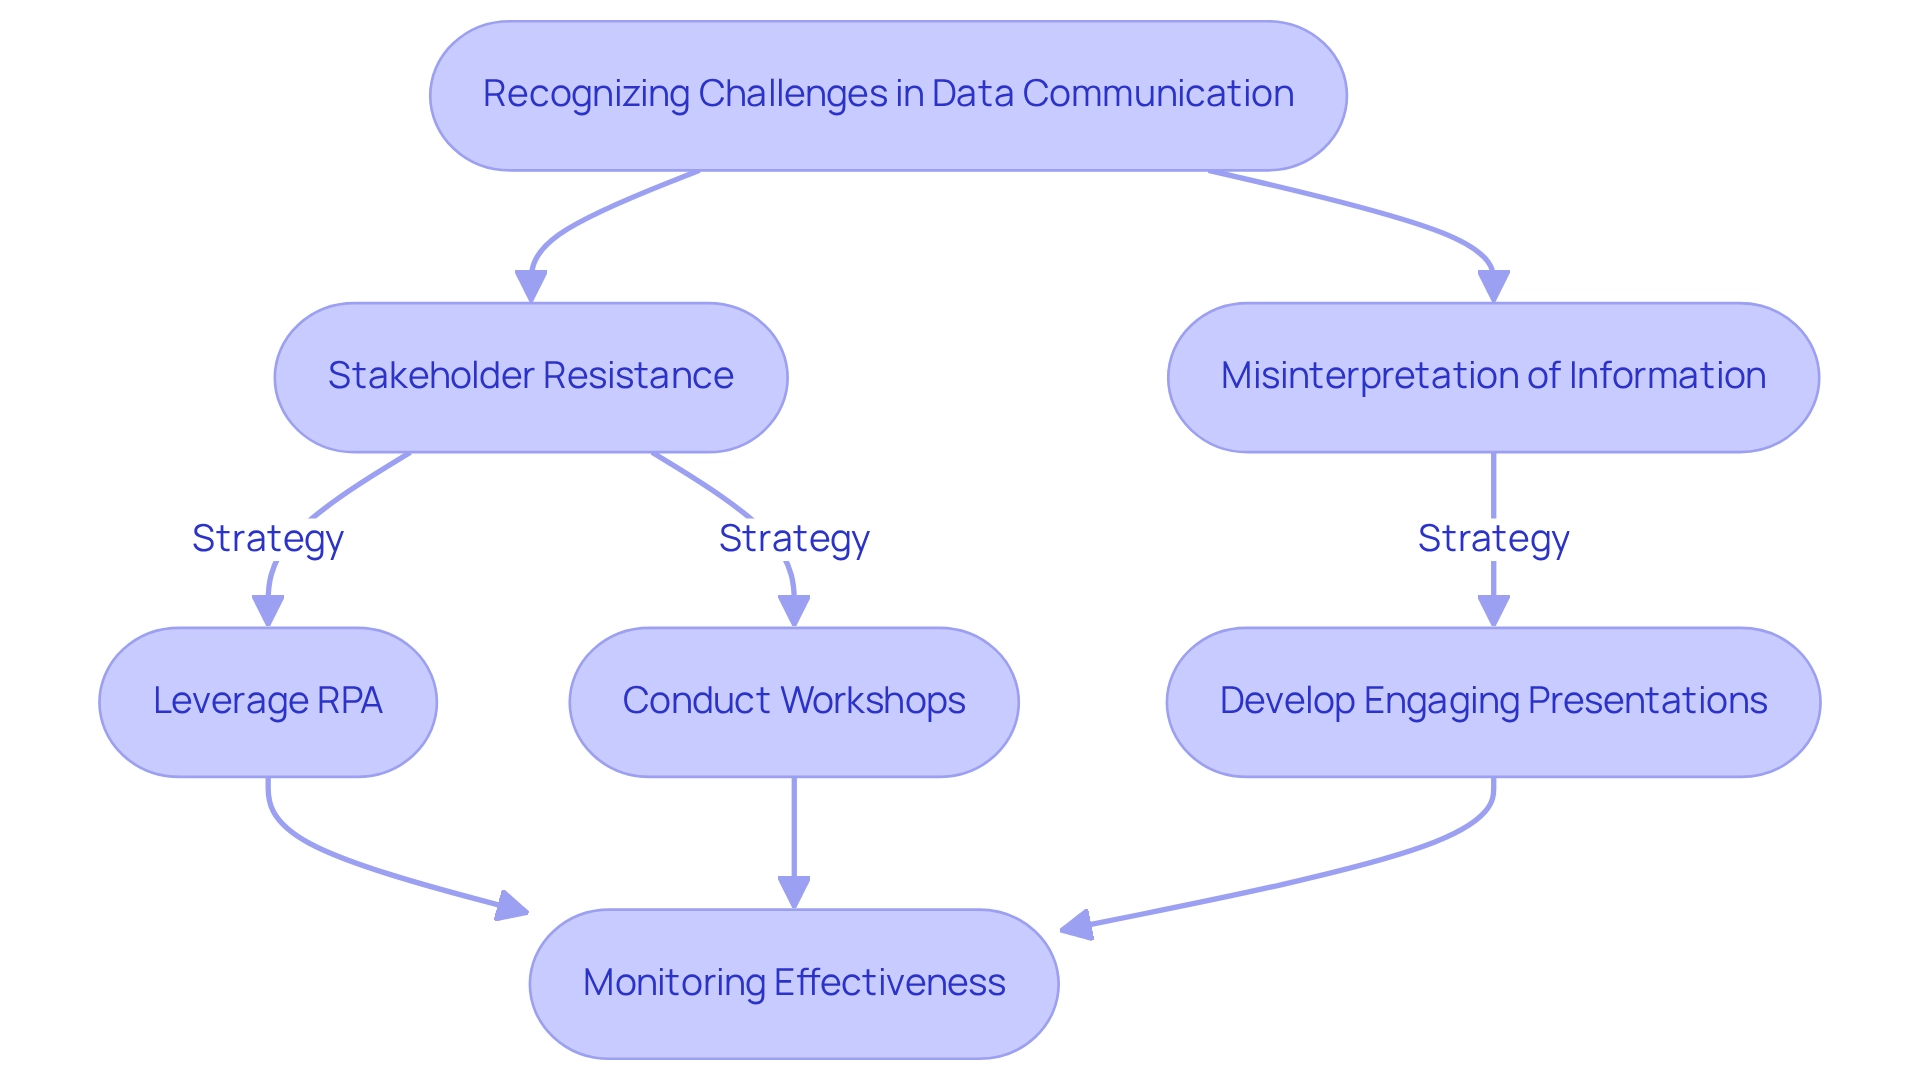
Conclusion
Effective data communication is crucial for organizations striving to thrive in today’s information-saturated environment. By understanding audience preferences, organizations can tailor their messaging to resonate with different stakeholders—executives seeking high-level insights or technical teams needing detailed data. This targeted approach, combined with storytelling techniques, transforms raw data into compelling narratives that engage audiences and drive informed decision-making.
Clarity and simplicity play significant roles in effective data communication. Avoiding jargon and utilizing straightforward language makes data presentations more accessible to diverse audiences. Selecting the right visualizations enhances comprehension, making complex information easier to interpret. Implementing feedback loops ensures that communication efforts are continuously refined, fostering an environment where stakeholder input is valued and utilized.
Ultimately, measuring the effectiveness of data communication through defined metrics is essential for ongoing improvement. Establishing clear key performance indicators and regularly analyzing engagement data allows organizations to adapt their strategies to better meet audience needs. As businesses navigate the complexities of the digital landscape, mastering these communication strategies is not just beneficial; it is imperative for cultivating a culture of data-driven innovation and achieving long-term success. Embracing these principles empowers organizations to harness the full potential of their data, driving growth and fostering a more informed decision-making process.
Frequently Asked Questions
Why is understanding the audience important for effective information exchange?
Understanding the audience is crucial because it allows communicators to tailor their messages based on the audience’s roles, expertise, and interests, ensuring the information is relevant and comprehensible.
What are some effective methods to gather insights about the audience’s preferences?
Effective methods include conducting surveys or interviews to gather insights about the audience’s preferences and knowledge levels.
How does audience segmentation enhance presentations?
Audience segmentation enhances presentations by allowing communicators to categorize groups based on their information literacy and specific interests, leading to tailored communication strategies that improve relevance, engagement, and comprehension.
What role does Business Intelligence (BI) play in data communication?
Business Intelligence (BI) helps organizations transform raw data into actionable insights, facilitating informed decision-making that drives growth and innovation.
Can you provide an example of how effective data communication led to business success?
Yes, a multinational company optimized its digital ad placements using predictive models to forecast conversion rates, leading to a 30% reduction in unnecessary expenditures while enhancing overall ad performance.
What are the recommended action steps for evaluating preferences in information communication?
The recommended action steps are to analyze your audience through surveys or interviews, segment them based on data literacy and interests, and adjust your communication approach to suit each segment.
How can storytelling methods improve data presentations?
Storytelling methods can improve data presentations by embedding information within a narrative that outlines the issue, resolution, and effect, making statistics more relatable and impactful.
What are the key components of an effective narrative in presentations?
The key components include identifying the core message, creating a narrative arc that introduces the challenge, presents information, and concludes with implications, and utilizing visuals to support the narrative.
What impact do branded narratives have on audience trust and conversion rates?
Branded narratives can lead to a 4% increase in trust, which often translates into improved conversion rates.
How can effective corporate storytelling be characterized?
Effective corporate storytelling should be simple, structured, and considerate of the audience’s perspective, ensuring clarity and engagement.
Overview
Mastering DAX window functions in Power BI is essential for enhancing reporting capabilities and conducting advanced data analysis. This skill empowers users to perform complex calculations such as:
- Running totals
- Moving averages
Understanding window functions like:
- INDEX
- OFFSET
- WINDOW
is crucial, as is grasping their applications and optimization techniques. These elements are key to transforming raw data into actionable insights that drive informed decision-making and operational efficiency.
Introduction
In the realm of data analytics, DAX (Data Analysis Expressions) window functions emerge as indispensable tools for unlocking deeper insights and enhancing reporting capabilities within Power BI. These powerful functions empower users to execute complex calculations across related rows, facilitating essential tasks such as running totals, moving averages, and data ranking. As organizations increasingly rely on data-driven decision-making, mastering DAX window functions is crucial for optimizing analysis and boosting operational efficiency.
With the introduction of advanced functions like INDEX, OFFSET, and WINDOW, users can navigate the complexities of their datasets with greater agility, ultimately driving growth and innovation. This article delves into the significance of DAX window functions, their practical applications, and strategies for overcoming common challenges. By doing so, it paves the way for enhanced data analysis in an ever-evolving digital landscape.
Understanding DAX Window Functions: Definition and Importance
The DAX window function provides powerful capabilities that enable users to perform calculations across a group of rows related to the current row. This makes them essential for tasks such as computing running totals, moving averages, and ranking information. The introduction of advanced window features like INDEX, OFFSET, and WINDOW in Power BI has significantly enhanced the analytical capabilities of DAX, allowing users to derive deeper insights from their datasets with increased efficiency.
The significance of the DAX window function in Power BI is particularly pronounced for data analysis in 2025. These operations facilitate intricate calculations vital for precise reporting and informed decision-making. For instance, a recent case study on calculating a monthly running total of grades illustrates how these operations can reset at the beginning of each year, enabling effective trend analysis over time.
This capability not only supports fiscal reporting but also deepens the understanding of long-term performance trends. Organizations utilizing the DAX window function, such as Contoso, have reported substantial results, with sales figures reaching 2,000,000, underscoring the tangible advantages of efficient analysis.
Moreover, the benefits of employing DAX window function capabilities extend beyond basic calculations. They significantly enhance reporting efficiency by optimizing analysis processes, allowing teams to focus on strategic insights rather than manual data manipulation. Current statistics reveal that organizations leveraging the DAX window function experience a notable increase in operational efficiency, with many reporting improved information quality and actionable insights.
Tools like Power BI Desktop, Excel, and SQL Server Management Studio provide essential resources for crafting and managing DAX formulas, further empowering individuals in their analytical endeavors.
As the analytics landscape continues to evolve, staying informed about recent advancements in DAX window capabilities is crucial. Experts emphasize that the quality of insights derived from data is paramount, highlighting that it is not merely the volume of information that matters, but the ability to transform that information into meaningful knowledge. By mastering the DAX window function, Power BI users can elevate their analytical capabilities, driving growth and innovation within their organizations.
This aligns with our distinctive value proposition at Creatum GmbH, which is to deliver tailored solutions that enhance information quality and streamline AI implementation, ultimately assisting businesses in achieving their strategic objectives. Furthermore, our Power BI services, featuring the 3-Day Sprint for swift report generation and the General Management App for comprehensive oversight, are designed to address issues such as inconsistencies and governance, ensuring that decision-makers have access to clear, actionable insights.
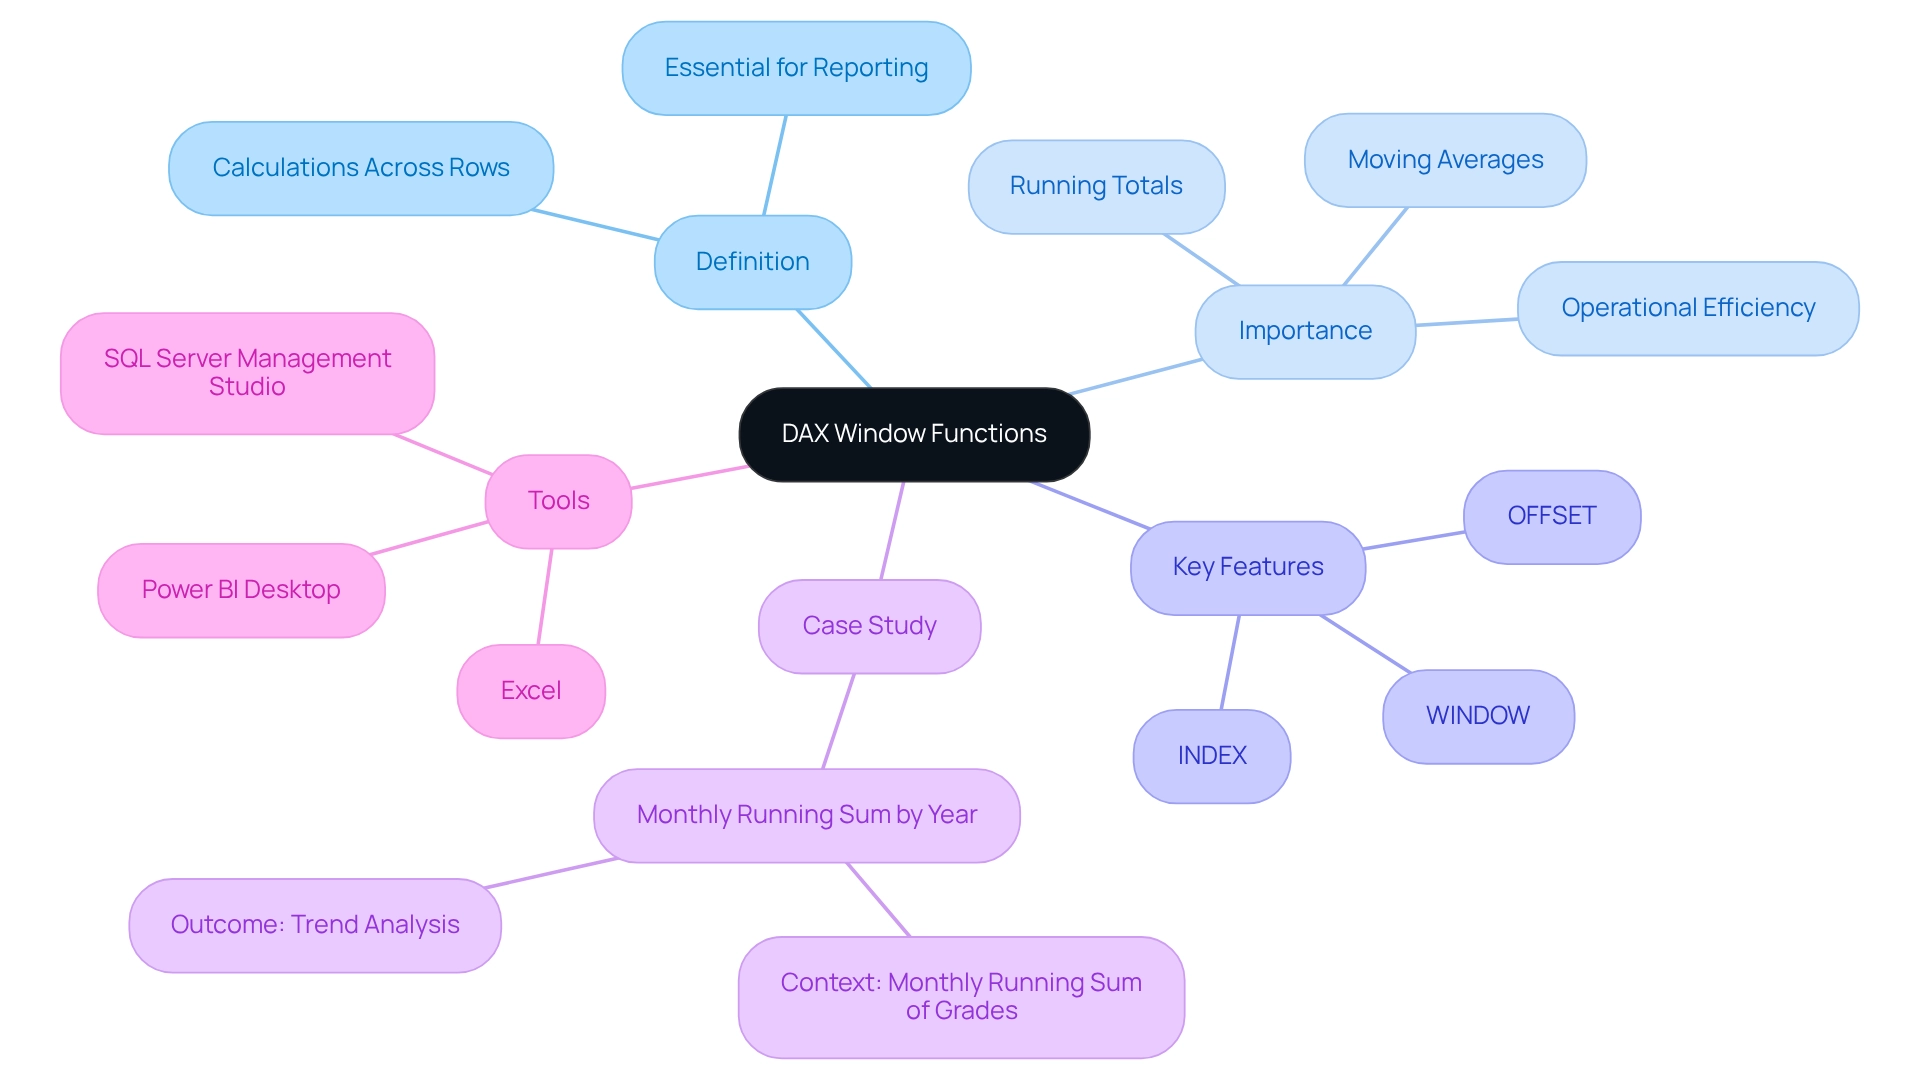
Exploring Different Types of DAX Window Functions in Power BI
In Power BI, the primary DAX window functions are essential tools for data analysis, each serving distinct purposes:
-
INDEX: This function retrieves the value of a specified row within a partitioned table, enabling users to access data relative to the current row. Its utility is especially clear in situations where accurate information referencing is essential for analysis. Significantly, the efficacy of the INDEX operation is underscored by a statistic indicating a SumValue for Index 200,803 at 559,538.52, showcasing its considerable influence on information retrieval.
-
OFFSET: The DAX window function OFFSET allows individuals to extract values from a specified number of rows before or after the current row. This feature is particularly advantageous for computing moving averages or recognizing trends over time, offering a dynamic perspective on fluctuations.
-
WINDOW: This DAX window function allows users to establish a range of rows within a specified partition, arranged by a defined order. This capability is invaluable for executing complex calculations that require context from multiple rows, facilitating deeper insights into information patterns.
These operations can be efficiently integrated to conduct advanced analyses, enhancing Power BI’s ability to convert raw information into actionable insights. As organizations increasingly encounter challenges such as time-consuming report creation, information inconsistencies, and a lack of actionable guidance, understanding and utilizing the DAX window function becomes crucial for driving growth and innovation.
The transformative impact of Creatum’s Power BI Sprint, as emphasized by Sascha Rudloff from PALFINGER, demonstrates how clients can accelerate their analysis and reporting success, ultimately resulting in a more efficient information-driven decision-making process. Sascha noted, “The outcomes of the Sprint surpassed our expectations and provided a considerable enhancement for our analysis strategy.”
Additionally, the case study titled “Business Intelligence Empowerment” illustrates how organizations can leverage these capabilities to convert raw information into practical insights, ultimately fostering growth and innovation.
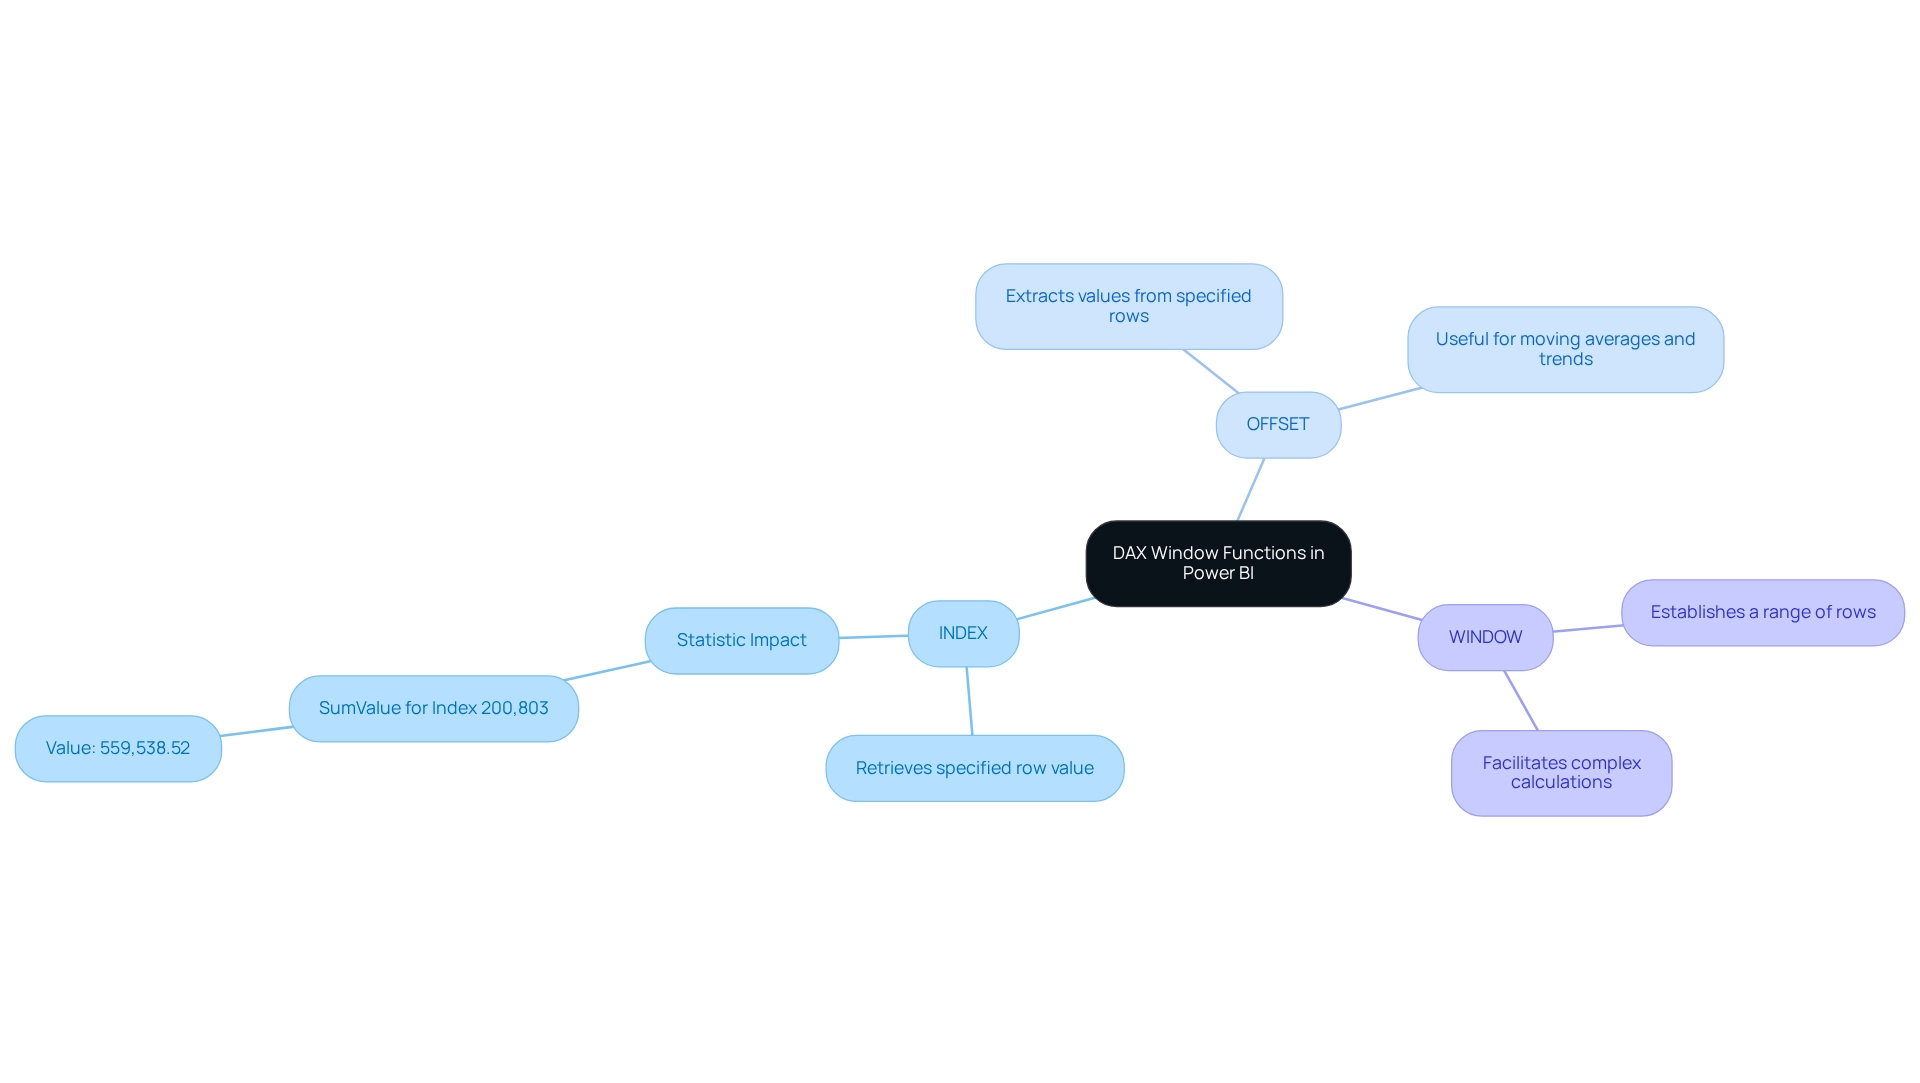
Practical Applications: Implementing DAX Window Functions in Power BI
Applying the DAX window function can significantly enhance your Power BI reports by providing deeper insights and more dynamic analytics. This approach addresses common challenges such as time-consuming report generation and inconsistencies, particularly those arising from a lack of governance strategy. Consider these practical applications:
-
Calculating Running Totals: By leveraging the
CALCULATEandFILTERmethods alongside a time dimension, users can generate a running total of sales over time. This visualization of cumulative sales performance aids stakeholders in better forecasting and strategic planning, ultimately minimizing the time spent on manual report creation. -
Moving Averages: The
AVERAGEXformula is instrumental in computing moving averages, which smooth out data variations and reveal underlying trends over specified periods. This technique is invaluable for identifying seasonal patterns and making informed decisions based on historical performance. For instance, a recent calculation of a rolling average of sales figures with a window size of 3 highlighted how this method can provide a clearer perspective on sales trends, thereby enhancing the actionable insights available to stakeholders. -
Ranking Data: The
RANKXmethod enables users to rank products or categories based on sales figures or other metrics. This functionality empowers companies to quickly identify top performers and areas needing improvement, fostering targeted strategies for growth and addressing discrepancies in reporting.
To execute these operations effectively, users can create calculated columns or measures in Power BI, utilizing the DAX window function to specify their calculations. This approach not only enhances report insights but also simplifies the analysis process, allowing teams to focus on strategic initiatives rather than manual data handling.
Real-world applications of these DAX functions have proven their effectiveness in improving business reporting. Companies that have integrated running totals and moving averages into their dashboards report greater clarity in performance tracking and decision-making. As Sharin Fritz noted, “For information engineering & analytics, these take-home assignments we were doing ourselves are a bit time-consuming, so we wanted to automate that.”
This statement underscores the importance of efficiency in information analysis, especially in rapidly growing enterprises like Daraz.pk, which has expanded significantly since its inception in 2012 and currently employs between 51-200 individuals. By adopting these techniques, organizations can transform their data into actionable insights, driving operational efficiency and leveraging Business Intelligence for sustained growth. Creatum GmbH is dedicated to assisting businesses in navigating these challenges effectively.
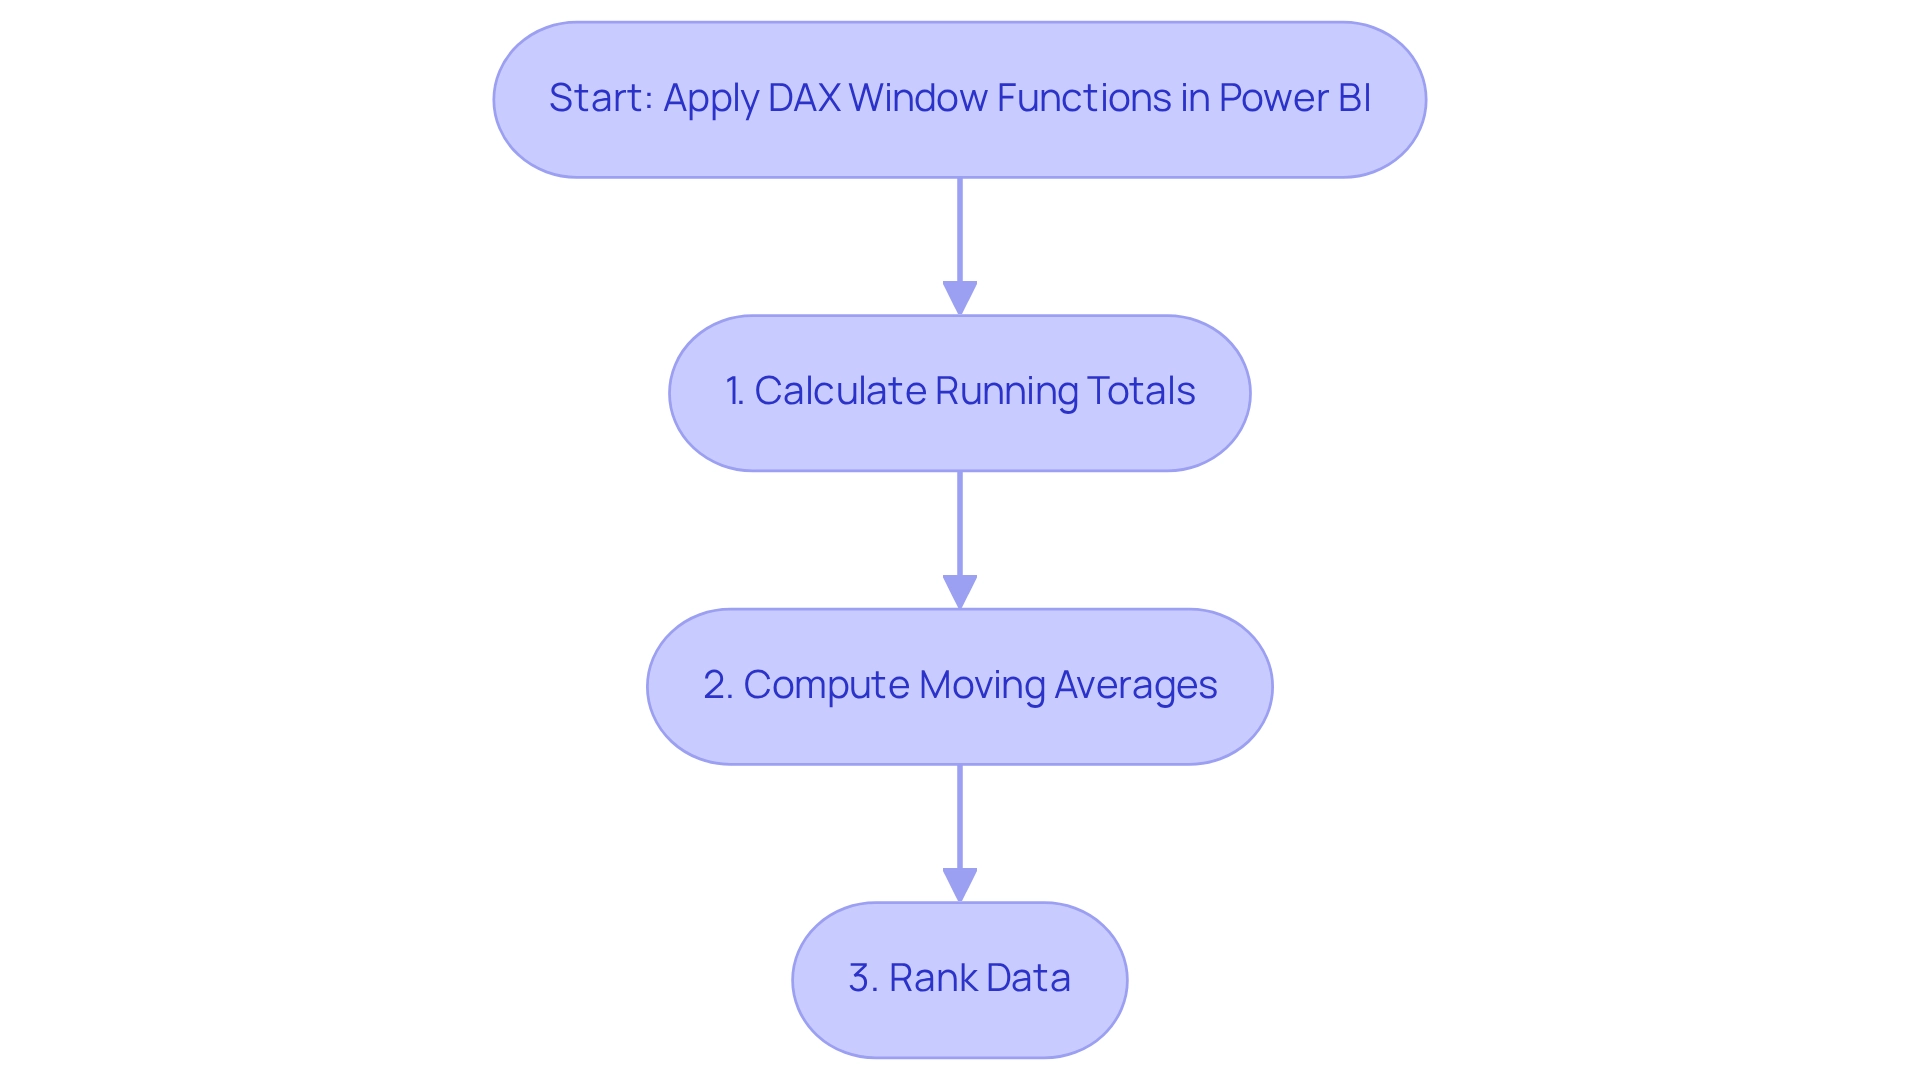
Common Challenges and Solutions When Using DAX Window Functions
DAX window functions provide substantial capabilities, yet users frequently encounter challenges that can undermine their effectiveness.
Context Issues: DAX operates within a specific filter context, potentially leading to unexpected results if not properly managed. Statistics reveal that ambiguous relationships or many-to-many relationships often result in incorrect outcomes, underscoring the necessity of managing context diligently. To mitigate these issues, it is essential to define measures accurately and fully comprehend the context in which they function. This understanding is vital to prevent skewed results, particularly in complex data models.
Performance Concerns: The application of complex calculations with window functions can negatively impact report performance. Statistics indicate that intricate DAX expressions may cause slower report loading times, particularly when many-to-many relationships are present. Moreover, executing R and Python scripts in Power BI is limited to individuals with personal gateways, which can hinder performance and introduce security and environmental setup challenges. To enhance efficiency, consider simplifying DAX expressions or utilizing aggregations where feasible. Implementing Power Query’s Diagnostics feature can help identify slow-loading queries. For instance, advanced troubleshooting methods can uncover inefficiencies, enabling individuals to take corrective actions to improve report speed. By integrating Robotic Process Automation (RPA), organizations can streamline workflows, minimizing the time spent on manual report creation and allowing teams to concentrate on strategic analysis. Furthermore, tailored AI solutions can assist in optimizing DAX calculations and automating data preparation processes, effectively addressing performance concerns.
Self-Dependency Errors: Functions such as INDEX may lead to self-dependency errors if they reference themselves within the calculation. To resolve these issues, it is crucial to structure DAX expressions to avoid circular references. This careful structuring not only prevents errors but also enhances the overall reliability of calculations.
As v-rzhou-msft noted, “According to your statement, I think you want to develop a report by Power BI. Here I will give you some suggestions.” By acknowledging these prevalent challenges and applying the proposed solutions—including leveraging Business Intelligence for informed decision-making and customized AI solutions to enhance DAX performance—users can navigate the complexities of DAX window function operations more efficiently, ultimately improving their reporting capabilities in Power BI.
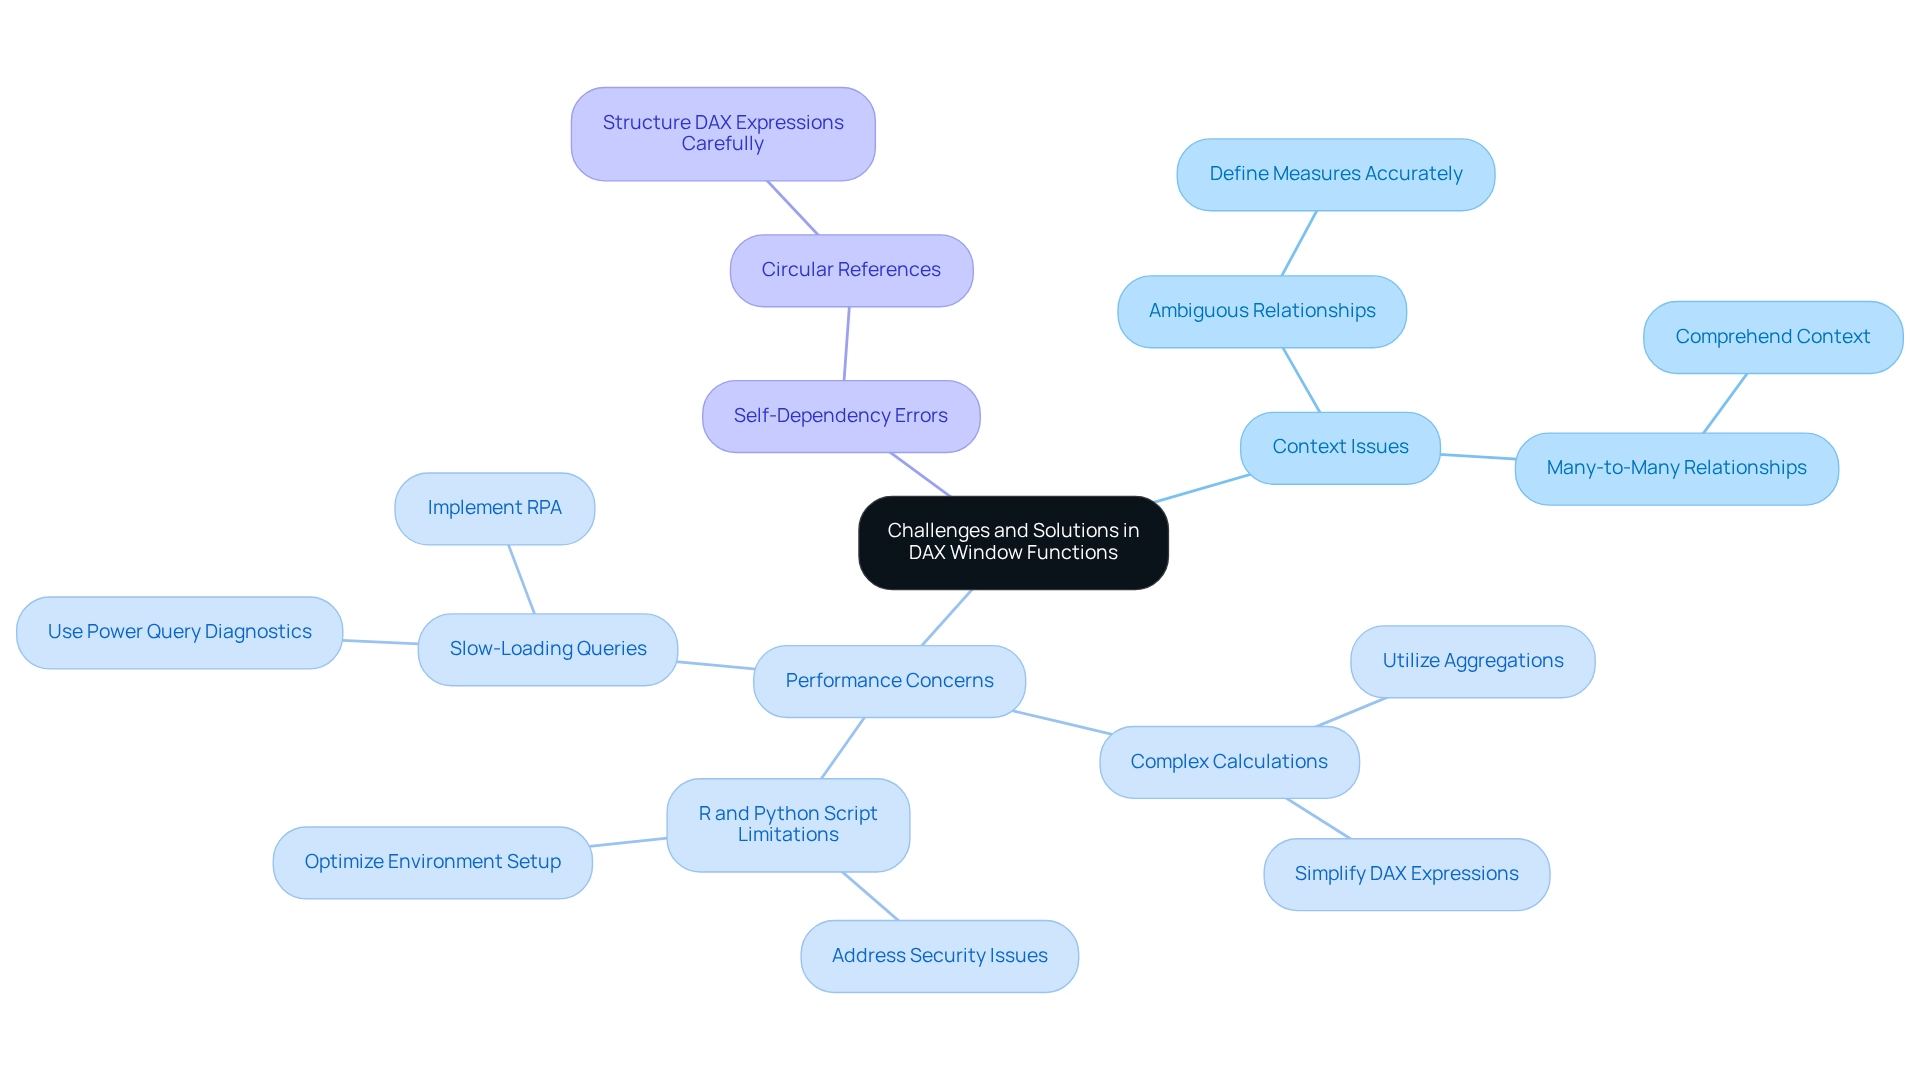
Performance Optimization: Enhancing Efficiency with DAX Window Functions
To significantly enhance the performance of the DAX window function in Power BI while leveraging Robotic Process Automation (RPA) for operational efficiency, consider implementing the following strategies:
-
Limit the Scope: By applying filters to restrict the information processed by your DAX expressions, you can effectively reduce the computational load. This approach not only streamlines calculations but also enhances overall report performance.
-
Optimize DAX Expressions: Simplifying complex DAX formulas by breaking them into smaller, more manageable components can lead to improved readability and performance. As the AccountingInsights Team notes, choosing between calculated columns and measures is critical in DAX, as it impacts both performance and functionality. This practice allows for easier debugging and maintenance, which is crucial for long-term efficiency.
-
Use Variables: Incorporating variables within your DAX calculations to store intermediate results can significantly boost performance. This technique not only enhances execution speed but also contributes to cleaner, more understandable code, making it easier for teams to collaborate and innovate.
-
Monitor Performance: Leverage Power BI’s performance analyzer to identify slow-running queries. By pinpointing these bottlenecks, you can optimize them effectively, ensuring that your reports remain responsive and efficient, even when handling large datasets. Understanding DAX engine behavior and avoiding row-by-row iterations can further enhance the speed and maintainability of your reports. RPA can assist in monitoring these performance metrics in real-time, providing actionable insights for continuous improvement.
-
Real-World Examples: Consider case studies that demonstrate the impact of these strategies. For example, the accessible interface created for DAX optimizations aids straightforward implementation, promoting wider adoption of the tool and allowing more individuals to utilize DAX optimizations efficiently. Incorporating RPA into these case studies can demonstrate how automation has revolutionized information management and reporting procedures.
-
Utilize DAX Optimizer: For those new to DAX, the DAX Optimizer can be a valuable tool to quickly improve proficiency and understanding of best practices. Combined with RPA, this tool can simplify the learning process, enabling users to concentrate on strategic insights instead of manual information manipulation.
By utilizing these optimization techniques and leveraging RPA, users can ensure their Power BI reports are not only efficient but also capable of providing actionable insights quickly, thereby supporting informed decision-making in an information-rich environment.
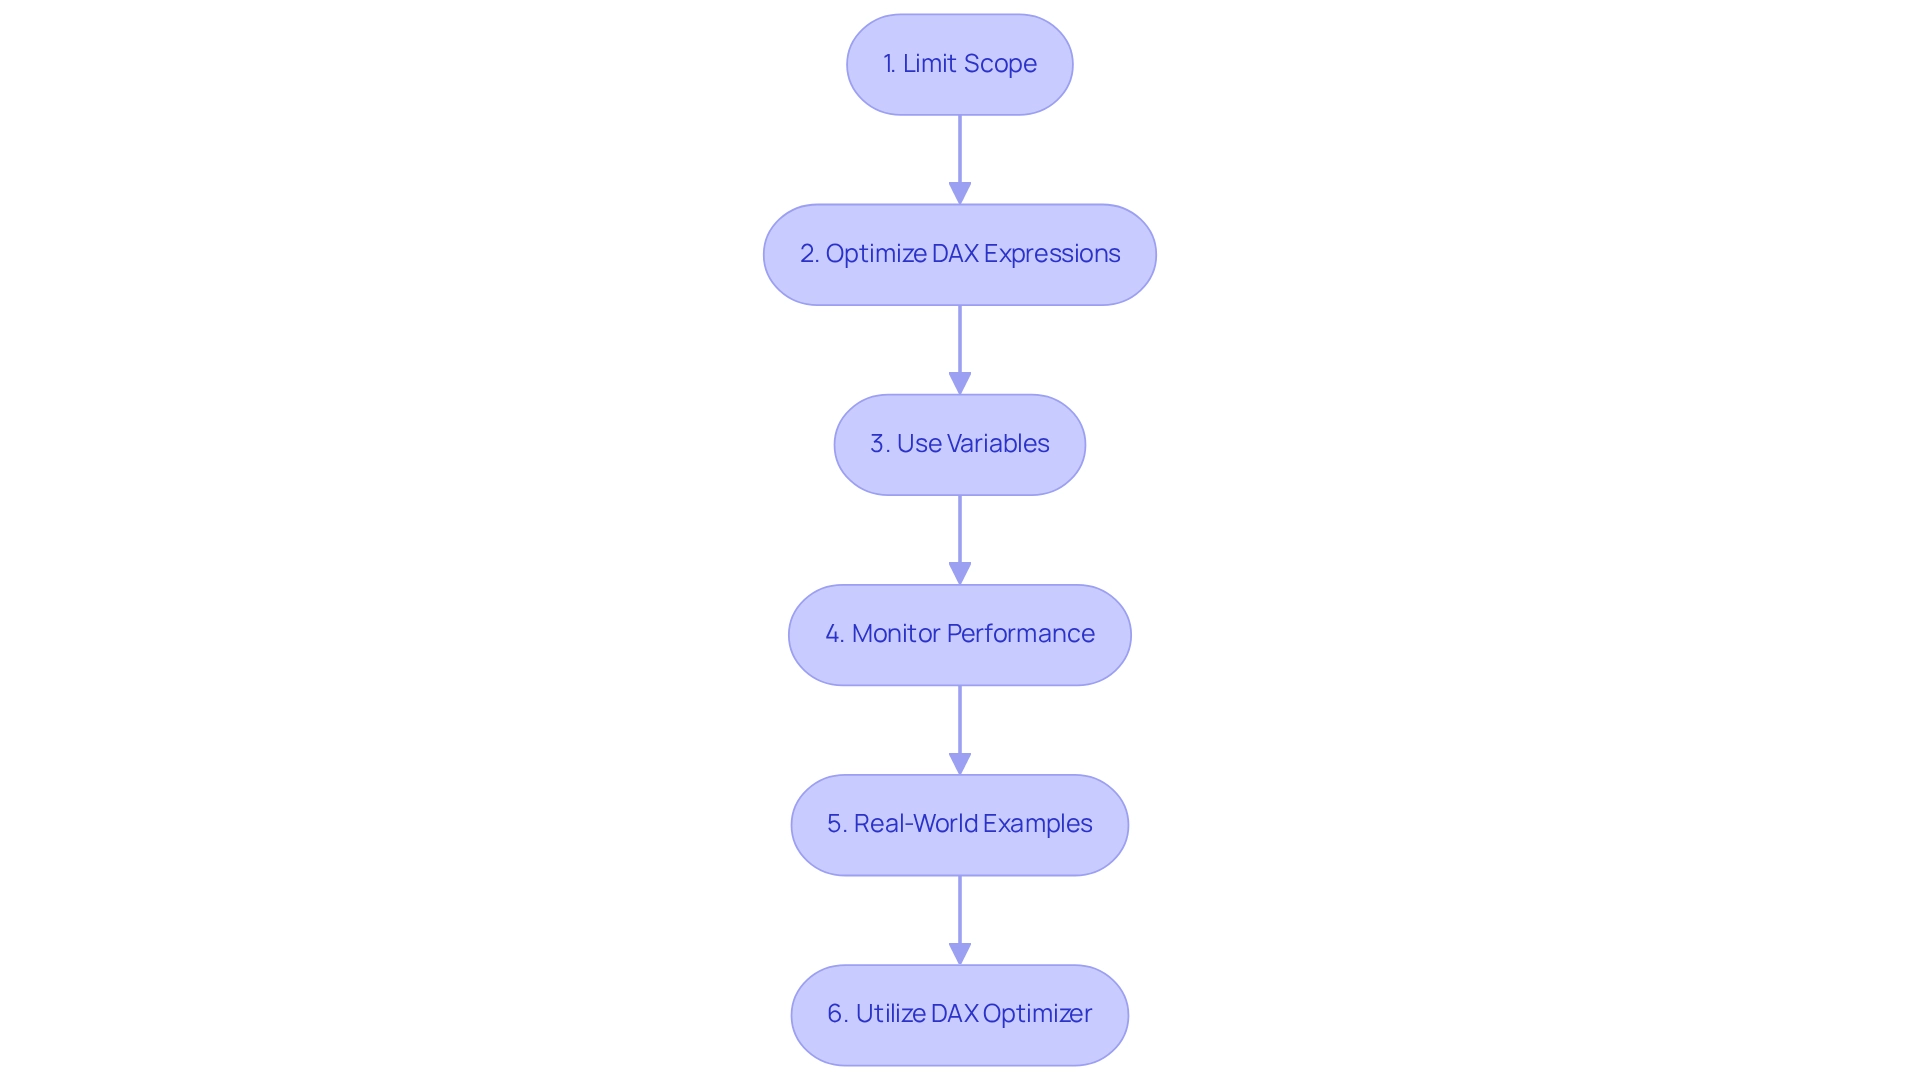
Advanced Techniques for Mastering DAX Window Functions
To effectively master DAX window functions in Power BI, consider implementing the following advanced techniques:
- Combining Functions: Utilize multiple window functions in tandem to develop intricate calculations. For instance, pairing
OFFSETwithINDEXallows for a comprehensive analysis of trends over time while simultaneously ranking data, providing a multifaceted view of performance metrics. This approach is particularly useful in performance measurement, as illustrated by Anna, who scored 93, showcasing how DAX can quantify and analyze results effectively. - Dynamic Calculations: Create dynamic measures that adjust according to interactions within reports. This can be accomplished by integrating slicers and filters into your DAX expressions, enabling real-time adjustments that reflect user selections and enhance the interactivity of your dashboards. Remember that formulas can be assessed in various contexts, shaped by filters, relationships, and design elements, which is essential for precise information representation.
- Utilizing PARTITIONBY: When using the
WINDOWoperation, thePARTITIONBYclause is invaluable for segmenting your information into relevant groups. This segmentation facilitates more detailed analysis, allowing you to uncover insights that may be obscured in a broader dataset.
These advanced techniques not only enhance your analytical skills within Power BI but also enable you to derive deeper insights from your information. For example, a case study on calculating a monthly running sum of grades illustrates how these techniques can be applied to track performance trends over time, supporting strategic planning and fiscal reporting. As noted by Mirko Peters, “They provide a way to perform advanced analytics and calculations without the need for complex subqueries or multiple database queries.”
By mastering the DAX window function operations, you can significantly improve your analysis skills and promote informed decision-making. Additionally, tools like DAX Studio and Tabular Editor, along with DAX editors in Power BI Desktop, Excel, and SQL Server Management Studio (SSMS), are available to assist you in implementing these techniques effectively.
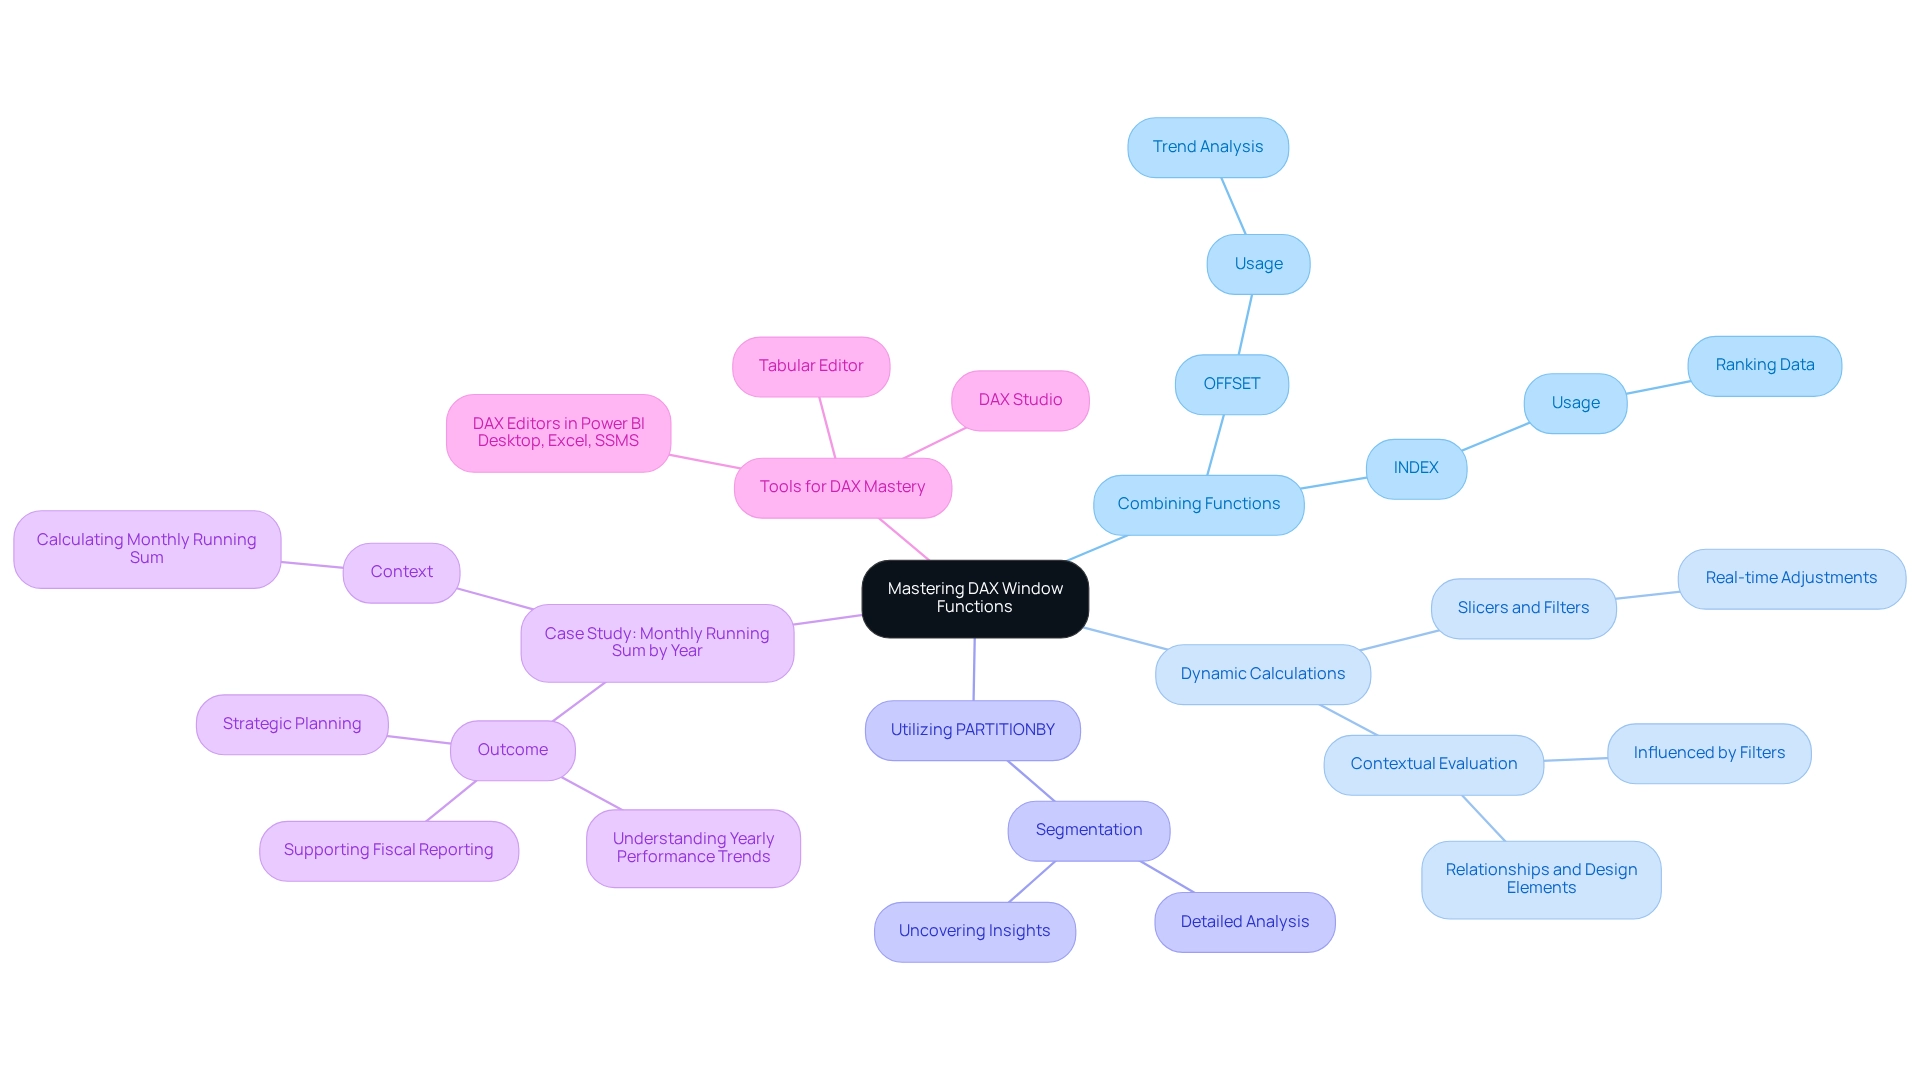
Key Takeaways: Mastering DAX Window Functions for Enhanced Power BI Reporting
Mastering the DAX window function is essential for Power BI professionals aiming to enhance their reporting capabilities and fully leverage the potential of Business Intelligence. Here are the main takeaways:
- DAX window operations such as
INDEX,OFFSET, andWINDOWserve as powerful tools for advanced data analysis. They enable users to perform intricate calculations and derive deeper insights from their datasets. DAX operates on tables and columns rather than individual cells, utilizing two types of context: Row Context and Filter Context. Understanding these contexts is crucial for effectively employing these operations. - A comprehensive grasp of the various types of window operations and their specific applications is vital for successful implementation. This knowledge allows individuals to tailor their analyses to meet particular business needs, aligning with the customized AI solutions from Creatum GmbH that navigate the extensive market options. Being aware of common challenges associated with the DAX window function, along with performance enhancement techniques, can help users avoid potential pitfalls and increase the effectiveness of their reports. For instance, optimizing calculations can lead to significant improvements in report loading times and responsiveness, which are critical for operational efficiency. Advanced techniques utilizing the DAX window function can unveil new analytical opportunities, fostering more dynamic reporting and enabling users to identify trends and patterns that support informed decision-making. As highlighted in the case study ‘Business Intelligence Empowerment,’ transforming raw data into actionable insights through effective DAX application drives growth and innovation.
- Practically speaking, the total sales amount calculated using DAX was 4,984,304.80, illustrating the tangible impact of effective DAX application on business performance.
- Chris Webb, a member of the Fabric CAT team at Microsoft, advocates for using window methods in DirectQuery mode, whether aggregations are present or not, offering valuable expert insights on DAX window methods.
By leveraging these insights, users can significantly enhance their Power BI reports, ultimately leading to better business decisions and fostering a culture driven by information within their organizations. As the landscape of data analytics evolves, staying informed about current trends in the use of the DAX window function will be essential for maximizing reporting effectiveness in 2025 and beyond. Additionally, understanding how to navigate the complex AI landscape will empower the Director of Operations Efficiency to implement effective BI practices that drive operational success.
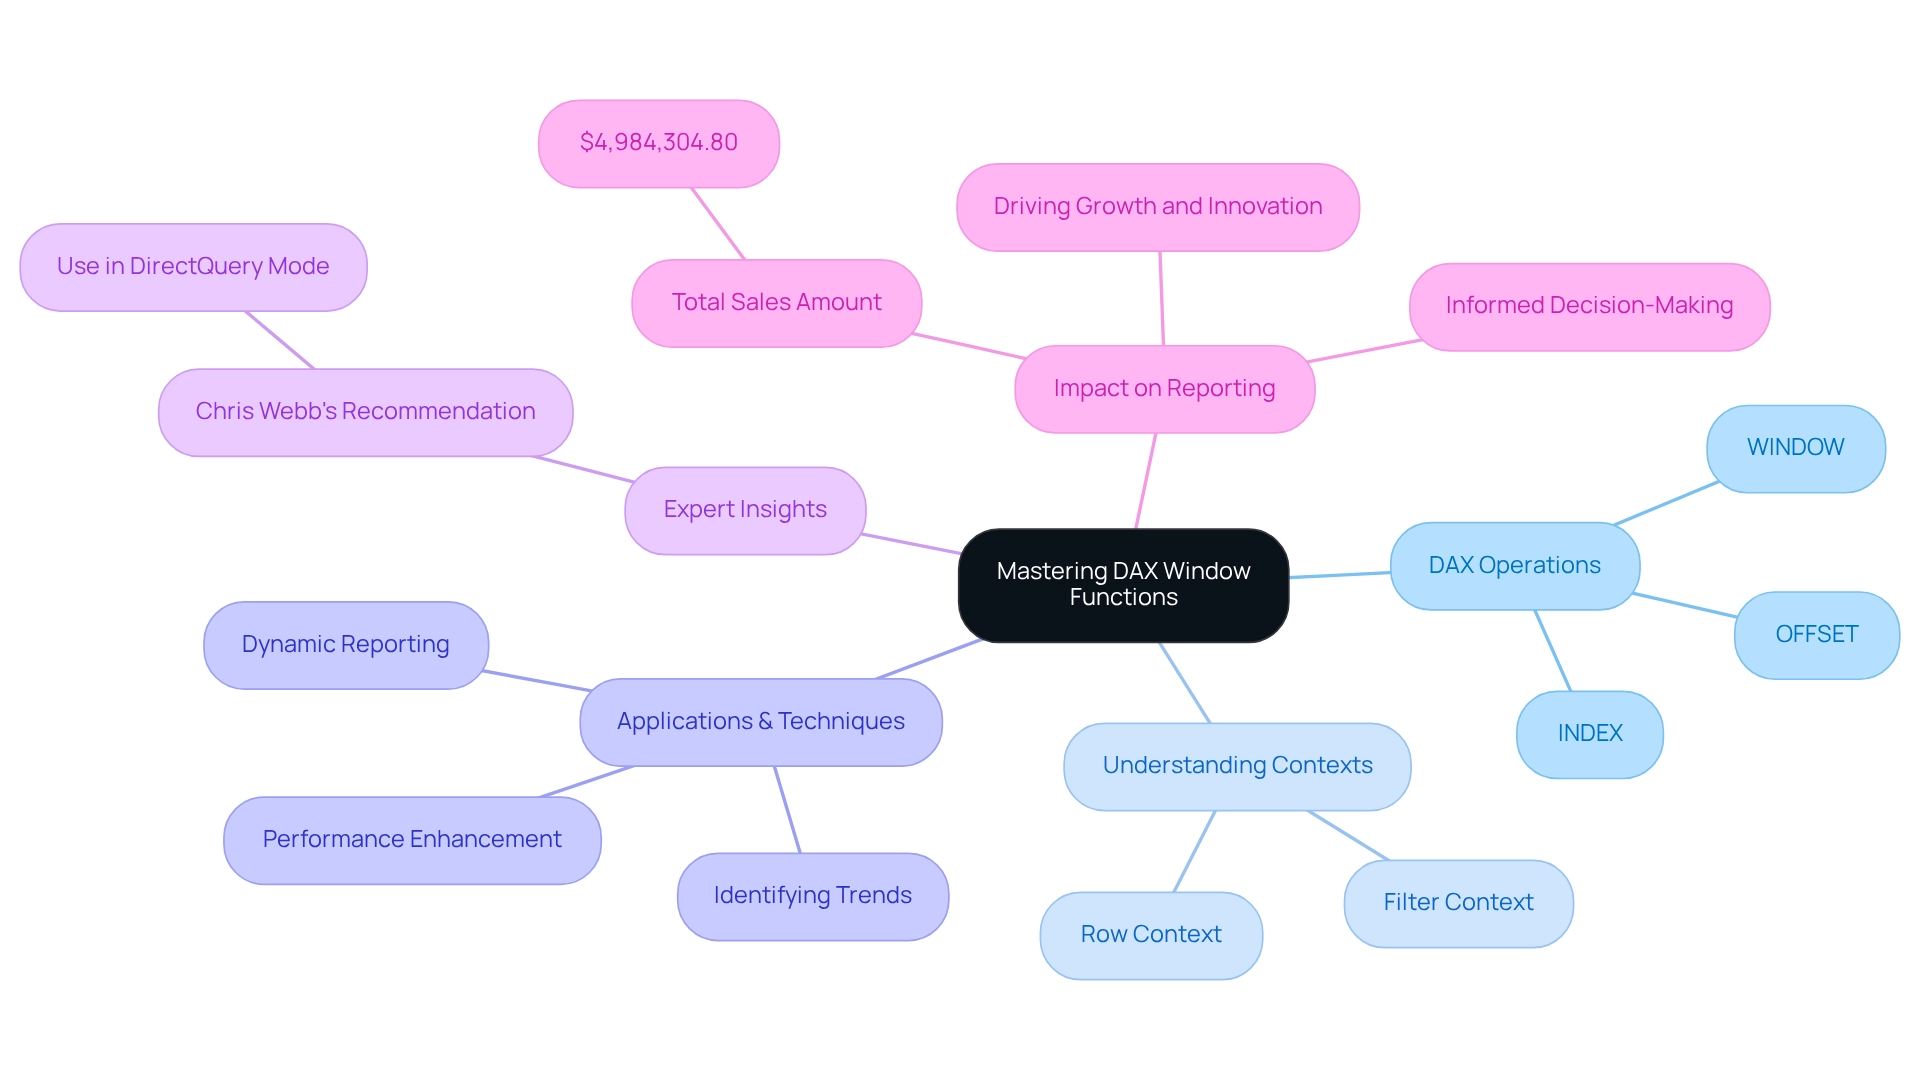
Conclusion
Mastering DAX window functions is essential for enhancing reporting capabilities and unlocking the full potential of Business Intelligence within Power BI. These powerful tools, including functions like INDEX, OFFSET, and WINDOW, enable users to perform complex calculations across related rows, facilitating deeper insights and more dynamic data analysis. Understanding how to effectively utilize these functions, along with their specific applications, is crucial for tailoring analyses to meet unique business needs.
Moreover, awareness of common challenges and performance optimization techniques can significantly improve the efficiency of reports. By simplifying calculations and leveraging advanced techniques, users can uncover valuable trends and patterns that inform strategic decision-making. The real-world impact of implementing DAX window functions is evident, with organizations experiencing enhanced operational efficiency and clearer insights into their data.
As the landscape of data analytics continues to evolve, staying current with advancements in DAX window functions will be vital for maximizing reporting effectiveness. Embracing these tools not only supports informed decision-making but also fosters a data-driven culture that drives growth and innovation within organizations. Ultimately, mastering DAX window functions positions users to navigate the complexities of data analysis, ensuring they remain competitive in an increasingly data-centric world.
Frequently Asked Questions
What is the DAX window function and its significance in Power BI?
The DAX window function allows users to perform calculations across a group of rows related to the current row, essential for tasks like computing running totals, moving averages, and rankings. Its significance in Power BI is particularly pronounced for data analysis in 2025, facilitating intricate calculations vital for precise reporting and informed decision-making.
What are the primary DAX window functions in Power BI?
The primary DAX window functions in Power BI are INDEX, OFFSET, and WINDOW. INDEX retrieves the value of a specified row within a partitioned table, OFFSET extracts values from a specified number of rows before or after the current row, and WINDOW establishes a range of rows within a specified partition, allowing for complex calculations.
How does the DAX window function enhance reporting efficiency?
The DAX window function enhances reporting efficiency by optimizing analysis processes, allowing teams to focus on strategic insights rather than manual data manipulation. Organizations leveraging this function report improved operational efficiency and better information quality.
Can you provide an example of how the DAX window function is used in practice?
A case study on calculating a monthly running total of grades illustrates how DAX window functions can reset at the beginning of each year, enabling effective trend analysis over time and supporting fiscal reporting.
What tools are essential for using DAX window functions?
Essential tools for crafting and managing DAX formulas include Power BI Desktop, Excel, and SQL Server Management Studio. These tools empower users in their analytical endeavors.
How does mastering the DAX window function benefit organizations?
Mastering the DAX window function allows Power BI users to elevate their analytical capabilities, driving growth and innovation within organizations by transforming data into meaningful insights.
What is the role of Creatum GmbH in enhancing DAX window function capabilities?
Creatum GmbH delivers tailored solutions that enhance information quality and streamline AI implementation, assisting businesses in achieving their strategic objectives through services like the 3-Day Sprint for swift report generation and the General Management App for oversight.
Overview
Creating a new table in Power BI from existing tables offers a variety of methods, including:
- Manual entry
- DAX formulas
- Power Query transformations
Understanding these techniques is essential for enhancing data manipulation capabilities. Mastering these skills not only improves operational efficiency but also informs decision-making in the realm of business intelligence. By leveraging these methods, professionals can significantly elevate their analytical practices and drive better outcomes.
Introduction
In the realm of data analytics, Power BI emerges as a formidable tool, empowering organizations to convert raw data into actionable insights. At the core of this transformation is the creation and management of tables—essential building blocks for organizing and analyzing information.
Whether dealing with sales transactions or customer profiles, well-structured tables enable effective data visualization and informed decision-making. Yet, many users face hurdles in mastering the diverse methods of table creation, be it through manual entry, DAX formulas, or Power Query.
This article explores crucial techniques and best practices for creating and managing tables in Power BI, equipping readers with the knowledge necessary to enhance their analytical capabilities and drive operational efficiency.
Understanding the Basics of Table Creation in Power BI
In this software, grids serve as essential components for organizing information, presenting it in a structured format of rows and columns. Each chart encapsulates a distinct dataset, such as sales transactions or customer profiles, making it vital for effective analysis and visualization. Recent statistics reveal that approximately 80% of companies utilizing BI for data visualization recognize the critical role of charts in their analytical processes.
Understanding how to create new tables in Power BI from existing tables and manage these structures is crucial. Power BI provides various methods for creating datasets, including manual entry, DAX (Data Analysis Expressions) formulas, and Power Query transformations. Mastering these techniques not only enhances your ability to manipulate data but also improves the overall quality of insights derived from your datasets.
The importance of well-organized charts cannot be overstated. As David J. Slutsky, Assistant Professor at Harbor-UCLA Medical Center, asserts, “Design each table so that it is understandable on its own, without reference to the text.” This approach fosters clarity and facilitates better decision-making.
Moreover, case studies illustrate the efficiency of proper information management in BI. For instance, the testimonial from Sascha Rudloff, Team Leader of IT and Process Management at PALFINGER Tail Lifts GmbH, underscores how the 3-Day Power BI Sprint from Creatum not only delivered an immediately usable Power BI report but also significantly expedited their Power BI development. This transformative impact highlights the importance of organized information management in enhancing business intelligence strategies.
Additionally, the General Management App provided by Creatum further enhances information reporting and oversight, addressing consistency and governance challenges faced by numerous organizations. By implementing robust framework structures and utilizing the General Management App, organizations can improve information integrity and streamline their reporting processes.
Organizations that have established strong frameworks report substantial improvements in information integrity and analytical efficiency. By linking entities through relationships, users can construct intricate models that enable them to create new tables in Power BI from existing tables, facilitating thorough analysis and uncovering trends and insights that drive strategic initiatives.
Furthermore, employing tools such as heat maps can enhance the visualization of trends and associations, simplifying the interpretation of complex datasets.
In conclusion, mastering the creation and management of charts in Business Intelligence is vital for any organization aiming to leverage information effectively. By utilizing the various methods available and adhering to best practices in information structuring, businesses can transform raw information into actionable insights, ultimately boosting operational efficiency and decision-making capabilities.
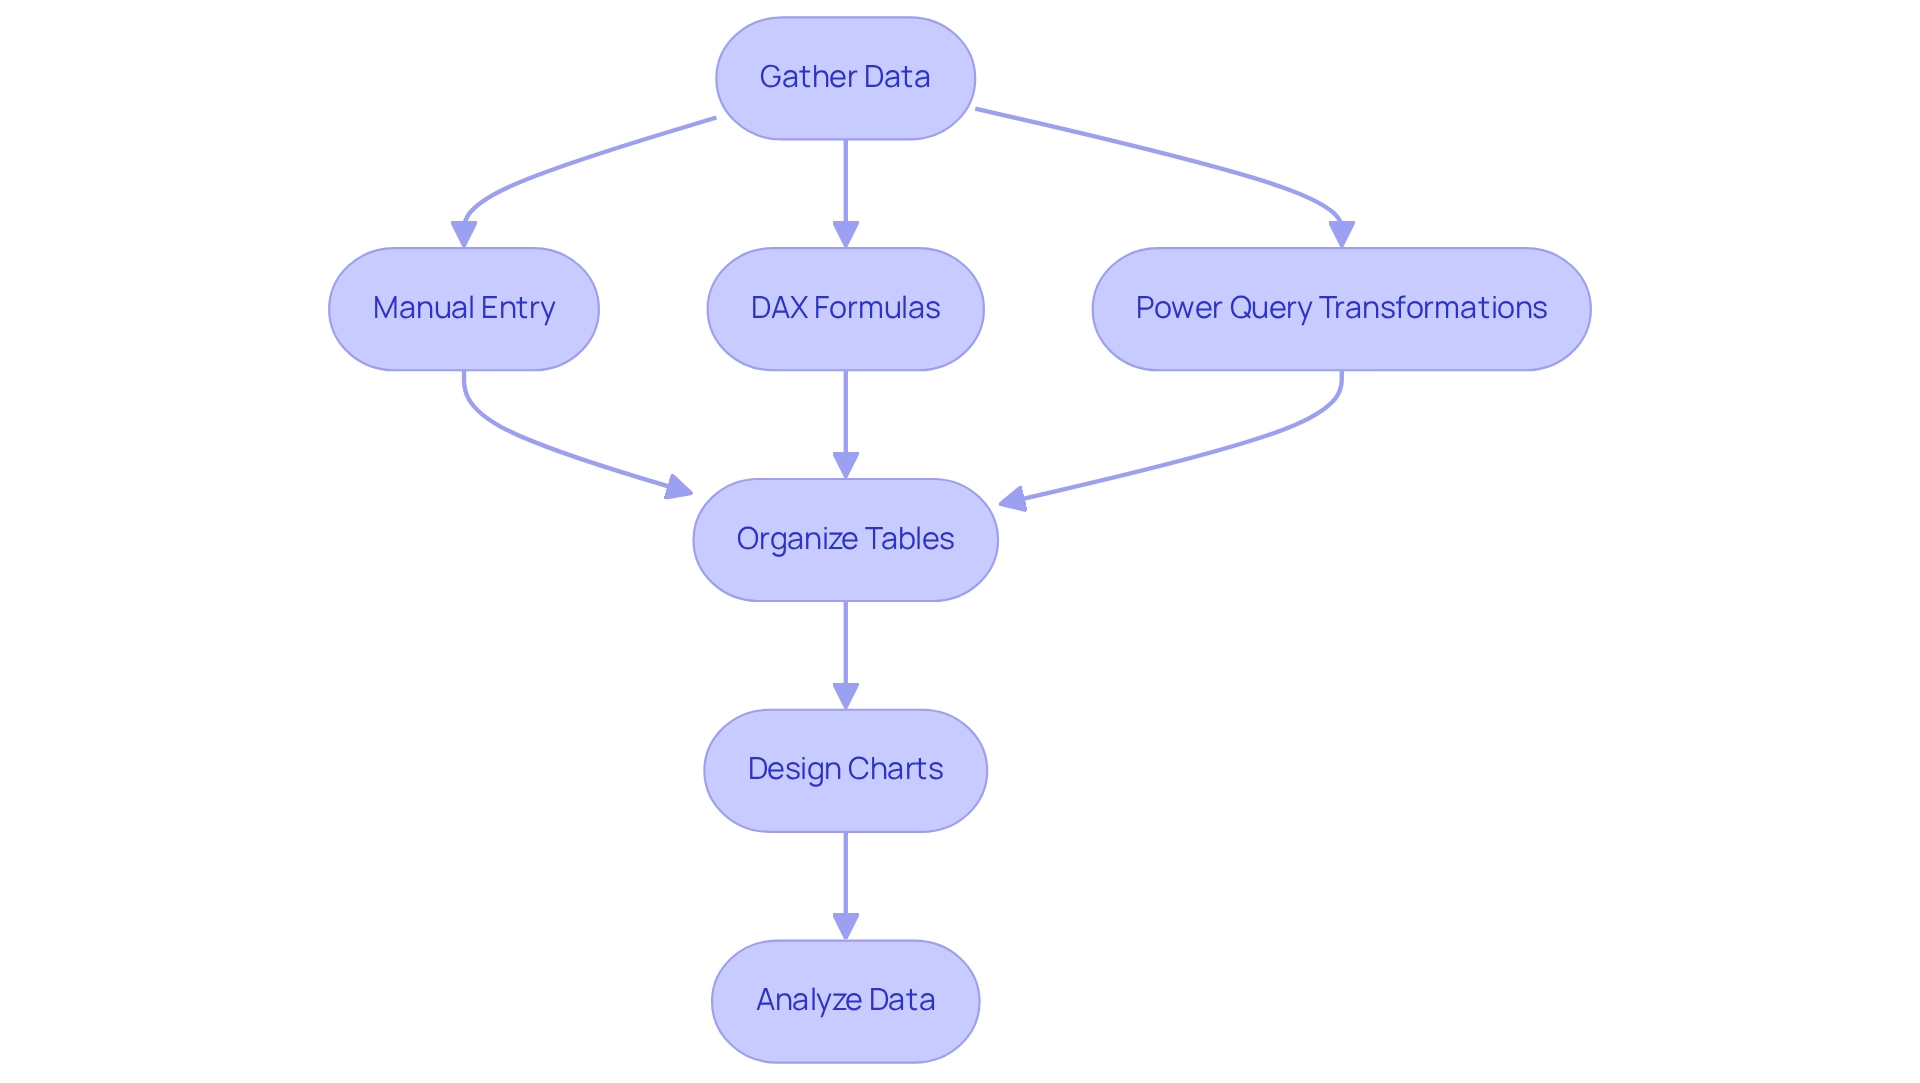
Methods for Creating New Tables in Power BI
Power BI provides a diverse array of methods for creating new tables, each tailored to specific use cases and user needs, significantly enhancing operational efficiency and supporting data-driven decision-making:
-
Enter Information: This straightforward method empowers users to manually input information directly into Power BI by selecting ‘Enter Information’ from the Home tab. It is particularly efficient for small collections or quick entries, enabling rapid information input without reliance on external sources. This minimizes the time spent on repetitive tasks.
-
DAX Table Constructor: Utilizing DAX (Data Analysis Expressions), individuals can create tables through formulas, which is especially advantageous for producing dynamic tables that adjust according to current information. This method enhances flexibility and allows for complex calculations and aggregations, making it a preferred choice among industry leaders. As organizations strive for growth and innovation, leveraging DAX can significantly boost operational efficiency and help overcome challenges in report creation and inconsistencies.
-
Query: This technique focuses on converting and loading information from various sources. Users can create new tables in Power BI from existing tables by merging or appending datasets, ideal for managing larger collections of data. The robust capabilities of Power Query streamline the preparation process, ensuring users can efficiently manage and manipulate their information, ultimately leading to better insights and informed decision-making.
-
Calculated Tables: Created using DAX expressions that reference other tables, calculated tables are instrumental in summarizing information or aggregating details. They provide a powerful means to derive insights from existing datasets, enhancing the analytical capabilities of Power BI and supporting the drive for data-driven insights.
Integrating Robotic Process Automation (RPA) can further optimize these processes, alleviating the burden of manual information handling and improving overall efficiency. A practical suggestion from industry expert Liang recommends, “Try to Unpivot the chart in query editor,” which can assist users in enhancing their information structure for improved analysis and operational efficiency.
By understanding and leveraging these methods, users can effectively create new tables in Power BI from existing data, driving operational efficiency and informed decision-making. Recent statistics indicate that the adoption of DAX for table creation is on the rise, reflecting its benefits in constructing intricate models and enhancing user experience. Organizations that effectively manage their information have reported median revenues of 71,000 units in 2023, underscoring the importance of these methods in fostering growth and innovation.
Furthermore, case studies illustrate how organizations have successfully utilized these methods to transform raw data into actionable insights, ultimately promoting growth and innovation in their operations. The recent DataViz World Championships for BI, held from February 14 to March 31, further emphasize the relevance and timeliness of BI in the current landscape, providing opportunities for users to showcase their skills and engage with the community. Creatum GmbH is dedicated to assisting companies in overcoming these challenges and harnessing the full potential of BI.
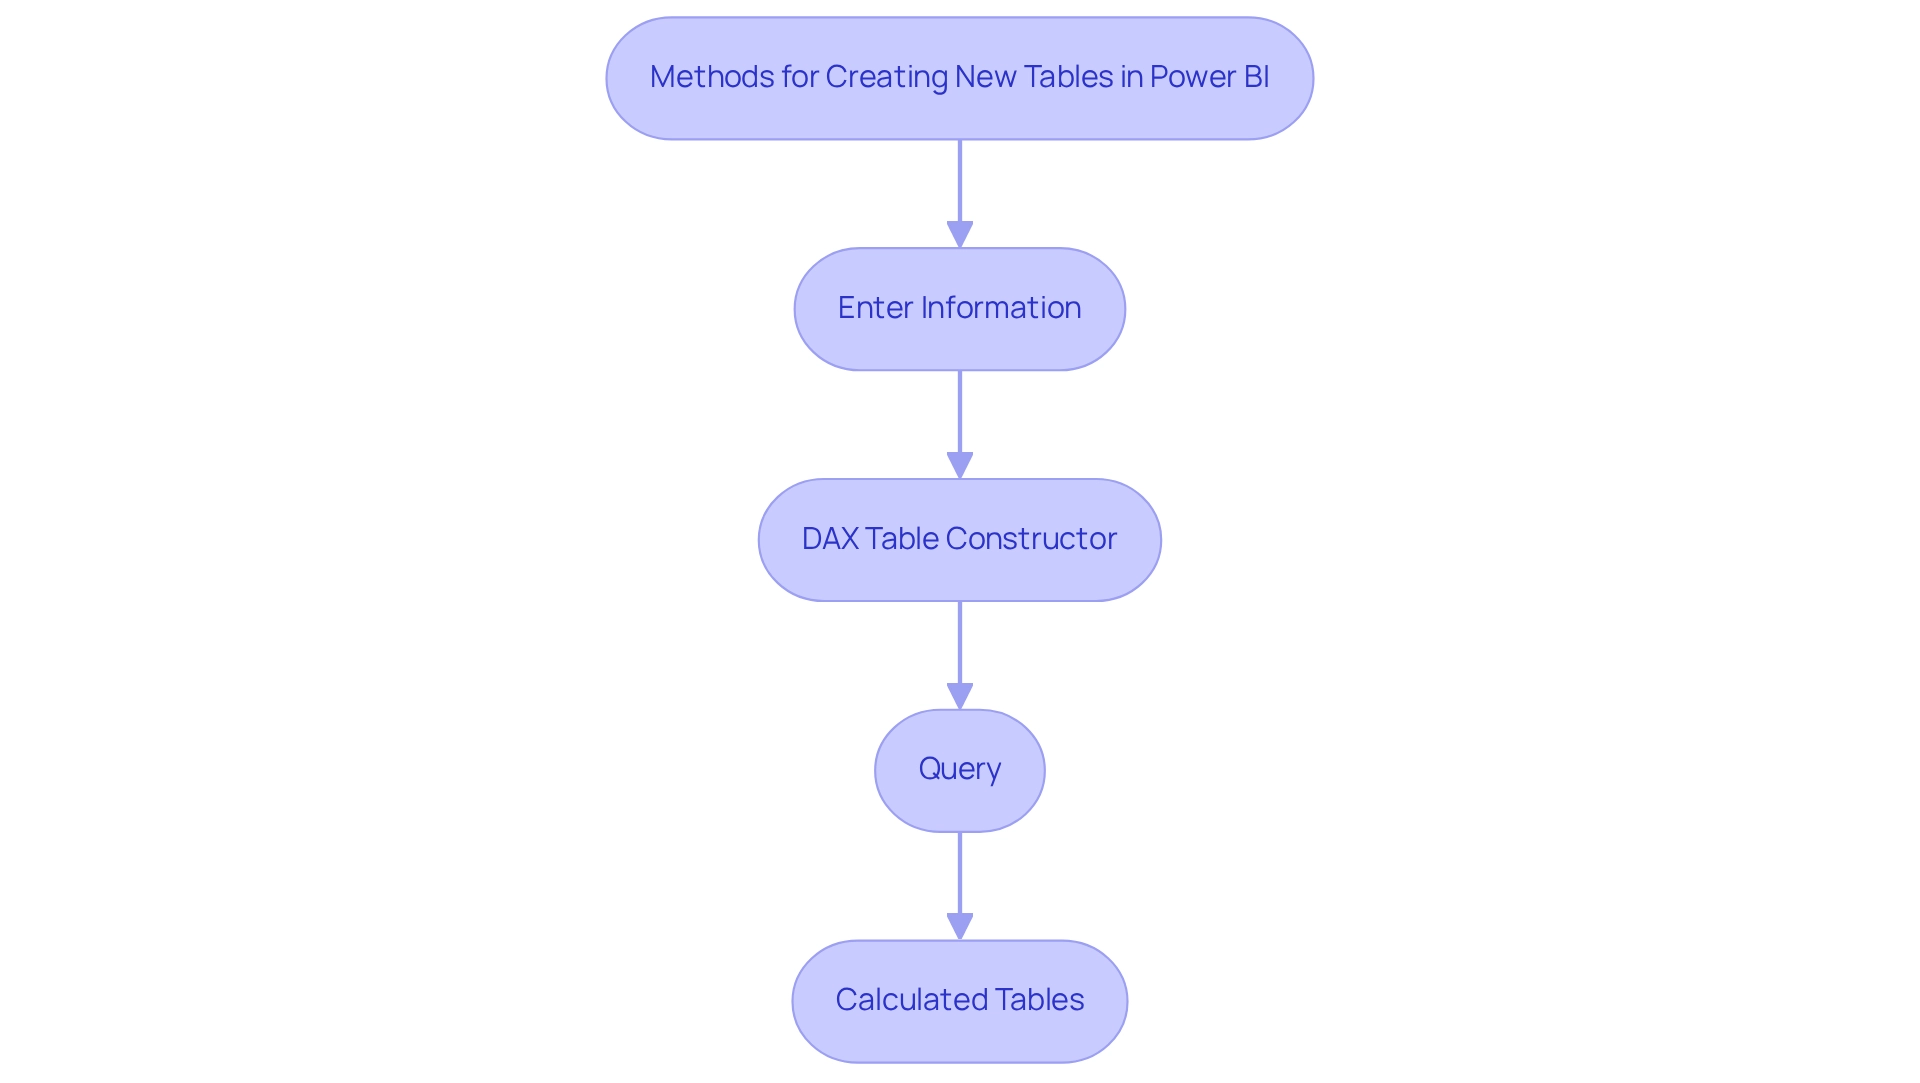
Step-by-Step Guide to Creating a Table Using DAX
Establishing a new chart in BI using DAX is a straightforward procedure that can significantly enhance your data analysis capabilities and address common organizational challenges. Follow these steps to efficiently create a new table:
-
Open Power BI Desktop: Begin by launching the application and opening your existing report.
-
Navigate to the Modeling Tab: Click on the ‘Modeling’ tab located in the ribbon at the top of the interface.
-
Select New Table: Choose ‘New Table’ to activate the formula bar where you will input your DAX expression.
-
Enter DAX Formula: In the formula bar, type your DAX expression. For instance:
new table = SUMMARIZE(existing table, existing table[existing table], existing table[Column2]) -
Press Enter: After entering your formula, press Enter to generate the new dataset.
-
View the New Structure: The recently established structure will now appear in the Fields pane, ready for incorporation into your reports.
Example DAX Expression: This example illustrates how to summarize data from an existing table based on specified columns, facilitating more focused analysis and helping to mitigate issues related to data inconsistencies.
Best Practices for DAX Table Creation:
- Optimize for Performance: When dealing with large datasets, be mindful of the maximum limit of 99,999 rows returned per query to ensure efficient processing. This limitation is crucial for maintaining performance when executing DAX queries in Power BI, particularly given the challenges of time-consuming report creation.
- Avoid Excessive Charts: As highlighted in community discussions, creating an abundance of charts can complicate your model, especially with large datasets. A community member noted, “I have a significantly large DataSet I am working on, so I am aiming to reach the end result with DAX language instead of additional datasets.” Instead, focus on utilizing DAX expressions that effectively summarize and filter information without the need for additional tables.
Importance of Actionable Guidance: To truly leverage insights from your Power BI dashboards, it is essential to ensure that your reports provide clear, actionable guidance. This assists stakeholders in understanding the subsequent actions based on the information provided, addressing the common issue of reports filled with figures but lacking direction.
Role of Business Intelligence and RPA: Integrating Business Intelligence and Robotic Process Automation (RPA) can significantly enhance operational efficiency and data-driven insights. By automating repetitive tasks and streamlining information processes, organizations can concentrate on analysis rather than report creation, ultimately driving growth and innovation.
Success Rates and Effectiveness: Users have reported high success rates when utilizing DAX for table creation, particularly when adhering to best practices. Recent statistics indicate that efficient DAX expressions can greatly improve information summarization, facilitating the extraction of actionable insights from complex datasets. Furthermore, a case study examined the challenges of organizing information in DAX, where a community member proposed establishing a grouping structure to filter the fact set by cancellation columns.
This underscores the importance of managing large datasets efficiently without generating unnecessary records. By mastering these techniques, you can streamline your reporting processes and enhance operational efficiency, ultimately harnessing the full potential of Business Intelligence and RPA for your organization.
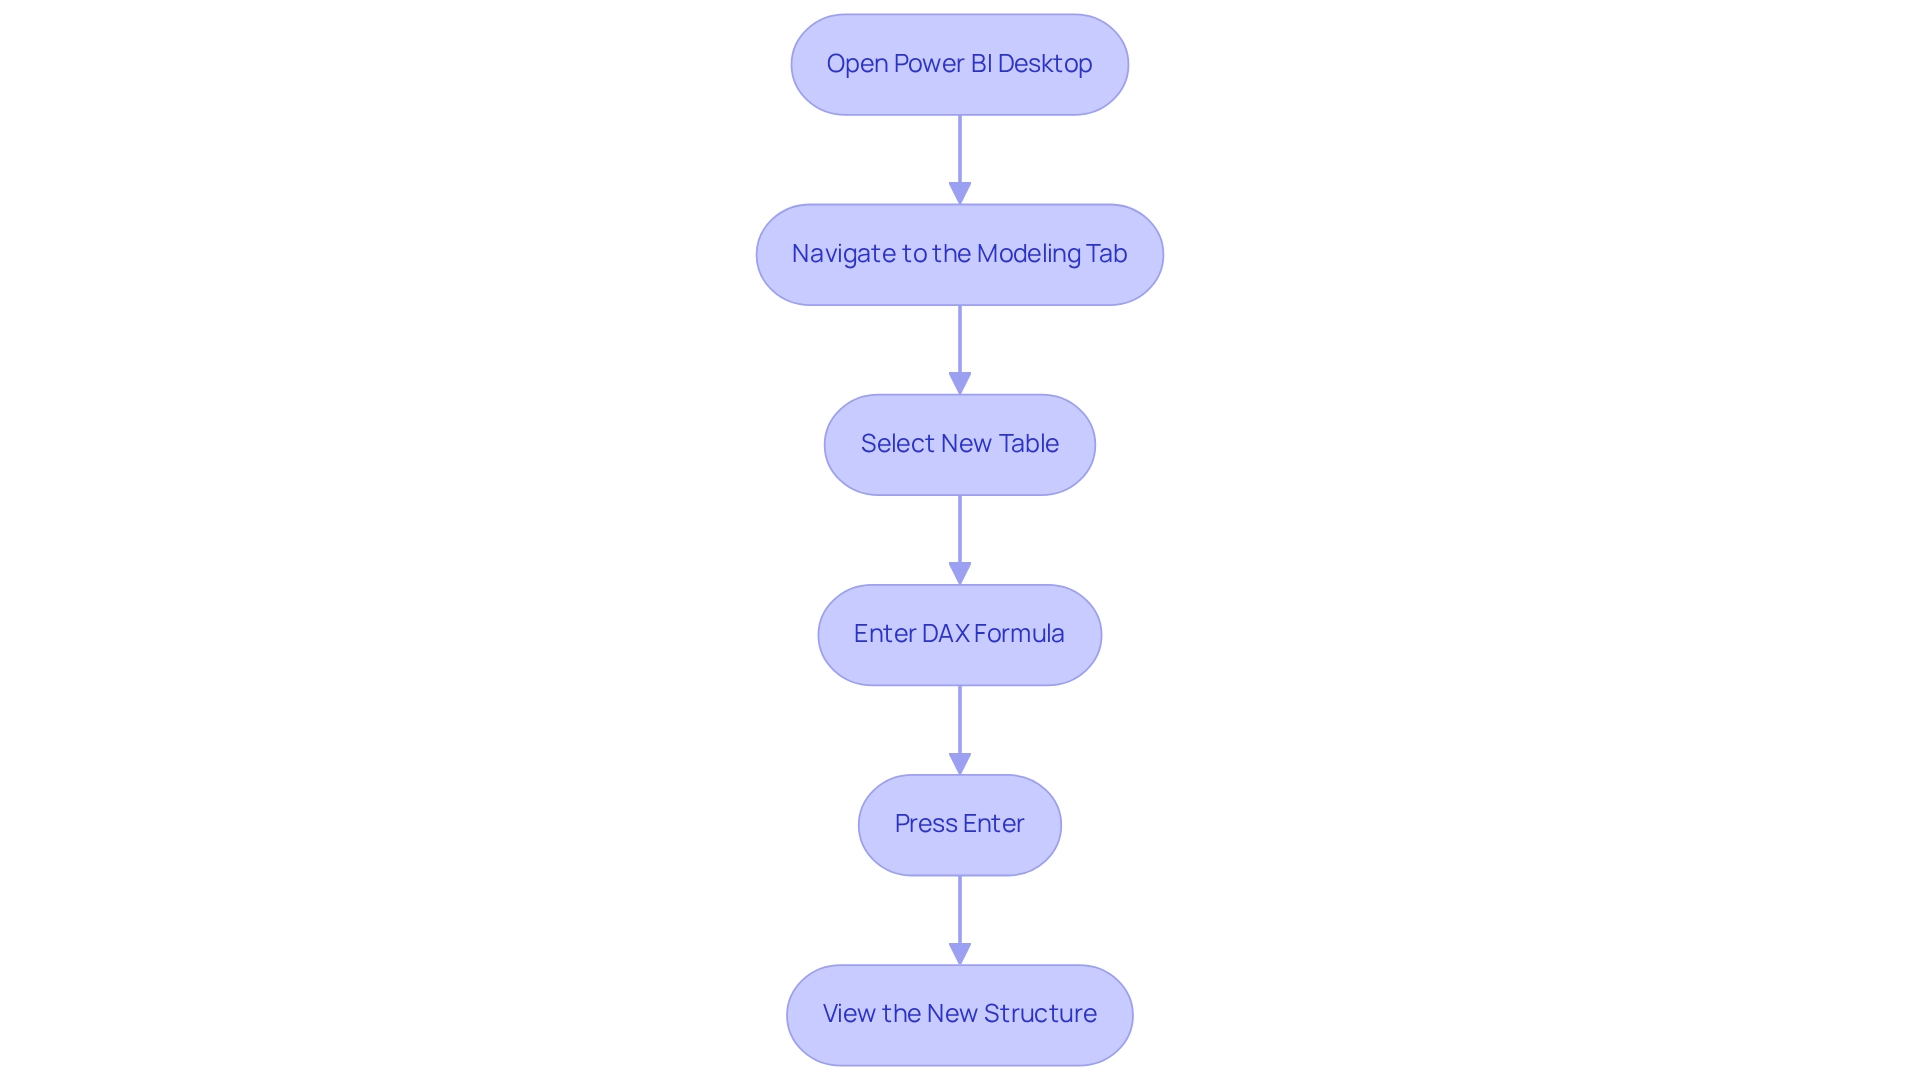
Creating Tables with Power Query: A Comprehensive Approach
Establishing a new structure in BI through Query empowers you to create new tables in Power BI from existing tables. This straightforward procedure can significantly enhance your data management capabilities and boost operational efficiency. Follow these steps to efficiently create and manage your tables:
- Open Power Query Editor: Launch Power BI Desktop and click on ‘Transform Data’ to access the Power Query Editor.
- Select a Source Dataset: Identify the dataset you wish to use as the foundation for your new dataset.
- Duplicate or Reference the Chart: Right-click on the selected chart and choose either ‘Duplicate’ to create an exact copy or ‘Reference’ to create a new query that links back to the original chart.
- Transform the Data: Implement necessary transformations, such as filtering rows, changing data types, or applying calculations to tailor the data to your needs. For instance, if you’re creating a summary chart, you might filter the original dataset to include only specific columns or rows based on defined criteria.
- Load the New Table: After completing your transformations, click ‘Close & Apply’ to import the new table into BI.
Best Practices for Power Query Table Creation
- Utilize Dictionary Encoding: Enabling dictionary encoding for repetitive text data can save space and enhance processing speed, making your data model more efficient.
- Leverage the ADD COLUMN / STATISTICS Feature: This feature allows for statistical aggregation across multiple columns, enabling you to calculate sums, averages, and other statistics seamlessly. As noted by dieter92, “The ADD COLUMN / STATISTICS idea of this is to do some statistics on several columns aggregation (not just two): sum of all columns, average of all, etc…”
Real-World Example
A notable case study involves MavenTech, which harnessed CRM data for insightful sales reporting. By utilizing Query, they automated the cleaning and transformation of raw information into a refined dataset. This automation significantly improved their ability to generate accurate, analysis-ready reports, laying a strong foundation for effective business intelligence reporting.
The implementation resulted in a 30% decrease in report generation time and enhanced information accuracy by 25%.
Time Efficiency
Research indicates that creating tables using Power Query can be completed in approximately 16 minutes, compared to the time-consuming manual entry process. This efficiency highlights the importance of utilizing Query to create new tables in Power BI from existing tables for transformation tasks in BI, especially in an information-rich setting where deriving significant insights is vital for sustaining a competitive advantage.
By adhering to these steps and best practices, you can simplify your information management processes in BI, ensuring that your records are not only precise but also enhanced for analysis, ultimately fostering growth and innovation. Moreover, incorporating RPA solutions from Creatum GmbH can further improve operational efficiency by automating repetitive tasks related to information management.
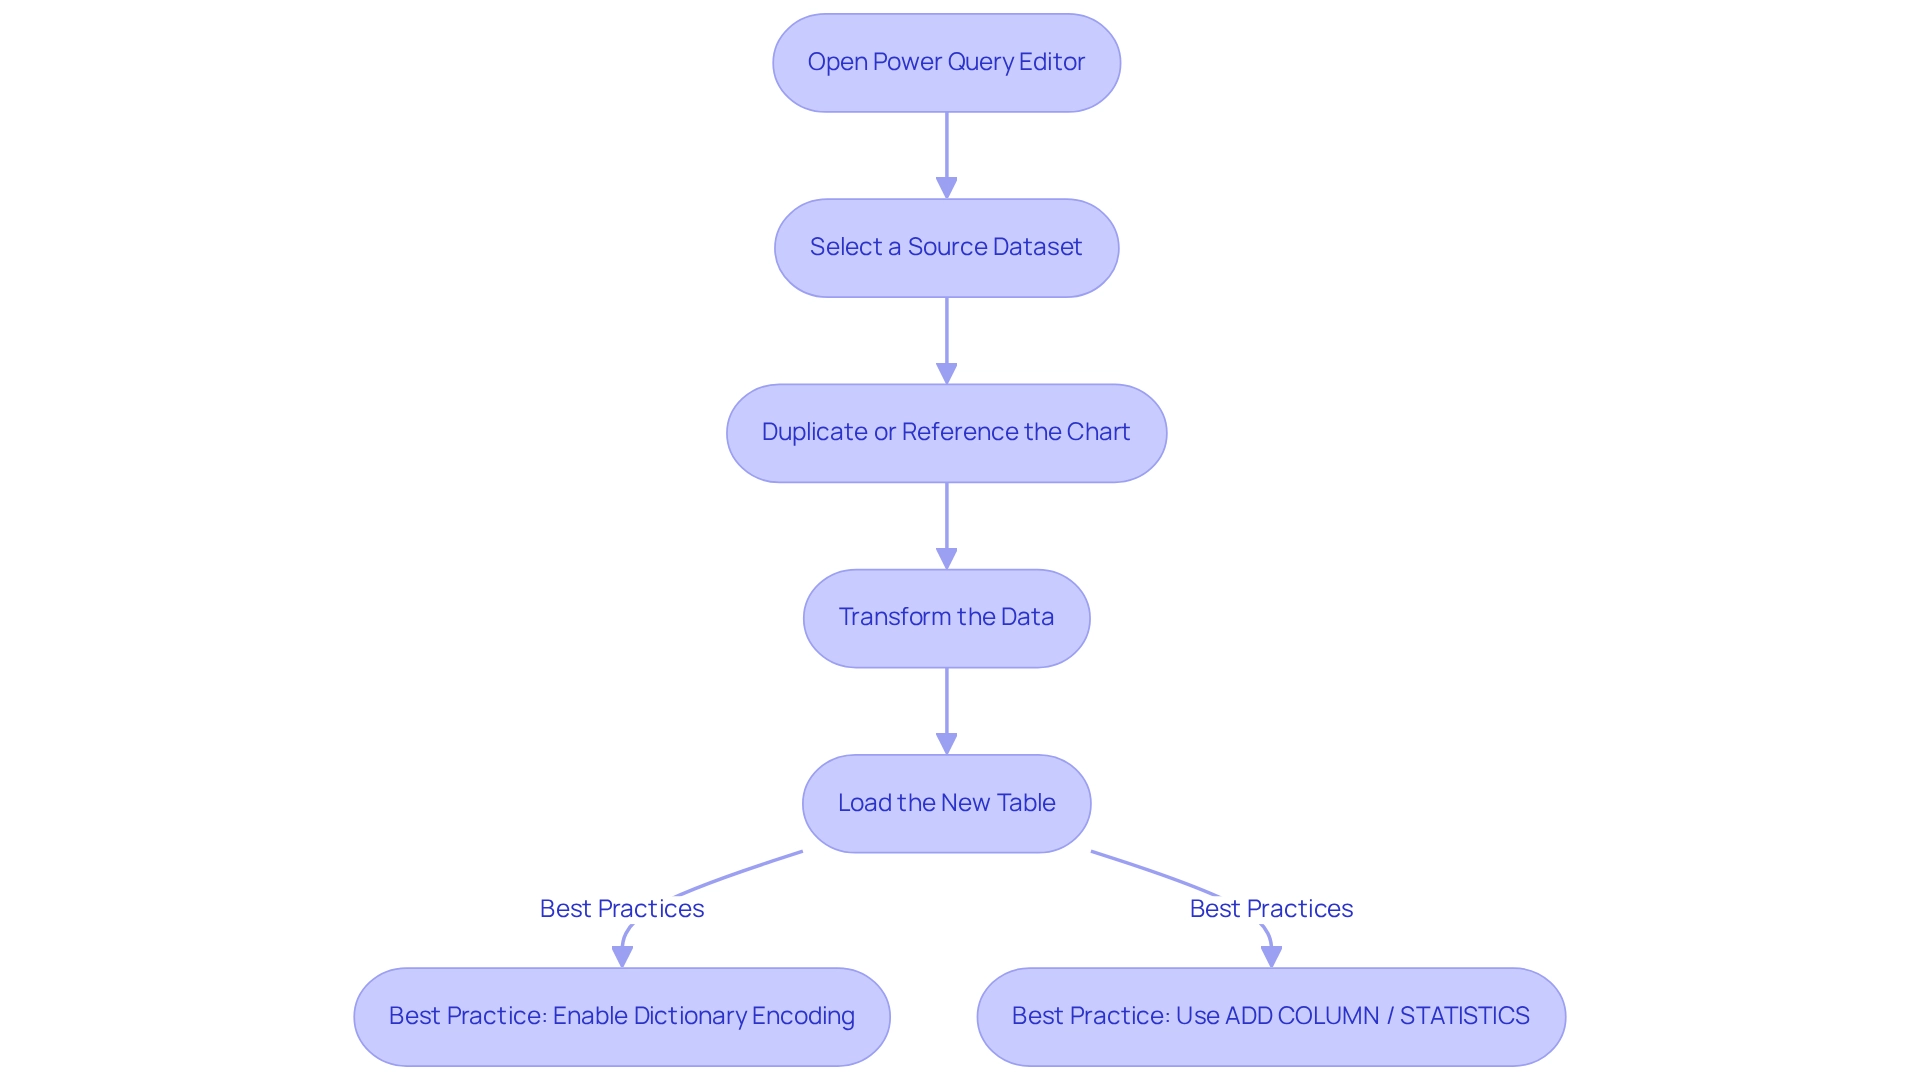
Utilizing Existing Tables to Create New Tables
Creating new tables from existing ones in Power BI can be accomplished through several effective methods, each tailored to enhance data management and analysis, ultimately driving operational efficiency and informed decision-making.
- Using DAX: The Data Analysis Expressions (DAX) language enables you to form new structures by aggregating or filtering information from current datasets. For instance, you can generate a new table that includes only those records where a specific column exceeds a certain value:
NewTable = FILTER(ExistingTable, ExistingTable[Column] > 100)
This method is particularly useful for creating targeted datasets that focus on specific criteria, addressing the challenge of time-consuming report creation in Power BI dashboards.
-
Power Query Merging: In Power Query, combining datasets is a straightforward process. By choosing ‘Merge Queries’, you can unite two or more datasets based on common columns. This method is advantageous for combining related datasets, providing a comprehensive perspective of your information and improving quality.
-
Appending Queries: When working with similar datasets, combining them can produce a new unified structure. This method is ideal for merging information from various sources, such as multiple sales regions or departments, into a single dataset for easier analysis, thus streamlining manual workflows.
-
Example of Merging Tables: Consider a scenario where you have a sales table and a customer table. By combining these two lists, you can generate a new record that features customer information alongside sales figures, offering a more comprehensive context for analysis. This integration not only improves information quality but also streamlines reporting processes, addressing the absence of actionable guidance frequently encountered in BI.
-
Best Practices and Insights: Industry leaders emphasize the importance of optimizing your data retrieval methods when merging tables. For example, utilizing
Table.Buffercan significantly improve performance, especially when working with large datasets. A case study highlighted a user who faced slow load times while appending data from 57 SharePoint sites, each containing multiple lists. By examining their strategy and applying best practices, they succeeded in improving efficiency, demonstrating how RPA, including solutions like EMMA RPA and Automate from Creatum GmbH, can support BI initiatives.
Statistics indicate that a significant percentage of users utilize existing tables to create new tables in Power BI from existing tables, underscoring the effectiveness of these methods in Business Intelligence. In fact, a message seeking solutions to similar problems garnered 13,076 views, reflecting the high demand for effective information management techniques. As organizations increasingly rely on data-driven decision-making, mastering these techniques is essential for operational efficiency and strategic growth.
Mitchell Pearson, a Platform Consultant and Training Manager, remarks, “This summary encapsulates the core lessons from the tutorial, aimed at professionals seeking to enhance their management capabilities in Power BI.” This strengthens the tutorial’s importance for those aiming to improve their abilities in information management. By focusing on enhancing data quality and simplifying AI implementation, organizations can drive growth and innovation in their data practices.
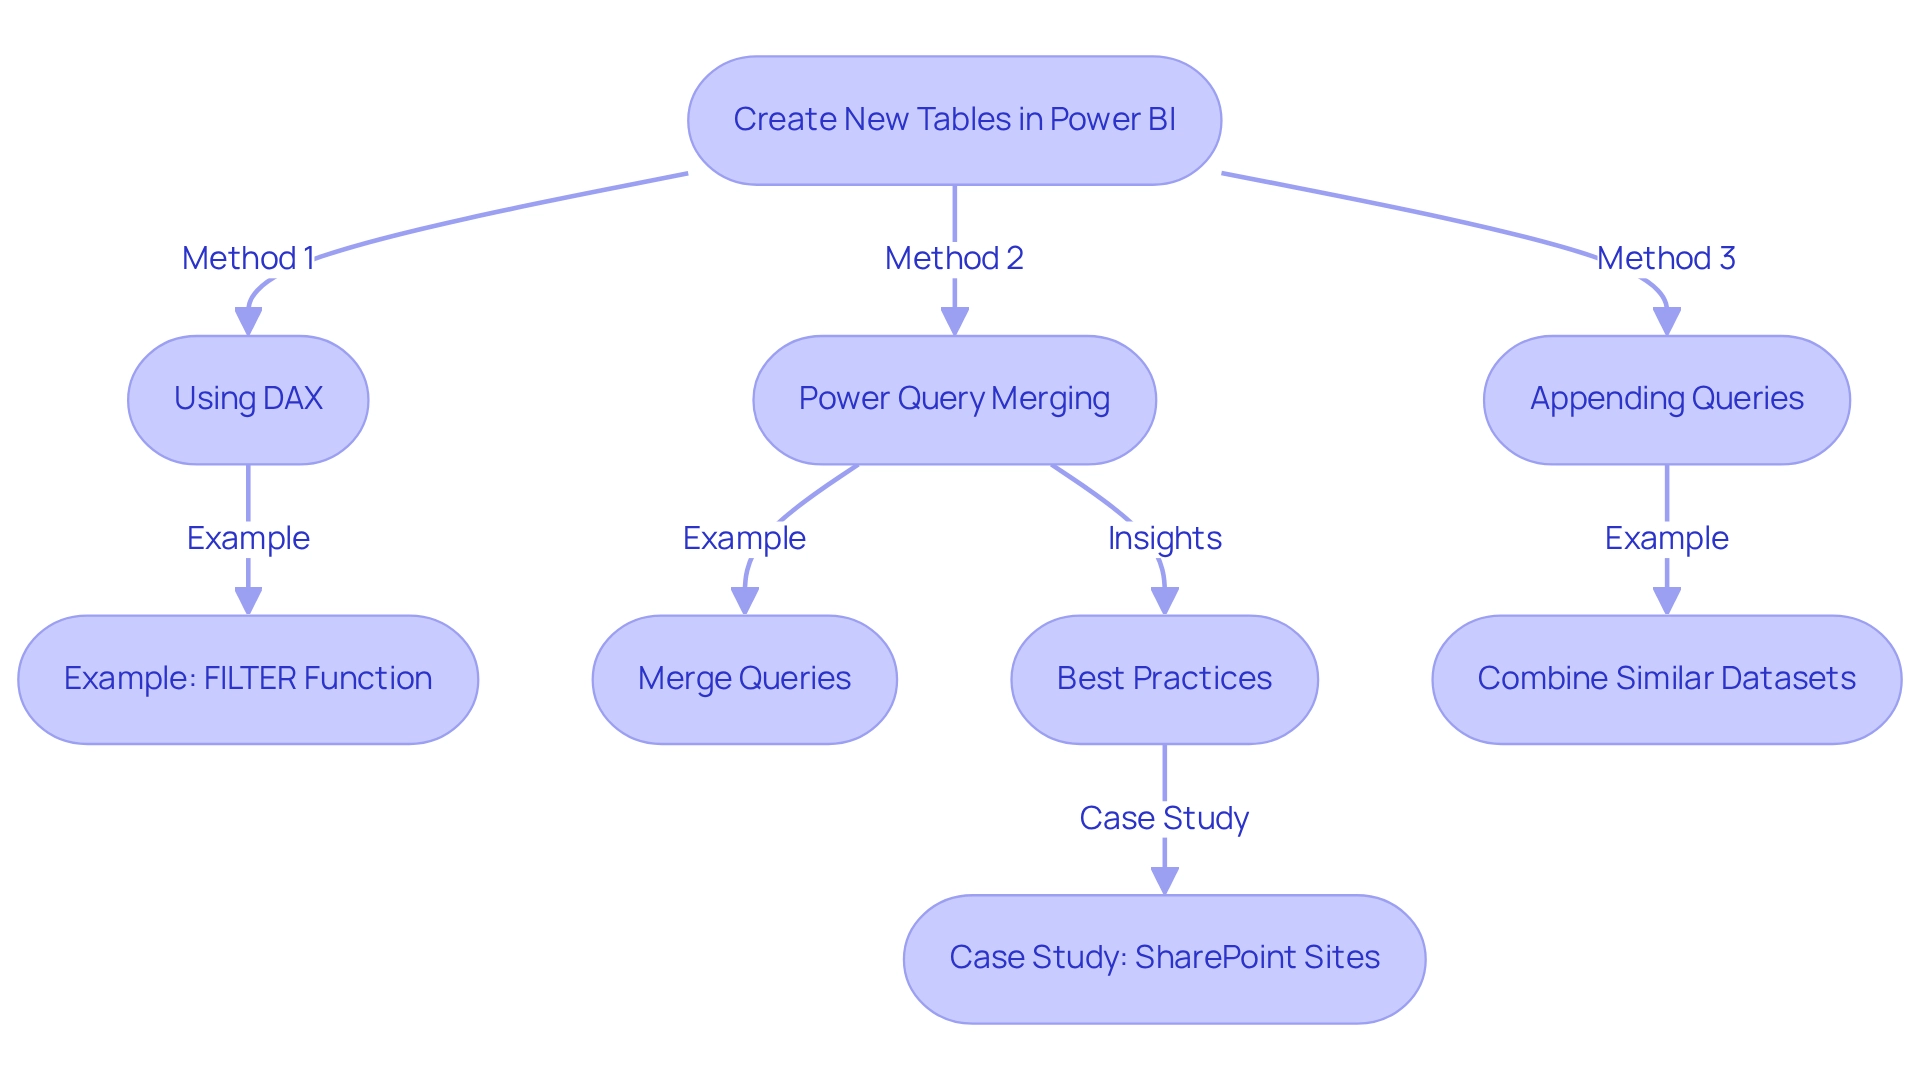
Best Practices for Creating and Managing Tables in Power BI
To optimize your table creation and management in Power BI, adhere to the following best practices:
-
Use Descriptive Names: Clearly name your structures and columns to accurately reflect their content. This practice not only aids comprehension but also enhances the overall clarity of your information model.
-
Limit Columns: Include only the necessary columns in your lists. This method reduces complexity, boosts performance, and ensures that users can navigate the information effortlessly.
-
Establish Relationships: Properly define relationships between tables. This is essential for facilitating efficient information analysis and reporting, enabling users to extract valuable insights from related datasets.
-
Regularly Review Information Models: Periodically evaluate your information models for efficiency and relevance. Eliminating outdated or unnecessary structures helps maintain a streamlined environment that promotes optimal performance.
-
Document Changes: Maintain a thorough log of modifications made to your tables and information models. This documentation fosters clarity and encourages collaboration among team members, ensuring everyone is aligned on the current framework and purpose of the information.
-
Establish a Clear Role Hierarchy: Implementing a clear role hierarchy simplifies permissions management in Power BI, ensuring that users have appropriate access to the data they need.
-
Encourage Collaboration: Foster an environment where team members can comment and annotate within reports. Establishing specialized collaborative environments enhances teamwork and facilitates more efficient resource management.
Example of Naming Conventions:
- Instead of using generic names like ‘Table1’, opt for specific names such as ‘SalesData_2025’. This not only enhances clarity but also aids in quickly identifying the purpose of each table.
As mentioned by Sascha Rudloff, Teamleader of IT- and Processmanagement at PALFINGER Tail Lifts GMBH, “With the BI Sprint from CREATUM, we not only received a readily usable BI report and a gateway setup but also experienced a significant acceleration in our own BI development.” The outcomes of the sprint surpassed our anticipations and served as a vital catalyst for our analysis strategy. This emphasizes the transformative effect of Creatum’s Business Intelligence Sprint on analytics development.
By applying these best practices, organizations can create new tables in Power BI from existing tables, significantly enhancing their BI table management and leading to improved information quality and more effective decision-making processes. Moreover, incorporating Robotic Process Automation (RPA) can simplify repetitive tasks related to information management, boosting operational efficiency. Customized AI solutions can also assist in tackling challenges associated with data analysis and reporting, ensuring that businesses derive meaningful insights from their BI dashboards.
Ultimately, these strategies drive growth and innovation for businesses.
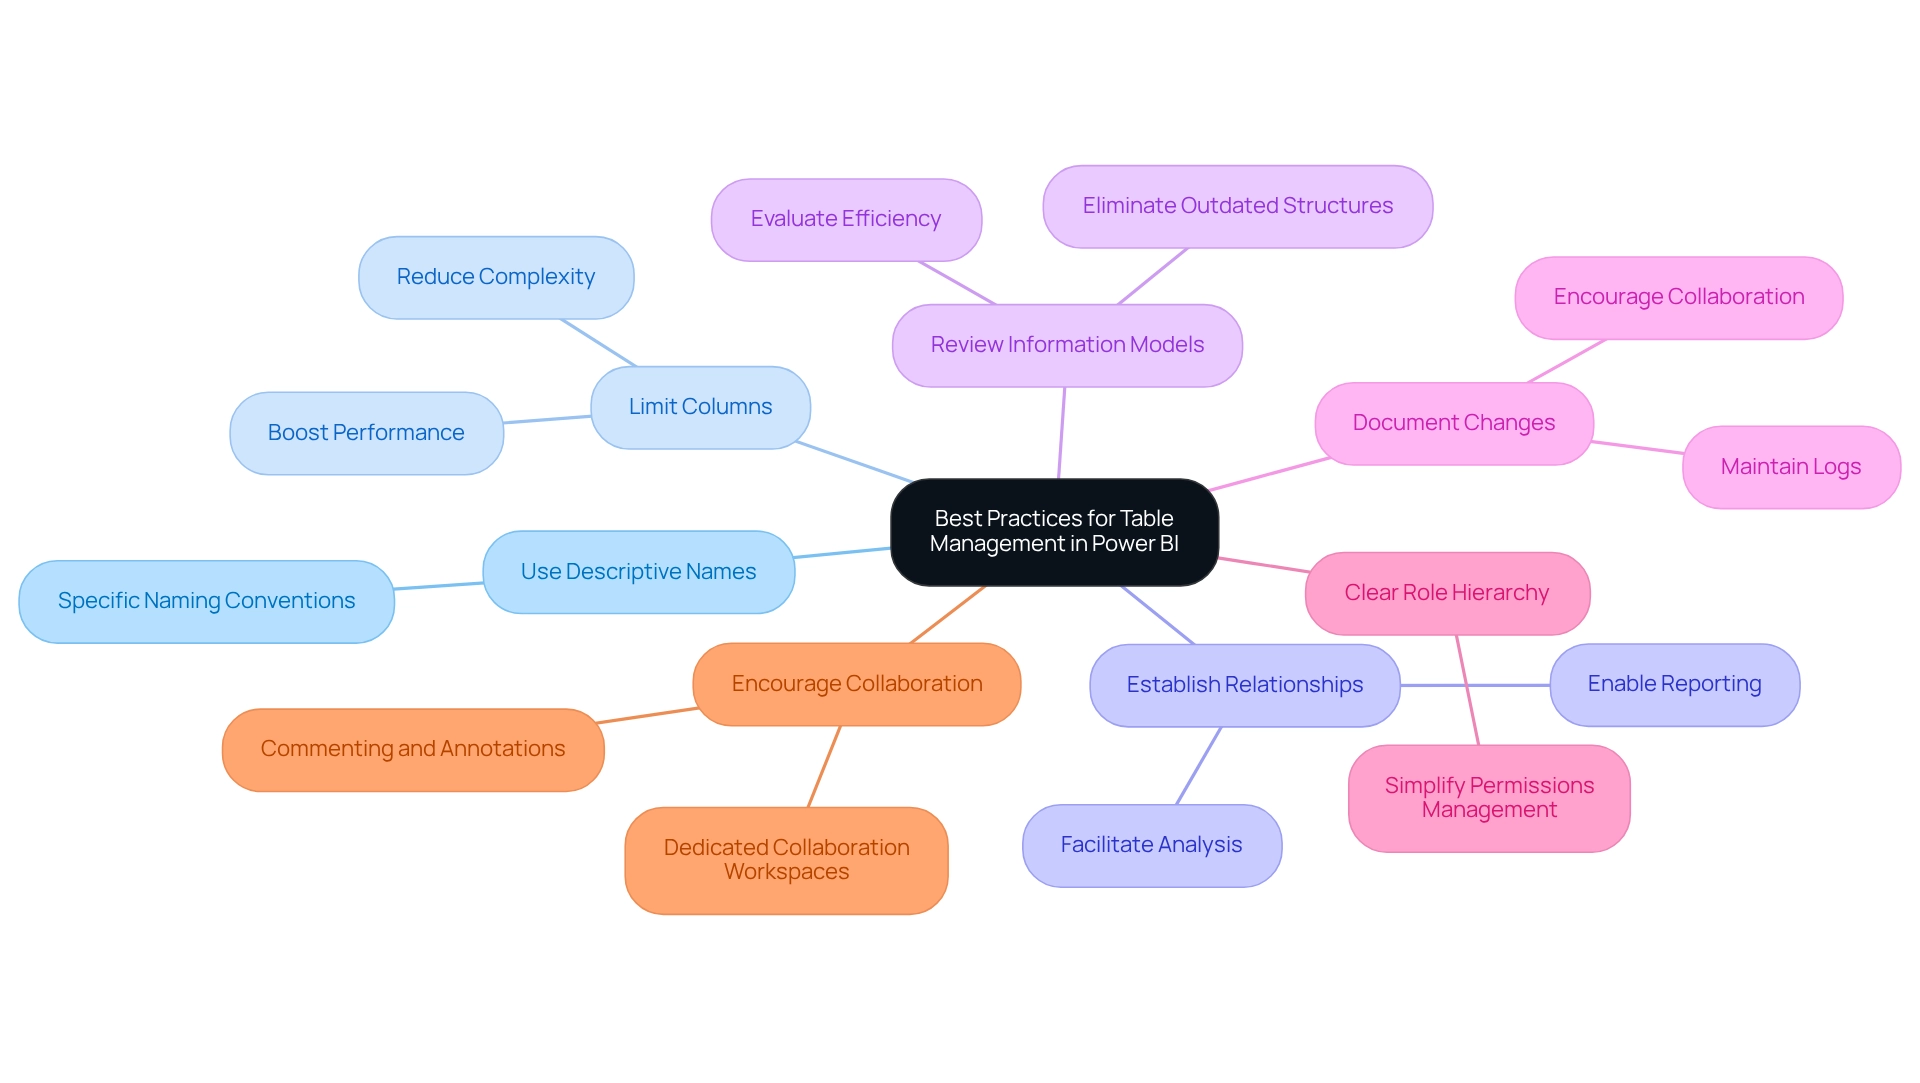
Troubleshooting Common Issues in Table Creation
Building charts in Power BI presents various challenges that can hinder your workflow. Here are some common issues along with expert solutions to help you navigate these obstacles effectively:
-
Error Messages: When you encounter error messages during table creation, it is essential to scrutinize your DAX syntax. Look for mistakes or missing elements that could be causing the issue. Tools like the Tabular Editor Best Practice Analyzer can help identify unnecessary columns that may complicate your model. Statistics indicate that utilizing this tool can significantly reduce mistakes in your information model, ultimately enhancing your Business Intelligence initiatives.
-
Data Type Mismatches: Data type mismatches frequently lead to errors when merging or appending columns. Ensure that the types of the columns involved are compatible. A substantial percentage of errors in Power BI stem from these mismatches, so verifying types can save time and frustration, enabling smoother insights based on information.
-
Performance Issues: If your reports are running slowly, consider optimizing your DAX calculations and reducing the number of columns in your tables. Enhancing your information model not only boosts performance but also improves the overall user experience. Additionally, updating the model, verifying sources for structural changes, and clearing the Power BI cache are crucial steps for resolving model issues—though time-consuming, they are vital for operational efficiency.
-
Relationship Conflicts: Challenges in establishing connections between entities often arise from incompatible categories or values in the columns used for relationships. Confirm that these columns align in both type and content to establish successful relationships, which is critical for accurate reporting and analysis.
Example of Resolving Errors: For instance, if you encounter a ‘maximum size exceeded’ error, simplifying your data model by removing unnecessary tables or columns can be beneficial. This method not only rectifies the error but also enhances the efficiency of your BI reports. Remember, using the DIVIDE function in DAX instead of ‘/’ can help avoid errors when the denominator is 0.
By addressing these common problems with targeted solutions, you can significantly improve your experience in creating new tables in Power BI from existing ones, ultimately leading to more effective data analysis and decision-making. As Gusdate2, a helper, noted, “I didn’t think to unpivot,” highlighting a frequent oversight that can complicate the creation of the structure. Furthermore, the case study titled “Business Intelligence for Informed Decision-Making” illustrates how organizations empower businesses to derive meaningful insights, underscoring the importance of efficient management in fostering growth and innovation.
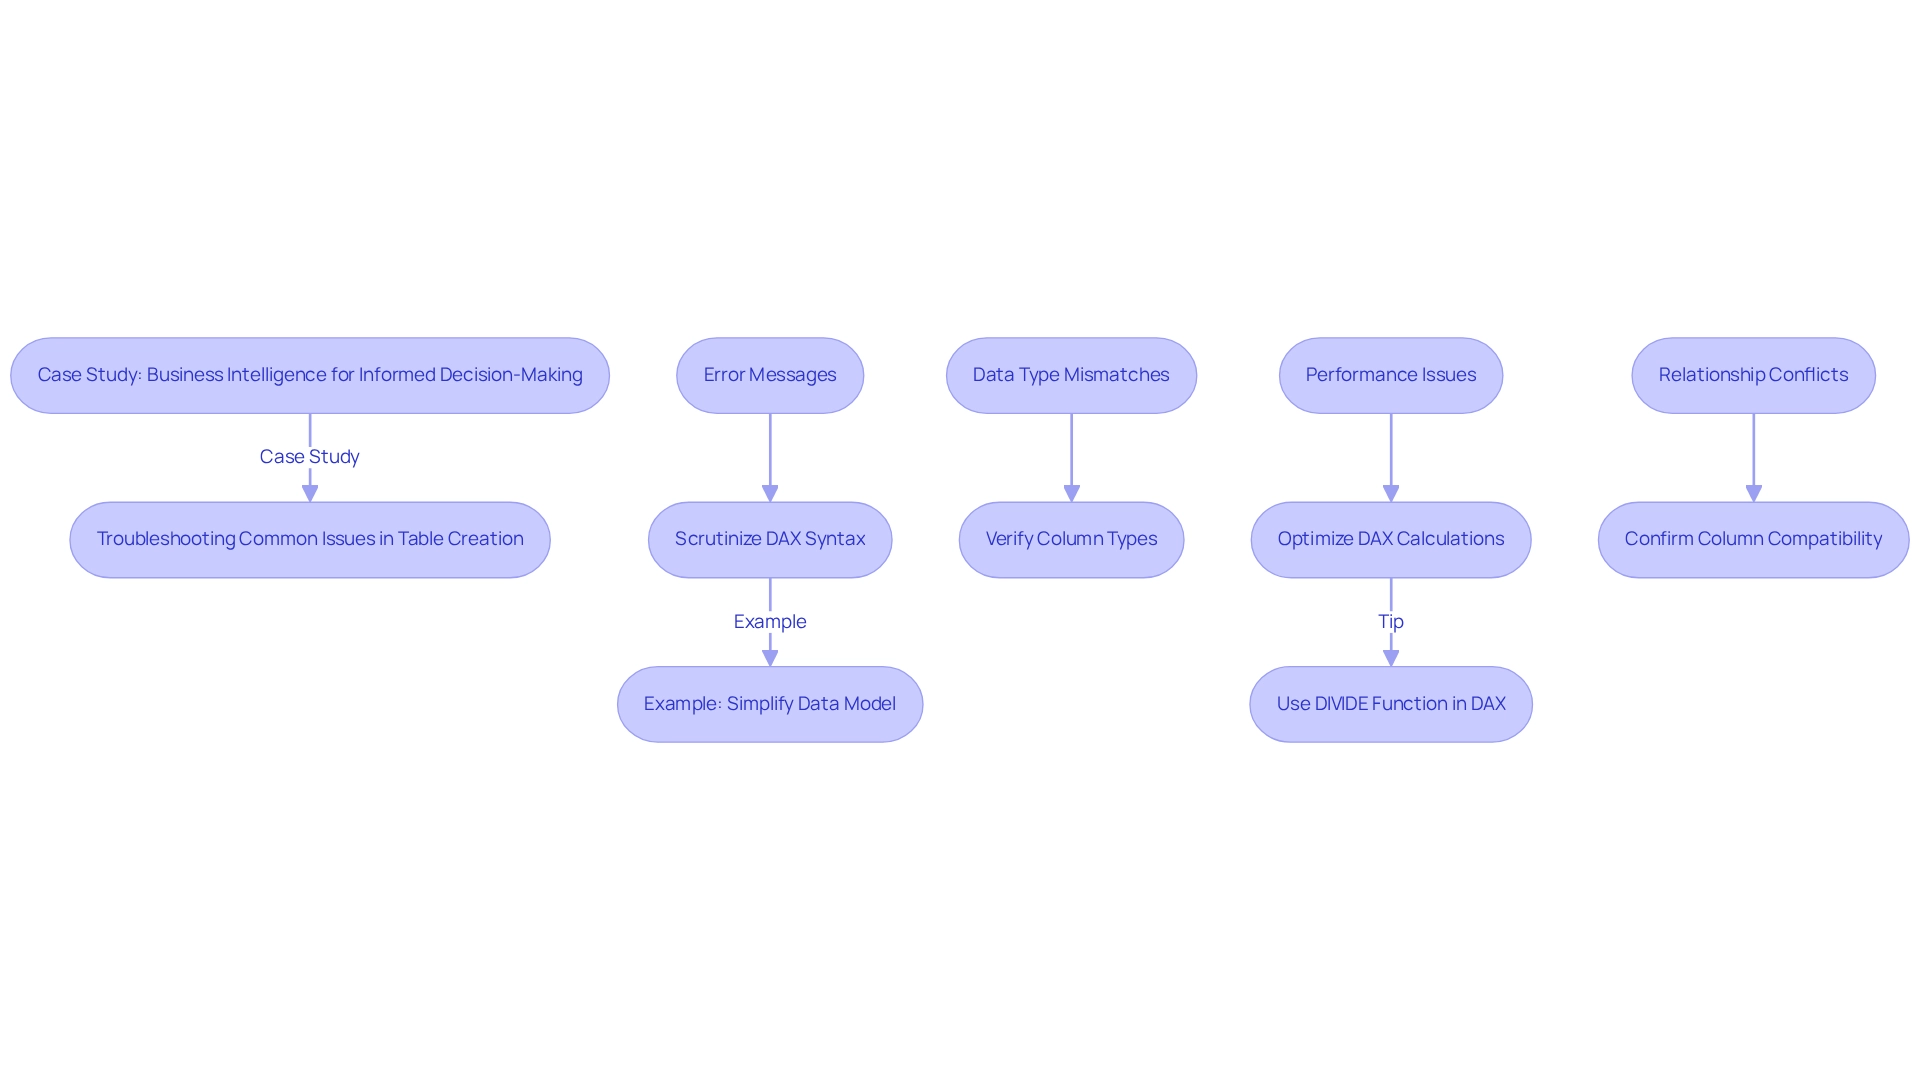
Key Takeaways and Next Steps in Power BI Table Creation
Creating a new table in Power BI from existing tables can be accomplished through various methods, including manual entry, DAX, and Query. Mastering these techniques is essential for effective data modeling and leveraging Business Intelligence to drive informed decision-making. To enhance your Power BI skills and operational efficiency, consider the following next steps:
- Practice Creating Structures: Engage in hands-on experimentation with various techniques to produce layouts tailored to your datasets. This practical experience will deepen your understanding and enhance your skills, ultimately improving your ability to derive actionable insights from your data.
- Explore Advanced DAX Functions: Delve deeper into DAX to uncover advanced techniques for table creation. Approximately 30% of users are already utilizing advanced DAX functions, significantly enhancing their data manipulation capabilities and addressing common challenges such as data inconsistencies.
- Utilize RPA for Efficiency: Consider how Robotic Process Automation (RPA) can streamline your workflow alongside BI. By automating repetitive tasks, RPA solutions like EMMA RPA can alleviate task repetition fatigue, allowing your team to focus on more strategic, value-adding work.
- Join BI Communities: Actively participate in BI communities to share insights and learn from others’ experiences. As Henry from Community Support noted, “Here is a solution on how to connect Twitter, Facebook, and YouTube using BI, hope to assist you.” Engaging with peers can provide valuable perspectives on overcoming challenges and implementing effective solutions, particularly in the context of time-consuming report creation.
- Stay Informed: Regularly check for new features and updates in BI. Continuous learning is crucial in this rapidly evolving field, and staying informed about the latest enhancements will enable you to leverage the full potential of the tool, ensuring effective use of BI for strategic decision-making.
Additionally, consider the case study titled “Business Intelligence for Insights,” which underscores the importance of extracting valuable insights from unprocessed information for informed decision-making. Understanding how to handle information efficiently in BI can transform your analytical methods and operational effectiveness.
By following these steps, you can effectively create new tables in Power BI from existing tables, enabling you to convert raw information into actionable insights that drive informed decision-making. Remember, the journey of mastering Power BI is ongoing, and each step you take contributes to your growth in this data-rich environment. Also, be aware that usage metrics reports are not supported for My Workspace and do not capture usage for embedded dashboards, which is vital for understanding data access and management.
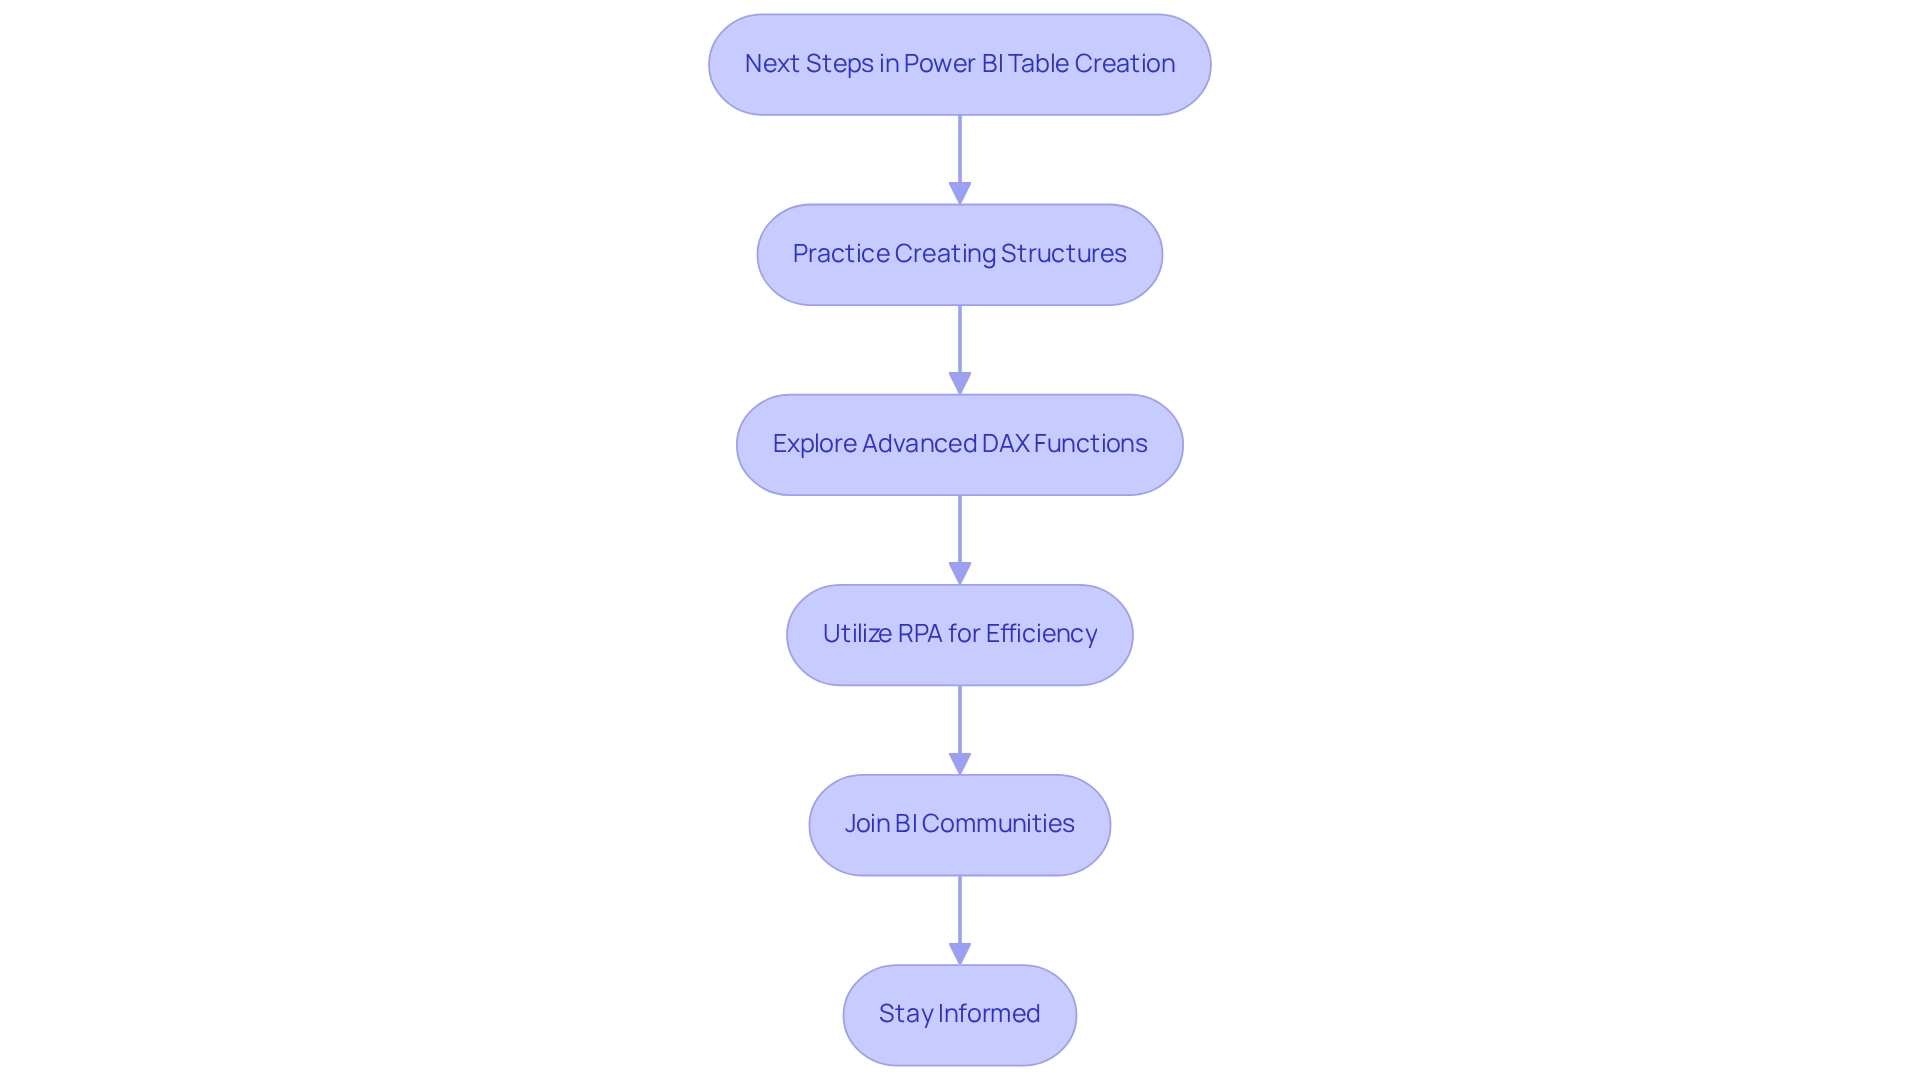
Conclusion
Mastering table creation and management in Power BI is essential for organizations aiming to harness their data’s power. This article has explored various methods for creating tables, including manual entry, DAX formulas, and Power Query transformations. Each method presents unique advantages, catering to different use cases and enhancing operational efficiency.
The significance of well-structured tables cannot be overstated. By employing best practices—such as using descriptive names, limiting unnecessary columns, and establishing clear relationships between tables—users can improve data quality and facilitate better decision-making. Additionally, addressing common challenges like error messages and data type mismatches ensures a smoother workflow and enhances overall performance.
Ultimately, effectively managing tables in Power BI transforms raw data into actionable insights, driving informed decision-making and operational efficiency. As organizations navigate the complexities of data analytics, implementing robust table structures and leveraging advanced techniques will be crucial for sustaining growth and innovation. Engaging in continuous learning and utilizing available resources, including community support and automation solutions, will empower users to unlock the full potential of Power BI and navigate the data-driven landscape with confidence.
Frequently Asked Questions
What role do grids play in Power BI?
Grids in Power BI are essential components for organizing information, presenting it in a structured format of rows and columns. They encapsulate distinct datasets, such as sales transactions or customer profiles, which are vital for effective analysis and visualization.
How significant are charts in Business Intelligence (BI)?
Charts are recognized as critical components in the analytical processes of approximately 80% of companies utilizing BI for data visualization, underscoring their importance in effective data analysis.
What methods does Power BI provide for creating new tables?
Power BI offers several methods for creating new tables, including: 1. Enter Information: Manual entry of data directly into Power BI. 2. DAX Table Constructor: Using DAX formulas to create dynamic tables. 3. Query: Converting and loading information from various sources, merging or appending datasets. 4. Calculated Tables: Using DAX expressions that reference other tables to summarize or aggregate information.
Why is it important to design tables that are understandable on their own?
Designing tables to be understandable without reference to text fosters clarity and facilitates better decision-making, as emphasized by David J. Slutsky, Assistant Professor at Harbor-UCLA Medical Center.
How can organizations improve information integrity and streamline reporting processes?
Organizations can improve information integrity and streamline reporting processes by implementing robust framework structures and utilizing tools like the General Management App provided by Creatum, which addresses consistency and governance challenges.
What benefits do organizations report from establishing strong frameworks in BI?
Organizations that establish strong frameworks report substantial improvements in information integrity and analytical efficiency, enabling them to create intricate models for thorough analysis and trend uncovering.
How do tools like heat maps enhance data visualization in Power BI?
Tools such as heat maps enhance the visualization of trends and associations, simplifying the interpretation of complex datasets and aiding in better data analysis.
What impact did the 3-Day Power BI Sprint from Creatum have on PALFINGER Tail Lifts GmbH?
The 3-Day Power BI Sprint provided by Creatum delivered an immediately usable Power BI report and significantly expedited their Power BI development, highlighting the efficiency of proper information management in BI.
What is the significance of employing DAX in Power BI?
DAX enhances flexibility and allows for complex calculations and aggregations, making it a preferred choice among industry leaders for creating dynamic tables and improving operational efficiency.
What recent statistics indicate about the adoption of DAX for table creation?
Recent statistics show an increase in the adoption of DAX for table creation, reflecting its benefits in constructing intricate models and enhancing user experience, contributing to organizational growth and innovation.
Overview
The article “How to Communicate Data Effectively: A Step-by-Step Guide” captures attention by outlining essential strategies and techniques for effective data communication. It builds interest by emphasizing the mastery of key components of data transmission—sender, message, medium, and receiver. By utilizing appropriate tools and storytelling techniques, organizations can enhance clarity and engagement. This ultimately generates desire for improved decision-making and operational efficiency. In conclusion, implementing these strategies is crucial for any organization aiming to excel in data communication.
Introduction
In an era where data reigns supreme, the ability to communicate insights effectively is critical. Organizations increasingly recognize that successful data communication transcends mere transmission; it requires crafting narratives that resonate with diverse audiences, leveraging appropriate tools, and employing best practices to ensure clarity and engagement.
Understanding the fundamental components of data communication and mastering advanced visualization techniques present opportunities to enhance decision-making and foster collaboration. As businesses navigate the complexities of the digital landscape, tailoring messages, avoiding common pitfalls, and committing to continuous improvement in communication skills become paramount.
This article delves into the essentials of effective data communication, exploring strategies and tools that empower organizations to transform raw data into actionable insights, ultimately driving growth and innovation.
Understanding the Basics of Data Communication
Data transmission involves the transfer of information between devices or systems, a fundamental process for effective communication. It comprises several key components: the sender, the message, the medium, and the receiver. Each element is vital in ensuring seamless interaction. The sender initiates the process by transmitting a message through a selected medium—be it wired connections, wireless signals, or other technologies—to the receiver, who then interprets the information.
Understanding these components is essential for mastering information exchange across diverse contexts, from formal reports to dynamic presentations. Recent statistics reveal that 98% of organizations now report privacy metrics to their board of directors, underscoring a heightened focus on information integrity and security in communication practices. Additionally, a significant 70% of business experts have noted considerable benefits from privacy initiatives, which not only reduce sales delays but also enhance operational efficiency and foster innovation.
This case study illustrates that effective privacy management cultivates customer trust and aligns with organizational objectives.
In the rapidly evolving AI landscape, employing Robotic Process Automation (RPA) from Creatum GmbH can significantly streamline manual workflows, thereby boosting operational efficiency. By automating repetitive tasks, organizations can reallocate valuable resources toward more strategic initiatives. Moreover, tailored AI solutions, including Small Language Models for effective information analysis and GenAI Workshops for practical training, can help navigate the complexities of management, addressing challenges such as quality deficiencies and governance issues.
This approach is crucial for generating insights based on information and enhancing decision-making capabilities.
Expert opinions emphasize the importance of these fundamentals; effective information exchange transcends mere detail conveyance, ensuring that the message is accurately received and understood. As Pew highlights, 63% of Americans confess to knowing very little, if anything, about the laws and regulations currently in place to protect their privacy. This underscores the necessity for organizations to communicate not only information but also the context and regulations surrounding it.
As technology advances, staying abreast of current trends in information-sharing methods becomes increasingly critical. The emergence of automated systems and artificial intelligence is reshaping how information is communicated, making it imperative for organizations to adapt and refine their strategies. Workshops focused on Generative AI (GenAI) can provide practical training, equipping teams with the skills necessary to leverage these technologies effectively.
In conclusion, a robust understanding of the dynamics between sender, message, medium, and receiver is vital for effective information exchange. This comprehension not only facilitates clearer communication but also supports the broader objectives of operational efficiency and strategic decision-making, ultimately driving business growth.
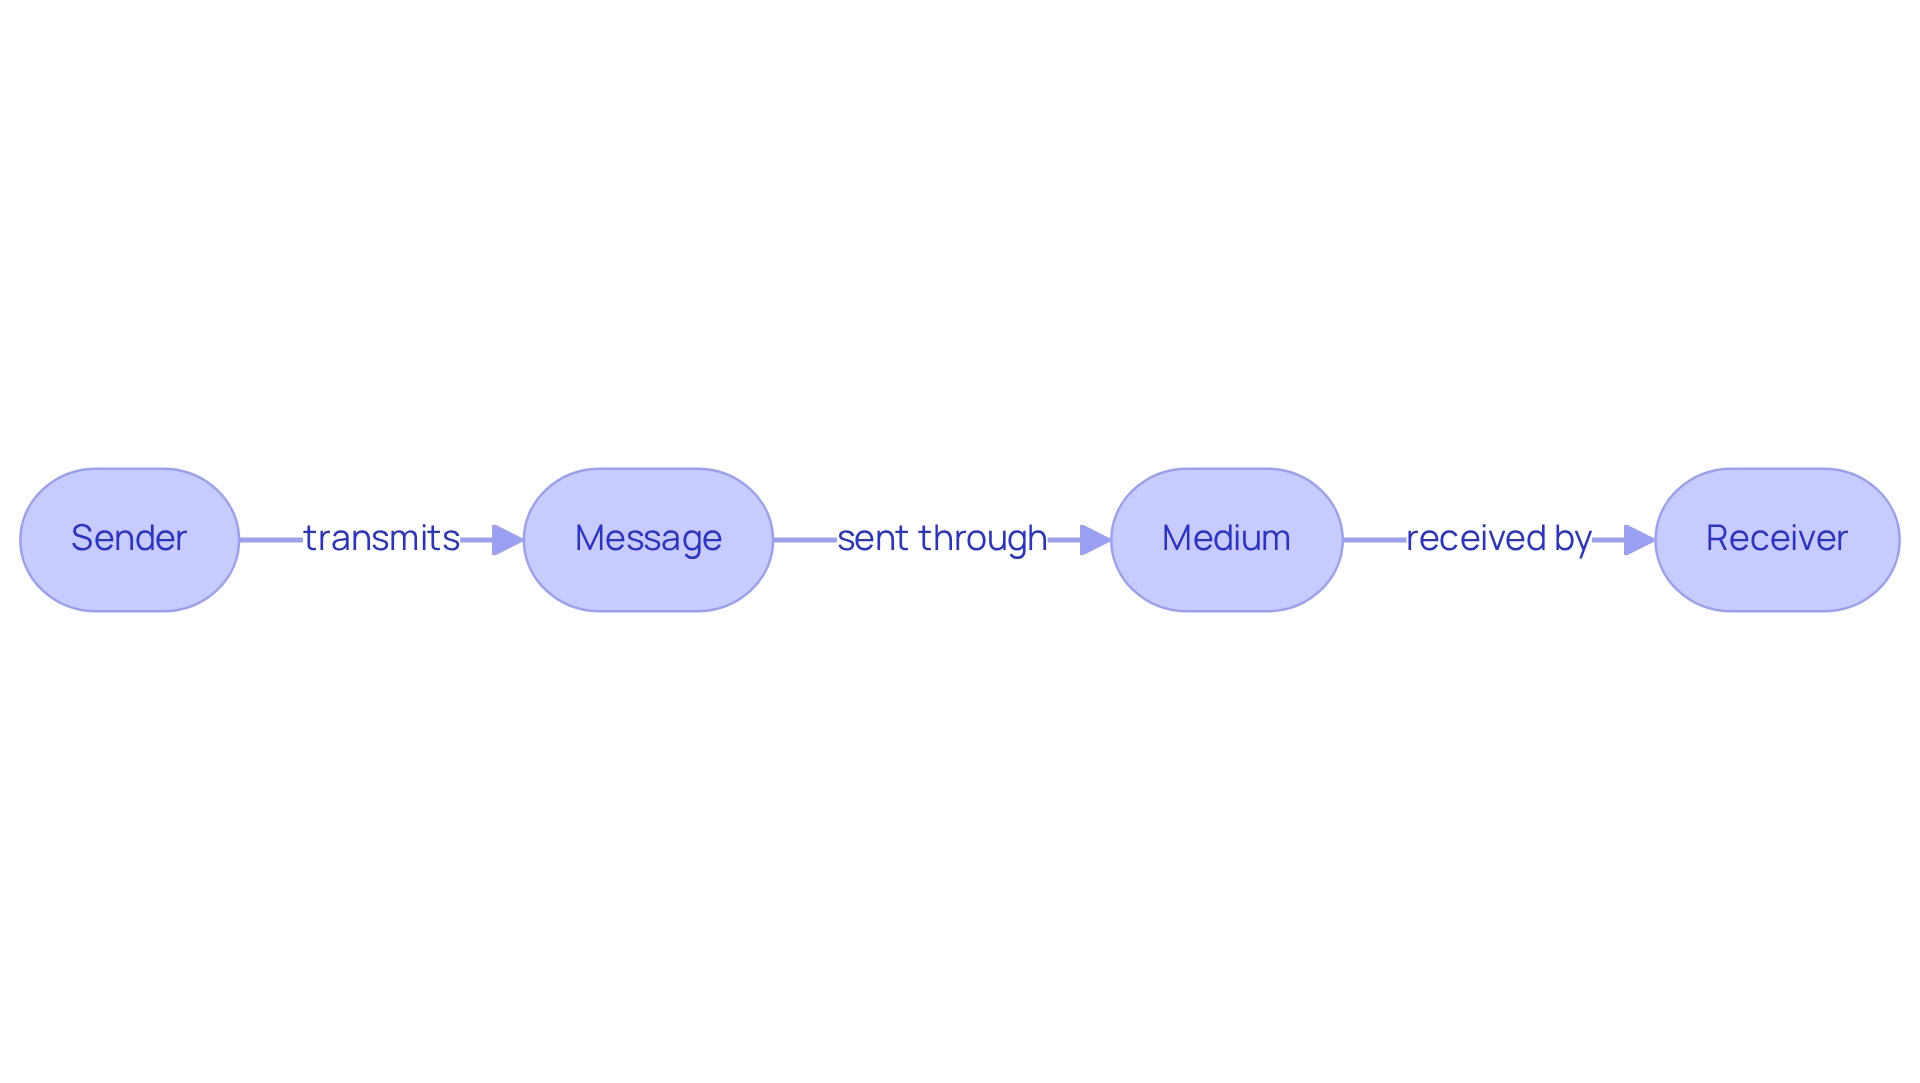
The Importance of Effective Data Communication
Effective information exchange is essential for organizations, guaranteeing that insights obtained from information can communicate data clearly and convincingly. When information is communicated effectively, it enhances understanding, facilitates informed decision-making, and fosters collaboration among stakeholders. In contrast, inadequate information exchange can lead to misunderstandings and misinterpretations, ultimately resulting in detrimental business decisions.
For instance, a case study on ensuring information security and privacy highlights how organizations that implemented robust security measures not only protected customer rights but also maintained transparency in information usage. This approach improves trust and decision-making processes.
In today’s rapidly evolving AI landscape, navigating the overwhelming options can be daunting. However, entities that emphasize efficient information exchange and utilize customized AI solutions can convert raw information into practical insights. This capability is crucial for driving growth and innovation.
Statistics show that organizations prioritizing efficient information exchange experience substantial enhancements in collaboration, with studies indicating a 25% rise in team productivity. This underscores the significance of mastering the craft of information exchange to communicate data effectively for anyone aiming to leverage insights for strategic benefit. Thought leaders, such as Randy Bean, CEO and managing partner of NewVantage Partners, stress that “large information sets are already being utilized to enhance operational efficiency,” reinforcing the need for clear interaction channels.
Furthermore, the transformative effect of Creatum’s Power BI Sprint is evident in client testimonials. For example, Sascha Rudloff, Team Leader of IT and Process Management at PALFINGER Tail Lifts GMBH, remarked on a notable increase in their Power BI development and an enhancement to their analysis strategy. As the information landscape continues to change, organizations must embrace successful interaction strategies to effectively communicate data, manage complexities, and promote informed decision-making. By prioritizing effective information exchange and leveraging Business Intelligence, organizations can unlock the full potential of their insights, ultimately leading to enhanced outcomes and sustained growth.
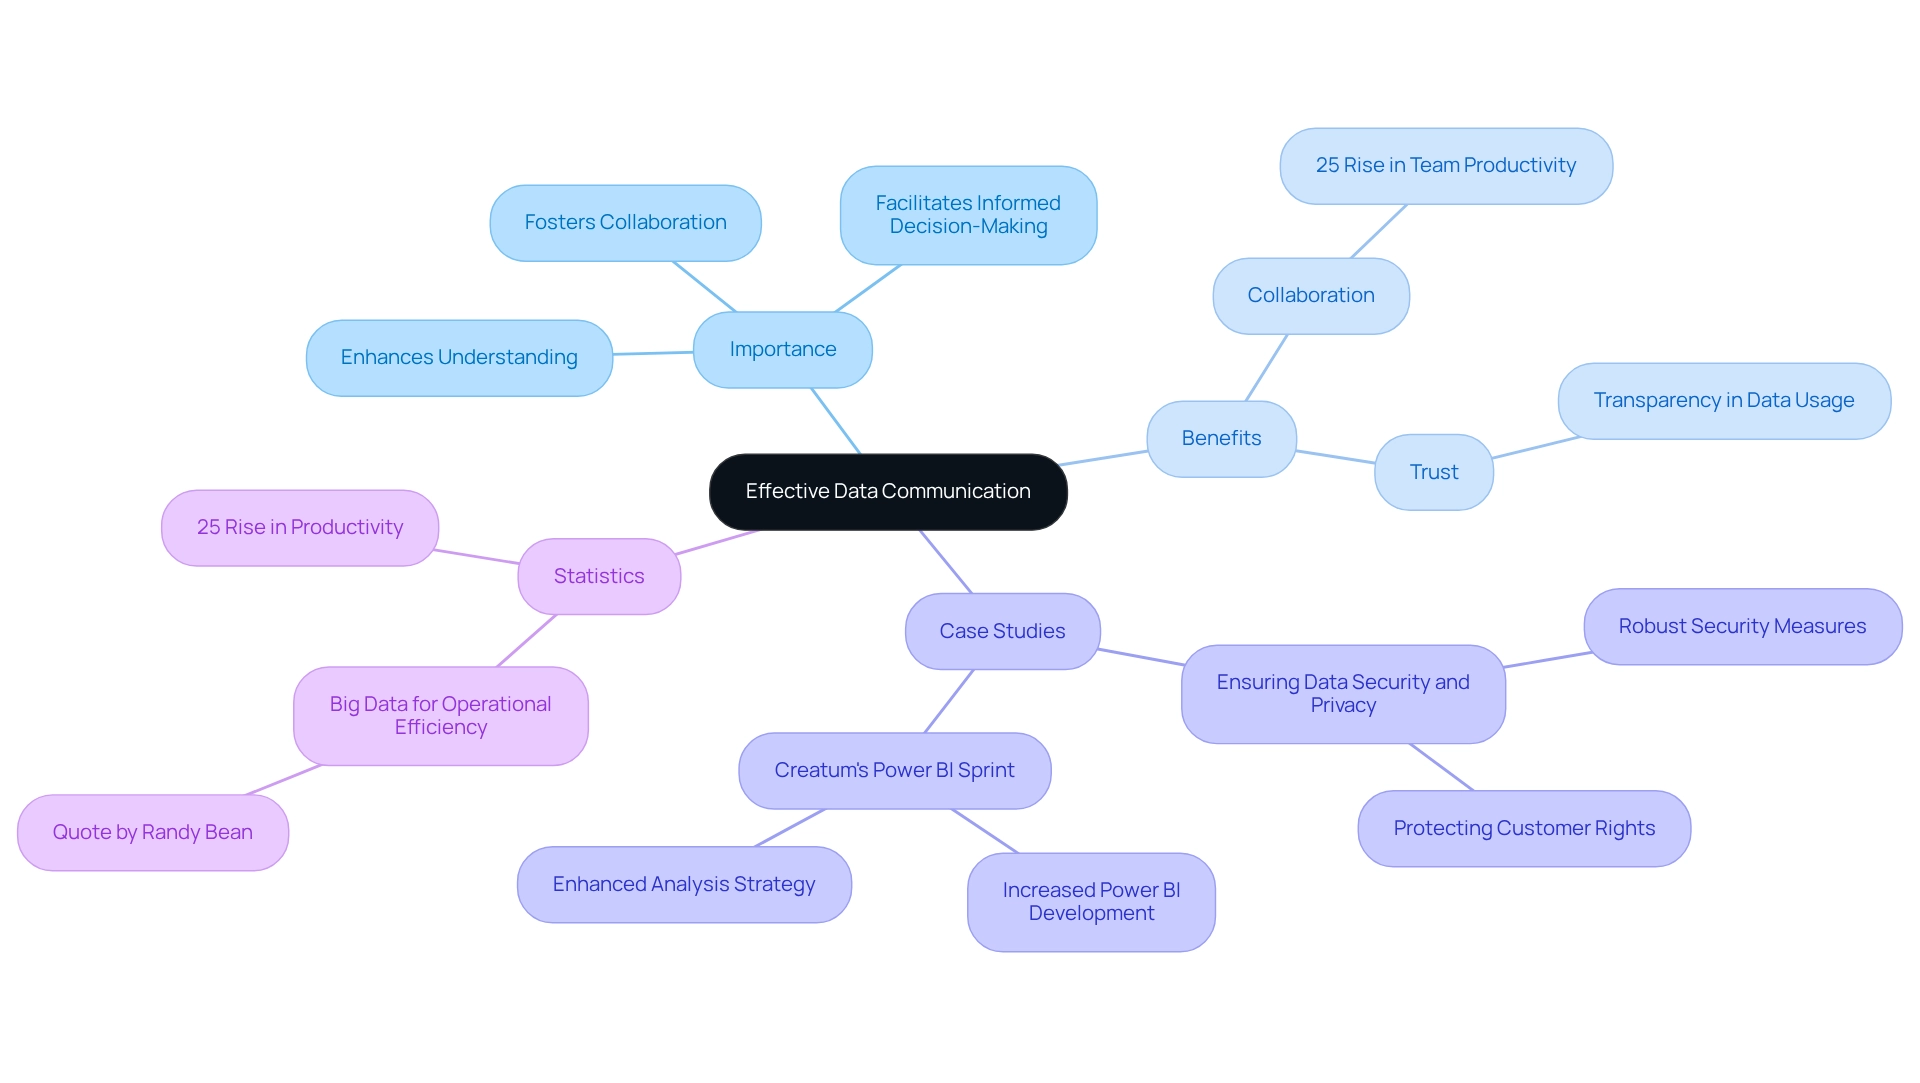
Tools and Techniques for Communicating Data
Efficient information communication hinges on a variety of tools and methods designed to enhance clarity and engagement, ultimately facilitating effective data communication. Among the most prominent visualization tools are:
- Tableau
- Microsoft Power BI
- Google Charts
Each offering unique features that contribute to the creation of interactive and visually compelling presentations. Notably, Microsoft Power BI distinguishes itself as an Editors’ Choice platform, celebrated for its user-friendly interface and extensive source connectors that streamline the preparation process.
Its capabilities are further augmented by services like the 3-Day Power BI Sprint, which enables organizations to swiftly generate professionally designed reports, and the General Management App, which supports comprehensive management and insightful reviews.
To maximize the impact of information presentations, employing techniques such as:
- Infographics
- Dashboards
- Clear charts
is essential. These strategies not only enhance visual appeal but also bolster the audience’s comprehension of the information. Moreover, integrating storytelling methods can provide context, rendering the information more relatable and engaging.
By weaving narratives around the information, presenters can spotlight key insights and underscore the significance of the details being shared.
When leveraging tools like Power BI, adherence to best practices is paramount. For instance, ensuring that visualizations are not overly complex and concentrate on key metrics can significantly enhance audience retention and understanding. Furthermore, utilizing the latest features of Power BI, including its desktop and web versions for information preparation, can elevate the overall efficiency of information exchange.
In contrast, tools such as Chartio, while boasting an impressive processing engine and robust SQL query optimization, have faced criticism for their poorly designed user interface and steep learning curve, which may hinder user adoption.
Additionally, harnessing AI through Small Language Models and participating in GenAI Workshops can improve information quality and training, enabling organizations to implement AI effectively in their operations. The significance of Business Intelligence and RPA, such as EMMA RPA and Power Automate, cannot be overstated in fostering data-driven insights and operational efficiency for business growth. These tools aid in automating repetitive tasks, enhancing efficiency, and providing a risk-free ROI evaluation, ultimately allowing teams to focus on strategic initiatives.
In summary, the right combination of tools and methods is vital for effective data communication. By selecting appropriate visualization tools like Power BI and applying best practices, alongside leveraging AI and RPA solutions, organizations can transform raw information into actionable insights, thereby enhancing informed decision-making and operational efficiency.
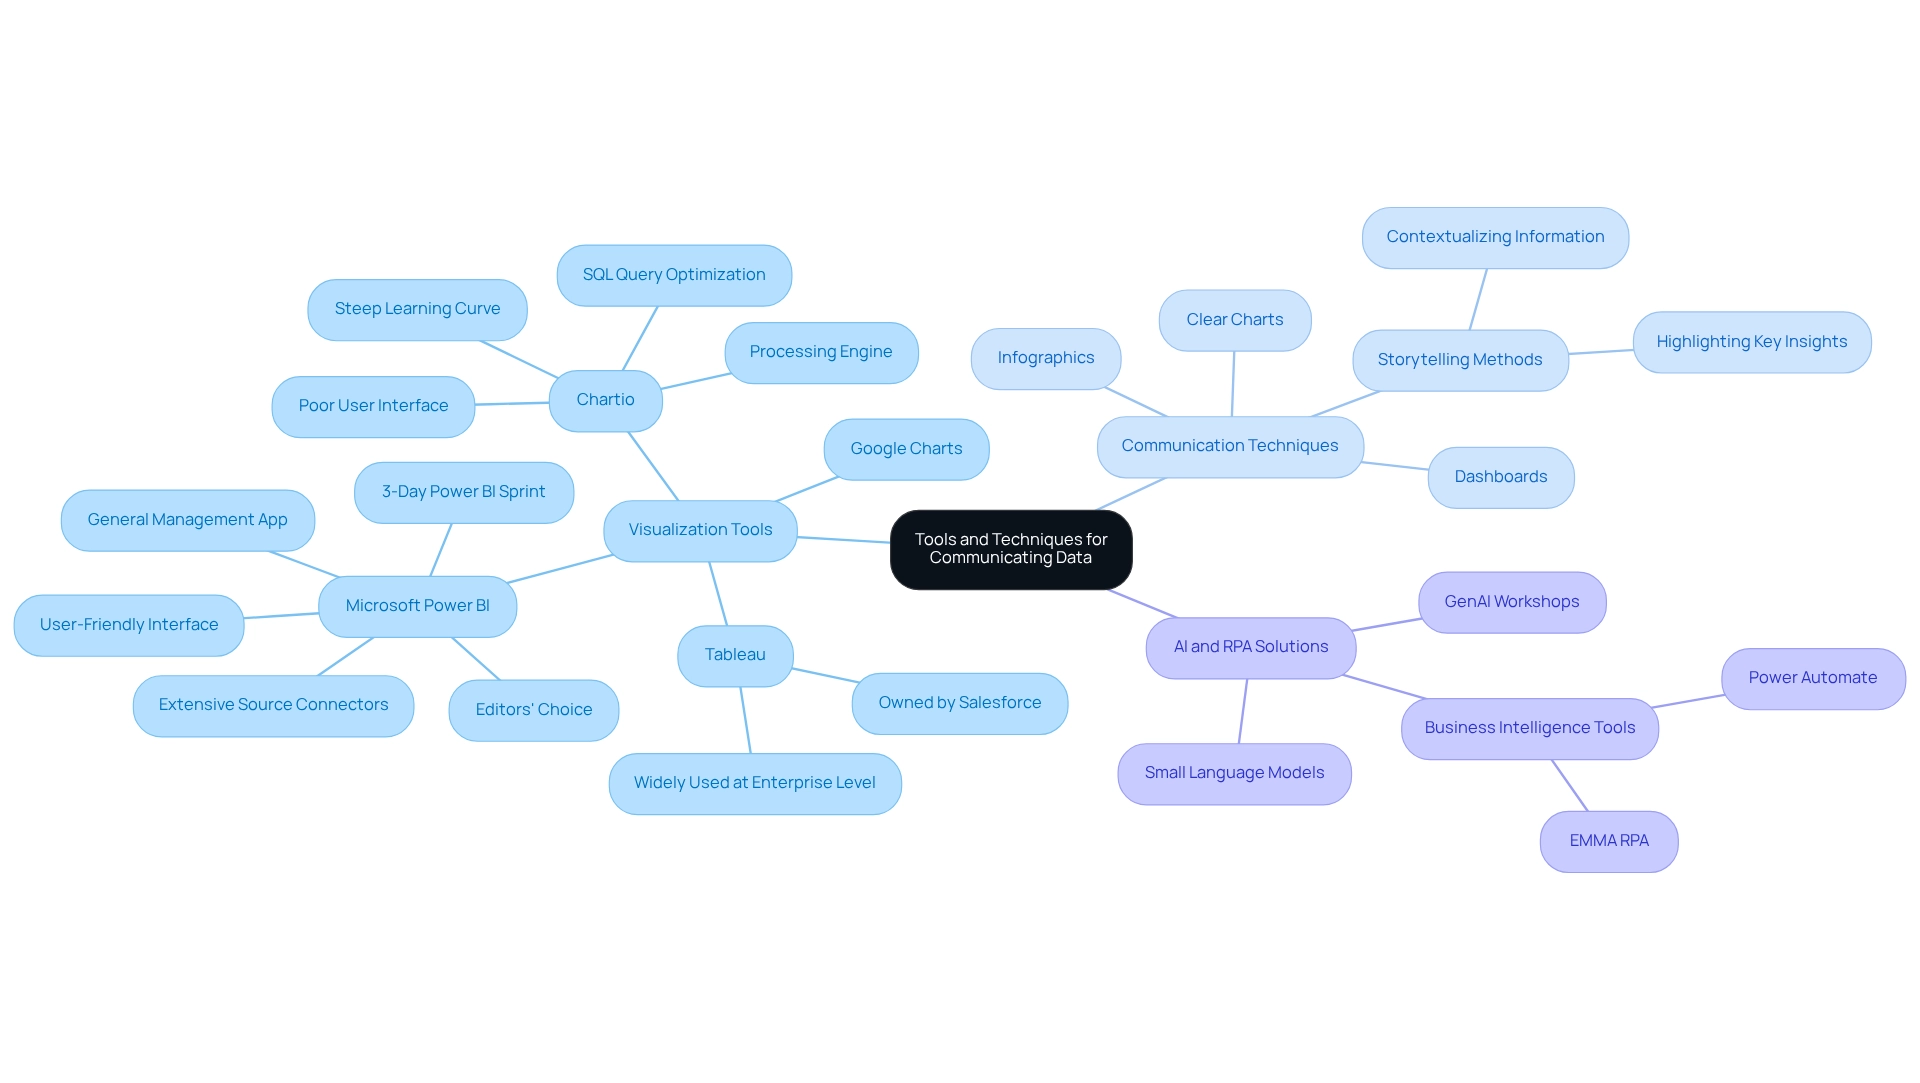
The Power of Storytelling in Data Communication
Storytelling serves as a transformative tool to communicate data in the field of information communication. By incorporating information within a narrative structure, presenters can create a captivating context that resonates deeply with their audience. This approach not only makes the information more relatable but also highlights essential insights and trends.
For instance, instead of merely showcasing statistics, a talented storyteller might demonstrate how those figures impact real people or lead to important business results. This narrative technique fosters emotional connections, significantly enhancing the audience’s ability to communicate data and understand the information presented.
The advantages of narrative in information exchange are significant. Research indicates that campaigns incorporating storytelling elements can increase engagement and funding, with video narratives receiving 114% more support than those without. This statistic emphasizes how storytelling can improve the effectiveness of information communication to better communicate data and make it more engaging.
Furthermore, a study reveals that pairing a story with a product can elevate its perceived value by an astonishing 2,706%. Such statistics highlight the effectiveness of storytelling in transforming information into a compelling narrative that captivates and informs.
Expert opinions consistently emphasize the importance of storytelling in improving information presentations. As noted by GO-Globe, “Storytelling holds real power. It helps build a genuine connection with your listeners, which is exactly what brands need to stand out, as data storytellers assert that narratives not only clarify complex information but also communicate data to foster closer relationships with stakeholders by ensuring a shared understanding of marketing results.”
For example, the transformative effect of Creatum GmbH’s Power BI Sprint service illustrates how impactful narrative presentation can enhance engagement and visibility, enabling businesses to connect with their clients on a deeper level.
To develop a compelling narrative using information, one must concentrate on constructing a tale that resonates with the listeners’ interests and requirements. Effective information storytelling involves choosing pertinent information points, contextualizing them within a relatable framework, and illustrating their implications through real-world examples. By taking this approach, companies can greatly enhance viewer interaction and promote informed decision-making, ultimately turning unrefined information into practical insights.
The success of Creatum’s Power BI Sprint, as emphasized by client feedback, demonstrates how such services can speed up information analysis and reporting, further improving operational efficiency and business growth. Creatum GmbH’s commitment to collaboration and creativity ensures that these solutions are tailored to meet the unique needs of the Director of Operations Efficiency, driving meaningful change in their organizations.
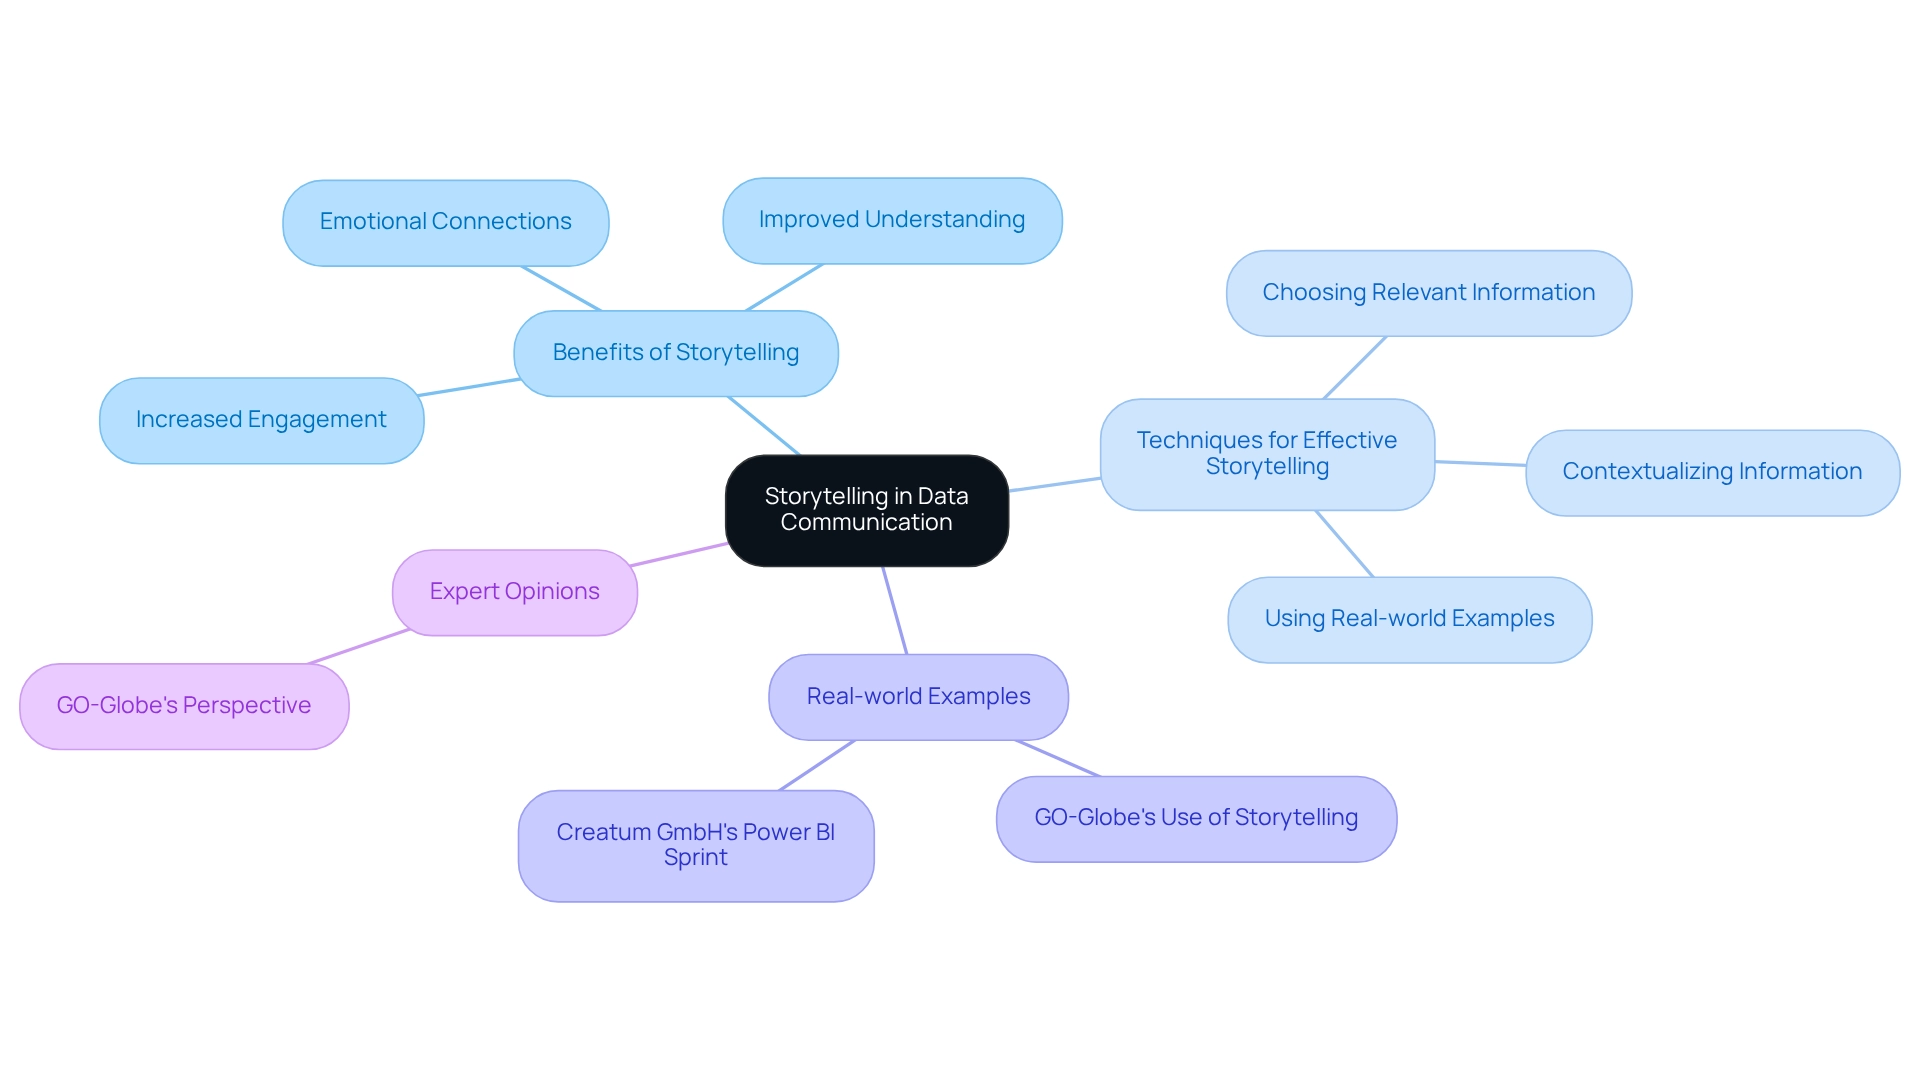
Tailoring Your Message for Different Audiences
Adapting your message for various groups is crucial for successful information exchange, particularly in the context of utilizing Robotic Process Automation (RPA) to improve operational efficiency. A profound comprehension of your viewers’ background, interests, and expertise allows you to present information in a way that connects with them. For instance, when addressing technical teams, exploring detailed analytics and in-depth metrics related to RPA implementations can reduce errors and free up teams for more strategic work.
Conversely, when engaging with executive stakeholders, a brief summary that emphasizes crucial insights and the transformative effect of RPA on business processes is frequently more effective.
Statistics indicate that 56% of customers feel frustration when asked to restate their information to various representatives, highlighting the significance of tailored interaction. This frustration can be alleviated by ensuring that information presentations are customized to the needs and expectations of the viewers, especially in a swiftly changing AI environment where it is vital to communicate data efficiently for operational success.
Strategies for personalizing information presentations include using language and examples that align with the viewers’ context. Technical groups may value jargon and particular information, while executive groups may favor more general trends and implications. Client testimonials from leaders like Herr Malte-Nils Hunold of NSB GROUP and Herr Sebastian Rusdorf of Hellmann Marine Solutions highlight how Creatum GmbH’s technology solutions have significantly enhanced operational efficiency and driven business growth through tailored RPA strategies and AI solutions that align with specific business goals.
A notable case study is Coca-Cola’s ‘Share a Coke’ campaign, which personalized product labels with popular names, creating a personal connection with consumers. This approach not only enhanced customer engagement but also significantly boosted sales and social media interaction, demonstrating the power of tailored messaging. This case illustrates how impactful information exchange can result in operational success by nurturing stronger relationships with customers.
Expert insights indicate that grasping the backgrounds of the listeners is essential in information sharing. By analyzing factors such as campaign source and customer behavior, marketers can personalize content effectively. This customization results in heightened loyalty, as devoted customers are five times more inclined to repurchase, five times more willing to forgive, four times more apt to refer, and seven times more inclined to try a new product or service.
In summary, effective communication strategies must adjust to the recipient’s technical or executive status to effectively communicate data that is pertinent and impactful. By employing these techniques, organizations can enhance engagement and drive better decision-making, ultimately contributing to improved operational efficiency and leveraging the full potential of RPA and business intelligence.
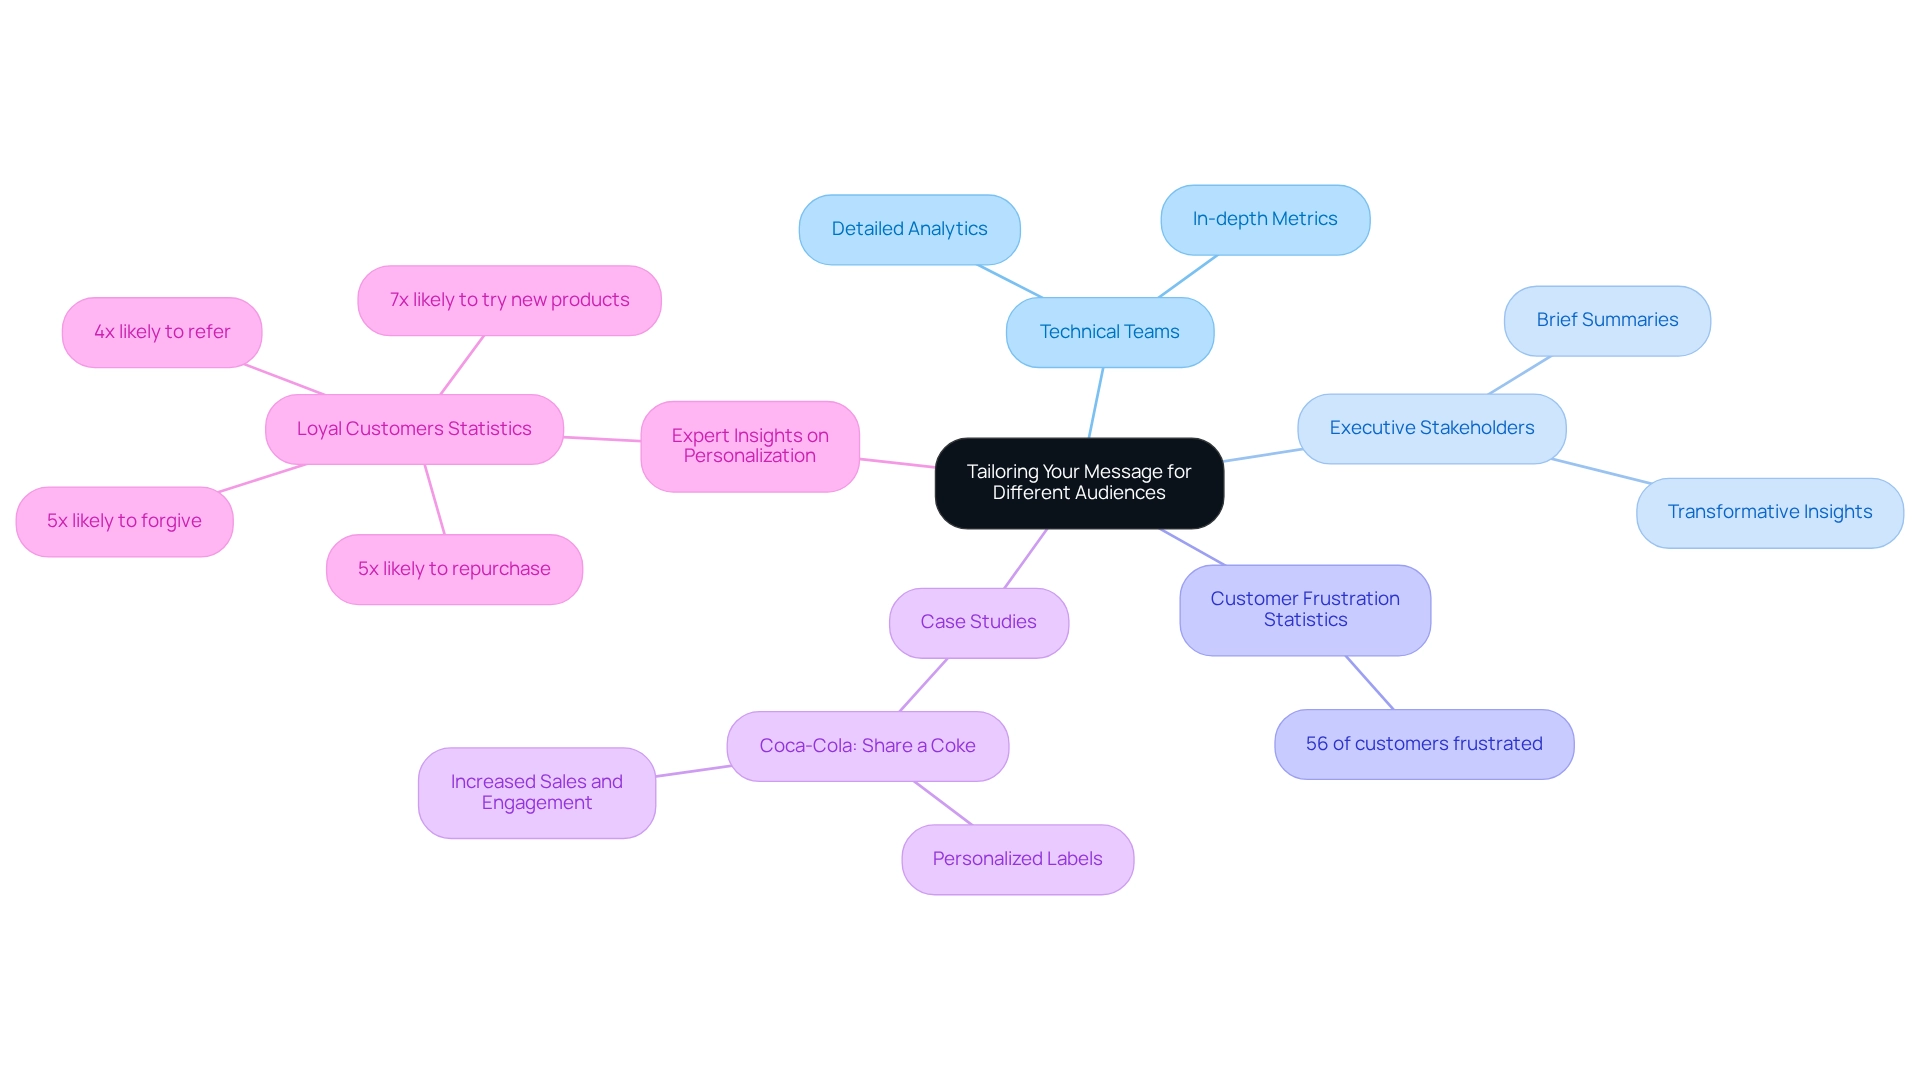
Effective Data Visualization Techniques
Effective information visualization techniques are essential for enhancing the clarity and impact of presentations. Selecting the right chart types forms a foundational step; for instance, bar charts are ideal for comparisons, while line graphs effectively illustrate trends over time. Thoughtful use of color can highlight key insights, yet it is crucial to avoid cluttered visuals that may confuse viewers.
Integrating interactive components into visual representations significantly enhances audience involvement, allowing viewers to examine information more meaningfully. This interactivity not only promotes exploration but also aids in directing the viewer’s comprehension of the displayed information. Best practices in information visualization emphasize the importance of accessibility.
For example, Smashing Magazine suggests that ’16 pixels should generally be the minimum size for body copy in modern web design,’ a crucial guideline for ensuring readability. Initiatives like LinkedIn Learning’s courses on accessibility in information visualization empower individuals to create inclusive visuals that cater to diverse audiences. This approach ensures that information is not only informative but also accessible to everyone.
Moreover, expert recommendations stress that the selection of chart type must align with the foundational question and information type. This reinforces that effective communication of information relies on careful design. As statistician Kaiser Fung illustrates through his annual Pi Day project, where he and his colleague transform poorly designed pie charts into more suitable formats, it serves as a reminder of the importance of clarity in information presentation. Ultimately, the goal of visualization is to simplify complex information to communicate data effectively, making it approachable and engaging for viewers, thus transforming raw content into practical insights.
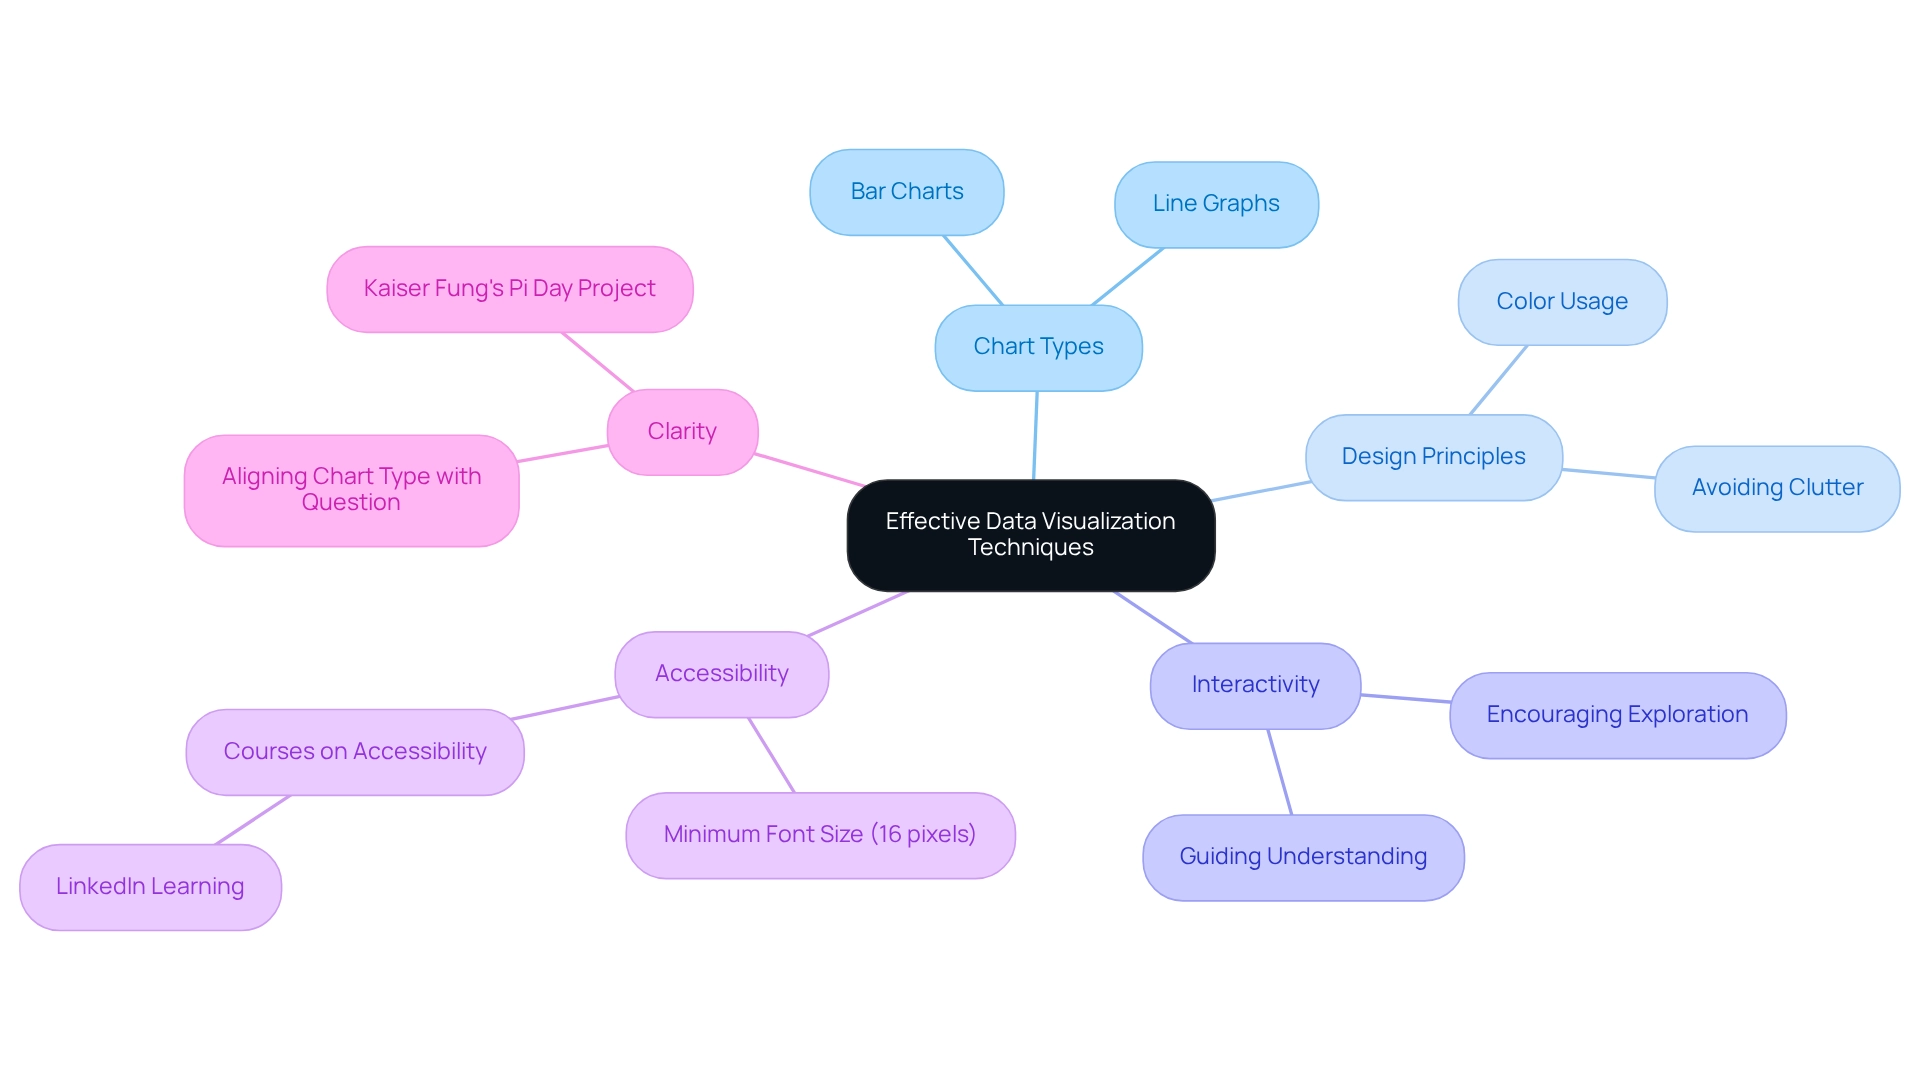
Common Pitfalls in Data Communication and How to Avoid Them
Effectively communicating data is crucial for ensuring insights are understood and actionable. Common pitfalls include overwhelming the audience with excessive information, using jargon that may alienate or confuse, and neglecting to provide necessary context for the information presented. Studies suggest that statistical traps like p-hacking, cherry-picking, and overfitting can occur in various areas, emphasizing the significance of meticulous information presentation to prevent misguided results.
To mitigate these issues, prioritize clarity and simplicity in your presentations:
- Limit the amount of information on each slide or visual to avoid cognitive overload. Information overload can lead to disengagement and misunderstanding, making it essential to distill complex information into digestible formats.
- Use plain language to enhance comprehension. Avoid technical jargon unless it is well understood by your listeners, as this can create barriers to effective communication.
Always clarify the importance of the information. Providing context helps the audience grasp the relevance of the information, enabling them to communicate data effectively and make informed decisions based on the insights shared. As Lisa Schwarz, Senior Director of Global Product Marketing, states, “By gathering and assessing information from various sources, analysts can assist leaders in recognizing patterns, evaluating key performance indicators (KPIs), and making evidence-based forecasts about future trends and outcomes.”
In today’s information-rich environment, utilizing Business Intelligence tools like Power BI can enhance this process, but challenges such as time-consuming report creation and inconsistencies must be addressed. Seeking feedback from peers can also be invaluable. Participating in open dialogue enables the recognition of aspects for enhancement in both expression style and content.
This collaborative method not only improves individual presentations but also nurtures a culture of ongoing enhancement in communication practices. Collaboration among professionals is encouraged to enhance development regarding the use of statistics.
Integrating automated validation checks and setting clear guidelines can further reduce formatting mistakes and ensure that the information presented is precise and trustworthy. The case study titled “Analysis Errors FAQs” emphasizes that successful evaluation requires quality controls and proper governance to avoid common challenges faced by analysts. By tackling these frequent obstacles, organizations can greatly enhance their strategies to communicate data, resulting in improved decision-making and increased operational efficiency through the effective use of Business Intelligence and RPA solutions like EMMA RPA and Power Automate.
To learn more about how Creatum GmbH can assist you, book a free consultation today.
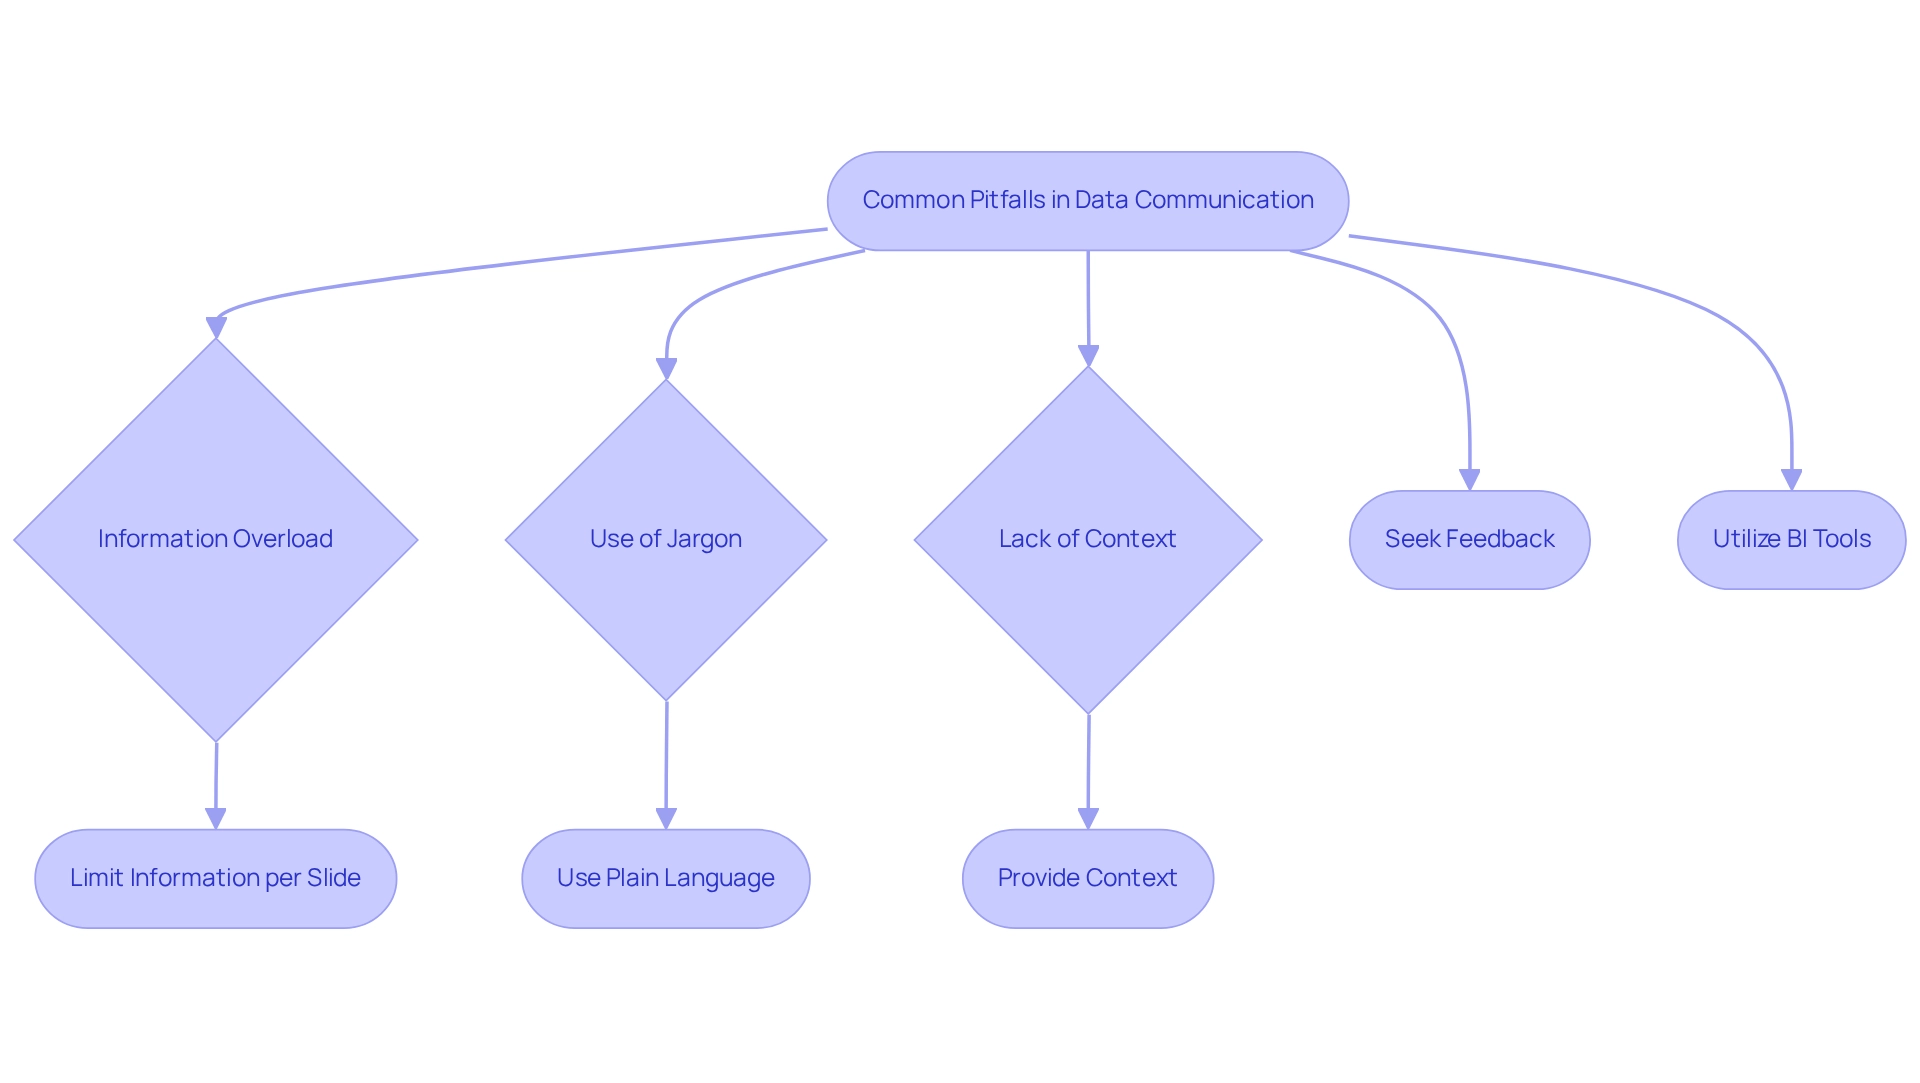
Continuous Improvement in Data Communication Skills
The ongoing enhancement of information exchange abilities is essential for sustaining significance in today’s rapid-paced environment. Regularly soliciting feedback from colleagues and stakeholders illuminates both strengths and areas for development. Engaging in workshops, webinars, and training sessions focused on communicating data and conveying ideas is vital; these opportunities not only improve skills but also foster a culture of learning.
Organizations emphasizing interaction training have reported a remarkable 40% rise in team creativity and innovation, underscoring the importance of effective dialogue. Additionally, with 75% of employees preferring visual aids over text-based communications, integrating visual elements can significantly enhance understanding and engagement.
Another key strategy is to practice your skills by presenting to diverse audiences and reflecting on their responses. This iterative process refines your approach, making you a more effective communicator. Experts in the field emphasize that feedback is vital for development; it offers perspectives that can lead to notable enhancements in how we communicate data.
Furthermore, case studies, such as those from AIrScreen, illustrate how detailed analytics can measure the effectiveness of communication strategies, enabling businesses to communicate data and optimize their methods based on data-driven decisions.
A powerful example is the experience of PALFINGER Tail Lifts GMBH, where the Power BI Sprint from Creatum not only provided an immediately deployable Power BI report and gateway setup but also significantly accelerated their own Power BI development. As Sascha Rudloff, Team Leader of IT and Process Management, observed, “The outcomes of the Sprint surpassed our expectations and served as a vital catalyst for our analytical strategy.” This underscores the significance of utilizing Business Intelligence tools, like those provided by Creatum, to effectively communicate data and convert raw information into actionable insights, ultimately fostering growth and innovation.
By committing to continuous improvement in their ability to communicate data, organizations can enhance operational efficiency and drive innovation.
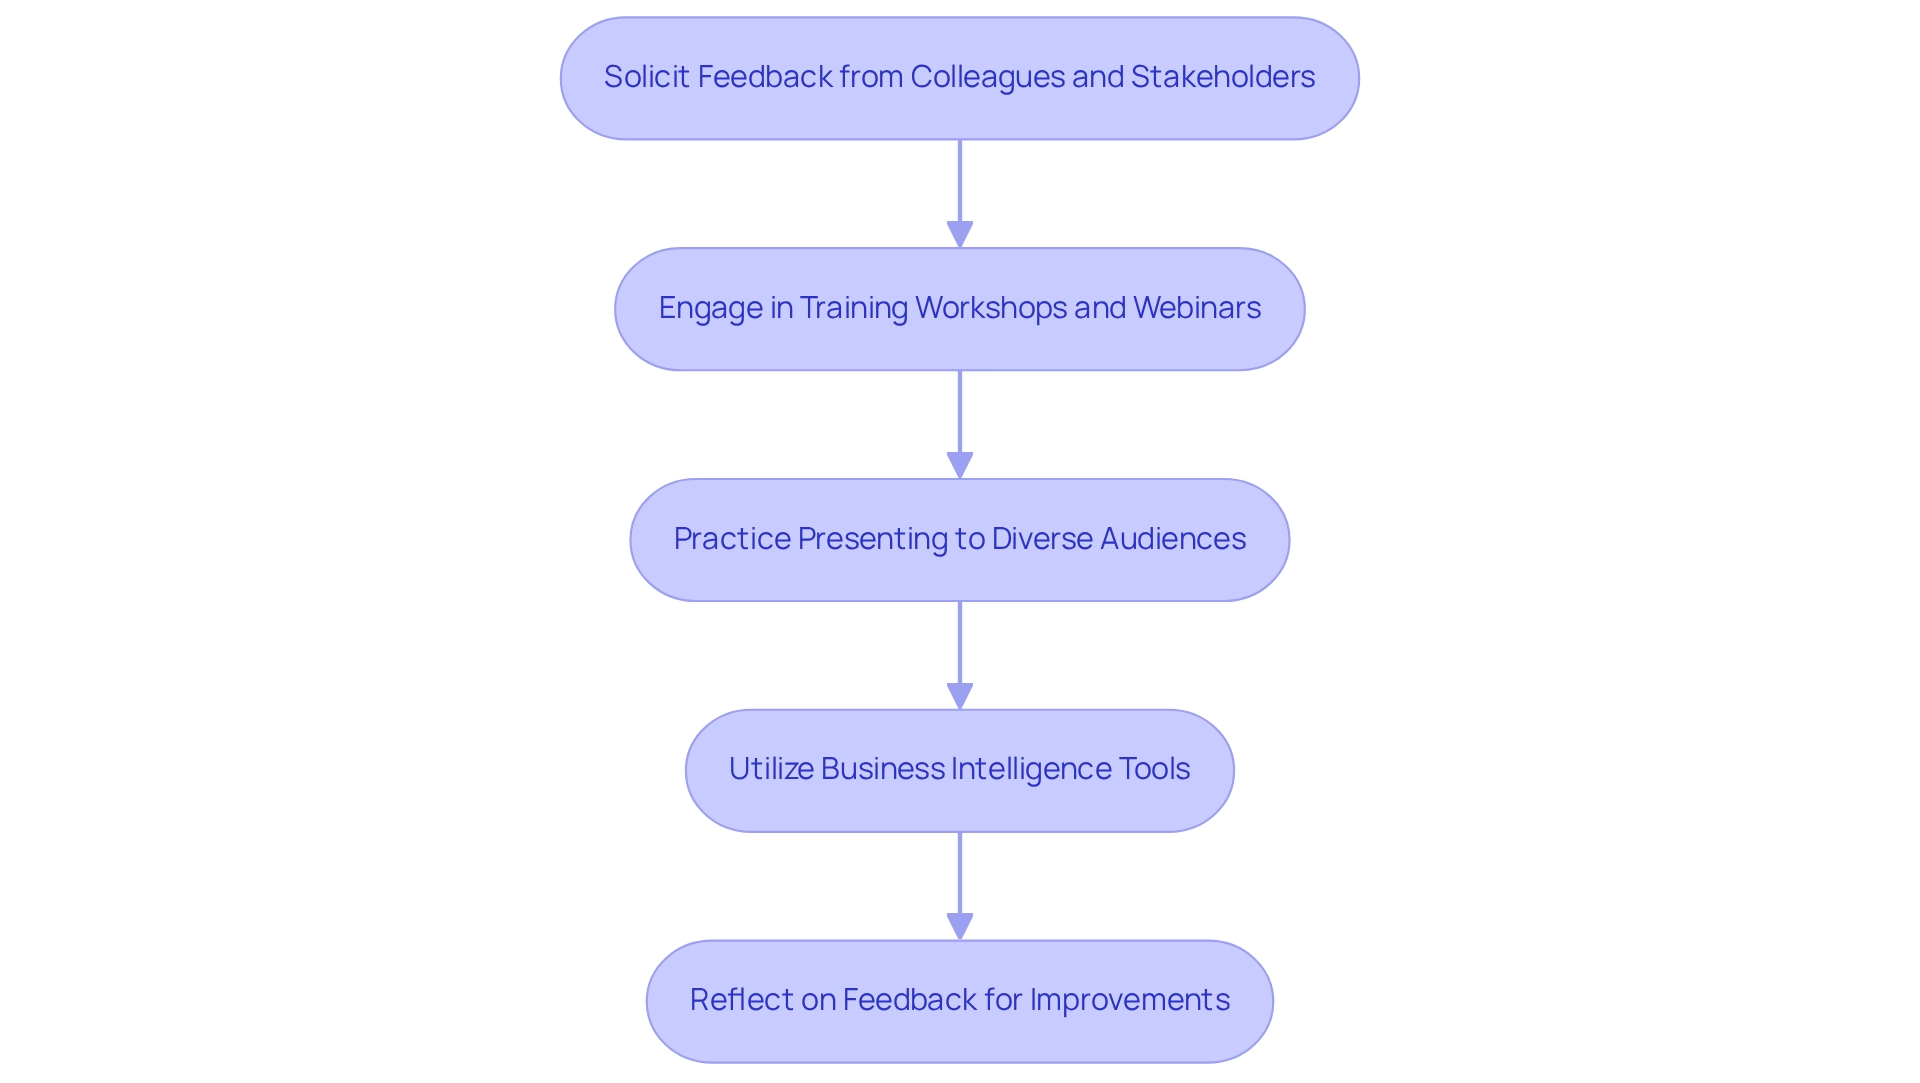
Conclusion
Effective data communication stands as a vital cornerstone for organizations striving to excel in today’s data-driven landscape. By grasping the fundamental components—sender, message, medium, and receiver—businesses can cultivate clearer exchanges and bolster operational efficiency. The integration of advanced tools like Microsoft Power BI, alongside the strategic use of storytelling, not only renders data more relatable but also significantly enhances audience engagement and comprehension.
Moreover, tailoring messages for specific audiences proves crucial. Acknowledging the differing needs of technical teams versus executive stakeholders paves the way for more impactful communication, ultimately steering informed decision-making. Steering clear of common pitfalls such as information overload and jargon is essential for crafting messages that resonate and uphold clarity. This dedication to clarity is further reinforced by implementing best practices in data visualization, transforming complex information into accessible insights.
Continuous improvement in data communication skills is paramount. By engaging in ongoing training and seeking feedback, organizations can refine their techniques and adapt to evolving communication needs. The case studies and statistics presented throughout the article illustrate that organizations prioritizing effective data communication not only enhance collaboration and innovation but also unlock significant growth opportunities.
In conclusion, mastering the art of data communication is not merely beneficial; it is essential for leveraging data as a strategic asset. By fostering a culture of effective communication, organizations can adeptly navigate the complexities of their environments, promote collaboration, and drive sustainable growth in an increasingly competitive landscape.
Frequently Asked Questions
What are the key components of data transmission?
The key components of data transmission are the sender, the message, the medium, and the receiver. Each element is essential for ensuring seamless interaction.
How does the sender initiate the data transmission process?
The sender initiates the process by transmitting a message through a selected medium, which can include wired connections, wireless signals, or other technologies, to the receiver.
Why is understanding data transmission components important?
Understanding these components is crucial for mastering information exchange across various contexts, such as formal reports and dynamic presentations.
What recent statistics highlight the importance of privacy in communication?
Recent statistics indicate that 98% of organizations report privacy metrics to their board of directors, and 70% of business experts note considerable benefits from privacy initiatives, which enhance operational efficiency and innovation.
How does effective privacy management impact customer trust?
Effective privacy management cultivates customer trust and aligns with organizational objectives, contributing to better decision-making and transparency.
What role does Robotic Process Automation (RPA) play in operational efficiency?
Employing RPA can streamline manual workflows, allowing organizations to automate repetitive tasks and reallocate resources toward more strategic initiatives.
How can tailored AI solutions assist organizations?
Tailored AI solutions, such as Small Language Models for information analysis and GenAI Workshops for training, help organizations navigate management challenges and improve decision-making capabilities.
What is the significance of effective information exchange in organizations?
Effective information exchange enhances understanding, facilitates informed decision-making, and fosters collaboration among stakeholders, while inadequate exchange can lead to misunderstandings and poor business decisions.
What impact does prioritizing efficient information exchange have on collaboration?
Organizations that prioritize efficient information exchange experience substantial enhancements in collaboration, with studies indicating a 25% rise in team productivity.
How can organizations leverage Business Intelligence for growth?
By prioritizing effective information exchange and leveraging Business Intelligence, organizations can unlock the full potential of their insights, leading to enhanced outcomes and sustained growth.