Overview
Calculating standard deviation in Power BI is a critical skill for data professionals. Users can efficiently achieve this by employing DAX functions such as STDEV.P and STDEV.S, tailored for population and sample data respectively. This article provides a clear, step-by-step guide that underscores the importance of understanding the data context, ensuring data cleanliness, and implementing effective visualization techniques. By following these guidelines, users can derive accurate insights that inform sound decision-making.
Introduction
In the realm of data analysis, grasping the nuances of standard deviation is crucial for extracting valuable insights from complex datasets. This vital statistical measure not only underscores the variability within data but also functions as an essential tool in risk assessment and predictive modeling. As businesses increasingly depend on data-driven decisions, mastering standard deviation becomes imperative for evaluating performance metrics and identifying trends.
Within the context of Power BI, organizations can leverage the power of standard deviation to enhance reporting capabilities, streamline operations, and propel strategic initiatives. This article explores the significance of standard deviation, provides practical guidance on its calculation using DAX functions, and examines its real-world applications across various sectors. Ultimately, it empowers businesses to navigate the intricacies of data with confidence.
Understanding Standard Deviation: Definition and Importance
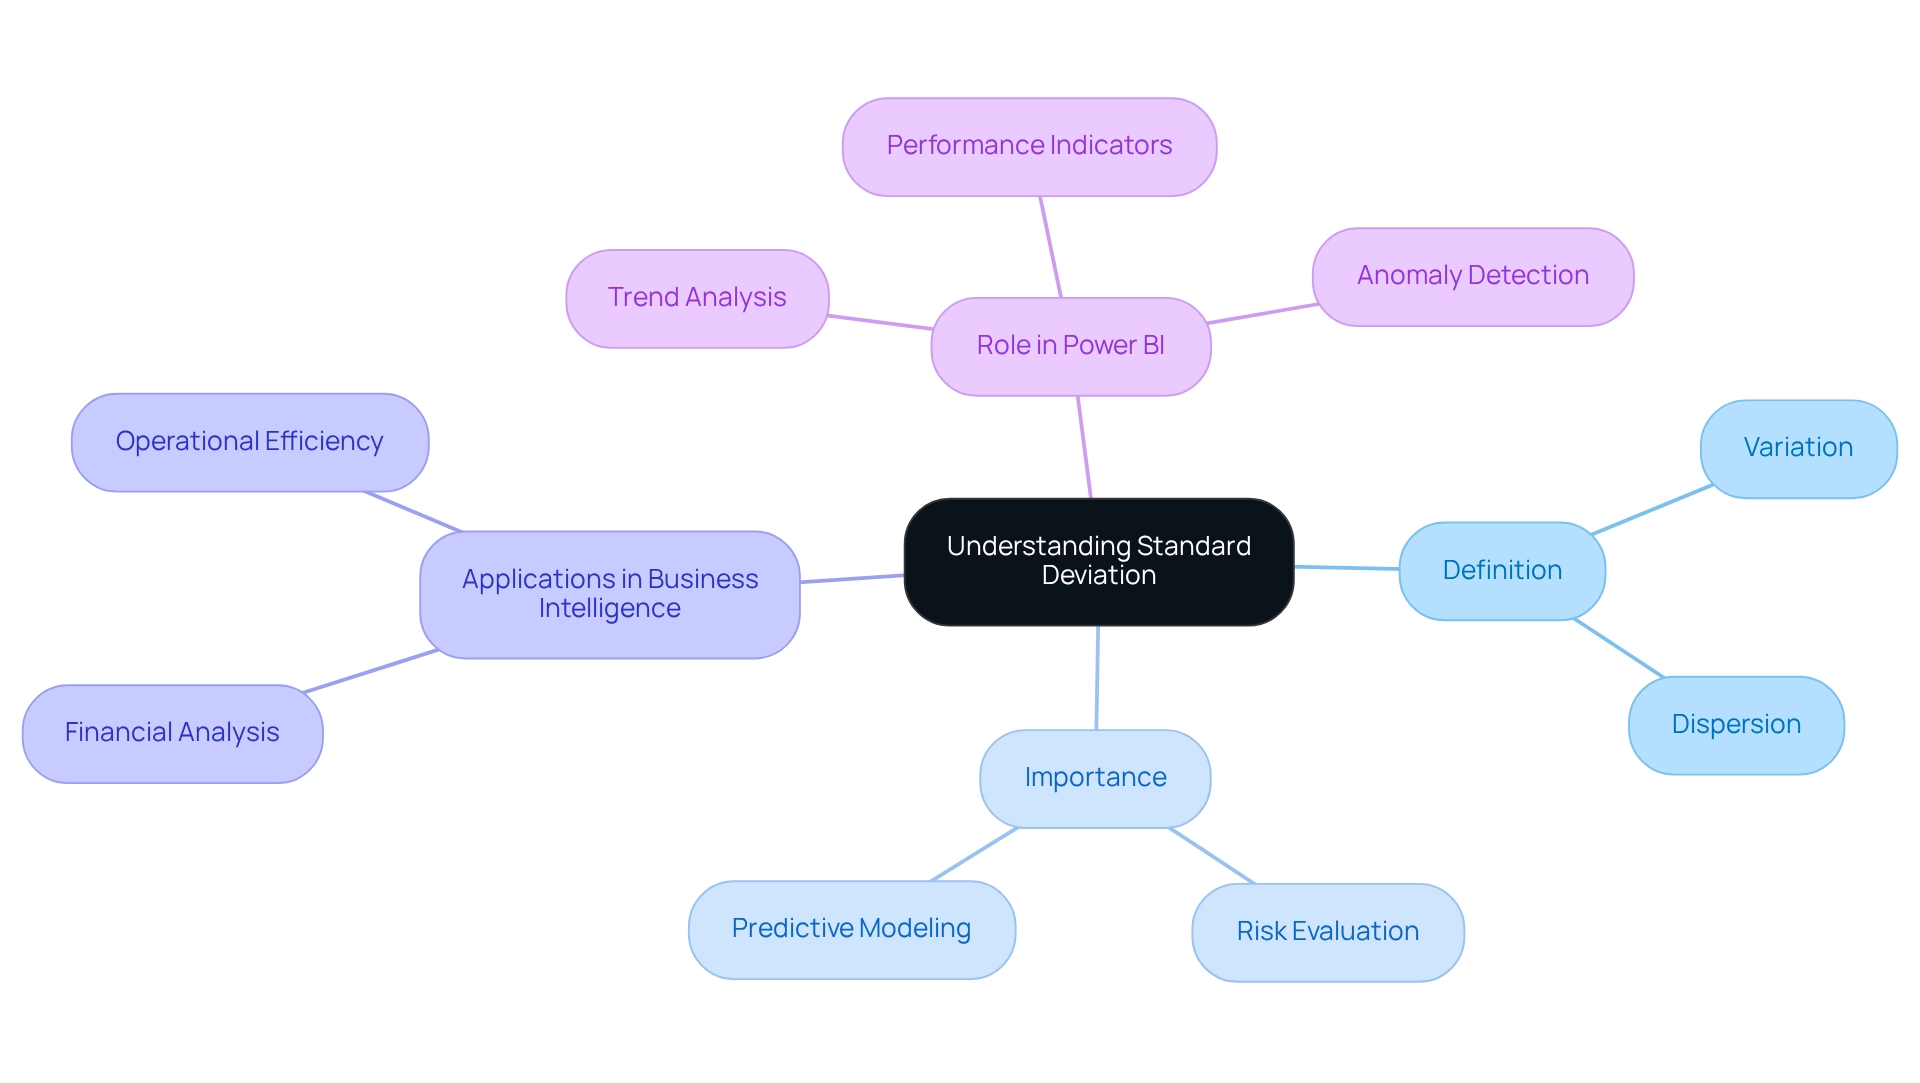
Standard variation is a crucial statistical measure that quantifies the variation or dispersion within a dataset. A small variation in values signifies that the points are grouped closely around the average, indicating consistency. In contrast, a large variation shows a broader range of values, suggesting greater variability. This measure is essential in analysis, as it aids in evaluating the reliability of information and plays a vital role in risk evaluation and predictive modeling based on historical trends.
Moreover, the interquartile range (IQR) signifies the central 50% of values, offering additional context for understanding variability alongside typical variation.
In the domain of Power BI, a strong understanding of standard deviation is crucial for precisely analyzing trends and making informed, analytical decisions. Companies can utilize variation to assess performance indicators, recognize anomalies, and improve forecasting precision. Recent statistics highlight the significance of standard deviation in Power BI analysis, especially in 2025, when organizations increasingly depend on accurate metrics to direct strategic initiatives.
Creatum GmbH’s Power BI services, including the 3-Day Power BI Sprint and the General Management App, enable organizations to enhance their reporting capabilities and obtain actionable insights. This service facilitates the rapid creation of professionally designed reports while addressing data inconsistency and governance challenges, ultimately supporting enhanced decision-making processes.
Professional insights emphasize that grasping standard deviation in Power BI is essential for efficient decision-making in business intelligence. As Alex Dos Diaz points out, “Standard variation calculates all uncertainty as risk, even when it’s in the investor’s favor—such as above-average returns.” This perspective underscores the importance of variation in measuring uncertainty and facilitating better decisions, ultimately fostering growth and innovation.
Practical applications of statistical variation in business decision-making encompass financial analysis, assisting investors in evaluating risk and return profiles, and operational efficiency evaluations that help identify process variations.
Case studies demonstrate the revolutionary effect of variation on information insights. For instance, in the case analysis titled ‘Business Intelligence for Insights,’ companies that effectively employ typical variation in their analytical frameworks report better quality information and enhanced decision-making abilities. Furthermore, feedback from customers who have engaged with Creatum’s Power BI Sprint emphasizes significant improvements in their information evaluation capabilities. This demonstrates how incorporating standard deviation in Power BI not only elucidates fundamental patterns but also enables organizations to navigate the complexities of an information-rich environment with confidence.
To explore how Creatum GmbH can enhance your reporting and decision-making processes, schedule a complimentary consultation today.
Step-by-Step Guide to Calculating Standard Deviation in Power BI
Calculating the standard deviation in Power BI is a straightforward process that can significantly enhance your data analysis skills, particularly in leveraging Business Intelligence for informed decision-making. Follow these steps to effectively calculate the typical variation using DAX functions:
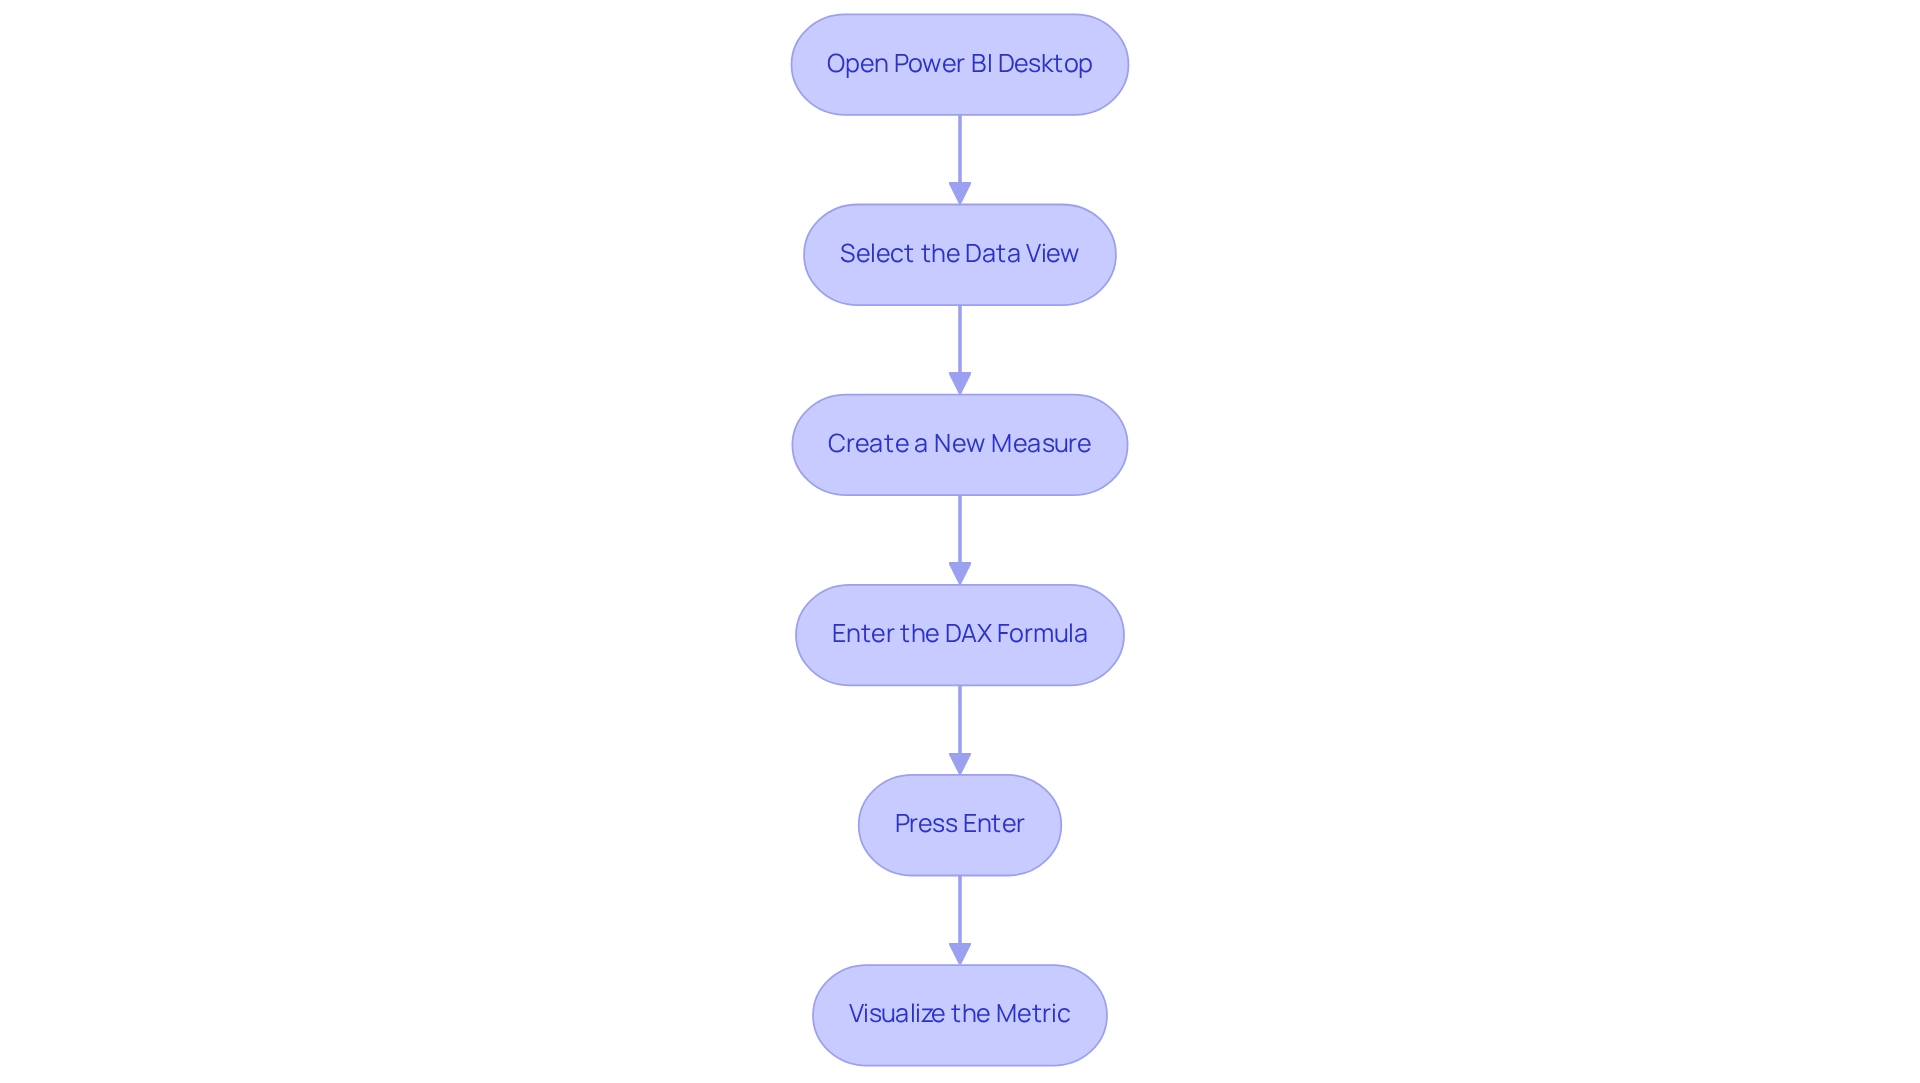
- Open Power BI Desktop: Start by launching the application and loading your dataset.
- Select the Data View: Click on the table icon located in the left sidebar to navigate to the Data view.
- Create a New Measure: Go to the ‘Modeling’ tab and select ‘New Measure’ to initiate the creation of a new calculation.
- Enter the DAX Formula: In the formula bar, input the appropriate DAX formula for typical variation. For population standard deviation, use:
StdDev_Pop = STDEV.P('YourTable'[YourColumn])For sample standard deviation, the formula is:
StdDev_Sample = STDEV.S('YourTable'[YourColumn]) - Press Enter: After entering the formula, press Enter to finalize the creation of the measure.
- Visualize the Metric: Drag the newly created metric into a visual to examine the typical variation within your dataset.
Utilizing Power BI for information analysis is increasingly popular, with user satisfaction ratings reflecting its effectiveness—Power BI boasts a score of 4.7 out of 5, surpassing competitors like Tableau at 4.4 and Excel at 3.8. This highlights Power BI’s superiority in user satisfaction. As organizations continue to recognize the value of data-driven insights, the demand for skilled professionals in business intelligence is on the rise.
Indeed, the need for Business Intelligence experts, especially analytics specialists, is increasing swiftly. Analytics specialists rank as the #3 position on Glassdoor’s Top 50 Jobs in America list, providing a median salary of $102,000. By mastering DAX functions for calculating standard deviation in Power BI, you position yourself to extract deeper insights from your information, ultimately driving informed decision-making. Moreover, the incorporation of Robotic Process Automation (RPA) can improve operational efficiency by automating repetitive tasks, addressing issues such as time-consuming report generation and inconsistencies.
This ensures that your organization remains competitive and efficient while transforming raw information into actionable insights. The governance market was valued at $3.02 billion in 2022, underscoring the growing significance of governance in relation to analysis tools like Power BI.
Utilizing DAX Functions for Standard Deviation in Power BI
Power BI employs DAX (Data Analysis Expressions) to execute a variety of calculations, including the critical analysis of variance, which is essential for understanding data variability and fostering analytics-driven decision-making. The two primary functions for calculating standard deviation are:
-
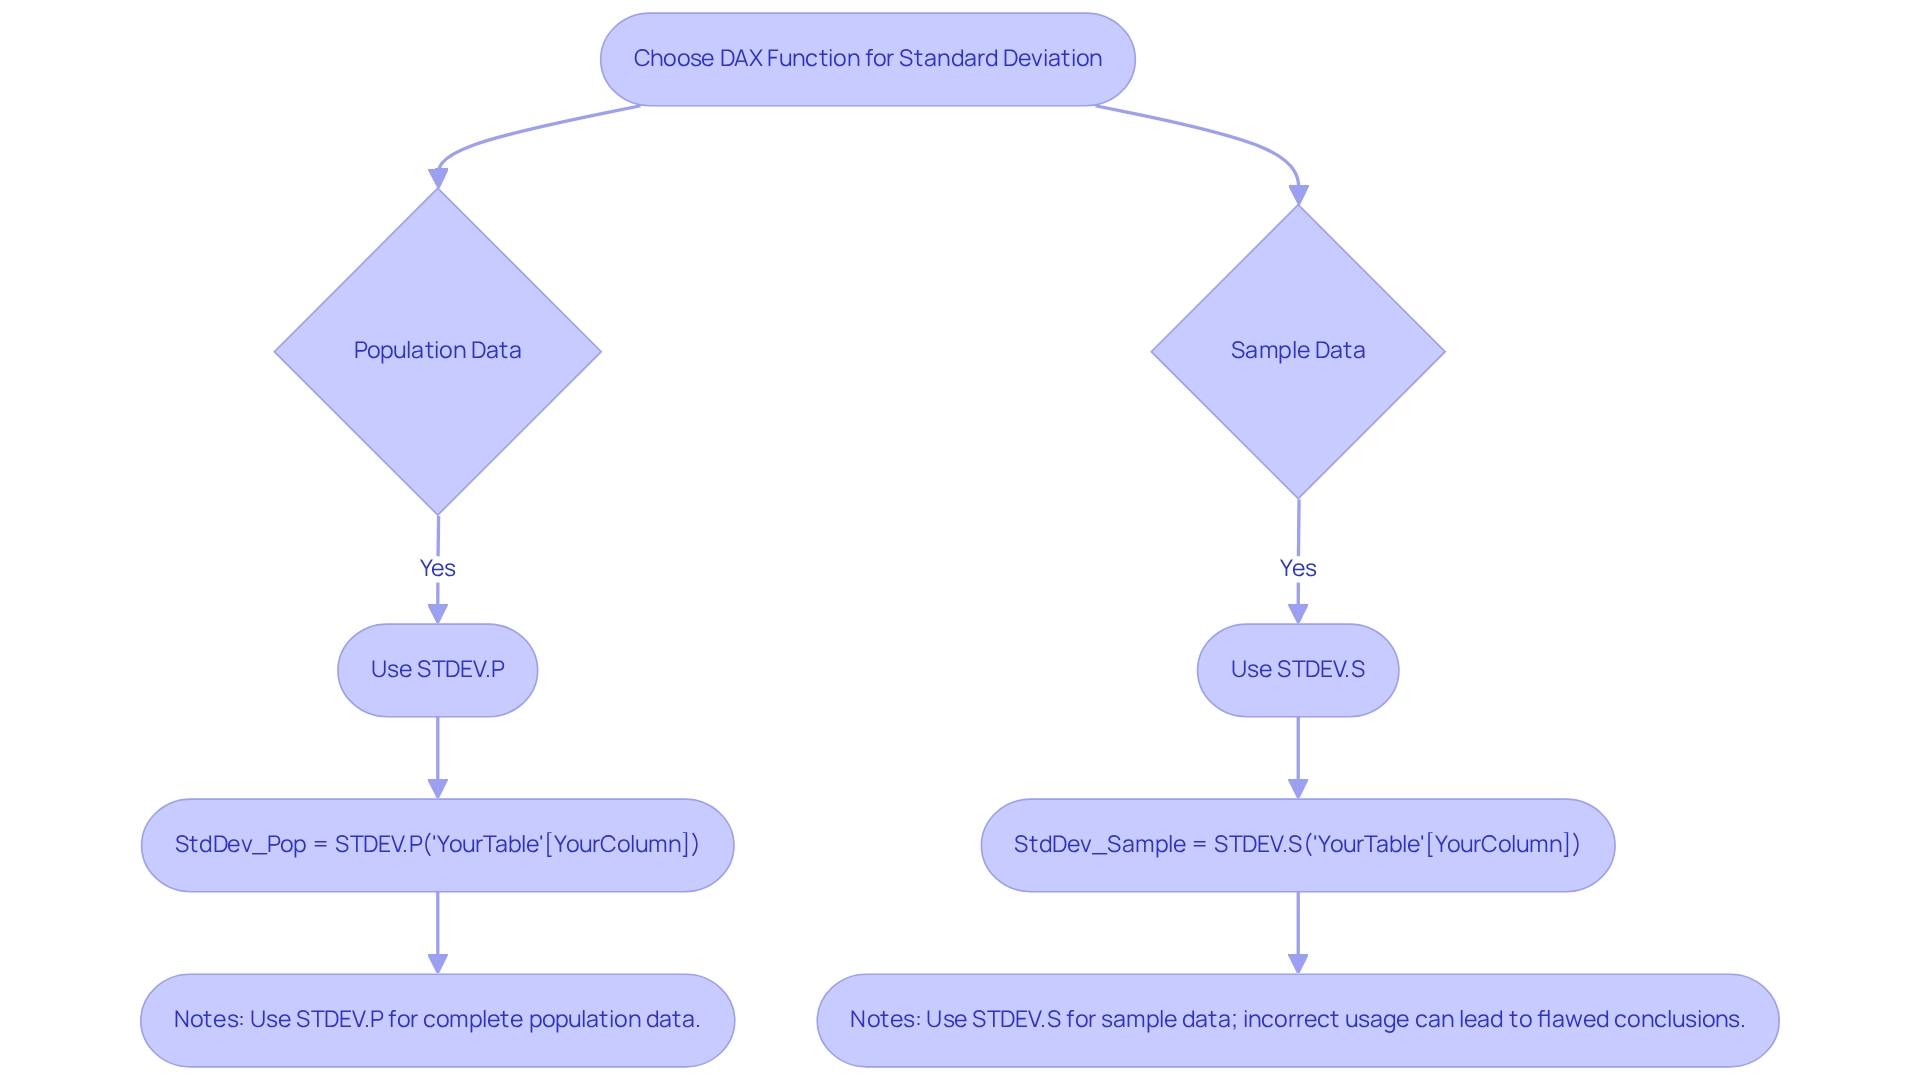
STDEV.P: This function calculates the standard deviation based on the entire population. It is applicable when you possess data for the complete group under examination. The syntax for this function is:
StdDev_Pop = STDEV.P('YourTable'[YourColumn]) -
STDEV.S: Conversely, this function estimates the standard deviation from a sample of the population. It proves particularly useful when your dataset represents a subset of a larger group. The syntax for this function is:
StdDev_Sample = STDEV.S('YourTable'[YourColumn])
Accurate application of these functions is vital for obtaining precise calculations of variability in your data, which is crucial for effective analysis and operational efficiency. Recent statistics indicate that the population variability is approximately 8.896, underscoring the importance of precise calculations in data-informed decision-making. This statistic illustrates how understanding variability can significantly influence strategic decisions within organizations, especially in a data-rich environment where insights drive growth and innovation.
In practice, utilizing STDEV.P and STDEV.S can yield different insights based on the context of your data. For example, a case study on statistical guidelines in biomedical journals revealed that numerous articles misreported statistical measures, leading to flawed conclusions and impacting data-driven decisions in that field. This emphasizes the necessity for accurate standard deviation calculations to enhance the reliability of published research and improve operational outcomes.
Experts in the field advocate for the appropriate use of these functions, noting their significant role in reducing the time to insights. As Ram Ravichandran, Google Analytics Manager, remarked, “An invaluable tool for analysts, the platform’s self-driven analytics reduce time to insights significantly.” The choice between STDEV.P and STDEV.S can greatly affect data analysis, highlighting the necessity of understanding the underlying structure before selecting the appropriate function. By mastering these DAX functions, analysts can ensure their analyses are both robust and reliable, ultimately driving growth and innovation in their organizations while overcoming challenges such as time-consuming report creation and inconsistencies.
At Creatum GmbH, we underscore the importance of these analytical tools in our Business Intelligence and Robotic Process Automation solutions. To explore how our services can enhance your data-driven decision-making, we invite you to book a free consultation.
Troubleshooting Common Issues in Standard Deviation Calculations
Calculating typical variation in Power BI presents several challenges that users must navigate to achieve precise results. This is particularly vital when aiming to enhance operational efficiency through data-driven insights with Creatum GmbH’s solutions.
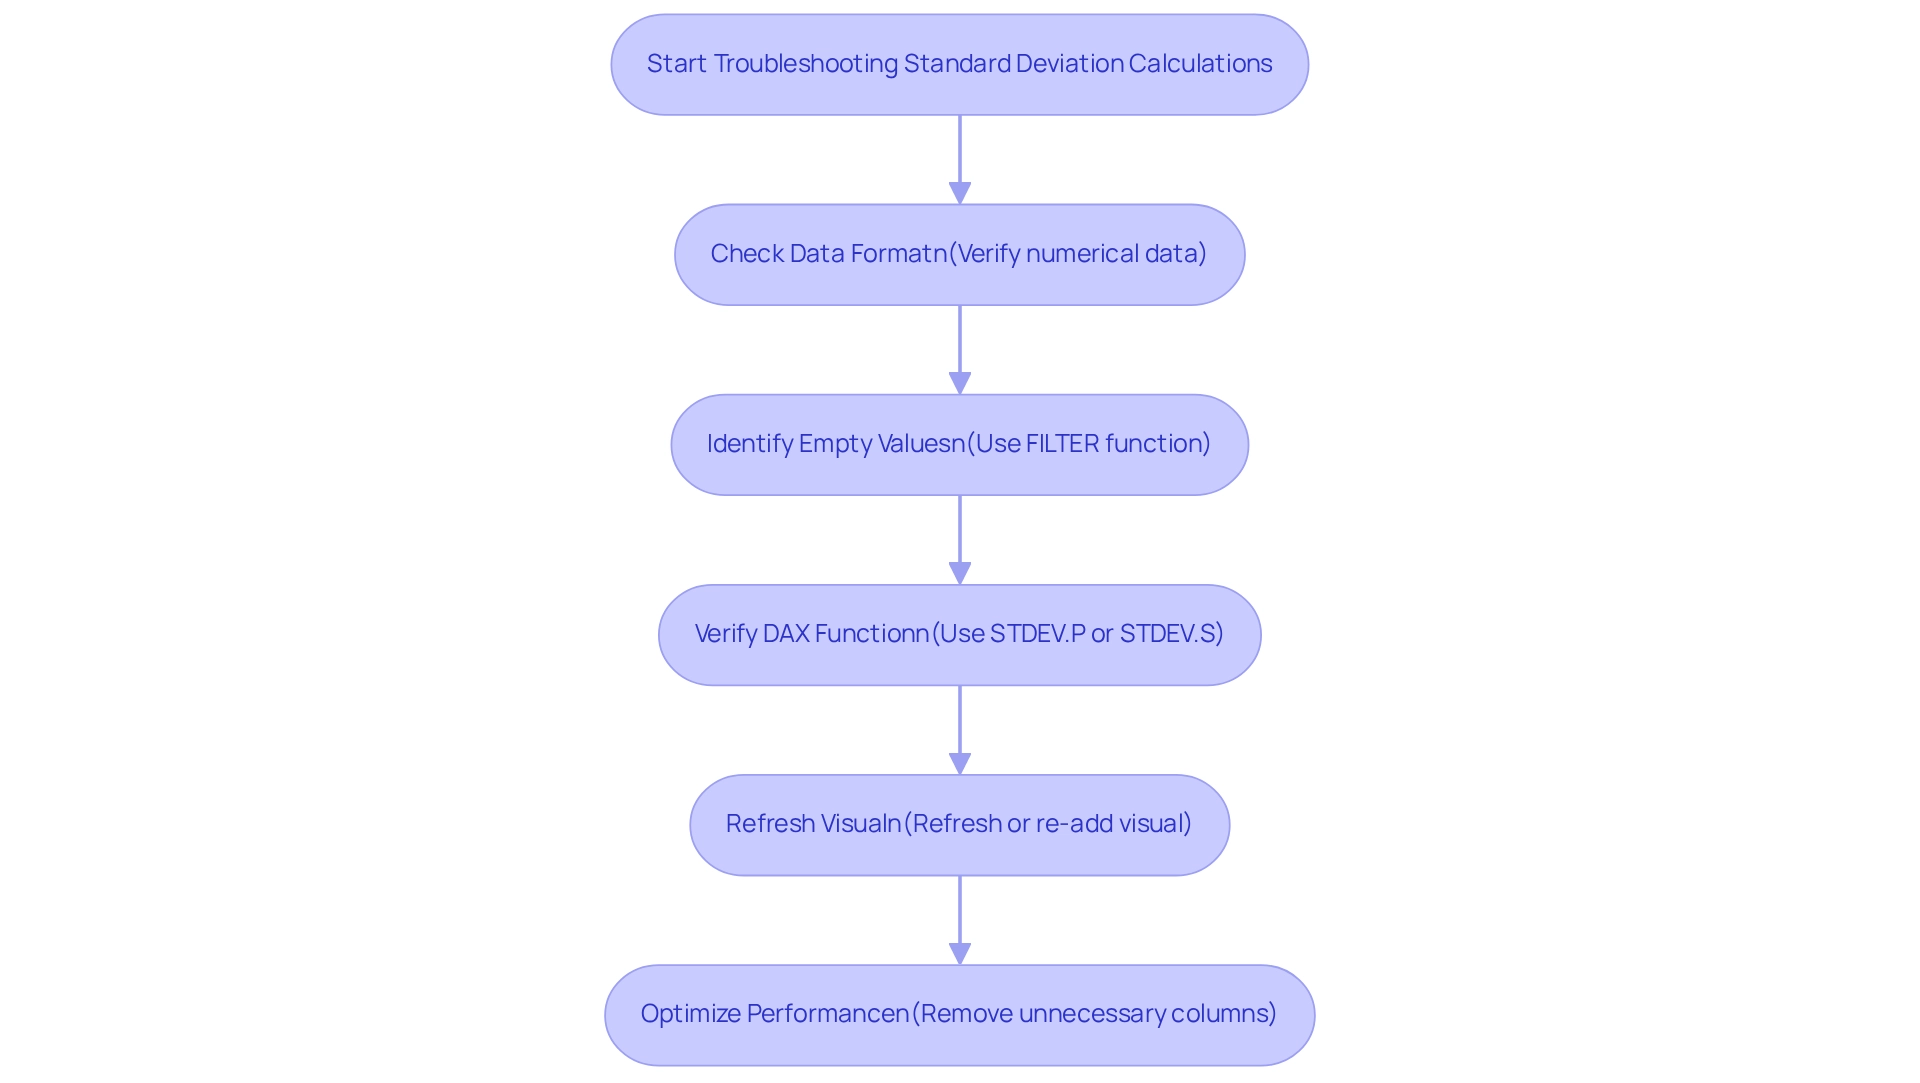
Incorrect Formats: It is essential to confirm that the column under examination contains numerical data. If the information type is incorrectly set, Power BI will be unable to compute the standard deviation, resulting in misleading insights. Always verify the type settings in the model to ensure they align with your evaluation requirements.
Empty Values: The presence of empty or null values within your dataset can severely affect the accuracy of your calculations. To mitigate this, utilize the FILTER function to exclude these values from your evaluation. This step is crucial for maintaining the integrity of your statistical calculations, ensuring that your insights are actionable.
Using the Wrong Function: Selecting the correct DAX function is vital. Ensure you are using STDEV.P for population data and STDEV.S for sample data. Misapplication of these functions can lead to incorrect standard deviation results, skewing your analysis and potentially hindering informed decision-making.
Visual Not Refreshing: Should your visual fail to represent the newly calculated measure, refreshing the information or re-adding the visual to the report canvas may be necessary. This guarantees that all modifications are accurately depicted in your visualizations, enabling effective storytelling and operational insights.
Performance Issues: Working with large datasets can lead to performance bottlenecks, slowing down calculations. To enhance performance, consider optimizing your information model by removing unnecessary columns or employing aggregations. This approach not only accelerates computations but also improves the overall user experience in Power BI, aligning with RPA objectives to simplify workflows.
By addressing these common issues, users can refine their skills in calculating standard deviation in Power BI, ultimately leading to more reliable analysis and decision-making. Proactive management of Power BI challenges, including regular performance tuning and robust modeling, has been shown to bolster an organization’s capacity to extract meaningful insights from information. This is evidenced by forward-looking enterprises that prioritize these practices. Effectively utilizing Business Intelligence tools can transform raw information into actionable insights, fostering growth and innovation.
Applications of Standard Deviation in Data Analysis and Visualization
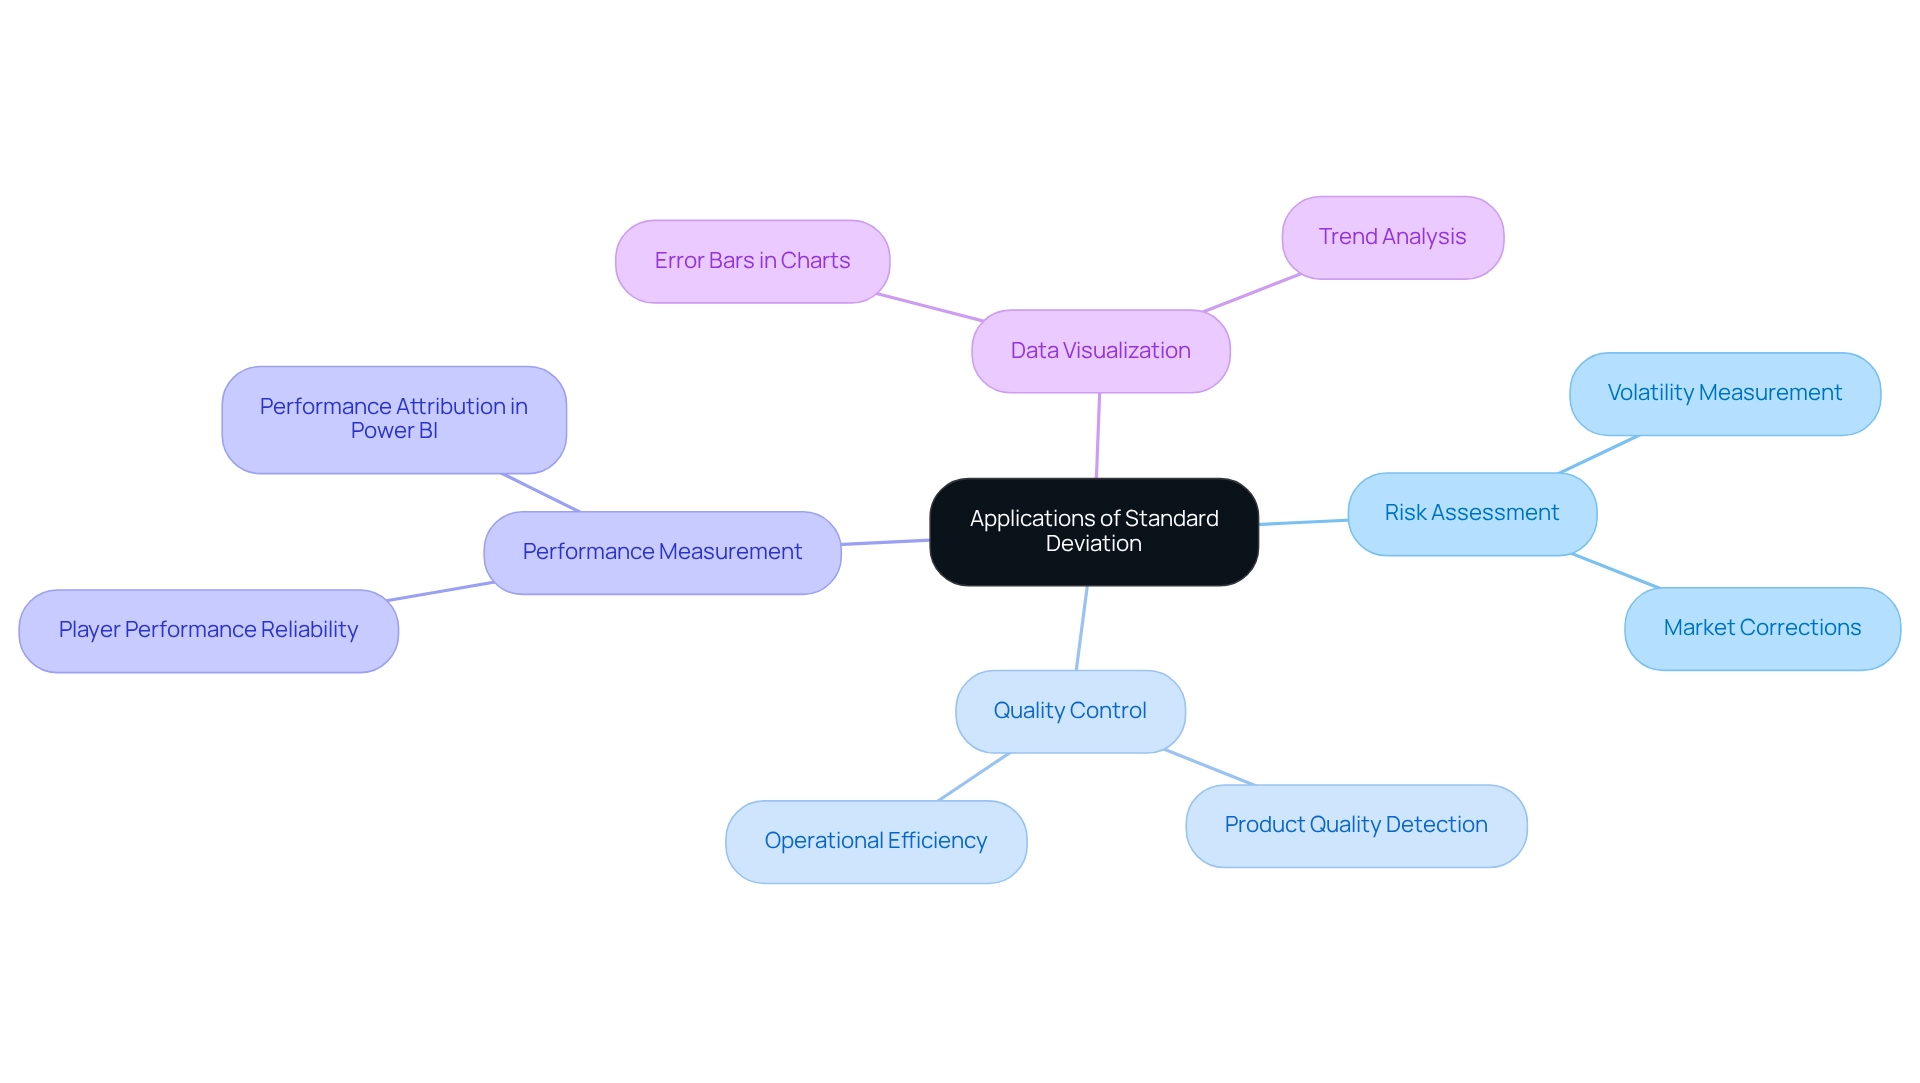
Standard deviation plays a crucial role in data analysis and visualization, with applications spanning multiple domains.
Risk Assessment: In the financial sector, standard deviation serves as a key metric for measuring the volatility of asset prices. Many advanced financial models and investment strategies depend on the accurate measurement of volatility to balance risk and reward effectively. An increased variation signifies greater risk, making it crucial for investors to evaluate potential fluctuations in their portfolios. Historical examination suggests that times of increased variability frequently precede market adjustments, emphasizing its significance in proactive investment approaches. A case study named ‘Historical Trends and Market Corrections’ illustrates that investors who tracked these statistical indicators were more equipped to modify their strategies, highlighting the essential function of variability in investment decision-making.
Quality Control: Within manufacturing, variability is essential in detecting differences in product quality. By establishing acceptable ranges, manufacturers can identify products that fall outside these parameters, signaling potential quality issues. This application not only enhances product reliability but also minimizes waste and rework, ultimately driving operational efficiency.
Performance Measurement: In the field of sports analytics, variability is employed to assess the reliability of player performance. A reduced variability suggests more reliable performance, which can be essential for coaches and managers when making strategic choices regarding player usage and growth. As mentioned by the AccountingInsights Team, in performance attribution, the standard deviation in Power BI helps pinpoint the sources of return variability, further emphasizing its importance in performance assessment.
Data Visualization: The standard deviation in Power BI can be effectively represented through error bars in charts, which convey the variability of information points. This visualization assists stakeholders in making educated choices based on observed trends, enabling a clearer comprehension of potential risks and opportunities.
Incorporating variability in data examination not only improves the precision of insights but also enables organizations to make data-informed choices that align with their strategic objectives, ultimately fostering growth and innovation.
Best Practices for Implementing Standard Deviation in Power BI
To effectively implement standard deviation in Power BI, consider the following best practices:
-
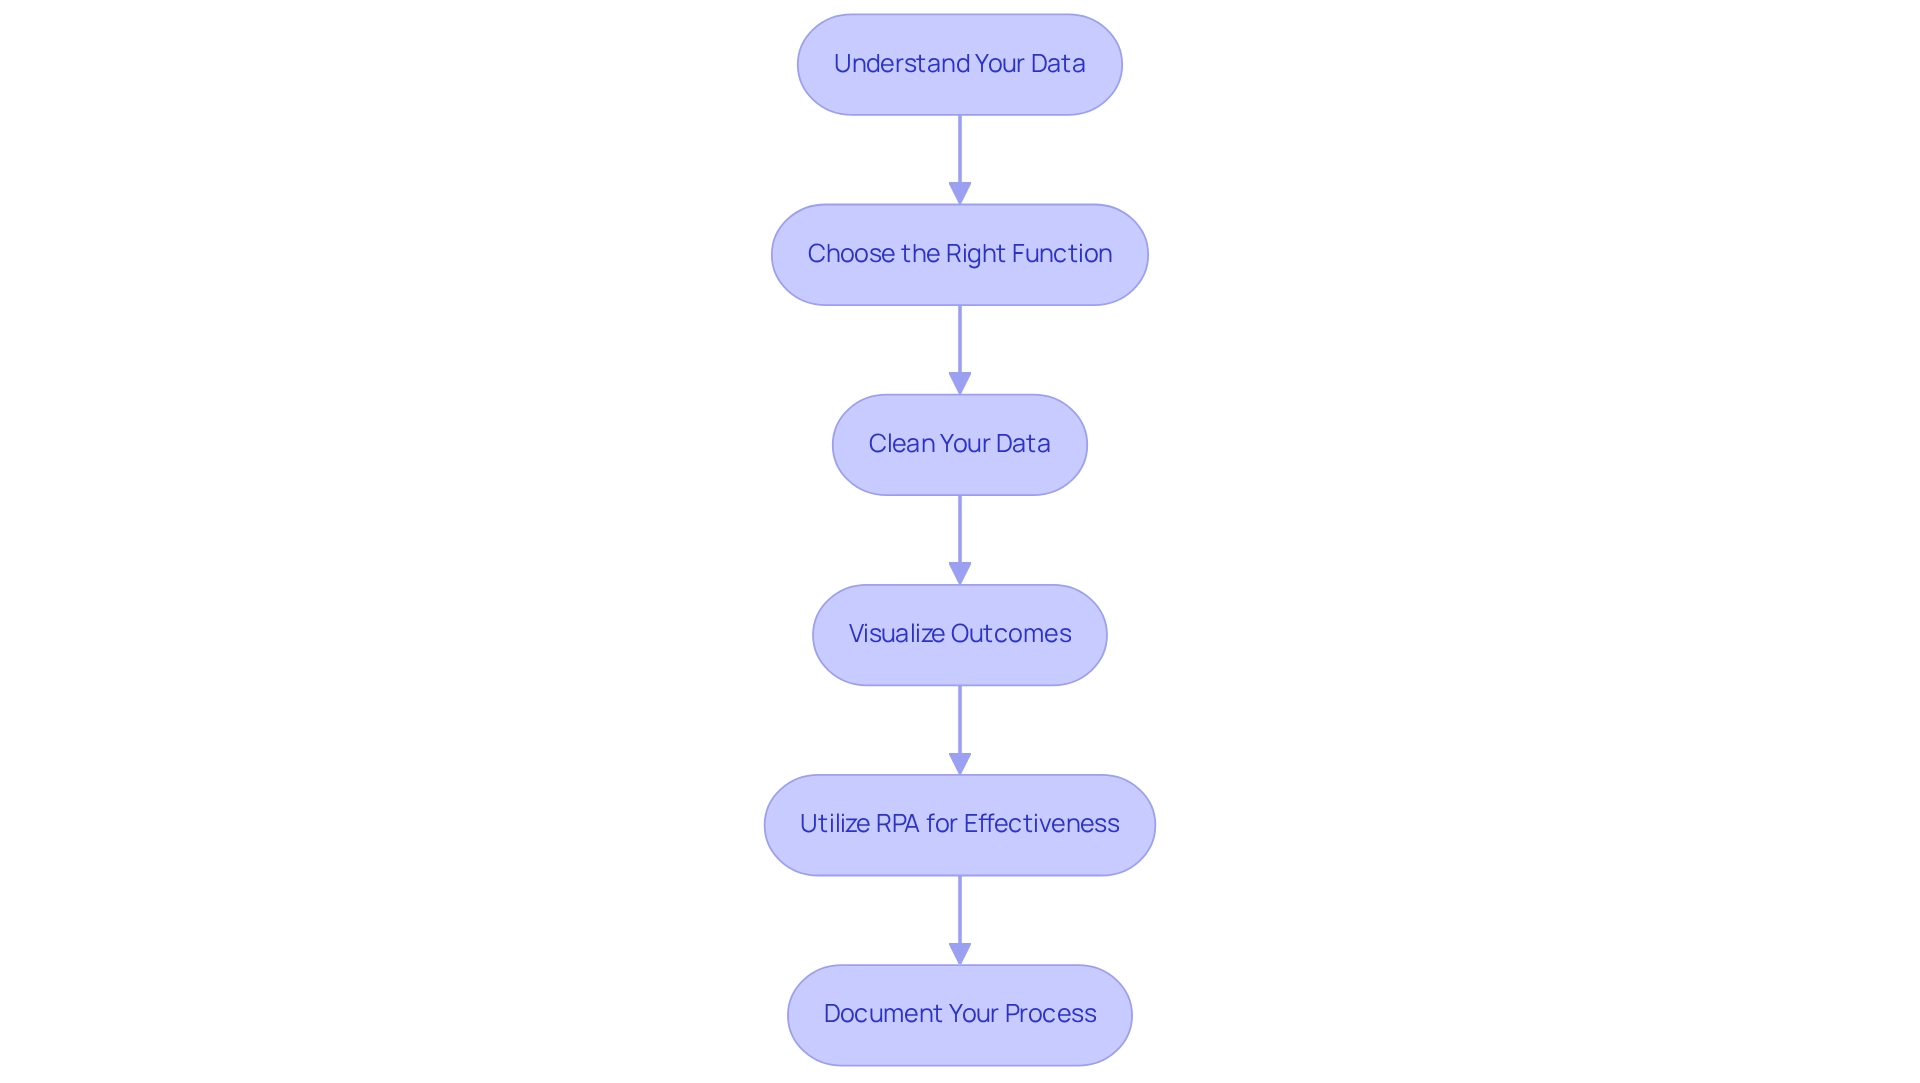
Understand Your Data: A comprehensive understanding of your dataset and the context of your analysis is crucial. This foundational knowledge allows for more accurate interpretations and insights. In today’s information-rich environment, utilizing Business Intelligence (BI) is essential for converting raw information into actionable insights that foster growth and innovation.
-
Choose the Right Function: Selecting the appropriate function is essential for accurate calculations. Utilize
STDEV.Pfor population andSTDEV.Sfor sample to ensure your results reflect the correct statistical context, which is vital for informed decision-making. -
Clean Your Data: Data cleaning is vital for accurate standard deviation calculations. Eliminate outliers and incorrect points that could distort your results. Techniques such as filtering, normalization, and validation checks can significantly enhance information quality, leading to more reliable analyses. For instance, in a case study named ‘Baseball Team Age Analysis,’ a group of 25 players was examined, showing an average age of 30.68 years and a typical variation of 6.09 years, illustrating how effective information management can produce significant insights. This step is crucial in overcoming challenges such as inconsistencies that frequently occur in Power BI dashboards, particularly when analyzing standard deviation.
-
Visualize Outcomes: Efficient representation of variation is essential for conveying variability. Utilize visuals such as scatter plots or line charts with error bars to represent standard deviation clearly, making it easier for stakeholders to grasp the implications of the information. This aligns with the objective of BI to present information in a manner that is actionable and insightful.
-
Utilize RPA for Effectiveness: Incorporating Robotic Process Automation (RPA) can greatly improve your information evaluation process. By automating repetitive tasks associated with information collection and cleaning, tools like EMMA RPA and Power Automate can liberate valuable time for analysts, enabling them to concentrate on deriving insights instead of becoming overwhelmed by manual processes.
-
Document Your Process: Maintaining thorough documentation of your calculations and the rationale behind your choices is important. This practice not only promotes transparency but also serves as a useful reference for future evaluations and for colleagues assessing your work. As Jim aptly stated, “Congratulations! May you continue to increase your survival Z-score!” This underscores the importance of grasping standard deviation in the realm of information evaluation.
Integrating these best practices will enhance the precision and efficiency of your analysis in Power BI, particularly in calculating standard deviation, ultimately resulting in more informed decision-making. Furthermore, merging clinical expertise with statistical understanding, as emphasized in evidence-based medicine, is essential for accurate data interpretation. By leveraging BI and RPA, organizations can automate repetitive tasks and improve operational efficiency, thus driving business growth.
To learn more about how our solutions can help you achieve operational excellence, book a free consultation with Creatum GmbH today.
Conclusion
Understanding standard deviation is fundamental for any organization aiming to harness the power of data analysis in today’s competitive landscape. This article has explored the essential role standard deviation plays in quantifying data variability, assessing risk, and enhancing decision-making processes. From its calculation using DAX functions in Power BI to its applications in various sectors such as finance, manufacturing, and sports analytics, the significance of standard deviation cannot be overstated.
By mastering the techniques for calculating standard deviation and implementing best practices in Power BI, organizations can improve the accuracy and reliability of their data insights. This improvement supports informed decision-making and strategic planning, ultimately driving growth and innovation. The challenges associated with standard deviation calculations can be effectively navigated through proactive data management and the integration of automation tools, ensuring that businesses remain agile and data-driven.
In conclusion, embracing the principles of standard deviation equips organizations with the necessary tools to interpret complex datasets confidently. As businesses continue to rely on data-driven insights, understanding and applying standard deviation will be pivotal in unlocking the full potential of their analytics capabilities. This fosters a culture of informed decision-making that leads to sustainable success.
Frequently Asked Questions
What is standard deviation and why is it important?
Standard deviation is a statistical measure that quantifies the variation or dispersion within a dataset. It indicates how closely data points are grouped around the average. A small standard deviation signifies consistency, while a large standard deviation indicates greater variability. It is essential for evaluating the reliability of information, risk evaluation, and predictive modeling based on historical trends.
What does the interquartile range (IQR) represent?
The interquartile range (IQR) signifies the central 50% of values in a dataset, providing additional context for understanding variability alongside standard deviation.
How is standard deviation used in Power BI?
In Power BI, understanding standard deviation is crucial for analyzing trends and making informed decisions. It helps companies assess performance indicators, recognize anomalies, and improve forecasting precision.
What services does Creatum GmbH offer related to Power BI?
Creatum GmbH offers Power BI services, including the 3-Day Power BI Sprint and the General Management App, which help organizations enhance their reporting capabilities and obtain actionable insights while addressing data inconsistency and governance challenges.
How does standard deviation relate to business decision-making?
Standard deviation helps in financial analysis by assisting investors in evaluating risk and return profiles, as well as in operational efficiency evaluations to identify process variations. It plays a vital role in measuring uncertainty and facilitating better decision-making.
What are some practical applications of statistical variation in business?
Practical applications include financial analysis for evaluating risk and return profiles, operational efficiency evaluations to identify process variations, and enhancing decision-making abilities through better quality information.
How can standard deviation be calculated in Power BI?
To calculate standard deviation in Power BI, follow these steps: 1. Open Power BI Desktop and load your dataset. 2. Select the Data View. 3. Create a New Measure in the ‘Modeling’ tab. 4. Enter the appropriate DAX formula: For population standard deviation: StdDev_Pop = STDEV.P(‘YourTable'[YourColumn]) For sample standard deviation: StdDev_Sample = STDEV.S(‘YourTable'[YourColumn]) 5. Press Enter to finalize the measure. 6. Visualize the metric in your report.
What is the user satisfaction rating for Power BI compared to its competitors?
Power BI has a user satisfaction rating of 4.7 out of 5, which surpasses competitors like Tableau (4.4) and Excel (3.8).
What is the significance of governance in relation to analysis tools like Power BI?
The governance market was valued at $3.02 billion in 2022, highlighting the growing importance of governance in data analysis and decision-making processes using tools like Power BI.
Overview
Direct Query in Power BI represents a transformative connectivity mode, enabling users to access real-time data directly from the source without the need for importing. This capability significantly enhances operational efficiency and empowers timely decision-making.
Notably, this approach facilitates immediate insights and minimizes manual data handling, making it an attractive option for organizations. However, it is crucial to recognize that there are performance considerations and limitations that must be navigated to fully leverage its advantages.
Organizations that embrace Direct Query can unlock a new level of data-driven decision-making, but they must remain vigilant about the challenges it presents. By understanding these dynamics, businesses can optimize their data strategies and drive impactful results.
Introduction
In today’s landscape of data-driven decision-making, organizations are increasingly leveraging innovative tools to enhance their analytical capabilities. One such tool is Direct Query in Power BI, a feature that allows users to connect directly to their data sources. This ensures access to real-time insights without the cumbersome need for data imports. Such an approach streamlines reporting processes and significantly alleviates the operational burdens tied to data management.
Yet, despite these compelling benefits—ranging from improved decision-making speed to enhanced efficiency—organizations must also navigate certain challenges. Understanding the optimal timing and methods for implementing Direct Query can revolutionize data analysis, empowering businesses to respond swiftly to market changes and optimize operations in an ever-evolving landscape.
Understanding Direct Query: An Introduction
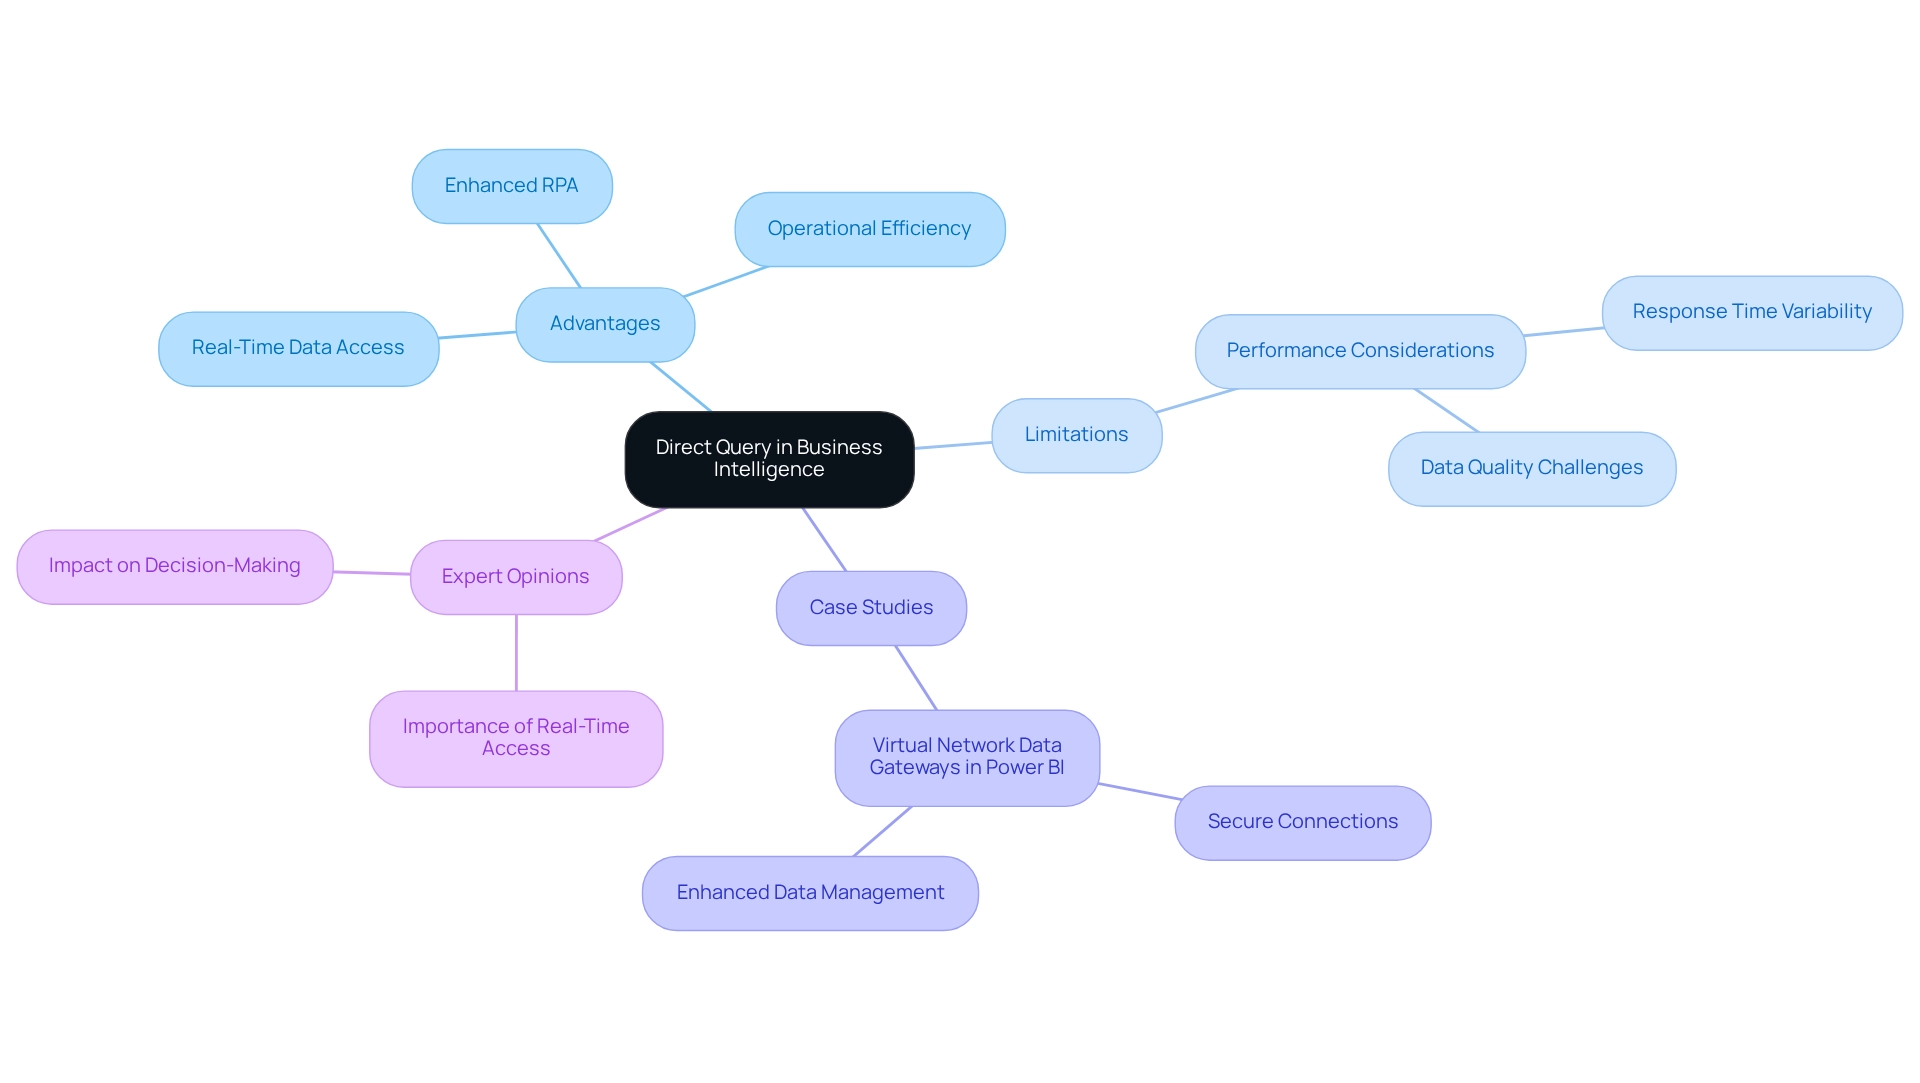
Direct Query stands out as a robust connectivity mode in Business Intelligence (BI), allowing users to connect directly to data sources without the need to import information into BI’s internal storage. This functionality empowers Power BI to send queries directly to the underlying data source each time a report is accessed or refreshed, ensuring that users consistently work with the most current information available. This capability is particularly advantageous for organizations requiring real-time information analysis and reporting, as it eliminates the need for periodic data refreshes, thereby enhancing operational efficiency and facilitating the automation of manual workflows through Robotic Process Automation (RPA).
RPA not only streamlines these workflows but also reduces errors, freeing your team to focus on more strategic, value-adding tasks.
However, while Direct Query offers substantial advantages, it also poses certain limitations and performance considerations. For instance, the response time for queries can vary based on the performance of the underlying data source and the complexity of the executed queries. Recent advancements in Power BI have focused on refining these interactions, with improvements aimed at enhancing the speed and reliability of direct connections.
It is important to note that it can take up to 10 minutes beyond the configured time for files to appear in the specified folder, a crucial factor for organizations reliant on prompt data access.
Statistics indicate that organizations leveraging real-time retrieval can achieve faster decision-making processes, as they gain immediate insights. In practice, companies utilizing Direct Query experience a significant improvement in their ability to respond swiftly to market fluctuations, with some studies revealing a reduction in reporting times by as much as 50% compared to traditional import methods. This capability is essential in a rapidly evolving AI landscape, where timely data access can greatly enhance operational efficiency and support strategic decision-making.
A notable case study involves the implementation of virtual network data gateways in Power BI, enabling secure connections to services within an Azure virtual network. This setup not only enhances data management capabilities but also ensures that organizations can maintain compliance and security while accessing real-time information, further supporting the integration of RPA solutions and customized AI technologies.
Expert opinions underscore the importance of real-time data access in business intelligence. Analysts assert that having immediate access to up-to-date information is critical for informed decision-making, particularly in fast-paced industries. As one analyst remarked, ‘Real-time data access transforms how companies operate, enabling them to pivot quickly and capitalize on new opportunities.’
In conclusion, Direct Query in the context of BI serves as an essential tool for organizations striving to leverage real-time information, driving efficiency and informed decision-making in an increasingly data-driven landscape. It also enhances the effectiveness of RPA initiatives while addressing challenges related to subpar master data quality.
Key Benefits of Using Direct Query in Power BI
The primary benefits of utilizing Direct Query in Power BI are significant and multifaceted:
-
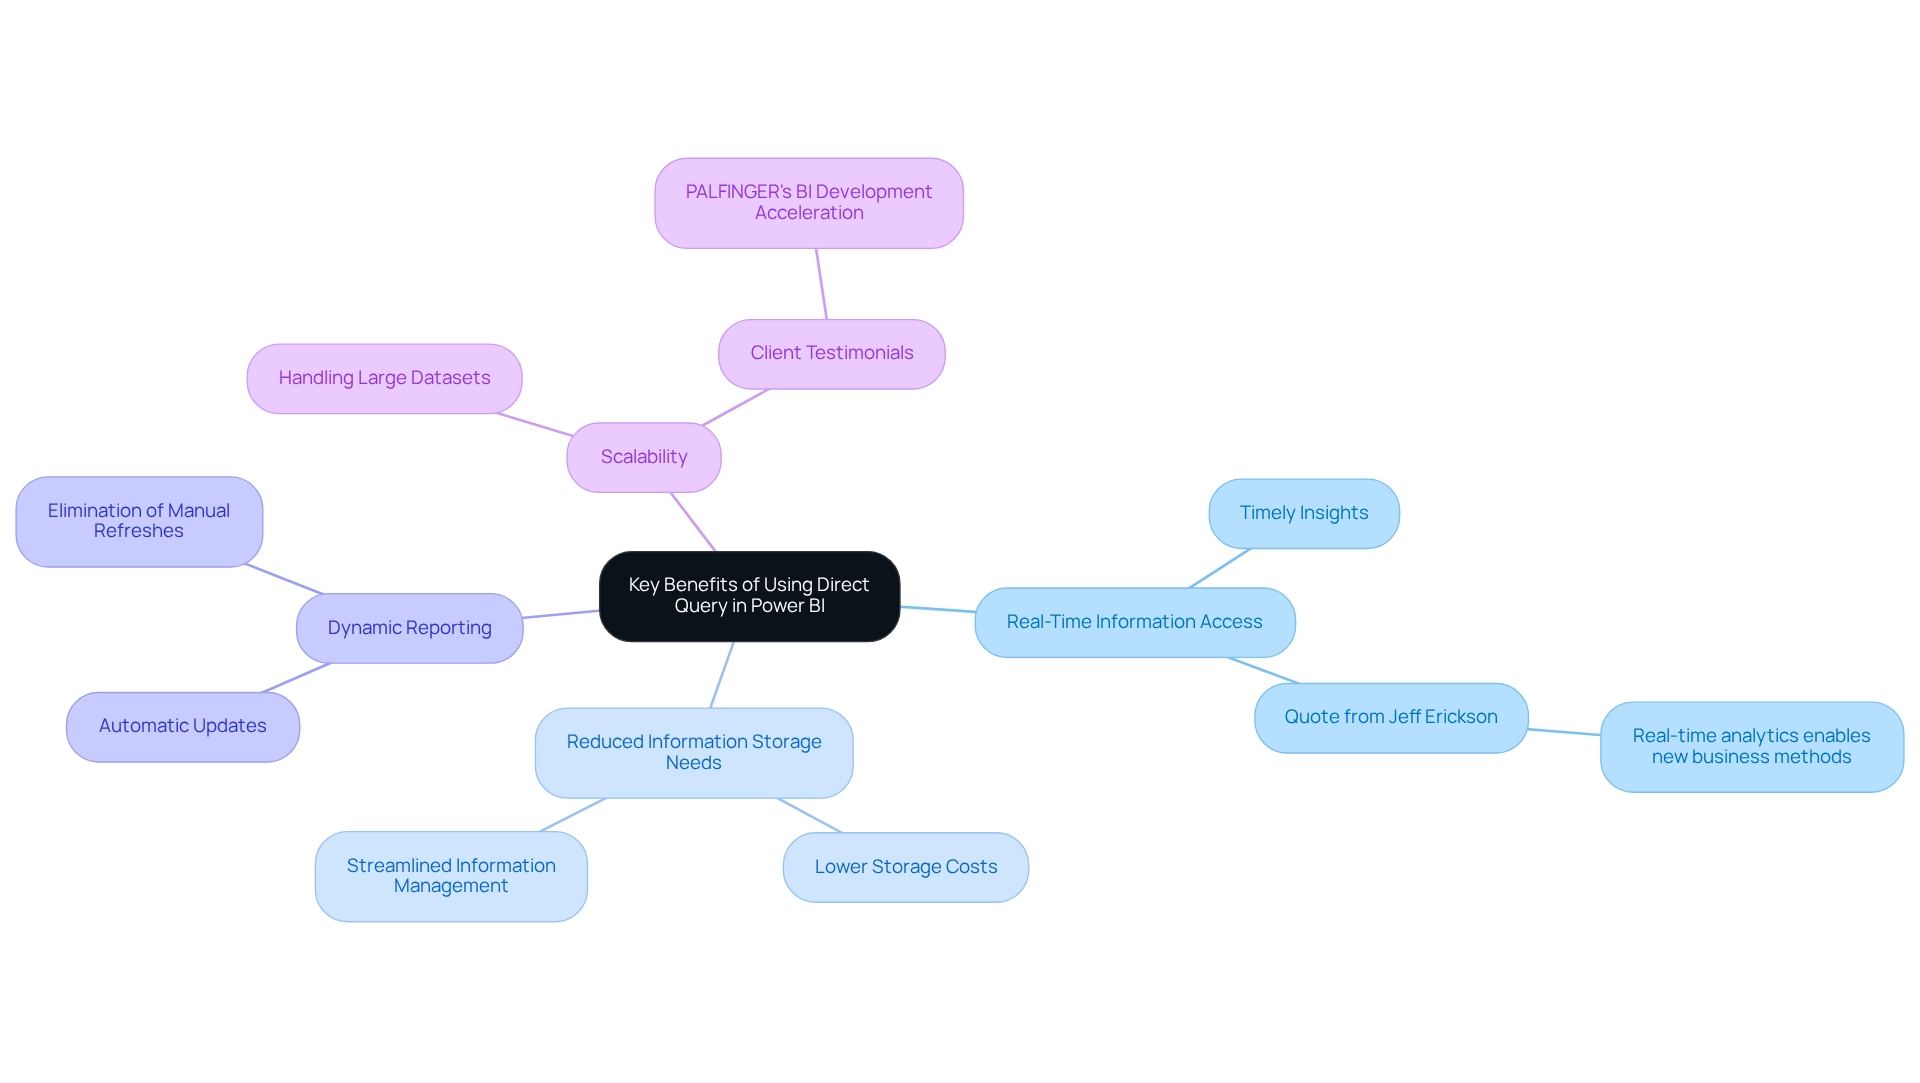
Real-Time Information Access: Direct Query allows users to access the most current information directly from the source, which is crucial for scenarios where timely insights are essential. This capability enables organizations to respond swiftly to changing conditions, enhancing operational agility. As Jeff Erickson, a Tech Content Strategist, observes, “Unlike conventional analytics, real-time analytics is about more than guiding future choices; it allows entirely new methods of conducting business by enabling teams to act instantly.” This is particularly relevant in the context of Business Intelligence, as the ability to derive actionable insights quickly can drive growth and innovation.
-
Reduced Information Storage Needs: By not storing information within Power BI, organizations can significantly lower their storage costs. This method streamlines information management and clarifies the concept of Direct Query by easing the difficulties linked with processing large collections, making it a cost-effective solution for many companies. Efficiency is further improved by RPA solutions that automate repetitive tasks, allowing teams to focus on strategic analysis rather than management.
-
Dynamic Reporting: With real-time access, users can create dynamic reports that automatically reflect alterations in the underlying information. This eliminates the need for manual dataset refreshes, ensuring that decision-makers always have access to the latest insights—vital for informed decision-making. The challenges of time-consuming report creation and inconsistencies are mitigated, allowing for a smoother analytical process.
-
Scalability: Direct Query is designed to handle extensive datasets that may exceed the memory thresholds of the BI tool. This scalability enables organizations to assess large volumes of information without encountering performance problems, making it an excellent option for information-heavy operations. The transformative impact of utilizing Direct Query in BI is emphasized by testimonials from clients like PALFINGER, who experienced significant acceleration in their BI development through Creatum’s BI Sprint service. This service not only provided them with a ready-to-use Power BI report but also enhanced their overall information analysis strategy.
The benefits of real-time information access are underscored by statistics showing that enhanced information accessibility can lead to a 20% improvement in overall research accuracy. Furthermore, organizations like Domino’s Pizza have demonstrated the power of real-time analytics; after implementing their ‘Domino’s Tracker’ system, they reported a 25% increase in customer satisfaction and sales. Such examples highlight Direct Query as a strategic resource that Immediate Inquiry signifies for companies seeking to optimize their data analysis capabilities and improve operational effectiveness.
When to Use Direct Query: Ideal Scenarios
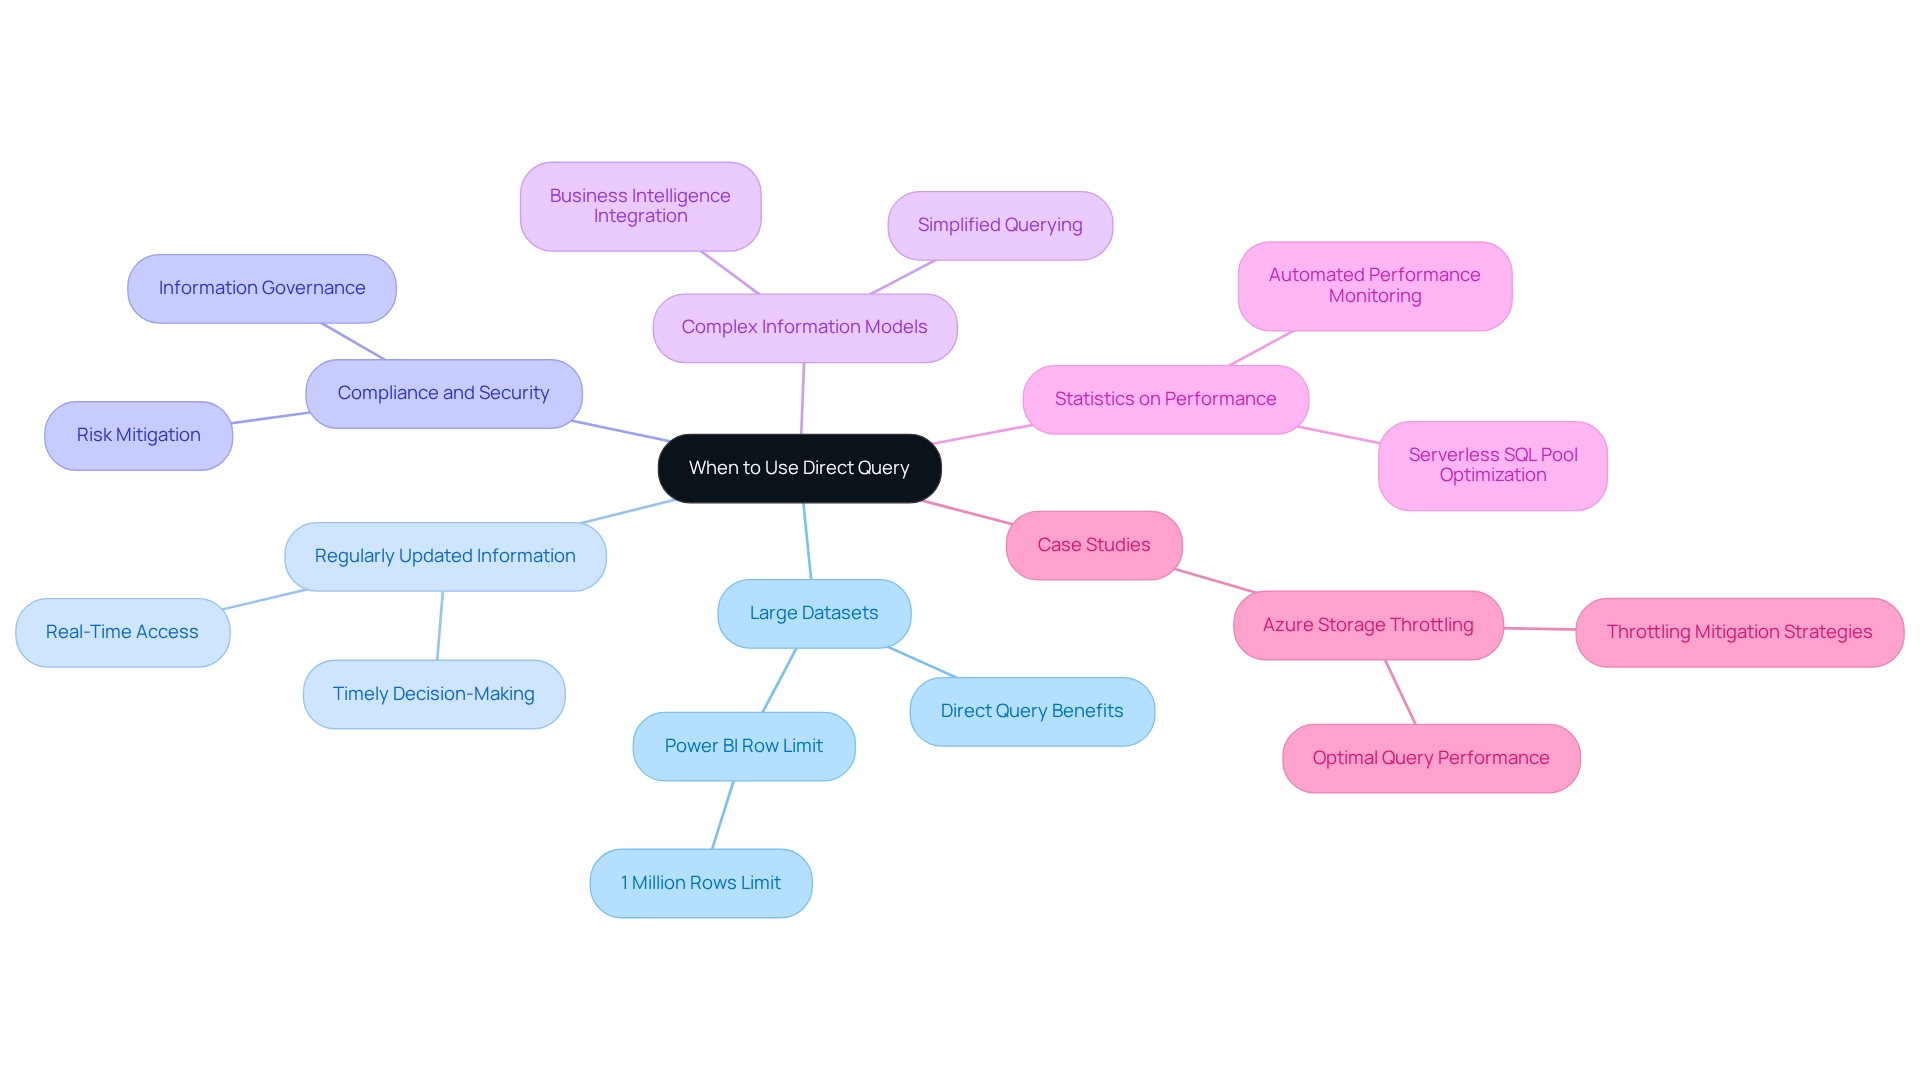
Immediate Inquiry proves to be especially beneficial in various critical situations:
-
For organizations grappling with large datasets that exceed Power BI’s import limits, understanding what direct query entails facilitates analysis without the constraints of memory limitations. Notably, a fixed limit of 1 million rows is placed on the number of rows that can be returned in any single query to the underlying source, as highlighted by v-jingzhang from Community Support. This capability is vital for sectors like healthcare and finance, where information volumes can be considerable. Utilizing Robotic Process Automation (RPA) can further enhance these processes, ensuring that information is efficiently managed and analyzed, thereby automating manual workflows that would otherwise consume valuable time.
-
Regularly Updated Information: Companies operating in dynamic environments, such as financial markets or inventory control, gain substantial advantages from real-time access to information. This feature allows for immediate insights, enabling timely decision-making that can significantly impact operational efficiency. By integrating RPA, organizations can automate the retrieval and processing of this information, enhancing responsiveness and reducing manual workload, which is essential for maintaining a competitive advantage.
-
Compliance and Security Mandates: Firms subject to strict information governance policies find Immediate Inquiry particularly advantageous. By retaining sensitive information in its original location, it mitigates the risk of breaches and ensures adherence to regulations, which is crucial for sectors like banking and healthcare. RPA can assist in monitoring compliance and automating reporting processes, further enhancing security measures and addressing technology implementation challenges.
-
Complex Information Models: In scenarios involving intricate information structures that require regular updates, Straightforward Access simplifies the querying process. Rather than relying on sporadic imports, it permits direct access to the information source, streamlining operations and improving accuracy. The integration of Business Intelligence tools can provide deeper insights into these complex models, driving better decision-making and overcoming the hurdles of technology implementation.
-
Statistics on Performance: Understanding what direct query is and how utilizing direct inquiries can significantly enhance query efficiency is essential, as serverless SQL pools optimize retrieval by bypassing unnecessary row groups based on specified conditions. This efficiency is vital for organizations that rely on large datasets for their analytics. RPA can help automate performance monitoring, ensuring that systems operate at peak efficiency and that manual oversight is minimized.
-
Case Studies: For instance, in addressing Azure Storage Throttling, organizations have implemented strategies to prevent overloading storage accounts during query execution. This method not only reduces throttling impacts but also sustains optimal request performance, demonstrating the practical advantages of immediate access in real-world applications. By merging RPA with immediate inquiries, companies can further boost their operational effectiveness and information management strategies, illustrating how automation can reduce manual effort and enhance overall performance.
By comprehending these situations, organizations can better utilize immediate inquiries in Business Intelligence to improve their analytics capabilities and foster informed decision-making. Additionally, the upcoming Microsoft Fabric Community Conference 2025, taking place from March 31 to April 2 in Las Vegas, Nevada, presents an opportunity for professionals to explore advancements in data analytics and network with industry leaders.
Challenges and Limitations of Direct Query
While Direct Query in Power BI offers notable advantages, it is crucial to acknowledge the accompanying challenges and limitations:
-
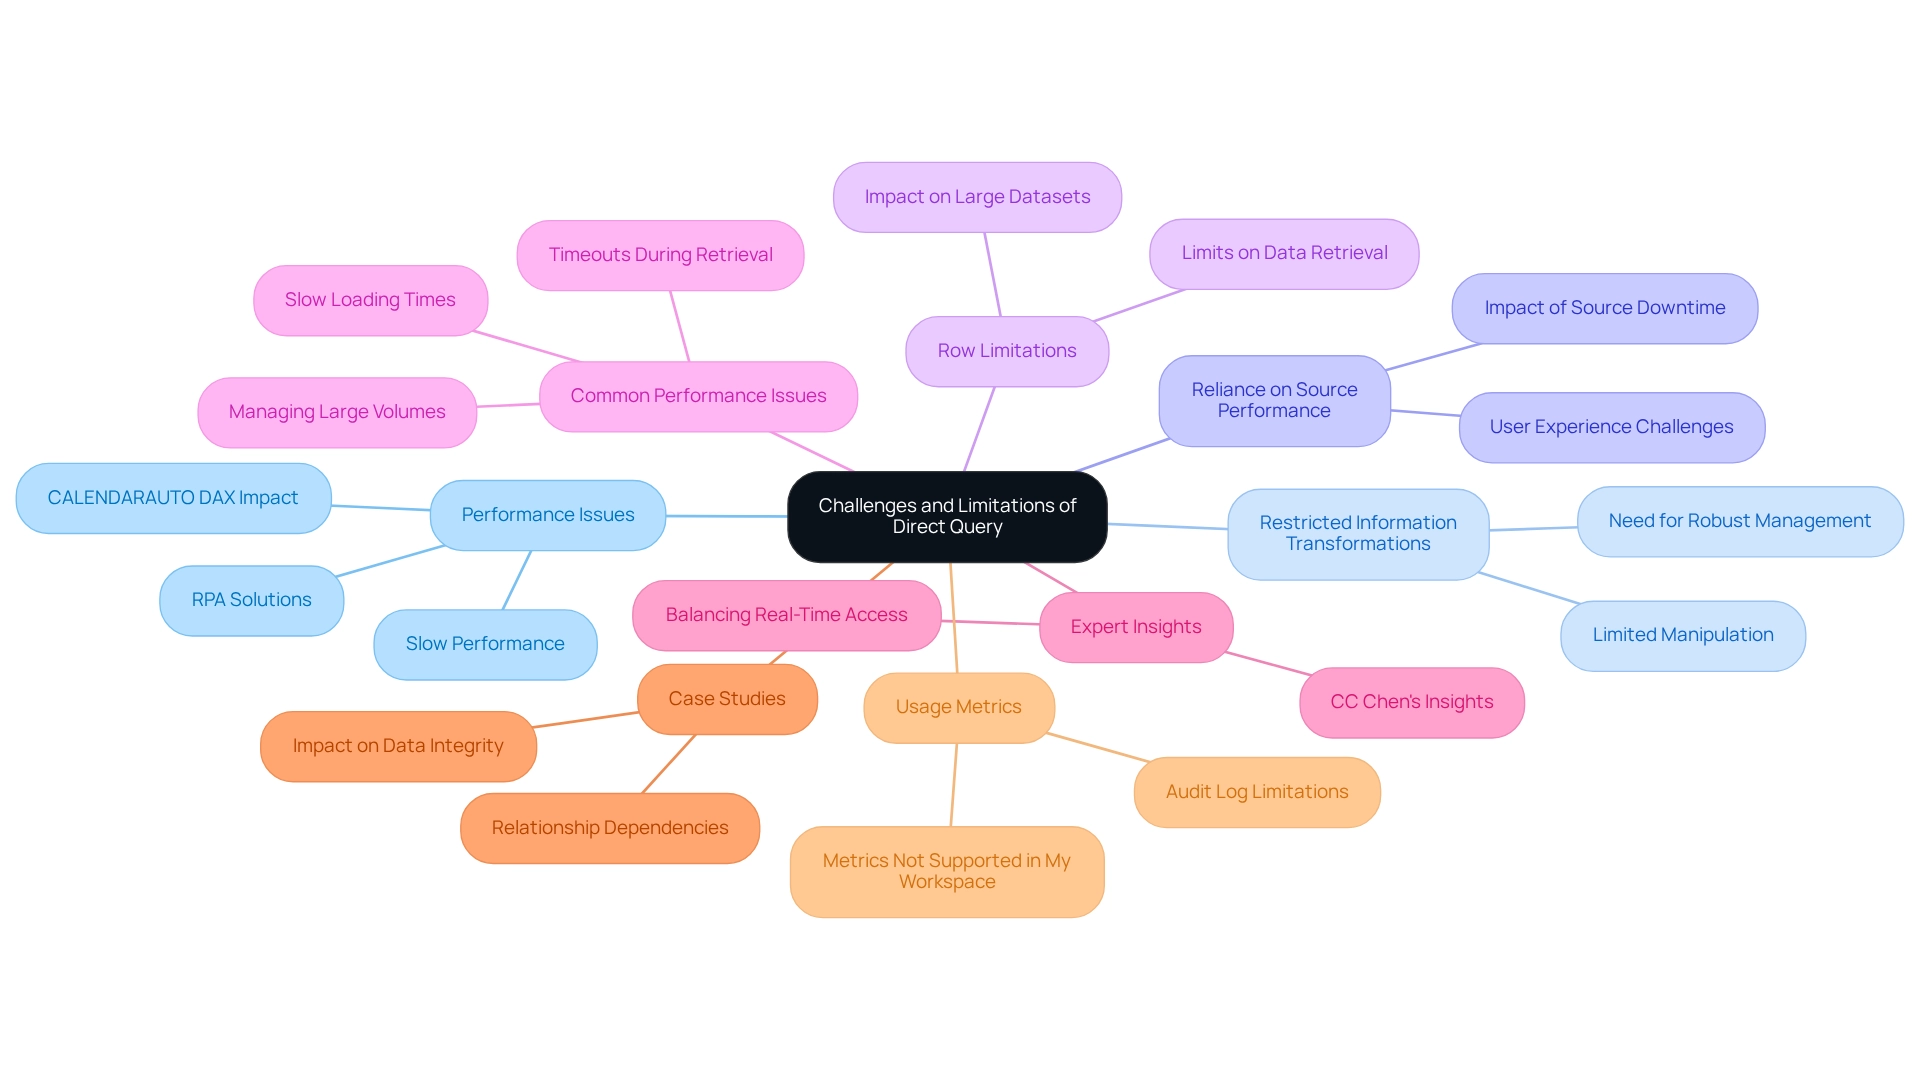
Performance Issues: A primary concern with Direct Query is its potential to slow down performance. This is particularly evident when the underlying information source is not optimized for efficient query execution. Each interaction with a report can initiate multiple inquiries to the source, leading to considerable delays in response times, especially during peak usage. The CALENDARAUTO DAX function, which scans all date and date/time columns in your model to determine the earliest and latest stored date values, can also impact performance if not managed properly. These performance challenges can hinder the effectiveness of business intelligence initiatives, making it essential for organizations to adopt solutions like RPA from Creatum GmbH to streamline workflows and enhance operational efficiency.
-
Restricted Information Transformations: When utilizing Immediate Inquiry, users face limitations in transformation capabilities within Power Transformation. Unlike imported information, which allows extensive manipulation, Immediate Access restricts the complexity of transformations that can be applied. This constraint can impede the ability to derive deeper insights from the information, underscoring the necessity for robust management practices to ensure high-quality master records.
-
Reliance on Source Performance: The effectiveness of immediate reports is closely tied to the performance of the underlying source. If the information source is slow or experiences downtime, it directly impacts the user experience in Power BI, potentially leading to frustration and decreased productivity. Organizations must address these challenges to leverage insights effectively and understand what Direct Query entails to make informed decisions.
-
Row Limitations: Direct Query imposes limits on the number of rows that can be retrieved in a single request. This limitation can significantly affect the analysis of large datasets, as users may find themselves unable to access all essential information for comprehensive reporting.
-
Common Performance Issues: Organizations frequently encounter performance challenges when using Direct Query. These include slow loading times, timeouts during information retrieval, and difficulties in managing large volumes of information. Such issues can undermine the effectiveness of business intelligence initiatives, particularly in understanding what Direct Query is. Optimization techniques such as removing unused columns, filtering information, and enabling incremental refresh can help alleviate these challenges, resulting in a more efficient and scalable Power BI model.
-
Expert Insights: Information management specialists emphasize that while Direct Query can facilitate real-time information access, it is vital to weigh these advantages against the potential performance limitations. CC Chen states, “In this article, I’ll be sharing my recent insights into analytical information processing — focusing on Business Intelligence dashboards and the…” This highlights the importance of balancing real-time access with performance factors, crucial for organizations striving to enhance their decision-making processes.
-
Case Studies: A significant case analysis on relationship dependencies illustrates how changes in one component can affect others, resulting in circular relationships that compromise information integrity. Understanding these dependencies is essential for managing the complexities associated with real-time data access, as they can greatly influence analysis and reporting.
-
Usage Metrics: It is important to note that usage metrics reports are not available in My Workspace, which may relate to the restrictions of immediate inquiry regarding accessibility and reporting.
In summary, while immediate access offers the promise of real-time data retrieval, organizations must navigate its limitations thoughtfully to ensure optimal performance and data integrity. By leveraging Business Intelligence and RPA solutions such as EMMA RPA and Automate from Creatum GmbH, businesses can address these challenges and foster growth through informed decision-making.
Performance Considerations for Direct Query
To enhance performance when utilizing Direct Query in Power BI, several key strategies should be implemented:
-
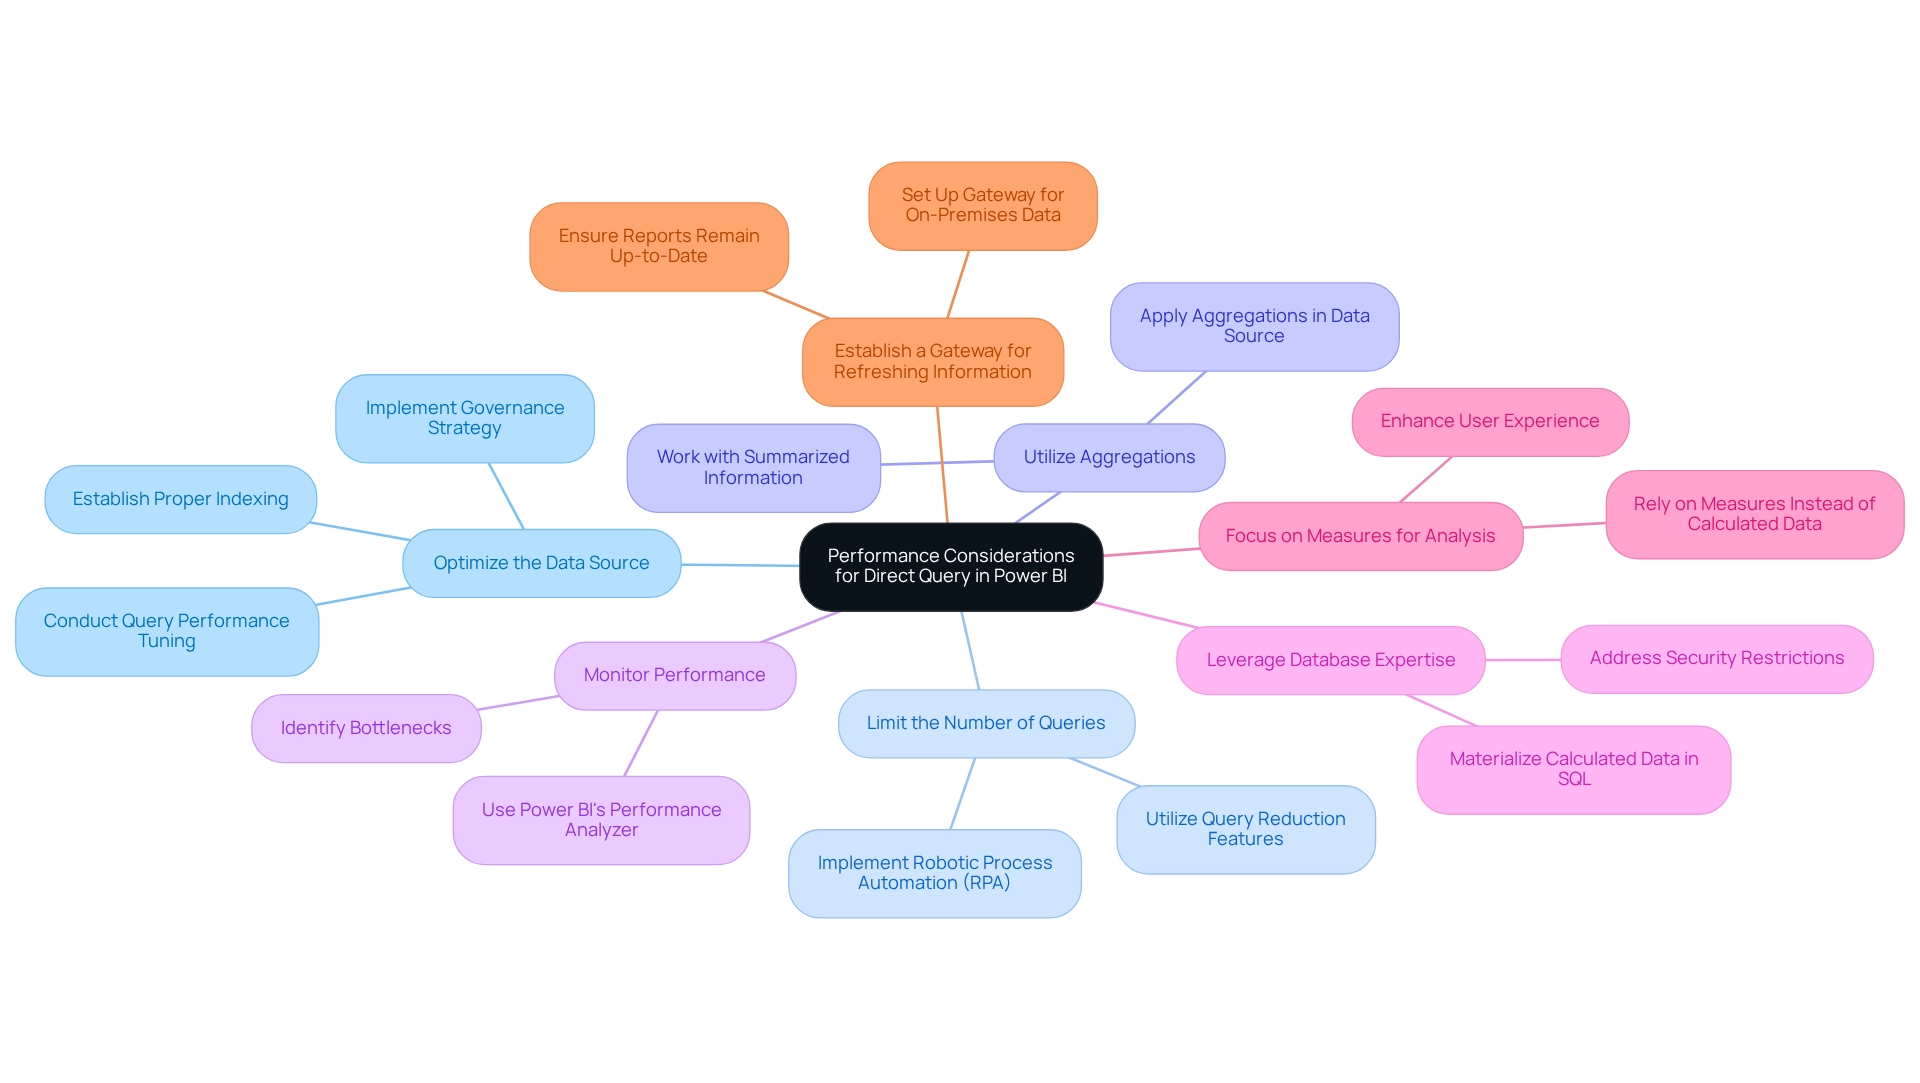
Optimize the Data Source: Ensure that the underlying database is meticulously optimized. This includes establishing proper indexing and conducting query performance tuning, which can significantly reduce response times and improve overall efficiency. This optimization is crucial to address the frequent issue of inconsistencies that can occur from poorly managed information sources. Furthermore, establishing a governance strategy can assist in preserving information integrity and consistency across reports.
-
Limit the Number of Queries: Utilize features like query reduction to decrease the frequency of requests sent to the source. This practice not only streamlines performance but also alleviates the load on the database, leading to faster report generation and allowing teams to focus on leveraging insights rather than spending excessive time on report creation. Robotic Process Automation (RPA) can also be utilized to automate repetitive tasks, further enhancing efficiency.
-
Utilize Aggregations: Applying aggregations within the information source can significantly decrease the amount of information being queried. This is especially advantageous for extensive datasets, as it improves performance by enabling the application to operate with summarized information instead of unprocessed material, thereby offering clearer, actionable insights.
-
Monitor Performance: Regularly evaluate the performance of real-time reports using tools like Power BI’s Performance Analyzer. This proactive monitoring aids in recognizing bottlenecks and areas for enhancement, ensuring that reports operate seamlessly and effectively, which is vital for preserving stakeholder confidence in the information presented.
-
Leverage Database Expertise: As highlighted in a case study explaining what is direct query implementation, having database expertise is crucial for optimizing performance. The case study outlines the challenges encountered when implementing DirectQuery, especially in environments with security restrictions that require on-premises information storage. It highlights the necessity for database proficiency to enhance performance and the challenges in attaining uniform information refresh across visuals. Achieving good performance with DirectQuery is complex and may require materializing calculated information in SQL, which could negatively impact user experience.
-
Focus on Measures for Analysis: Experts suggest depending on measures instead of implementing calculated information in SQL. As David Cenna, a certified expert in Data Import perspective, states, “Therefore, @Sam.McKay has always recommended to rely most of the times on measures in order to achieve diverse analysis.” This approach not only simplifies the analysis process but also enhances user experience by maintaining performance integrity.
-
Establish a Gateway for Refreshing Information: When publishing reports created with DirectQuery to the BI Service, it is essential to establish a Gateway for refreshing from on-premises information. This requirement is critical for ensuring that the reports remain up-to-date and perform optimally.
By implementing these approaches, organizations can greatly enhance the effectiveness of what is direct query in BI, resulting in more efficient information management and improved decision-making abilities. Moreover, incremental refresh verifies that only a few thousand new rows are retrieved daily, further highlighting the effectiveness of information management in immediate access.
Best Practices for Optimizing Direct Query Usage
To maximize the effectiveness of Direct Query in Power BI, consider these best practices:
-
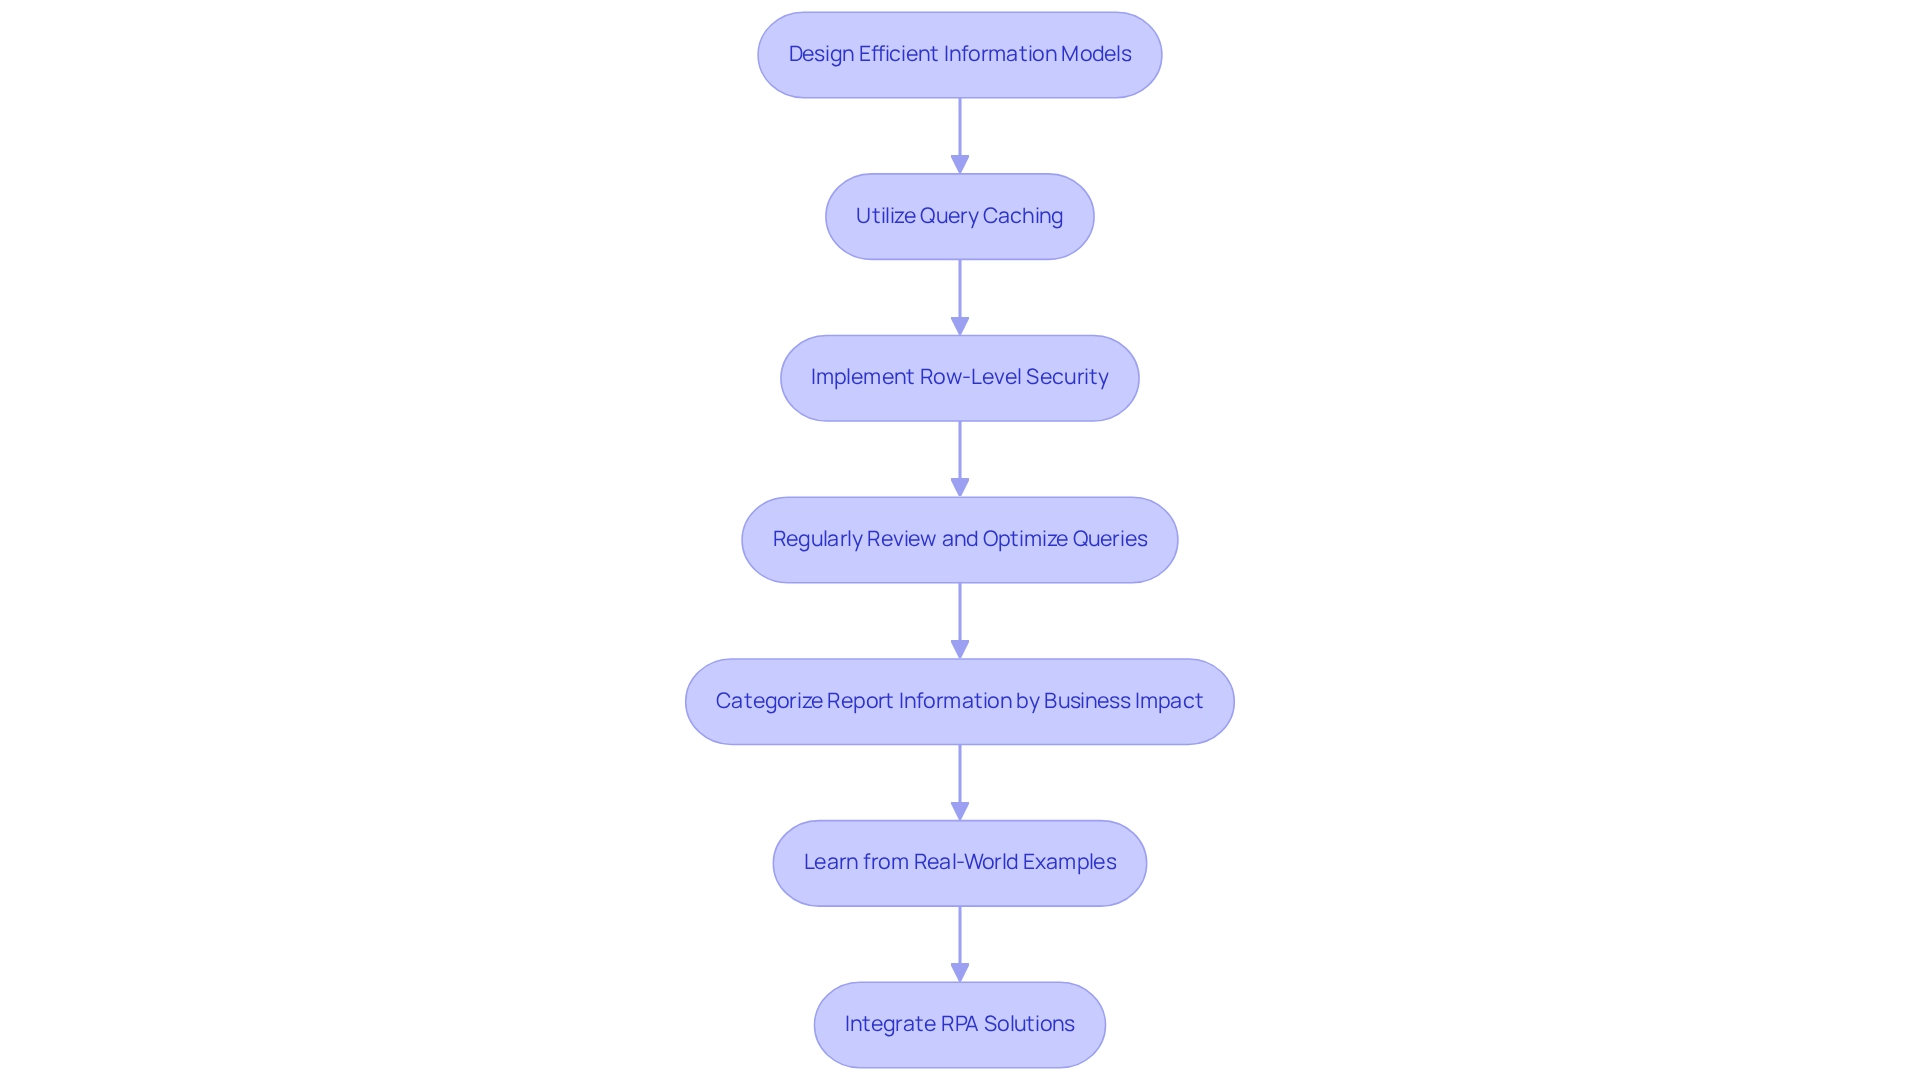
Design Efficient Information Models: Focus on organizing your models to reduce complexity. Ensure that only essential information is queried. This approach streamlines performance and enhances user experience, aligning with the demand for tailored solutions in today’s AI landscape.
-
Utilize Query Caching: Take advantage of Power BI’s query caching capabilities to significantly boost performance. By storing results, you reduce the number of queries sent to the information source, resulting in quicker report loading times and enhanced responsiveness. This efficiency is vital for extracting significant insights from your data.
-
Implement Row-Level Security: Establish row-level security to manage access to information at a granular level. This practice ensures users only view data relevant to their roles, enhancing security and optimizing performance by limiting the data processed during queries, thereby supporting operational efficiency.
-
Regularly Review and Optimize Queries: Make it a routine to analyze your direct queries. Identifying and addressing inefficiencies can lead to substantial performance improvements, ensuring that your reports run smoothly and effectively. This is crucial for leveraging insights from Power BI dashboards.
-
Categorize Report Information by Business Impact: Use sensitivity labels to categorize report content based on its business impact. This strategy not only raises user awareness about information security but also aids in prioritizing access and management strategies, reinforcing the significance of BI in driving insight-driven decisions.
-
Learn from Real-World Examples: Reflect on the case study regarding Azure Storage Throttling, which underscores the importance of implementing strategies to avoid overloading the storage account during query execution. By doing so, organizations can mitigate throttling effects and enhance overall query performance, showcasing the practical outcomes of effective BI practices.
-
Integrate RPA Solutions: Consider incorporating Robotic Process Automation (RPA) to automate repetitive tasks related to information management and reporting. This integration can significantly enhance operational efficiency, allowing teams to focus on strategic decision-making instead of mundane tasks.
As Tim Radney remarked, “Thanks for this post; it was a good read,” emphasizing the value of sharing best practices within the community. By adhering to these best practices, organizations can improve their use of Direct Query in Business Intelligence, resulting in enhanced operational efficiency and more insightful analysis. Staying informed about best practices, as discussed in the author’s recent presentation at the PASS Community Summit, is essential for continued success in effectively utilizing BI.
Creatum GmbH is dedicated to assisting companies in overcoming these challenges and harnessing the full capabilities of their information.
Security Considerations in Direct Query
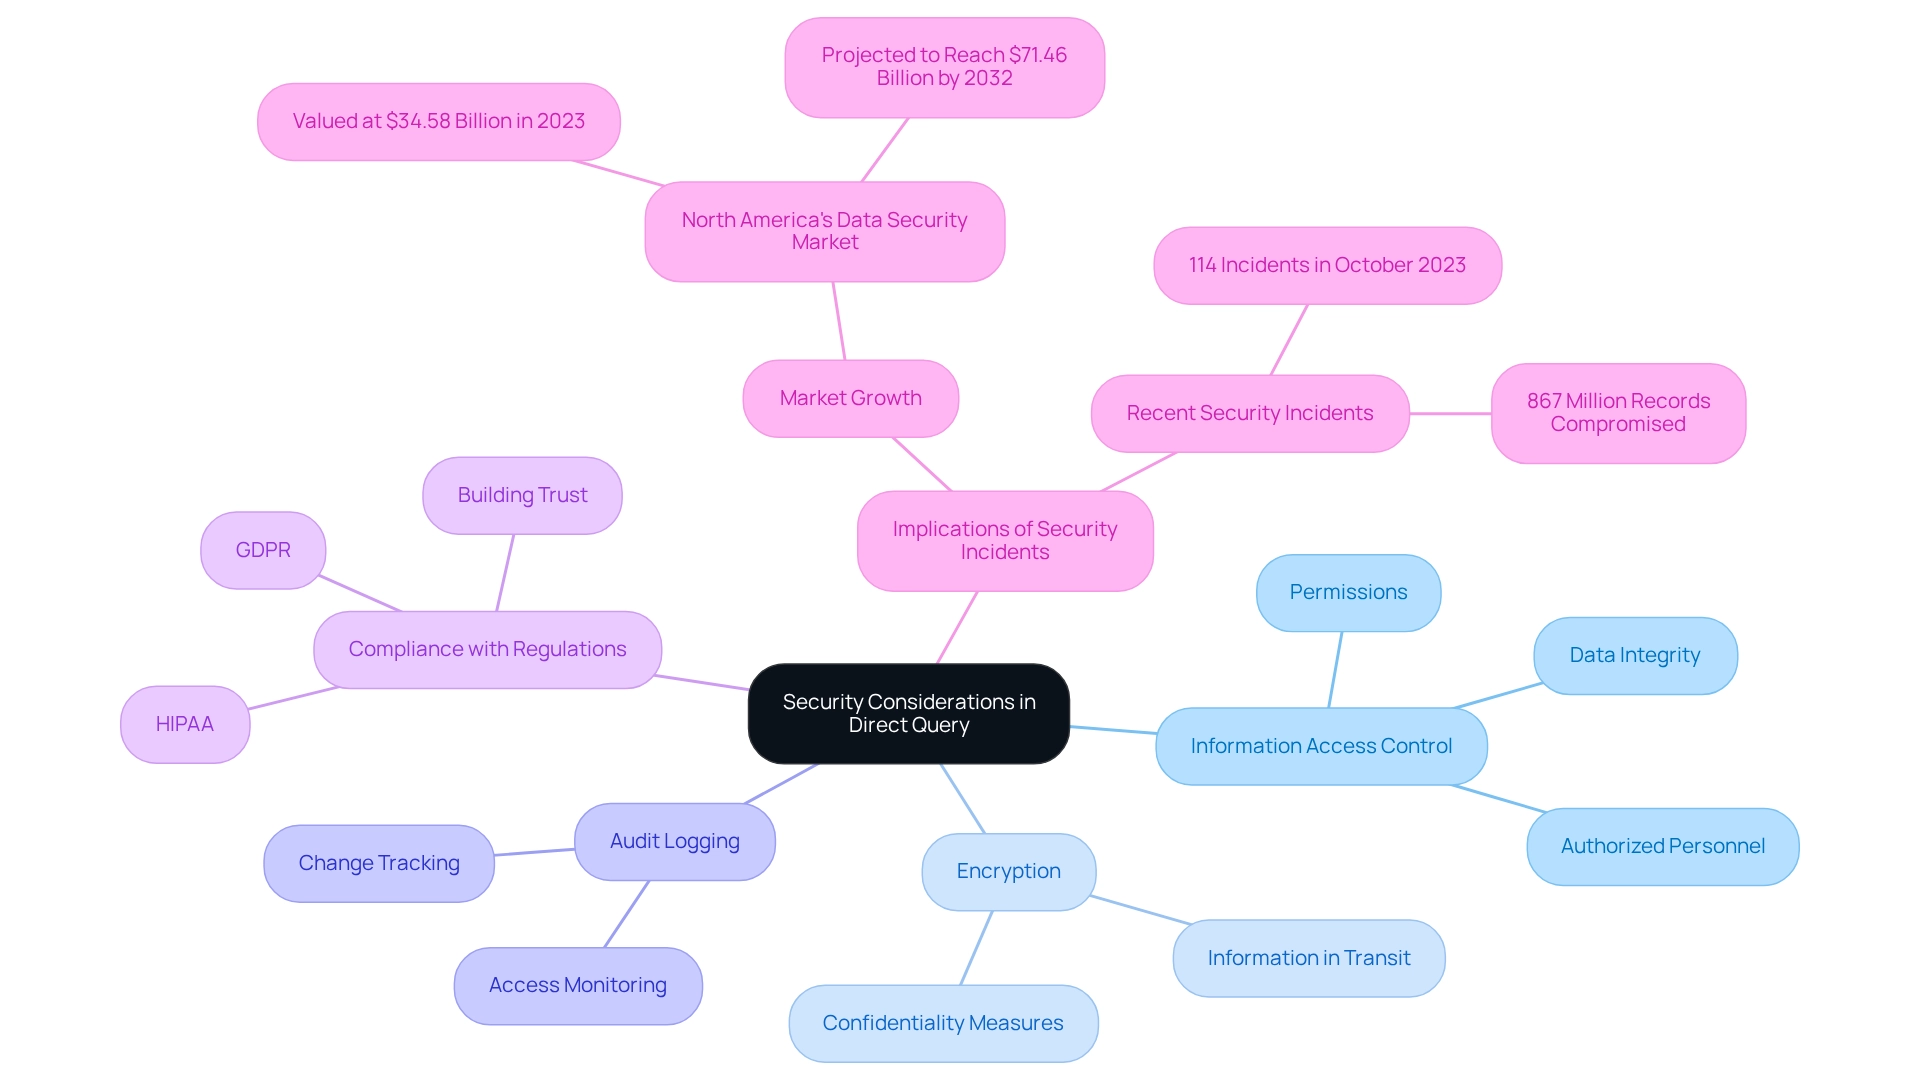
When utilizing Direct Query in Power BI, organizations must prioritize several critical security aspects to safeguard their data while effectively leveraging insights:
-
Information Access Control: Implementing strict access controls to the underlying information sources is crucial. This involves setting appropriate permissions for users accessing reports in Power BI, ensuring that only authorized personnel can view or manipulate sensitive information. Such practices not only protect information but also preserve the integrity of the insights obtained.
-
Encryption: Implementing encryption for information in transit is vital. This measure safeguards sensitive information from unauthorized access during query execution, thereby preserving the confidentiality and integrity of the information being processed. In an information-rich environment, the emphasis should be on actionable insights rather than merely raw data.
-
Audit Logging: Strong audit logging systems are essential for monitoring access and changes to the source. This practice provides a thorough account of who accessed which information and when, promoting accountability and transparency in information management. Such transparency is critical for building trust in the insights generated from Power BI dashboards.
-
Compliance with Regulations: Organizations must ensure that their use of Direct Query aligns with relevant information protection regulations, such as GDPR and HIPAA. Masha Komnenic, an Information Security and Data Privacy Specialist, emphasizes the importance of compliance, stating, “Implementing effective security measures is not just about protecting information; it’s about building trust with stakeholders through transparency and accountability.” Adhering to these regulations not only reduces legal risks but also enhances stakeholder trust by demonstrating a commitment to information privacy and security.
Considering the rising number of security incidents—114 publicly disclosed cases in October 2023 alone, compromising over 867 million records valued at over $5 billion—organizations must grasp the significance of Direct Query to adopt proactive measures that strengthen their security strategies. The North American information security market, valued at $34.58 billion in 2023, is anticipated to expand considerably, indicating an increased need for effective risk management solutions. This growth underscores the necessity for organizations to understand Direct Query in Business Intelligence, as it requires investment in robust access control measures and encryption practices to ensure their information remains secure and compliant, facilitating informed decision-making that fosters growth and innovation.
Moreover, organizations must recognize that inefficient utilization of Business Intelligence can lead to a competitive disadvantage, as time-consuming report generation and information inconsistencies obstruct the capacity to obtain actionable insights from Power BI dashboards. Creatum GmbH is committed to assisting organizations in navigating these challenges and enhancing their operational efficiency.
The Impact of Direct Query on Operational Efficiency
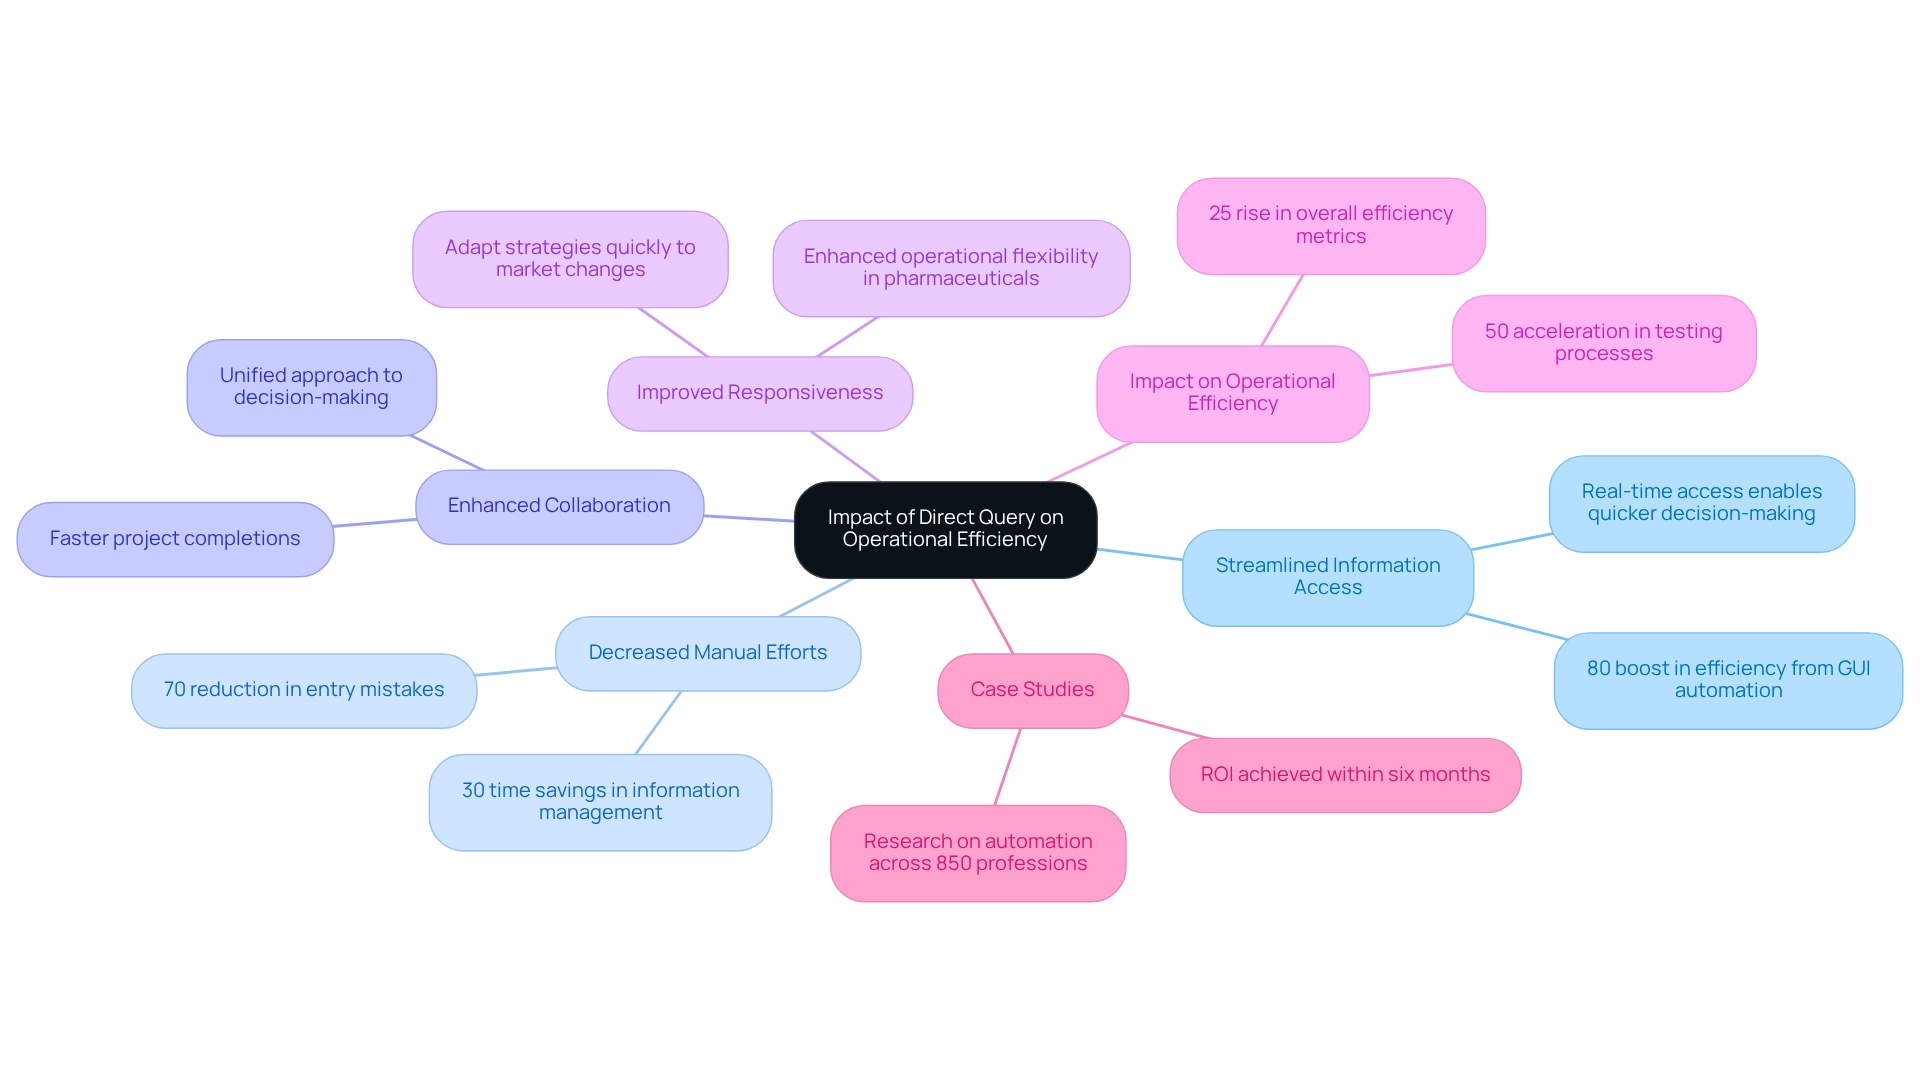
Direct Query can significantly enhance operational efficiency in various ways:
-
Streamlined Information Access: Direct query allows for real-time access to information, enabling quicker decision-making and significantly decreasing the time invested in information preparation. This immediacy empowers organizations to act swiftly on insights, which is crucial in today’s fast-paced business environment. By simplifying information access, organizations can propel growth and innovation, aligning with their mission to improve operational efficiency. A recent case study illustrated how a mid-sized healthcare firm faced obstacles like manual entry mistakes and sluggish software testing, but enhanced its operational workflows by adopting GUI automation, resulting in an 80% boost in efficiency.
-
Decreased Manual Efforts: By automating information retrieval, this method reduces the necessity for manual imports. This shift enables teams to focus on analysis instead of information management, resulting in significant time savings. Industry specialists have observed that organizations utilizing direct query can save up to 30% of the time they previously dedicated to information management. This efficiency is especially significant considering the environmental impact of information processing, as training one large language model can emit approximately 315 tons of carbon dioxide. In the case study, the healthcare company decreased entry mistakes by 70% through automation, demonstrating the effectiveness of such solutions.
-
Enhanced Collaboration: With current information readily available, teams can collaborate more effectively. This ensures that all stakeholders are working with the same information, fostering a unified approach to decision-making. Operations managers have indicated that streamlined data access, defined by direct query, has resulted in enhanced team alignment and quicker project completions. Testimonials from clients like NSB GROUP highlight how Creatum GmbH’s technology solutions have driven business growth through enhanced collaboration.
-
Improved Responsiveness: Organizations can respond more quickly to changing business conditions and market demands. By leveraging real-time insights, they can adapt strategies and operations promptly. For example, a recent case study emphasized how a pharmaceutical firm enhanced its operational flexibility by incorporating direct query, which enabled it to modify its supply chain strategies in reaction to market changes. This adaptability is essential, especially as pharmaceutical companies must implement quality checks and ensure explainability when integrating new technologies.
-
Impact on Operational Efficiency: The adoption of immediate data access has been demonstrated to improve operational efficiency considerably. Based on recent statistics, organizations using real-time data access have observed a 25% rise in overall efficiency metrics. This enhancement is credited to the decrease in latency and the capacity to make informed decisions quickly. As Michael Chui, a partner at McKinsey, stated, ‘The moment to take action is now,’ highlighting the urgency of embracing technologies such as direct query to enhance operational efficiency. The case study on GUI automation also reported a 50% acceleration in testing processes, further illustrating the benefits of automation.
-
Case Studies: An extensive examination of automation possibilities across 850 professions demonstrated that organizations utilizing immediate access not only improved their information retrieval but also optimized their overall operational processes. This research underscores the importance of adopting such technologies to stay competitive in the evolving landscape. The transformative effect of Creatum’s Power BI Sprint service has also been highlighted in client testimonials, demonstrating accelerated analytics and reporting success. Notably, the healthcare company achieved a return on investment (ROI) within six months of implementing these solutions.
In summary, understanding direct query not only streamlines data access and decision-making but also plays a pivotal role in driving operational efficiency, making it an essential tool for organizations aiming to thrive in 2025 and beyond.
Conclusion
The implementation of Direct Query in Power BI stands out as a transformative solution for organizations aiming to elevate their data analytics capabilities. By providing real-time access to data, Direct Query empowers businesses to swiftly respond to market changes and operational demands, ultimately driving enhanced decision-making and operational efficiency. The capability to connect directly to data sources eliminates cumbersome data imports, streamlining reporting processes while reducing manual errors and freeing up valuable time for strategic analysis.
However, while the benefits of Direct Query are compelling, it is crucial to recognize and address the associated challenges, including performance issues and limitations on data transformations. Organizations must adopt best practices, such as:
- Optimizing data sources
- Implementing robust security measures
to fully harness the potential of Direct Query. By doing so, they can mitigate risks and ensure data integrity is maintained, fostering a more informed decision-making environment.
Ultimately, embracing Direct Query in Power BI positions organizations to thrive in an increasingly data-driven landscape. As they leverage real-time insights and automated processes, businesses can enhance collaboration, improve responsiveness, and achieve significant gains in operational efficiency. The journey to effective data utilization begins with a thorough understanding and implementation of Direct Query, paving the way for sustained growth and innovation in the years to come.
Frequently Asked Questions
What is Direct Query in Business Intelligence (BI)?
Direct Query is a connectivity mode in Business Intelligence that allows users to connect directly to data sources without importing data into BI’s internal storage, enabling real-time access to the most current information.
What are the advantages of using Direct Query?
The advantages of Direct Query include real-time information access, reduced information storage needs, dynamic reporting, and scalability for handling large datasets.
How does Direct Query enhance operational efficiency?
Direct Query eliminates the need for periodic data refreshes, allowing organizations to analyze real-time information, automate workflows through Robotic Process Automation (RPA), and reduce errors, ultimately enabling teams to focus on strategic tasks.
What are the performance considerations when using Direct Query?
The response time for queries can vary depending on the performance of the underlying data source and the complexity of the executed queries, which may affect overall performance.
How does Direct Query impact decision-making processes in organizations?
Organizations leveraging real-time retrieval through Direct Query can achieve faster decision-making processes, with some studies indicating a reduction in reporting times by up to 50% compared to traditional import methods.
What is the significance of real-time data access in business intelligence?
Real-time data access is critical for informed decision-making, particularly in fast-paced industries, as it allows companies to pivot quickly and capitalize on new opportunities.
What role does RPA play in conjunction with Direct Query?
RPA streamlines workflows and reduces errors, enhancing the effectiveness of Direct Query by allowing teams to focus on more strategic, value-adding tasks.
Can Direct Query handle large datasets effectively?
Yes, Direct Query is designed to manage extensive datasets that may exceed the memory thresholds of BI tools, making it suitable for information-heavy operations.
What are some real-world examples of organizations benefiting from Direct Query?
Companies like Domino’s Pizza have reported significant improvements in customer satisfaction and sales after implementing real-time analytics systems, demonstrating the strategic value of Direct Query in optimizing data analysis capabilities.
How does Direct Query ensure compliance and security?
The implementation of virtual network data gateways in Power BI enables secure connections to services within an Azure virtual network, enhancing data management capabilities while maintaining compliance and security.
Overview
Diagnostic analytics can be broadly categorized into two distinct areas:
- Anomaly detection
- What-if analysis
Each category serves a unique purpose in the realm of understanding past events and informing future decisions. Anomaly detection is crucial as it identifies unusual patterns that demand immediate attention, ensuring that organizations can respond swiftly to potential issues. On the other hand, what-if analysis empowers organizations to simulate various scenarios, allowing them to predict outcomes effectively. This capability not only enhances operational efficiency but also supports strategic planning. By leveraging these analytical tools, organizations can make informed decisions that drive success.
Introduction
In the dynamic realm of data analytics, diagnostic analytics emerges as an essential tool for organizations seeking to comprehend the ‘why’ behind historical events and trends. This analytical approach transcends simple data summarization, offering profound insights that foster informed decision-making and enhance operational efficiency.
With businesses increasingly acknowledging its critical role—particularly in industries such as healthcare and finance—the need for integrating advanced technologies and methodologies becomes paramount.
As the global market for diagnostic analytics is poised for significant growth, grasping its applications, challenges, and implementation strategies is crucial for organizations aiming to effectively leverage data in a competitive landscape.
Understanding Diagnostic Analytics: An Overview
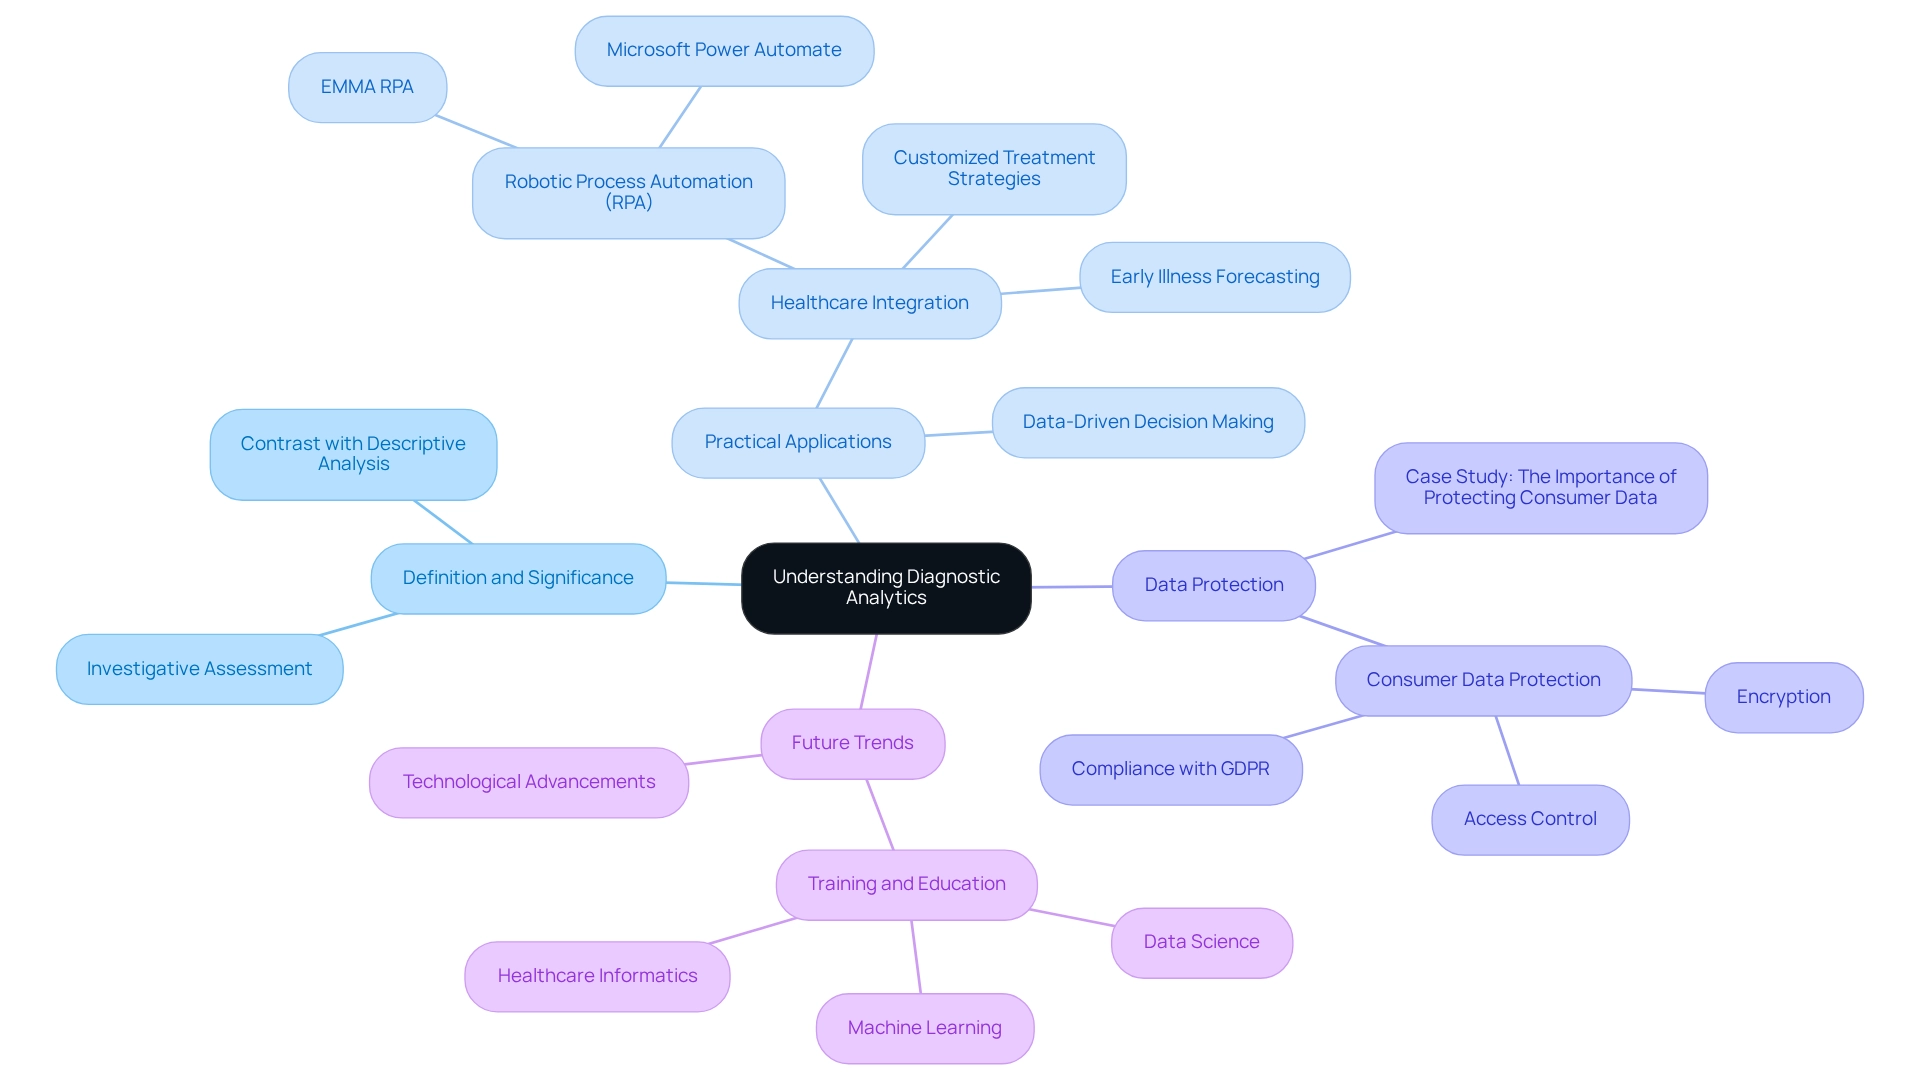
Diagnostic analysis is a pivotal field that delves into the underlying reasons for past occurrences and trends. Investigative assessment, one of the two broad categories of diagnostic analytics, provides deeper insights into why specific results occurred, in contrast to descriptive analysis, which merely summarizes historical data. This analytical approach is essential for organizations aiming to enhance operational efficiency and make informed, data-driven decisions.
As we look toward 2025, the landscape of assessment methods is evolving rapidly, with organizations increasingly recognizing its significance in optimizing operations. The global Internet of Medical Things market is projected to reach a staggering $286.77 billion, underscoring the growing importance of assessment metrics in healthcare and operational efficiency. By pinpointing the root causes of inefficiencies, businesses can effectively tackle issues and refine their strategic planning processes.
Healthcare organizations, for instance, are leveraging assessment insights in conjunction with Robotic Process Automation (RPA) tools like EMMA RPA and Microsoft Power Automate. These technologies enhance patient outcomes through early illness forecasting and tailored treatment strategies, showcasing their transformative potential.
Numerous practical examples exist, with firms employing analytical tools to inform decision-making. Organizations that have established robust information protection measures, such as encryption and access control, have experienced significant improvements in operational efficiency while ensuring compliance with regulations like GDPR. This highlights the dual benefit of analytical assessment: enhancing operational processes while safeguarding consumer data.
The case study titled “The Importance of Protecting Consumer Data” illustrates how these measures can mitigate risks and bolster operational effectiveness.
Industry leaders assert that diagnostic analysis is vital for informed decision-making. Dmytro Tymofiiev, Delivery Manager at SPD Technology, emphasizes, “Sometimes it makes sense to assist your healthcare professionals in acquiring further education in science related to information, machine learning, or healthcare informatics to gain a deeper comprehension of the complexities of analysis.” Investing in knowledge is crucial as organizations navigate the intricacies of data analysis, ultimately leading to improved outcomes.
In conclusion, assessment analysis not only aids in understanding past performance but also plays a critical role in shaping future strategies. By distinguishing itself from descriptive data analysis, it empowers organizations to make informed choices that enhance operational efficiency and foster innovation. Current trends in diagnostic analysis for 2025 indicate a sustained focus on integrating advanced technologies, such as RPA, and training, further amplifying its impact on operational efficiency.
Exploring the Two Broad Categories of Diagnostic Analytics
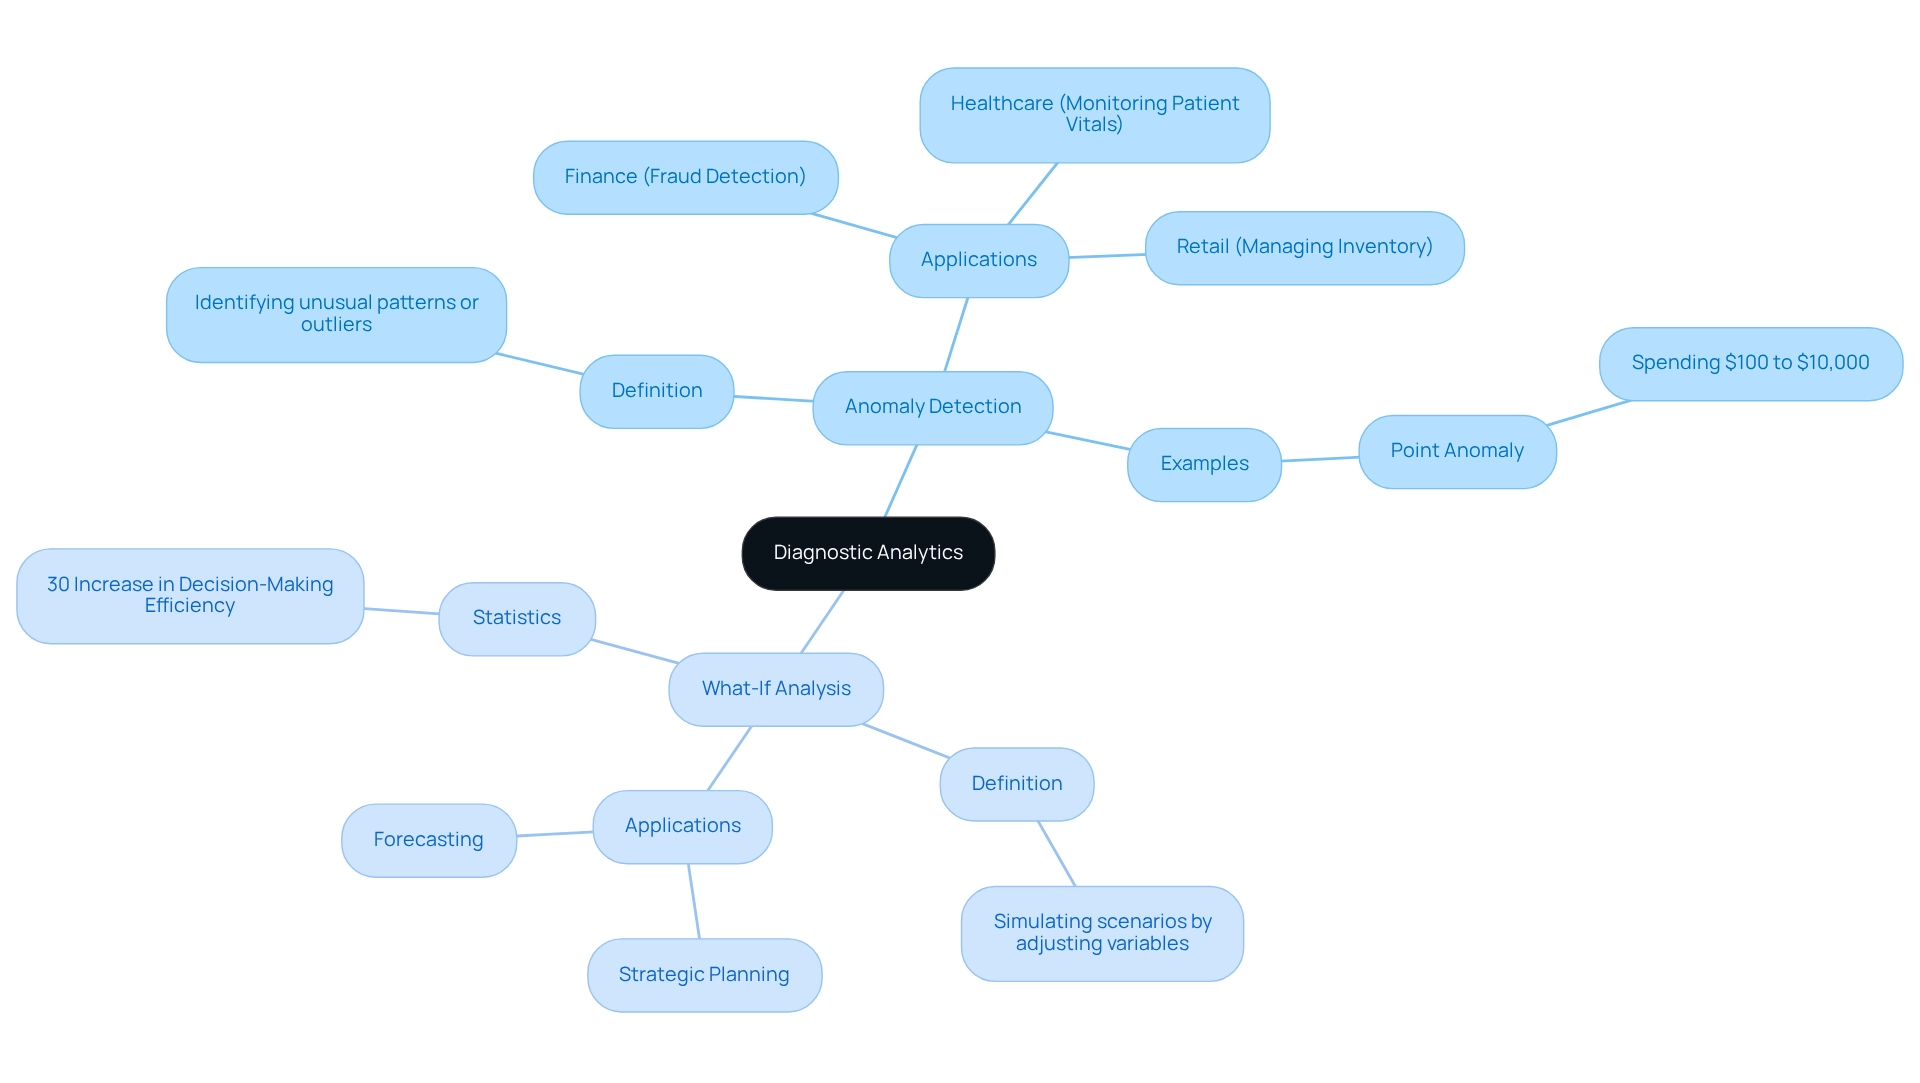
Diagnostic analytics can be divided into two primary types: anomaly detection and what-if analysis. Anomaly detection is essential for identifying unusual patterns or outliers in information that deviate from expected behavior. For instance, a consumer typically spending $100 on groceries suddenly spending $10,000 exemplifies a point anomaly that warrants immediate investigation.
This technique is crucial across various industries, including finance for fraud detection, healthcare for monitoring patient vitals, and retail for managing inventory. By utilizing real-time information ingestion—such as Tinybird’s method for sales transactions—organizations can identify anomalies rapidly and initiate alerts, thereby improving operational responsiveness.
Moreover, the integration of Power BI services can significantly enhance reporting and provide actionable insights. With features like the 3-Day Power BI Sprint, businesses can swiftly create professionally designed reports that facilitate better decision-making. This becomes particularly important when addressing data inconsistency and governance challenges in business reporting, ultimately leading to improved operational efficiency.
Conversely, what-if analysis empowers businesses to simulate various scenarios by adjusting key variables to observe potential outcomes. This analytical method is invaluable for strategic planning and forecasting, enabling entities to evaluate the impact of various decisions prior to execution. Recent statistics indicate that businesses employing what-if analysis report a significant enhancement in decision-making efficiency, with studies demonstrating that entities incorporating this technique into their operational planning processes experience up to a 30% increase in efficiency.
The distinction between anomaly detection and what-if analysis is essential, as it highlights their differing objectives: anomaly detection aims to identify issues that require immediate attention, while what-if analysis supports proactive planning by exploring potential future scenarios. Expert insights underscore the significance of these techniques in diagnostic analytics, with content creator Bex Tuychiev noting, “I enjoy writing in-depth articles on AI and ML with a touch of sarcasm because you need to do something to make them a little less tedious.” This emphasizes the necessity for engaging and informative content in the field.
Furthermore, utilizing AI solutions, such as Small Language Models and GenAI Workshops, can further enhance companies’ capabilities in addressing quality challenges and training personnel effectively. Case studies, like the two-step outlier detection approach for weekly and monthly information using the Generalized Extreme Studentized Deviate (GESD) test combined with an adjusted box-plot method, illustrate the effective application of both techniques. These examples showcase how organizations can harness these tools to enhance their analytical capabilities and make informed decisions, ultimately driving operational efficiency and strategic growth.
Additionally, the adoption of Robotic Process Automation (RPA) can streamline manual workflows, allowing teams to focus on more strategic, value-adding work, thereby enhancing overall productivity in a rapidly evolving AI landscape.
Category One: Identifying Anomalies and Outliers
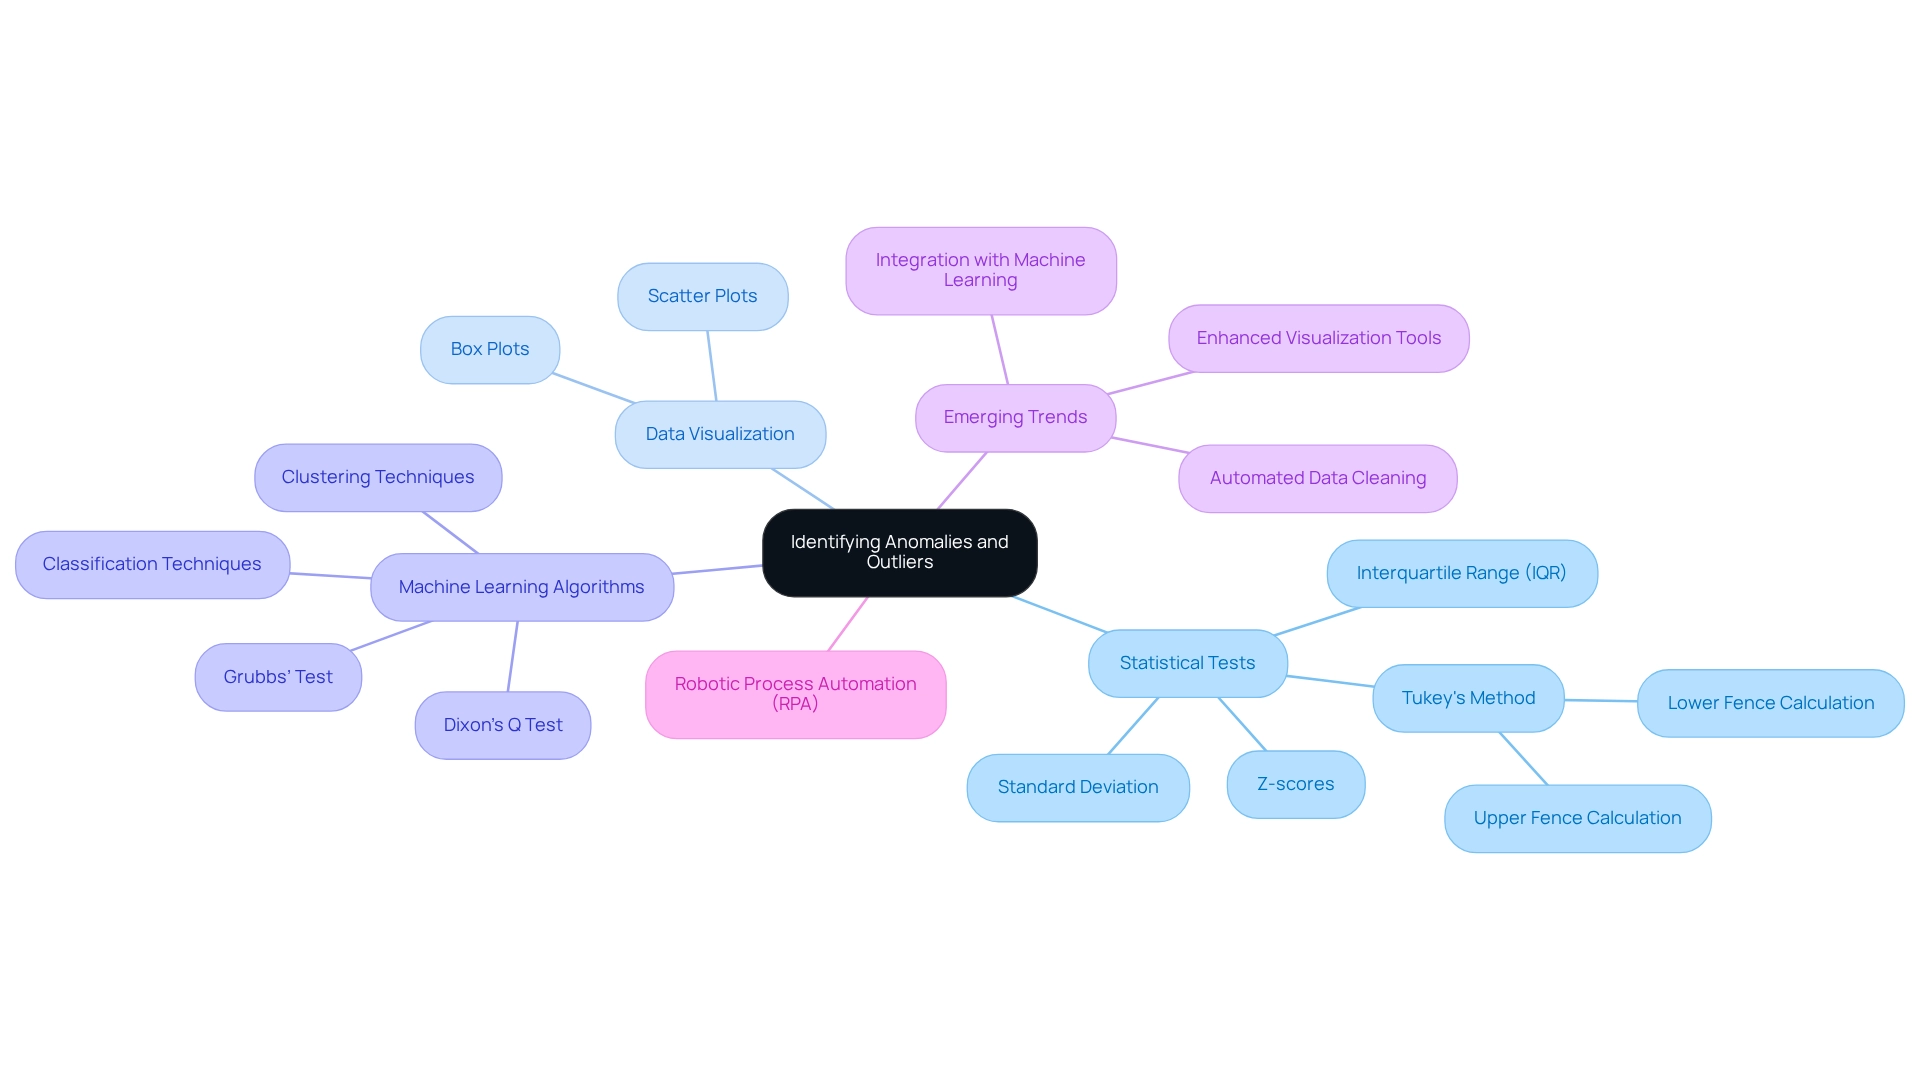
Recognizing anomalies and outliers is essential for preserving information integrity and operational efficiency. This process employs a combination of statistical methods and visualization techniques to pinpoint points that diverge significantly from expected patterns. Key techniques include:
-
Statistical Tests: Techniques such as z-scores and the interquartile range (IQR) form the foundation of outlier detection. Tukey’s method, for example, defines the lower and upper fences for outliers using the formula: lower fence = Q1 – k * IQR and upper fence = Q3 + k * IQR, where k is typically set to 1.5 for moderate outliers. Additionally, the function of standard deviation is crucial; values that fall beyond the range established by the empirical rule are flagged as potential outliers. These methods empower analysts to gauge how far an observation is from the mean, effectively identifying possible anomalies.
-
Data Visualization: Visualization tools like box plots and scatter plots are pivotal in anomaly detection. These graphical representations allow analysts to swiftly identify irregularities by providing clear visual context. For instance, box plots can illustrate the distribution of values and highlight outliers, while scatter plots can reveal clusters and gaps in information that may indicate anomalies.
-
Machine Learning Algorithms: The integration of machine learning in anomaly detection has transformed the field. Algorithms such as clustering and classification can automatically identify outliers in extensive datasets, significantly boosting efficiency. Techniques like Grubbs’ test and Dixon’s Q test are utilized in manufacturing quality control to detect defective measurements, thereby minimizing waste and enhancing quality assurance. As noted by Andrew Rukhin, “this really transforms to a t distribution,” underscoring the significance of statistical methods in this context.
Alongside these conventional techniques, leveraging AI through Small Language Models can enhance information analysis and improve quality, while GenAI Workshops can provide teams with the necessary training to implement these technologies successfully. Furthermore, the adoption of Robotic Process Automation (RPA) can streamline manual workflows, allowing organizations to focus on strategic initiatives rather than repetitive tasks. The effectiveness of these methods is reinforced by emerging trends in outlier detection, which include the integration of machine learning for automated information cleaning and advanced visualization tools.
As data scientists continue to explore these advancements, the consensus is clear: combining statistical methods, machine learning algorithms, and RPA not only enhances anomaly detection but also enables companies to tackle underlying issues, such as operational inefficiencies and data quality challenges.
Category Two: Performing What-If Analysis
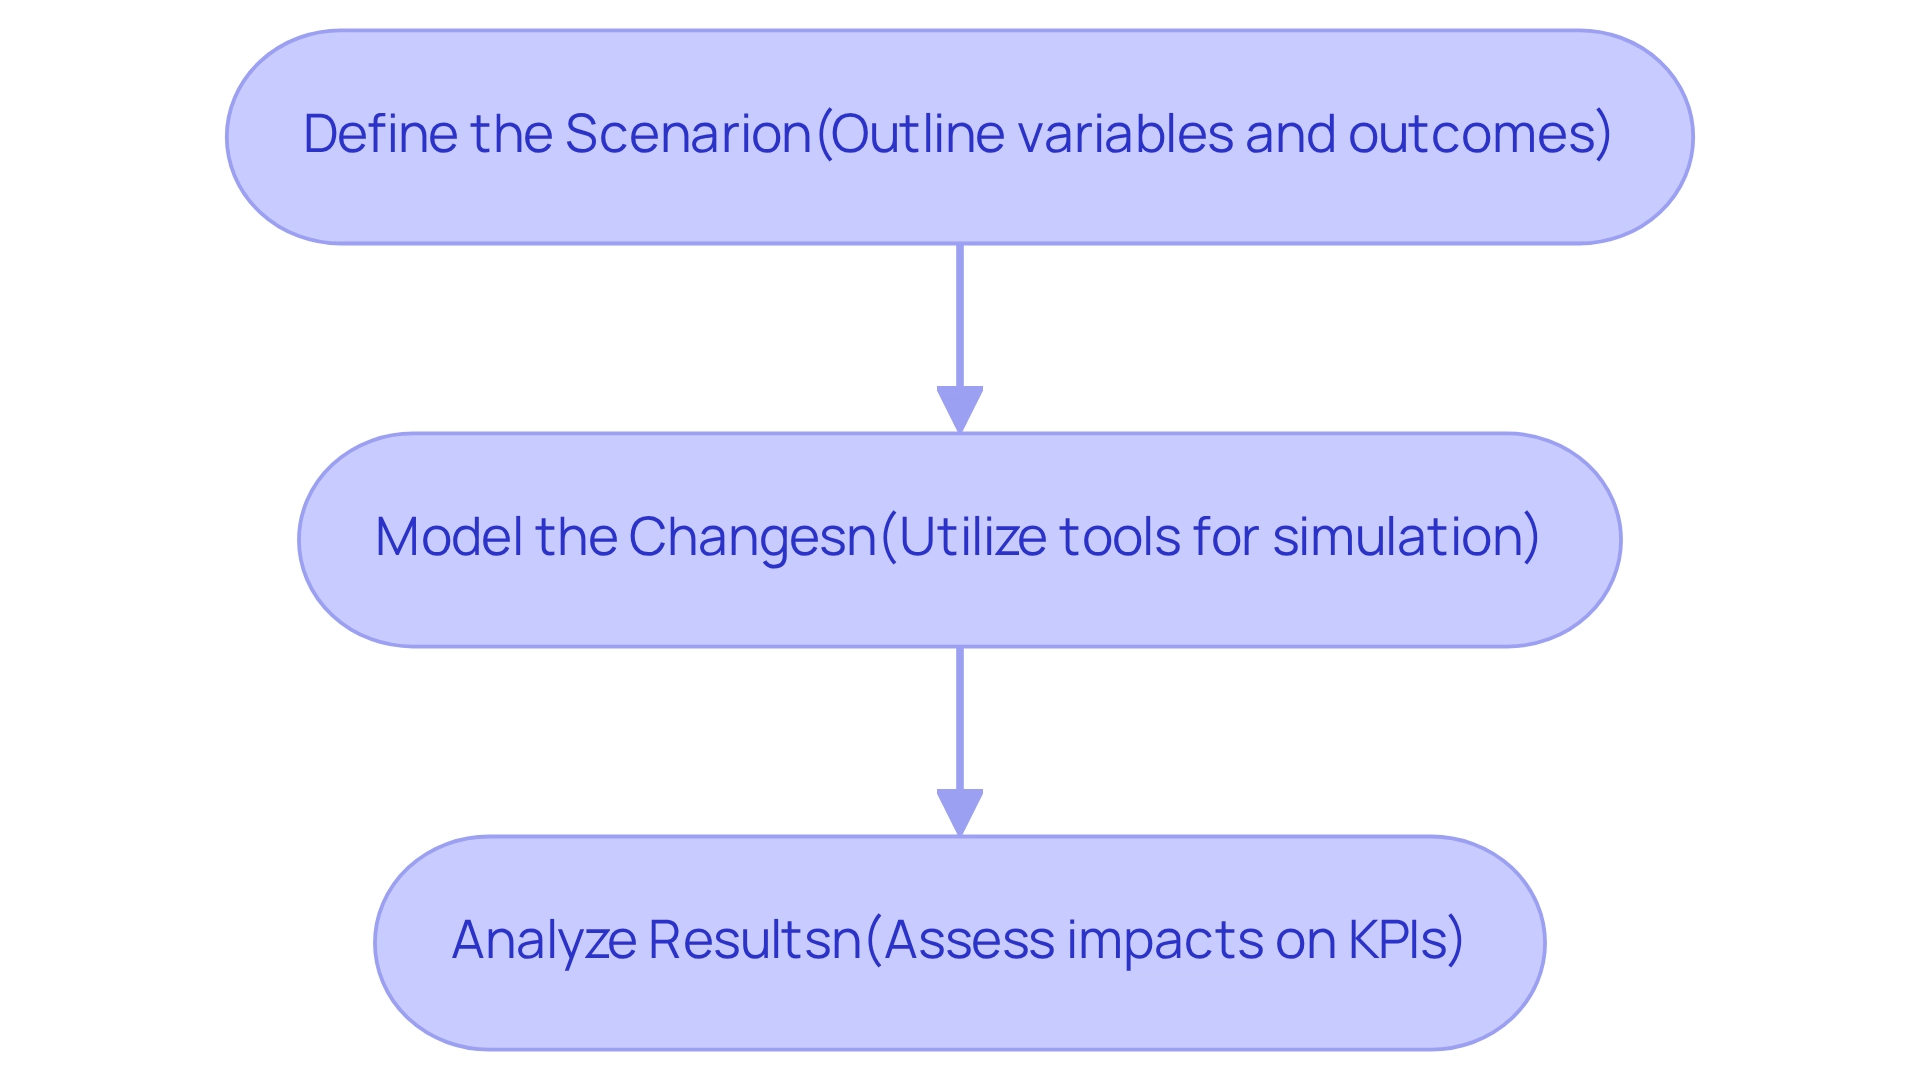
What-if analysis is a powerful technique that involves altering input variables to evaluate their impact on outcomes. This approach is widely employed in financial modeling, risk management, and operational planning, enabling entities to navigate uncertainties effectively. The key steps in performing what-if analysis include:
-
Define the Scenario: Begin by clearly outlining the variables that will be modified and the anticipated outcomes. This step is crucial for setting the parameters of the analysis.
-
Model the Changes: Utilize spreadsheet software or specialized analytics tools, potentially enhanced by Robotic Process Automation (RPA), to simulate various scenarios. This modeling allows for a structured approach to understanding potential outcomes based on different inputs, streamlining the workflow and reducing manual effort.
-
Analyze Results: After modeling, assess how the changes influence key performance indicators (KPIs). This examination is essential for making informed choices that align with institutional objectives, particularly in a swiftly changing AI environment where data-driven insights are crucial.
Utilizing what-if analysis enables entities to prepare for various future scenarios, refining strategies to bolster resilience against market variations. Recent statistics suggest that around 70% of entities utilize what-if analysis in their financial modeling processes, underscoring its importance in strategic planning. Additionally, the performance of predictive models can be quantified, with an R² score of 0.82 demonstrating their effectiveness in forecasting outcomes.
Expert insights highlight the importance of scenario modeling in operational planning, with financial analysts emphasizing that effective scenario modeling can lead to more robust decision-making frameworks. As noted by P8, scenario modeling serves as an adjunct to traditional analysis, enhancing the overall decision-making process. Moreover, as companies progressively embrace advanced analytics, the amalgamation of what-if analysis with AI and machine learning is anticipated to improve predictive capabilities, enabling real-time information processing and more tailored customer experiences.
Case studies demonstrate the practical use of what-if analysis in financial modeling. For example, companies that have implemented this technique have reported improved risk management strategies, enabling them to identify vulnerabilities and adapt to changing market conditions. The evolution of influence analysis, which is expected to integrate more deeply with AI and machine learning, will further enhance the capabilities of what-if analysis, fostering sustainable growth and corporate responsibility.
As we progress through 2025, the trend towards employing what-if analysis for business planning continues to expand, with companies increasingly acknowledging its importance in promoting sustainable growth and corporate responsibility. Additionally, WIA techniques facilitate collaborative analyses, allowing stakeholders to engage in decision reasoning collectively. Utilizing tools such as Power BI can further improve reporting and actionable insights, ensuring that organizations are prepared to make informed choices based on thorough analysis.
Practical Applications of Diagnostic Analytics in Business
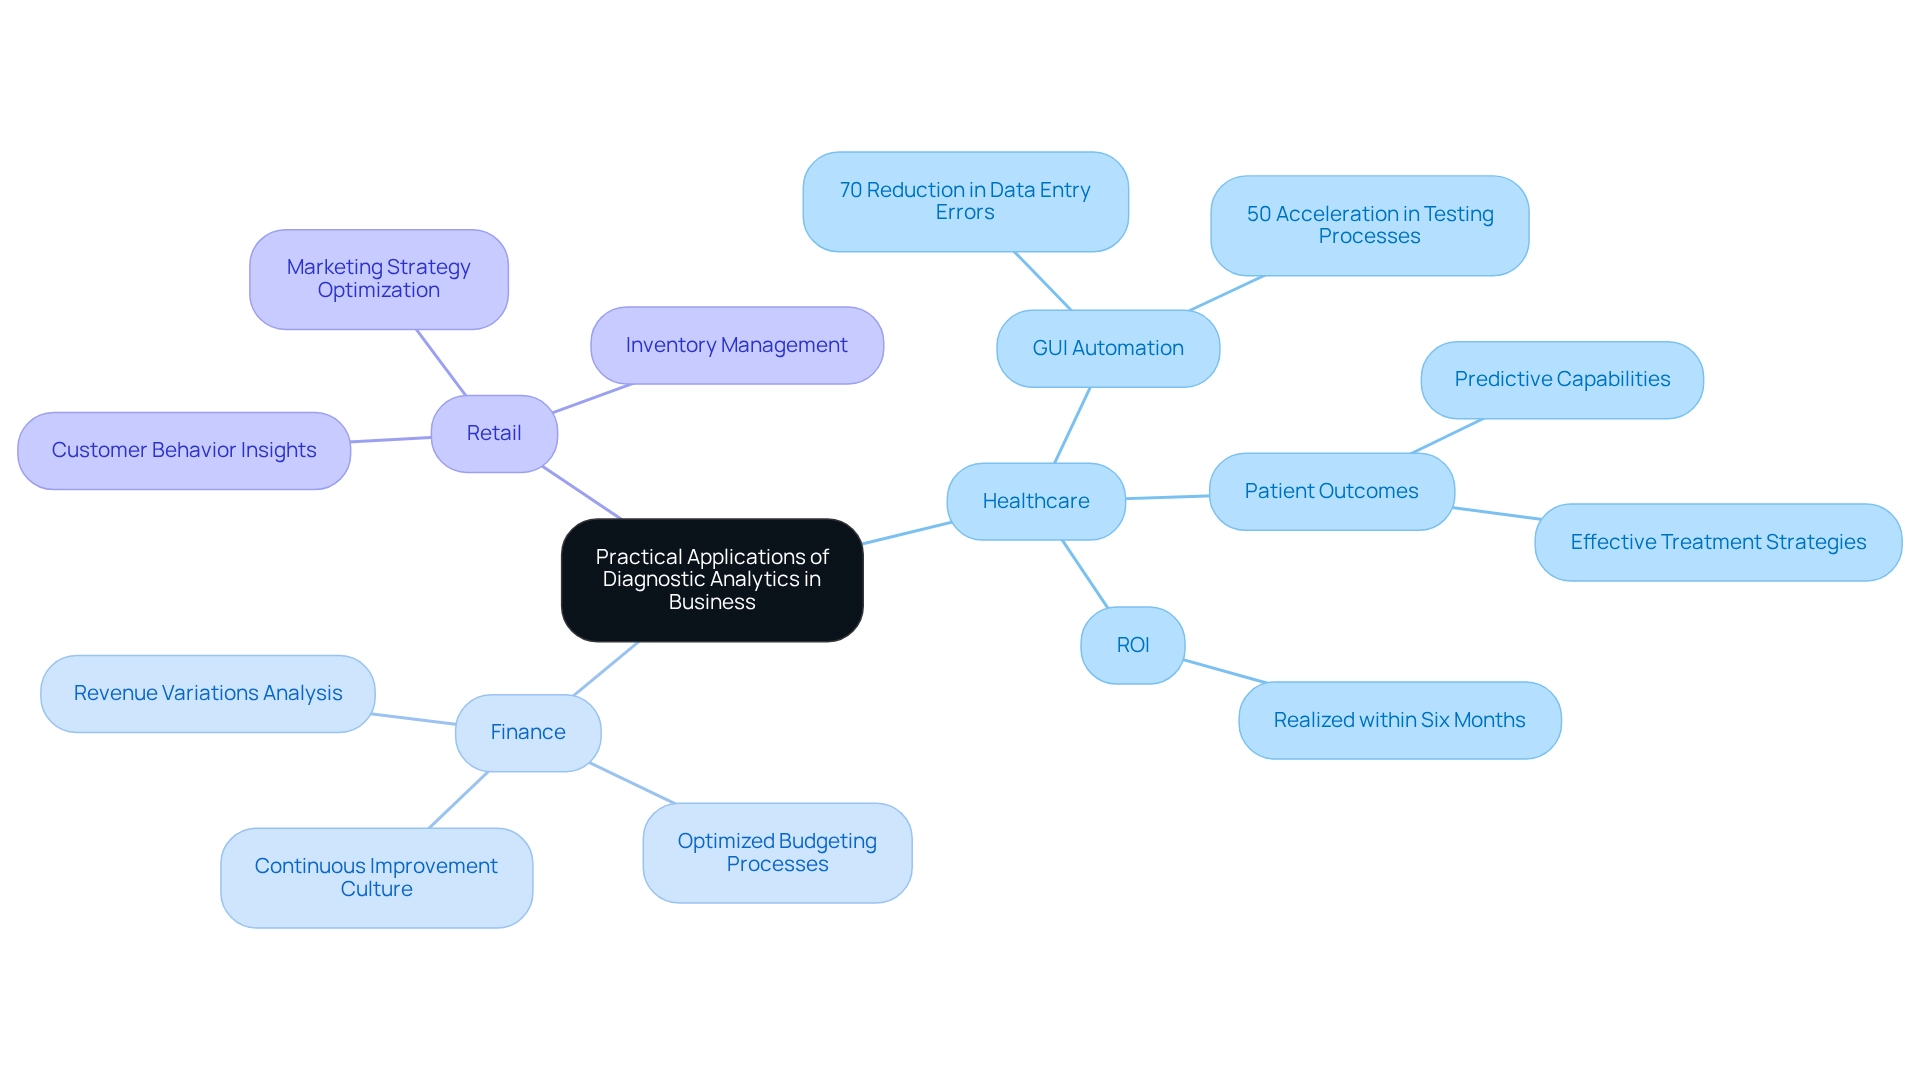
In the realm of operational efficiency and strategic decision-making, understanding the pivotal role of diagnostic analytics across multiple sectors is essential. Its applications span various industries:
-
Healthcare: By analyzing patient data trends, healthcare providers can significantly enhance treatment outcomes and reduce readmission rates. For instance, a mid-sized healthcare company implemented GUI automation to streamline data entry and software testing, achieving a remarkable 70% reduction in data entry errors and a 50% acceleration in testing processes. This automation not only improved assessment precision but also empowered healthcare professionals to foresee illnesses and identify high-risk patients more effectively. A study involving 37 patients demonstrated the efficacy of these methods in deriving positive and negative likelihood ratios, leading to more precise recommendations for confirmatory tests and better management of patient outcomes. Furthermore, prescriptive analysis develops effective treatment strategies and suggests measures to enhance patient outcomes, ultimately improving operational efficiency in healthcare institutions. Notably, the ROI from these implementations was realized within six months, underscoring the effectiveness of GUI automation.
-
Finance: In the financial sector, analytical assessments are crucial for uncovering the root causes of revenue variations. By analyzing historical financial performance, organizations can optimize budgeting processes and make informed decisions that enhance profitability. The incorporation of evaluative insights fosters a culture of continuous improvement, enabling companies to adapt swiftly to evolving market conditions.
-
Retail: Understanding customer behavior is vital for crafting effective marketing strategies and optimizing inventory management. Retail experts emphasize the importance of utilizing analytical tools to gain insights into customer preferences and purchasing behaviors. This data-driven approach not only enhances customer satisfaction but also drives sales growth.
Through analytical assessments, organizations in these fields can make informed, data-driven choices that lead to enhanced efficiency and profitability. In today’s data-rich environment, the impact of these analytics transcends operational improvements, significantly enhancing financial performance. As Craig R. Denegar noted, the use of statistics is essential for establishing certainty in diagnosis, further highlighting the importance of robust analytical frameworks in achieving these results.
Moreover, case studies such as “Enhancing Diagnostics and Predictions through AI and Machine Learning” illustrate how AI and machine learning bolster diagnostic accuracy and predictive capabilities, resulting in more effective healthcare solutions. Client testimonials from entities like NSB GROUP and Hellmann Marine Solutions underscore the transformative impact of Creatum GmbH’s technology solutions in improving operational efficiency and fostering business growth. This is particularly evident through services like the 3-Day Power BI Sprint, which facilitates rapid report generation and actionable insights. The Power BI services offer features such as a comprehensive management application and a systematic approach to reporting, ensuring consistency and clarity in decision-making.
Challenges and Limitations of Diagnostic Analytics
While diagnostic analytics provides essential insights, companies frequently face significant challenges that can hinder its effective implementation.
-
Quality Issues: The accuracy and comprehensiveness of data are crucial. In 2025, organizations continue to grapple with data quality challenges, where incorrect or inadequate information can lead to misleading conclusions, ultimately affecting decision-making processes. Poor master data quality can severely impede the success of both RPA and Business Intelligence initiatives, making it vital to address these foundational issues.
-
Complexity of Analysis: The analytical landscape is becoming increasingly intricate, necessitating advanced statistical skills and sophisticated tools. This complexity can serve as a barrier for many organizations, limiting their ability to leverage analytical insights effectively. Tailored AI solutions can simplify this landscape, providing targeted technologies that align with specific business objectives and challenges, thereby enhancing analytical capabilities.
-
Resistance to Change: Employees may show reluctance to embrace new analytical methods, which can hinder progress. Implementing effective change management strategies is essential to facilitate this transition and foster a culture of data-driven decision-making. Organizations can overcome this resistance by promoting a culture of continuous education and skill enhancement in data science, similar to practices observed in leading firms like Amazon, which mandate ongoing ‘learning hours’ for analysts. Addressing these challenges is crucial for organizations aiming to maximize the benefits of evaluative analysis. For instance, a case study on transforming public health management illustrates how analytical techniques can analyze diverse data sources to identify disease outbreaks before they escalate. This capability enables healthcare organizations to manage public health emergencies more effectively, showcasing the potential to tackle data quality issues through the strategic application of RPA and Business Intelligence.
Moreover, retail leaders have successfully employed analytical assessments to understand customer purchasing patterns, refining their marketing strategies. Such examples underscore the importance of addressing complexity and data quality, two broad categories of diagnostic analytics, to enhance the efficiency of diagnostic analysis. As organizations navigate these challenges, expert insights suggest that fostering a culture of continuous learning and upskilling in analytics can significantly mitigate resistance and improve analytical capabilities.
Additionally, developing nations face challenges in adopting big data analysis in healthcare, particularly regarding integration and cloud-based innovations. This context emphasizes the broader hurdles organizations encounter when implementing evaluative analysis. Furthermore, platforms like Amplitude Analytics provide extensive analytical features, including root cause analysis, which can aid organizations in overcoming these challenges.
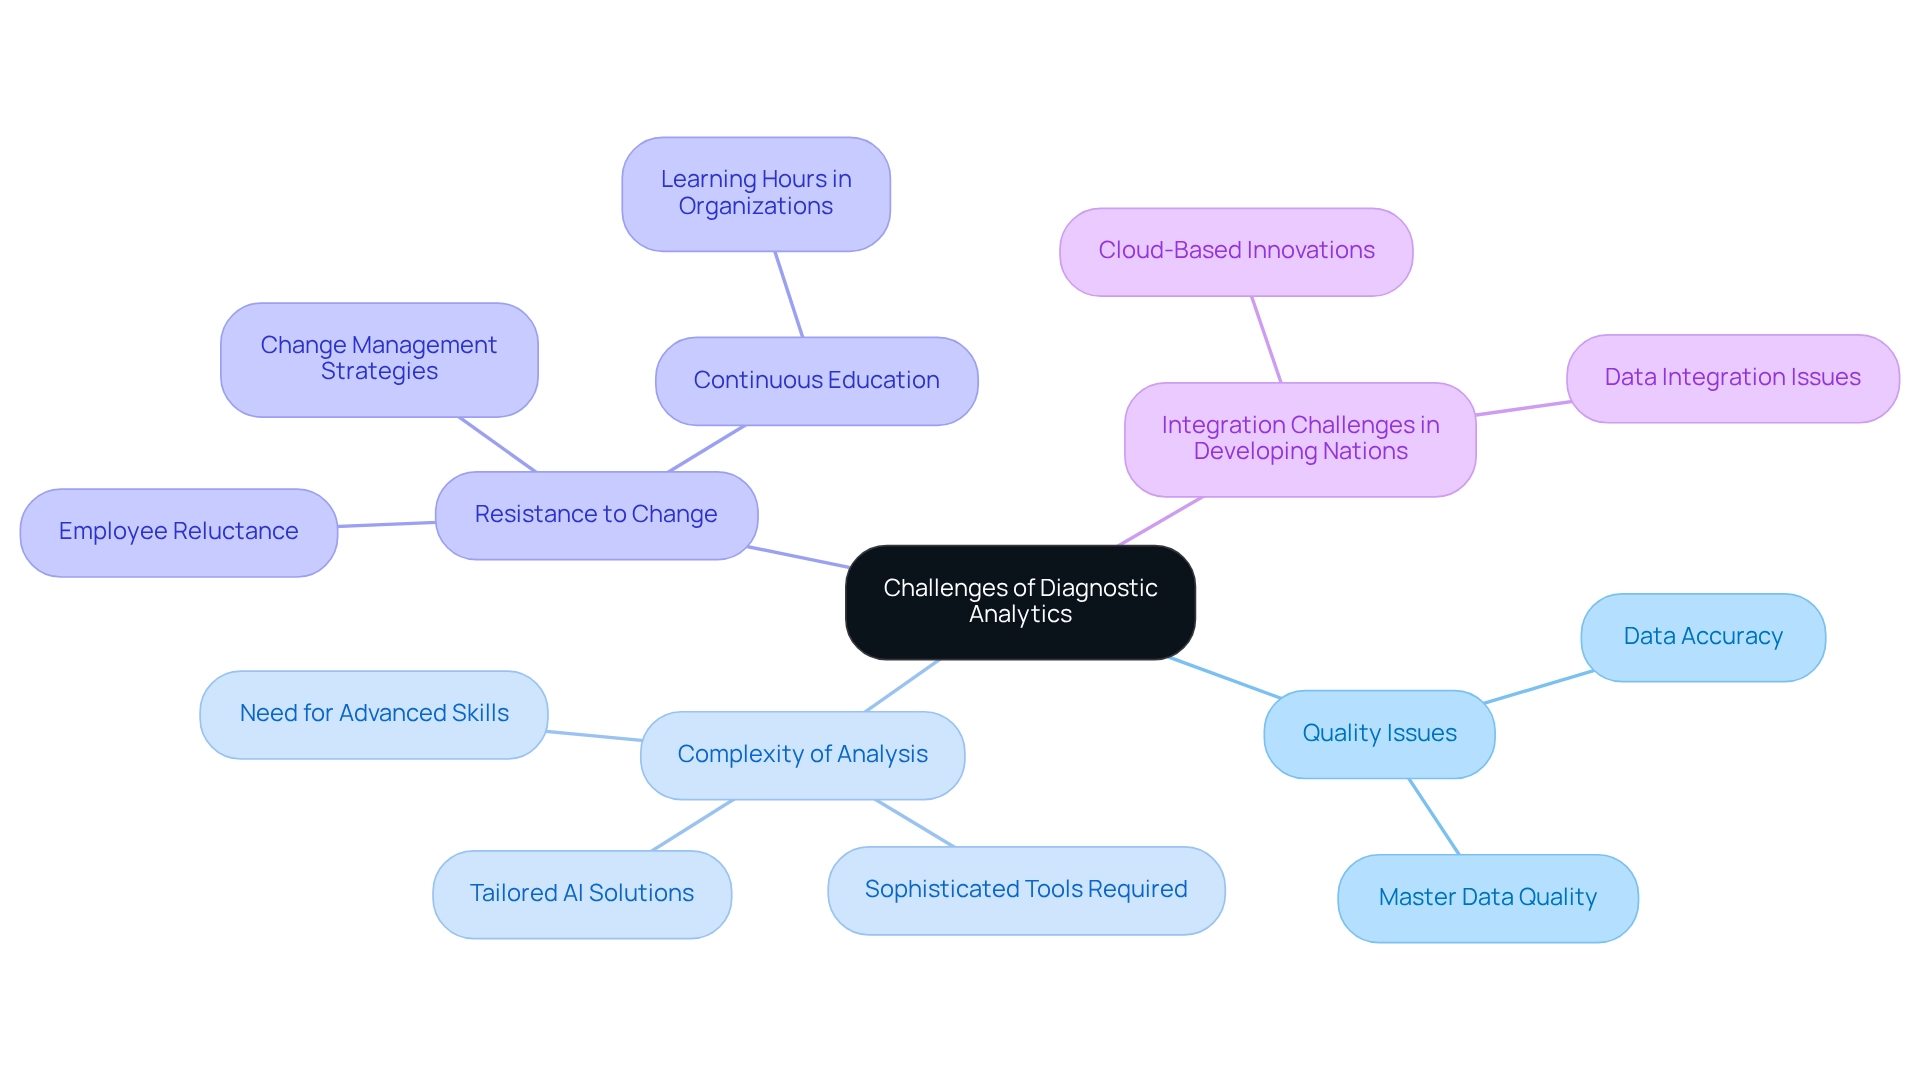
Integrating Diagnostic Analytics with Other Analytical Approaches
Combining evaluative assessments with other analytical methods, such as predictive and prescriptive techniques, creates a holistic data strategy that significantly enhances organizational competencies. This integration enables organizations to enhance forecasting, decision-making, and drive continuous improvement.
Enhance Forecasting: By leveraging insights derived from diagnostic analytics, organizations can refine their predictive models, resulting in improved accuracy in forecasting future trends and behaviors. For instance, a client experienced an impressive 264% rise in organic traffic after employing both evaluative and predictive methods, underscoring the tangible benefits of this strategy.
Enhance Decision-Making: The combination of historical insights from evaluative data with forward-looking predictions empowers organizations to make more informed strategic choices. This dual perspective ensures that decisions are rooted in both past performance and future potential, fostering a comprehensive view of the business landscape. As noted by the Analytics & Insights group at Seer, “The Analytics & Insights team also utilizes predictive analysis to assist clients in making data-informed choices regarding their marketing strategy by examining extensive data collections and recognizing trends that can be applied to forecast customer behavior and campaign effectiveness.”
Drive Continuous Improvement: Establishing a feedback loop where insights from diagnostic analytics inform ongoing adjustments in predictive models is essential for maintaining relevance in a dynamic market. This iterative process not only enhances the precision of predictions but also cultivates a culture of continuous improvement within the organization.
By adopting a multi-faceted analytical approach, organizations can achieve greater operational efficiency and strategic alignment. The integration of diagnostic analytics—one of the two broad categories of diagnostic analytics—with predictive and prescriptive analytics streamlines workflows and empowers teams to focus on value-adding activities, ultimately driving growth and innovation.
However, businesses often face challenges in integrating analyses, particularly when combining information from disparate sources. Manual information gathering from various sources can lead to inefficiencies and potential errors. Utilizing Business Intelligence tools such as Power BI, including our 3-Day Power BI Sprint for quick report generation and the General Management App for thorough management, can address these challenges by ensuring consistency and reliability in analysis, thereby enhancing the effectiveness of integrated analytical methods.
Furthermore, incorporating Robotic Process Automation (RPA) can streamline manual workflows, allowing teams to concentrate on strategic tasks rather than repetitive data handling. Additionally, hypothesis testing functions as a statistical procedure in evaluative studies, guiding the analysis with historically-oriented hypotheses, which is critical for informed decision-making.
To explore how these solutions can benefit your business, schedule a complimentary consultation with us today.
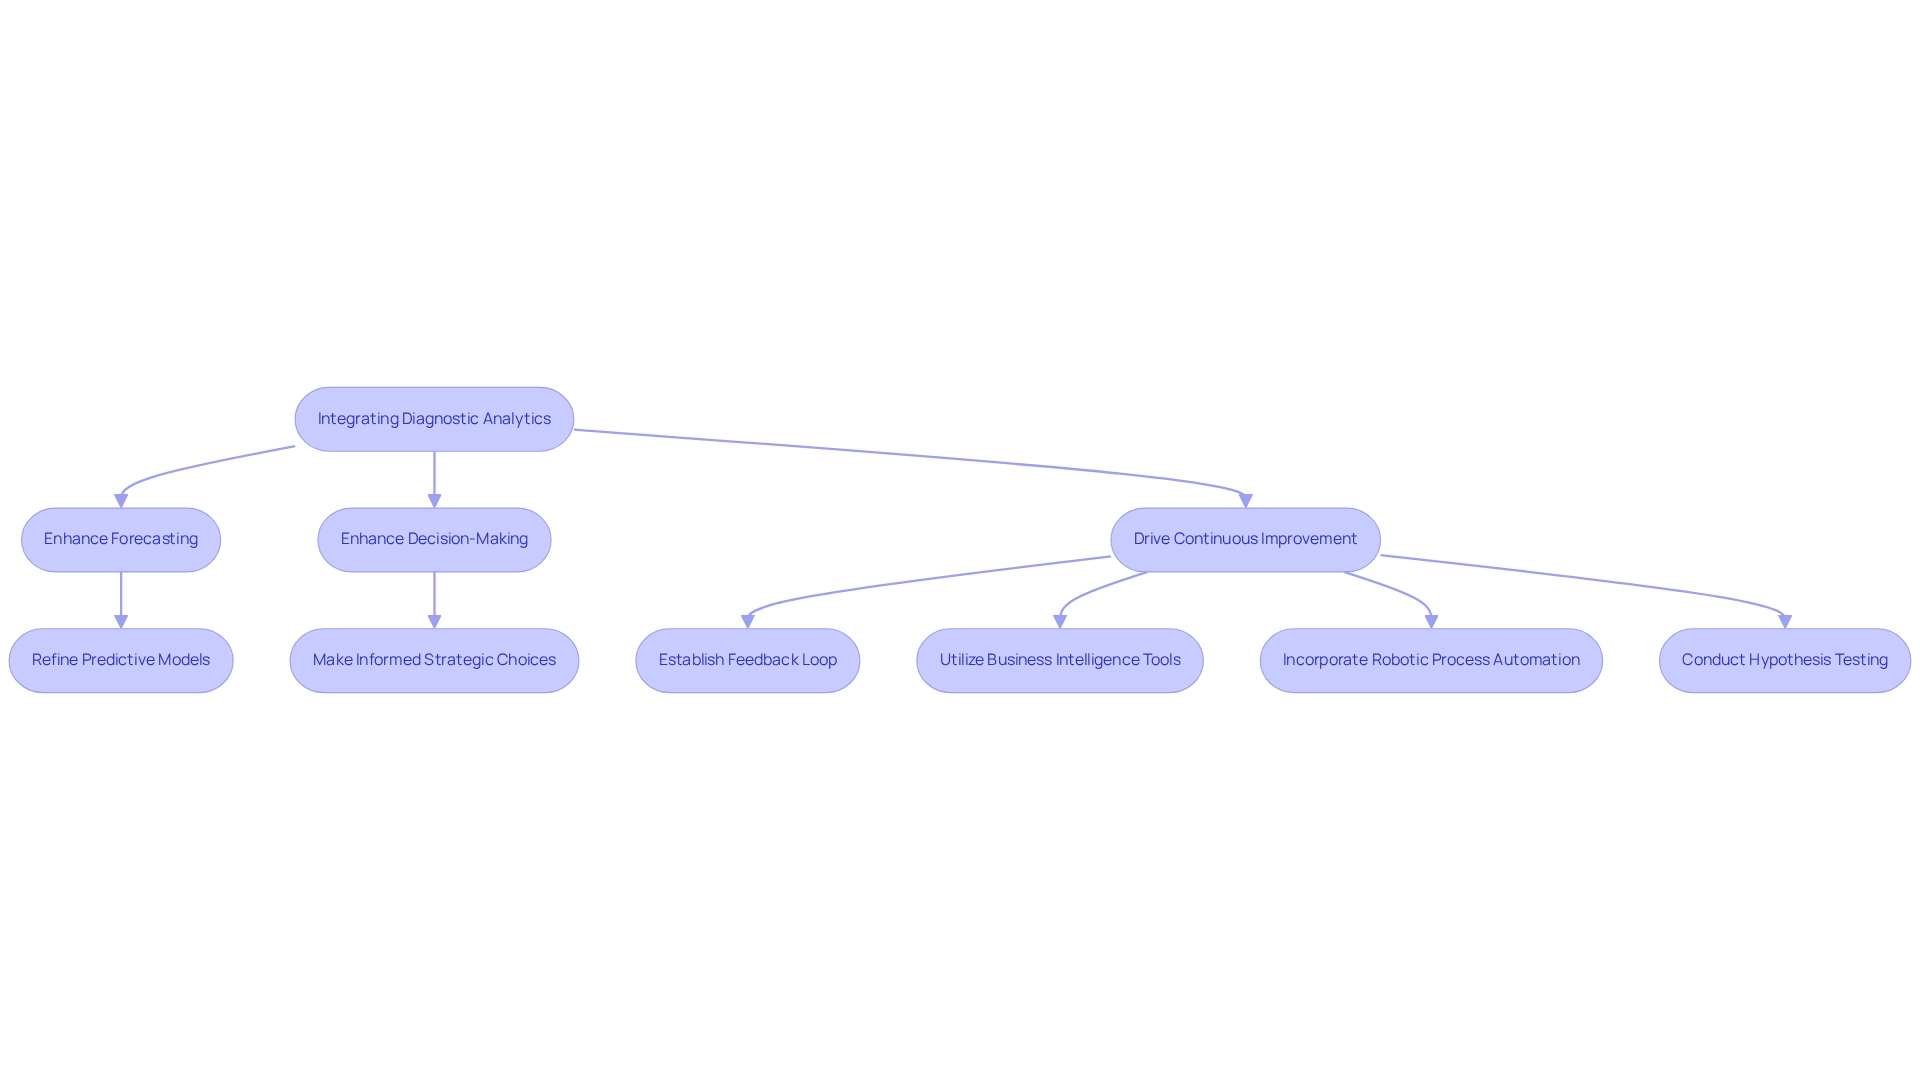
Strategies for Implementing Diagnostic Analytics in Your Organization
To effectively implement diagnostic analytics within your company, consider the following strategies:
-
Invest in Training: Equip your team with essential skills in data analysis and interpretation. Research shows that 88% of entities mention inadequate user experience as a main reason for changing learning technology solutions, emphasizing the necessity for effective training programs that improve user engagement and analytical abilities. Furthermore, with 17% of small enterprises employing virtual classrooms, companies should investigate various training techniques to address their teams’ requirements. Creatum GmbH provides specialized training as a component of its Comprehensive Power BI Services, guaranteeing your team can utilize advanced analysis tools efficiently.
-
Ensure Information Quality: Establish robust processes for information cleansing and validation. High-quality information is essential for dependable insights; organizations that prioritize information quality often experience substantial enhancements in their analytical results. For example, 92% of survey participants think that aligning training objectives with a positive employee experience can improve quality initiatives. Subpar master data quality can obstruct AI adoption, making it crucial to tackle these issues proactively.
-
Leverage Technology: Utilize advanced analytical tools and software, such as those provided in our 3-Day Power BI Sprint, to enhance data analysis and visualization. This sprint is designed to help you create professional reports quickly, allowing your team to focus on deriving actionable insights from complex datasets. The integration of sophisticated technologies can streamline the data analysis process, enhancing operational efficiency.
-
Foster a Data-Driven Culture: Encourage a culture that values data-driven decision-making at all organizational levels. Industry leaders stress that nurturing such a culture is essential for optimizing the effects of data analysis. For example, 50% of learning and development professionals work closely with executive leadership, and 44% collaborate with the chief human resource officer to ensure that data initiatives align with strategic goals. By leveraging RPA to automate manual workflows, you can free up resources for more strategic, value-adding work, which aligns with the question of which of the following is one of the two broad categories of diagnostic analytics, further embedding a data-driven mindset within your organization. By implementing these strategies, organizations can successfully integrate diagnostic analytics into their operations, leading to meaningful improvements and informed decision-making. The emphasis on training goals that reinforce a positive employee experience further illustrates the importance of aligning training initiatives with broader cultural and engagement objectives.
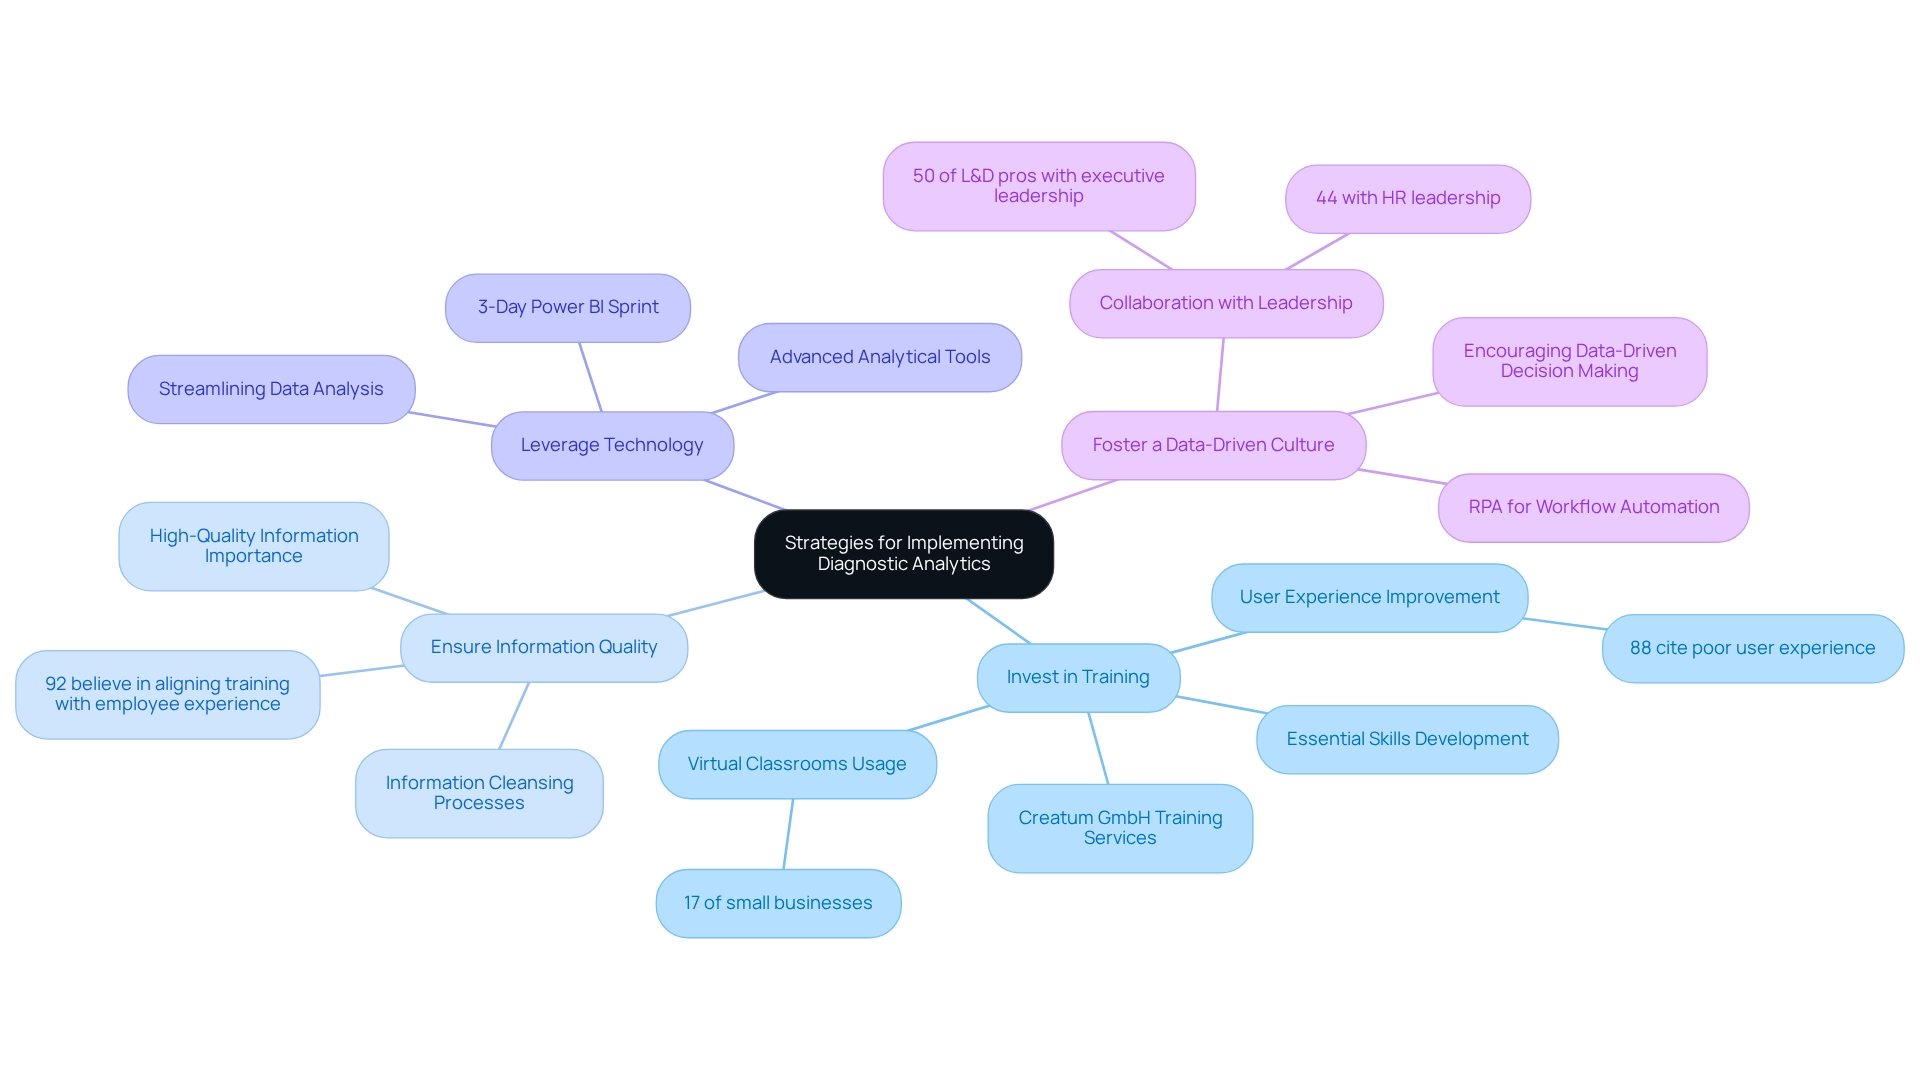
Conclusion
Diagnostic analytics emerges as a transformative force in today’s data-driven landscape, enabling organizations to explore the underlying reasons behind past events and trends. By setting itself apart from more superficial analytical methods, it empowers businesses to make informed decisions that enhance operational efficiency and drive innovation. The increasing integration of advanced technologies, such as Robotic Process Automation and machine learning, further amplifies its potential across various sectors, including healthcare, finance, and retail.
The practical applications of diagnostic analytics are extensive, yielding significant improvements in operational performance and strategic decision-making. For instance, reducing patient readmission rates in healthcare and optimizing inventory management in retail illustrate how insights generated through diagnostic analytics foster a nuanced understanding of organizational dynamics. However, the successful implementation of these analytical strategies presents challenges. Organizations must tackle data quality issues, overcome resistance to change, and invest in continuous training to fully leverage the power of diagnostic analytics.
As the landscape of data analytics evolves, integrating diagnostic analytics with predictive and prescriptive approaches becomes crucial for organizations seeking a competitive edge. By cultivating a culture of data-driven decision-making and utilizing advanced analytical tools, businesses can confidently navigate the complexities of the modern market. Embracing diagnostic analytics transcends mere data analysis; it transforms insights into actionable strategies that propel growth and sustainability in an increasingly complex world.
Frequently Asked Questions
What is diagnostic analysis?
Diagnostic analysis is a field that investigates the underlying reasons for past occurrences and trends, providing deeper insights into why specific results occurred, unlike descriptive analysis, which only summarizes historical data.
How does investigative assessment differ from descriptive analysis?
Investigative assessment delves into the reasons behind specific results, offering insights that help organizations enhance operational efficiency, whereas descriptive analysis simply summarizes past data without providing deeper understanding.
What is the significance of diagnostic analysis for organizations?
Diagnostic analysis is essential for organizations aiming to improve operational efficiency and make informed, data-driven decisions by identifying root causes of inefficiencies.
What is the projected growth of the Internet of Medical Things market by 2025?
The global Internet of Medical Things market is projected to reach $286.77 billion by 2025, highlighting the increasing importance of assessment metrics in healthcare and operational efficiency.
How are healthcare organizations utilizing assessment insights?
Healthcare organizations are using assessment insights alongside Robotic Process Automation (RPA) tools to enhance patient outcomes through early illness forecasting and tailored treatment strategies.
What benefits do organizations experience by implementing robust information protection measures?
Organizations that implement robust information protection measures, such as encryption and access control, see significant improvements in operational efficiency while ensuring compliance with regulations like GDPR.
What role does diagnostic analysis play in decision-making according to industry leaders?
Diagnostic analysis is considered vital for informed decision-making, and investing in education related to information science, machine learning, or healthcare informatics is crucial for organizations to navigate the complexities of data analysis.
What are the two primary types of diagnostic analytics?
The two primary types of diagnostic analytics are anomaly detection and what-if analysis.
What is anomaly detection and its importance?
Anomaly detection identifies unusual patterns or outliers in data that deviate from expected behavior, which is critical for various industries, including finance for fraud detection, healthcare for patient monitoring, and retail for inventory management.
How does what-if analysis benefit businesses?
What-if analysis allows businesses to simulate different scenarios by adjusting key variables to observe potential outcomes, significantly enhancing decision-making efficiency and enabling proactive planning.
What distinguishes anomaly detection from what-if analysis?
Anomaly detection aims to identify immediate issues that require attention, while what-if analysis supports proactive planning by exploring potential future scenarios.
How can AI solutions enhance diagnostic analytics capabilities?
AI solutions, such as Small Language Models and GenAI Workshops, can improve companies’ abilities to address quality challenges and effectively train personnel, thereby enhancing their analytical capabilities.
What is the role of Robotic Process Automation (RPA) in operational efficiency?
RPA streamlines manual workflows, allowing teams to focus on more strategic, value-adding tasks, which enhances overall productivity in a rapidly evolving AI landscape.
Overview
This article delves into the effective utilization of the EDATE DAX function in Power BI for date calculations. It highlights the syntax, practical applications, and best practices associated with this powerful tool. Mastering EDATE is crucial for achieving accurate time-related computations in business intelligence. It empowers users to manage timelines for projects, subscriptions, and financial forecasts, ultimately enhancing operational efficiency and informed decision-making.
Introduction
In the realm of data analysis, accurately manipulating dates is a cornerstone of effective decision-making. The EDATE function in DAX stands out as an essential tool for professionals navigating the complexities of time-sensitive data in Power BI. It allows users to calculate dates that are a specified number of months before or after a given starting point, streamlining processes such as:
- Subscription management
- Loan payment scheduling
- Sales forecasting
As organizations increasingly depend on precise data handling to drive operational efficiency and strategic growth, mastering this function becomes crucial. This article delves into the intricacies of the EDATE function, exploring its:
- Syntax
- Practical applications
- Common pitfalls
- Best practices
Ultimately, it empowers users to harness its full potential in their data-driven endeavors.
Understanding the EDATE Function in DAX
The formula in DAX serves as a powerful tool designed to yield a specific point in time that is either a designated number of months before or after a given starting point. This approach is crucial for determining due timelines, maturity periods, or any time-related adjustments requiring month alterations. The syntax for the EDATE function is as follows:
EDATE(<StartDate>, <Months>)
- StartDate: This parameter signifies the initial date from which the calculation will commence.
- Months: This parameter denotes the number of months to add (using a positive value) or subtract (using a negative value) from the starting point.
For example, to ascertain the date that occurs three months after January 1, 2025, you would utilize:
EDATE("2025-01-01", 3)
This calculation would result in April 1, 2025. Mastering the EDATE DAX function is imperative for anyone aiming to execute time-related calculations effectively in Power BI.
Recent statistics underscore the importance of date calculations in business intelligence, with over 70% of organizations asserting that precise date handling is vital for operational efficiency. As Mark Twain aptly noted, “Facts are stubborn things, but statistics are pliable,” emphasizing the necessity of analysis in decision-making.
Moreover, the application of DAX operations, including specific functions, has been shown to enhance analytical capabilities, empowering teams to derive actionable insights from their datasets. For instance, in a case study analyzing sales cycles, companies utilized EDATE to project future sales periods based on historical data, ensuring they could meet customer demand effectively. This strategy not only streamlined operations but also improved staffing decisions, illustrating its tangible impact on business outcomes.
However, numerous organizations continue to encounter challenges stemming from outdated systems that impede their ability to leverage such insights effectively. By integrating tools like EMMA RPA, businesses can modernize their processes, overcome these operational hurdles, and boost efficiency. EMMA RPA offers functionalities such as intelligent automation and seamless digitalization, which are essential for transforming raw data into actionable insights.
In conclusion, the date calculation tool, known as EDATE DAX, is a crucial component of DAX that empowers users to perform accurate date computations, ultimately enhancing decision-making and operational efficiency in Power BI. Furthermore, exploring DAX’s statistical capabilities can provide a deeper understanding of analysis, further advancing operational efficiency. By leveraging RPA solutions, organizations can ensure they are not only keeping pace with technological advancements but also fostering growth and innovation.

Practical Applications of EDATE in Power BI
The EDATE function in Power BI serves a variety of practical applications, particularly in managing time-sensitive data across different business scenarios. It plays a crucial role in enhancing operational efficiency through automation.
Subscription Management: This function is invaluable for determining the next billing occurrence for subscriptions by adding the billing cycle duration to the present time. For instance, if a subscription begins on January 15, 2025, with a monthly billing cycle, the next billing date can be calculated as follows:
EDATE("2025-01-15", 1)
This calculation yields February 15, 2025, ensuring timely billing and enhancing customer satisfaction. With the projected number of paying YouTube Music and YouTube Premium subscribers reaching K million by 2024, effective subscription management is increasingly vital in a growing market.
Loan Payment Schedules: The system can also forecast upcoming payment timelines based on the loan’s initiation and payment frequency. For example, if a loan commences on March 1, 2025, with monthly payments, the next payment date can be determined using:
EDATE("2025-03-01", 1)
This results in April 1, 2025, facilitating accurate financial planning for both lenders and borrowers.
Sales Projection: The role assists in modifying sales predictions using past information by determining upcoming periods for anticipated sales. For instance, to forecast sales six months ahead from today, you can apply:
EDATE(TODAY(), 6)
This provides the date six months from the current date, allowing businesses to strategize effectively based on anticipated market conditions.
These examples demonstrate the flexibility of the time management tool in handling time-related information, which is essential for improving operational efficiency and enhancing decision-making processes. Accurate billing date calculations can significantly impact customer retention, as timely and precise billing fosters trust and satisfaction among subscribers. Furthermore, the integration of RPA can reduce manual errors associated with these calculations, freeing up resources for more strategic tasks.
As Isabelle Roussin, chief solution expert on quote-to-cash at SAP, noted, “The trend we start to see is an ‘outcome-based’ model, where customers will pay for a guaranteed outcome serving their needs – not for the usage, but for the guaranteed outcome of a usage.” Additionally, aligning subscription metrics with business goals can drive overall success, as highlighted in the case study titled “Understanding Subscription Business Metrics,” which emphasizes the importance of selecting appropriate metrics for evaluating performance. Tackling difficulties in utilizing insights from Power BI dashboards, such as labor-intensive report generation and data discrepancies, can be alleviated through the efficient application of EDATE DAX, emphasizing the importance of employing tools like this for strong data management and analytics in subscription-driven enterprises.

Syntax and Structure of the EDATE Function
The EDATE DAX function is crafted with a clear syntax that is essential for its effective use in formulas, particularly as organizations harness Robotic Process Automation (RPA) to automate manual workflows and improve operational efficiency. Here’s a concise overview of its structure:
EDATE(<StartDate>, <Months>)
- StartDate: This parameter can be a date value, a date column, or a date expression. It is critical that this input adheres to a valid format recognized by EDATE DAX.
- Months: This parameter is an integer indicating the number of months to add or subtract. Positive integers will add months, while negative integers will subtract them.
Example of Syntax Usage
To illustrate the application of the EDATE function, consider the following examples:
-
Adding 2 months to a specific date:
EDATE("2025-04-07", 2)This expression returns June 7, 2025.
-
Subtracting 3 months from a date:
EDATE("2025-04-07", -3)This expression returns January 7, 2025.
Important Notes
Ensuring that the StartDate is formatted correctly is vital; otherwise, the function will produce an error. The Months parameter can also be dynamically computed using the EDATE DAX function, allowing for more complex date manipulations. This flexibility empowers users to create sophisticated reports and analyses with EDATE DAX, thereby enhancing operational efficiency and decision-making capabilities, especially when integrated with Business Intelligence tools.
Additional Insights
- Understanding DAX Outputs: Measures should return single values, while calculated tables often yield multiple rows. This distinction is crucial for effective DAX operation usage.
- Common Errors: A case study titled “Sales Error2: Missing Row Context in Related Table” highlights a frequent mistake associated with DAX operations. This error arises when the measure formula lacks the appropriate row context for the ‘Product’ table, even though the row context exists for the ‘Sales’ table. To resolve this, it is essential to obtain the correct row from the associated ‘Product’ table, potentially utilizing the RELATED tool.
- Debugging Tips: To debug filters in Power BI, create simple measures like COUNTROWS to verify the number of rows being filtered.
- Expert Advice: As Shubham Saxena, a Data Analyst, advises, “Remember, debugging DAX is not just about fixing errors; it’s about learning through practice and experimentation.” This perspective fosters ongoing enhancement and mastery of DAX capabilities, which is crucial in a rapidly evolving AI landscape.
Integrating tailored AI solutions from Creatum GmbH can further elevate the efficiency of DAX operations, addressing the challenges posed by manual, repetitive tasks and enabling organizations to leverage information for informed decision-making.

Examples of EDATE Usage in Power BI
The date calculation tool in Power BI offers a multitude of practical applications that significantly enhance project management and data analysis, particularly in the realms of Business Intelligence and RPA. Consider the following compelling examples:
-
Calculating Due Dates: For projects that demand precise deadline management, the date calculation function proves invaluable. For instance, if a project starts on May 1, 2025, and you need to determine the due date four months later, you would apply:
EDATE("2025-05-01", 4)This calculation results in September 1, 2025, establishing a clear timeline for project deliverables, which is critical for maintaining operational efficiency and supporting the company’s objective to increase sales by 20% annually.
-
Creating a Calendar Table: This function is essential for generating comprehensive calendar tables, which are vital for time-related analyses. To create a new date based on existing dates in your dataset, you can implement:
new date = date([StartDate], [Months])This formula is applicable in a calculated column, facilitating dynamic date generation that aligns with your project’s timeline, thereby addressing challenges like data inconsistencies and time-consuming report creation.
-
Rolling Forecasts: In financial planning contexts, this tool enables rolling forecasts that adjust monthly. For example, to calculate a forecast date that updates based on the current date and a specified number of months, you would utilize:
ForecastDate = EDATE(TODAY(), [ForecastMonths])This method ensures that your forecasts remain pertinent and timely, adapting to ongoing changes in your operational environment, which is crucial for informed decision-making.
These examples underscore the versatility of the date calculation tool in various analytical scenarios within Power BI, rendering it an indispensable resource for enhancing operational efficiency and decision-making. As highlighted by the Indeed Editorial Team, effective communication is paramount for systems analysts, ensuring that project requirements are accurately gathered and understood. This is particularly relevant when employing tools such as date functions, as clear communication can lead to successful project outcomes.
Moreover, with the company’s ambition to boost sales by 20% each year, leveraging efficient analysis and forecasting tools is critical in achieving these business objectives. Insights drawn from Excel’s capabilities for data visualization and regression analysis further illustrate the broader context of data analysis tools available alongside Power BI.
However, users must remain vigilant regarding common pitfalls, such as incorrect month inputs or misalignment with fiscal calendars, to prevent errors in their analyses. Addressing these pitfalls is essential for overcoming challenges in extracting insights from Power BI dashboards.

Common Pitfalls When Using EDATE in DAX
When utilizing the EDATE feature in Power BI, users frequently encounter several common pitfalls that can impede their effectiveness, particularly in driving data-driven insights and operational efficiency.
Invalid Date Formats: If the StartDate is not formatted correctly, the procedure will return an error. To prevent this, always ensure that the time is in a valid format.
- Tip: Use the DATE function to create valid dates when necessary:
EDATE(DATE(2025, 4, 7), 2)
Incorrect Month Values: Providing a non-integer value for the Months parameter will lead to an error. Always confirm that this value is an integer to maintain operational integrity.
Context Issues: The EDATE DAX function may yield unexpected results if used in a context where the time is not properly filtered. As noted by darrenfishell, exploring different approaches to replicate row-level equivalents can enhance understanding of context issues. Additionally, consider alternatives to CALCULATE for changing filter context, which can provide valuable insights into effectively managing these issues.
Overlapping Dates: When calculating dates that may coincide with existing information, it is essential to verify that your calculations do not inadvertently create duplicate or conflicting entries. This can lead to information integrity problems and misinterpretation of outcomes.
To further enhance your skills, consider the statistics indicating that the advanced analytical features tutorial in Power BI lasts 11 minutes. This suggests that users may benefit from additional training or resources to avoid common pitfalls. Moreover, a case study highlighting the absence of documentation and training underscores the importance of adequate training and documentation in preventing mistakes with the date adjustment tool.
By identifying and addressing these challenges, users can significantly improve their efficiency and precision when utilizing the EDATE DAX function in Power BI. This ultimately results in more trustworthy data analysis. Remember, avoiding the ten common mistakes when using DAX in Power BI, such as incorrect syntax and misunderstanding evaluation contexts, is crucial for successful implementation.

Best Practices for Implementing EDATE in Power BI
To effectively implement the EDATE function in Power BI, consider the following best practices:
-
Use Valid Date Formats: Ensure that the StartDate is formatted correctly to prevent errors. When necessary, utilize the DATE tool to generate valid date entries. Implementing robust error handling in your DAX formulas, using functions such as IFERROR or ISERROR, is essential for regularly validating input information.
-
Utilize Time Tables: Create a specific time table within your model. This practice not only facilitates improved time management but also enhances the effectiveness of your DAX calculations, resulting in more efficient information processing. As demonstrated in the case study on employing filter context in DAX formulas, applying specific filters can significantly enhance calculations based on established criteria, which is crucial for efficient time management.
-
Dynamic Calculations: Implement dynamic calculations for the Months parameter to accommodate evolving business requirements. For instance, you can derive the number of months based on user input or other relevant metrics, allowing for greater flexibility in your analyses.
-
Test Your Formulas: Before deploying your DAX formulas, conduct tests in a controlled environment to verify that they yield the expected results. This proactive approach helps identify and rectify errors early in the process.
-
Document Your Calculations: Maintain comprehensive documentation of your DAX calculations and their intended purposes. This record is invaluable for future reference and can assist other team members in understanding the logic behind your analyses.
By adhering to these best practices, users can significantly enhance their proficiency with the EDATE DAX function, ultimately improving their analytical capabilities in Power BI. Furthermore, employing calendar tables in information models has been shown to simplify computations and enhance overall efficiency, establishing it as an essential element of successful DAX execution. As one expert noted, “When you get the information you need, you can begin to solve real business problems that affect your bottom line.”
Additionally, recognizing the importance of detecting outliers in datasets, such as vehicles sold for more than 180 thousand Reais, underscores the necessity for precise management and calculations. In today’s data-driven environment, the demand for effective DAX skills is evident, as illustrated by CloudThat’s training of over 650,000 professionals and the delivery of numerous consulting projects. To further enhance your operational efficiency and address the competitive disadvantage of struggling to extract meaningful insights, consider leveraging RPA solutions like EMMA RPA and Power Automate.
Schedule a complimentary consultation to discover how these tools can revolutionize your management processes.

Key Takeaways on Using EDATE in Power BI
The formula for calculating dates using EDATE DAX is an essential tool for time manipulation within Power BI, offering a range of features that can significantly enhance information analysis and operational effectiveness. As information is increasingly recognized as ‘the new oil,’ mastering such tools is crucial for maximizing the value of data in a rapidly evolving AI landscape. Here are the key takeaways:
-
Functionality: EDATE empowers users to add or subtract months from a specified date, making it vital for various date-related calculations, such as adjusting timelines for financial forecasts or project planning. This capability is particularly advantageous in automating manual workflows through Robotic Process Automation (RPA), allowing teams to concentrate on more strategic tasks.
-
Practical Applications: This functionality proves useful in numerous scenarios, including subscription management, where it assists in tracking renewal timelines, loan payment schedules for accurate financial planning, and sales forecasting to project future income based on historical data. A systematic review highlighted the importance of effective data manipulation in business analytics, as evidenced by the selection of 29 articles for analysis from a pool of 1,487, underscoring the role of Business Intelligence in driving growth. The correct syntax for the EDATE DAX function is
EDATE(<StartDate>, <Months>), ensuring that both parameters provided are valid timestamps to prevent errors. -
Common Pitfalls: Users must remain vigilant regarding potential errors stemming from incorrect time formats and contextual issues, which can lead to inaccurate results. Understanding these pitfalls is essential for effective data manipulation and for extracting insights from Power BI dashboards, especially given challenges like time-consuming report generation and inconsistencies. Best practices suggest that to maximize the effectiveness of the EDATE DAX function, it is advisable to consistently use valid date formats and leverage date tables within Power BI. This approach not only simplifies calculations but also enhances overall data integrity, addressing issues such as time-consuming report creation and inconsistencies.
Moreover, the BFSI sector held the largest income share of over 23% in the fabric market in 2022, while North America maintained more than 47% of the market share. This highlights the importance of efficient data handling in high-stakes industries, reinforcing the necessity of mastering DAX operations like EDATE DAX functions.
Mastering the date calculation tool enables users to refine their analytical skills in Power BI, fostering more informed decision-making and strategic planning. Insights from the case study titled “Interpretation of the Statistics” demonstrate the transformative effect of embedded analytics on software innovation, emphasizing user engagement, economic value, technical performance, and data quality. By utilizing the EDATE function in conjunction with RPA, users can elevate their analytical capabilities and drive improved outcomes, ultimately contributing to operational efficiency and business growth.

Conclusion
The EDATE function in DAX is an essential tool for effective date manipulation within Power BI, delivering significant advantages across various applications. By enabling users to add or subtract months from a specified date, this function enhances operational efficiency in areas such as subscription management, loan scheduling, and sales forecasting. It is vital to understand the syntax and common pitfalls associated with EDATE to avoid errors and ensure accurate data analysis.
Implementing best practices, such as utilizing valid date formats and leveraging dynamic calculations, further amplifies the utility of the EDATE function. Additionally, establishing dedicated date tables can streamline data processing and improve overall performance. As organizations increasingly depend on data-driven insights for strategic decision-making, mastering functions like EDATE is imperative for maintaining a competitive edge.
Ultimately, the ability to manipulate dates effectively using the EDATE function not only supports operational efficiency but also empowers users to derive actionable insights from their data. In a landscape where data is likened to ‘the new oil,’ harnessing the full potential of tools like EDATE can lead to informed decisions that drive growth and innovation. By integrating these capabilities with Robotic Process Automation (RPA), businesses can transform their data management processes, paving the way for enhanced analytical outcomes and sustained success.
Frequently Asked Questions
What is the purpose of the EDATE function in DAX?
The EDATE function in DAX is designed to calculate a specific date that is a designated number of months before or after a given starting date, which is essential for determining due timelines, maturity periods, or any time-related adjustments.
What is the syntax for the EDATE function?
The syntax for the EDATE function is as follows: EDATE(
Can you provide an example of how to use the EDATE function?
For example, to find the date that occurs three months after January 1, 2025, you would use: EDATE(“2025-01-01”, 3), which results in April 1, 2025.
Why is mastering the EDATE function important in Power BI?
Mastering the EDATE function is crucial for anyone looking to perform accurate time-related calculations, enhancing decision-making and operational efficiency in Power BI.
What are some practical applications of the EDATE function in business scenarios?
The EDATE function can be used for subscription management to determine billing dates, for loan payment schedules to forecast payment timelines, and for sales projections to adjust anticipated sales periods based on historical data.
How does the EDATE function improve operational efficiency?
By automating date calculations, the EDATE function facilitates accurate billing, financial planning, and strategic sales forecasting, thereby improving operational efficiency and decision-making processes.
What challenges do organizations face regarding date calculations?
Many organizations struggle with outdated systems that hinder their ability to leverage insights effectively, which can be addressed by integrating modern tools and automation solutions like EMMA RPA.
How can RPA solutions enhance the use of the EDATE function?
RPA solutions can reduce manual errors associated with date calculations, streamline processes, and free up resources for more strategic tasks, ultimately improving data management and analytics in subscription-driven enterprises.
Overview
This article presents a comprehensive step-by-step guide for implementing cross reports aimed at maximizing operational efficiency within organizations. It highlights the critical role of interdepartmental communication and data integration. Successful implementation not only enhances decision-making but also fosters collaboration and improves overall efficiency. This assertion is backed by various case studies and statistical evidence, demonstrating the tangible benefits of adopting these practices.
Introduction
In the dynamic realm of business, the capacity to make informed decisions relies heavily on the effective integration of data across departments. Cross reports serve as crucial instruments that not only consolidate diverse data sources but also illuminate performance metrics. This enables organizations to identify trends and enhance collaboration.
With a growing number of marketers acknowledging the significance of integrated data analysis, the pursuit of operational efficiency has never been more urgent. As companies aim to refine their decision-making processes, grasping the complexities of cross reporting is essential.
This article explores the definition, benefits, and implementation strategies of cross reports, illustrating how they can revolutionize organizational communication and propel growth in an increasingly competitive landscape.
Understanding Cross Reports: Definition and Importance
Cross reports serve as crucial analytical instruments that unify information from diverse origins or divisions within a company, providing a comprehensive perspective of performance metrics. Their significance lies in their ability to identify trends, facilitate informed decision-making, and foster collaboration among teams through the utilization of cross reports. Organizations that harness interdepartmental communication can enhance operational efficiency by streamlining processes and aligning strategies across departments.
Current statistics underscore the importance of interdepartmental communications in organizations:
- A notable 59% of marketers believe they are employing the right number of channels in their marketing strategies, indicating a growing acknowledgment of the need for integrated data analysis.
- Only 4% of employees endorse podcasts as a communication method, highlighting the necessity for more effective communication strategies that can be supported by cross reports.
- Organizations that empower staff to make assigned decisions experience a 3.9 times increase in their chances of success, emphasizing the essential role of informed decision-making backed by extensive data.
The ‘Mehrabian Myth‘ illustrates that a significant portion of communication is nonverbal, underscoring the importance of clear and integrated communication in the context of reporting. Case studies reveal that many companies are reassessing their meeting cultures, with employees indicating that approximately one-third of their weekly meetings are unnecessary. This frustration has catalyzed a shift towards more effective communication strategies, including the implementation of collaborative documents to enhance engagement and operational effectiveness.
Understanding the meaning and significance of collaborative documents is vital for entities aiming to boost their operational efficiency in 2025 and beyond. By employing interconnected evaluations and cross reports, companies can enhance their performance indicators and improve decision-making procedures, ultimately fostering growth and innovation. Furthermore, integrating Robotic Process Automation (RPA) solutions, such as EMMA RPA and Microsoft Power Automate, can streamline workflows and elevate employee morale, reinforcing the case for a comprehensive approach to operational efficiency.
Examples of organizations successfully executing collaborative documents illustrate their effectiveness in achieving strategic objectives and enhancing performance.

Benefits of Cross Reporting for Operational Efficiency
Implementing cross reports can yield numerous benefits, including:
-
Enhanced Decision-Making: Cross analyses provide a comprehensive perspective on information, empowering leaders to make informed choices based on holistic insights. This approach significantly improves decision quality, as research indicates that organizations leveraging combined data experience a marked increase in decision-making efficiency. For instance, best-in-class companies prioritizing data-driven decision-making report process improvements of up to 30%. A case study on GUI automation at a mid-sized company illustrates how automating data tasks not only reduced errors by 70% but also enhanced the overall decision-making process.
-
Enhanced Cooperation: By breaking down departmental barriers, joint reports foster collaboration among teams, motivating them to unite towards common goals. This collaborative environment enhances communication and aligns efforts across the organization, leading to more cohesive strategies. Cultural norms play a crucial role; interdependent cultures often favor group involvement to ensure social harmony, which can enhance the effectiveness of a cross report. The success of GUI automation in streamlining workflows further exemplifies this collaborative spirit.
-
Enhanced Efficiency: Automating the reporting process minimizes the time spent on manual data collection and analysis. This efficiency allows teams to redirect their focus towards strategic initiatives that drive growth and innovation, rather than getting bogged down in routine tasks. The implementation of GUI automation has demonstrated an 80% improvement in workflow efficiency, showcasing the potential of automation in enhancing operational processes.
-
Improved Resource Distribution: Cross analyses enable organizations to identify underperforming sectors, promoting more efficient resource allocation. By pinpointing where resources are most needed, companies can optimize performance and ensure that investments yield the highest returns. The case study titled ‘Enhancing Data-Driven Decision-Making’ emphasizes the importance of information technology in integrating, storing, and presenting data to decision-makers, highlighting the necessity for a cultural shift within organizations to view information as a valuable asset.
-
Data-Driven Culture: The utilization of interconnected reports fosters a culture of data-informed decision-making, enhancing accountability and transparency across the organization. As teams become more accustomed to relying on data for their decisions, the overall organizational mindset shifts towards valuing information as a critical asset, ultimately leading to improved outcomes. As noted by Snibbe & Markus, different cultural perspectives can influence decision-making, with middle-class Americans often exhibiting a dissonance effect in their choices, while working-class Americans may approach decisions differently.
In 2025, organizations emphasizing collaborative reporting are anticipated to achieve substantial operational efficiency improvements, with studies suggesting that companies adopting this practice can enhance their decision-making processes by as much as 30%. For example, top-tier companies that have integrated interdepartmental reporting into their operations indicate higher levels of collaboration and resource optimization, providing a competitive edge in their respective markets. The transformative impact of Creatum GmbH’s Power BI Sprint service underscores the importance of effective data reporting and actionable insights in achieving these goals.
Client testimonials highlight the effectiveness of Creatum GmbH’s solutions in enhancing operational efficiency and driving business growth.

Step-by-Step Guide to Implementing Cross Reports
To apply integrated analyses efficiently and enhance operational productivity, adhere to these crucial steps:
-
Identify Key Metrics: Begin by determining the metrics that are crucial for achieving your organization’s objectives. Involve stakeholders from various departments to ensure alignment and that the selected metrics reflect broader strategic goals. Choosing the right KPIs is essential for improving performance and making informed decisions based on business objectives, as highlighted in the case study on selecting operational metrics KPIs.
-
Select Information Sources: Identify the information sources that will contribute to your cross report. This may encompass databases, spreadsheets, and various reporting tools. Selecting appropriate information sources is vital, as it directly influences the quality and reliability of your reports.
-
Establish Information Integration: Utilize information integration tools to consolidate insights from different sources. Ensure that the information is compatible and can be aggregated seamlessly. Effective information integration is foundational for accurate reporting and analysis.
-
Design the Layout: Create a layout that presents information clearly and effectively. Incorporate visualizations such as charts and graphs to enhance comprehension and facilitate quick insights.
-
Automate Document Creation: Utilize automation tools, such as robotic process automation (RPA) solutions like EMMA RPA and Microsoft Power Automate, to enhance the document creation process. This reduces manual effort and minimizes errors, allowing teams to focus on analysis rather than data collection. Companies that utilize effective operational metrics have seen a 24% increase in performance compared to their counterparts, underscoring the value of automation in enhancing operational efficiency and employee morale. By addressing repetitive tasks and staffing shortages, RPA solutions can significantly improve workplace productivity.
-
Test and Validate: Prior to full deployment, conduct tests with a select group of users to gather feedback. This step is essential for identifying any issues and making necessary adjustments to enhance the document’s functionality and usability.
-
Train Users: Provide comprehensive training for users on how to interpret and utilize the cross report data effectively. Ensuring that users are well-prepared to utilize the documents will enhance their influence on decision-making.
-
Monitor and Optimize: Following implementation, continuously observe the documents for accuracy and relevance. Consistently evaluate and modify the documents as necessary to enhance their efficiency and guarantee they stay in line with operational objectives. Moreover, consider the average time to recuperate acquisition expenses per new client, gauged by the CAC payback duration, as an essential metric to evaluate the effect of your operational efficiency initiatives.
By adhering to these steps, firms can execute joint analyses that not only improve operational efficiency but also facilitate informed decision-making across divisions. Creatum GmbH’s RPA solutions are designed to tackle these challenges effectively.

Overcoming Challenges in Cross Report Implementation
Implementing cross reports presents significant challenges that organizations must navigate to achieve maximum operational efficiency.
- Information Silos: Departments often accumulate information, creating barriers to accessing essential details. To combat this, fostering a culture of sharing and collaboration is crucial.
Organizations that prioritize cross-departmental information collaboration have seen remarkable results. For instance, companies like Spotify reported 45% faster feature development cycles by breaking down these silos. Moreover, a recent survey revealed that 72% of participants are merging security with observability and monitoring to tackle evolving security threats, highlighting the significance of cohesive information management in cross reports.
- Inconsistent Information Quality: Variations in information quality can lead to flawed reports, undermining decision-making processes.
Implementing strong information governance practices is essential to guarantee consistency and reliability across all reporting metrics. This approach not only improves information quality but also aids in informed decision-making, as demonstrated in case studies where entities transformed raw information into actionable insights. By leveraging Business Intelligence, organizations can empower themselves to extract meaningful insights from raw data, enhancing data quality and supporting informed decision-making.
-
Resistance to Change: Employees may resist new reporting processes due to uncertainty or fear of the unknown. To alleviate this, it is essential to clearly convey the advantages of cross reports and engage team members in the implementation process. Engaging employees in discussions about how these changes can enhance their workflows can significantly increase buy-in and reduce resistance.
-
Technical Limitations: Existing systems may lack the capability to support inter-reporting effectively. Conducting a thorough assessment of current technology is necessary to identify gaps. Organizations should be prepared to invest in necessary upgrades or integrations to facilitate seamless cross-report functionalities.
Leveraging Robotic Process Automation (RPA) can help automate manual workflows, enhancing operational efficiency in this rapidly evolving AI landscape.
- Training Needs: Users may require training to effectively utilize new reporting tools. Providing comprehensive training sessions and ongoing support is essential to facilitate adoption.
Ensuring that employees are well-equipped to navigate new systems can lead to smoother transitions and improved reporting efficiency. The 3-Day Power BI Sprint offered by Creatum GmbH exemplifies how targeted training can empower teams to leverage insights effectively.
By addressing these challenges head-on, organizations can enhance their reporting capabilities, ultimately leading to improved operational efficiency and better decision-making outcomes.

Ensuring Data Quality and Integration for Effective Cross Reporting
To ensure data quality and integration for effective cross reporting, consider the following strategies:
-
Implement Information Governance Policies: Establishing robust information governance policies is crucial for maintaining high standards in entry, management, and sharing. These policies should define roles, processes, and metrics to ensure accountability and consistency throughout the entity. In 2024, essential components for governance frameworks will encompass information, roles, processes, communications, metrics, and tools, emphasizing the necessity for entities to adjust to these evolving standards.
-
Leverage Robotic Process Automation (RPA): Implementing RPA can significantly streamline manual workflows, reducing errors and freeing up your team for more strategic tasks. By automating repetitive processes, companies can improve operational efficiency and ensure that information is consistently managed and reported.
-
Routine Information Audits: Performing routine information audits is crucial for detecting and correcting discrepancies. Statistics suggest that organizations with developed governance frameworks surpass their counterparts by an average of 20% in key performance indicators, with this gap expanding to 30% after five years. Regular audits help maintain this competitive edge by ensuring that all information remains accurate and up-to-date.
-
Utilize Validation Tools: Using automated validation tools can greatly decrease inaccuracies. These tools verify for mistakes and discrepancies in entries, ensuring that only trustworthy information is utilized for reporting, which is crucial considering that 70% of executives’ time is dedicated to locating information instead of assessing it.
-
Train Staff on Information Management: Providing comprehensive training for employees on best practices for information entry and management minimizes errors at the source. Empowering staff with knowledge about information governance policies enhances overall quality and supports effective cross reporting.
-
Integrate Information Sources: Utilizing integration tools is key to harmonizing information from various sources. This guarantees that all pertinent information is easily accessible for reporting purposes, facilitating informed decision-making and enhancing operational efficiency. Organizations that prioritize information integration are better positioned to utilize insights from their resources, driving growth and innovation.
As Steve Bennett, a Business Formation Expert, states, “Our commitment is to empower you with reliable, up-to-date, and actionable insights, ensuring you make informed decisions.” This highlights the significance of implementing effective information governance and management practices, alongside leveraging RPA and AI solutions to enhance operational efficiency.

Leveraging Technology: RPA and AI in Cross Reporting
Leveraging technology is crucial for optimizing the cross report process. Here’s how RPA and AI can significantly enhance this process:
-
Automate Information Collection: Robotic Process Automation (RPA) from Creatum GmbH streamlines the extraction of information from diverse sources, drastically reducing the time and effort usually spent on manual information gathering. This automation not only accelerates the process but also allows teams to focus on more strategic tasks, ultimately enhancing employee morale by reducing repetitive workloads.
-
Enhance Information Accuracy: Artificial Intelligence (AI) algorithms play a vital role in scrutinizing content for inconsistencies and errors. By guaranteeing that solely premium information is used in analyses, entities can enhance the dependability of their insights, which is crucial for informed decision-making. As observed, half of all entities now acknowledge that employing automation greatly diminishes or even removes errors resulting from manual processes, tackling inconsistencies and governance challenges.
-
Streamline Reporting Processes: RPA automates the generation and distribution of cross reports, ensuring timely delivery to stakeholders without requiring manual intervention. This efficiency is particularly beneficial in a fast-paced business environment where timely insights are critical, transforming business operations and overcoming outdated systems through intelligent automation.
-
Predictive Analytics: AI enables organizations with predictive insights derived from historical information, allowing them to foresee trends and make proactive choices. This capability is becoming more crucial as companies strive to remain ahead in a competitive environment, utilizing customized AI solutions for improved information reporting and actionable insights.
-
User-Friendly Interfaces: The implementation of AI-driven dashboards enhances user interaction with data, enabling on-demand document generation. This accessibility not only enhances usability but also promotes data-driven decision-making throughout the entity, reinforcing the significance of Business Intelligence in fostering growth and innovation.
As the hyper-automation market is anticipated to attain $600 billion by 2025, the incorporation of RPA and AI in inter reporting processes is becoming progressively vital. Notably, 61% of finance companies report significant cost savings through automation, underscoring the financial benefits of these technologies. Moreover, entities utilizing AI for predictive analytics in cross reporting are experiencing improved operational efficiency, as demonstrated by case studies showcasing the transformative effect of RPA and AI on interconnected reporting processes. The rising vendor funding for RPA, which has hit a record level, demonstrates the growing confidence in these technologies, further aiding their incorporation into various reporting. Book a free consultation.

Measuring Success: Key Metrics for Cross Reporting
To effectively measure the success of the cross report, organizations should focus on the following key metrics:
-
Report Precision: This metric evaluates the proportion of documents that are free from mistakes, serving as an essential gauge of information quality and trustworthiness. High precision levels are crucial for building confidence in the insights obtained from documents.
Tailored solutions, such as Robotic Process Automation (RPA) from Creatum GmbH, can improve data quality, ensuring that documents are not only precise but also pertinent to the organization’s objectives.
-
Time to Create Documents: Monitoring the time needed to generate interconnected documents is essential, particularly as automation is introduced. Organizations should aim for a continuous reduction in this time, enhancing efficiency and allowing teams to allocate resources to more strategic tasks. The integration of tailored AI solutions can further streamline this process.
However, it is important to present these metrics with appropriate precision; overstating can lead to misleading conclusions, similar to the example of serum total bilirubin measurements in newborns.
-
User Adoption Rates: Tracking the frequency with which employees use shared documents offers insight into the effectiveness of training and communication initiatives. High adoption rates indicate that users consider the documents valuable and accessible, which is essential for maximizing their impact.
-
Decision-Making Speed: Assessing the pace at which choices are made based on insights from diverse analyses is crucial. Organizations should strive for quicker turnaround times, as this agility can significantly enhance operational responsiveness and competitiveness. It is important to interpret these metrics carefully; statistical significance does not imply causation, and rigorous evaluation is necessary to draw valid conclusions.
-
Impact on Operational Efficiency: Evaluating enhancements in key operational metrics, such as productivity and resource allocation, can be directly linked to the use of cross reports. A case study on a mid-sized company that implemented GUI automation to streamline operations illustrates how automation can reduce data entry errors by 70% and improve workflow efficiency by 80%. This assessment aids in comprehending the broader implications of inter-reporting on overall business performance.
The case study emphasizes the necessity for thorough statistical assessment to guarantee that the conclusions derived from these metrics are legitimate and backed by evidence.
By methodically monitoring these metrics, entities can obtain valuable insights into the effectiveness of their cross report initiatives, ultimately enhancing operational efficiency and informed decision-making. Furthermore, leveraging Business Intelligence alongside RPA can enhance the overall effectiveness of these metrics, addressing the challenges posed by manual, repetitive tasks.

Best Practices for Maintaining and Optimizing Cross Reports
To effectively maintain and optimize cross reports, organizations should adhere to the following best practices:
-
Regularly Review Metrics: Continuously evaluate the key metrics established to ensure they remain relevant and aligned with organizational objectives. This ongoing assessment helps organizations stay focused on their goals and adapt to any shifts in priorities, ultimately enhancing operational efficiency.
-
Solicit User Feedback: Actively gather input from users to identify areas for enhancement in design and functionality. Organizations that prioritize user feedback often see significant improvements in document usability and effectiveness. As Gabriel Chodick, an Academic Editor, states, “It is crucial that enhancing the quality of publications becomes a collaborative effort involving reviewers, authors, and publishers.” This collaborative method can result in enhanced satisfaction levels, with studies suggesting that organizations utilizing user feedback systems noted a 30% rise in satisfaction.
-
Refresh Information Sources: Frequently update and combine information sources to ensure the precision and pertinence of reports. This practice is crucial in a data-rich environment, where outdated information can lead to misguided decisions. For example, in 2019, 106 publications reported prospective cross-sectional studies, while 221 reported retrospective cross-sectional studies, emphasizing the significance of precise information in generating trustworthy insights. Ensuring that data is current allows for more reliable insights and better decision-making, which is essential for leveraging Business Intelligence effectively.
-
Invest in Training: Offer continuous education for staff to keep them updated on new tools and best practices in reporting. Empowering employees with the latest knowledge not only enhances their skills but also fosters a culture of continuous improvement within the organization, which is vital in a rapidly evolving AI landscape.
-
Adapt to Changing Needs: Be flexible and willing to adjust cross reporting practices as organizational needs evolve. This adaptability guarantees that documents continue to provide value and satisfy the changing demands of the business environment. The recent guidelines seek to enhance the documentation of research in developing regions, highlighting the importance of keeping precise and thorough records.
-
Illustrate Practical Applications: Utilize case studies to demonstrate the practical use of reports. For example, a case study on a mid-sized company that improved efficiency through GUI automation illustrates how automating manual workflows can significantly enhance operational efficiency. This showcases the transformative impact of Creatum GmbH’s technology solutions in driving business growth and informed decision-making. As one client noted, “Creatum GmbH’s solutions have revolutionized our reporting processes, allowing us to make data-driven decisions with confidence.”
By implementing these best practices, organizations can optimize their cross report systems, ultimately leading to improved operational efficiency and informed decision-making.

Conclusion
Implementing cross reports stands as a transformative strategy that empowers organizations to harness the full potential of integrated data analysis. By consolidating information from diverse departments, cross reports deliver a comprehensive view of performance metrics that drive informed decision-making and foster enhanced collaboration. The advantages of adopting cross reporting are unmistakable: improved decision-making, increased collaboration, optimized resource allocation, and the cultivation of a data-driven culture within the organization.
To successfully implement cross reports, organizations must adhere to a structured approach that encompasses:
- Identifying key metrics
- Selecting suitable data sources
- Leveraging automation tools to streamline processes
While challenges such as data silos, inconsistent data quality, and resistance to change may emerge, proactive measures—including robust data governance and thorough training—can effectively mitigate these issues.
Moreover, the integration of advanced technologies such as Robotic Process Automation (RPA) and Artificial Intelligence (AI) significantly bolsters the effectiveness of cross reporting. These technologies not only enhance data accuracy but also facilitate timely insights that are crucial for maintaining a competitive edge. As organizations increasingly prioritize cross reporting, they are poised to experience substantial operational efficiency gains, ultimately leading to enhanced growth and innovation in an ever-competitive market.
In conclusion, embracing cross reporting transcends mere operational improvement; it emerges as a strategic necessity for organizations striving to thrive in the contemporary business landscape. By nurturing a culture of collaboration and leveraging integrated data, companies can position themselves for success, ensuring they make informed decisions that drive performance and achieve their strategic objectives.
Frequently Asked Questions
What are cross reports and why are they important?
Cross reports are analytical tools that unify information from various sources within a company, providing a comprehensive view of performance metrics. They are important because they help identify trends, facilitate informed decision-making, and promote collaboration among teams.
How do cross reports enhance decision-making?
Cross reports enhance decision-making by providing a holistic perspective on information, which empowers leaders to make informed choices. Organizations that leverage combined data often experience significant improvements in decision-making efficiency.
What role does interdepartmental communication play in organizations?
Interdepartmental communication is crucial for enhancing operational efficiency. It helps streamline processes and align strategies across departments, ultimately leading to better collaboration and improved performance.
What statistics highlight the importance of interdepartmental communication?
Statistics indicate that 59% of marketers believe they are using the right number of channels for marketing, while only 4% of employees support podcasts as a communication method. Additionally, organizations that empower staff to make decisions have a 3.9 times greater chance of success.
How can collaborative documents improve operational efficiency?
Collaborative documents enhance engagement and operational effectiveness by promoting clear communication and reducing unnecessary meetings. They are vital for organizations aiming to boost efficiency in the future.
What benefits can organizations expect from implementing cross reports?
Organizations can expect several benefits from cross reports, including enhanced decision-making, improved cooperation among teams, increased efficiency through automation, better resource distribution, and the cultivation of a data-driven culture.
How does automation impact the reporting process?
Automation minimizes the time spent on manual data collection and analysis, allowing teams to focus on strategic initiatives rather than routine tasks. This can lead to significant improvements in workflow efficiency.
What is the significance of a data-driven culture in organizations?
A data-driven culture fosters accountability and transparency, encouraging teams to rely on data for decision-making. This shift in mindset leads to improved outcomes and a greater appreciation for information as a valuable asset.
What are the anticipated outcomes for organizations adopting collaborative reporting by 2025?
Organizations that emphasize collaborative reporting are expected to achieve substantial improvements in operational efficiency, with studies suggesting enhancements in decision-making processes by as much as 30%.
Can you provide an example of a company successfully using cross reports?
Creatum GmbH’s Power BI Sprint service illustrates the effectiveness of cross reporting in enhancing operational efficiency and driving business growth, as highlighted by client testimonials.
Overview
This article serves as a comprehensive guide to harnessing SQL Server Power, aimed at enhancing operational efficiency through effective data management and seamless integration with Business Intelligence (BI) tools. It underscores the necessity of mastering SQL Management Studio and leveraging automation techniques, such as Robotic Process Automation (RPA). Furthermore, it advocates for best practices in connecting SQL Server with Power BI, which facilitates real-time insights, streamlines reporting processes, and empowers informed decision-making.
Introduction
In an increasingly data-driven world, the integration of SQL Server with Power BI emerges as a pivotal strategy for organizations aiming to boost operational efficiency. This dynamic duo not only enables real-time data access but also converts complex datasets into intuitive visual insights, empowering teams to make informed decisions swiftly. As businesses confront the challenges of modern data management, grasping the nuances of SQL Server’s architecture and its seamless connection to Power BI becomes imperative. By optimizing queries and leveraging advanced analytics tools, organizations can unlock a wealth of opportunities that foster growth and innovation.
This article explores the myriad benefits of this integration, practical methods for implementation, and best practices to navigate common challenges. Ultimately, it positions businesses for sustained success in an ever-evolving landscape.
Understanding SQL Server: A Foundation for Operational Efficiency
SQL Server Power, a robust relational database management system (RDBMS) created by Microsoft, is essential for businesses aiming to optimize information management and enhance operational efficiency. Its architecture, which encompasses tables, indexes, and queries, is vital for effective information management. The SQL database supports a diverse range of data types and integrates advanced security features, establishing itself as a reliable choice for organizations seeking to streamline processes and reduce errors.
Recent statistics reveal that SQL Database 2022 has seen a remarkable increase in adoption, achieving a 21% market share as of Winter 2025, up from 13% in the previous quarter. This trend underscores the growing recognition of SQL’s capabilities, particularly as companies prepare for the end of support for earlier versions. SQL 2019 remains dominant with a 44% share, emphasizing the importance of understanding the evolving landscape of SQL versions for effective data management.
As Alan Cranfield aptly noted, “A great snapshot of where we are with versions!”
However, organizations must remain vigilant regarding various internal errors and limitations encountered during database operations, as these can adversely affect overall efficiency. Additionally, Azure SQL DB and Managed Instances represent 2% of the market, further illustrating the diverse options available within the SQL ecosystem.
To fully leverage SQL’s potential, proficiency with SQL Management Studio (SSMS) is crucial. This graphical interface simplifies the management of SQL databases, enabling users to create databases, execute queries, and configure security settings. Mastering SSMS is vital for effectively utilizing SQL Server Power, empowering organizations to enhance operational efficiency through improved information management and informed decision-making.
Incorporating the latest updates from SQL Server Management Studio can further optimize performance. For instance, the introduction of the sys.dm_os_memory_allocations_filtered and sys.dm_os_parent_block_descriptors tables offers valuable insights for memory troubleshooting, a critical aspect of maintaining operational efficiency. By understanding these features and their implications, organizations can more effectively manage their information environments and drive growth.
Moreover, leveraging Robotic Process Automation (RPA) can automate manual workflows, significantly enhancing efficiency and reducing errors, allowing teams to concentrate on strategic initiatives. The integration of BI services, provided by Creatum GmbH, improves data reporting and offers actionable insights, addressing data inconsistency and governance challenges, ultimately fostering better decision-making. Key features such as the 3-Day Business Intelligence Sprint for rapid report creation and the General Management App for comprehensive management further empower organizations to effectively tackle these challenges.
The SQL ConstantCare® Population Report for Winter 2025 also highlights the gradual increase in market share for SQL Database 2022, emphasizing the power of SQL Server and the necessity of staying updated with SQL architecture and its impact on operational efficiency.

Connecting SQL Server to Power BI: Unlocking Data Insights
Integrating SQL Database with Business Intelligence empowers organizations to visualize their data effectively, transforming raw information into actionable insights. BI serves as a robust business analytics tool, offering interactive visualizations and comprehensive capabilities. To establish a seamless connection between SQL Server and Power BI, follow these steps:
- Open Power BI Desktop: Launch the application on your computer.
- Get Data: Navigate to the ‘Home’ tab and select ‘Get Data’. From the list of data sources, choose ‘SQL Database’.
- Enter Host Information: Input the SQL Host name and the specific database name. Select the appropriate authentication method, either Windows or SQL Server authentication.
- Load Data: Once the connection is established, choose the tables or views you wish to import into BI. Click ‘Load’ to incorporate the information into your BI model.
This integration not only facilitates the development of dynamic reports and dashboards that represent real-time information but also enhances operational decision-making. Recent statistics indicate that organizations utilizing BI have experienced a significant boost in visualization effectiveness, with many reporting improved insights that drive strategic initiatives. Notably, information science and analytics positions remain available for an average of 45 days, highlighting the increasing demand for skilled experts in this area and underscoring the value of efficient tools such as BI.
Moreover, the adoption of cloud-based BI solutions has surged, particularly in industries with distributed workforces, emphasizing the importance of scalable and cost-effective analytics tools. As Tajammul Pangarkar, CMO at Prudour Pvt Ltd, states, “The integration of advanced analytics tools is crucial for organizations aiming to enhance their operational efficiency and decision-making capabilities.” By employing BI alongside SQL Server Power, companies can fully leverage their information capabilities, resulting in improved teamwork and operational effectiveness.
Additionally, utilizing Robotic Process Automation (RPA) can simplify manual workflows, addressing challenges like time-consuming report generation and inconsistencies, ultimately promoting business growth. The expansion of business intelligence solutions in the Asia-Pacific region reflects the growing need for effective analytics tools to meet market demands.

Methods to Connect SQL Server to Power BI: A Practical Overview
Connecting SQL Database to Business Intelligence can be achieved through several methods, each offering distinct advantages that address the common challenges organizations face in leveraging insights effectively.
DirectQuery: This method allows Power BI to query the SQL Server Power database directly, ensuring that the information remains current. It is particularly beneficial for large datasets where real-time access is critical, helping to mitigate issues of inconsistencies that may arise from outdated reports. However, organizations often encounter difficulties due to a lack of actionable guidance from the data presented.
- Steps: When establishing the connection, select ‘DirectQuery’ as your connection method. This enables live querying of the database, allowing stakeholders to access actionable insights without the delays associated with report creation.
Import Mode: In this approach, data is imported into Power BI, resulting in faster report generation. However, this information is not real-time and requires SQL Server Power for periodic refreshes. This method can be advantageous when immediate insights are less critical, but it is essential to implement a governance strategy to ensure data accuracy and consistency. Without proper guidance, stakeholders may struggle to interpret the data effectively.
- Steps: Choose ‘Import’ when connecting to SQL Server. Configure scheduled refreshes to keep the information up to date, ensuring that reports remain relevant and reliable.
Utilizing BI Gateway: For on-premises SQL databases, establishing a BI Gateway facilitates secure data transfer between SQL and BI. This method enhances operational efficiency by simplifying data access and reducing the time needed for report creation. Additionally, integrating the General Management App and Microsoft Copilot can further enhance the actionable insights derived from the data.
- Steps: Install the gateway on your server, configure it to connect to your SQL Server, and then link Power BI to the gateway for seamless data access.
Each method has its specific use cases, and selecting the appropriate one depends on your organization’s data needs and infrastructure. By employing these integration techniques, organizations can overcome the challenges of report generation and governance, ultimately fostering improved decision-making and business growth. At Creatum GmbH, we emphasize the importance of actionable insights and efficient information management to enhance operational effectiveness.

Benefits of SQL Server and Power BI Integration for Operational Efficiency
Integrating SQL Server with Power BI offers a multitude of advantages that significantly enhance operational efficiency:
-
Real-Time Information Access: By utilizing DirectQuery, users can access the latest information, enabling prompt and informed decision-making. In today’s fast-paced business environment, timely insights are crucial for gaining competitive advantages.
-
Enhanced Data Visualization: Power BI’s robust visualization tools empower organizations to interpret complex datasets effectively. Transforming raw data into intuitive visual formats allows teams to swiftly identify trends and derive actionable insights, ultimately driving better business outcomes.
-
Improved Collaboration: The ability to share Power BI dashboards among teams enhances collaboration. Stakeholders gain access to consistent information insights, fostering a unified approach to decision-making and strategy development.
-
Automated Reporting: This integration streamlines the reporting process through automation, significantly reducing time spent on manual tasks. Such efficiency enables teams to focus on strategic initiatives, thereby enhancing overall productivity. Additionally, leveraging Robotic Process Automation (RPA) can further automate workflows, boosting efficiency and minimizing errors, freeing your team for more value-adding work.
-
Scalability: As organizations expand, the SQL database and Business Intelligence integration can seamlessly scale to manage larger datasets and more complex queries. This scalability ensures that performance remains robust, even as requirements evolve.
Organizations that have embraced this integration report substantial improvements in operational efficiency. For instance, a recent case study demonstrated how linking SQL Server Profiler to Power BI Desktop allowed users to identify and enhance slow queries, resulting in improved report performance. By applying the methods highlighted in this integration, organizations can achieve notable advancements. As Stefan Alexandrov stated, “By utilizing the methods outlined above, we achieved a 10× improvement in both report load times and processing speed.”
Moreover, the transformative impact of Creatum GmbH’s BI Sprint has been echoed by clients like Sascha Rudloff from PALFINGER, who noted, “The outcomes of the Sprint surpassed our expectations and served as a vital motivation for our analysis strategy.” This real-time data access not only enhances decision-making but also establishes a precedent for future development practices.
By harnessing these advantages, organizations can streamline operations, reduce costs, and significantly boost productivity, positioning themselves for sustained growth and innovation in 2025 and beyond. With 6,651 subscribers to our blog, we are committed to sharing insights that empower businesses to leverage SQL and Power BI effectively.

Overcoming Challenges in SQL Server and Power BI Integration
Integrating SQL Database with Power BI can significantly enhance operational efficiency, yet several challenges may arise:
-
Connection Issues: Users may encounter difficulties connecting to the SQL database due to network configurations or firewall settings. It is essential to ensure that the SQL Server is accessible and that the correct credentials are used.
- Solution: Verify network settings and confirm that the SQL Server allows remote connections.
-
Refresh Issues: Problems with refreshes, particularly when utilizing DirectQuery, can lead to delays in accessing the most current data, ultimately impacting decision-making.
- Solution: Monitor the performance of the SQL Server and optimize queries to ensure efficient data retrieval, enhancing overall workflow and reducing errors. Implementing Robotic Process Automation (RPA) can further streamline these processes.
-
Performance Bottlenecks: Large datasets can slow down report performance in Power BI, making it challenging to extract meaningful insights quickly.
- Solution: Optimize SQL queries and consider using aggregations or summary tables to improve performance. This approach can help leverage Business Intelligence for informed decision-making, converting raw information into actionable insights that drive growth and innovation. User training is crucial, as employees may require guidance to effectively utilize BI and harness the power of SQL Server. Without proper training, the potential of these tools may not be fully realized.
- Solution: Provide training sessions and resources to help users become proficient in using both tools, ensuring they can navigate the overwhelming AI landscape and utilize tailored solutions effectively.
By proactively addressing these challenges, organizations can ensure a successful integration process, ultimately enhancing efficiency and driving growth. At Creatum GmbH, we are committed to helping you overcome these technology implementation challenges.

Best Practices for Leveraging SQL Server with Power BI
To fully harness the power of SQL Server in conjunction with Power BI, organizations must adopt several best practices:
-
Optimize SQL Queries: Crafting efficient SQL queries is crucial for minimizing resource consumption and enhancing performance. Instead of using
SELECT *, specify only the necessary columns to streamline information retrieval and reduce processing time. Following query design guidelines can significantly improve cardinality estimates, leading to better performance. -
Use Indexes Wisely: Implementing indexes on frequently queried columns can dramatically speed up retrieval times. Regular maintenance and updates of these indexes are essential to ensure they continue to deliver optimal performance; outdated indexes can lead to slower query responses.
-
Leverage Query Folding: The query folding capability allows transformation tasks to be executed directly on SQL Server. This method decreases the computational burden on BI, resulting in quicker report creation and enhanced overall performance.
-
Schedule Information Refreshes: Establishing consistent refresh timelines is vital for ensuring that BI reports reflect the most up-to-date information. Automating this process reduces the need for manual intervention and enhances the reliability of insights produced, addressing inconsistencies and governance challenges in business reporting.
-
Monitor Performance: Continuous observation of both SQL Server and BI performance is essential for identifying and resolving potential bottlenecks. Tools such as the Performance Analyzer in Power BI can help pinpoint performance issues by outlining the execution time of each visual, DAX query, or connection. This tool is invaluable for organizations seeking to enhance operational efficiency and drive data-driven insights.
-
Avoid Bi-directional Relationships: As noted by expert Jayleny, unless absolutely necessary, it is advisable to avoid bi-directional relationships, as they can lead to performance issues and increased model complexity.
By applying these best practices, organizations can significantly enhance their operational efficiency and maximize the advantages of SQL Server power in their integration efforts. The case study titled “Business Intelligence Empowerment” illustrates how organizations can transform unrefined information into actionable insights through improved information quality and business intelligence solutions, ultimately fostering more informed decision-making and strategic growth. Furthermore, in Azure SQL Database, Query Store hints can be utilized to enforce plans instead of relying solely on plan guides, providing additional technical guidance on optimizing SQL queries.
Moreover, leveraging customized AI solutions can aid in navigating the complex technological landscape, ensuring that businesses can effectively harness the power of Business Intelligence for growth and innovation.
![]()
Key Takeaways: Enhancing Operational Efficiency with SQL Server
In summary, leveraging SQL Database in conjunction with BI tools can substantially elevate operational efficiency, particularly when integrated with Robotic Process Automation (RPA) solutions. Key takeaways include:
- Recognizing SQL Server as a foundational tool for effective data management. The significance of linking SQL Server to Business Intelligence for real-time data insights is further amplified through SQL Server’s capabilities and RPA, automating manual workflows.
- Exploring various methods for establishing this connection, each offering distinct advantages.
- Understanding the myriad benefits of integration, such as enhanced decision-making, collaboration, and operational efficiency fueled by data insights.
- Implementing strategies to navigate common challenges during the integration process, especially within the swiftly evolving AI landscape.
- Adopting best practices for optimizing SQL Server Power with Business Intelligence, enabling organizations to adeptly maneuver through the complexities of AI with tailored solutions.
By executing these strategies, organizations can streamline operations, cut costs, and foster innovation through data-driven decision-making. Client testimonials reveal that Creatum GmbH’s technology solutions have markedly improved operational efficiency and spurred business growth, highlighting the transformative impact of our Power BI Sprint on Business Intelligence development.

Conclusion
Integrating SQL Server with Power BI empowers organizations to significantly enhance operational efficiency and make informed decisions grounded in real-time data insights. By grasping SQL Server’s architecture and leveraging its capabilities alongside Power BI’s dynamic visualizations, businesses can transform intricate datasets into actionable intelligence. This integration not only streamlines data management but also cultivates collaboration among teams, enabling them to work with consistent and reliable information.
The various methods to connect SQL Server to Power BI, such as DirectQuery and Import Mode, provide organizations the flexibility to select the optimal approach based on their unique data needs and infrastructure. Moreover, implementing best practices—like optimizing SQL queries, judiciously using indexes, and monitoring performance—can substantially enhance the effectiveness of this integration. By proactively addressing common challenges, organizations can ensure a seamless integration process that maximizes the advantages of both SQL Server and Power BI.
Ultimately, the synergy of SQL Server and Power BI positions businesses for sustained growth and innovation. By embracing these advanced analytics tools, organizations not only enhance their operational efficiency but also secure a competitive edge in today’s data-driven landscape. As the demand for skilled professionals in this domain continues to surge, the focus on effective data management and visualization will only intensify, making it imperative for businesses to fully harness the potential of their data assets.
Frequently Asked Questions
What is SQL Server Power and its significance for businesses?
SQL Server Power is a robust relational database management system (RDBMS) created by Microsoft, essential for optimizing information management and enhancing operational efficiency in businesses.
What are the key components of SQL Server architecture?
The architecture of SQL Server includes tables, indexes, and queries, which are vital for effective information management.
What types of data does SQL Server support?
SQL Server supports a diverse range of data types and integrates advanced security features, making it a reliable choice for organizations.
How has the market share of SQL Database 2022 changed recently?
As of Winter 2025, SQL Database 2022 has achieved a 21% market share, up from 13% in the previous quarter, indicating a significant increase in adoption.
What is the market share of SQL 2019 compared to SQL Database 2022?
SQL 2019 remains dominant with a 44% market share, highlighting the importance of understanding the evolving landscape of SQL versions.
What is the role of SQL Management Studio (SSMS)?
SQL Management Studio (SSMS) is a graphical interface that simplifies the management of SQL databases, enabling users to create databases, execute queries, and configure security settings.
Why is it important to keep SQL Server Management Studio updated?
Incorporating the latest updates from SSMS can optimize performance and provide valuable insights for memory troubleshooting, essential for maintaining operational efficiency.
How can Robotic Process Automation (RPA) benefit organizations using SQL Server?
RPA can automate manual workflows, significantly enhancing efficiency and reducing errors, allowing teams to focus on strategic initiatives.
What advantages does integrating SQL Database with Business Intelligence (BI) provide?
Integrating SQL Database with BI empowers organizations to visualize data effectively, transforming raw information into actionable insights and enhancing operational decision-making.
What are the steps to connect SQL Server with Power BI?
- Open Power BI Desktop. 2. Navigate to the ‘Home’ tab and select ‘Get Data’. 3. Choose ‘SQL Database’ and enter the SQL Host name and database name. 4. Select the authentication method and load the desired tables or views into BI.
What impact does Business Intelligence have on organizations?
Organizations utilizing BI have reported significant improvements in visualization effectiveness, leading to better insights that drive strategic initiatives.
How has the demand for business intelligence tools changed?
The adoption of cloud-based BI solutions has surged, especially in industries with distributed workforces, highlighting the need for scalable and cost-effective analytics tools.
Overview
This article serves as a comprehensive guide to the DAX EXCEPT function in Power BI, highlighting its essential role in identifying unique records through the comparison of two tables. It outlines the syntax and practical applications, while also addressing common pitfalls to avoid. Furthermore, advanced techniques are discussed, illustrating how the DAX EXCEPT function significantly enhances data analysis and operational efficiency in business intelligence scenarios.
Introduction
In the realm of data analysis, discerning unique records from overlapping datasets is paramount. The DAX EXCEPT function in Power BI stands out as a powerful tool, enabling users to extract rows from one table that are absent in another. This functionality is invaluable in various scenarios, such as:
- Identifying customers who made purchases without any returns
- Comparing sales figures across different periods
As organizations strive for operational efficiency and data-driven decision-making, mastering the intricacies of DAX EXCEPT becomes essential. This article will delve into the syntax, practical applications, common pitfalls, and advanced techniques associated with the DAX EXCEPT function, equipping professionals with the knowledge to enhance their data analysis capabilities and drive business success.
Understanding DAX EXCEPT: An Overview
The DAX exclusion mechanism serves as a vital tool in Power BI, enabling users to compare two tables and retrieve rows from the first table that are absent in the second. This feature is particularly beneficial in data analysis scenarios where identifying unique records is crucial. For example, imagine having a list of customers who made purchases alongside another list of customers who returned items.
By leveraging the exclusion capability, you can swiftly identify which customers made purchases without returning any items, thus gaining valuable insights into customer behavior. The outcome of the EXCLUDE operation distinctly presents the rows unique to the first table in relation to the second, underscoring its practicality.
The importance of the DAX EXCEPT feature extends beyond mere information comparison; it plays a pivotal role in enhancing operational efficiency. By facilitating the identification of unique records, organizations can streamline their reporting processes and concentrate on strategic decision-making. In fact, employing such functions can significantly reduce the time spent on manual reconciliation, allowing teams to dedicate resources to more value-adding activities.
This aligns with the overarching goals of our Power BI services, which aim to enhance reporting and provide actionable insights through initiatives like the 3-Day Power BI Sprint and the General Management App.
Moreover, integrating Robotic Process Automation (RPA) can further optimize workflows, enhancing operational efficiency by automating repetitive tasks related to information management. Statistics indicate that the effective application of DAX operations such as EXCLUDE can lead to improved information quality and precision in reporting. As organizations increasingly depend on data-driven insights, grasping and implementing the DAX EXCEPT function becomes essential for achieving operational excellence.
Addressing inconsistency and governance challenges in business reporting is crucial for maintaining integrity and supporting informed decision-making.
As highlighted by the upcoming AI Skills Fest from April 8 to May 28, 2025, continuous learning and mastery of tools like Power BI are vital for professionals striving to stay ahead in the evolving landscape of data analysis. This event will provide an in-depth exploration and practical applications, emphasizing the necessity of mastering DAX capabilities to foster business success. As noted in Power BI Docs, comprehending these capabilities is indeed essential for operational excellence.
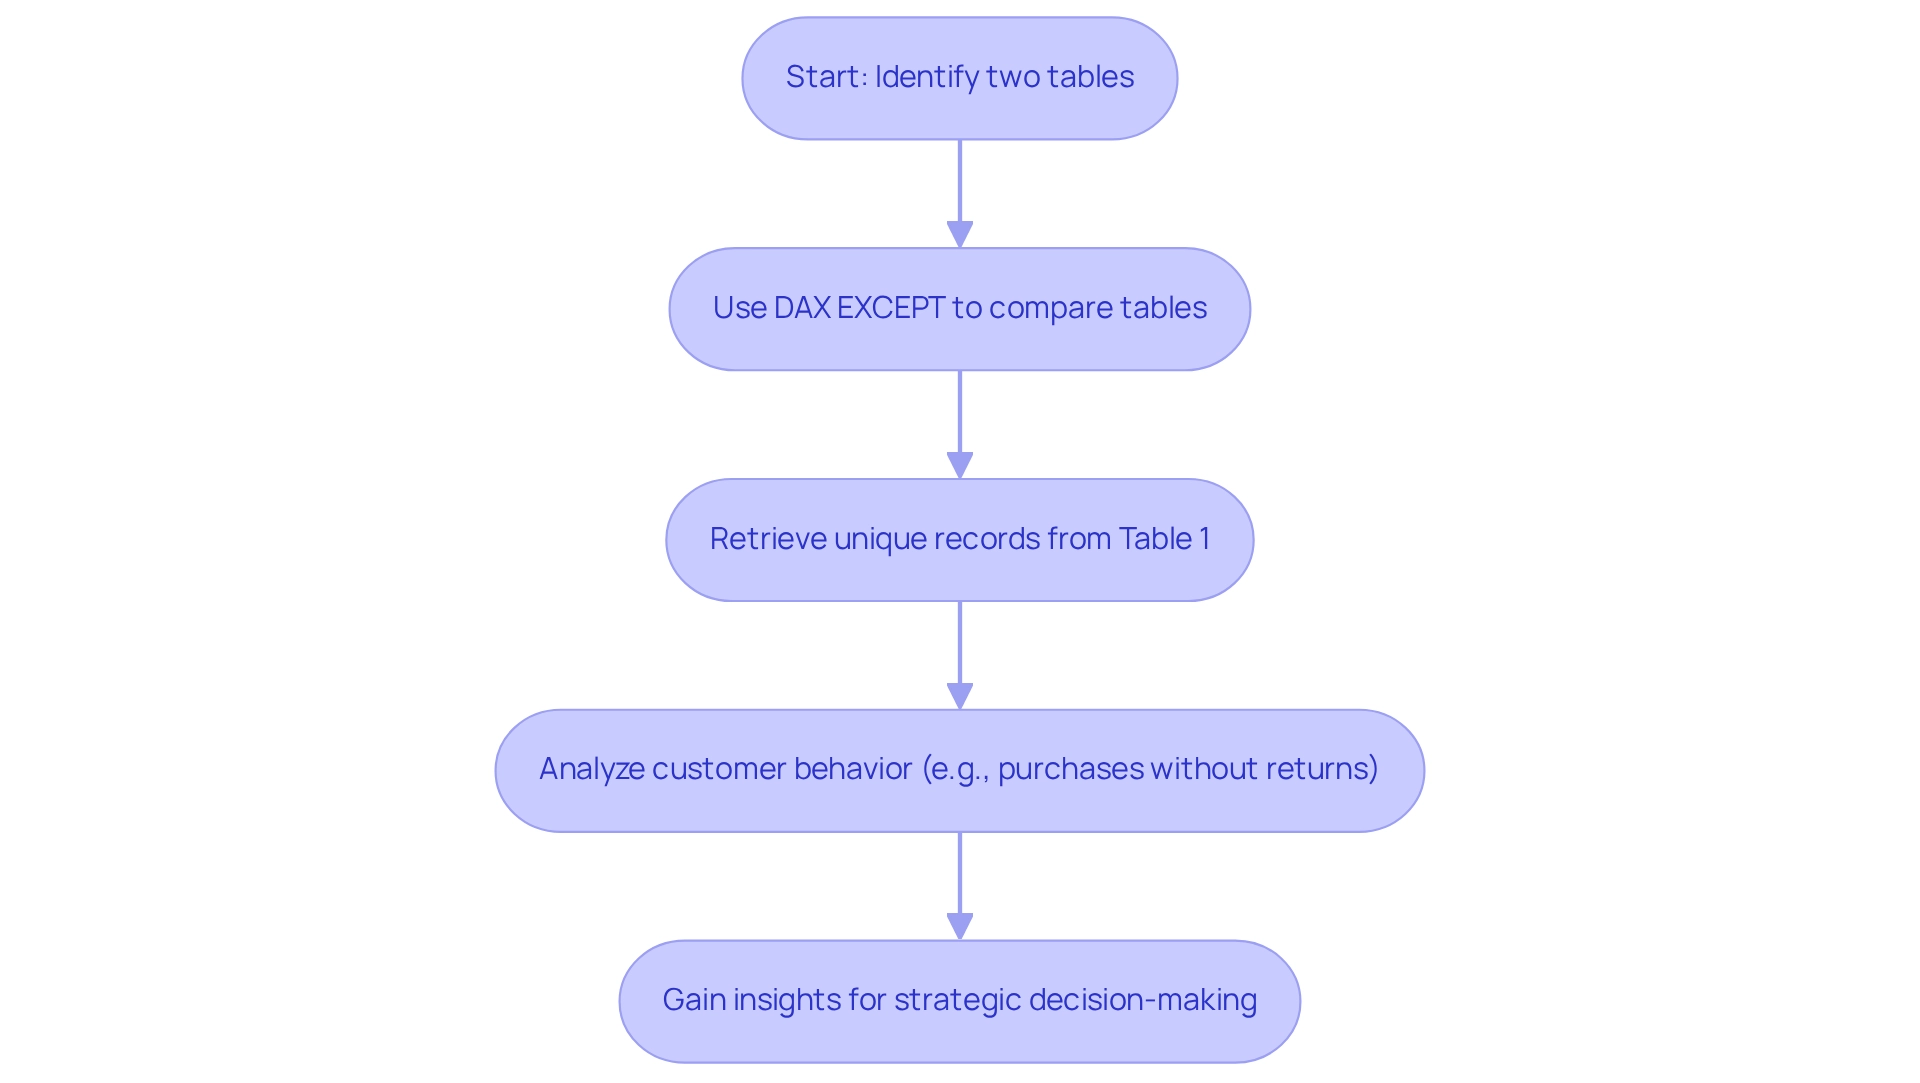
DAX EXCEPT Syntax and Structure
The DAX EXCEPT function is structured as follows:
EXCEPT(<table1>, <table2>)
- table1: This is the primary table from which you want to retrieve rows.
- table2: This is the secondary table from which you want to exclude rows using DAX EXCEPT.
It is crucial that both tables have an identical number of columns and that the types of these columns are compatible. For instance, consider two tables named Sales and Returns. To identify sales records that do not have corresponding return records, you would use the following formula:
EXCEPT(Sales, Returns)
This function is particularly useful in business intelligence scenarios where understanding discrepancies between datasets is crucial for informed decision-making. By utilizing DAX EXCEPT, organizations can enhance their information analysis capabilities, ultimately fostering growth and innovation in a resource-rich environment. Furthermore, the availability of a training module for Power BI users equips them to add calculated tables and columns, which is essential for mastering DAX functions.
For example, consider a recent sales amount of $4,433,004.10 for a Friday. Examining such information using DAX EXCEPT can offer insights into sales performance compared to returns, emphasizing the significance of converting raw information into actionable insights. This aligns with the challenges encountered in utilizing insights from Power BI dashboards, such as time-consuming report creation and inconsistencies in information.
The case study titled “Business Intelligence Empowerment” illustrates how organizations can effectively utilize information analysis to drive growth and innovation, showcasing the critical role of Business Intelligence and RPA in enhancing operational efficiency.
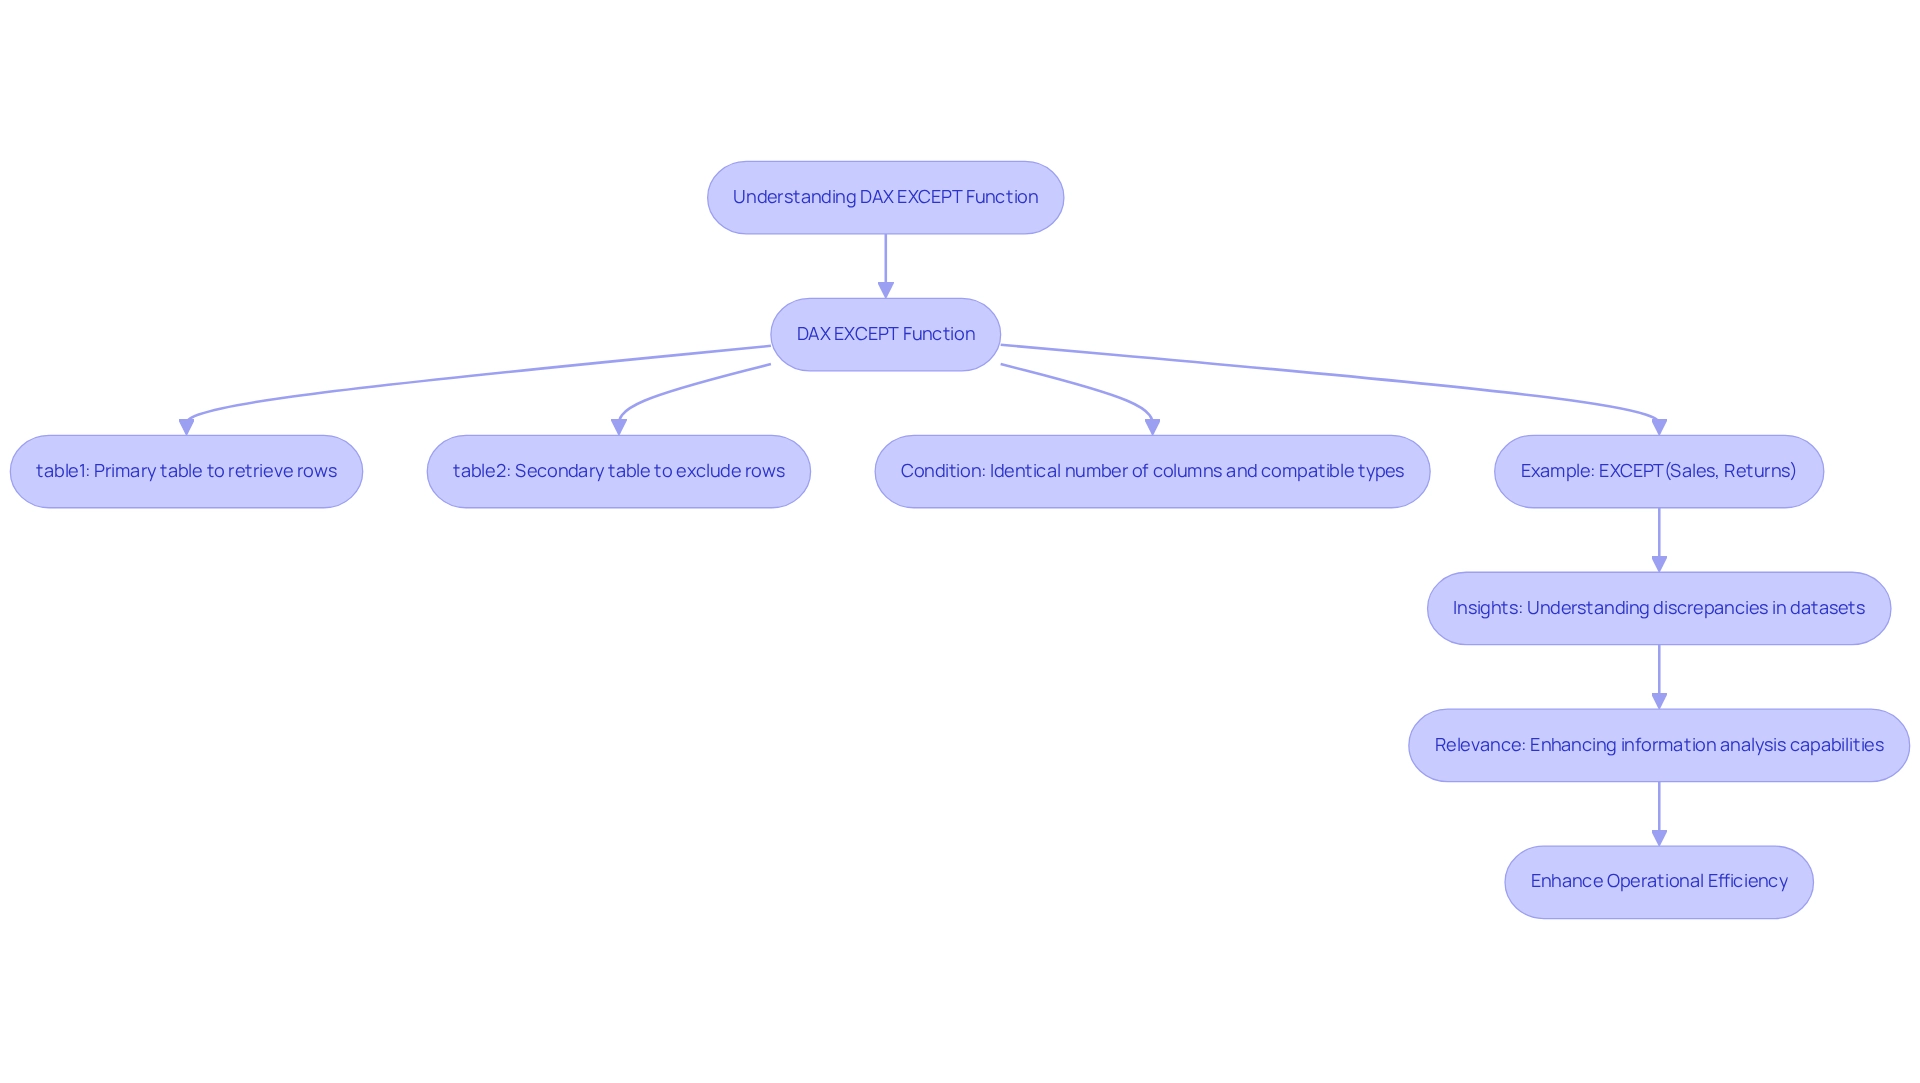
Practical Applications of DAX EXCEPT in Power BI
The DAX function, DAX EXCEPT, which excludes certain values, offers various practical applications that can significantly enhance data analysis skills, especially in today’s complex AI landscape. Here are some key examples:
-
Identifying Unique Customers: By utilizing DAX EXCEPT, businesses can easily pinpoint customers who have not made any purchases. For instance, with a comprehensive table of all customers alongside a separate table for those who have made purchases, the following DAX expression highlights the unique customers:
EXCEPT(All Customers, Purchases)This application is vital for targeted marketing strategies, enabling businesses to engage with potential customers who have yet to convert.
-
Comparing Sales Information: DAX EXCEPT can also be employed to compare sales figures across different periods. For example, to identify which sales records are unique to the first quarter, you can use:
EXCEPT(Sales_Q1, Sales_Q2)This comparison aids in understanding seasonal trends and evaluating the effectiveness of sales strategies over time.
-
Filtering Out Returned Items: Another practical application of DAX EXCEPT is examining sales information without the impact of returned items. By applying the following DAX formula, you can focus on net sales:
EXCEPT(Sales, Returns)This approach ensures that decision-makers have a clearer view of actual sales performance, free from the distortions caused by returns.
These examples illustrate how the DAX EXCEPT function can streamline data analysis by isolating unique records, ultimately enhancing the decision-making process. In a landscape where data-driven insights are paramount, leveraging such capabilities can lead to more informed and strategic business decisions.
Moreover, businesses that struggle to extract meaningful insights may find themselves at a competitive disadvantage. Creatum GmbH’s customized AI solutions can assist in navigating this overwhelming AI environment, improving analytical capabilities and facilitating informed decision-making. Learning DAX functions can be efficient; for instance, the ‘Excel Basics Cheat Sheet’ can be completed in just 18 minutes, emphasizing the ease of acquiring essential skills for operational efficiency.
Furthermore, platforms like TIBCO Spotfire demonstrate the strength of analytical tools, allowing users to effectively examine both historical and real-time information. As Richie Cotton aptly puts it, he spends all day discussing information, highlighting the importance of effective management of information in decision-making. In this context, DAX provides a vital tool for various professionals, including data analysts and business analysts, who rely on data analysis tools to convert raw data into valuable insights that drive decision-making and innovation, ultimately supporting business growth.
Explore how Creatum GmbH can assist you in integrating these insights into your operations.
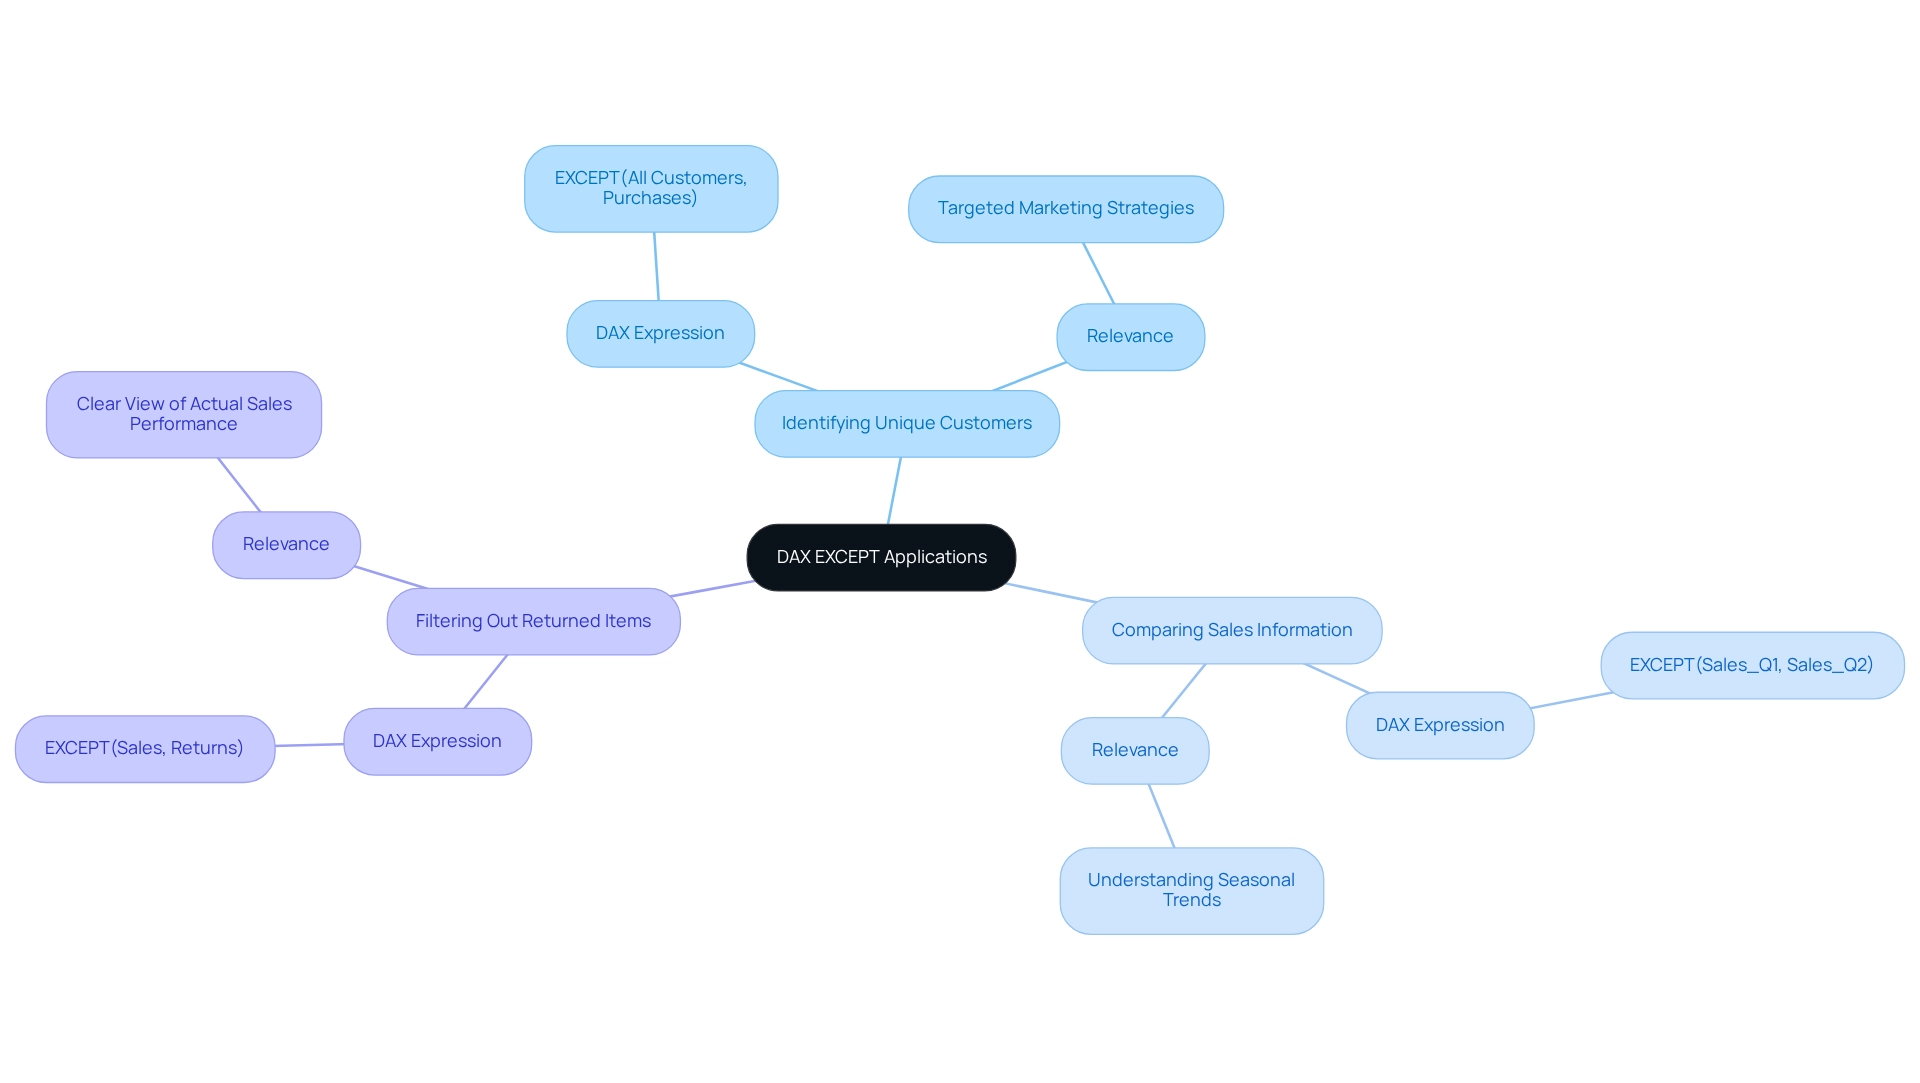
Common Mistakes to Avoid with DAX EXCEPT
When utilizing the DAX EXCEPT function, it is crucial to be aware of several common pitfalls that can lead to errors and inefficiencies, particularly when leveraging insights from Power BI dashboards.
-
Mismatched Column Counts: Both tables involved in the EXCEPT function must have the same number of columns. A discrepancy in column count will result in an error, disrupting your analysis and potentially leading to time-consuming report creation.
-
Incompatible Information Types: Ensure that the columns being compared share compatible information types. For example, attempting to compare a text column with a numeric column will trigger errors, undermining the integrity of your results and contributing to data inconsistencies across reports.
-
Ignoring Duplicates: The exclusion method keeps duplicates from the initial table. If your analysis necessitates unique outcomes, it is recommended to utilize the DISTINCT function along with the alternative. For instance:
DISTINCT(EXCEPT(Sales, Returns))
This approach ensures that your output is free from redundancy, enhancing the clarity of your data and providing actionable guidance for stakeholders.
-
Not Testing with Sample Information: Before utilizing DAX expressions on larger datasets, always conduct tests with sample information. This practice allows you to verify that your expressions yield the expected results, thereby preventing potential errors in your final reports and ensuring that insights are effectively leveraged.
-
Performance Considerations: Be mindful of Bi-Di and M2M relationships, as they can lead to performance degradation by requiring the engine to navigate more pathways and verify more information points. This highlights the significance of information integrity and effective DAX application in enhancing operational efficiency.
-
Selective Data Importation: As noted by Power BI Expert Mark Endicott, “Do not think it’s ok to import every table from your relational database into your model.” This emphasizes the necessity for careful choice of information to enhance performance and prevent overloading your reports with superfluous details. This selective approach also ties into the need for a governance strategy to maintain data quality and consistency.
-
Avoiding Overuse of FILTER: A case study on filtering a column reveals that excessive use of the FILTER tool can lead to performance issues. Instead, consider alternative methods for filtering that improve performance, such as using direct column filtering or KEEPFILTERS, which can streamline your reporting process.
-
Auto Date/Time Setting: The Auto Date/Time setting can harm DAX writing, model size, and performance; it lacks flexibility for complex reporting needs. Being aware of this can help you make more informed decisions when designing your DAX models, ultimately enhancing the effectiveness of your insights.
By being mindful of these common mistakes, you can significantly reduce error rates associated with DAX functions, especially DAX EXCEPT, and improve the overall performance of your Power BI reports. Grasping these subtleties is crucial as information volumes continue to increase, ensuring that your reporting stays effective and efficient, thereby aiding informed decision-making that fosters growth and innovation. Furthermore, leveraging Business Intelligence effectively can transform raw data into actionable insights, reinforcing the importance of a robust governance strategy in your reporting processes.
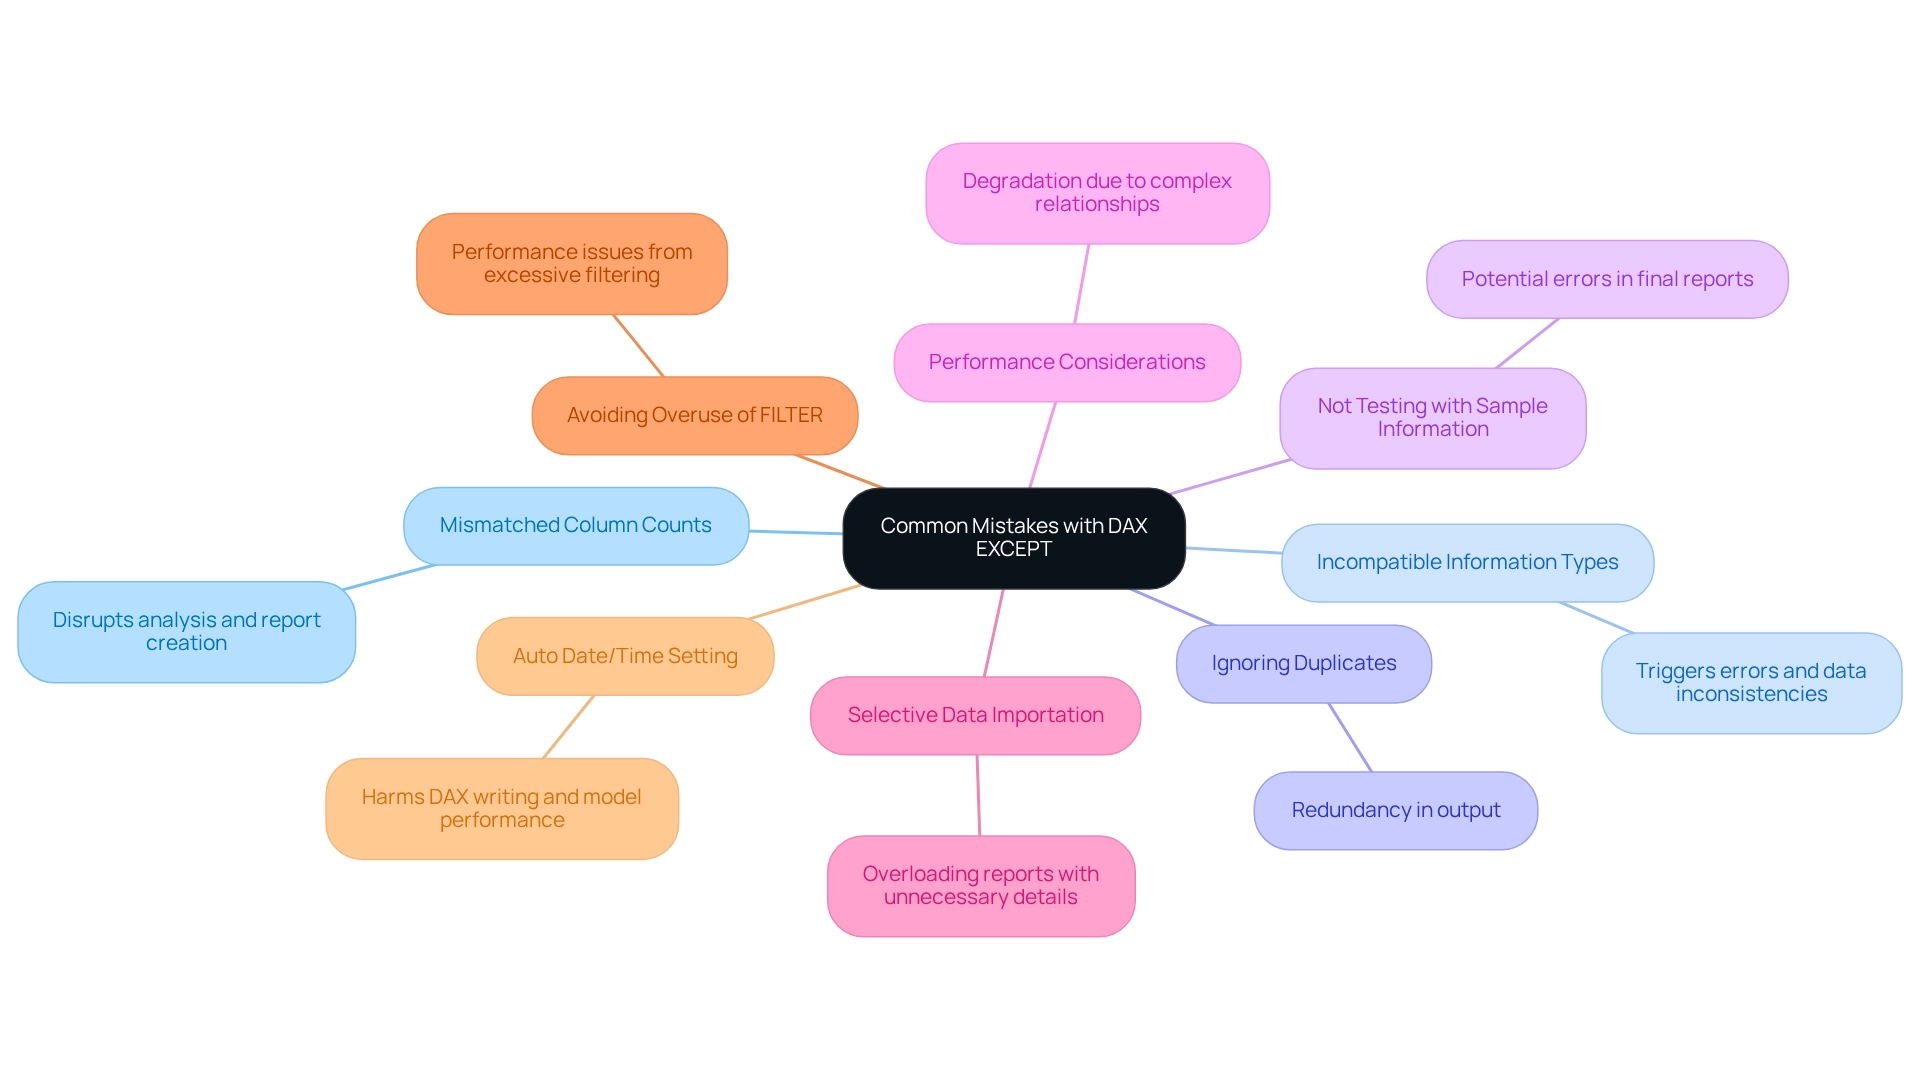
Advanced Techniques for Using DAX EXCEPT
To fully leverage the DAX EXCEPT function, consider implementing advanced techniques that can significantly enhance your analytical capabilities:
-
Combining with Other Functions: Elevate the power of the EXCEPT function by integrating it with other DAX functions such as CALCULATE or FILTER. This strategy facilitates the creation of intricate queries that yield more insightful results. For instance:
CALCULATE(SUM(Sales[Amount]), EXCEPT(AllCustomers, Returns)) -
Using Variables: Streamline complex expressions and boost performance by defining variables. By storing intermediate results, you simplify your calculations. An example of this technique is:
VAR UniqueSales = EXCEPT(Sales, Returns) RETURN SUMX(UniqueSales, Sales[Amount]) -
Dynamic Filtering: Develop dynamic measures that adapt based on user selections within reports. This not only enhances interactivity but also significantly improves user experience, making information exploration more intuitive.
-
Performance Optimization: When managing large datasets, optimizing your DAX queries is crucial. Focus on reducing row-by-row operations and instead utilize set-based operations. This shift can lead to substantial performance improvements, particularly in environments with high data volume.
-
Foundational Knowledge: DAX operates on tables and columns, governed by two types of context: Row Context and Filter Context. A solid understanding of these concepts is essential for effectively applying advanced techniques.
-
Real-World Application: Consider the case study titled “Worked Example of View and Viewer Metrics,” which illustrates how usage metrics are calculated based on user interactions with multiple reports. This example clarifies the metrics involved in tracking report engagement, enabling users to interpret usage information effectively and apply it to enhance report accessibility and relevance.
Integrating these advanced techniques will not only improve the functionality of your DAX usage but also facilitate more efficient analysis and reporting in Power BI. Additionally, as the AI Skills Fest runs from April 8 to May 28, 2025, it serves as a timely reminder of the importance of continuous learning in DAX and AI, ultimately driving growth and innovation. By leveraging tailored AI solutions, you can navigate the complexities of the AI landscape, while Business Intelligence and Robotic Process Automation (RPA) can further enhance operational efficiency and address the challenges posed by manual, repetitive tasks, enabling data-driven decisions that propel your business forward.
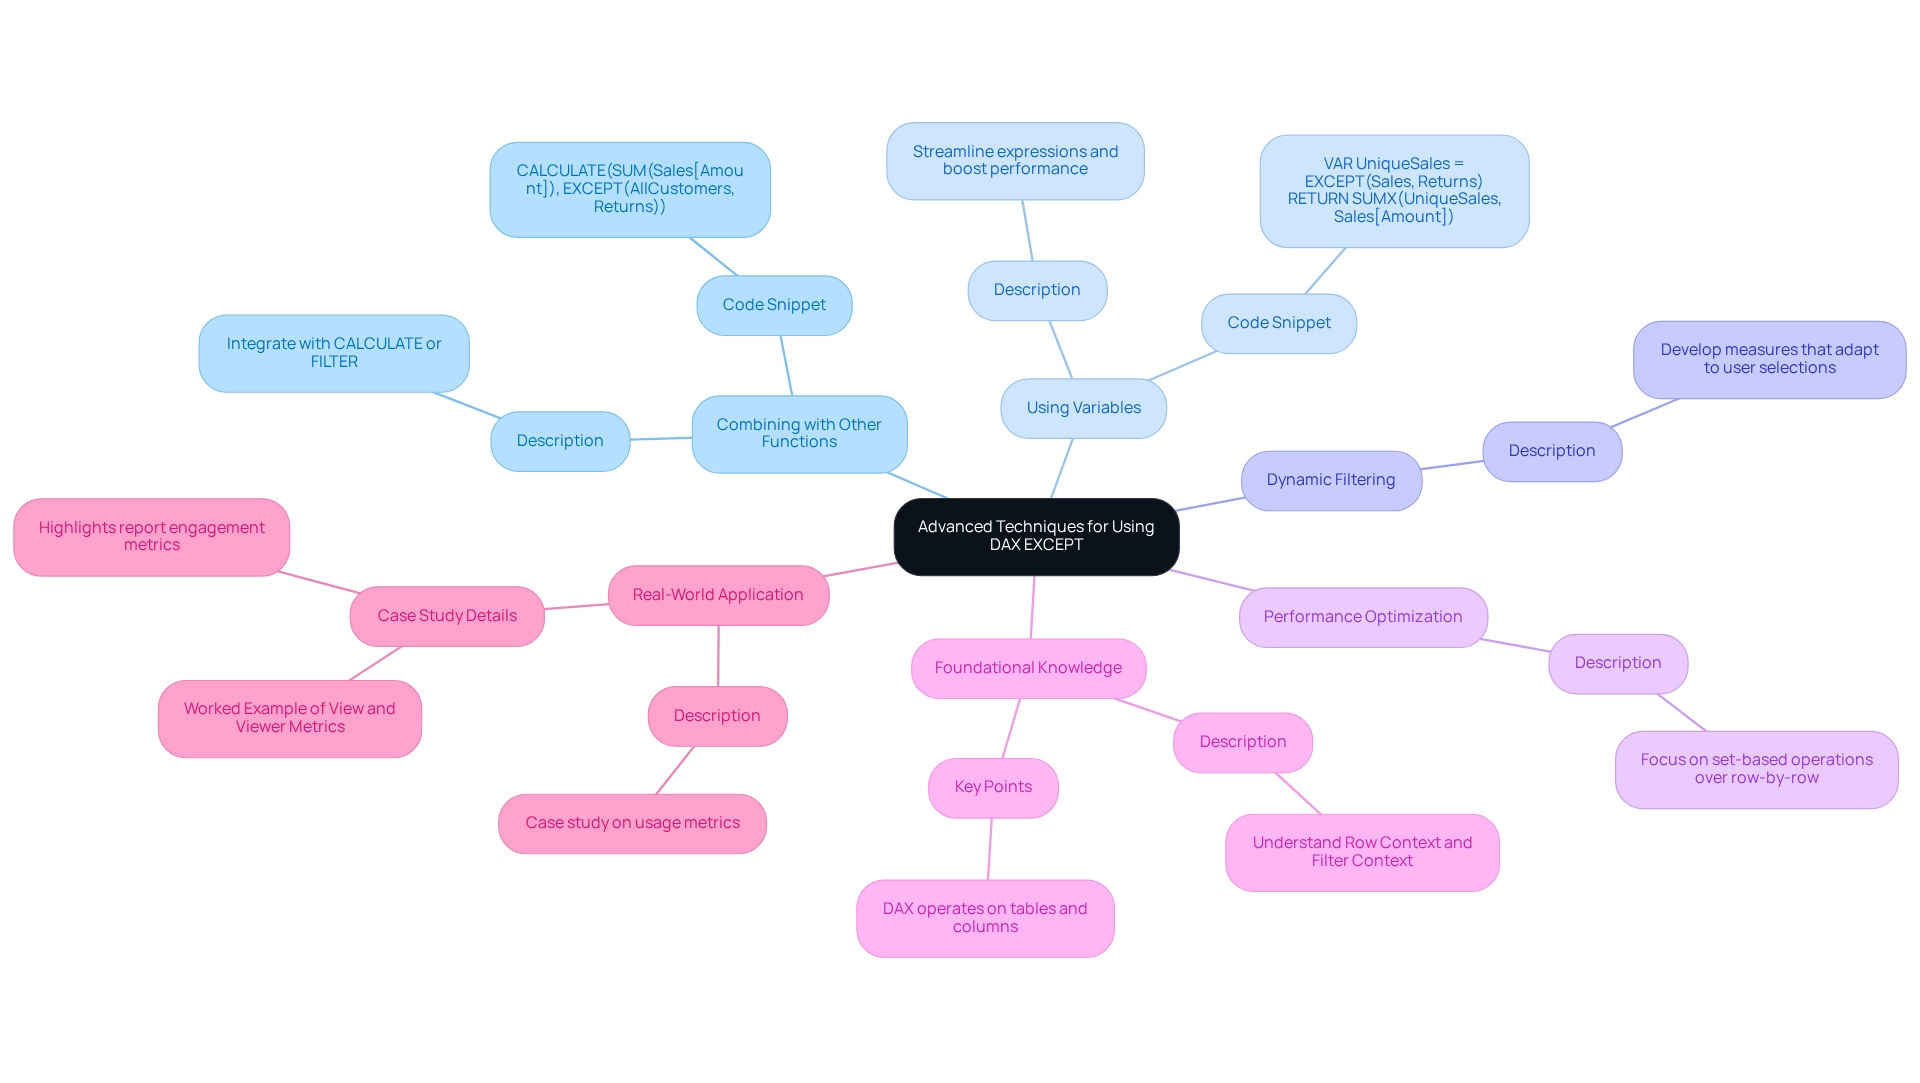
Key Takeaways and Best Practices for DAX EXCEPT
-
Understand the Syntax: Mastering the syntax of DAX EXCEPT is crucial. Ensure that both tables involved have the same number of columns and that their types are compatible to avoid errors. Utilizing Robotic Process Automation (RPA) can assist in automating the preparation of these datasets, ensuring uniformity and precision in your analysis procedures.
-
Test with Sample Data: Always validate your DAX expressions using sample datasets. This practice helps confirm the accuracy of your calculations before applying them to larger datasets. For example, in a case study, the organization identified 2888 customers who bought in both 2012 and 2013, emphasizing the significance of precise information analysis for customer retention strategies. RPA can facilitate this testing phase by automating information extraction and validation, allowing for quicker insights.
-
Avoid Common Mistakes: Be vigilant about common pitfalls, such as mismatched columns and incompatible formats, which can lead to unexpected results and hinder your analysis. Implementing RPA can help reduce these risks by automating checks and ensuring that your sets are correctly formatted before analysis.
-
Leverage Advanced Techniques: Enhance your analyses by combining the EXCEPT function with other DAX functions. Utilizing variables can also simplify complex calculations and improve readability. A practical application of this is demonstrated in the case study named “Identifying Customers Who Purchased in 2012 but Not in 2013,” where the organization altered their analysis method to distinguish between returning and new customers, offering insights into customer retention. RPA can optimize this process by automating the information manipulation needed for such analyses.
-
Optimize for Performance: Prioritize set-based operations to boost performance, particularly when working with large datasets. This approach can significantly reduce processing time and improve overall efficiency. By incorporating RPA into your workflow, you can automate repetitive tasks, enabling your team to concentrate on strategic analysis instead of manual information processing.
Furthermore, consider participating in the forthcoming AI Skills Fest from April 8 to May 28, 2025, which provides 50 days of learning opportunities that could enhance your grasp of DAX capabilities and analysis. By adhering to these best practices and leveraging customized solutions that enhance data quality and simplify AI implementation, you can maximize the effectiveness of DAX EXCEPT, thereby enhancing your data analysis capabilities in Power BI.
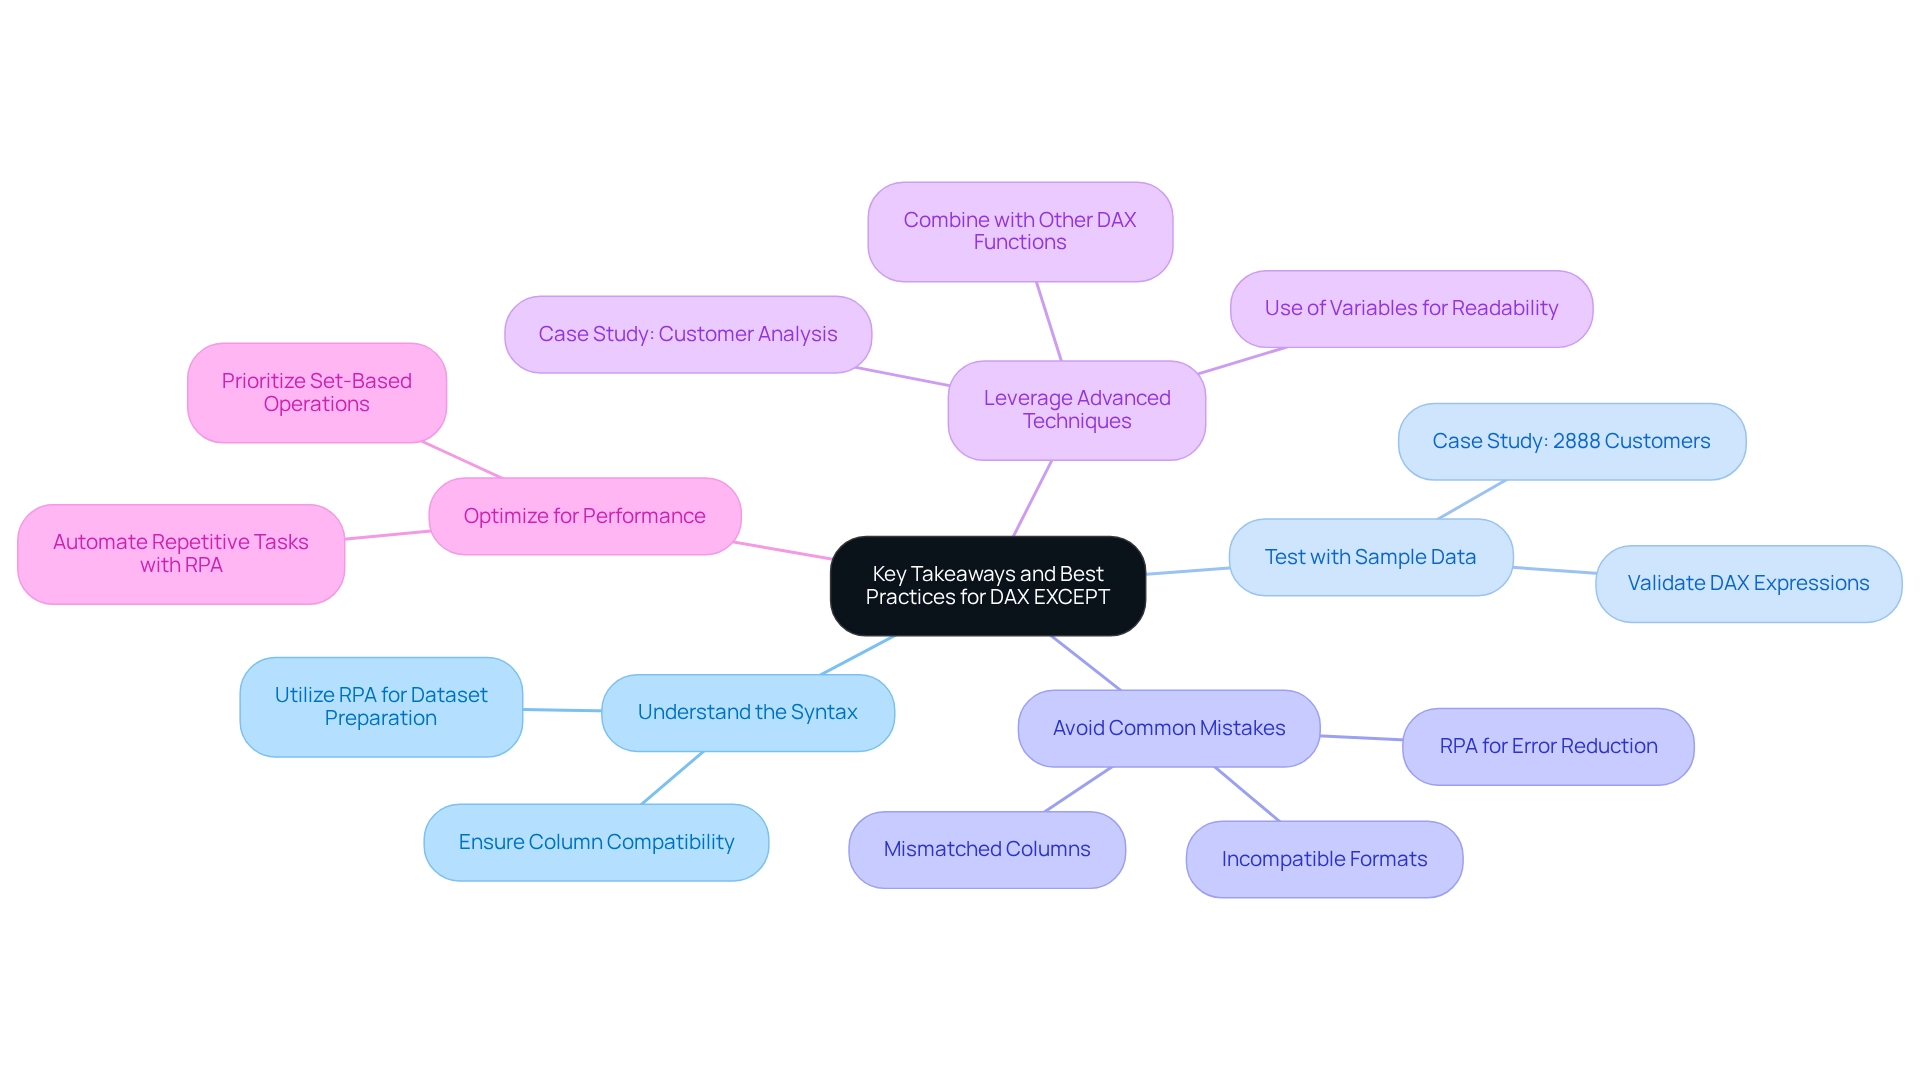
Conclusion
The DAX EXCEPT function stands as a vital asset for data analysts aiming to elevate their analytical capabilities within Power BI. By enabling users to pinpoint unique records from overlapping datasets, DAX EXCEPT reveals essential business insights, such as identifying customers who made purchases without returns and comparing sales data across different periods. The practical applications of this function highlight its role in streamlining reporting processes, ultimately fostering more strategic decision-making.
However, to effectively harness DAX EXCEPT, one must grasp its syntax and structure while being mindful of common pitfalls. Challenges like mismatched column counts and incompatible data types can result in errors that obstruct analysis. By steering clear of these issues and adhering to best practices—such as testing with sample data and integrating advanced techniques—organizations can maximize their utilization of DAX EXCEPT to enhance operational efficiency.
As businesses increasingly depend on data-driven insights, mastering DAX functions like EXCEPT becomes essential. Continuous learning opportunities, exemplified by the upcoming AI Skills Fest, underscore the necessity of staying abreast of these tools in the dynamic realm of data analysis. By leveraging DAX EXCEPT in conjunction with other DAX functions, organizations can convert raw data into actionable insights that drive innovation and support informed decision-making, ultimately propelling business growth.
Frequently Asked Questions
What is the DAX exclusion mechanism in Power BI?
The DAX exclusion mechanism, specifically the DAX EXCEPT function, allows users to compare two tables and retrieve rows from the first table that are absent in the second. This is useful for identifying unique records in data analysis scenarios.
How can the DAX EXCEPT function be applied in a practical scenario?
For example, if you have a list of customers who made purchases and another list of customers who returned items, you can use the DAX EXCEPT function to quickly identify which customers made purchases without returning any items, providing insights into customer behavior.
What are the benefits of using the DAX EXCEPT function?
The DAX EXCEPT function enhances operational efficiency by identifying unique records, streamlining reporting processes, and reducing the time spent on manual reconciliation, allowing teams to focus on more strategic activities.
What is the structure of the DAX EXCEPT function?
The DAX EXCEPT function is structured as follows: EXCEPT(
What are the requirements for using the DAX EXCEPT function?
Both tables used in the DAX EXCEPT function must have an identical number of columns, and the types of these columns must be compatible.
Can you provide an example of using the DAX EXCEPT function?
To identify sales records that do not have corresponding return records, you would use the formula: EXCEPT(Sales, Returns).
How does the DAX EXCEPT function contribute to business intelligence?
By utilizing DAX EXCEPT, organizations can enhance their information analysis capabilities, helping to identify discrepancies between datasets, which is crucial for informed decision-making and driving growth and innovation.
What additional resources are available for mastering DAX functions in Power BI?
There are training modules available for Power BI users that equip them to add calculated tables and columns, which are essential for mastering DAX functions.
What challenges does the DAX EXCEPT function help address in Power BI?
The DAX EXCEPT function helps address challenges such as time-consuming report creation and inconsistencies in information, ultimately leading to improved information quality and precision in reporting.
What event emphasizes the importance of mastering tools like Power BI?
The upcoming AI Skills Fest from April 8 to May 28, 2025, highlights the necessity of continuous learning and mastery of tools like Power BI for professionals in the evolving landscape of data analysis.
Overview
This article serves as a comprehensive guide on connecting SharePoint lists to Power BI. It outlines the prerequisites, provides a step-by-step process, offers troubleshooting tips, and highlights the benefits of this integration. By following the outlined steps and grasping the advantages—such as improved information analysis and enhanced decision-making—organizations can effectively leverage this integration. This not only boosts operational efficiency but also fosters a collaborative environment. Take action now to transform your data handling and decision-making processes.
Introduction
In the modern business landscape, effectively harnessing data can differentiate success from stagnation. Power BI and SharePoint—two robust tools from Microsoft—when integrated, create a dynamic synergy that allows organizations to visualize and share insights seamlessly. This integration not only enhances data accessibility but also fosters collaboration and informed decision-making across teams. Given the increasing demand for real-time data and actionable insights, understanding how to connect SharePoint lists to Power BI is essential for organizations aiming to cultivate a strong data culture.
From troubleshooting connection issues to leveraging advanced features, this article explores the intricacies of maximizing the potential of Power BI and SharePoint integration, ultimately transforming data into a strategic asset.
Understanding Power BI and SharePoint Integration
This tool distinguishes itself as a robust business analytics application, enabling users to visualize information and share insights across their organizations. In contrast, the platform operates as a web-based collaboration tool seamlessly integrated with Microsoft Office. When these two powerful tools merge, the software retrieves information from a SharePoint list to Power BI, facilitating the generation of dynamic reports and dashboards that represent real-time insights.
The integration of the SharePoint list to Power BI significantly enhances information accessibility and fosters improved collaboration and decision-making processes within organizations.
Key Benefits of Integration:
- Enhanced Information Visualization: The tool effectively transforms raw data from a collaborative platform into interactive dashboards, simplifying complex datasets for easier understanding and analysis.
- Real-Time Insights: Users gain access to up-to-date information, which is crucial for timely decision-making, particularly in fast-paced business environments.
- Improved Collaboration: Teams can share reports directly within the platform, promoting a collaborative atmosphere that boosts productivity and engagement.
Creatum GmbH’s services, including the innovative 3-Day Sprint and the General Management App, offer a streamlined approach to report creation, ensuring that organizations can quickly develop professionally designed reports tailored to their specific needs. This service not only accelerates the reporting process but also addresses information inconsistency and governance challenges, ultimately enhancing decision-making capabilities.
Recent statistics reveal that fewer than 20% of executives believe they have established a ‘culture of information’ within their organizations. This underscores the importance of effective information integration tools such as BI, which can assist organizations in cultivating a stronger information culture by making insights more accessible and actionable. Moreover, starting in 2024, the need for accessible analytics solutions becomes even more pressing, enabling non-technical users to extract insights from data.
The combination of Power BI and an alternative platform meets this requirement by streamlining information analysis and reporting.
Real-life examples demonstrate how organizations leveraging this tool alongside an alternative platform have significantly improved their operational efficiency. For instance, companies utilizing this integration have reported enhanced decision-making capabilities and streamlined workflows, ultimately driving growth and innovation. A testimonial from Sascha Rudloff, Team Leader of IT and Process Management at PALFINGER Tail Lifts GMBH, highlights the transformative impact of Creatum’s Business Intelligence Sprint, stating that it not only provided an instantly usable Business Intelligence report but also significantly accelerated their own Business Intelligence development.
As the business intelligence landscape evolves, with Mode Analytics leading with a 27.78% market share, the combination of BI tools and collaboration platforms continues to offer strategic advantages for organizations aiming to leverage the full potential of their data.
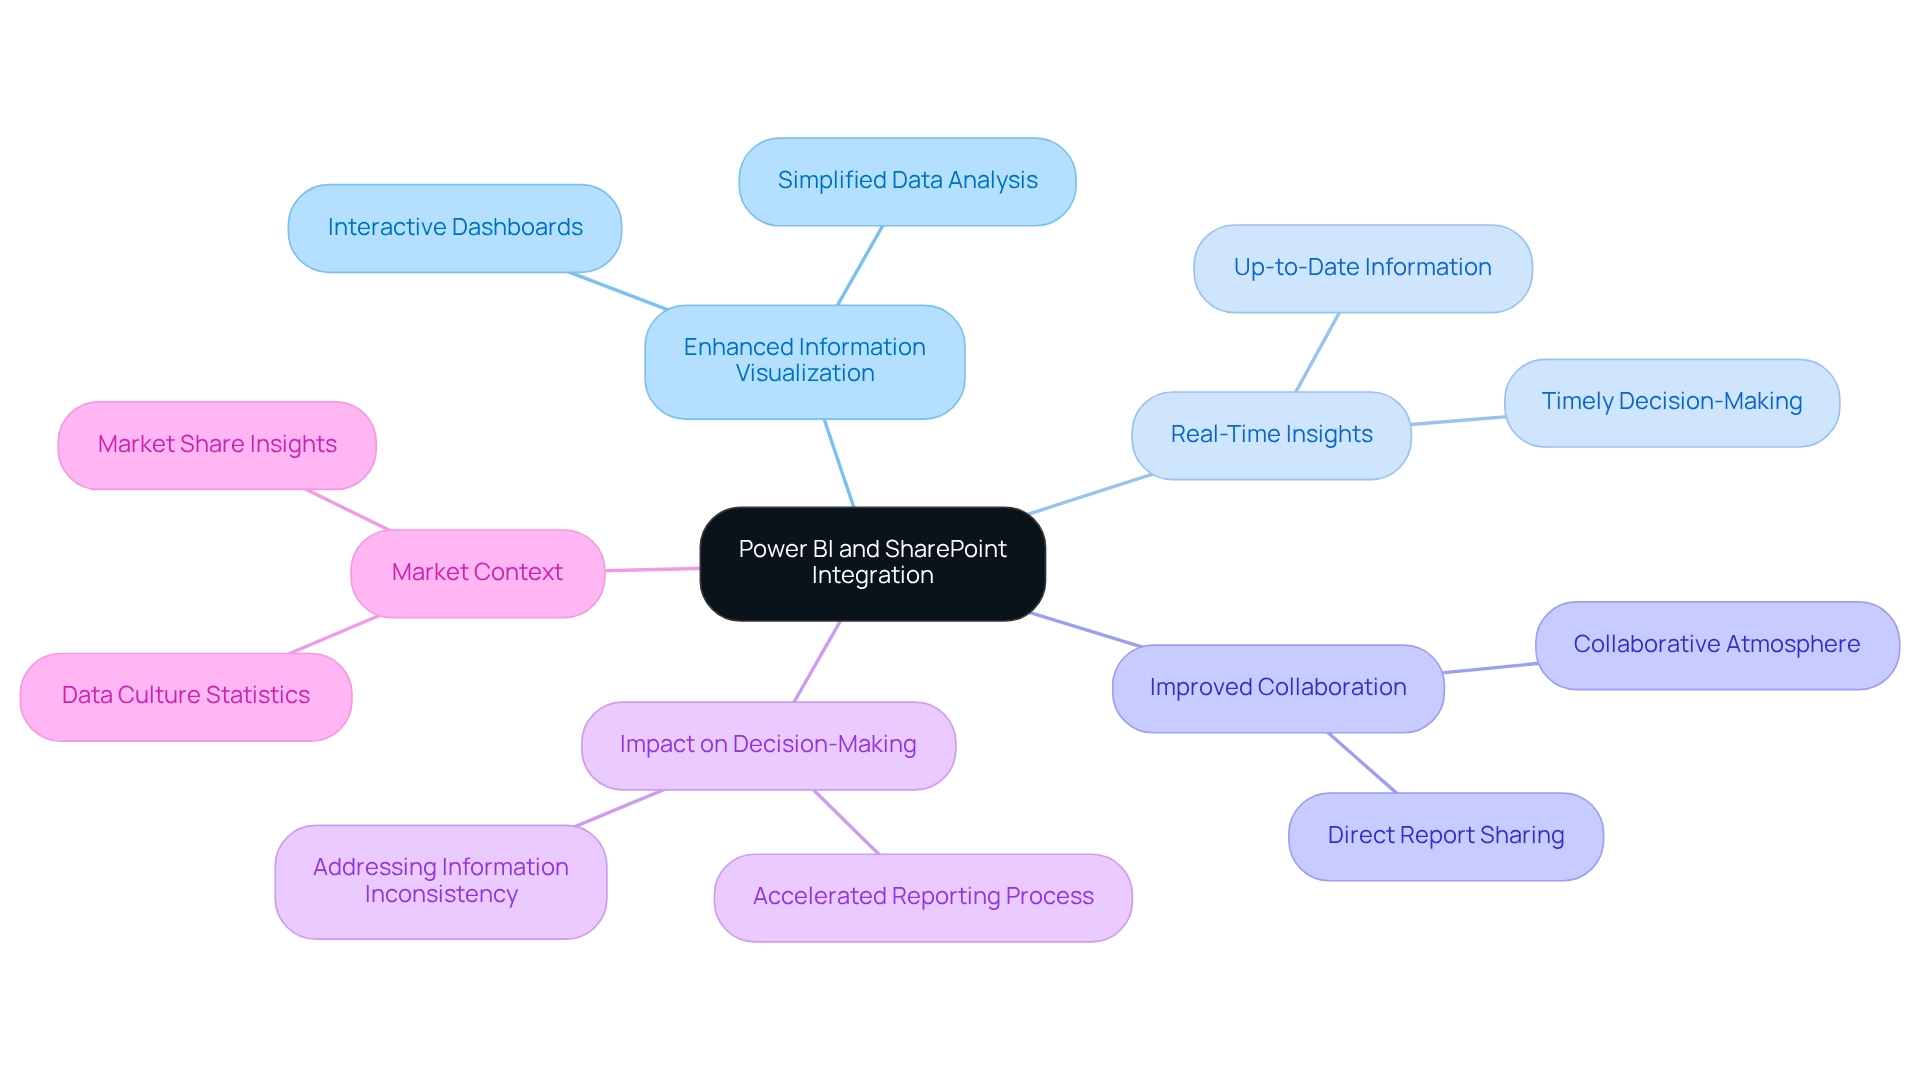
Prerequisites for Connecting SharePoint Lists to Power BI
To effectively link lists from a collaboration platform to Business Intelligence and leverage its full capabilities, it is essential to meet the following prerequisites:
-
Access to Power BI Desktop: Start by downloading and installing Power BI Desktop from the official Microsoft website. This tool is vital for creating and managing your reports, enabling you to extract actionable insights that drive operational efficiency.
-
SharePoint Online Account: Ensure you have a valid SharePoint Online account with the necessary permissions to access the specific lists you intend to connect. User permissions are critical for information accessibility and security. As Annika Baumhecker, a Market Research Analyst, highlights, efficient information management and analytics are crucial for utilizing tools like BI, especially in environments where RPA can automate manual workflows, enhance productivity, and minimize errors, allowing your team to focus on strategic, value-enhancing tasks. To connect your SharePoint list to Power BI, obtain the URL of the site containing your desired list. This URL is essential for creating a successful link that integrates the SharePoint list into Power BI, facilitating smooth information integration.
-
Information Permissions: Verify that you have the appropriate permissions to view and obtain the information within the SharePoint list. Correct permissions are vital to ensure users can effectively utilize analytics tools without facing access issues. Given that the organization is currently achieving a maturity level of 200 in executive sponsorship, enhancing information integration efforts through RPA is crucial for boosting operational efficiency and advancing strategic objectives.
-
Internet Connection: A stable internet connection is necessary to connect to SharePoint Online, ensuring seamless information retrieval and report generation.
By adhering to these prerequisites, organizations can enhance their information integration efforts. Additionally, regular adoption monitoring, as illustrated in the case study on the benefits of adoption tracking, can foster improved resource allocation and strengthen executive support for projects. This ongoing assessment is essential for informed decision-making and achieving operational efficiency, particularly as RPA continues to evolve and offer new opportunities for streamlining processes.
However, organizations must also recognize the challenges in utilizing insights from BI dashboards, such as time-consuming report creation and data inconsistencies, to fully capitalize on the benefits of RPA and Business Intelligence. Creatum GmbH is dedicated to assisting organizations in navigating these complexities.
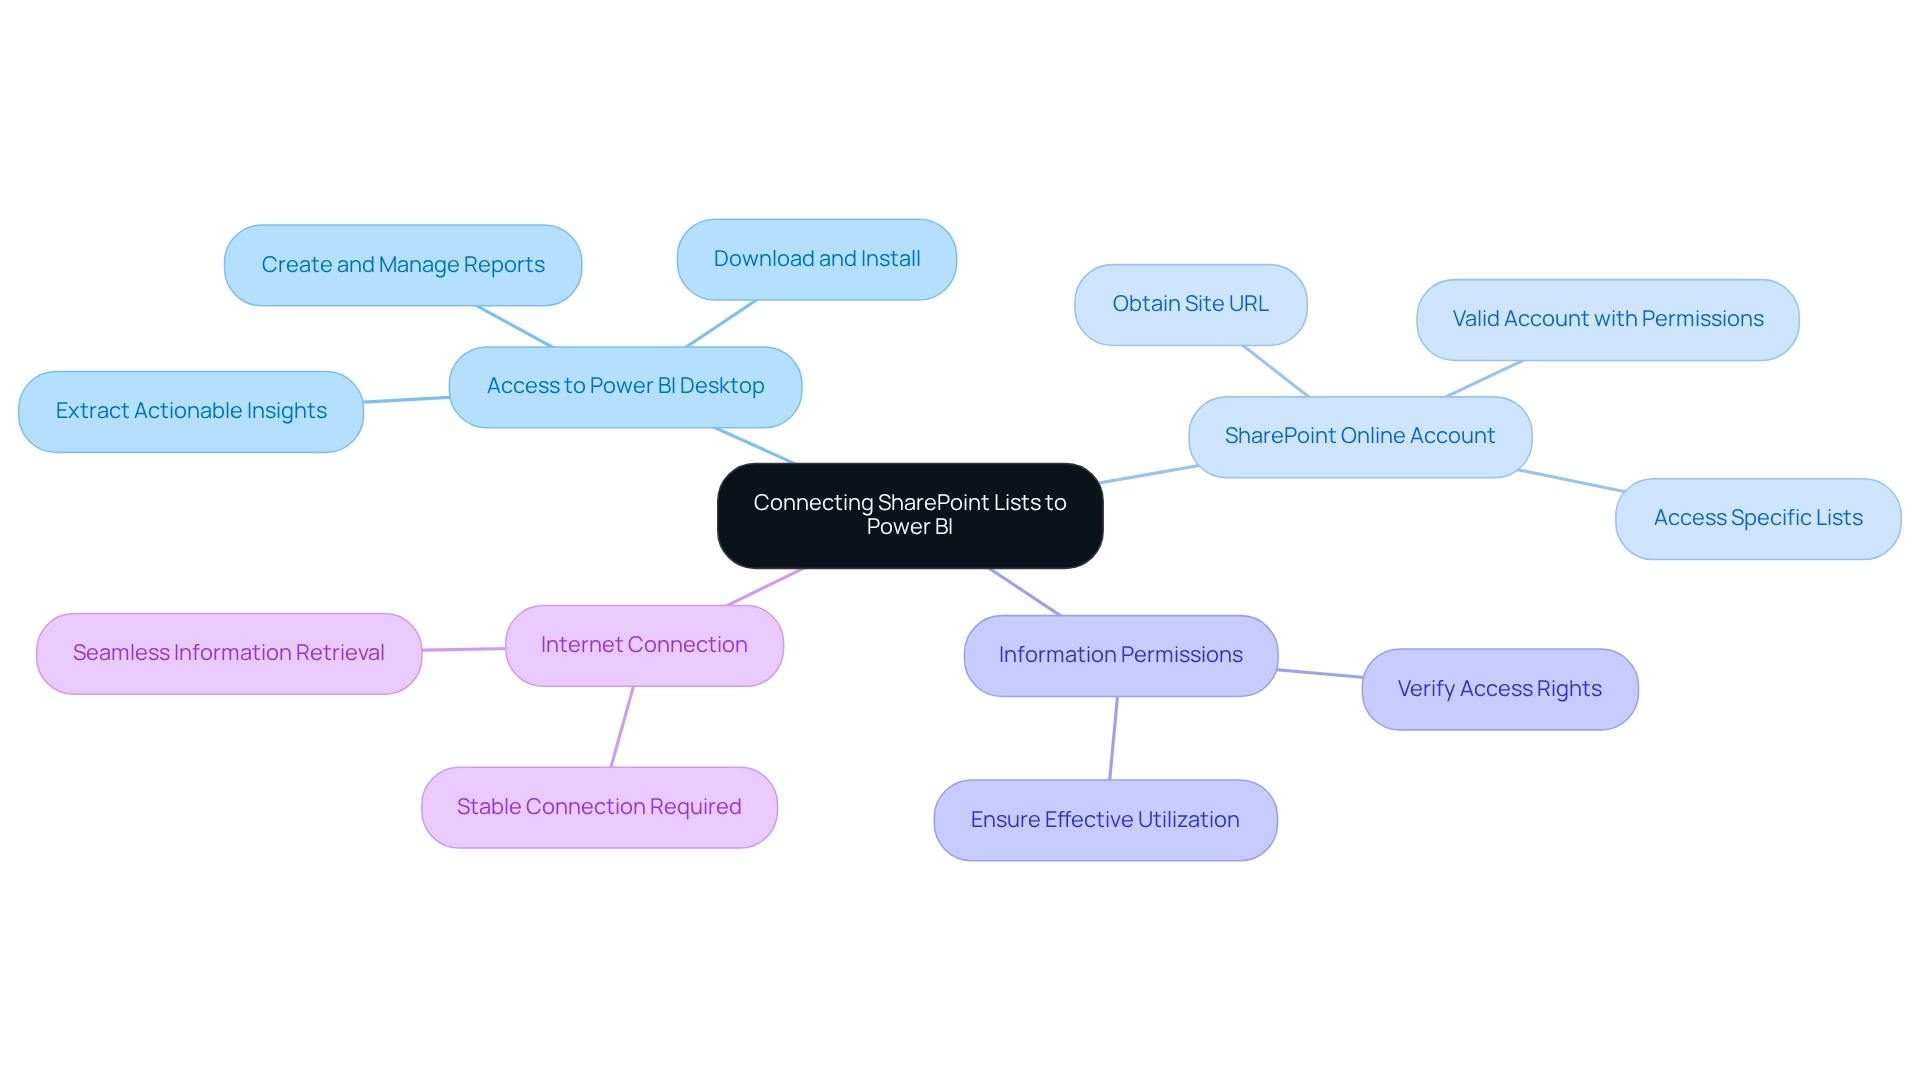
Step-by-Step Process to Connect SharePoint Lists to Power BI
To seamlessly connect your SharePoint list to Power BI and enhance operational efficiency through automation, follow these detailed steps:
- Open Power BI Desktop: Begin by launching the Power BI application on your computer.
- Get Data: Navigate to the ‘Home’ tab and select ‘Get Data’ to initiate the connection process.
- Select Online List: In the ‘Get Data’ window, choose ‘Online Services’ and then opt for ‘Online List’ to specify the data source.
- Enter Site URL: Input the URL of your collaboration site (e.g.,
https://yourcompany.sharepoint.com/sites/yoursite) and click ‘OK’ to proceed. - Authenticate: When prompted, sign in using your credentials to verify your access.
- Select Your List: A navigator window will appear displaying available lists. Select the particular SharePoint list to Power BI that you want to import and click ‘Load’ to bring the information into Power BI.
- Create Reports: With the information successfully loaded, you can now begin crafting reports and visualizations, leveraging the insights from your SharePoint list to Power BI.
This process not only enhances your analytical capabilities but also permits the creation of dynamic visualizations that can significantly improve understanding and insights derived from your information. By incorporating Robotic Process Automation (RPA) into your workflows, you can automate the repetitive tasks related to information management, thereby minimizing mistakes and allowing your team to focus on more strategic initiatives. Organizations that have effectively combined Power BI with other platforms have reported enhanced efficiency in information management and reporting, demonstrating the transformative potential of this integration.
As a best practice, ensure that you regularly review user permissions in the platform to maintain data security and integrity, as highlighted in recent case studies on configuring permissions for secure data use. Additionally, with the most popular content accessible in the platform over the last two weeks, it is crucial to leverage these insights for informed decision-making. As laurenlee, a frequent visitor, mentioned, “Thank you, I already have GA set up but we are unable to track demographic information with GA which is why we need to access proper stats in the platform.”
This highlights the importance of integrating robust data analysis tools to overcome common challenges.
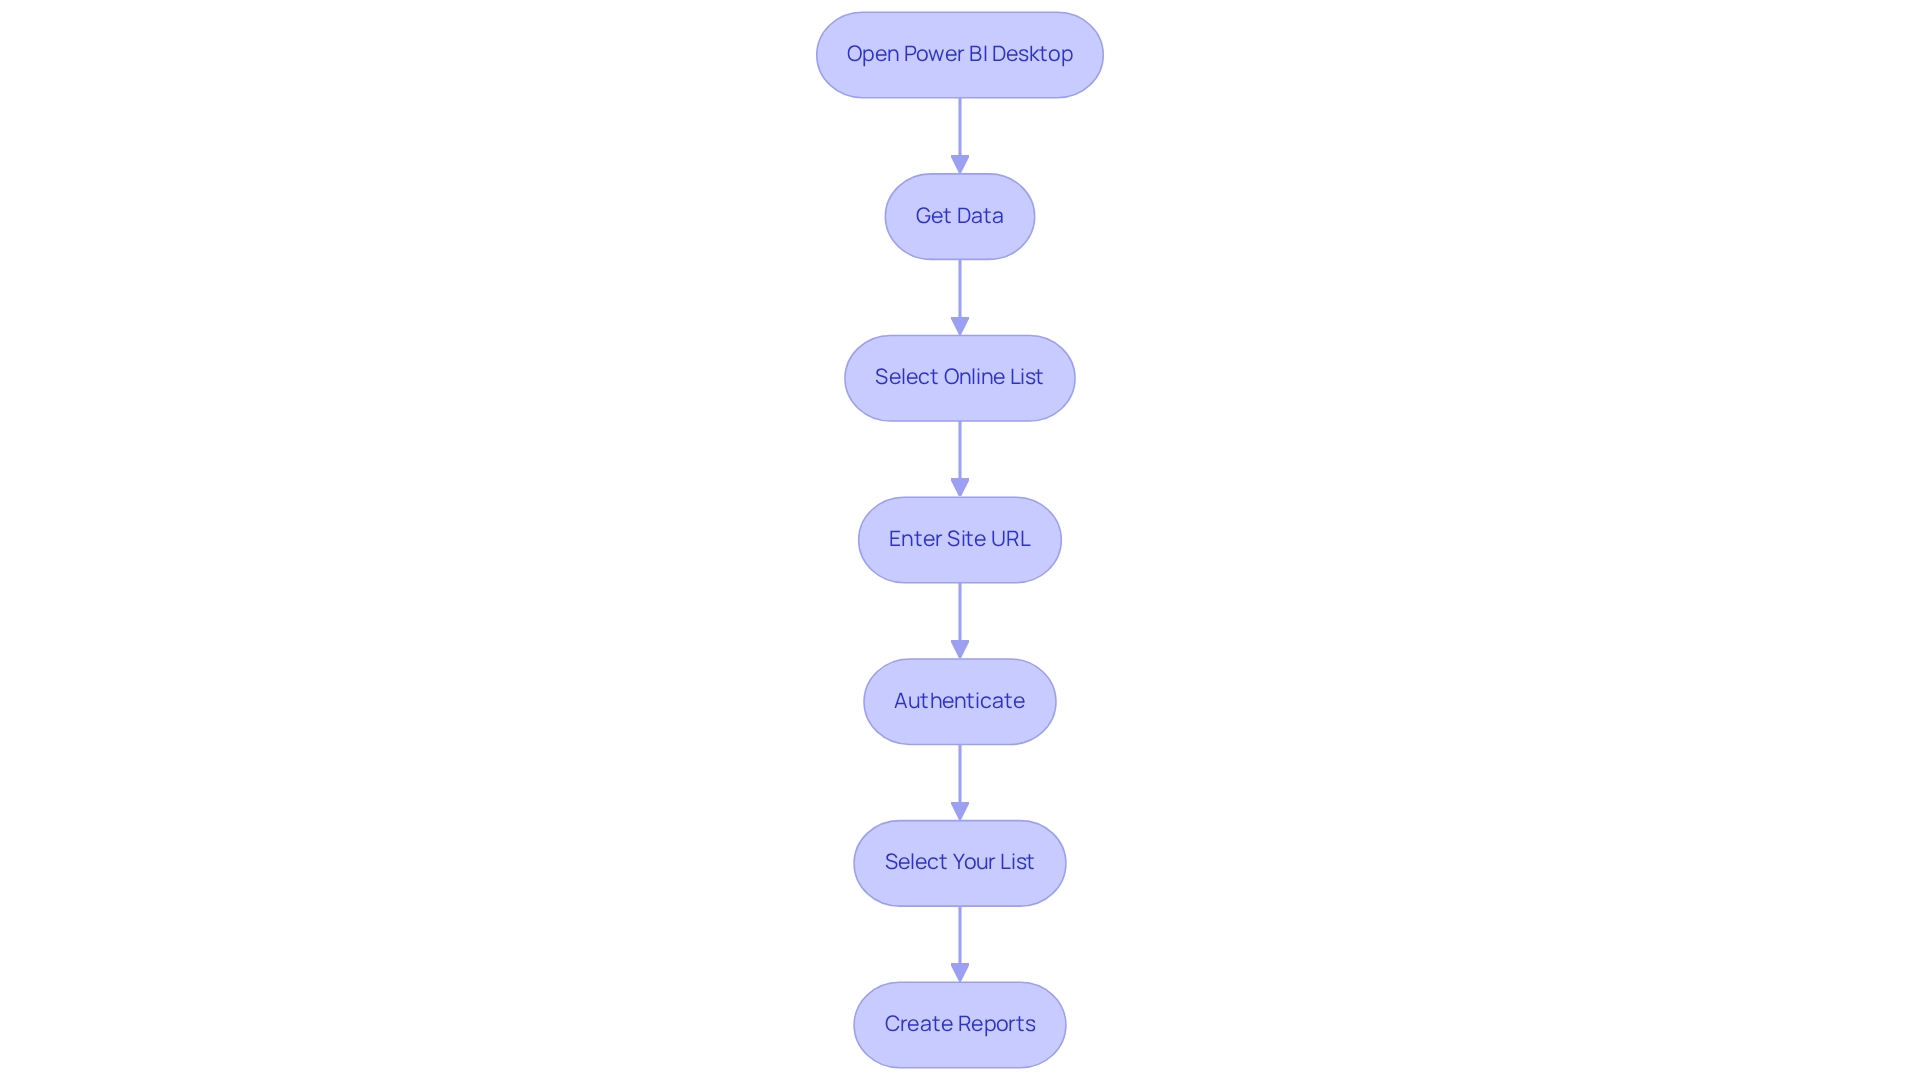
Troubleshooting Common Connection Issues
When linking a SharePoint list to Power BI, several challenges may arise that can hinder your efficiency and decision-making capabilities. Here are effective troubleshooting tips to help you navigate these obstacles:
- Check Permissions: Confirm that you have the necessary permissions to access the list. Inadequate permissions are a frequent barrier to successful connections and can lead to wasted time and resources.
- Verify URL: Ensure the site URL is accurate and free of subfolders. An incorrect URL can prevent Power BI from locating the data source, complicating your data integration efforts.
- Authentication Issues: Authentication errors are common, with many users reporting difficulties. Make sure you are using the correct credentials and that your account has the appropriate access rights to the site.
- Network Connectivity: A stable internet connection is crucial. Weak connectivity may lead to timeouts or unsuccessful connections, disrupting your workflow and impairing your ability to leverage Business Intelligence effectively.
- Clear Cache: Clearing the Power BI cache can often resolve persistent connection issues. Navigate to ‘File’ > ‘Options and settings’ > ‘Options’ > ‘Load’ to clear the cache and refresh your connection.
In a recent case study titled ‘Business Intelligence Empowerment,’ organizations that implemented these troubleshooting strategies reported significant improvements in their ability to connect a SharePoint list to Power BI. This enhancement led to better information quality and more informed decision-making. Notably, the CSV file contains 15 columns, underscoring the importance of understanding information structure when addressing connection issues. By tackling these common challenges, you can streamline your information integration process and fully harness the potential of your business intelligence tools, ultimately boosting your operational efficiency.
Additionally, consider how Robotic Process Automation (RPA) and tailored AI solutions from Creatum GmbH can further enhance your efficiency and decision-making capabilities.
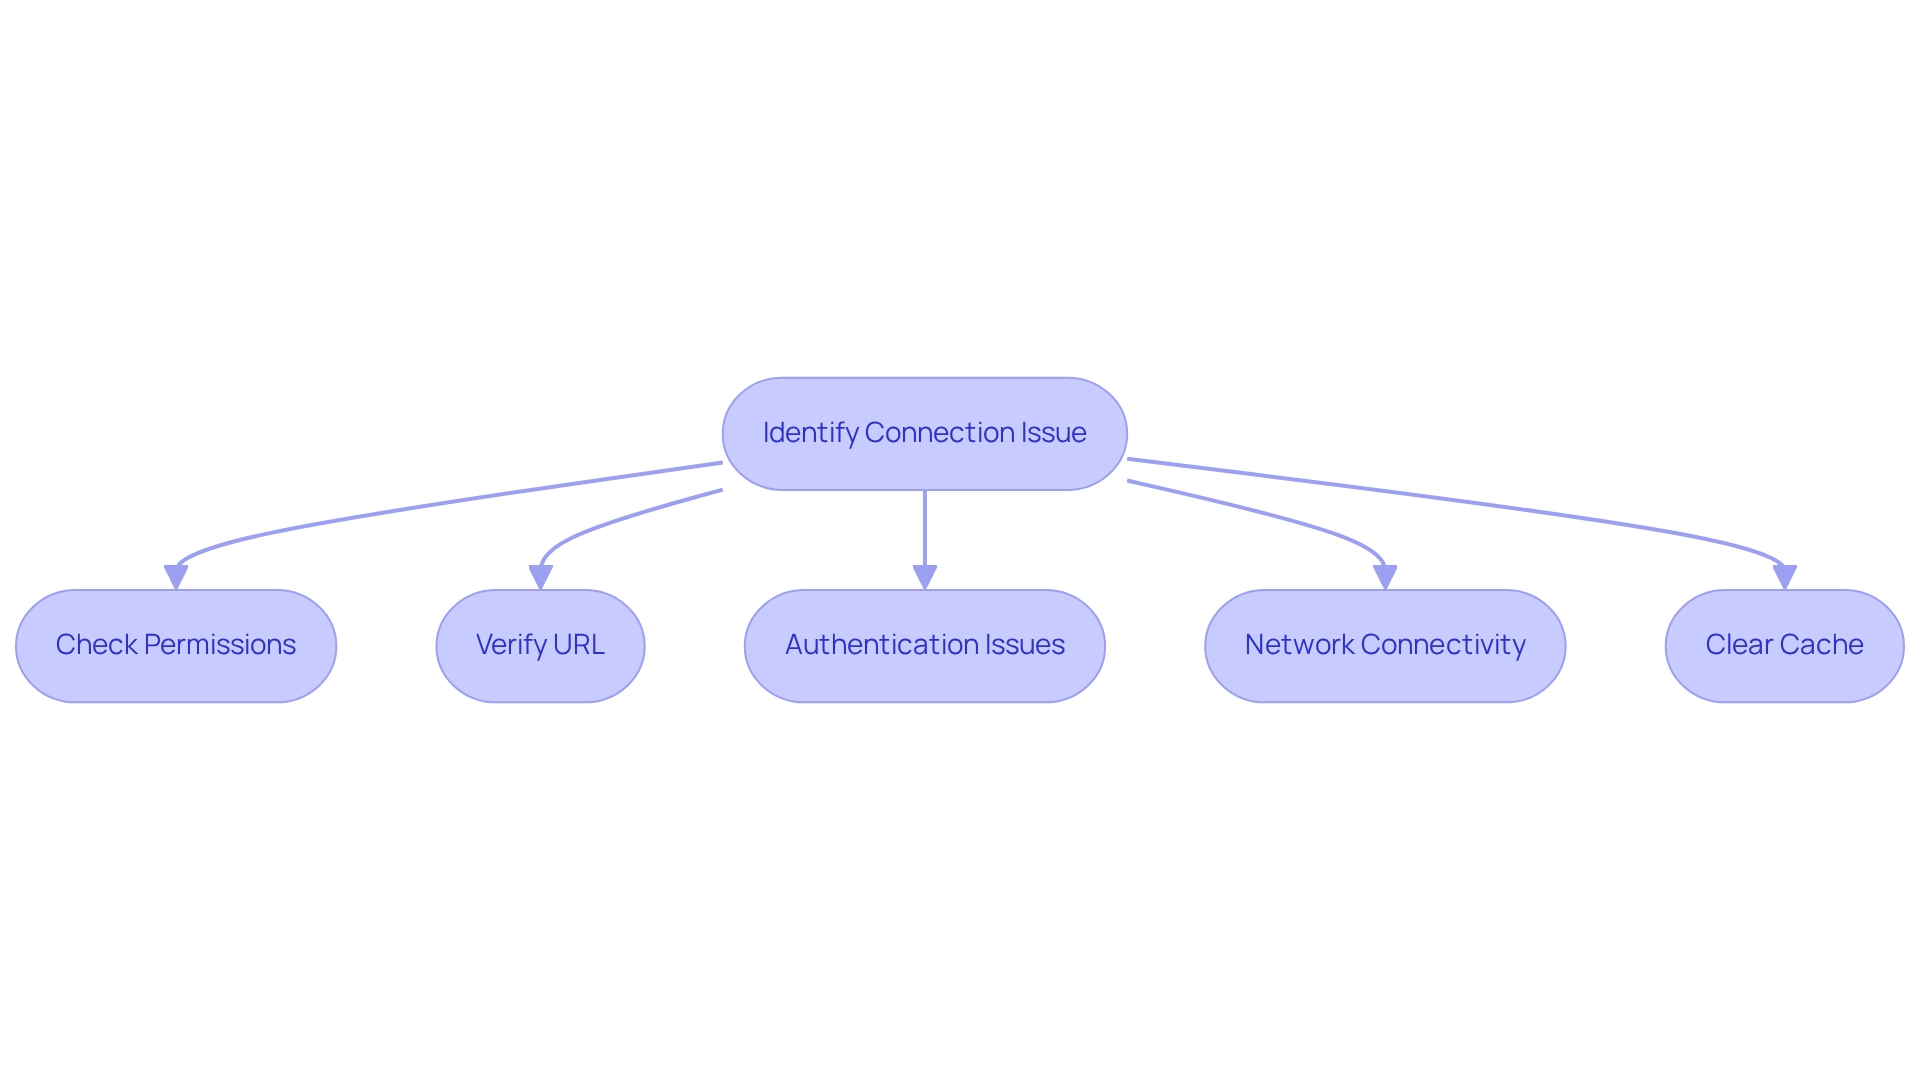
Advanced Features and Customization in Power BI and SharePoint Integration
After successfully linking SharePoint lists to BI, you can leverage several advanced features to enhance your reporting capabilities:
-
Custom Visuals: Elevate your reports by utilizing custom visuals available in BI. Importing visuals from the marketplace allows for captivating presentations tailored to your unique storytelling needs. Organizations that have embraced custom visuals report increased user engagement and improved information comprehension, which is vital for generating actionable insights.
-
Information Transformation: Power Query serves as a powerful tool for modifying your data before it enters Power BI. This includes essential tasks such as filtering, merging, and shaping your data to align with your reporting goals. Effective information transformation can significantly enhance the accuracy and relevance of your insights, with studies indicating that proper data preparation can lead to a 30% increase in reporting success rates. As noted by Yogesh Ajmire, there is a keen interest in acquiring comprehensive dataset information, including the volume of datasets and their most recent updates, underscoring the importance of efficient data management and governance in addressing inconsistencies.
-
Scheduled Update: To ensure your BI reports consistently reflect the latest information from the platform, implement scheduled updates. This feature can be easily configured within the BI service, facilitating real-time data updates that enhance decision-making processes and promote a data-driven culture within your organization.
-
Embedding Reports: Integrating BI reports directly into site pages provides seamless access and collaboration among team members. This integration not only streamlines workflows but also fosters a data-driven culture, enabling users to interact with live reports without leaving the SharePoint environment. However, it is crucial to acknowledge that usage metrics do not capture engagement for embedded dashboards and reports, which can impact how organizations assess their reporting strategies.
-
Training and Certification: For individuals aiming to enhance their expertise, training and certification resources are available for advanced techniques in Business Intelligence. This empowers users to fully leverage the platform’s capabilities, ultimately driving operational efficiency and growth.
-
3-Day BI Sprint: Creatum GmbH offers a 3-Day BI Sprint, enabling organizations to swiftly create professionally designed reports tailored to their specific needs.
-
General Management Application: The General Management Application delivers comprehensive management and smart reviews, further enhancing the reporting capabilities of BI.
By exploring these advanced features, including the 3-Day BI Sprint and General Management Application, and considering the limitations of usage metrics, you can significantly enhance the functionality of your BI reports, ensuring they deliver actionable insights that drive operational efficiency.
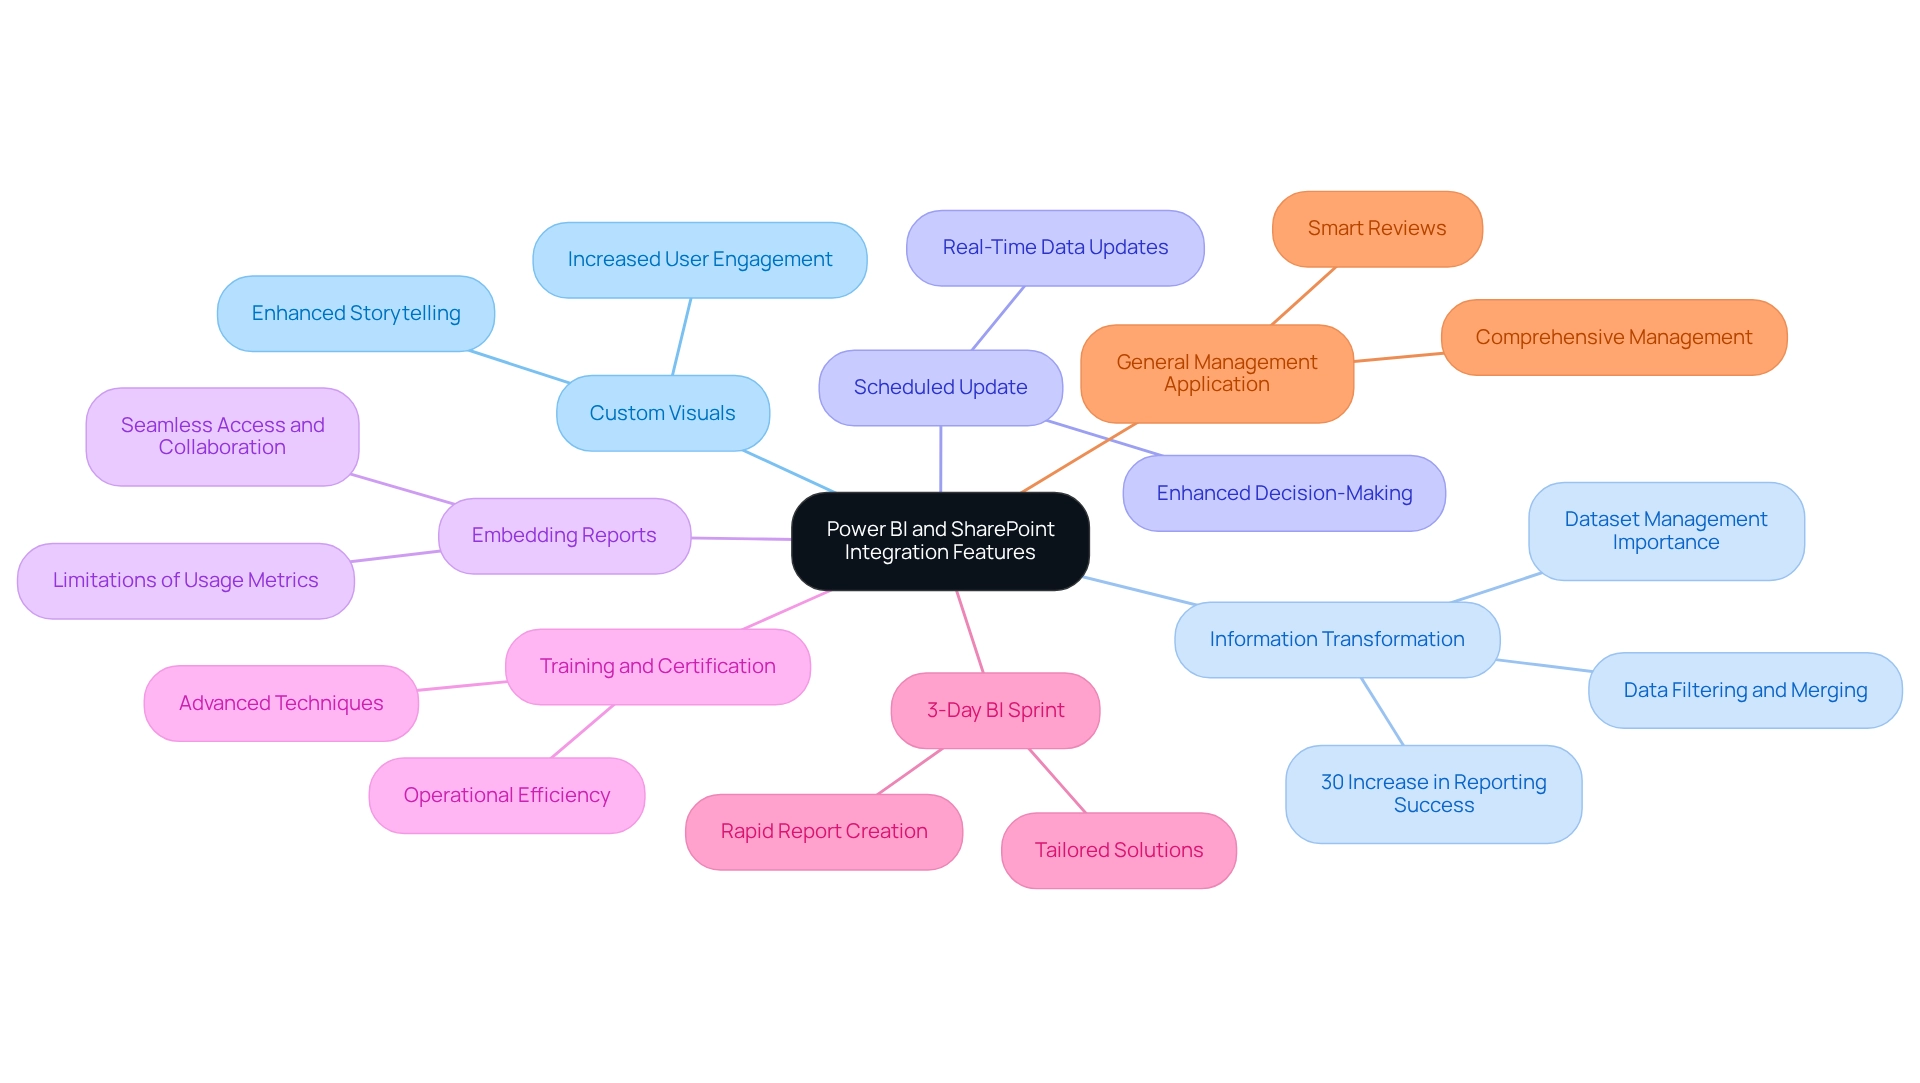
Best Practices for Data Security and Integrity
To ensure data security and integrity when integrating Power BI with SharePoint, organizations must adhere to the following best practices. These practices not only enhance security but also support operational efficiency and informed decision-making:
- Utilize Organizational Accounts: Always connect using organizational accounts to guarantee secure access to SharePoint data. This method reduces the threat of unapproved entry and conforms to industry guidelines for information protection, thus improving overall efficiency.
- Implement Role-Based Access Control (RBAC): Establish clear user roles and permissions within SharePoint to regulate who can view or modify information. Organizations using RBAC experience a considerable decrease in breaches, as it restricts entry to sensitive information based on user roles, promoting a secure setting for insight generation.
- Enable Multi-Factor Authentication (MFA): Strengthen security by requiring MFA for users accessing sensitive information. This extra layer of protection is essential in reducing risks linked to compromised credentials, particularly in settings where remote connectivity is common, guaranteeing that your information stays secure while enhancing operational efficiency.
- Regularly Review Permissions: Conduct periodic assessments and updates of user permissions to ensure that only authorized personnel can reach specific information. This practice not only improves security but also assists in upholding compliance with governance policies, which is crucial for utilizing insights from Power BI dashboards effectively.
- Monitor Information Retrieval: Utilize the auditing capabilities of the platform to monitor who retrieves information and when. This capability is crucial for detecting unauthorized access attempts and ensuring accountability among users, vital for upholding the integrity of your information.
- Stay Informed on Security Trends: Keep abreast of the latest security trends and recommendations from cybersecurity experts. For instance, Amichai Shulman emphasizes the significance of comprehending supply chain attacks in low-code/no-code development settings, pertinent to the integration of BI and SharePoint. Furthermore, specialists highlight the importance of proactive security measures, such as governance and loss prevention strategies, especially in light of rising cyber threats.
- Utilize BI’s Versatility: Remember that the BI application supports iOS, Android, and Windows devices, improving accessibility while ensuring security. This flexibility enables users to retrieve information securely from multiple platforms, facilitating prompt decision-making.
- Understand User Authentication: Familiarize yourself with the user authentication process in BI, which follows a sequence of requests and responses using Microsoft Entra auth code grant flow. This understanding is essential for guaranteeing secure entry to information and addressing challenges associated with inconsistencies in information.
- Employ Secure Mobile Access: The BI mobile application supports secure information storage and user verification, employing industry-standard security measures. This underscores the significance of security measures in the realm of mobile usage, ensuring that your team can operate effectively and safely.
By adopting these best practices, organizations can significantly improve the security of their integration from SharePoint list to Power BI. This protects sensitive information while allowing efficient entry for authorized users. The case study titled “Proactive Security Measures” demonstrates how organizations faced unparalleled access to systems by cybercriminals and suggested a mix of governance, multi-factor authentication, and loss prevention strategies to enhance security without compromising efficiency. Moreover, incorporating Robotic Process Automation (RPA) can further optimize processes and enhance operational efficiency, while customized AI solutions can help in addressing challenges connected to information extraction and report generation, ensuring that your organization remains competitive in an analytics-driven environment.
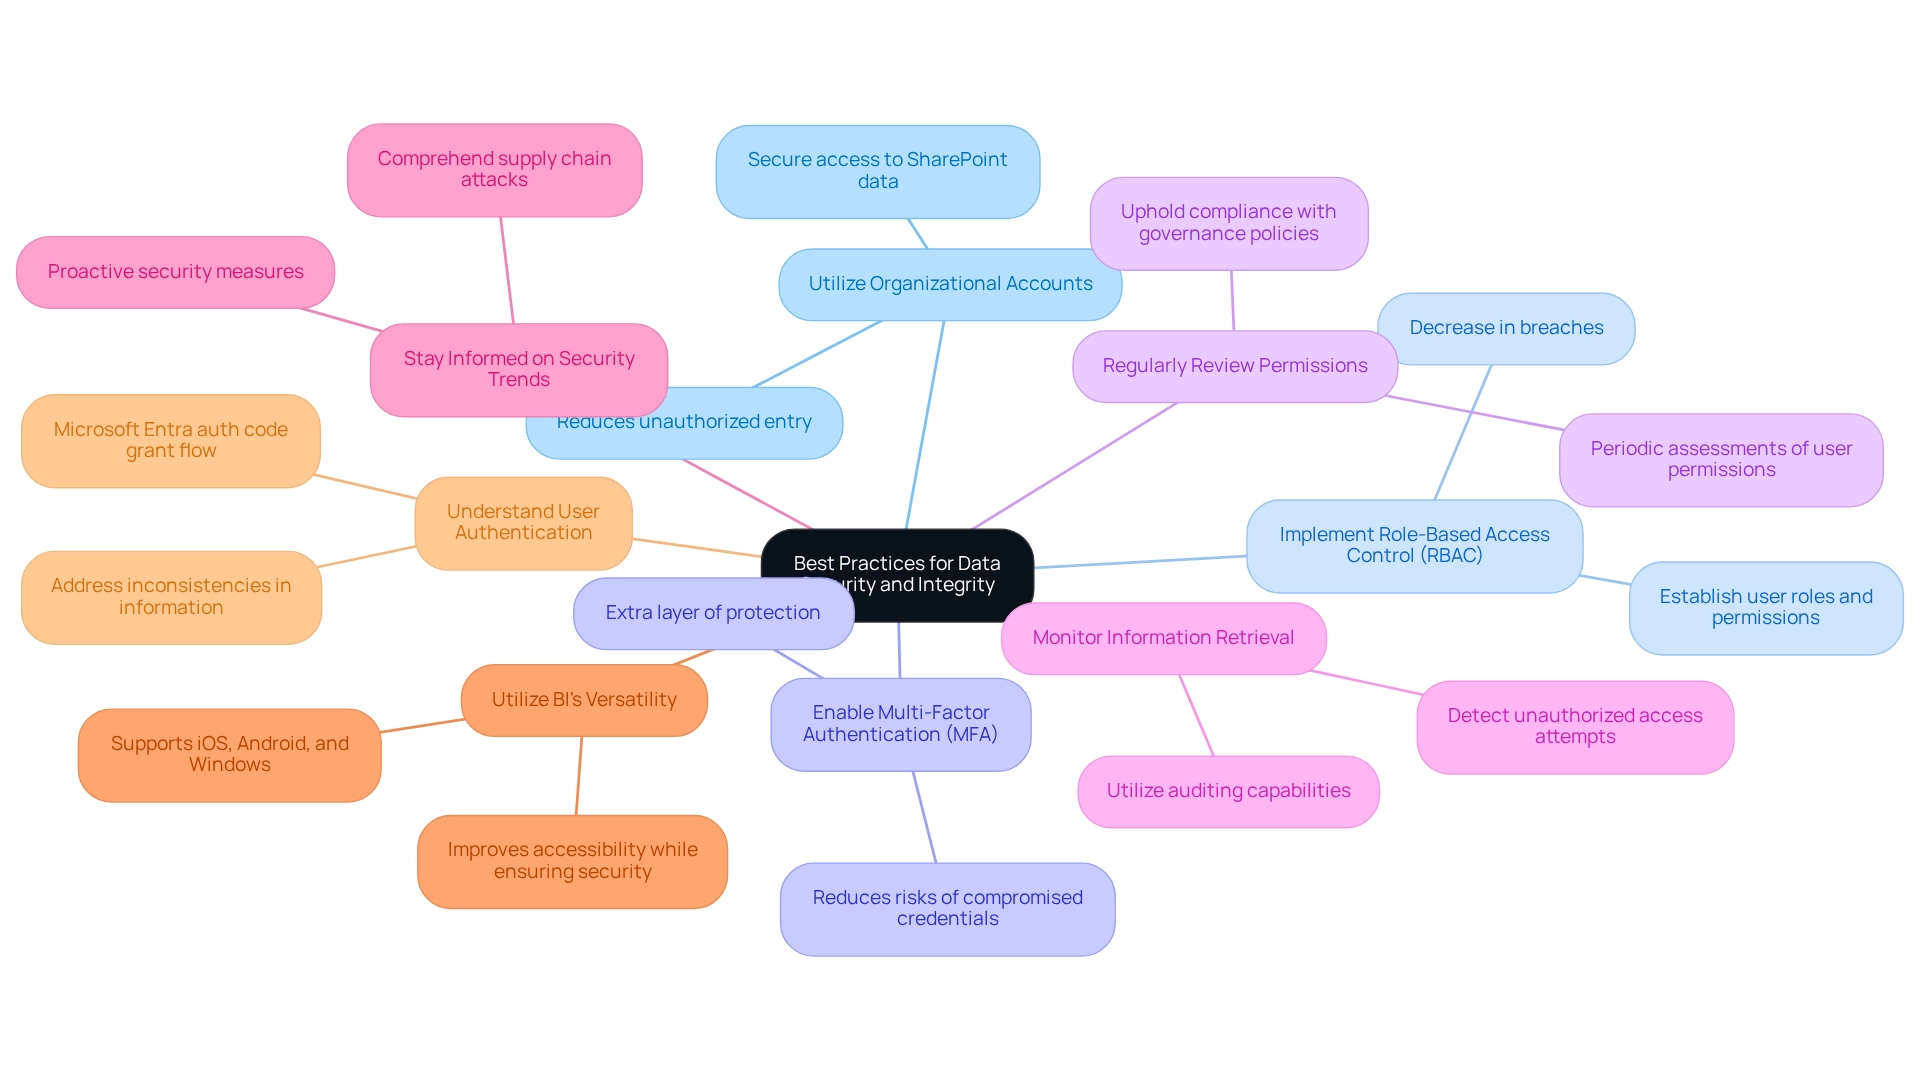
Benefits of Connecting SharePoint Lists to Power BI
Integrating SharePoint lists with Business Intelligence (BI) provides significant advantages that can enhance organizational efficiency and improve decision-making processes.
Improved Information Analysis: Users can generate comprehensive reports that delve deeper into their data, transforming raw information into actionable insights. This capability is essential in today’s data-centric environment, where informed decisions are critical. As highlighted by Sascha Rudloff from PALFINGER, the Power BI Sprint from Creatum not only delivered instant reporting capabilities but also accelerated their overall Power BI development, showcasing the transformative impact of such integrations.
Enhanced Decision-Making: Access to real-time information empowers organizations to make swift and informed choices. Statistics reveal that 56% of enterprises find real-time analytics beneficial for refining their decision-making processes, underscoring the importance of this integration. Furthermore, organizations with robust feedback mechanisms experience a 20% increase in user proficiency over time, emphasizing the necessity of continuous improvement in decision-making.
Streamlined Workflows: Automating information retrieval and reporting enables organizations to minimize manual effort, thereby enhancing productivity. This automation not only conserves time but also reduces the likelihood of human error, which is vital for maintaining information integrity. Harnessing Robotic Process Automation (RPA) from Creatum can further boost operational efficiency by mitigating errors and allowing teams to concentrate on strategic initiatives rather than repetitive tasks.
Collaboration: The integration cultivates a collaborative atmosphere where teams can effortlessly share insights and reports. This partnership enhances overall effectiveness and ensures that all stakeholders are aligned with the latest information derived from data.
Scalability: As organizations expand, the integration of Power BI supports the seamless growth of analytical capabilities. This adaptability ensures that existing workflows remain intact while accommodating increasing data demands.
A case study illustrating the establishment of permissions for secure information retrieval underscores the importance of implementing robust access controls within the platform. By adhering to the principle of least privilege and conducting regular audits of user permissions, organizations can significantly mitigate the risk of data breaches. This proactive strategy not only fortifies data protection but also leads to considerable cost savings, reinforcing the essential nature of secure data access in the context of integrating SharePoint lists with Power BI.
In conclusion, the integration of SharePoint lists with Power BI not only enhances data analysis and decision-making but also fosters collaboration and scalability, positioning it as a crucial strategy for organizations striving to excel in today’s data-driven landscape.
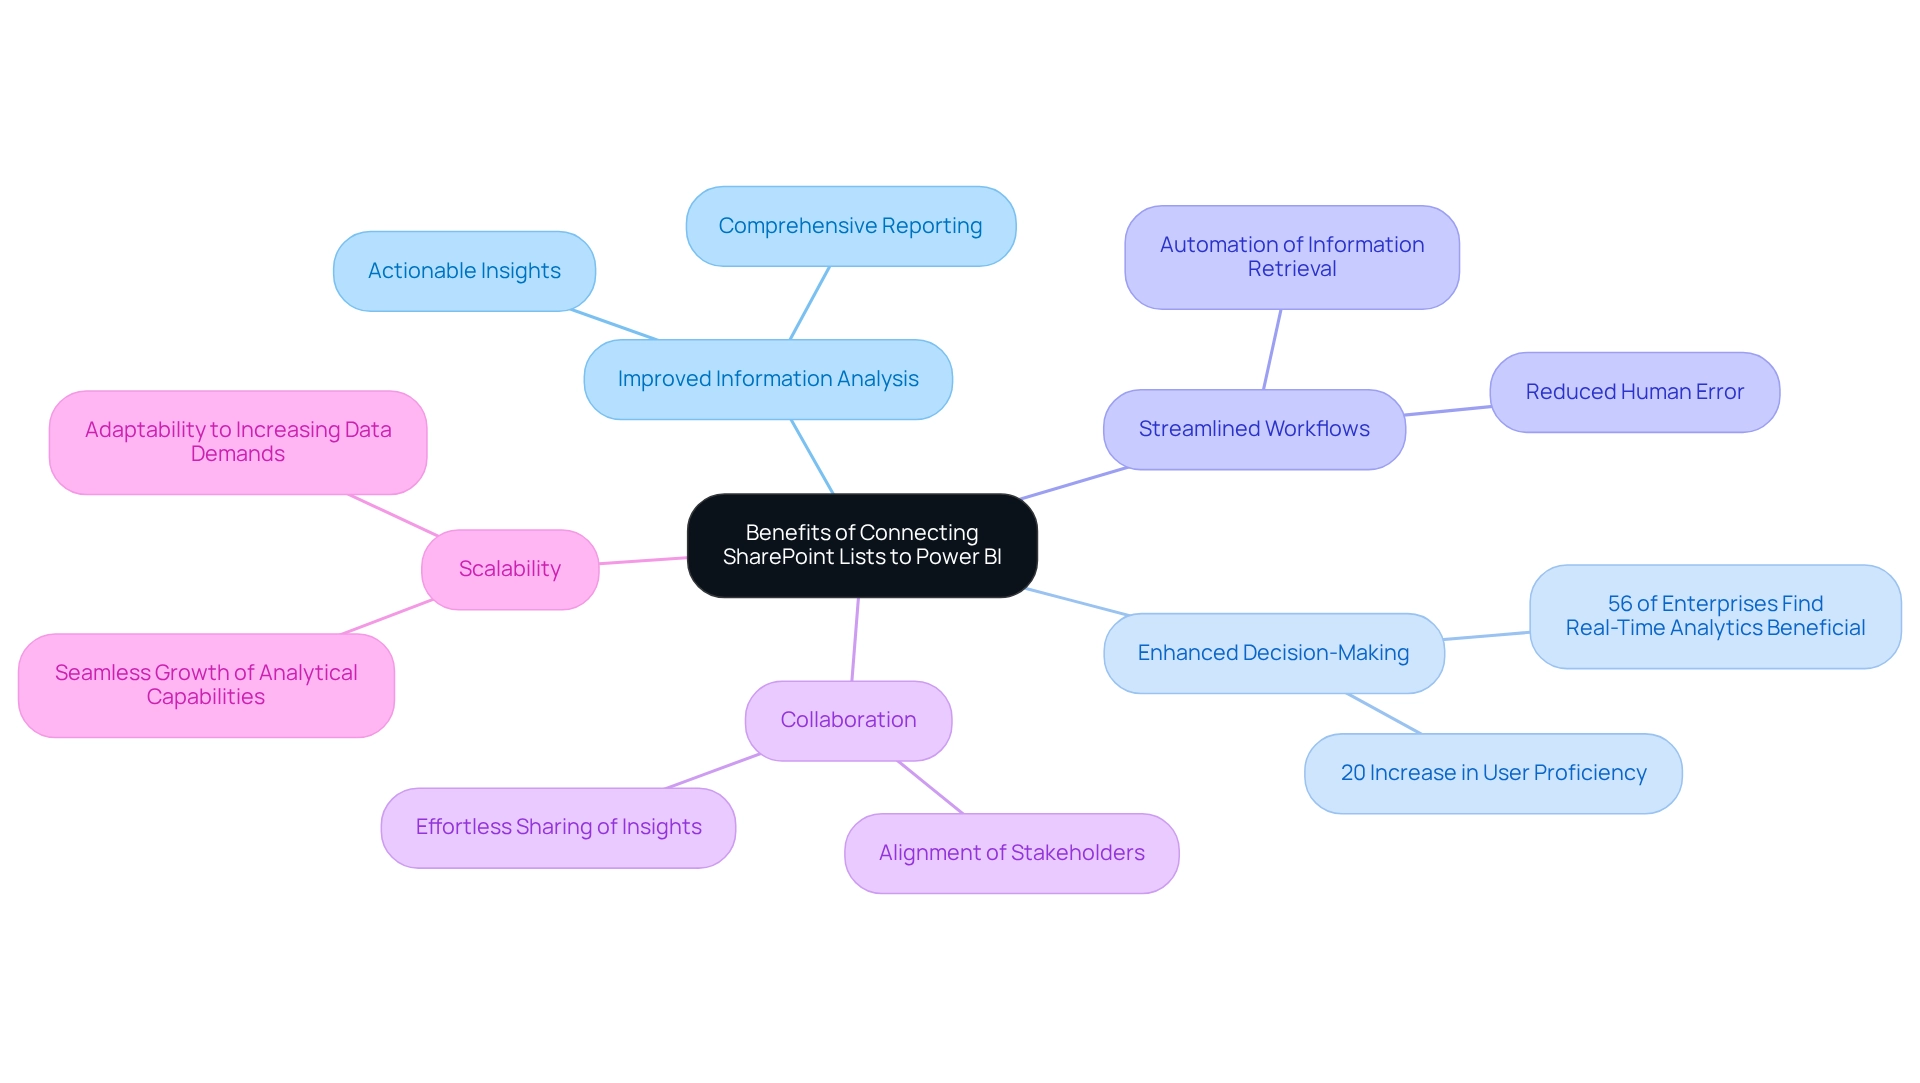
Conclusion
Harnessing the integration of Power BI and SharePoint unlocks a wealth of advantages that can transform organizational operations. By connecting SharePoint lists to Power BI, businesses enhance data visualization and accessibility, leading to improved decision-making and streamlined workflows. The seamless flow of real-time insights empowers teams to act swiftly in fast-paced environments, fostering a culture where data-driven decisions are the norm rather than the exception.
Moreover, this integration facilitates collaboration among teams, allowing for easy sharing of reports and insights directly within the SharePoint platform. This collaborative approach boosts productivity and ensures that all stakeholders remain aligned with the latest developments. As organizations grow, the scalability of this integration guarantees that data analysis capabilities can expand without disrupting existing workflows, thereby supporting ongoing operational efficiency.
In a landscape where the demand for actionable insights continues to rise, the effective use of tools like Power BI and SharePoint becomes vital. By adhering to best practices for data security and integrity, organizations protect sensitive information while reaping the benefits of enhanced data analysis and reporting capabilities. Ultimately, the strategic integration of these two powerful tools is not just about improving data access; it cultivates a robust data culture that drives innovation and growth in today’s competitive business environment.
Frequently Asked Questions
What is the primary function of the tool mentioned in the article?
The tool is a robust business analytics application that enables users to visualize information and share insights across their organizations.
How does the tool integrate with Microsoft Office?
The platform operates as a web-based collaboration tool that is seamlessly integrated with Microsoft Office, allowing for enhanced functionality.
What is the significance of integrating SharePoint lists with Power BI?
The integration significantly enhances information accessibility and fosters improved collaboration and decision-making processes within organizations.
What are the key benefits of the integration between SharePoint and Power BI?
Key benefits include enhanced information visualization, real-time insights for timely decision-making, and improved collaboration through report sharing.
What services does Creatum GmbH offer to support report creation?
Creatum GmbH offers services such as the innovative 3-Day Sprint and the General Management App, which streamline the report creation process and address information inconsistency and governance challenges.
What statistic highlights the need for effective information integration tools?
Recent statistics reveal that fewer than 20% of executives believe they have established a ‘culture of information’ within their organizations.
Why is accessible analytics important starting in 2024?
The need for accessible analytics solutions becomes pressing to enable non-technical users to extract insights from data.
What are the prerequisites for linking SharePoint lists to Power BI?
Prerequisites include access to Power BI Desktop, a valid SharePoint Online account with necessary permissions, appropriate information permissions, and a stable internet connection.
How can organizations enhance their information integration efforts?
Organizations can enhance their efforts by adhering to the prerequisites and regularly monitoring adoption to improve resource allocation and strengthen executive support for projects.
What challenges might organizations face when utilizing insights from BI dashboards?
Organizations may encounter challenges such as time-consuming report creation and data inconsistencies, which can hinder the full capitalization of the benefits of RPA and Business Intelligence.
Overview
This article delves into the effective utilization of the DAX GROUPBY function, a critical tool for data analysts aiming to summarize and analyze datasets in Power BI and Excel. By examining the function’s syntax and practical applications, it lays a foundation for understanding its pros and cons.
The discussion emphasizes best practices, highlighting the necessity of grasping grouping techniques to enhance data insights and operational efficiency. Moreover, it addresses how this understanding can be significantly augmented when paired with Robotic Process Automation (RPA), streamlining data handling processes for better outcomes.
Introduction
In the realm of data analysis, the DAX GROUPBY function stands out as a pivotal tool that empowers analysts to distill vast datasets into meaningful summaries. By grouping data according to specified columns, this function facilitates not only the aggregation of information but also enhances the clarity of insights drawn from complex data structures.
As organizations increasingly adopt data-driven strategies, mastering GROUPBY becomes essential for those aiming to optimize workflows and make informed decisions. In a landscape where efficiency is paramount, understanding the intricacies of this function—alongside its practical applications and potential pitfalls—can significantly elevate the analytical capabilities of professionals in fields such as business intelligence and operational management.
Understanding the DAX GROUPBY Function
The DAX GROUPBY feature stands as a cornerstone in analysis within Power BI and Excel, empowering users to summarize tables by categorizing them based on specified columns. This feature is vital for consolidating insights and performing computations on grouped datasets, making it an essential tool for analysts aiming to enhance their information manipulation processes, especially in an environment increasingly influenced by Robotic Process Automation (RPA).
Consider a sales table where the goal is to analyze sales information by product category. By employing the aggregation function, a new table can be created that succinctly summarizes sales figures for each category, thereby facilitating clearer insights into performance metrics. This capability is crucial in a rapidly evolving AI landscape, where the ability to extract actionable insights from data significantly boosts operational efficiency.
Statistics reveal that mastering Excel basics can be accomplished in just 18 minutes, underscoring the accessibility of tools like DAX for improving operational efficiency. Additionally, alternatives to DAX GROUPBY, such as SUMMARIZECOLUMNS(), offer faster summary table creation, while DAX GROUPBY excels in straightforward grouping operations. It is imperative for analysts to weigh these alternatives to choose the most suitable option for their specific needs, particularly when faced with challenges like time-consuming report generation and data inconsistencies.
As Laiba Siddiqui, a content strategist, notes, “I’m a content strategist who enjoys clarifying intricate subjects,” which resonates with the goal of making data analysis more approachable through effective DAX expression usage. Practical applications of the aggregation function highlight its versatility. For instance, a case study demonstrated that utilizing a grouping technique allowed analysts to efficiently summarize complex datasets, resulting in improved performance and expedited decision-making processes.
This aligns with expert perspectives emphasizing the importance of categorization in simplifying analysis tasks and driving business growth through enhanced insights.
Moreover, RPA solutions from Creatum GmbH can automate the manual tasks associated with DAX operations, addressing the challenges of report generation and data inconsistencies. As the field of analysis evolves, staying abreast of the latest advancements in the DAX GROUPBY feature in Power BI is crucial. These updates not only enhance operational capabilities but also empower analysts to extract deeper insights from their data, ultimately fostering informed decision-making and strategic growth.
Furthermore, guidelines on organizing rows and columns, inserting values, and applying filtering in spreadsheets are essential skills that enhance the use of DAX tools in analysis, further supported by RPA solutions that automate repetitive tasks and improve overall efficiency.
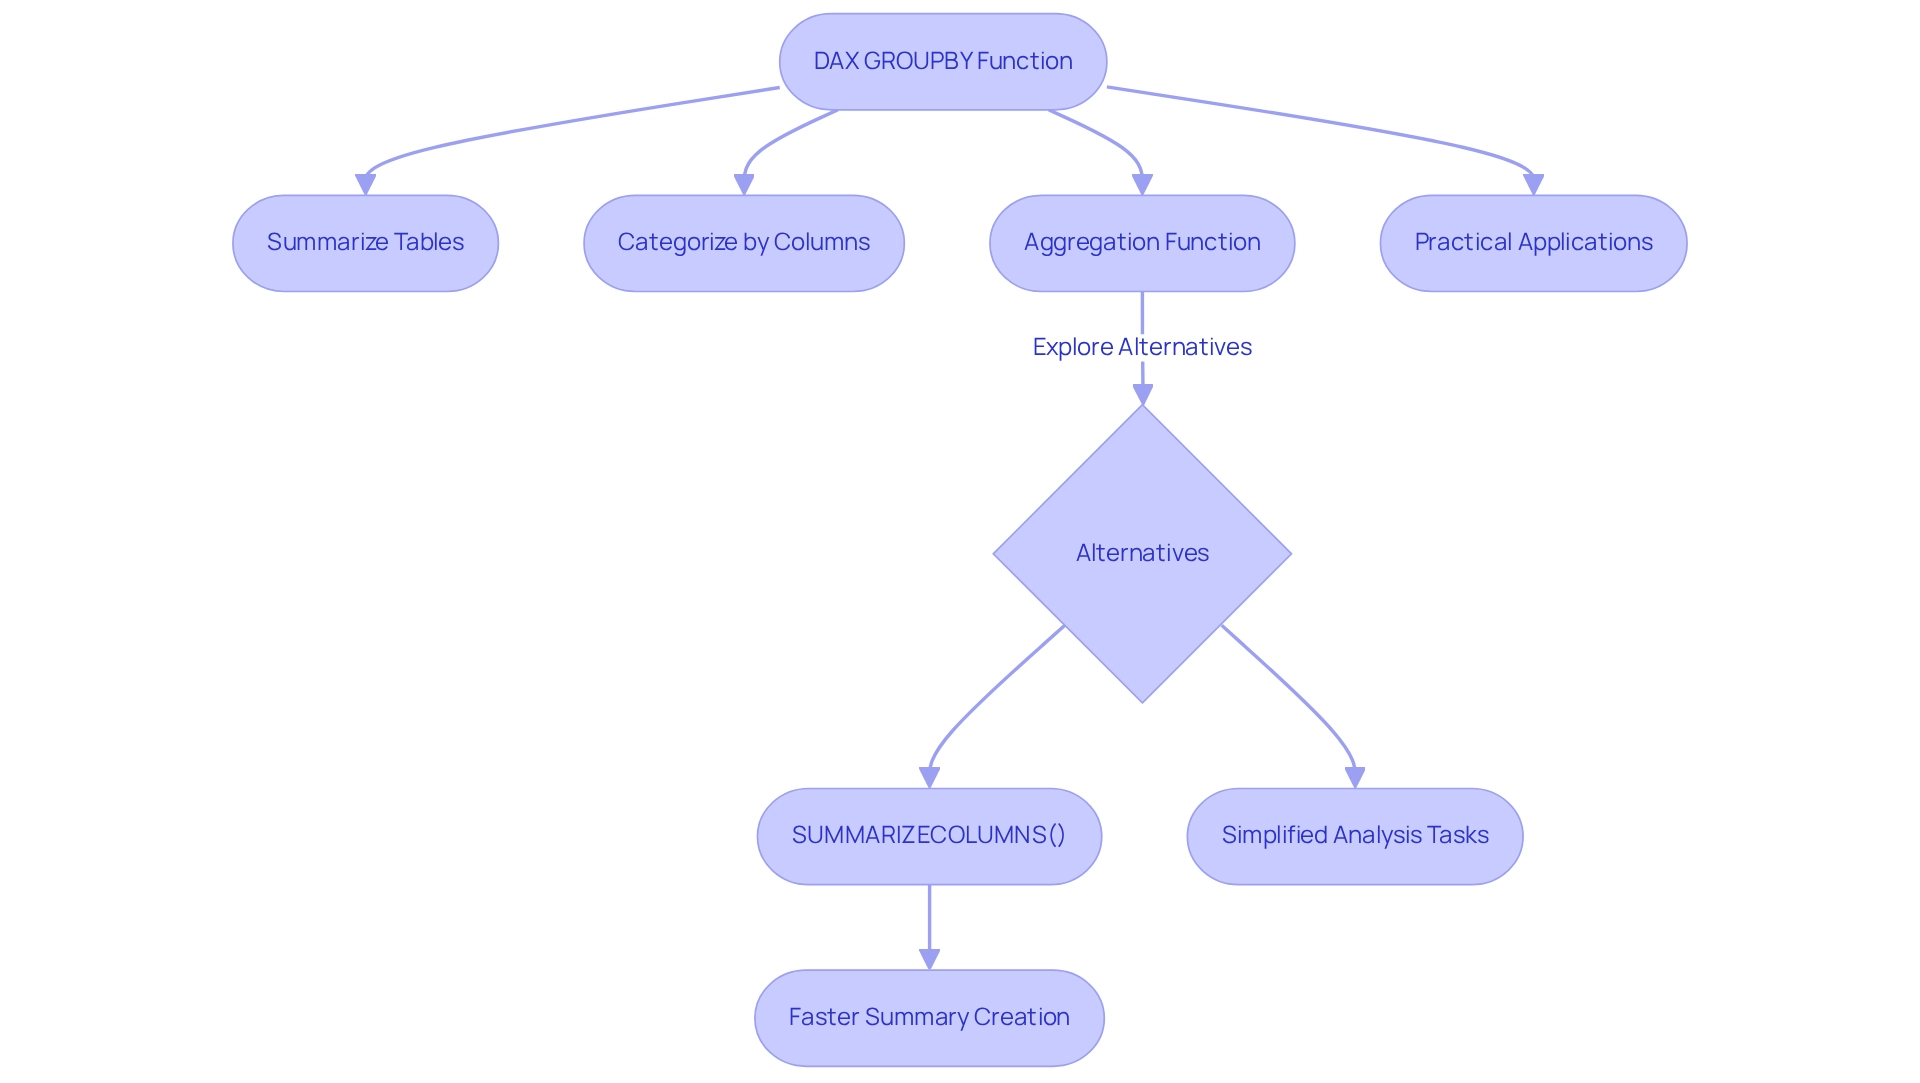
Syntax and Parameters of GROUPBY
The syntax for the GROUPBY function in DAX is structured as follows:
group by(<table>, <group by_column name>, [<name>, <expression>])
: This parameter specifies the table you wish to group.
- <groupBy_columnName>: Here, you specify the column(s) that will act as the foundation for grouping the information using DAX GROUPBY.
- [
, : These optional parameters facilitate the creation of new columns derived from specified expressions, allowing for more intricate analysis.]
Example: To group a sales table by ‘ProductCategory’, the syntax would be:
GROUPBY(Sales, Sales[ProductCategory])
Utilizing the GROUPBY function effectively can significantly enhance your data modeling capabilities, particularly in the context of Business Intelligence at Creatum GmbH. In today’s information-rich environment, where extracting meaningful insights is crucial for maintaining a competitive edge, effective grouping can streamline analysis and enhance the clarity of insights derived from Power BI dashboards.
When organizing information, it is crucial to ensure that the columns utilized for grouping are clearly defined and pertinent to the analysis at hand. This practice not only improves operational efficiency but also addresses common challenges such as time-consuming report generation and inconsistencies, which can be alleviated through RPA solutions provided by Creatum GmbH.
In terms of usage statistics, it is noteworthy that defining measures in a model becomes challenging when exceeding 500 measures. This limitation underscores the significance of efficient grouping with DAX GROUPBY to sustain performance and manageability in your models. Furthermore, recent updates to the DAX syntax have introduced enhancements that facilitate better organization and readability of queries, making it simpler for analysts to manage complex datasets.
As Aditya Sharma observes, “Discover how to utilize the RELATED DAX feature in Power BI to streamline information modeling and create insightful reports.” This emphasizes the significance of comprehending different DAX capabilities, including aggregation, to improve data analysis and foster business expansion.
For practical applications, consider a case study where the DAX query view features, such as commenting and uncommenting lines of code, have been employed to improve query management. This functionality allows users to write cleaner and more organized queries, ultimately boosting productivity and enabling more insightful reporting. The DAX query view includes a ribbon with common actions for writing DAX queries, which aids in query management and enhances overall productivity.
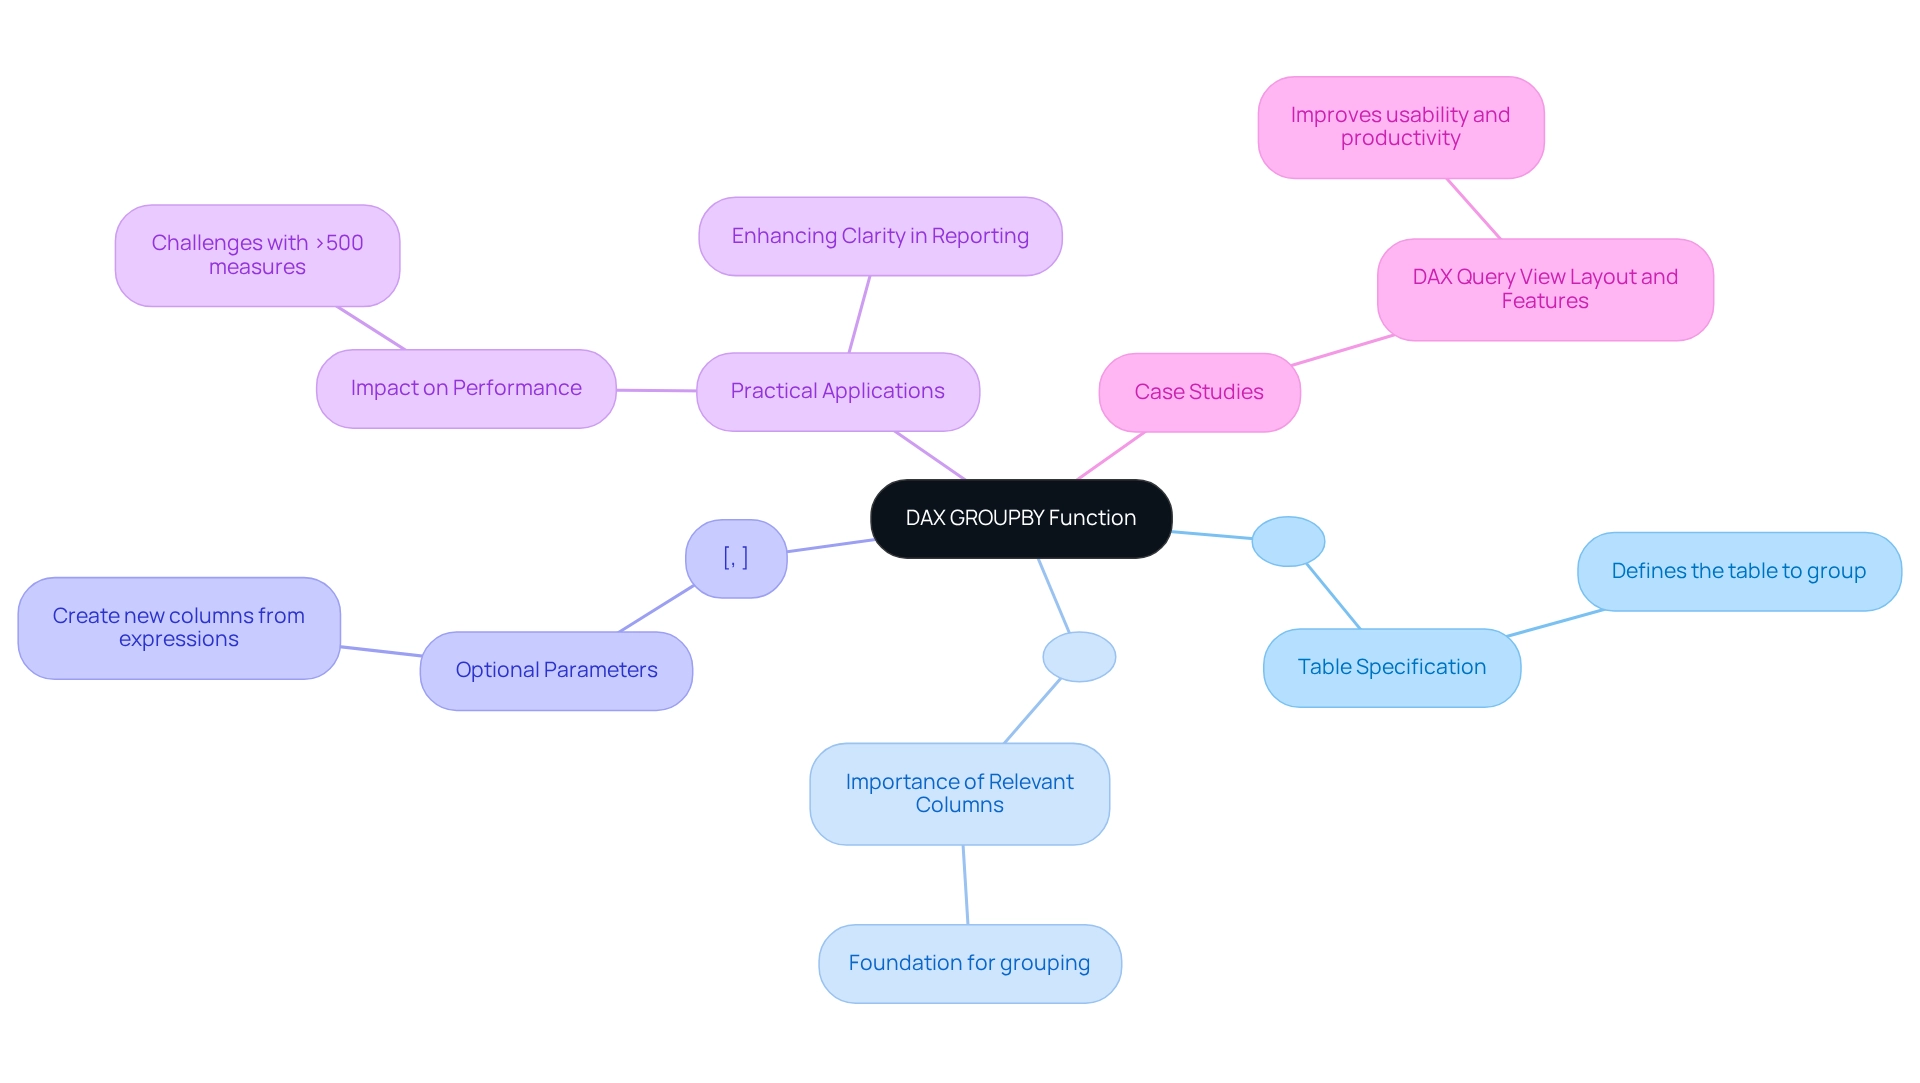
Return Values of the GROUPBY Function
The DAX aggregation tool employs dax groupby to generate a table that features one row for each distinct combination of values in the designated group columns. Consequently, each row in the resulting table signifies a distinct group, while any additional columns defined within the function will present the outcomes of the specified expressions.
For instance, utilizing dax groupby to aggregate data by ‘ProductCategory’ and incorporating a calculation for the sum of ‘SalesAmount’ will yield a result table displaying distinct product categories alongside their corresponding total sales figures. This functionality is essential for analysts, as it offers a clear perspective on how various categories contribute to overall sales performance, ultimately fostering insights that are vital for business growth.
Understanding the return values of the aggregation method is crucial for efficient information analysis. Recent statistics indicate that leveraging DAX capabilities, such as aggregation, can significantly enhance data insights, with numerous analysts reporting improved clarity in their reports. Notably, the Excel Basics Cheat Sheet can be mastered in just 18 minutes, highlighting the accessibility of learning DAX techniques, which resonates effectively with the intended audience.
Moreover, expert opinions emphasize that mastering the return values of data grouping can bolster your Power BI skills, enabling you to extract valuable insights from complex datasets. Joleen Bothma asserts, “Learn what DAX is and explore the essential DAX syntax and features you’ll need to elevate your Power BI skills to the next level.”
In practical applications, the dax groupby function can be pivotal in identifying unique combinations within datasets, which is crucial for making informed business decisions. However, it is important to recognize that when connected live to a published Power BI semantic model, users are unable to view or edit model measures, potentially limiting the functionality of DAX queries.
For example, a case study on the application of dax groupby in sales analysis revealed that organizations could uncover trends and patterns previously concealed in raw data, leading to more strategic operational decisions. Additionally, the DAX query view permits users to comment out lines in their queries, facilitating debugging or temporarily disabling parts of the query without deletion, thus aiding in clarity and organization within complex queries. This aligns with the necessity for enhanced reporting and actionable insights, addressing challenges in consistency and governance for improved decision-making.
To further elevate your information reporting capabilities, consider our Power BI services, including the 3-Day Sprint for rapid report creation and the General Management App for comprehensive management and intelligent reviews. Book a free consultation to discover how our solutions can drive operational efficiency and data-driven insights for your business.
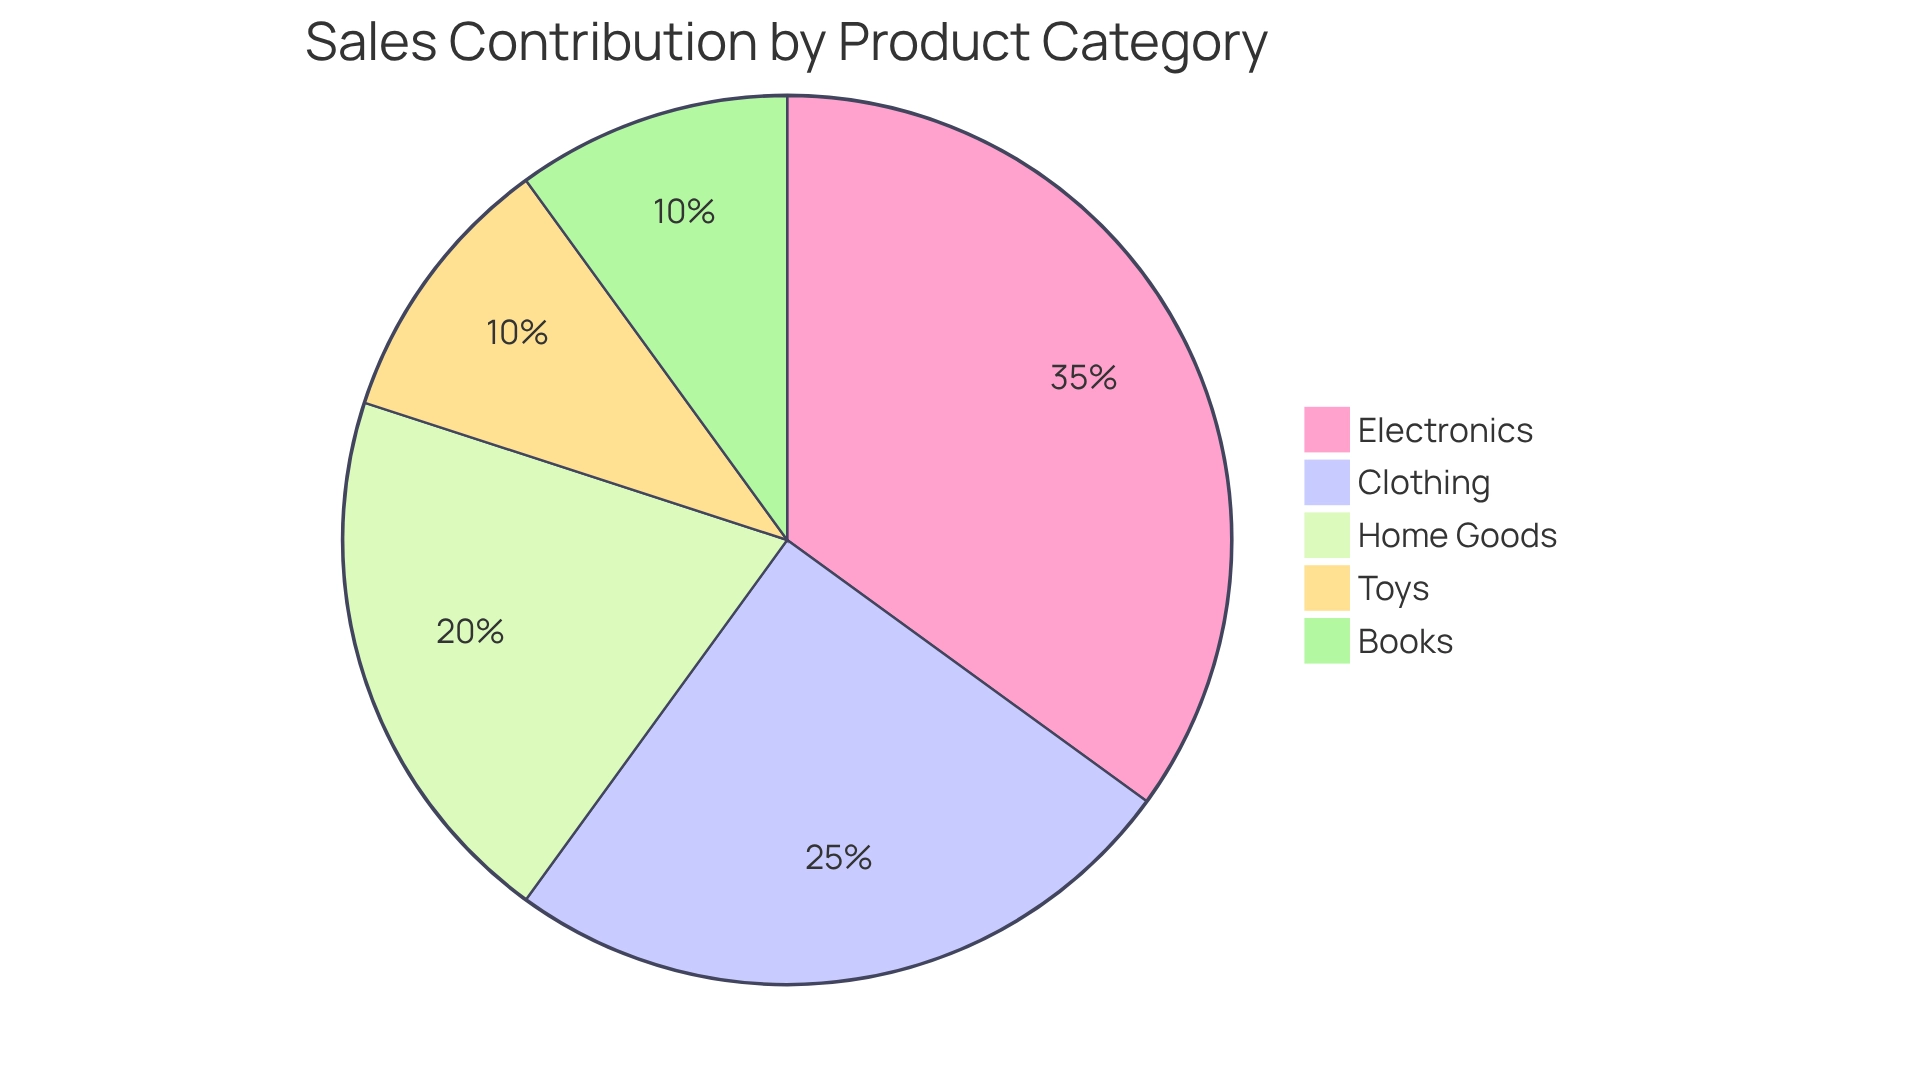
Practical Use Cases for GROUPBY in Data Analysis
The DAX GROUPBY function is a powerful tool that can be effectively utilized in various analytical scenarios, including:
-
Sales Analysis: By categorizing sales information by region, analysts gain insights into performance across different geographical areas. For instance, summarizing total sales by ‘Region’ and ‘ProductCategory’ enables the identification of high-performing regions and products. This facilitates targeted strategies to boost sales.
Integrating Robotic Process Automation (RPA) enhances this process, reducing the time spent on manual information aggregation and allowing teams to focus on strategic analysis. Manual workflows often lead to wasted time and resources, making RPA an essential tool for efficiency.
-
Customer Segmentation: DAX GROUPBY can classify customer information based on demographics, enabling businesses to customize their marketing strategies. This segmentation aids in understanding customer preferences and behaviors, leading to more effective campaigns. RPA can automate the information collection and segmentation process, ensuring insights are derived swiftly and precisely, thus enhancing operational efficiency. The challenges of manual information handling can hinder timely decision-making, which RPA effectively addresses.
-
Inventory Management: In inventory analysis, organizing product information by category aids in evaluating stock levels and identifying reorder requirements. This application ensures that businesses maintain optimal inventory levels, reducing costs associated with overstocking or stockouts. By integrating RPA, organizations can automate inventory tracking and reporting, further improving efficiency and accuracy. The potential for errors in manual processes can lead to significant resource waste, underscoring the need for automation.
Common Pitfalls: A case study on common pitfalls associated with the GROUPBY function highlights mistakes such as ignoring context, misusing calculated columns, and overlooking relationships. Analysts can enhance report precision and performance by understanding DAX evaluation context and optimizing models. Approaches to avoid these traps include pre-filtering information and simplifying DAX expressions, which can be improved by RPA tools that automate information preparation tasks. Identifying these obstacles is crucial, as they frequently arise from manual procedures that can be optimized through automation.
Real-World Application: A case study on customer segmentation using a grouping method revealed that companies efficiently dividing their customer base experienced a 20% rise in targeted marketing response rates. By grasping the nuances of DAX evaluation context and employing DAX GROUPBY to optimize models, analysts can sidestep common pitfalls, such as misusing calculated columns or overlooking relationships, which can hinder report accuracy and performance. RPA plays a crucial role in this process by automating segmentation and reporting tasks, allowing analysts to focus on deriving actionable insights. The incorporation of RPA not only improves efficiency but also mitigates the risks linked to manual information handling.
Statistics: Recent analyses indicate that organizations investing between $30K and $50K to enhance sales processes have significantly benefited from implementing DAX operations, bolstering their information-driven decision-making capabilities. Furthermore, the introduction of quick measures in Power BI has simplified the calculation process for users unfamiliar with DAX, promoting further exploration and training in DAX functionalities. As one analyst noted, ‘It saves us a ton of time we would otherwise be spending in churning out the code.’ Incorporating RPA into this workflow can further enhance efficiency, enabling teams to leverage insights more effectively and minimize time wasted in manual processes.
In summary, the DAX aggregation tool is a formidable resource for analysts, offering essential insights that drive strategic decisions across sales, customer engagement, and inventory management, particularly when paired with RPA to automate manual workflows and address inefficiencies.
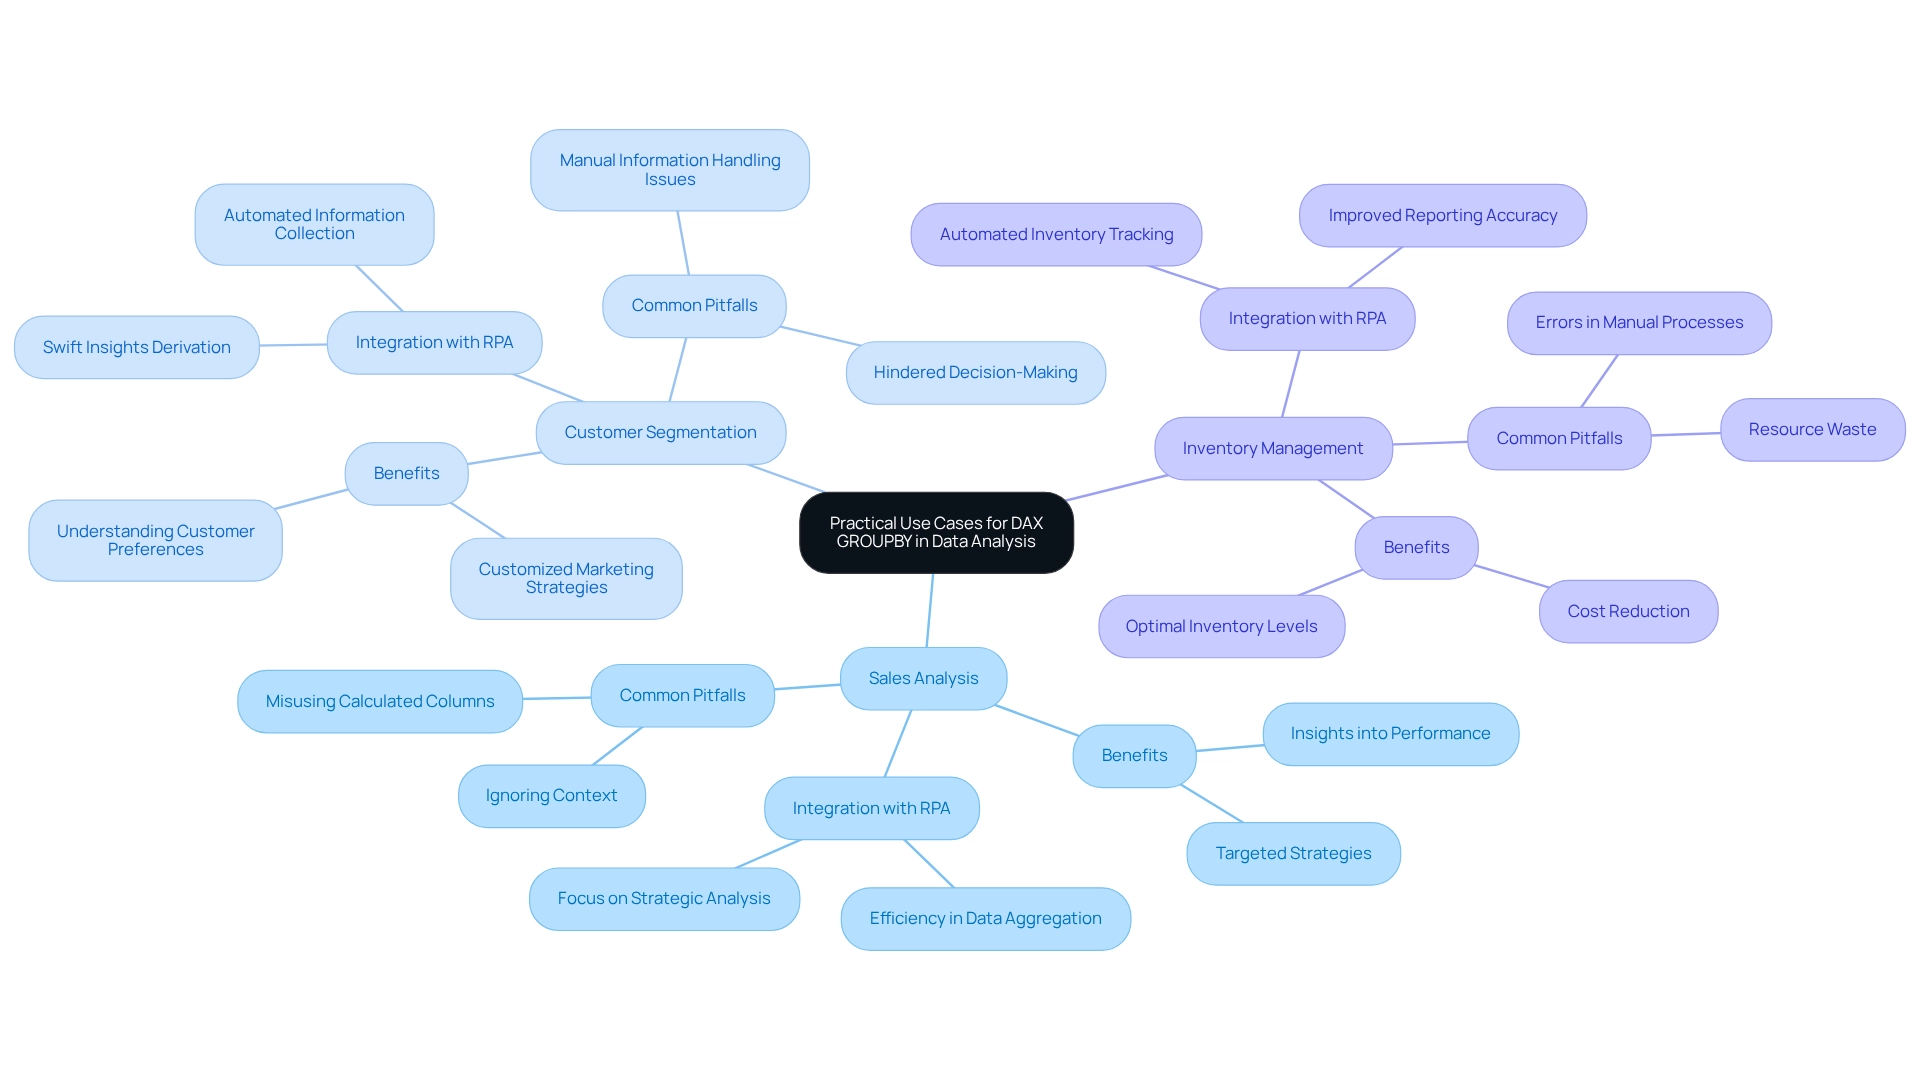
Pros and Cons of Using GROUPBY
Pros:
-
Efficiency: The DAX GROUPBY function frequently surpasses alternatives like SUMMARIZE, especially when managing large datasets. Its streamlined data processing capabilities can drastically reduce computation time, making it a favored option for analysts dealing with extensive data. Users can define all measures within a model to construct comprehensive DAX queries for analysis, further boosting efficiency. This efficiency is critical in an era where Robotic Process Automation (RPA) is increasingly employed to automate manual workflows, allowing teams to concentrate on strategic initiatives. By alleviating the burden of manual, repetitive tasks, RPA empowers analysts to leverage DAX functions more effectively.
-
Flexibility: This function offers remarkable flexibility, enabling users to execute complex aggregations and calculations directly within the grouping. Such capabilities facilitate tailored data analysis that can adapt to specific business needs, enhancing the overall analytical process. As Zoe Douglas, a Product Manager, noted, “Now I have an understanding of how DAX queries function, I can develop my own,” underscoring the ease of use this feature provides. When paired with Business Intelligence tools, this flexibility can drive data-driven insights that support informed decision-making. Tailored AI solutions can further assist users in navigating the complexities of DAX, ensuring they maximize the potential of their analyses.
Cons:
-
Complexity: Despite its power, the syntax of GROUPBY can be daunting for newcomers to DAX. This complexity may lead to errors if users are not meticulous, particularly when crafting intricate queries that necessitate a comprehensive understanding of the function’s mechanics. As organizations increasingly adopt AI solutions to navigate complex data environments, grasping these nuances becomes essential. The challenges posed by manual workflows can complicate this process, making it vital for teams to possess the right tools and support.
-
Performance: Although GROUPBY is typically efficient, its performance can decline if not implemented correctly. In scenarios involving large datasets, improper utilization may result in slower execution times, emphasizing the importance of understanding the subtleties of the process. The integration of the DAX query view with the Performance Analyzer feature in Power BI enables users to record and analyze the performance of visuals and their underlying DAX queries, offering insights into optimizing reports and dashboards. This optimization is critical for effectively leveraging Business Intelligence, ensuring that data insights are both timely and actionable. Failing to extract valuable insights can place companies at a competitive disadvantage, highlighting the importance of mastering DAX functions such as aggregation.
Conclusion:
Evaluating the advantages and disadvantages of DAX GROUPBY is essential for analysts aiming to leverage its capabilities effectively. By considering these elements, analytics experts can make informed decisions about when to utilize aggregation to enhance efficiency and precision in their analyses. The DAX query view also establishes a block to define all measures within a model, further enhancing the flexibility and efficiency of utilizing aggregation functions, particularly in conjunction with RPA and Business Intelligence strategies.
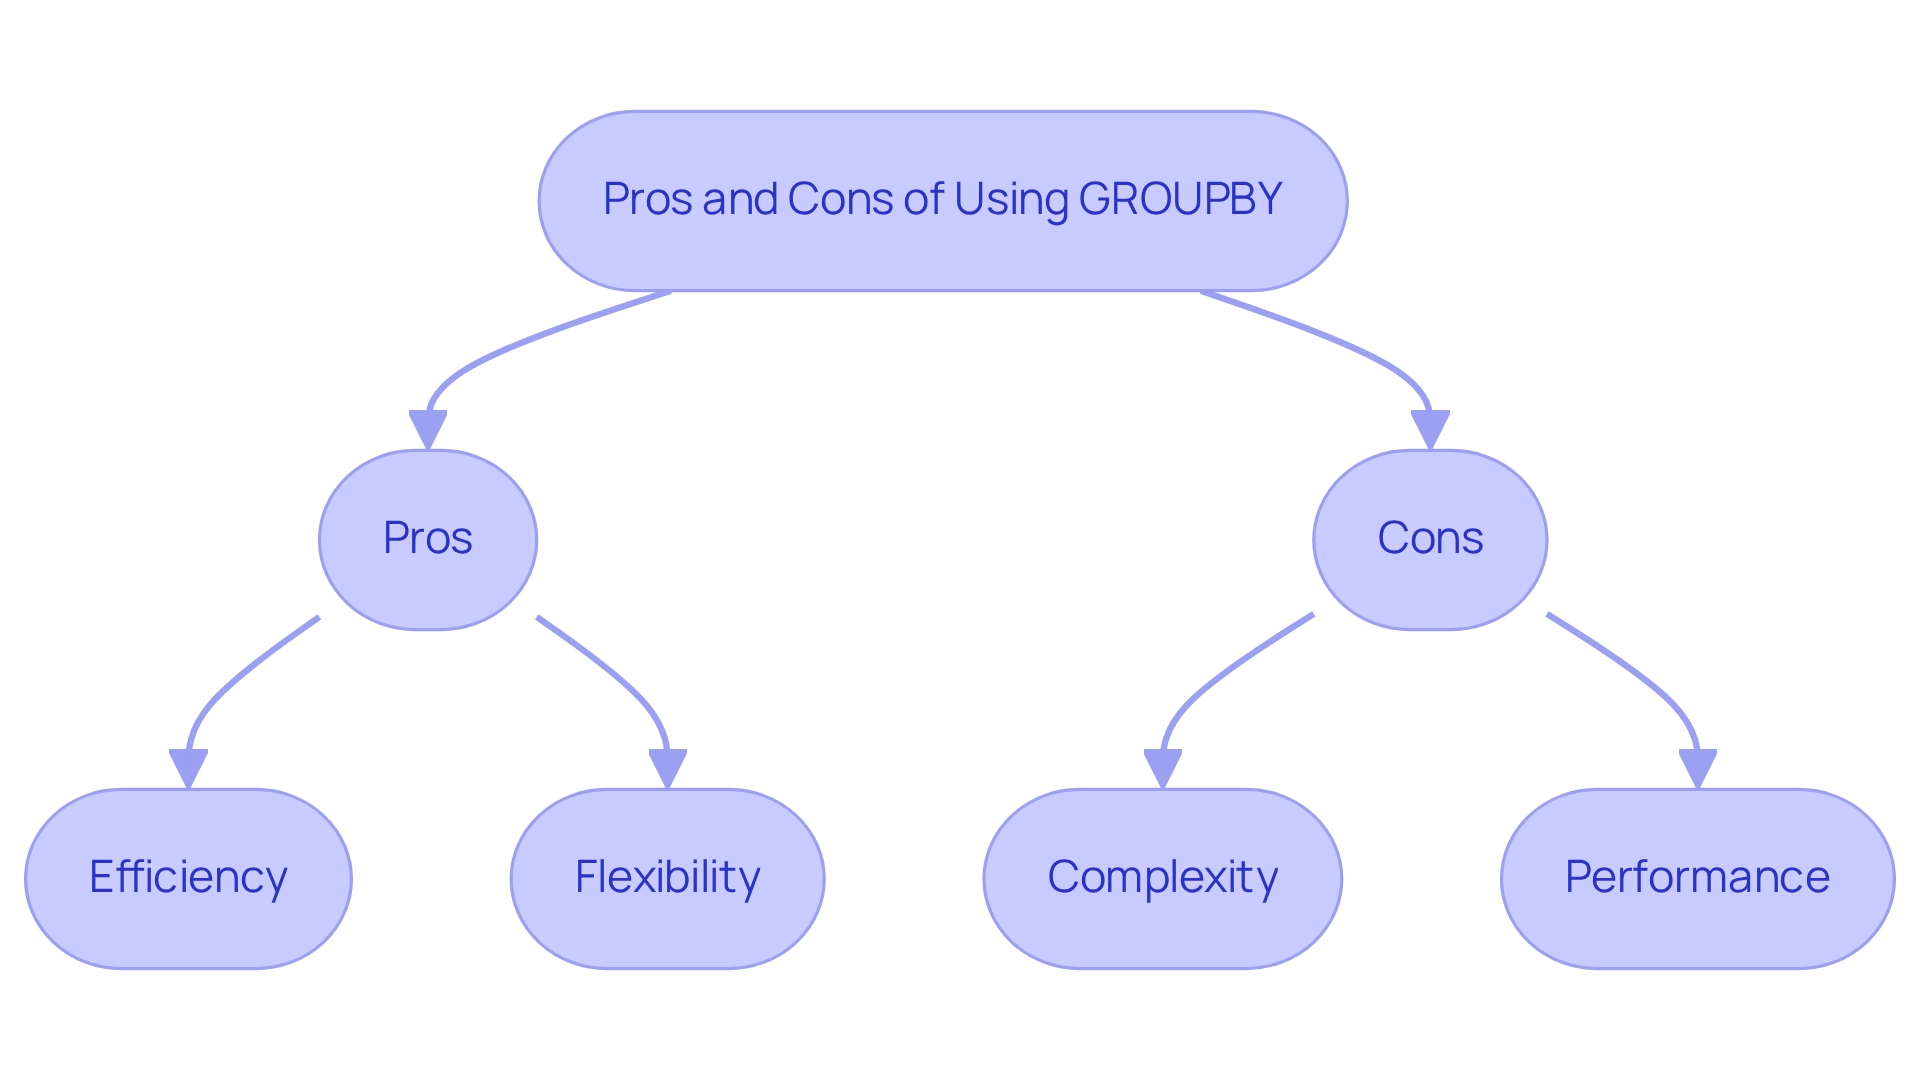
Challenges and Considerations When Using GROUPBY
When utilizing the DAX GROUPBY function, analysts face several key challenges that must be navigated to ensure effective data analysis.
-
Data Types: Verifying that the columns designated for grouping are of compatible data types is crucial. Incompatible types can lead to errors that disrupt the analysis process. Therefore, standardizing types before executing GROUPBY queries is essential. Poor master information quality can exacerbate these issues, resulting in inefficient operations and flawed decision-making. Addressing these challenges is vital, as Robotic Process Automation (RPA) can assist in optimizing information management processes, ensuring improved quality and consistency.
-
Performance Issues: Analysts should closely monitor performance, especially when working with large datasets. The DAX GROUPBY function can significantly slow down query execution if not properly optimized. Implementing effective indexing and model optimization strategies can enhance performance, ensuring efficient query execution even with substantial information volumes. Notably, incremental refresh can query and update information for the last three days, which is advantageous for managing large datasets effectively. Utilizing Business Intelligence tools can further streamline this process, converting raw information into actionable insights. Customized AI solutions can also enhance performance by automating repetitive tasks and increasing processing efficiency.
-
Understanding Context: A thorough understanding of filter context is vital, as it directly influences the results produced by GROUPBY. Analysts must recognize how filters applied in the information model can affect aggregation outcomes, potentially leading to unforeseen results if not managed carefully. This comprehension is essential for effectively utilizing insights from Power BI dashboards, where discrepancies can obstruct efficient analysis. RPA can play a significant role in addressing these inconsistencies by automating information validation and cleansing processes.
-
Testing with Smaller Datasets: It is advisable to test aggregation queries on smaller datasets first. This practice allows analysts to validate the functionality and accuracy of their queries, including those using DAX GROUPBY, before scaling them up to larger datasets. This approach minimizes the risk of errors and performance issues. By tackling these challenges, analysts can unlock the full potential of the aggregation method, enhancing their analytical capabilities and ensuring more dependable results.
In the words of Errin O’Connor, “Power BI’s DAX GROUPBY feature enables a range of aggregation operations, including sum, average, count, min, max, and more, offering flexibility in analysis.” For instance, the case study titled ‘Using DAX GROUPBY for Simple Grouping Operations’ demonstrates how the DAX GROUPBY method efficiently computes Total Revenue by Category, highlighting its effectiveness in managing simple grouping activities. Furthermore, this function enhances data analysis by enabling various types of analysis, including time series, cohort, comparative analysis, and data cleaning, further underscoring its value in the analytical process.
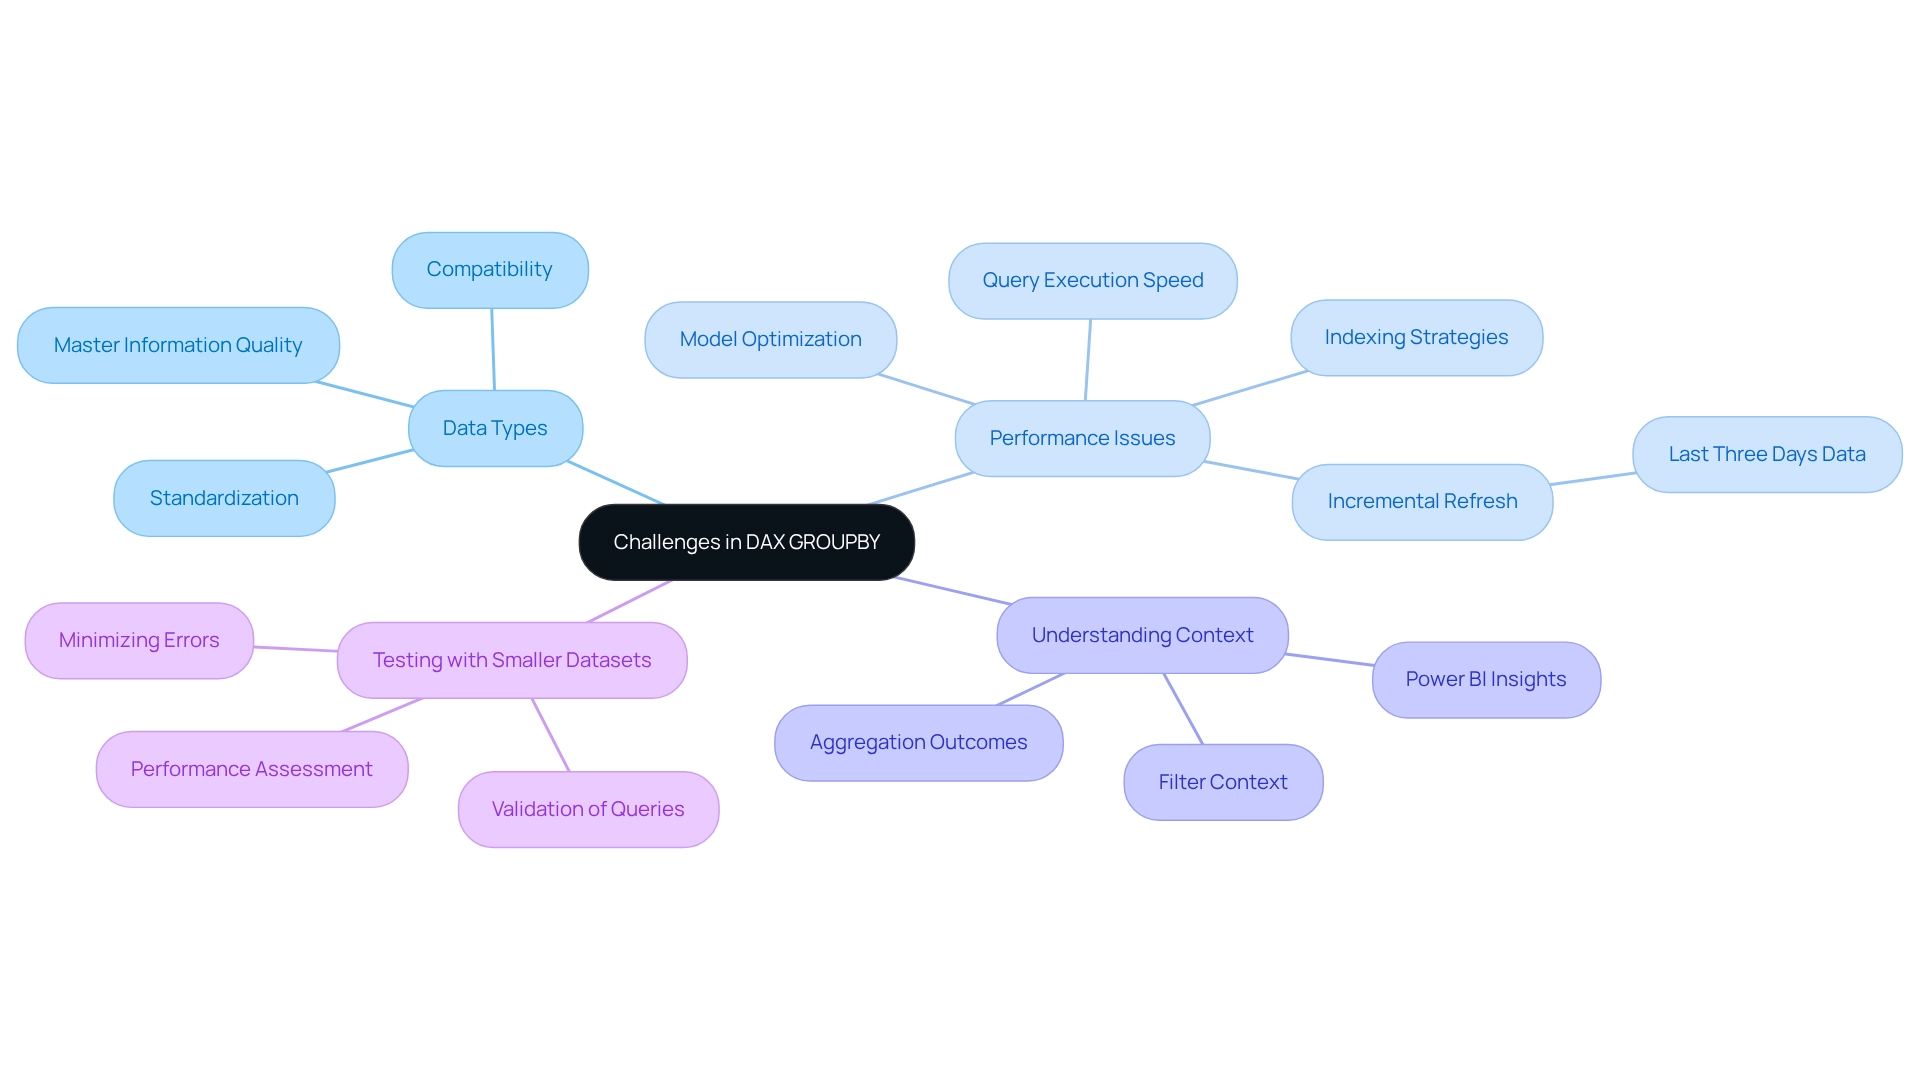
Best Practices for Effective Use of GROUPBY
To effectively leverage the GROUPBY function in DAX, adhere to the following best practices:
-
Start Simple: Begin with basic aggregation queries. This foundational approach allows you to grasp core functionalities before progressing to more intricate scenarios, ensuring a solid understanding of the function’s mechanics.
-
Use Descriptive Names: When creating new columns within GROUPBY, opt for clear and descriptive names. This practice enhances the readability of your code and aids in maintaining clarity for future reference, making it easier for others (or yourself) to understand the logic behind your queries.
-
Test Incrementally: Adopt an incremental testing strategy for your queries. By validating each segment of your DAX code as you build it, you can swiftly identify and rectify errors, gaining insights into how modifications impact your results. This method is particularly beneficial in complex queries where the interplay of multiple components can lead to unexpected outcomes.
-
Optimize Performance: Regularly assess and refine your DAX queries to ensure optimal performance, especially when working with large datasets. For example, merging
SUMMARIZE()withADDCOLUMNS()can greatly improve your analysis abilities by permitting the addition of custom-calculated columns within grouped information. A practical application of this is the formula:
sales with addcolumns = ADDCOLUMNS(SUMMARIZE(sales_roll up, sales_roll up[Region], sales_roll up[Product], 'Total Sales', SUM(sales_average[total]), 'Quantity', SUM(sales_average[Quantity])), 'Average total per Unit', DIVIDE(SUM(sales_average[total]), SUM(sales_rollup[Quantity]), 0))
This formula not only calculates total sales and quantities but also derives the average sales per unit, showcasing the power of combining these functions for enhanced data insights.
Example: Before finalizing a complex DAX GROUPBY query, it is advisable to decompose it into smaller, manageable parts. Test each segment to ensure accuracy and performance, which can lead to more efficient and effective queries overall.
Case Study: The integration of the DAX query view with the Performance Analyzer in Power BI allows users to record and analyze the performance of visuals by examining the underlying DAX queries. This integration helps users optimize their reports by providing insights into the performance of DAX queries, enabling them to make informed adjustments to improve efficiency. This is especially pertinent in tackling challenges such as time-consuming report generation and inconsistencies in information.
Expert Insight: As Salvatore Cagliari notes, “Sometimes we have a slow report, and we need to figure out why. I will demonstrate how to gather performance information and what these metrics signify.” This highlights the importance of understanding performance metrics in optimizing DAX queries, which is crucial for leveraging Business Intelligence effectively.
By adhering to these best practices, analysts can enhance their use of the DAX GROUPBY function, leading to improved performance and more insightful analysis. Furthermore, customized solutions that enhance data quality can drive growth and innovation in data analysis, making the effective use of GROUPBY even more critical.
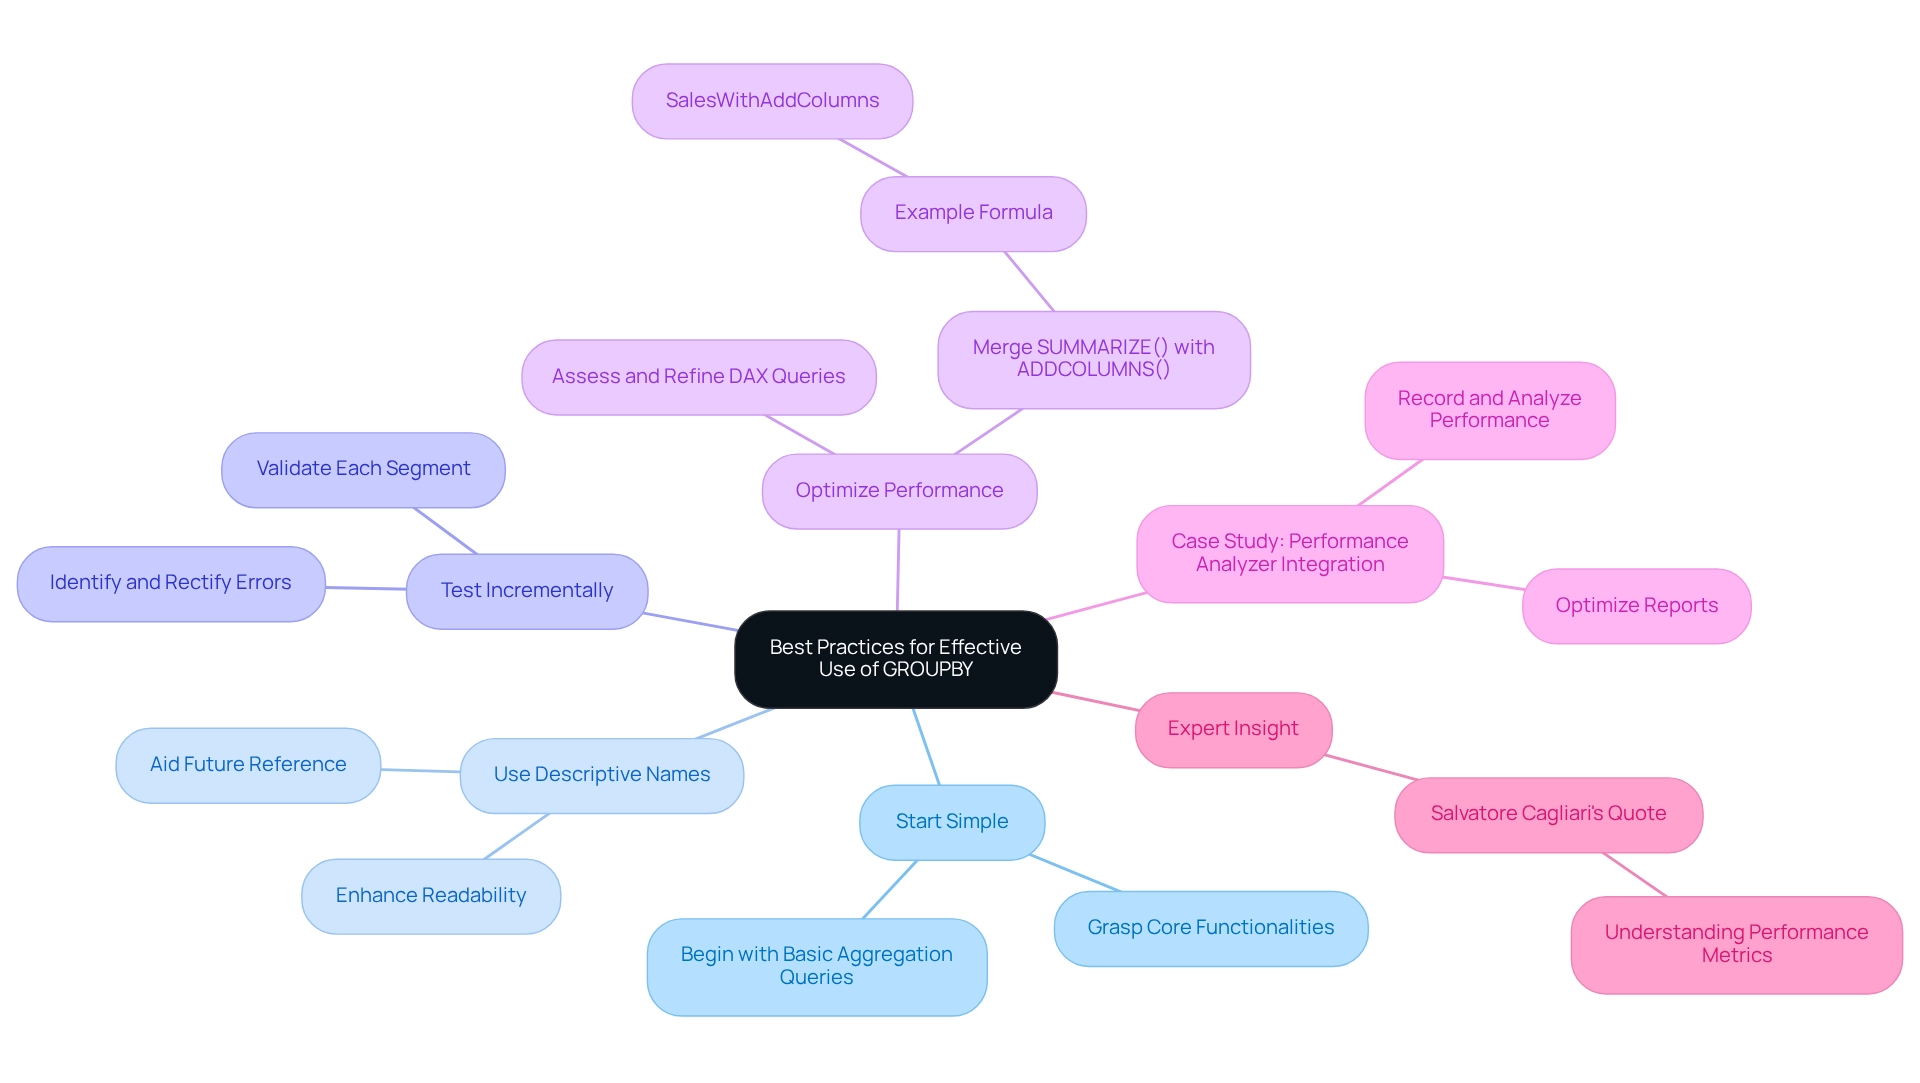
Conclusion
The DAX GROUPBY function stands as a cornerstone in data analysis, particularly for professionals aiming to distill intricate datasets into actionable insights. Its capability to summarize data by specified columns not only enhances clarity but also facilitates informed decision-making across diverse domains, ranging from sales analysis to inventory management. By effectively leveraging GROUPBY, analysts can pinpoint trends, optimize workflows, and drive strategic growth—an essential endeavor in today’s fast-paced data landscape.
However, navigating the intricacies of the GROUPBY function necessitates careful adherence to best practices. Starting with simple queries, employing descriptive naming conventions, and optimizing performance are foundational steps. Moreover, understanding potential pitfalls—such as data type compatibility and filter context—is crucial for maximizing the effectiveness of this powerful tool. As organizations increasingly integrate Robotic Process Automation (RPA) into their workflows, the efficiency gained from automating repetitive tasks further underscores the importance of mastering DAX functions like GROUPBY.
Ultimately, proficiency in utilizing the GROUPBY function not only enhances analytical capabilities but also empowers professionals to harness the full potential of data-driven strategies. By staying abreast of updates and best practices, analysts can elevate their data analysis skills, ensuring their organizations maintain a competitive edge in an ever-evolving market. Embracing these insights paves the way for more effective decision-making and fosters a culture of continuous improvement in data analysis practices.
Frequently Asked Questions
What is the DAX GROUPBY feature used for?
The DAX GROUPBY feature is used to summarize tables by categorizing them based on specified columns, allowing analysts to consolidate insights and perform computations on grouped datasets.
How can the DAX GROUPBY feature enhance operational efficiency?
By enabling users to extract actionable insights from data, the DAX GROUPBY feature improves operational efficiency, particularly in environments influenced by Robotic Process Automation (RPA).
Can you provide an example of how DAX GROUPBY is applied?
For instance, in a sales table, DAX GROUPBY can be used to analyze sales information by product category, creating a new table that summarizes sales figures for each category, thereby providing clearer performance metrics.
What are some alternatives to DAX GROUPBY?
Alternatives to DAX GROUPBY include SUMMARIZECOLUMNS(), which offers faster summary table creation, while DAX GROUPBY is better suited for straightforward grouping operations.
What is the syntax for the DAX GROUPBY function?
The syntax for the GROUPBY function in DAX is as follows: GROUPBY(
What challenges can DAX GROUPBY help address?
DAX GROUPBY can help address challenges like time-consuming report generation and data inconsistencies by improving the organization and clarity of data analysis.
What are some recent updates to the DAX syntax?
Recent updates have introduced enhancements that improve the organization and readability of queries, making it easier for analysts to manage complex datasets.
How does RPA relate to the use of DAX GROUPBY?
RPA solutions can automate manual tasks associated with DAX operations, helping to alleviate challenges related to report generation and data inconsistencies.
Why is understanding DAX capabilities important for analysts?
Understanding DAX capabilities, including aggregation functions like GROUPBY, is crucial for improving data analysis and fostering business growth through enhanced insights.
What practical applications can improve query management in DAX?
Practical applications include using DAX query view features, such as commenting and uncommenting lines of code, which enhance query management and boost productivity.
Overview
This article delves into the best practices for establishing a successful Center of Excellence (CoE) in analytics. It highlights strategies that significantly enhance organizational analytical capabilities. Key components include:
- Leadership support
- Experienced teams
- Clear objectives
- Robust governance
Together, these elements cultivate a culture of data-driven decision-making and operational efficiency. Ultimately, this approach leads to improved business outcomes that every organization strives for.
Introduction
In an age where data reigns supreme, organizations are increasingly turning to Centers of Excellence (CoEs) in analytics to harness the power of their data assets. These centralized hubs not only consolidate expertise and resources but also foster a collaborative environment that drives innovation and strategic alignment across departments. As companies navigate the complexities of data management, establishing a high-performing analytics CoE has become essential for translating vast amounts of information into actionable insights.
By integrating advanced technologies like Robotic Process Automation and adopting best practices for data governance, organizations can enhance decision-making processes and achieve measurable success. This article delves into the key components and methodologies that underpin a successful analytics CoE, highlighting the importance of leadership support, skilled teams, and continuous innovation in unlocking the full potential of data analytics.
Understanding the Center of Excellence in Analytics
A Center of Excellence (CoE) in data analysis, known as coe analytics, acts as a centralized hub that consolidates expertise, resources, and best practices, significantly enhancing an organization’s analytical capabilities. By fostering teamwork, innovation, and strategic alignment, the CoE unites scientists, analysts, and business stakeholders to advance information initiatives closely aligned with organizational objectives. This integration prevents data analysis efforts from becoming isolated, cultivating a culture of shared insights and informed decision-making across departments.
In today’s information-rich landscape, creating a CoE is particularly advantageous. Organizations face the challenge of transforming vast quantities of information into actionable insights. Current trends indicate that entities leveraging coe analytics are better positioned to harness insights for competitive advantage, as they can standardize practices and enhance information analysis capabilities. For instance, CoE analytics has successfully bridged the gap between business needs, data science, and technology, generating tangible value by aligning analytics vision with business strategy.
This alignment is essential. As Radu Arslanian, Sr. Principal Consultant in Informatica’s Advisory Services group, observes, “Gartner shows that 95% of organizations that establish a Cloud COE will deliver measurable cloud transformational success through 2021.”
Furthermore, integrating Robotic Process Automation (RPA) within the CoE can streamline manual workflows, enhancing operational efficiency and allowing teams to focus on strategic initiatives. RPA significantly reduces time spent on repetitive tasks, leading to improved productivity and accuracy. Since FY 2018, the Data Analytics Center of Excellence has effectively employed coe analytics tools and strategies to enhance decision-making and program results.
Industry insights further suggest that organizations establishing a CoE Analytics are likely to experience quantifiable transformational success. This highlights the importance of centralized data hubs in boosting operational efficiency and effectiveness. The Enterprise Big Data Framework offers practical guidance on developing data-driven decision-making and governance processes, which are crucial for enhancing analytical capabilities. As we approach 2025, the role of data Codes will continue to evolve, becoming increasingly vital for organizations aiming to fully leverage their data assets, particularly through tailored AI solutions and Business Intelligence strategies.
Creatum GmbH is committed to helping organizations navigate these challenges, ensuring they can effectively implement RPA and BI solutions to achieve their strategic objectives.
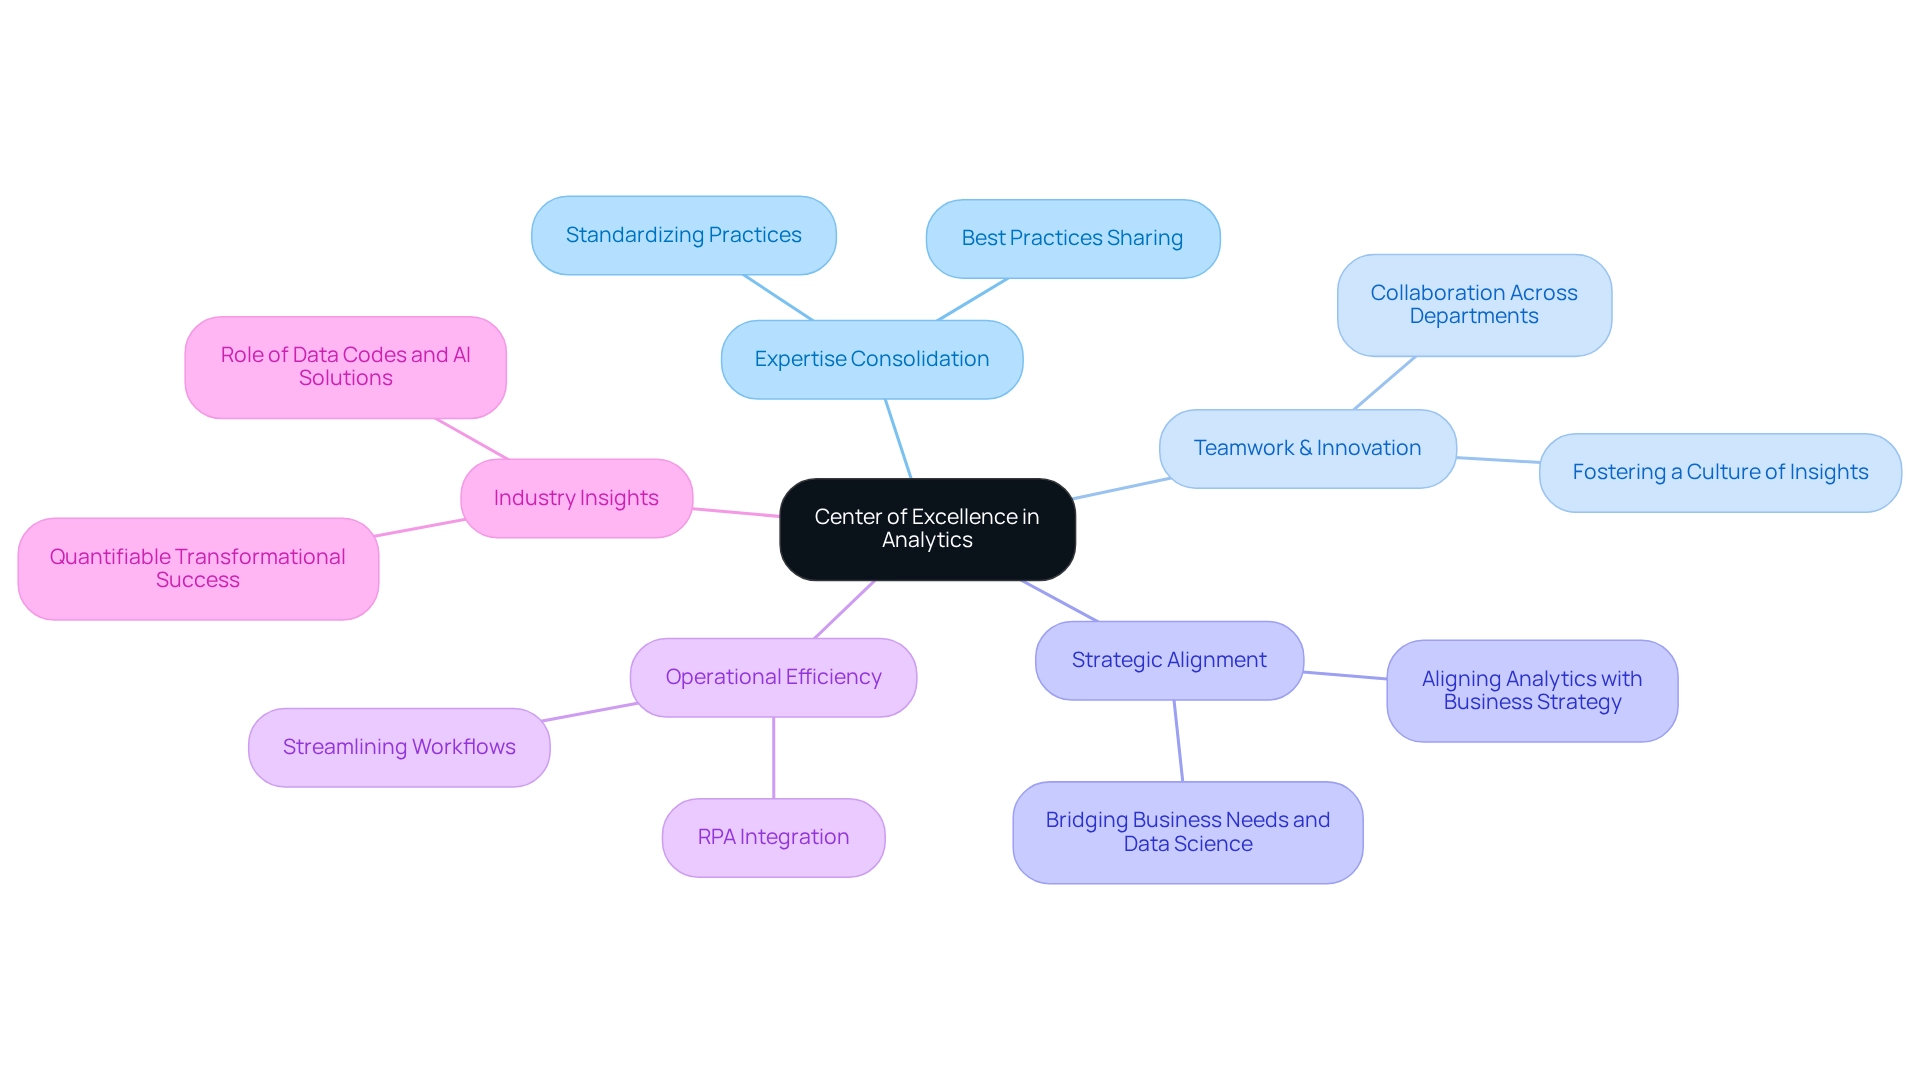
Key Components of a High-Performing Analytics CoE
A high-performing data analysis Center of Excellence (CoE) is characterized by several essential components that drive its success:
-
Leadership Support: Strong backing from senior management is vital for securing necessary resources and fostering a culture that prioritizes data-driven decision-making. Research shows that organizations with strong leadership backing for data initiatives can achieve a 25% improvement in overall results, highlighting the significance of executive involvement. Additionally, persuading a powerful audience is crucial, as they hold significant control over organizational resources and priorities. This leadership support is essential for leveraging Business Intelligence and Robotic Process Automation (RPA) to drive data-driven insights and operational efficiency through CoE analytics.
-
Experienced Group: A varied group equipped with knowledge in information science, analysis, and business intelligence is essential for efficient operations. This diversity not only enhances problem-solving capabilities but also promotes innovative approaches to CoE analytics challenges, ensuring that the CoE can adapt to evolving market demands. Leveraging AI through tailored solutions, such as Small Language Models and GenAI Workshops, can further enhance the group’s capabilities in data analysis and training, addressing specific challenges like poor master data quality and perceived AI complexities.
-
Clear Objectives: Establishing specific, measurable goals is essential for aligning the CoE’s activities with the organization’s strategic vision. This clarity helps teams focus their efforts on initiatives that drive meaningful impact, ultimately leading to improved decision-making speed and reduced operational costs. For instance, a retailer achieved a 30% boost in decision-making speed and reduced market research costs by 25% through effective analytics practices. Employing Power BI services, such as the 3-Day Sprint for quick report generation, can greatly improve information reporting and actionable insights through CoE analytics.
-
Collaboration Framework: A structured approach to collaboration among various departments fosters knowledge sharing and innovation. By breaking down silos, organizations can leverage collective expertise, leading to more comprehensive insights and enhanced performance across the board. This partnership is crucial for tackling information inconsistency and governance challenges in business reporting, ultimately improving decision-making.
-
Technology Infrastructure: Investing in the appropriate tools and technologies is essential for effective information management and analysis. A robust technology stack allows groups to harness data effectively, transforming raw information into actionable insights that inform strategic decisions. Integrating Robotic Process Automation (RPA) can simplify workflows, increase efficiency, and offer a risk-free ROI evaluation, enabling teams to concentrate on more strategic, value-enhancing tasks.
Integrating these elements not only improves the performance of CoE analytics but also positions firms to maintain a competitive advantage in an increasingly data-driven environment. Furthermore, continuous education is essential for leadership development, providing leaders with updated knowledge and skills necessary for effective decision-making and innovation. By nurturing leaders from within, entities can further improve their results, emphasizing the significance of robust leadership backing in data initiatives.
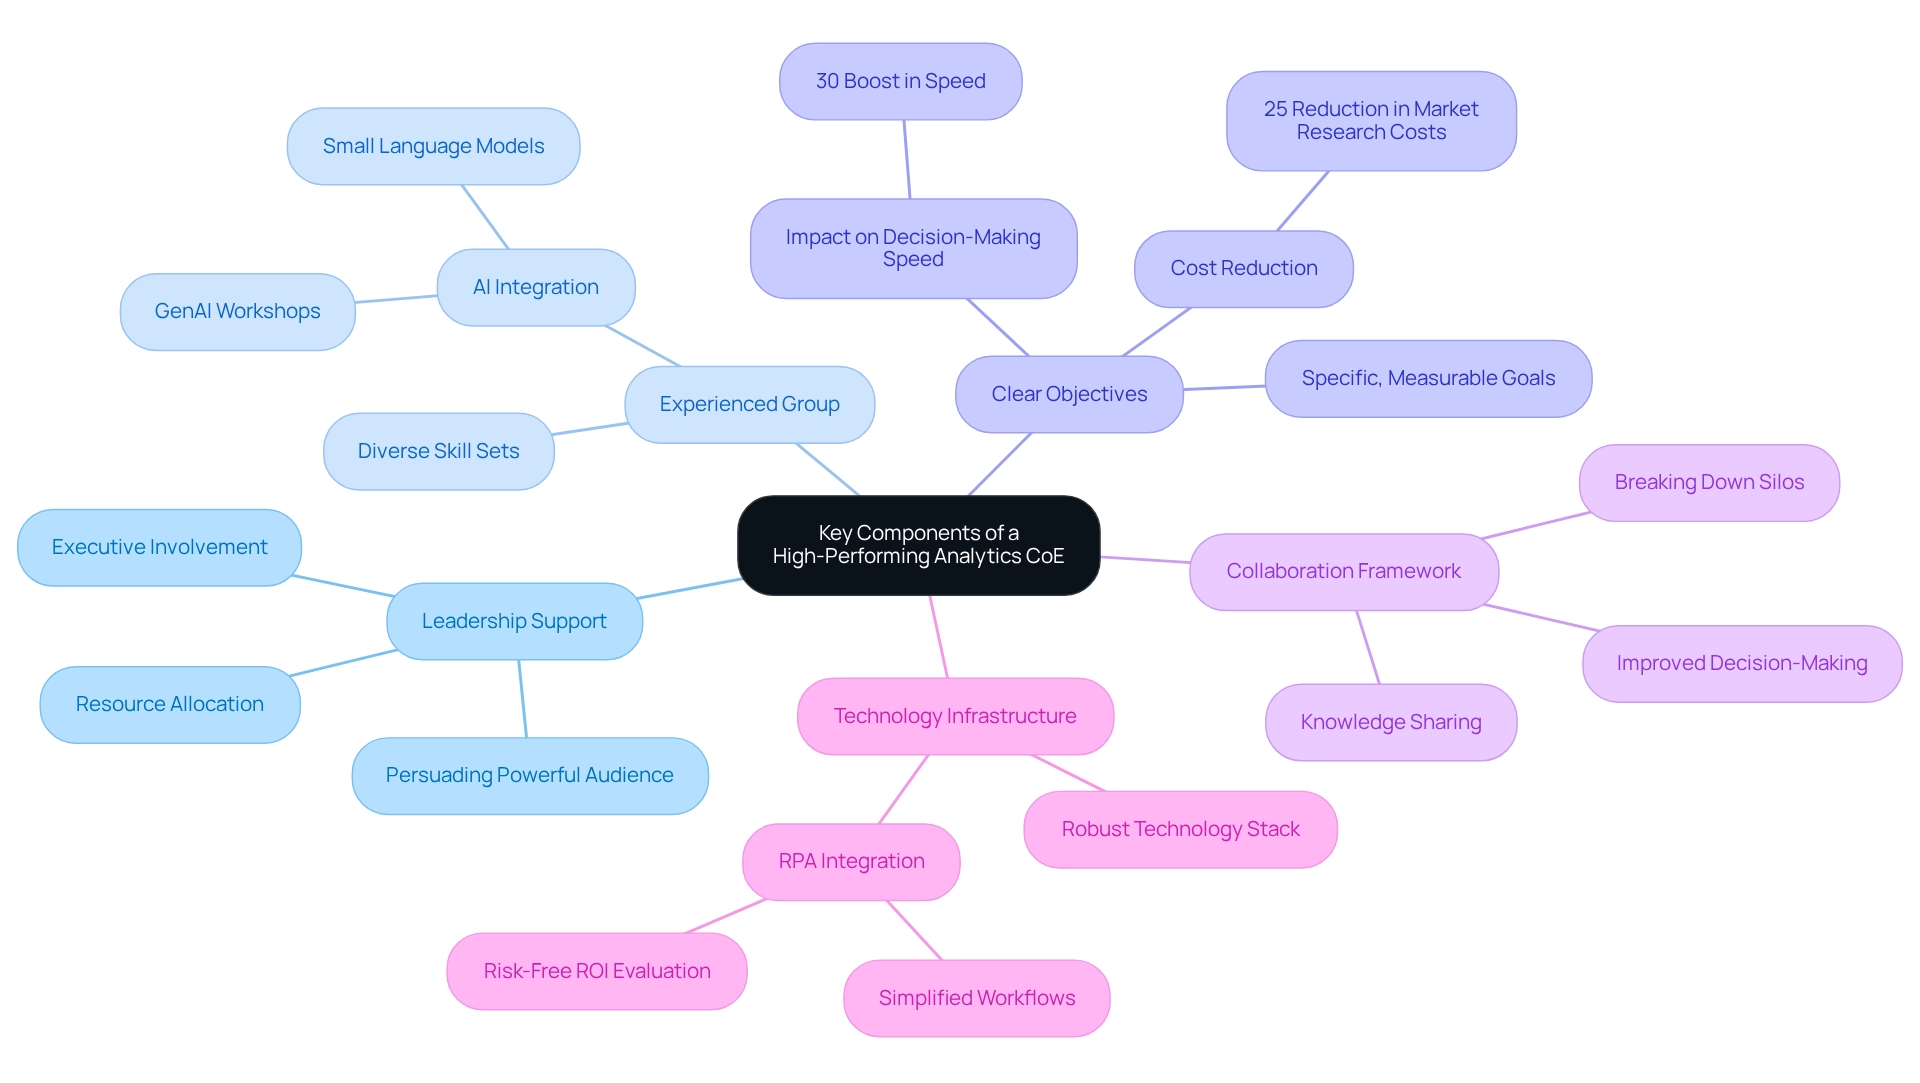
Ensuring Data Quality and Governance
Ensuring information quality and governance is crucial for entities aiming to utilize analytics efficiently. This necessitates the creation of comprehensive policies and procedures that regulate information management practices. Key strategies include:
-
Information Stewardship: Appointing dedicated information stewards to oversee quality and compliance fosters accountability and ensures that governance principles are upheld throughout the organization.
-
Regular Audits: Conducting periodic evaluations of information sources and processes is essential for identifying and rectifying quality issues. These audits help maintain high standards, ensuring that information remains trustworthy and precise.
-
Standardization: Implementing uniform information standards across the organization promotes consistency and reliability. This standardization is vital for effective information integration and supports overall digital transformation efforts, particularly in the context of Business Intelligence and RPA solutions provided by Creatum GmbH, such as EMMA RPA and Power Automate.
-
Training: Offering extensive instruction for staff on information governance principles enhances awareness and compliance with quality standards. An informed workforce is better equipped to handle information responsibly and effectively, especially when utilizing AI technologies like Small Language Models and participating in GenAI Workshops.
-
Feedback Mechanisms: Establishing pathways for input on quality concerns enables ongoing enhancement. Promoting transparent communication assists organizations in adjusting and refining their governance strategies over time.
In 2025, the significance of information management in analysis cannot be overstated. As emphasized by industry specialists, “Investing in the essential resources and staff is vital to cultivating a culture that utilizes technology and encourages innovation while aiming for steady performance enhancement,” states Koushik Nandiraju, an award-winning engineer. Organizations with robust governance frameworks report significantly enhanced information quality, which is essential for successful coe analytics initiatives.
For instance, a recent case study on information quality implementation demonstrated how combining information governance with contemporary catalog solutions can improve overall information observability and address a wider array of information quality challenges. This partnership not only enhances information management but also enables entities to derive significant insights from their information, ultimately fostering growth and innovation. Furthermore, measuring data quality with key metrics and KPIs is crucial for success, as poor data quality impedes organizations in embracing data integration and adopting IT solutions, making data quality integral to digital transformation.
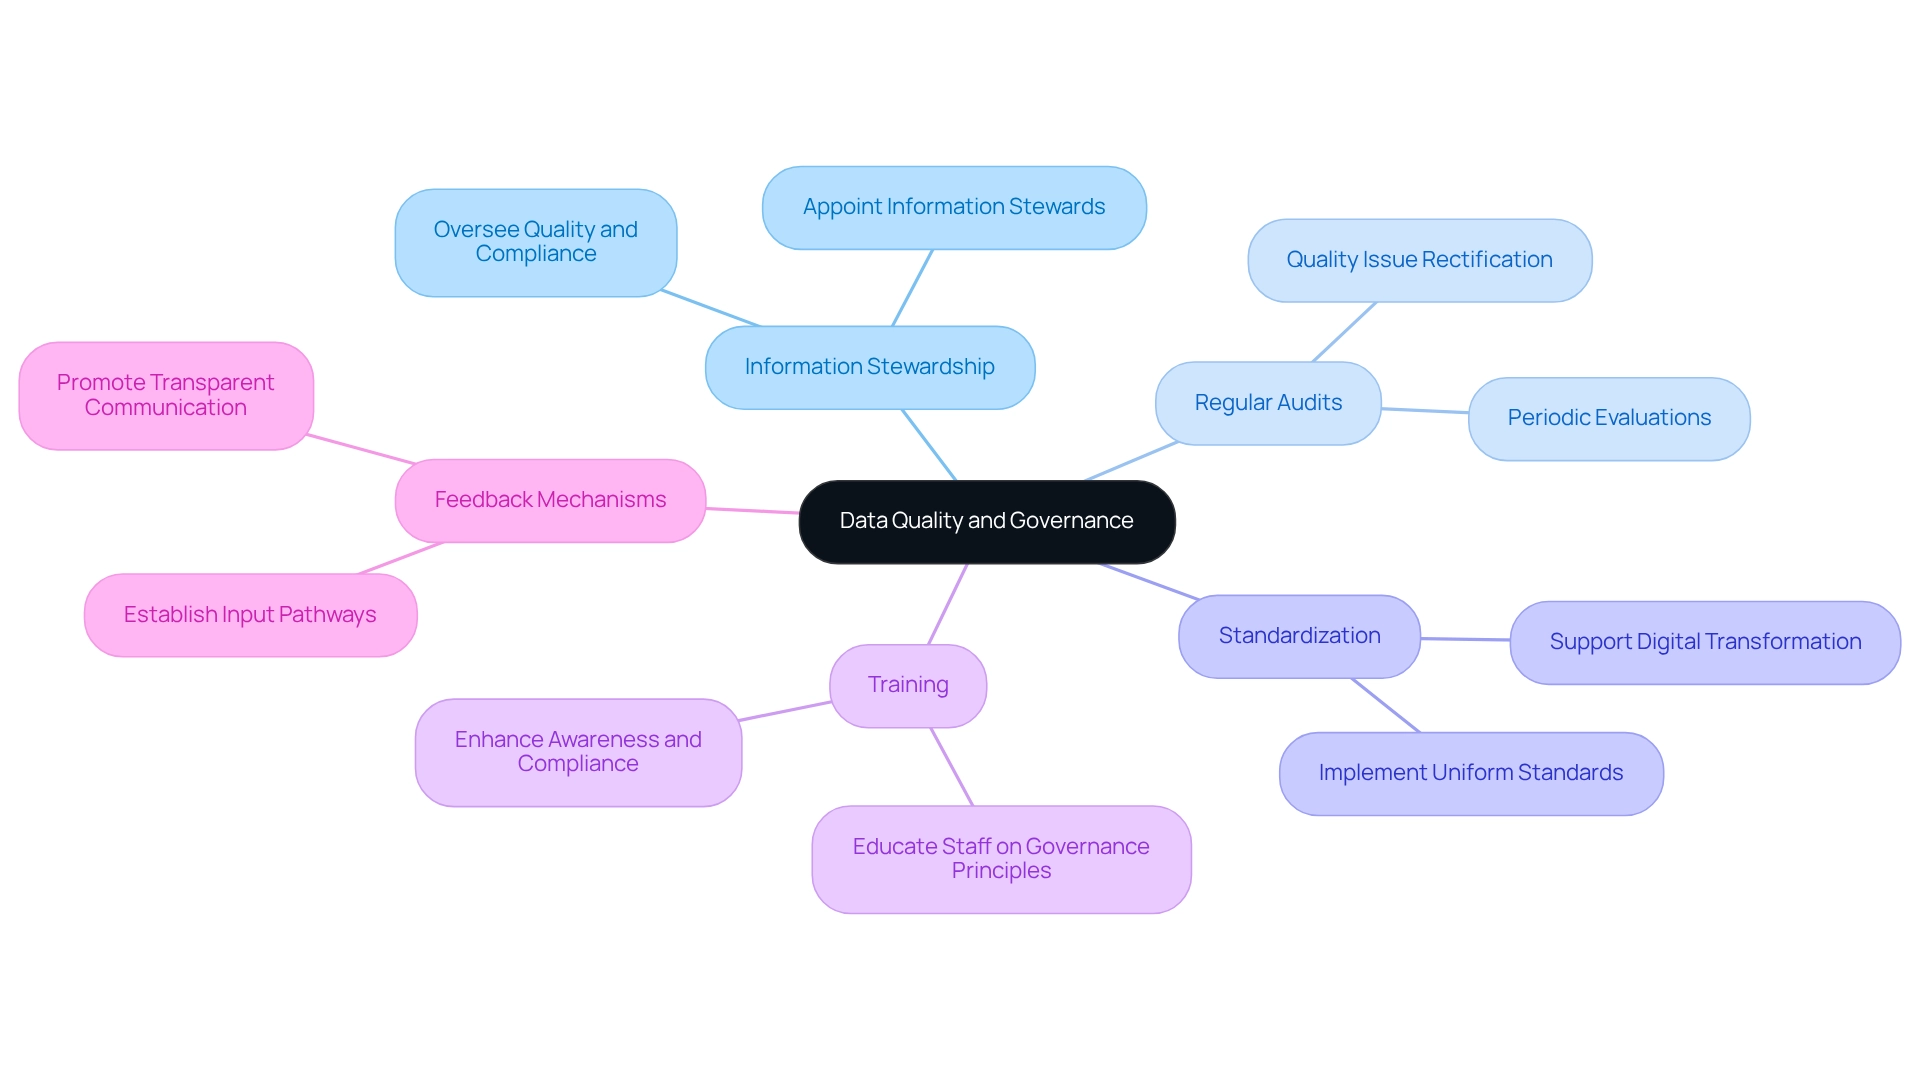
Optimizing Resources for Analytics Success
Enhancing resources for successful data analysis requires a strategic approach to the planning and distribution of both human and technological assets. Effective practices include:
-
Cross-Functional Groups: Forming teams with diverse skill sets not only enhances problem-solving capabilities but also fosters innovation. Analysis results significantly improve when individuals from various departments collaborate, bringing distinct perspectives and expertise. By reducing cycle time, teams can accomplish tasks more swiftly and efficiently, leading to increased productivity and cost savings, as highlighted by analyst Chris Bergh.
-
Technology Investment: Allocating budget towards advanced analytics tools and platforms is essential. Investing in solutions such as Creatum GmbH’s Power BI services, which feature the 3-Day Power BI Sprint for rapid report creation, and EMMA RPA can streamline processes and enhance data processing capabilities. Organizations leveraging cutting-edge technology often experience a notable increase in productivity and cost savings, effectively preventing burnout and project delays.
-
Performance Metrics: Establishing clear metrics for evaluating resource utilization is crucial. This practice helps identify inefficiencies and opportunities for improvement, allowing teams to focus their efforts where they are most needed. Analytics can reveal overlaps where multiple members may be engaged in similar tasks unnecessarily, underscoring the importance of efficient resource management.
-
Flexible Resource Allocation: A versatile approach to resource distribution enables organizations to adapt swiftly to changing analytical needs. This agility is vital in a fast-paced environment, ensuring that teams can pivot and respond to new challenges without hesitation.
-
Continuous Training: Ongoing training for data personnel is imperative to keep them adept in the latest tools and techniques. As technology evolves, so must the skills of the workforce. Investing in continuous education not only enhances individual competencies but also strengthens the overall data analysis function within the organization.
-
DataOps Principles and Observability: Implementing DataOps principles can assist in tracking and improving key metrics related to resource optimization. This approach ensures that teams consistently evaluate their performance and make data-driven decisions.
By applying these best practices, enterprises can maximize their resources effectively, leading to improved analytics outcomes and greater overall success in their operations. Creatum GmbH’s solutions, including RPA for automating manual workflows and Power BI for actionable insights, empower teams to overcome challenges such as staffing shortages and outdated systems, ultimately driving business growth. To discover how our solutions can benefit your organization, book a free consultation today.
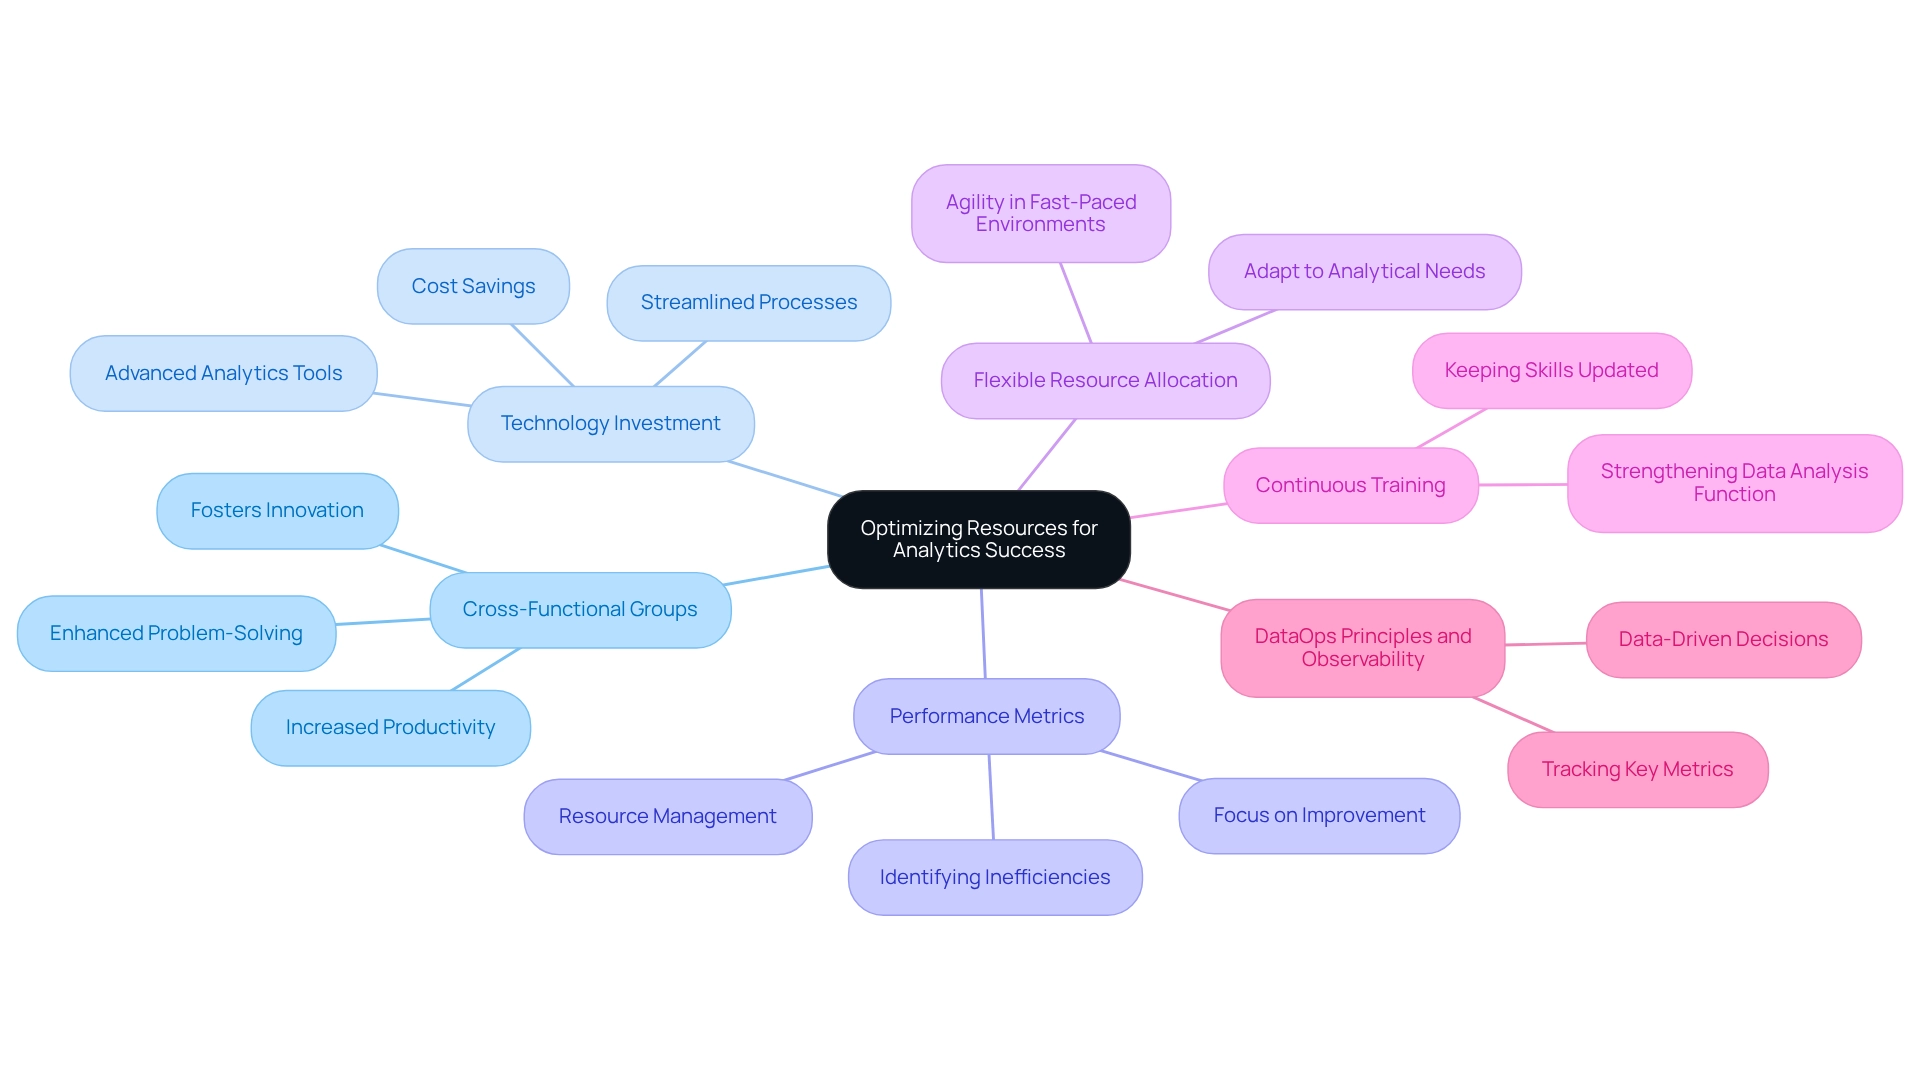
Fostering Knowledge Sharing and Collaboration
Fostering knowledge sharing and collaboration within a Center of Excellence (CoE) is crucial for enhancing overall effectiveness. The primary purpose of CoE analytics is to centralize expertise and resources, fostering a data-driven culture and driving strategic decision-making. Implementing targeted strategies can significantly enhance group performance and drive better outcomes.
Key strategies include:
-
Regular Workshops: Organizing interactive workshops, like those conducted by Sebastian Rusdorf from Creatum GmbH, promotes participants to share insights and best practices while fostering a culture of continuous learning. These sessions can be customized to tackle specific challenges encountered by the group, ensuring that knowledge is pertinent and practical. By focusing on method-based approaches, these workshops can yield tangible results in marine solutions and beyond.
-
Collaborative Tools: The adoption of advanced collaboration tools and platforms is essential for facilitating seamless communication and information sharing among group members. Tools such as shared dashboards and project management software enable real-time updates and foster a more integrated approach to analytics.
-
Mentorship Programs: Establishing mentorship programs that pair experienced analysts with newcomers is a powerful way to promote knowledge transfer. This relationship not only speeds up the onboarding process for new members but also enhances the overall skill set of the data analysis group, resulting in improved performance.
-
Recognition Programs: Implementing recognition and reward systems for collaborative efforts can significantly enhance teamwork. Recognizing contributions promotes a positive atmosphere where group members feel appreciated and inspired to participate in knowledge sharing.
-
Cross-Departmental Projects: Promoting initiatives that engage various departments enhances the comprehension of data applications throughout the company. This collaborative approach not only enhances the skill set of individual team members but also promotes a unified vision for data-driven decision-making.
As noted by Arif Abdelwhab Ali, the lack of knowledge sharing practices and the eminent loss of technical knowledge within the oil and gas industry create significant challenges for practitioners. By prioritizing these strategies, entities can create a robust framework for knowledge sharing within their CoE analytics, ultimately driving strategic decision-making and fostering a data-driven culture. Moreover, entities that swiftly deploy top talent for critical initiatives are more likely to deliver shareholder value, highlighting the significance of efficient collaboration and knowledge exchange. A recent study involving 203 responses from the oil and gas industry highlights the critical need for structured approaches to overcome common obstacles in establishing a CoE Analytics.
Additionally, leveraging technologies such as Robotic Process Automation (RPA) and tailored AI solutions can enhance operational efficiency and support informed decision-making, further driving business growth.
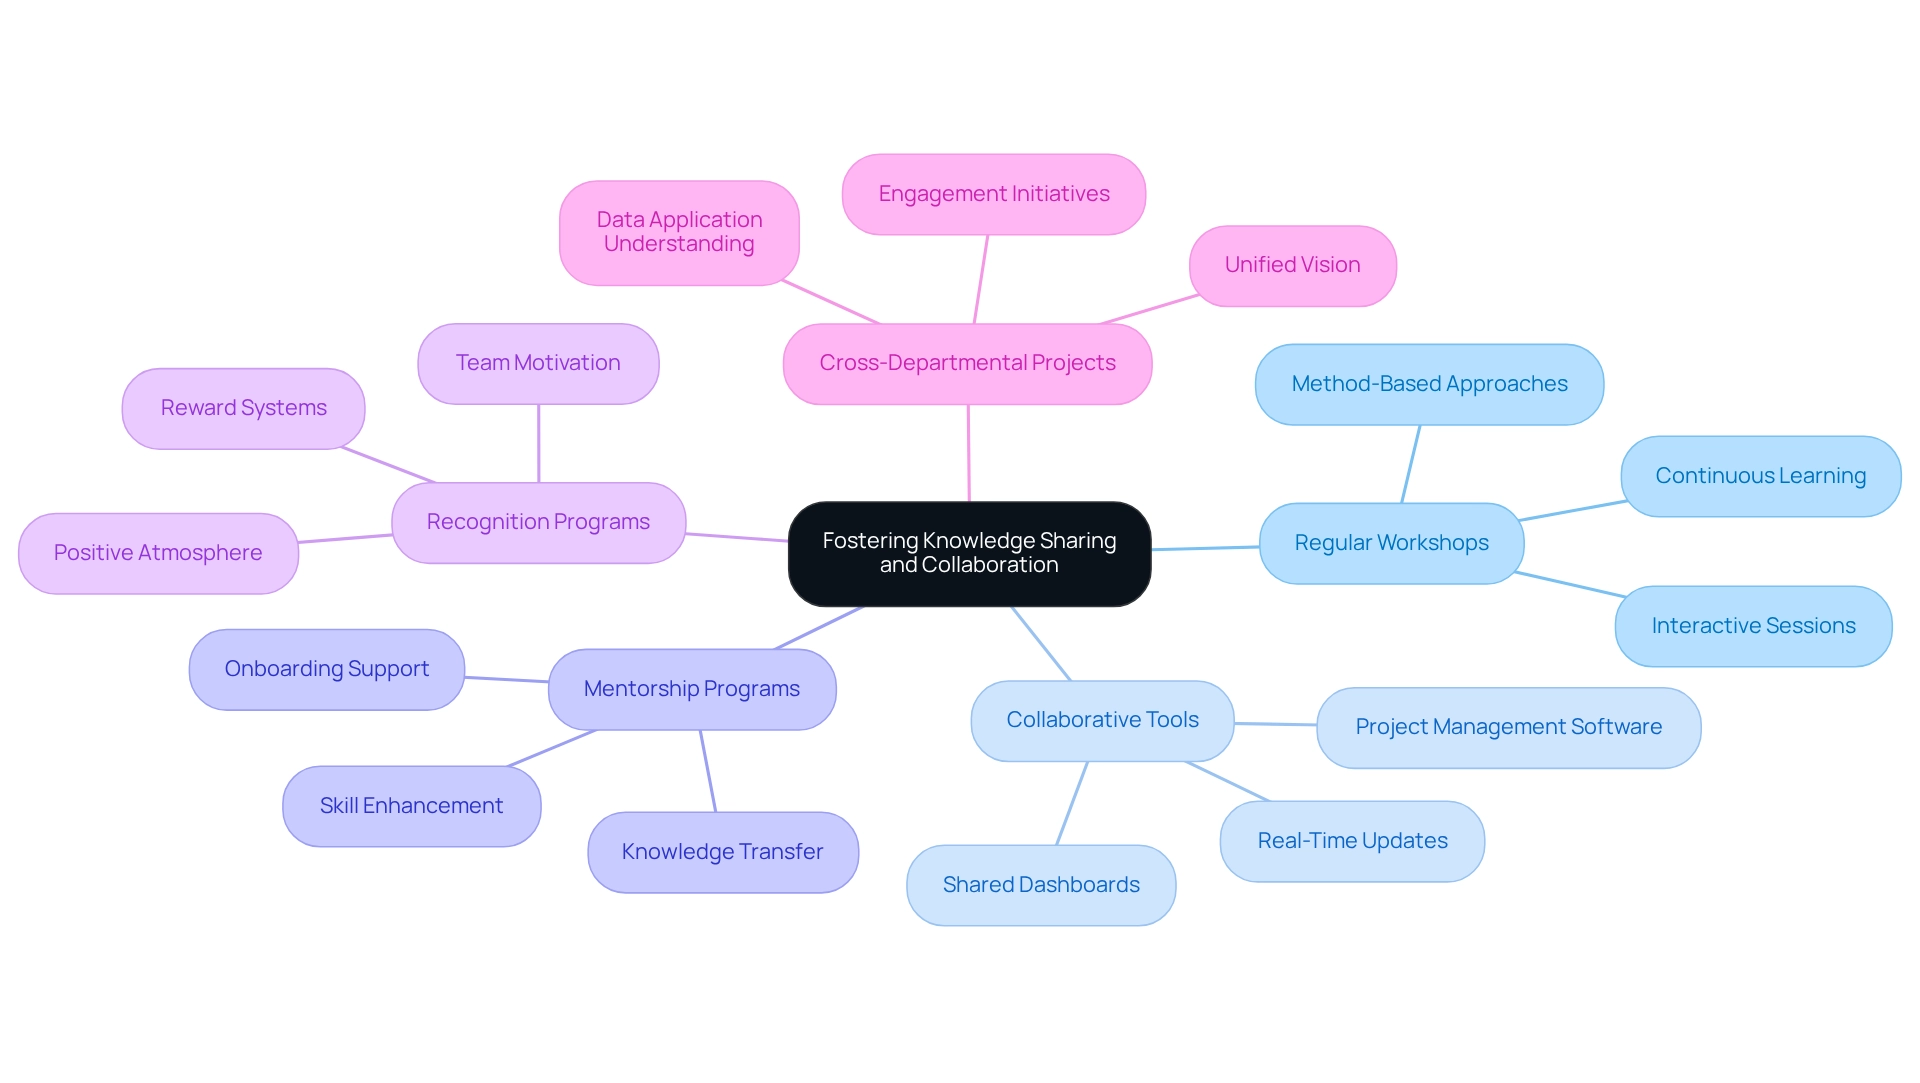
Driving Continuous Innovation in Analytics
Driving continuous innovation in coe analytics necessitates a proactive exploration of emerging methodologies and technologies. Key practices that entities can adopt include experimentation, feedback loops, collaborations, innovation labs, and regular reviews.
Experimentation is crucial. Fostering a culture of experimentation empowers teams to explore new tools and techniques, essential for driving innovation. As organizations embrace this mindset, they can uncover innovative solutions that enhance their coe analytics capabilities. Industry leaders emphasize that coe analytics and experimentation are vital for achieving success in data analysis. Gartner forecasts that by the end of the year, 60% of the information utilized by AI and data analysis solutions will be synthetic data.
Feedback loops are equally important. Establishing robust feedback loops allows teams to learn from previous projects, refining their approaches. This iterative process not only enhances outcomes but also cultivates a learning environment that values insights gained from coe analytics and past experiences.
Collaborations with external specialists and institutions can introduce fresh perspectives and creative concepts into data practices. For instance, the partnership between Planet Fitness and Coherent Solutions demonstrates how leveraging coe analytics can lead to a deeper understanding of customer behavior, ultimately enhancing service personalization and satisfaction.
Innovation labs play a pivotal role. Creating dedicated spaces for innovation encourages creative thinking and problem-solving. These labs serve as incubators for new ideas, enabling teams to experiment with coe analytics without the constraints of traditional workflows.
Regular reviews of data strategies are necessary to ensure alignment with organizational goals and responsiveness to market trends. This practice is essential in a rapidly evolving landscape, where coe analytics can enhance adaptability and significantly impact success. Additionally, recognizing that manual, repetitive tasks can impede operations is crucial. Leveraging Robotic Process Automation (RPA) solutions, such as EMMA RPA and Microsoft Power Automate, can dramatically enhance operational efficiency by automating these tasks, reducing errors, and freeing up resources for more strategic initiatives.
Moreover, the growing significance of cloud computing, particularly through coe analytics, offers enhanced accessibility, scalability, and cost-effectiveness for information processing and storage. This bolsters the methodologies and practices discussed. As companies navigate the complexities of information analysis, adopting coe analytics practices will be vital for sustaining a competitive advantage and fostering enterprise expansion. The emphasis on experimentation, particularly in coe analytics, is underscored by industry leaders who acknowledge its role in fostering innovation and achieving data success. Ultimately, coe analytics will remain a distinguishing factor for companies, driving enterprise growth and providing immediate insights.
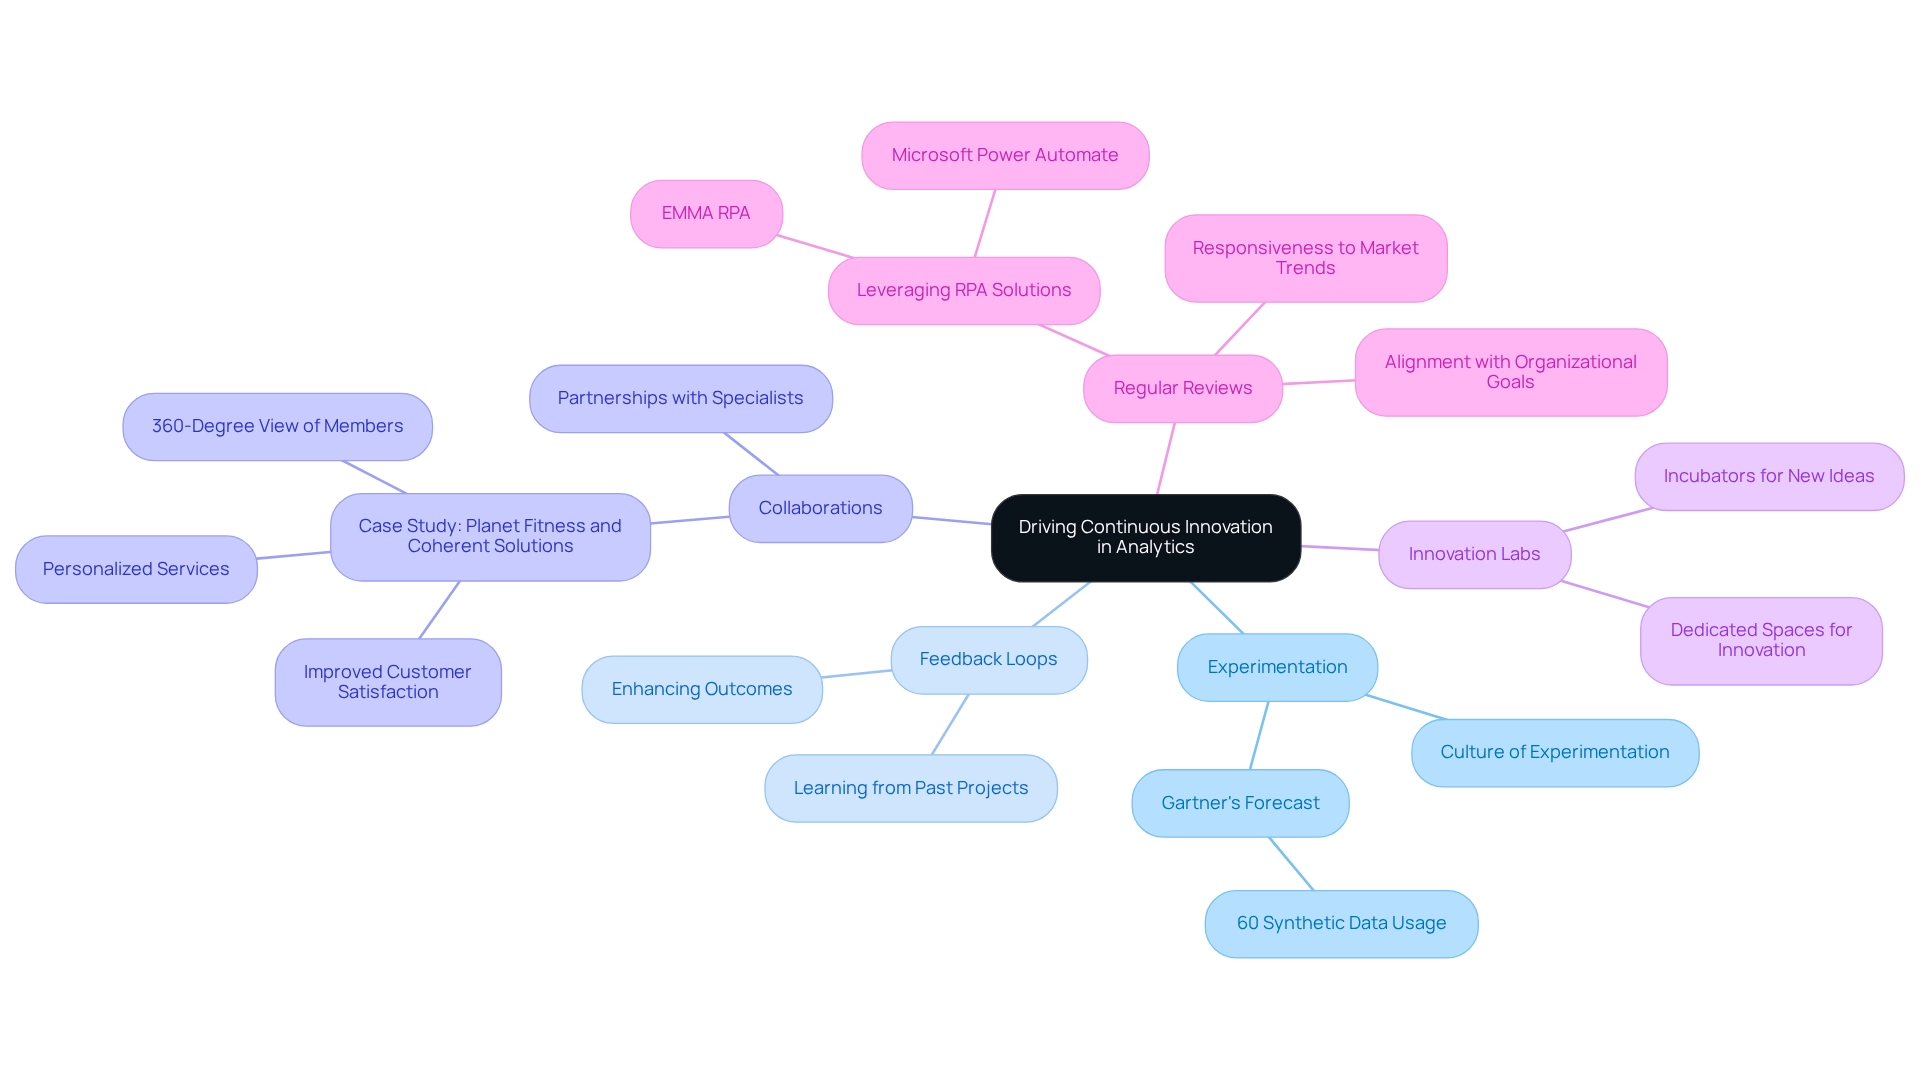
Best Practices for Building a Successful Analytics CoE
Building a successful CoE Analytics Center of Excellence (CoE) requires a strategic approach grounded in best practices that foster engagement and drive results.
- Define Clear Objectives: Establishing specific, measurable objectives is crucial for aligning the CoE’s initiatives with the broader organizational goals. This clarity helps in prioritizing efforts and measuring success effectively.
For instance, organizations can set clear marketing goals and align them with relevant metrics, tracking key performance indicators to measure progress and effectiveness. Utilizing Business Intelligence tools can convert raw information into actionable insights, facilitating informed decision-making that propels growth and innovation.
- Engage Stakeholders: Active participation of key stakeholders from the outset is crucial for obtaining buy-in and support for data initiatives.
In 2025, entities that emphasize stakeholder involvement are likely to experience increased collaboration and trust in information, resulting in better decision-making and operational effectiveness. As stated by MicroStrategy, merely 3% of employees could access the information necessary for business decisions in seconds, while 60% required hours or days, highlighting the necessity for effective analytics and the role of RPA in optimizing workflows. Creatum GmbH can assist organizations in overcoming these challenges by implementing customized RPA solutions that improve information accessibility and operational efficiency.
-
Invest in Training: Ongoing training for group members is essential to improve their analytical skills and keep them informed of the latest industry trends. This investment not only boosts individual capabilities but also strengthens the overall effectiveness of the CoE Analytics. Customizing AI solutions, like Small Language Models and GenAI Workshops, can further enhance information quality and enable teams to utilize AI effectively.
-
Establish Governance: Implementing robust governance frameworks is necessary to ensure information quality and compliance with relevant regulations. Robust governance practices assist in reducing risks linked to information management and improve the trustworthiness of analytical results. Addressing data inconsistency and governance challenges is essential for enhanced decision-making and operational efficiency.
-
Measure Success: Regularly assessing the CoE’s impact on business outcomes is critical for demonstrating its value. By monitoring essential performance metrics and aligning them with organizational goals, leaders can obtain continuous backing and resources for data initiatives. A successful CoE Analytics can lead to better decision-making, lower expenses, and improved collaboration among departments, ultimately fostering growth and innovation.
Integrating these best practices can greatly improve the efficiency of a data Center of Excellence. For instance, organizations that have successfully implemented these strategies report greater trust in their data and improved collaboration across departments, leading to a more competitive edge in the market. Additionally, utilizing Enhanced Ecommerce can help identify areas for improvement and optimize the online shopping experience, further aligning with the theme of operational efficiency.
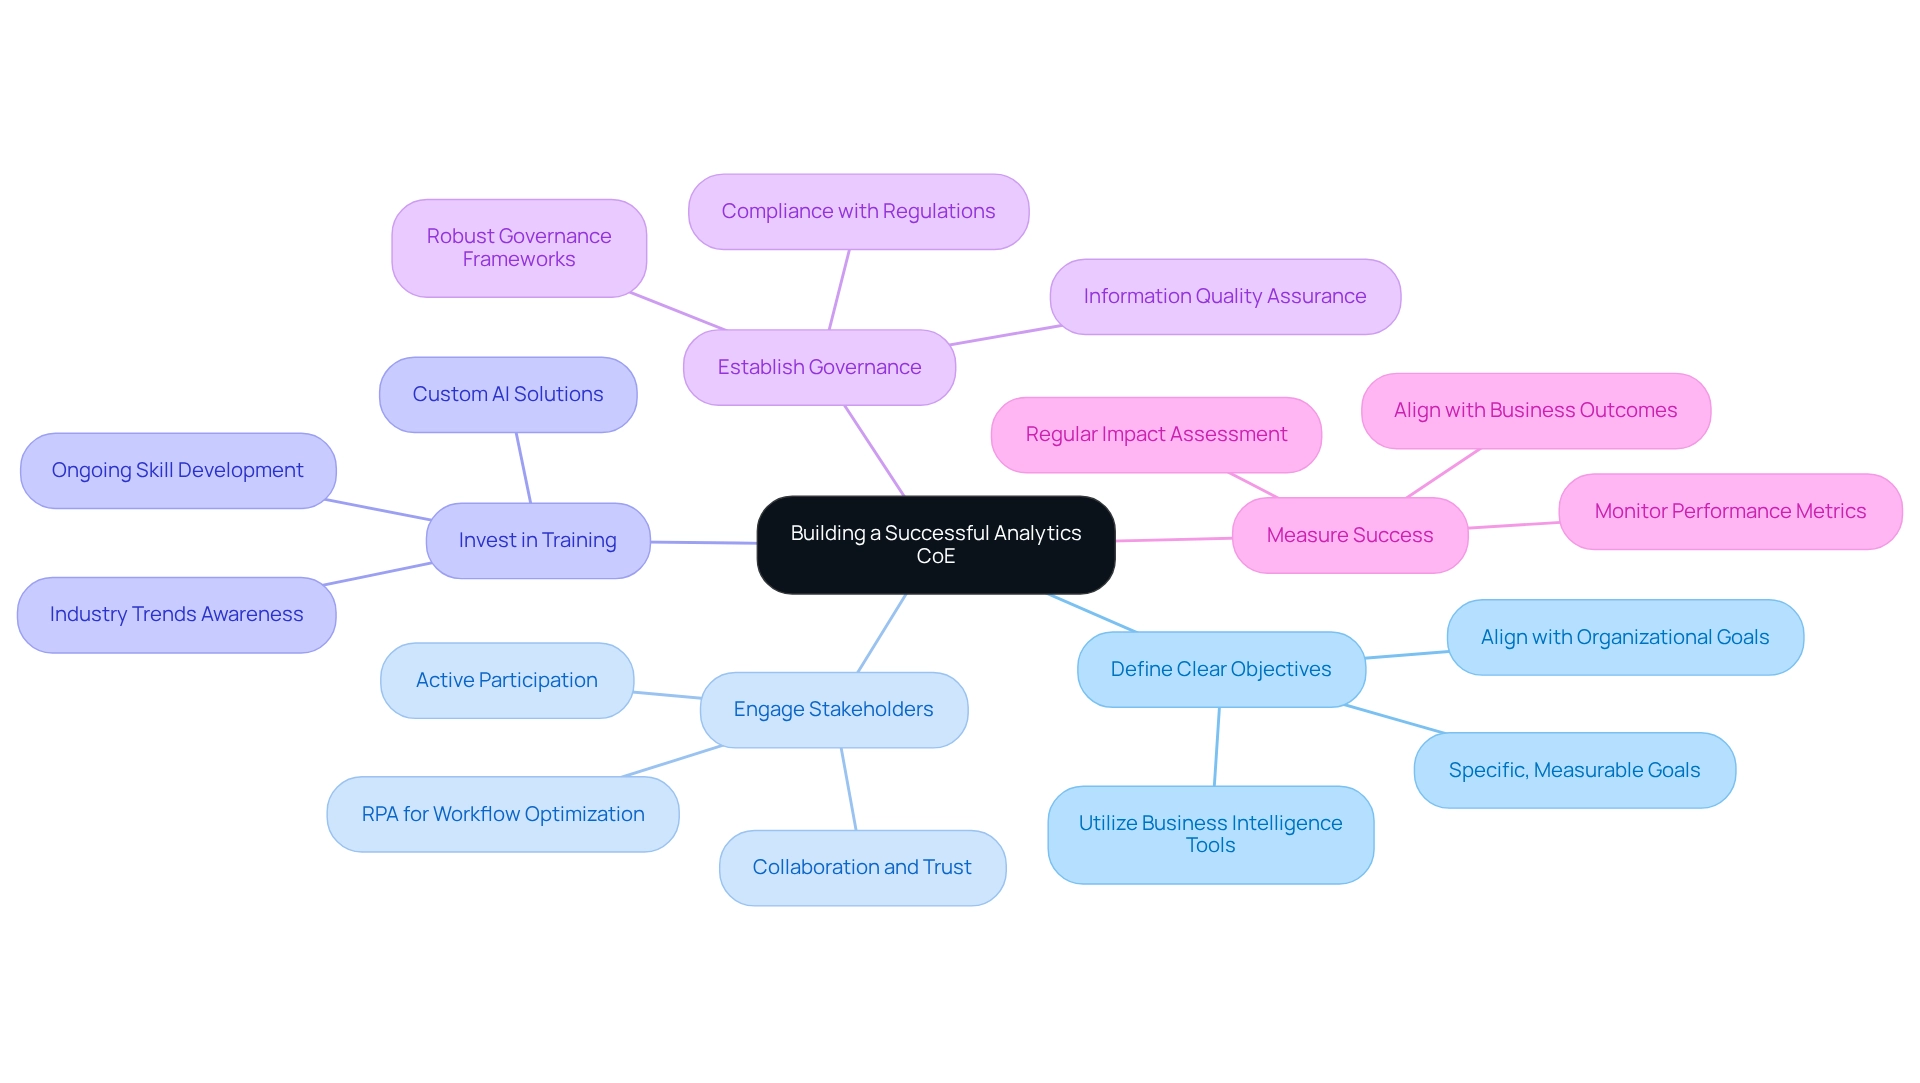
Measuring ROI and Realizing Benefits from Analytics
Measuring ROI and realizing benefits from analytics initiatives involves several critical steps that can significantly enhance operational efficiency and drive business success.
-
Define Metrics: Establishing clear and relevant metrics for success is essential. This process not only measures the effect of coe analytics efforts but also aligns them with organizational objectives. Companies that define specific KPIs, such as customer acquisition costs or revenue growth rates, can better assess the effectiveness of their analytics initiatives. The effectiveness of a company’s information strategy is reflected in its positive financial impact, including cost reductions and wider profit margins. Incorporating Robotic Process Automation (RPA) from Creatum GmbH into this process can further simplify the definition of these metrics by automating information collection and analysis, thus minimizing errors and liberating team resources for more strategic tasks.
-
Track Performance: Regularly monitoring performance against these defined metrics allows organizations to assess the effectiveness of their data initiatives. Employing coe analytics through cloud-based information analysis platforms provides scalability and adaptability for handling increasing volumes, ensuring that performance monitoring remains strong and informative. RPA can improve this tracking by automating the information retrieval process, allowing teams to concentrate on analysis rather than information collection.
-
Communicate Results: Effectively conveying the outcomes of data projects to stakeholders is crucial for securing ongoing support and funding. Clarity in reporting fosters trust and emphasizes the positive financial effects of a well-executed information strategy. As mentioned by the Svitla Team, “Reach out to discover more about our method for strategic collaboration and ways we could assist your business in strategizing and obtaining ROI from analytics.” Leveraging RPA can also facilitate more timely and accurate reporting, ensuring stakeholders receive the insights they need promptly.
-
Adjust Strategies: Leveraging insights gained from performance tracking to refine strategies is vital for continuous improvement. Organizations that adapt their approaches based on data-driven insights can enhance their operational efficiency and better meet their objectives. RPA can play a key role here by automating the analysis of performance information, allowing for quicker adjustments to strategies based on real-time insights.
-
Benchmarking: Comparing performance against industry standards aids entities in identifying areas for enhancement and innovation. Retailers such as Amazon and Best Buy have effectively employed information analysis to tackle fraud by concentrating on KPIs like chargeback rates and order approval rates. This case study illustrates how tracking these specific metrics leads to faster fraud detection and minimizes the impact of fraudulent activities. By incorporating RPA from Creatum GmbH into benchmarking processes, companies can automate the comparison of their metrics against industry standards, leading to more efficient identification of improvement areas.
By adhering to these steps and utilizing RPA from Creatum GmbH, organizations can effectively measure the ROI from their data initiatives, ensuring that they not only track performance metrics but also employ coe analytics to convert information into actionable insights that promote growth and innovation.
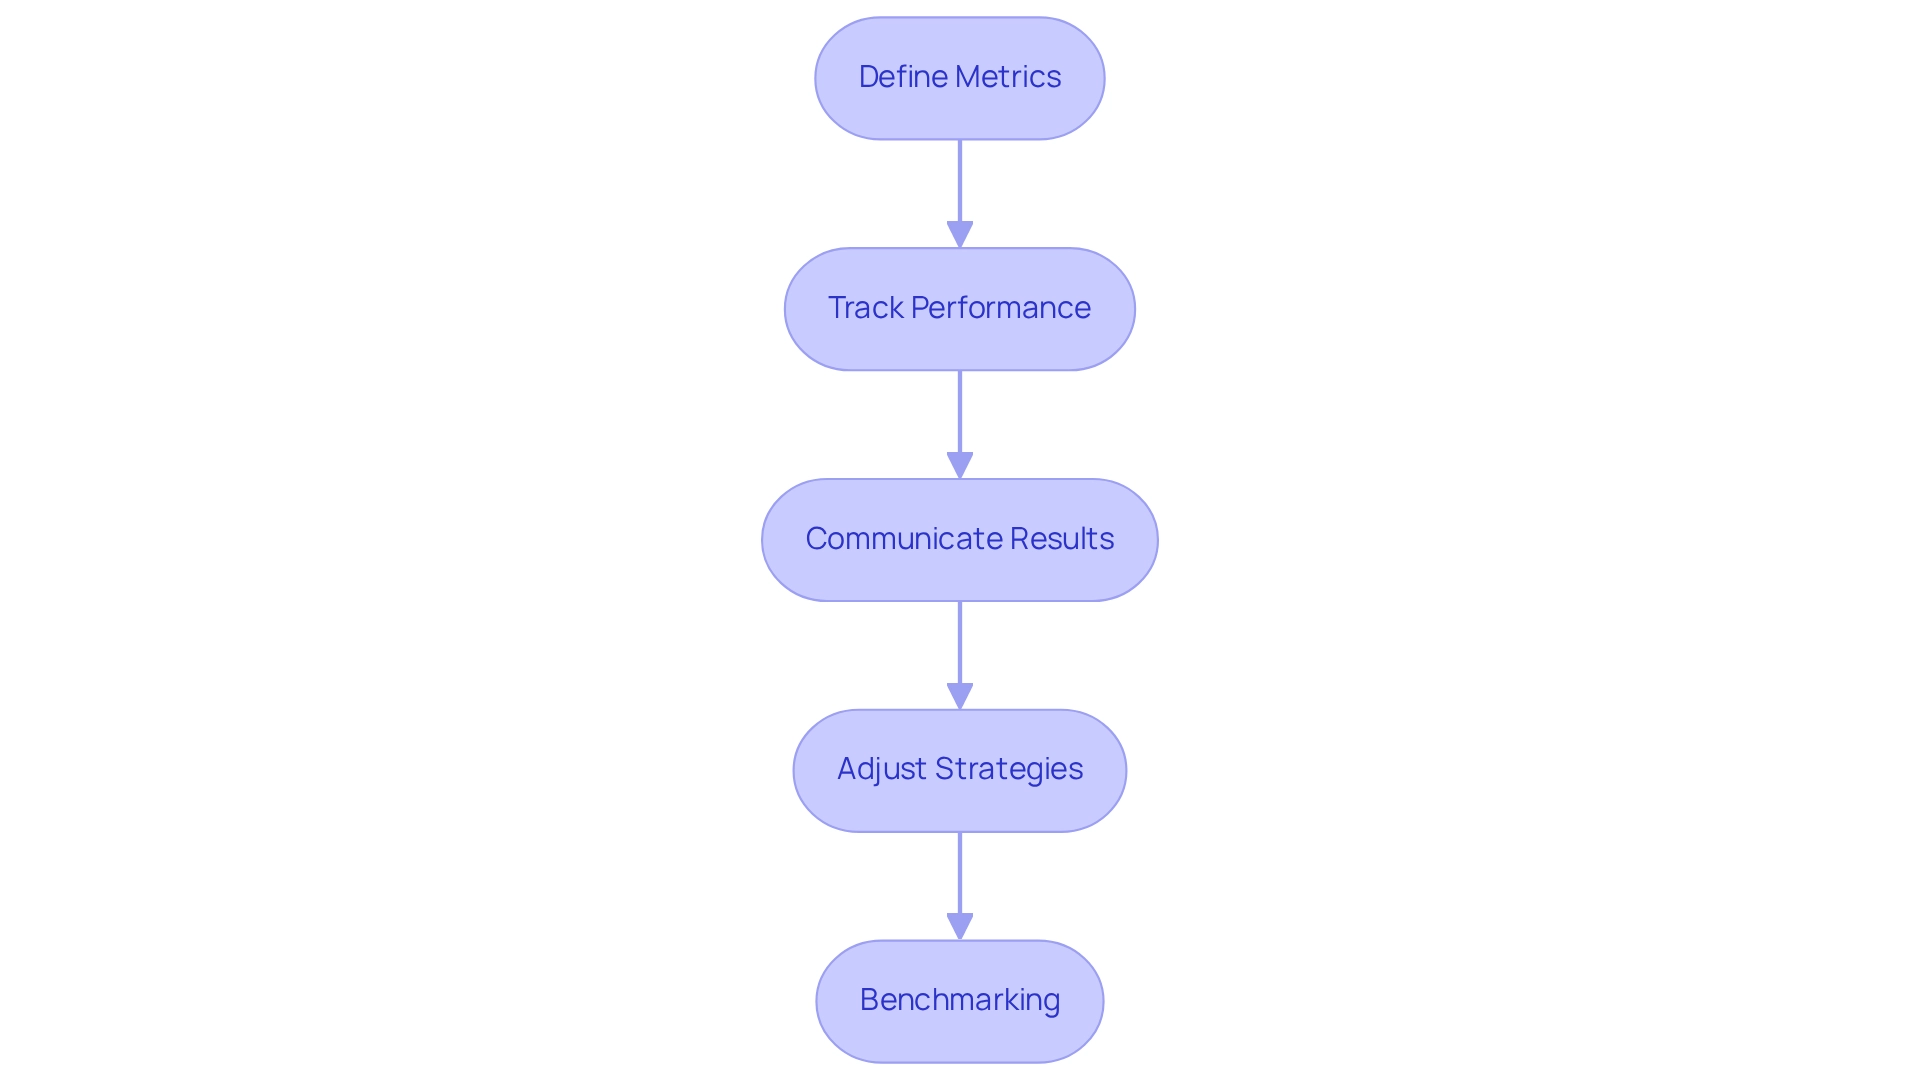
Methodologies and Best Practices for Effective Analytics
Utilizing effective methodologies and best practices in coe analytics is crucial for attaining optimal results in 2025 and beyond. Key methodologies include:
-
Agile Analytics: Embracing agile methodologies fosters flexibility and rapid iteration in analytics projects, allowing teams to adapt quickly to changing requirements. This method has been demonstrated to enhance project success rates, with companies reporting a 30% improvement in delivery timelines when agile practices are adopted.
-
Data-Informed Decision Making: Fostering a culture of data-informed decision-making guarantees that insights are effectively leveraged throughout the entity. Companies that prioritize data-driven strategies are 5 times more likely to make faster decisions than their competitors, leading to enhanced operational efficiency and strategic alignment. Hypothesis testing in statistical analysis plays a crucial role here, as it helps confirm or reject business assumptions about customer preferences, further enhancing decision-making processes.
-
Predictive Analytics: The implementation of predictive analytics empowers organizations to anticipate future trends and make proactive decisions. By utilizing historical information, businesses can predict customer behavior and market changes, leading to a 20% rise in revenue for those who effectively employ these insights.
-
Information Visualization: Employing information visualization methods greatly improves the accessibility and understanding of intricate sets of information. Effective visualizations can improve stakeholder engagement and facilitate quicker decision-making, as they transform raw data into intuitive formats that highlight key insights.
-
Continuous Improvement: Establishing a framework for ongoing enhancement ensures that data processes evolve in response to changing business needs. Organizations that embrace a mindset of continuous improvement in their data practices report a 15% increase in overall performance metrics, demonstrating the value of adaptability in data analysis.
Furthermore, comprehending the two primary forms of statistical analysis—descriptive and inferential—is essential for effective analytical methods. A recent case study on common statistical errors in biomedical research emphasizes the significance of utilizing suitable tests for information types and avoiding misinterpretation of results. This underscores the need for proper training or consultation to improve the quality of statistical analyses.
As Dr. Prabhaker Mishra notes, “proper consultation from statistical experts may be an alternative option and can reduce the burden from the clinicians to go in depth of statistics which required lots of time and effort and ultimately affect their clinical works.” Integrating these methodologies not only simplifies coe analytics processes but also fosters innovation and growth. For example, a recent case study emphasized how a healthcare entity enhanced its patient results by utilizing agile analysis to improve its information gathering and reporting methods, ultimately resulting in more informed clinical decisions.
As industry leaders highlight, the integration of agile analytical methodologies, alongside Robotic Process Automation (RPA) solutions like EMMA RPA and Microsoft Power Automate, is essential for organizations seeking to excel in a data-rich environment while tackling issues such as poor master data quality and obstacles to AI adoption. RPA not only automates manual workflows but also enhances efficiency and reduces errors, making it an essential component of modern analytics strategies.
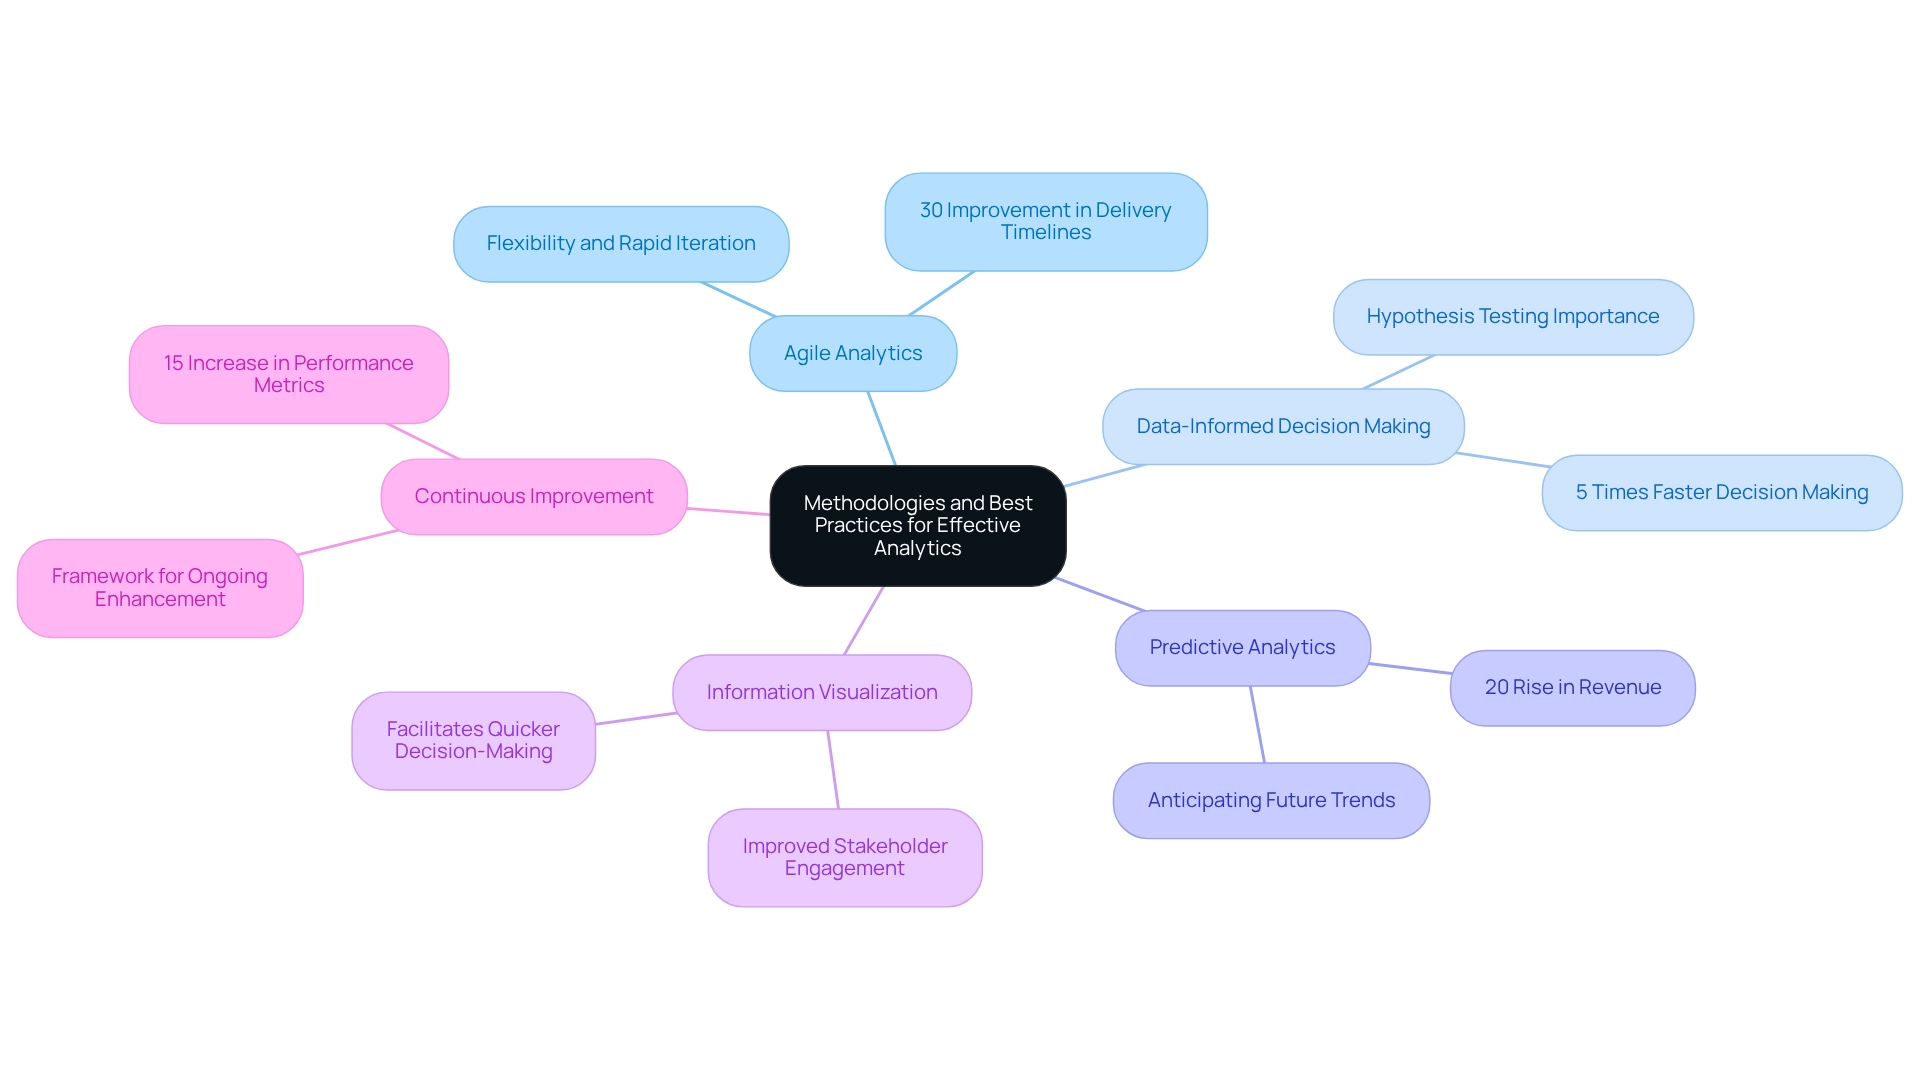
Conclusion
Establishing a Center of Excellence (CoE) in analytics represents a transformative step for organizations aiming to fully leverage their data assets. By centralizing expertise and resources, a CoE fosters a culture of collaboration and innovation. This enables businesses to align their analytics efforts with strategic objectives. Essential components contributing to the success of a high-performing analytics CoE include:
- Leadership support
- A skilled team
- Clear objectives
- A robust technological infrastructure
To effectively harness the power of data, organizations must prioritize data quality and governance. This ensures that comprehensive policies are in place to maintain reliability and compliance. Regular audits and training initiatives are critical for sustaining high standards and fostering a data-driven culture. Additionally, optimizing resources through cross-functional teams and investing in advanced analytics tools can significantly enhance productivity and operational efficiency.
Driving continuous innovation is equally vital. By embracing experimentation and establishing feedback loops, organizations can refine their analytics methodologies and adapt to evolving market demands. The integration of emerging technologies, such as Robotic Process Automation (RPA), not only streamlines workflows but also empowers teams to focus on strategic initiatives rather than repetitive tasks.
Ultimately, the journey toward a successful analytics CoE is marked by a commitment to best practices, continuous learning, and a focus on measurable outcomes. By implementing these strategies, organizations can unlock the full potential of their data, driving informed decision-making and fostering sustainable growth in a competitive landscape. The future of analytics lies in embracing these principles, ensuring that data becomes a pivotal driver of innovation and success.
Frequently Asked Questions
What is a Center of Excellence (CoE) in data analysis?
A Center of Excellence (CoE) in data analysis, known as coe analytics, is a centralized hub that consolidates expertise, resources, and best practices to enhance an organization’s analytical capabilities. It fosters teamwork and strategic alignment among scientists, analysts, and business stakeholders to advance information initiatives aligned with organizational objectives.
Why is creating a CoE particularly advantageous in today’s information-rich landscape?
Creating a CoE is advantageous because organizations face the challenge of transforming vast quantities of information into actionable insights. CoE analytics helps standardize practices and enhance information analysis capabilities, positioning organizations to harness insights for competitive advantage.
What role does leadership support play in the success of a CoE?
Strong backing from senior management is vital for securing necessary resources and fostering a culture of data-driven decision-making. Research indicates that organizations with strong leadership backing for data initiatives can achieve a 25% improvement in overall results.
What are the essential components of a high-performing data analysis CoE?
Essential components include leadership support, an experienced group, clear objectives, a collaboration framework, and a robust technology infrastructure. Each component contributes to driving the success of the CoE.
How does integrating Robotic Process Automation (RPA) benefit a CoE?
Integrating RPA within a CoE streamlines manual workflows, enhances operational efficiency, and allows teams to focus on strategic initiatives by reducing time spent on repetitive tasks, leading to improved productivity and accuracy.
What strategies are important for ensuring information quality and governance in a CoE?
Key strategies include appointing information stewards, conducting regular audits, implementing standardization, providing training, and establishing feedback mechanisms to enhance accountability and maintain high-quality information.
How can organizations measure the success of their CoE analytics initiatives?
Organizations can measure success by evaluating the quality of information through key metrics and KPIs, as well as assessing improvements in decision-making speed and operational efficiency as a result of effective analytics practices.
What is the significance of continuous education for leadership in a CoE?
Continuous education is essential for leadership development as it provides leaders with updated knowledge and skills necessary for effective decision-making and innovation, ultimately enhancing the results of data initiatives.