Introduction
In a world where data is the new currency, mastering Power BI can be the key to unlocking unprecedented insights and driving operational success. As organizations strive to harness the power of business intelligence, the ability to visualize and share data effectively becomes paramount.
With the social business intelligence market projected to soar, understanding the intricacies of Power BI—from its essential components to advanced data modeling techniques—can empower teams to make informed decisions that propel growth.
However, many face hurdles such as:
- Time-consuming report generation
- Data inconsistencies that can stifle innovation
By embracing RPA solutions and leveraging the full capabilities of Power BI, organizations can transform their data landscape, streamline processes, and foster a culture of collaboration that ultimately leads to enhanced efficiency and success.
This article delves into the essential skills and strategies needed to navigate Power BI, ensuring that users are equipped to turn challenges into opportunities for impactful data storytelling.
Getting Started with Power BI: An Overview
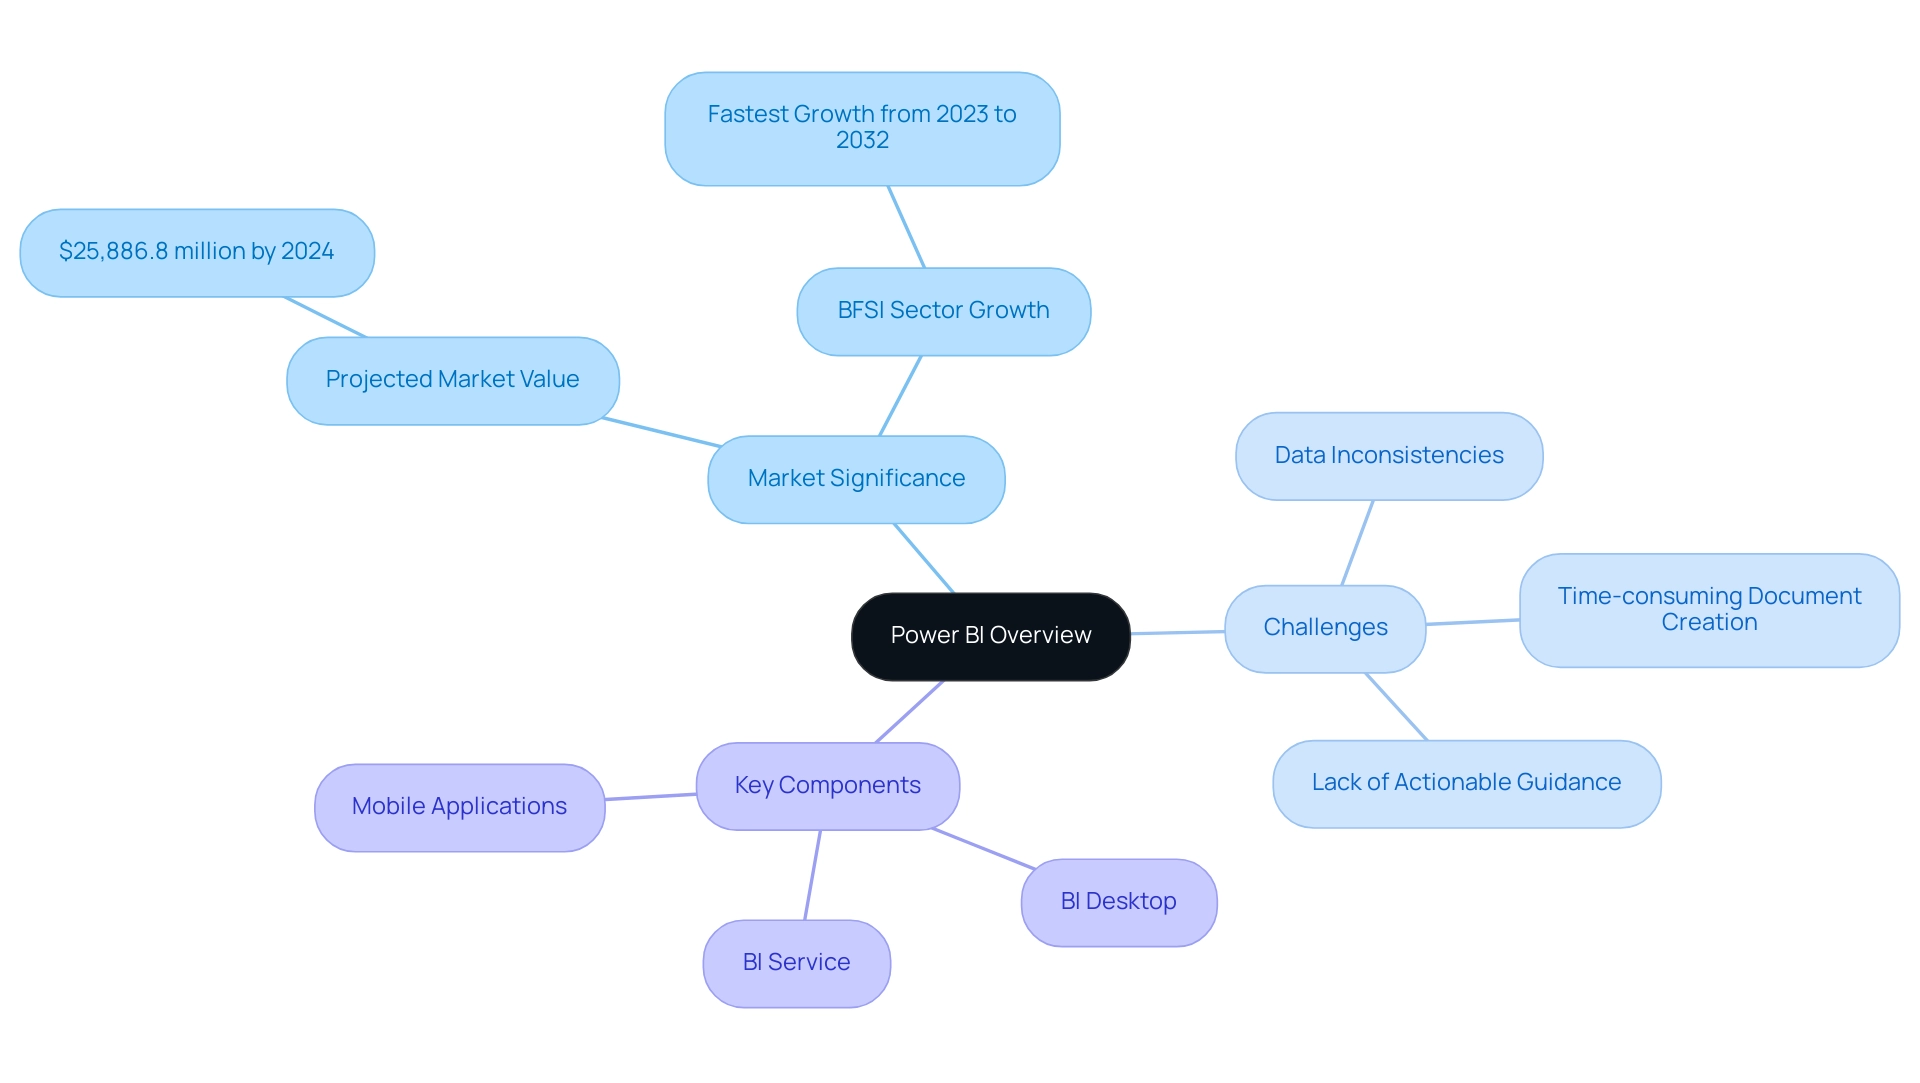
This software, created by Microsoft, stands out as a strong business analytics tool that enables organizations to visualize their information and share insights throughout their teams. In a time when the social business intelligence market is anticipated to attain an impressive $25,886.8 million by 2024, the significance of effective information utilization cannot be overstated. As highlighted by Inkwood Research, the BFSI (Banking, Financial Services, and Insurance) sector is expected to experience rapid growth, driven by the consistent implementation of BI technologies that enhance operational efficiency.
However, many organizations encounter difficulties in utilizing insights from BI dashboards, including:
- Time-consuming document creation
- Data inconsistencies
- A lack of actionable guidance
For those new to BI, participating in a power bi introduction training to familiarize yourself with its interface is crucial. The platform comprises several key components:
- BI Desktop for report creation
- The BI Service for sharing and collaboration
- Mobile applications that enable users to access reports on-the-go
This foundational understanding of BI’s components will enable you to navigate the platform with confidence and overcome the hurdles of outdated tools and fear of new technology adoption. By mastering BI and integrating RPA solutions like EMMA RPA, which automates repetitive tasks, and Automate, which streamlines operations, you position yourself at the forefront of this evolving market. These tools not only enhance operational efficiency but also address task repetition fatigue and staffing shortages, driving data-driven insights that fuel business growth and innovation.
Essential Skills for Beginners: Data Visualization and Reporting in Power BI
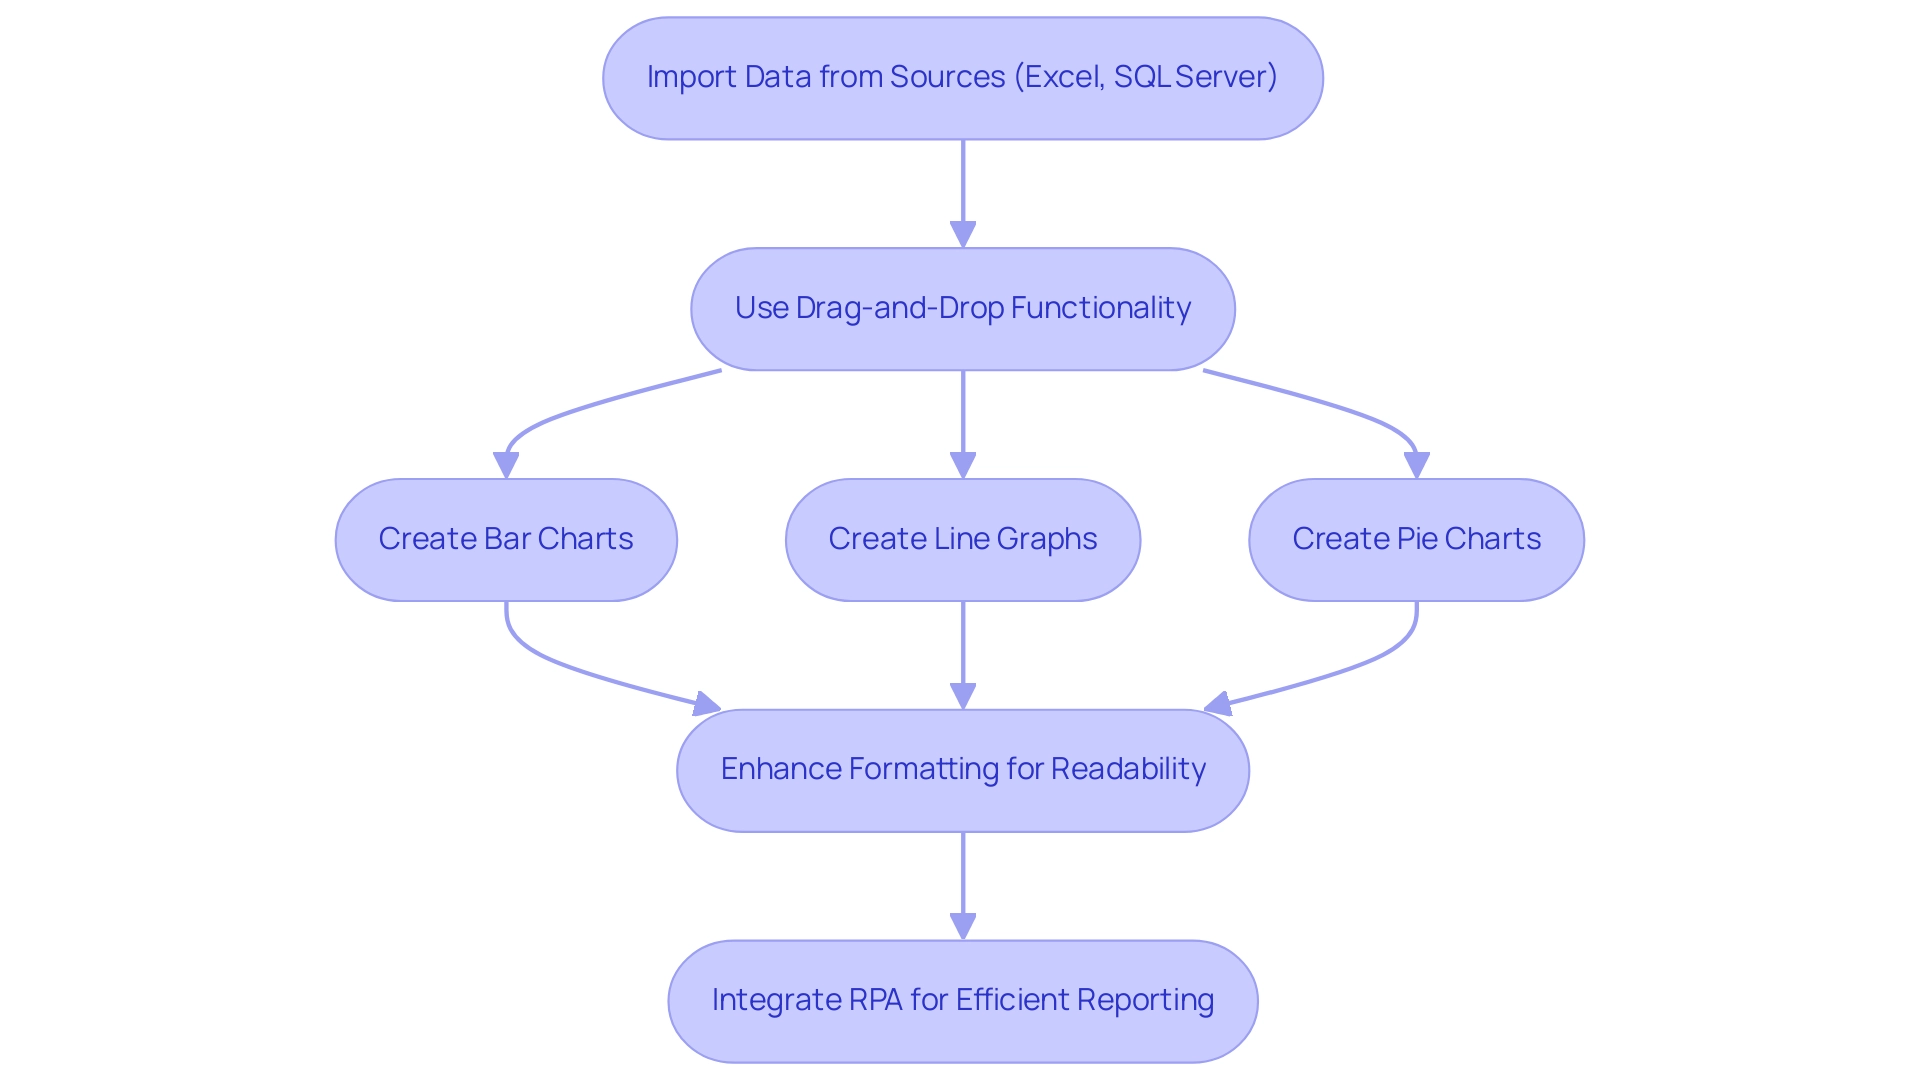
For newcomers aiming to excel in visualization using BI tools, a Power BI introduction training is essential to cultivate a range of fundamental skills that will allow you to produce engaging charts, graphs, and dashboards. Start by importing information from diverse sources such as Excel and SQL Server into Power BI Desktop. Once your information is successfully loaded, leverage the intuitive drag-and-drop functionality to craft visual representations of it.
Get acquainted with different visual types:
– Employ bar charts for straightforward comparisons
– Use line graphs to demonstrate trends over time
– Utilize pie charts to represent proportional information effectively
Pay careful attention to the formatting options available; this will significantly enhance the readability and impact of your visualizations. The increasing enthusiasm for visualization tools is clear, as the search volume for ‘Tableau Public’ has risen by over 80% in the last five years, highlighting the significance of mastering platforms such as BI.
Key sectors such as finance, healthcare, retail, manufacturing, and transportation are increasingly utilizing large-scale information. However, numerous organizations encounter difficulties in utilizing insights from BI dashboards, including time-consuming creation of documents and inconsistencies in information. Integrating RPA solutions like EMMA RPA and Automate can streamline these processes, allowing for more efficient reporting and enhanced operational efficiency.
Thus, comprehending how to efficiently present and visualize information through Power BI introduction training can enable you to create meaningful documents that not only communicate your information narrative but also foster informed decision-making within your organization, ultimately improving operational efficiency through effective BI and RPA strategies.
Exploring Power BI’s Data Modeling Capabilities
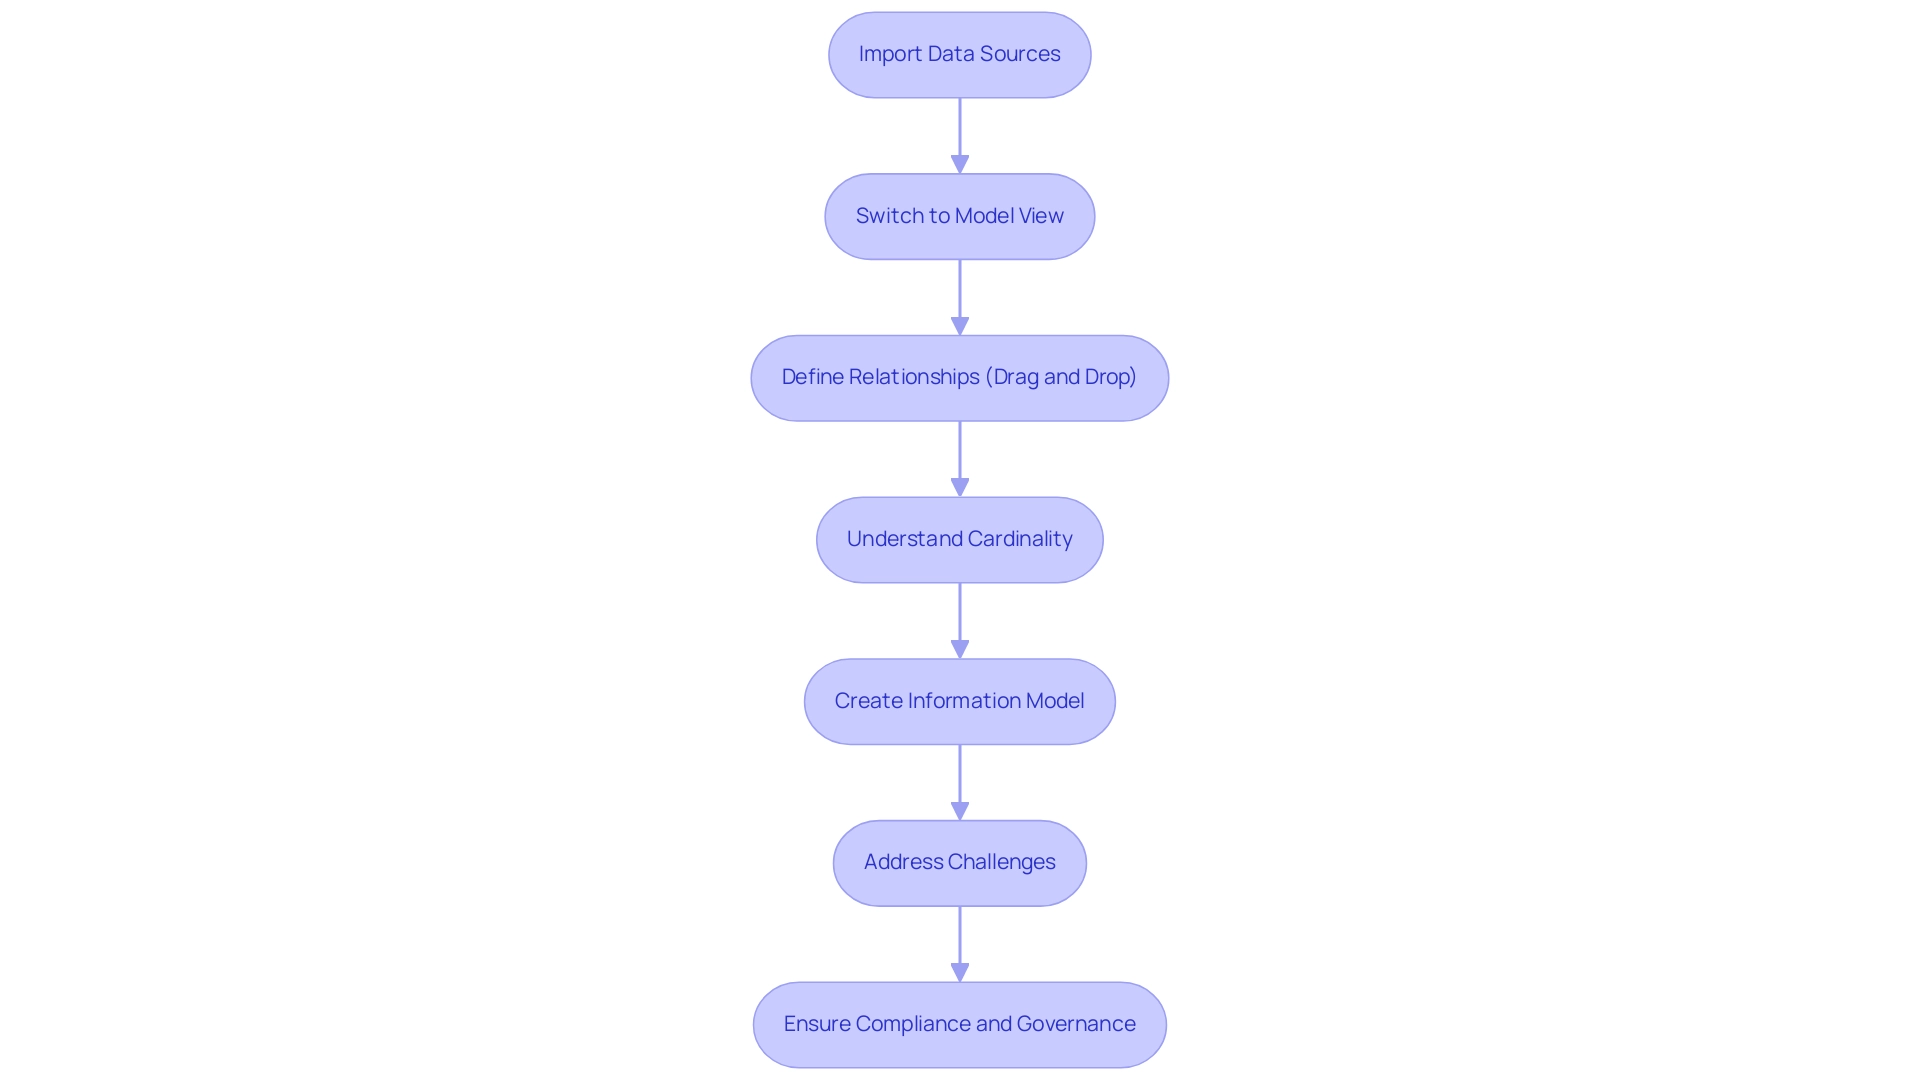
Efficient information modeling in BI is a crucial element for creating insightful reports, as it entails establishing connections among various tables. To start, import all pertinent information sources into BI and switch to the ‘Model’ view in BI Desktop. From there, you can easily define relationships by dragging and dropping fields between tables.
A thorough understanding of cardinality—whether one-to-one or one-to-many—is essential for accurately setting up these relationships. As Juan Sequeda, a principal scientist and head of the AI Lab at data.world, notes,
Knowledge graphs simplify complex concepts at one glance by giving rich, meaningful context and connections between datasets.
This emphasizes the significance of a well-organized information model; without it, organizations risk creating systems that fail to meet customer needs.
In today’s data-rich environment, struggling to extract meaningful insights can leave your business at a competitive disadvantage. Utilizing the capabilities of Business Intelligence and RPA solutions, like EMMA RPA and Power Automate, can convert raw information into actionable insights, facilitating informed decision-making that promotes growth and innovation. For instance, the network information model represents information in a complex network-like structure, allowing multiple parent-child relationships, often used for modeling intricate information relationships.
By investing time in creating a solid information model, you can ensure that your visualizations yield precise and meaningful insights, ultimately facilitating more informed decision-making. Recent statistics indicate that 55% of data engineers face challenges when incorporating various formats into cohesive models, underscoring the necessity of robust connections in BI. Additionally, organizations face challenges like task repetition fatigue and staffing shortages, which RPA solutions can effectively address by automating repetitive tasks and streamlining operations.
Furthermore, as we approach 2024, the importance of information governance and ethical information handling practices becomes increasingly vital, shaping the landscape of modeling in BI and ensuring systems are constructed with compliance and responsibility in mind.
Creating Interactive Dashboards
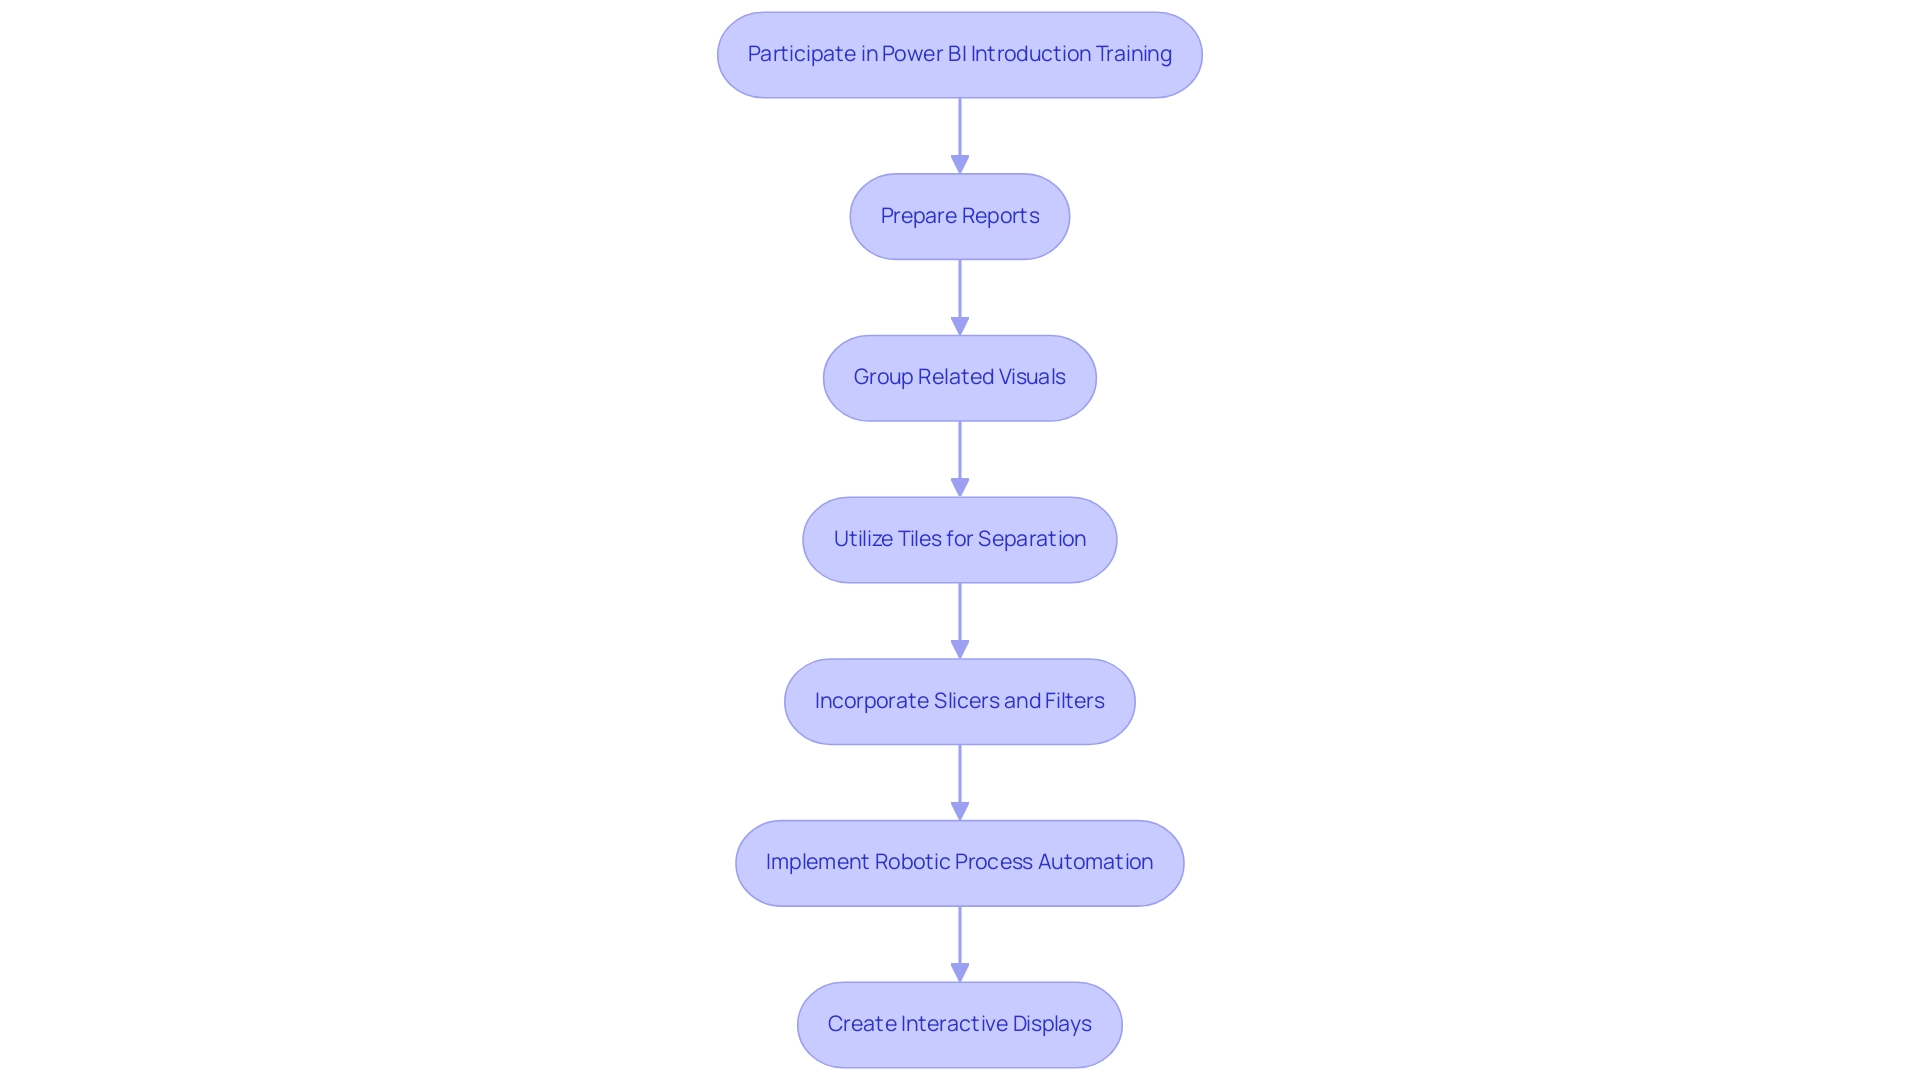
Participating in power bi introduction training enables you to create interactive displays in Power BI, providing a powerful way to convey your insights effectively. However, challenges such as time-consuming document creation and information inconsistencies can hinder the process of extracting actionable insights. To overcome these hurdles, once your reports are prepared, you can easily attach visualizations to a panel by selecting the pin icon on the desired visuals and choosing the appropriate panel.
As you create your display, prioritize a thoughtful layout by:
- Grouping related visuals
- Utilizing tiles to distinctly separate various information categories
This approach not only enhances clarity but also ensures that the dashboard remains relevant to different user roles, spotlighting the metrics that matter most. To encourage interactivity, utilize features such as slicers and filters, allowing users to examine the information in greater depth.
Furthermore, incorporating Robotic Process Automation (RPA) can simplify repetitive tasks linked to preparation, significantly decreasing the time required for report generation and minimizing inconsistencies. As highlighted by ThoughtSpot, ‘AI-Powered Analytics allows everyone to create personalized insights to drive decisions and take action.’ A well-structured interface, combined with RPA, can convert intricate information into easily understandable insights, aiding informed decision-making for stakeholders at a glance.
In 2024, the emphasis on interactive displays will be crucial as organizations transition from data secrecy to a culture of openness, enhancing collaboration across all business functions. Moreover, companies implementing the AI TRiSM framework are anticipated to be 50% more successful in adoption, business objectives, and user acceptance by 2026, highlighting the significance of incorporating interactive displays and RPA into business intelligence strategies. By adopting these best practices, you can ensure that your displays, especially during the power bi introduction training, not only convey insights but also drive meaningful actions within your organization.
Sharing and Collaborating in Power BI
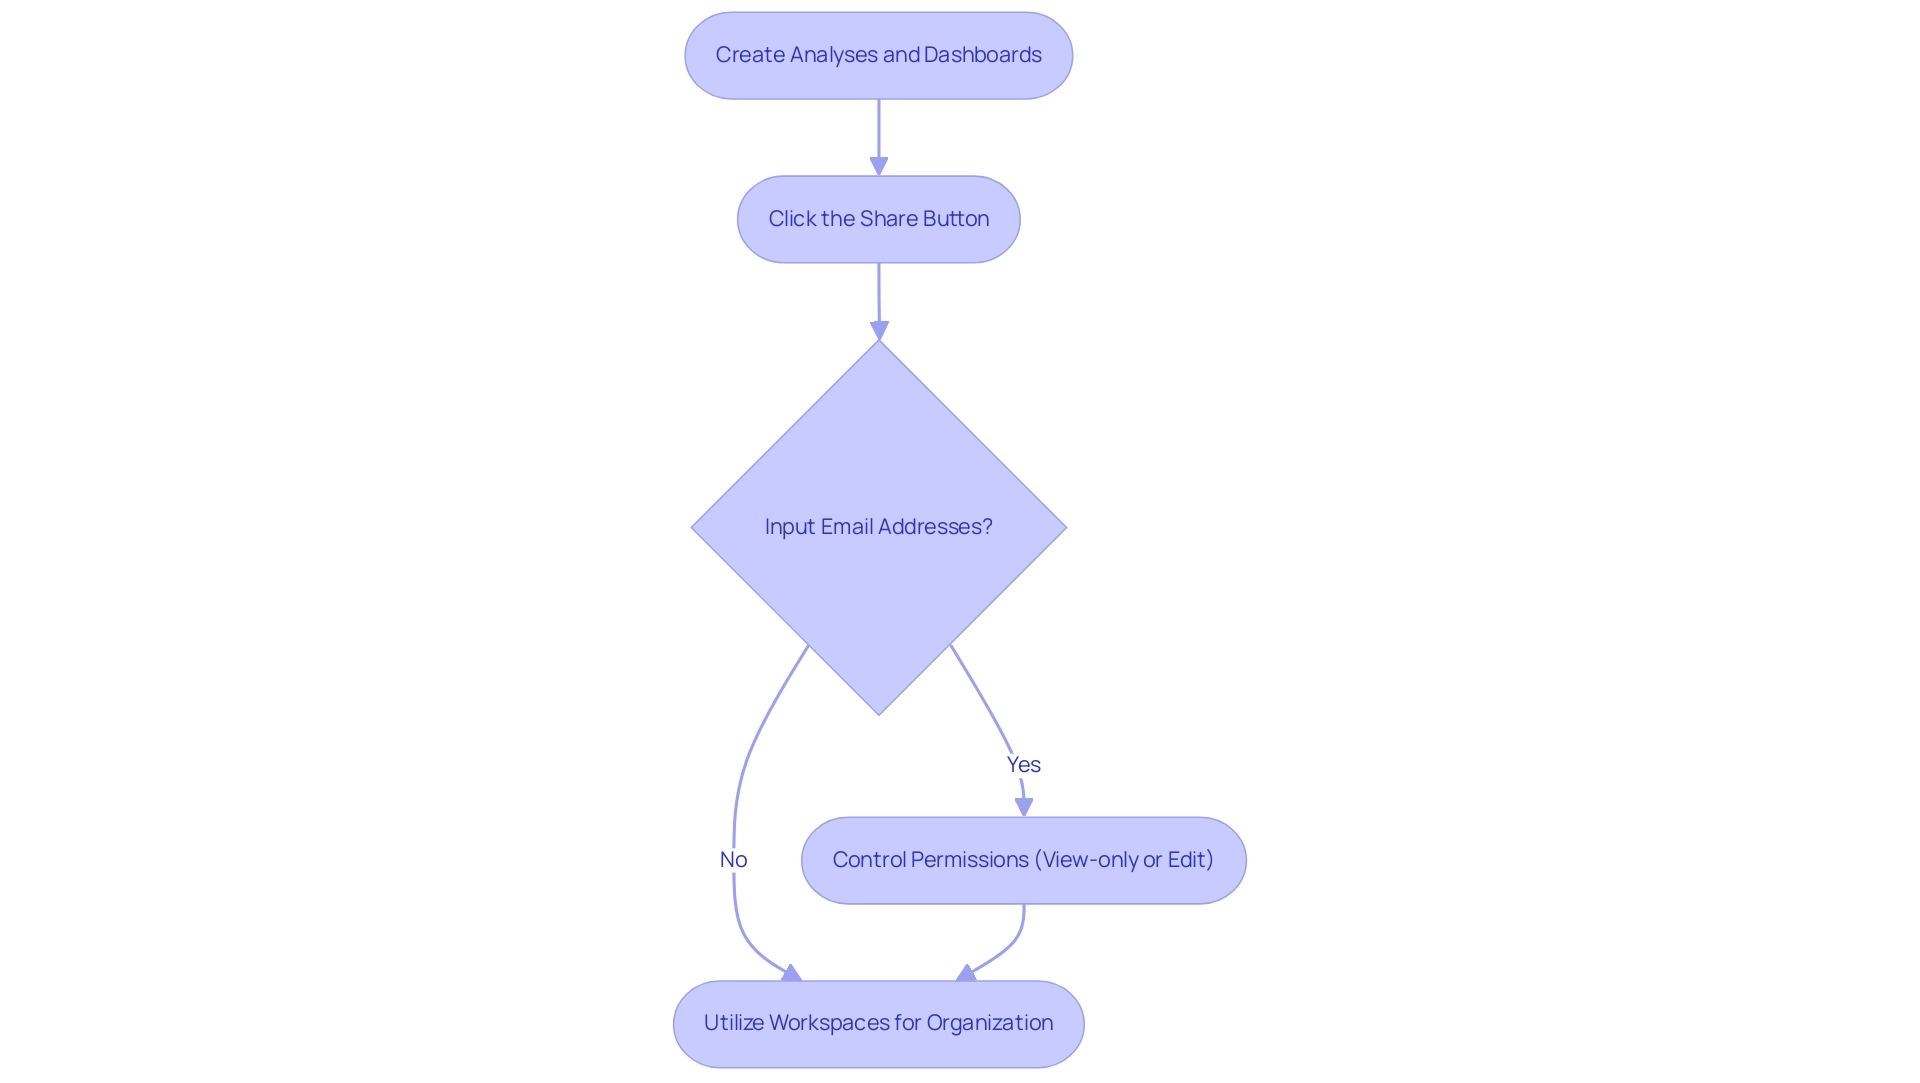
After creating insightful analyses and dashboards in BI, Power BI introduction training is crucial for effective sharing with your team and collaborative decision-making. The process is facilitated seamlessly through the Power BI introduction training. To share a document, simply click the ‘Share’ button located in the view, and input the email addresses of your colleagues.
You are also empowered to control permissions, granting either view-only access or editing rights tailored to your requirements. Utilizing workspaces during your Power BI introduction training can further enhance your workflow by organizing related reports and dashboards, thereby ensuring streamlined collaboration. As Kim Manis, Vice President of Product Management, aptly stated,
Fabric is a complete analytics platform that reshapes how your teams work with information by bringing everyone together with tools for every analytics professional.
Considering that 98% of employees voice dissatisfaction with video meetings held from home, incorporating Power BI introduction training to utilize sharing functionalities becomes even more essential. By fostering a data-driven culture within your organization through Power BI introduction training, you can significantly improve user satisfaction in remote environments, making effective collaboration tools essential. Moreover, for businesses struggling with time-consuming report creation and data inconsistencies, our 3-Day BI Sprint is designed to transform your approach, providing you with a fully functional, professionally designed report on a topic of your choice.
This not only enables actionable insights but also serves as a template for future projects, ensuring a professional design from the start. Microsoft’s recognition as a Leader in the 2024 Gartner Magic Quadrant for Analytics and Business Intelligence Platforms underscores the reliability of BI as a leading solution in this field. For assistance with Power BI, please contact +1 281 899 0865 or email arish.siddiqui@dynamicssquare.com.
Conclusion
Harnessing the full potential of Power BI is essential for organizations seeking to thrive in today’s data-driven landscape. By mastering its key components—from data visualization and reporting to effective data modeling and interactive dashboards—teams can transform raw data into actionable insights that drive informed decision-making. The integration of Robotic Process Automation (RPA) further enhances these capabilities, streamlining processes and alleviating common pain points such as time-consuming report generation and data inconsistencies.
As businesses navigate the complexities of data management, fostering a collaborative culture through effective sharing and communication becomes paramount. Power BI’s capabilities in facilitating teamwork and collaboration empower organizations to break down silos, ensuring that insights are readily accessible and actionable across all levels.
In conclusion, the journey to becoming proficient in Power BI is not just about acquiring technical skills; it’s about embracing a transformative mindset that prioritizes data-driven decision-making. By equipping teams with the right tools and strategies, organizations can turn challenges into opportunities, paving the way for sustained growth and operational excellence. Now is the time to invest in Power BI and RPA solutions to unlock the insights that will drive innovation and success in the future.

