Introduction
In the dynamic landscape of business intelligence, organizations are often faced with the critical decision of selecting the right tools to enhance their data capabilities. Power BI and Tableau emerge as two frontrunners in this arena, each offering unique strengths tailored to different operational needs. As businesses increasingly seek to integrate these platforms with Salesforce, understanding their functionalities becomes paramount.
While Power BI boasts seamless integration with Microsoft applications and user-friendly features, Tableau stands out for its advanced visualization capabilities. However, the journey to effective data utilization is not without its challenges, including:
- Report creation inefficiencies
- Data inconsistencies
This article delves into a comparative overview of Power BI and Tableau, examining their strengths and weaknesses, integration techniques, and the future trends that will shape the BI landscape for Salesforce users. By exploring these elements, organizations can make informed decisions that drive operational efficiency and foster growth in an ever-evolving data environment.
Comparative Overview of Power BI and Tableau for Salesforce Integration
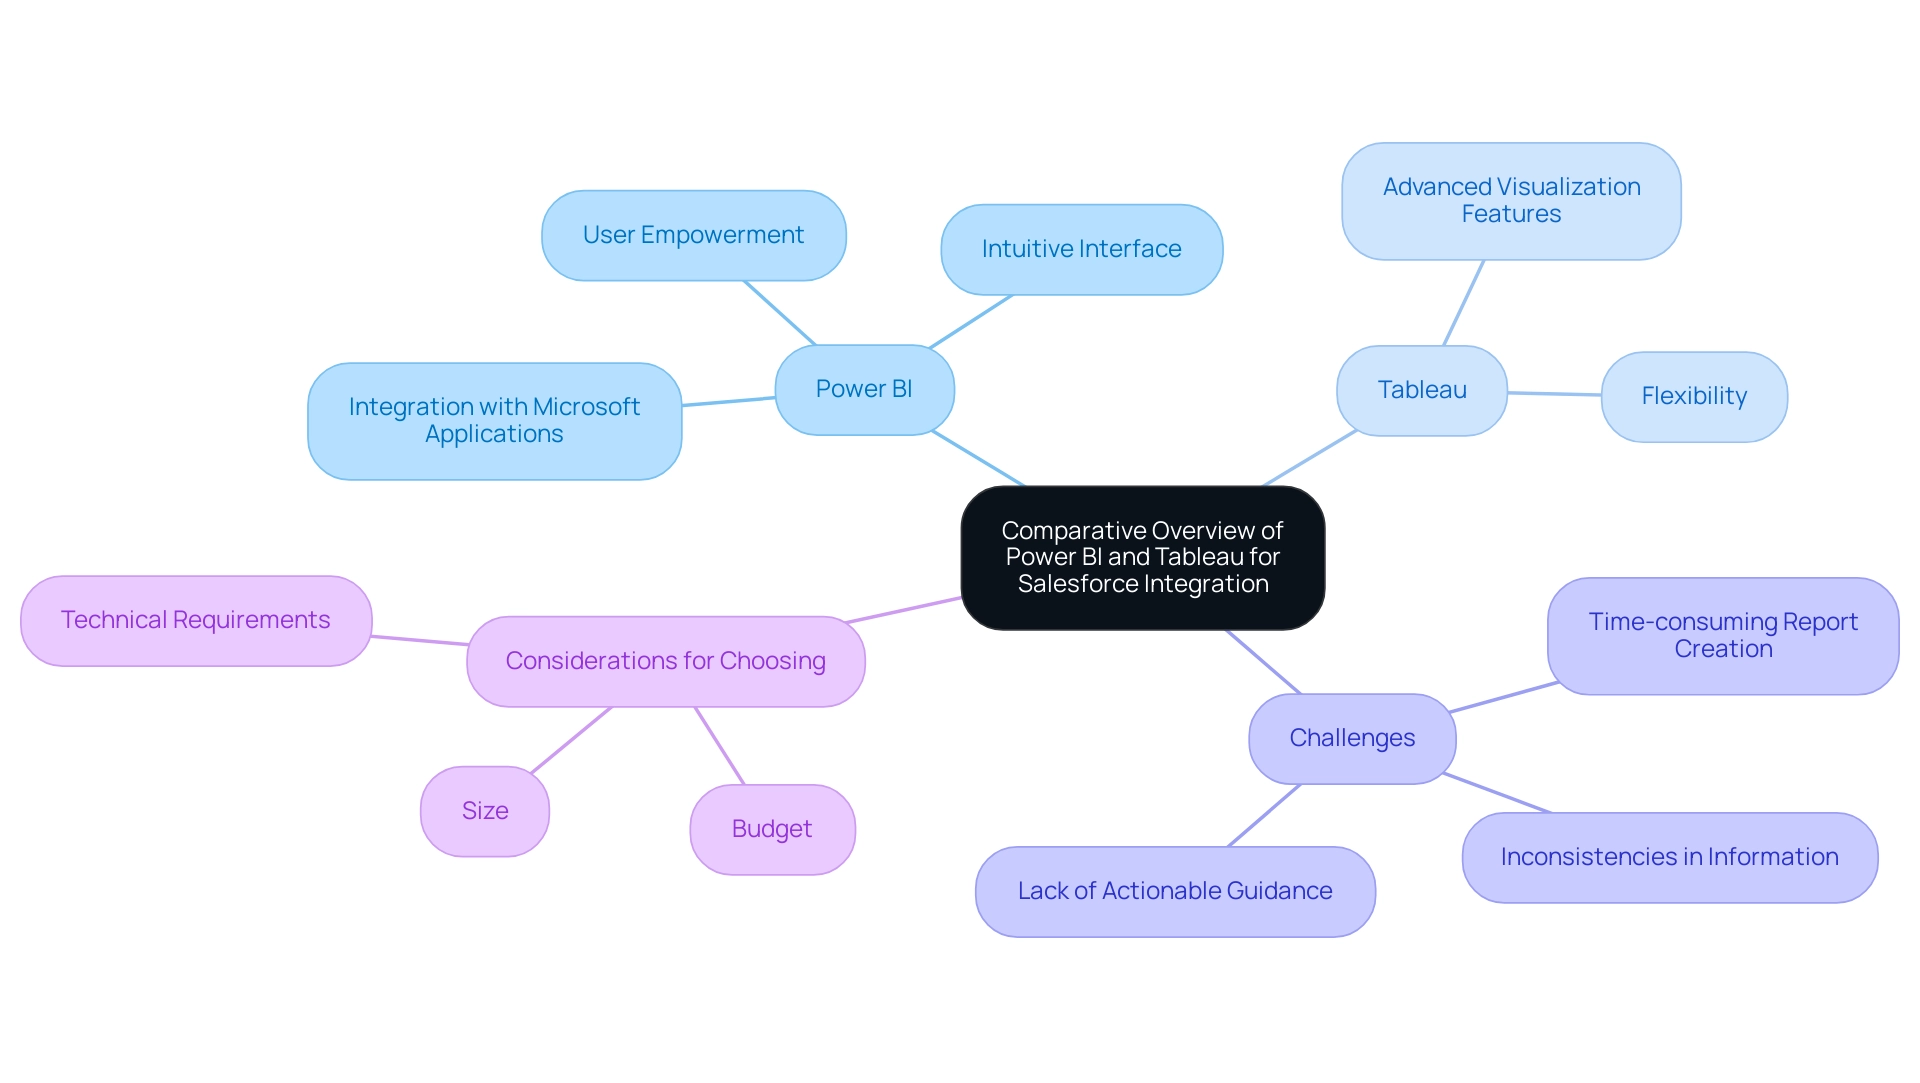
Business Intelligence (BI) tools like Power BI and other platforms are prominent, each designed to address various organizational needs. BI, created by Microsoft, excels in its effortless integration with other Microsoft applications, coupled with an intuitive interface that empowers users with limited technical expertise to harness its capabilities effectively. In contrast, the platform is renowned for its sophisticated visualization features and flexibility, attracting analysts and professionals seeking advanced analytical tools.
When examining Salesforce integration, both Salesforce BI and Tableau provide strong solutions for extracting, analyzing, and visualizing information, yet their methodologies and functionalities distinctly diverge. However, companies frequently encounter challenges in utilizing insights from BI dashboards, including:
- Time-consuming report creation
- Inconsistencies in information
- A lack of actionable guidance
These challenges can impede decision-making and result in a competitive disadvantage. Notably, 88% of organizations using cloud-based BI reported increased flexibility in accessing and analyzing information, highlighting the advantages of utilizing these tools in a cloud environment.
Furthermore, as organizations assess their alternatives, the case study titled ‘Choosing the Right Tool for 2024‘ highlights the significance of factoring in budget, size, and technical requirements when choosing between Tableau and BI. This practical framework is essential as the global information landscape continues to expand, with a staggering 64.2 zettabytes generated in 2020 projected to escalate to 181 zettabytes by 2025. As organizations maneuver through this information flood, harnessing the potential of Business Intelligence alongside RPA solutions such as EMMA RPA and Automate becomes essential for fostering growth and operational efficiency.
These RPA tools automate repetitive tasks, enhance information accuracy, and streamline processes, ultimately empowering businesses to make informed decisions faster. As Tajammul Pangarkar, CMO at Prudour Pvt Ltd, notes, ‘Understanding tech trends is crucial for leveraging the right tools in business intelligence.’ To explore how these tools can transform your operations, book a free consultation today.
Strengths and Weaknesses of Power BI and Tableau in Salesforce Context
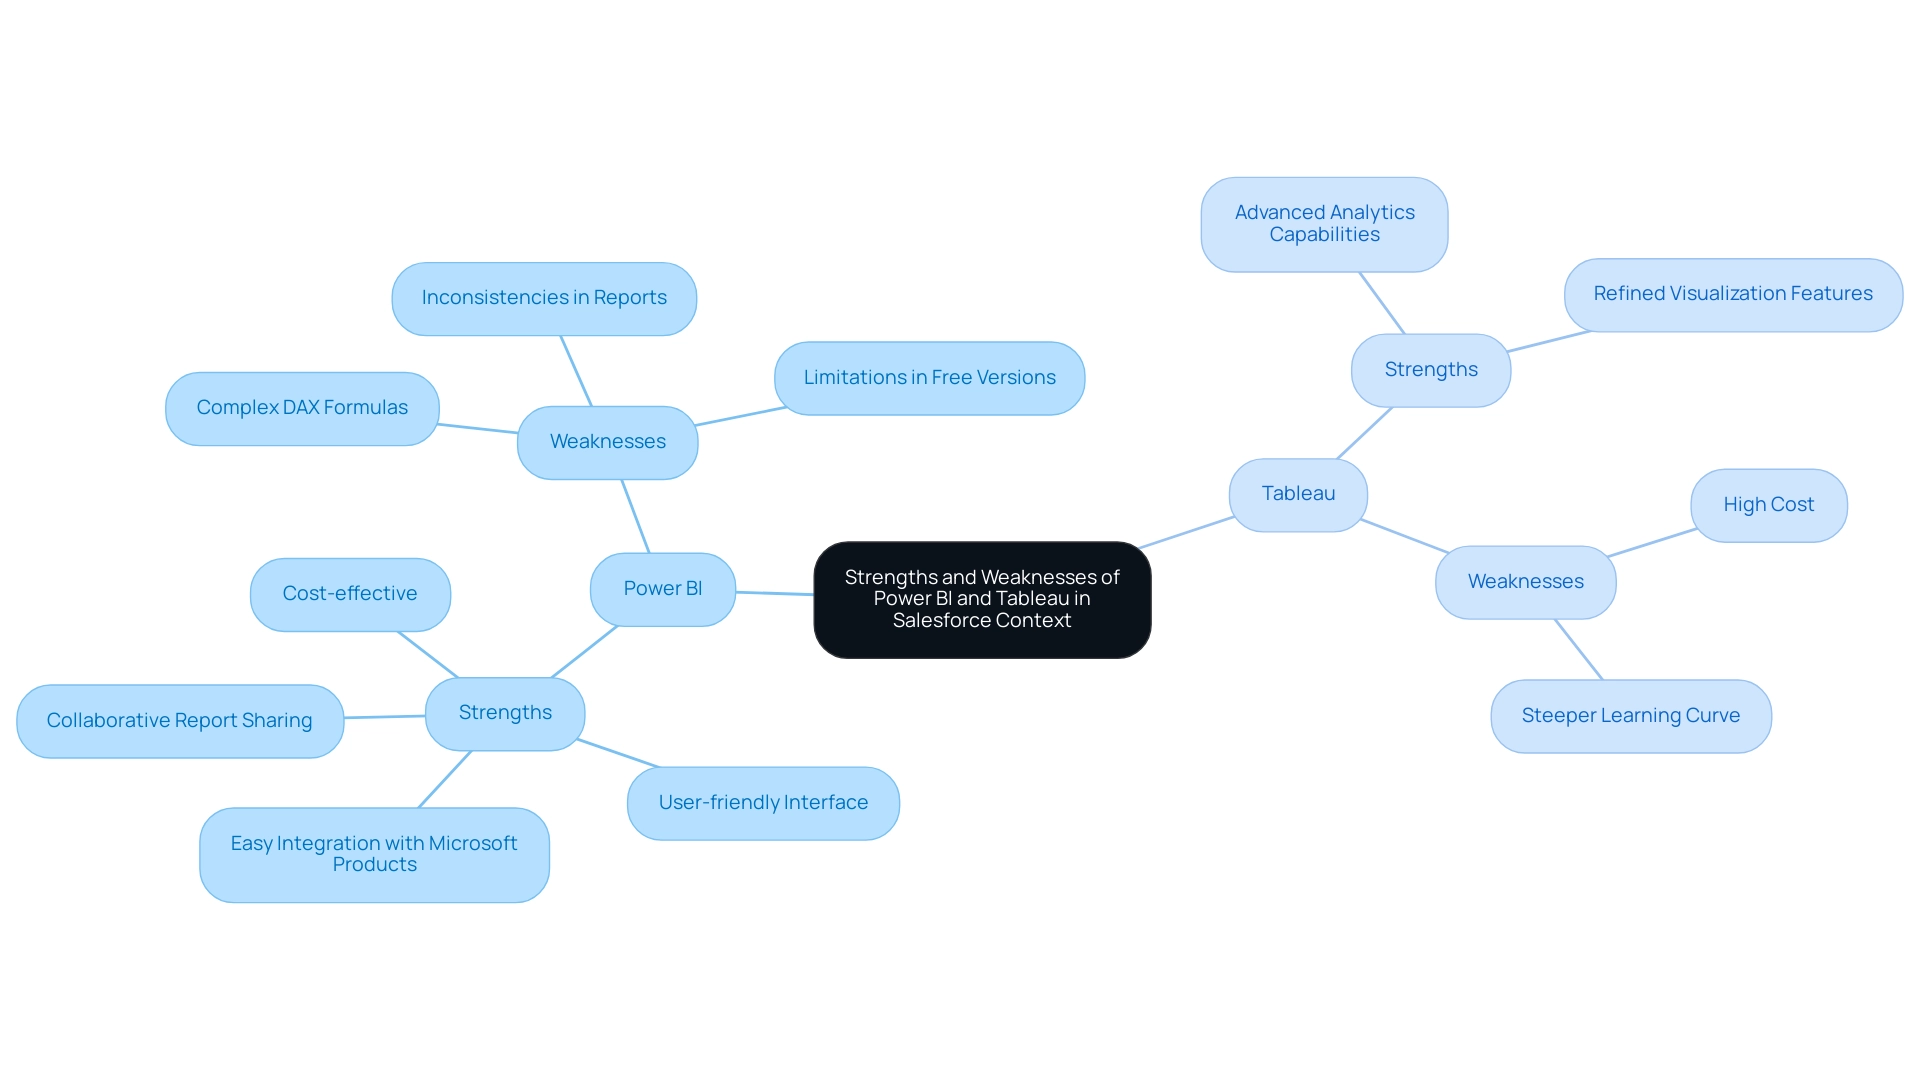
In the realm of Salesforce integration, Salesforce BI stands out for its cost-effectiveness and user-friendly interface, making it an appealing choice for organizations seeking quick and straightforward dashboard and report creation. According to Leila Gharani, an expert in data analytics, the Business Intelligence tool connects easily to Excel, Azure, and many other data sources. It’s a great choice for teams already using Microsoft products.
This seamless integration is particularly beneficial for users familiar with Excel and other Microsoft programs, further simplifying the learning curve. However, the challenges of leveraging insights from BI are notable. Many Directors of Operations Efficiency find themselves spending more time on constructing reports than on extracting meaningful insights, leading to inefficiencies.
Additionally, inconsistencies in information across reports due to a lack of governance can foster confusion and mistrust. While BI excels with its user-friendly interface and collaborative report sharing, it does have limitations, including complex DAX formulas and restrictions in free versions concerning handling. Some users view its visualization features as less refined compared to the platform recognized for its advanced visual options.
Thus, businesses must carefully evaluate their budget constraints, technical expertise, and specific analytical needs to make an informed decision between these powerful tools. A recent analysis indicates that while BI is preferred by cost-conscious businesses, Tableau remains the go-to for those requiring advanced analytics and visualization capabilities. To enhance the effectiveness of Business Intelligence, organizations should concentrate on delivering clear, actionable guidance from their dashboards and implement governance strategies to ensure consistency and reliability.
Integration Techniques: Connecting Power BI and Tableau with Salesforce
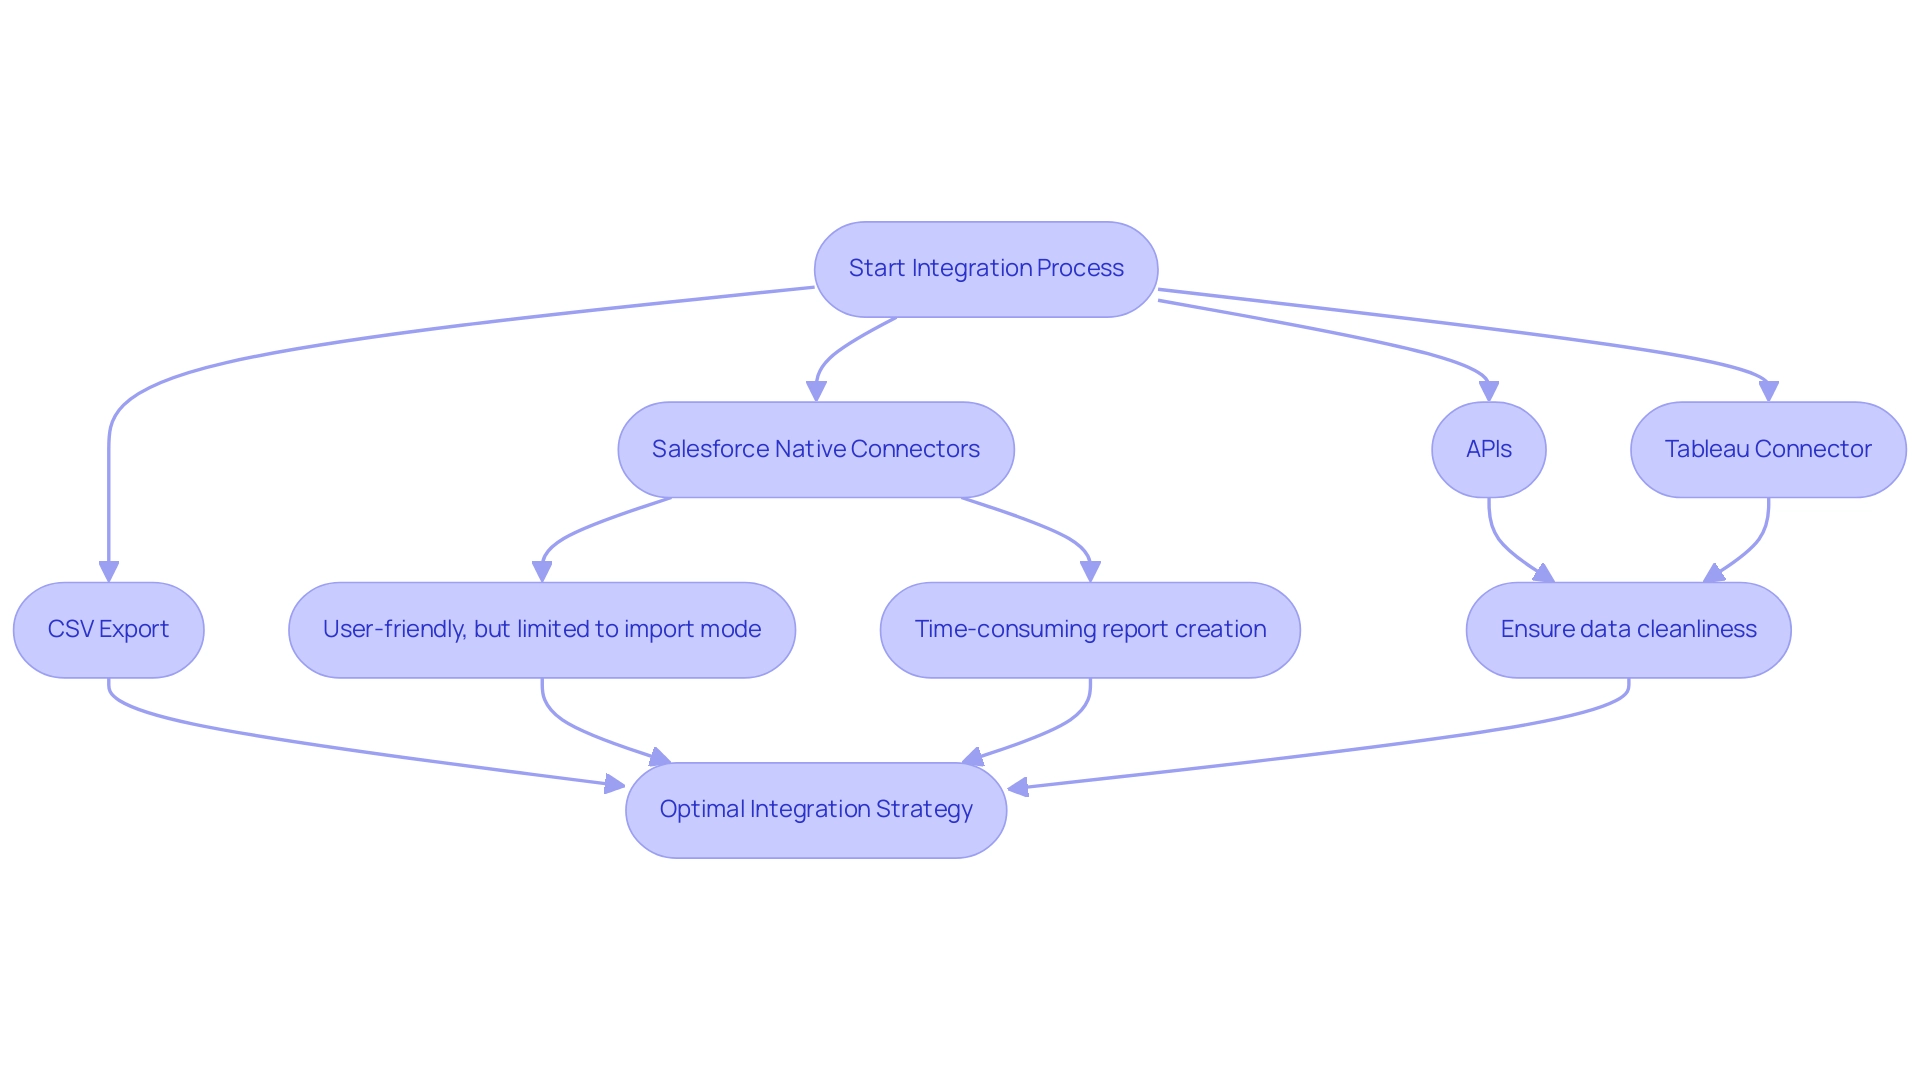
Integrating Power BI with Salesforce BI offers several effective methods, including Salesforce’s native connectors and APIs, which facilitate seamless information exchange. However, as lbendlin, a Super User, points out, ‘Neither Salesforce Objects nor Salesforce Reports connector offer real-time (Direct Query) connectivity. Both are strictly import mode…
If you need real-time reports, use Salesforce Reports, in Salesforce.’ This highlights a significant limitation for users seeking real-time reporting capabilities. In today’s information-rich environment, it’s critical to address challenges like time-consuming report creation and inconsistencies, which can be mitigated through a robust governance strategy to ensure integrity and build trust in the insights presented.
BI does provide pre-built templates designed to simplify the connection process, making it more user-friendly, yet many organizations find themselves investing excessive time in constructing reports rather than leveraging insights effectively. In contrast, Tableau enables a more nuanced integration through its Tableau Connector for Salesforce or by utilizing extracts, providing users with greater flexibility. An alternative method is to export Salesforce Reports to CSV, store them on SharePoint, and then ingest them into Power BI, which is suitable for handling large datasets where real-time reporting is not necessary.
To enhance the integration experience and promote operational efficiency, best practices suggest ensuring cleanliness and a well-structured format prior to integration, along with regular updates to connection settings for sustained accuracy. An important technique is to create measures instead of combining tables when addressing varying levels of granularity, as suggested by feedback on effective information handling. For instance, individuals have reported that creating measures has led to improved performance and clearer insights compared to merging tables, indicating a preference for this approach.
Organizations should assess their current IT infrastructure and resources to identify the most suitable integration method, customizing their strategy to address specific operational requirements and information complexity while maximizing the potential of Salesforce BI solutions.
Data Visualization and Reporting: Power BI vs. Tableau
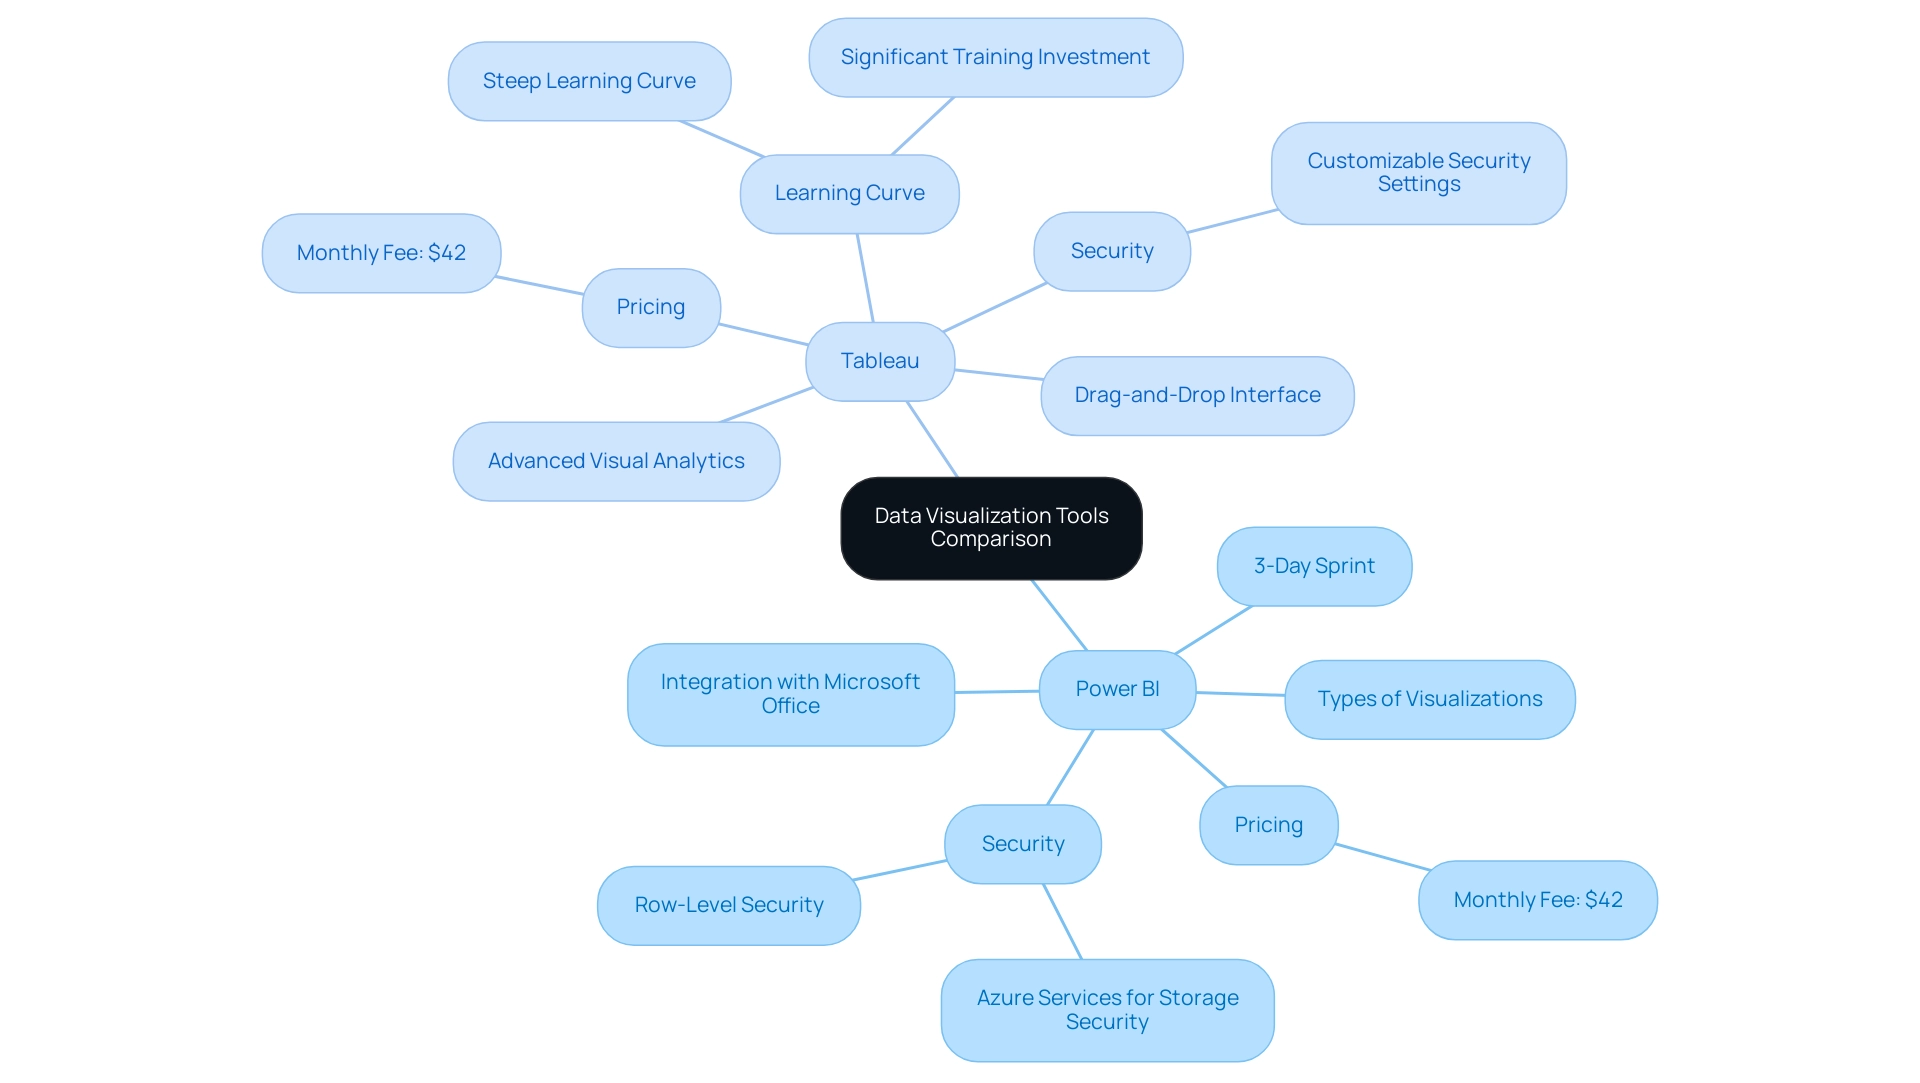
This software excels in information visualization, especially because of its smooth integration with Microsoft Office tools, enabling individuals to create visually appealing reports directly linked to applications like Excel. It provides a diverse array of visualization types—from charts and maps to tables—along with customization options that cater to various reporting needs. This functionality ensures that users can present information in a manner that resonates with their audience, promoting informed decision-making that drives growth.
Additionally, the 3-Day Power BI Sprint allows for rapid creation of professionally designed reports, while the General Management App supports comprehensive management and smart reviews, enhancing overall operational efficiency. Moreover, our actions portfolio provides customized strategies to enhance the effect of your initiatives, and we encourage you to schedule a complimentary consultation to discover how we can support you additionally.
On the other hand, a well-known tool is acknowledged for its advanced visual analytics features, allowing the development of highly interactive dashboards that reveal key insights. Its intuitive drag-and-drop interface provides individuals the flexibility to create intricate visualizations, making it perfect for comprehensive analysis and narrative through information. However, while the business intelligence tool serves well for straightforward reporting tasks and offers a risk-free ROI assessment, the other platform excels in scenarios demanding comprehensive exploration.
It is essential to note that this software incurs a fee of $42 monthly for each individual, which may affect budget considerations for organizations.
Both platforms implement robust security measures; Power BI utilizes Azure services for storage security and offers row-level security for access, while this software allows individuals to configure authentication and security with various roles for access permissions. However, the steep learning curve of Tableau requires significant training investment for users to master its features, presenting a challenge for the Director of Operations Efficiency when evaluating these tools. With the right tools and strategies, including addressing the challenges of time-consuming report creation and inconsistencies, businesses can unlock the power of Business Intelligence and RPA, transforming information into actionable insights that foster growth and innovation.
Future Trends in BI Tools: What Lies Ahead for Salesforce Users
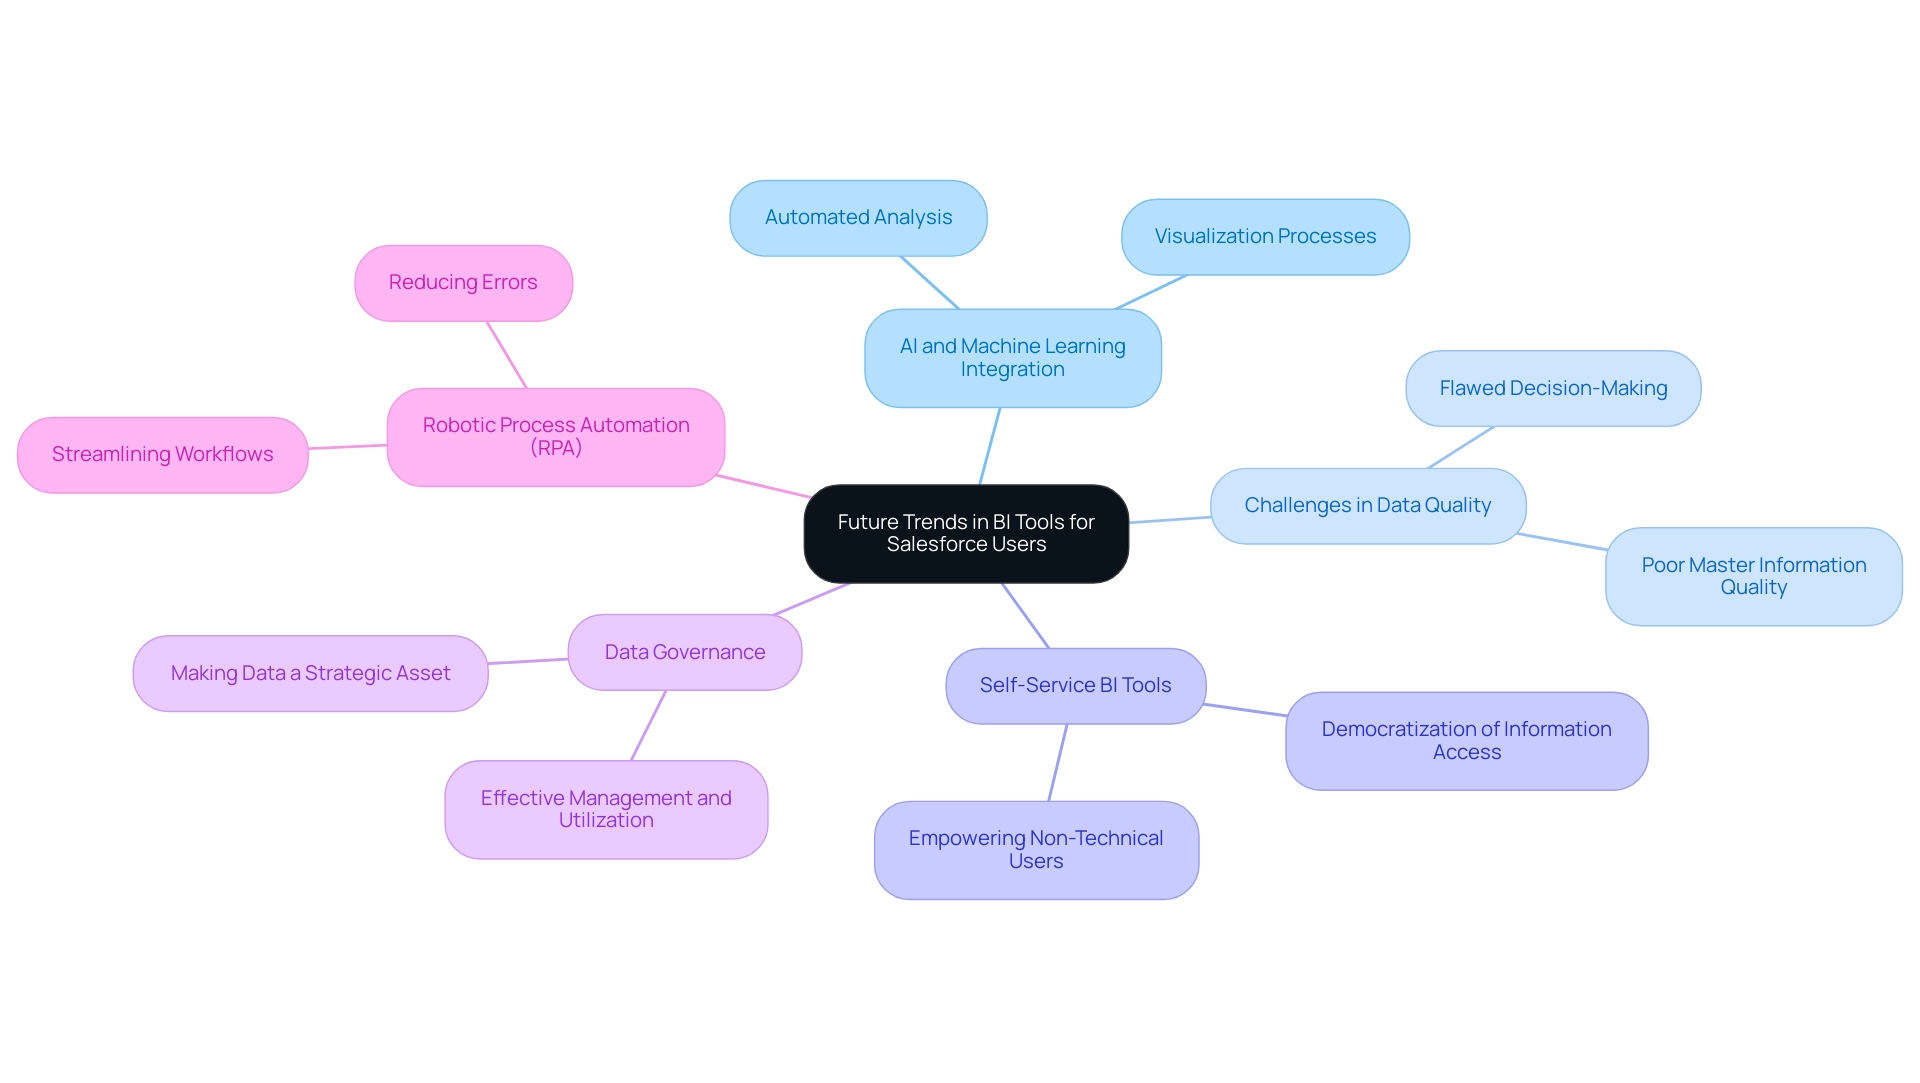
As business intelligence (BI) tools continue to advance, organizations can anticipate increasingly robust integration capabilities with Salesforce BI, driven by rapid developments in artificial intelligence (AI) and machine learning. Predictions from BI experts indicate a significant shift towards automated analysis and visualization processes, aiming to reduce the time currently consumed by manual preparation—an estimated 45% of scientists’ efforts. This evolution will enable individuals to extract valuable insights with minimal intervention, enhancing productivity across the board.
However, organizations often face challenges related to poor master information quality, which can hinder effective AI implementation and lead to flawed decision-making. Furthermore, the perception that AI projects are time-intensive and costly can deter businesses from adopting these transformative technologies. The emergence of self-service BI tools is set to democratize information access, enabling non-technical users to independently create reports and dashboards, fostering a culture of informed decision-making throughout organizations.
Statista highlights that annual spending on cloud IT infrastructure is steadily growing, reflecting the financial commitment businesses are making to enhance their Salesforce BI capabilities. To fully capitalize on these transformative trends, companies must prioritize making information a strategic asset through effective Governance, ensuring optimal management and utilization of their resources. Moreover, leveraging Robotic Process Automation (RPA) can significantly streamline workflows, reduce errors, and free up teams for more strategic work.
A case study on decentralized data management in the pharmaceutical sector illustrates how effective data governance can bolster operational effectiveness and data integrity, underscoring the necessity for organizations to adapt their strategies and harness the full potential of Salesforce BI investments to drive operational excellence.
Conclusion
Power BI and Tableau are both formidable players in the business intelligence landscape, each catering to distinct organizational needs while offering robust integration with Salesforce. Power BI’s strength lies in its cost-effectiveness and user-friendly interface, making it accessible for teams familiar with Microsoft products. However, the inefficiencies in report creation and data inconsistencies can pose challenges for organizations looking to derive actionable insights. Conversely, Tableau’s advanced visualization capabilities make it a preferred choice for data analysts seeking deeper analytical tools, although it may require a more significant investment and a steeper learning curve.
As businesses look to the future, the integration of AI and machine learning with BI tools promises to transform how organizations interact with data. This evolution, coupled with the rise of self-service BI tools, will empower users to generate insights with greater autonomy and efficiency. However, to fully leverage these advancements, organizations must prioritize data governance and ensure data integrity. Transforming data into a strategic asset will be essential for driving informed decision-making and operational excellence.
In conclusion, the choice between Power BI and Tableau hinges on a careful assessment of an organization’s specific needs, budget constraints, and technical capabilities. By understanding the strengths and weaknesses of each platform, along with the integration techniques and future trends in BI, organizations can make informed decisions that not only enhance their data capabilities but also pave the way for sustained growth and operational efficiency in an increasingly data-driven world.

