Introduction
In the realm of business analytics, Microsoft Power BI emerges as a transformative tool, enabling organizations to harness the power of data for strategic decision-making. With its impressive market share and robust features, Power BI not only simplifies data visualization but also enhances collaboration and operational efficiency.
From creating engaging reports to leveraging automation, this comprehensive guide delves into the essential steps for maximizing Power BI’s potential. By embracing best practices in data preparation, visualization, and report sharing, organizations can unlock actionable insights that drive growth and innovation, positioning themselves at the forefront of their industries.
Understanding Power BI: An Overview of Its Features and Benefits
Microsoft Power BI distinguishes itself as a top business analytics instrument, enabling organizations to visualize information, share insights, and support informed decision-making. As of 2021, BI commanded over 30% of the market share among business intelligence platforms, followed closely by Tableau at approximately 19% and Qlik at around 10%. This demonstrates its significant adoption and trust within the industry.
Key features of BI include:
- 3-Day BI Sprint: Accelerate your reporting capabilities with professionally designed reports created in just three days.
- General Management App: A comprehensive solution that offers smart reviews and management insights to drive efficiency.
- Interactive Dashboards: Craft real-time dashboards that deliver a holistic view of your business metrics, allowing for quick and informed decisions.
- Data Connectivity: Seamlessly connect to a variety of data sources such as Excel, SQL Server, and numerous cloud-based services, ensuring your data is always accessible.
- Custom Visualizations: Leverage a diverse array of visualizations to effectively present your data, enhancing clarity and engagement.
- Collaboration Tools: Effortlessly create reports in Power BI and share reports and dashboards with team members and stakeholders, fostering a collaborative environment that drives operational efficiency.
The advantages of utilizing BI are profound: it enhances data-driven decision-making, promotes collaboration, and transforms raw data into actionable insights, ensuring data consistency and providing clear guidance for strategic decisions. This makes BI an indispensable asset for organizations striving to maximize their operational efficiency. As industry leaders like Tajammul Pangarkar, CMO at Prudour Pvt Ltd, emphasize, understanding technological trends and capabilities is crucial for leveraging tools like BI effectively.
Furthermore, the integration of RPA solutions like EMMA can overcome outdated systems and automate repetitive tasks, further enhancing operational efficiency and employee morale. By merging the functionalities of Business Intelligence with RPA solutions, organizations can optimize workflows and enhance the quality of insights obtained from their information. The recent merger of Salesforce and Tableau illustrates the evolving landscape of BI platforms, enhancing the business intelligence solutions available to customers by combining Salesforce’s CRM platform with Tableau’s visualization capabilities.
Lastly, a comprehensive guide detailing the differences between BI Desktop, Pro, and Premium has been published, providing valuable insights into the product offerings that would benefit decision-makers.
Step-by-Step Guide to Creating Your First Power BI Report
Developing your initial BI report is an empowering step toward utilizing analytics effectively and enhancing operational efficiency. Follow these streamlined steps to get started:
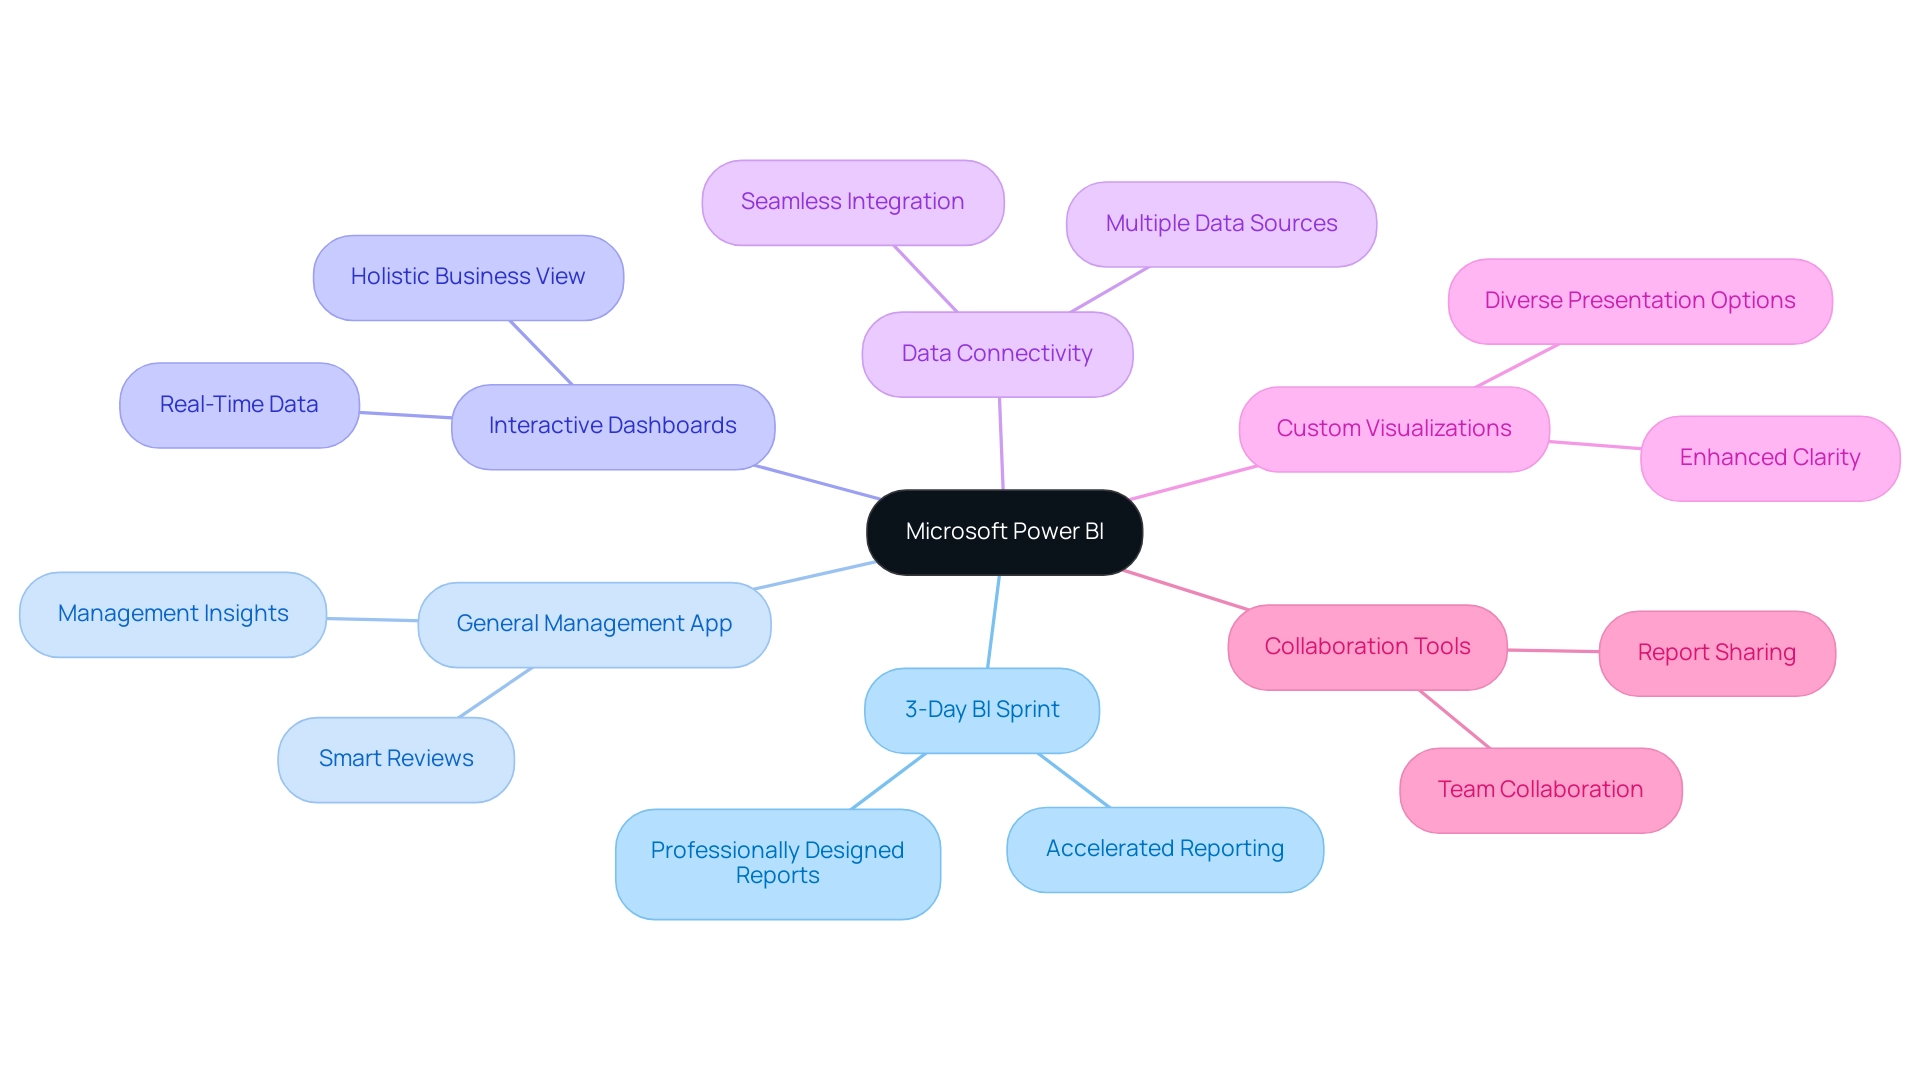
- Open Power BI Desktop: Launch the application on your machine to begin your journey.
- Retrieve Information: Click on the ‘Retrieve Information’ button to establish a connection with your preferred source, ensuring you have the right details at your fingertips. Integrating RPA solutions such as EMMA RPA can automate this information gathering, reducing time and minimizing errors, thus addressing the challenge of time-consuming report creation.
- Load Information: After choosing your information source, seamlessly load the relevant information into Power BI. This step is crucial, as Tijani Azeez Titilope emphasizes understanding the boundaries for the lowest, middle, and upper quarters of information to make informed decisions. By automating this process, you can avoid inconsistencies that often slow down analysis.
- Generate a Document: In the document view, drag and drop fields from the information pane onto the canvas, crafting visualizations that effectively convey your insights. For instance, the case study on augmenting data to documents demonstrates how users can link to different data sources, ensuring their documents are founded on precise and pertinent information.
- Customize Visuals: Utilize the formatting options available to tailor the appearance of your visuals, making sure they align with your analytical goals and enhance readability. RPA tools such as Automate can assist in preserving uniformity in visual formatting throughout documents, further improving the quality of insights.
- Save Your Report: Conclude your work by saving your progress—click the ‘Save’ icon or use the shortcut Ctrl + S.
By following these steps, you will successfully create your first BI report, setting the stage for further enhancements and in-depth analysis. Mastering BI equips you with robust analytics features and seamlessly integrates with other Microsoft products, enhancing your operational efficiency while overcoming common implementation challenges. This transformative potential of Business Intelligence is crucial for informed decision-making and driving growth.
Preparing and Cleaning Your Data for Effective Reporting
To effectively prepare and clean your information for Power BI reporting, consider implementing the following best practices:
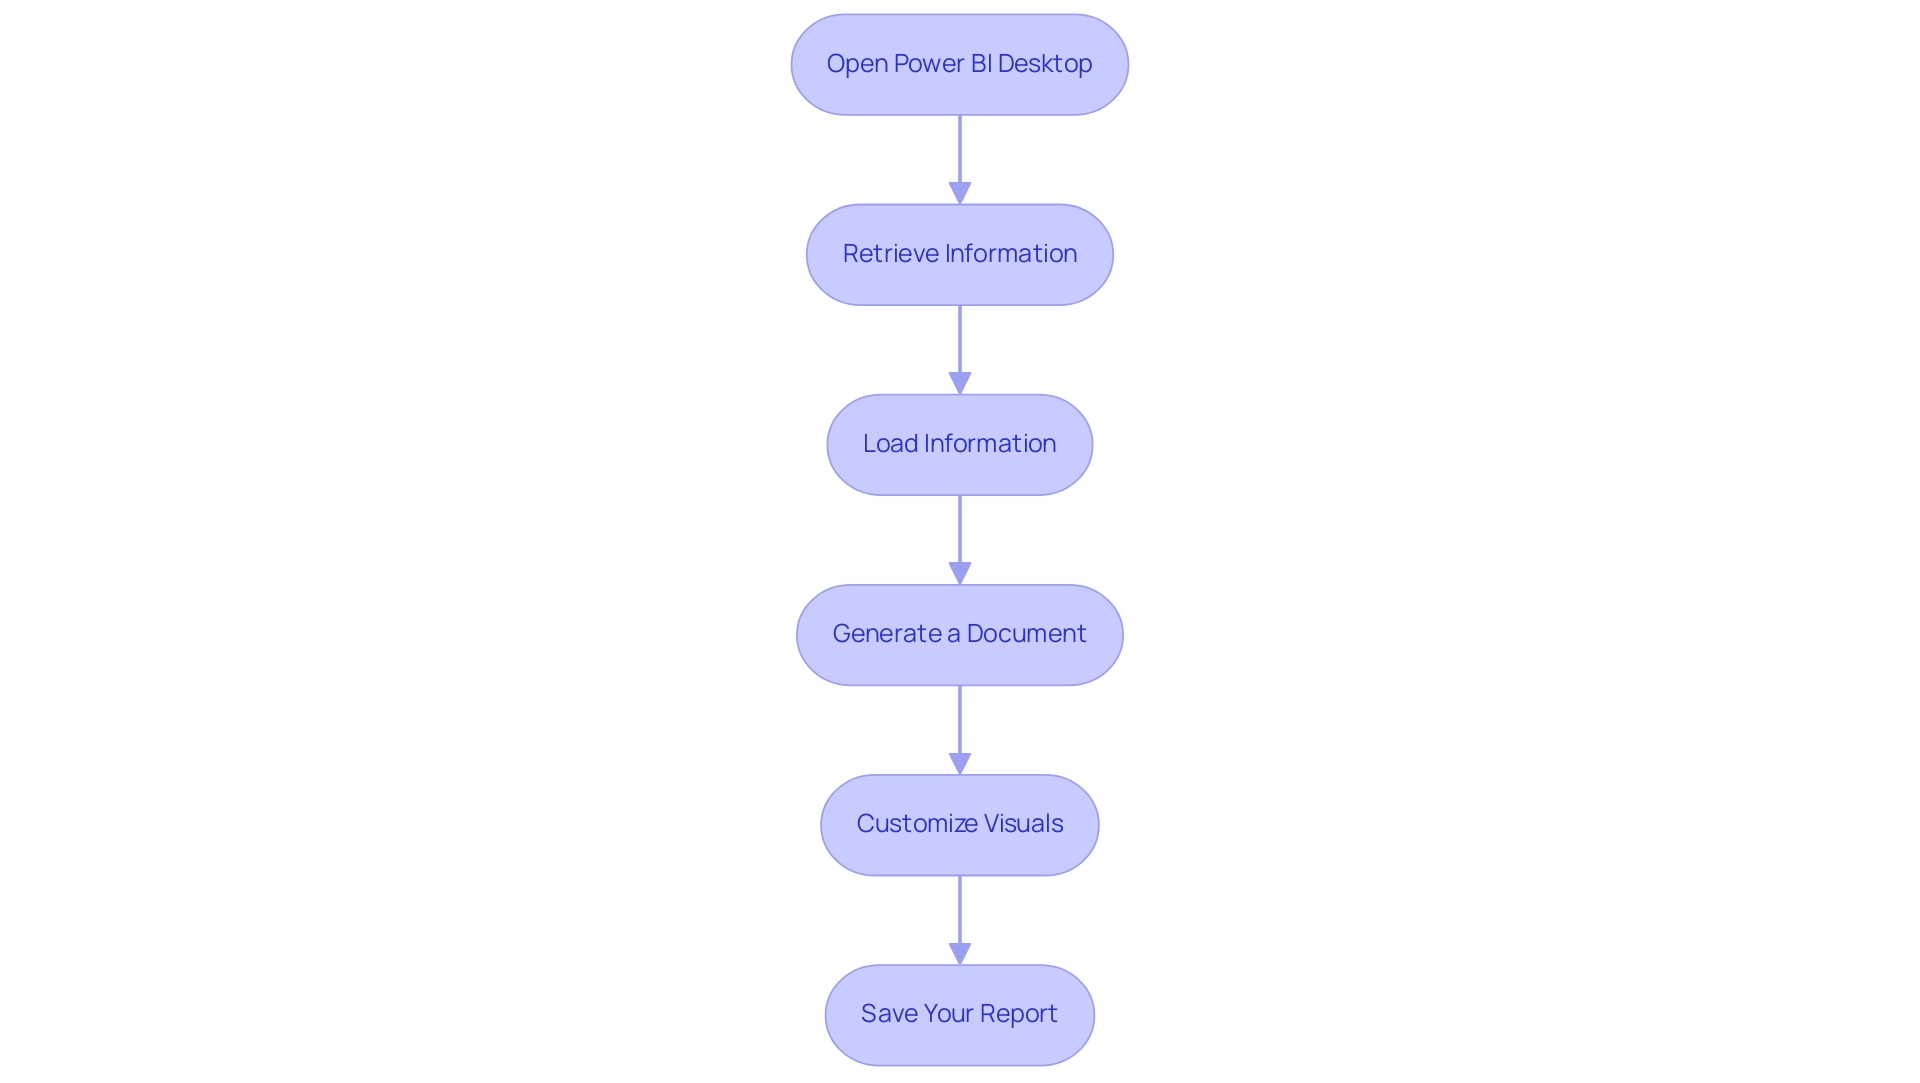
- Remove Duplicates: Begin by identifying and eliminating any duplicate entries in your dataset. RPA can automate this process by using algorithms to detect and remove duplicates, ensuring your analysis remains accurate and efficient.
- Handle Missing Values: Carefully address missing values using logical reasoning. RPA tools can be programmed to fill in gaps through imputation methods or to flag incomplete entries for review, maintaining the integrity of your dataset. Rui Gao emphasizes the importance of these approaches in ensuring realistic information representation in his article, stating that proper handling of missing values is essential for reliable analysis.
- Format Information: Ensure that all types are accurately formatted. RPA can streamline this process by automatically converting information into the required formats, such as dates and currency, which minimizes errors in reporting and enhances insights that are driven by information.
- Create Calculated Columns: Add necessary calculated fields that enhance your analysis. RPA can help in automating the creation of these columns based on predefined rules, offering additional insights that make your documents more informative and actionable.
- Filter Out Irrelevant Information: Remove any information that does not contribute to the report’s objectives. RPA can assist in automating this filtering process, improving clarity and enhancing the overall quality of your reporting, enabling your team to concentrate on strategic initiatives.
A recent case study exemplifies the critical nature of precise information reporting, where confusion over the interpretation of mortgage amounts—whether $1,400 or $1.4 million—led to significant inaccuracies. This emphasizes the potential consequences of not following best practices in information cleaning. By rectifying such discrepancies and aligning the information with property purchase prices, organizations can significantly improve the accuracy of their analyses and leverage RPA to automate these processes for enhanced efficiency.
The advantages of effective information cleaning include increased productivity, removal of errors, improved client satisfaction, and more efficient business practices. By adhering to these steps and utilizing RPA, you will ensure that your data is not only clean and relevant but also primed to create reports in Power BI that generate actionable insights, driving operational efficiency and supporting your business growth goals.
Creating Engaging Visualizations in Your Power BI Report
To create engaging visualizations in Power BI that drive data-driven insights and operational efficiency, consider the following best practices:
-
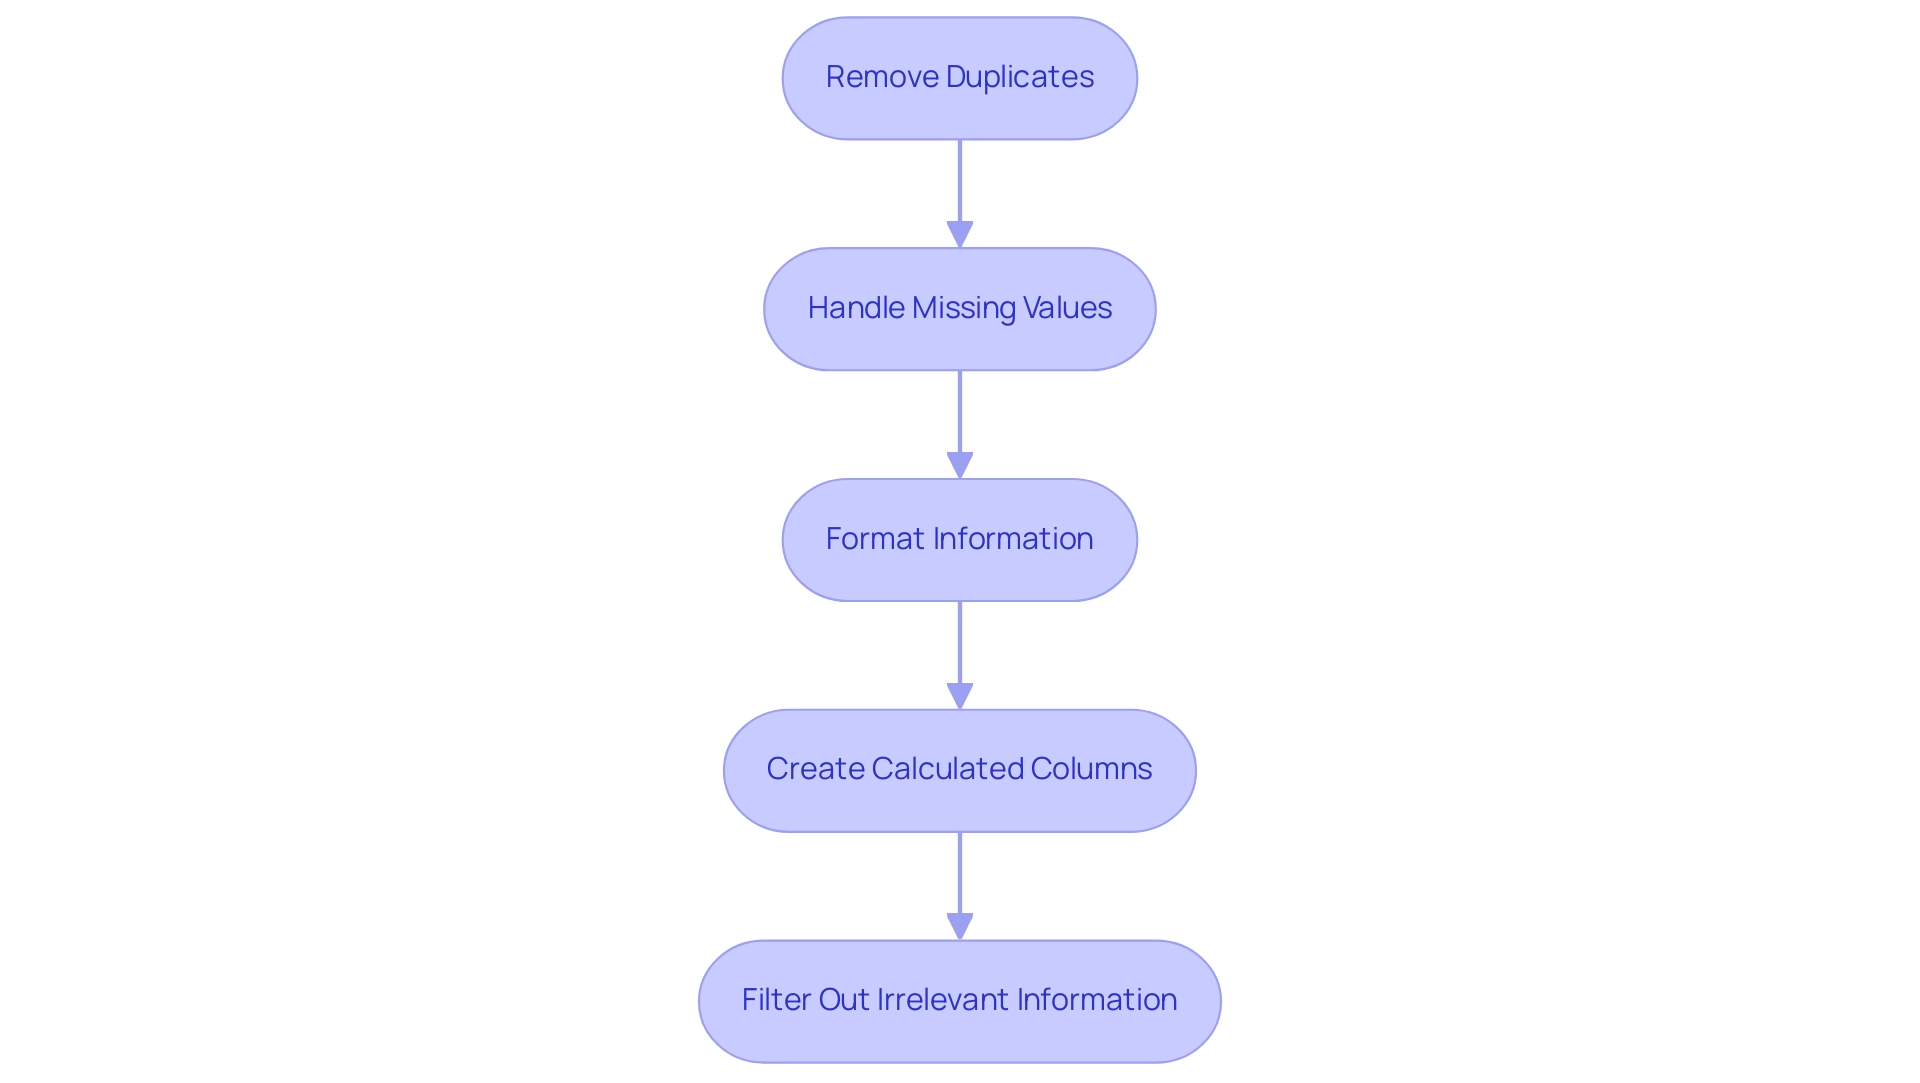
Choose the Right Visualization Type: Selecting the appropriate format—be it column charts for comparative analysis, line charts for trend analysis, pie charts for parts-of-a-whole, or funnel charts for visualizing processes with stages—can significantly enhance understanding and tackle challenges like time-consuming report creation. According to Divyansh Sharma, a Marketing Research Analyst at Hevo Data,
Line charts and area charts are effective for trend analysis over time, which is essential for illustrating changes in information over specific periods. -
Use Colors Wisely: A consistent color scheme is vital. Colors should not only enhance the visual appeal but also improve readability and help convey the message clearly, thereby reducing inconsistencies in information presentation.
-
Add Tooltips: Tooltips provide additional context when users hover over visuals, enhancing understanding by offering extra information without cluttering the visual space. This feature is essential for making actionable insights easily accessible.
-
Incorporate Interactivity: Features like drill-downs and filters empower users to engage with the information dynamically, allowing them to explore underlying details and trends. For example, the Drill Down Waterfall PRO is especially effective for Profit & Loss analysis, budget planning, and project resource allocation, illustrating how interactivity can offer deeper insights into financial information and improve operational efficiency.
-
Utilize RPA Tools: Incorporating Robotic Process Automation (RPA) tools like EMMA RPA and Power Automate can enhance the procedure of information gathering and document creation, decreasing the time dedicated to these activities and boosting precision. By automating repetitive data handling tasks, businesses can focus on deriving insights rather than getting bogged down by manual processes.
-
Test Your Visuals: Rigorous testing is essential to ensure that your visuals communicate the intended message clearly and concisely. This step aids in recognizing any possible confusion and permits adjustments prior to sharing the findings, ensuring that the insights obtained are actionable and trustworthy.
By concentrating on these strategies, including the integration of RPA, you can create compelling visualizations that not only enhance the clarity of your BI analysis but also significantly increase user engagement, ultimately driving growth and innovation in your organization.
Publishing and Sharing Your Power BI Reports with Stakeholders
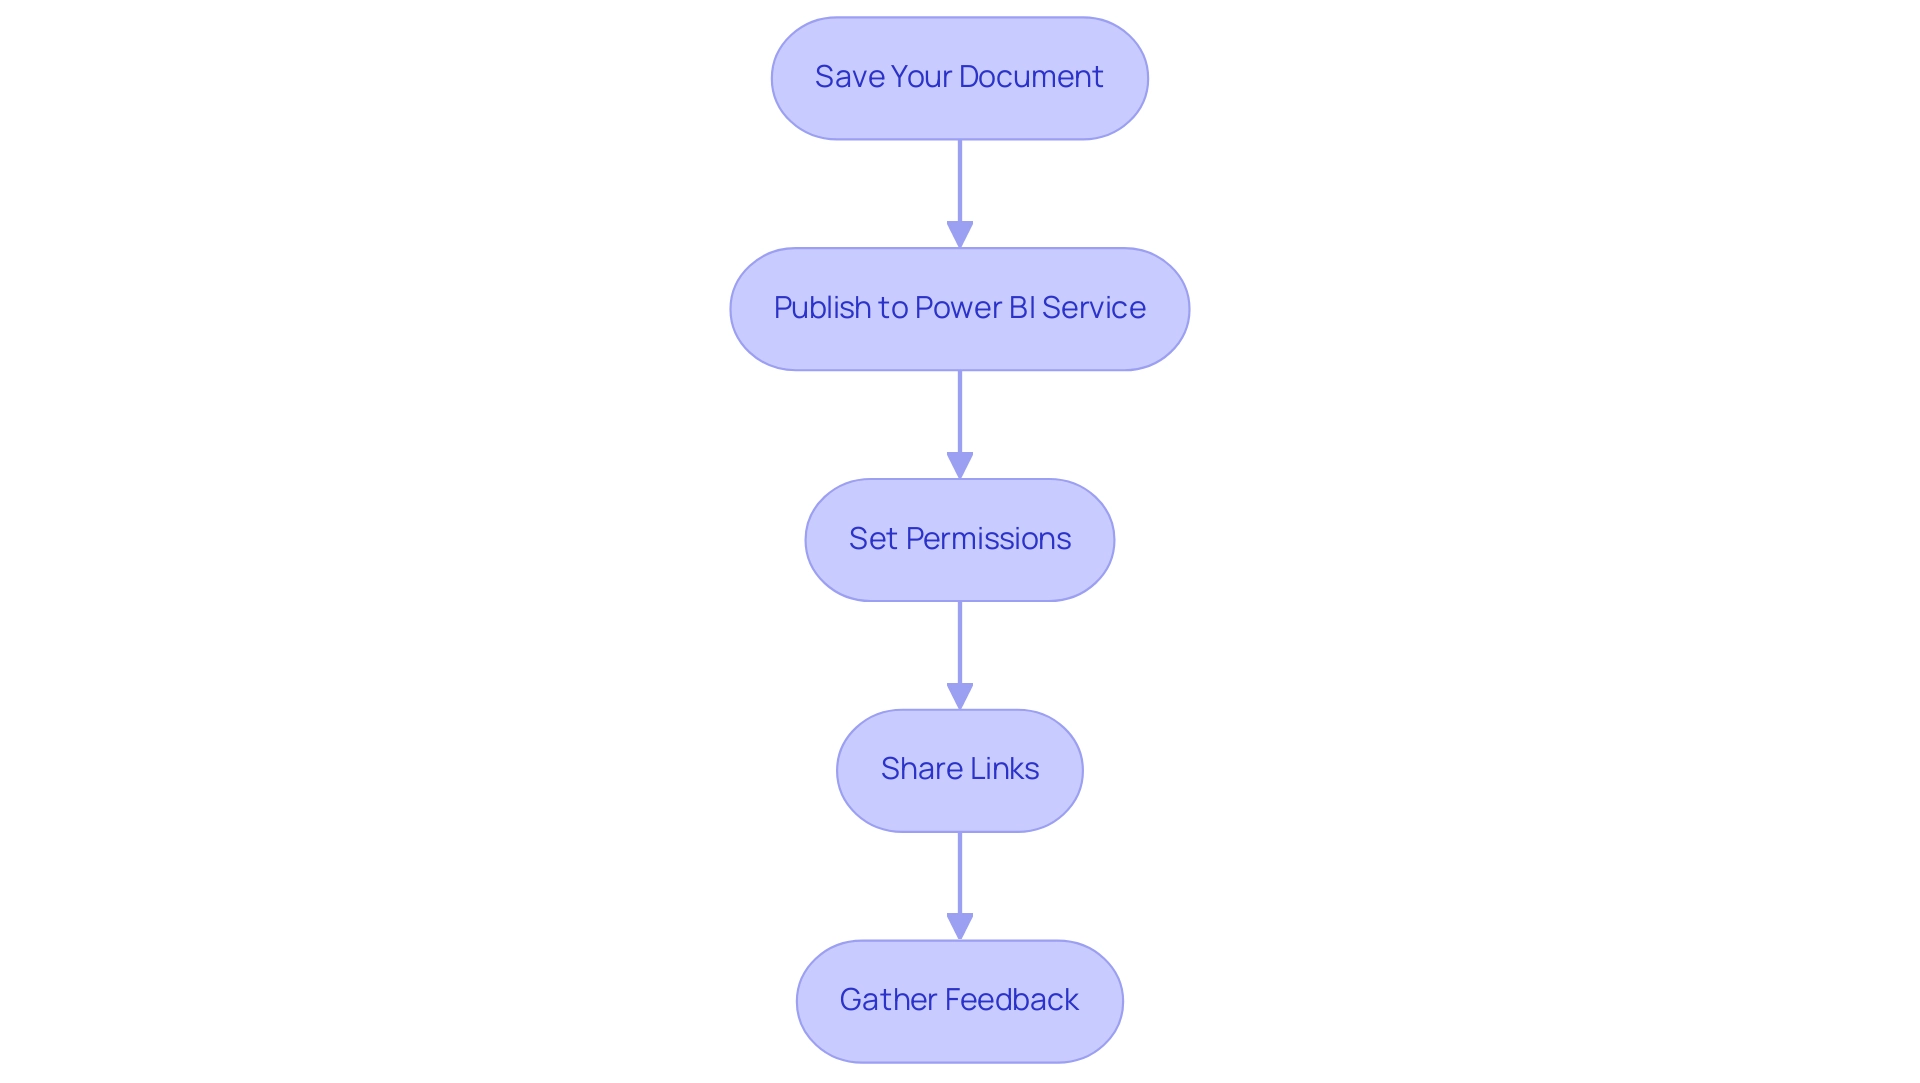
To effectively publish and share your Power BI reports, follow these comprehensive steps:
- Save Your Document: Begin by ensuring that your document is saved and finalized for sharing.
- Publish to Power BI Service: Click the ‘Publish’ button to upload your document to the Power BI service, making it accessible to your stakeholders and enhancing your organization’s Business Intelligence capabilities.
- Set Permissions: Carefully adjust the sharing settings to determine who can view or edit the document. This is crucial, especially when sharing with groups that include external email addresses; using a security group is recommended, as distribution groups may not function properly for this purpose.
- Share Links: Generate shareable links or invite stakeholders directly via email. Note that email notifications for shared documents are sent only to individual users, not groups, ensuring that each stakeholder is informed and engaged.
- Gather Feedback: Actively encourage stakeholders to provide input on the document. This input is invaluable for refining and enhancing future documents, fostering a culture of collaboration and informed decision-making. By utilizing the insights obtained, your organization can tackle obstacles such as time-consuming document preparation and inconsistencies in information. Implementing RPA solutions can significantly streamline the generation process, reducing the time spent on repetitive tasks and minimizing errors in data presentation.
Furthermore, statistics indicate that the total count in the usage document represents distinct entries viewed over 90 days, highlighting the significance of interaction with your documents. A practical example of effective document management is illustrated in the case study on viewing all workspace usage metrics; users must remove default filters to gain a broader analysis of usage across all documents, enhancing overall management of BI resources. As Shubhangi Pandey, a Product Marketing Enthusiast, notes, “The ability to share and receive feedback on documents is vital for continuous improvement and effective decision-making.”
By following these steps, you will successfully create a report in Power BI, publish it, and share it, enhancing collaboration and empowering your organization to make data-driven decisions while addressing the operational challenges that may arise.
Conclusion
Harnessing the power of Microsoft Power BI can truly transform the way organizations approach business analytics. By understanding its core features—such as interactive dashboards, data connectivity, and customizable visualizations—companies can significantly enhance their decision-making processes. The integration of Robotic Process Automation (RPA) further streamlines workflows, allowing teams to focus on deriving valuable insights rather than getting bogged down by manual tasks.
Creating effective Power BI reports involves a systematic approach, including:
- Data preparation and cleaning
- Crafting engaging visualizations
Implementing best practices in each of these areas ensures that the insights generated are both accurate and actionable. By prioritizing clarity and interactivity in visualizations, organizations can foster a deeper understanding of their data, ultimately driving operational efficiency and innovation.
Furthermore, the ability to publish and share reports with stakeholders enhances collaboration and encourages a culture of feedback. This continuous improvement loop is essential for adapting to the dynamic landscape of business intelligence. As organizations embrace these strategies, they position themselves to leverage data as a strategic asset, paving the way for sustained growth and a competitive edge in their respective industries. Now is the time to fully embrace Power BI and unlock its potential to drive informed decision-making and operational excellence.

