Introduction
In a world where data drives decisions, Power BI emerges as a vital tool for organizations aiming to harness the full potential of their information. This powerful business analytics solution transforms raw data into insightful visualizations, enabling teams to make informed choices that propel growth and innovation.
As industries like Banking, Financial Services, and Insurance (BFSI) anticipate rapid advancements in business intelligence, the importance of mastering Power BI becomes increasingly clear. From streamlining report generation to enhancing data visualization and integration with other tools, Power BI equips organizations with the capabilities to overcome common challenges and improve operational efficiency.
This article delves into the essential features and best practices of Power BI, providing actionable insights that empower organizations to navigate their data analytics journey with confidence.
Introduction to Power BI: Understanding Its Role in Data Analytics
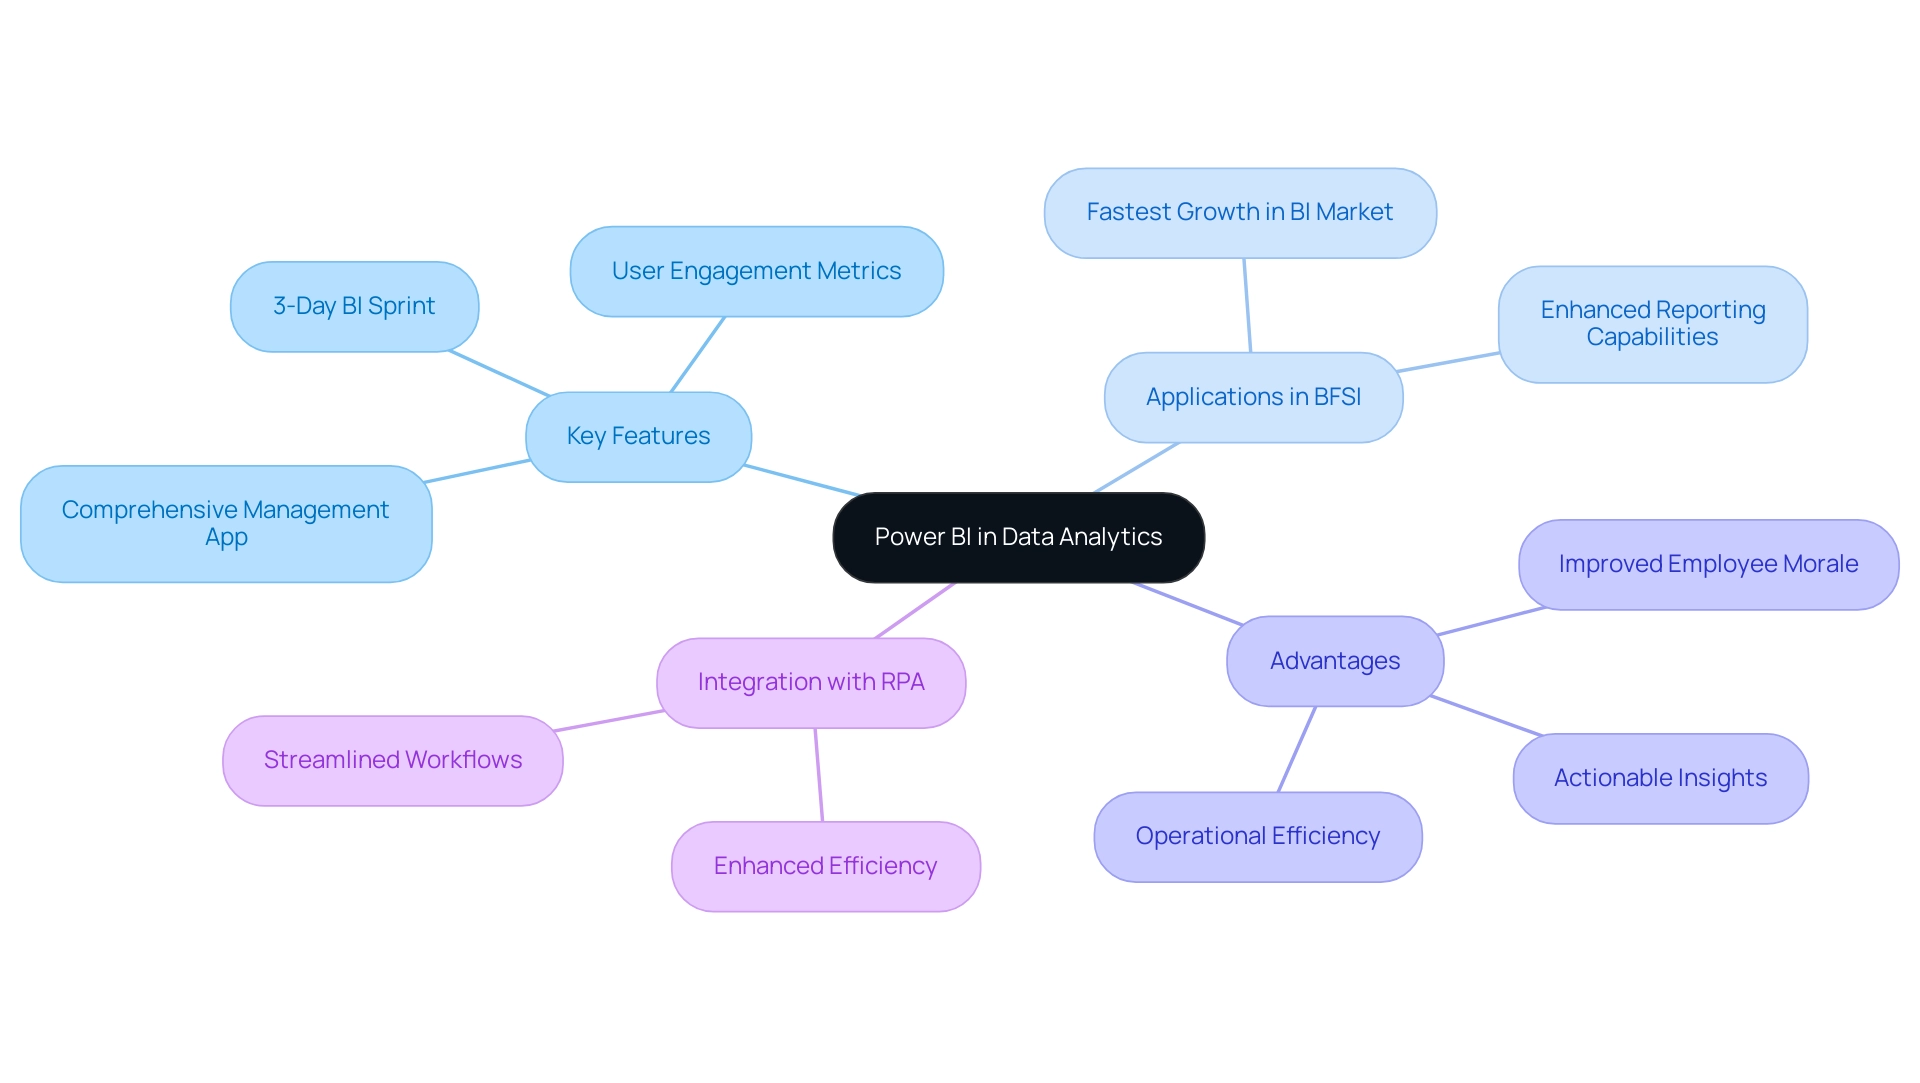
This tool, developed by Microsoft, distinguishes itself as a revolutionary business analytics instrument that enables organizations to perform data analytics using Power BI to visualize information and share understandings effectively. Its pivotal role in data analytics using Power BI lies in its ability to convert raw information into actionable insights, facilitating informed decision-making crucial for driving growth and innovation. As noted by Inkwood Research, the BFSI (Banking, Financial Services, and Insurance) sector will experience the fastest growth in the business intelligence market from 2023 to 2032, underscoring the significance of BI in this landscape.
With features like the 3-Day BI Sprint, organizations can swiftly produce professionally designed reports, overcoming the challenges of lengthy report generation and information inconsistencies. Furthermore, the General Management App supports comprehensive management and smart reviews, further enhancing reporting capabilities. Data analytics using Power BI connects effortlessly with numerous information sources, enhancing its flexibility for visualization, reporting, and knowledge sharing.
With a business intelligence tool generating a pre-constructed usage metrics document for content over the last 90 days, users can analyze data based on access methods and user engagement, which refreshes daily to offer continuous insights into document usage. This capability not only illustrates user engagement—where a viewer is defined as someone who has opened the report at least once—but also showcases how organizations can utilize BI to boost operational efficiency and productivity. Furthermore, integrating RPA solutions like EMMA RPA and Automate can streamline workflows and improve efficiency, enhancing employee morale.
Comprehending these functionalities is essential for fully leveraging BI’s potential and driving strategic initiatives. To explore how our RPA solutions can complement your use of BI, book a free consultation today.
Getting Started with Power BI: Data Transformation and Report Building
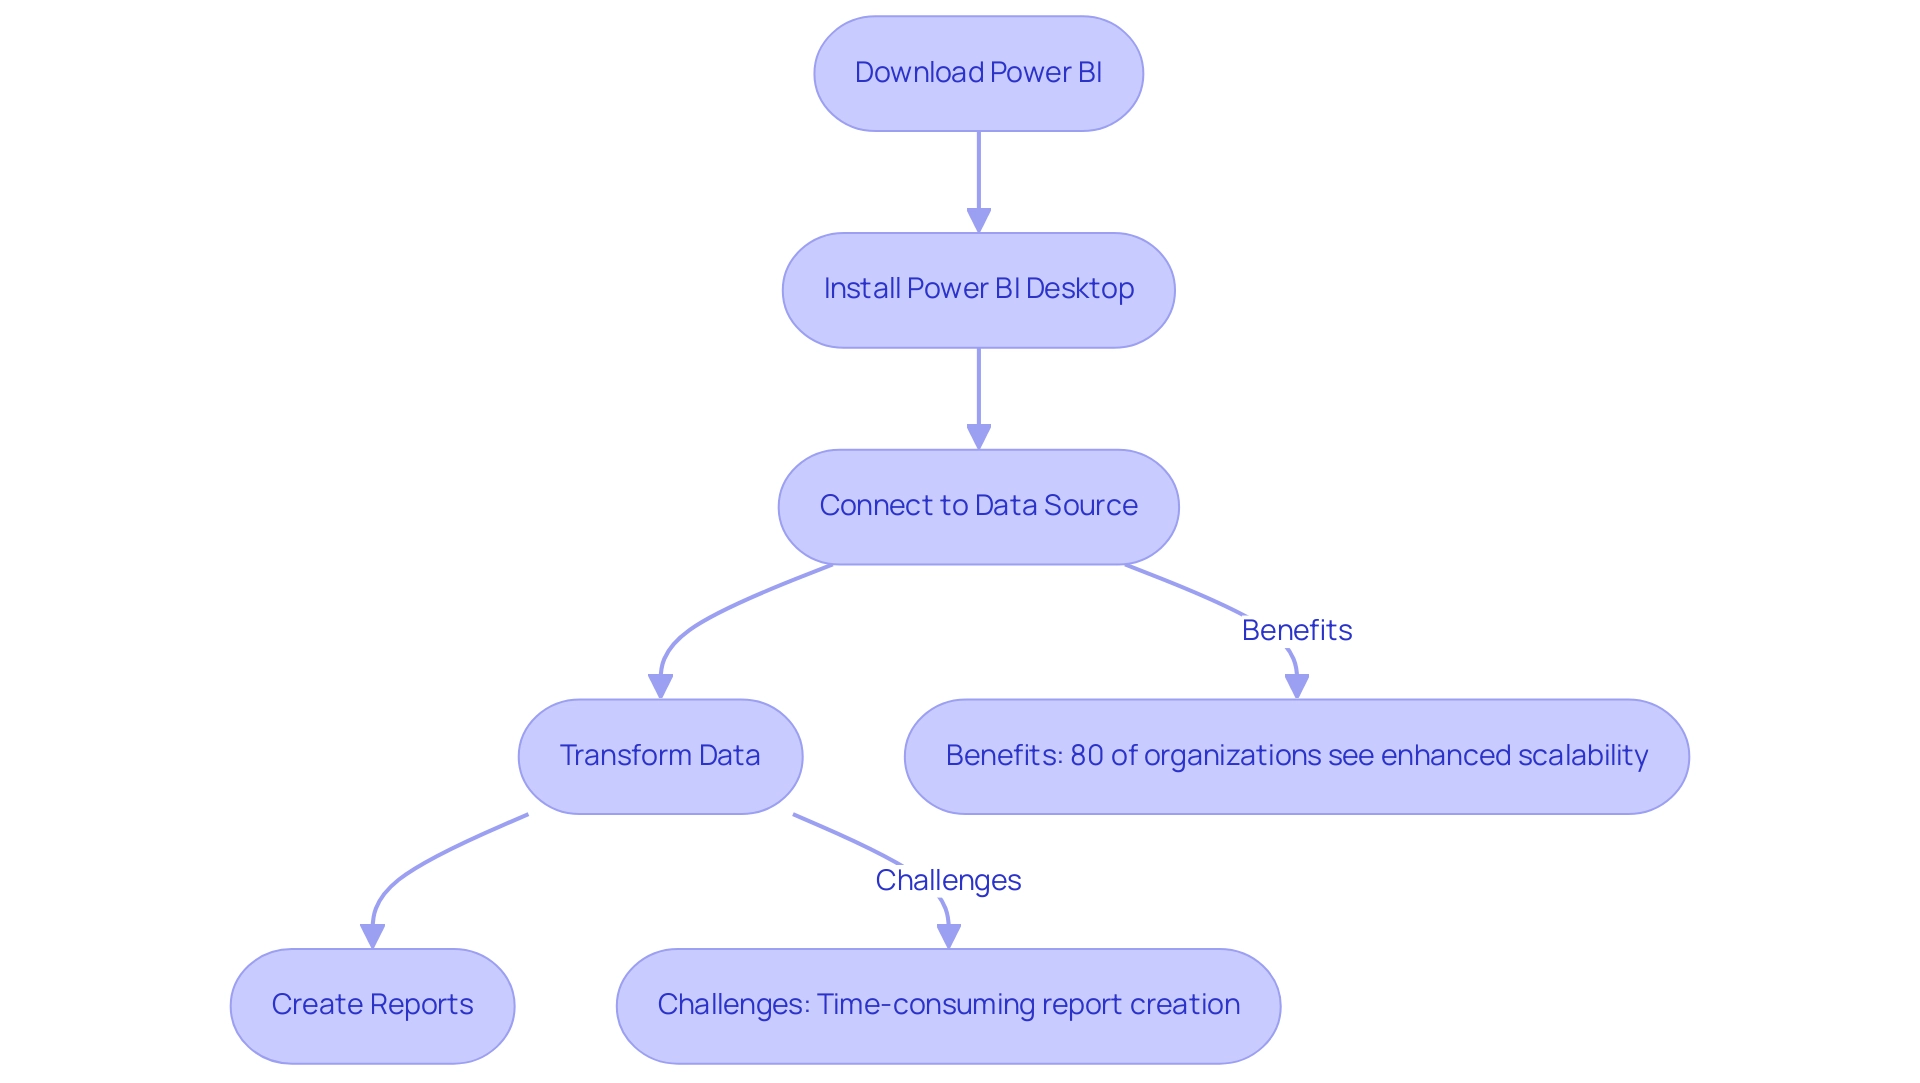
To embark on your BI journey, begin by downloading the application from the official website and proceed with the installation. Once Power BI Desktop is configured, connect to your information source by choosing ‘Get Data.’ Choose from various formats such as Excel or SQL Server, and load your information into the platform.
With your information now at your fingertips, exploit the ‘Transform Data’ feature to meticulously clean and shape it. This stage is crucial—remove unnecessary columns or rows and ensure that all types are correct for optimal analysis. Once your information is prepared, you can begin creating documents by simply dragging and dropping fields onto the canvas.
Customize your visuals thoughtfully to convey insights effectively. However, numerous organizations encounter challenges such as:
- Time-consuming report creation
- Inconsistencies
- A lack of actionable guidance in their data analytics using Power BI
These challenges can result in a competitive disadvantage in today’s information-driven market. Significantly, 80% of organizations utilizing cloud-based BI have encountered enhanced scalability, highlighting the benefits of data analytics using Power BI in such environments.
Moreover, based on HG’s information, almost 2 million firms in the United States invested $22.7 billion in data analytics using Power BI solutions in 2023, emphasizing the importance of investing in tools such as BI. As the BFSI sector is expected to undergo the quickest expansion in the business intelligence market from 2023 to 2032, your efforts in mastering data analytics using Power BI will not only prepare information but also position your organization for significant decision-making and informed strategies. By integrating RPA solutions, you can automate repetitive tasks, thereby enhancing operational efficiency and addressing the challenges related to management and reporting.
Advanced Power BI Techniques: Mastering Data Modeling and DAX
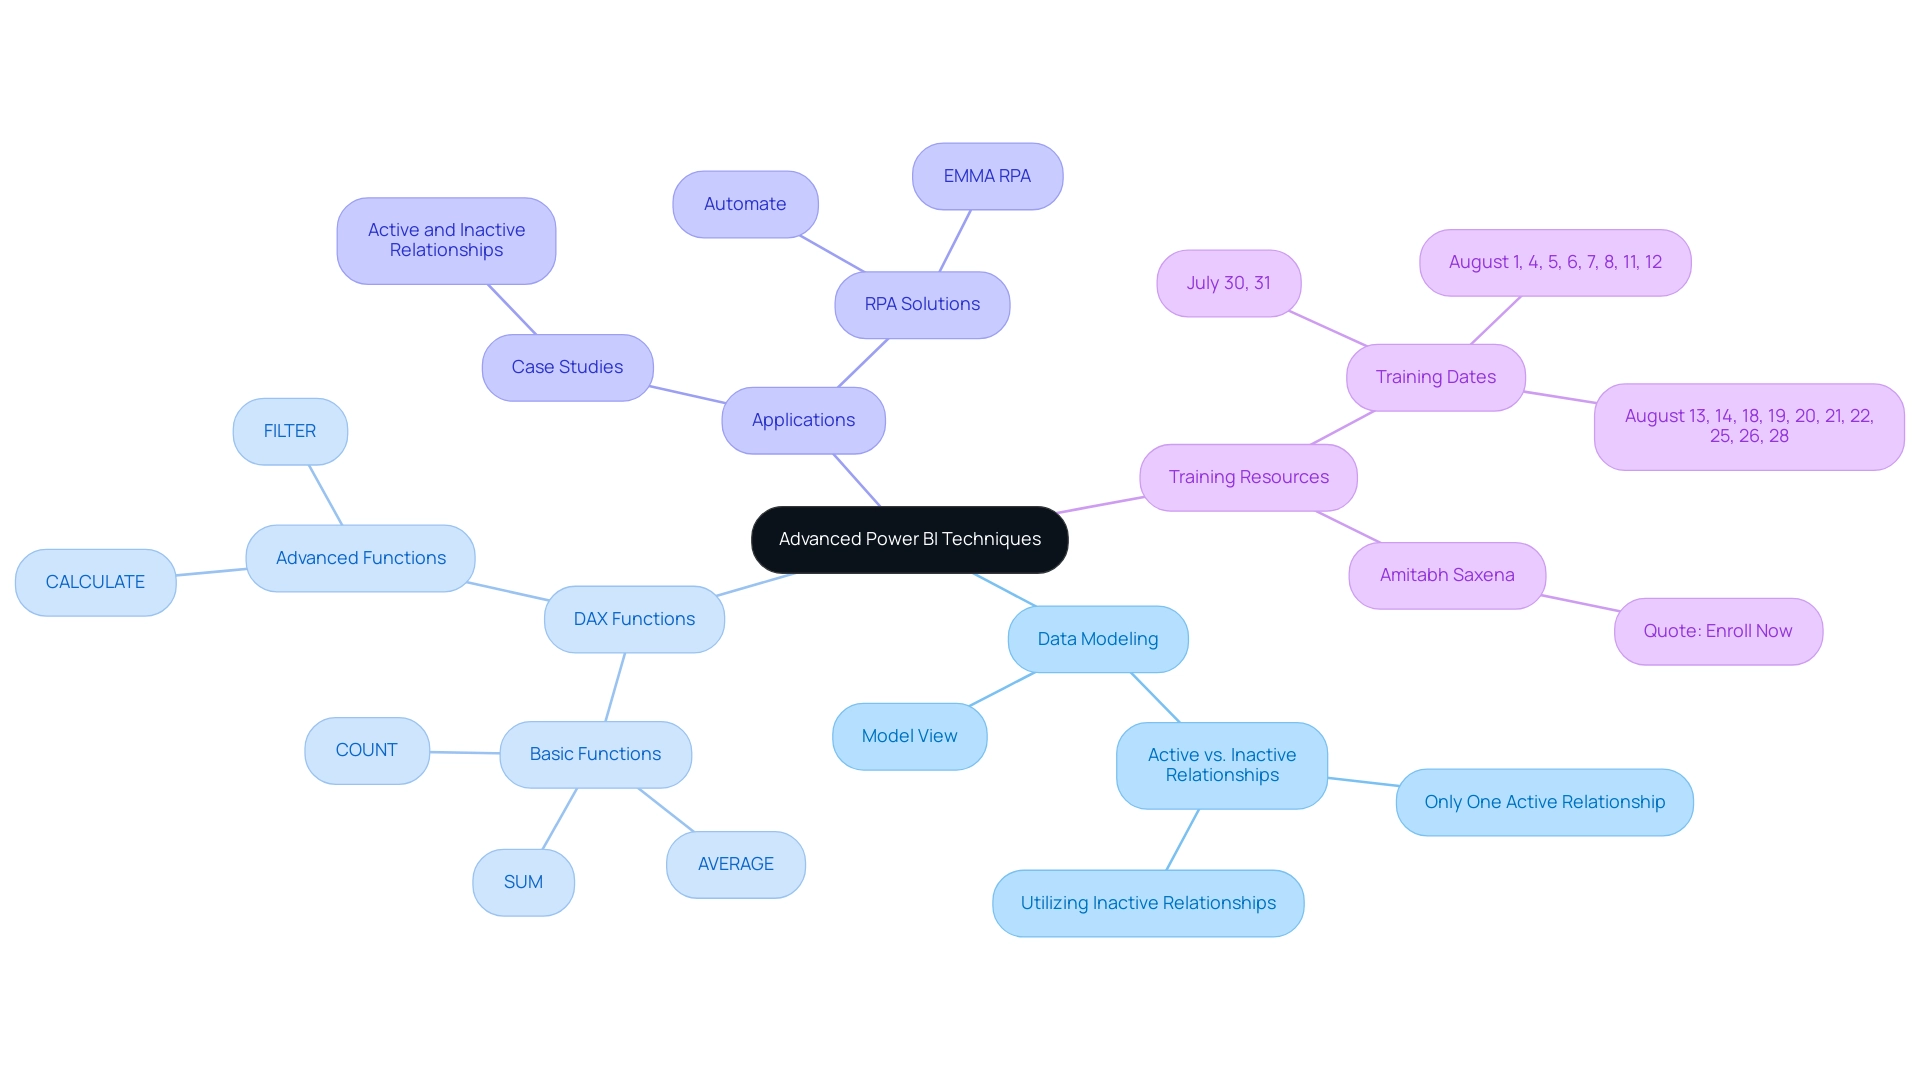
Modeling information in data analytics using Power BI is an essential process that enables you to establish connections between different tables, ultimately providing a comprehensive view of your datasets. In today’s data-rich environment, where extracting actionable insights is essential for business growth, data analytics using Power BI allows you to navigate to the ‘Model’ view to establish these critical relationships by simply dragging fields. Understanding the context of these relationships is vital; it’s essential to note that only one active relationship can exist between two tables at any given time, while additional relationships remain inactive.
This design helps prevent conflicting outcomes in your analysis and addresses common challenges such as inconsistencies and task repetition fatigue, which can lead to staffing shortages within teams.
A powerful tool at your disposal is DAX (Data Analysis Expressions), a robust formula language that allows you to generate custom calculations tailored to your business needs. Mastering fundamental functions such as SUM, AVERAGE, and COUNT is the first step in your DAX journey. As you gain confidence, delve into more complex functions like CALCULATE and FILTER, which enable sophisticated analytical capabilities and help overcome the time-consuming report creation process often experienced in BI.
Consider integrating case studies such as the management of active and inactive relationships, which illustrate the importance of leveraging inactive relationships through DAX expressions or duplicate dimension tables. This approach not only enhances your modeling flexibility but also maintains optimal performance in data analytics using Power BI, driving insights that are essential for operational efficiency. Furthermore, employing RPA solutions such as EMMA RPA and Automate can greatly reduce task repetition fatigue, enhancing information management and reporting processes.
To further bolster your DAX proficiency, take advantage of the wealth of resources available in BI community forums and Microsoft documentation. Continuous learning is key, and as Amitabh Saxena emphasizes, “Enroll Now” in the upcoming training sessions scheduled for July 30, 31, August 1, 4, 5, 6, 7, 8, 11, 12, and continuing through August 26, 2025. These sessions will be instrumental in assisting you in mastering the latest advancements in modeling techniques, including DAX usage for complex calculations, ultimately empowering you to leverage Business Intelligence effectively.
Creating Effective Visualizations in Power BI: Best Practices
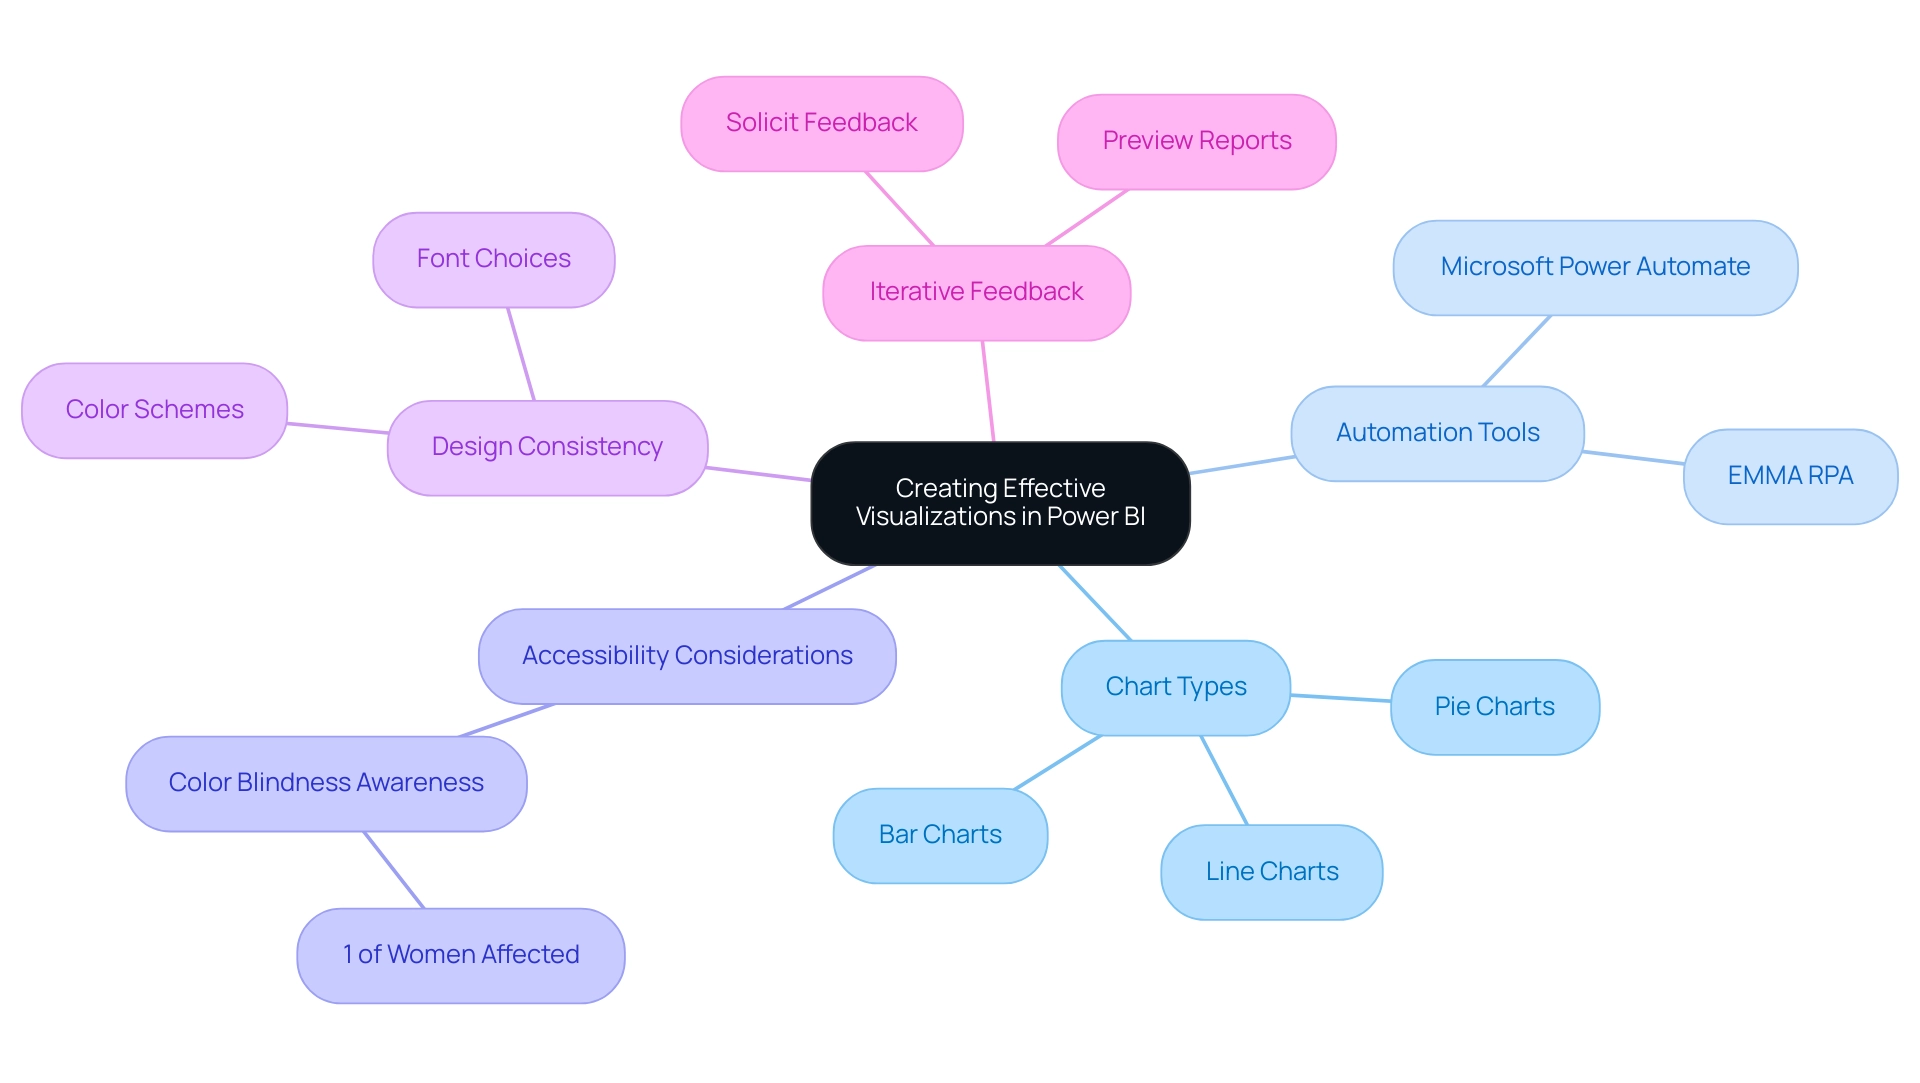
Developing impactful visual representations in BI requires a clear comprehension of your audience and the messages you intend to convey. Selecting the appropriate chart type is essential; for instance:
- Bar charts excel at illustrating comparisons.
- Line charts effectively showcase trends over time.
- Pie charts are ideal for displaying parts of a whole.
Integrating Robotic Process Automation (RPA) tools like EMMA RPA or Microsoft Power Automate can further improve this process by automating repetitive tasks related to information preparation, enabling your team to concentrate on strategic insights instead of manual document creation.
It’s also important to consider accessibility, as around 1% of women have some form of color blindness, impacting how your visuals are perceived. To maintain clarity and enhance readability, limit the number of visuals on each page—this prevents clutter and facilitates user engagement. Furthermore, harnessing features such as tooltips and drill-through capabilities provides additional context without overwhelming users.
As Microsoft emphasizes, ‘Environmental, Social, and Governance (ESG) reporting is becoming a priority for businesses worldwide,’ making effective information storytelling increasingly essential. Consistency in color schemes and font choices is equally crucial, as it contributes to a polished, professional appearance that aids interpretation. Always take the time to preview your reports and solicit feedback; this iterative process is vital for refining your visual storytelling.
The integration of Business Intelligence tools, such as data analytics using Power BI’s built-in analytics features, can help ensure consistency, transforming raw information into actionable insights, thereby driving growth and innovation. For example, the case study titled ‘Help the User’ illustrates how combining documentation and help icons can assist users in navigating the dashboard, making exploration intuitive and informative. Additionally, a real-world example of a company that implemented RPA and BI integration led to a 30% reduction in report preparation time, showcasing the tangible benefits of these technologies.
Integrating Power BI with Other Tools: Enhancing Your Data Analysis Workflow
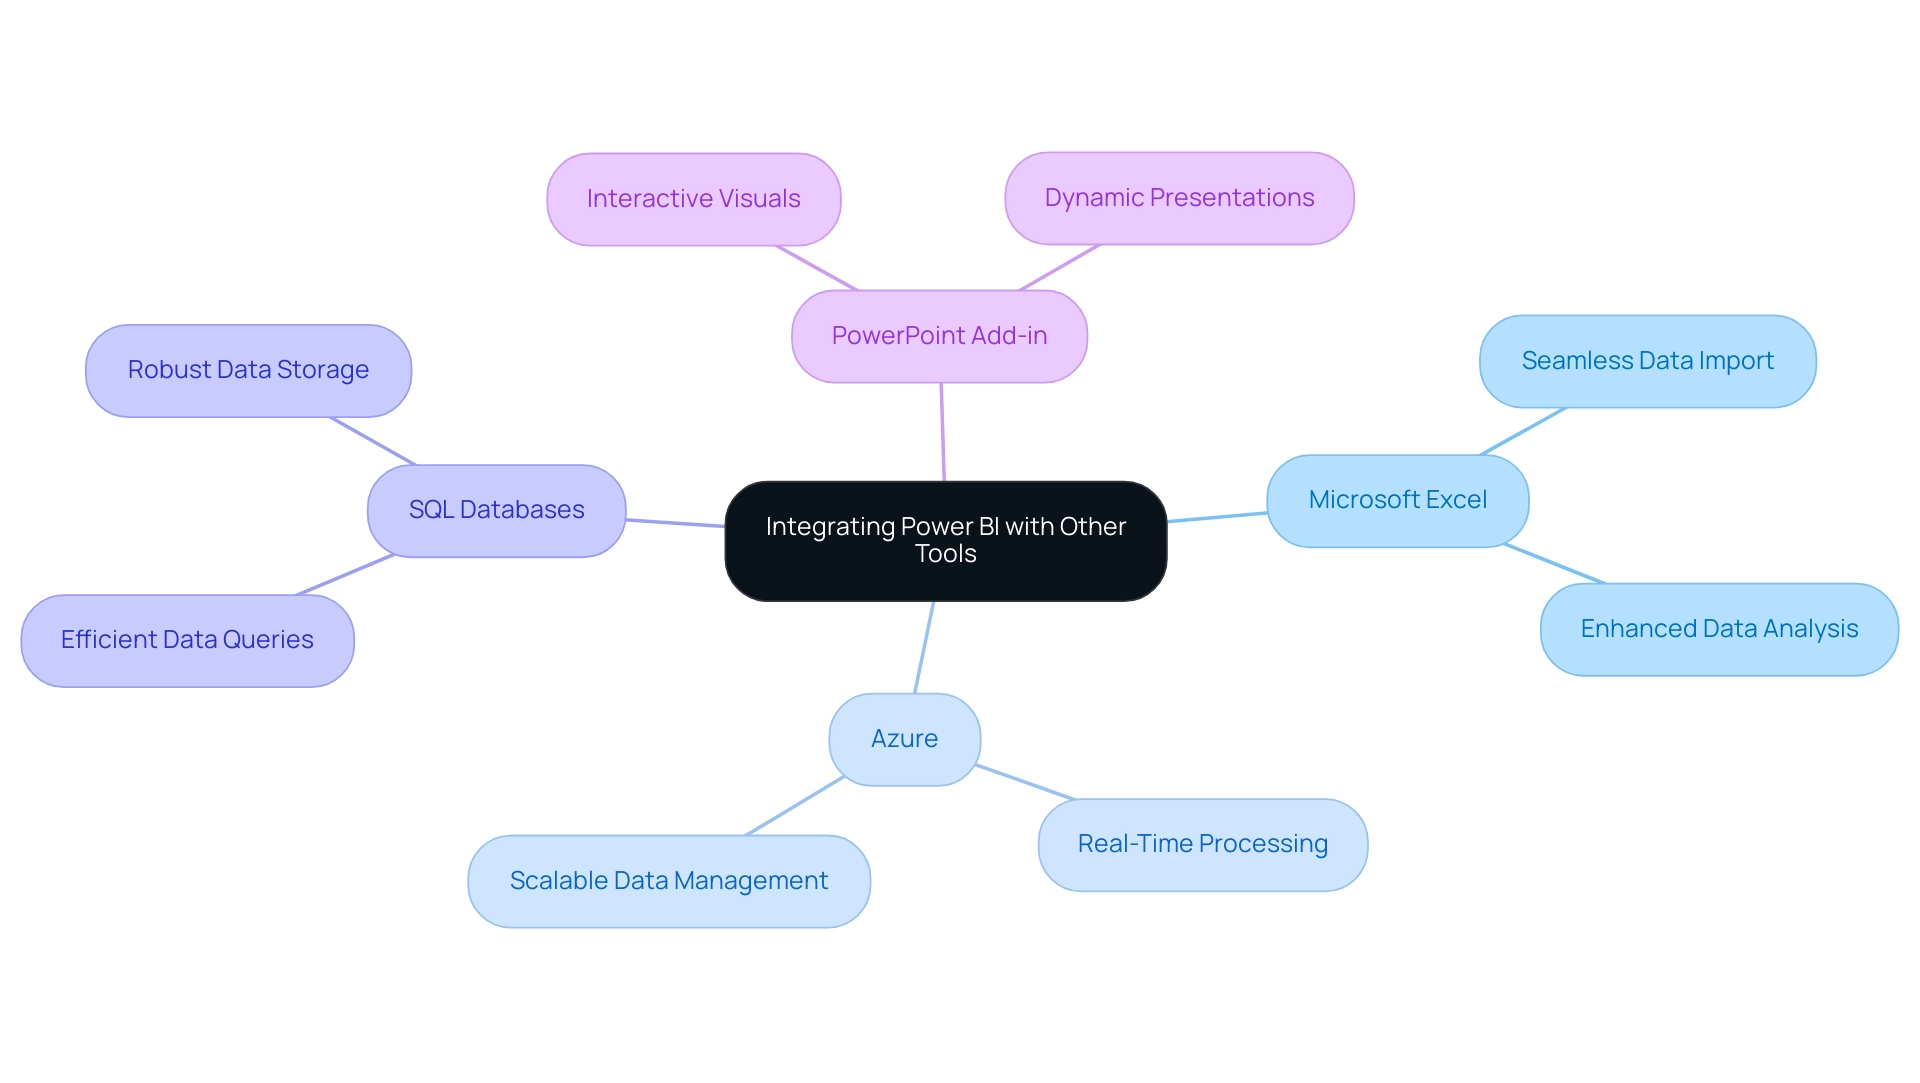
BI not only provides smooth integration with a broad range of tools, including Microsoft Excel, Azure, and SQL databases, but also acts as a strong partner in improving your analysis workflows. With the ability to manage up to 100 TB of information, BI guarantees effective oversight of even the largest datasets. As noted by Jamie O’Brien, ‘Microsoft was named a Leader for the seventeenth year in a row’ in the 2024 Gartner Magic Quadrant for Analytics and Business Intelligence Platforms, underscoring the platform’s strength in the analytics space.
To enhance information preparation, utilize Query for importing and shaping content from various sources before analysis in BI. Linking BI with Azure enables real-time information processing, improving the immediacy and relevance of your insights. Furthermore, the new BI add-in for PowerPoint allows users to integrate live, interactive visuals into presentations, providing an appealing substitute for static screenshots.
Through our 3-Day Power BI Sprint, we promise to deliver a fully functional, professionally designed report tailored to your needs, demonstrating the effectiveness of data analytics using Power BI in addressing common challenges such as:
- Time-consuming report creation
- Data inconsistencies
Case studies, such as automating reporting with Coupler.io, illustrate how clients have saved time and resources, empowering their teams to prioritize strategic initiatives over routine updates. This allows you to focus on leveraging insights for impactful business decisions.
Conclusion
Power BI stands as a transformative force in the realm of data analytics, enabling organizations to convert raw data into actionable insights that fuel growth and innovation. Throughout this article, the essential features of Power BI have been explored, from its user-friendly report-building capabilities to advanced data modeling techniques and effective visualization practices. The integration of Power BI with RPA solutions exemplifies how organizations can streamline their workflows, reduce report preparation times, and enhance operational efficiency.
Mastering Power BI is not merely about gaining technical skills; it’s about empowering teams to make informed decisions that drive strategic initiatives. By leveraging features such as:
- Data transformation
- DAX calculations
- Seamless integration with other tools
organizations can unlock the full potential of their data. This positions them to navigate the complexities of today’s data-driven landscape with confidence.
Ultimately, the journey with Power BI is one of continuous learning and adaptation. As industries like Banking, Financial Services, and Insurance experience rapid advancements in business intelligence, embracing Power BI becomes imperative. The insights gained from this powerful tool can lead to significant competitive advantages, ensuring that organizations not only keep pace with industry trends but also set the stage for future success.

