Introduction
In the digital age, where data reigns supreme, the ability to effectively harness and analyze information is paramount for organizations striving for operational excellence. Power BI stands out as a powerful tool that transforms raw data into actionable insights, but the journey begins with mastering the intricacies of data importation, transformation, visualization, and sharing.
This article delves into practical strategies and techniques that empower users to navigate Power BI with confidence, enhancing their reporting capabilities and driving informed decision-making. From understanding the nuances of data sources to optimizing report performance, each section is designed to equip professionals with the essential skills needed to thrive in an increasingly data-driven landscape.
By embracing these methodologies, organizations can unlock the full potential of their data, fostering a culture of continuous improvement and strategic insight.
Exploring Data Sources: How to Import Data into Power BI
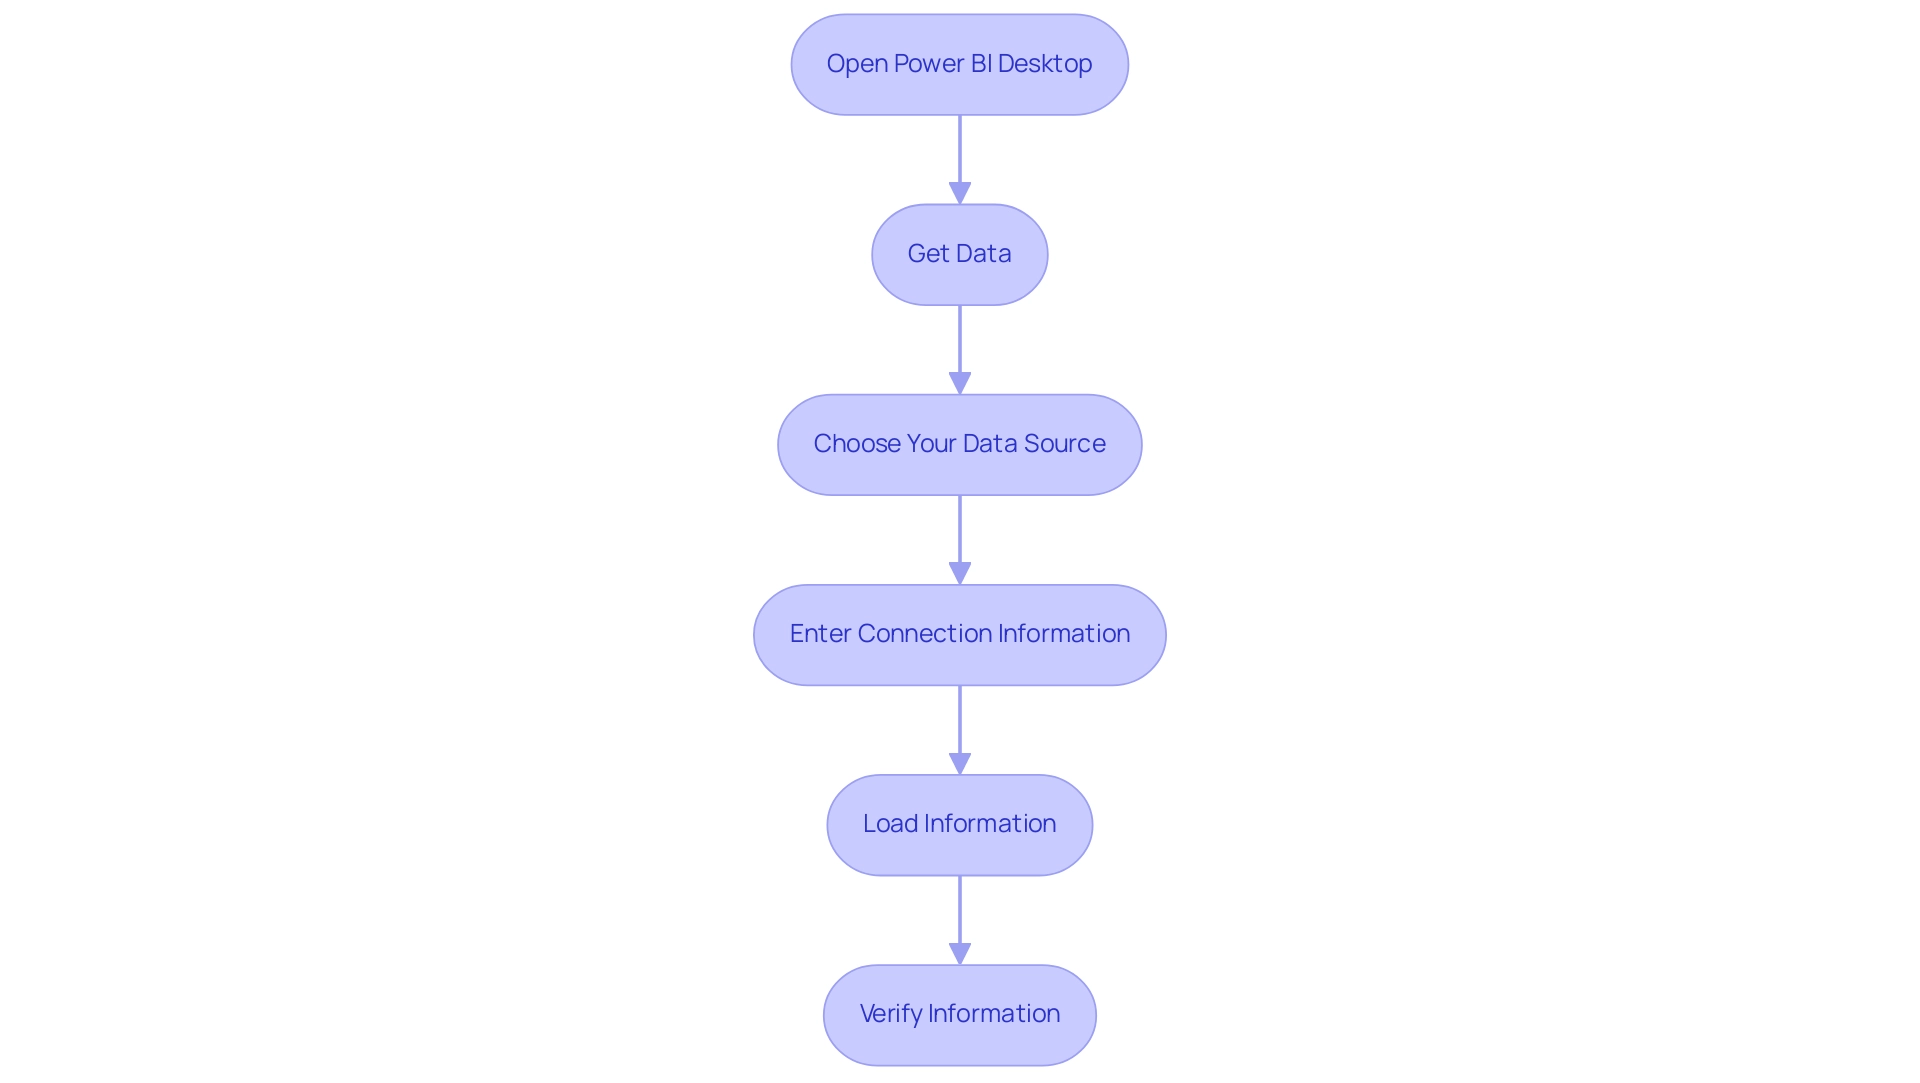
Understanding how to get data into Power BI is a vital initial step in utilizing its features for effective analysis and enhancing operational efficiency. The platform supports a variety of information sources, including Excel spreadsheets, SQL databases, cloud services like Azure, and web APIs. Here’s a streamlined process to get you started:
- Open Power BI Desktop: Launch the application on your computer.
- Get Data: Navigate to the ‘Home’ tab and select ‘Get Data.’ This action will open a window showcasing various source options.
- Choose Your Data Source: Identify and select the relevant source from the list (e.g., Excel, SQL Server, etc.), then click ‘Connect.’
- Enter Connection Information: Depending on the chosen source, you may need to input specific details such as the file path or server name.
- Load Information: After establishing the connection, a preview of the information will appear. Choose the tables or queries you wish to import, then click ‘Load.’
- Verify Information: Once imported, review the information model to confirm that all details have been accurately integrated.
Implementing these steps will facilitate seamless integration of diverse sources into BI, effectively demonstrating how to get data into Power BI and laying a strong foundation for insightful analysis. In a setting where lengthy document generation and information discrepancies can impede advancement, utilizing RPA tools like EMMA RPA and Automate can streamline these manual processes, greatly improving operational efficiency and allowing your team to concentrate on strategic perspectives. Tackling the ‘Lack of Evidence-Based Insights’ is vital; efficient information integration through BI not only streamlines operations but also enables organizations to extract actionable insights from their information.
Recent reports indicate that the BFSI sector is poised for rapid growth in information management from 2023 to 2032, making effective integration more crucial than ever. Additionally, as noted by Joaquin, a Microsoft Employee, prioritizing usage statistics on Power BI Report Server can significantly enhance reporting capabilities. Furthermore, as emphasized in the case study titled ‘Prioritization of Information Governance and Location Intelligence,’ organizations that implement effective information governance and location intelligence strategies benefit from enhanced operational efficiency.
By adopting these practices, you position your organization at the forefront of the evolving information landscape.
Transforming Data in Power BI: Essential Techniques and Tools
Once you learn how to get data into Power BI, effective transformation becomes essential for providing insightful analysis. Notably, Coupler.io permits refresh schedules as frequently as every 15 minutes, underscoring the significance of timely management.
Here are key techniques and tools to empower you in this process:
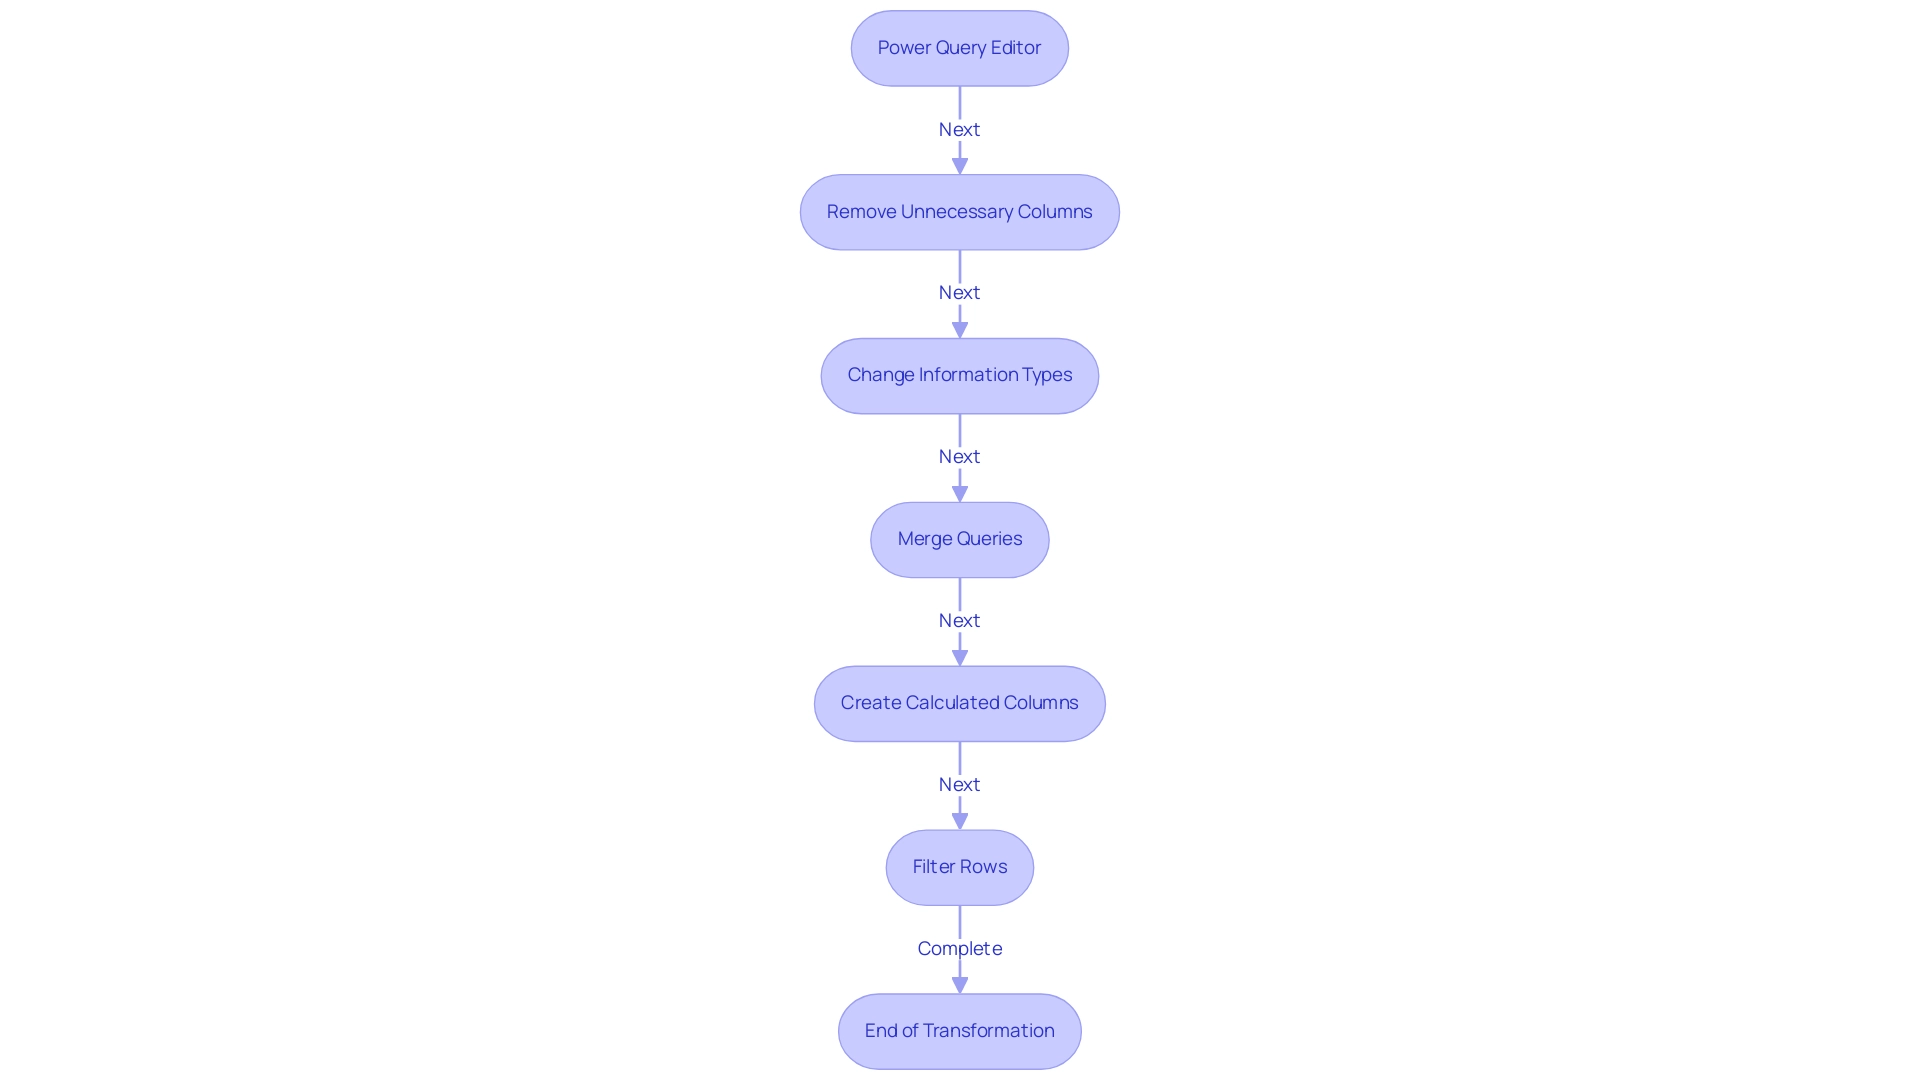
- Power Query Editor: Begin by utilizing the Power Query Editor to clean and transform your information. You can access this tool by clicking ‘Transform Data’ after loading your dataset. This feature is fundamental for optimizing information before analysis.
- Remove Unnecessary Columns: Streamline your dataset by identifying and removing any columns that do not contribute to your analysis. This aids in concentrating on pertinent information and improves performance.
- Change Information Types: Ensure that each column reflects the correct type—be it text, number, or date. Choose the column and modify the type in the ribbon to ensure integrity.
- Merge Queries: To combine information from various sources effectively, employ the ‘Merge Queries’ function. This capability allows for vertical and horizontal dataset expansion, creating a unified dataset for comprehensive analysis through append and join operations.
- Create Calculated Columns: Utilize DAX (Data Analysis Expressions) to formulate new columns derived from existing information, enabling more complex calculations and deeper insights.
- Filter Rows: Apply filters to exclude any irrelevant or duplicate entries, ensuring that your analyses are grounded in accurate information.
Integrating BI services like the 3-Day BI Sprint, which enables quick creation of visuals, and the General Management App can greatly enhance your workflow. These services directly tackle challenges such as time-consuming report creation and inconsistencies by providing structured frameworks for efficient management. Furthermore, integrating Automation can enhance operational efficiency, ensuring risk-free ROI assessments and professional execution of your automation needs.
Mastering these transformation techniques will not only enhance your preparation process but also align with the broader goal of learning how to get data into Power BI to harness Business Intelligence and RPA solutions for driving insights and operational efficiency for business growth. The case study titled ‘Using Statistical Measures in Power BI‘ illustrates the significance of statistical measures in analysis, particularly using a Car Sales dataset as an example. As noted by Denys Arkharov, a BI Engineer at Coupler.io, effective information management is crucial for impactful reporting, reflecting the growing trend of utilizing statistical measures to drive analysis.
By embracing these practices, you position yourself to extract the maximum value from your information. Additionally, explore our Actions portfolio for tailored solutions and consider booking a free consultation to discuss how we can support your information management needs.
Creating Visualizations in Power BI: Best Practices
Creating impactful visualizations in Power BI requires a deep understanding of both your information and your audience, as well as proficiency in essential Power BI tools like Power Query for transformation and DAX for advanced calculations. To achieve this, consider the following best practices:
-
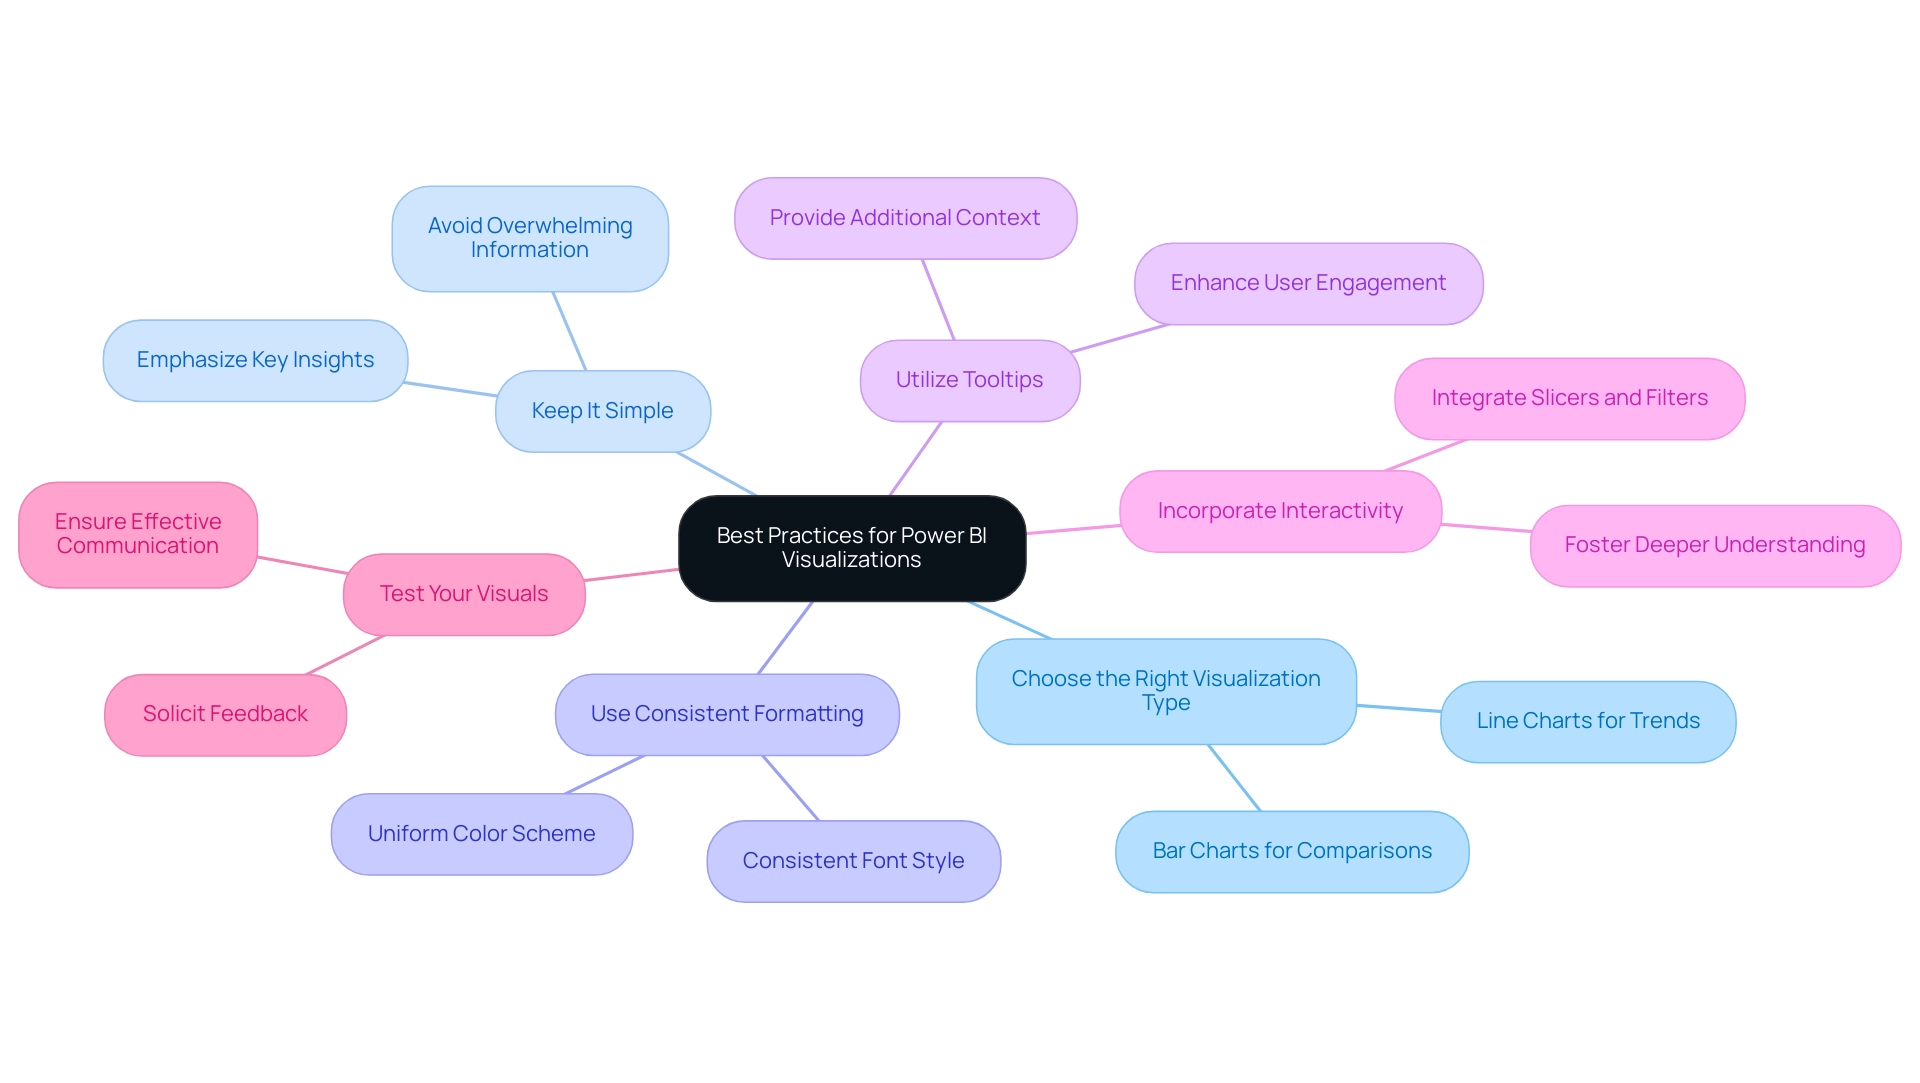
Choose the Right Visualization Type: Selecting an appropriate visualization is crucial; for instance, utilize bar charts for comparisons and line charts to illustrate trends effectively.
This choice is vital in ensuring that your data-driven conclusions are communicated clearly. -
Keep It Simple: Clarity is key—avoid overwhelming your visuals with excessive information. Emphasizing key insights will guarantee your documents stay intuitive and easy to navigate, tackling common challenges such as time-consuming creation and inconsistencies.
-
Use Consistent Formatting: A uniform color scheme and consistent font style will lend a professional touch to your report, enhancing readability and user experience, which is essential in a data-rich environment.
-
Utilize Tooltips: Improve user engagement by implementing tooltips that provide additional context when users hover over specific information points, enriching the overall experience and encouraging informed decision-making.
-
Incorporate Interactivity: Empower users by integrating slicers and filters, which allow them to explore various dimensions of the information, fostering a deeper understanding of the content presented and driving operational efficiency.
-
Test Your Visuals: Prior to finalizing your report, solicit feedback from colleagues or stakeholders to ensure that your visualizations convey the intended message effectively, thereby overcoming the challenges of actionable guidance.
Additionally, understanding the Gestalt Principles of visual perception can significantly aid in effective dashboard design and communication of actionable information. These principles help in organizing visual elements in a way that enhances user comprehension. To further enhance operational efficiency, consider how RPA can assist in automating repetitive tasks related to data visualization and reporting, addressing task repetition fatigue and staffing shortages. By adhering to these best practices, you can craft compelling visualizations that not only engage your audience but also communicate insights with precision.
Additionally, as Marco Russo from SQLBI.com recommends,
Watch Dashboard design best practices in BI for design tips; staying updated on the latest trends can significantly enhance your reporting capabilities and ensure your business remains competitive.
Ultimately, with the current average sales this month hovering around $180,000, the ability to present information effectively can play a pivotal role in driving business success.
Publishing and Sharing Reports in Power BI
Distributing and sharing documents in BI can change how your organization works together and uses information. Follow these straightforward steps to ensure your documents reach the right audience effectively:
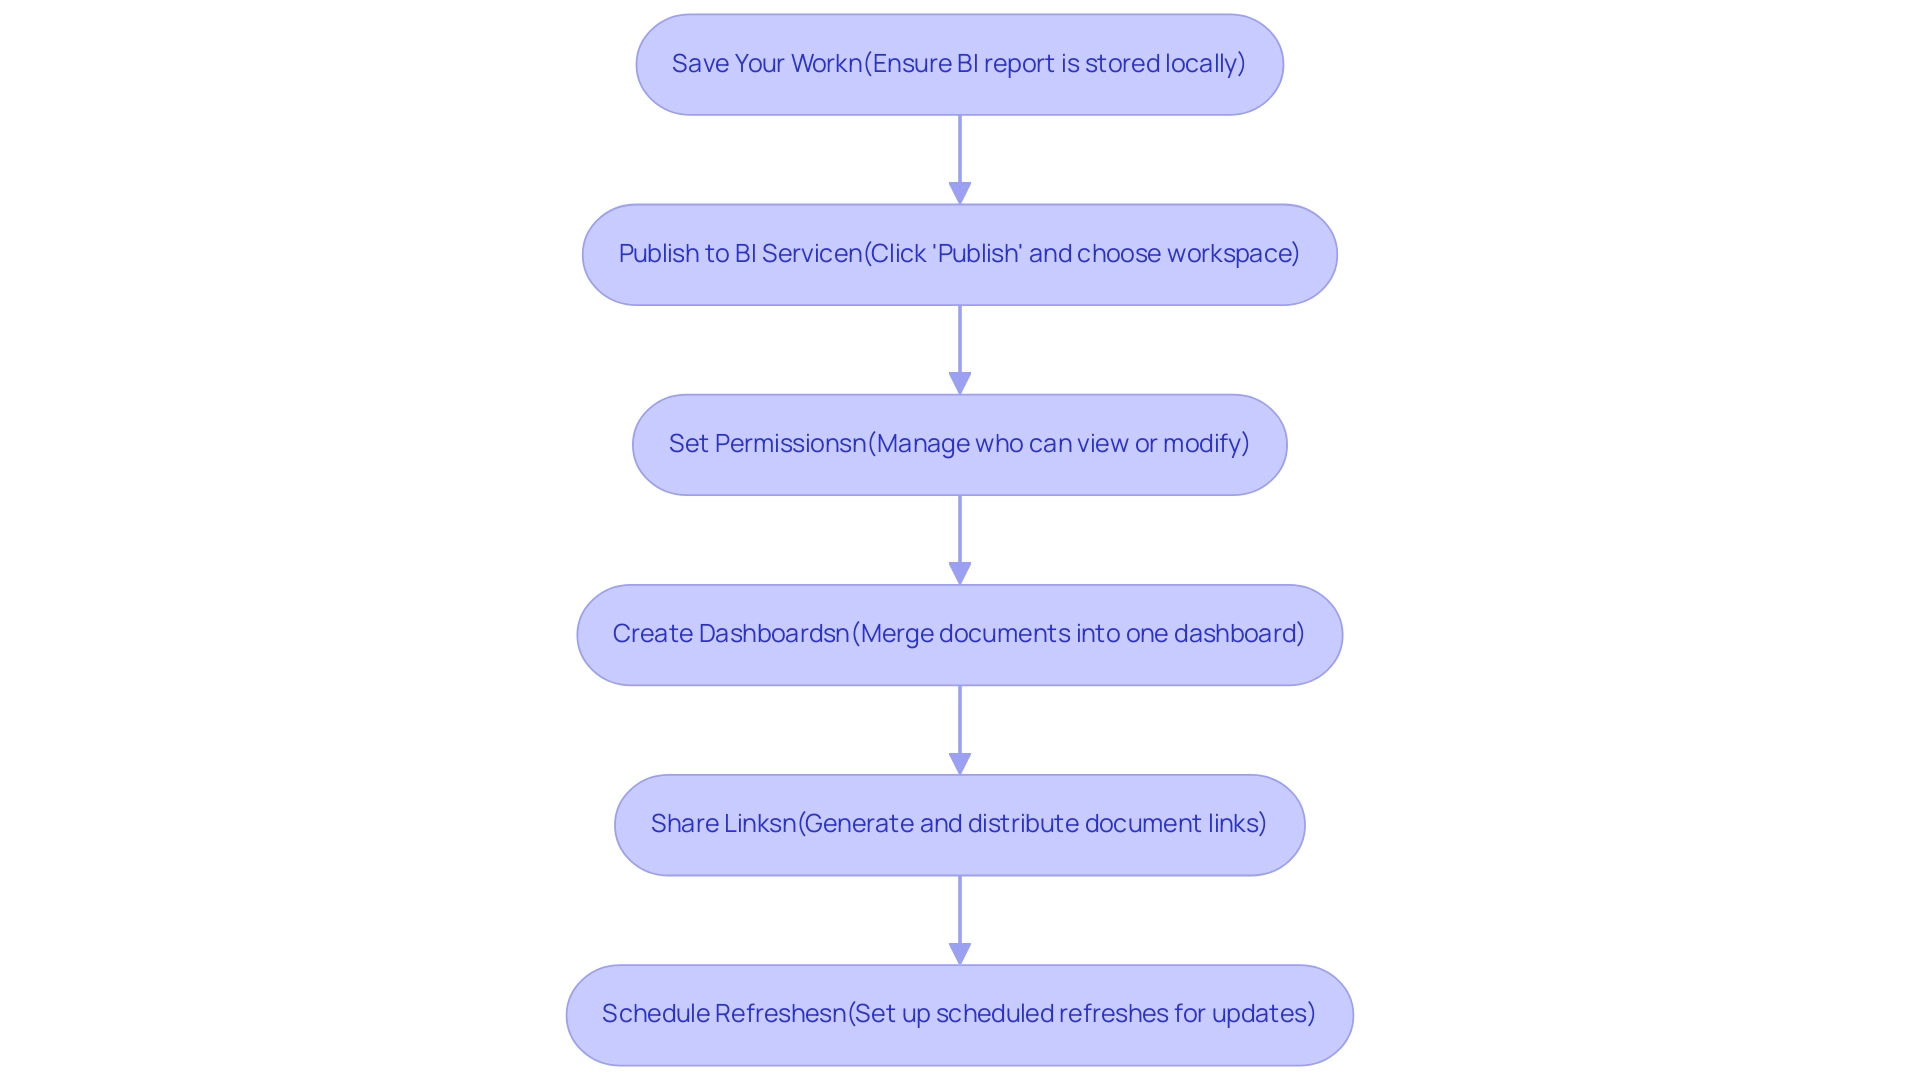
- Save Your Work: Before publishing, ensure your BI report is stored locally to prevent any data loss.
- Publish to BI Service: Click on the ‘Publish’ button in BI Desktop. Sign in to your BI account and choose the desired workspace for your report.
- Set Permissions: After publishing, head over to the Power BI Service. Here, you can manage permissions, indicating who can view or modify your document, ensuring information security and control. Note that without Row-Level Security (RLS) or Object-Level Security (OLS), shared documents provide full access to the underlying semantic model information, which is critical to manage carefully.
- Create Dashboards: Improve information analysis by merging several documents into one dashboard. Pin visuals from different documents to create a cohesive view that highlights key insights. Collaborative semantic models in Business Intelligence allow organizations to utilize well-structured information models across documents, ensuring uniformity in information interpretation.
- Share Links: Utilize the ‘Share’ function to generate a link to your document or dashboard. This link can be easily distributed to colleagues and stakeholders, promoting accessibility and collaboration.
- Schedule Refreshes: For dynamic information sources, set up scheduled refreshes in the BI Service. This guarantees your documents reflect the latest information, keeping your team informed and prepared to make data-driven decisions.
By mastering these steps, you can improve your organization’s data management capabilities and understand how to get data into Power BI. Furthermore, think about participating in our 3-Day BI Sprint, where we will collaborate with you to create a refined, fully operational document customized to your requirements. This service includes personalized guidance, advanced analytics integration, and the creation of a template that you can leverage for future projects, allowing you to focus on utilizing the insights that drive growth and innovation.
Book your free consultation today to get started!
Monitoring and Improving Report Performance in Power BI
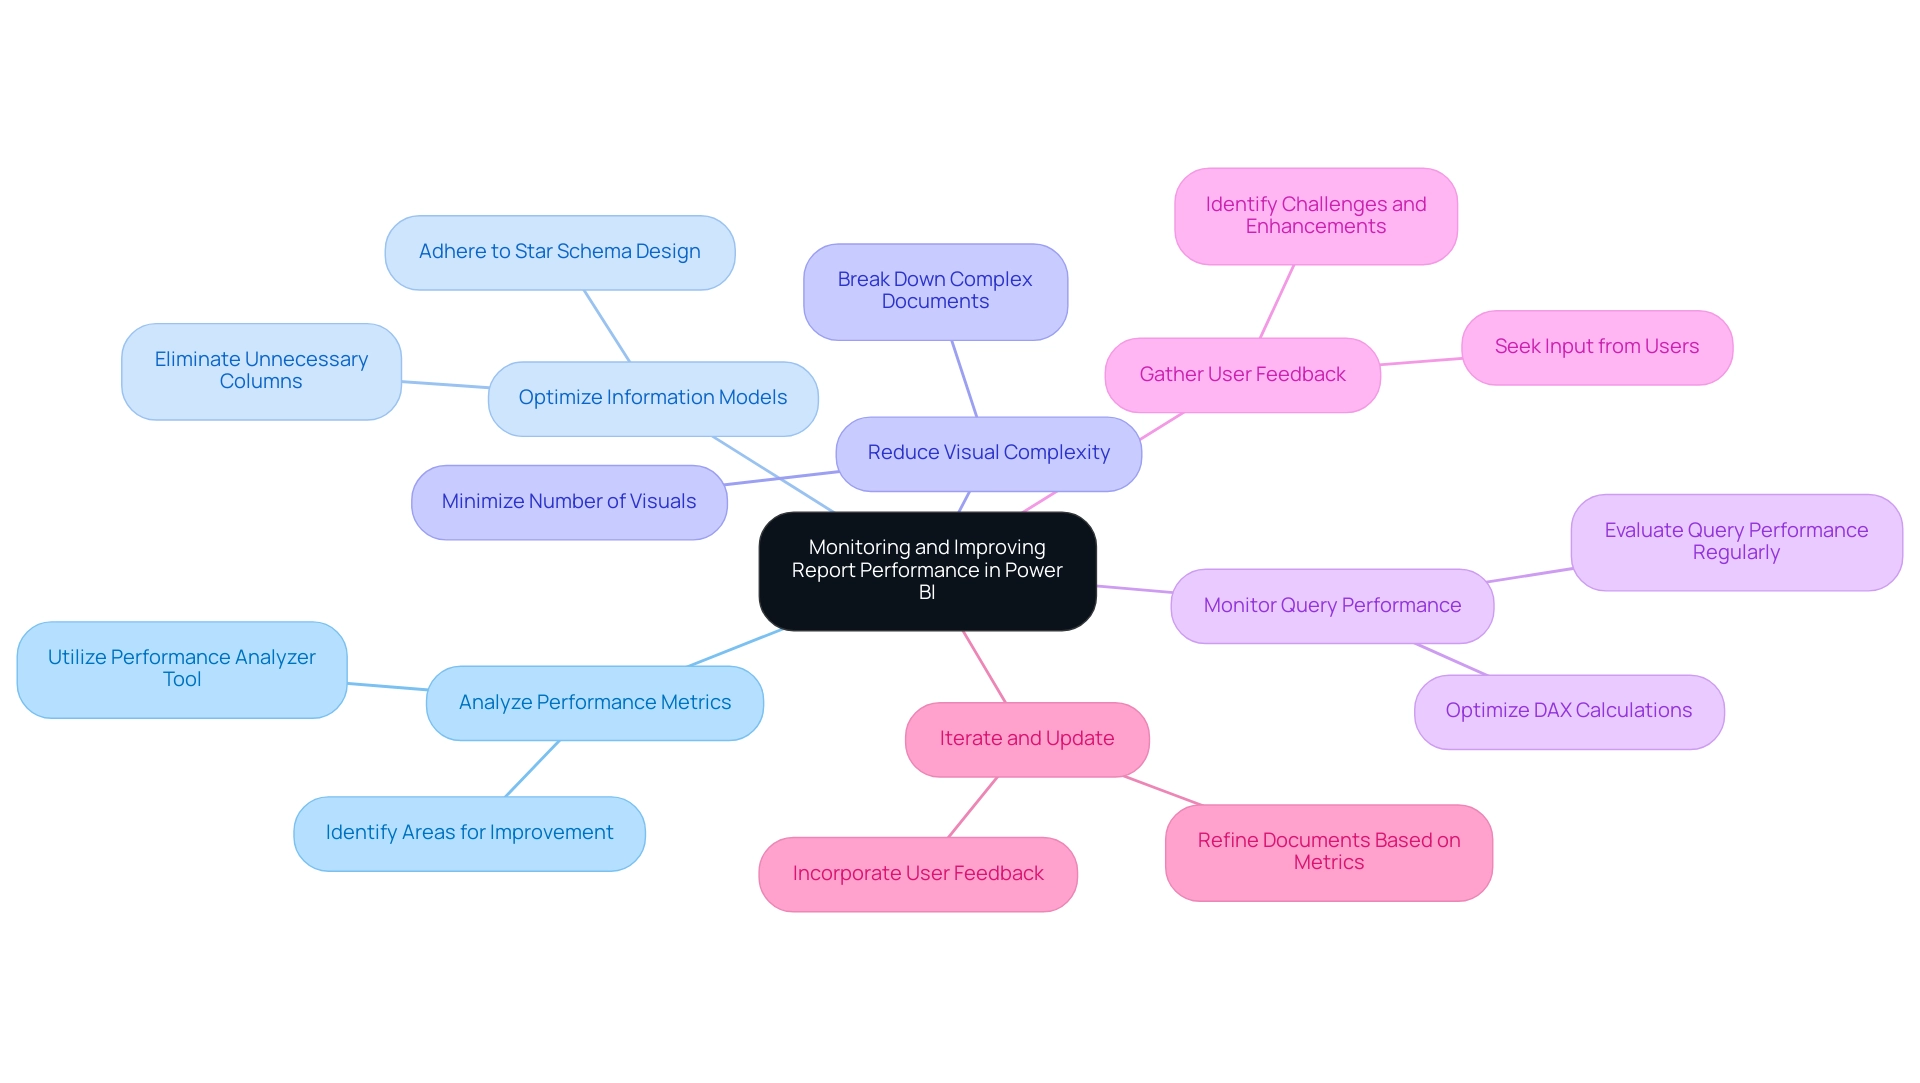
To effectively monitor and enhance the performance of your Power BI reports and harness their full potential, consider implementing the following strategies alongside our specialized Power BI services:
-
Analyze Performance Metrics: Utilize the Performance Analyzer tool in Power BI to identify areas where your outputs may experience delays. This tool is invaluable for understanding load times associated with different visuals, allowing for targeted improvements that enhance overall efficiency.
-
Optimize Information Models: Ensure your model operates efficiently by eliminating unnecessary columns and tables. Adhering to star schema design principles can significantly streamline data retrieval and processing, enhancing performance of outputs.
-
Reduce Visual Complexity: To improve load times, minimize the number of visuals on a single page. Breaking down complex documents into multiple pages or tabs can lead to a better user experience and enhanced performance.
-
Monitor Query Performance: Regularly evaluate the performance of the queries used in your analyses. Optimize DAX calculations to enhance efficiency, ensuring that your outputs run smoothly under various conditions.
-
Gather User Feedback: Actively seek input from users to identify challenges they encounter and areas for future enhancements. Their insights can direct your optimization efforts effectively, ensuring your documents meet user needs.
-
Iterate and Update: Commit to continuously refining your documents based on performance metrics and user feedback. This iterative process ensures your documents remain effective and deliver maximum value to your organization.
Additionally, consider utilizing our 3-Day BI Sprint to quickly create professionally designed reports that incorporate these strategies. The General Management App can also enhance your management capabilities, providing comprehensive oversight and smart reviews of your data.
In a practical application of these strategies, consider the ‘Time-Tracking Dashboard for Harvest in Business Intelligence.’ This dashboard effectively displays time usage for a team providing paid services, detailing billable hours and client-specific time allocation. By analyzing total hours and profit margins, the dashboard reveals areas for optimization and tracks performance effectively.
As Denys Arkharov, a BI Engineer at Coupler.io, states, “A notable achievement in my career was my involvement in creating Risk Indicators for Ukraine’s ProZorro platform, a project that led to my work being incorporated into the Ukrainian Law on Public Procurement.” This emphasizes the importance of performance monitoring in driving significant outcomes.
By utilizing these techniques and real-world examples, along with the powerful tools offered by our Power BI services, you can ensure your reports not only perform optimally but also provide the critical insights needed to drive operational efficiency and informed decision-making.
Conclusion
Harnessing the full potential of Power BI is an essential step for organizations looking to thrive in a data-driven landscape. The journey begins with effectively importing data from diverse sources, such as:
- Excel
- SQL databases
- Cloud services
By mastering this foundational skill, organizations can ensure a seamless integration of data that sets the stage for insightful analysis and operational efficiency.
Once data is imported, transforming it with techniques like:
- Using Power Query Editor
- Merging queries
- Creating calculated columns
becomes crucial. These practices not only enhance data preparation but also empower users to derive deeper insights through advanced analytics. Coupled with effective visualization strategies, such as selecting the right chart types and maintaining clarity, organizations can communicate their findings in a compelling manner that drives engagement and informed decision-making.
Publishing and sharing reports effectively further amplifies the impact of insights generated through Power BI. By:
- Setting appropriate permissions
- Creating dashboards that consolidate information
organizations can ensure that stakeholders have access to the data they need, fostering a collaborative environment. Additionally, monitoring report performance through tools like Performance Analyzer and optimizing data models ensures that reports run smoothly and efficiently, ultimately enhancing user experience.
By adopting these strategies, organizations not only improve their operational efficiency but also cultivate a culture of data-driven decision-making. In today’s fast-paced environment, leveraging Power BI to its fullest extent can lead to significant competitive advantages, enabling teams to focus on strategic insights that drive growth and innovation. Embracing these methodologies positions organizations at the forefront of the evolving data landscape, ready to tackle challenges and seize opportunities with confidence.
