Introduction
In the realm of data analysis, Power BI stands out as a powerful tool that empowers organizations to transform raw data into actionable insights. At the heart of this transformation lies the effective use of sample data, which not only accelerates the learning curve for new users but also enhances the quality of reports and dashboards.
By leveraging pre-defined datasets, businesses can bypass the hurdles of data collection and inconsistencies, allowing them to focus on what truly matters—extracting meaningful trends and insights that drive strategic decisions.
As organizations increasingly recognize the value of data-driven approaches, understanding the best practices for utilizing sample data becomes essential. This article delves into the myriad benefits of sample data in Power BI, offering practical strategies to optimize its use and ultimately elevate decision-making processes across various sectors.
Understanding Sample Data in Power BI: A Key Component for Effective Analysis
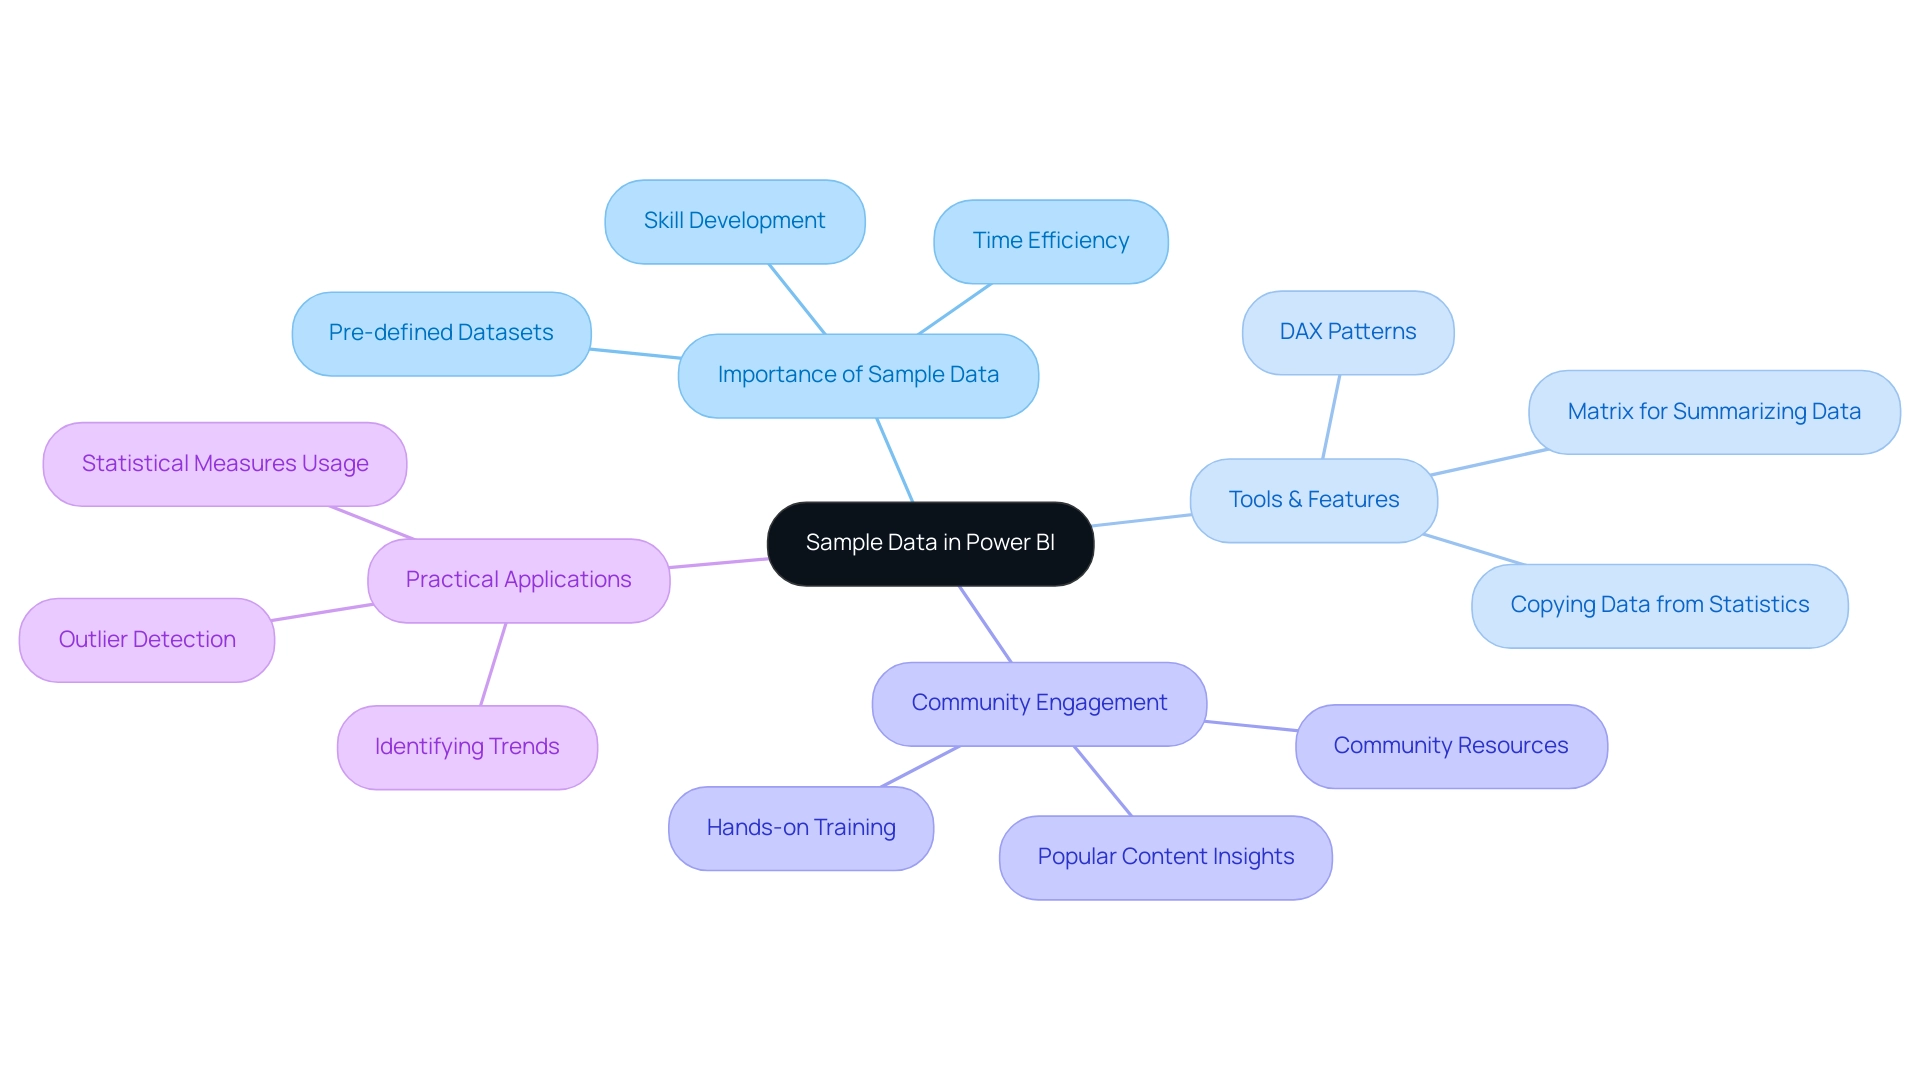
In Power BI, sample information serves as a vital resource for users, especially as they navigate the complexities of information management and insights generation. By utilizing pre-defined datasets, newcomers can engage with the software’s features without the delay of collecting their own information. This prompt access not only promotes skillfulness in information manipulation and visualization but also tackles the prevalent issues of time-consuming document creation and information inconsistencies, often worsened by an absence of governance strategy.
As individuals learn to create insightful reports using example information, they are better prepared to extract clear, actionable guidance from their analyses, addressing the common problem of reports filled with figures yet lacking clarity.
Recent improvements to BI tools, such as the capability to copy information from column statistics and the DAX Patterns repository for calculating statistical measures, further empower users. These tools streamline interactions with datasets and enhance analytical capabilities, crucial for directors focused on operational efficiency. As Greg Deckler emphasizes, community engagement is key to effective learning, and the Power BI community’s resources, including hands-on training sessions, exemplify this approach.
Notably, a case study demonstrating the use of basic statistical measures illustrates how users can summarize information without extensive technical knowledge, enabling them to identify trends, such as outliers among car sales over 180 thousand Reais. This practical usefulness of example information not only clarifies intricate ideas but also proves vital for making informed choices in real-world situations.

Use Cases of Sample Data: Enhancing Power BI Dashboards and Reports
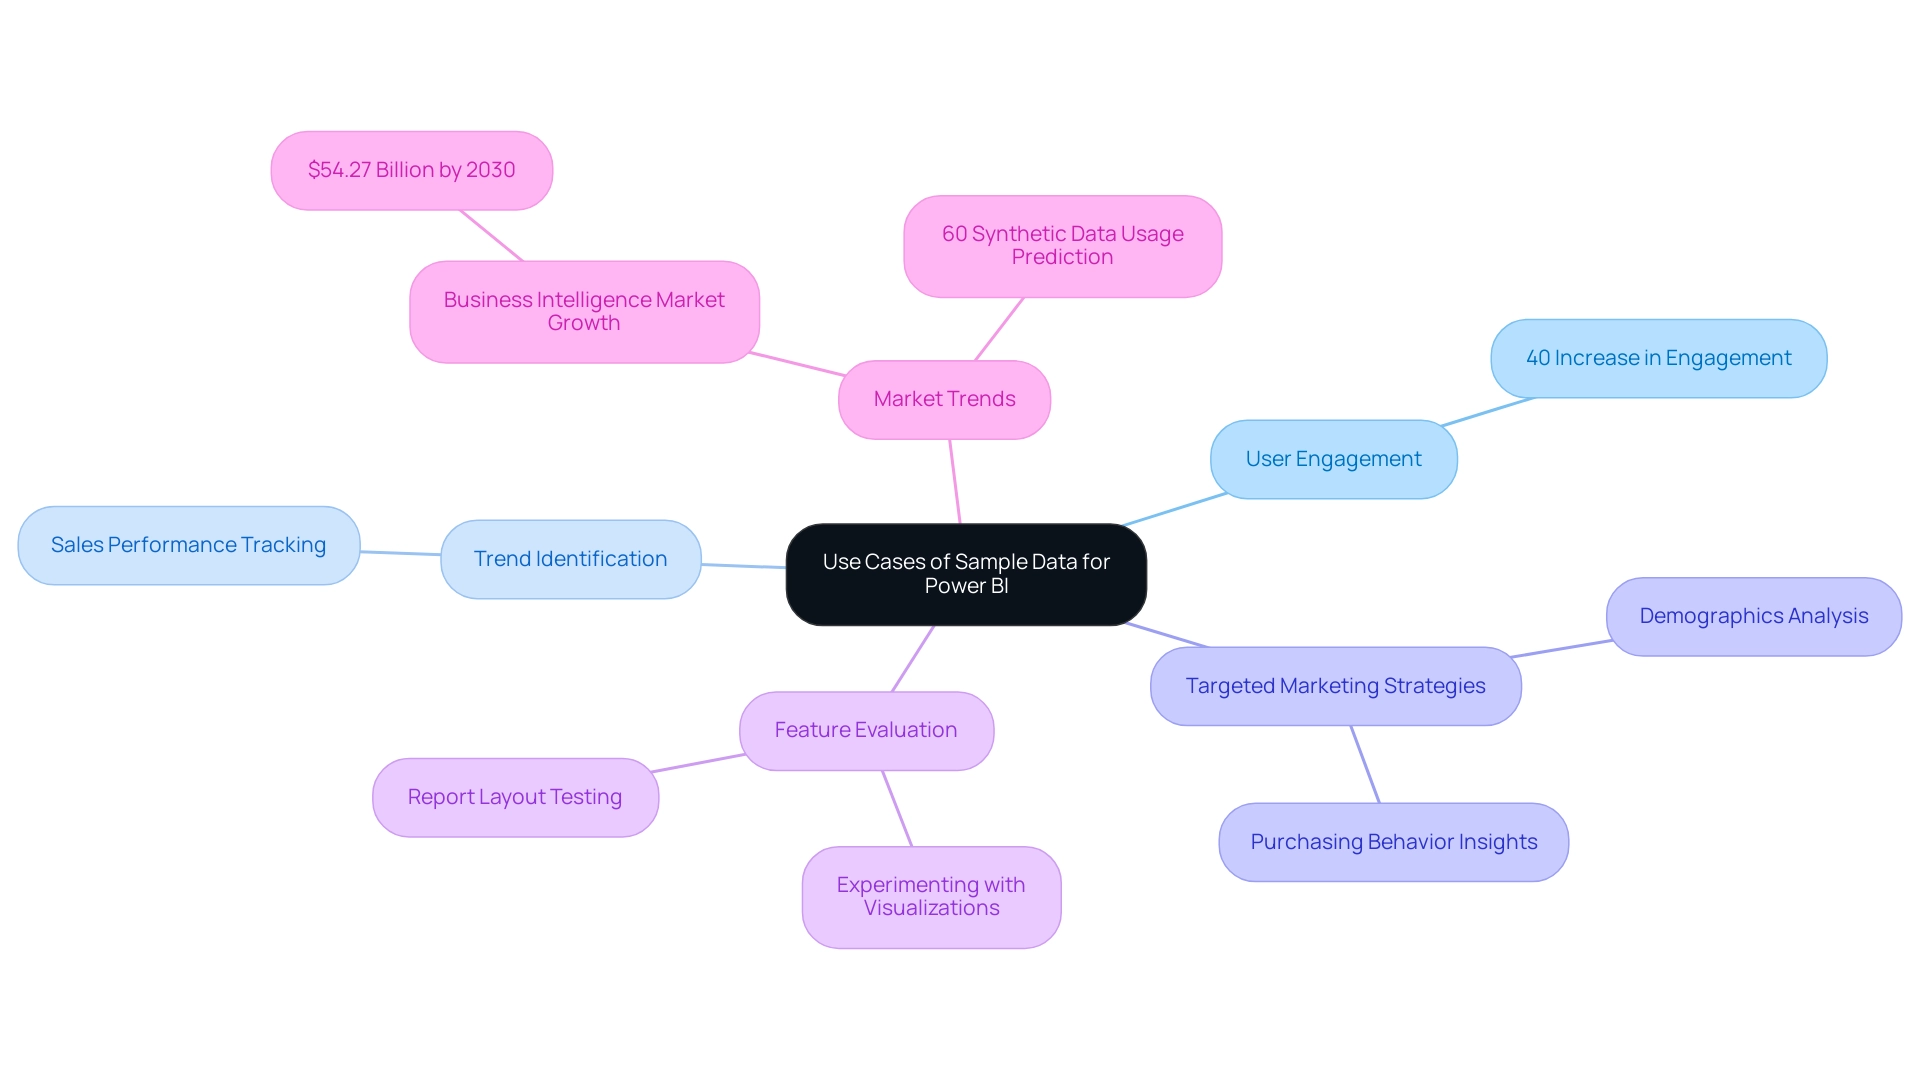
Utilizing sample data for Power BI provides numerous opportunities to enhance dashboards and reports, significantly boosting analytical capabilities. For example, statistics indicate that dashboards employing sample data for Power BI can enhance user engagement by as much as 40%, enabling organizations to generate dynamic visualizations that track sales performance over time using test sales figures. This approach enables stakeholders to identify trends and make informed, strategic decisions.
Furthermore, utilizing customer information enables companies to examine demographics and purchasing behaviors, aiding the creation of targeted marketing strategies. Another valuable use of sample data for Power BI is in evaluating new features, where users can experiment with various visualizations and report layouts without jeopardizing live information integrity. This capability not only fosters innovation but also accelerates the development of business intelligence solutions.
The recent case study of Databricks, which filed for its initial public offering (IPO), highlights the significance of innovative information management and analytics in a competitive landscape. With the business intelligence market expected to rise to $54.27 billion by 2030, utilizing sample data for Power BI becomes increasingly essential for organizations striving to stay competitive. As highlighted by industry experts, ‘The business intelligence market is evolving rapidly, and organizations must adapt to stay ahead.’
Furthermore, Gartner predicts that by the end of the year, 60% of the information utilized by AI and analytics solutions will be synthetic, making effective information management more critical than ever. By harnessing the strength of sample data for Power BI, organizations can effectively streamline their BI processes, ensuring they deliver insights that truly drive strategic initiatives and optimize performance. Additionally, our 3-Day BI Sprint can help you quickly create professionally designed reports, while the General Management App provides comprehensive management and smart reviews.
To explore how these features can benefit your organization, book a free consultation today.

Best Practices for Utilizing Sample Data in Power BI
To maximize the utility of sample information in Power BI and leverage the power of Business Intelligence, the following best practices are essential:
-
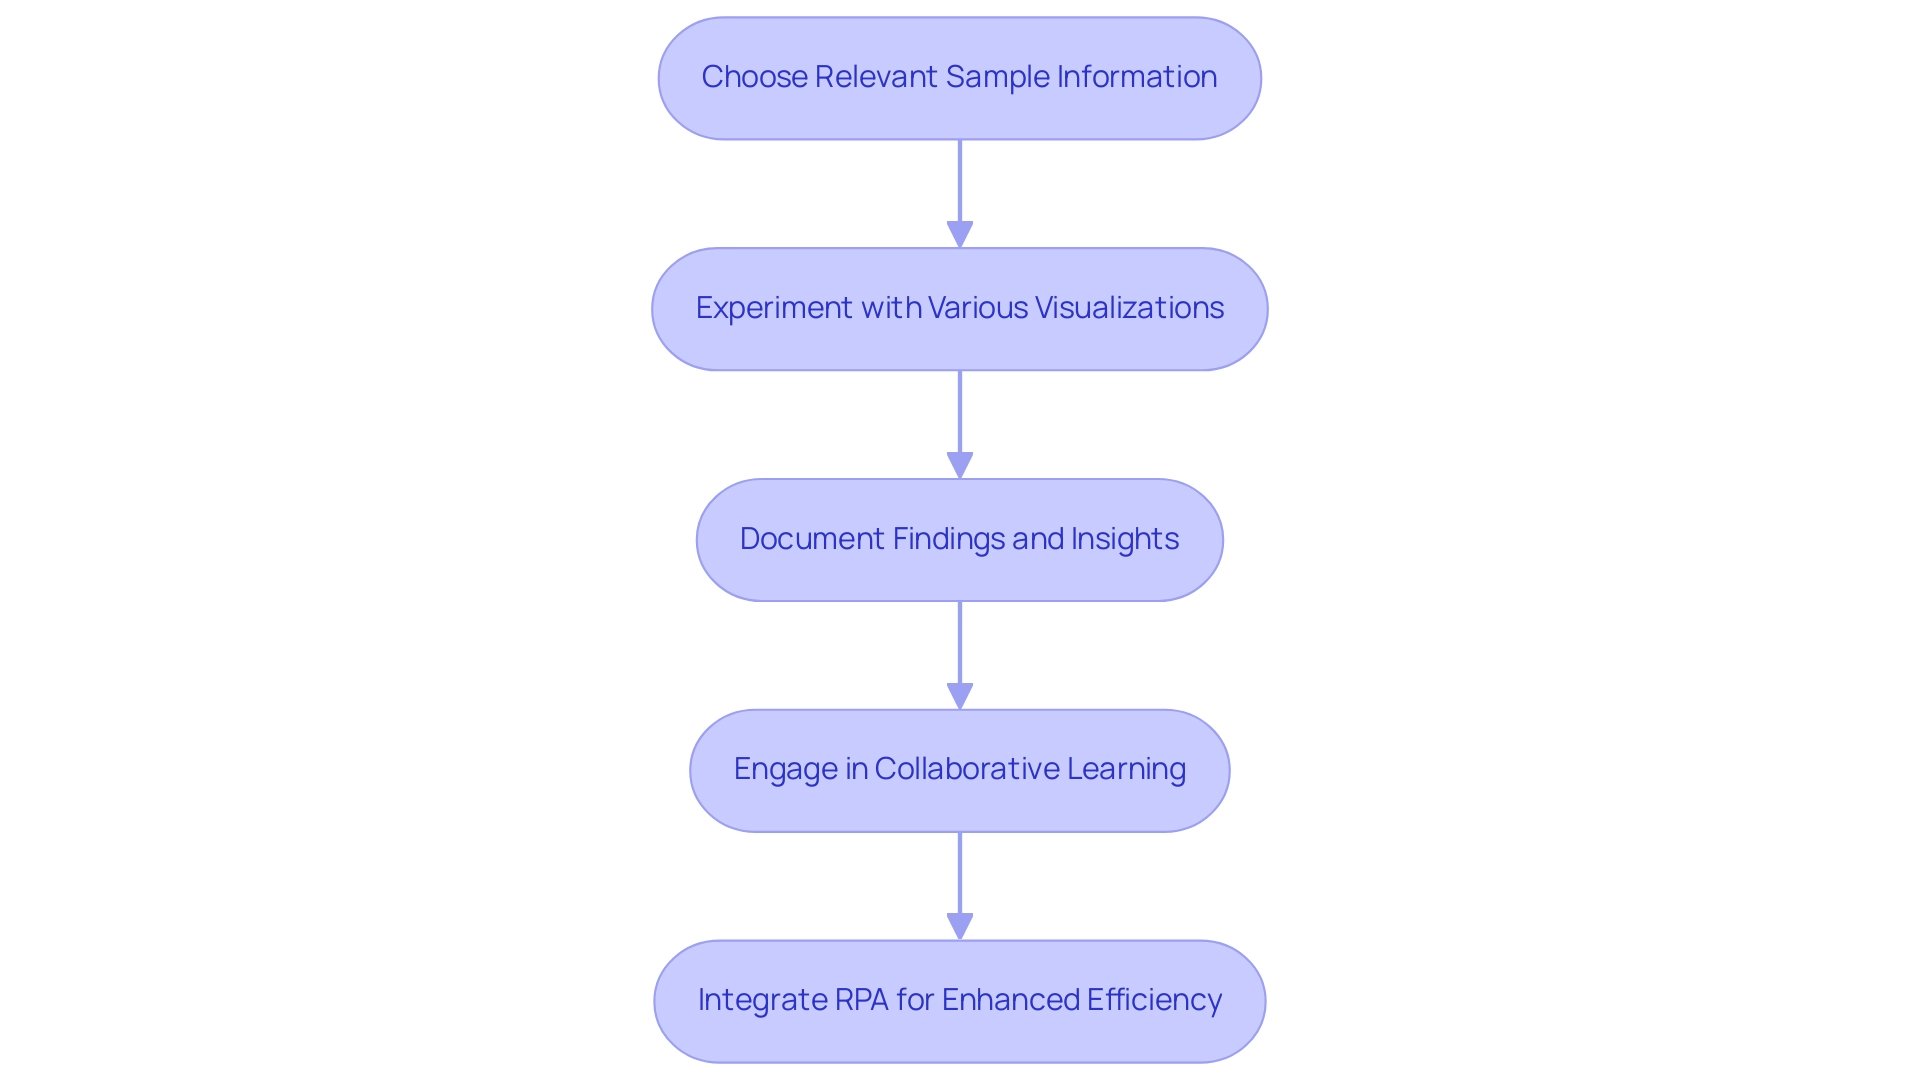
Choose Relevant Sample Information: Opt for datasets that closely mirror upcoming production information. This alignment facilitates a clearer understanding of final document functionality and aesthetics, paving the way for more effective operational insights.
-
Experiment with Various Visualizations: Utilize example information to test a range of visualization methods. This experimentation can unveil the most impactful methods for presenting insights effectively, addressing the common challenge of report creation that can be time-consuming.
-
Document Findings and Insights: As you explore representative information, meticulously record observations regarding successful strategies and pitfalls. Such records will serve as invaluable references during the analysis of actual information and can help mitigate inconsistencies.
-
Engage in Collaborative Learning: Foster a collaborative environment by sharing insights and findings with colleagues. This exchange fosters a culture of learning and ongoing enhancement in utilizing sample information and promotes growth through informed decision-making.
-
Integrate RPA for Enhanced Efficiency: Consider how Robotic Process Automation (RPA) can complement these best practices by automating repetitive tasks, thus improving overall efficiency in information management and report generation.
By adhering to these practices, users can significantly enhance their proficiency in Power BI, leading to the creation of dashboards that not only present insights effectively but also drive informed decision-making. A case study titled ‘Building the Dashboard’ underscores this approach, showing that visualizing calculated measures—such as mean, median, mode, and standard deviation—using a column chart can illuminate information distribution and outliers, thereby improving analytical clarity. For instance, cars sold for over 180 thousand Reais indicate the existence of outliers, showcasing the importance of identifying these values in analysis. As Brahmareddy aptly states,
This not only reduced the information size but also made the subsequent analysis much quicker.
Additionally, to upload Excel files to the BI service, users must sign in, navigate to their workspace, and select the upload option. Applying these strategies will not only enhance the utilization of examples in BI tools but also boost user involvement and efficiency within BI projects. Remember, failing to leverage Business Intelligence effectively can leave your business at a competitive disadvantage, making these practices all the more crucial.

Measuring the Impact of Sample Data on Decision-Making
The impact of example information in Power BI on decision-making quality is significant and quantifiable. By utilizing representative information effectively, organizations can produce thorough reports that reveal essential insights into business performance, emerging trends, and strategic opportunities. This approach empowers decision-makers to formulate strategies grounded in strong analysis rather than relying on intuition alone.
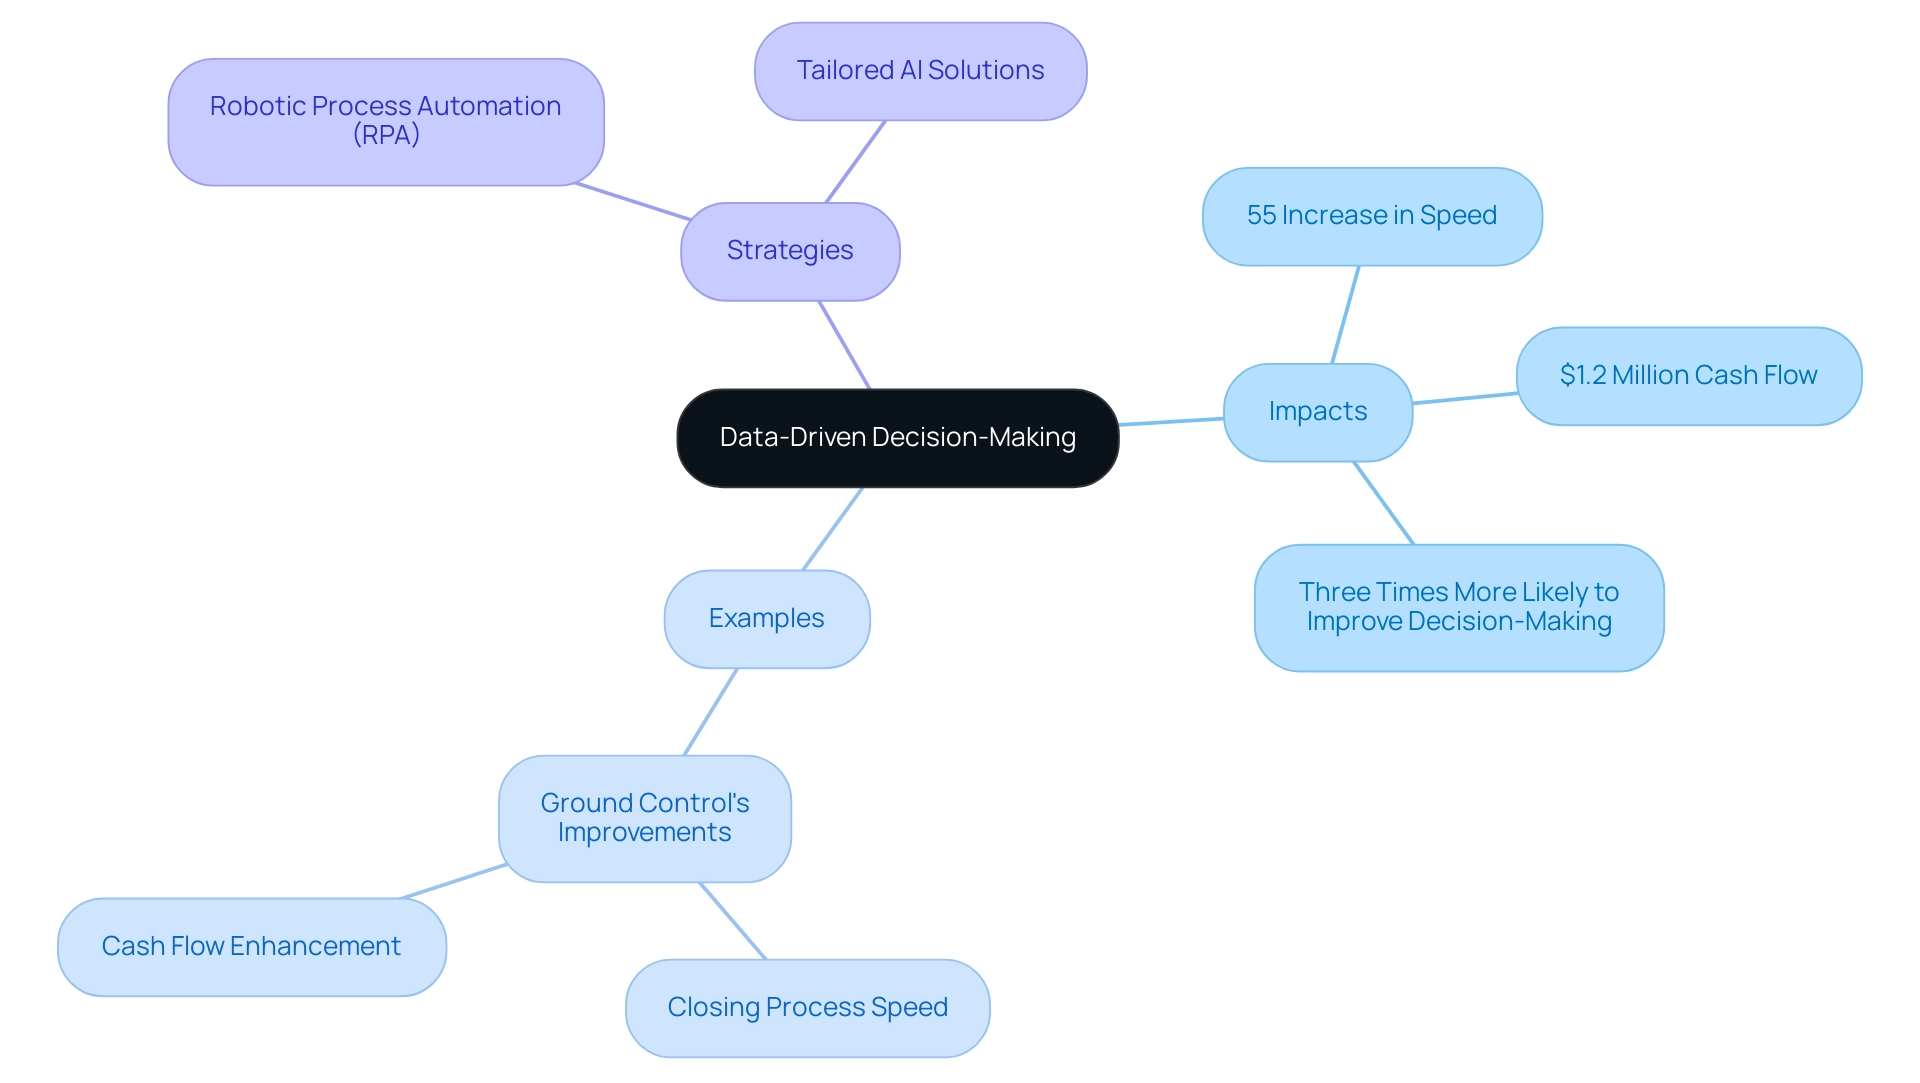
For instance, Ground Control implemented strategies that significantly improved their closing process, achieving a 55% increase in speed and freeing up $1.2 million in cash flow, illustrating the tangible benefits of data-driven decision-making. Furthermore, organizations that diligently integrate sample data for Power BI into their BI processes cultivate a culture of informed decision-making, ultimately enhancing operational efficiency and overall effectiveness. As highlighted by marketing specialist Tim Stobierski, ‘Data-driven strategies not only streamline processes but also empower organizations to make informed decisions that drive success.’
Additionally, a recent survey by PwC shows that organizations prioritizing data-driven strategies are three times more likely to experience notable improvements in decision-making compared to their counterparts. This shift towards data-centric operations is further underscored by the timely release of the infographic titled ‘Data Mesh and Data Fabric – From Theory to Application,’ which illustrates modern approaches to data management and their implications for business success. To further enhance productivity and efficiency, integrating Robotic Process Automation (RPA) can streamline repetitive tasks, addressing the challenges of manual processes that often hinder operational flow.
Tailored AI solutions can also help identify the right technologies to address specific business challenges, ultimately driving operational excellence. We encourage you to explore how these solutions can transform your operations and lead to significant improvements in performance.

Conclusion
Harnessing the power of sample data in Power BI is a game-changer for organizations striving to enhance their data analysis capabilities. By utilizing pre-defined datasets, users can streamline their learning process, overcome common challenges, and create meaningful insights that drive strategic decisions. The practical applications of sample data—from improving user engagement in dashboards to facilitating innovative testing—underscore its value in a competitive business landscape.
Implementing best practices, such as selecting relevant datasets and engaging in collaborative learning, can significantly elevate the effectiveness of Power BI projects. By documenting findings and experimenting with different visualizations, organizations can create reports that not only reflect accurate data but also tell a compelling story. The impact of this approach is evident in the measurable improvements in decision-making quality, as evidenced by case studies highlighting substantial gains in operational efficiency and financial performance.
As the business intelligence market continues to evolve, the integration of sample data into analytical processes will be essential for organizations seeking to maintain a competitive edge. Embracing these strategies not only fosters a culture of data-driven decision-making but also empowers teams to navigate complexities with confidence. Prioritizing the use of sample data in Power BI is not just a technical enhancement; it is a strategic imperative that positions organizations for success in an increasingly data-centric world.

