Overview
To successfully embed a Power BI report in a web application, one must establish prerequisites such as a Power BI account, a published report, proper access permissions, and familiarity with web development technologies. The article outlines a step-by-step process, including creating an embed URL and using an <iframe> tag for integration, emphasizing that following these steps enhances data accessibility and operational efficiency while addressing common challenges in utilizing insights effectively.
Introduction
In a landscape where data-driven decision-making is paramount, embedding Power BI reports into web applications emerges as a powerful strategy to enhance operational efficiency and insight accessibility. As organizations grapple with the challenges of extracting meaningful insights from their data, the ability to seamlessly integrate advanced reporting tools can transform how teams engage with information.
This article delves into the essential prerequisites, step-by-step processes, and best practices for embedding Power BI reports, ensuring that users not only access critical data but also harness it to drive informed decisions. By addressing common hurdles and implementing effective solutions, organizations can unlock the full potential of their data, fostering a culture of innovation and strategic growth.
Prerequisites for Embedding Power BI Reports
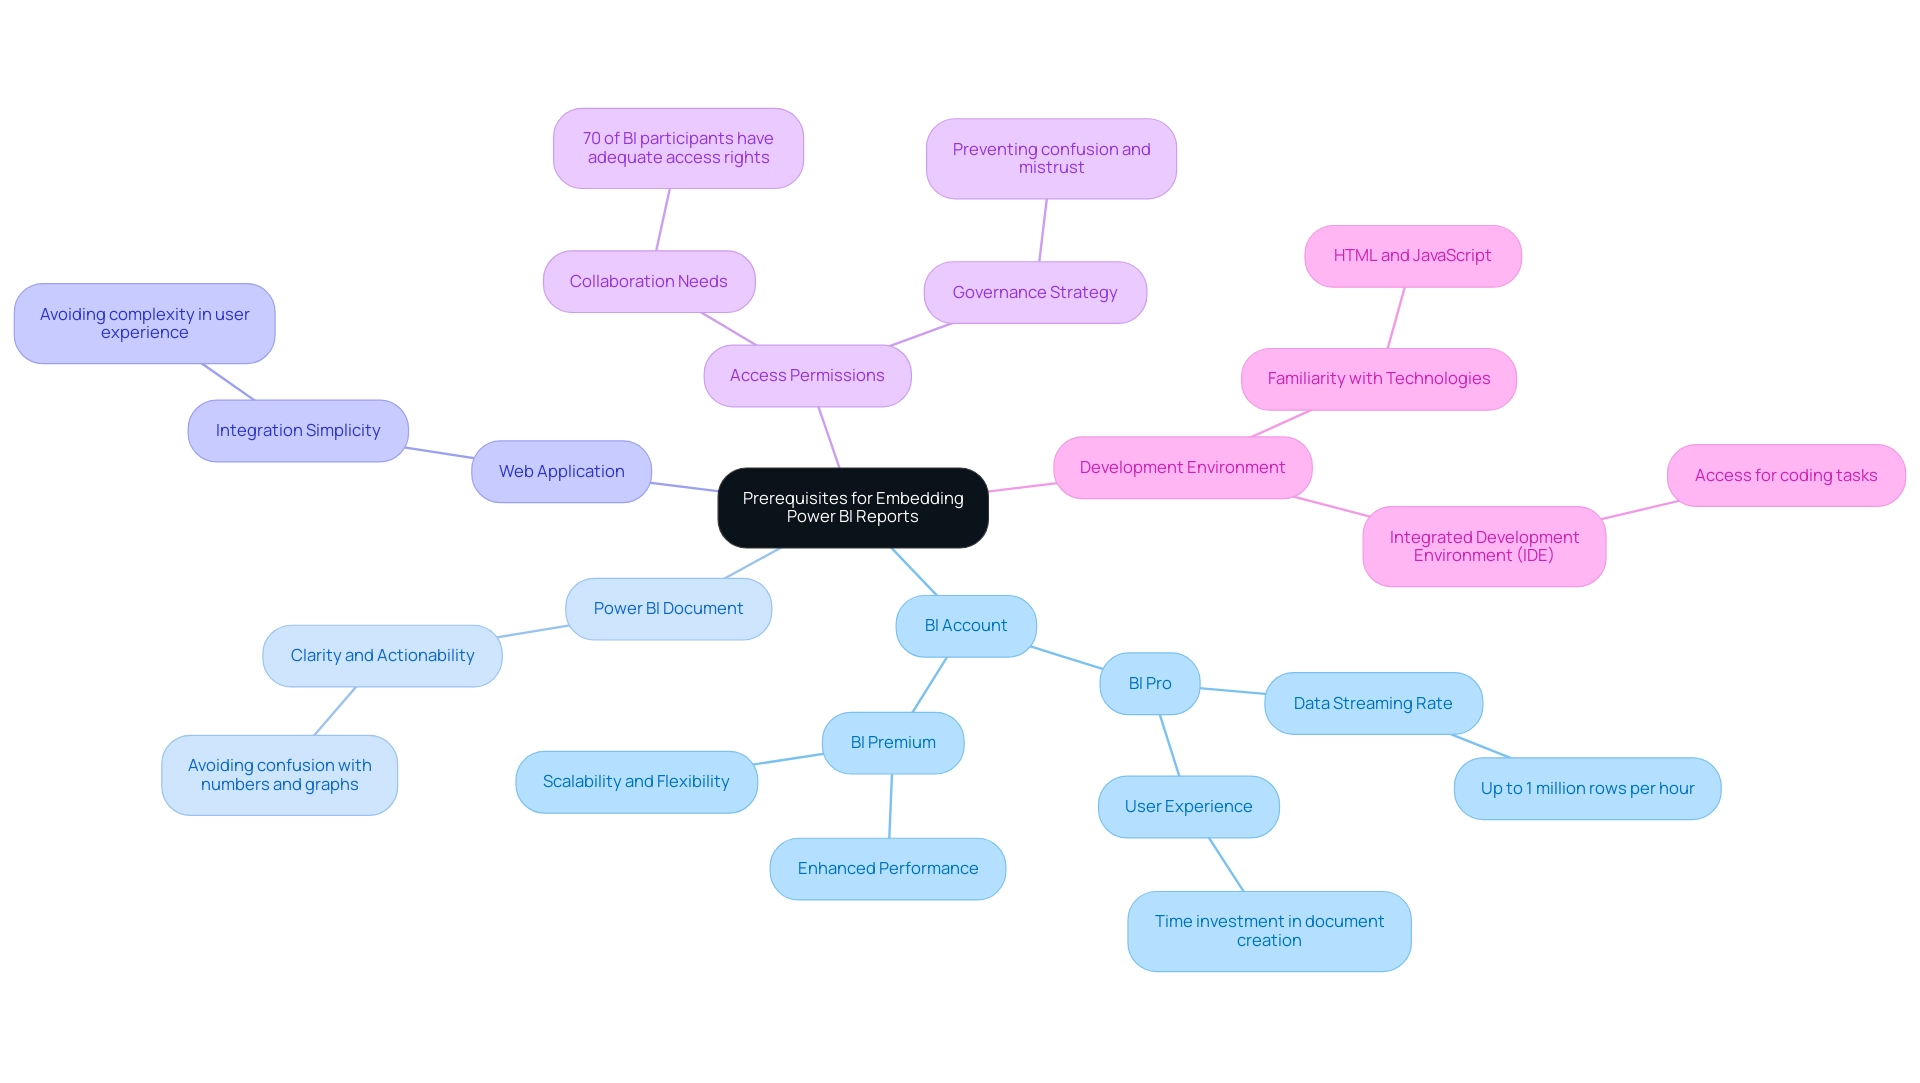
To successfully embed Power BI reports, it’s crucial to have the following prerequisites established:
-
BI Account: A BI Pro or Premium account is essential for creating and sharing documents effectively. BI Pro enables impressive data streaming capabilities of up to 1 million rows per hour, enhancing reporting efficiency. However, many users find themselves investing more time in creating documents than in leveraging insights, which can lead to frustration. As Sophia Ellis observes, ‘BI Premium is an advanced service that provides improved performance, scalability, and flexibility for your Business Intelligence requirements.’
-
Power BI Document: Begin by creating and publishing the document you intend to embed within the Power BI service, ensuring its readiness for your audience. It’s essential to ensure that the document provides clear, actionable guidance, as many submissions often contain numbers and graphs but lack direction.
-
Web Application: Identify the web application where you plan to learn how to embed Power BI report in web application, ensuring a seamless experience for individuals. This integration should be straightforward to avoid adding complexity to the experience journey.
-
Access Permissions: Verify that individuals who will view the document have the required permissions. About 70% of BI participants indicate having adequate access rights, which is essential for collaboration and information sharing. Inconsistencies in data access can lead to confusion and mistrust, often exacerbated by a lack of governance strategy.
-
Development Environment: Familiarity with web development technologies such as HTML and JavaScript is crucial, alongside access to an appropriate Integrated Development Environment (IDE) for coding tasks.
By ensuring these prerequisites are in place, you lay a robust foundation for a seamless and effective embedding experience. Furthermore, organizations should take into account the recent insights on selecting between BI Pro and Premium based on user scale and performance demands. RPA solutions can enhance BI by automating repetitive tasks, thus addressing operational efficiency challenges.
The case study on BI Free, Pro, and Premium highlights the main differentiators in performance, assisting IT professionals in optimizing their infrastructure and dataset requirements. This comprehensive approach enables your organization to utilize BI to its fullest potential, transforming information into actionable insights and enhancing operational efficiency.
Step-by-Step Process to Embed Power BI Reports
Learning how to embed Power BI report in web application can significantly improve your visualization abilities and tackle the challenges of utilizing insights effectively. In an era where 40% of executives indicate their organizations’ information strategies have not produced success, struggling to derive meaningful insights can leave your business at a competitive disadvantage. It is critical to adopt effective data strategies alongside automation solutions.
Follow these straightforward steps to achieve seamless integration:
-
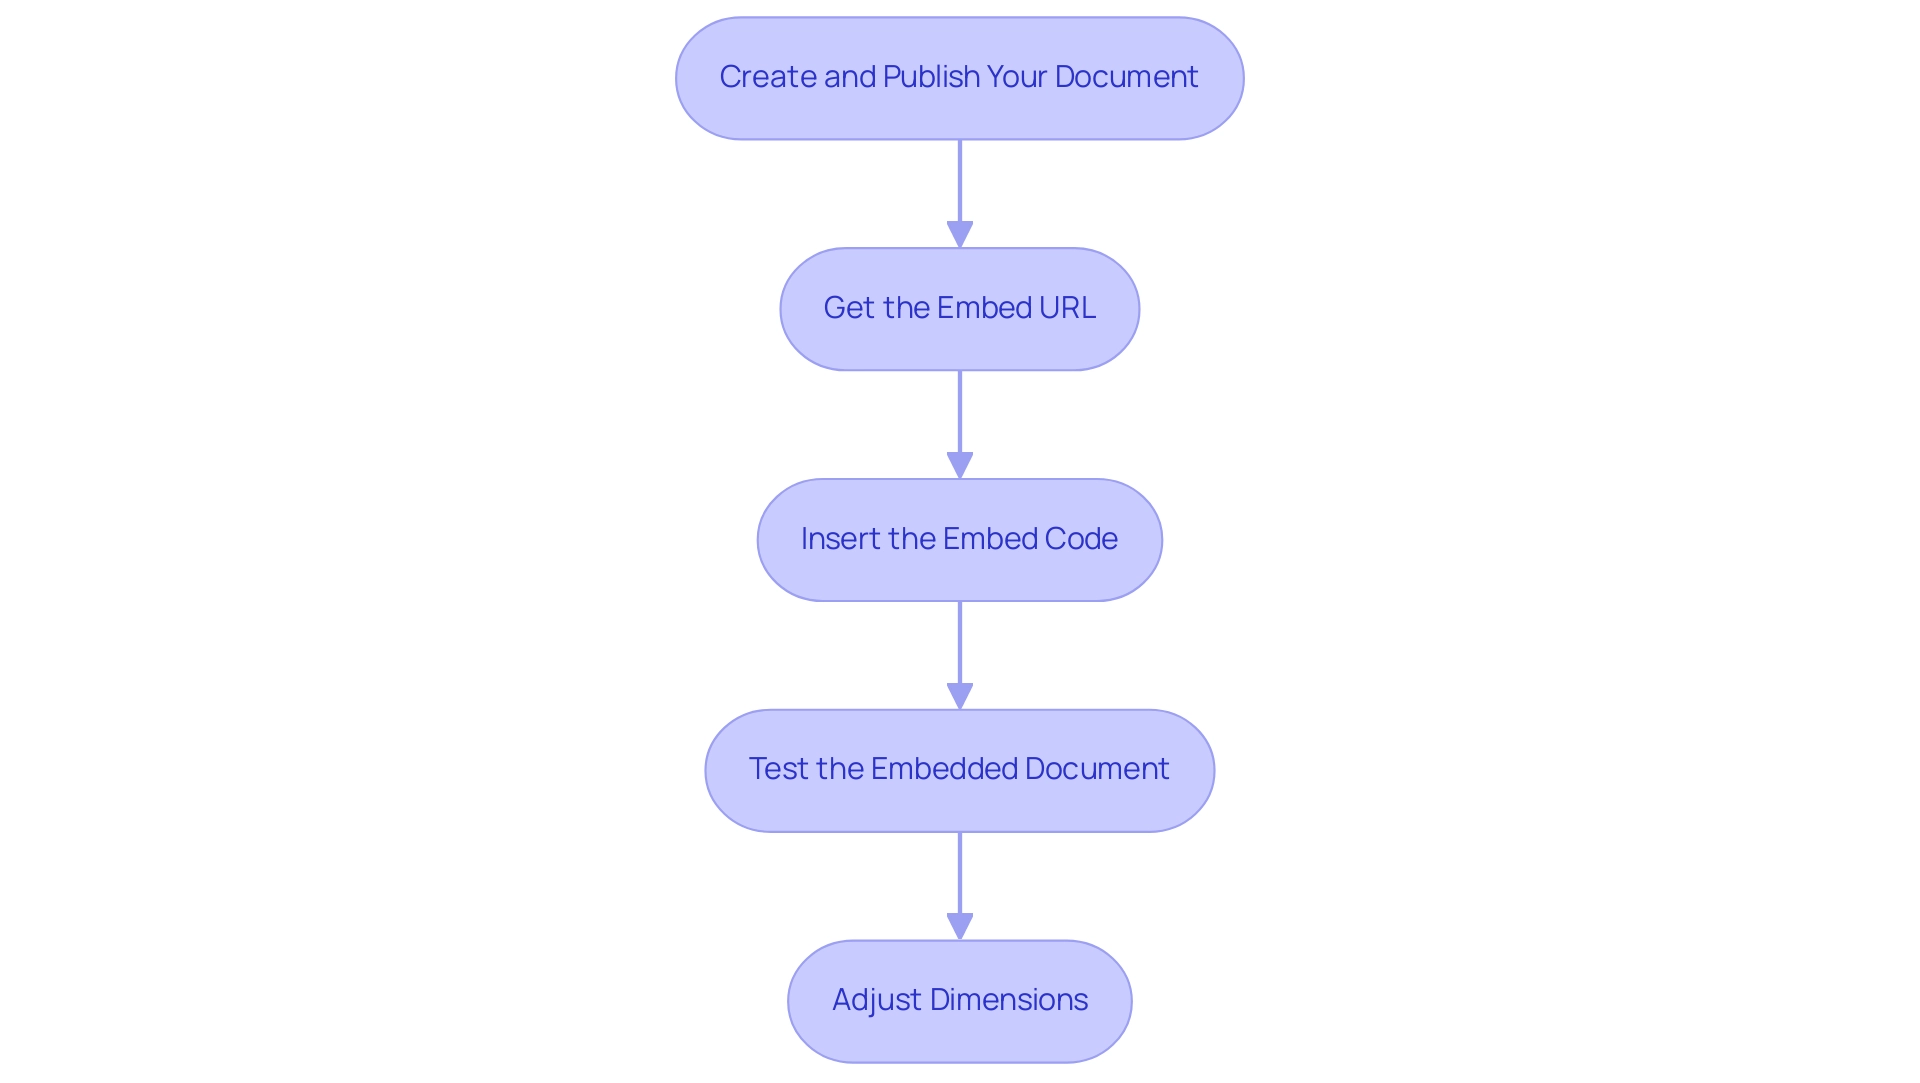
Create and Publish Your Document: Start by crafting your document in BI Desktop. Once satisfied with your design, publish it to the BI service to make it accessible for embedding.
-
Get the Embed URL: In the Power BI service, navigate to your published document. Click on the ‘File’ menu, select ‘Embed document’, then choose ‘Website or portal’. This action will generate an embed URL that you can copy.
-
Insert the Embed Code: In your web application, utilize an
<iframe>tag to insert the document. For example:<iframe width="800" height="600" src="YOUR_EMBED_URL" frameborder="0" allowFullScreen="true"></iframe> -
Test the Embedded Document: After inserting the code, open your web application in a browser to ensure the document displays correctly and interacts as expected.
-
Adjust Dimensions: Modify the width and height attributes in the
<iframe>tag to align with your application’s layout requirements, ensuring a user-friendly experience.
By following these steps, you will understand how to embed Power BI report in web application, which enhances data accessibility and visualization. This integration not only improves operational efficiency but also helps mitigate the data-related challenges that lead to productivity losses—averaging over five working days per employee annually. Additionally, RPA solutions can further streamline processes by automating repetitive tasks, complementing the insights gained from BI.
A worked example of view and viewer metrics illustrates how usage metrics are calculated based on user interactions with multiple reports, clarifying how report views and page views are counted. This understanding is vital for making informed, data-driven decisions. As Douglas Rocha, a data science enthusiast, states, ‘Can you do statistics in BI without DAX?’
Yes, you can, you can do it without measures as well and I will teach you how at the end of this tutorial. This flexibility in utilizing BI is essential for empowering directors of operations to drive growth and innovation.
Generating Embed Codes and Configuring Settings
To effectively create embed codes and configure settings for your BI analysis, adhere to the following structured steps:
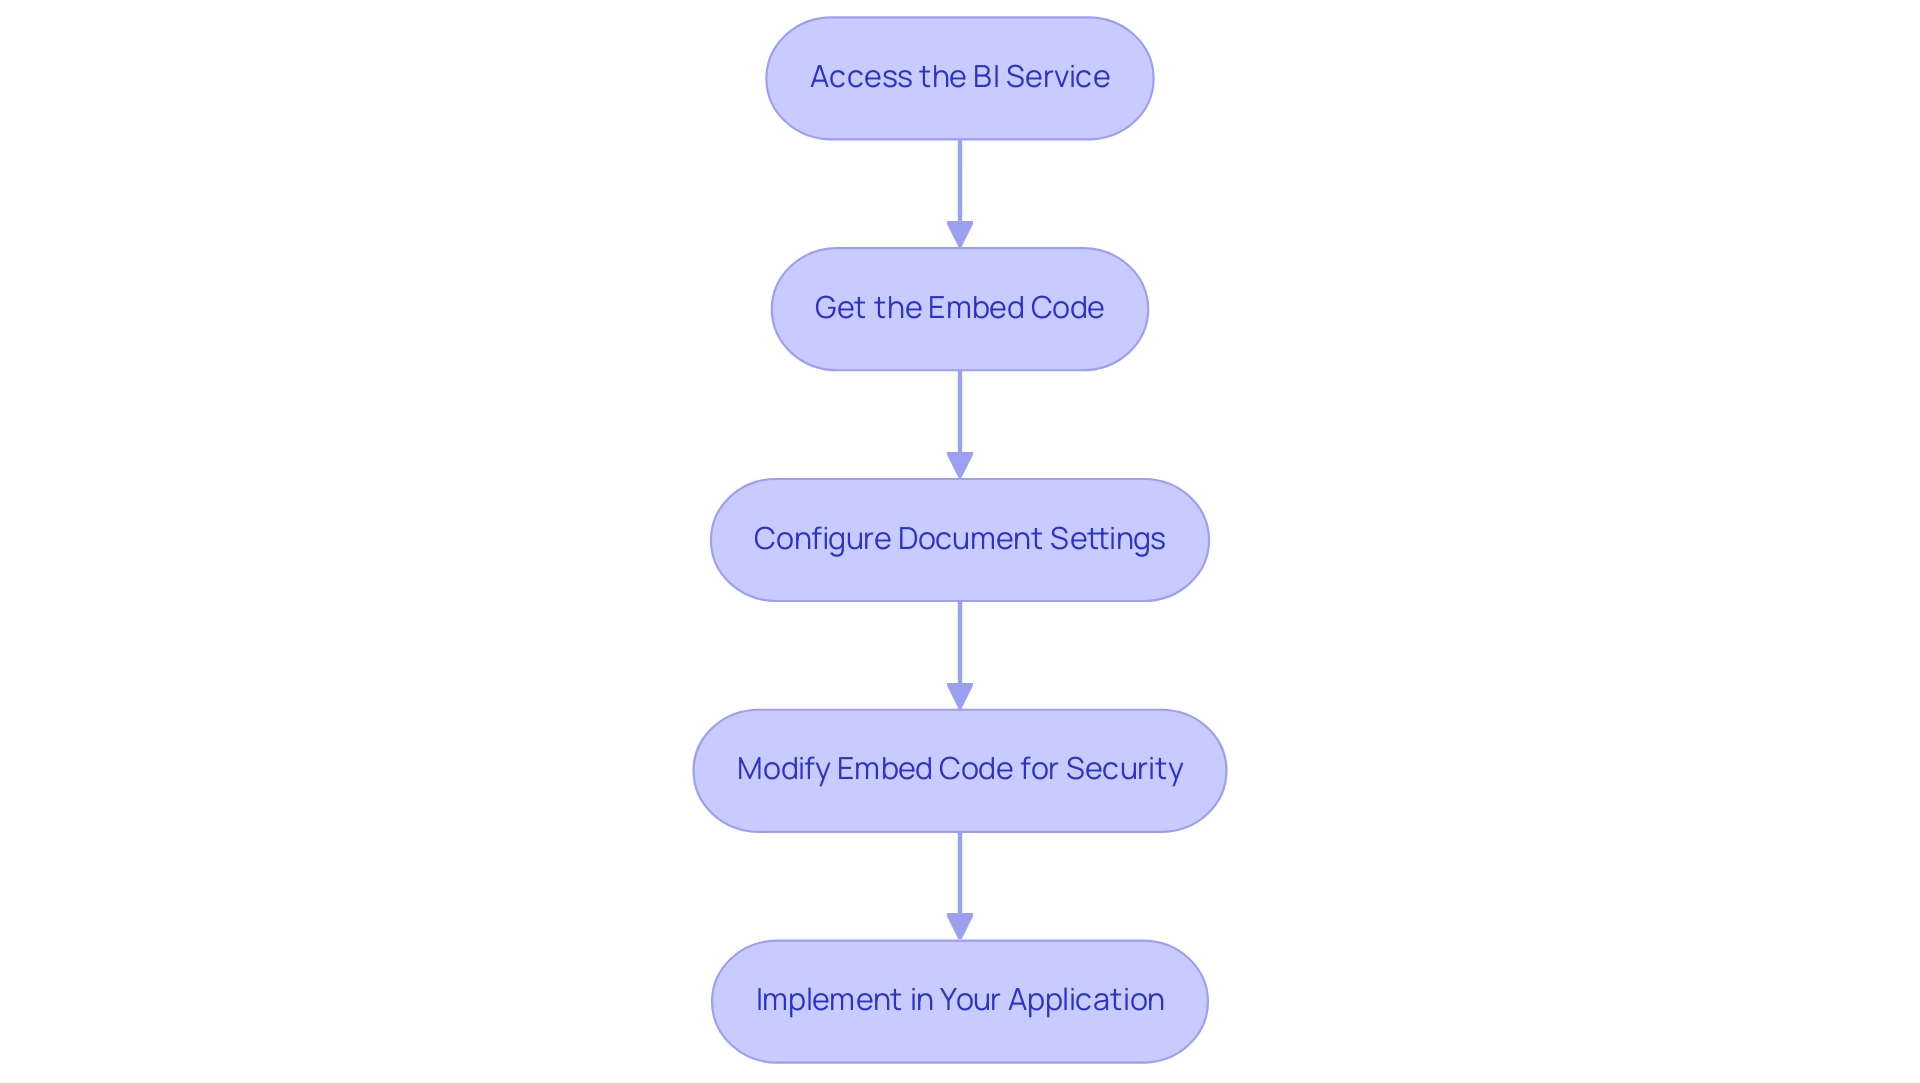
- Access the BI Service: Start by signing into your BI account and going to the specific document you wish to embed. With 3,518 users online, BI’s popularity underscores the importance of these capabilities in driving data-driven insights for operational efficiency and business growth.
2. Get the Embed Code: Click on ‘File’, select ‘Embed document’, and then opt for ‘Website or portal’. Here, you’ll find the embed code, which contains the URL and necessary parameters—copy this code for your use.
3. Configure Document Settings: Within the BI service, it’s crucial to verify that your settings permit embedding. Ensure the ‘Embed settings’ option ‘Allow individuals to share this document’ is enabled to facilitate sharing functionality and enhance collaboration.
4. Modify Embed Code for Security: Tailor the embed code according to your security requirements. As lbendlin advises, consult with your Tenant admin to review audit logs, which can provide insight into security measures. For improved security, consider using the BI Embedded service, which provides greater control over user access and ensures compliance with local residency regulations.
5. Implement in Your Application: Finally, paste the embed code into your web application at the desired location to show how to embed Power BI report in web application for the display of the analysis.
By diligently following these steps and considering the compliance illustrated in the case study on ‘Usage Metrics in National/Regional Clouds’, you will ensure that your BI analysis is not only correctly configured for embedding but also aligns with necessary security protocols and compliance considerations. Furthermore, Creatum provides extensive BI services, including tailored dashboards, information integration, and professional training, to assist businesses in overcoming the difficulties of document creation and insights extraction. This holistic approach empowers your organization to leverage insights for impactful decisions, addressing the common hurdles faced in information management.
Managing Authentication and Security for Embedded Reports
To effectively manage authentication and security for your embedded Power BI reports, consider implementing the following strategies:
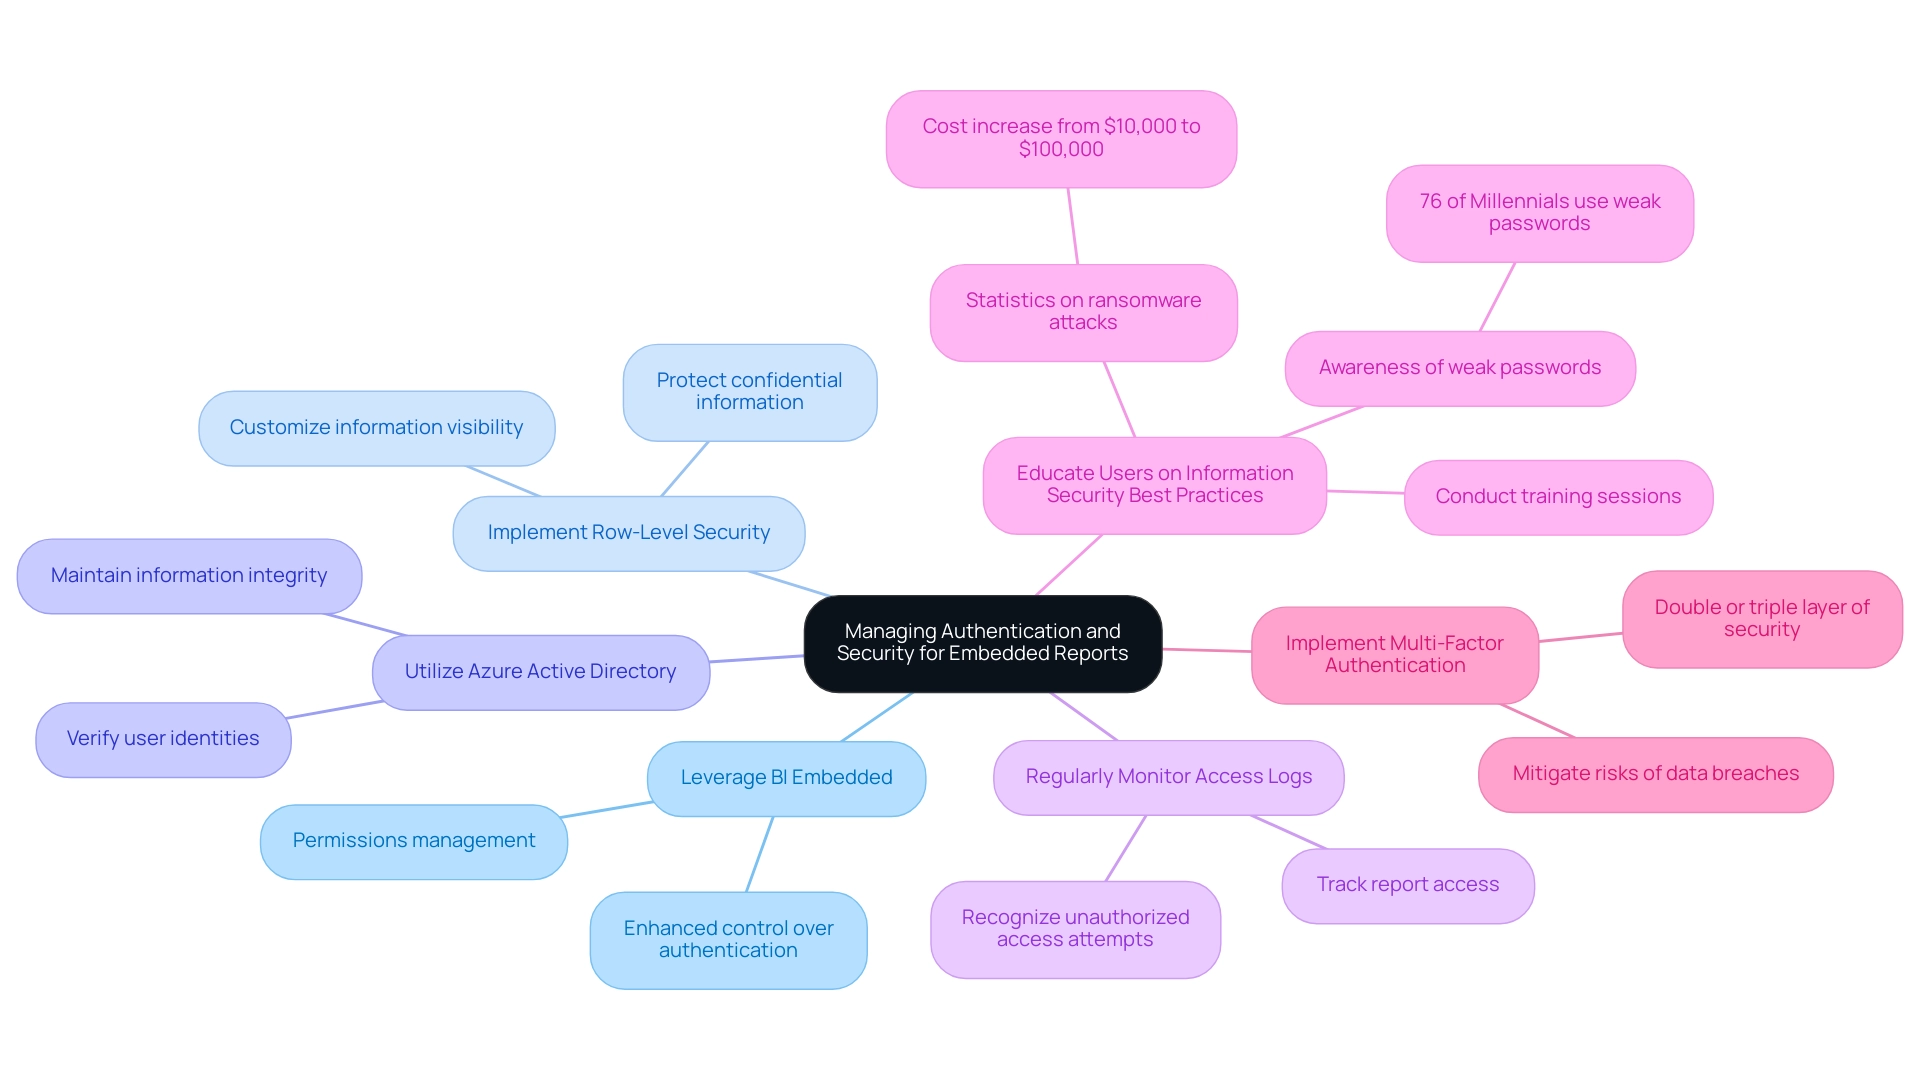
- Leverage BI Embedded: Utilize BI Embedded for applications requiring secure access, as it provides enhanced control over authentication and permissions, ensuring that only authorized individuals can access sensitive information.
- Implement Row-Level Security: Establish row-level security within Power BI to customize information visibility based on roles. This not only protects confidential information but also guarantees that individuals view only the information relevant to their duties.
- Utilize Azure Active Directory for Access Authentication: Employ Azure Active Directory (AAD) for verifying individuals accessing your embedded documents. This method is crucial for verifying user identities and maintaining information integrity, making it significantly harder for cybercriminals to breach access.
- Regularly Monitor Access Logs: Consistently review access logs to track report access. This practice not only aids in recognizing unauthorized access attempts but also guarantees adherence to your organization’s security protocols, tackling the challenges of inconsistencies.
- Educate Users on Information Security Best Practices: Conduct training sessions focused on information security best practices, emphasizing the significance of safeguarding sensitive information. Recent statistics reveal that ransomware attacks on healthcare organizations have escalated in cost from an average of $10,000 in 2017 to $100,000 in 2019, underscoring the urgent need for improved security measures. Additionally, as highlighted by Security.org, a staggering 76% of Millennials tend to use weak passwords, often relying on memory rather than utilizing password managers. By educating users, you can cultivate a culture of security awareness within your organization, thereby enhancing operational efficiency.
- Implement Multi-Factor Authentication (MFA): As shown in the case study titled “Enhanced Protection with MFA,” enabling MFA offers a double or triple layer of security, making it more difficult for hackers to obtain access. The suggestion is to use MFA wherever applicable to reduce the risks of breaches.
By adopting these strategies, you can significantly enhance the security of your embedded business intelligence visuals while learning how to embed Power BI report in web application, addressing the critical need for data-driven insights and operational efficiency in today’s competitive landscape. Furthermore, utilizing RPA can assist in optimizing the document creation process, reducing the time spent on repetitive tasks and minimizing data inconsistencies, ultimately enhancing decision-making and business growth.
Best Practices and Troubleshooting for Embedded Power BI Reports
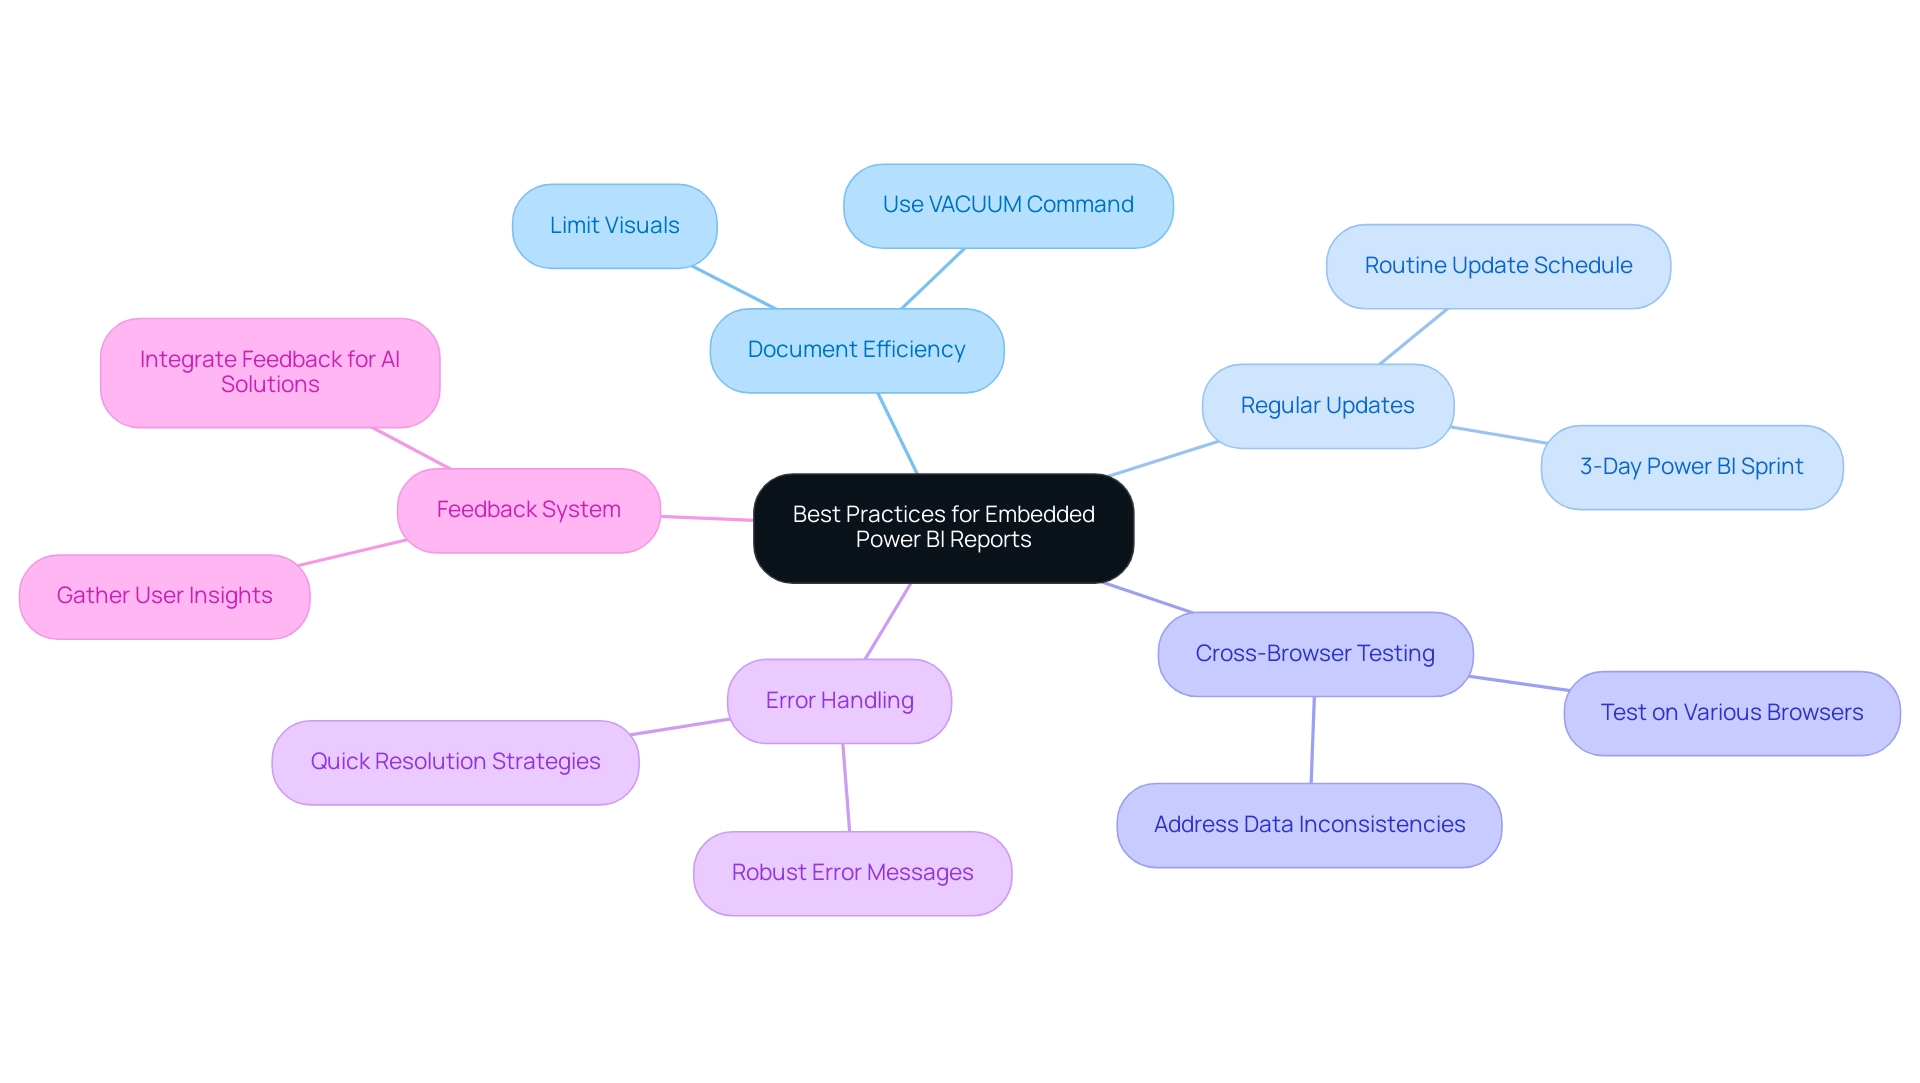
To ensure the seamless operation of embedded Power BI displays and effectively address potential issues, consider the following best practices and troubleshooting tips:
-
Enhance Document Efficiency: Simplify documents by limiting the number of visuals to improve loading times. Employing the VACUUM command can also assist in clearing out old files, minimizing storage clutter and improving overall performance—particularly advantageous for a large group of over 100 developers who need to handle extensive information efficiently. This aligns with the efficiency gains anticipated from implementing Robotic Process Automation (RPA).
-
Regularly Update Documents: Keep your documents current by implementing a routine update schedule. This ensures that users access the latest data and insights, which is critical for informed decision-making—a principle reinforced by leveraging Business Intelligence. Our 3-Day Power BI Sprint can assist in rapidly creating professionally designed documents to maintain this relevance.
-
Test Across Browsers: Conduct thorough testing of your embedded reports on various web browsers. This will help ensure a consistent experience, as discrepancies can arise between different platforms, directly addressing the challenge of data inconsistencies.
-
Handle Errors Gracefully: Implement robust error handling in your web application. Providing individuals with clear and informative messages in the event of an error not only improves experience but also allows for quicker resolutions—streamlining operations and enhancing overall efficiency.
-
Feedback System: Set up a feedback system to gather insights from individuals concerning the integrated data. This ongoing conversation enables constant enhancement, ensuring the documents develop alongside consumer requirements. By integrating these insights, you can inform the development of tailored AI solutions that align with your business goals.
Incorporating these best practices and troubleshooting strategies can significantly enhance user experience and ensure the effectiveness of how to embed Power BI report in web application. As observed by Tarsem Singh, utilizing techniques such as the Star Schema modeling can enhance performance by organizing information effectively into fact and dimension tables. Moreover, community insights from Manoj Prabhakar highlight practical strategies such as using dedicated Dates tables, splitting DateTime columns, filtering unnecessary data, and utilizing performance optimization tools like Tabular Editor and DAX Studio. Ultimately, these strategies will not only streamline operations but also drive improved performance metrics across your organization, reinforcing the role of Business Intelligence in achieving data-driven insights.
Conclusion
Embedding Power BI reports into web applications is a transformative strategy that empowers organizations to unlock the full potential of their data. The foundational prerequisites, such as having a Power BI account, creating actionable reports, and ensuring proper access permissions, set the stage for successful implementation. By following a structured step-by-step process to embed reports, organizations can significantly enhance their data visualization capabilities and improve access to critical insights.
Security and authentication are paramount when it comes to managing embedded reports. Implementing robust strategies such as row-level security and utilizing Azure Active Directory ensures that sensitive data remains protected while still being accessible to authorized users. Regular monitoring of access logs and educating users on data security best practices further strengthens the defense against potential breaches.
Adopting best practices, including optimizing report performance and establishing a feedback mechanism, ensures that embedded reports not only function seamlessly but also evolve according to user needs. By addressing common hurdles and leveraging automation, organizations can streamline their operations, reduce time spent on repetitive tasks, and ultimately drive informed, data-driven decisions.
In conclusion, embedding Power BI reports is not just about enhancing data accessibility; it is a strategic move towards fostering a culture of innovation and operational efficiency. As organizations embrace these practices, they position themselves to thrive in a data-driven landscape, transforming insights into actionable strategies for growth and success.

