Overview
The article focuses on mastering percentile DAX calculations, which are essential for analysts to interpret data distributions accurately and derive actionable insights from complex datasets. It supports this by detailing various DAX functions, such as PERCENTILEX and RANKX, and emphasizing the importance of understanding their applications and challenges in the context of Business Intelligence, particularly in improving operational efficiency and decision-making processes.
Introduction
In the realm of data analysis, percentiles emerge as crucial indicators that reveal the relative position of values within a dataset. For professionals working with DAX, the ability to accurately calculate and interpret these statistical measures is essential, especially in an era dominated by the need for actionable insights from complex data.
As organizations strive to harness the full potential of Business Intelligence tools like Power BI, understanding the intricacies of percentile calculations becomes paramount. This article delves into the fundamentals of percentiles, the various methods available for their calculation within DAX, and practical applications that can drive strategic decision-making.
By exploring both the challenges and advanced techniques involved, analysts can enhance their proficiency, ensuring they are well-equipped to navigate the evolving landscape of data analysis in 2024.
Understanding Percentiles: The Basics of DAX Calculations
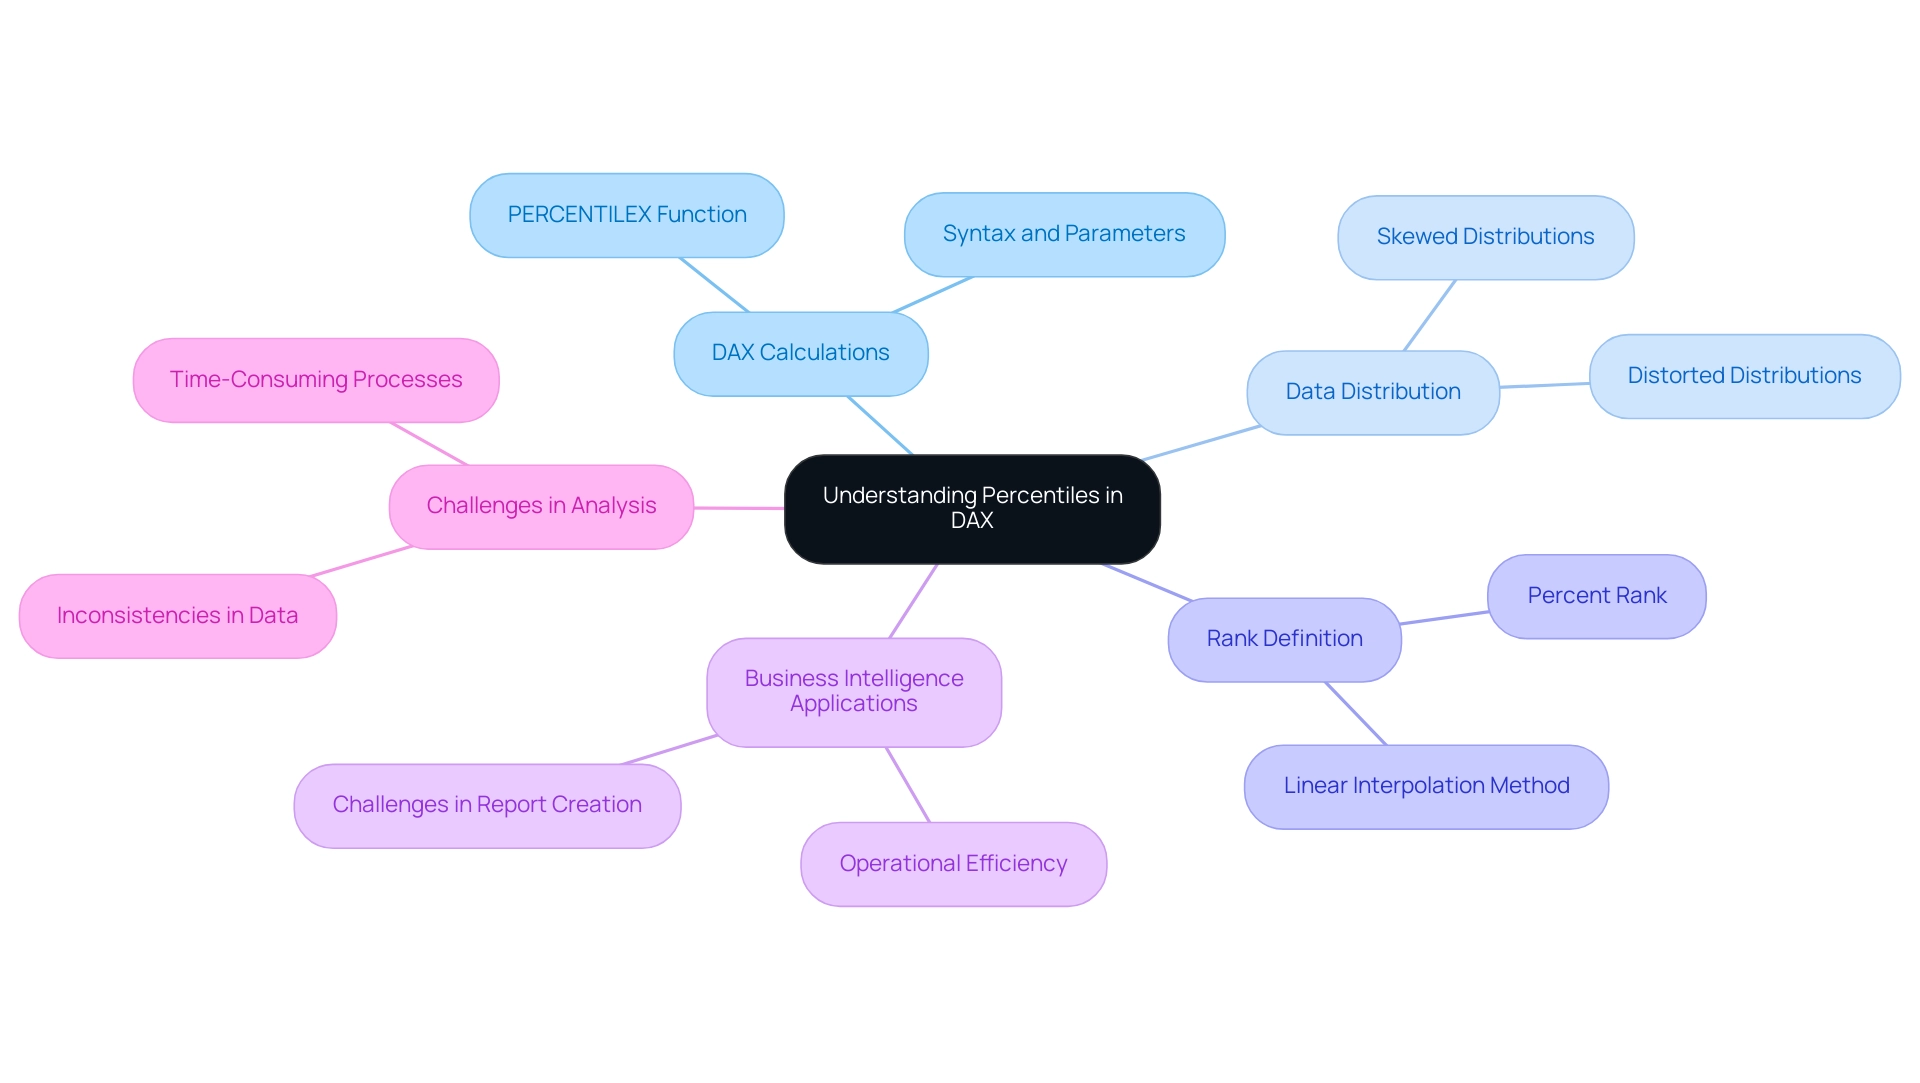
Percentiles serve as vital statistical measures that reflect the relative standing of a specific value within a dataset. For analysts using DAX, mastering percentile dax calculations is vital for precisely interpreting information distributions, which is critical in today’s information-driven environment. The significance of Business Intelligence (BI) is highlighted by the challenges organizations encounter in producing actionable insights from Power BI dashboards, including time-consuming report creation and inconsistencies that obstruct effective decision-making.
A rank indicates the percentage of values that lie below a given number; for instance, the 70th rank signifies that 70% of the points are less than that threshold. Comprehending these concepts is crucial, particularly as the environment of analysis evolves in 2024. The PERCENTILEX function in DAX offers a robust method for computing these values, allowing experts to leverage percentile dax to extract significant insights from intricate datasets.
Understanding its syntax and parameters lays the groundwork for more advanced analytical techniques. As emphasized by Avijeet Biswal, a Senior Research Analyst at Simplilearn:
You have learnt about what is percentile and how you can calculate the percentile of any collection with the help of a formula.
This expertise not only enhances information interpretation but also empowers analysts to leverage Business Intelligence effectively, improving operational efficiency.
Furthermore, platforms like Secoda exemplify effective information management, leveraging AI to centralize discovery, lineage tracking, and governance. By enhancing collaboration and efficiency, Secoda allows users to easily find, understand, and trust their information, thus improving overall analytical effectiveness. Moreover, comprehending distorted distributions is vital, as they can greatly influence rank calculations, making it important for analysts to consider how values fall on either side of the distribution.
Recent conversations in the field also indicate the absence of a standard definition of percent rank, with various methods such as linear interpolation being employed to compute percent ranks, emphasizing the evolving techniques in information analysis. Moreover, the integration of Robotic Process Automation (RPA) can streamline the report creation process, reducing the time and effort required to generate insights, thus addressing some of the operational challenges faced by organizations.
Exploring Different Approaches to Percentile Calculations in DAX
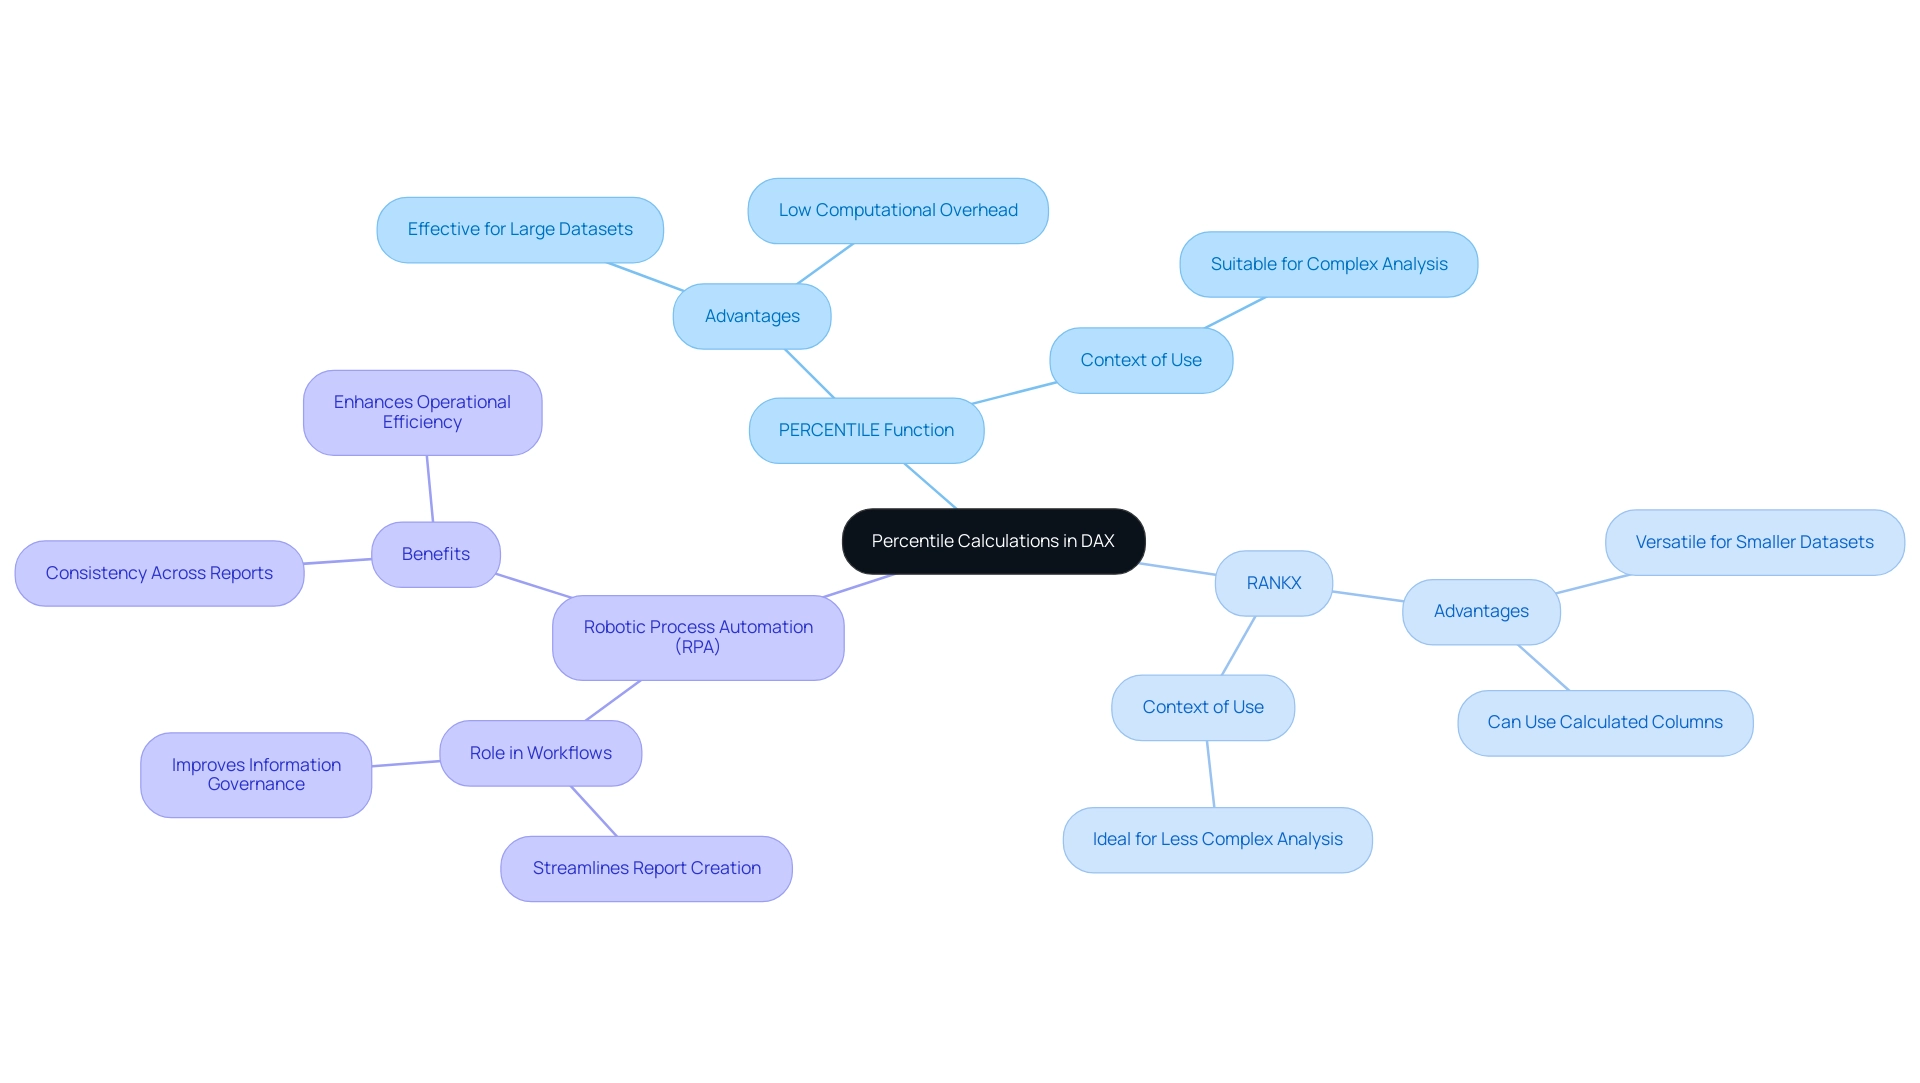
Calculating rankings in DAX can be accomplished through multiple methods, each offering unique advantages depending on the context of the data. The PERCENTILE function stands out as a robust option for determining the k-th value across a specified table or column, making it particularly effective for large datasets. It functions effectively, enabling professionals to obtain significant insights without extensive computational overhead.
On the other hand, RANKX can be utilized alongside calculated columns to establish percentile dax rankings, making it a suitable choice for smaller or less complex datasets. This versatility enables analysts to select the most appropriate method based on their specific analytical requirements. As numerous organizations encounter challenges in leveraging insights from Power BI dashboards—such as time-consuming report creation and inconsistencies—understanding the nuances between PERCENTILE and RANKX becomes essential for optimizing analysis workflows.
To tackle these challenges, incorporating Robotic Process Automation (RPA) can significantly streamline the workflow, reducing the time spent on report creation and improving information governance. For instance, RPA can automate the information extraction and report generation processes, ensuring consistency and accuracy across reports. Moreover, grasping the distinctions in user preferences about customized advertising—like those retained for as long as 390 days—can offer valuable perspectives on how analytical methods can be enhanced for operational efficiency.
Ultimately, leveraging RPA alongside robust analysis methods not only enhances operational efficiency but also ensures that stakeholders are equipped with actionable insights for informed decision-making.
Practical Applications of Percentile Calculations in Power BI
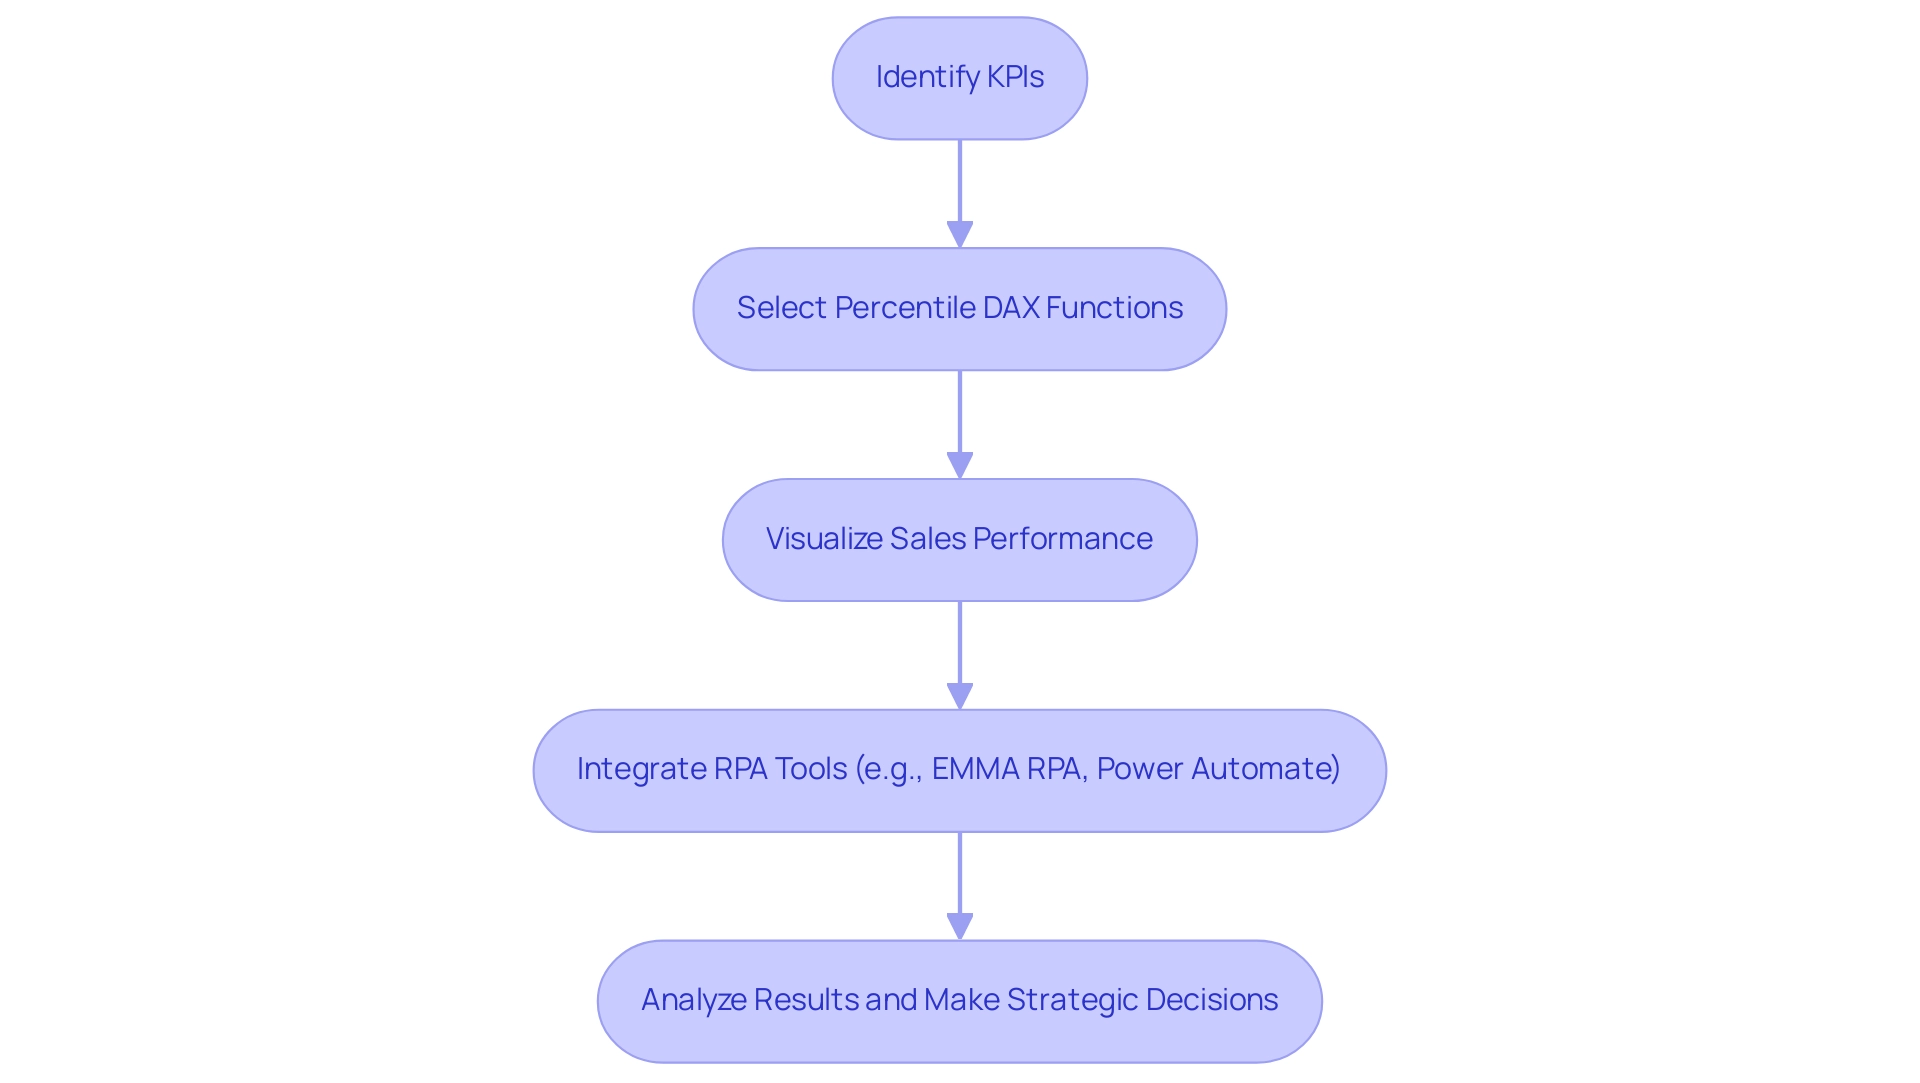
In Power BI, percentage calculations play a crucial role in assessing key performance indicators (KPIs) and evaluating distributions across various categories. For instance, analysts can visually represent sales performance by categorizing products into specific percentile dax ranges, allowing for a clearer understanding of which items are performing best. However, challenges such as time-consuming report creation and inconsistencies can hinder effective analysis.
Unlocking the power of Business Intelligence through RPA, particularly tools like EMMA RPA and Power Automate, can streamline these processes, transforming raw information into actionable insights that drive growth and inform strategic decision-making. It’s important to note that the P and S versions of these functions differ based on whether the calculation considers the whole population or a sample, which is crucial for precise analysis. Utilizing the PERCENTILEX function empowers analysts to create dynamic reports that segment information effectively, enabling the identification of top-performing sales representatives and a deeper understanding of customer satisfaction levels derived from survey scores, particularly through the lens of percentile dax.
Douglas Rocha, a statistics enthusiast, notes,
Can you do statistics in Power BI without DAX?
Yes, you can, you can do it without measures as well and I will teach you how at the end of this tutorial. Such practical applications not only improve narrative techniques but also guide strategic decision-making by providing clear perspectives on performance metrics. Moreover, present features in Power BI, like the capacity to incorporate dynamic reference lines via the Analytics pane, enable users to emphasize significant trends and observations.
The recent incorporation of Analytics features to the Strip Plot further enhances this capability, making it easier for analysts to visualize important information points. As Marta Garcia states,
You can highlight interesting trends and insights by creating dynamic reference lines with the Analytics pane.
Additionally, understanding the default line width of 3 and transparency settings of 50% can aid in better data representation when utilizing these features.
This synergy of ranking calculations, RPA, and visualization techniques significantly contributes to effective KPI analysis in Power BI, ultimately guiding organizations toward more informed business strategies. To explore how EMMA RPA and Power Automate can further enhance your operational efficiency, book a free consultation today.
Overcoming Challenges in DAX Percentile Calculations
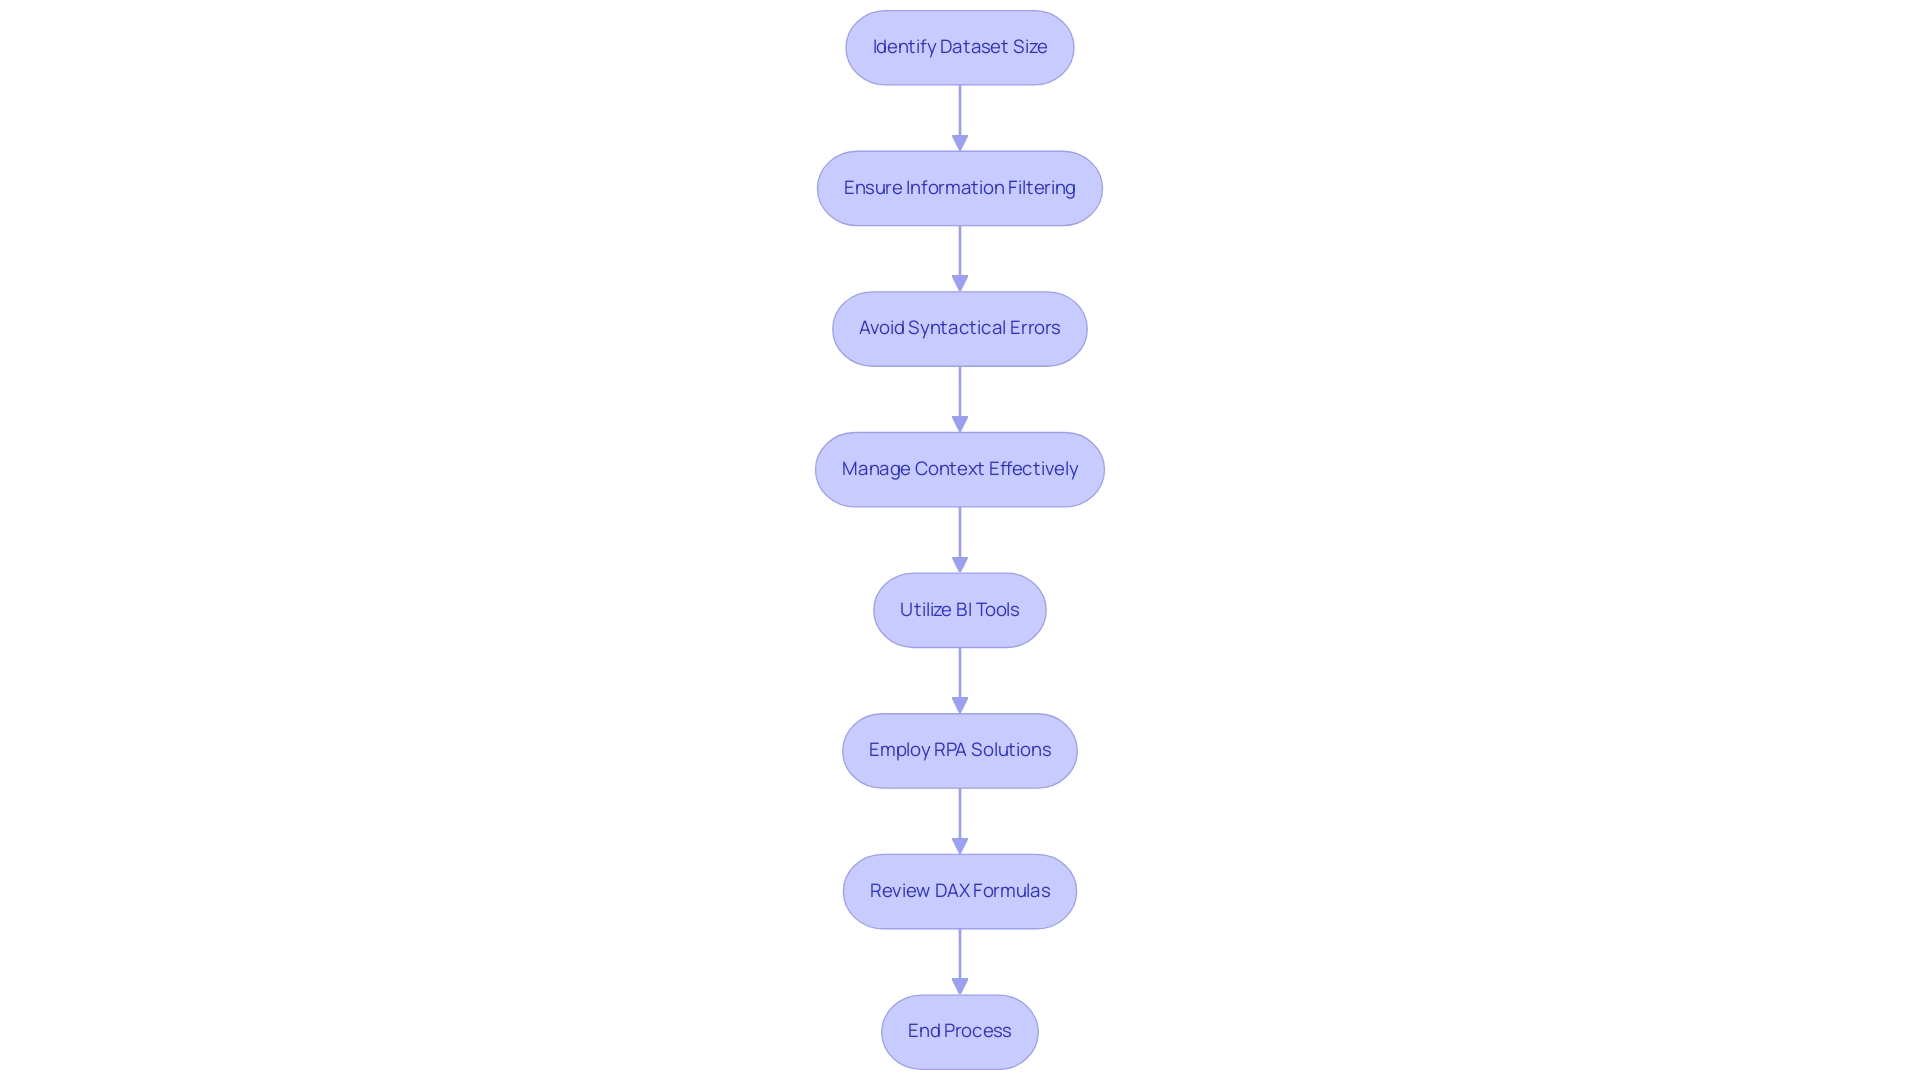
Calculating percentile dax can pose significant challenges, particularly when working with large datasets. Analysts must navigate issues such as ensuring precise information filtering and avoiding syntactical errors in functions. A frequent pitfall arises from the incorrect application of the percentile dax function; if the information context is not meticulously managed, it can result in misleading outcomes.
As Henry Chukwunwike Morgan-Dibie aptly states,
Simplifying complex topics to empower understanding and decision-making.
Therefore, it is crucial for analysts to be acutely aware of the context in which they operate and to effectively employ the appropriate functions, including percentile dax. Utilizing Business Intelligence tools, along with RPA solutions such as EMMA RPA and Power Automate, can convert raw information into actionable insights, which is vital for informed decision-making that propels growth and innovation.
Understanding the implications of information types and maintaining consistency in modeling can significantly reduce errors during calculations. Additionally, the use of the BI Connector can enhance visualization capabilities, making it easier to connect and analyze information accurately. DAX, designed specifically for creating calculated columns, measures, and calculated tables in Power BI, emphasizes the importance of correct function application.
Regularly reviewing and testing DAX formulas is essential for identifying potential issues at an early stage, thereby enhancing the reliability and accuracy of analyses. By tackling these typical issues and gaining insights from case studies such as ‘Understanding Data Models and Analysis Services,’ which demonstrate real-world applications and difficulties encountered in DAX calculations, data professionals can create more effective strategies for overcoming barriers in their data processes while enhancing operational efficiency. Automating repetitive tasks through RPA solutions can further streamline these processes, enabling professionals to concentrate on deriving insights instead of getting bogged down by manual calculations.
Advanced Techniques for Optimizing Percentile Calculations in DAX
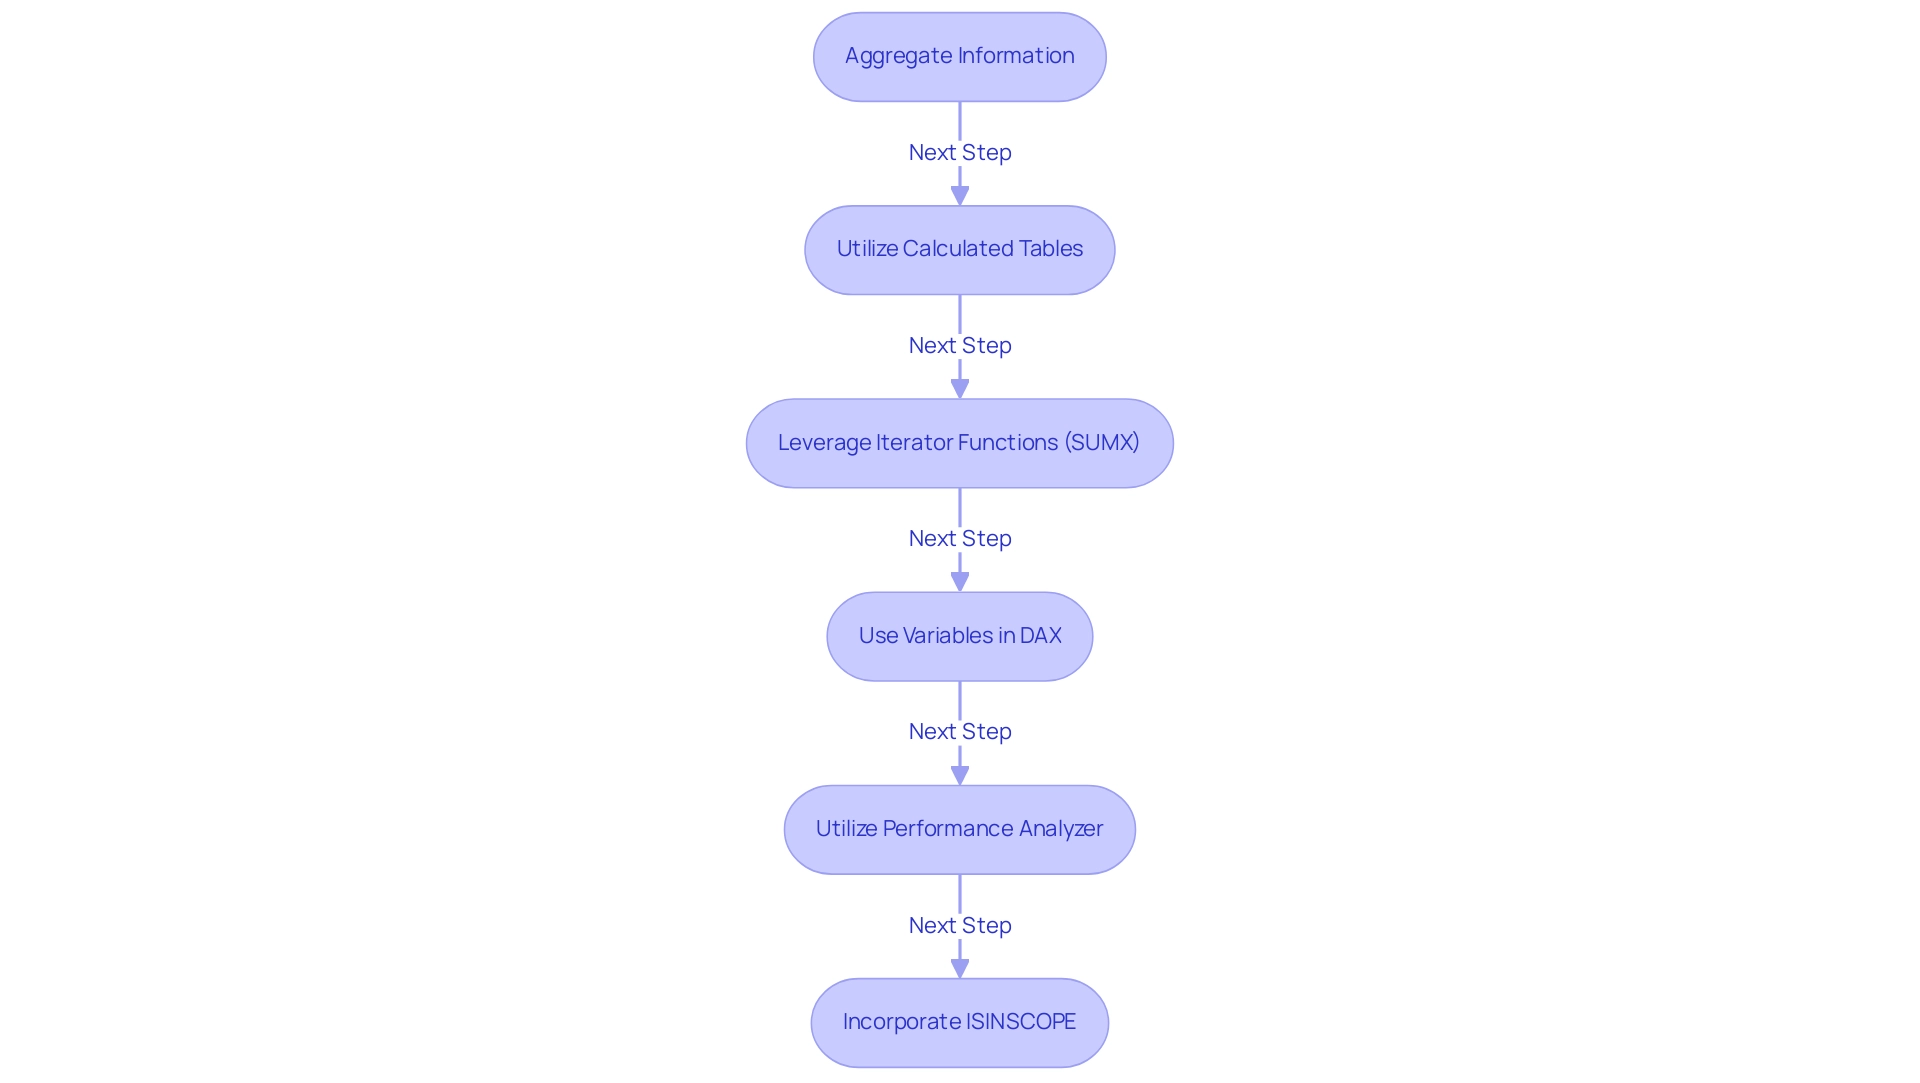
To improve the effectiveness of ranking calculations in DAX, professionals should adopt several advanced methods, including percentile dax, that align with the principles of Robotic Process Automation (RPA) and Business Intelligence. One effective strategy is to aggregate information prior to applying percentile dax functions, which significantly reduces the computational burden during report generation and minimizes the potential for errors. Utilizing calculated tables to pre-calculate values offers a robust approach to streamline processes, echoing the efficiency goals of RPA and freeing up team resources for more strategic, value-adding work.
Moreover, leveraging iterator functions like SUMX can further optimize performance by iterating over each row in a table, allowing for more efficient calculations while minimizing the need for recalculating filter context during iterations. The use of variables within DAX formulas enhances performance by capturing filter context and minimizing redundant calculations, improving code readability and execution speed. Analysts are encouraged to utilize Power Bi’s built-in performance analyzer to identify bottlenecks in their DAX queries, enabling targeted optimizations that can lower operational costs.
Furthermore, incorporating ISINSCOPE can provide faster and more reliable results in specific scenarios. By mastering these advanced techniques, analysts can not only enhance the efficiency of their analyses but also leverage Business Intelligence and percentile dax to drive more impactful business outcomes in 2024, making informed decisions that are essential in today’s rapidly evolving AI landscape. For more insights on optimizing your data analysis processes, consider exploring our latest publication on advanced DAX techniques.
Conclusion
Percentiles are essential tools for data analysts, especially when utilizing DAX in Power BI. This article has explored the foundational concepts of percentiles, emphasizing their significance in interpreting data distributions and enhancing decision-making processes. By mastering functions like PERCENTILEX and RANKX, analysts can navigate large datasets with greater efficiency, unlocking valuable insights necessary for driving strategic initiatives.
The practical applications of percentile calculations extend beyond mere statistical measures; they play a critical role in evaluating key performance indicators and visualizing data effectively. By leveraging advanced techniques and integrating Robotic Process Automation, analysts can streamline workflows, reduce errors, and ensure that their insights are both accurate and actionable. These methods not only improve operational efficiency but also empower stakeholders to make informed decisions based on rich, data-driven narratives.
As the landscape of data analysis continues to evolve in 2024, staying abreast of the latest techniques and tools will be paramount. The challenges associated with percentile calculations are surmountable through careful data management and the application of best practices. By embracing these strategies, analysts can enhance their proficiency and contribute significantly to their organizations’ success in an increasingly complex data environment.