Overview
Power BI conditional formatting based on date is applied by selecting the visual, accessing the conditional styles, and setting rules to modify colors or fonts according to date conditions, enhancing report clarity and urgency. The article outlines a step-by-step process to implement this feature, emphasizing its role in improving decision-making by visually distinguishing time-sensitive information, thus facilitating quicker responses to critical tasks.
Introduction
In the realm of data visualization, Power BI stands out as a powerful tool, particularly when it comes to enhancing reports through conditional formatting. This feature not only streamlines the creation of visually appealing reports but also addresses critical issues such as data inconsistencies and the need for swift decision-making. By applying tailored visual cues based on specific conditions, users can transform complex data into clear, actionable insights.
As organizations increasingly recognize the importance of timely data interpretation, the integration of advanced techniques—such as dynamic formatting and color gradients—becomes essential. This article delves into the intricacies of conditional formatting in Power BI, exploring its significance, practical applications, and best practices to optimize reporting efforts.
Understanding Conditional Formatting in Power BI
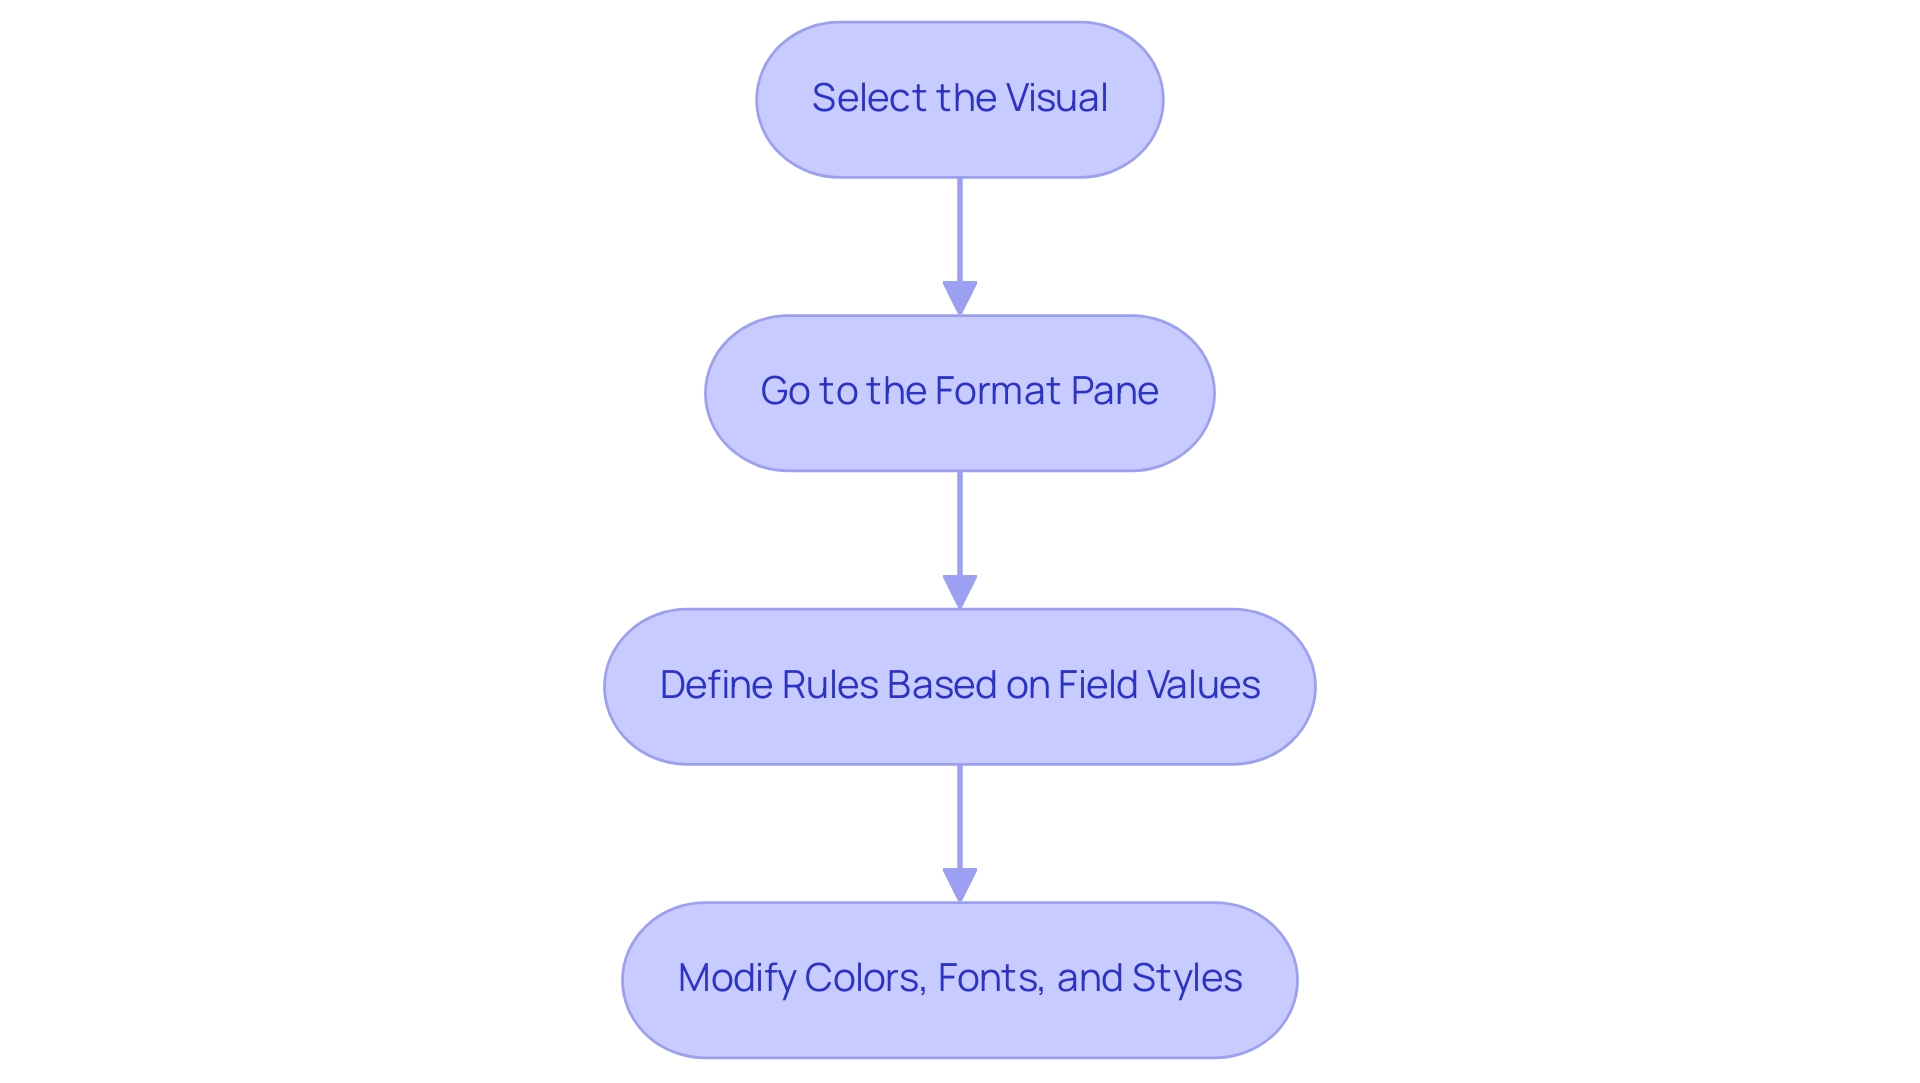
Conditional styling in Power BI acts as a transformative tool for visualization, tackling common issues such as time-consuming report creation and inconsistencies, often worsened by an absence of governance strategy. By applying distinct visual cues based on predefined conditions, users can enhance the interpretability of their reports and ensure consistency in information presentation. To implement Power BI conditional formatting based on date, select the visual, go to the Format pane, and define rules based on field values.
This feature allows for modifications in colors, fonts, and styles of data points, making it easier to derive actionable insights. For instance, employing Power BI conditional formatting based on date to highlight dates according to their status—past, present, or future—enables users to swiftly identify time-sensitive information that demands immediate attention. As Yash Arora, Content Manager at Hevo Data, points out,
The Background color or font color dialogue box will appear with the title containing the name of the field you’re adjusting,
underscoring the intuitive nature of the adjustment process.
A notable statistic shows that red was used for higher numbers of failed banks, representing a negative outcome, illustrating how color choices can convey critical information in information presentation and lead to better decision-making. Recent statistics suggest a rising trend in the use of specialized styling, with many organizations utilizing this feature to improve their information presentation and address the challenge of providing clear, actionable guidance. Moreover, the capability to incorporate web URLs directly into Power BI reports—shown in a case study where clickable links guided users to pertinent Wikipedia pages—highlights the practical uses of situational style, allowing users to concentrate on extracting insights instead of dealing with information logistics.
The Importance of Date-Based Conditional Formatting
Date-oriented conditional styling, such as Power BI conditional formatting based on date, plays a vital role in organizations that rely on timely information for informed decision-making. As Laiba Siddiqui notes, ‘Learn to identify and format all types of data in Excel, then explore valuable tips on converting between data types to make your spreadsheet more functional.’ For example, studies show that effective project deadline management can significantly enhance operational efficiency.
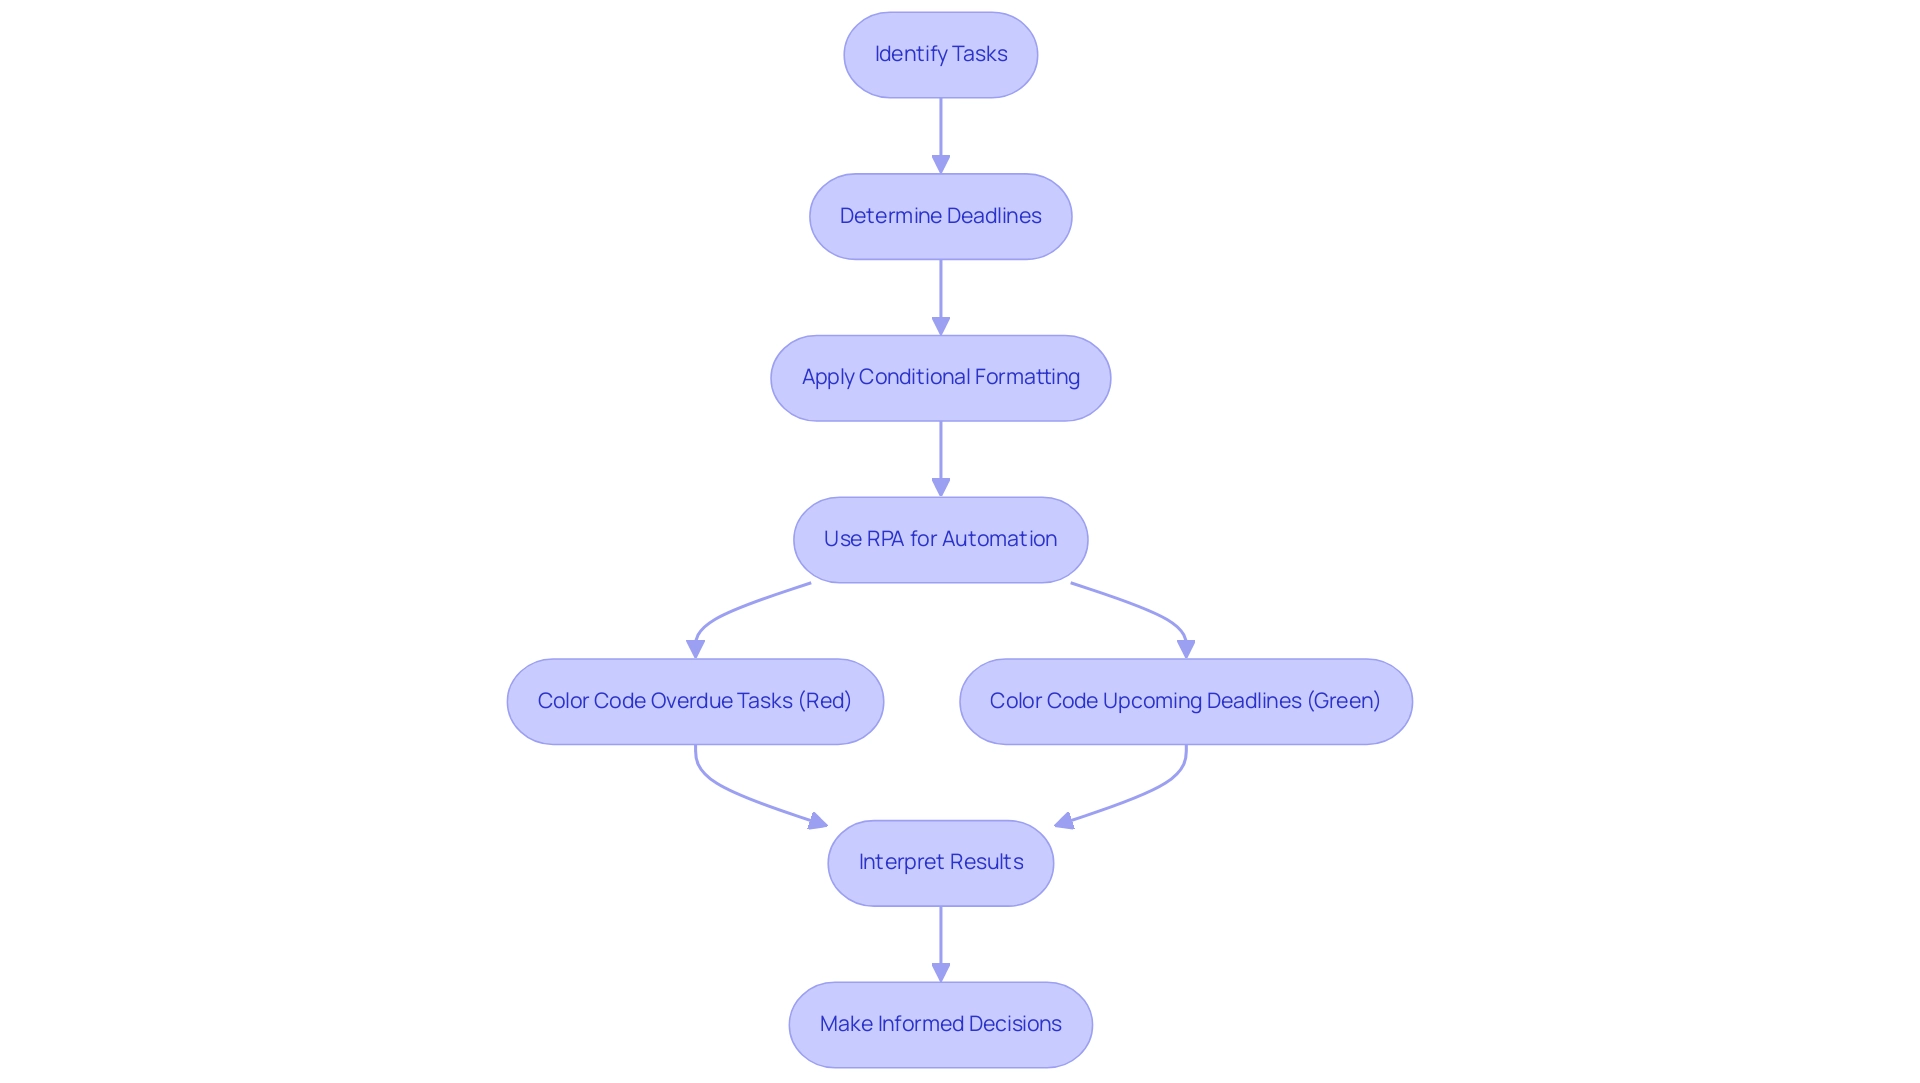
Utilizing Robotic Process Automation (RPA) enables teams to automate the identification and organization of overdue tasks, which can be highlighted in red as a prompt visual cue, indicating areas that need urgent attention. RPA can simplify the arrangement of rules based on conditions, decreasing the repetitive manual effort usually required in this process. Conversely, using green to signify upcoming deadlines, facilitated by RPA, allows teams to prioritize their tasks effectively.
This method of visual differentiation not only simplifies information interpretation but also facilitates quicker responses to potential delays while minimizing the risk of human error. The case analysis named ‘Conclusion on Conditional Styles‘ emphasizes how individuals are encouraged to investigate pre-designed styles and custom regulations, showcasing the simplicity and efficiency of these techniques in highlighting significant information in spreadsheets. Moreover, recent studies highlight that organizations utilizing Power BI conditional formatting based on date alongside RPA experience enhancements in project management results and decision-making processes, with statistics showing that companies employing these practices observe a 30% rise in meeting project deadlines.
By exploring pre-built styles and customizing rules within Excel, and integrating RPA, users can significantly enhance their data analysis capabilities, ultimately leading to better strategic decisions.
Step-by-Step Process for Applying Date Conditional Formatting
To successfully apply date-specific styles in Power BI while ensuring compliance with usage metrics and enhancing operational efficiency through data-driven insights, adhere to the following detailed steps:
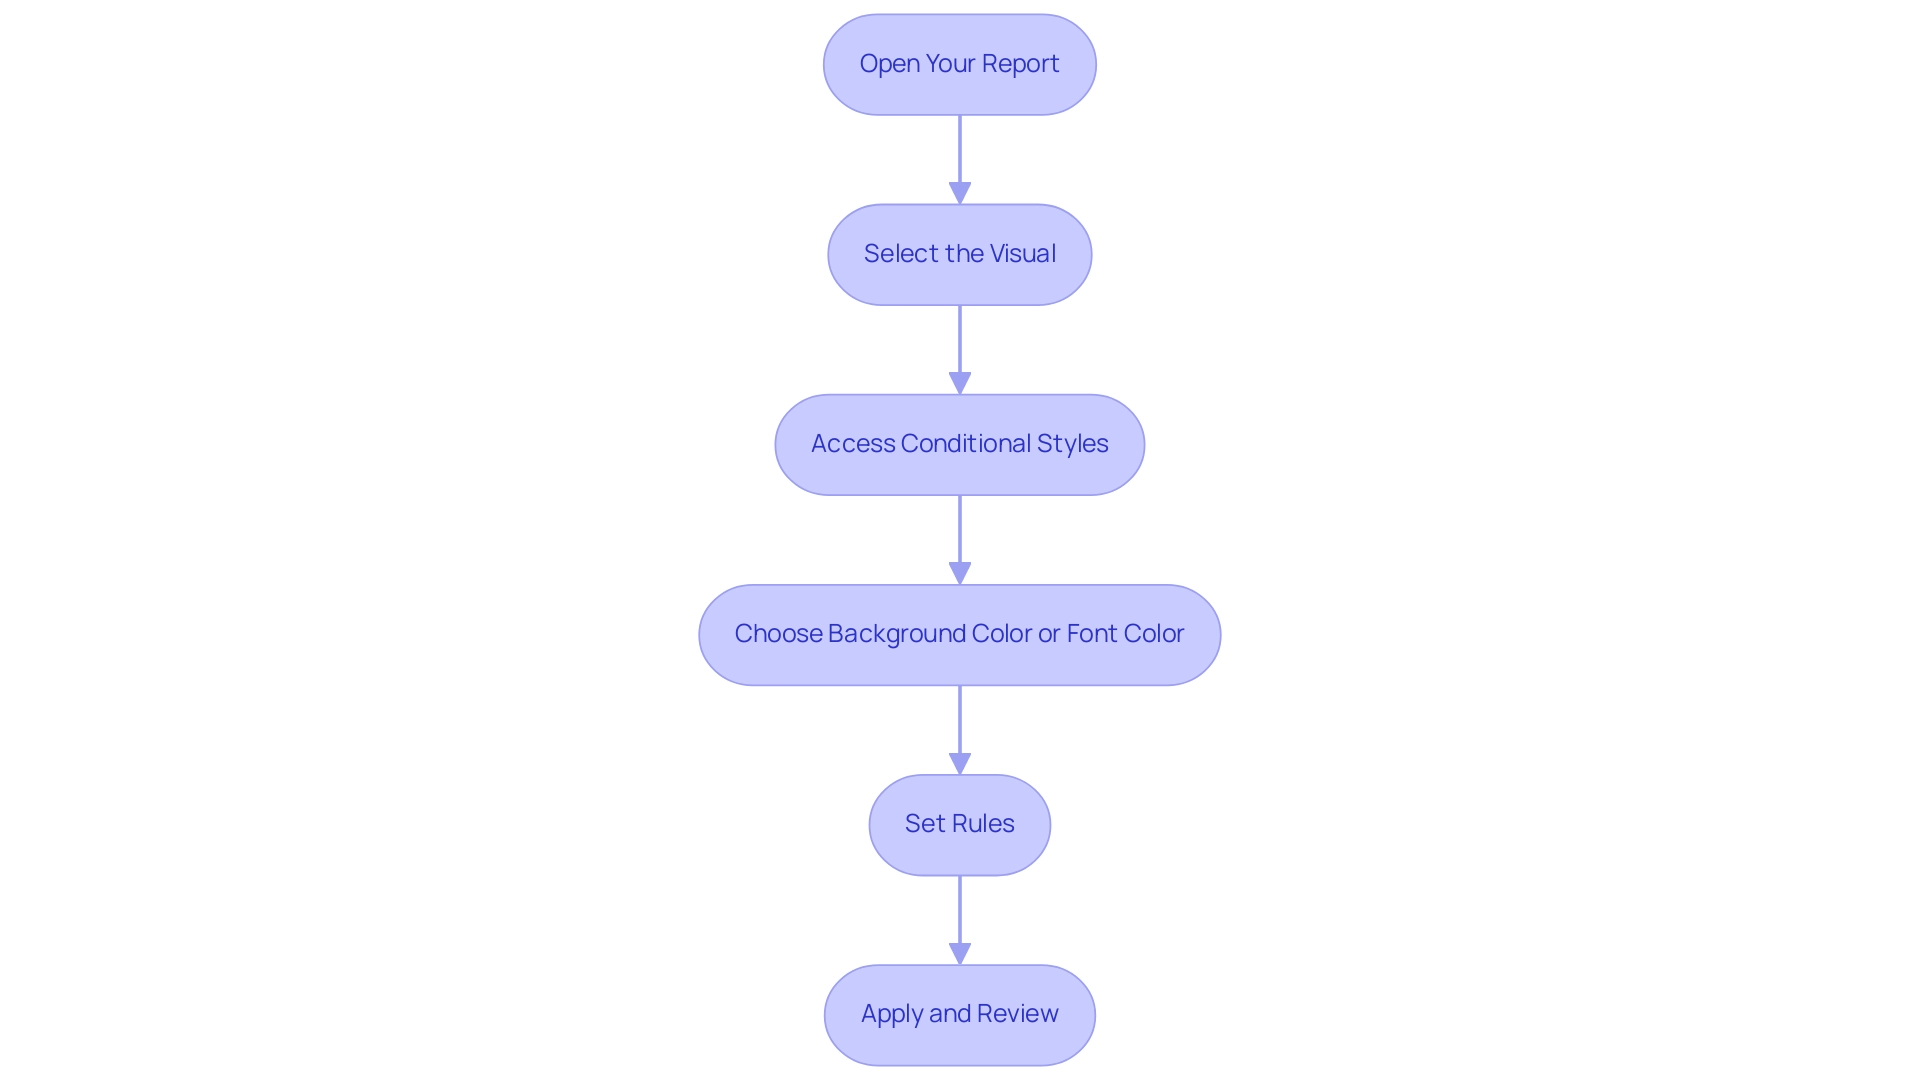
- Open Your Report: Begin by launching Power BI Desktop and opening the specific report where you intend to apply the conditional formatting.
- Select the Visual: Click on the desired visual that includes the date field requiring adjustment. This could be a table, matrix, or any other relevant visual representation.
- Access Conditional Styles: In the Visualizations pane, click the dropdown arrow next to the date field located in the Values section, then select ‘Conditional styles’ to proceed.
- Choose Background Color or Font Color: Decide whether you want to format the ‘Background color’ or the ‘Font color’ according to your visual design preferences.
- Set Rules: In the conditional styling dialog, select ‘Format by’ and choose ‘Rules’. Define conditions based on your date values, such as ‘is before today’ or ‘is after today’, and specify the color that corresponds to each condition to utilize Power BI conditional formatting based on date effectively.
- Apply and Review: After establishing your rules, click ‘OK’ to implement the changes. Take a moment to review your visual to ensure that the conditional formatting reflects as intended and enhances visibility.
It’s crucial to recognize that all new metrics created within scorecards have a default daily tracking cycle, underlining the significance of consistent monitoring in Power BI. Additionally, ensure compliance with NinjaOne’s End User License Agreement (EULA) when utilizing these features. Incorporating RPA can further streamline your information preparation processes, eliminating repetitive tasks and enhancing overall efficiency.
As highlighted in our emphasis on leveraging Business Intelligence, utilizing these guidelines not only streamlines your reporting processes but also aligns with best practices in data visualization, allowing you to overcome challenges such as data inconsistencies and time-consuming report creation while achieving potential cost savings and productivity improvements.
Common Challenges and Solutions in Date Conditional Formatting
The challenges users face with date specific styling can be addressed through Power BI conditional formatting based on date, particularly when overcoming technology implementation issues. Here are some common problems and their solutions:
-
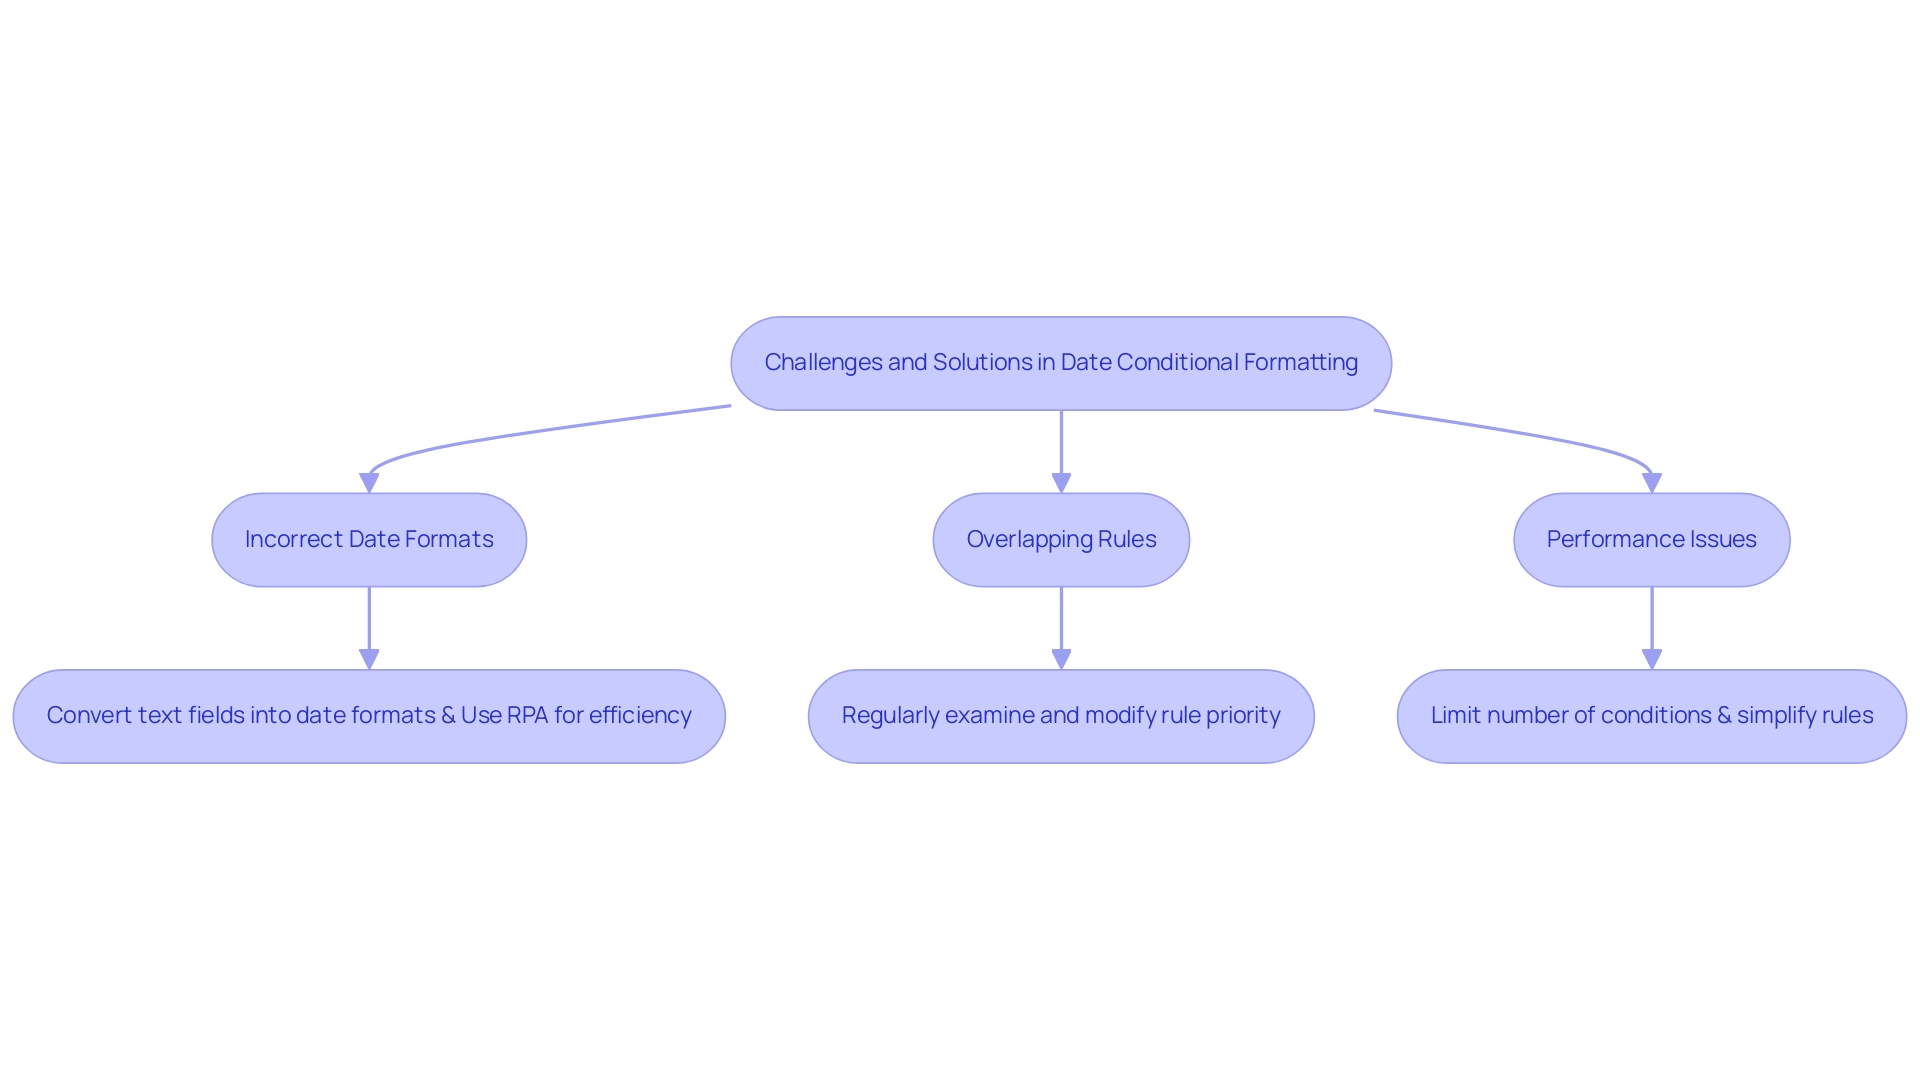
Incorrect Date Formats: A frequent hurdle is ensuring that your date fields are recognized correctly by Power BI. If dates are not in the appropriate format, conditional formatting will not be applied.
It’s essential to convert any text fields into date formats within Power BI to ensure proper functionality, thereby enhancing efficiency and reducing mistakes in interpretation. Additionally, implementing Robotic Process Automation (RPA) can streamline this conversion process, further improving operational efficiency.
-
Overlapping Rules: Multiple rules applied to the same information can lead to confusion; the order of those rules can significantly impact the end result. Users should regularly examine and modify the priority of their rules to ensure that the intended display is shown correctly. This practice connects directly to the wider challenge of inadequate master information quality, which can weaken the effectiveness of AI solutions and business intelligence tools, such as Power BI conditional formatting based on date. Subpar master data quality can result in inconsistent result displays, making it essential to tackle these data problems in advance.
-
Performance Issues: An excess of format rules can impede report performance, worsening difficulties such as lengthy report creation. Statistics indicate that reports with excessive styling can suffer up to a 30% reduction in performance efficiency. To combat this, it’s advisable to limit the number of conditions applied and simplify the rules where possible. This not only enhances performance but also ensures that the report remains responsive and actionable. Leveraging Business Intelligence tools can provide insights into which conditions are most effective, allowing for better decision-making regarding Power BI conditional formatting based on date.
These challenges highlight the importance of strategic management in Power BI conditional formatting based on date. For instance, addressing overlapping rules can be particularly crucial; as noted by community member William Moura,
That’s because somehow, when I select the red and the yellow together, the yellow becomes white.
This underscores the need for clear and prioritized rules to avoid unexpected results. Furthermore, the case study on dynamic filtering illustrates that optimizing conditions can lead to enhanced interactivity and experience in reports. By utilizing multiple slicers effectively, individuals can ensure that their visuals, including the Card visual, display relevant messages based on selected filters, enhancing overall functionality and responsiveness while leveraging insights from Power BI dashboards.
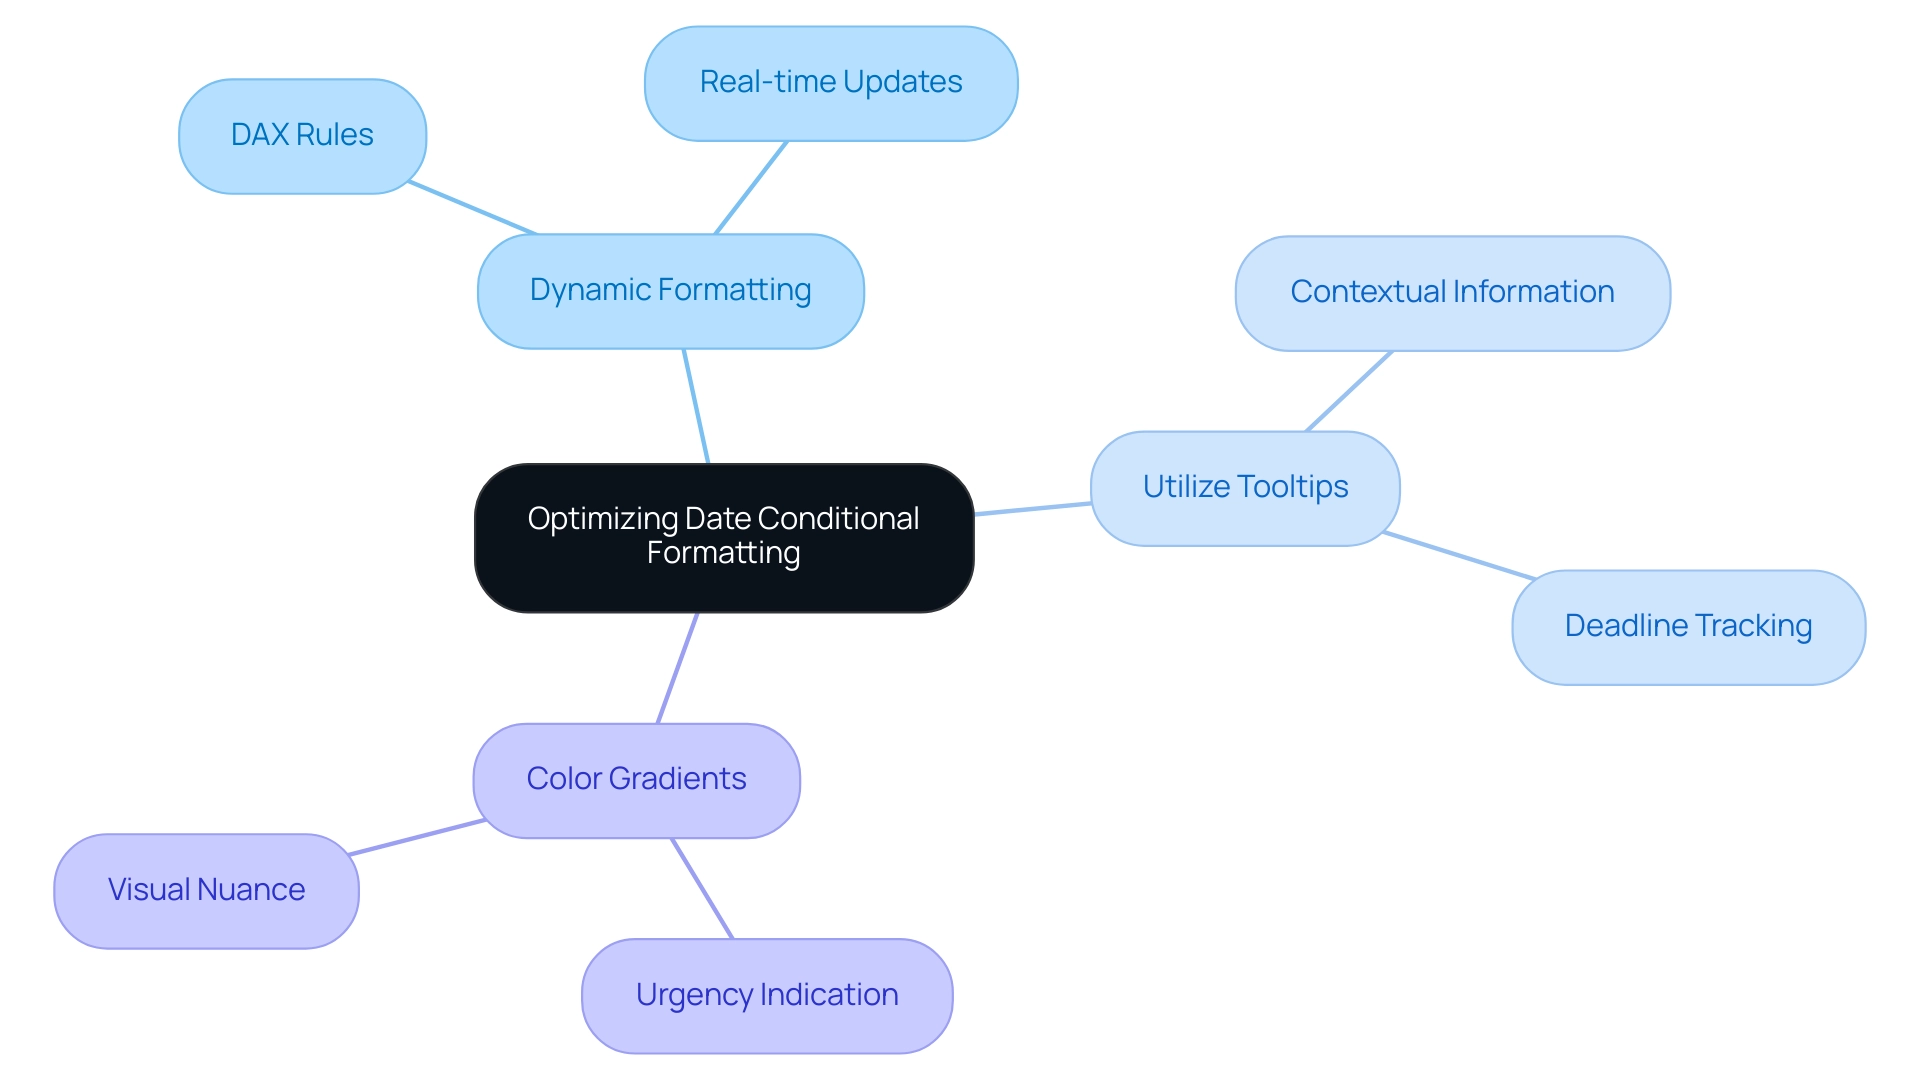
Advanced Techniques for Optimizing Date Conditional Formatting
To enhance your date conditional formatting in Power BI effectively and leverage the power of Business Intelligence, consider implementing the following advanced techniques while also addressing common challenges faced in leveraging insights from Power BI dashboards:
-
Dynamic Formatting: Leverage Data Analysis Expressions (DAX) to establish dynamic rules that adapt based on user inputs or slicers. This method enables the development of interactive reports that react to real-time information changes, significantly enhancing engagement and tackling issues such as time-consuming report generation.
-
Utilize Tooltips: Enhance the overall experience by integrating tooltips that provide additional context when individuals hover over formatted dates. These tooltips can show essential information such as the number of days left until a deadline or comparisons to historical records, enhancing the analytical depth of your reports and ensuring actionable guidance.
-
Color Gradients: Move beyond solid color applications and consider using color gradients to visually convey the urgency of dates. For instance, using a gradient that shifts from green to red can effectively indicate the proximity of deadlines, presenting a more nuanced perspective on the information and allowing users to quickly assess critical timelines.
As shown in a recent case study by Angelica Domenech, applying background color styling can significantly improve information interpretation. Angelica stated, ‘In the example presented, I demonstrated how to apply conditional formatting to show failed banks by state.’ In her example, she utilized color coding to illustrate the number of failed banks by state, where green represented lower numbers (a positive outcome) and red indicated higher figures (a negative outcome).
This method not only clarified the information but also made it visually engaging for users.
Moreover, the challenges of inconsistencies can be mitigated by utilizing COUNTIF in conjunction with these techniques, while also applying Power BI conditional formatting based on date to enhance your management and decision-making processes. By embracing these BI practices alongside RPA solutions, such as EMMA RPA and Microsoft’s Power Automate, you can transform raw data into actionable insights that drive growth and operational efficiency.
Conclusion
Conditional formatting in Power BI is a game-changer for organizations striving to enhance their data visualization capabilities. By applying tailored visual cues based on specific conditions, users can simplify complex data sets and ensure consistency in reporting. The practical application of this feature, particularly in highlighting critical information such as deadlines, empowers teams to make swift and informed decisions, ultimately boosting operational efficiency.
The importance of date-based conditional formatting cannot be overstated. It not only aids in effective project management by providing immediate visual cues for overdue tasks but also enhances overall productivity through automation. Leveraging tools like Robotic Process Automation (RPA) alongside Power BI allows organizations to streamline their reporting processes, facilitating better data analysis and strategic decision-making.
Despite the advantages, challenges such as incorrect date formats and overlapping rules can hinder the effectiveness of conditional formatting. By understanding these common pitfalls and implementing advanced techniques like dynamic formatting and color gradients, users can optimize their reports for improved clarity and responsiveness. This strategic approach not only enhances user engagement but also transforms raw data into actionable insights, paving the way for greater organizational success.
In conclusion, as the reliance on data-driven decision-making continues to grow, the integration of conditional formatting in Power BI is essential. Organizations that embrace these practices will find themselves better equipped to navigate complex data landscapes, ensuring that their reporting efforts lead to meaningful insights and improved outcomes. The time to harness the full potential of Power BI is now, and doing so will undoubtedly yield significant benefits for teams and stakeholders alike.

