Overview
To ensure your Power BI table shows all rows, it is essential to systematically check for common issues such as active filters, data relationships, and row-level security settings. The article outlines a step-by-step approach, emphasizing the importance of removing filters, verifying relationships, and refreshing data to enhance visibility and ensure comprehensive data representation.
Introduction
In the realm of data visualization, Power BI stands out as a powerful tool designed to transform raw data into meaningful insights. However, users often encounter challenges related to row visibility in tables, which can obscure critical information and lead to flawed decision-making. Understanding the intricacies of Power BI tables, including the significance of data relationships, filters, and security settings, is essential for maximizing the reporting experience.
By implementing best practices and leveraging advanced techniques like DAX and Power Query, users can ensure that their reports are not only comprehensive but also actionable. This article delves into common pitfalls, step-by-step solutions, and expert recommendations to enhance data visibility in Power BI, empowering organizations to harness the full potential of their data.
Understanding Power BI Tables and Row Visibility
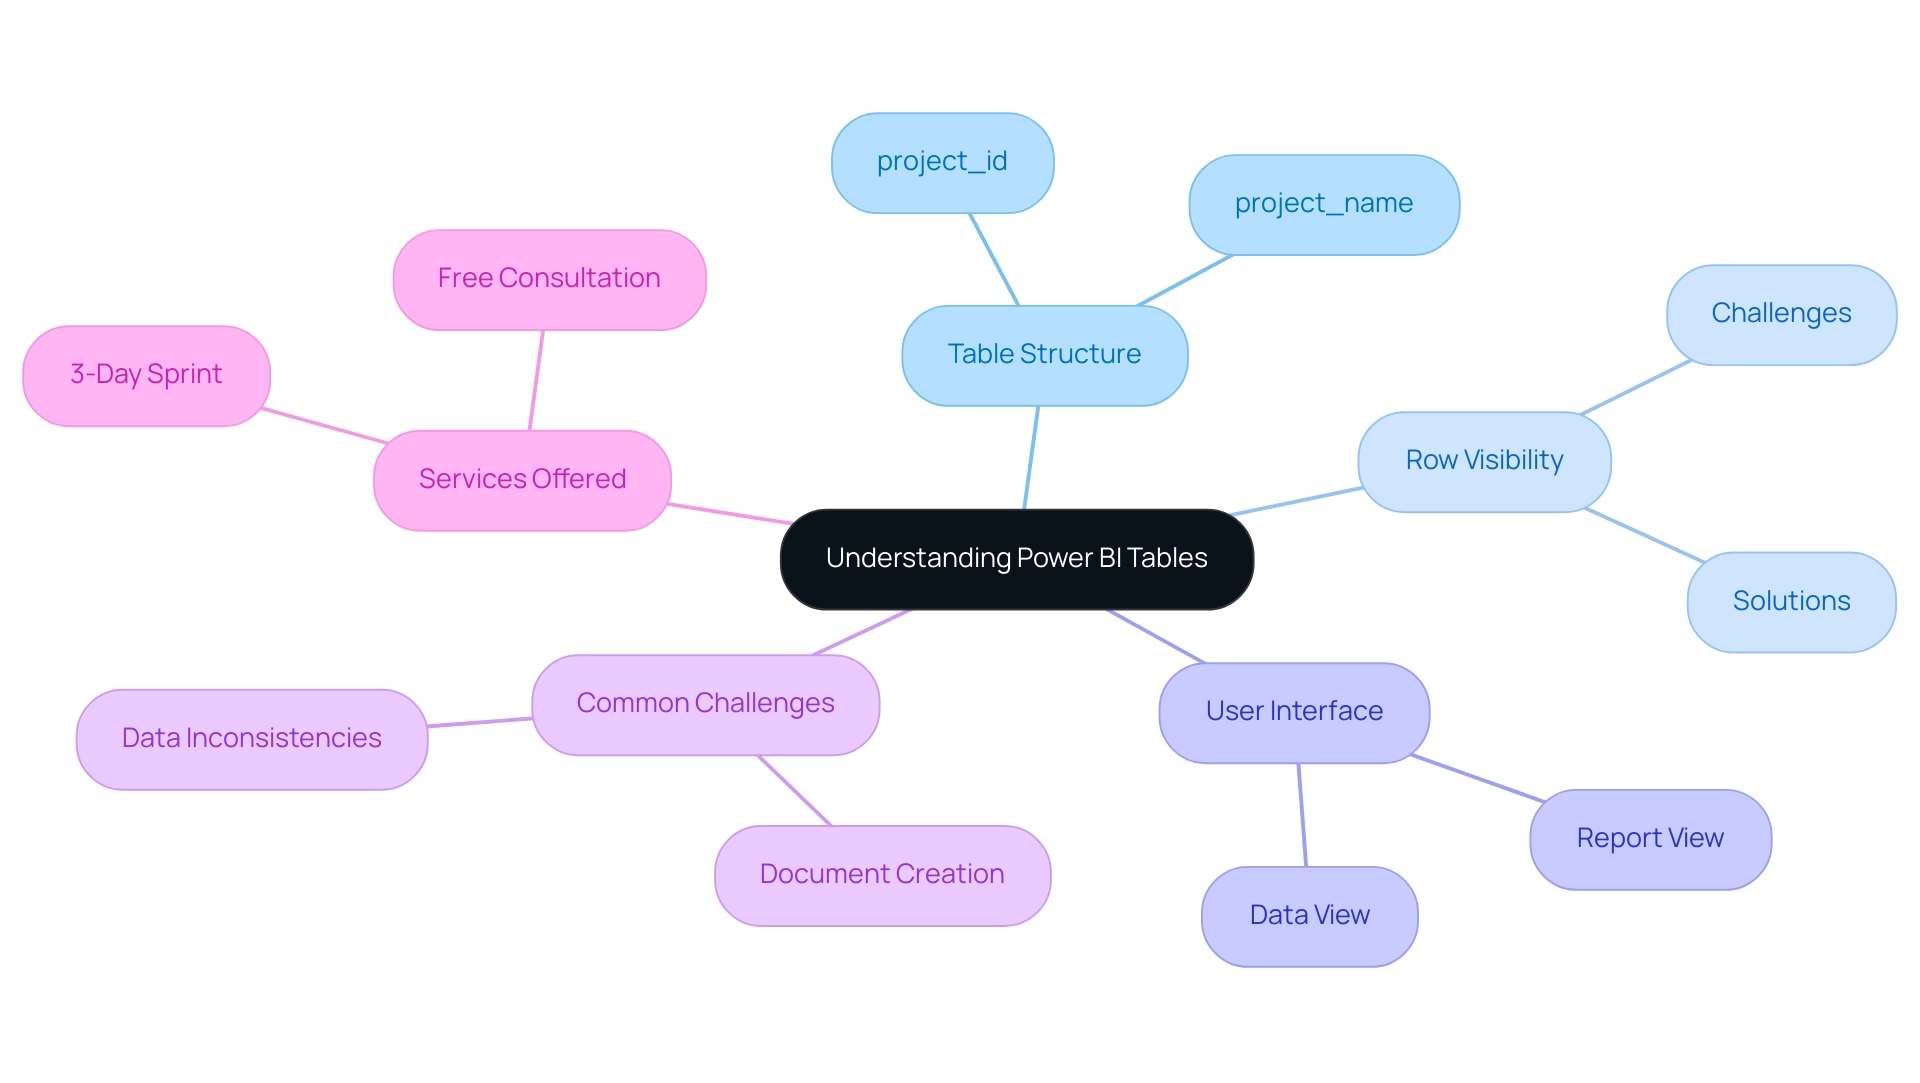
BI tables function as the backbone of effective reporting, enabling users to visualize information methodically. Each table comprises two essential columns: project_id and project_name, with every row corresponding to a distinct record. It is essential to guarantee the clarity of all rows in a power bi table not showing all rows, as any lapse in information completeness can result in distorted insights and misguided decisions.
Users are encouraged to become proficient with the Power BI interface, particularly the data view and report view, to fully grasp how data is showcased and interacted with. This foundational understanding is key to diagnosing and resolving potential row access issues in the reporting process, particularly when a power bi table not showing all rows is involved. However, it’s important to note that the solution for enhancing visibility may not yield the same results for specific visuals, such as Waterfall charts, Scatter plots, and Maps, due to their unique rendering methods.
Furthermore, utilizing BI effectively involves tackling typical obstacles like time-consuming document creation and data inconsistencies, which can hinder obtaining actionable insights. Our services, including the 3-Day Business Intelligence Sprint for rapid report creation—designed to deliver customized, visually appealing reports in just three days—and the General Management App for comprehensive management and smart reviews, are specifically tailored to tackle these challenges head-on. We also offer a free consultation to help you understand how to maximize the benefits of these services.
As highlighted by an Excel specialist turned BI expert,
There’s still a long way to go as you can see when we compare Query against other tools in the market, but it’s nice to know that the Query team is investing in improving the User Experience.
This dedication to user experience is further demonstrated by the ongoing updates and feature enhancements in BI, underscoring the significance of organized information representation for effective reporting.
Common Reasons Rows May Not Show in Power BI Tables
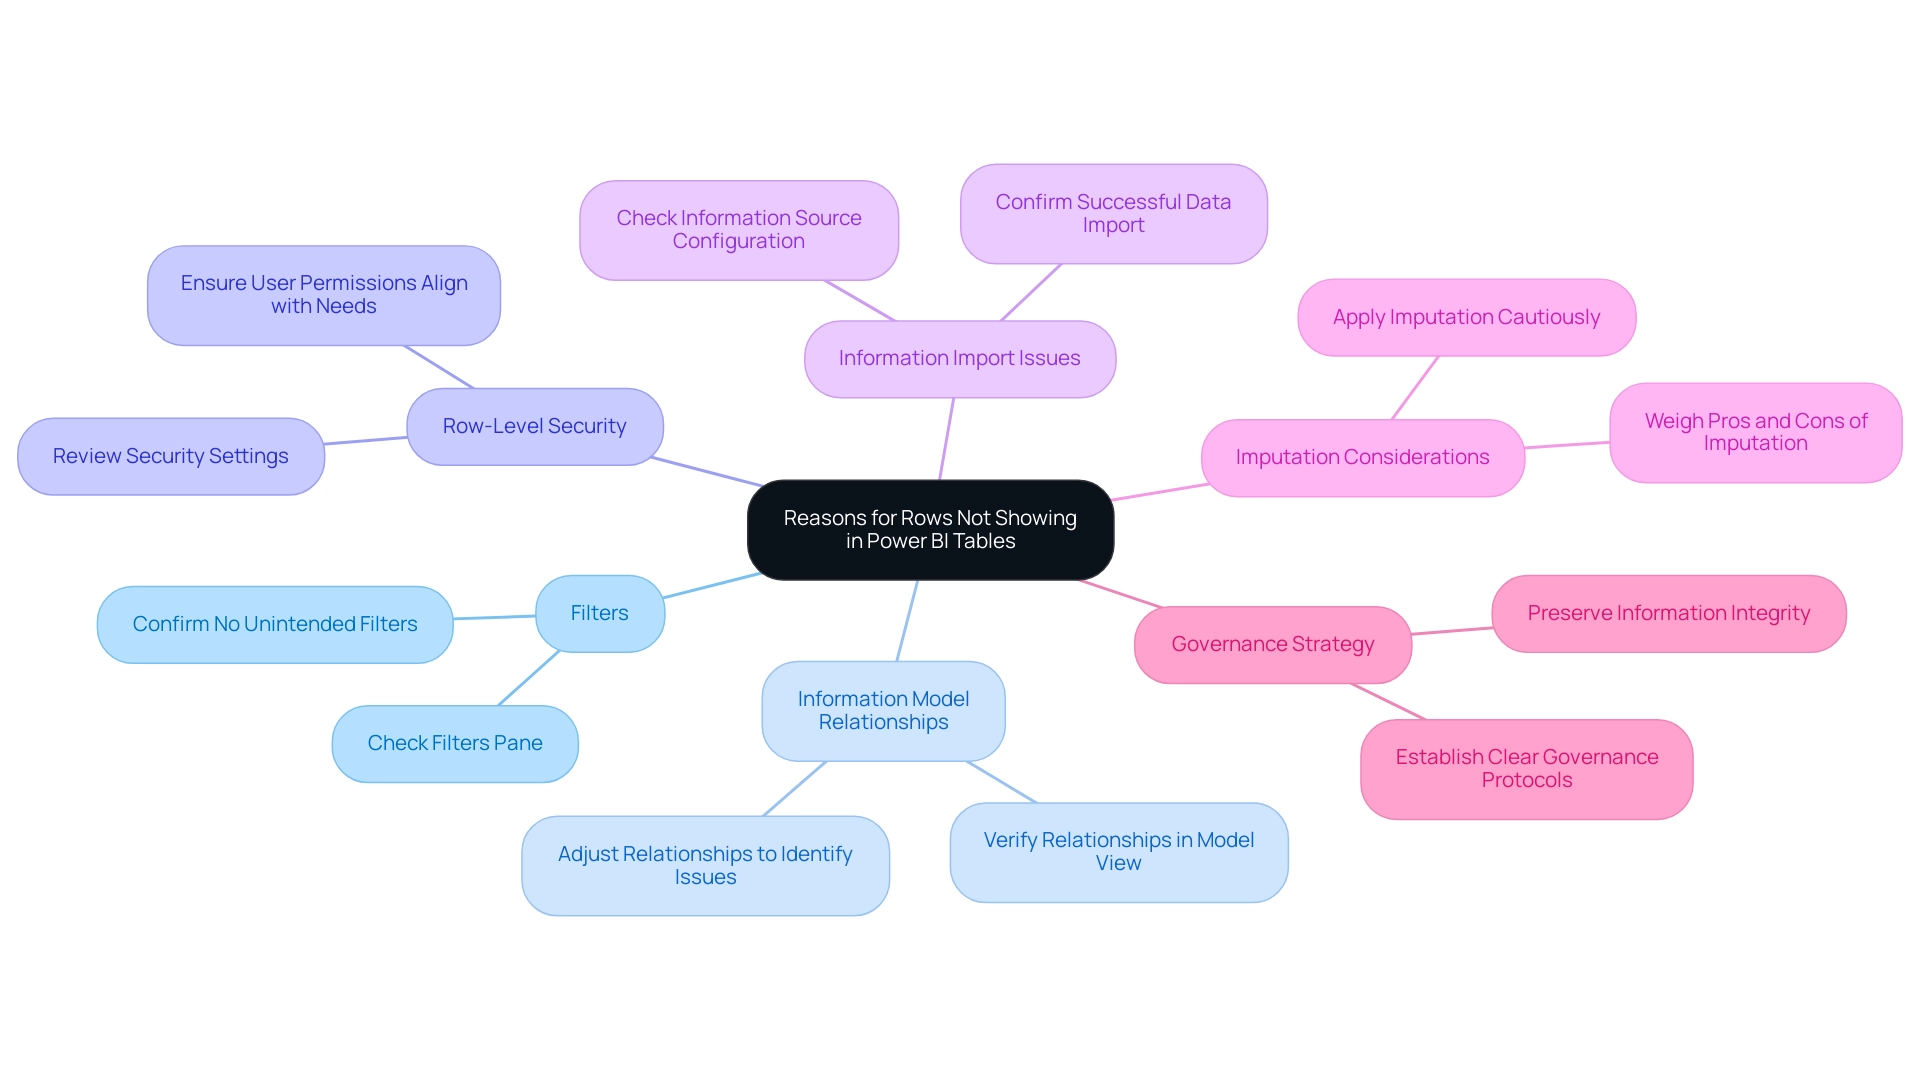
A variety of factors can contribute to the problem of a Power BI table not showing all rows, each requiring careful consideration during troubleshooting. Understanding these challenges is essential for the Director of Operations Efficiency looking to enhance insight generation:
-
Filters: The implementation of active filters on reports or specific pages can significantly restrict displayed information.
It is crucial to examine the filters pane to confirm that no unintended filters are restricting visibility, as this could result in the Power BI table not showing all rows. -
Information Model Relationships: Incorrectly configured relationships between tables can lead to gaps in the information displayed.
Regular verification of these relationships in the model view is essential to ensure they are accurately set up.
As mentioned in recent conversations, adjusting relationships may assist in identifying problems with display, as proposed by another user who advised turning on and off various relationships to check if the absent information shows up. -
Row-Level Security: Implementing row-level security can restrict visibility based on user permissions.
A thorough review of security settings is necessary to ensure they align with the needs of all users, allowing appropriate access to data. -
Information Import Issues: Problems during the information import process can also cause a Power BI table not showing all rows.
It is important to ensure that the information source is correctly configured and that all necessary details are successfully imported into Power BI. -
Imputation Considerations: As Pritha Bhandari states, ‘Imputation is a complicated task because you have to weigh the pros and cons.’
This emphasizes the significance of careful information management practices to avoid inaccuracies that could further complicate visibility issues. -
Governance Strategy: A lack of a proper governance strategy can exacerbate inconsistencies, leading to confusion and mistrust among stakeholders.
Establishing clear governance protocols is essential for preserving information integrity and ensuring that all users can depend on the details provided.
By tackling these challenges, including time-consuming report creation and inconsistencies, users can improve their management strategies and ensure a more effective use of BI. Furthermore, providing stakeholders with clear, actionable guidance will help transform insights into meaningful actions, preventing situations where information is presented without direction.
Step-by-Step Techniques to Display All Rows in Power BI Tables
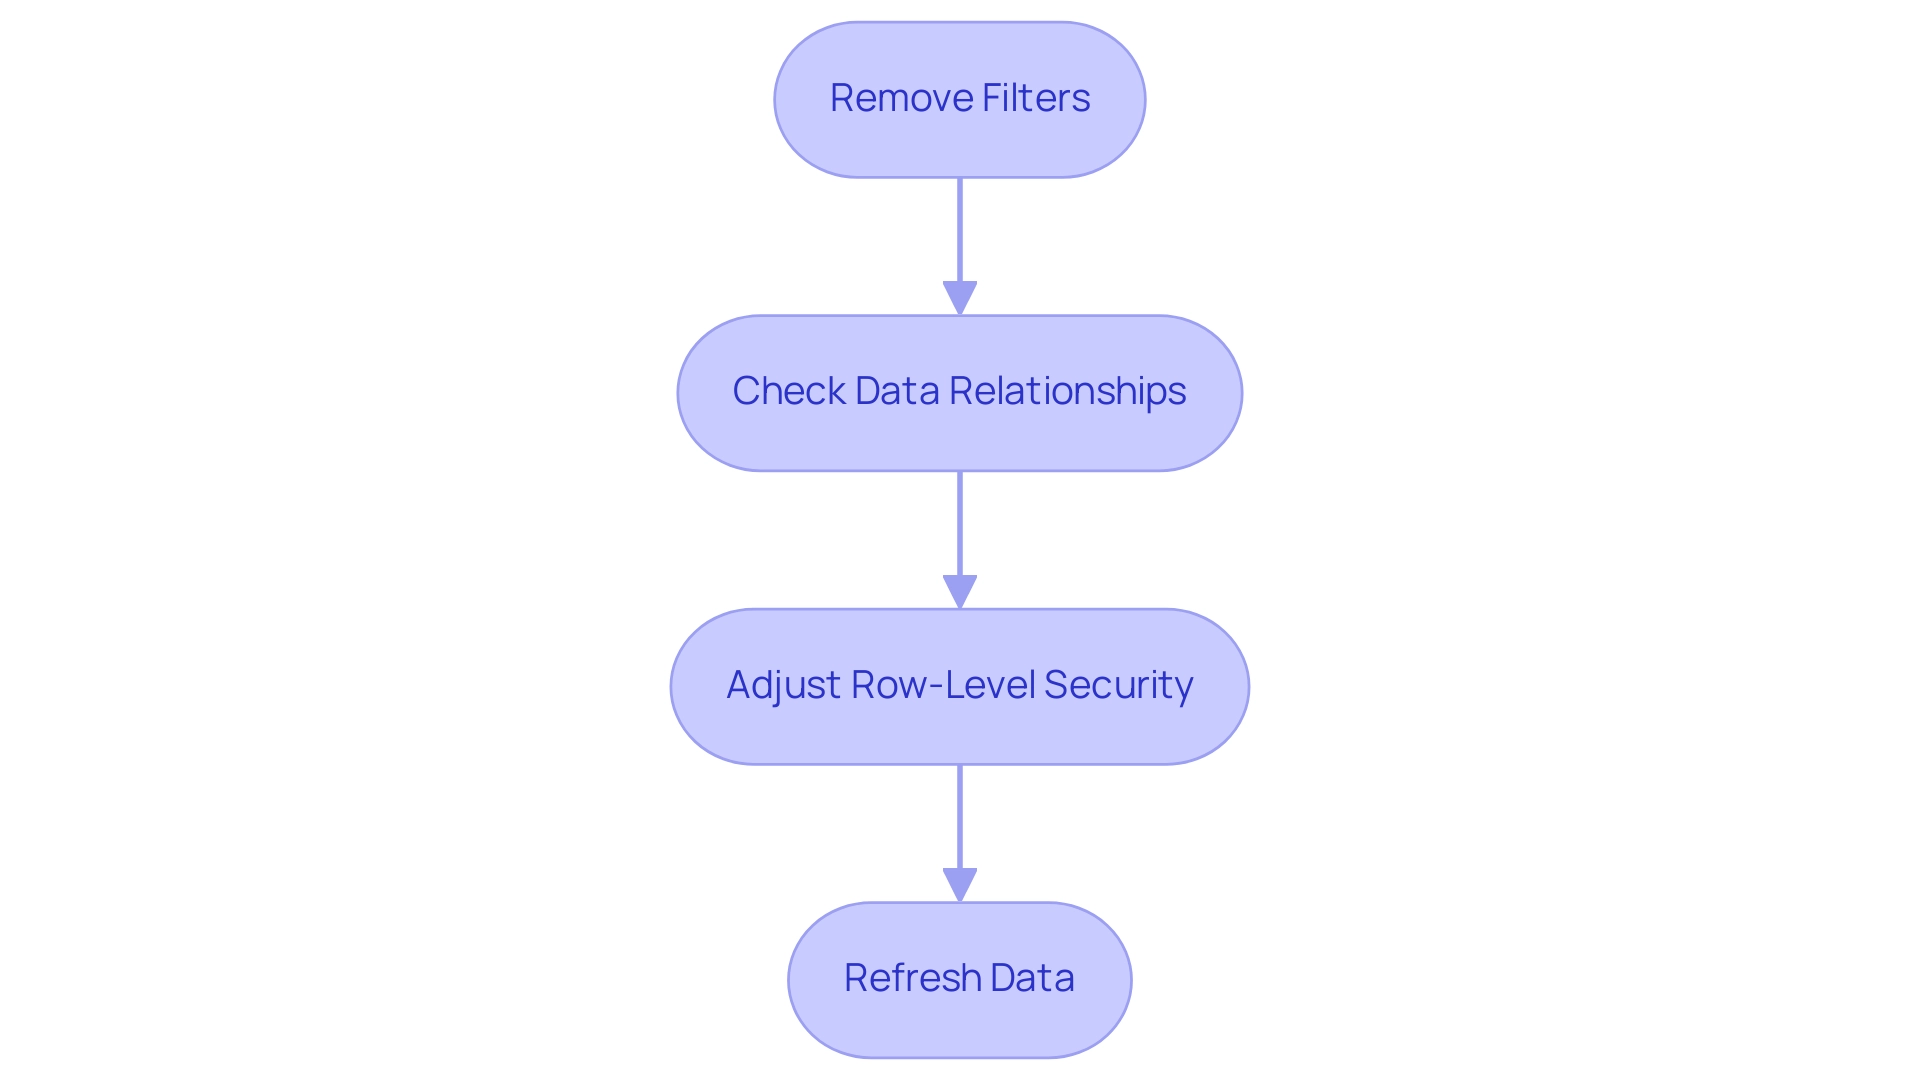
To effectively resolve the problem of a Power BI table not showing all rows, it’s essential to follow a structured approach that ensures optimal visibility. Here’s a comprehensive step-by-step guide:
-
Remove Filters: Begin by navigating to the filters pane.
Clear any filters that may limit the information you want to view. This fundamental step is crucial for ensuring that all pertinent information is considered. -
Check Data Relationships: Proceed to the model view and confirm that all necessary relationships between tables are correctly established.
If you identify any missing relationships, create them by dragging the appropriate fields together. Hubert Ferenc, the Power Platform Practice Lead at TTMS, emphasizes the importance of customized connections, stating,Webcon would have been too large and costly a solution, which is why we chose Power Apps—it met all our needs perfectly.
This emphasizes how essential it is to have well-defined relationships for effective reporting.
Furthermore, ensuring robust data management is essential to prevent confusion and mistrust in the data presented. -
Adjust Row-Level Security: If your report utilizes row-level security, review the settings under the ‘Manage Roles’ option in the modeling tab.
Ensure that the roles assigned to users are configured to allow visibility of the necessary rows. Properly set roles are vital for maintaining information integrity while allowing appropriate access. -
Refresh Data: Finally, click the ‘Refresh’ button located in the Home tab.
This action refreshes the most recent information into BI, addressing potential issues that may occur from outdated details. Frequently updating your information is a best practice for sustaining precise reporting and examination.
By executing these steps, you can address the issue of the Power BI table not showing all rows, greatly improving information visibility and ensuring that all pertinent details are readily accessible for analysis. It’s essential to recognize typical obstacles in utilizing insights from Power BI, such as time-consuming document creation and information inconsistencies. Additionally, addressing the lack of actionable guidance in reports is vital for informing stakeholders on the next steps.
Integrating best practices for information relationships further underscores the importance of tailored solutions in achieving operational efficiency and informed decision-making.
Leveraging DAX and Power Query for Enhanced Row Visibility
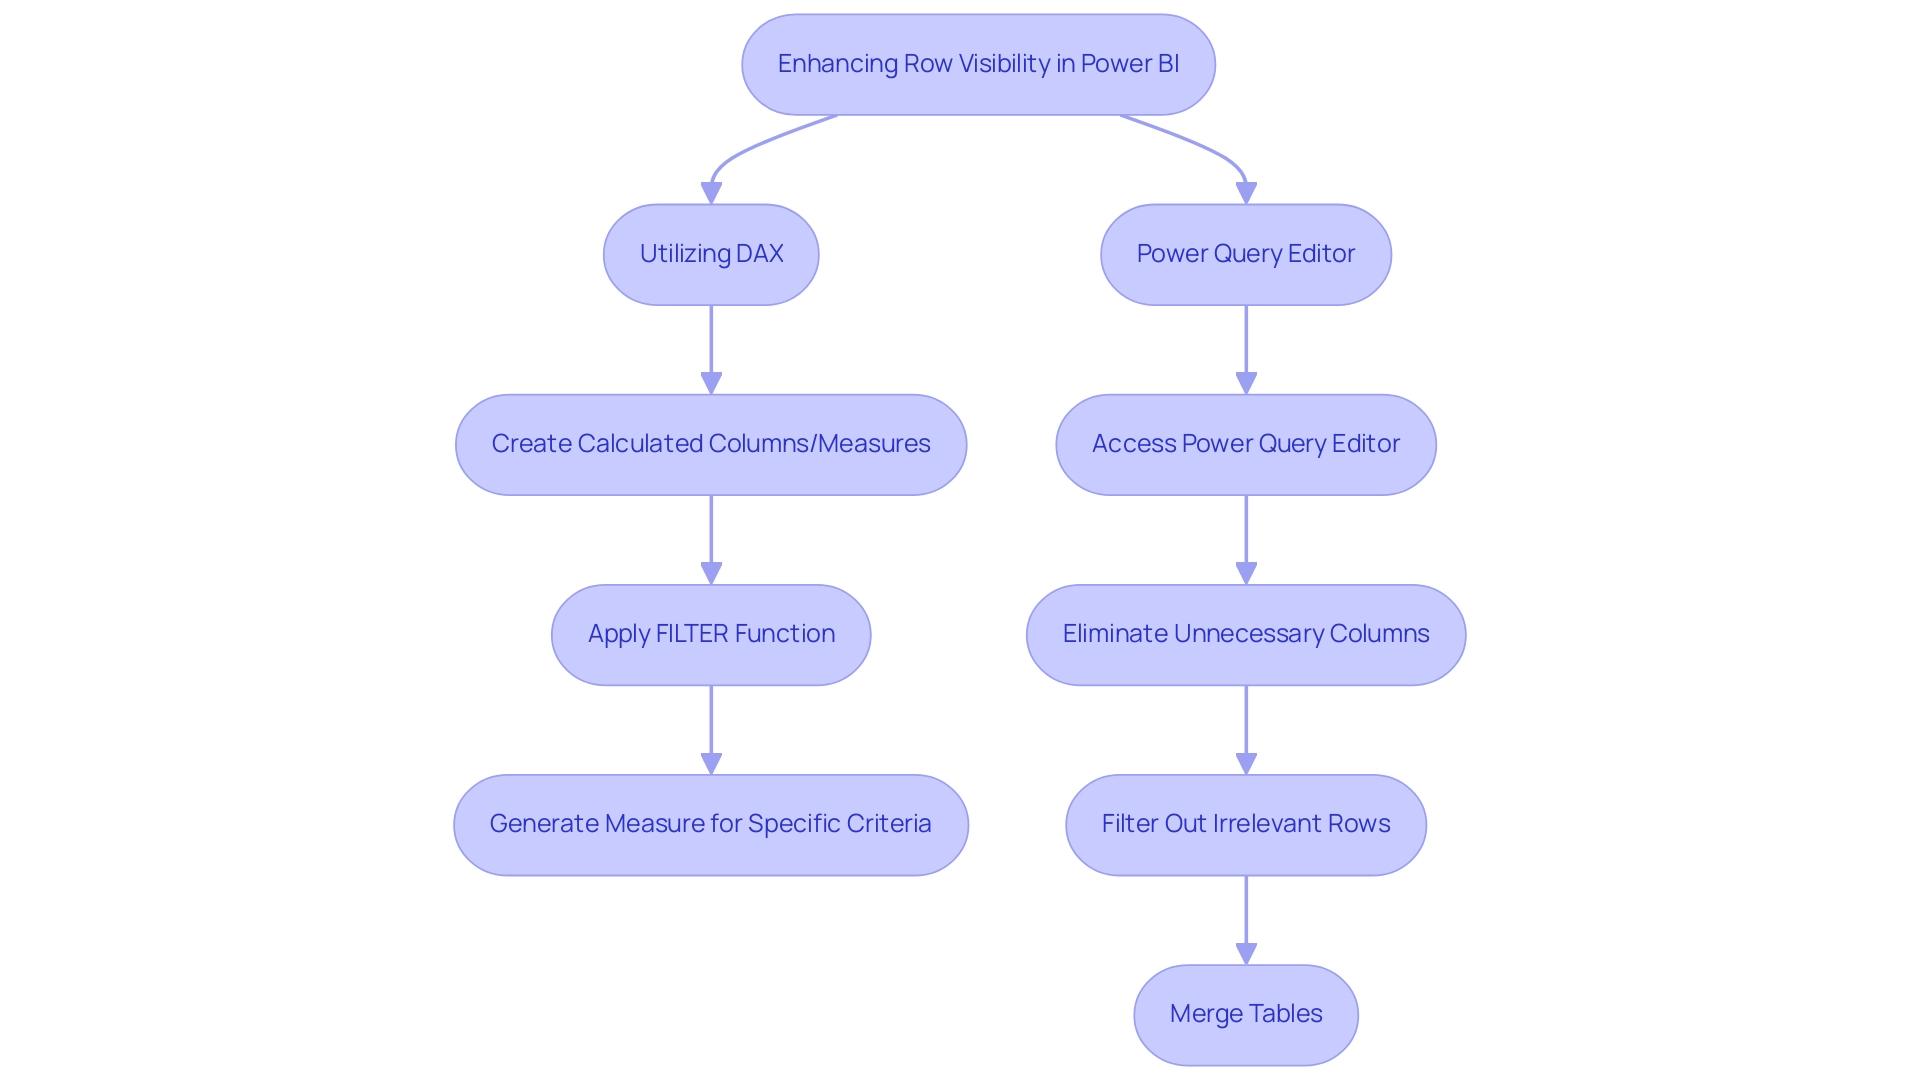
To effectively control information presentation in Power BI and leverage the full potential of Business Intelligence, it’s essential to utilize both DAX and Power Query techniques. Here are key approaches:
-
Utilizing DAX: By creating calculated columns or measures, you can dynamically filter information to display only the most relevant content.
For instance, applying the
FILTERfunction allows you to generate a measure that includes rows meeting specific criteria, thereby providing more precise control over visibility. This can greatly improve your summaries and dashboards, particularly in addressing issues like lengthy document creation and inconsistencies in information. Not utilizing information effectively can leave your business at a competitive disadvantage, making it crucial to maximize the impact of reports that have been viewed in the past 90 days. -
Power Query Editor: Access the Power Query Editor to refine your information prior to its integration into Power BI. This powerful tool enables you to eliminate unnecessary columns, filter out irrelevant rows, and merge tables to address the issue of the Power BI table not showing all rows, ensuring comprehensive information inclusion.
After making your adjustments, remember to apply the changes and close the editor to reflect these updates in your report. As mentioned by Jay from the Community Support Team, “If you are an Admin for BI, you could access this information in Admin portal Audit logs,” which highlights the significance of having administrative access to oversee visibility. Additionally, it’s crucial to remember that for information to be processed for the Usage Metrics Report, users must view the content from within the workspace at least once.
Moreover, incorporating RPA solutions can simplify repetitive tasks related to information management in BI, improving overall reporting efficiency. By employing these techniques, not only do you streamline data management, but you also improve overall reporting efficiency, thus enhancing your organization’s ability to make informed decisions and drive growth.
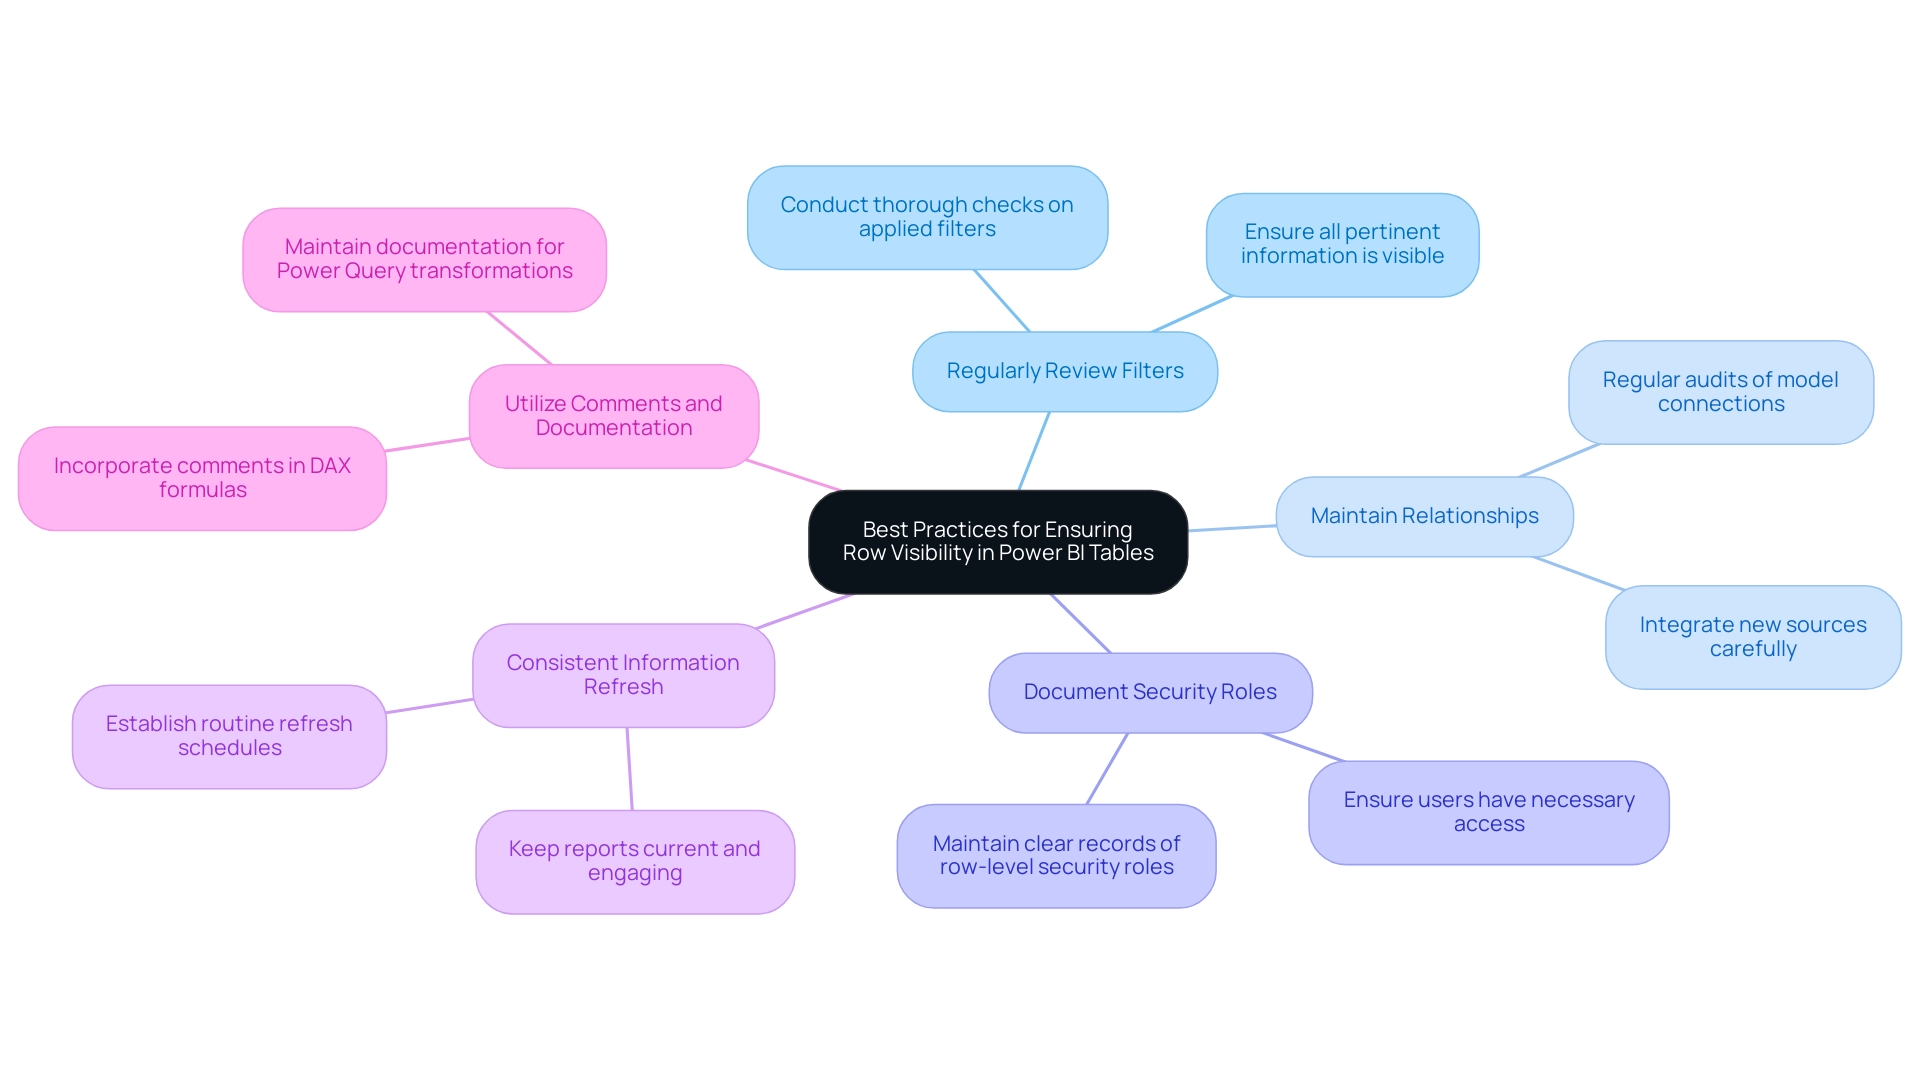
Best Practices for Ensuring Row Visibility in Power BI Tables
To ensure that the power bi table is not showing all rows and to leverage the full potential of Business Intelligence for data-driven insights, it is vital to implement the following best practices:
-
Regularly Review Filters:
Conduct thorough checks on applied filters to address the issue of the power bi table not showing all rows prior to finalizing reports. This step ensures that all pertinent information is visible, which is crucial in situations where a power bi table not showing all rows could lead to oversight of essential details that obstruct informed decision-making. -
Maintain Relationships:
Regular audits of your model are essential to confirm that connections remain intact as new sources are integrated. This practice reduces mistakes and improves information integrity across documents, thus driving operational efficiency. -
Document Security Roles:
Maintaining a clear record of row-level security roles and their associated permissions is crucial. This documentation reduces confusion and ensures users have access to the information they require, while also protecting sensitive details. -
Consistent Information Refresh:
Establish a routine schedule for refreshes to keep reports current and reflective of the latest information. Regular updates can enhance user engagement, as mobile optimization has been shown to increase engagement by up to 30%. -
Utilize Comments and Documentation:
Incorporate comments in your DAX formulas and maintain documentation for your Power Query transformations. This practice facilitates understanding among team members regarding the reasoning behind information manipulations.
As highlighted by experts,
Before joining columns, always clean your information by trimming whitespace and ensuring the values are in a compatible format.
Additionally, utilizing BI’s accessibility checker for dashboard design not only ensures inclusivity but also enhances user satisfaction and adoption rates. Incorporating RPA tools such as EMMA RPA and Automate can enhance processing tasks, minimizing the time required for creation and tackling challenges related to information access.
By adhering to these best practices, you can enhance row visibility, secure sensitive data, and drive better insights from your Power BI reports, ultimately helping to resolve the issue of the power bi table not showing all rows, while also overcoming the challenges of time-consuming report creation and data inconsistencies.
Conclusion
Effective data visualization in Power BI hinges on ensuring row visibility within tables, a critical factor for accurate reporting and informed decision-making. This article has explored the common challenges users face, including:
- Filters
- Data model relationships
- Row-level security
- Data import issues
By addressing these concerns, organizations can enhance their data management strategies and ultimately improve the insights derived from Power BI reports.
Implementing a structured approach to troubleshooting, such as:
- Removing filters
- Verifying data relationships
- Adjusting security settings
- Regularly refreshing data
is essential for displaying all relevant rows. Additionally, leveraging advanced techniques with DAX and Power Query can significantly enhance data visibility, enabling users to create dynamic and actionable reports.
Incorporating best practices—such as:
- Regular reviews of filters and data relationships
- Maintaining clear documentation
- Utilizing automation tools
ensures that Power BI serves as a powerful ally in data-driven decision-making. By focusing on these strategies, organizations can maximize their reporting capabilities and fully harness the potential of their data, paving the way for greater operational efficiency and strategic growth.