Overview
KPI cards stand as essential tools in data visualization, succinctly presenting key performance indicators alongside their target values. This capability empowers organizations to enhance operational efficiency and make informed decisions. By providing immediate insights into performance metrics, KPI cards streamline workflows and facilitate strategic alignment across departments. In doing so, they support effective decision-making in today’s fast-paced business environment.
Consider how KPI cards can transform your organizational approach. They not only offer clarity but also drive accountability, ensuring that teams remain focused on their goals. As you reflect on your current practices, ask yourself: Are you leveraging these powerful tools to their fullest potential?
In conclusion, embracing KPI cards can significantly impact your decision-making processes. By integrating them into your operational strategies, you position your organization for success in a competitive landscape.
Introduction
In the dynamic realm of business, where data is the cornerstone of decision-making and strategy formulation, Key Performance Indicator (KPI) cards have become essential assets for organizations pursuing operational excellence. These visual tools not only display critical metrics alongside their targets but also equip decision-makers with immediate insights that can profoundly impact strategic planning.
As companies navigate the intricacies of performance measurement, KPI cards direct attention to areas requiring focus, ultimately boosting efficiency and effectiveness. This article explores the purpose, features, and best practices related to KPI cards, underscoring their crucial role in promoting data-driven decision-making and aligning organizational objectives in 2025 and beyond.
Defining KPI Cards: An Overview of Their Purpose and Importance
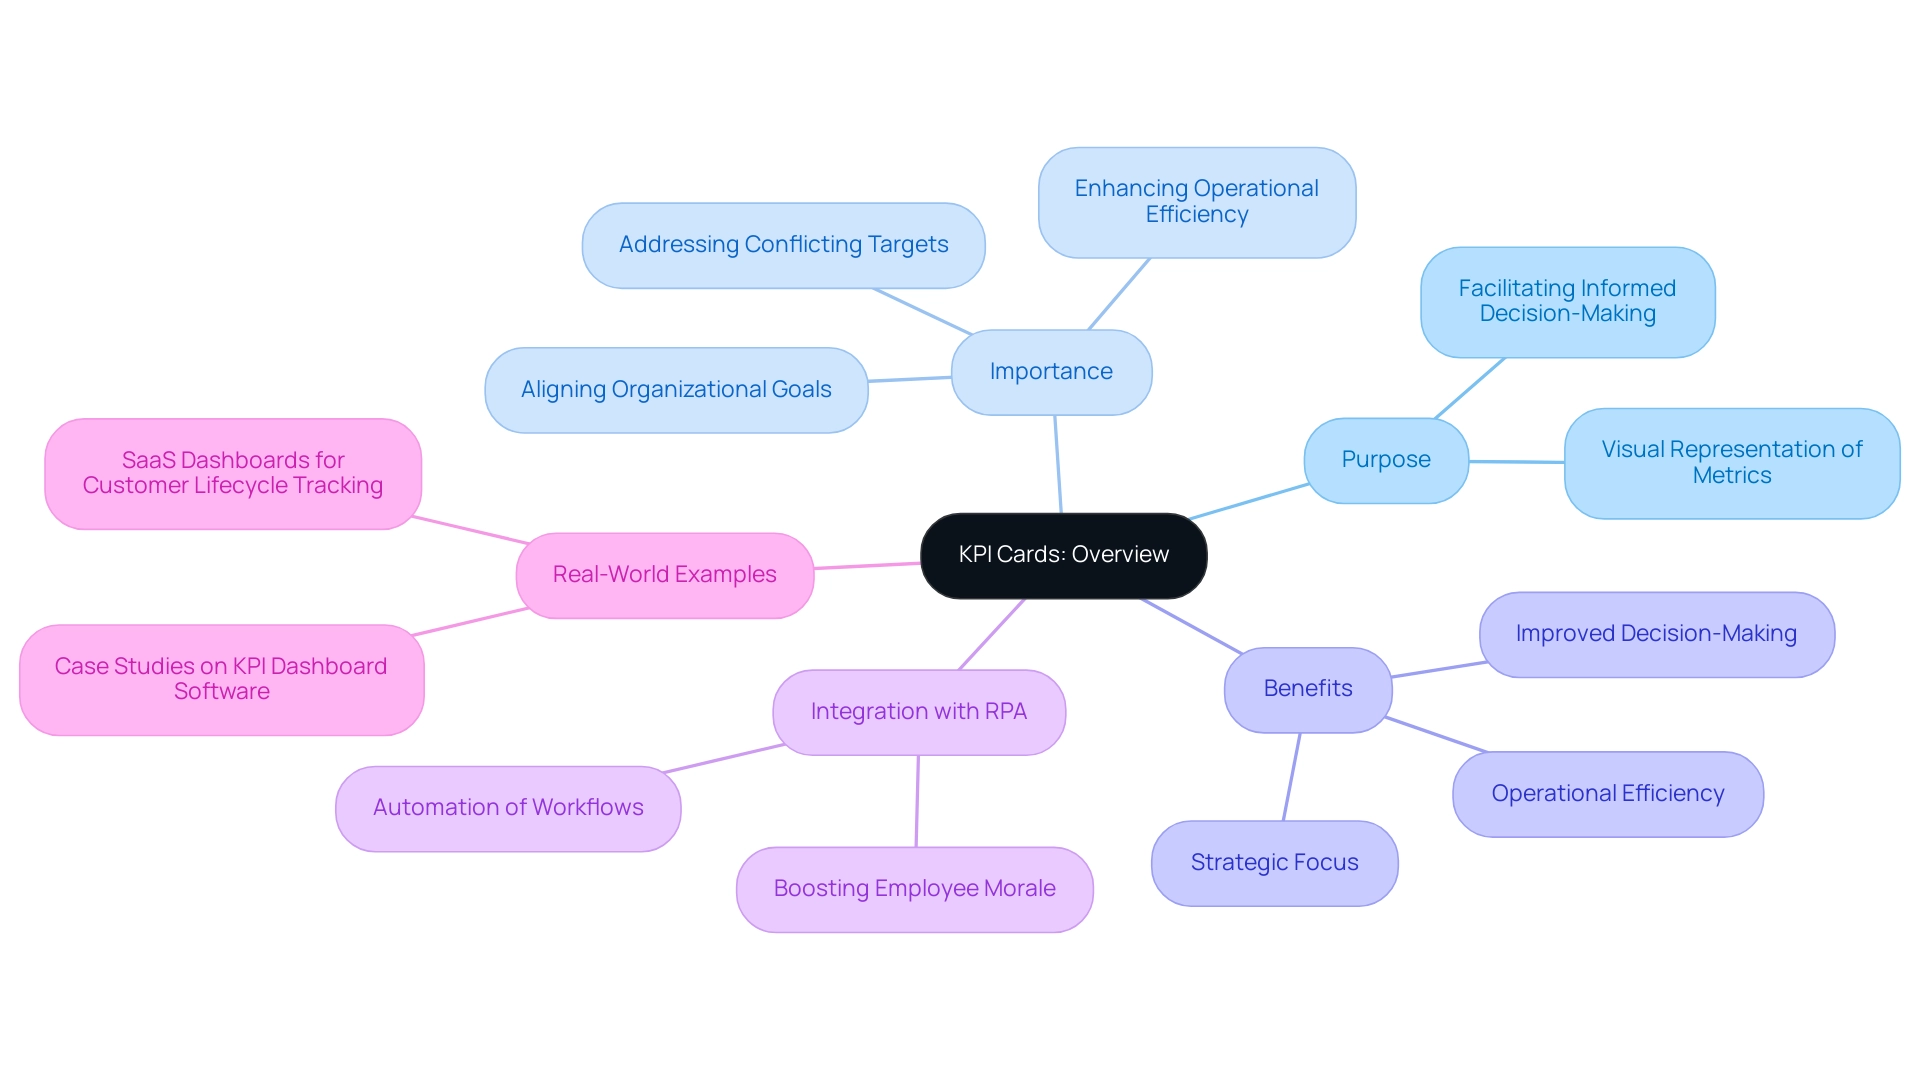
A KPI card serves as a powerful visual tool that succinctly presents a key performance indicator alongside its target value, establishing a cornerstone of effective data visualization. As we approach 2025, KPI card tools have become indispensable for organizations striving to enhance operational efficiency and decision-making processes. They provide a clear snapshot of performance, enabling decision-makers to swiftly assess how well a specific metric aligns with its goal.
This immediacy is vital in today’s fast-paced business environment, where timely insights can significantly influence strategic planning. The aim of KPI tools transcends mere representation; they encompass essential metrics that facilitate informed decision-making. By highlighting areas requiring attention or improvement, KPI tools empower teams to focus their efforts strategically. For instance, organizations that utilize KPI tools have reported a notable increase in operational efficiency, as these resources streamline workflows and minimize the time spent on data analysis.
This relevance is particularly pronounced in the context of Robotic Process Automation (RPA), where automating manual workflows can further boost efficiency and employee morale. Real-world examples illustrate the effectiveness of KPI tools in enhancing decision-making. Companies that have adopted tailored KPI cards have experienced improved visibility into their performance metrics, allowing for more agile responses to market changes. Moreover, integrating KPI card tools into SaaS dashboards facilitates comprehensive tracking of the entire customer lifecycle, yielding valuable insights for marketing, product development, and customer support.
This aligns with the capabilities of Power BI services, which enhance reporting and actionable insights. Professional insights underscore the significance of KPI tools in visual representation. As organizations navigate conflicting targets across departments, KPI tools emerge as a unifying metric that aligns efforts toward common goals. This alignment is crucial, as conflicting objectives can undermine optimization efforts, resulting in inefficiencies.
In this context, KPI tools not only enhance data quality but also clarify the intricate environment of evaluation, ensuring that companies can make data-informed choices that foster growth and innovation. As noted by British economist Charles Goodhart, “When a measure becomes a target, it ceases to be a good measure,” highlighting the critical balance KPI metrics must maintain in evaluating results.
In summary, KPI tools, including the KPI card, are more than just visual aids; they are essential components of a robust decision-making framework. Their ability to provide immediate insights into measurement metrics renders the KPI card indispensable for organizations aiming for operational excellence in 2025 and beyond. Furthermore, the significance of selecting the right KPI card software cannot be overstated, as it ensures that organizations can effectively track their KPIs and derive actionable insights tailored to their specific needs.
Leveraging RPA solutions like EMMA RPA and Microsoft Power Automate can further enhance this process, ensuring that organizations remain competitive in a rapidly evolving AI landscape.
Key Features and Benefits of KPI Cards in Data Visualization
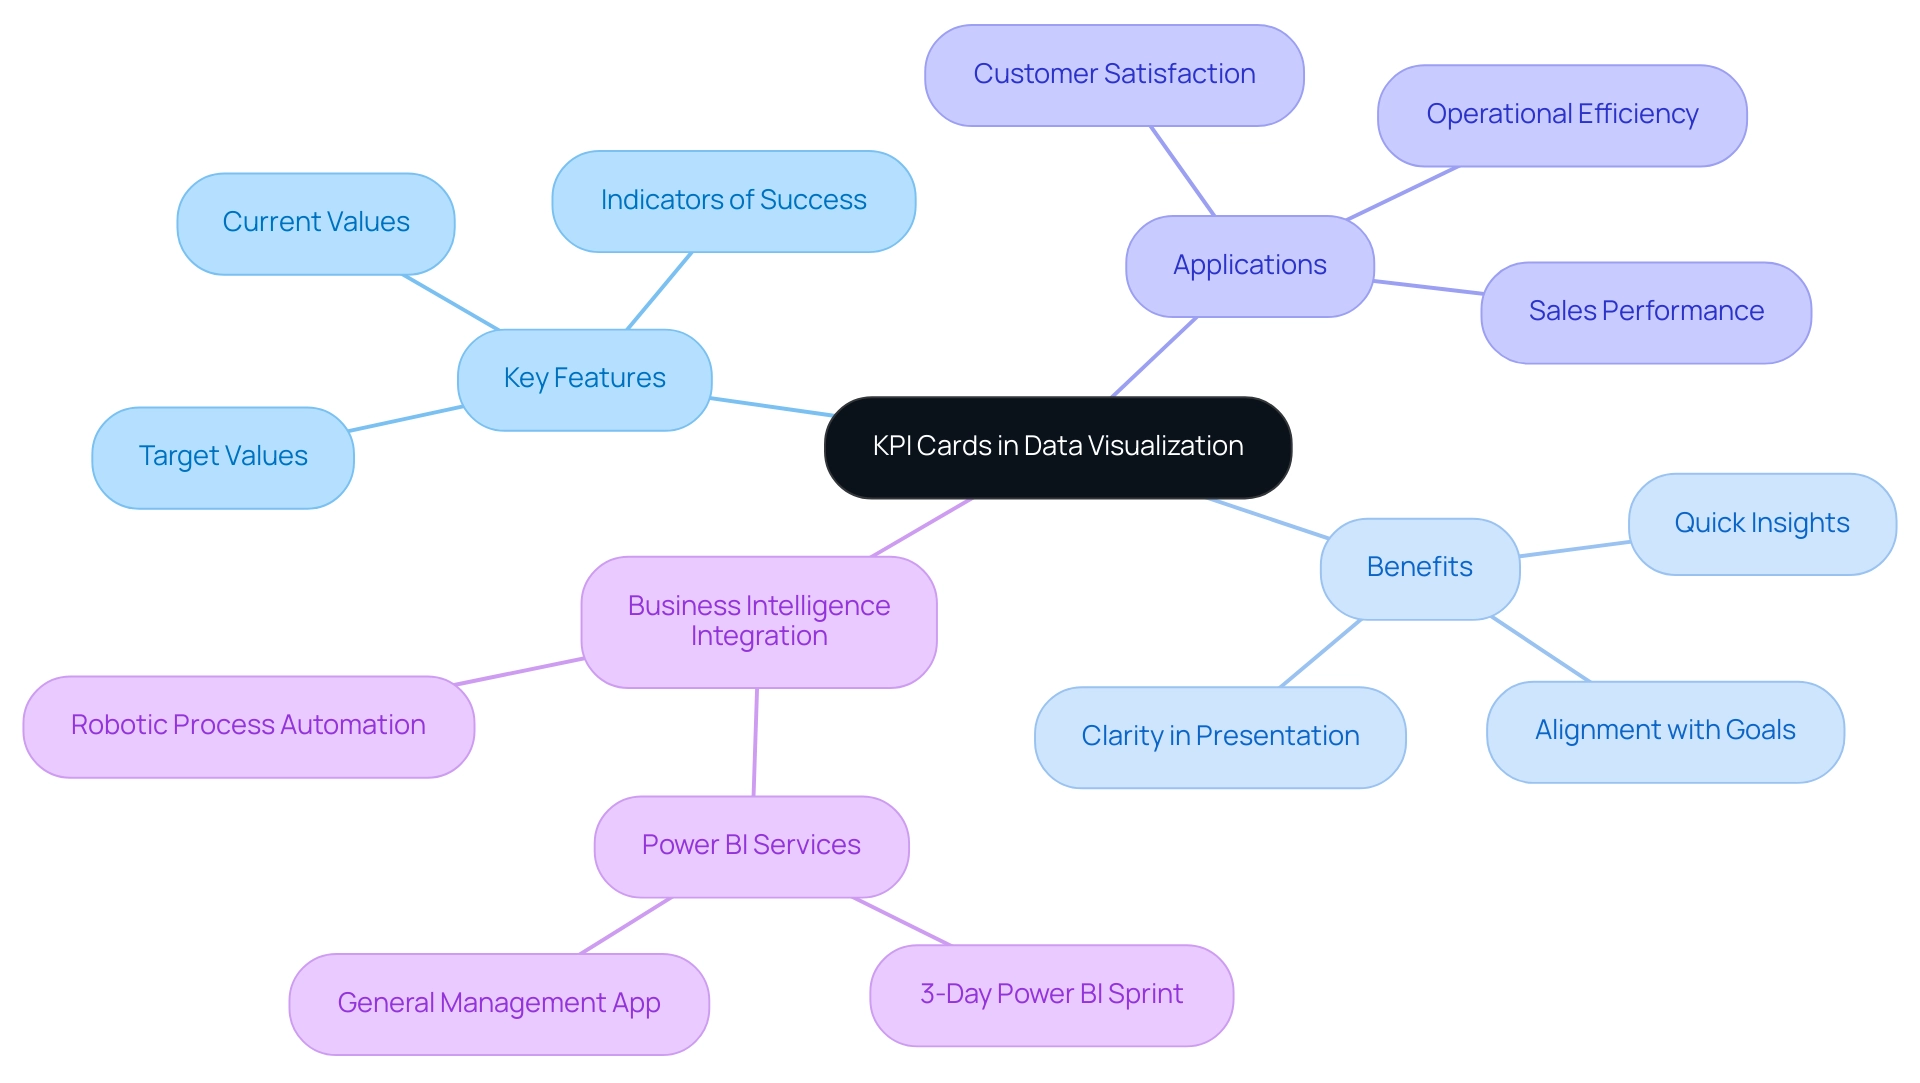
KPI cards are equipped with crucial attributes that significantly enhance their efficiency in information visualization. These features include the ability to display current values, target values, and indicators of success in a concise format, essential for swift decision-making. The benefits of KPI cards are numerous; they enhance clarity in data presentation, provide quick insights into trends, and highlight essential metrics that align with overarching business goals.
Organizations can utilize KPI tools to monitor sales performance, customer satisfaction scores, or operational efficiency metrics. This empowers teams to make informed, data-driven decisions promptly. Regular reviews of these KPIs are vital to ensure they remain relevant and aligned with the dynamic business landscape.
As Lorea Lastiri noted, “Long periods of system failure may have significant repercussions, such as lost sales revenue or loss of customer confidence,” underscoring the importance of maintaining accurate KPIs.
Moreover, KPI cards can be tailored to reflect specific organizational goals, making them versatile tools applicable across various industries. A notable case study illustrates how SaaS companies meticulously track the entire customer lifecycle—from acquisition to support and churn—using a KPI card. This method not only communicates information effectively but also aids in making informed choices about marketing strategies, product development, and customer support initiatives, showcasing the practical use of KPI cards in real-world scenarios.
The significance of Business Intelligence in this context cannot be overstated; it transforms raw data into actionable insights, enabling informed decision-making that drives growth and innovation. Furthermore, integrating Power BI services, including the 3-Day Power BI Sprint for rapid report creation and the General Management App for comprehensive oversight, enhances the effectiveness of KPI card displays. The 3-Day Power BI Sprint allows organizations to swiftly produce professionally crafted reports, while the General Management App offers a complete overview of metrics.
Coupled with Robotic Process Automation (RPA), businesses can automate manual workflows, boosting efficiency and enabling teams to focus on strategic initiatives that foster growth.
How to Create and Configure KPI Cards Effectively
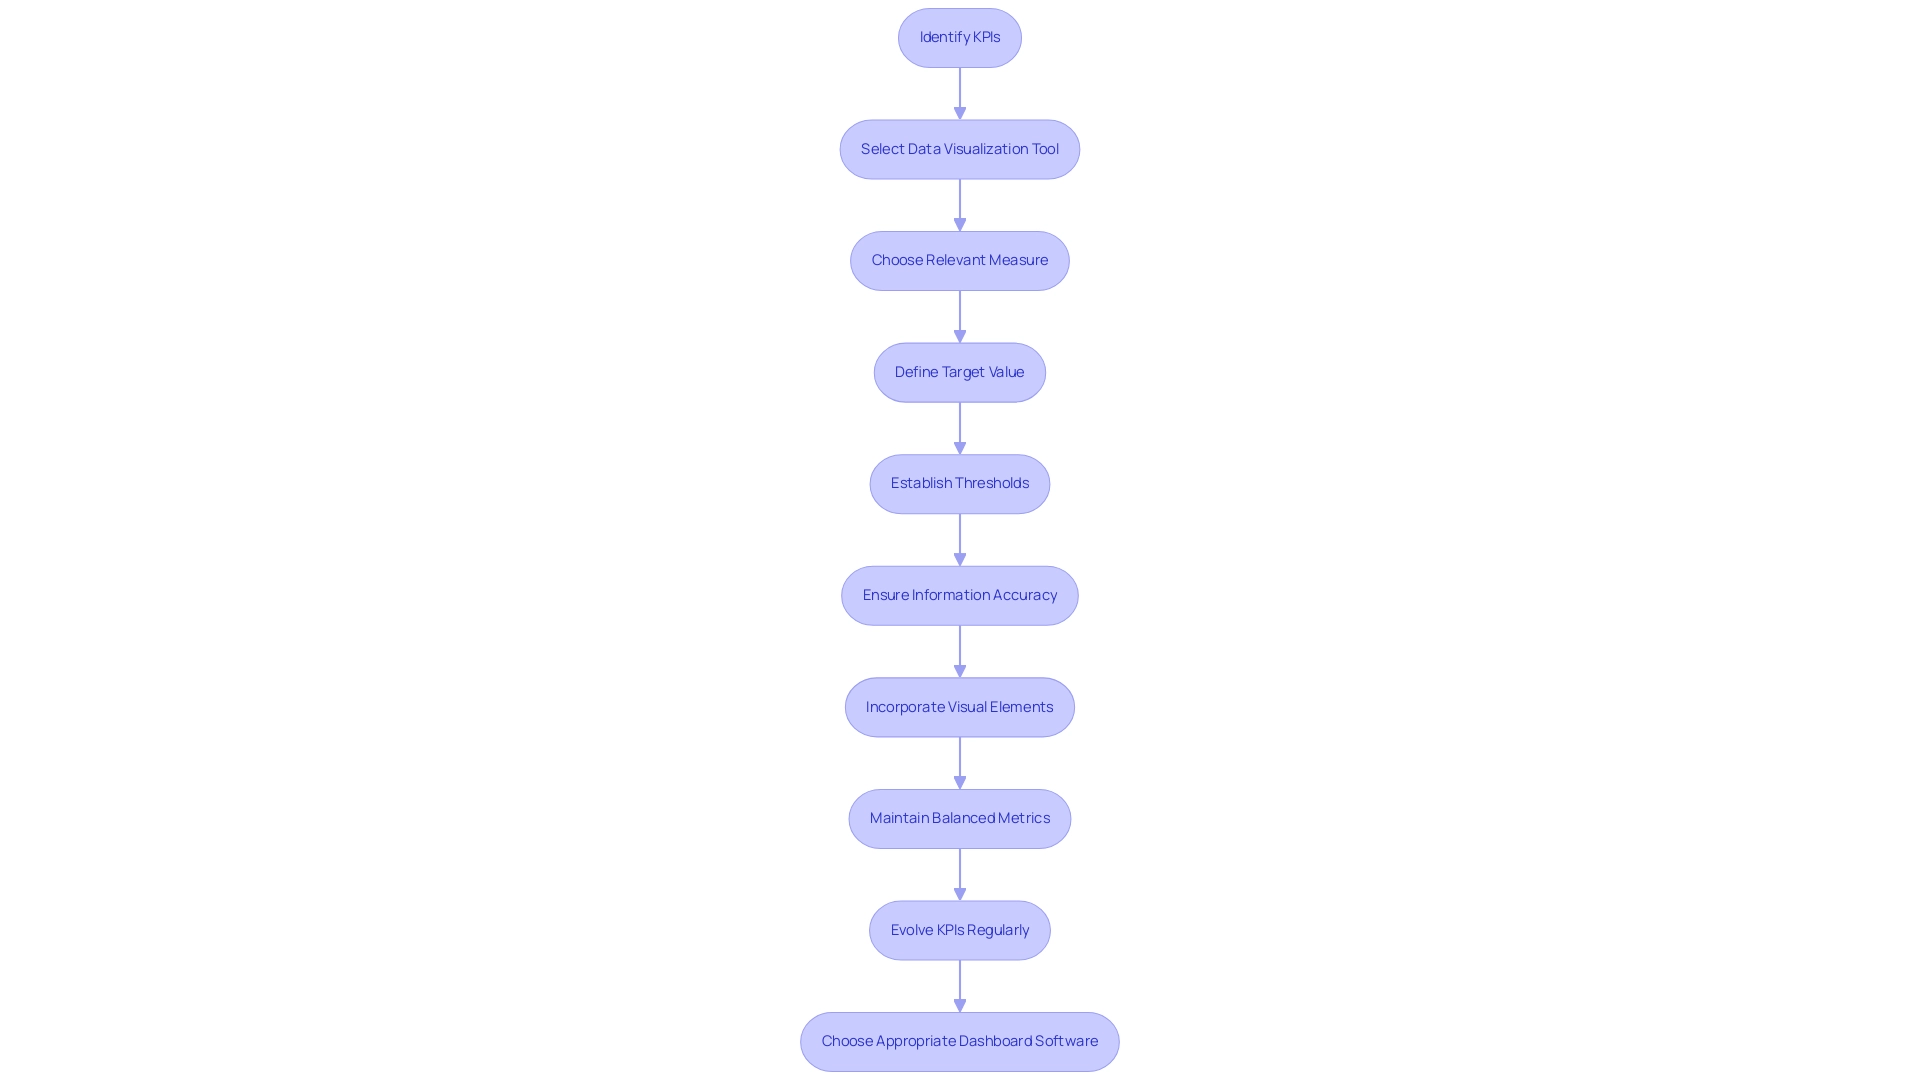
Creating and configuring a KPI card display is a critical process that ensures effective communication of key metrics. Begin by identifying the key success indicators (KPIs) that align with your business objectives; these will serve as the foundation for your analysis. Selecting the right data visualization tool is equally important—both Power BI and Tableau provide robust capabilities for the creation of KPI cards.
In Power BI, the process involves several straightforward steps:
- Choose a relevant measure that reflects your KPI.
- Define a target value that represents success for that measure.
- Establish thresholds to indicate varying levels of achievement.
This structured approach clarifies expectations and facilitates performance tracking.
Ensuring information accuracy and timeliness is crucial. Outdated or incorrect information can lead to misguided decisions, undermining the very purpose of a KPI card. Therefore, ensure that your information sources are reliable and regularly updated.
Utilizing Business Intelligence tools such as Power BI can significantly improve your reporting capabilities, ensuring efficient reporting and consistency.
However, organizations frequently encounter obstacles like time-consuming report generation and inconsistencies, which can impede the effectiveness of KPI displays. To mitigate these issues, integrating RPA solutions can streamline data management processes, reduce manual errors, and enhance operational efficiency.
To enhance the effectiveness of your KPI displays, incorporate visual elements such as colors and icons. These elements can significantly improve readability and impact, making it easier for stakeholders to grasp the information at a glance. For instance, using a color-coded system to indicate achievement levels can quickly convey whether a KPI is on track, at risk, or off target.
Best practices for creating a KPI card display in 2025 emphasize the importance of a balanced approach to metrics. Organizations should aim for a 60/40 ratio of leading to lagging indicators, allowing for both predictive insights and validation of past performance. This balance ensures that your KPI card indicators reflect current standings and guide future actions.
Additionally, expert opinions suggest that continuous evolution of KPIs is necessary to adapt to changing business conditions. Regularly revisiting and adjusting your metrics will help maintain alignment with organizational goals and market dynamics. As Rebecca Reynoso, Lead Editor at G2, states, “Hey, we’re Databox. Our mission is to help businesses save time and grow faster,” highlighting the importance of effective KPI management in driving business growth.
Case studies highlight the significance of selecting the right KPI dashboard software, as this choice directly impacts the accuracy and actionability of insights. By understanding your tracking requirements and the functionalities offered by various software options, you can effectively customize your KPI card displays to meet specific needs. For instance, a free Databox template is available for monitoring important KPIs related to website visitor engagement, which can be set up easily without coding.
In summary, developing effective visuals for a KPI card in Power BI and Tableau requires a systematic approach that emphasizes information integrity, visual clarity, and strategic alignment with business objectives. By adhering to these guidelines and utilizing Power BI services from Creatum GmbH, including the 3-Day Sprint for swift report creation, organizations can harness KPI displays as powerful tools for data-driven decision-making.
Integrating KPI Cards with Power BI and Tableau for Enhanced Insights
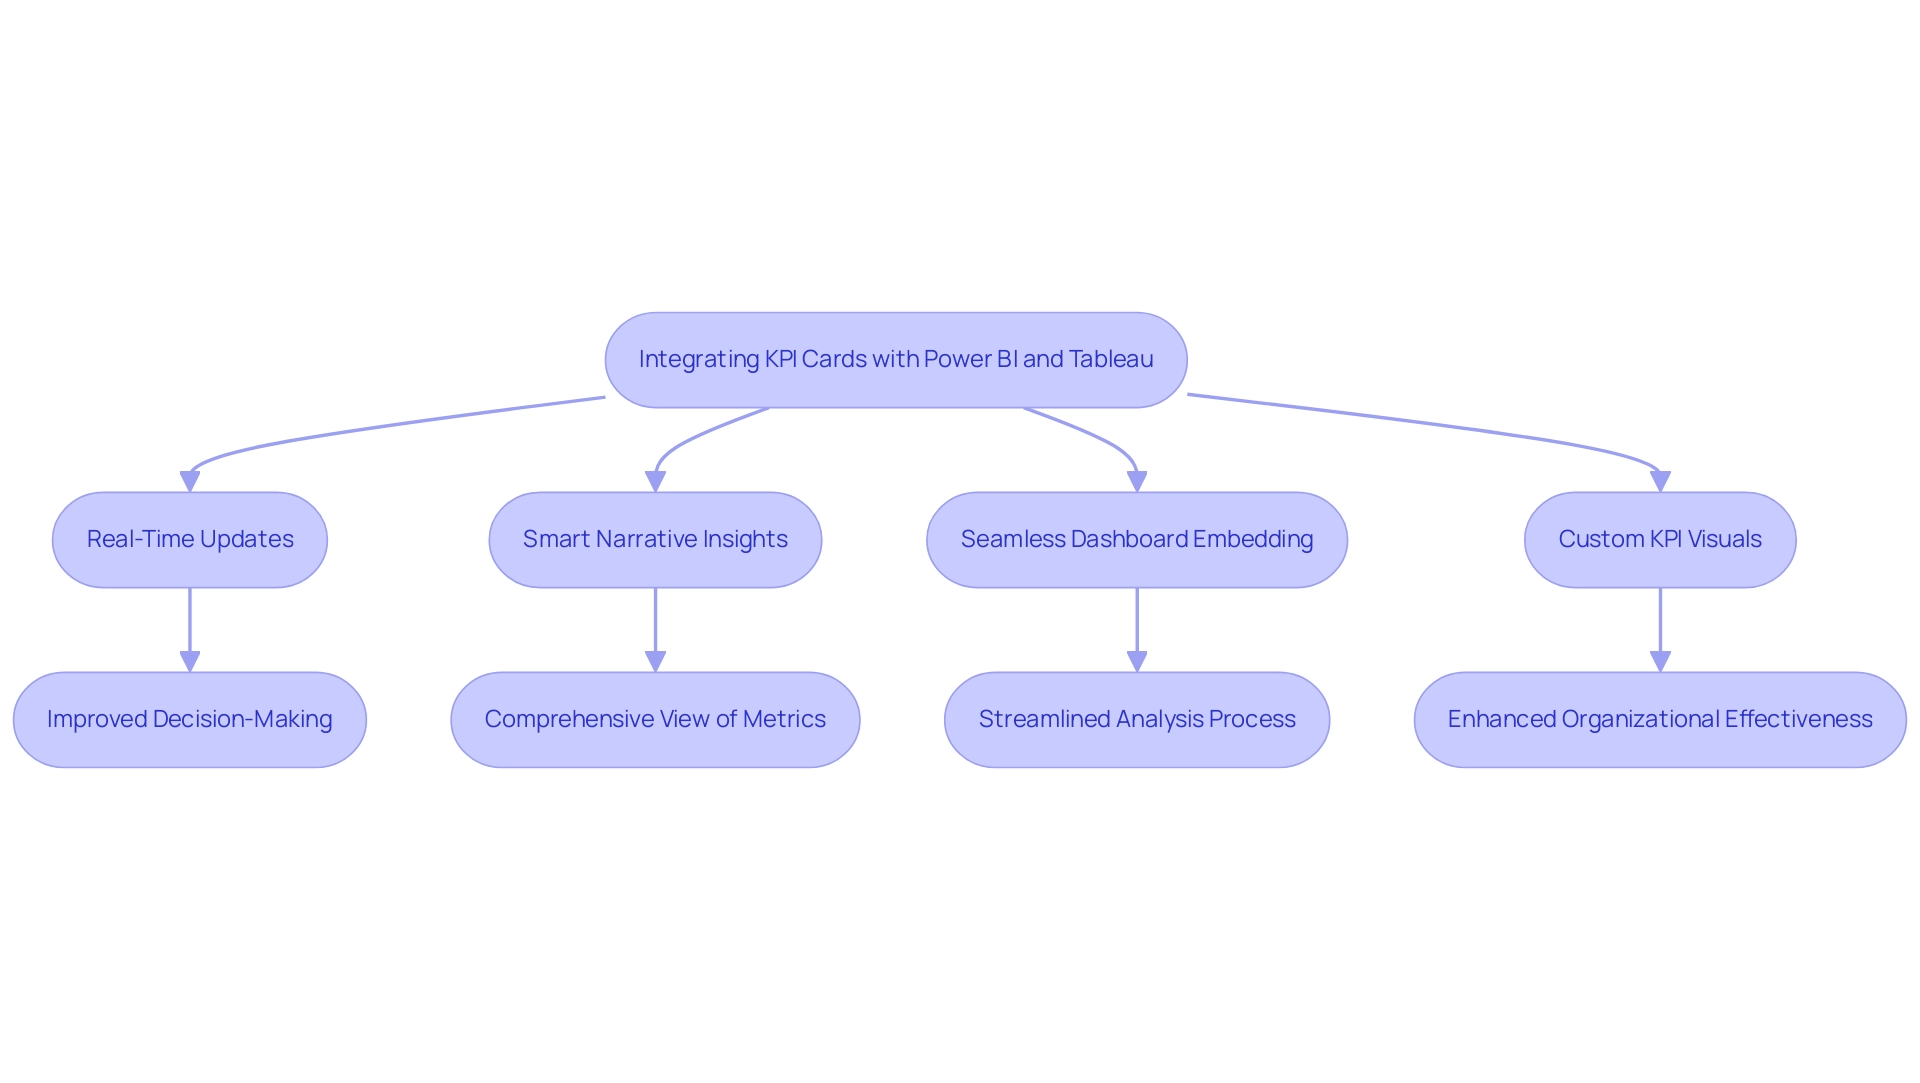
Integrating KPI displays with visualization tools like Power BI and Tableau significantly enhances the ability to derive actionable insights from data. In Power BI, users can create dynamic KPI displays that automatically update with new inputs, offering real-time insights into organizational performance. This functionality is particularly valuable, especially in light of common challenges such as time-consuming report creation and inconsistencies that can lead to confusion and mistrust in the information presented.
Power BI’s Smart Narrative feature can generate four distinct insights for the entire dashboard, ensuring users have a comprehensive view of their metrics and actionable guidance for decision-making.
Similarly, Tableau allows users to create KPI displays that can be seamlessly embedded within dashboards, presenting key metrics alongside other visualizations. This integration streamlines the analysis process and fosters a cohesive narrative around metrics, which is essential for informed strategic decision-making. Current trends indicate a growing emphasis on real-time insights from the KPI card, with organizations increasingly relying on this tool to refine their strategies.
For instance, various custom KPI visuals—such as clustered bar charts, text boxes, and gauges—effectively communicate progress and achievements, thereby enhancing overall organizational effectiveness. As highlighted in the case study titled “Popular Custom KPI Visuals,” utilizing a well-designed KPI card is instrumental in conveying progress and accomplishments to teams and stakeholders, ultimately enhancing strategies for success.
Moreover, as organizations navigate the complexities of KPI construction in Power BI, challenges such as incorrect field placement and sorting may arise. However, newer versions now include a Filters option to assist with sorting, addressing these common challenges. Dr. Ernesto Lee, Chief Innovation Officer, remarked, “As demonstrated in the retail case study, Power BI can drive measurable improvements in sales, inventory management, and strategic planning, proving its effectiveness in real-world applications.”
This evolution in functionality underscores the importance of leveraging advanced visualization tools to drive measurable improvements in performance metrics, ultimately enhancing operational efficiency and supporting business growth. Additionally, Creatum GmbH offers a 3-Day Power BI Sprint and a General Management App to further enhance reporting capabilities and ensure governance, addressing the critical need for a robust governance strategy to mitigate inconsistencies.
Common Challenges and Best Practices for Using KPI Cards
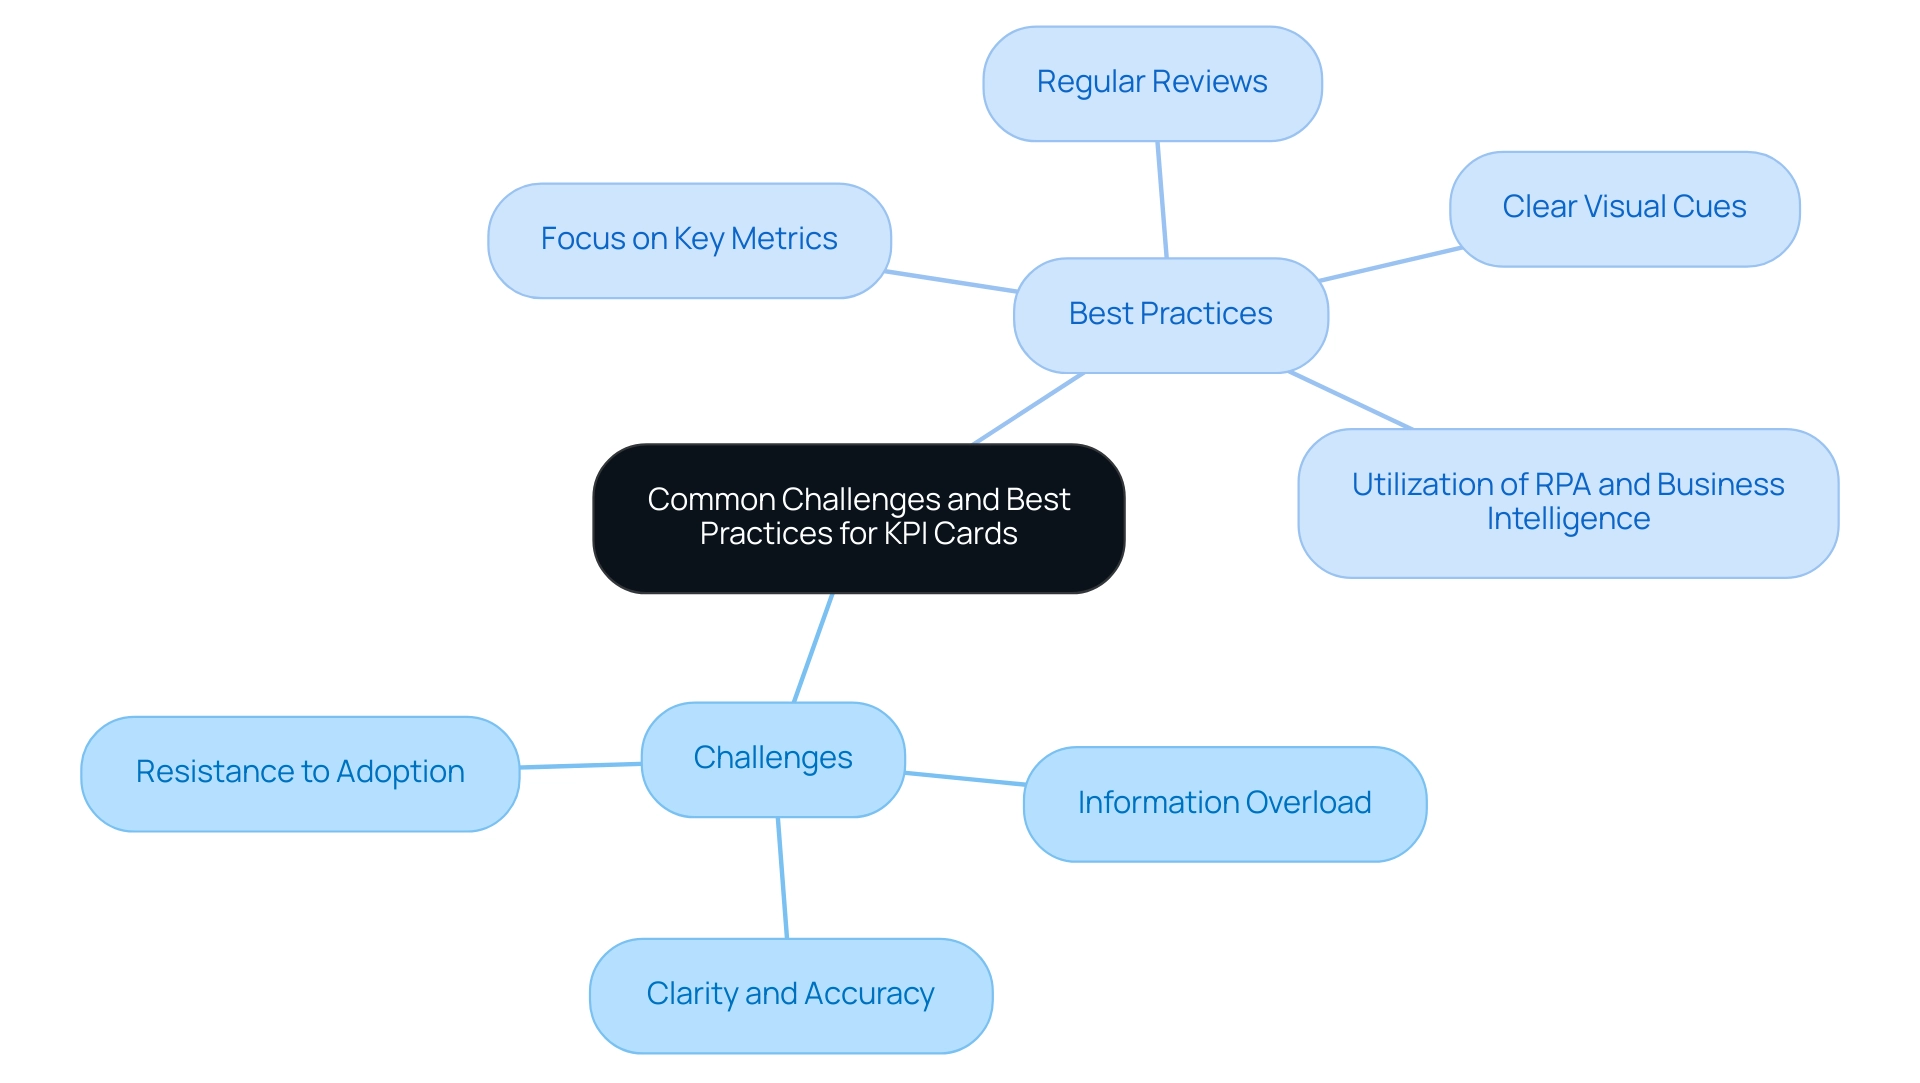
KPI tools serve as essential resources for information visualization; however, companies often face significant challenges in their implementation. A common issue is the overloading of KPI displays with excessive information, which can obscure insights rather than clarify them. To address this, it is vital to focus on a select few key metrics that directly align with the organization’s strategic objectives.
Research shows that effective KPIs should be strategic, quantifiable, relevant, timely, and actionable, highlighting the importance of clarity in their selection. Furthermore, maintaining accuracy and consistency is crucial; poor quality can severely undermine the effectiveness of the KPI card. This is where Business Intelligence plays a pivotal role, transforming raw data into actionable insights that facilitate informed decision-making, ultimately driving growth and innovation.
A case study titled ‘Aligning Dashboards with Strategic Goals’ exemplifies this concept: organizations that clearly defined and communicated their goals, linking them to KPIs, were able to monitor progress and report achievements more effectively. This alignment not only enhances monitoring but also ensures that the KPIs reflect the organization’s vision and objectives.
Additionally, incorporating Robotic Process Automation (RPA) can streamline the information collection process, reducing the time spent on manual, repetitive tasks that often lead to inconsistencies. Best practices for utilizing KPI displays include:
- Regularly reviewing and updating the metrics displayed to align with current priorities
- Using clear visual cues to indicate performance levels
- Ensuring that these displays are accessible to stakeholders who need timely information for decision-making
Expert insights suggest that fostering effective communication and engagement methods can also help overcome employee reluctance to adopt these tools, ultimately enhancing their usability and the trust users place in the information presented.
As Marcio Magalhaes, an Operations Analyst, remarked, ‘Essa abordagem não só melhorou a usabilidade, como também elevou a confiança dos usuários nos dados apresentados.’ By adhering to these best practices and leveraging RPA and Business Intelligence, organizations can maximize the impact of their KPI card, transforming raw data into actionable insights that drive informed decision-making. However, it is crucial to acknowledge the potential risks associated with KPI card tracking when not implemented ethically, as illustrated by the Wells Fargo scandal in 2016. This incident serves as a cautionary tale regarding the consequences of prioritizing aggressive targets over ethical practices, underscoring the necessity for careful KPI management and communication.
Conclusion
KPI cards are indispensable tools for achieving operational excellence, providing a clear visual representation of key performance indicators alongside their target values. They facilitate quick assessments of performance, highlighting areas that require attention and enabling informed decision-making in today’s fast-paced business environment.
By integrating KPI cards with Business Intelligence platforms like Power BI and Tableau, organizations can access real-time insights that significantly enhance strategic planning. Concentrating on a select few key metrics aligned with organizational goals helps prevent information overload, ensuring clarity and usability.
Maintaining data accuracy and relevance is crucial; regularly reviewing and updating KPIs ensures they remain aligned with evolving business objectives. Moreover, leveraging Robotic Process Automation can streamline data management, allowing teams to focus on strategic initiatives rather than manual tasks.
Ethical management of performance tracking is equally vital. Past scandals highlight the necessity of balancing performance targets with ethical practices. By adhering to best practices in KPI management, organizations can transform raw data into actionable insights that drive growth and innovation.
In conclusion, embracing KPI cards is essential for organizations striving to excel in 2025 and beyond. They serve as powerful instruments for visualizing performance, aligning strategies, and fostering a culture of data-driven decision-making.
Frequently Asked Questions
What is a KPI card and why is it important?
A KPI card is a visual tool that presents a key performance indicator alongside its target value, making it essential for effective data visualization. It provides a clear snapshot of performance, allowing decision-makers to quickly assess how well a specific metric aligns with its goal.
How do KPI cards enhance operational efficiency?
KPI cards streamline workflows and minimize the time spent on data analysis, which leads to a notable increase in operational efficiency for organizations that utilize them.
In what ways do KPI cards support decision-making?
KPI cards highlight areas requiring attention or improvement, empowering teams to focus their efforts strategically and enabling informed, data-driven decisions promptly.
How do KPI cards integrate with Robotic Process Automation (RPA)?
KPI cards enhance the effectiveness of RPA by automating manual workflows, which boosts efficiency and employee morale, allowing teams to concentrate on strategic initiatives.
What role do KPI cards play in tracking customer lifecycle?
KPI cards facilitate comprehensive tracking of the entire customer lifecycle, providing valuable insights for marketing, product development, and customer support.
Why is the selection of the right KPI card software important?
Choosing the right KPI card software ensures organizations can effectively track their KPIs and derive actionable insights tailored to their specific needs, which is crucial for operational excellence.
How do KPI cards help align conflicting objectives across departments?
KPI cards serve as a unifying metric that aligns efforts toward common goals, which is essential in preventing inefficiencies caused by conflicting targets across departments.
What are the benefits of using Power BI services with KPI cards?
Power BI services enhance reporting and actionable insights, allowing organizations to swiftly produce professionally crafted reports and gain a comprehensive overview of their metrics.
What should organizations do to maintain the relevance of their KPIs?
Regular reviews of KPIs are vital to ensure they remain relevant and aligned with the dynamic business landscape, helping organizations adapt to changes effectively.
What is a notable real-world application of KPI cards?
SaaS companies use KPI cards to meticulously track the entire customer lifecycle, aiding in informed choices about marketing strategies, product development, and customer support initiatives.

