Overview
The article titled “Connecting Power BI Databricks: A Comprehensive Step-by-Step Guide” serves as an essential resource for integrating Power BI with Databricks, aiming to elevate business intelligence capabilities. It begins by outlining the necessary prerequisites, capturing the reader’s attention with the promise of enhanced data processing and visualization.
Following this, the guide presents detailed setup instructions, fostering interest by breaking down complex processes into manageable steps. Best practices for creating visualizations and managing data refreshes are also highlighted, generating desire for effective integration that can significantly improve operational efficiency within organizations.
In conclusion, this comprehensive guide not only equips professionals with actionable insights but also encourages them to reflect on their current practices, prompting immediate action towards optimizing their data strategies.
Introduction
In the dynamic landscape of data analytics, organizations are increasingly turning to powerful tools like Power BI and Databricks to unlock the full potential of their data. Power BI, renowned for its robust visualization capabilities and interactive dashboards, empowers users to derive insights and make informed decisions. Meanwhile, Databricks serves as a cutting-edge analytics platform that harnesses the power of big data and machine learning, enabling organizations to process vast datasets seamlessly. Together, these tools create a formidable synergy, enhancing data accessibility and performance while driving strategic growth in an ever-evolving digital marketplace. As businesses strive to remain competitive, understanding the integration of Power BI with Databricks is essential for transforming raw data into actionable insights that propel innovation and operational efficiency.
Understanding Power BI and Databricks: Key Features and Benefits
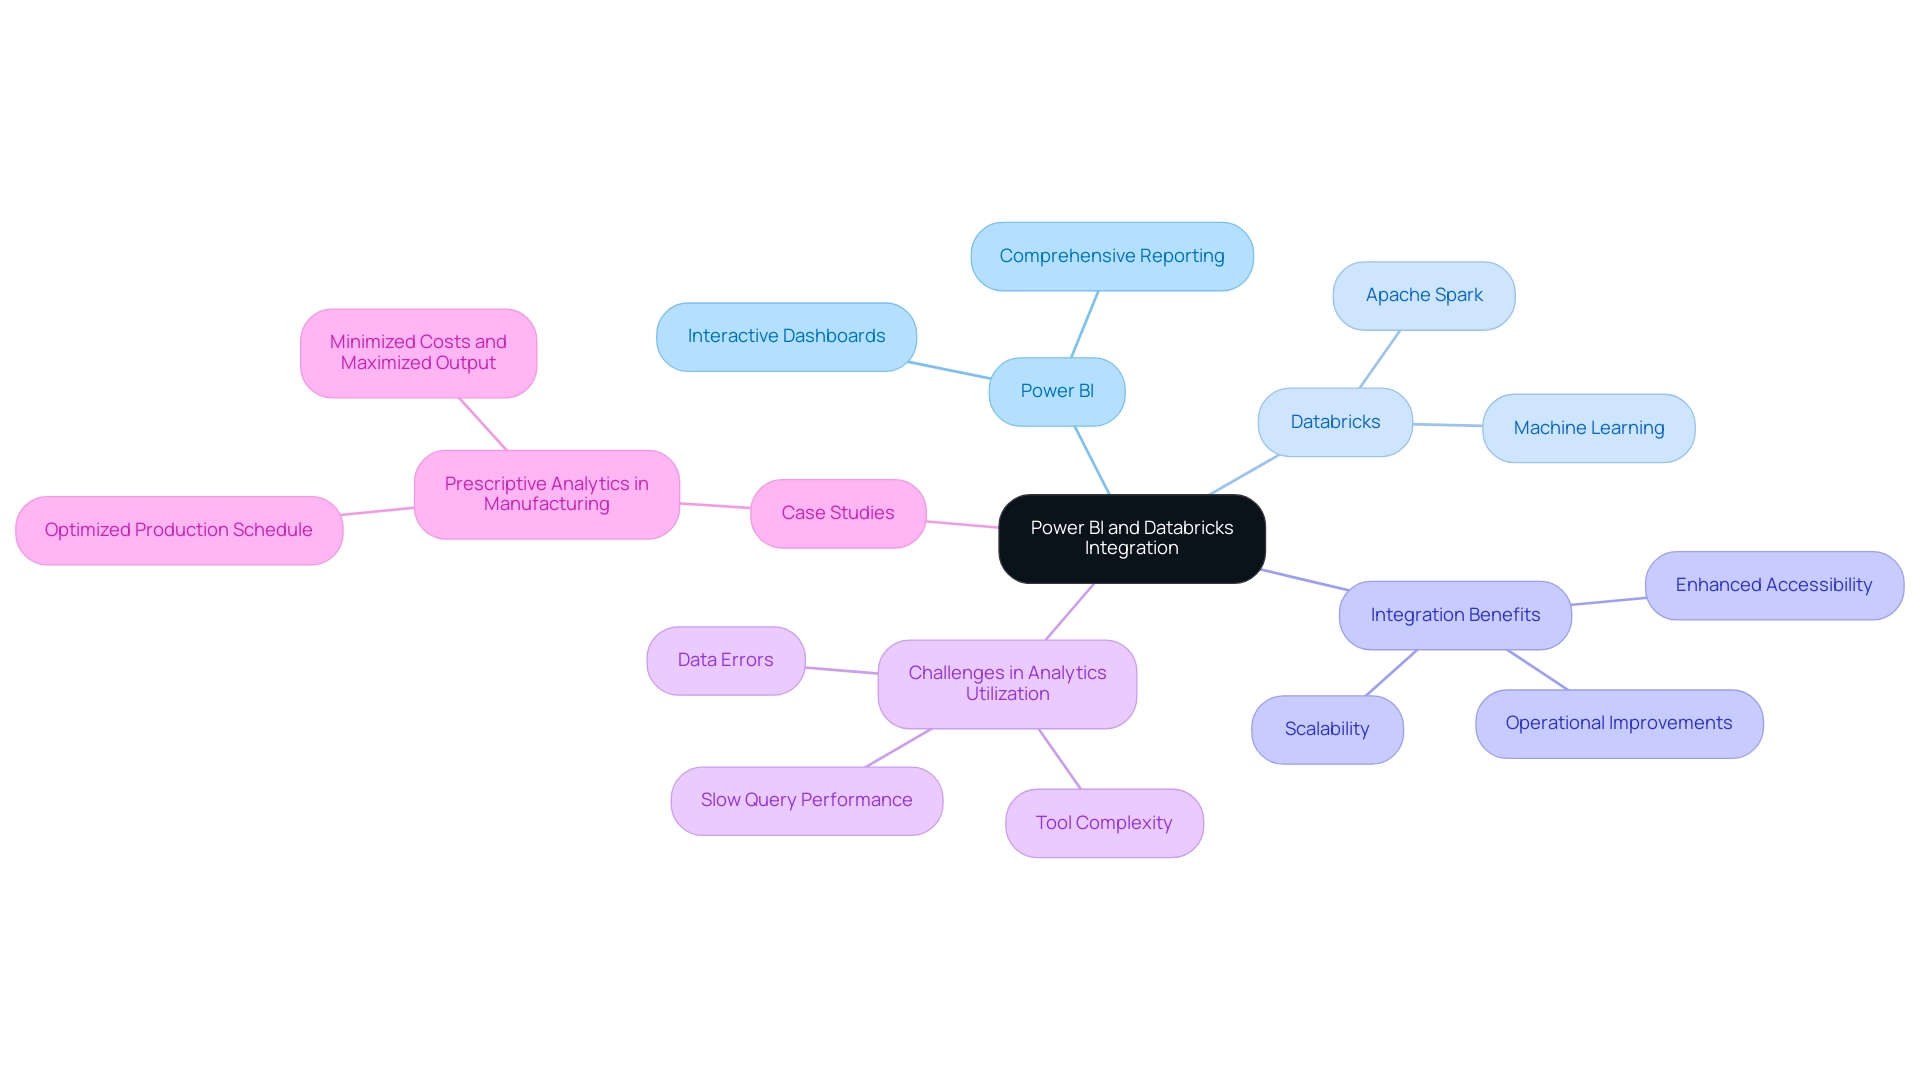
This tool distinguishes itself as a robust business analytics instrument, empowering users to visualize information and share insights across their organizations. With interactive dashboards and comprehensive reporting capabilities, BI facilitates informed decision-making. In contrast, this platform serves as an advanced analytics system tailored for large-scale information and machine learning, leveraging the capabilities of Apache Spark.
The integration of BI tools and analytics platforms allows organizations to effectively manage extensive datasets and create significant visual representations.
Incorporating BI with another platform significantly enhances accessibility, scalability, and performance. This synergy empowers users to extract deeper insights from their information, driving informed strategies and operational improvements. As the social business intelligence market is projected to reach approximately $25.9 billion by 2025, the adoption of tools like Power BI and Databricks is becoming increasingly essential for entities striving to remain competitive.
However, despite initiatives for self-service tools and modern information platforms, many companies encounter challenges in effectively utilizing analytics due to issues such as tool complexity, slow query performance, and errors. As Tajammul Pangarkar, CMO at Prudour Pvt Ltd, observes, “The effective use of analytics tools is essential for organizations to fully leverage their information assets.” This is where our BI services come into play, offering a 3-Day Sprint for rapid report creation and a General Management App for comprehensive management and smart reviews, ensuring efficient reporting and information consistency.
Recent updates to the Databricks analytics platform further enhance its capabilities, providing features that streamline data processing and analytics workflows. These enhancements, combined with the intuitive interface of Power BI and Databricks, create a powerful ecosystem for data-driven decision-making. Real-world applications illustrate that entities leveraging this integration can achieve significant operational efficiencies, as evidenced by case studies in sectors like manufacturing, where prescriptive analytics has optimized production schedules and minimized costs.
Ultimately, as companies navigate the complexities of analytics, the partnership between BI and another platform emerges as a strategic advantage, enabling organizations to harness the full potential of their assets and drive growth and innovation. Furthermore, utilizing AI through Small Language Models and GenAI Workshops can enhance information quality and training, while automation provides streamlined workflow management, ensuring a risk-free ROI evaluation and professional execution.
Prerequisites for Connecting Power BI with Databricks
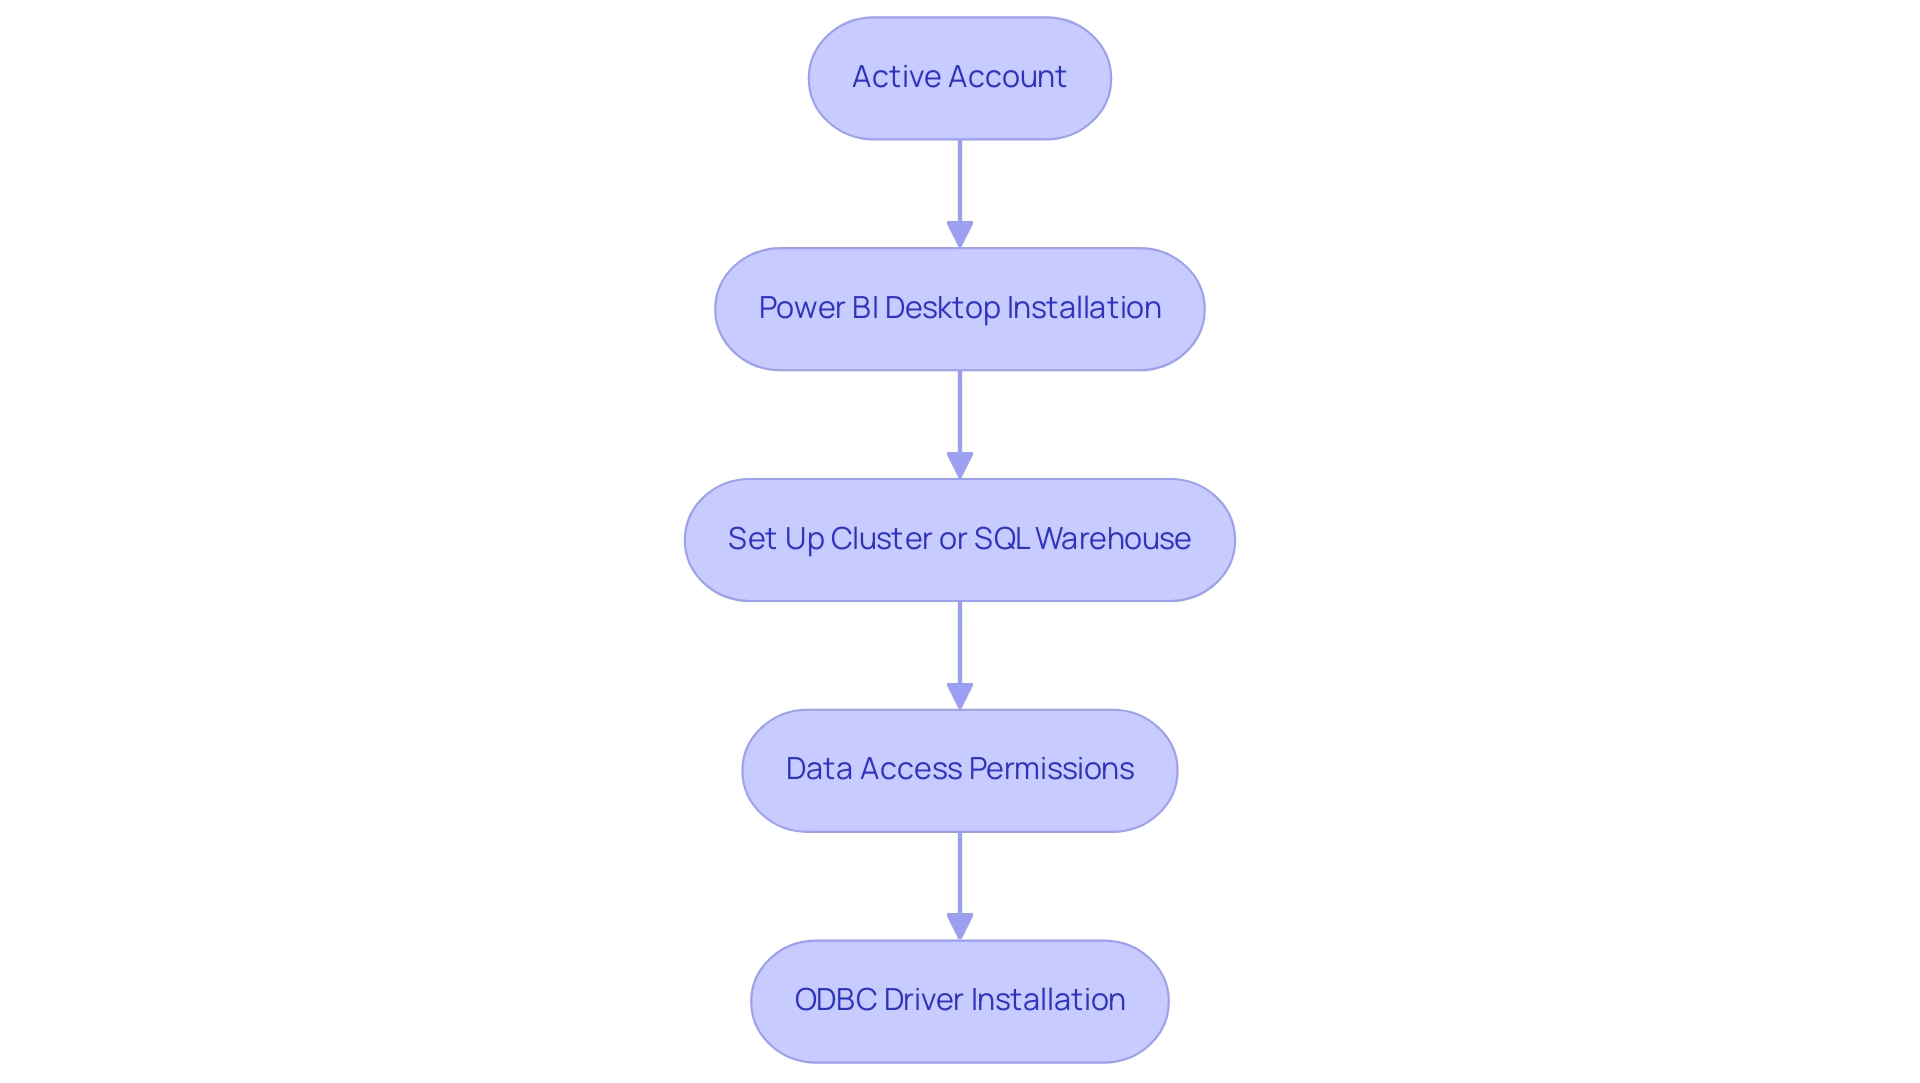
To successfully connect Power BI to Databricks, it is essential to meet the following prerequisites:
- Active account: Ensure you have a current account with access to a workspace, as this is essential for any information operations.
- Power BI Desktop: Install the latest version of Power BI Desktop on your machine to leverage its full capabilities for visualization and reporting.
- Set Up Cluster or SQL Warehouse: A properly set up cluster or SQL warehouse is essential to enable information processing and querying.
- Data Access Permissions: Confirm that you have the required authorizations to access the information stored in the platform, as this will facilitate smooth integration of the information.
- ODBC Driver: If you intend to use ODBC for the connection, ensure that the latest version of the ODBC driver is installed on your system.
In 2025, a significant percentage of organizations are utilizing Power BI Databricks, reflecting the growing trend towards integrated information solutions. Successful implementations have demonstrated that aligning the baseline table schema with the monitored table—excluding the timestamp column in time series or inference profiles—can enhance information accuracy and reporting efficiency.
As Pubudu Dewagama observed, “In today’s information-driven environment, businesses seek powerful solutions to harness the full potential of their resources.” By adhering to these prerequisites, organizations can streamline the connection process, thereby overcoming common challenges such as time-consuming report creation and inconsistencies. This enables them to convert raw information into actionable insights, driving informed decision-making and fostering innovation.
Additionally, integrating Robotic Process Automation (RPA) can further streamline the integration process, enhancing operational efficiency by automating repetitive tasks related to handling information. Customized AI solutions can also help in tackling particular challenges associated with information integration and reporting, ensuring that entities can effectively utilize their assets. The case study titled “Business Intelligence Empowerment” illustrates how the organization enables businesses to extract meaningful insights, further linking the connection process to the broader goal of informed decision-making and innovation.
Setting Up Databricks Community Edition: A Step-by-Step Guide
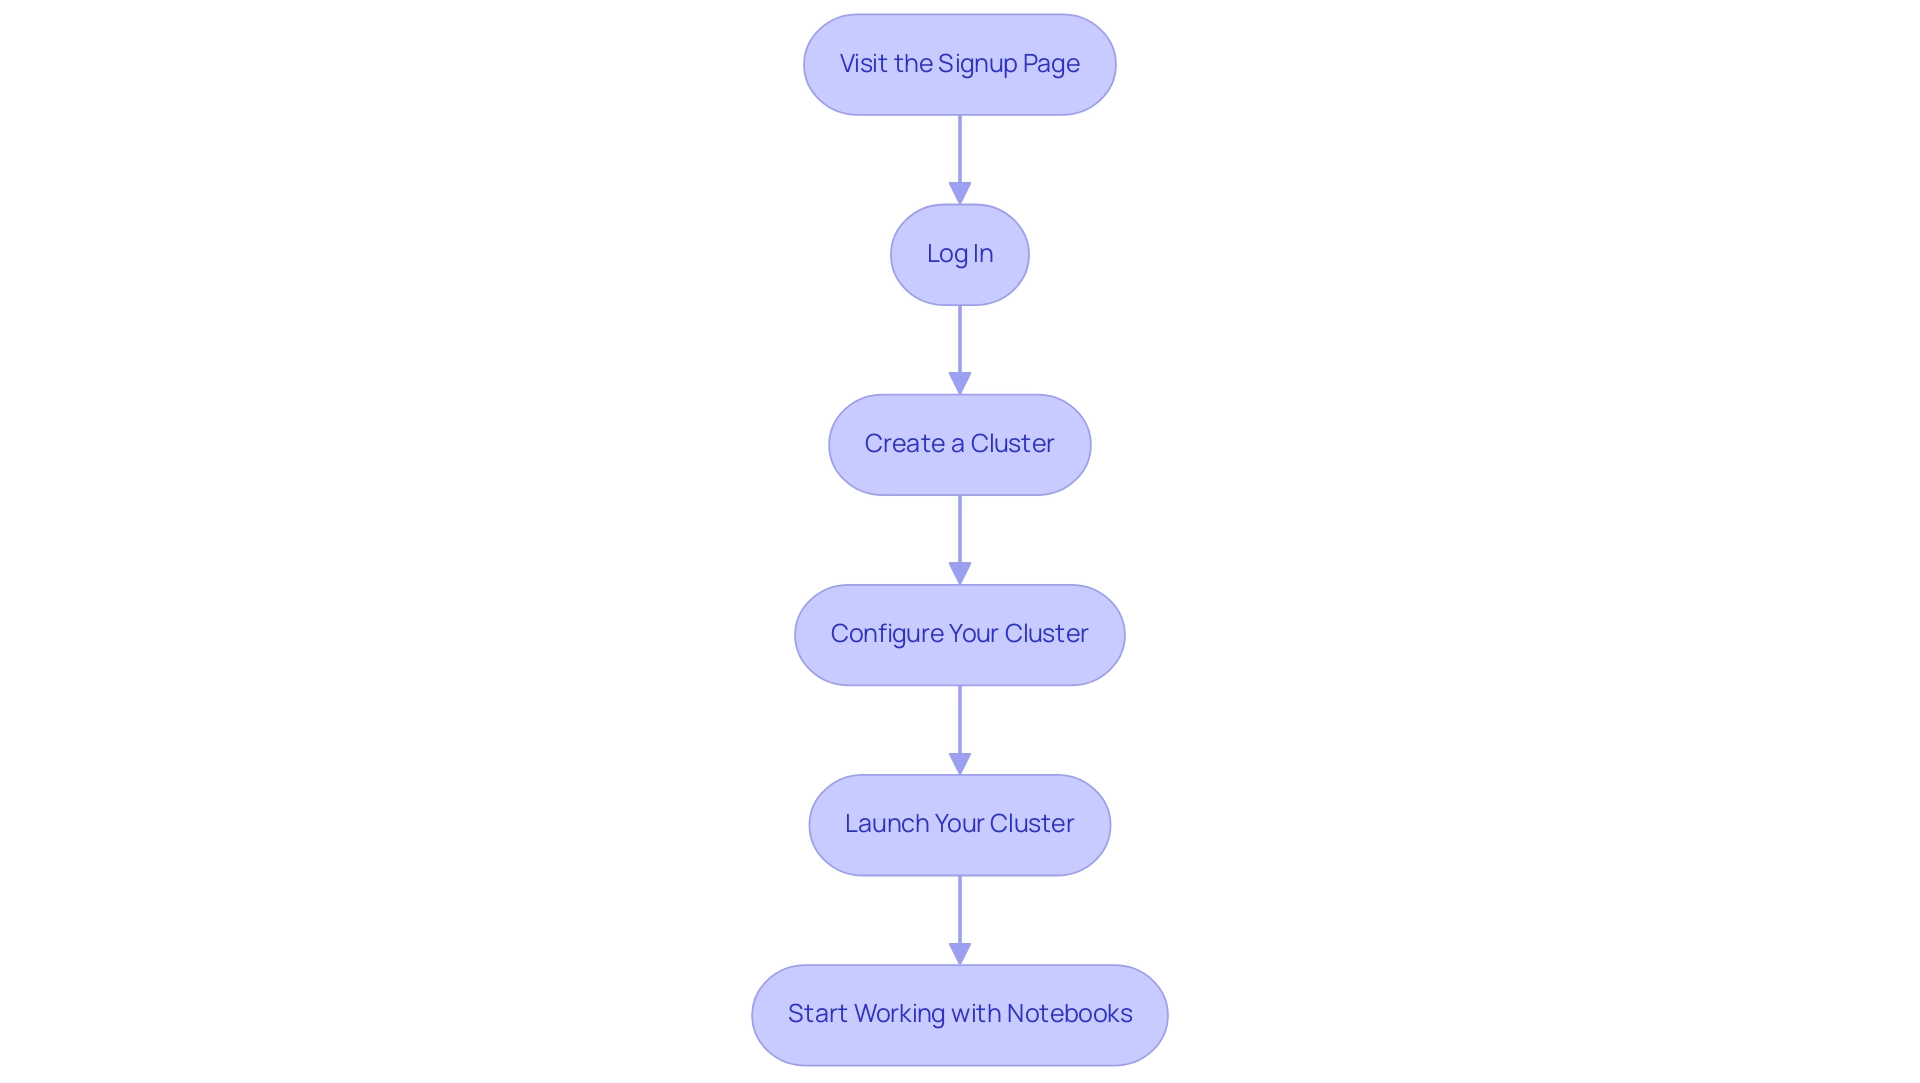
Setting up the Community Edition is a straightforward process that can significantly enhance your data analytics capabilities using Power BI Databricks. Follow these steps to get started:
- Visit the Signup Page: Go to the Community Edition signup page and create your account. This initial step is crucial for accessing the platform’s features.
- Log In: Once registered, log in to your Databricks workspace to begin your journey.
- Create a Cluster: Navigate to the ‘Compute’ section in the sidebar and click on ‘Create Compute’. This is where you will configure the environment for your processing tasks.
- Configure Your Cluster: Name your cluster and select the default settings, typically optimized for Community Edition. This ensures that you are leveraging the best configurations for your needs.
- Launch Your Cluster: Click ‘Create Compute’ to launch your cluster. This step initiates the resources necessary for executing your tasks.
- Start Working with Notebooks: After your cluster is operational, you can begin creating notebooks and importing information. Notebooks are essential for interactive coding and documentation, allowing you to visualize and analyze your information effectively.
As of 2025, the growth rate of Community Edition users has been impressive, reflecting its increasing popularity among analytics professionals. Notably, Delta Cache ensures faster read speeds for processing remote storage data, enhancing the efficiency of your analytics tasks in Power BI Databricks.
Core concepts of the platform, such as clusters for executing code, jobs for automating tasks, and notebooks for interactive coding and documentation, can be effectively utilized with Power BI Databricks. Understanding these elements is crucial for maximizing your use of the platform.
Additionally, Spark metric charts available in the compute metrics UI provide insights into server load distribution, active tasks, and overall cluster performance, which are vital for monitoring your resources effectively.
Real-world examples, such as Airbnb’s implementation of advanced analytics infrastructure using StarRocks, showcase the transformative potential of this technology in driving data-driven decision-making. As Allan Ouko states, “Discover how to utilize this SQL platform for effective analytics, querying, and business intelligence with practical examples and best practices.”
By following this setup guide, you can harness the potential of Community Edition to enhance your analytics capabilities.
Connecting Databricks to Power BI: Step-by-Step Instructions
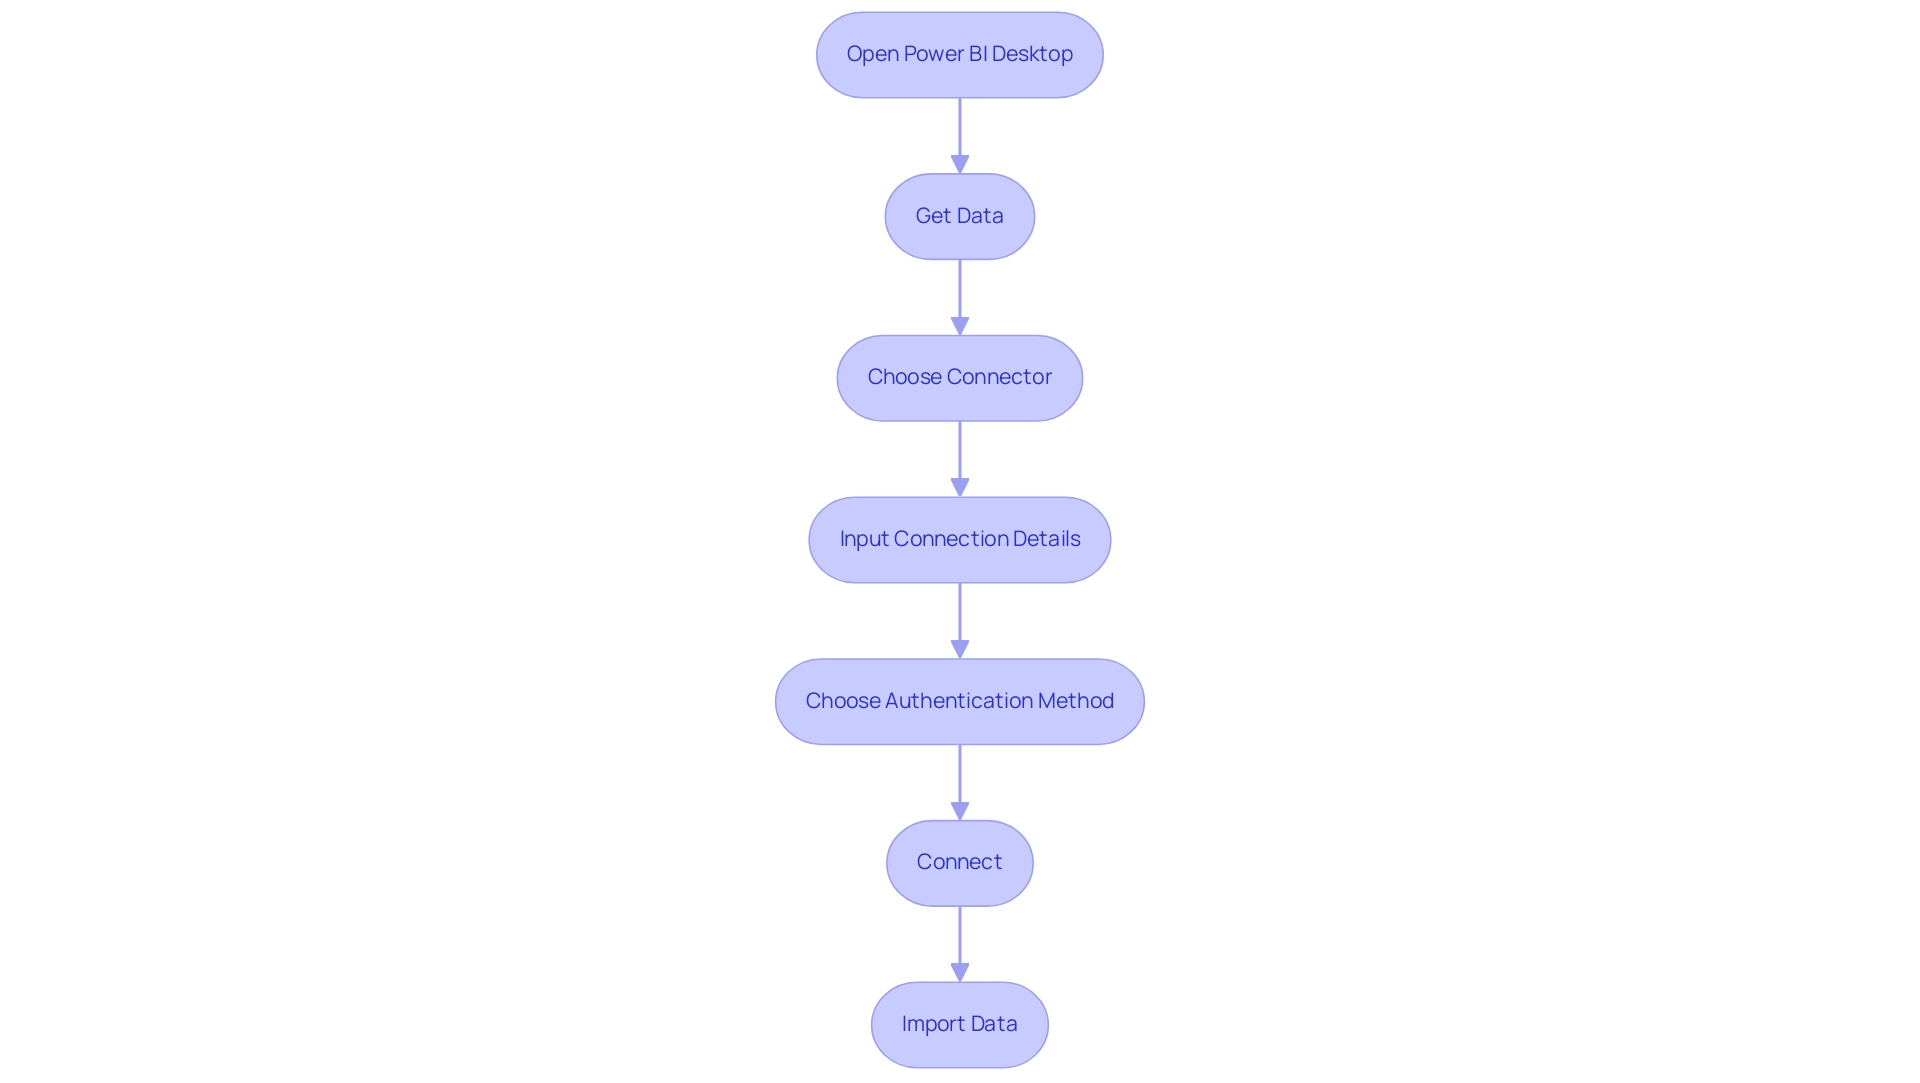
Linking the analytics platform to Business Intelligence is a straightforward process that can significantly enhance your data visualization capabilities and drive operational efficiency. Follow these detailed steps to establish a successful connection:
- Open Power BI Desktop: Launch the application and navigate to the main interface.
- Get Data: Click on the ‘Get Data’ option located in the Home ribbon.
- Choose Connector: In the ‘Get Data’ window, type ‘Databricks’ in the search bar and choose the connector from the list.
- Input Connection Details: Enter the Server Hostname and HTTP Path from your workspace. These details are crucial for establishing a secure connection.
- Choose Authentication Method: Select your preferred authentication method, such as Azure Active Directory or Personal Access Token, to ensure secure access to your data.
- Connect: Click ‘Connect’ to initiate the connection process.
- Import Data: Once connected, you will be presented with a list of tables and views available in your environment. Select the ones you wish to import into BI.
Recent updates in 2025 have improved the Power BI Databricks connector, significantly enhancing performance and user experience. For instance, performance metrics indicate that querying a dataset of 2.4 terabytes organized into 200 partitions averages just 2.12 seconds for visual generation, showcasing the efficiency of the lakehouse architecture. However, challenges persist, such as time-consuming report creation and inconsistencies, which can hinder actionable insights.
Real-world examples demonstrate the effectiveness of this integration. A notable case study involved creating a Delta table with sample student information in the platform, illustrating how users can efficiently store and query structured information. This capability not only simplifies information management but also improves analytical processes, tackling the common challenges encountered in utilizing insights from BI dashboards.
To ensure a seamless connection, consider best practices from data integration specialists, such as verifying your connection settings and regularly updating your BI and analytics environments to leverage the latest features and improvements. As Sravan Voona noted, “We strongly believe that the Engine might be encountering issues in parsing the large query (with numerous OR clauses) and generating the execution plan,” which is crucial for users troubleshooting connections. By following these steps and recommendations, you can effectively link the platform to Business Intelligence using Power BI Databricks, unlocking powerful insights and driving data-driven decision-making.
Moreover, utilizing tailored RPA solutions such as EMMA RPA and Automate from Creatum GmbH can improve data quality and streamline the integration process, aligning with our dedication to fostering growth and innovation. Additionally, addressing the lack of data-driven insights through this integration is essential for informed decision-making.
Creating Visualizations in Power BI Using Databricks Data
Once you have successfully established a connection between Databricks and Power BI, you can create impactful visualizations by following these streamlined steps:
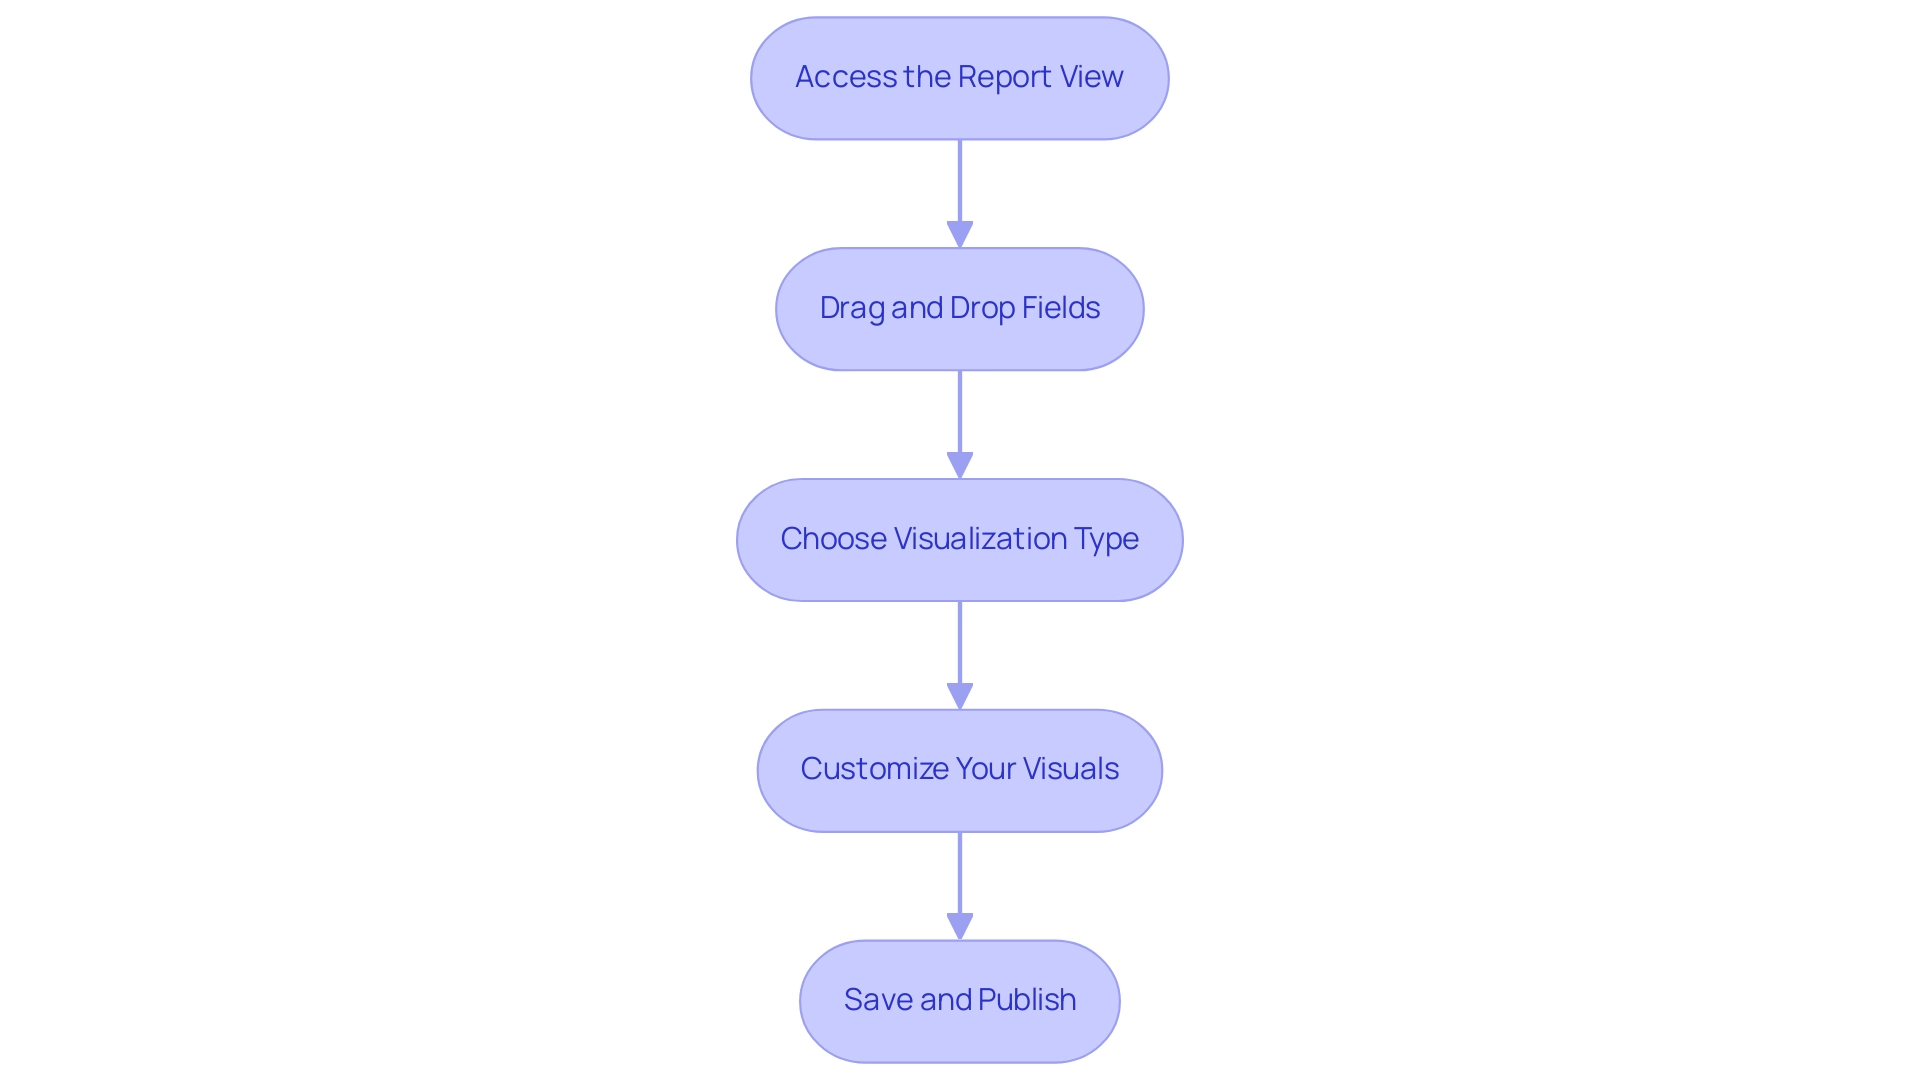
- Access the Report View: Begin by navigating to the ‘Report’ view within Power BI, where you can design your visualizations effectively.
- Drag and Drop Fields: Select the relevant fields from the Power BI Databricks information model and drag them onto the report canvas. This intuitive action allows for swift visualization of your data, addressing the common challenge of time-consuming report creation.
- Choose Visualization Type: Utilize the visualization pane to select your desired chart or graph type, such as bar charts, line graphs, or advanced options like heatmaps and 3D maps. These can be enhanced using Mapbox and ArcGIS for customizable spatial analytics. Power BI offers two types of cards: Single numbers and Multi-row cards, providing versatile options for displaying key metrics.
- Customize Your Visuals in Power BI Databricks: Tailor your visualizations by adjusting formatting options in the visualization pane. This includes condition-based formatting, which significantly enhances the interpretability of your data. The Advanced Card visual in Power BI features condition-based formatting, support for prefixes and postfixes, and customizable content alignment, enriching your visualizations and ensuring consistency.
- Save and Publish: After finalizing your report, save your work and publish it to the Power BI service. This crucial step ensures that your insights are easily shareable with stakeholders, fostering improved communication and collaboration across teams.
In 2025, the emphasis on information visualization continues to rise, with statistics indicating that organizations utilizing visual tools experience a substantial enhancement in decision-making efficiency. Real-world examples illustrate that effective visualizations not only improve understanding but also drive business performance by aligning teams and reducing silos. For instance, the case study titled ‘Enhanced Communication through Visualization’ demonstrates how visualizing information fosters communication and collaboration between teams, thereby enhancing overall organizational efficiency.
By incorporating this information into Business Intelligence through Power BI Databricks, you can unlock the full potential of your data, transforming it into actionable insights that propel your organization forward. As Satyam Chaturvedi, Digital Marketing Manager, states, “By collaborating with Arka Softwares, you can confidently access the full functionalities of BI, unlocking the inherent value within your data and maximizing its potential.
Refreshing Data in Power BI: Best Practices for Databricks Integration
To ensure that Power BI Databricks delivers timely and pertinent insights, implementing effective refresh strategies from Databricks is essential.
-
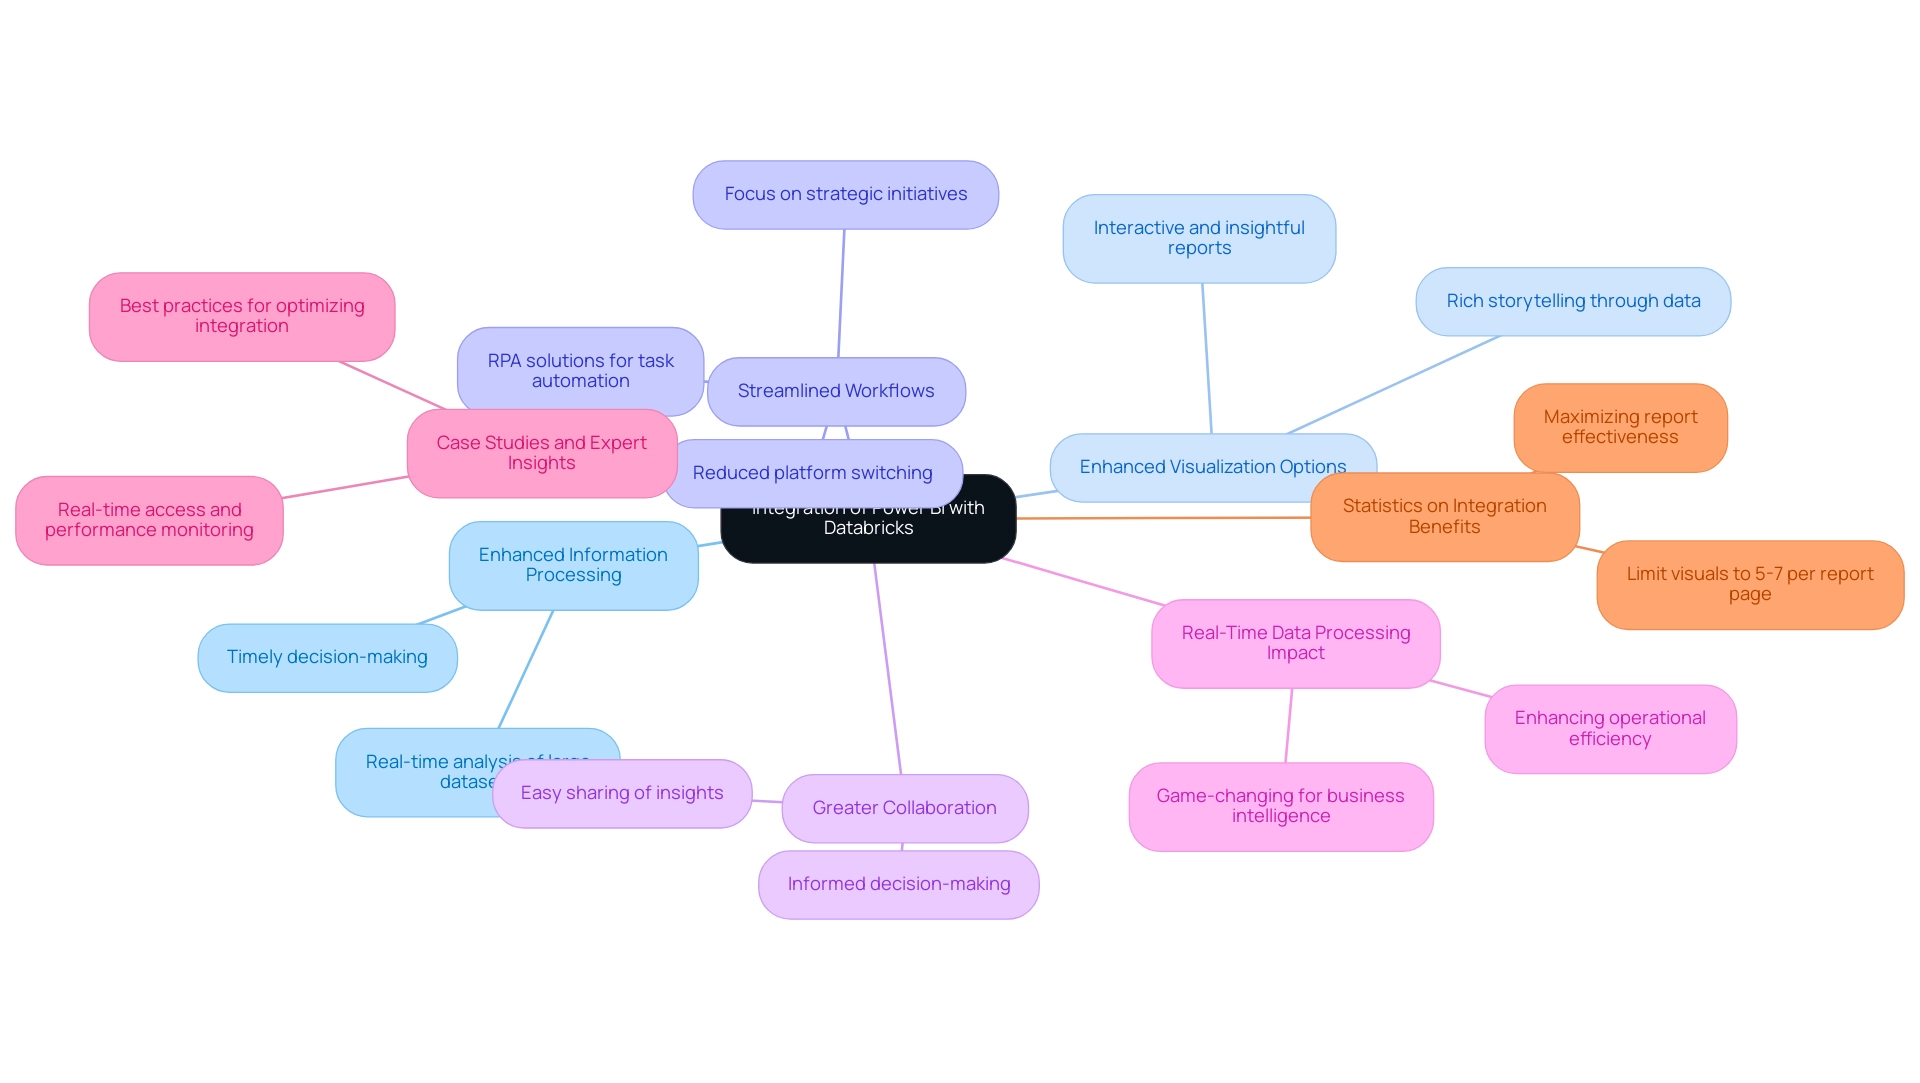
Schedule Regular Data Refreshes: Establish a routine for refreshing data in BI. This ensures that your reports consistently reflect the most current information, enhancing decision-making capabilities. Note that the Power BI cache update frequency is set to one hour by default; while the actual refresh might start within 15 minutes of the scheduled time, it can be delayed by up to one hour.
-
Utilize Incremental Refresh Options: For entities managing large datasets, leveraging incremental refresh can significantly enhance performance. This approach permits only the new or modified information to be loaded, reducing load times and optimizing resource usage. In 2025, around 60% of organizations are anticipated to implement incremental refresh strategies in BI, emphasizing its increasing significance in information management.
-
Monitor Refresh Failures: Regularly track the outcomes of scheduled refreshes using the History view feature in Power BI. This tool enables administrators to sort refresh information, view error messages, and export detailed reports, facilitating the prompt resolution of any issues that arise. Addressing these challenges is essential for leveraging insights effectively and avoiding time-consuming report creation.
-
Enhance Queries: Effective information retrieval is crucial during refresh operations. By optimizing queries in Power BI Databricks, organizations can ensure that information is fetched quickly and effectively, minimizing delays in report updates. This optimization is vital for overcoming inconsistencies that can hinder actionable guidance.
-
Implement Sensitivity Labels: Categorizing report information by business impact using sensitivity labels not only enhances security but also raises awareness among users about the importance of handling sensitive information appropriately.
-
Leverage Best Practices from Case Studies: For instance, strategies such as using bookmarks, drillthrough pages, and tooltips have been shown to optimize report load times, particularly on landing pages where quick access to information is critical. These practices can significantly enhance user experience and engagement with reports. The case study on optimizing report load times demonstrates how these strategies enhance page load speeds and improve user experience, making them vital for effective reporting.
By adhering to these best practices, organizations can maximize the efficiency of their refresh processes in BI tools, ensuring that insights obtained from cloud-based services are both timely and actionable. This integration of Business Intelligence and RPA, including tools like EMMA RPA and Automate from Creatum GmbH, drives operational efficiency and supports business growth by transforming raw data into meaningful insights.
Troubleshooting Common Issues in Power BI and Databricks Integration
Integrating Power BI with alternative platforms can present several challenges that may hinder operational efficiency. Here are some common issues and their solutions:
-
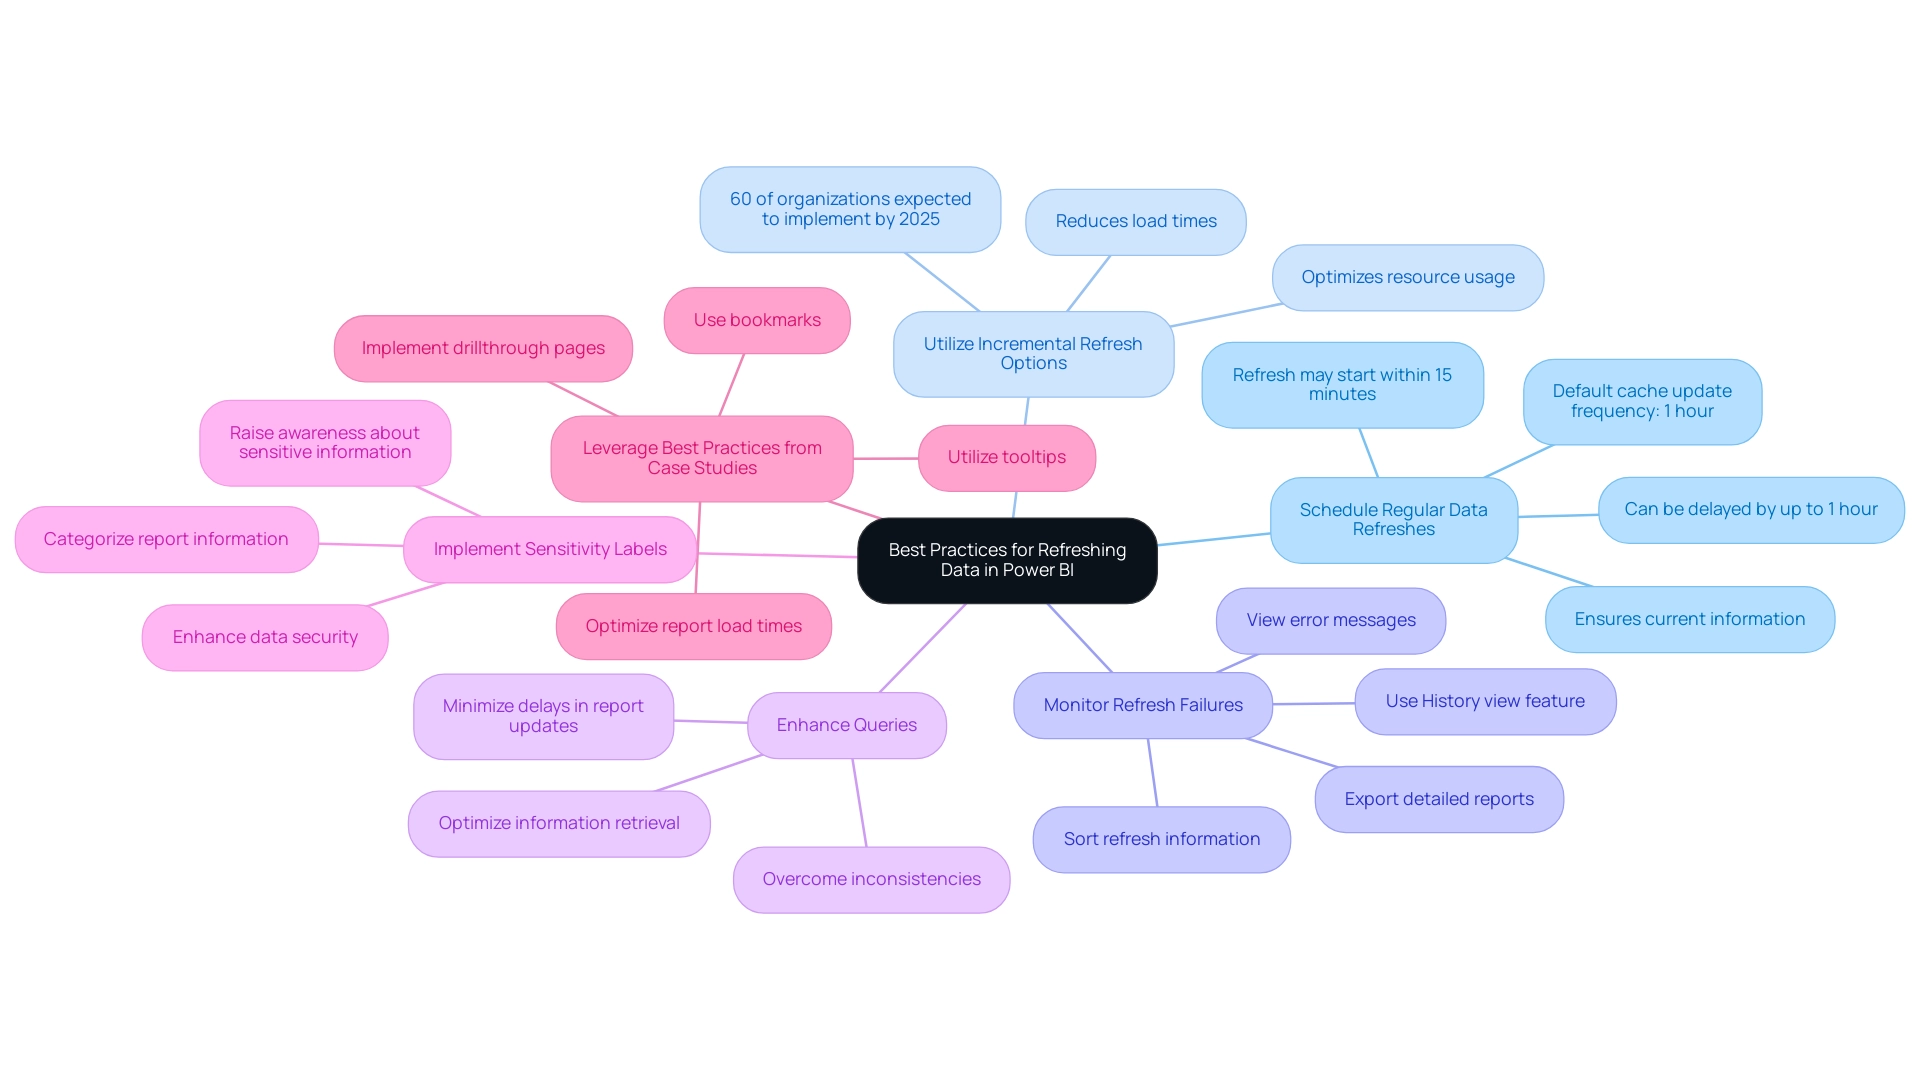
Connection Errors: A frequent issue arises when users encounter connection errors. To resolve this, ensure that your cluster is active and that you have entered the correct Server Hostname and HTTP Path. A significant percentage of users have reported experiencing connection errors, highlighting the importance of verifying these settings.
-
Data Refresh Failures: Data refresh failures can disrupt the flow of information. It’s crucial to check your refresh settings and optimize your queries. For large datasets, consider turning off background refresh in the PBIX file settings, as recommended by support teams. Monitoring CPU and memory usage can also help identify bottlenecks during refresh operations. Additionally, checking local file settings in the PBIX file can further enhance refresh performance.
-
Permissions Issues: Permissions can often be a roadblock. Ensure that you have the necessary access rights to the data stored in the platform. It’s crucial to recognize that Row Level Security (RLS) cannot be implemented using a token for BI connections to a cloud data platform. Without the correct permissions, even the most optimized queries will fail to execute.
-
Performance Issues: Performance can degrade significantly when Power BI generates overly complex queries, particularly those with numerous OR clauses. These queries can exceed 8,000 lines of code, leading to execution delays and cancellations before a plan is generated. As noted by Sravan Voona, the engine might encounter issues in parsing such large queries and generating the execution plan. To mitigate this, consider preprocessing data in the platform, using views, and optimizing file pruning to simplify queries. Users have faced execution times exceeding four minutes due to these complexities, underscoring the need for optimization. The case study titled “Power Bi Performance with Azure” highlights these challenges, illustrating the performance issues stemming from complex queries.
-
Row Level Security (RLS): It’s important to note that Row Level Security cannot be applied using a token for connections to the analytics platform. This limitation can complicate information governance and access control, necessitating alternative strategies for managing user permissions.
By tackling these frequent challenges with specific remedies, entities can improve their incorporation of Power BI Databricks alongside cloud platforms, ultimately converting unrefined information into practical insights for informed decision-making. This aligns with our mission at Creatum GmbH to address the challenges of manual, repetitive tasks that hinder operational efficiency, allowing teams to focus on more strategic, value-adding activities. Leveraging Robotic Process Automation (RPA) can further streamline these workflows, enhancing overall operational efficiency in a rapidly evolving AI landscape.
The Benefits of Integrating Power BI with Databricks for Enhanced Business Intelligence
Integrating Power BI with Databricks presents a multitude of advantages that significantly enhance business intelligence capabilities:
-
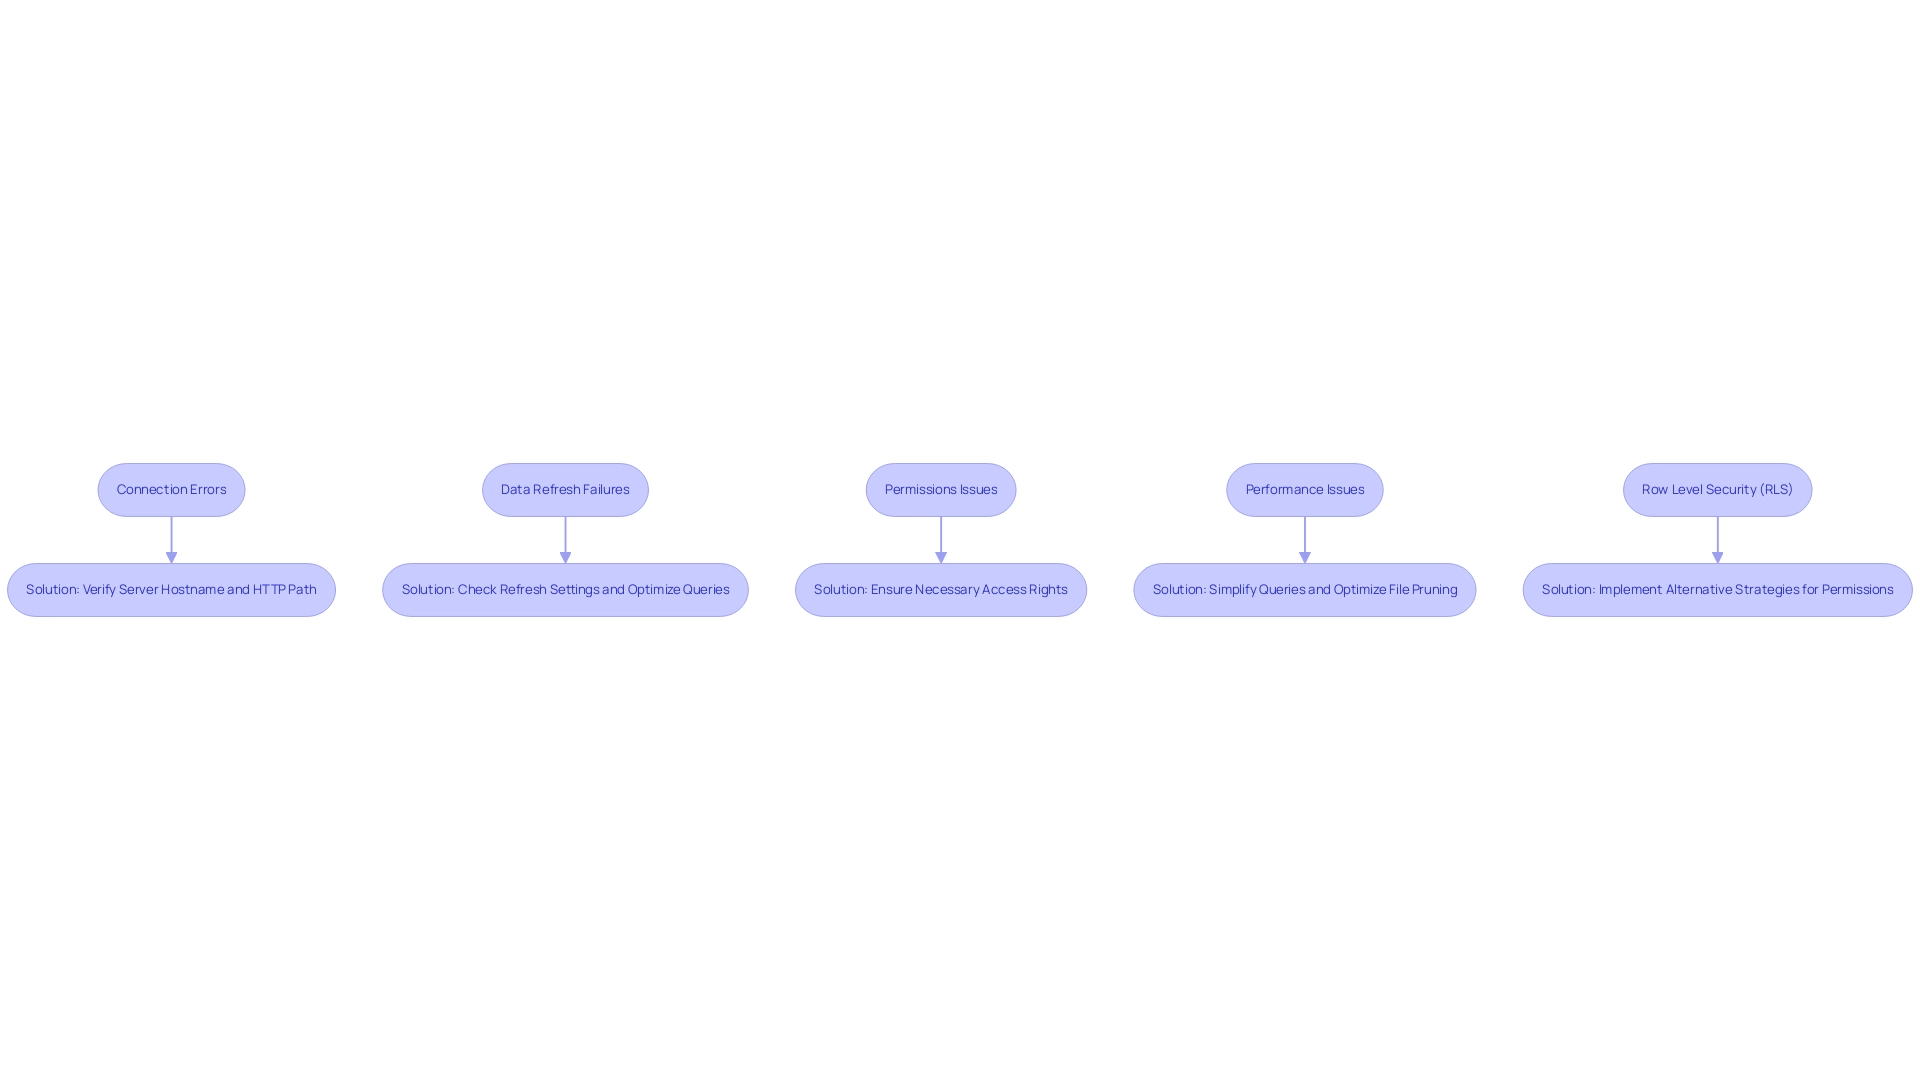
Enhanced Information Processing Capabilities: This integration enables the analysis of large datasets in real-time, allowing organizations to make timely decisions based on the most current information. In today’s fast-paced business environment, timely insights can lead to competitive advantages.
-
Enhanced Visualization Options: Users can generate interactive and insightful reports that not only showcase information but also narrate a story. The combination of a leading business intelligence tool’s strong visualization features with advanced analytical capabilities produces reports that are visually attractive and rich in insights, aiding improved comprehension and communication of data discoveries.
-
Streamlined Workflows: Leveraging Databricks’ powerful analytics features directly within Business Intelligence allows users to streamline their workflows. This integration reduces the need for switching between platforms, enhancing productivity and enabling teams to focus on strategic initiatives rather than repetitive tasks. Furthermore, Robotic Process Automation (RPA) solutions from Creatum GmbH can address task repetition fatigue, enhancing operational efficiency and boosting employee morale by automating manual workflows.
-
Greater Collaboration Across Teams: Power BI dashboards facilitate easy sharing of insights, fostering collaboration among teams. This collaborative environment ensures that all stakeholders have access to the same information and insights, promoting informed decision-making across the organization.
-
Real-Time Data Processing Impact: In 2025, the ability to process data in real-time will be a game-changer for business intelligence. Organizations harnessing this capability will not only improve operational efficiency but also enhance employee morale by reducing task repetition fatigue, enabling teams to focus on more value-adding activities. As Kyle Hale, Azure Solution Architect at the company, notes, ‘This is a really good article.’ It’s encouraging to see the positive impact of such integrations highlighted.
-
Power BI Databricks: Case studies and expert insights on best practices for optimizing the Power BI Databricks connector emphasize the significance of real-time access and performance monitoring. Implementing these practices can lead to enhanced analytical capabilities, driving growth and innovation. Experts in the field assert that integrating these tools is essential for entities aiming to stay ahead in a data-driven landscape.
-
Statistics on Integration Benefits: It is recommended to limit visuals to five to seven per report page to optimize performance, ensuring that reports remain clear and actionable. This statistic underscores the importance of careful information presentation in maximizing the effectiveness of business intelligence tools.
In summary, the integration of Power BI Databricks not only enhances analysis but also transforms how companies approach business intelligence, making it a vital strategy for success in 2025. Additionally, tailored AI solutions from Creatum GmbH can further support organizations in overcoming technology implementation challenges, ensuring they leverage the full potential of their data.
Conclusion
The integration of Power BI and Databricks signals a transformative shift in how organizations approach data analytics and business intelligence. By leveraging the robust visualization capabilities of Power BI alongside the powerful data processing features of Databricks, businesses can unlock deeper insights and drive strategic decision-making. This synergy enhances data accessibility and operational efficiency while fostering collaboration across teams, ensuring that all stakeholders are equipped with the same information to make informed choices.
Key benefits of this integration include:
- Improved data processing capabilities
- Enabling real-time analysis of large datasets
- A variety of visualization options that convert complex data into compelling narratives
As organizations strive to remain competitive in a rapidly evolving digital landscape, effectively leveraging these tools becomes crucial. Implementing best practices for data refresh, troubleshooting common issues, and optimizing queries can further enhance the overall experience and output of analytics initiatives.
Ultimately, the collaboration between Power BI and Databricks transcends mere technology; it empowers organizations to transform raw data into actionable insights that drive growth and innovation. As businesses navigate the complexities of data, embracing this integration will be essential for cultivating a data-driven culture that prioritizes informed decision-making and operational excellence.
Frequently Asked Questions
What is the primary function of the BI tool mentioned in the article?
The BI tool serves as a robust business analytics instrument that empowers users to visualize information and share insights across their organizations, facilitating informed decision-making through interactive dashboards and comprehensive reporting capabilities.
How does the platform differ from traditional BI tools?
The platform is an advanced analytics system tailored for large-scale information and machine learning, leveraging the capabilities of Apache Spark, which allows for more extensive data processing compared to traditional BI tools.
What benefits arise from integrating BI tools with analytics platforms?
Integrating BI tools with analytics platforms enhances accessibility, scalability, and performance, enabling organizations to manage extensive datasets and extract deeper insights, which drives informed strategies and operational improvements.
What challenges do companies face when utilizing analytics tools?
Companies often encounter challenges such as tool complexity, slow query performance, and errors, which hinder their ability to effectively utilize analytics.
What services does the article mention to help organizations with reporting and information consistency?
The article mentions BI services that include a 3-Day Sprint for rapid report creation and a General Management App for comprehensive management and smart reviews.
What recent updates have been made to the Databricks analytics platform?
Recent updates to the Databricks analytics platform enhance its capabilities by streamlining data processing and analytics workflows, contributing to a powerful ecosystem for data-driven decision-making.
What is the significance of the projected growth of the social business intelligence market?
The social business intelligence market is projected to reach approximately $25.9 billion by 2025, indicating the increasing importance of tools like Power BI and Databricks for organizations aiming to remain competitive.
What prerequisites are necessary to connect Power BI to Databricks?
The prerequisites include having an active account with access to a workspace, installing the latest version of Power BI Desktop, setting up a cluster or SQL warehouse, confirming data access permissions, and installing the latest ODBC driver if using ODBC for the connection.
How can organizations overcome common challenges in report creation and information integration?
By adhering to the prerequisites for connecting Power BI to Databricks, organizations can streamline the connection process, which helps overcome challenges like time-consuming report creation and inconsistencies.
What additional technologies can enhance the integration process?
Integrating Robotic Process Automation (RPA) can streamline the integration process by automating repetitive tasks, and customized AI solutions can address specific challenges associated with information integration and reporting.

