Overview
Mastering custom sort order in Power BI is essential for presenting information in a meaningful sequence. By creating a dedicated sort table and effectively integrating it into your data model, you can significantly enhance data visualization clarity and operational efficiency. This practice not only improves the overall presentation of data but also addresses common challenges users encounter, such as data inconsistencies. Furthermore, it paves the way for advanced sorting techniques, including calculated columns. Are you ready to elevate your data presentation skills?
Introduction
In the dynamic realm of data visualization, Power BI emerges as a formidable tool, empowering users to customize their data presentations to fulfill specific analytical requirements. Custom sorting, a pivotal feature of Power BI, facilitates the organization of data beyond conventional alphabetical or numerical sequences, thereby ensuring that insights are communicated with clarity and impact.
As organizations increasingly depend on data-driven decision-making, mastering the nuances of custom sorting becomes imperative for developing reports that not only inform but also resonate with stakeholders. This article explores the critical role of custom sorting in Power BI, addressing common challenges users encounter, providing practical steps for establishing sort tables, and unveiling advanced techniques that can elevate data analysis to unprecedented levels.
By grasping these concepts, users can refine their data storytelling abilities, fostering enhanced decision-making and operational efficiency in a fiercely competitive landscape.
Understanding Custom Sorting in Power BI
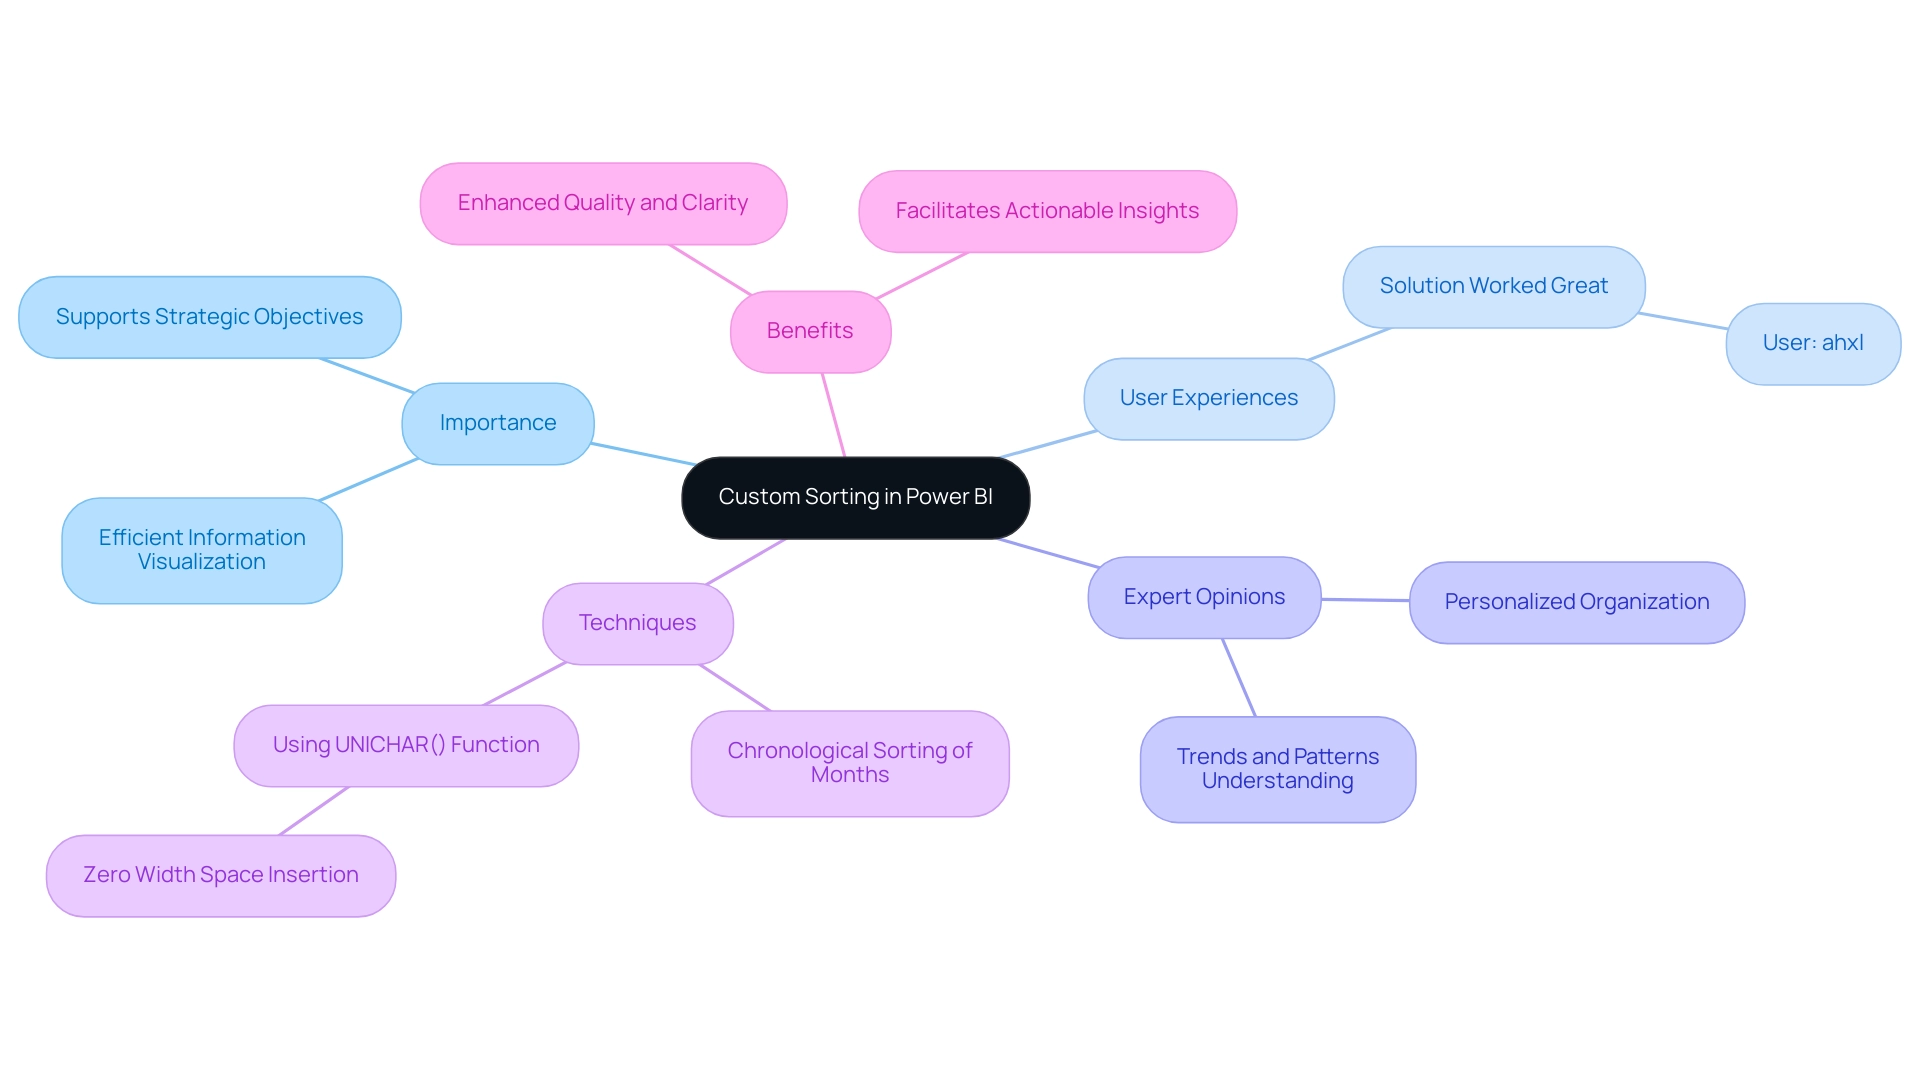
The Power BI custom sort order empowers users to dictate the arrangement of information in reports and dashboards, transcending the limitations of default alphabetical or numerical organization. This capability is crucial when the inherent order of information diverges from the desired presentation. For instance, employing Power BI custom sort order ensures that months are arranged chronologically rather than alphabetically. In 2025, the importance of custom arrangement has been underscored by numerous discussions, with one post attracting over 340,426 views as users sought solutions for organizational challenges, particularly with calculated columns.
This statistic highlights the growing recognition of customized organization’s role in efficient information visualization, aligning with the demand for personalized AI solutions that navigate the overwhelming choices present in the market.
Expert opinions affirm that effective personalized organization is essential for information visualization, enabling a more intuitive understanding of trends and patterns. A regular visitor, ahxl, remarked, “This solution worked great for a situation where I had months – August, September, and October not displaying in the correct order in my visual,” illustrating the practical challenges users encounter. A case study further demonstrated how the UNICHAR() function was utilized to establish a custom sort order in a table, successfully grouping ‘Bad’ and ‘Warning’ statuses while preserving a specific sequence.
By inserting a ‘Zero width space’ before text entries, the desired order was achieved without disrupting other visual elements.
The benefits of custom sorting extend to enhancing quality and clarity in visualizations, facilitating easier extraction of actionable insights for stakeholders. This is particularly vital in today’s information-rich environment, where organizations struggle to leverage insights from BI dashboards due to time-consuming report generation and information inconsistencies. Moreover, incorporating the Category field into the Legend can aid in visualizing how segments are categorized, thereby enhancing the clarity of presentations.
As organizations increasingly rely on information-driven decision-making, mastering custom sorting techniques in BI becomes essential for presenting narratives that resonate with audiences and support strategic objectives. This aligns with Creatum GmbH’s unique value in enhancing information quality and streamlining AI implementation, ultimately driving growth and innovation.
Common Challenges in Implementing Custom Sorts
Implementing a custom sort order in Power BI presents several challenges that users must navigate to achieve effective analysis. Key issues include:
-
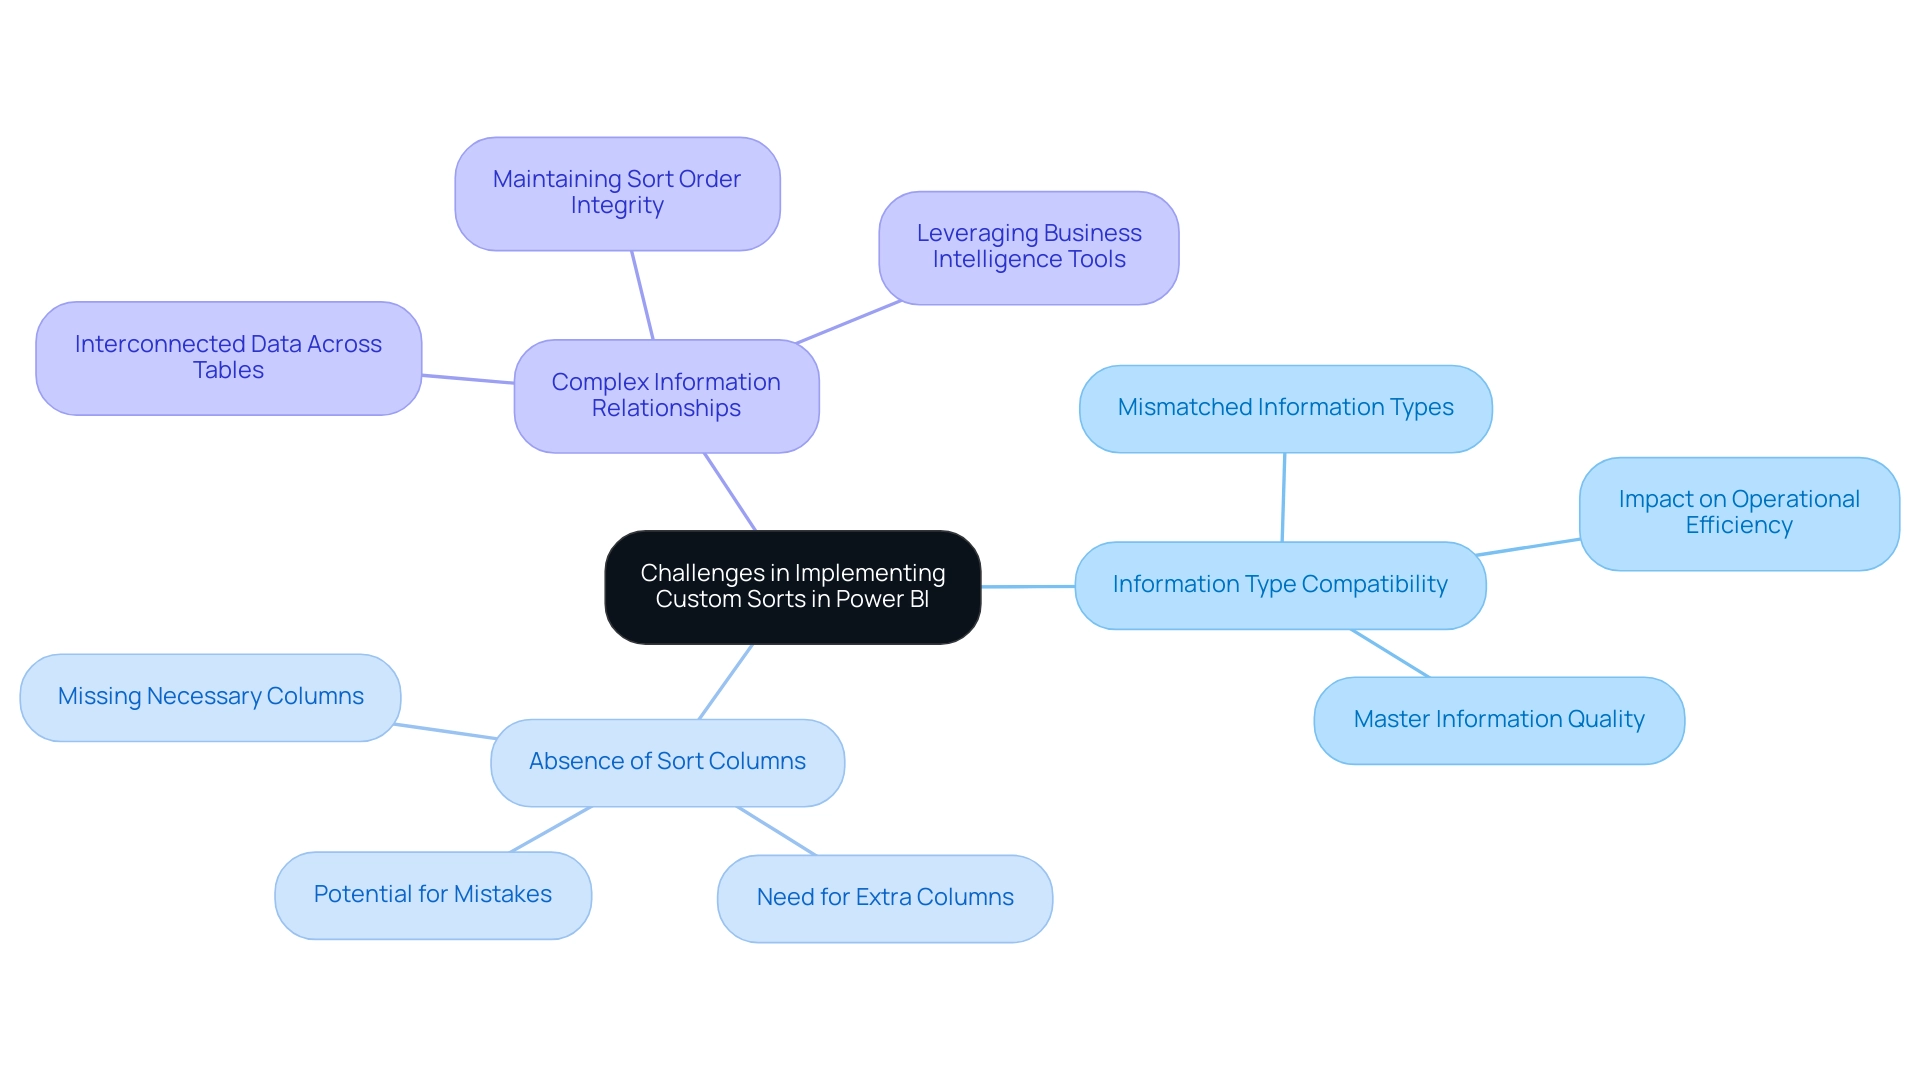
Information Type Compatibility: A significant hurdle is ensuring that the types of the columns being sorted are compatible. Organizing text fields necessitates careful attention to detail; mismatched information types can lead to unforeseen ordering outcomes. This issue is especially pressing in 2025, as organizations increasingly depend on various information sources that may not always align seamlessly. This reflects a broader challenge of poor master information quality, which can hinder operational efficiency and decision-making.
-
Absence of Sort Columns: Users often encounter situations where the necessary columns for sorting are missing from the dataset. This limitation may require the creation of extra columns to enable the desired arrangement, complicating the preparation process and raising the potential for mistakes. Such challenges can be exacerbated by apprehension surrounding AI adoption, as organizations may hesitate to integrate advanced technologies that could streamline these processes.
-
Complex Information Relationships: When information is interconnected across multiple tables, maintaining the integrity of sort orders becomes increasingly complex. Users must have a clear understanding of these relationships to ensure that sorting remains consistent and accurate across the entire dataset. This complexity underscores the importance of leveraging business intelligence tools effectively to transform raw data into actionable insights, enabling informed decision-making that drives growth and innovation.
Addressing these challenges is crucial for utilizing Power BI’s custom sort order to its full potential. Microsoft offers a 60-day trial phase of BI Pro, allowing users facing organizational challenges to explore its features. As Brian, an Enterprise DNA Expert, noted, “I hope you found it useful. I really enjoyed this challenge and learned an enormous amount from the experience, which I wanted to document in detail here for my own purposes as well.” This perspective highlights the significance of comprehending categorization challenges in BI.
Furthermore, a case study contrasting BI with Tableau emphasizes BI’s strengths in usability, which can indirectly aid discussions on organizational challenges by showcasing the tool’s overall benefits. The BI community also shares valuable experiences, tutorials, and tips for visual representation, encouraging users to seek additional resources and assistance for overcoming organizational challenges. By recognizing and tackling these common issues, users can enhance their data visualization efforts and drive more informed decision-making.
Setting Up a Sort Table for Custom Sorting
To effectively set up a sort table for custom sorting in Power BI, follow these detailed steps while keeping in mind the common challenges faced in leveraging insights from Power BI dashboards:
-
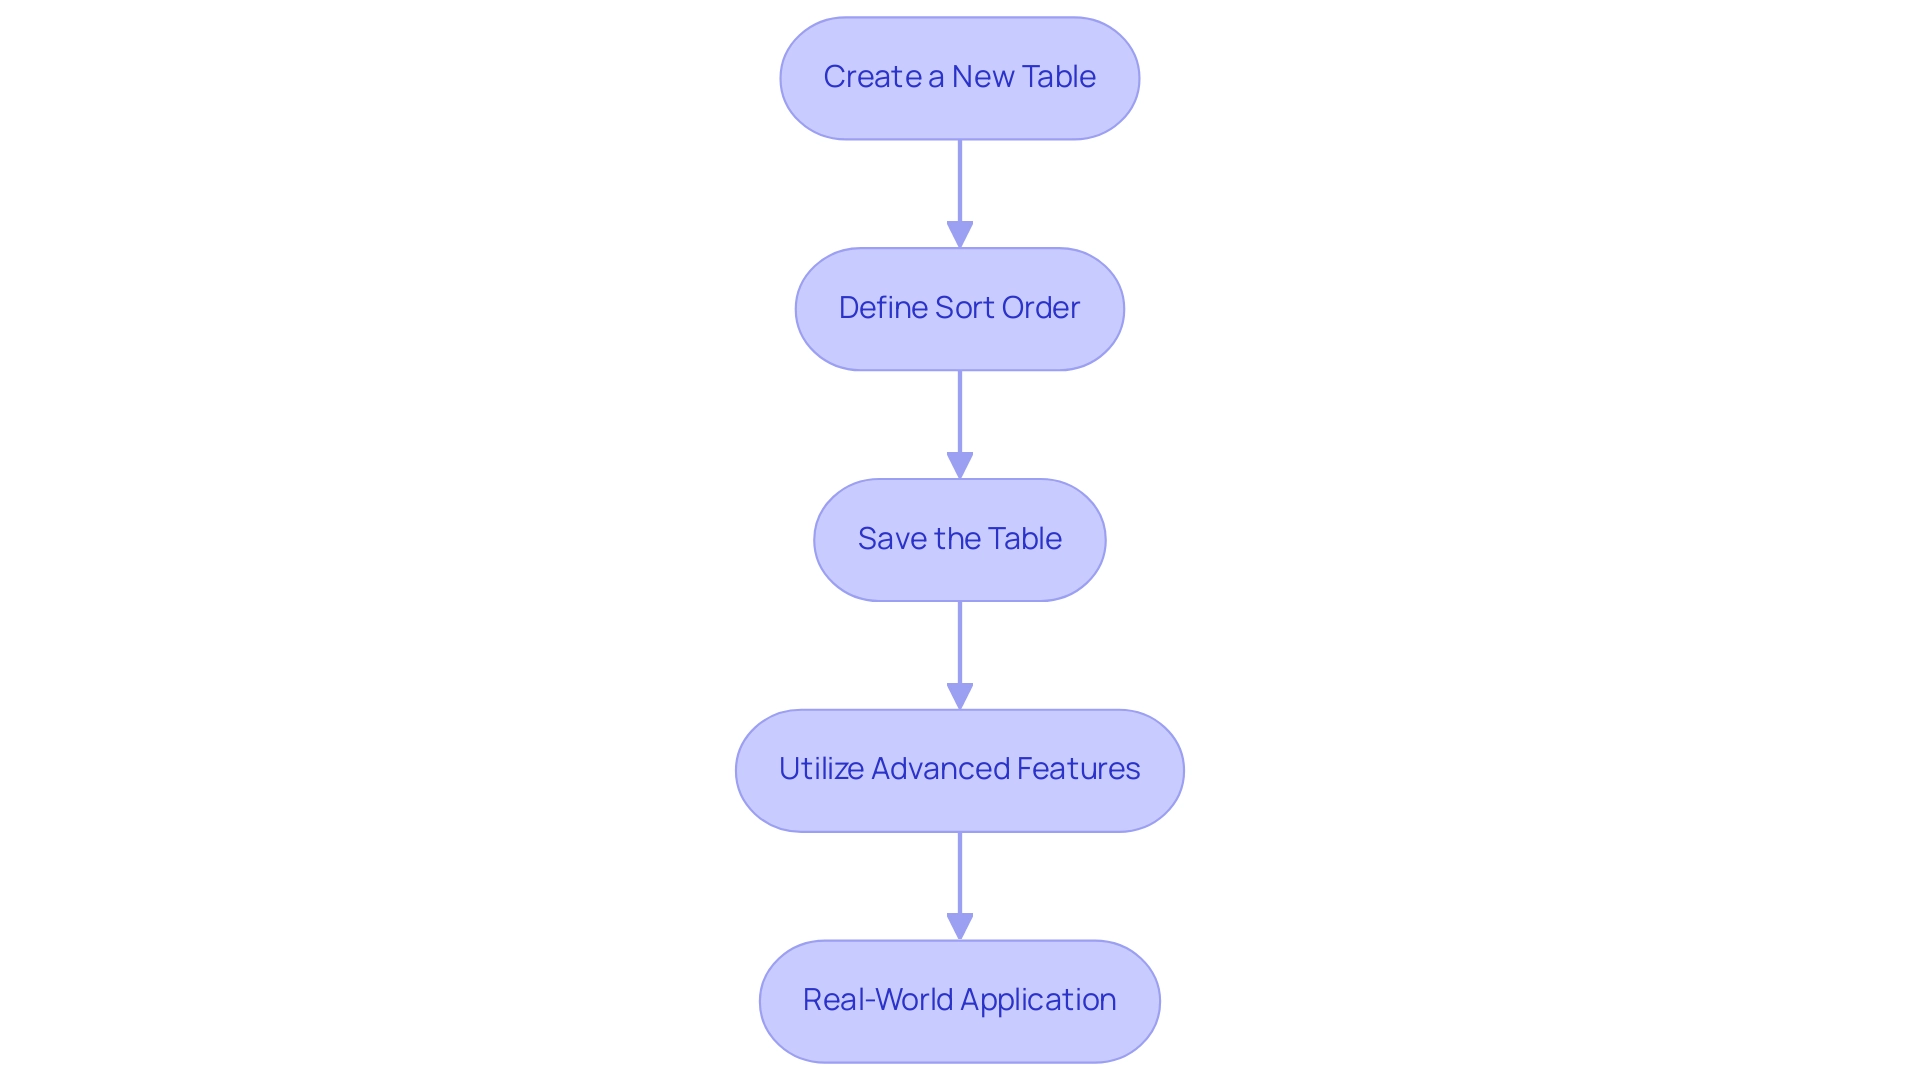
Create a New Table: Start by navigating to the ‘Home’ tab in Power BI and selecting ‘Enter Data’. This allows you to create a new table specifically for sorting purposes. Ensure this table contains two essential columns: one for the values you wish to arrange and another for the Power BI custom sort order. This step is crucial to avoid the time-consuming report creation that often detracts from data analysis.
-
Define Sort Order: In the sort order column, input numeric values that reflect the desired sequence. For example, when arranging months, assign January the value of 1, February the value of 2, and continue this pattern through December. This custom arrangement logic can also classify items into groups, such as Rural, Urban, Mix, and Youth, enhancing the clarity of your presentation and addressing potential inconsistencies that may arise from a lack of governance strategy, utilizing a Power BI custom sort order.
-
Save the Table: After populating your sort table, save it and ensure it is properly connected to your main information table. This connection is essential for effective sorting and will enable seamless analysis. Note that if you wish to share your report, it must be saved in Premium capacity to enable sharing, thus ensuring that stakeholders have access to consistent and reliable information.
-
Utilize Advanced Features: Leverage Power BI’s capabilities, such as conditional formatting, to enhance your visualizations. This feature allows you to apply color gradients and icons based on numerical values, making your information more intuitive and engaging. As Keren Aharon observes, “This solution demonstrates how advanced DAX measures and nested sorting can be utilized in BI to enhance visualization and analysis,” offering practical guidance that is frequently absent in conventional reports. These advanced features specifically address the challenges of report creation and inconsistencies by allowing for more dynamic and insightful presentations of information.
-
Real-World Application: Consider the case study of creating a new table named ‘Key’ in Business Intelligence, which serves as a foundation for future calculations. This approach not only organizes information effectively but also prepares it for advanced analysis, showcasing the importance of a well-structured sort table in driving insights and operational efficiency for business growth.
By following these steps, you can establish a robust sorting mechanism in Business Intelligence using Power BI custom sort order that enhances information visualization and analysis, ultimately driving better decision-making and addressing the challenges of report creation and information governance. At Creatum GmbH, we stress the significance of these strategies in enhancing your information processes.
Integrating the Sort Table into Your Data Model
Incorporating an organized table into your Power BI information model is essential for efficient analysis, especially in today’s information-rich environment where leveraging Business Intelligence (BI) and Robotic Process Automation (RPA) is crucial for driving growth and innovation. Follow these steps to ensure seamless integration:
-
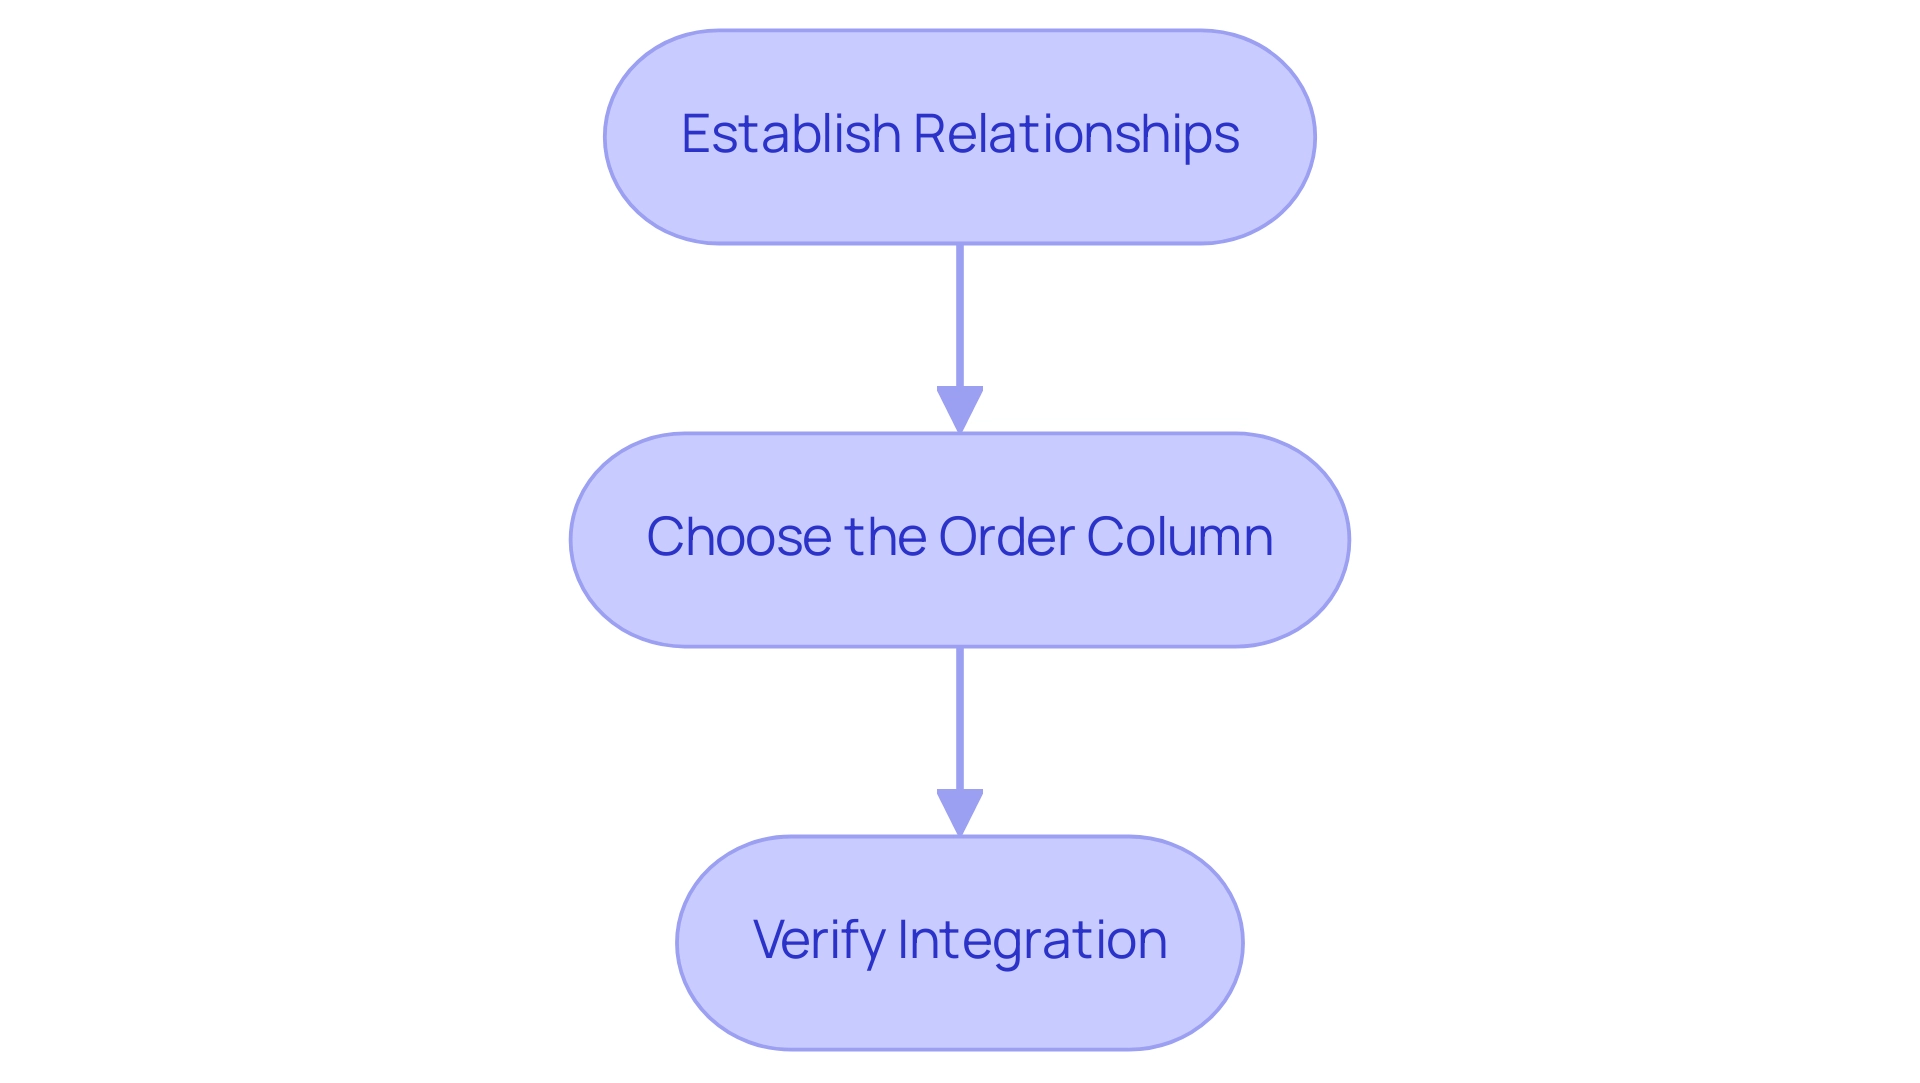
Establish Relationships: Start by navigating to the ‘Model’ view. Here, create a connection between your main information table and the sort table. This relationship should link the value column in your main table to the corresponding value in the sort table, which is vital for implementing the Power BI custom sort order for precise representation. Establishing these relationships not only enhances information integrity but also optimizes the performance of your reports. The star schema methodology, which categorizes tables effectively for analytical querying, supports this approach. As Hayley Hodges emphasizes, ‘The star schema is a well-established modeling technique commonly used in relational warehouses.’
-
Choose the Order Column: In your primary information table, identify the column you wish to arrange. Navigate to the ‘Column tools’ tab and select ‘Sort by Column’. From your sort table, choose the appropriate sort order column. This step is critical for ensuring that your information is presented in a meaningful sequence, achieved by applying a Power BI custom sort order that aligns with your analytical goals. Additionally, consider utilizing Power BI’s conditional formatting options, such as color gradients and icons, to visually represent data values in tables, thereby enhancing the overall data visualization experience.
-
Verify Integration: After applying the arrangement order, it is essential to confirm that the integration has been successful. Check your visualizations to ensure that the custom arrangement is functioning as intended. This verification process is crucial, as it impacts the overall effectiveness of your analysis and decision-making.
In 2025, incorporating sort tables in BI models has grown increasingly important, with experts underscoring the necessity for robust relationships between tables to enable Power BI custom sort order. Statistics indicate that organizations leveraging these techniques experience enhanced clarity and operational efficiency. For instance, Shashanka Shekhar’s post on March 10, 2024, garnered 102 interactions, highlighting the relevance and engagement of the topic within the community.
Real-world examples illustrate that effective relationship management in BI enhances sorting capabilities, particularly with the use of Power BI custom sort order, driving better insights and leading to more informed business decisions. Furthermore, employing a star schema can optimize analytical querying and improve the performance and maintainability of BI reports, addressing common challenges such as time-consuming report creation and data inconsistencies. By integrating RPA solutions like EMMA RPA and Automate, businesses can further streamline their processes, reduce manual effort, and enhance operational efficiency.
Finalizing Your Custom Sort Settings
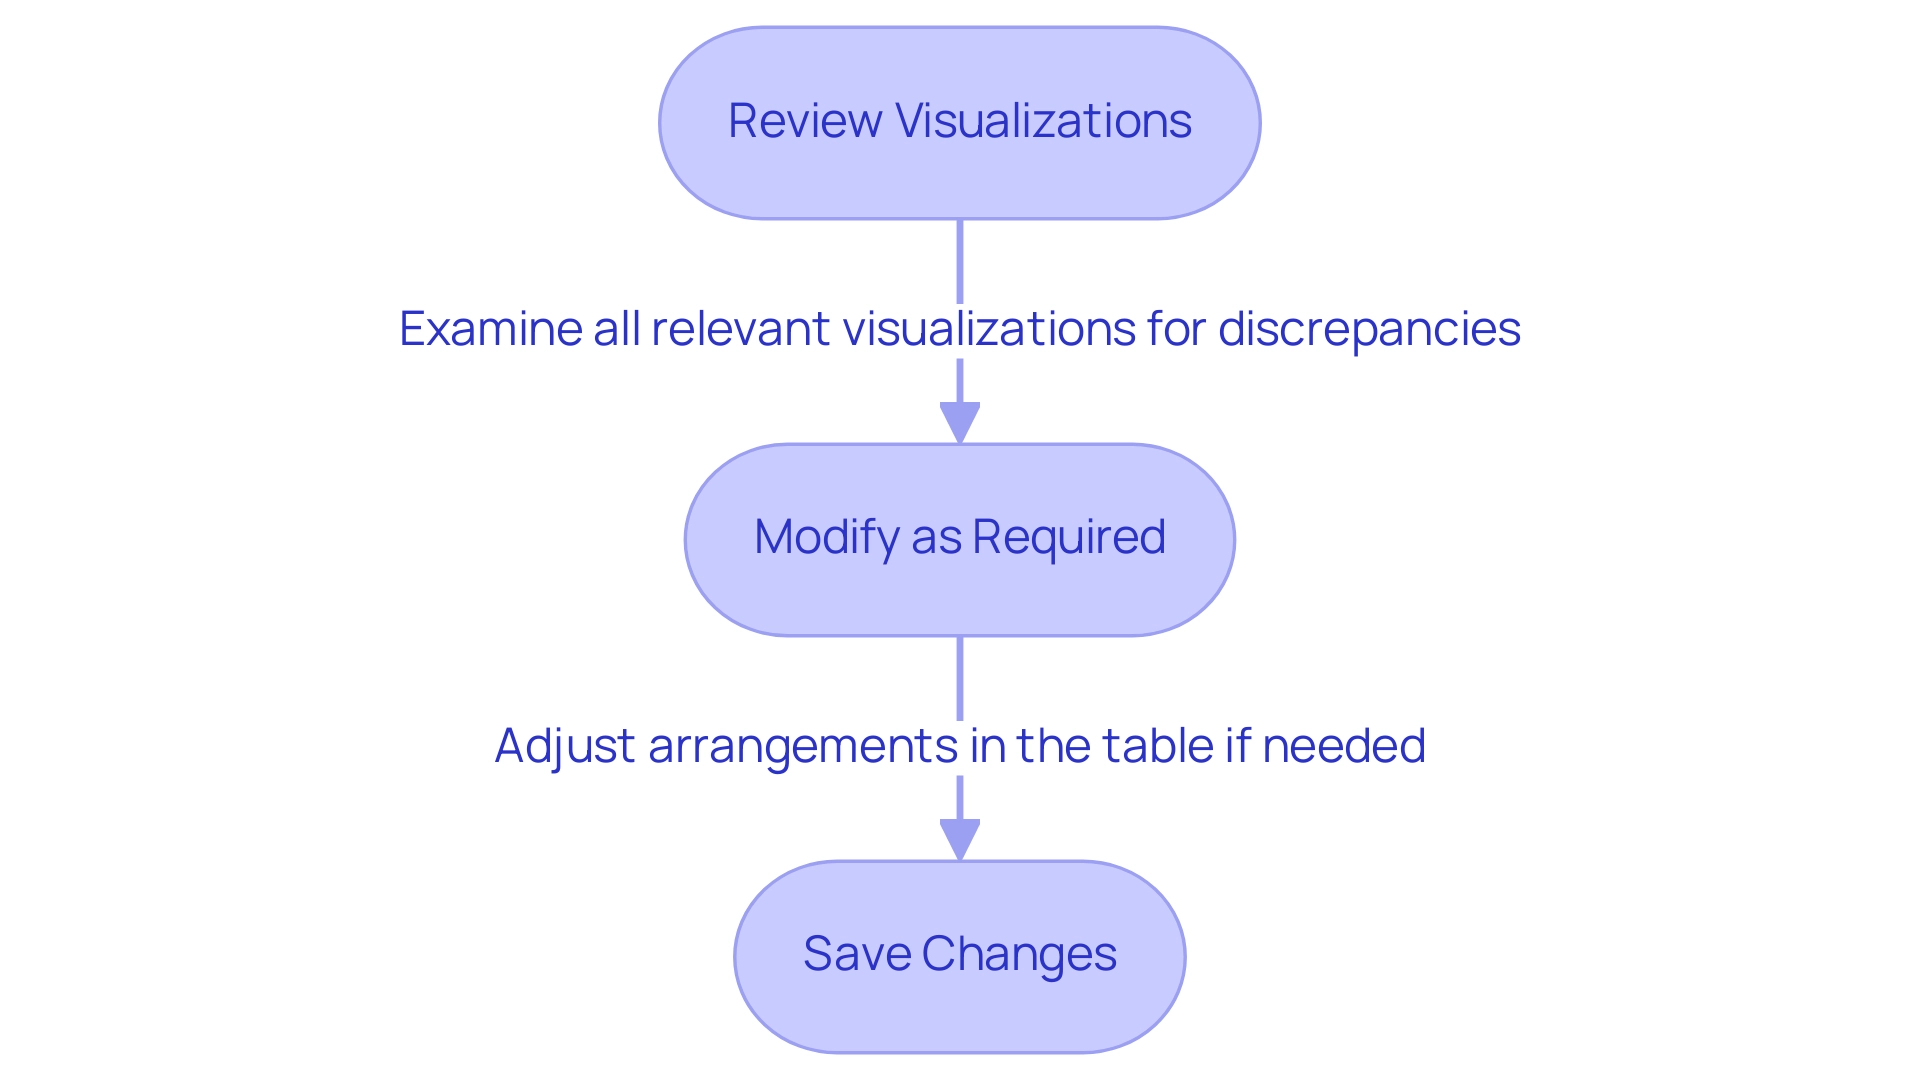
To effectively finalize your custom sort settings in Power BI, follow these structured steps:
-
Review Visualizations: Begin by thoroughly examining all relevant visualizations to confirm that the custom arrangement is accurately applied. Pay close attention to any discrepancies in how information is presented, as this can significantly impact analysis outcomes and hinder your ability to leverage actionable insights from your dashboards.
-
Modify as Required: If you notice any visual representations that do not display the desired arrangement, review the arrangement table and the connections within your information model. Making these adjustments is crucial for ensuring consistency across your reports. BI administrators can enable or disable data model editing in the service for specific security groups, which is essential for maintaining data integrity and addressing challenges like data inconsistencies.
-
Save Changes: After confirming that your custom sort settings meet your expectations, save your Power BI report. This action preserves your adjustments, ensuring that your custom sorting remains intact for future analyses, thus streamlining the report creation process.
In 2025, the significance of examining visualizations cannot be overstated, as it directly affects the effectiveness of analysis. Organizations utilizing advanced analytics tools, such as Inforiver Analytics+, can leverage over 100 chart types to visualize information effectively, supporting use cases with more than 30,000 points. This capability highlights the necessity of meticulous review processes to enhance information clarity and usability, ultimately driving business growth through informed decision-making.
Real-world examples, such as the CleanMac Dashboard developed by Outcrowd, illustrate how thoughtful information architecture can aid users in navigating complex data without feeling overwhelmed. Additionally, adding the Category field to the Legend helps visualize how segments are categorized, further enhancing the clarity of your reports. As Patrick LeBlanc, Principal Program Manager, emphasizes, “We highly value your feedback, so please share your thoughts using the feedback forum.”
By adopting these practices, you can guarantee that your BI visualizations not only demonstrate precise arrangement but also support informed decision-making, utilizing the full potential of Business Intelligence and RPA for operational efficiency.
Advanced Techniques: Using Calculated Columns for Sorting
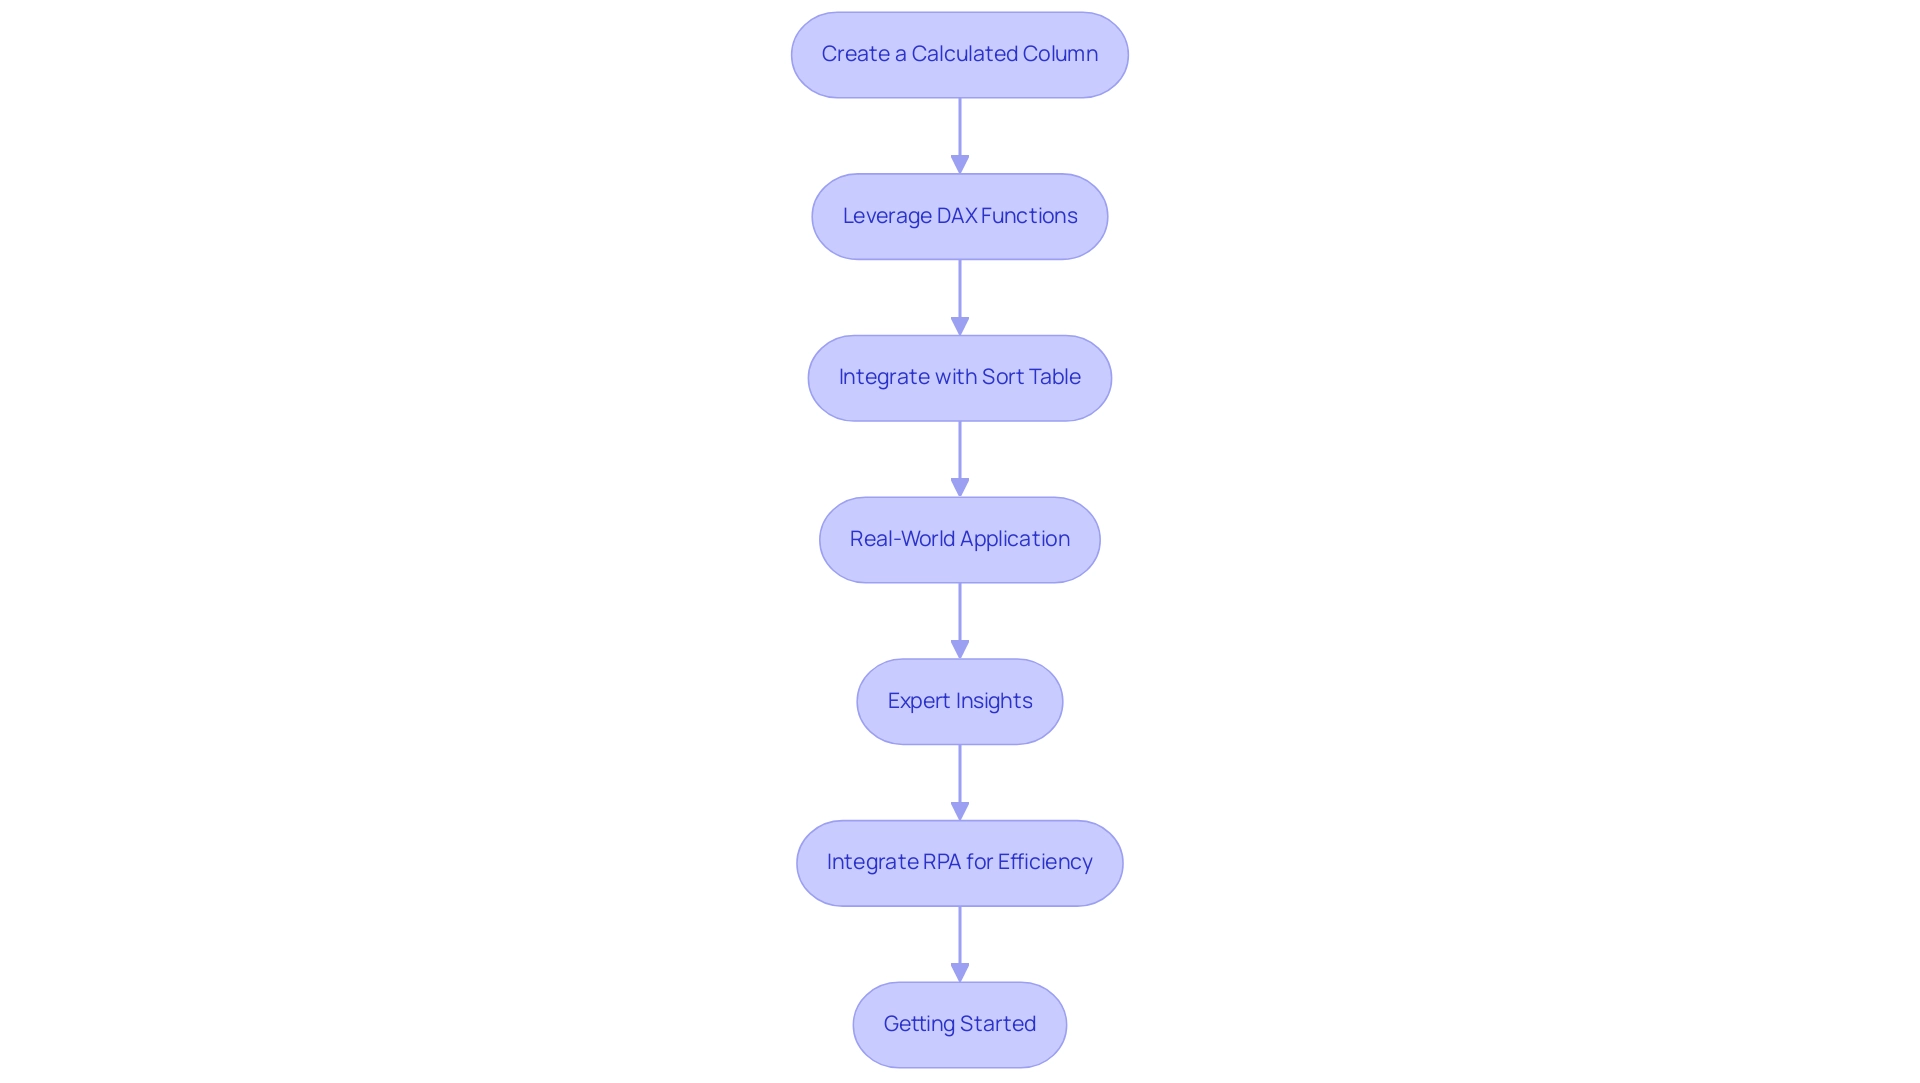
Advanced users can significantly elevate their custom sorting capabilities in Power BI custom sort order by effectively utilizing calculated columns. Here’s a detailed approach to mastering this technique, while also addressing the challenges of time-consuming report creation and data inconsistencies that often hinder effective data analysis:
-
Create a Calculated Column: Begin by adding a calculated column to your main table. This column should establish the arrangement based on specific criteria pertinent to your analysis. For instance, if you aim to sort products by sales figures, your calculated column could reflect the total sales for each product, thus enhancing the actionable insights derived from your data.
-
Leverage DAX Functions: Utilize DAX (Data Analysis Expressions) functions to establish dynamic ordering logic. This approach enables you to implement more intricate sorting scenarios, such as sorting by multiple criteria simultaneously. For example, you could arrange products first by category and then by sales within each category, enhancing the clarity of your visualizations and addressing the common issue of lack of actionable guidance in Power BI dashboards.
-
Integrate with Sort Table: It is crucial to ensure that your calculated column is seamlessly integrated with your sort table. This integration maintains consistency in arrangement across all visualizations, allowing for a cohesive data presentation. By doing so, you can avoid discrepancies that may arise from manual organization methods, thus improving operational efficiency.
-
Real-World Application: A case study on nested arrangement in Power BI Bar charts illustrates the effectiveness of using calculated fields. This study highlights the limitations of traditional sorting methods, such as the Shift + Click technique, and demonstrates how calculated columns can facilitate hierarchical sorting. By utilizing calculated fields or ranking measures, users can ensure that visualizations accurately reflect the desired organization, overcoming the challenges posed by conventional methods and enhancing the overall information-driven decision-making process.
-
Expert Insights: Industry specialists, including Devin Knight, highlight the significance of mastering X-axis customization techniques for creating more meaningful visuals in BI. Knight states, “Driving adoption of technology through learning is essential for operational efficiency.” By adopting calculated columns for sorting, users can utilize a Power BI custom sort order to enhance their storytelling capabilities, ultimately driving better decision-making and leveraging the full potential of Business Intelligence.
-
Integrate RPA for Efficiency: To further streamline the report creation process, consider integrating Robotic Process Automation (RPA) tools like EMMA RPA or Automate. These tools can automate repetitive tasks involved in data preparation and report generation, significantly reducing the time spent on manual processes and minimizing data inconsistencies. This integration not only enhances operational efficiency but also allows users to focus on deriving actionable insights from their BI reports.
-
Getting Started: Users can create a BI report by opening BI Desktop and clicking ‘Get Data’ in the ‘Home’ tab, providing a practical starting point for their analysis.
By implementing these advanced techniques and integrating RPA, users can transform their BI reports into effective tools for data analysis, ensuring that insights are not only accurate but also presented in a visually compelling manner. Mastering X-axis customization techniques is crucial for achieving meaningful visuals in BI, thereby reinforcing the significance of BI and RPA in driving business growth.
Key Takeaways for Mastering Custom Sort Order
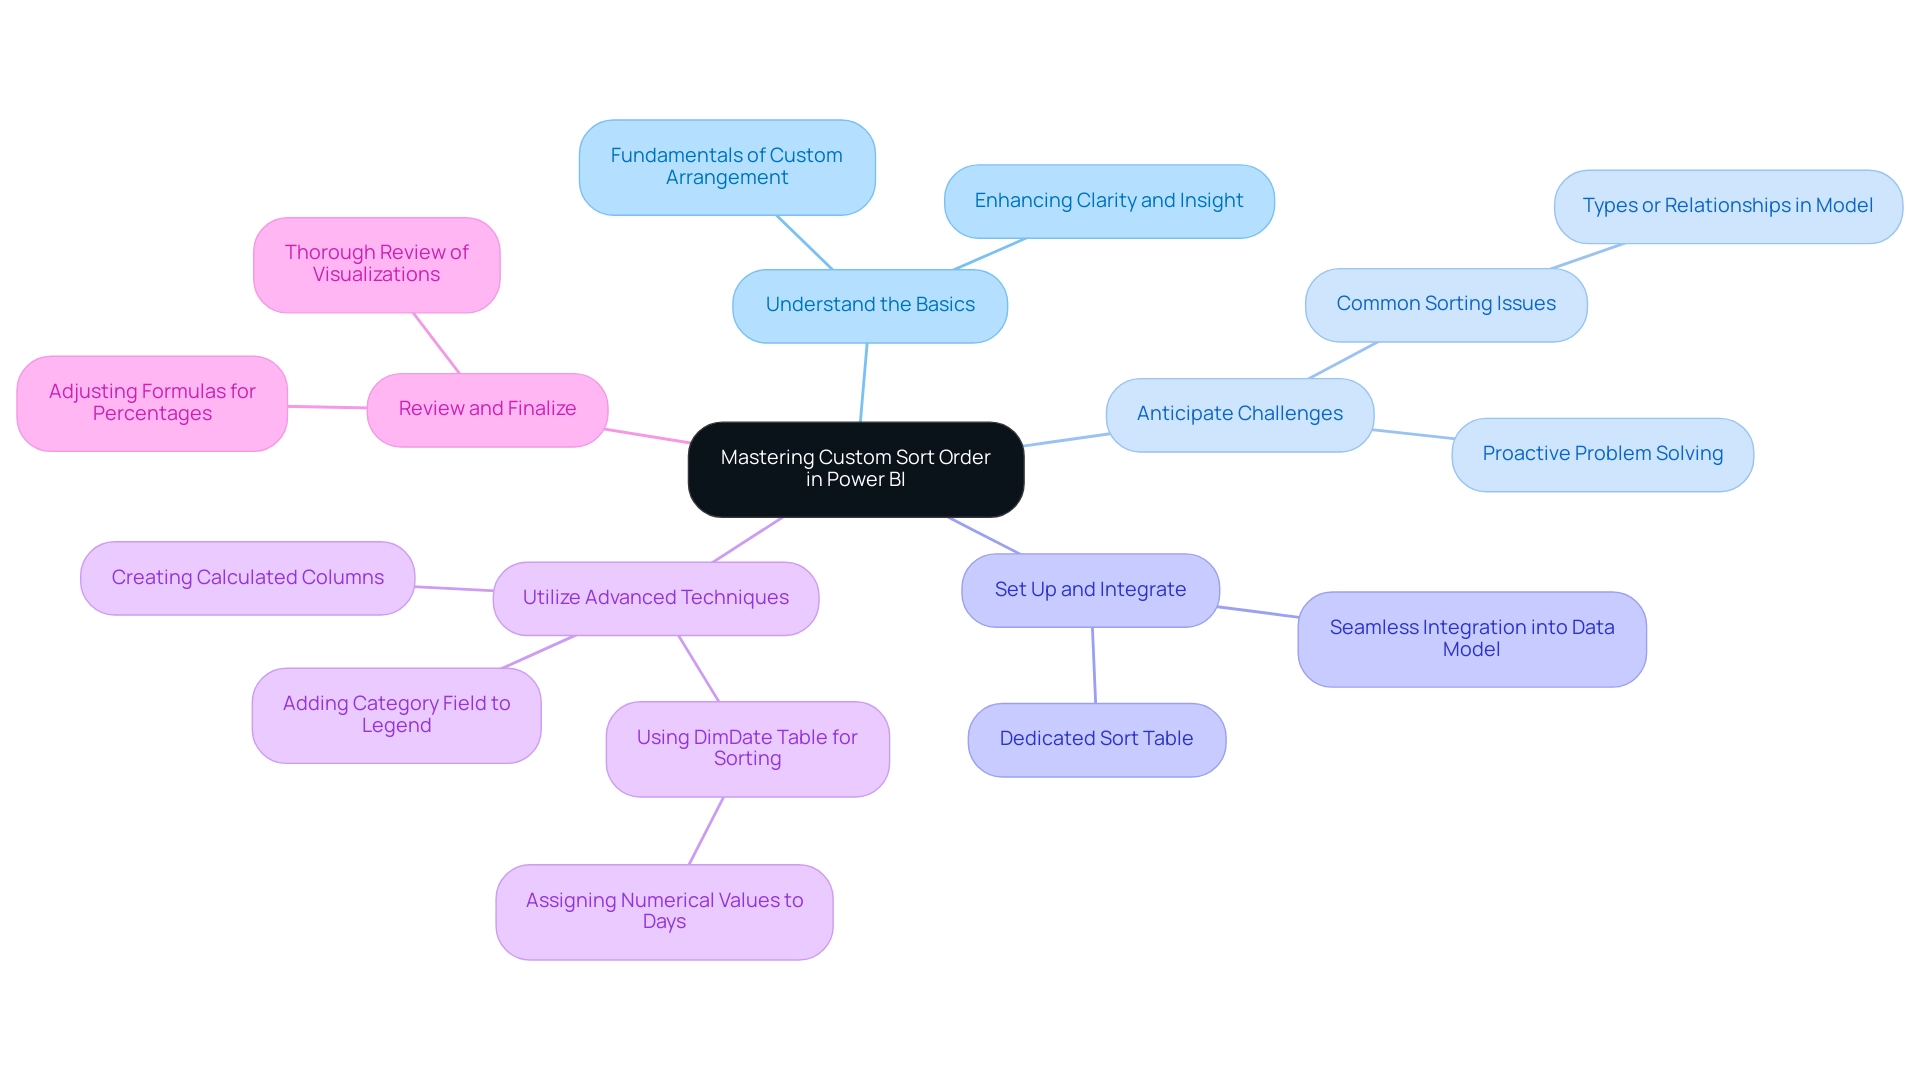
To effectively master Power BI custom sort order, consider the following essential points.
-
Understand the Basics: Grasping the fundamentals of custom arrangement is crucial for effective information visualization. Custom organization enables a more intuitive arrangement of information, enhancing clarity and insight, which is essential in overcoming challenges related to poor master information quality.
-
Anticipate Challenges: Recognizing potential difficulties in arranging is vital. With 330,215 views for user reporting sorting issues, common problems may arise from types or relationships within your model. Being ready to address these proactively can save time and enhance results, especially in an environment where inconsistencies can obstruct effective decision-making.
-
Set Up and Integrate: Establish a dedicated sort table and ensure it is seamlessly integrated into your data model. This integration is key to achieving the desired arrangement effect across your visualizations, aligning with the need for tailored solutions that enhance operational efficiency.
-
Utilize Advanced Techniques: Leverage advanced sorting methods, such as creating calculated columns. For example, utilizing a DimDate table to assign numerical values to days of the week enables a more structured presentation of time-related information. This approach is demonstrated in case studies where users successfully sorted abbreviated day names. Additionally, adding the Category field to the Legend helps visualize how segments are categorized, providing clarity in your reports and addressing the challenges of time-consuming report creation.
-
Review and Finalize: Conduct thorough reviews of your visualizations. Finalizing your settings is essential to ensure that the information is presented accurately and effectively, which is particularly important in an information-rich environment where clarity is paramount. As noted by theblackknight, when calculating percentages for each category after arranging, you will need to adjust your formula to aggregate based on the new column created in the original table.
By mastering these techniques, you can significantly enhance your data presentation capabilities in Power BI, ensuring that your insights are not only accurate but also easily interpretable. Understanding the nuances of Power BI custom sort order will empower you to create more impactful visualizations that resonate with your audience, ultimately driving growth and innovation.
Conclusion
Custom sorting in Power BI is not just a skill—it’s a game changer for data visualization and decision-making. By transcending traditional sorting methods, users can customize their reports to align precisely with their analytical objectives. Understanding the intricacies of implementing custom sorts, including data type compatibility and establishing proper relationships within data models, is essential for overcoming common challenges and ensuring clarity in data representation.
The outlined steps for setting up sort tables, integrating them into data models, and finalizing custom sort settings offer practical guidance that users can readily apply. Highlighting the importance of calculated columns and advanced techniques further emphasizes Power BI’s potential as a robust tool for data analysis. By leveraging these strategies, users not only streamline report creation but also enhance the overall quality of insights derived from their data.
Mastering custom sorting in Power BI empowers users to craft compelling narratives from their data, fostering informed decision-making and operational efficiency in a competitive landscape. By prioritizing these techniques, organizations can transform their approach to data visualization, ensuring that insights resonate with stakeholders and drive growth and innovation.
Frequently Asked Questions
What is the purpose of custom sort order in Power BI?
Custom sort order in Power BI allows users to dictate the arrangement of information in reports and dashboards, enabling a more intuitive presentation that can differ from default alphabetical or numerical organization.
Why is custom sorting important in 2025?
In 2025, the importance of custom sorting has been highlighted by many discussions, as users seek solutions for organizational challenges, particularly with calculated columns, which enhances the efficiency of information visualization.
How does custom sorting improve data visualization?
Custom sorting enhances the quality and clarity of visualizations, making it easier to extract actionable insights for stakeholders, which is crucial in today’s information-rich environment.
What are some common challenges when implementing custom sort order in Power BI?
Key challenges include ensuring compatibility of information types, the absence of necessary sort columns, and managing complex information relationships across multiple tables.
How can users address the issue of incompatible information types?
Users must pay careful attention to detail when organizing text fields, as mismatched information types can lead to unexpected ordering outcomes.
What should users do if the necessary sort columns are missing from their dataset?
Users may need to create additional columns to enable the desired arrangement, which can complicate the preparation process and increase the risk of mistakes.
Why is understanding complex information relationships important for sorting?
Maintaining the integrity of sort orders across interconnected tables is complex, requiring a clear understanding of these relationships to ensure consistent and accurate sorting.
What resources are available for users facing organizational challenges in Power BI?
Microsoft offers a 60-day trial phase of BI Pro, and the BI community shares valuable experiences, tutorials, and tips to help users overcome organizational challenges.
What was a practical example shared by a user regarding custom sorting?
A user noted that custom sorting effectively resolved an issue where months were not displaying in the correct chronological order in their visual.
How can the Category field be utilized in Power BI?
Incorporating the Category field into the Legend can aid in visualizing how segments are categorized, thereby enhancing the clarity of presentations.

