Overview
Creating a Power BI KPI scorecard requires a structured approach that is essential for success. Begin by preparing your data meticulously. This foundational step ensures that the information you work with is both accurate and relevant. Next, select appropriate visuals that not only represent the data effectively but also resonate with your audience’s needs.
Aligning performance indicators with business goals is crucial. This alignment not only enhances the relevance of your KPIs but also drives strategic decision-making. Consider customizing visuals for clarity, as this will improve comprehension and engagement among stakeholders.
Avoiding common pitfalls is vital to ensure effective KPI reporting. By being aware of these challenges, you can enhance operational efficiency and facilitate better outcomes. In conclusion, a well-structured KPI scorecard can serve as a powerful tool for driving performance and achieving business objectives.
Introduction
In the dynamic landscape of business analytics, Key Performance Indicators (KPIs) have become indispensable tools for organizations aiming to measure success and drive informed decision-making. Within the realm of Power BI, these quantifiable metrics not only provide a visual representation of progress but also serve as a compass guiding companies toward their strategic objectives. As the significance of data-driven insights continues to escalate, mastering the effective use of KPIs in Power BI is essential for enhancing operational efficiency and cultivating a culture of accountability.
This article explores the intricacies of KPI implementation, encompassing:
- Preparation
- Visualization techniques
- Best practices
- Real-world applications
By equipping organizations with the knowledge to transform their data into actionable insights, we empower them to drive growth and innovation. Are you ready to leverage KPIs to propel your organization forward?
Understanding Key Performance Indicators (KPIs) in Power BI
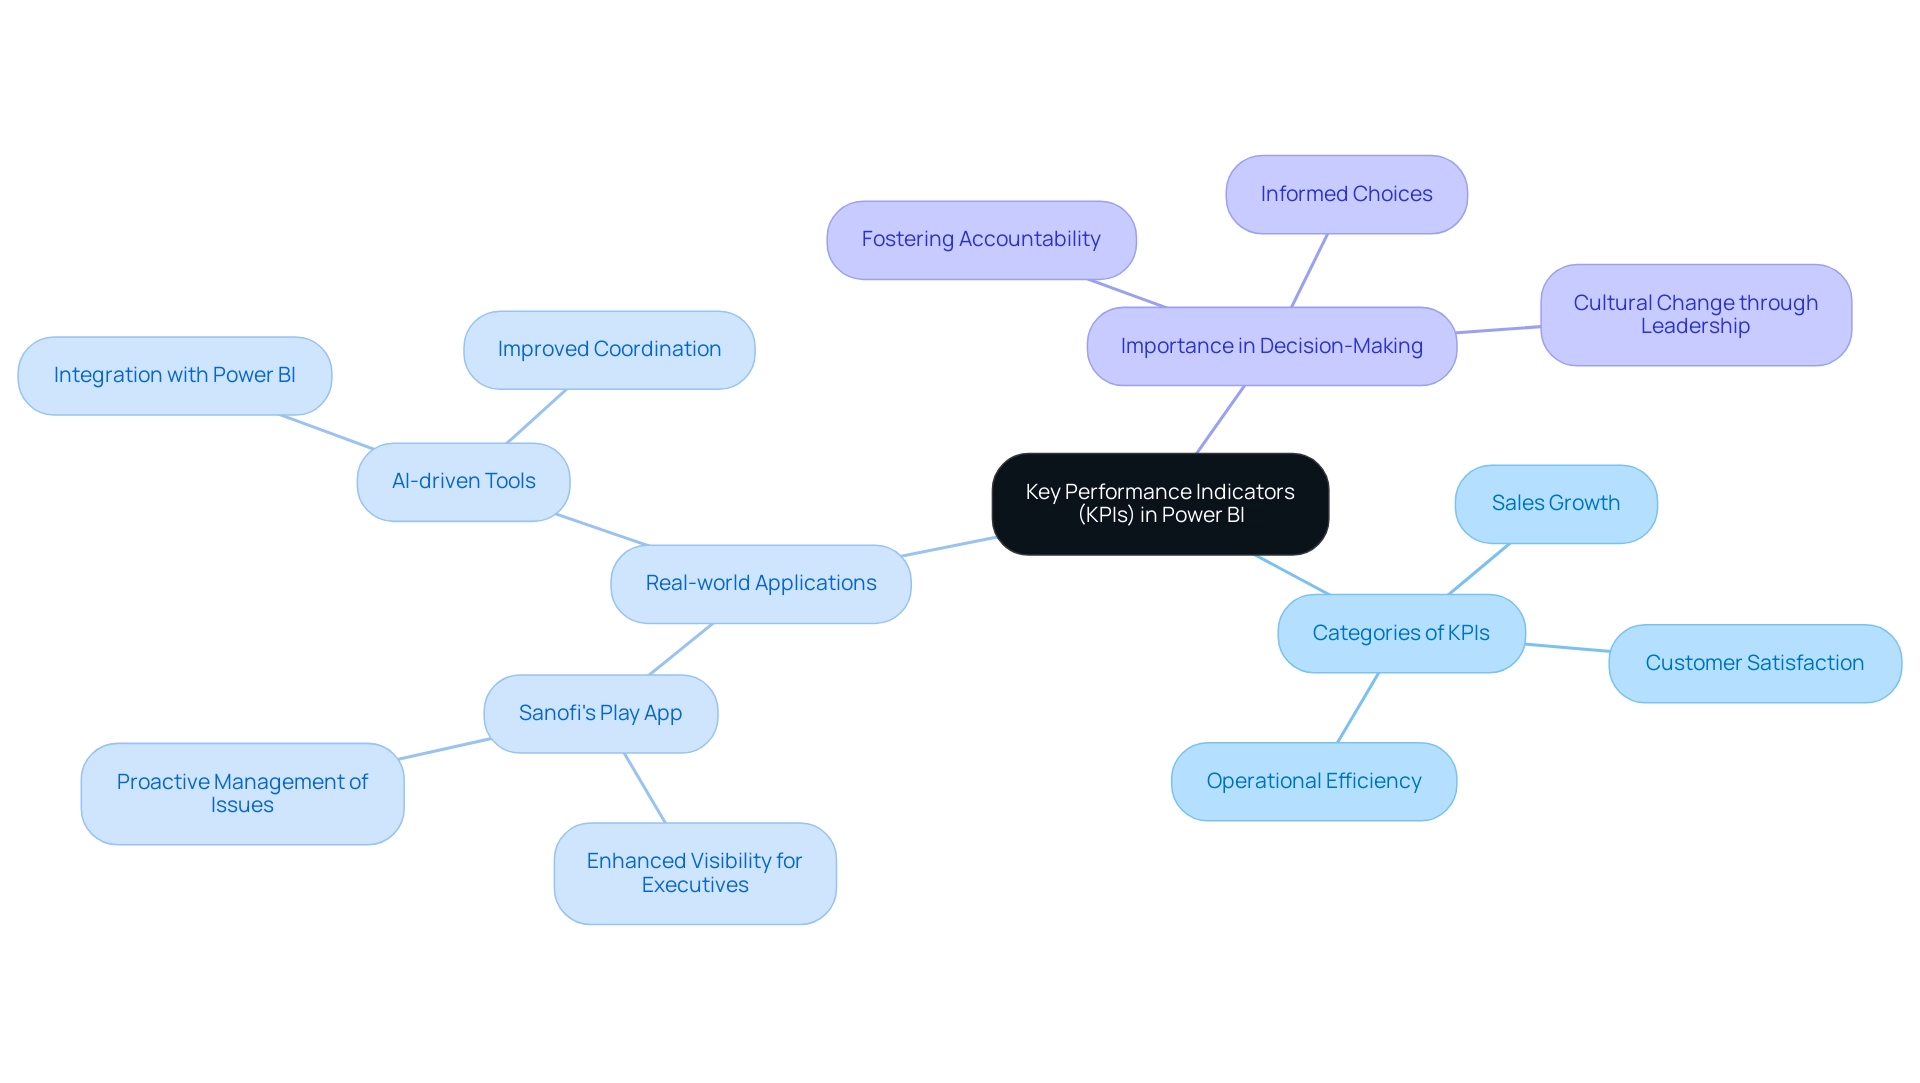
Key Performance Metrics are essential quantifiable measures that enable organizations to assess their outcomes against specific objectives. Within the realm of Power BI, the Power BI KPI scorecard functions as a visual marker, effectively conveying progress toward these goals. For instance, a sales KPI may track actual revenue against set targets, providing immediate insights into performance levels.
In 2025, the importance of key performance indicators in enhancing operational efficiency cannot be overstated. More than half of surveyed leaders prioritize improving the quality of these indicators. This emphasis reflects a broader trend in which organizations increasingly rely on performance indicators for informed decision-making, with a significant percentage of businesses integrating these metrics into their strategic frameworks. As Lorea Lastiri states, “Monitoring this KPI provides the necessary information required to determine what is happening so that you can take the essential steps.”
Understanding the categories of key performance indicators relevant to your organization is crucial for maximizing the capabilities of the Power BI KPI scorecard. Common examples include sales growth, customer satisfaction scores, and operational efficiency metrics. By establishing clear and relevant performance indicators, organizations can focus their efforts on what truly matters, ensuring that data-driven decisions align with overarching strategic goals.
Real-world applications of KPIs showcase their impact on business performance. For example, Sanofi’s implementation of the Play app has granted approximately 10,000 executives enhanced visibility into KPI information. This AI-driven tool connects internal information with personalized insights, fostering improved dialogue and productivity within teams.
The result has been a proactive approach to managing potential issues, such as out-of-stock situations and ambitious sales forecasts.
Industry leaders emphasize that effective KPI measurement is vital for operational success. Senior management must lead by example to cultivate cultural change and demonstrate the value of smart metrics in decision-making. Monitoring key performance indicators not only provides essential information for decision-making but also nurtures a culture of accountability and performance within organizations.
By leveraging Power BI to visualize and track KPIs, businesses can create a comprehensive Power BI KPI scorecard alongside innovative tools like EMMA RPA and Microsoft Power Automate from Creatum GmbH. This transforms raw information into actionable insights, driving growth and innovation while enhancing operational efficiency through automation. Furthermore, RPA solutions address task repetition fatigue and staffing shortages, allowing teams to focus on strategic initiatives rather than mundane tasks. Integrating AI solutions complements these efforts, providing advanced analytics and insights that further enhance operational efficiency.
Preparing Your Data for Effective KPI Visualization
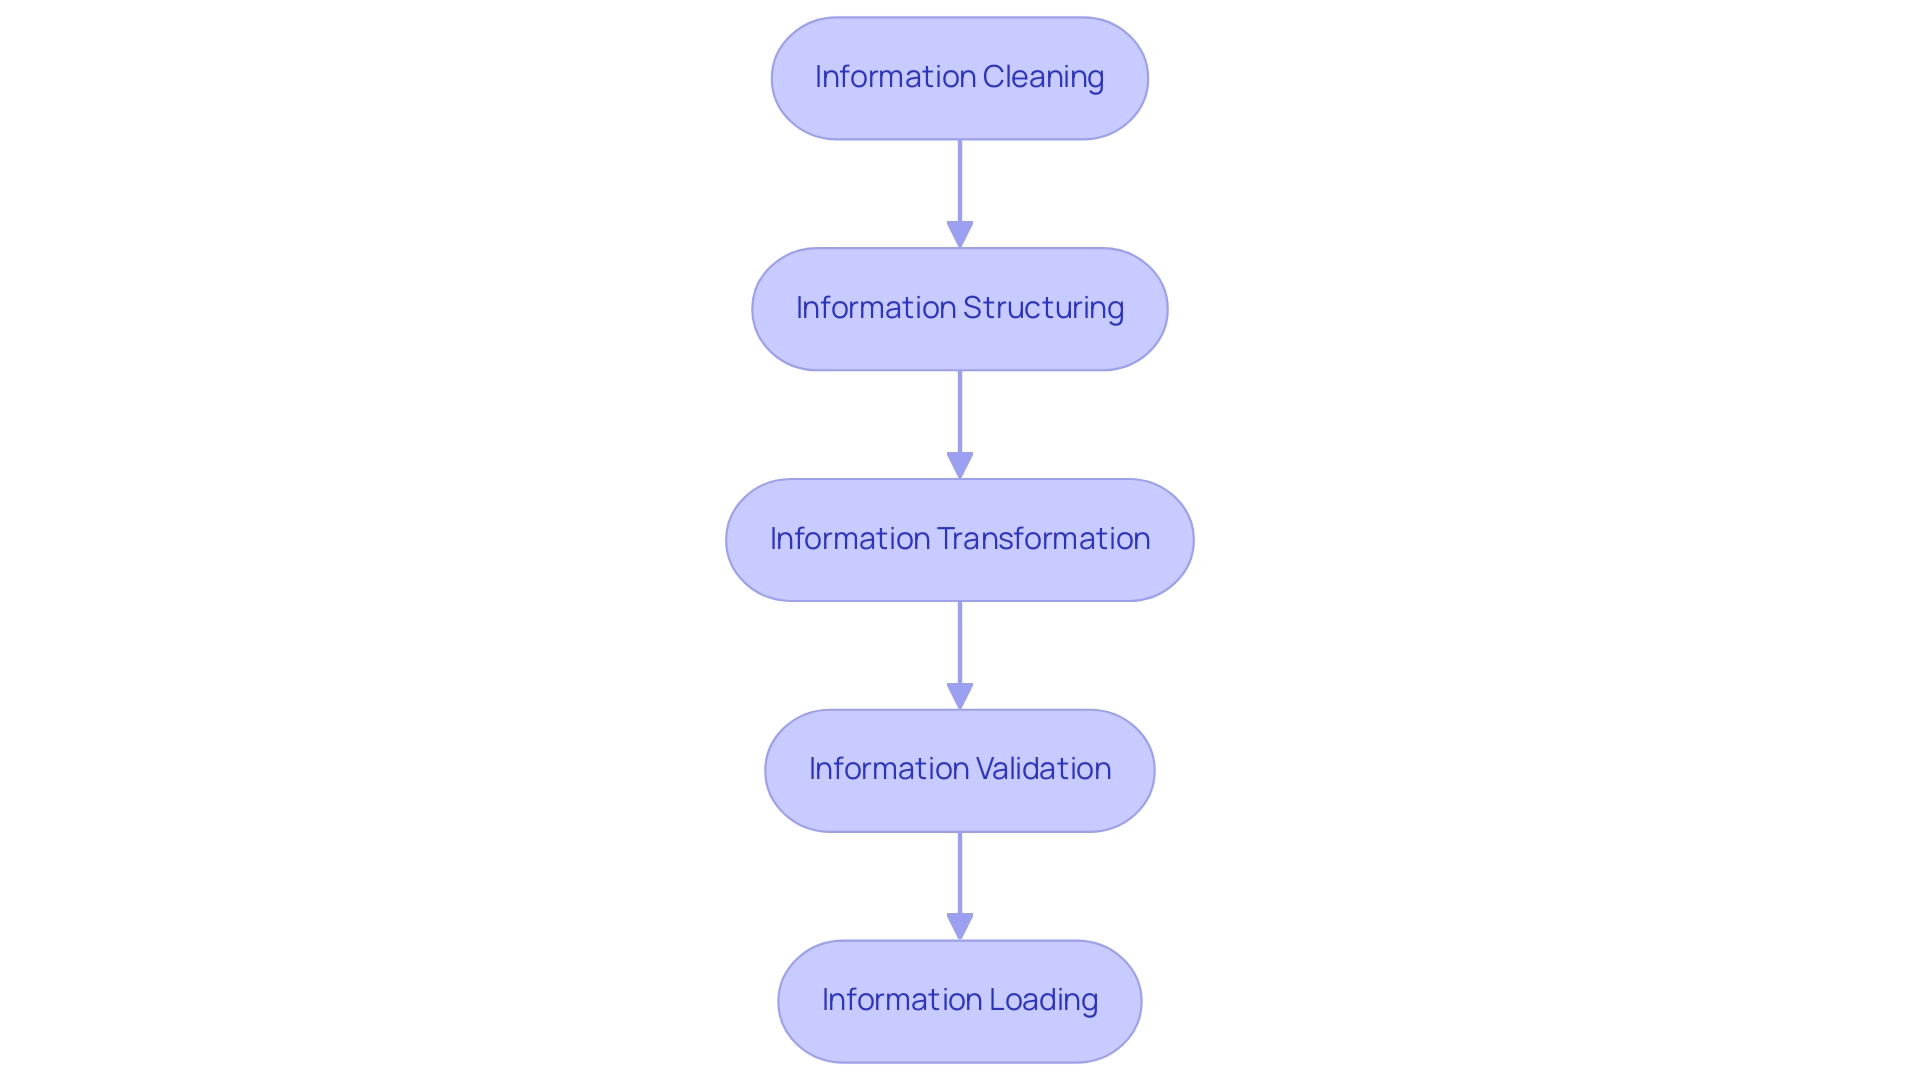
To effectively prepare your information for KPI visualization in Power BI, adhere to these critical steps:
-
Information Cleaning: Begin by eliminating duplicates, addressing missing values, and ensuring uniformity in formats. Utilizing Power Query can significantly streamline this process, making it more efficient and less prone to errors. By automating these manual tasks through Robotic Process Automation (RPA), you can further enhance efficiency and reduce the likelihood of errors.
-
Information Structuring: Organize your information into well-defined tables that accurately represent the relationships among various metrics. This frequently entails the creation of fact and dimension tables, which are crucial for effective analysis. RPA can assist in structuring information by automating the organization of these tables, ensuring consistency and accuracy.
-
Information Transformation: Implement necessary transformations to your information, such as aggregating sales figures on a monthly basis or calculating year-over-year growth rates. These transformations are vital for deriving meaningful insights from your information. RPA can automate repetitive transformation tasks, allowing your team to focus on strategic analysis.
-
Information Validation: It is crucial to verify that your information accurately reflects the metrics you aim to track. Cross-referencing with source information ensures the integrity and reliability of your details, which is essential for effective reporting on the Power BI KPI scorecard. Automating validation processes with RPA can save time and enhance accuracy.
-
Information Loading: Finally, load the cleaned and structured information into Power BI, ensuring it is primed for analysis and visualization. This step is critical as it sets the foundation for generating accurate and actionable insights. RPA can facilitate the loading process, ensuring that information is consistently updated and ready for analysis.
By diligently following these steps and leveraging RPA, you can ensure that your KPIs are effectively tracked using a Power BI KPI scorecard, ultimately leading to more precise insights and enhanced operational efficiency. The challenges posed by manual workflows can significantly hinder your preparation efforts, making the integration of RPA even more essential. In fact, statistics indicate that a significant percentage of organizations are now utilizing Power Query for information preparation, underscoring its importance in modern practices.
As the AI market continues to expand, with projections reaching $738.80 billion by 2030, the emphasis on high-quality information becomes even more paramount for informed decision-making and strategic growth. At Creatum GmbH, we understand these challenges and are committed to providing solutions that enhance your operational efficiency.
Step-by-Step Guide to Creating KPI Visuals in Power BI
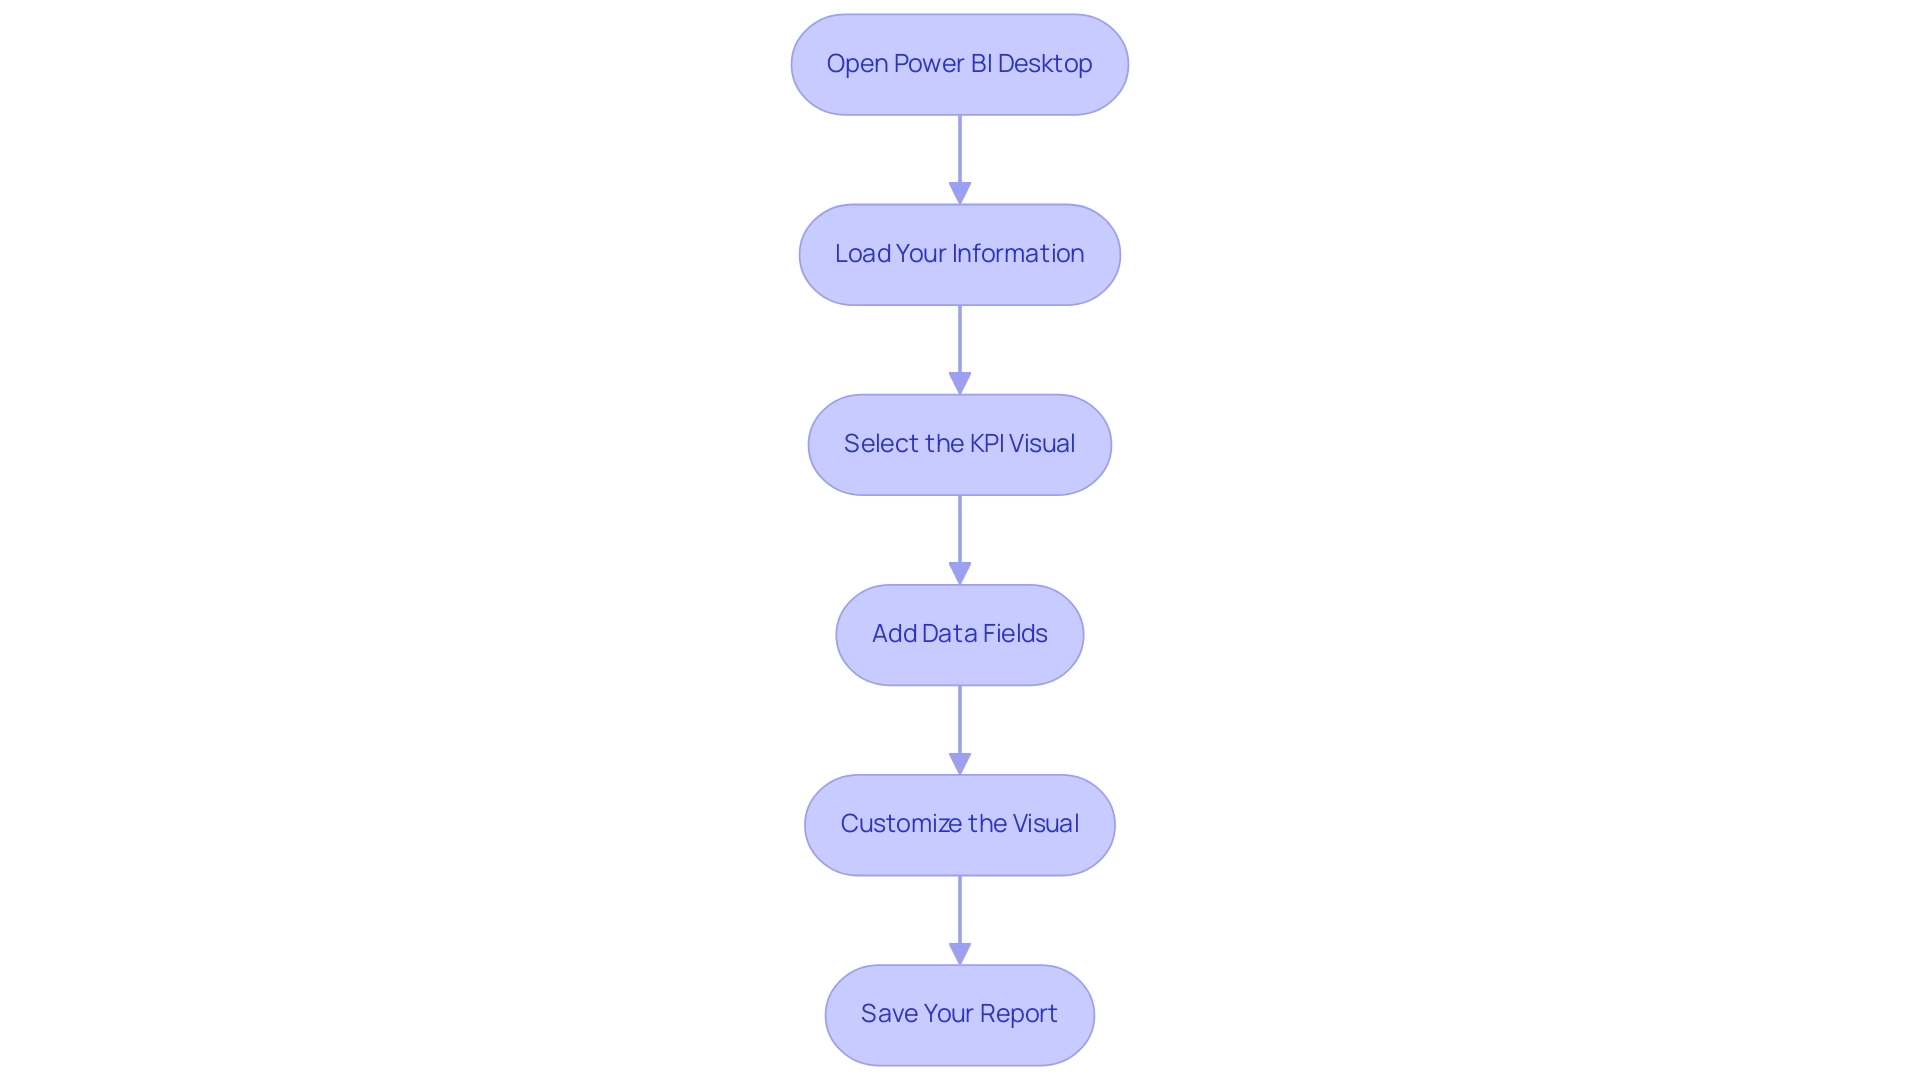
Creating KPI visuals in Power BI, particularly a Power BI KPI scorecard, is a straightforward process that can significantly enhance your analysis capabilities and drive operational efficiency. Follow these steps to develop effective KPI visuals that deliver immediate insights into your business performance:
- Open Power BI Desktop: Start by launching the application and opening your existing report or creating a new one.
- Load Your Information: Ensure that your prepared information is loaded into Power BI. Quality and consistency are critical for reliable KPI dashboards, especially when utilizing a Power BI KPI scorecard. Acceldata’s Observability Platform highlights the importance of precise information in powering your dashboards. This is crucial for overcoming challenges such as inconsistencies that can lead to confusion and mistrust in the insights presented. Implementing a governance strategy can help maintain data integrity and consistency across reports.
- Select the KPI Visual: In the Visualizations pane, choose the KPI visual icon to begin creating your visualization.
- Add Data Fields: Drag and drop the relevant fields into the KPI visual. You will need to include:
- Value: This represents the actual performance measure (e.g., total sales).
- Target: Define the goal or target value (e.g., sales target).
- Trend: Incorporate a measure that illustrates the trend over time (e.g., sales growth).
- Customize the Visual: Tailor the formatting options to enhance readability. For instance, use color coding to indicate performance levels—green for on-target results and red for those falling below expectations. This customization aligns with current best practices for KPI visualization in 2025, ensuring clarity and impact. Additionally, integrating RPA solutions can automate repetitive tasks in report generation, allowing your team to focus on analysis rather than time-consuming report creation. It’s also essential to ensure that your reports provide actionable guidance to stakeholders, helping them understand the next steps based on the information presented.
- Save Your Report: After finalizing your visual, save your report to secure your work.
By adhering to these steps, you can create a Power BI KPI scorecard that delivers immediate insights and supports strategic decision-making. A significant 70% of businesses acknowledge the importance of visualization in shaping their strategies, as noted in the case study titled “Visualization and Strategic Business Decisions.” This underscores the value of effective Power BI KPI scorecard dashboards in driving growth and success. Furthermore, employing visualization tools has been demonstrated to boost client engagement and comprehension, with 65% of companies indicating enhanced results in their presentations.
As Walmart demonstrates, using drill-downs to analyze regional sales helps identify underperforming areas for targeted interventions. Highlighting the personalization of KPI visuals will further enable your organization to utilize information effectively. Creatum GmbH is committed to helping businesses navigate these challenges and maximize their data-driven insights.
Exploring Different Types of KPI Visuals in Power BI
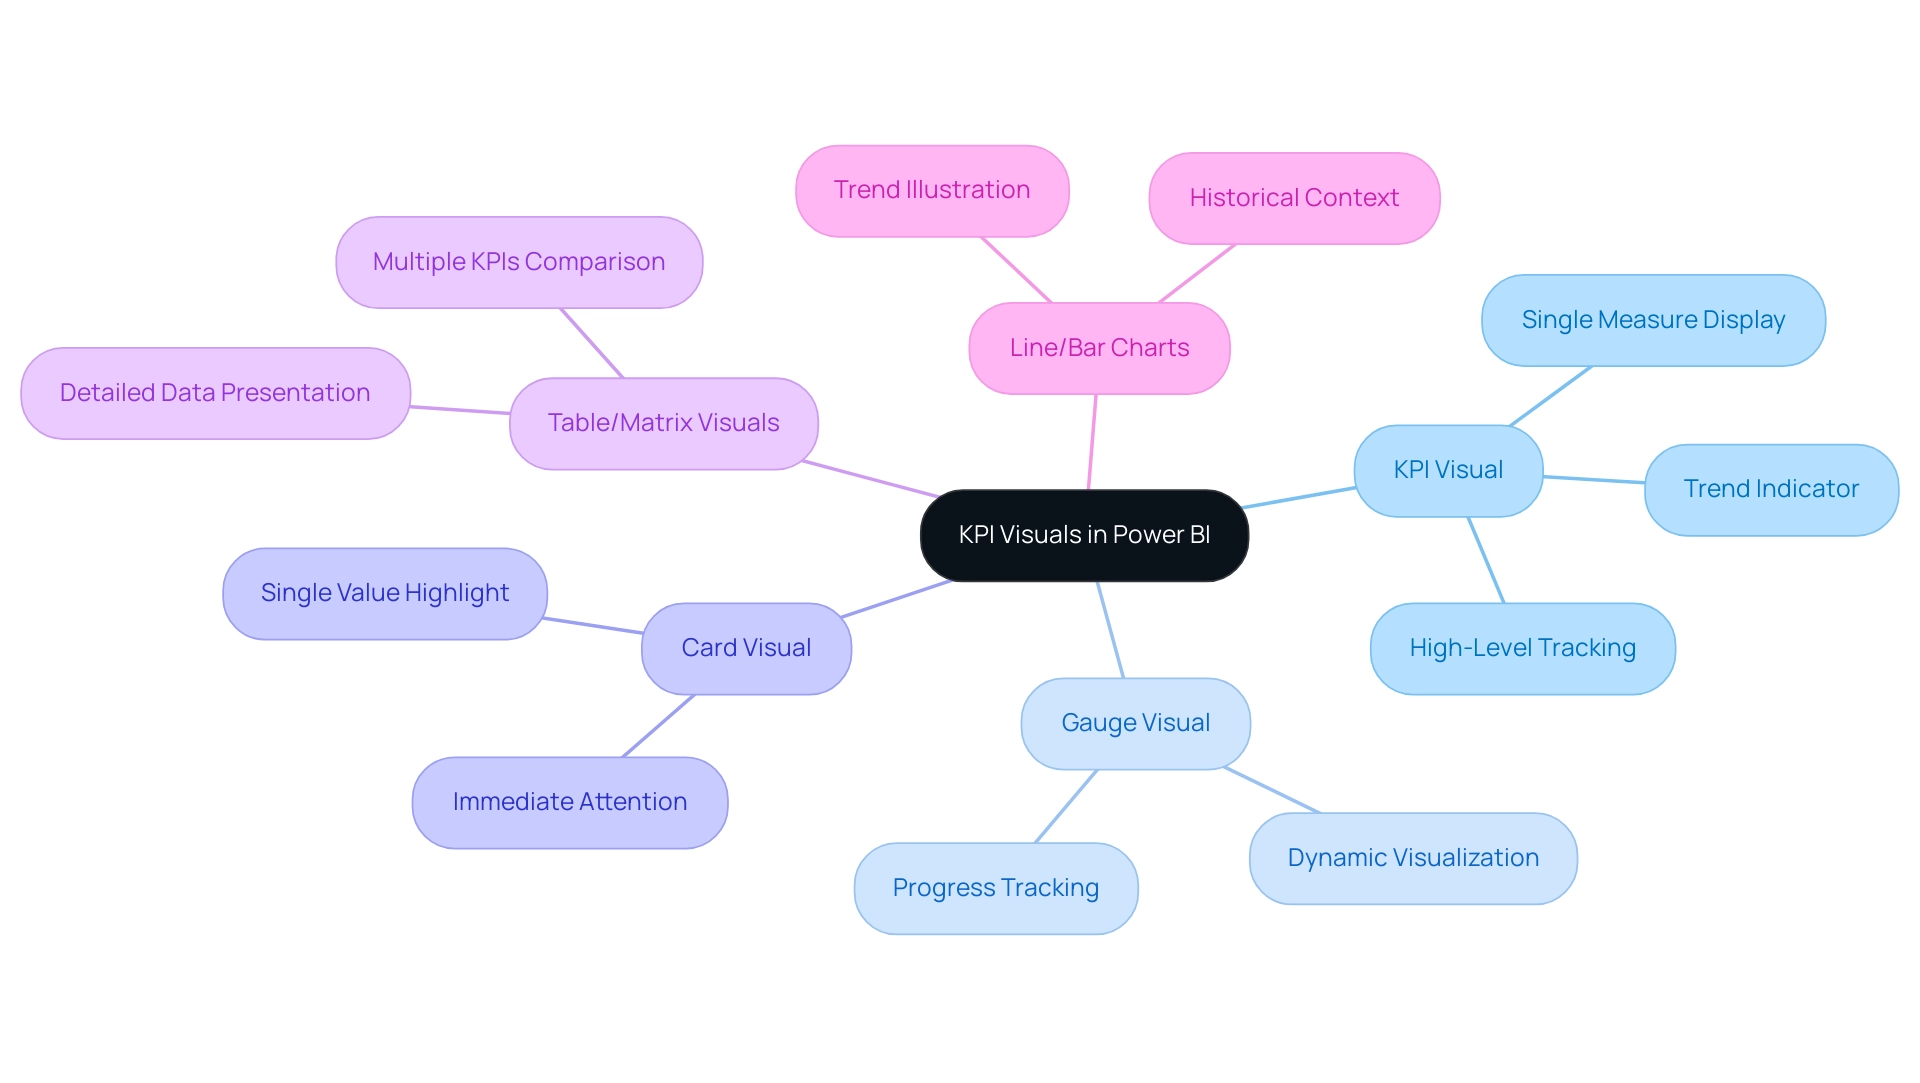
The Power BI KPI scorecard offers a diverse array of KPI visuals, each tailored to meet specific data presentation requirements, thereby enhancing the analytical capabilities of organizations. Let’s explore the various types of KPI visuals available:
-
KPI Visual: This visual displays a single measure against a predefined target, often accompanied by a trend indicator. It is particularly effective for high-level tracking of results, allowing stakeholders to quickly assess whether objectives are being met.
-
Gauge Visual: Representing progress toward a goal as a dial, the gauge visual provides a dynamic way to visualize performance against targets. This format is particularly useful for illustrating how close an organization is to achieving its objectives, making it easier to identify areas needing attention.
-
Card Visual: The card visual prominently showcases a single value, such as total sales or customer count. This simplicity makes it an excellent choice for highlighting key metrics that require immediate attention, ensuring that critical information points stand out in reports.
-
Table and Matrix Visuals: These visuals facilitate a more detailed presentation of data, allowing users to display multiple KPIs across various categories or time periods. This capability is essential for comprehensive analysis, enabling users to compare metrics side by side.
-
Line and Bar Charts: Although not conventional KPI visuals, line and bar charts can effectively illustrate trends over time, providing essential context to KPI outcomes. By visualizing historical information, organizations can better comprehend trends and make informed forecasts.
Current statistics reveal that daily metrics are calculated for 25%, 50%, and 75% of open report actions, underscoring the significance of choosing the appropriate visual for effective analysis. As organizations increasingly rely on data-driven decision-making, understanding when to use gauge, card, or Power BI KPI scorecard visuals becomes crucial. For instance, gauge visuals are ideal for real-time performance tracking, while card visuals excel in presenting key figures at a glance.
In 2025, the trend in KPI visualization techniques continues to evolve, with a growing emphasis on clarity and user engagement. Organizations are now concentrating on visuals that not only display information but also enhance user interaction and comprehension. The enhanced usage metrics report now encompasses only the last 30 days, reflecting a shift towards more relevant and timely analysis. Organizations that have successfully implemented the Power BI KPI scorecard report enhanced information quality and improved decision-making processes.
A notable case study highlights how businesses overwhelmed by information transformed raw details into actionable insights through effective KPI visualization, driving growth and innovation. By integrating RPA solutions like EMMA RPA and Power Automate from Creatum GmbH, organizations can further streamline their reporting processes, addressing challenges such as time-consuming report creation and data inconsistencies. By carefully exploring these options, users can choose the most effective visual representation for their key performance indicators, ensuring that their reports are not only clear but also impactful.
Best Practices for KPI Reporting in Power BI
Achieving effective KPI reporting in Power BI necessitates the implementation of several best practices:
-
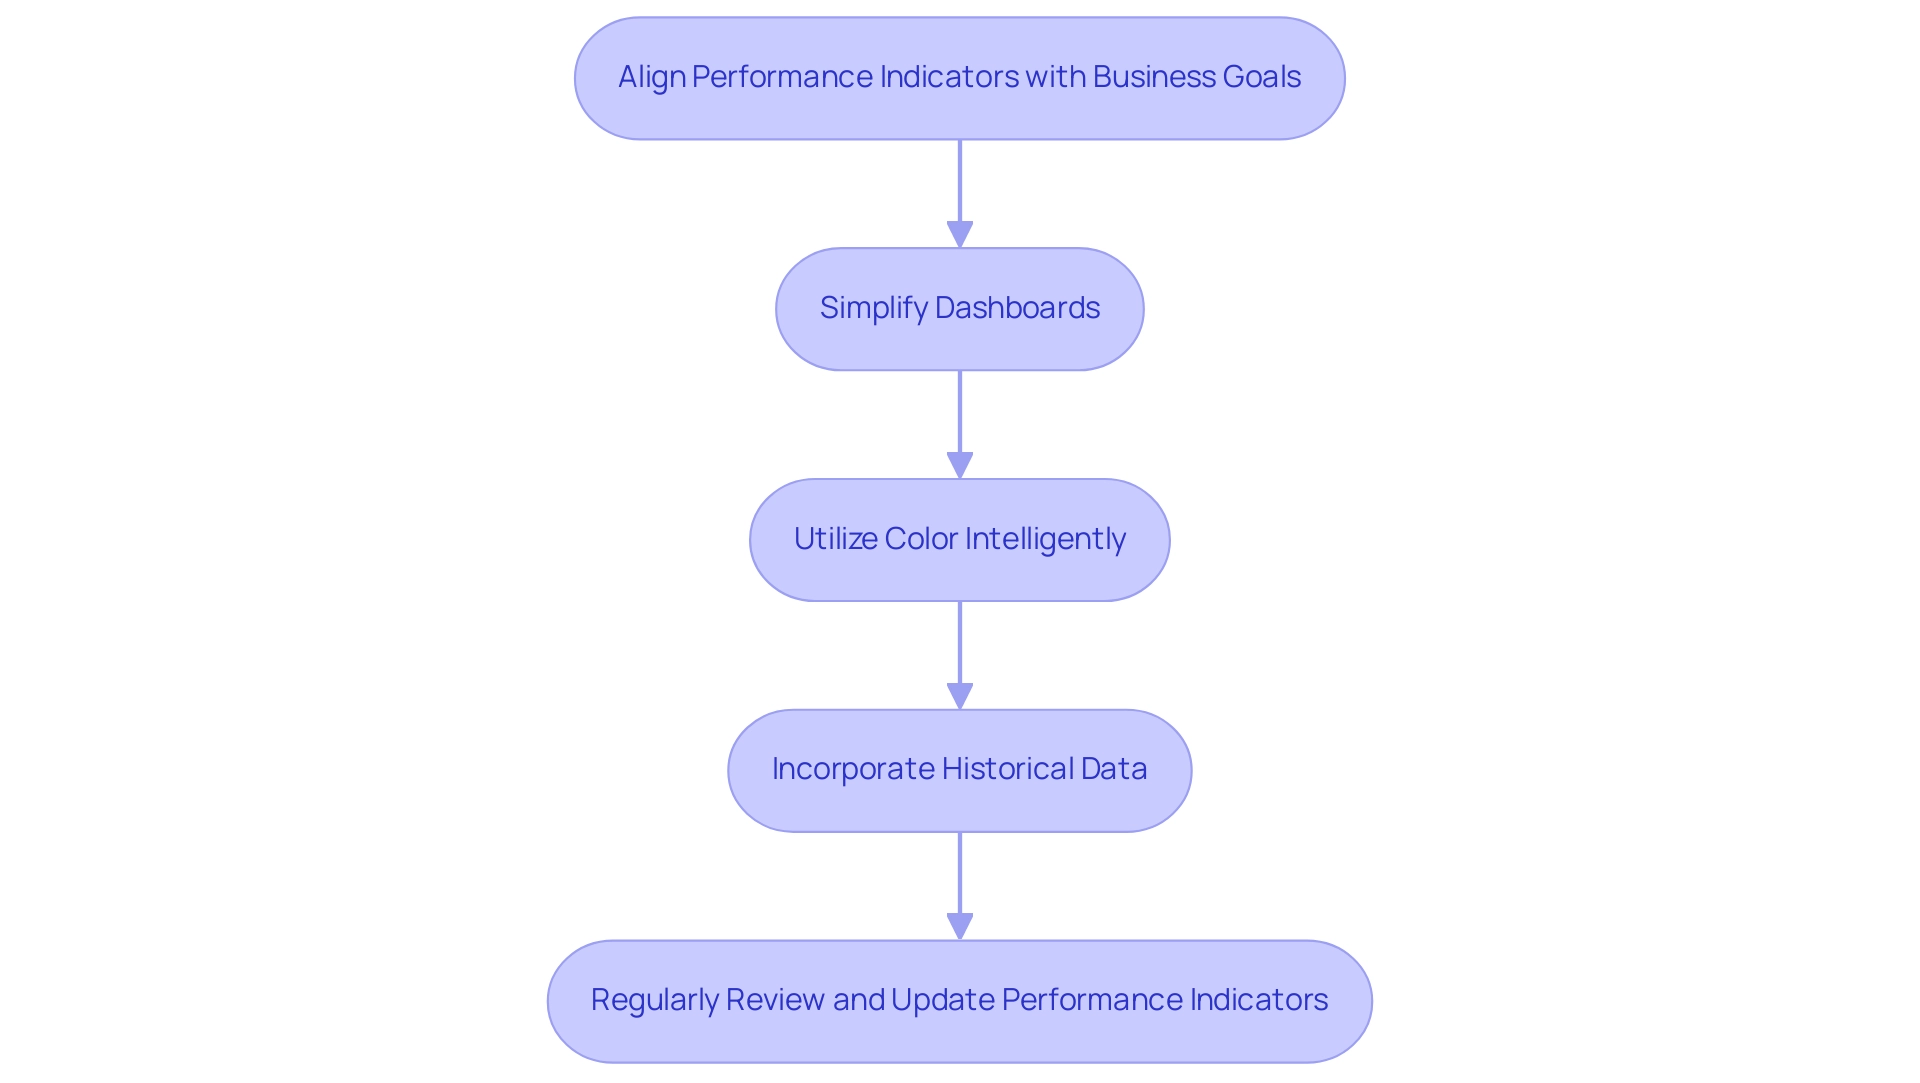
Align Performance Indicators with Business Goals: Ensure the metrics tracked are directly linked to your organization’s strategic objectives. This alignment enhances relevance and drives accountability across teams. As My aptly noted, “Remember, when performance indicators and goals move in unison, success isn’t just a target; it becomes a journey we’re all part of.”
-
Simplify Dashboards: Limit the number of KPIs displayed to maintain clarity. Research shows that organizations simplifying their dashboards for Power BI KPI scorecard reporting experience a significant increase in user engagement and comprehension, allowing stakeholders to focus on critical metrics. Efficient monitoring dashboards enhance KPI understanding and expedite decision-making by presenting information clearly.
-
Utilize Color Intelligently: Employ color coding to represent achievement levels effectively—green for on-target, red for below target. This visual cue facilitates quick understanding and immediate action when necessary.
-
Incorporate Historical Data: Pair historical data or benchmarks with current metrics. This context enables stakeholders to grasp trends and make informed decisions based on past performance.
-
Regularly Review and Update Performance Indicators: As business goals evolve, so should your metrics. Regular assessments of their relevance ensure reporting remains aligned with organizational objectives and responsive to changing conditions. Regular training sessions keep staff informed and skilled in data-driven decision-making, crucial for effective KPI reporting.
By adhering to these best practices, organizations can create KPI reports using a Power BI KPI scorecard that are not only informative but also actionable, ultimately driving better decision-making and operational efficiency. For example, in a case study on Project Management indicators, tracking metrics such as Project Completion Rate and Budget Adherence enabled IT departments to ensure projects were completed on time and within budget, directly supporting business objectives. This illustrates the power of effective KPI alignment in achieving strategic success.
Furthermore, consider leveraging Creatum GmbH’s 3-Day Power BI Sprint to produce professional reports that enhance your analysis capabilities. This service promises to deliver a polished report on a topic of your choice in just three days, allowing your organization to concentrate on growth and innovation. Additionally, this report can serve as a template for future projects, ensuring a professional design from the outset.
Common Pitfalls to Avoid in KPI Scorecard Creation
When developing KPI scorecards in Power BI, it is crucial to be aware of several common pitfalls that can undermine their effectiveness:
-
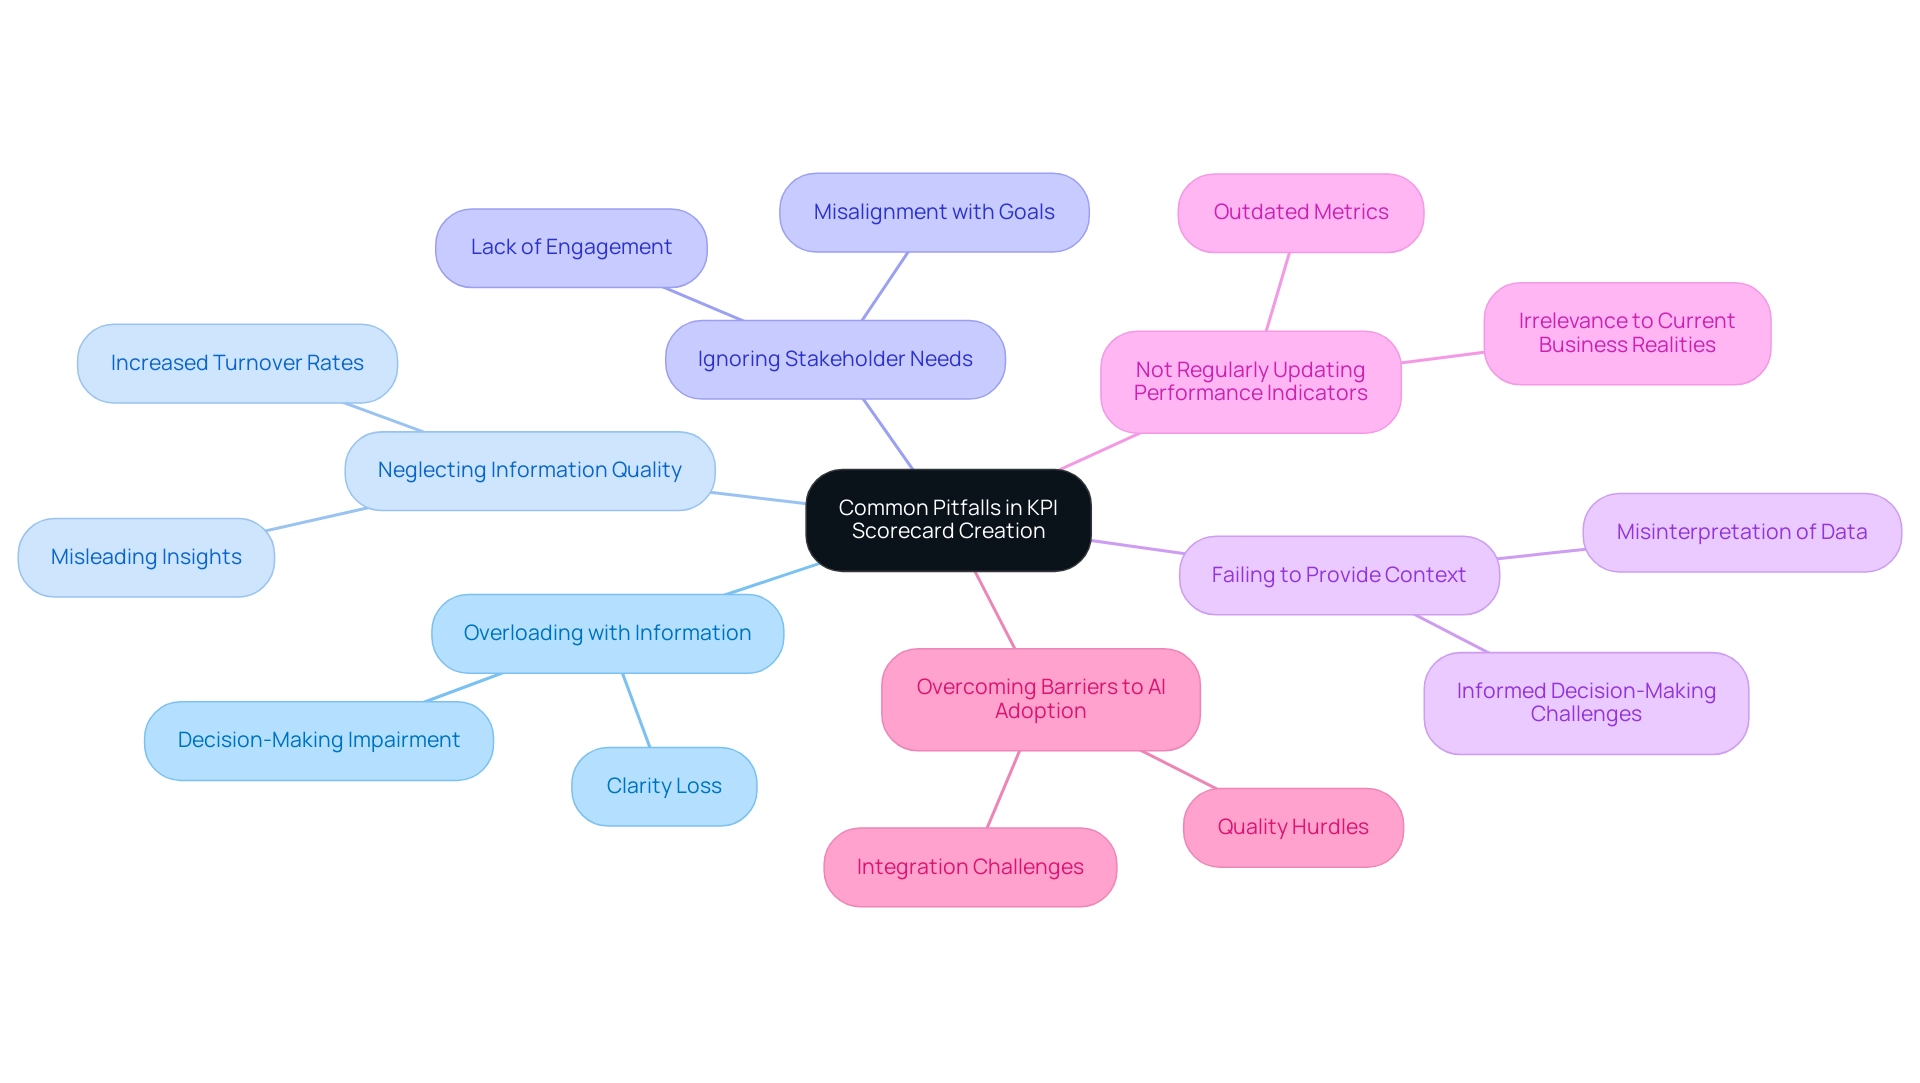
Overloading with Information: Resist the temptation to include an excessive number of key performance indicators in a single scorecard. Concentrating on the most pertinent metrics not only maintains clarity but also enhances decision-making.
-
Neglecting Information Quality: The accuracy and timeliness of the information feeding into your KPIs are paramount. Poor master information quality can lead to misleading insights, negatively impacting morale and productivity, and potentially increasing turnover rates. Organizations often struggle with inconsistent, incomplete, or inaccurate data, leading to inefficient operations and flawed decision-making. Statistics indicate that unaddressed mistakes in KPI management can result in reduced morale, decreased productivity, and high turnover rates.
-
Ignoring Stakeholder Needs: It is essential to tailor your performance indicators to align with the specific needs of your audience. The metrics that resonate with executives may differ significantly from those valued by operational teams, making stakeholder engagement critical. As management expert Peter Drucker famously stated, ‘What gets measured gets done,’ emphasizing the significance of assessing the appropriate performance indicators that align with organizational goals.
-
Failing to Provide Context: Key performance indicators devoid of context can easily be misinterpreted. Always include historical data or benchmarks to provide clarity on performance, ensuring that stakeholders can make informed decisions based on comprehensive insights.
-
Not Regularly Updating Performance Indicators: As business priorities evolve, so too should your performance indicators. Regular reviews and adjustments are necessary to keep them relevant and aligned with organizational goals. Statistics indicate that a significant percentage of organizations fail to update their KPIs regularly, leading to outdated metrics that no longer reflect current business realities. The case study titled “Takeaways on KPI Management” emphasizes the importance of keeping metric logic simple and focusing on tailored metrics that fit the unique context of the product.
-
Overcoming Barriers to AI Adoption: Organizations often view AI projects as time-intensive, costly, and challenging to implement. Poor master information quality can hinder effective AI integration in KPI management, making it essential to address these barriers. By enhancing information quality and understanding the integration process, organizations can leverage AI to improve their Power BI KPI scorecard.
By steering clear of these pitfalls, you can significantly enhance the effectiveness of your KPI scorecards, ensuring they fulfill their intended purpose and drive strategic decision-making. For instance, finance dashboards that monitor metrics such as monthly recurring revenue and churn rates provide actionable insights for adjusting revenue-related KPIs, further illustrating the importance of selecting the right metrics. At Creatum GmbH, we emphasize the need for high-quality data and effective AI integration to optimize your KPI management.
Real-World Applications of KPI Scorecards in Business
KPI scorecards, particularly the Power BI KPI scorecard, are essential tools across various business sectors, enhancing performance monitoring and strategic decision-making. Their applications are manifold:
-
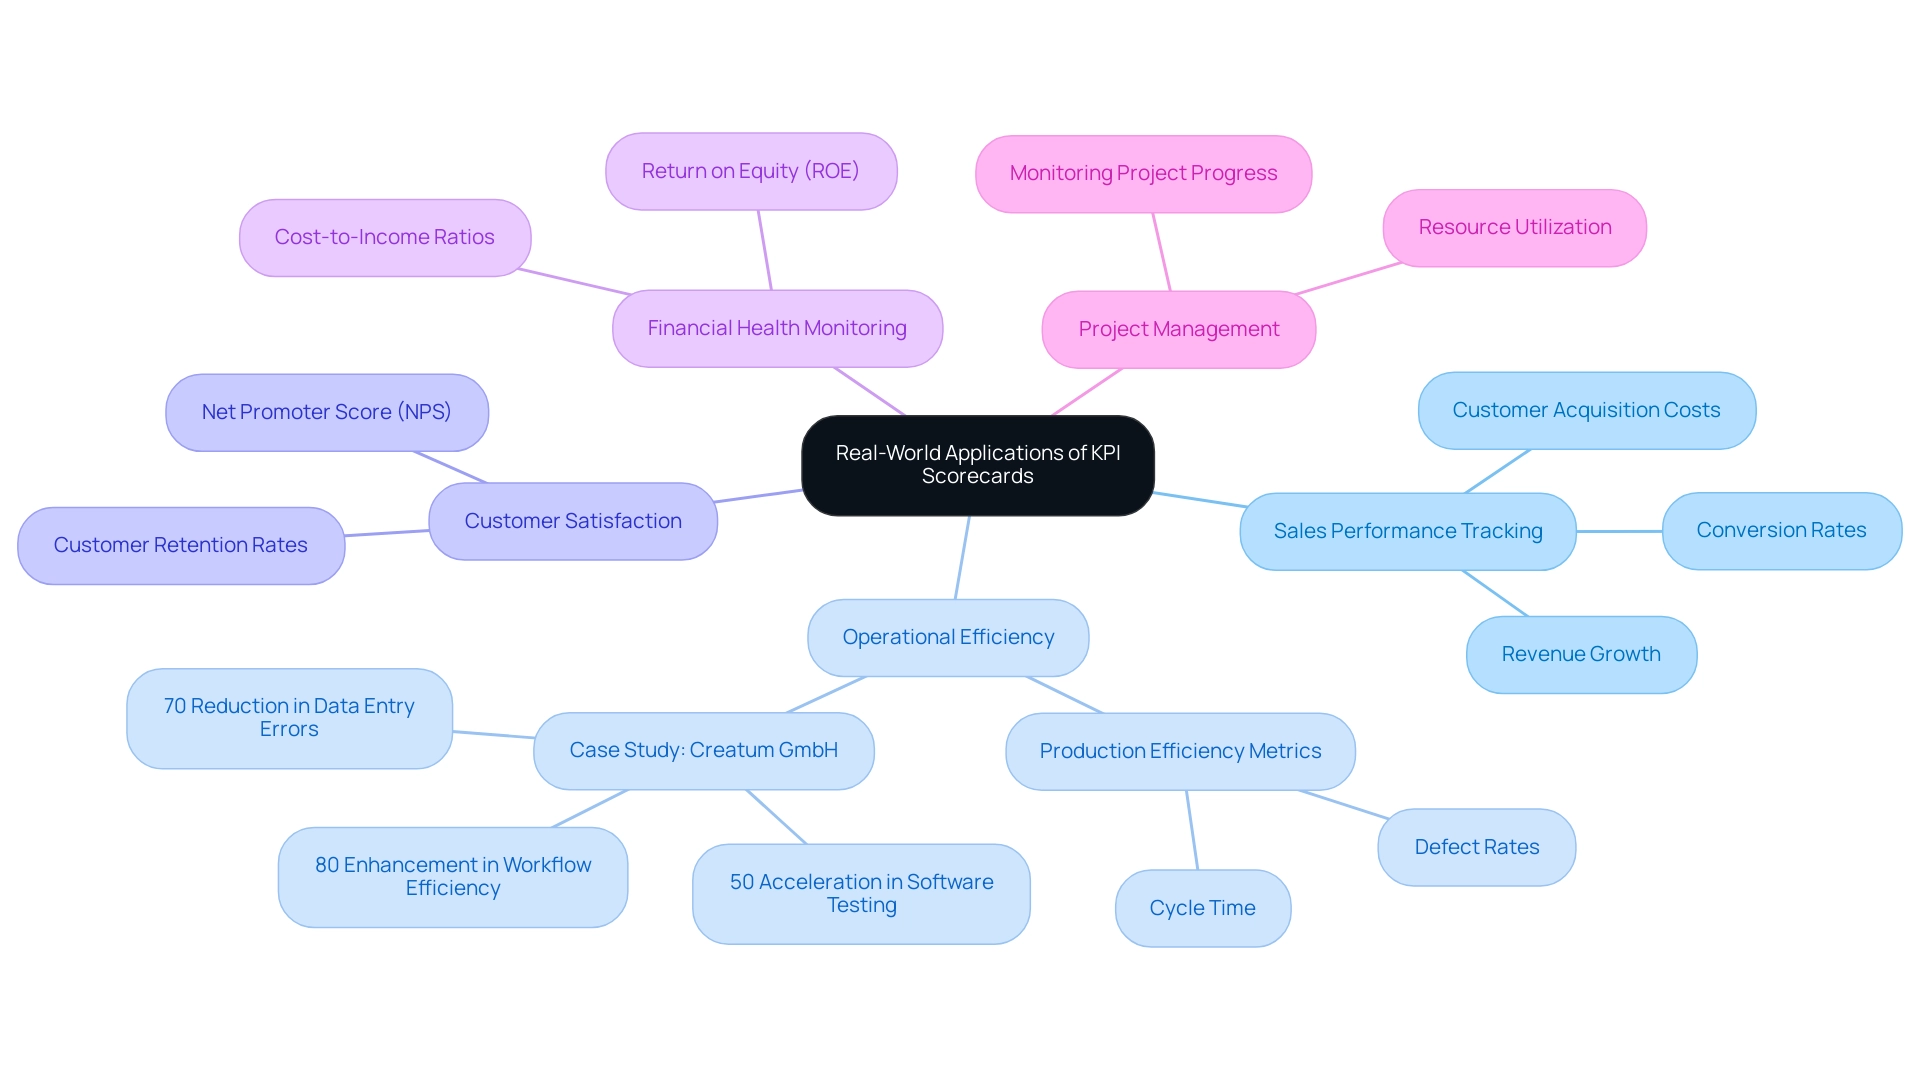
Sales Performance Tracking: Organizations leverage KPI scorecards to assess critical sales metrics, including revenue growth, conversion rates, and customer acquisition costs. This real-time monitoring empowers businesses to swiftly adapt their strategies, optimizing sales outcomes. Notably, integrating application performance indicators into development and marketing plans is crucial for effective strategy execution, as emphasized by industry experts.
-
Operational Efficiency: In manufacturing, companies monitor KPIs related to production efficiency, such as cycle time and defect rates. Identifying inefficiencies allows for targeted improvements that boost overall productivity. A case study of Creatum GmbH illustrates this, where challenges like manual data entry errors, slow software testing, and outdated system integration were resolved through GUI automation. This initiative led to a 70% reduction in data entry errors and a 50% acceleration in software testing, significantly enhancing workflow efficiency by 80%. Remarkably, the ROI was realized within six months, underscoring the solution’s effectiveness.
-
Customer Satisfaction: Service-oriented businesses often rely on metrics like Net Promoter Score (NPS) and customer retention rates to gauge satisfaction and loyalty. These metrics provide valuable insights, enabling organizations to refine their customer engagement strategies.
-
Financial Health Monitoring: Financial institutions track KPIs such as return on equity (ROE) and cost-to-income ratios to evaluate their financial performance and stability. This data-driven approach facilitates informed decisions that support long-term growth.
-
Project Management: KPI scorecards are vital for monitoring project progress against established timelines and budgets. By keeping projects on track, organizations ensure efficient resource utilization and the achievement of objectives.
In 2025, statistics reveal that a significant percentage of businesses utilize KPI scorecards for sales tracking, highlighting their role in driving operational efficiency. For instance, the average number of views to installs serves as a quantitative measure of KPI tracking success, illustrating the effectiveness of app listings. Case studies indicate that organizations employing customized technology solutions for KPI tracking can automate data gathering and obtain real-time insights, ultimately enhancing their ability to evaluate results against strategic objectives.
As Jonas Kurzweg, Growth Lead, states, “Tracking app KPIs should be integrated into your development and marketing plans, including which success metrics and mobile efficiency metrics are deemed the most valuable or important.” By effectively leveraging Power BI KPI scorecards, businesses can transform their monitoring processes and make data-driven decisions that foster growth and innovation, particularly in the context of rapidly evolving AI landscapes where Robotic Process Automation (RPA) can further streamline workflows.
Advanced Customization Techniques for Power BI KPIs
To effectively customize your KPI visuals in Power BI, consider implementing the following advanced techniques:
-
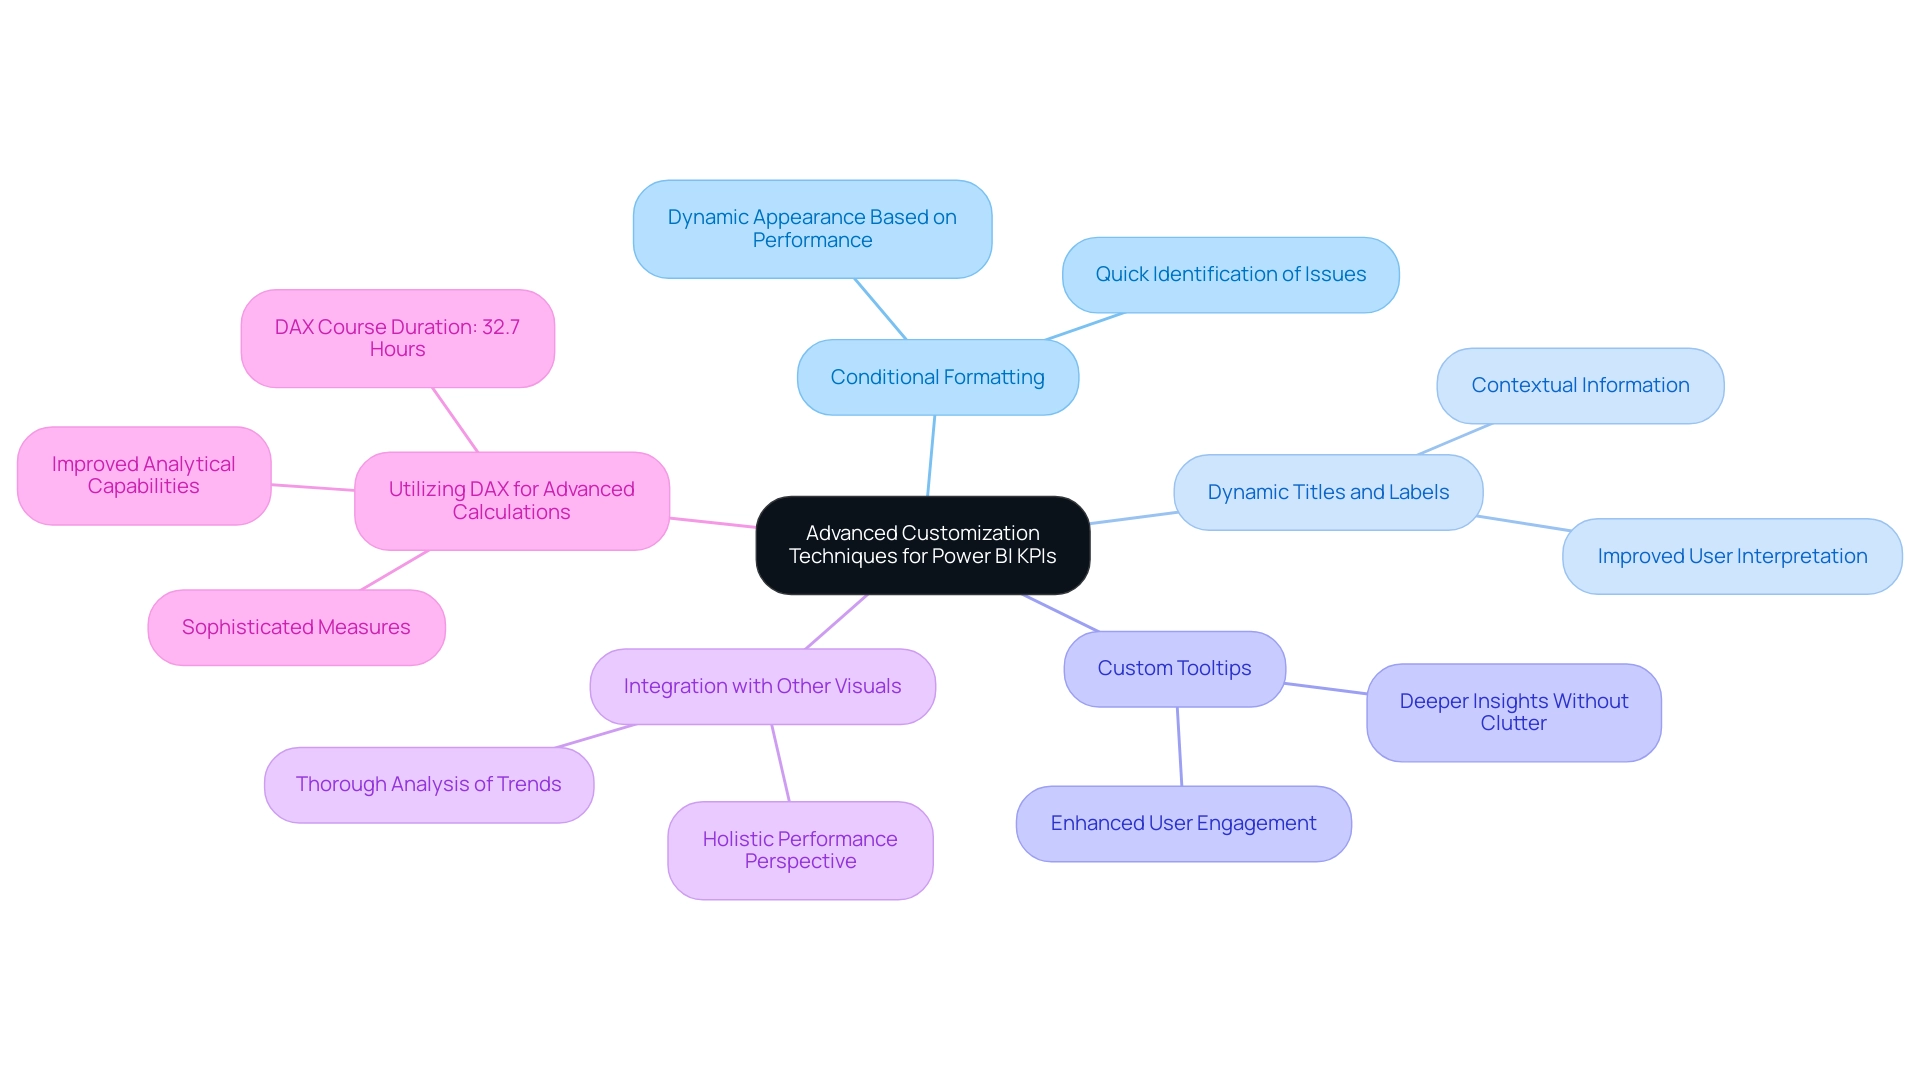
Conditional Formatting: Leverage conditional formatting to dynamically alter the appearance of KPI visuals based on performance thresholds. This technique allows for quick identification of areas that require immediate attention, enhancing the decision-making process and aligning with the principles of Business Intelligence.
-
Dynamic Titles and Labels: Implement dynamic titles that adjust according to the selected filters or slicers. This feature offers essential context to the displayed KPIs, ensuring that users can easily interpret the information in relation to their specific queries, thus addressing challenges in leveraging insights from Power BI dashboards.
-
Custom Tooltips: Improve user engagement by incorporating custom tooltips that reveal additional information when users hover over KPI visuals. This not only enhances the user experience but also enables deeper insights without cluttering the visual space, making the information more actionable.
-
Integration with Other Visuals: Combine KPI visuals with complementary visual types, such as bar charts or line graphs. This integration provides a holistic perspective of performance metrics, enabling a more thorough analysis and comprehension of trends, which is essential for effective reporting.
-
Utilizing DAX for Advanced Calculations: Harness the power of DAX (Data Analysis Expressions) to create sophisticated measures that enhance the insights derived from your KPIs. With the average time to complete a DAX course being approximately 32.7 hours, investing in this knowledge can significantly elevate your analytical capabilities. As Joleen Bothma, a Data Science Consultant, notes, “Additionally, you could configure the settings for import-mode datasets in the Power BI Service to refresh more frequently,” which can further improve the efficiency of your KPI visuals.
By applying these advanced customization techniques, you can develop visuals for the Power BI KPI scorecard that are not only informative but also engaging and tailored to meet the specific needs of your organization. For instance, case studies have shown that organizations utilizing Power BI’s automated refresh and scheduled reporting features have significantly improved their efficiency, ensuring that teams have access to real-time insights for evidence-based decision-making. Adopting these strategies will enable your team to utilize information effectively, driving operational excellence.
Additionally, advanced analytics in Power BI uses AI and machine learning to identify patterns and forecast trends, further enhancing decision-making capabilities. Furthermore, integrating Power Automate can streamline workflow automation, providing a risk-free ROI assessment and professional execution, ultimately supporting your operational efficiency goals.
Moreover, consider leveraging the ‘3-Day Power BI Sprint’ for rapid report creation and the ‘General Management App’ for comprehensive management and smart reviews, which can further enhance your data reporting capabilities.
Conclusion
Mastering Key Performance Indicators (KPIs) in Power BI is essential for organizations aiming to enhance operational efficiency and make informed, data-driven decisions. This article has illuminated the critical aspects of KPI implementation, starting with the vital preparation and cleaning of data, and progressing to effective visualization techniques that convert raw data into valuable insights. By emphasizing best practices, organizations can align their KPIs with strategic objectives, fostering a culture of accountability and performance.
Furthermore, exploring various types of KPI visuals underscores the significance of selecting the appropriate format for impactful data analysis. From straightforward card visuals to dynamic gauge displays, each type fulfills a distinct role in presenting performance metrics. Moreover, understanding common pitfalls in KPI scorecard creation empowers organizations to avoid mistakes that could compromise their reporting efforts, ensuring that the insights gained are both accurate and actionable.
Real-world applications of KPI scorecards demonstrate their versatility across a range of sectors, from tracking sales performance to enhancing operational efficiency and customer satisfaction. As organizations increasingly depend on these metrics, integrating advanced customization techniques in Power BI will elevate analytical capabilities, enabling deeper insights and improved decision-making.
In conclusion, the effective use of KPIs in Power BI transcends mere performance tracking; it establishes a robust framework that supports strategic growth and innovation. By leveraging these insights, organizations can adeptly navigate the complexities of the modern business landscape and drive sustained success. Now is the time to harness the power of KPIs and transform data into a strategic asset that propels organizations toward their goals.
Frequently Asked Questions
What are Key Performance Metrics and their importance in organizations?
Key Performance Metrics are quantifiable measures that enable organizations to assess their outcomes against specific objectives. They are essential for enhancing operational efficiency and informed decision-making.
How does Power BI facilitate the tracking of Key Performance Indicators (KPIs)?
Power BI uses a KPI scorecard as a visual tool to convey progress toward goals, such as tracking actual revenue against set sales targets, providing immediate insights into performance levels.
Why is there a growing emphasis on improving the quality of Key Performance Indicators?
More than half of surveyed leaders prioritize improving the quality of KPIs, reflecting a trend where organizations increasingly rely on these metrics for informed decision-making, integrating them into their strategic frameworks.
What are some common categories of Key Performance Indicators?
Common examples of KPIs include sales growth, customer satisfaction scores, and operational efficiency metrics.
Can you provide an example of a real-world application of KPIs?
Sanofi’s implementation of the Play app has provided approximately 10,000 executives with enhanced visibility into KPI information, improving dialogue and productivity within teams and proactively managing potential issues.
What role does senior management play in effective KPI measurement?
Senior management must lead by example to cultivate a culture of accountability and demonstrate the value of smart metrics in decision-making.
How can organizations leverage Power BI and other tools to enhance operational efficiency?
By using Power BI to visualize KPIs alongside tools like EMMA RPA and Microsoft Power Automate, businesses can transform raw information into actionable insights, driving growth and addressing task repetition fatigue.
What are the critical steps to prepare information for KPI visualization in Power BI?
The steps include Information Cleaning, Information Structuring, Information Transformation, Information Validation, and Information Loading.
How can Robotic Process Automation (RPA) enhance the preparation of KPI information?
RPA can automate manual tasks involved in cleaning, structuring, transforming, validating, and loading information, leading to increased efficiency and reduced errors.
What is the significance of high-quality information in the context of AI and business growth?
As the AI market expands, high-quality information is crucial for informed decision-making and strategic growth, underscoring the need for effective KPI tracking and management.

