Overview
This article explores the effective integration of R with Power BI, aimed at enhancing data analysis and visualization capabilities. By mastering both tools, users can harness R’s advanced statistical methods and custom visualizations alongside Power BI’s user-friendly interface. This powerful combination not only improves decision-making but also boosts operational efficiency.
Consider how your organization currently approaches data analysis. Are you utilizing the full potential of R and Power BI together? By leveraging these tools, you can transform your data insights into actionable strategies that drive success.
Ultimately, integrating R with Power BI empowers users to make informed decisions swiftly. The synergy between R’s analytical strength and Power BI’s accessibility leads to a more efficient workflow and better outcomes. Embrace this integration to elevate your data analysis capabilities.
Introduction
In the realm of data analysis, the integration of R and Power BI stands out as a transformative strategy for organizations aiming to enhance their decision-making processes. R, renowned for its robust statistical capabilities, complements Power BI’s powerful visualization tools, creating a synergy that converts raw data into actionable insights.
As businesses navigate an increasingly data-driven landscape, mastering these tools effectively becomes imperative. This article explores the unique strengths of R and Power BI, providing insights into their integration, practical applications, and advanced techniques that can unlock their full potential.
By harnessing these tools, organizations can streamline their data analysis processes, driving innovation and growth in a rapidly evolving marketplace.
Understanding R and Power BI: A Primer
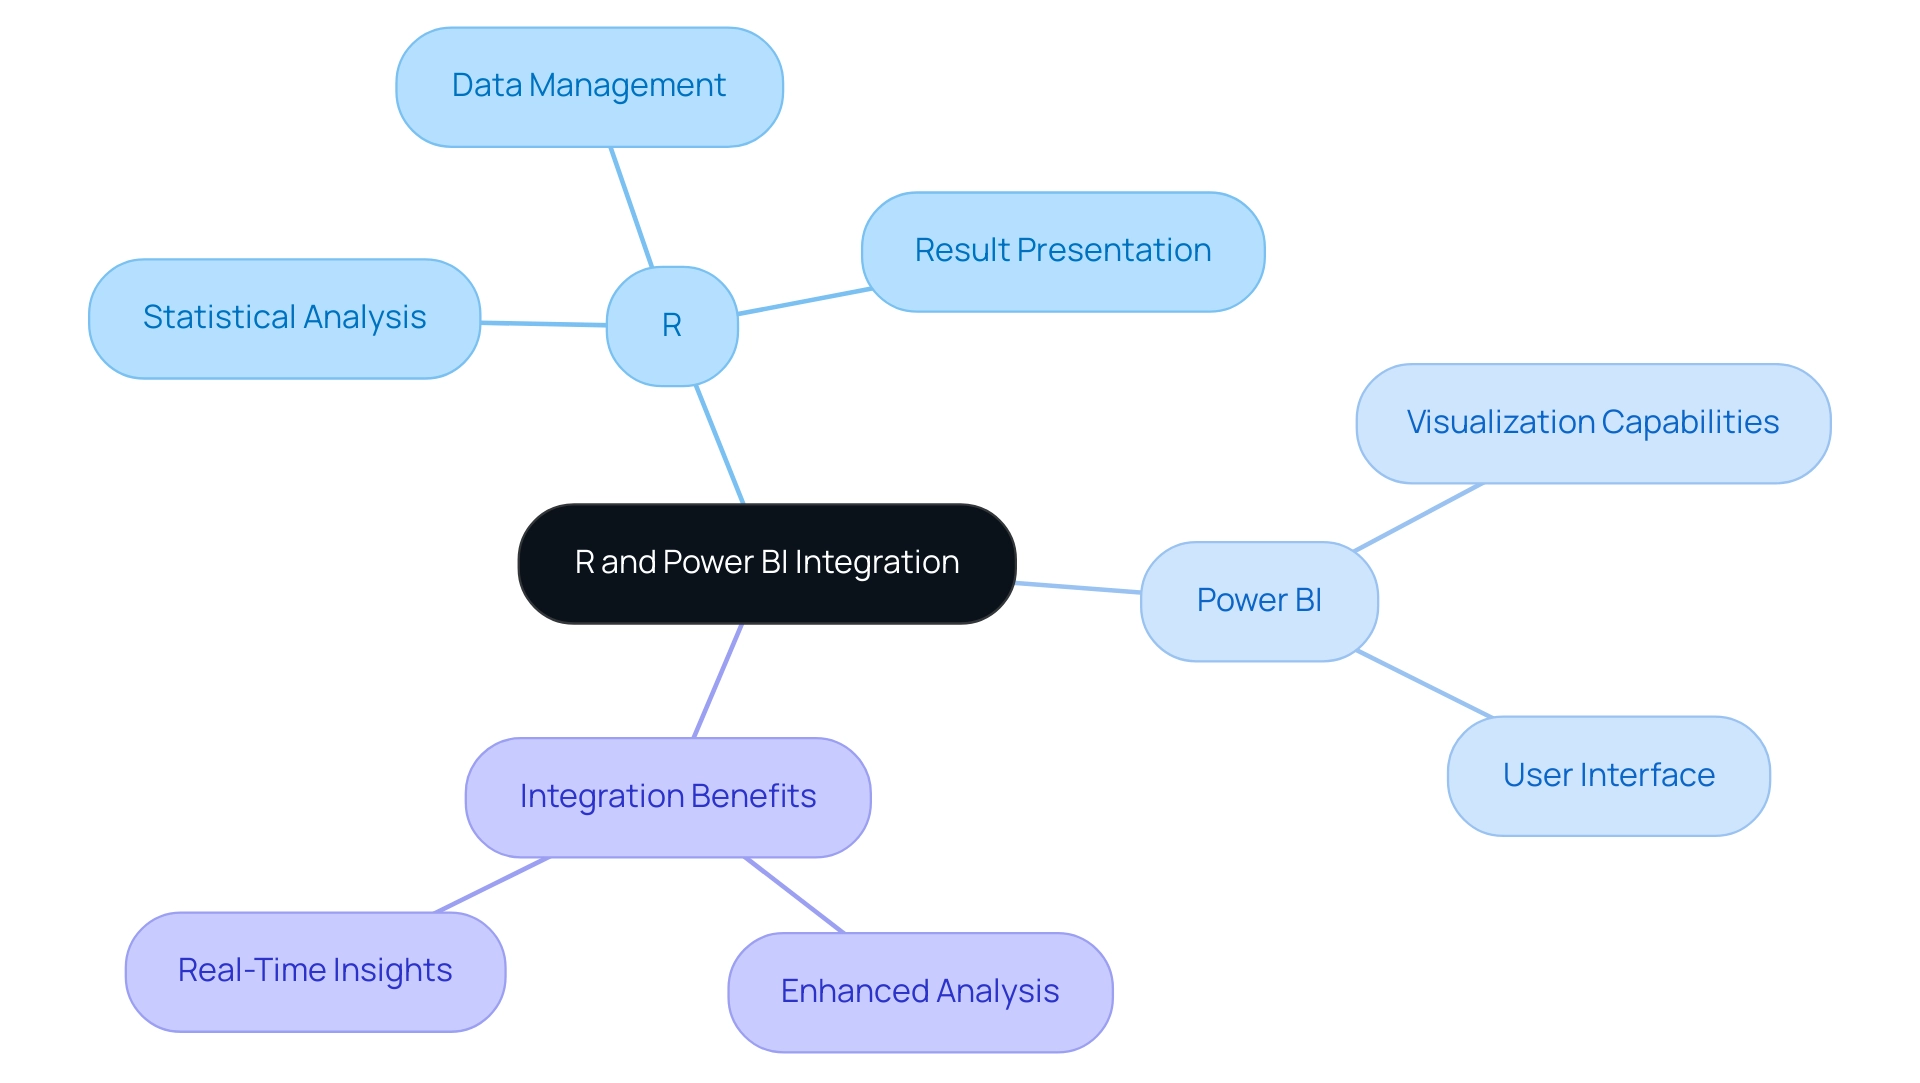
R is a powerful programming language and environment specifically designed for statistical computing and graphics, making it a preferred choice among statisticians and data miners for comprehensive data evaluation. In contrast, Microsoft’s business analytics tool serves as a robust resource that empowers users to visualize data and disseminate insights across their organizations. Recognizing the unique strengths of each tool is crucial:
- R excels in conducting complex statistical analyses and managing data, including organizing datasets and effectively presenting results.
- BI shines in delivering strong visualization capabilities through an intuitive user interface.
The synergy of using R with Power BI can significantly enhance analysis and reporting processes. Creatum GmbH amplifies this integration by providing tailored dashboards that deliver real-time insights, seamless data integration from various sources, and expert support to maximize the potential of your data. Notably, our services include a 3-Day BI Sprint for rapid report creation and the General Management App for comprehensive management and intelligent reviews.
A recent survey revealed that R maintains a prominent position in the programming landscape, ranking 17th on the TIOBE Index as of October 2023, highlighting its relevance in the field of analysis. This statistic underscores the importance of mastering both R and BI, particularly through the integration of R with Power BI, to fully leverage their capabilities.
To embark on this journey, it is advisable to familiarize yourself with the essential functionalities of using R with Power BI. Engaging with introductory tutorials or documentation available on their respective platforms can help establish a solid foundation. Furthermore, Creatum has successfully empowered businesses to transform raw data into actionable insights, as demonstrated in the case study titled ‘Business Intelligence Empowerment,’ which showcases real-world applications of our services.
By mastering both R and Business Intelligence, you can unlock the full potential of your data, transforming raw details into actionable insights that drive informed decision-making.
The Advantages of Integrating R with Power BI
Integrating R with Power BI unlocks a multitude of advantages that significantly enhance data analysis capabilities, particularly in the context of Business Intelligence and RPA.
-
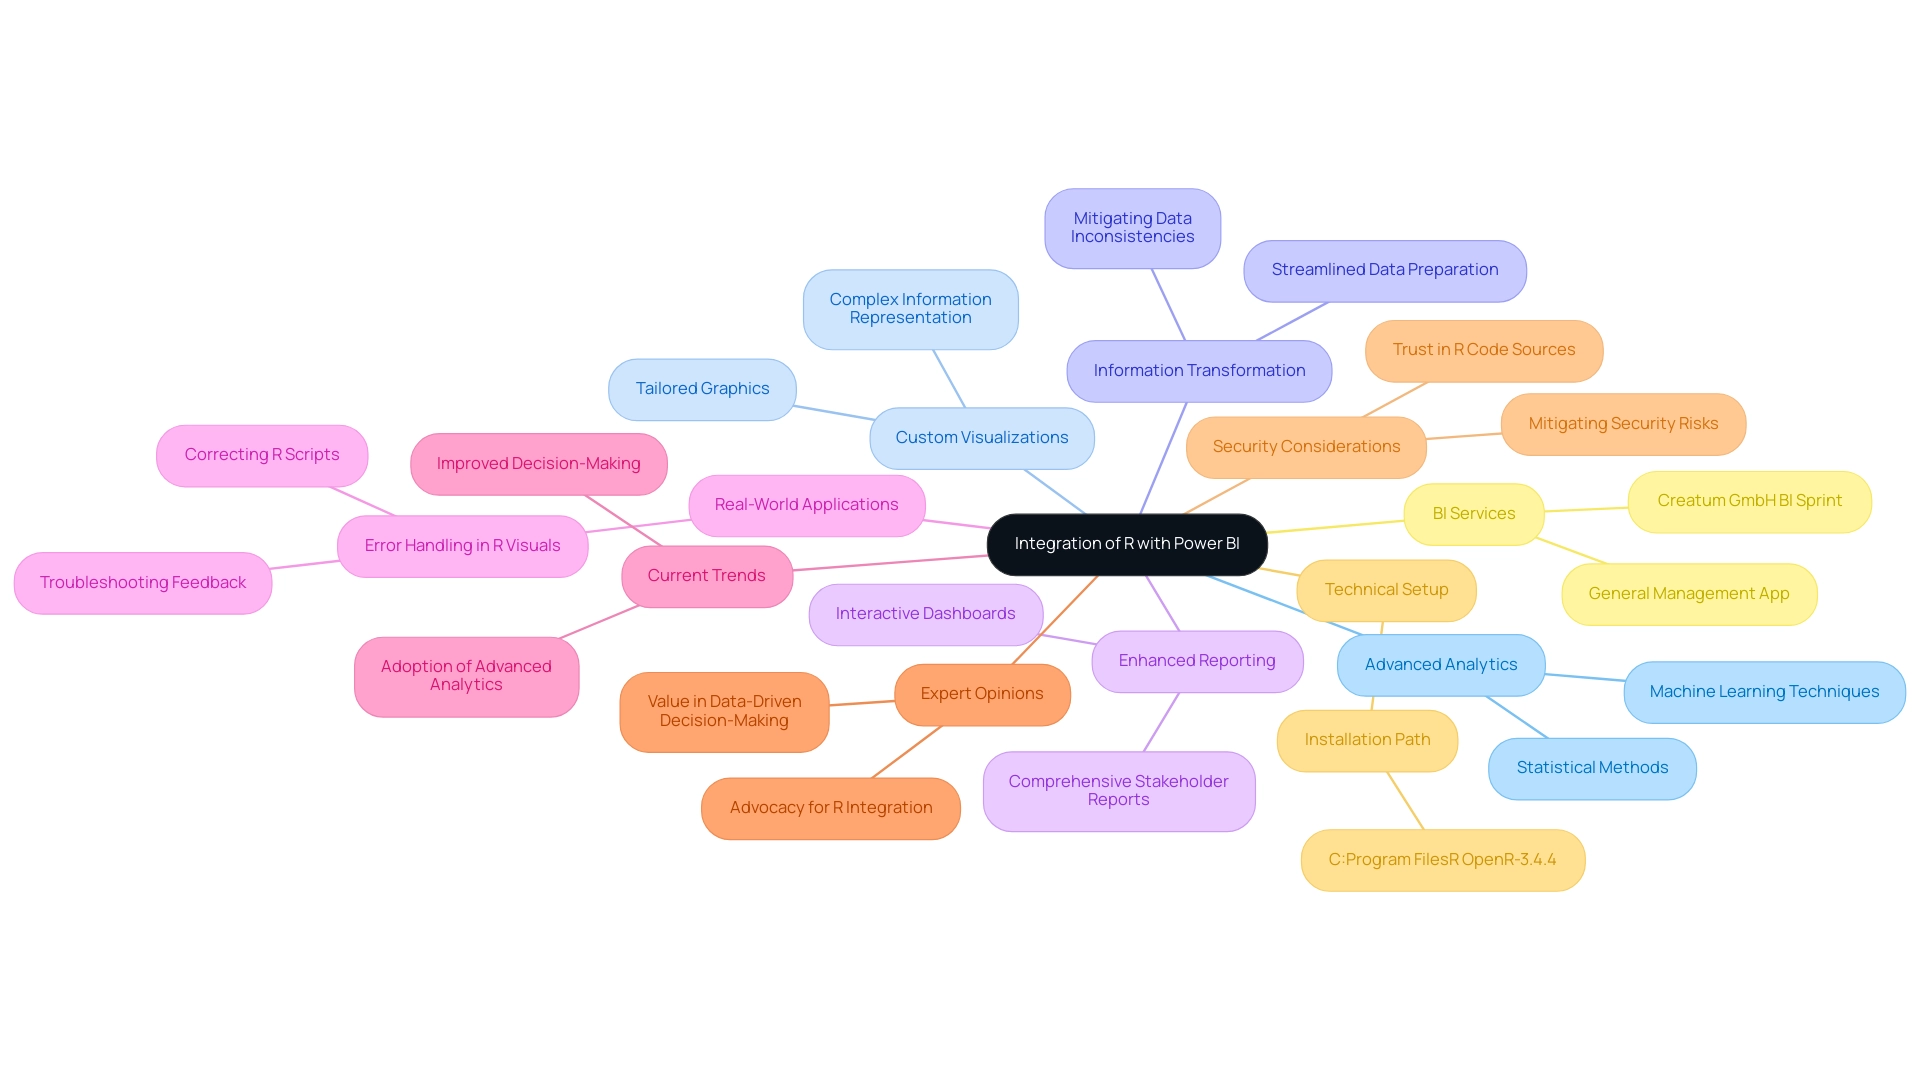
Advanced Analytics: R is renowned for its extensive collection of statistical and machine learning methods, seamlessly applied to datasets within BI. This integration empowers analysts to uncover deeper insights and trends that might otherwise remain obscured, effectively addressing the challenges of extracting meaningful insights in a data-rich environment.
-
Custom Visualizations: By leveraging R scripts, users can create highly tailored visualizations that surpass the standard offerings of BI. This flexibility enables the development of sophisticated graphics that better represent complex information narratives, ultimately enhancing the overall quality of reporting.
-
Information Transformation: R excels in executing complex information transformations, streamlining processes that may prove cumbersome when relying solely on BI’s built-in tools. This capability allows users to prepare their data more efficiently, ensuring it is primed for analysis and mitigating issues related to data inconsistencies.
-
Enhanced Reporting: Harnessing R’s analytical prowess enables users to produce reports that merge the interactivity of BI dashboards with the depth of R’s analytical capabilities. This combination results in comprehensive reporting that meets the diverse needs of stakeholders, effectively addressing the time-consuming nature of report creation.
-
Real-World Applications: A notable case study underscores the importance of error handling in R visuals within Business Intelligence. Users may encounter errors when executing R programs due to incorrect code or missing packages. BI provides detailed error messages, allowing users to troubleshoot effectively and refine their scripts for successful visualizations.
-
Current Trends: As businesses increasingly adopt advanced analytics, the integration of R with Business Intelligence is emerging as a standard practice. Recent statistics reveal that organizations leveraging this integration report improved decision-making capabilities and enhanced operational efficiency, reinforcing the significance of BI in driving growth.
-
Expert Opinions: Data analysts consistently advocate for utilizing R with Power BI in Business Intelligence, citing its ability to elevate analytical depth and reporting quality. The consensus is clear: employing R with Power BI not only enhances functionality but also delivers substantial value in data-driven decision-making.
-
Security Considerations: Users must trust the origin of R code due to potential security risks. Ensuring that scripts originate from reliable sources can mitigate vulnerabilities associated with executing external code, which is essential for maintaining data governance.
-
Technical Setup: For users looking to integrate R with Business Intelligence, the local installation path of R is typically found at
C:\Program Files\R Open\R-3.4.4. This information is crucial for correctly setting up the environment. -
BI Services: Creatum GmbH offers a 3-Day BI Sprint, enabling users to swiftly create professionally designed reports, along with a General Management App for comprehensive management and smart reviews. These services enhance the overall reporting experience and operational efficiency.
As Hemendra Singh, Director and Co-founder of The NineHertz, emphasizes, “Staying updated with the latest trends and technologies is vital for leveraging the full potential of analytics.” These compelling advantages position the integration of R with Business Intelligence as a crucial strategy for analysts aiming to maximize insights and reporting capabilities in today’s information-rich environment.
Setting Up R in Power BI: A Step-by-Step Guide
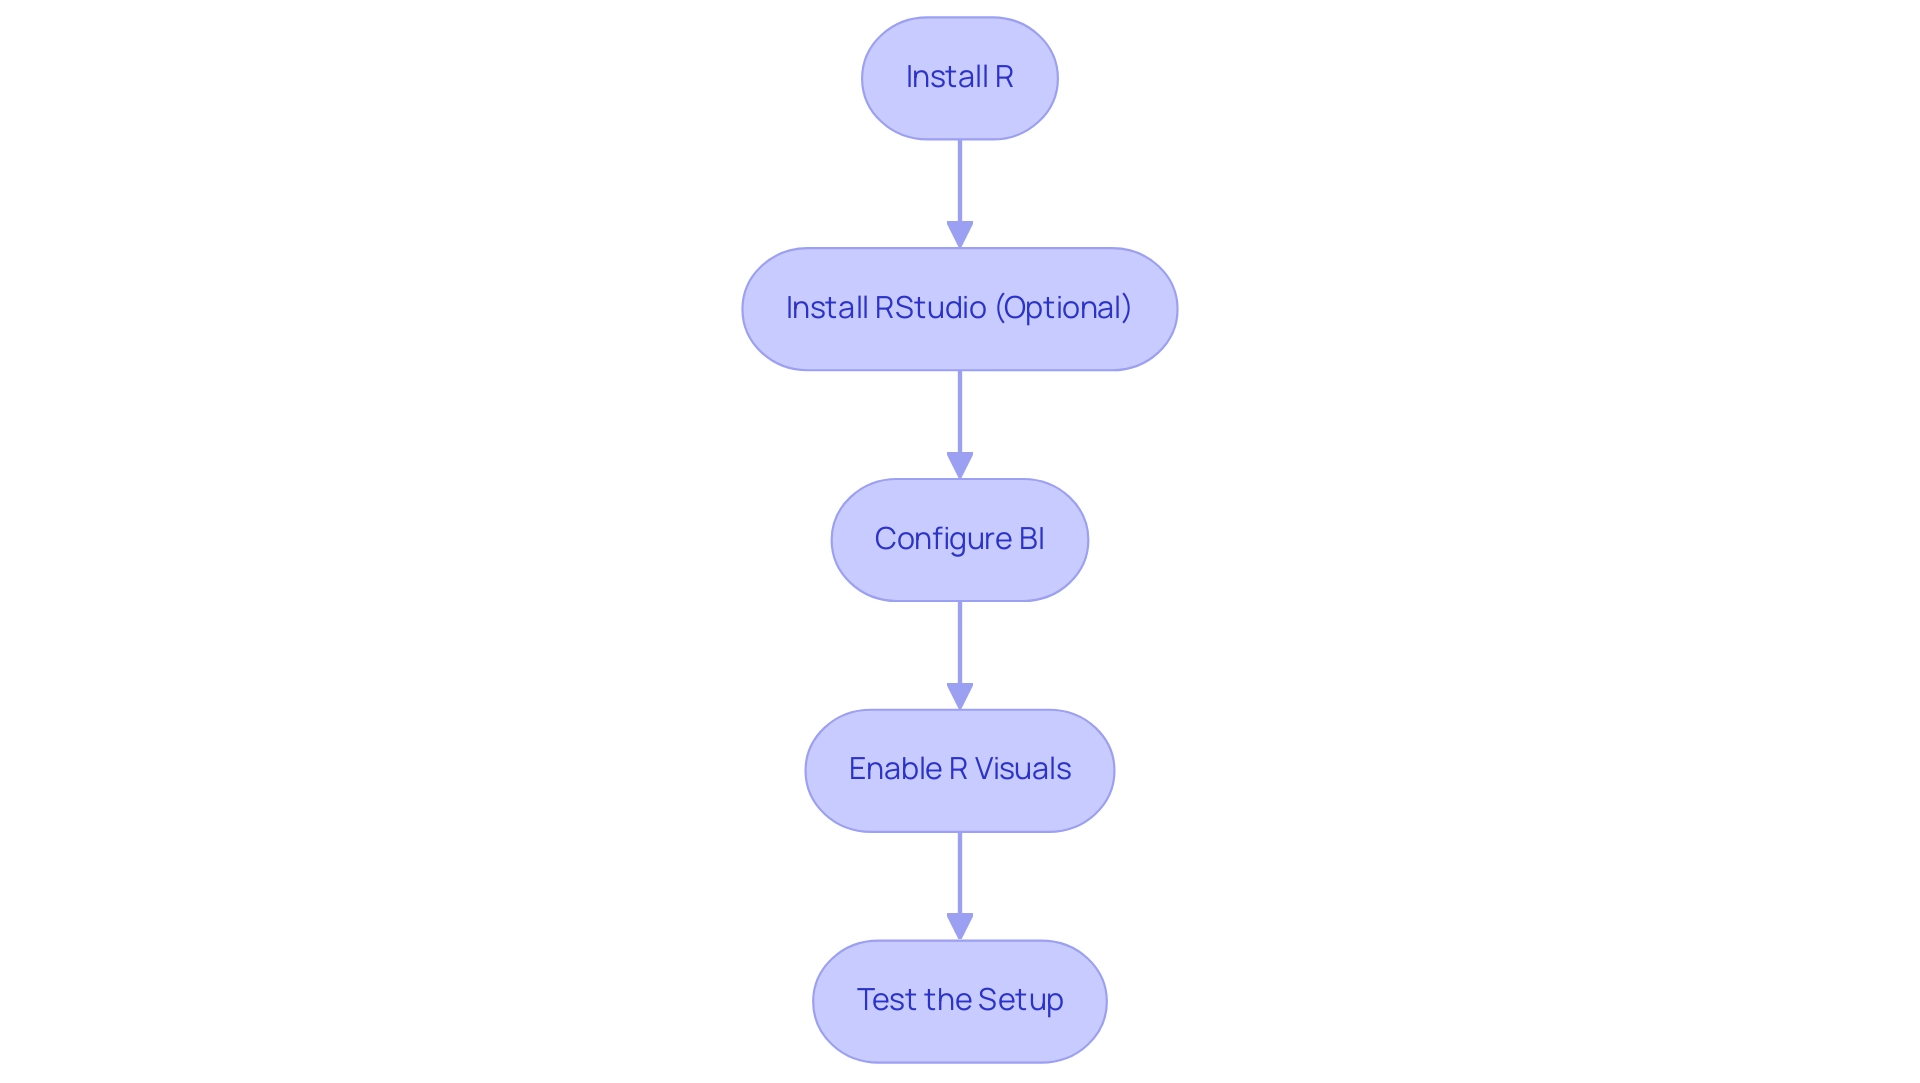
To effectively integrate R into BI for advanced data analysis, follow these detailed steps:
-
Install R: Begin by downloading R from the Comprehensive R Archive Network (CRAN). It is crucial to select the version that corresponds to your operating system to ensure compatibility.
-
Install RStudio (Optional): Although not mandatory, RStudio offers a more intuitive interface for writing and testing R scripts, which can enhance your productivity and ease of use.
-
Configure BI: Launch BI Desktop and navigate to ‘File’ > ‘Options and settings’ > ‘Options’. Under the ‘R scripting’ section, specify the installation path of R. This step is essential for BI to recognize your R installation.
-
Enable R Visuals: In the ‘Visualizations’ pane of BI, locate and select the R visual icon. If R visuals are not enabled, you will be prompted to do so. This feature enables you to utilize R’s powerful visualization capabilities directly within BI using R with Power BI.
-
Test the Setup: To confirm that your integration is successful, create a simple R visual by entering a basic R code in the R visual editor. This test will confirm that the setup is operating properly and prepared for more intricate evaluations.
By following these steps, you will create a strong environment for using R with Power BI to integrate R scripts into your BI reports, thus improving your data examination abilities.
Current Best Practices: As of 2025, it is recommended to regularly update both R and Power BI to leverage the latest features and improvements. Moreover, using R with Power BI for statistical examination can significantly enhance data-driven decision-making, as highlighted by case studies like ‘Building Business Reports with R,’ where organizations effectively aggregated and summarized key information for informed decisions.
For instance, businesses that implemented R in their reporting processes reported improved clarity and effectiveness in their decision-making frameworks.
Statistics on R Usage: Recent studies indicate that R is increasingly favored in business environments for its statistical prowess, with a notable percentage of scientists endorsing its capabilities for complex analysis tasks. For example, to display 6 plots on one page by filling each column in order, use par(mfcol=c(3,2)).
This trend highlights the significance of using R with Power BI to enhance insights in business intelligence tools. As Branimir K Hackenberger from the Department of Biology at Josip Juraj Strossmayer University stated, ‘Although unfriendly, R is perhaps today’s best tool for statistical information processing.’ This emphasizes R’s proficiency in information examination.
Creating Dynamic Visualizations with R Scripts in Power BI
Generating dynamic visual representations using R with Power BI in Business Intelligence is a powerful method to enhance analysis and reporting. This process transforms raw data into meaningful insights that drive informed decision-making. In today’s data-driven landscape, effectively leveraging Business Intelligence tools like Power BI, alongside RPA solutions, can significantly boost operational efficiency while addressing challenges such as time-consuming report creation and data inconsistencies.
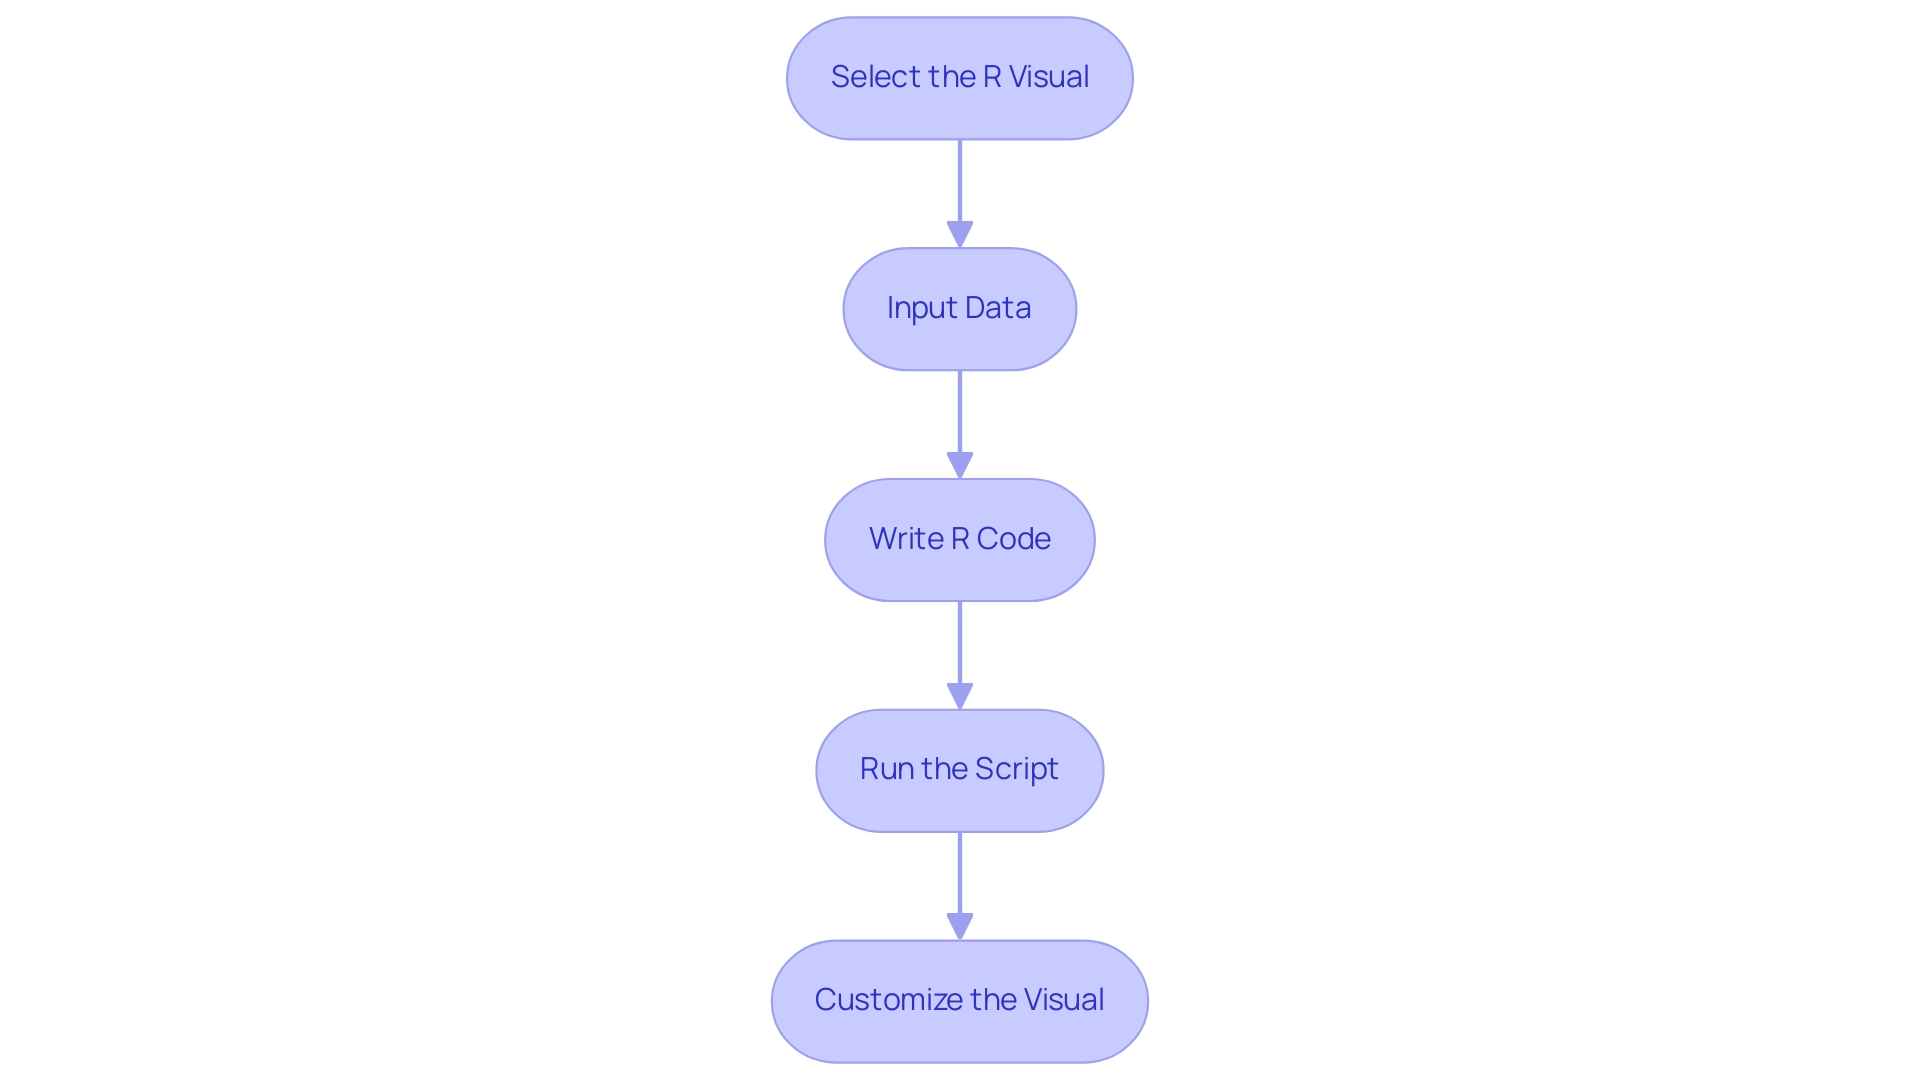
To successfully integrate R into your Power BI reports, follow these steps:
- Select the R Visual: Start by clicking on the R visual icon in your Power BI report to add it to your canvas.
- Input Data: Drag and drop the relevant fields into the ‘Values’ section of the R visual, ensuring you have the necessary data for your analysis.
- Write R Code: In the R code editor, develop your R code to generate the desired visualization. Utilizing libraries such as
ggplot2can greatly enhance your plotting capabilities, allowing for sophisticated and visually appealing graphics. As Daniel J. Denis noted, “Of all the graphic forms used today, the scatter plot is arguably the most versatile, polymorphic, and generally useful invention in the history of statistical graphics.” - Run the Script: Execute your R script by clicking ‘Run’. The visual will render based on the information you provided, showcasing the insights derived from your analysis.
- Customize the Visual: Tailor the visual’s properties within Power BI to enhance its appearance and interactivity, making it more engaging for your audience.
By implementing these steps, you can create compelling and interactive visualizations using R with Power BI, leveraging R’s advanced graphical capabilities. This approach not only enhances the clarity of your presentation but also aligns with current trends in visualization, facilitating better decision-making and operational efficiency. Dynamic data visualizations are crucial in identifying trends, aiding business leaders in understanding data relationships and acting accordingly.
For instance, the Big Mac Index case study illustrates how dynamic visualizations can effectively convey complex relationships and trends over time, further emphasizing the value of integrating R into your BI reports.
Overcoming Challenges: Common Issues with R in Power BI
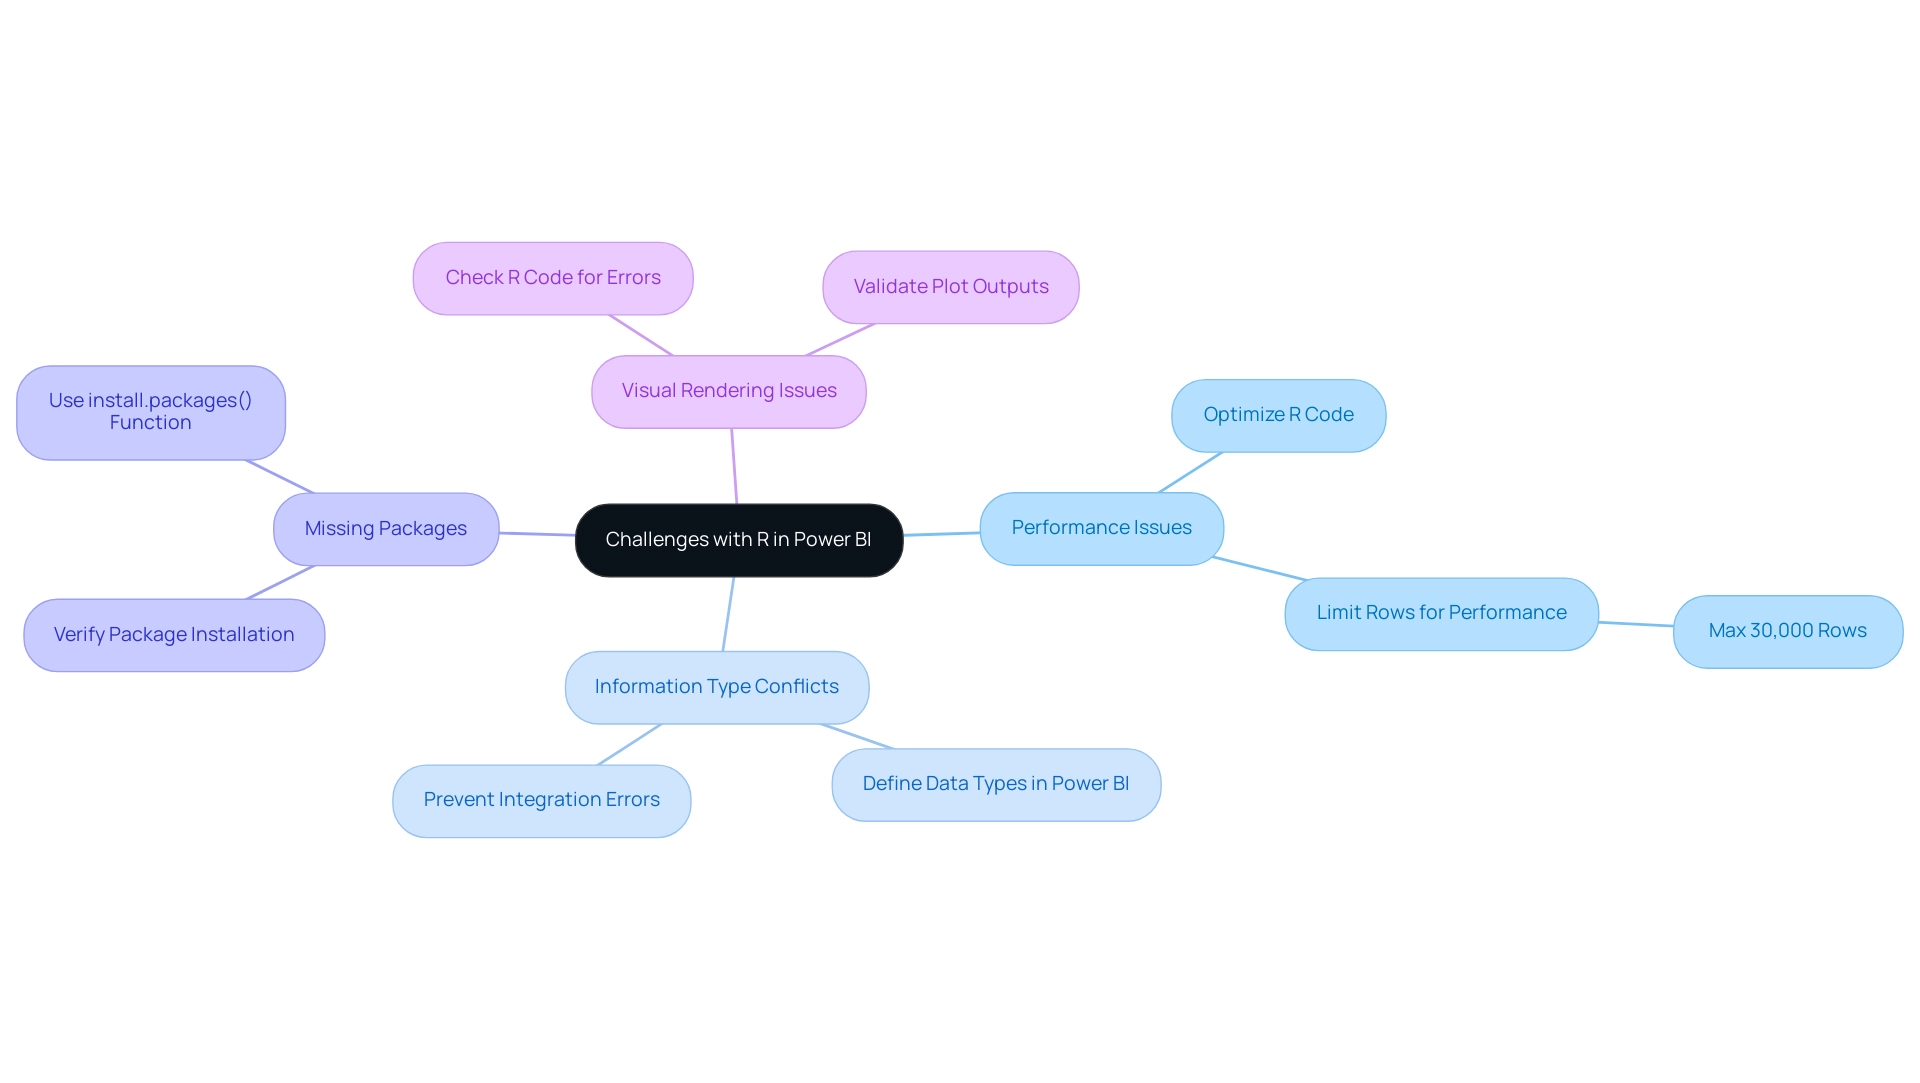
Integrating R with Power BI presents several challenges that users must be prepared to address.
-
Performance Issues: R scripts can be resource-intensive, often leading to significant slowdowns in BI. To mitigate this, optimizing your R code and limiting the amount of information processed is crucial. Statistics suggest that BI can manage up to 30,000 rows effectively, so remaining within this limit can enhance performance. This optimization aligns with the principles of Robotic Process Automation (RPA), which aims to streamline workflows and boost efficiency.
-
Information Type Conflicts: A common issue arises when BI modifies information types during import, potentially causing errors in R routines. To prevent this, ensure that data types are explicitly defined in Power BI before executing R code. This proactive approach not only prevents integration headaches but is also essential for tailoring AI solutions that meet specific business needs.
-
Missing Packages: If your R program relies on specific packages, verifying their installation in your R environment is essential. Utilize the
install.packages()function to add any missing libraries, ensuring that your scripts run smoothly without interruptions. This step is vital for leveraging Business Intelligence effectively, as it ensures all necessary tools are available for informed decision-making. -
Visual Rendering Issues: Occasionally, R visuals may fail to render correctly within BI, often due to errors in the R code or invalid plot outputs. Consistently examining your code for precision can assist in addressing these problems, ensuring that the insights obtained from your information are actionable and clear.
By understanding these common challenges and implementing best practices, users can effectively troubleshoot and optimize their processes using R with Power BI. For instance, a case study contrasting R and BI for visualization emphasizes that BI’s intuitive interface and seamless integration with external sources greatly enhance the capacity to present information visually, facilitating stakeholders’ understanding of intricate concepts. This underscores the importance of selecting the right tool for effective data analysis.
As Hemendra Singh, Director and Co-founder of The NineHertz, observes, “I am having a keen interest in the latest trends and technologies that are emerging in different domains,” highlighting the necessity for businesses to stay updated with efficient tools such as BI.
Advanced Techniques: Maximizing R’s Potential in Power BI
To fully harness the capabilities of R within Business Intelligence, consider implementing the following advanced techniques:
-
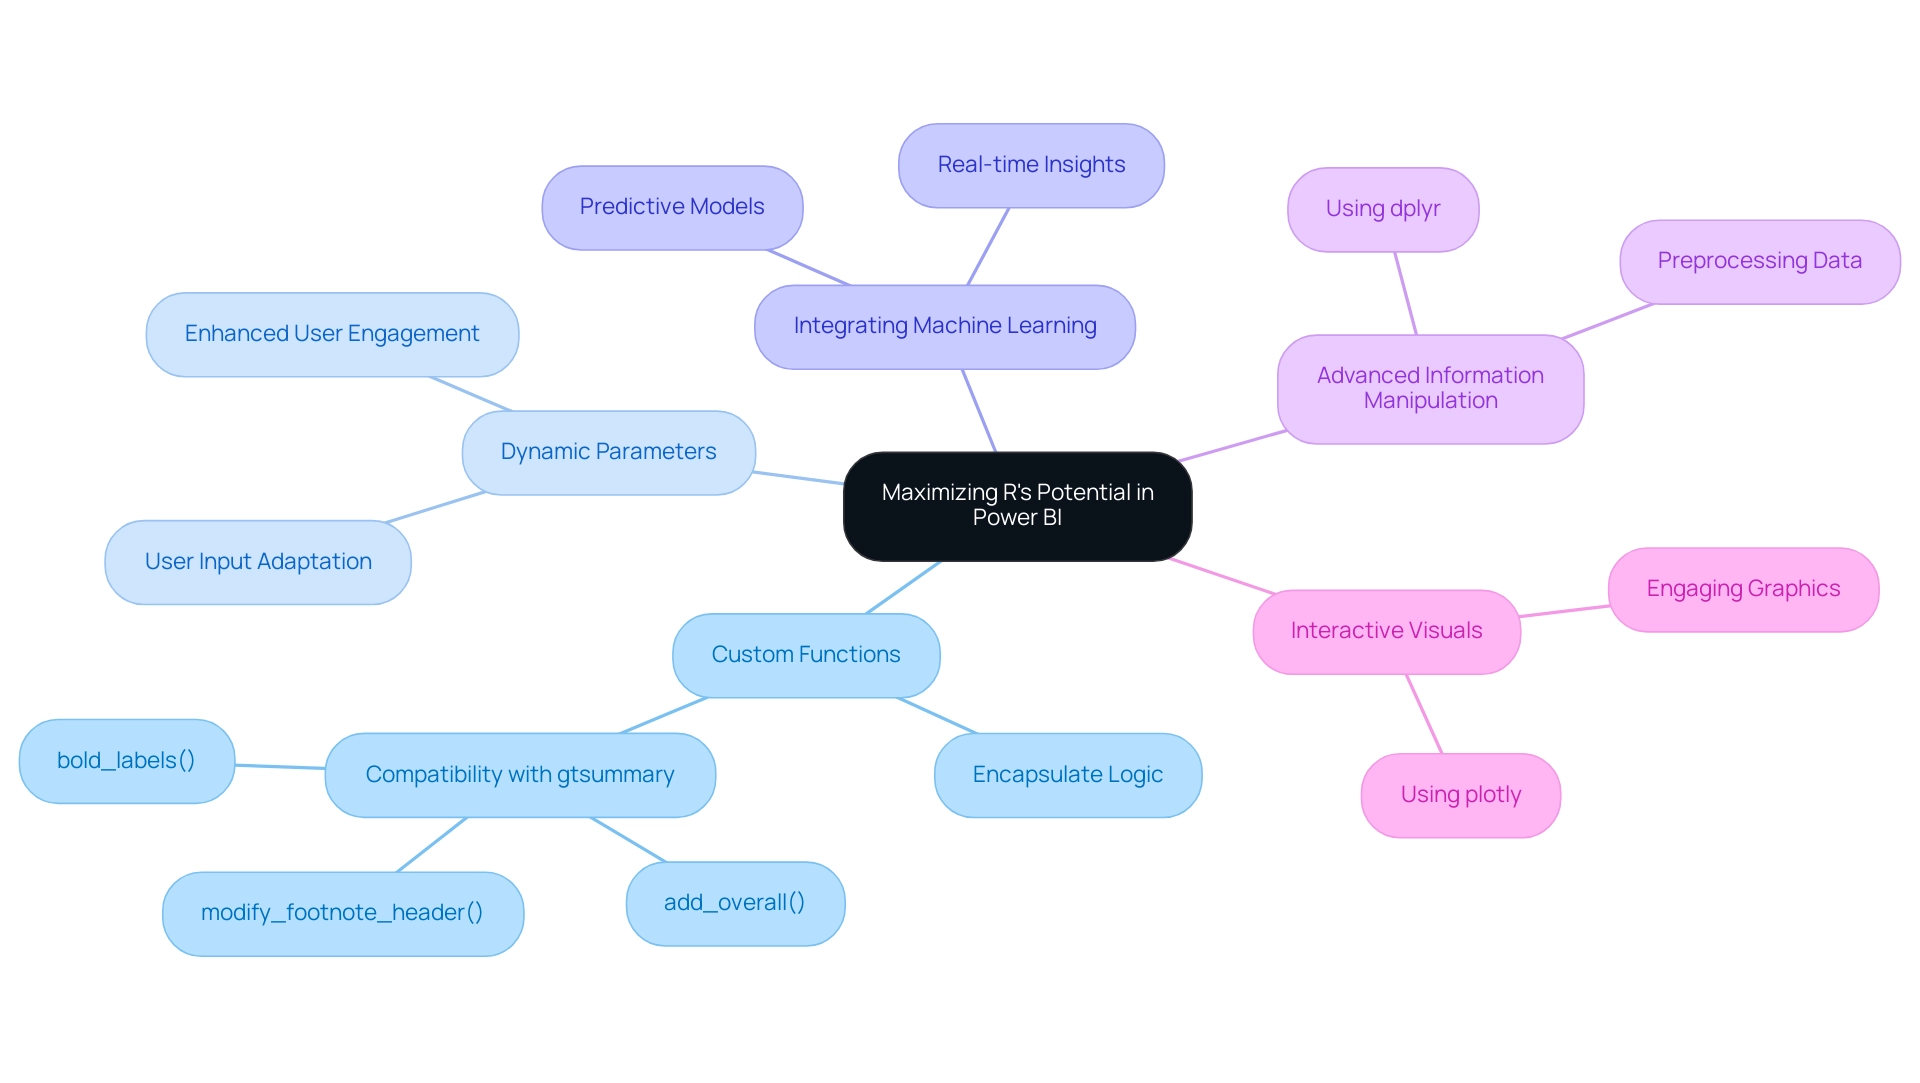
Custom Functions: Develop custom R functions to encapsulate intricate logic, allowing for reuse across various reports. This not only streamlines your workflow but also enhances consistency in your analysis. As noted by Joseph Larmarange, ‘The returned table is compatible with all gtsummary features applicable to a tbl_summary object, like add_overall(), modify_footnote_header(), and bold_labels(). However, some of them could be inappropriate in such case.’ This underscores the importance of understanding the compatibility of custom functions with various features in R.
-
Dynamic Parameters: Incorporate parameters in your R scripts to create dynamic visuals that adapt to user inputs in Business Intelligence. This interactivity can significantly enhance user experience and engagement with the information, aligning with our goal of improving reporting and actionable insights through our BI services.
-
Integrating Machine Learning: Utilize R’s robust machine learning libraries, such as
caretandrandomForest, to construct predictive models directly within Power BI. This integration enables real-time insights and supports information-driven decision-making, crucial for addressing inconsistencies and governance challenges in business reporting. -
Advanced Information Manipulation: Leverage R’s powerful information manipulation capabilities through packages like
dplyrto preprocess information effectively before visualization. This step is crucial for ensuring information quality and relevance in your reports, ultimately enhancing operational efficiency. -
Interactive Visuals: Explore visualization libraries such as
plotlyto create interactive graphics that engage users and enable deeper exploration of the data.
By adopting these advanced techniques, users can unlock R’s full potential in Business Intelligence using R with Power BI, leading to more insightful evaluations and ultimately driving growth and innovation in their organizations. A case study on business intelligence empowerment illustrates how transforming raw information into actionable insights can significantly enhance decision-making processes, reinforcing the value of these techniques in a rich information environment. Furthermore, the effectiveness of these techniques is supported by a statistic indicating a 95% confidence interval for the mean difference ranging from 0.2557008 to 0.8825708, underscoring their impact on operational efficiency and the importance of leveraging RPA to automate manual workflows.
Key Takeaways: Mastering Data Insights with R and Power BI
Utilizing R with Power BI unlocks a wealth of capabilities for information exploration and visualization, significantly enhancing the decision-making process within organizations. Key takeaways from this integration include:
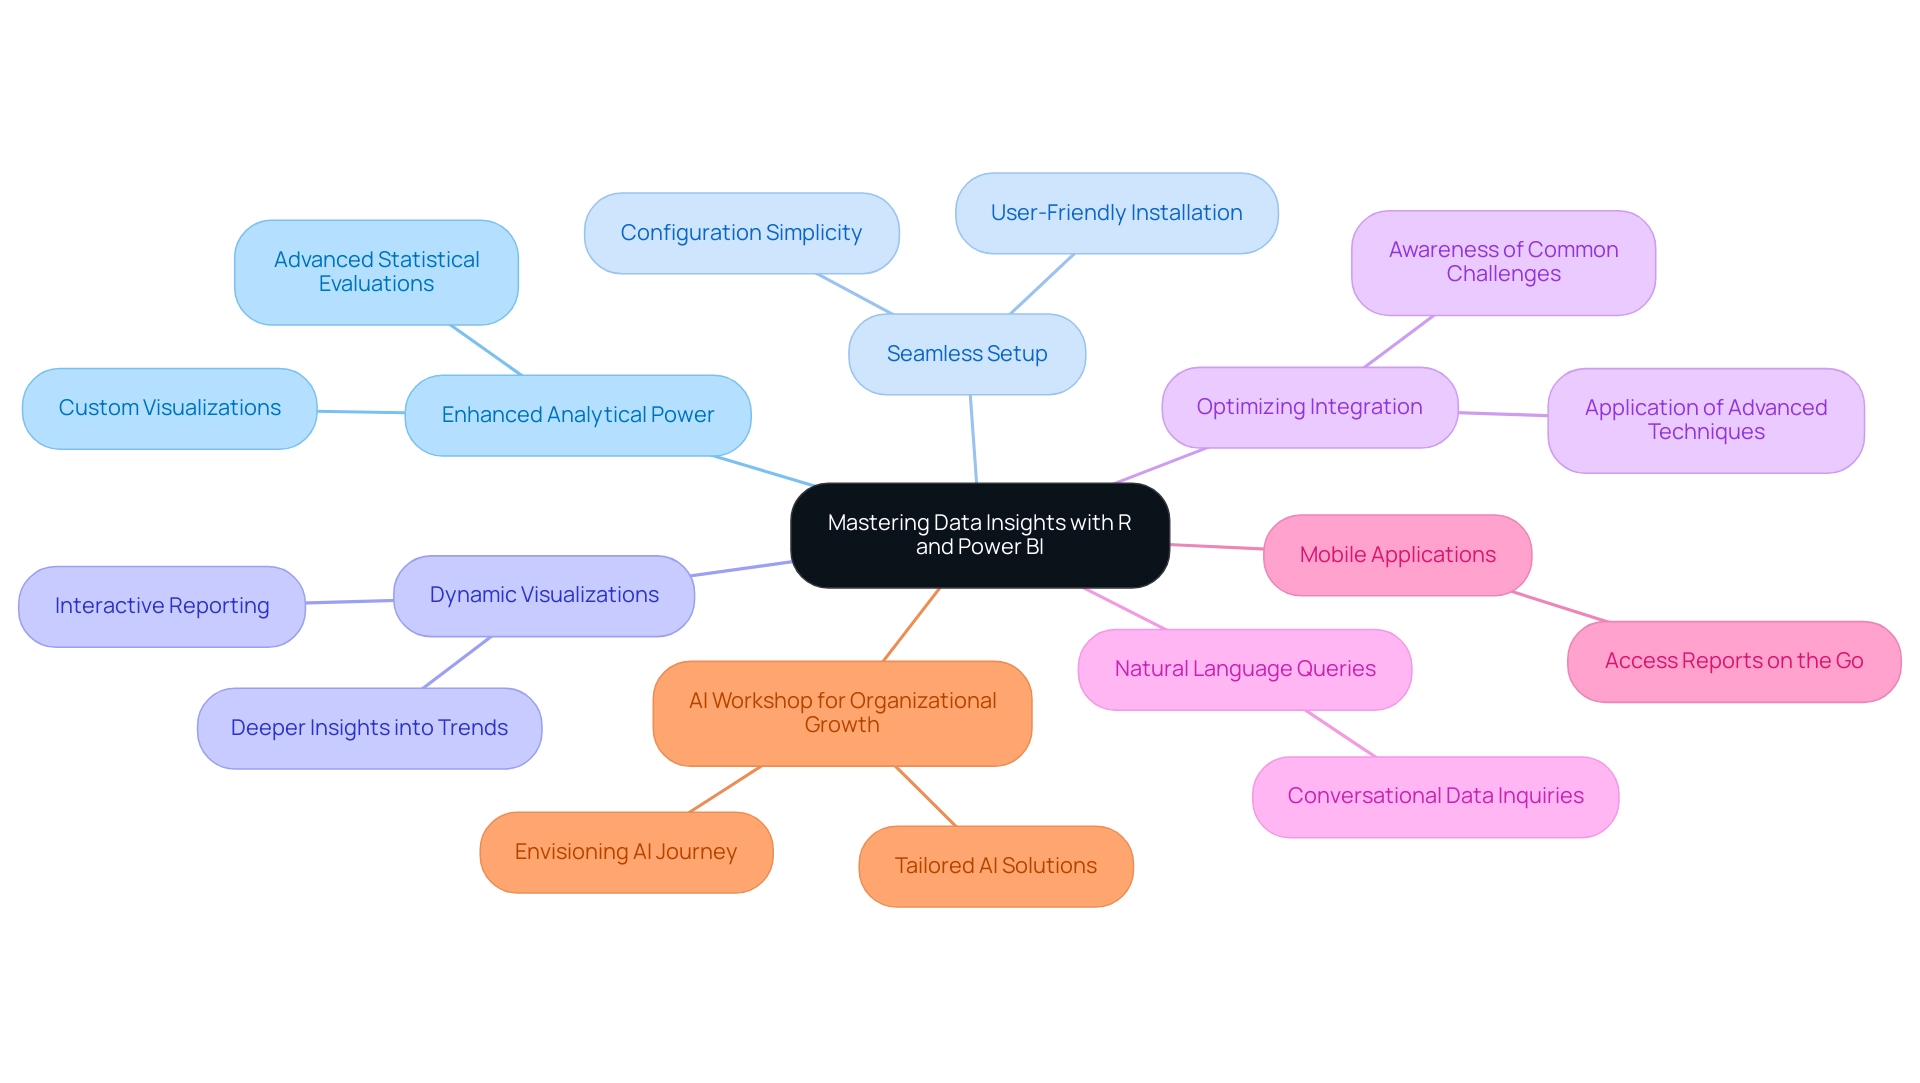
- Enhanced Analytical Power: R amplifies BI’s analytical capabilities, enabling advanced statistical evaluations and the creation of custom visualizations tailored to specific business needs.
- Seamless Setup: Setting up R in BI is user-friendly; it requires only proper installation and configuration to get started.
- Dynamic Visualizations: Users can leverage R scripts to develop dynamic and interactive visualizations, greatly enhancing reporting capabilities and providing deeper insights into trends.
- Optimizing Integration: Awareness of common challenges and the application of advanced techniques can significantly optimize the integration process, leading to improved insights.
Moreover, BI supports natural language queries, allowing users to inquire about their information using conversational language, further enhancing its user-friendly nature. The current trend indicates that organizations are increasingly adopting tools such as BI, with its mobile applications enabling access to reports and dashboards while traveling, facilitating real-time decision-making. As companies strive to excel in information interpretation, using R with Power BI emerges as a vital approach for transforming raw information into practical insights.
This method not only enhances operational efficiency but also aligns with the broader objective of utilizing information for strategic growth and innovation.
Creatum’s Business Intelligence Sprint service exemplifies this transformative impact, as highlighted by client testimonials. For instance, Sascha Rudloff from PALFINGER Tail Lifts GmbH noted that the sprint not only delivered a readily usable Power BI report but also greatly expedited their Power BI development, surpassing expectations and improving their information evaluation approach. By mastering these tools, organizations can enhance their data analysis processes, ultimately leading to more informed and impactful decision-making.
Furthermore, the AI Workshop for Organizational Growth illustrates how organizations can effectively implement AI technologies that align with their specific goals, reinforcing the importance of this integration. Leveraging Robotic Process Automation (RPA) alongside these tools can further streamline workflows, reduce manual errors, and free up teams for more strategic tasks, ensuring that businesses remain competitive in a rapidly evolving AI landscape.
Conclusion
Integrating R with Power BI presents a formidable alliance that remarkably amplifies data analysis and visualization capabilities. By harnessing R’s advanced statistical techniques alongside Power BI’s intuitive visualization tools, organizations can metamorphose raw data into actionable insights that propel informed decision-making. This article underscores the distinct strengths of both tools, accentuating the necessity of mastering them to unleash their full potential.
Key takeaways encompass the enhanced analytical prowess that R offers, empowering users to execute complex analyses and craft custom visualizations tailored to specific business needs. The straightforward setup process guarantees that organizations can swiftly incorporate R into their Power BI environment, facilitating dynamic and interactive visualizations that bolster reporting capabilities. Moreover, an awareness of common challenges coupled with the application of advanced techniques can refine the integration process, yielding improved insights and operational efficiency.
As businesses increasingly embrace data-driven strategies, the integration of R and Power BI stands out as a pivotal method for mastering data insights. This synergy not only streamlines workflows but also aligns with the overarching objective of leveraging data for strategic growth and innovation. By adopting these tools, organizations can elevate their decision-making processes, ultimately securing a more competitive advantage in today’s rapidly evolving marketplace.
Frequently Asked Questions
What is R, and why is it preferred for statistical computing?
R is a powerful programming language and environment designed specifically for statistical computing and graphics, making it a preferred choice among statisticians and data miners for comprehensive data evaluation.
How does Microsoft’s business analytics tool compare to R?
Microsoft’s business analytics tool excels in visualizing data and disseminating insights across organizations, while R is better suited for conducting complex statistical analyses and managing data.
What are the benefits of integrating R with Power BI?
Integrating R with Power BI enhances data analysis capabilities by providing advanced analytics, custom visualizations, efficient information transformation, enhanced reporting, and real-world applications that improve decision-making.
What services does Creatum GmbH offer to support R and Power BI integration?
Creatum GmbH offers tailored dashboards, real-time insights, seamless data integration, expert support, a 3-Day BI Sprint for rapid report creation, and a General Management App for comprehensive management.
What is the significance of R’s ranking on the TIOBE Index?
As of October 2023, R ranked 17th on the TIOBE Index, highlighting its relevance and importance in the field of analysis.
What are some key functionalities to learn when using R with Power BI?
Familiarizing oneself with essential functionalities includes understanding statistical methods, R scripting for custom visualizations, and the integration process with Power BI.
How does R handle complex information transformations?
R excels in executing complex information transformations, allowing users to prepare data more efficiently and mitigate issues related to data inconsistencies.
What should users be aware of regarding security when using R with Power BI?
Users must ensure that R code originates from reliable sources to mitigate potential security risks associated with executing external code.
What is the technical setup required for integrating R with Power BI?
The local installation path for R is typically found at C:\\Program Files\\R Open\\R-3.4.4, which is essential for setting up the environment correctly.
Why do data analysts advocate for using R with Power BI?
Data analysts advocate for this integration because it enhances analytical depth and reporting quality, providing substantial value in data-driven decision-making.

