Overview
R scripting in Power BI stands as a pivotal tool for professionals aiming to elevate their data analysis and visualization capabilities. It empowers users to leverage advanced statistical techniques and create customized visuals that extend beyond the limitations of standard BI functionalities. This integration of R not only facilitates the production of intricate visualizations but also automates processes, significantly enhancing decision-making and operational efficiency within organizations. By adopting R scripting, professionals can transform their analytical approach and drive impactful results.
Introduction
In the rapidly evolving world of data analytics, the integration of R scripting into Power BI stands out as a transformative opportunity for professionals eager to enhance their analytical prowess. Harnessing the power of R enables users to unlock advanced statistical techniques and craft stunning visualizations that surpass the limitations of standard Power BI features.
This article explores the significance of R scripting within Power BI, detailing its applications, prerequisites, and a step-by-step implementation process. Additionally, it highlights best practices for maximizing the advantages of R scripts while addressing potential challenges during integration.
As businesses increasingly rely on data-driven insights for strategic decision-making, mastering the effective use of R scripting in Power BI is essential for fostering innovation and operational efficiency.
Understanding R Scripting in Power BI: Importance and Applications
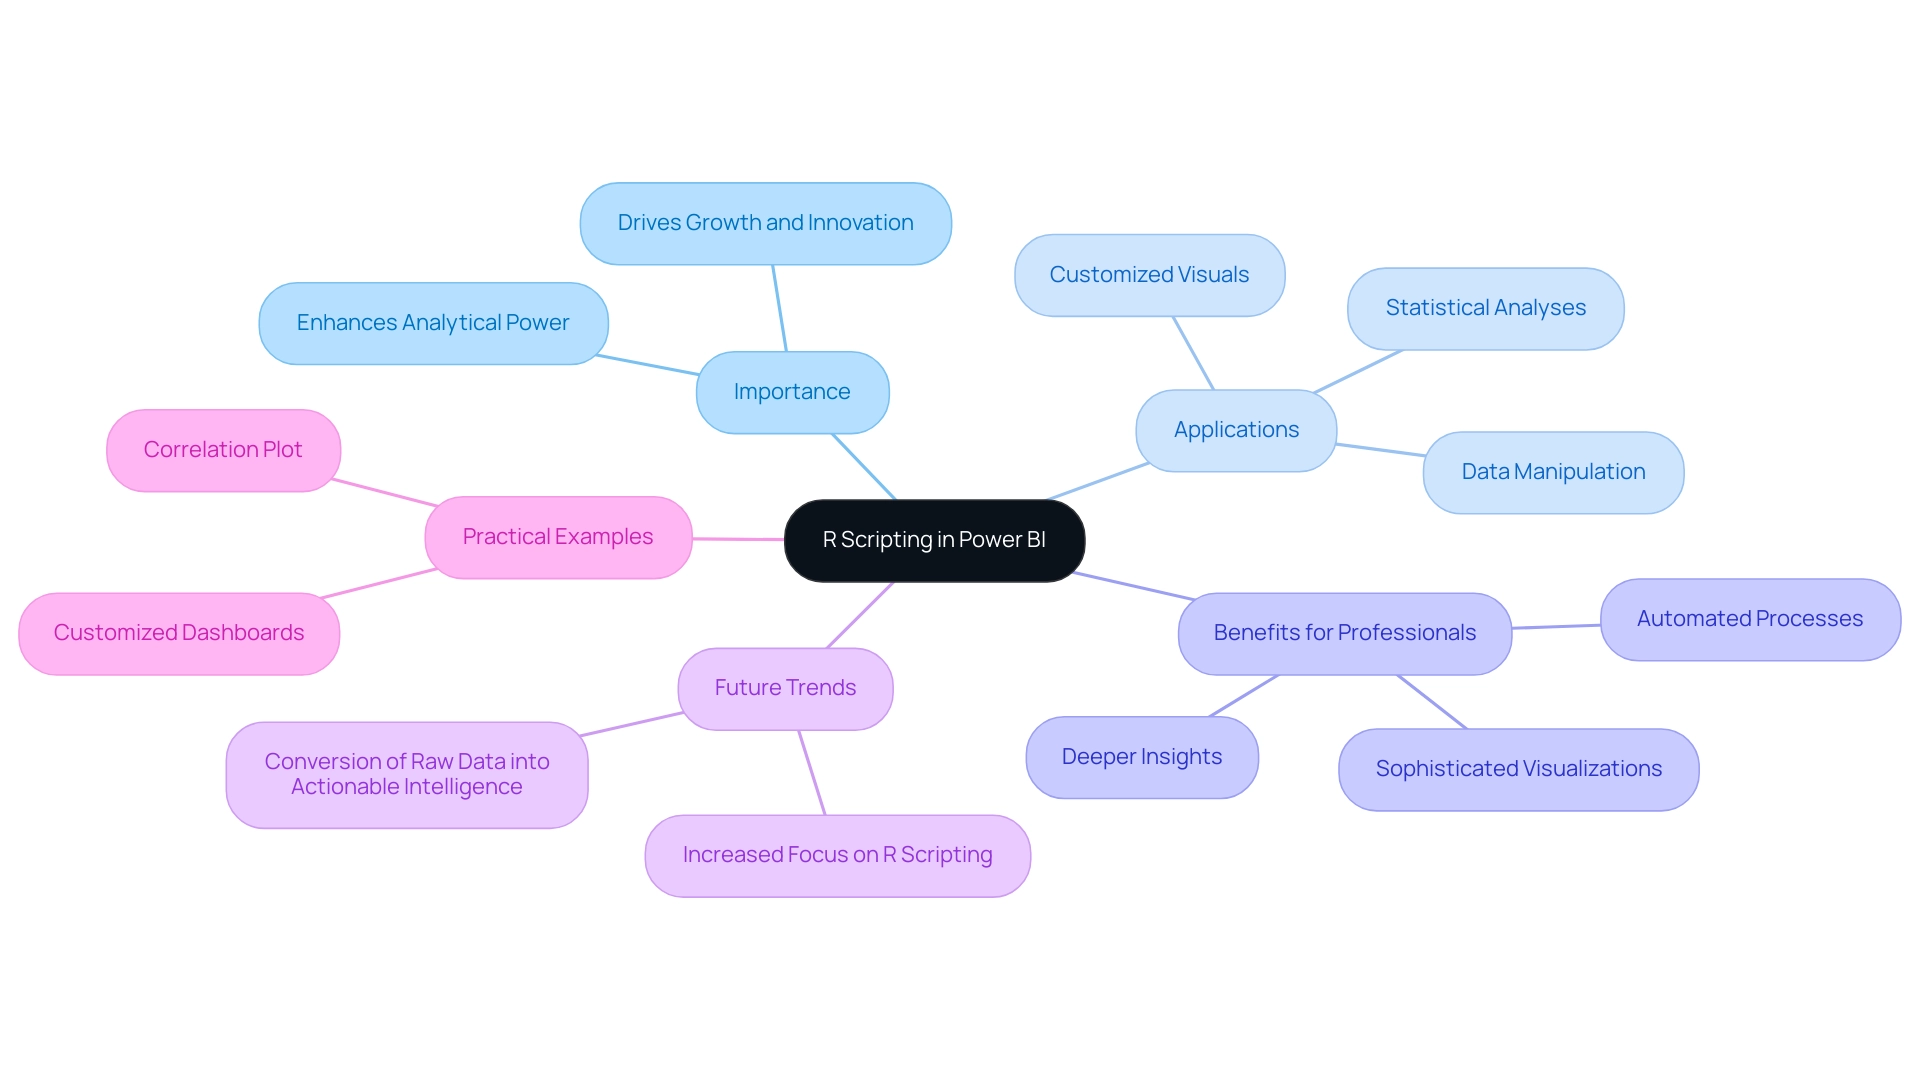
Incorporating R scripting in Power BI empowers users to harness the robust capabilities of the R programming language for advanced data analysis and visualization. This integration allows professionals to create customized visuals, conduct intricate statistical analyses, and manipulate data in ways that exceed the inherent functionalities of business intelligence (BI) tools. Such capabilities are particularly beneficial for data analysts and business intelligence professionals seeking deeper insights and more sophisticated visualizations.
R’s extensive library of packages facilitates the application of advanced analytics techniques, making it an indispensable asset for enhancing the analytical power of BI. For example, organizations have effectively leveraged R scripting to build tailored BI solutions, resulting in personalized dashboards and interactive reports that automate processes and boost productivity. This underscores the significance of continuous support and quality standards in these solutions, ensuring a seamless transition to Power BI while significantly enhancing decision-making capabilities. The role of R scripting in Power BI is pivotal, driving growth and innovation within businesses.
As the landscape of data analysis evolves, integrating R scripting in Power BI becomes increasingly crucial, enabling professionals to derive meaningful insights from complex datasets. By 2025, the focus on R scripting is expected to intensify as organizations recognize its potential to convert raw data into actionable intelligence, ultimately promoting informed decision-making and strategic planning. Notably, Power BI’s free version offers numerous features, while the paid version provides exceptional value, making it accessible for diverse business needs.
Moreover, as Mike Carlo stated, ‘You have completed a correlation plot using R scripting in Power BI within Business Intelligence,’ emphasizing the practical applications of R scripting in Power BI for enhancing data analysis and tackling data inconsistency challenges, thereby improving governance in business reporting.
Prerequisites for Implementing R Scripts in Power BI
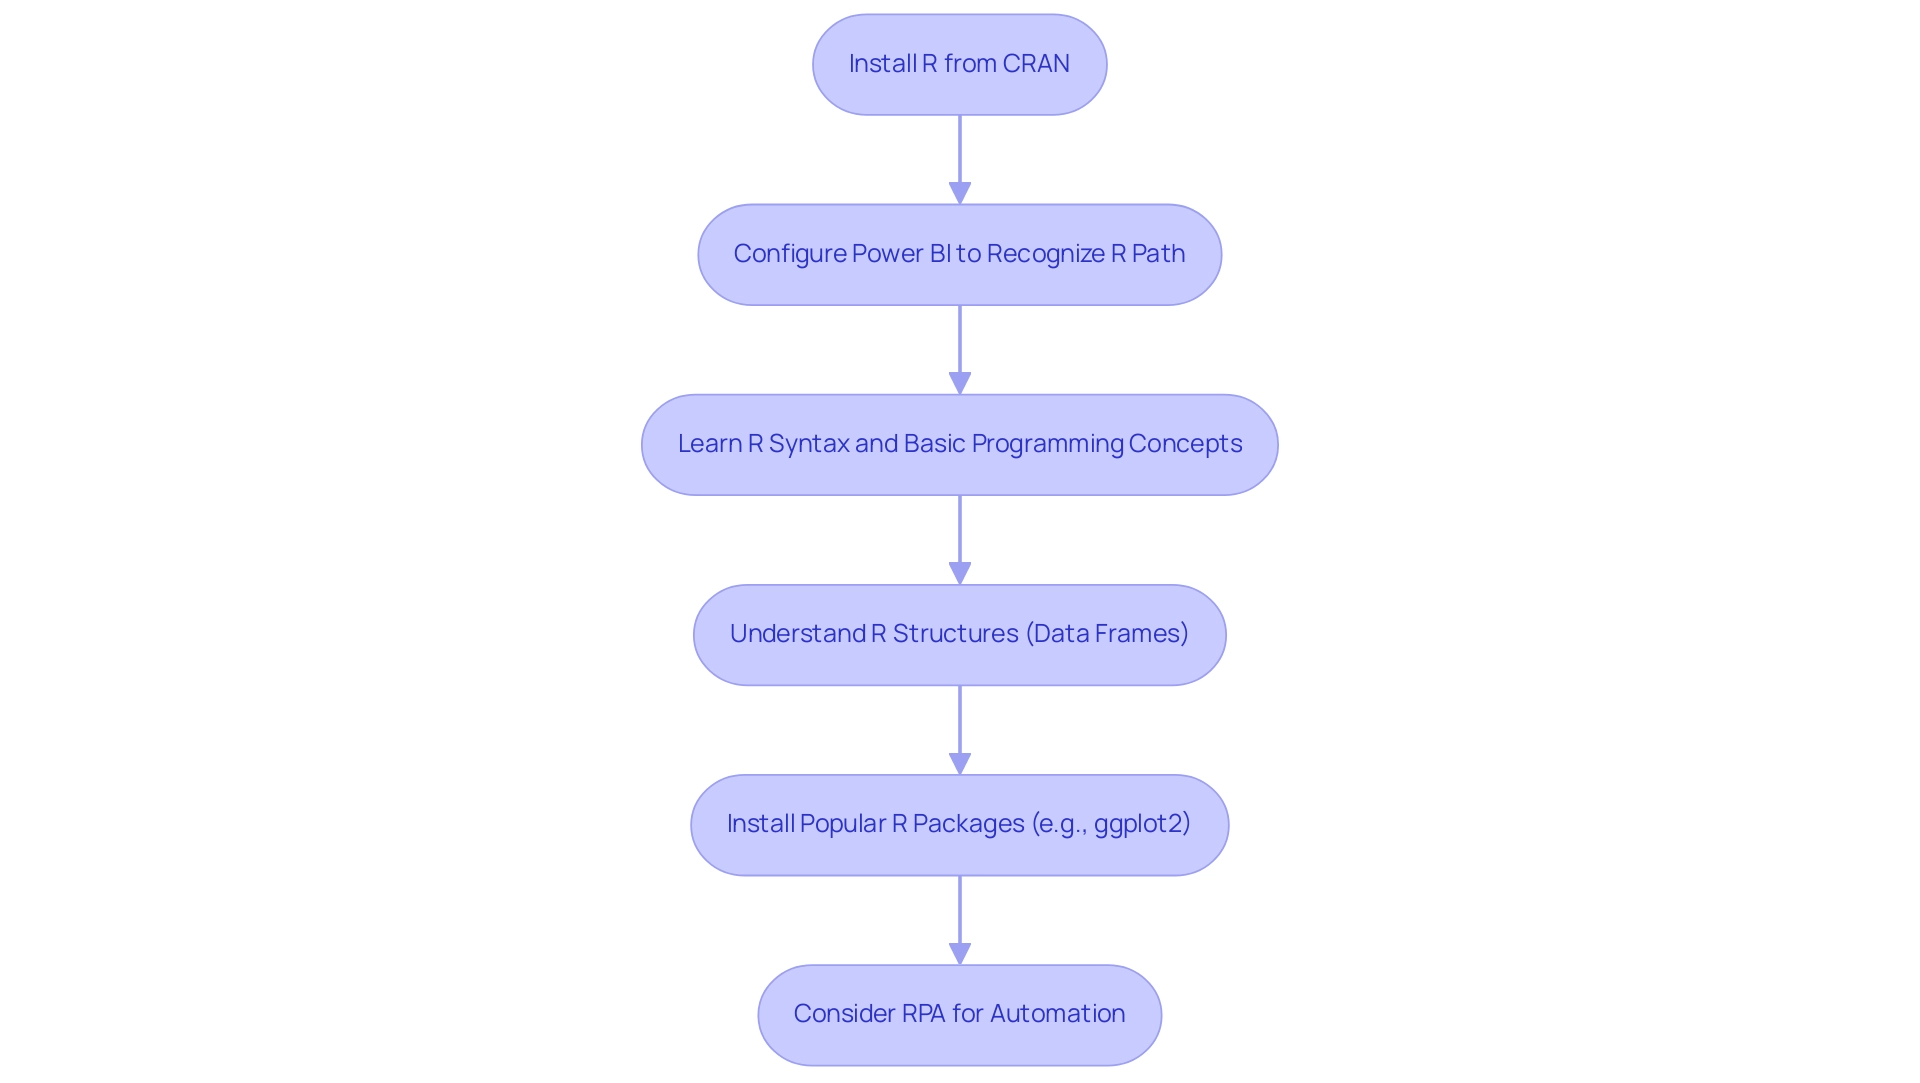
To successfully implement R scripting in Power BI, users must first ensure that R is installed on their local machine. This process begins with downloading R from the Comprehensive R Archive Network (CRAN) and configuring Power BI to recognize the installation path, typically found at C:\\Program Files\\R Open\\R-3.4.4\\. Familiarity with R’s syntax and basic programming concepts is essential for effectively writing and debugging scripts.
A solid understanding of structures in R, particularly data frames, is crucial for manipulating information within Power BI.
Moreover, individuals should consider installing popular R packages, such as ggplot2, which significantly enhance visualization capabilities. Recent statistics suggest that an increasing proportion of users are becoming acquainted with R scripting in Power BI, reflecting a trend towards incorporating advanced analytical techniques into business workflows. This trend is further supported by the observation that while DAX provides flexibility and power in calculating and visualizing statistical measures, it lacks a native function to calculate the mode, as noted by analytics enthusiast Douglas Rocha.
Incorporating Robotic Process Automation (RPA) can further streamline the implementation of R scripting in Power BI, automating repetitive tasks and enhancing overall operational efficiency. Customized AI solutions can also help in overcoming challenges related to analysis and reporting, ensuring that organizations can extract meaningful insights more effectively.
Case studies emphasize the successful application of R in Business Intelligence, particularly the case titled ‘Leveraging R Models in Business Intelligence,’ which illustrates how organizations have utilized R models to streamline information presentation and enhance insight accessibility. This integration not only facilitates better understanding and communication of data-derived insights but also empowers teams to focus on strategic decision-making, ultimately driving operational efficiency. By overcoming challenges such as time-consuming report creation and inconsistencies, organizations can enhance quality and simplify AI implementation, aligning with broader goals of utilizing R scripting in Power BI effectively.
Step-by-Step Guide to Creating R Scripts in Power BI
The process of developing R scripting in Power BI is not only straightforward but also significantly enhances data analysis capabilities and operational efficiency. By incorporating R scripting into your BI workflow, you can leverage the power of Robotic Process Automation (RPA) to automate manual tasks, ultimately freeing your team for more strategic work. Here’s how to integrate R scripting into your Power BI workflow:
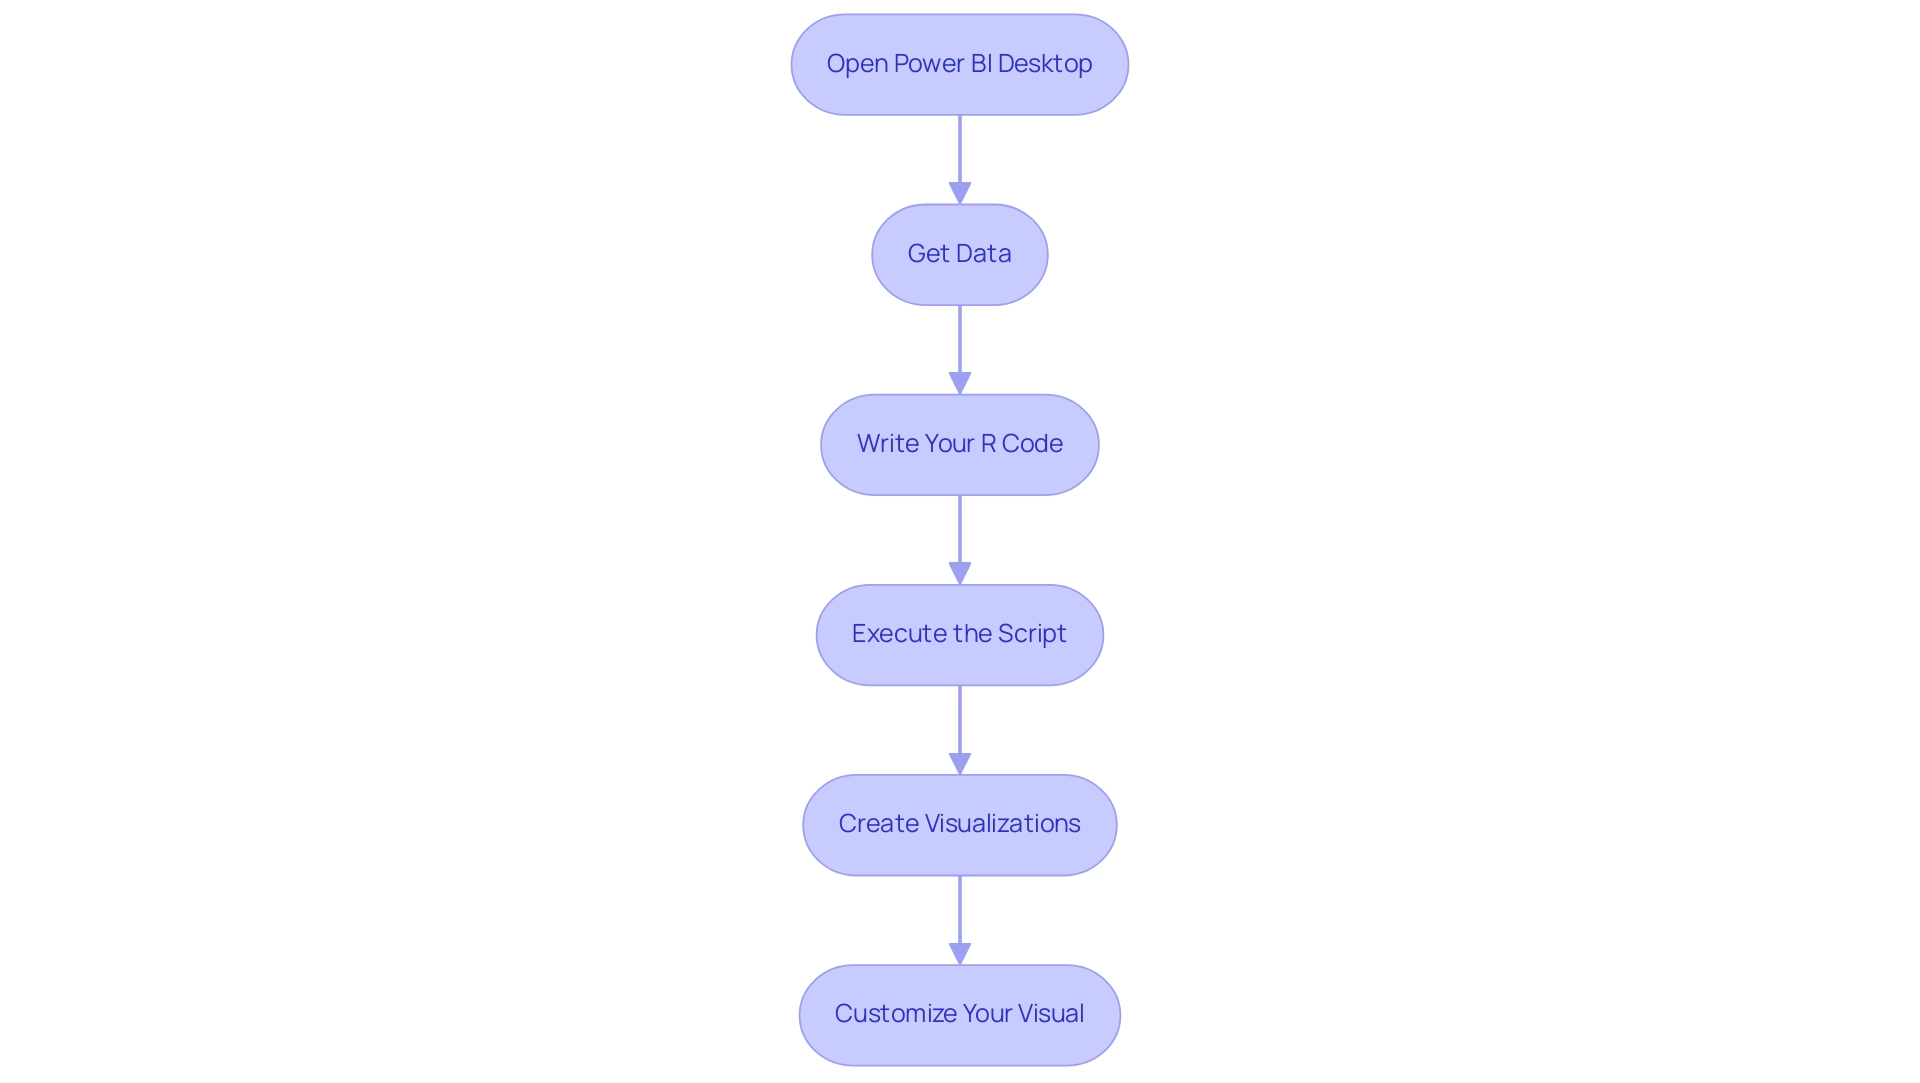
- Open Power BI Desktop: Begin by launching Power BI Desktop and navigating to the ‘Home’ tab.
- Get Data: Click on ‘Get Data’, then select ‘Other’ followed by ‘R script’. This option enables you to utilize R scripting in Power BI’s powerful manipulation features, addressing the challenges of time-consuming report creation and inconsistencies.
- Write Your R Code: In the R script window that appears, input your R code to import or manipulate the information as needed. This flexibility allows you to customize your processing to specific requirements, enhancing your ability to extract actionable insights.
- Execute the Script: Click ‘OK’ to run the script, which will load the processed information into BI. Ensure that your local R installation is correctly set up, typically found at
C:\Program Files\R Open\R-3.4.4\. - Create Visualizations: To illustrate the information, select the R Visual icon from the visualization pane. Input your R code to generate the desired plot, leveraging R’s extensive visualization libraries.
- Customize Your Visual: Finally, adjust the visual to meet your reporting needs and integrate it seamlessly into your BI report.
This process not only empowers individuals to leverage R scripting in Power BI directly but also enhances overall analysis workflows. Organizations that have embraced R scripting in Power BI report improved adoption rates and greater efficiency in data manipulation tasks, showcasing the value of integrating advanced analytics into everyday operations. As the EDNA Team states, “In fact, we are embracing AI, and staying ahead of the latest trends with our constantly updated course materials!”
This highlights the critical importance of keeping pace with technological advancements.
Furthermore, a case study titled “Executing R Scripting in Power BI” illustrates that once the R scripting in Power BI is created, individuals can execute it to generate visualizations, with Power BI Desktop successfully displaying the generated plots, allowing for interaction and customization of their visualizations. By adhering to these best practices, individuals can maximize the potential of R scripts, driving better insights and informed decision-making. At Creatum GmbH, we emphasize the role of Business Intelligence in transforming raw information into actionable insights, and we offer tailored AI solutions to help you navigate the complexities of analysis.
Leveraging R Scripts for Enhanced Data Visualization in Power BI
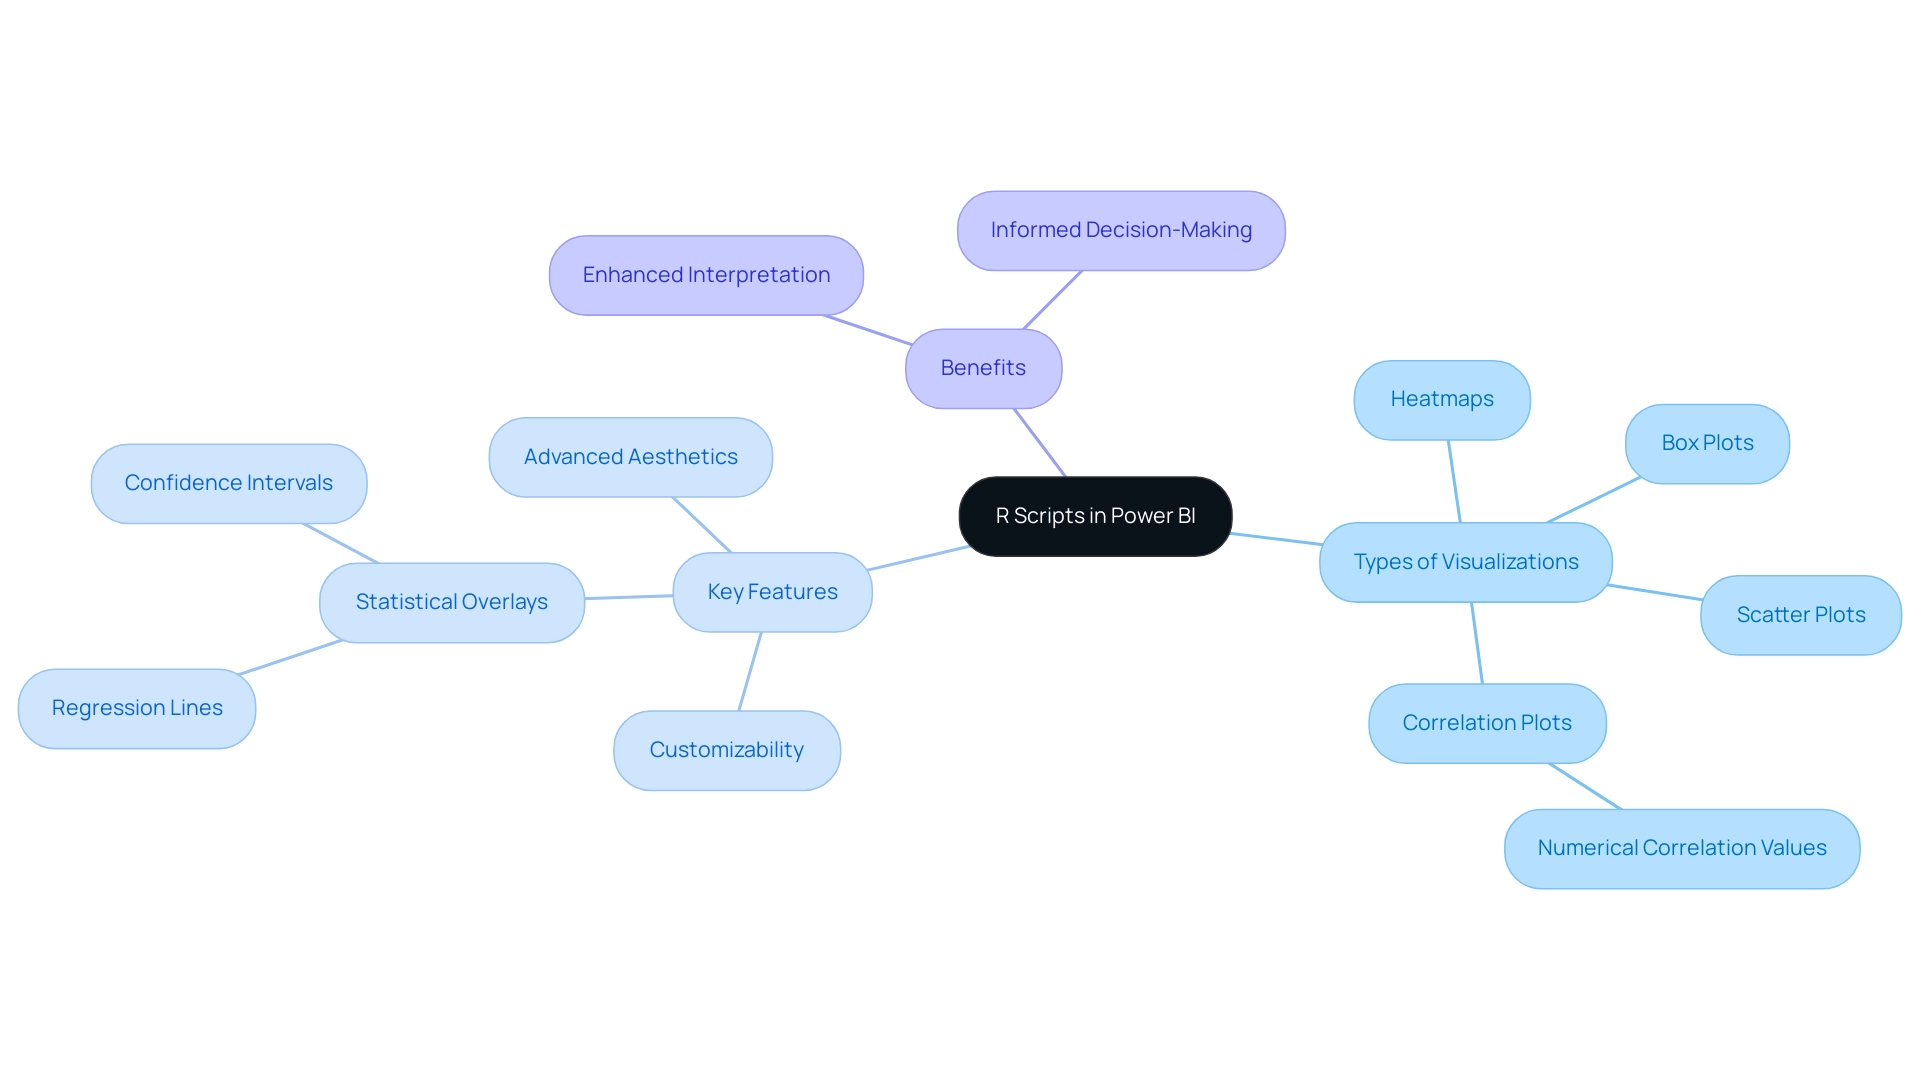
R scripting in Power BI is essential for enhancing visualization, empowering users to create highly customizable and sophisticated visual representations of their data. By leveraging R’s robust ggplot2 package, professionals can produce intricate visualizations, including heatmaps, box plots, and scatter plots, all enhanced with advanced aesthetics. This flexibility facilitates the integration of statistical overlays, such as regression lines and confidence intervals, directly within the visuals.
Correlation plots, for instance, can display numerical values that represent the correlation between features, offering deeper insights into relationships.
The integration of R visuals within BI not only enriches analytical capabilities but also significantly elevates user satisfaction. A case study titled ‘Using R Visuals in BI’ illustrates how organizations have effectively harnessed R’s statistical software to create intricate visual representations, such as correlation plots, which unveil deeper insights into relationships. This practical application underscores the effectiveness of R in transforming raw data into actionable insights, ultimately enabling informed decision-making.
Moreover, the ability to develop tailored visualizations using R scripting in Power BI has proven to enhance interpretation, leading to improved outcomes in business intelligence. At Creatum GmbH, we offer a 3-Day Power BI Sprint designed for the rapid development of professionally crafted reports, addressing common challenges such as time-consuming report creation and inconsistencies. Additionally, our General Management App supports extensive management and intelligent reviews, ensuring governance and consistency.
As organizations increasingly embrace R analytics, they discover that these advanced visualization techniques not only make information more accessible but also propel strategic initiatives by delivering clearer insights into performance metrics and trends. As Hemendra Singh, Director and Co-founder of The NineHertz, aptly notes, “I am having a keen interest in the latest trends and technologies that are emerging in different domains,” emphasizing the necessity of staying abreast of tools like R in the dynamic landscape of analytical processes.
Challenges and Limitations of Using R Scripts in Power BI
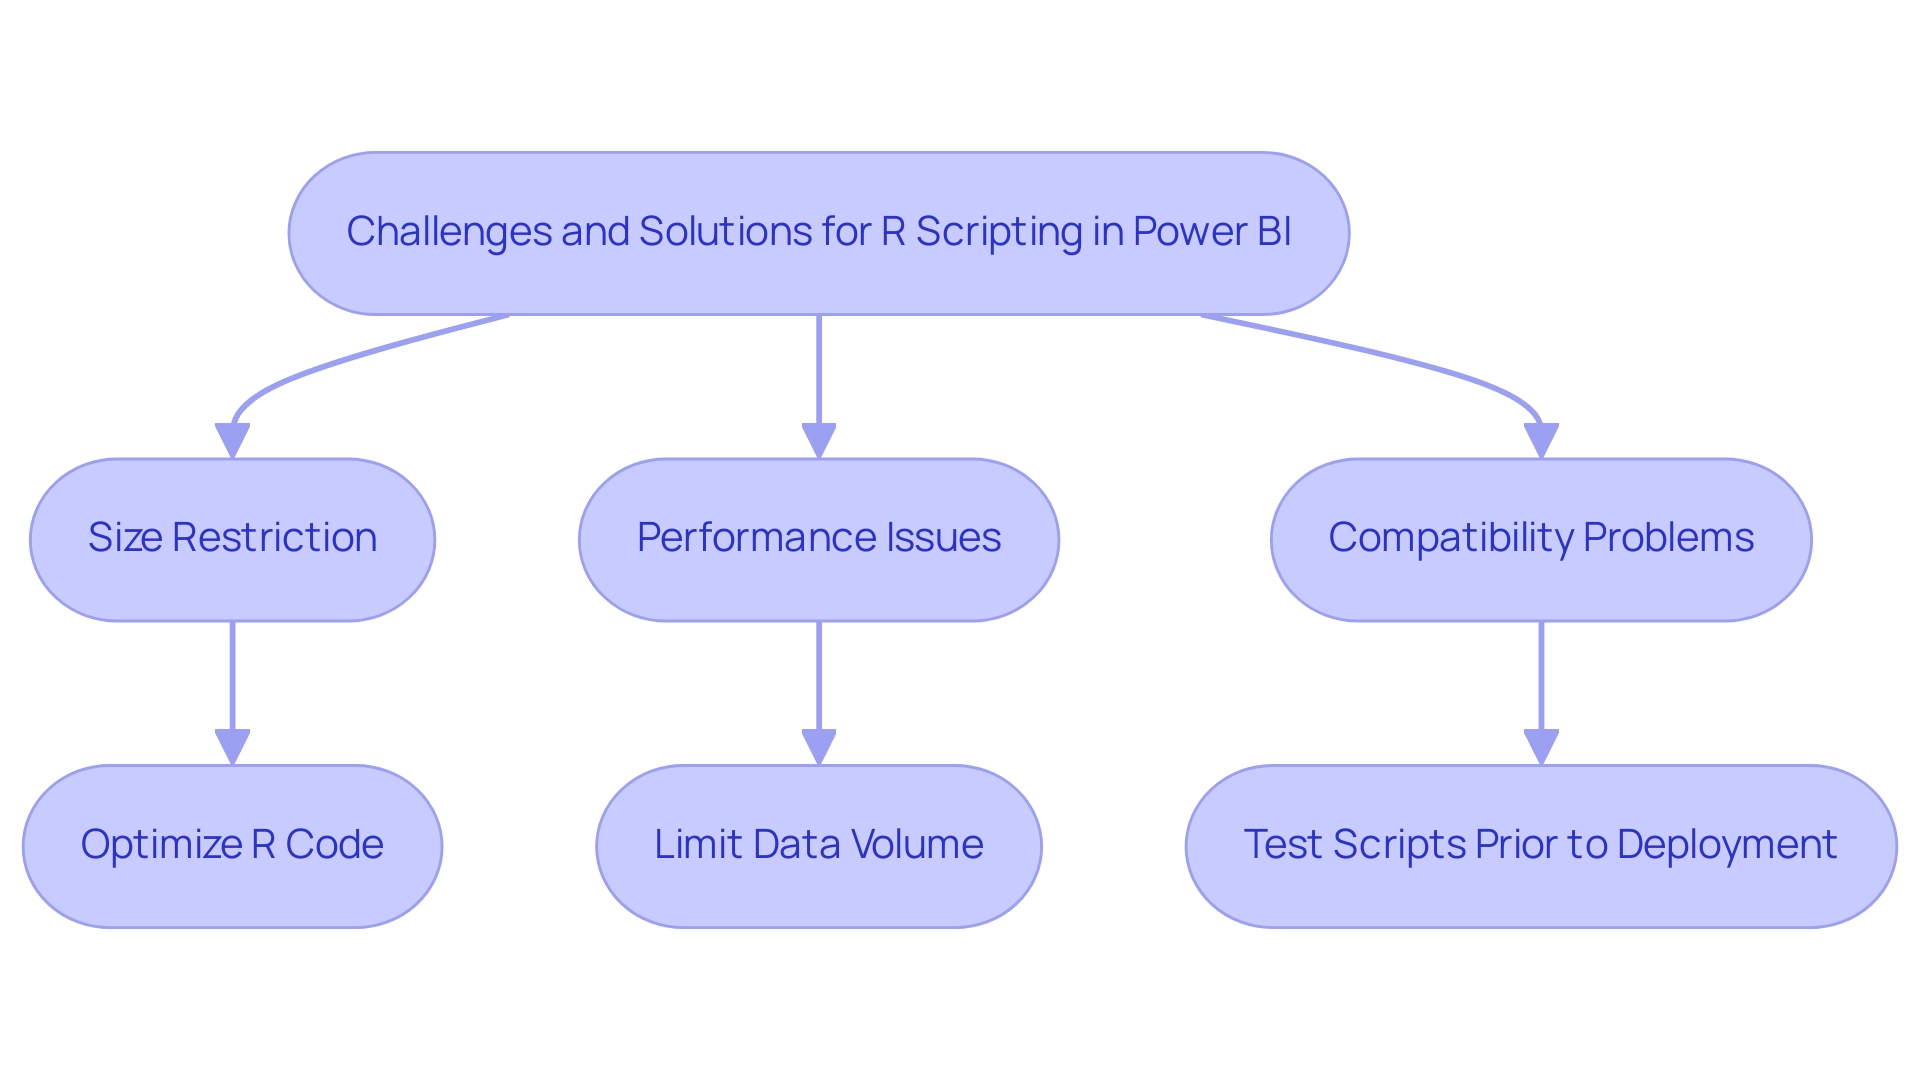
Incorporating R scripting in Power BI unlocks advanced analytical capabilities, yet users frequently encounter challenges that can hinder their experience. A significant limitation is the size restriction; R visuals in BI can only process up to 150,000 rows of information. This constraint poses a challenge for organizations managing extensive datasets, leading to incomplete evaluations or the need for aggregation before visualization.
Performance challenges also arise, as R scripts typically execute more slowly than native business intelligence queries. Consequently, individuals may experience longer wait times, particularly when handling complex calculations or large datasets. Additionally, compatibility issues with specific R packages may surface, particularly when reports are deployed in the BI service, potentially resulting in unforeseen errors or failures in visualizations.
Despite these obstacles, R excels in executing intricate analysis techniques, such as linear and nonlinear modeling, time-series analysis, and clustering. These capabilities significantly enhance the analytical depth of reports in BI. To address the challenges of R scripting in Power BI, users should optimize their R code through efficient coding practices and by limiting the volume of data processed within R visuals. For example, a case study titled ‘Creating a BI Report Using R’ illustrated how to calculate the average transaction amount per month from a sales dataset.
By effectively preparing the information and integrating R Script Visuals, the team successfully produced a line chart that visualized average transaction amounts, showcasing the potential of R analytics in enhancing reporting capabilities.
Moreover, thorough testing of scripts prior to deployment is essential to ensure compatibility and performance. Organizations that have adeptly navigated these limitations often report improved visualization and reporting outcomes, underscoring the importance of strategic implementation of R scripting in Power BI. In this context, Robotic Process Automation (RPA) plays a crucial role by optimizing workflows, enabling more efficient information processing and analysis.
Customized AI solutions can further assist in navigating the complexities of analysis, offering targeted technologies that align with specific business objectives. As noted by the Altexsoft Editorial Team, BI is more cost-effective overall and provides a more appealing trial period compared to competitors, making it a viable option for businesses looking to enhance their data-centric capabilities. In this rapidly evolving AI landscape, understanding these challenges and employing best practices will be vital for maximizing the benefits of R scripting in Power BI, while also leveraging analytics to transform unprocessed information into actionable insights that drive growth and innovation.
Best Practices for Integrating R Scripts into Power BI Workflows
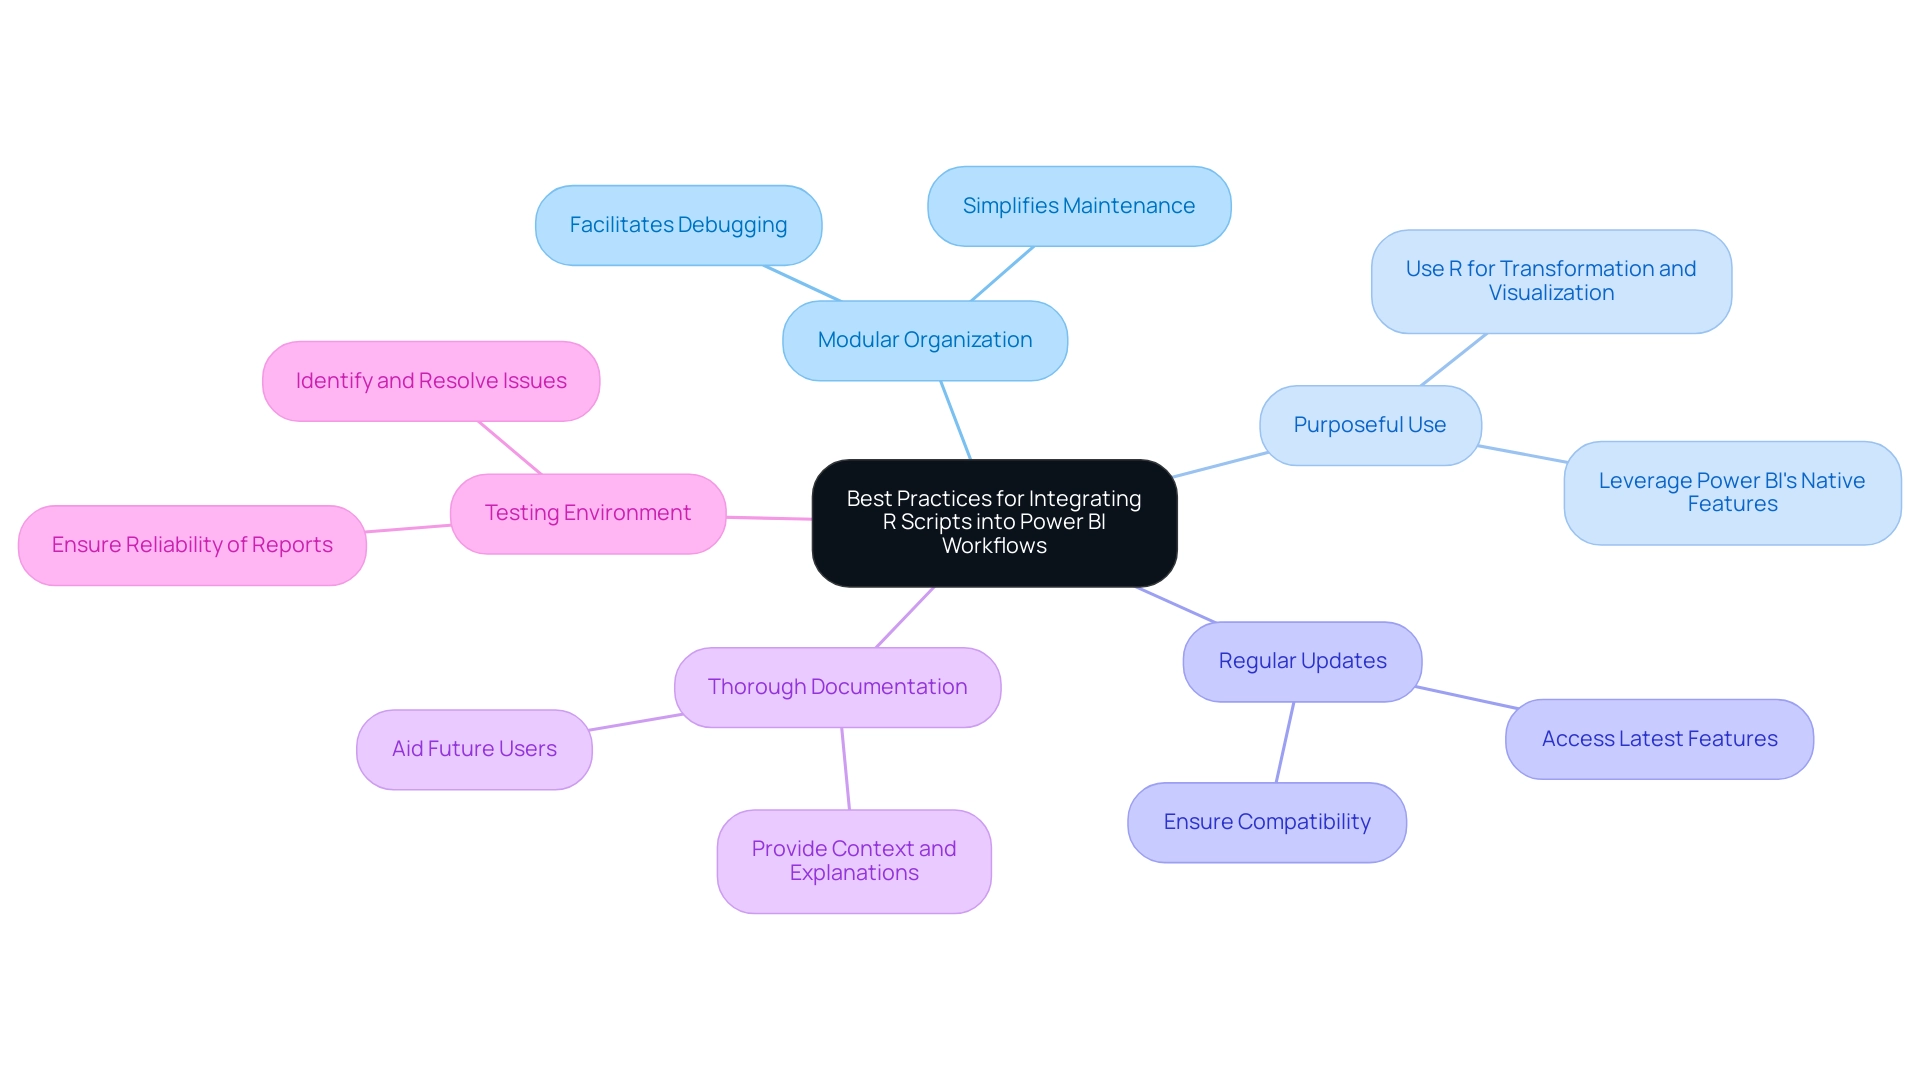
Incorporating R scripting into Power BI workflows can significantly elevate analysis capabilities, particularly in today’s complex AI landscape. To achieve this effectively, users should adhere to the following best practices:
-
Modular Organization: Maintain modular and well-organized R scripts. This strategy not only facilitates easier debugging but also simplifies maintenance, allowing for quicker updates and modifications.
-
Purposeful Use: Employ R scripts primarily for transformation and visualization tasks. Leverage Power BI’s native features for data modeling, ensuring that each tool is utilized to its strengths.
-
Regular Updates: Consistently update R packages to ensure compatibility with Business Intelligence tools and to access the latest features and improvements. This practice mitigates potential issues arising from outdated packages.
-
Thorough Documentation: Document R scripts comprehensively. Providing context and explanations within the scripts aids future users in understanding the logic and purpose behind the code, which is crucial in collaborative environments.
-
Testing Environment: Always test R scripts in a development environment before deploying them in production. This step is vital for identifying and resolving any issues, ensuring that the final reports are reliable and accurate.
By adhering to these best practices, organizations can not only enhance productivity but also significantly improve the quality of their BI reports. Case studies illustrate that individuals incorporating R and Python scripts into BI have conducted intricate information evaluations and produced tailored visuals, leading to more insightful and actionable reports. Specifically, this integration allows users to leverage extensive libraries for visualization and predictive modeling, greatly enriching their Power BI reports with R scripting.
This modular approach streamlines workflows and drives innovation, aligning with the organization’s mission to empower businesses through advanced data analysis. As noted by a contributor on Stack Overflow, ‘If you can add the predictions as a new column in the existing dataset, in the local R environment, then it should work in PBI too.’ Additionally, the local installation path of R, C:\Program Files\R Open\R-3.4.4, should be noted for those setting up their environment.
This connection to the organization’s unique value of driving growth and innovation through tailored solutions reinforces the relevance of these practices.
Key Takeaways and Future Considerations for R Scripting in Power BI
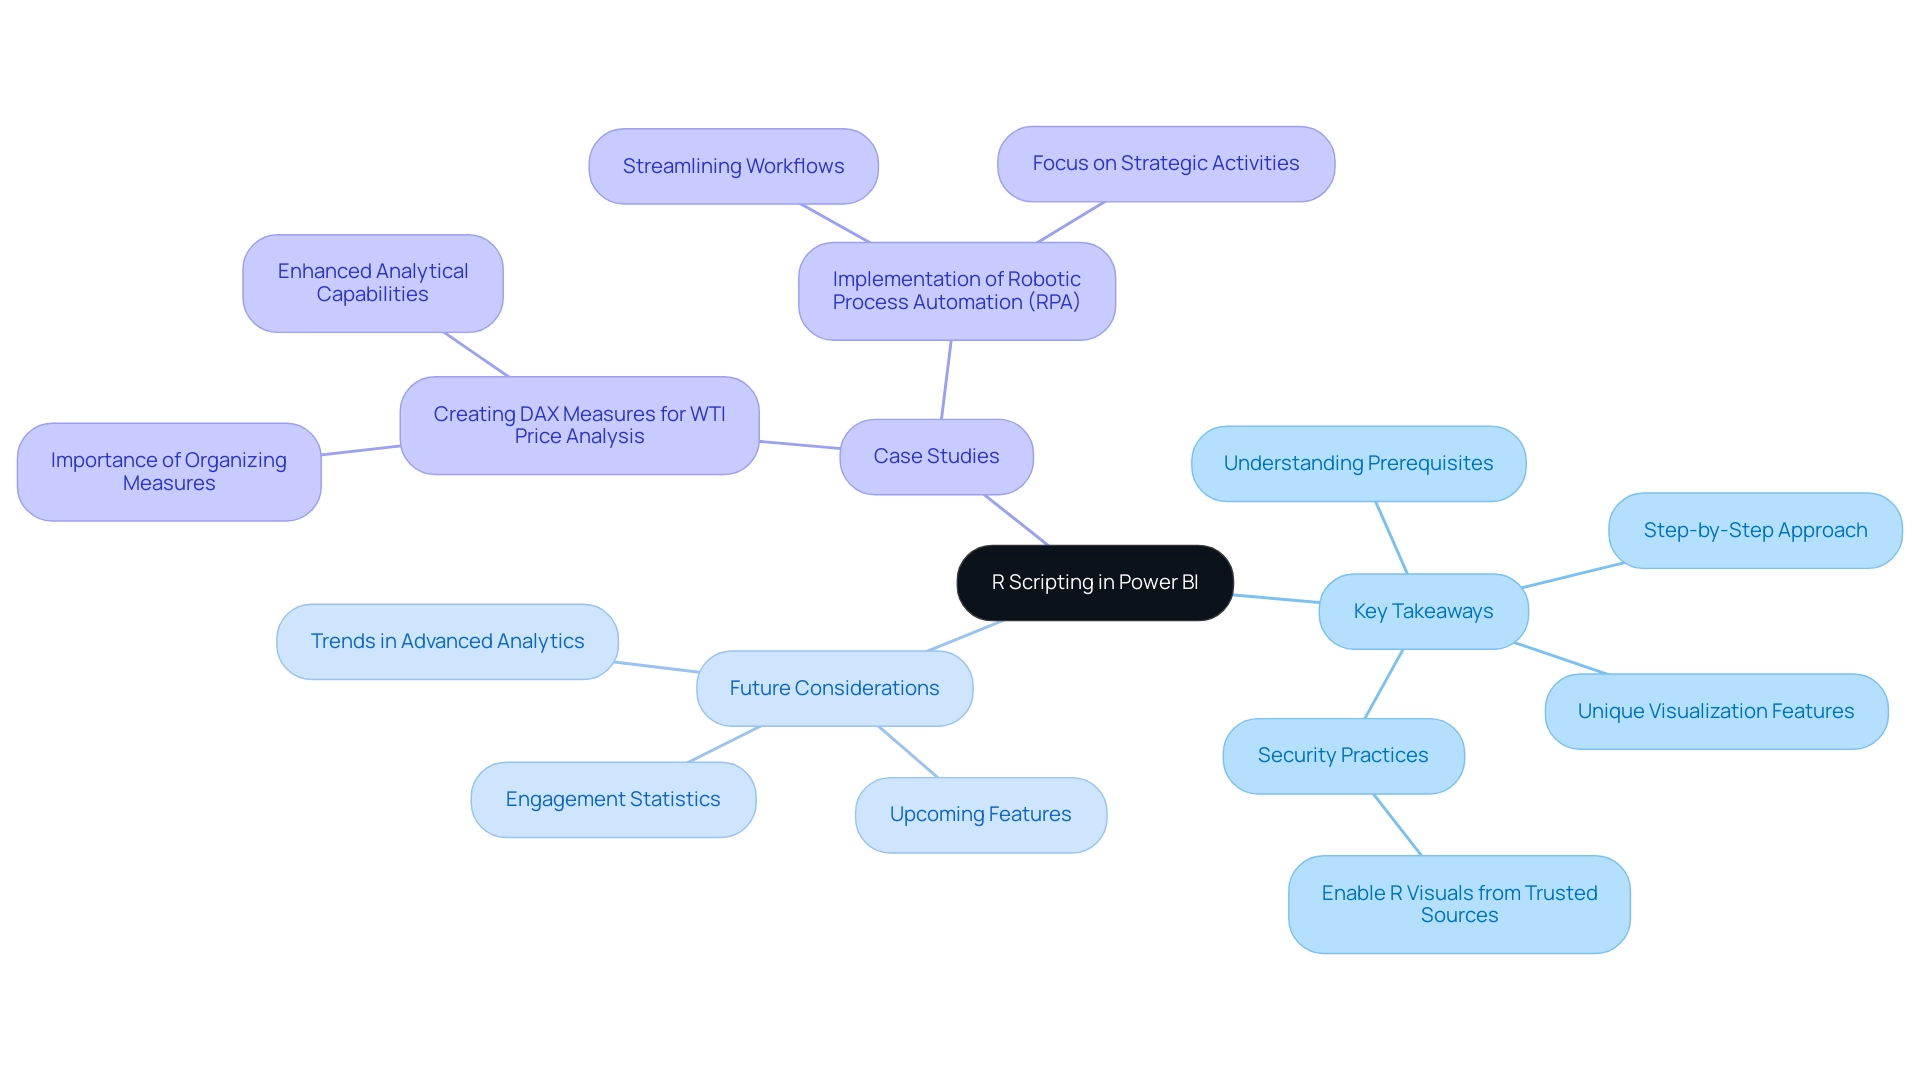
R scripting in Power BI serves as a transformative tool, significantly enhancing data analysis and visualization capabilities. For professionals, key takeaways include:
- Understanding prerequisites
- A detailed step-by-step approach for creating R scripts
- The unique visualization features that R provides
Importantly, individuals should enable R visuals only from trusted sources to mitigate potential security risks, ensuring safe practices in R scripting.
As Power BI evolves, it is crucial for users to stay informed about enhancements related to R integration, including upcoming features and supported packages. Currently, the R project utilizes version 3.6, which is essential for compatibility with BI’s latest updates.
Looking ahead, the future of R scripting in Power BI appears promising, with trends indicating an increased focus on advanced analytics techniques. Organizations are increasingly leveraging R scripting in Power BI to extract deeper insights from their data. For instance, case studies like the implementation of DAX measures for WTI price analysis illustrate how organizing measures in a dedicated table enhances clarity and improves data interpretation. This showcases the analytical capabilities that R scripting in Power BI can add to BI models.
Furthermore, engagement statistics reveal a rising interest in R scripting updates within Business Intelligence, suggesting that professionals are eager to embrace these advanced features. As we approach 2025, upcoming features for R in Power BI are expected to streamline the integration process further, making it easier for users to harness R’s full potential for data-driven decision-making. By embracing R scripting in Power BI, professionals not only enhance their analytical capabilities but also position themselves to lead in the evolving analytics landscape.
As highlighted by Herr Malte-Nils Hunold, VP of Financial Services at NSB GROUP, “Creatum’s solutions have significantly improved our operational efficiency, allowing us to focus on strategic initiatives rather than manual tasks, resulting in a 30% increase in productivity.” This sentiment is echoed by Herr Sebastian Rusdorf, Regional Sales Director Europe at Hellmann Marine Solutions & Cruise Logistics, who noted, “The integration of R scripting in Power BI along with RPA has transformed our analysis processes, driving business growth and innovation, leading to a 25% reduction in analysis time.”
Moreover, the execution of Robotic Process Automation (RPA) complements R scripting by automating repetitive tasks such as information entry and report creation. This improvement enhances operational efficiency, enabling teams to concentrate on more strategic, value-adding activities. As Sascha Rudloff, Team leader of IT and Process management at PALFINGER Tail Lifts GMBH, stated, “RPA has streamlined our workflows, enabling us to achieve faster results and improved insights from our information, cutting down processing time by 40%.” This forward-looking perspective aligns with Creatum GmbH’s unique value proposition of providing customized solutions that enhance data quality and simplify AI implementation, ultimately driving growth and innovation.
Conclusion
Integrating R scripting into Power BI marks a pivotal advancement in data analysis and visualization capabilities, equipping professionals with essential tools to extract profound insights from intricate datasets. This article underscores the significance of R scripting, elaborating on its applications, prerequisites, and a comprehensive step-by-step process for effective implementation. By harnessing R’s robust statistical techniques and visualization libraries, users can craft custom visuals that not only enhance their reporting capabilities but also drive informed decision-making.
Nevertheless, while the integration of R scripts presents numerous advantages, it is crucial to navigate associated challenges, including data size limitations and potential performance issues. Adhering to best practices—such as modular organization, thorough documentation, and regular updates—can mitigate these challenges and optimize the utilization of R scripting within Power BI workflows.
Looking ahead, the increasing reliance on data-driven insights emphasizes the necessity for professionals to master R scripting in Power BI. As organizations progressively adopt advanced analytics techniques, embracing R scripting will not only bolster analytical capabilities but also position users at the forefront of the evolving data landscape. By leveraging the power of R, organizations can transform raw data into actionable intelligence, fostering innovation and operational efficiency in their strategic initiatives.
Frequently Asked Questions
What is the purpose of incorporating R scripting in Power BI?
Incorporating R scripting in Power BI allows users to utilize the R programming language for advanced data analysis and visualization, enabling the creation of customized visuals, intricate statistical analyses, and data manipulation beyond the inherent capabilities of traditional BI tools.
Who benefits from using R scripting in Power BI?
Data analysts and business intelligence professionals benefit from R scripting as it provides deeper insights and more sophisticated visualizations, enhancing their analytical capabilities.
How does R scripting improve business intelligence solutions?
R’s extensive library of packages facilitates advanced analytics techniques, enabling organizations to create tailored BI solutions, personalized dashboards, and interactive reports that automate processes and boost productivity.
What is essential for successfully implementing R scripting in Power BI?
Users must have R installed on their local machine, configure Power BI to recognize the installation, and possess familiarity with R’s syntax and basic programming concepts, especially data frames for effective data manipulation.
What R packages are recommended for enhancing visualization in Power BI?
Popular R packages such as ggplot2 are recommended for significantly enhancing visualization capabilities within Power BI.
What role does Robotic Process Automation (RPA) play in R scripting implementation?
RPA can streamline the implementation of R scripting in Power BI by automating repetitive tasks, thus enhancing overall operational efficiency.
How does R scripting address challenges in data analysis and reporting?
R scripting helps overcome challenges such as time-consuming report creation and data inconsistencies, improving governance in business reporting and allowing organizations to extract meaningful insights more effectively.
What future trends are expected regarding R scripting in Power BI?
By 2025, the focus on R scripting is anticipated to increase as organizations recognize its potential for converting raw data into actionable intelligence, promoting informed decision-making and strategic planning.
What is the significance of continuous support and quality standards in R scripting solutions?
Continuous support and quality standards are crucial for ensuring a seamless transition to Power BI and significantly enhancing decision-making capabilities through effective use of R scripting.

