Overview
This article examines the implementation of the four levels of analytics—Descriptive, Diagnostic, Predictive, and Prescriptive—to significantly enhance operational efficiency within organizations. By systematically applying these levels, organizations can improve decision-making, identify inefficiencies, optimize resources, and drive continuous improvement.
Consider the successful case studies that demonstrate substantial operational gains achieved through data-driven insights and innovative tools.
Are you ready to transform your operations? Embrace these analytics levels to unlock your organization’s full potential.
Introduction
In the dynamic landscape of modern business, harnessing data effectively has become a cornerstone of operational success. The four levels of analytics—Descriptive, Diagnostic, Predictive, and Prescriptive—provide organizations with a structured approach to transforming raw data into actionable insights. Each level plays a critical role in enhancing operational efficiency, from summarizing historical performance to predicting future trends and guiding informed decision-making.
As organizations increasingly recognize the importance of data-driven strategies, understanding how to integrate these analytics levels into operational practices is essential for fostering growth and innovation. This article delves into the significance of each analytics level, outlines practical steps for implementation, and examines the transformative impact of leveraging advanced tools like Robotic Process Automation (RPA) in driving operational excellence.
Understanding the Four Levels of Analytics
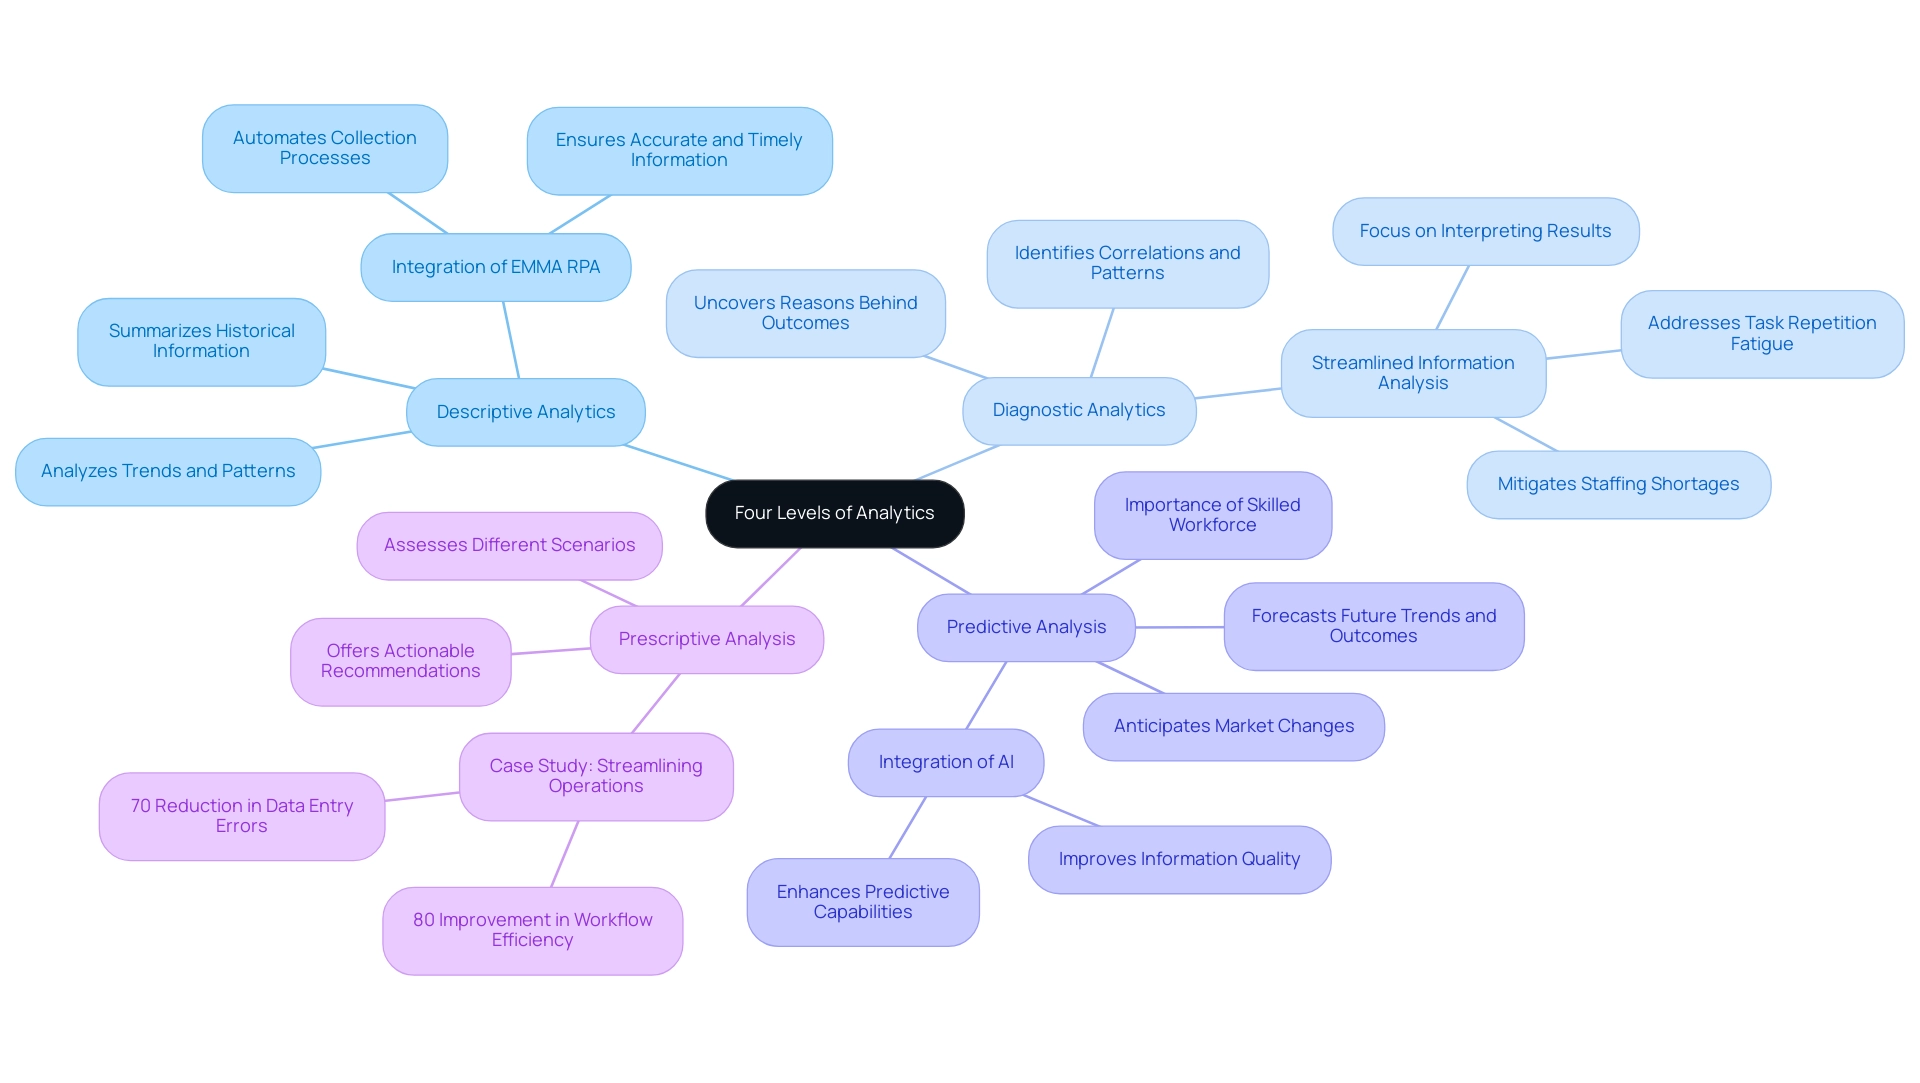
The four levels of analytics—Descriptive, Diagnostic, Predictive, and Prescriptive—form a structured hierarchy, each serving a distinct role in enhancing operational efficiency:
-
Descriptive Analytics: This foundational level summarizes historical information, providing insights into past performance. By analyzing trends and patterns, entities can gain a clearer understanding of what has transpired, which is crucial for informed decision-making. Integrating tools like EMMA RPA from Creatum GmbH can automate collection processes, ensuring that the information used for descriptive analytics is accurate and timely.
-
Diagnostic Analytics: Building on descriptive insights, this level delves deeper to uncover the reasons behind specific outcomes. It identifies correlations and patterns, enabling organizations to understand the factors that influenced past events. RPA solutions from Creatum GmbH can streamline information analysis, allowing teams to focus on interpreting results rather than collecting information. This level is essential for pinpointing areas for improvement and optimizing processes, particularly in addressing task repetition fatigue and staffing shortages.
-
Predictive Analysis: Utilizing historical data, predictive analysis forecasts future trends and outcomes. This level enables entities to anticipate changes in the market or operational environment, allowing for proactive adjustments. A workforce proficient in predictive analysis is vital, as it enhances the organization’s ability to navigate uncertainties effectively. The integration of AI, such as Small Language Models, can further enhance predictive capabilities by improving information quality and analysis efficiency.
-
Prescriptive Analysis: The most advanced level, prescriptive analysis, offers actionable recommendations based on comprehensive data evaluation. It assists entities in making informed choices by assessing different scenarios and their potential effects on key performance indicators. When incorporated with descriptive, diagnostic, and predictive analysis, prescriptive analysis significantly improves an organization’s analytical strategy. A notable case study titled “Streamlining Operations with GUI Automation” illustrates how a mid-sized company improved efficiency by automating data entry and software testing, achieving a 70% reduction in data entry errors and an 80% improvement in workflow efficiency.
Recent developments in analytics underscore the importance of the four levels of analytics in 2025. As entities increasingly depend on data-driven insights, aligning key performance indicators (KPIs) across departments becomes critical. Misalignment can undermine the efforts of data teams, as discussed in an upcoming co-written article on the importance of standardizing KPIs within organizations.
Real-world examples demonstrate the effectiveness of these data levels. For instance, a company utilizing prescriptive analysis was able to optimize its supply chain operations, resulting in a 15% reduction in costs while improving delivery times. Such case studies illustrate how utilizing the complete range of data analysis, alongside innovative tools like EMMA RPA and Microsoft Power Automate from Creatum GmbH, can result in significant operational enhancements.
In summary, the four levels of analytics are not simply instruments for examination; they are crucial elements of a structured method for comprehending and improving business processes. As Dylan aptly stated, “Analytics isn’t just about creating dashboards or running reports. It’s about creating a systematic approach to understanding your business through information.” Embracing these analytics levels equips entities to drive growth and innovation in an increasingly data-rich environment.
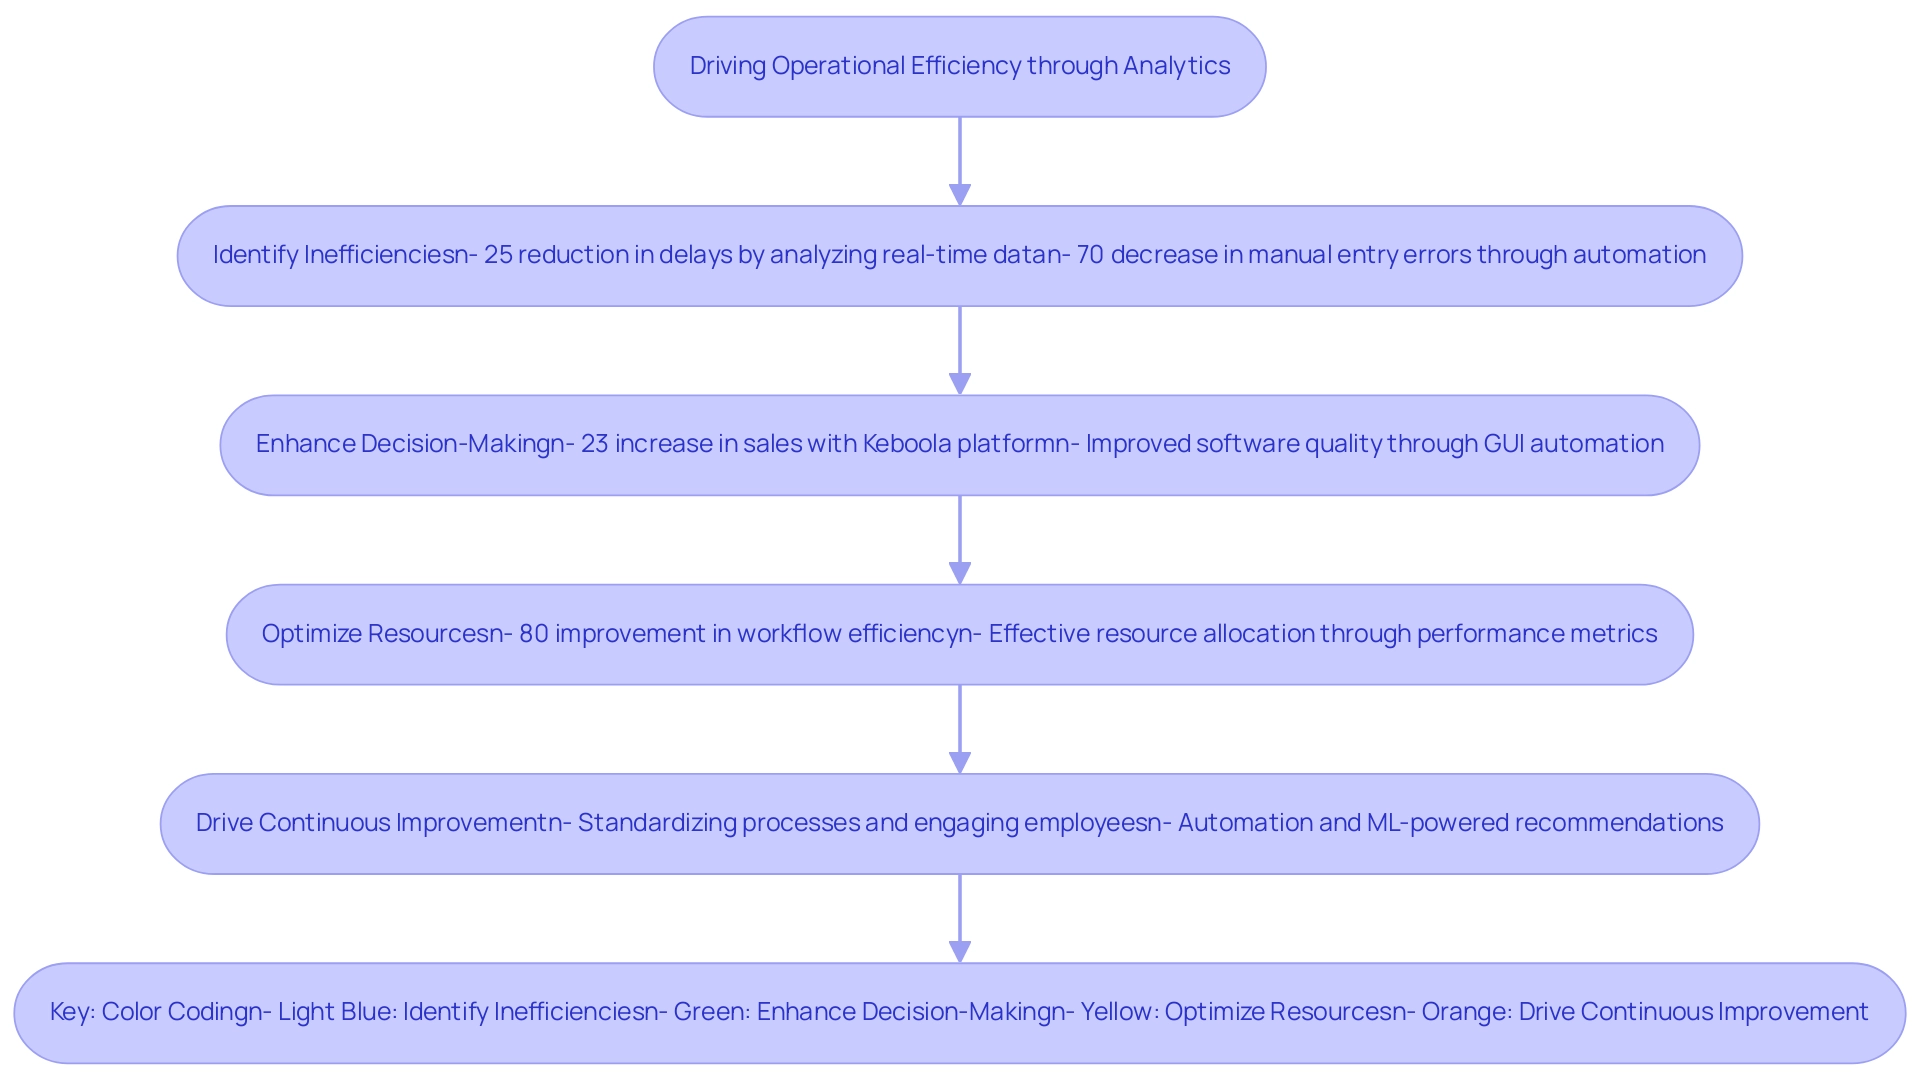
The Importance of Analytics in Operational Efficiency
Analytics play a crucial role in driving operational efficiency by empowering organizations to:
-
Identify Inefficiencies: Through comprehensive data analysis, businesses can uncover specific areas where processes are underperforming. For instance, a major airline successfully reduced delays by 25% by utilizing real-time information analysis to streamline operations. Similarly, a mid-sized firm enhanced efficiency by automating entry, software testing, and legacy system integration using GUI automation from Creatum GmbH, significantly decreasing manual entry errors by 70%.
-
Enhance Decision-Making: Data-driven insights facilitate more informed decision-making, moving away from reliance on intuition. Organizations like Slevomat have experienced a 23% increase in sales after implementing the Keboola data innovation platform, showcasing the power of analytics in shaping strategic choices. Additionally, the implementation of GUI automation from Creatum GmbH enhanced software quality and operational efficiency, revolutionizing processes in healthcare service delivery.
-
Optimize Resources: Analytics enable effective resource allocation, ensuring that teams concentrate on high-impact activities. By evaluating performance metrics and documenting workflows, companies can identify bottlenecks and optimize their operations, leading to improved efficiency. The mid-sized company mentioned earlier achieved an 80% improvement in workflow efficiency through streamlined processes.
-
Drive Continuous Improvement: Regular analysis fosters a culture of ongoing enhancement, enabling entities to adapt swiftly to evolving business landscapes. Best practices for implementing Operational Performance Analysis emphasize the importance of standardizing processes, using performance metrics, engaging employees in the process, and leveraging technology for enhanced decision-making. As noted by Jonathan Wagstaff, Director of Market Intelligence at DCC Technology, “The aspects that truly captured the attention of the management team were much of the automation work the team was undertaking—utilizing Python scripts to automate very complex, large processing tasks.” Automating manual processes and creating ML-powered recommendation engines was where we were freeing up a lot of time for the teams and very quickly making an impact and ROI.
In 2025, the significance of data analysis in efficiency continues to expand, as organizations increasingly acknowledge its worth in improving performance and fostering growth. By harnessing the potential of analysis, companies can convert unrefined information into practical insights, ultimately resulting in more strategic and efficient operations. Client testimonials further highlight the transformative impact of Creatum GmbH’s technology solutions, emphasizing how GUI automation has driven significant improvements in efficiency and business growth.
Testimonials:
- Herr Malte-Nils Hunold, VP Financial Services, NSB GROUP
- Herr Sebastian Rusdorf, Regional Sales Director Europe, Hellmann Marine Solutions & Cruise Logistics
- Sascha Rudloff, Teamleader of IT- and Processmanagement, PALFINGER Tail Lifts GMBH – ganderkesee
Level 1: Descriptive Analytics – Analyzing Past Performance
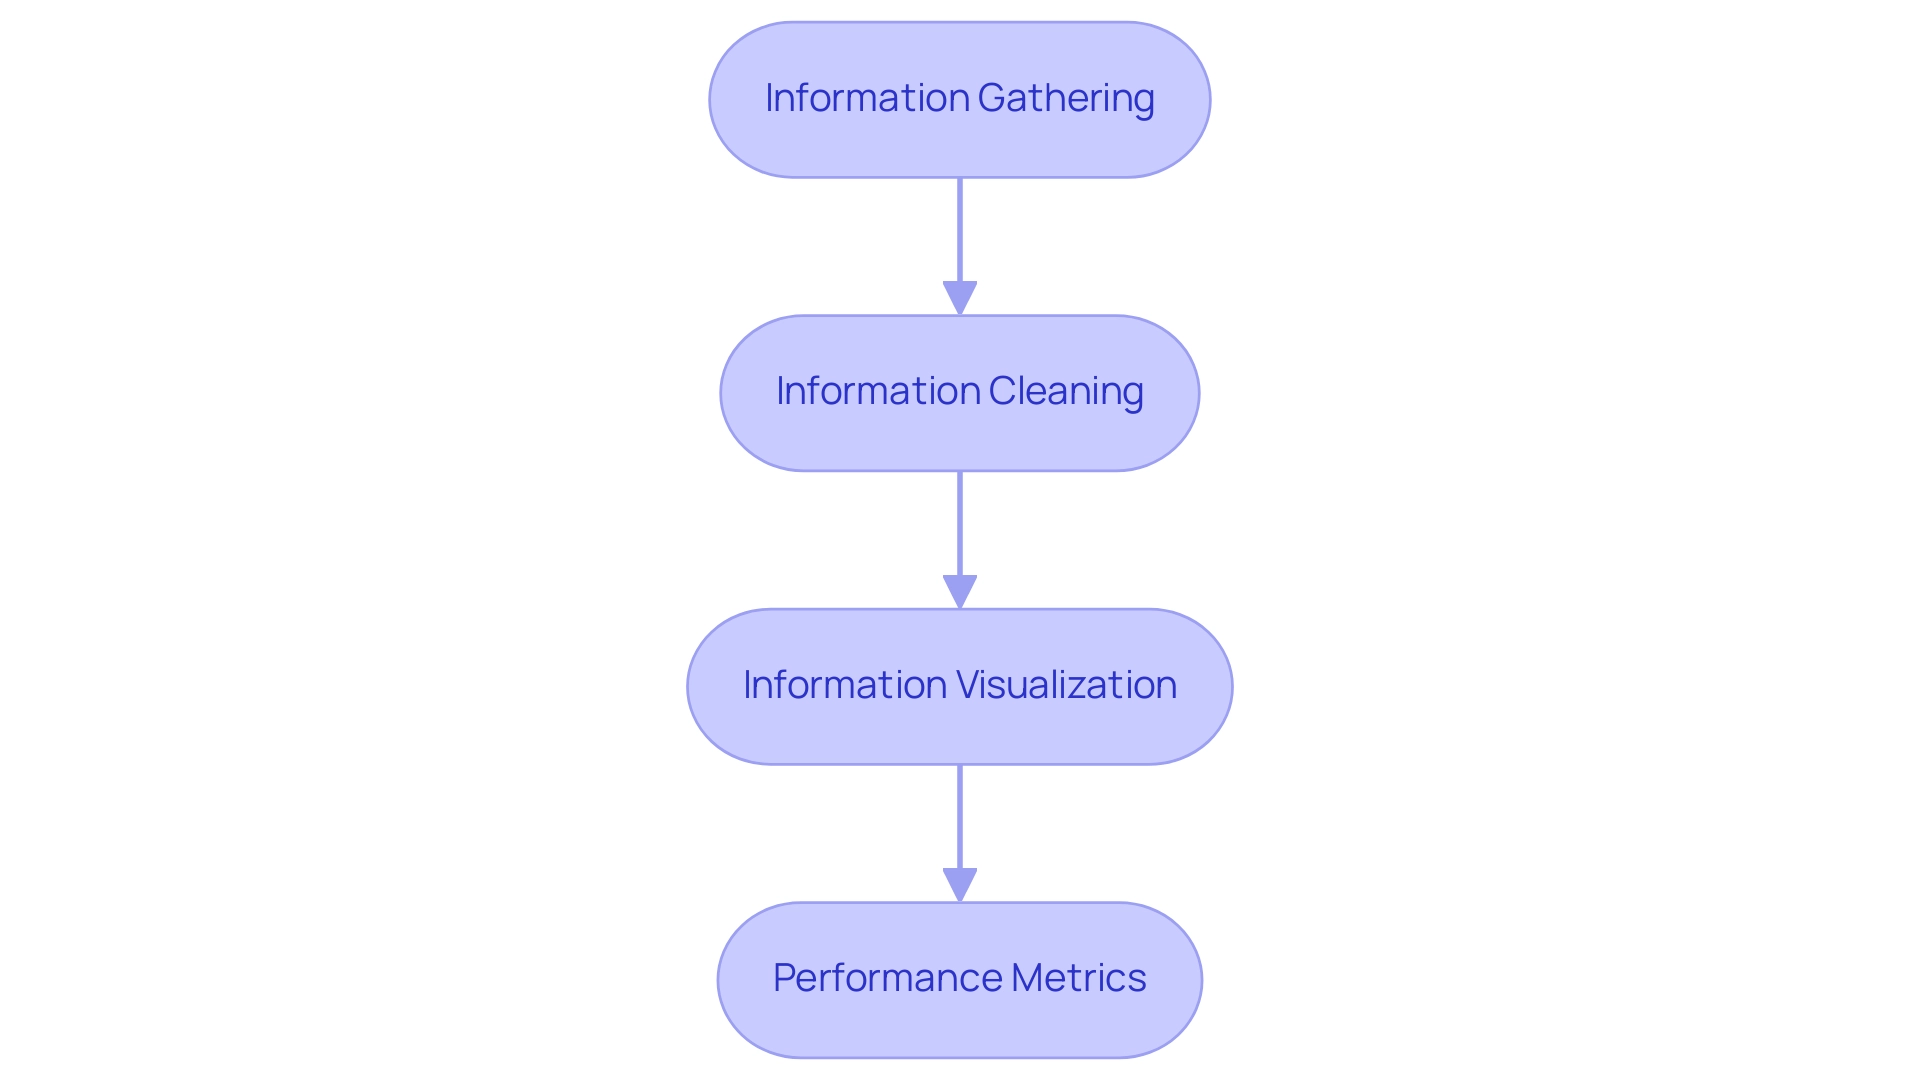
Descriptive analytics serves as a pivotal process that systematically collects and analyzes historical data to summarize past performance and inform future strategies. The following key steps are essential for effective implementation:
-
Information Gathering: Initiate the process by collecting relevant information from diverse sources, such as sales reports, operational logs, and customer feedback. This comprehensive approach ensures a holistic view of performance metrics.
-
Information Cleaning: Ensuring the accuracy of collected information is vital. Trustworthy insights stem from high-quality data, significantly impacting decision-making processes. Leveraging Robotic Process Automation (RPA) can streamline this process, reducing manual errors and freeing up resources for more strategic tasks.
-
Information Visualization: Utilizing charts, graphs, and dashboards enhances clarity and accessibility. Effective information visualization enables stakeholders to promptly identify trends and patterns, facilitating informed discussions and strategic planning. For instance, entities like Netflix employ descriptive analytics to visualize viewer habits, informing their content development strategy and enhancing audience engagement. Our Power BI services can further elevate data reporting, providing actionable insights through features like the 3-Day Power BI Sprint for rapid report creation and the General Management App for comprehensive management.
-
Performance Metrics: Establishing key performance indicators (KPIs) is essential for measuring success and tracking progress over time. For example, a group aiming for 500,000 monthly unique page views would be underperforming at 200,000 halfway through the month, as they should be at 250,000. By defining clear metrics, companies can assess their performance against set goals, enabling them to pivot strategies as necessary.
The effectiveness of descriptive analysis in performance measurement is underscored by recent statistics, indicating that organizations leveraging these insights can enhance operational efficiency by up to 30%. Moreover, the most recent trends in 2025 emphasize a growing dependence on sophisticated visualization tools that incorporate artificial intelligence, enabling real-time assessments and a deeper understanding of performance metrics. Our customized AI solutions, including Small Language Models and GenAI Workshops, address challenges such as poor information quality and governance, ensuring businesses can make informed decisions based on trustworthy data.
Catherine Cote, Marketing Coordinator at Harvard Business School Online, underscores the importance of adopting descriptive analysis, stating, “Organizations must utilize information to stay competitive and drive growth in a shifting market.”
Incorporating best practices for descriptive analytics, such as regular audits and stakeholder engagement in the visualization process, can further enhance the effectiveness of these initiatives. By adhering to these steps, entities can not only analyze past performance but also strategically position themselves for future growth. Additionally, the unique value of Creatum GmbH lies in providing customized solutions that enhance data quality and simplify AI implementation, ultimately driving growth and innovation.
Level 2: Diagnostic Analytics – Understanding Causes
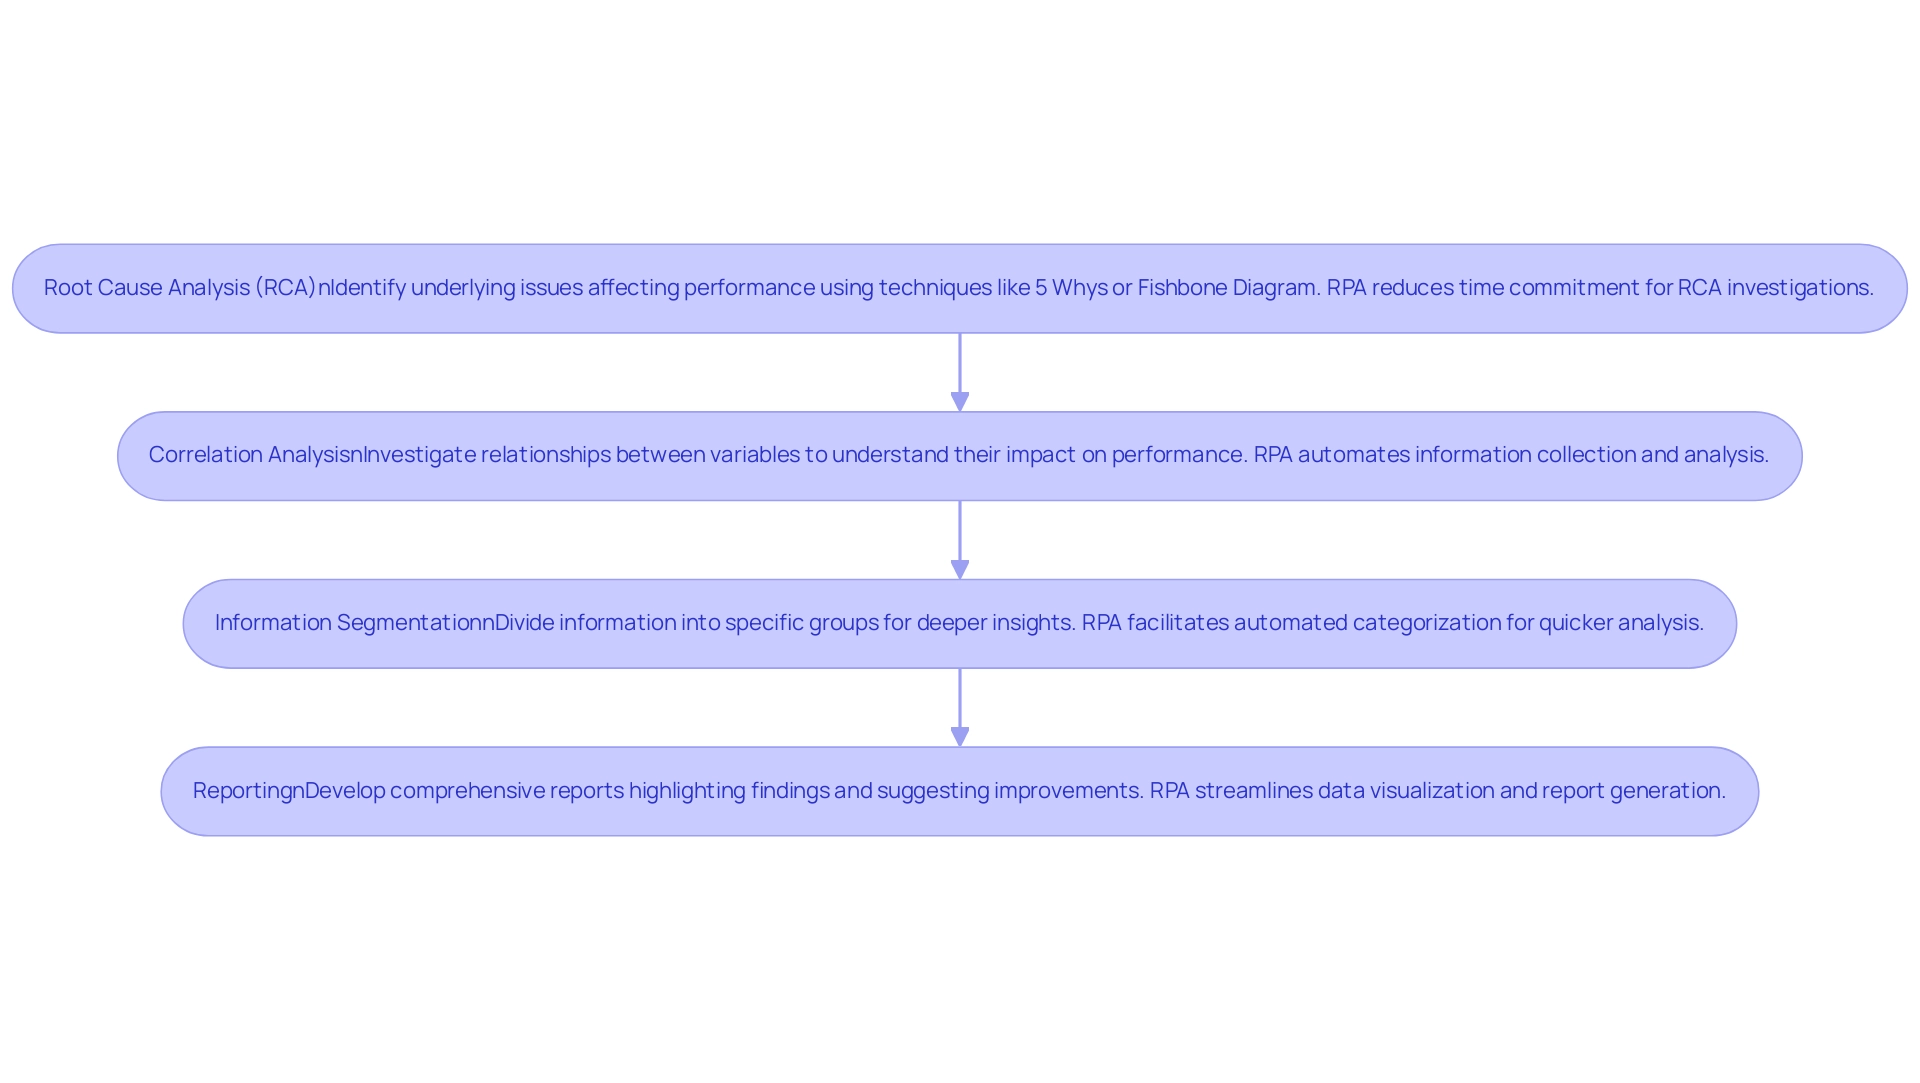
Diagnostic analysis is essential for uncovering the reasons behind past performance, enabling organizations to make informed decisions for future improvements. To effectively implement this level of analytics, consider the following steps, enhanced by the integration of Robotic Process Automation (RPA) to streamline processes, reduce errors, and improve operational efficiency:
-
Root Cause Analysis (RCA): Employ techniques such as the 5 Whys or Fishbone Diagram to systematically identify the underlying issues affecting performance. A study conducted in a children’s hospital demonstrated that RCA could effectively generate action plans to address adverse events, achieving nearly complete implementation of these plans. As noted by Morse and Pollack, “This study demonstrated that RCAs can be used effectively to generate moderate- and high-impact action plans to address a wide range of adverse events within a children’s hospital, with almost complete implementation of the action plans being achieved.” This emphasizes the practical usefulness of RCA in promoting enhancements. Furthermore, incorporating RPA can significantly decrease the time commitment needed for RCA investigations, which can last up to 20 hours for a nurse, thus improving efficiency and enabling staff to concentrate on more strategic tasks.
-
Correlation Analysis: Investigate the relationships between various variables to understand their impact on performance. Current trends indicate that correlation analysis is increasingly being utilized to enhance diagnostic analytics, allowing organizations to pinpoint factors that significantly influence outcomes. For example, identifying correlations between staffing levels and patient outcomes can lead to strategic adjustments that improve operational efficiency. RPA can aid in automating information collection and analysis, making this process more efficient and less susceptible to human error, ultimately freeing up team members for higher-level decision-making.
-
Information Segmentation: Dividing information into specific groups or time periods can yield deeper insights. By analyzing subsets of information, organizations can uncover trends and patterns that may not be visible in combined figures. This method is particularly useful in healthcare settings, where understanding patient demographics can inform targeted interventions. RPA can facilitate the segmentation process by automating the categorization of information, allowing for quicker and more accurate analysis, thus addressing the challenges posed by manual, repetitive tasks.
-
Reporting: Develop comprehensive reports that not only highlight findings but also suggest actionable areas for improvement. The narrative element in analysis tools such as Qlik can improve the communication of these findings, making it simpler for stakeholders to understand the significance of the information. This feature allows analysts to effectively convey their insights, ensuring that the information is accessible and actionable. RPA can streamline the reporting process by automating data visualization and report generation, saving valuable time for analysts and reducing the likelihood of errors.
Integrating these steps into your approach to the 4 levels of analytics, supported by RPA, can result in considerable enhancements. By utilizing these techniques, companies can improve their efficiency and promote significant change, ultimately contributing to business growth. The research supporting these findings was funded by the PROMETEO Research Program, Generalitat Valenciana, reinforcing the significance of the study’s outcomes.
Furthermore, as the AI landscape continues to evolve, integrating RPA becomes increasingly vital for organizations to stay competitive and responsive to changing demands.
Level 3: Predictive Analytics – Anticipating Future Trends
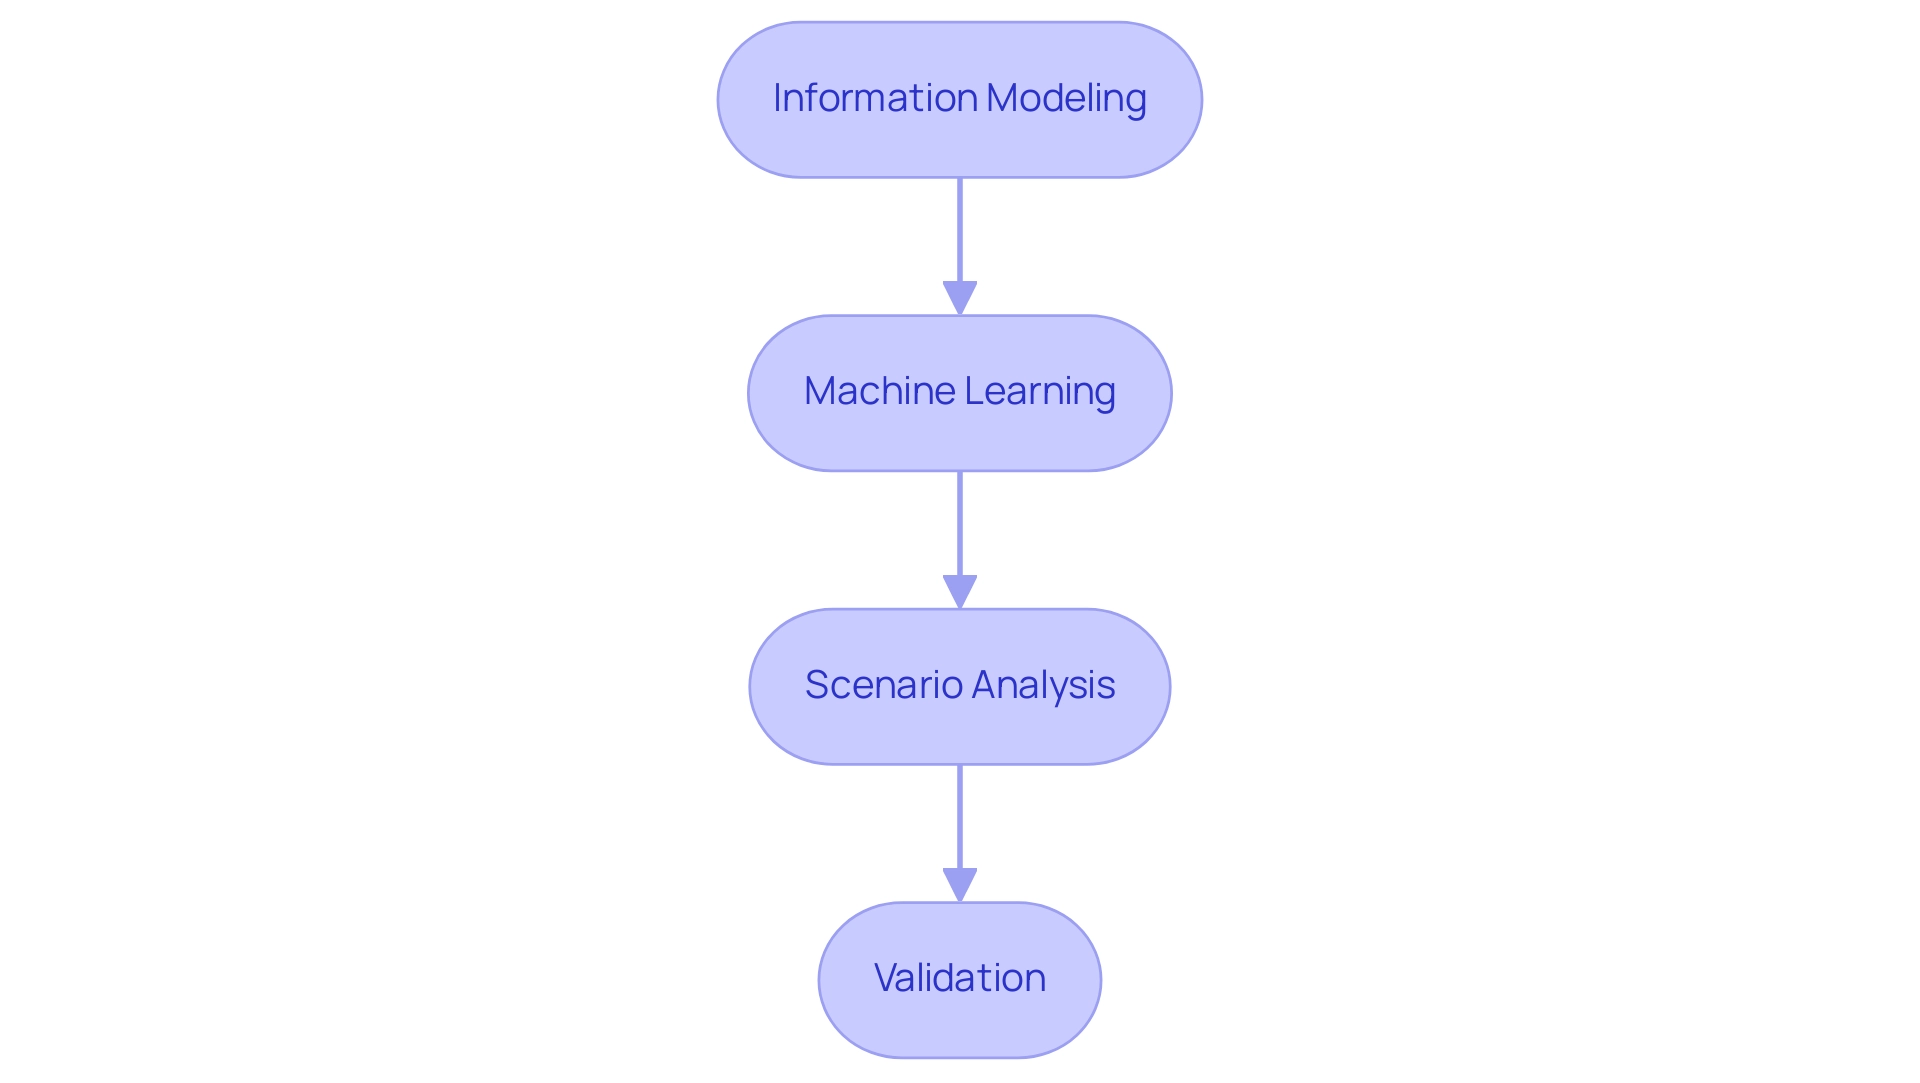
Predictive analytics stands as one of the four levels of analytics, leveraging historical information to forecast future outcomes and significantly enhancing operational efficiency. The process comprises several key steps:
-
Information Modeling: This foundational step involves developing statistical models that analyze historical information to identify patterns and predict future trends. Effective information modeling is essential for creating reliable forecasts that inform strategic decisions, particularly in improving quality through tailored AI solutions offered by Creatum GmbH.
-
Machine Learning: Implementing machine learning algorithms allows organizations to significantly enhance the accuracy of their predictions. These algorithms learn from new information over time, enabling continuous improvement in forecasting capabilities. For instance, companies like PepsiCo have employed machine learning to merge retailer information with supply chain insights through their Sales Intelligence Platform, effectively forecasting out-of-stocks and enhancing inventory management. This aligns with advancements in AI, such as Small Language Models, which facilitate efficient analysis and enhance privacy. Additionally, Creatum GmbH’s GenAI Workshops provide hands-on training to further bolster these capabilities.
-
Scenario Analysis: This step involves creating various scenarios to explore potential outcomes based on different inputs. By simulating different conditions, businesses can better understand the range of possible futures and prepare accordingly, addressing data inconsistency and governance challenges in business reporting for enhanced decision-making.
-
Validation: Regular validation of predictive models against actual outcomes is critical to ensure their reliability. This process enables entities to adjust their models as necessary, maintaining accuracy in their forecasts. A notable case study on emergency department volume prediction during the COVID-19 pandemic revealed that the accuracy of predictions dropped to approximately 64% of pre-pandemic levels. However, post-pandemic, forecasting ability improved to about 78.57%, underscoring the importance of ongoing validation and adjustment in predictive modeling.
The advancements in predictive modeling as of 2025 emphasize the significance of machine learning in refining forecasting accuracy. Experts concur that incorporating machine learning into predictive analysis not only improves the accuracy of forecasts but also allows organizations to react swiftly to emerging trends and anomalies, such as unusual spending patterns in financial sectors. Furthermore, utilizing Robotic Process Automation (RPA) plays a crucial role in automating manual workflows, improving efficiency, and driving data-driven insights.
Predictive analysis also plays a crucial role in risk and fraud forecasting by identifying anomalies and atypical behavior, enabling rapid responses to potential threats. As entities navigate a data-rich landscape, executing these measures in predictive analysis will be essential for fostering growth and operational effectiveness, backed by Creatum GmbH’s Business Intelligence services.
Level 4: Prescriptive Analytics – Making Informed Decisions
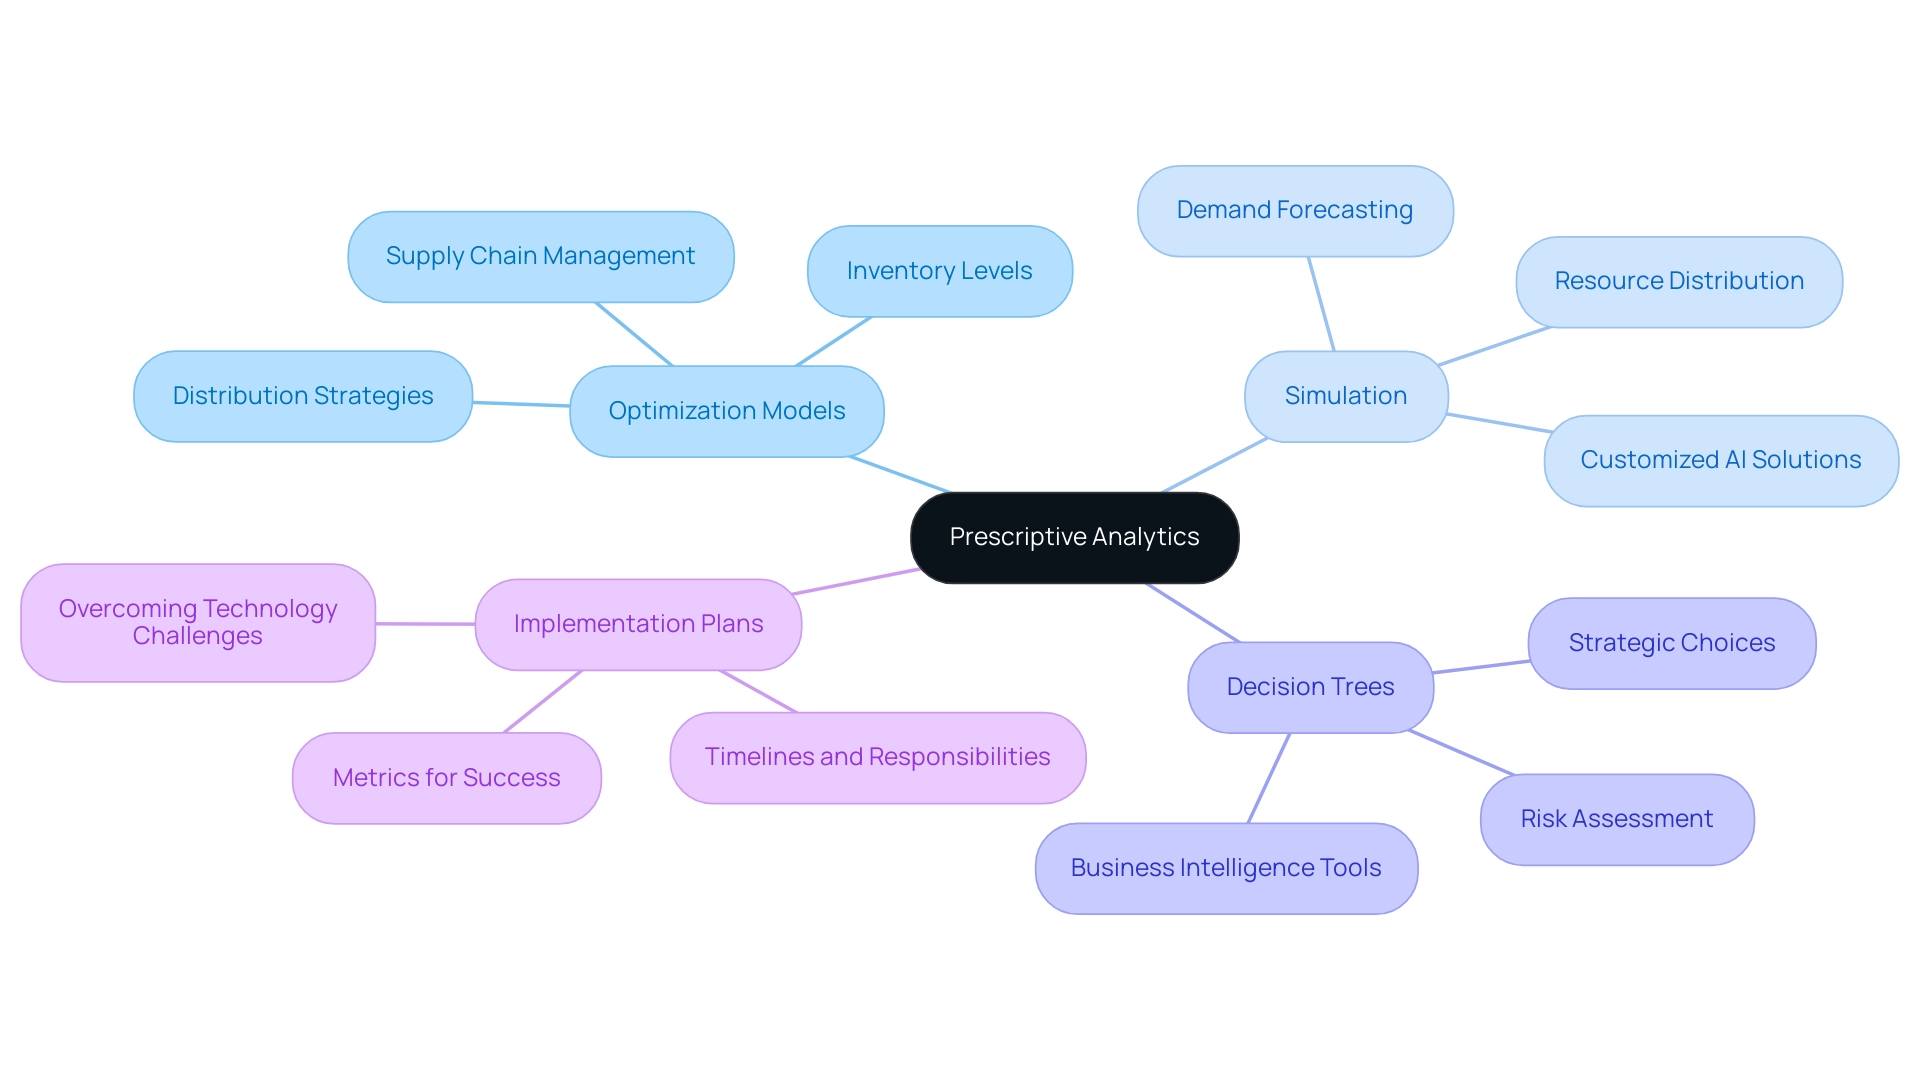
Prescriptive analysis plays a vital role in directing entities toward informed decision-making by offering actionable recommendations derived from extensive data examination. Implementing this level of analytics involves several key steps:
-
Optimization Models: These mathematical frameworks are essential for identifying the most effective course of action while considering various constraints and objectives. For instance, entities can leverage optimization models to enhance supply chain management, which accounted for the largest market revenue share in 2023, by determining optimal inventory levels and distribution strategies. This approach not only enhances efficiency but also aligns with the strategic objectives of the entity, particularly when integrated with Robotic Process Automation (RPA) from Creatum GmbH to streamline manual workflows.
-
Simulation: Running simulations allows businesses to test different strategies and assess their potential outcomes under varying conditions. This method is especially beneficial in dynamic settings, where organizations like Uber employ historical information to forecast demand and enhance driver placement during peak periods, ensuring effective resource distribution. By incorporating customized AI solutions from Creatum GmbH, businesses can further refine their simulations to align with specific challenges.
-
Decision Trees: Creating decision trees helps visualize possible actions and their consequences, facilitating clearer decision-making processes. This method enables teams to weigh the potential risks and rewards associated with each option, ultimately leading to more strategic choices. The integration of Business Intelligence tools from Creatum GmbH can enhance this process by providing deeper insights into data trends, boosting efficiency and reducing errors.
-
Implementation Plans: Developing comprehensive plans for executing recommendations is vital. These plans should outline specific timelines, assign responsibilities, and establish metrics for success. By doing so, companies can ensure that the insights obtained from prescriptive analysis translate into tangible actions that drive operational efficiency, especially when overcoming technology implementation challenges with RPA from Creatum GmbH.
Current trends indicate that North America dominated the prescriptive data analysis market with a 36.3% share in 2023, driven by its advanced technological infrastructure and strong adoption of AI-driven solutions. This dominance shapes trends and practices in decision-making processes, as entities increasingly depend on advanced data analysis to steer their strategies. As we approach 2025, the most recent advancements in prescriptive analysis highlight the significance of the four levels of analytics and optimization models in decision-making.
Experts concur that these models not only improve the precision of predictions but also enable entities to make proactive decisions that align with their strategic goals.
Data shows that entities utilizing prescriptive analysis experience considerable enhancements in decision-making efficiency, resulting in improved operational performance. For instance, the case study named ‘Business Intelligence Empowerment’ demonstrates how firms have effectively utilized prescriptive analysis to generate actionable recommendations, ultimately converting raw information into valuable insights that promote growth and innovation. As Catherine Cote, Marketing Coordinator at Harvard Business School Online, states, “Enhancing your data analysis skills can enable you to capitalize on insights your information provides and advance your career and institution.”
This emphasizes the crucial role that data analysis skills play in effective decision-making.
Integrating the Four Levels of Analytics into Operational Strategies
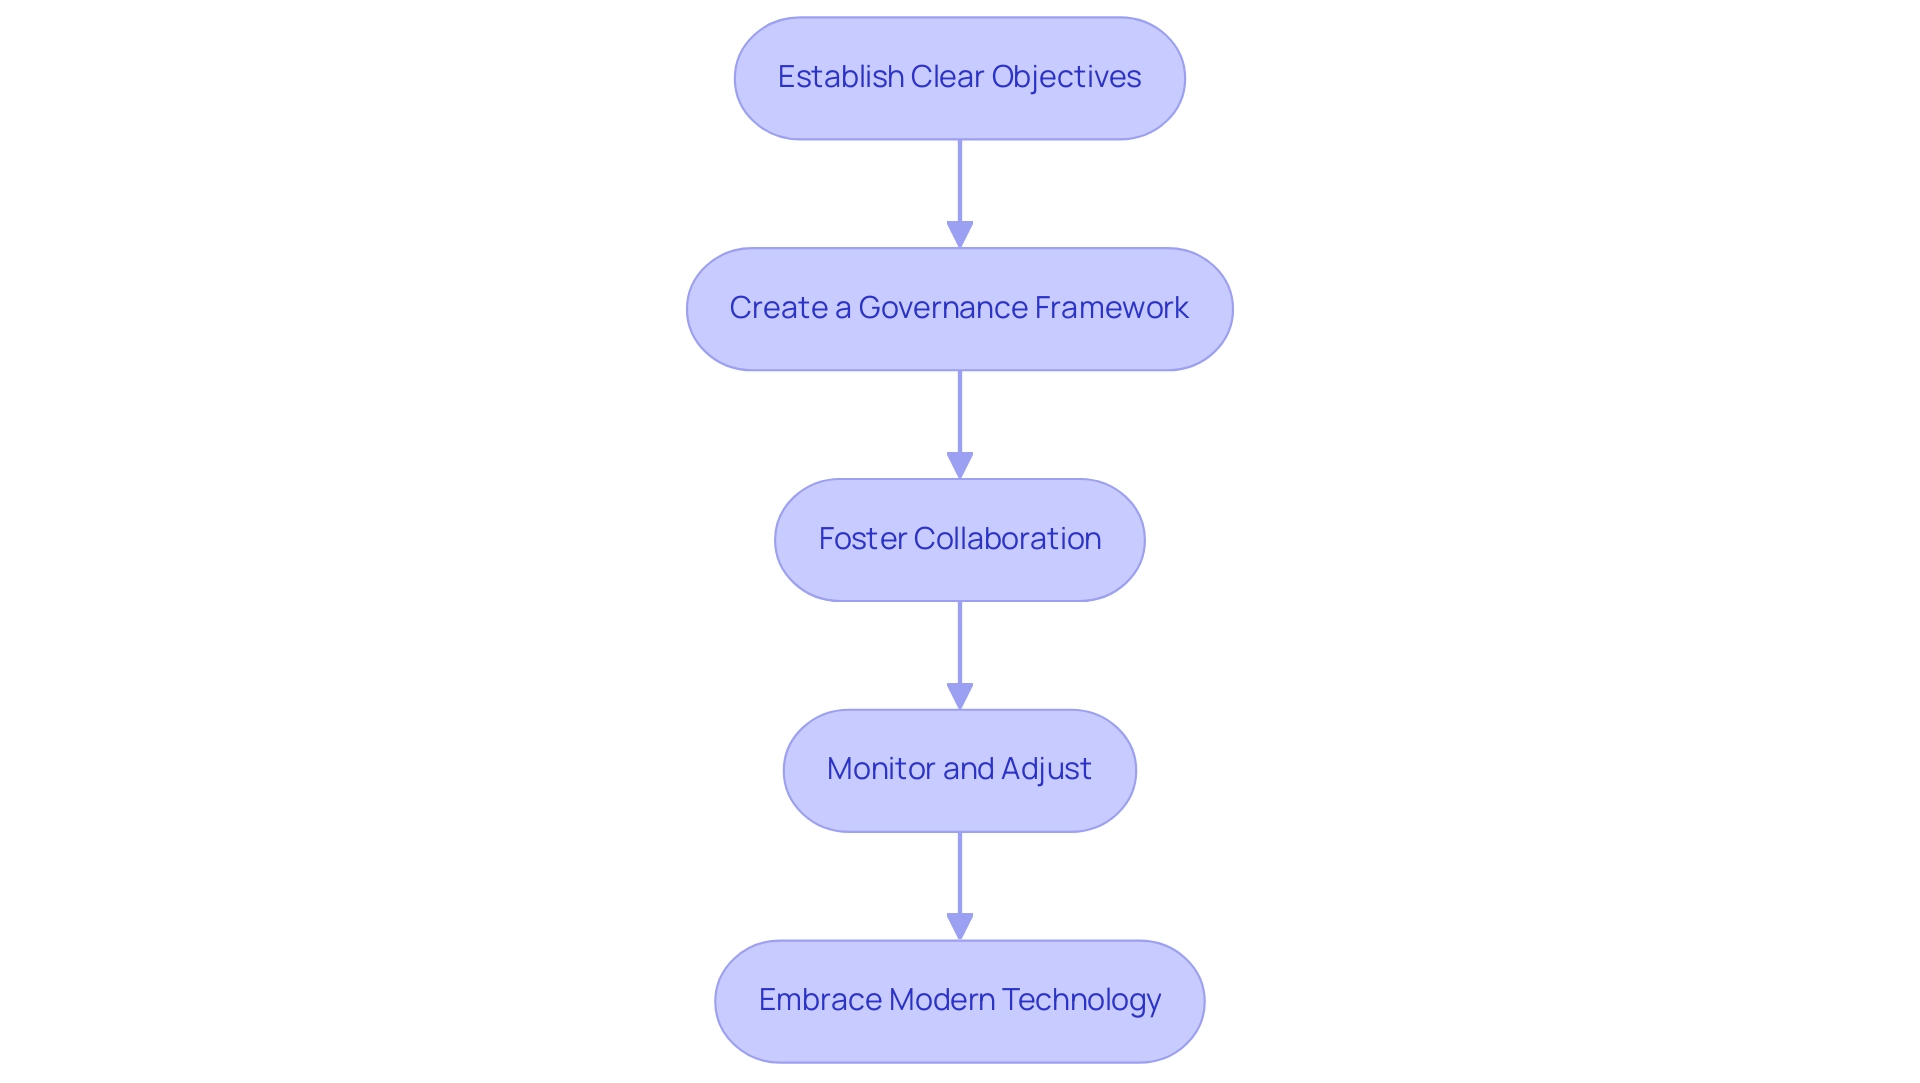
To effectively incorporate the four tiers of analysis into functional strategies, organizations should consider the following steps:
-
Establish Clear Objectives: Clearly define the goals for each of the four levels of analytics. This ensures that analytics efforts align with business objectives, enabling teams to focus on outcomes that drive operational efficiency.
-
Create a Governance Framework: Implement a robust governance framework to guarantee quality and accessibility. With the rise of privacy regulations like GDPR and CCPA, establishing governance protocols is essential for compliance and effective management. Data governance has become increasingly critical in 2024, prompting entities to adopt AI-powered governance tools to enforce policies and ensure compliance across distributed data environments.
-
Foster Collaboration: Encourage cross-departmental collaboration to share insights and strategies. By dismantling barriers, entities can utilize various viewpoints and skills, resulting in more thorough analysis results. For instance, Planet Fitness successfully partnered with Coherent Solutions to enhance customer intelligence, resulting in a 360-degree view of its members and improved service personalization.
-
Monitor and Adjust: Regularly review data outcomes and modify strategies based on findings. Continuous monitoring allows organizations to refine their approaches and respond to changing business needs. For example, JPMorgan Chase utilized big data analysis to enhance its credit risk assessment capabilities, improving loan underwriting accuracy and significantly lowering default rates. This illustrates the effect of iterative adjustments in data strategies.
-
Embrace Modern Technology: Stay informed about the evolving landscape of data analysis technology. Leveraging Robotic Process Automation (RPA) from Creatum GmbH can significantly streamline workflows, boosting efficiency and reducing errors, thereby enhancing overall productivity. Technology suppliers are updating their products to support composable application architecture, which can improve the incorporation of data analysis into business strategies. Unlocking the power of Business Intelligence can transform raw data into actionable insights, enabling informed decision-making that drives growth and innovation. Customized AI solutions from Creatum GmbH can also tackle particular business challenges, ensuring that organizations remain competitive in a swiftly changing AI environment.
By adhering to these steps, organizations can effectively incorporate data analysis into their operational strategies, enhancing efficiency and informed decision-making in an increasingly data-driven setting.
Practical Steps for Implementing Analytics in Operations
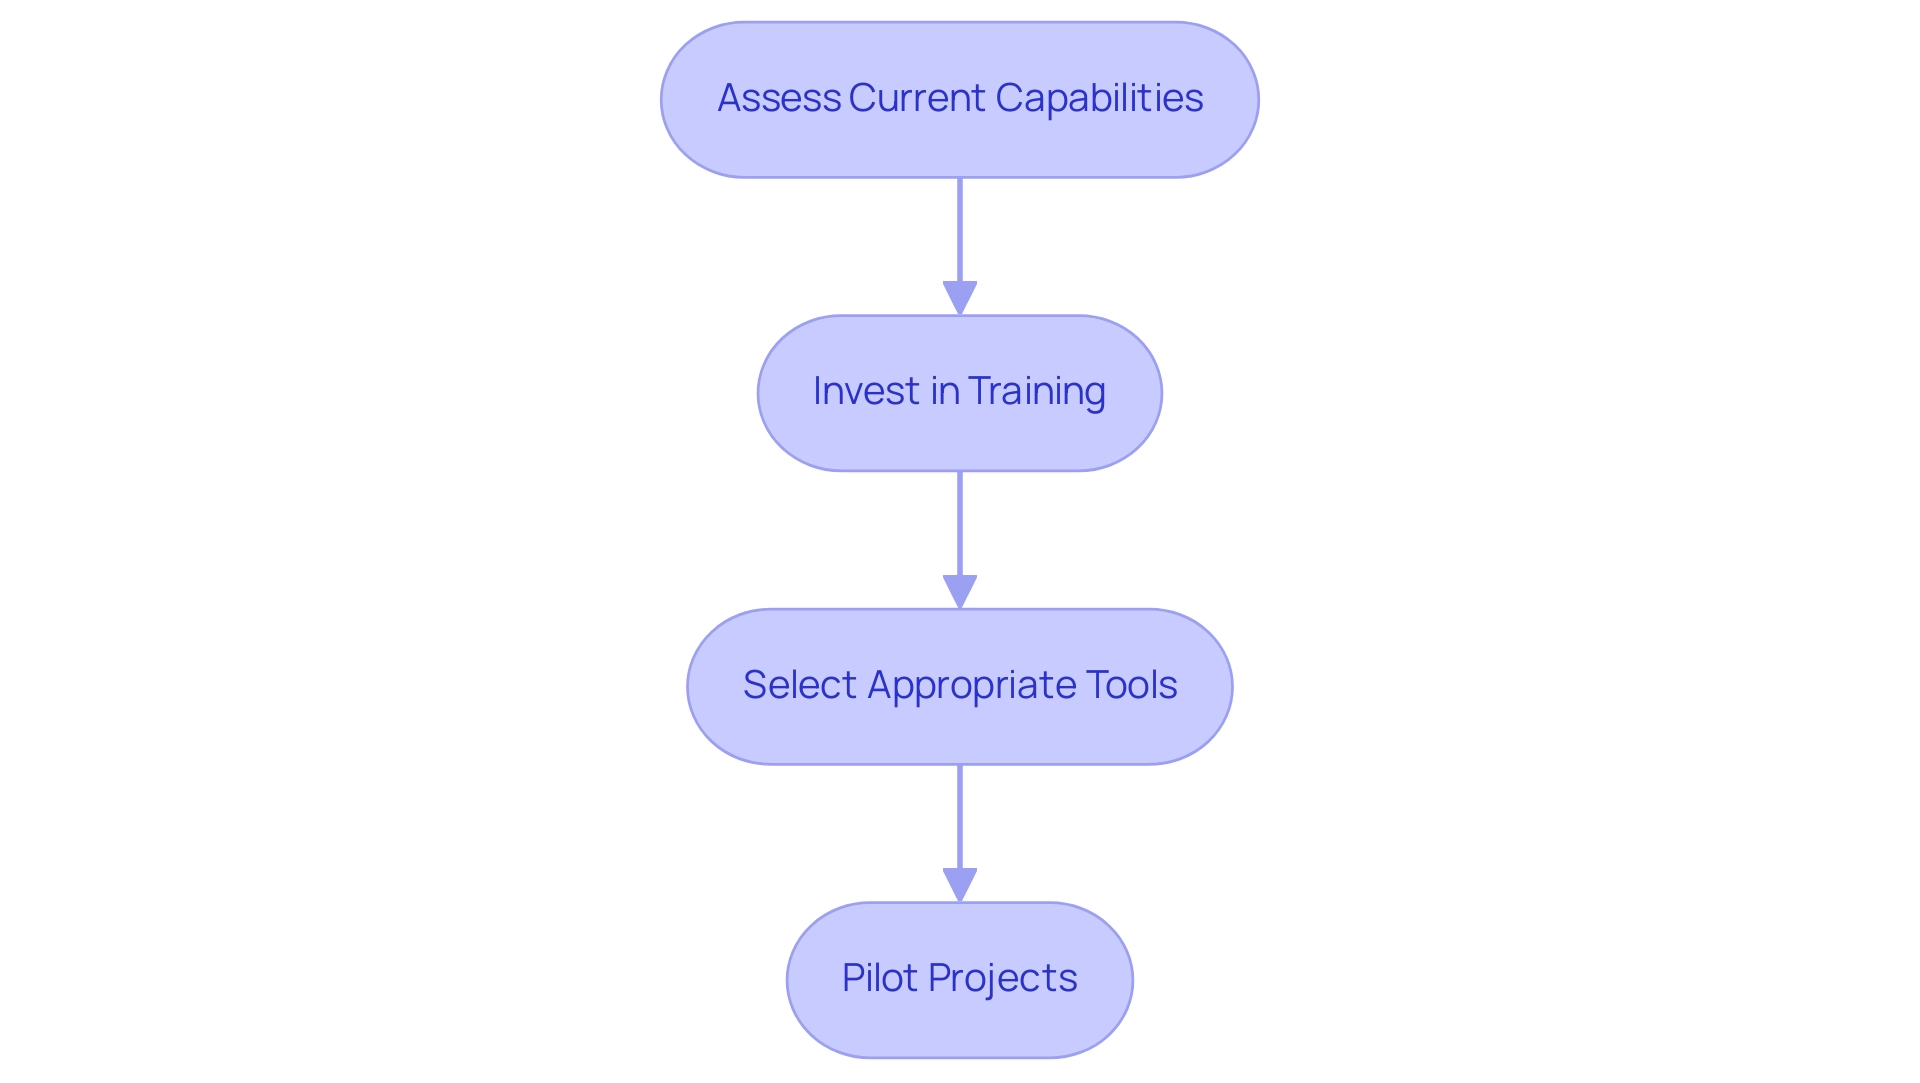
To apply data analysis effectively in operations, consider the following practical steps:
-
Assess Current Capabilities: Begin by reviewing your existing information infrastructure and analytical capabilities. Understanding your entity’s current standing regarding the four levels of analytics is crucial for identifying gaps and opportunities for improvement. For instance, organizations like JPMorgan Chase have significantly enhanced their credit risk evaluation abilities through extensive information analysis, underscoring the importance of a comprehensive assessment. Moreover, statistics reveal that companies such as Planet Fitness have achieved a 360-degree perspective of fitness club members via advanced information analysis, further illustrating the potential advantages of thorough evaluation.
-
Invest in Training: Providing training for staff to enhance information literacy and analytical skills is essential. Experts emphasize that cultivating a robust information culture within organizations can greatly improve analytical proficiency. A survey indicates that 50% of Chief Information Officers view enhancing information culture as a top priority, highlighting the need for ongoing education and skill development in this area. This focus on information culture is vital for ensuring that the four levels of analytics in evaluation projects are effective and sustainable.
-
Select Appropriate Tools: Choose analytics tools that align with your organizational needs and capabilities. The right tools can streamline information processing and analysis, simplifying the derivation of actionable insights. For example, Slevomat transitioned from using Excel for data reporting to the Keboola data innovation platform, enabling access to fresh, cleaned data from multiple sources, ultimately resulting in a 23% increase in sales. Additionally, leveraging Robotic Process Automation (RPA) solutions like EMMA RPA and Microsoft Power Automate can further enhance operational efficiency by automating repetitive tasks, allowing your team to concentrate on strategic initiatives.
-
Pilot Projects: Initiate pilot projects to test data analysis applications before full-scale implementation. This approach allows entities to assess the efficacy of data analysis solutions in practical situations, mitigating risks associated with broader implementation. By starting modestly, teams can refine their strategies and ensure that the chosen data analysis tools genuinely meet their functional requirements. Furthermore, integrating customized AI solutions and Business Intelligence tools can provide deeper insights and enhance information quality, ultimately fostering growth and innovation.
By adhering to these steps, entities can effectively incorporate the four levels of analytics into their operations, enhancing efficiency and informed decision-making in an information-rich environment.
Overcoming Challenges in Analytics Implementation
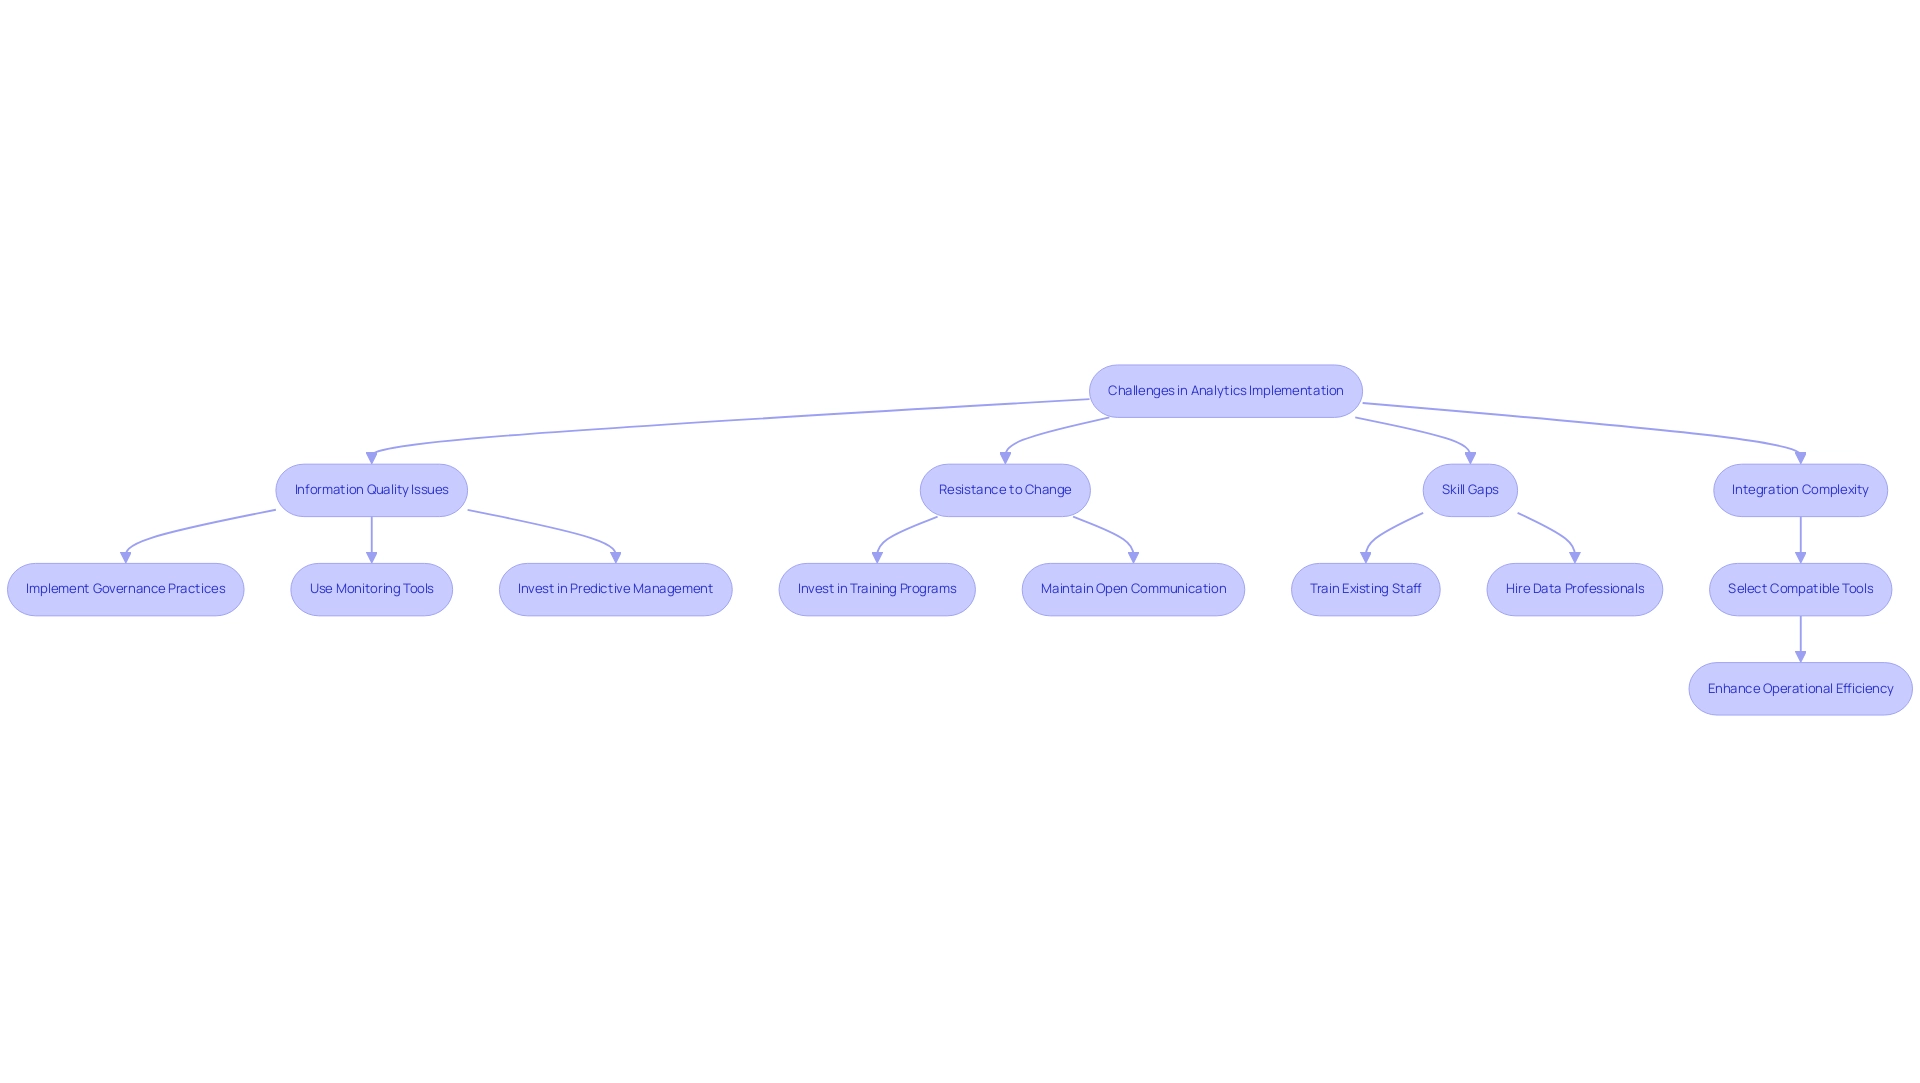
Common challenges in analytics implementation can significantly hinder operational efficiency. Addressing these challenges is crucial for organizations aiming to utilize information effectively.
-
Information Quality Issues: Ensuring accuracy and reliability is paramount. Implementing robust information governance practices can help maintain high quality of information. Organizations that emphasize information quality management can recognize and correct issues early in the information lifecycle, which is crucial for reliable analysis. Predictive information quality management can assist organizations in identifying and rectifying quality issues early, ensuring that analytics are based on reliable information. Additionally, monitoring tools can detect anomalies in information, aiding in the identification of quality problems. Statistics indicate that poor information quality results in an average yearly financial cost of $15 million, as noted by Idan Novogroder, underscoring the importance of proactive measures. Creatum’s customized solutions can assist in reducing these expenses by ensuring information integrity and relevance through regular updates and checks.
-
Resistance to Change: Overcoming resistance to change is vital for fostering a culture that embraces data-driven decision-making. Organizations can facilitate this transition by investing in comprehensive training programs and maintaining open lines of communication. Encouraging a mindset shift towards valuing insights can help mitigate resistance and promote a more analytical approach to operations.
-
Skill Gaps: The data analysis landscape is evolving rapidly, and addressing skill gaps is essential for successful implementation. Organizations should invest in training existing staff and consider hiring data professionals with the necessary expertise. This investment not only improves the team’s abilities but also guarantees that the entity can effectively employ data analysis tools and methods. Creatum’s tailored AI solutions can specifically address these skill gaps by providing targeted training and resources.
-
Integration Complexity: The complexity of integrating various analytics tools can pose significant challenges. To simplify this process, entities should select compatible tools and platforms that work seamlessly together. This strategic choice can reduce friction during implementation and enhance overall operational efficiency.
In 2025, companies are increasingly recognizing the need for specialized catalogs, with best-in-class firms being 30% more likely to possess one. This trend emphasizes the increasing significance of structured data management in addressing common analytical challenges. By confronting these issues directly, companies can unlock the full potential of the four levels of analytics in their initiatives, driving growth and innovation.
Moreover, leveraging Robotic Process Automation (RPA) can significantly streamline manual workflows, addressing the challenges of repetitive tasks that slow down operations. RPA not only reduces errors but also frees up teams for more strategic, value-adding work. Additionally, Creatum’s tailored AI solutions can assist companies in navigating the complexities of technology implementation, ensuring that the right tools align with specific business goals.
The transformative impact of Creatum’s Power BI Sprint is evident in client testimonials, such as that from Sascha Rudloff of PALFINGER, who noted a significant acceleration in their Power BI development, underscoring the importance of Business Intelligence in driving data-driven insights and operational efficiency.
Continuous Improvement: The Role of Analytics in Operational Efficiency
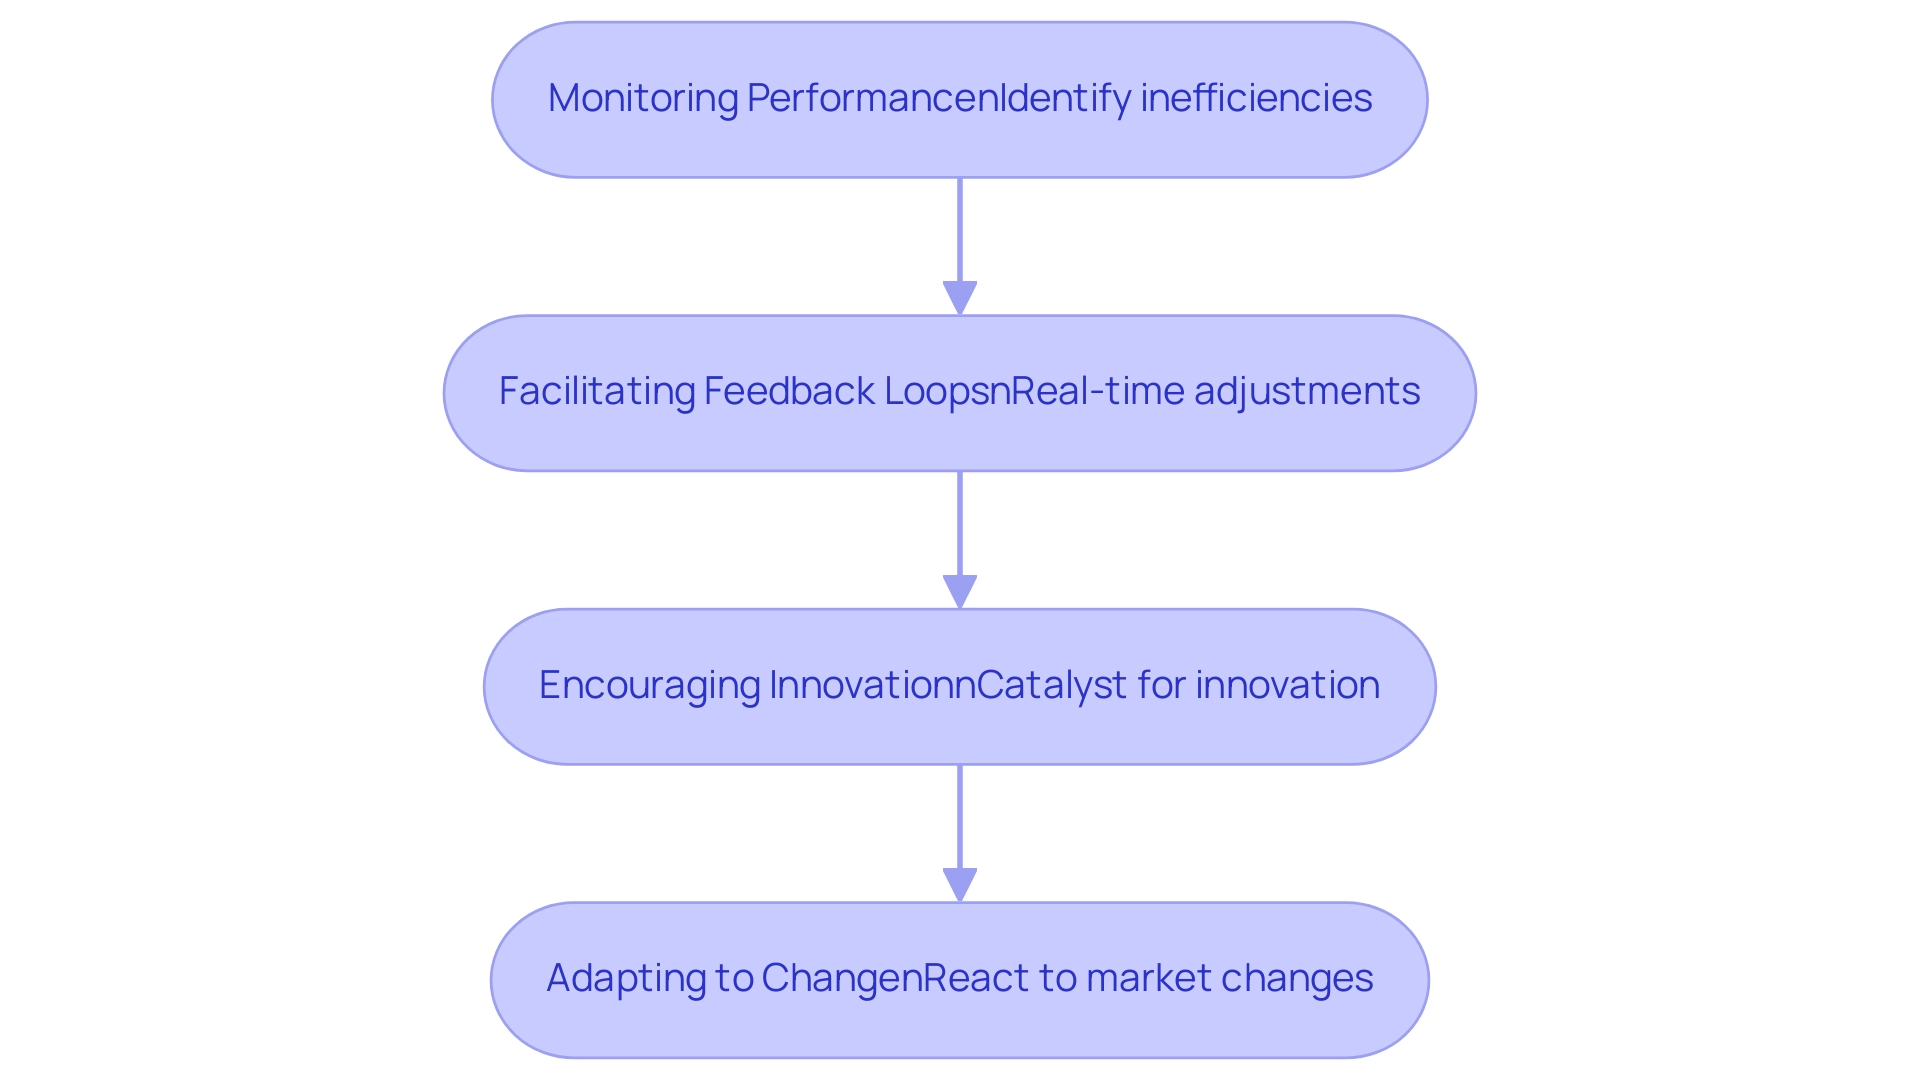
Analytics are essential for promoting continuous enhancement within entities by:
-
Monitoring Performance: Regular tracking of key performance indicators (KPIs) is essential for identifying areas that require attention. This proactive approach enables organizations to pinpoint inefficiencies and implement timely interventions. Significantly, only 33% of data leaders currently monitor the return on investment (ROI) of their data teams, indicating a critical need for improved metrics and accountability in these initiatives. Leveraging Robotic Process Automation (RPA) can significantly enhance this monitoring process, streamlining workflows and reducing errors, ultimately leading to better performance insights. Furthermore, Creatum GmbH’s customized AI solutions can further enhance this process by offering sophisticated analytical capabilities that align with specific business needs.
-
Facilitating Feedback Loops: By utilizing analytics, businesses can establish robust feedback loops that enhance decision-making processes. These loops allow for real-time adjustments to strategies based on data-driven insights, ensuring that organizations remain aligned with their goals. The integration of RPA further supports this by automating repetitive tasks, freeing up resources for more strategic analysis and feedback implementation, which is crucial for operational efficiency.
-
Encouraging Innovation: Insights derived from analytics serve as a catalyst for innovation. Organizations can leverage these insights to refine processes, develop new products, and enhance service delivery, ultimately driving growth and competitive advantage. Tailored solutions provided by Creatum GmbH improve information quality and simplify AI implementation, further fostering innovation. Client testimonials, including those from Herr Malte-Nils Hunold of NSB GROUP and Sascha Rudloff from PALFINGER Tail Lifts GMBH, emphasize how Creatum’s technology solutions have enhanced their efficiency and encouraged innovation.
-
Adapting to Change: In a rapidly evolving market landscape, agility is paramount. Ongoing analysis enables entities to quickly react to market changes and challenges, ensuring they stay resilient and proactive. The significance of Business Intelligence (BI) and RPA in generating insights through the 4 levels of analytics based on information cannot be overstated, as they allow companies to adjust effectively to shifts in their surroundings.
The importance of analysis in ongoing enhancement is highlighted by the fact that 68% of Chief Data Officers express a desire to improve their use of information and analysis. Additionally, specialists anticipate significant growth in the need for data professionals, emphasizing the rising significance of analysis in enhancing efficiency. By establishing effective performance monitoring through analytics and leveraging RPA, organizations can not only enhance operational efficiency but also foster a culture of continuous improvement that is responsive to feedback and innovation.
Conclusion
The integration of the four levels of analytics—Descriptive, Diagnostic, Predictive, and Prescriptive—serves as a foundational strategy for organizations aiming to enhance operational efficiency and drive informed decision-making. Each level contributes uniquely to the analytical landscape:
- Descriptive analytics provides insights into past performance.
- Diagnostic analytics uncovers the causes behind outcomes.
- Predictive analytics forecasts future trends.
- Prescriptive analytics guides actionable decision-making.
By leveraging these analytics levels, organizations can transform raw data into meaningful insights that foster growth and innovation.
Implementing these analytics effectively requires a systematic approach that includes:
- Establishing clear objectives
- Creating robust data governance frameworks
- Fostering collaboration across departments
Moreover, organizations must prioritize continuous improvement through regular monitoring of performance metrics and adapting strategies in response to evolving business needs. Embracing modern technologies, such as Robotic Process Automation (RPA) and tailored AI solutions, further enhances the capacity to derive insights from data, streamline workflows, and reduce errors.
As the importance of data-driven strategies grows in the modern business landscape, organizations that effectively harness the power of analytics will position themselves for success. By investing in analytics capabilities and cultivating a culture that values data insights, businesses can not only enhance operational efficiency but also drive innovation and adaptability in an increasingly competitive environment. The journey towards leveraging analytics is a continuous one, where the commitment to improvement and the embrace of technology will ultimately yield significant dividends in operational performance and strategic growth.
Frequently Asked Questions
What are the four levels of analytics?
The four levels of analytics are Descriptive, Diagnostic, Predictive, and Prescriptive. Each level serves a distinct role in enhancing operational efficiency.
What is Descriptive Analytics?
Descriptive Analytics summarizes historical information to provide insights into past performance. It analyzes trends and patterns, helping organizations understand what has transpired, which is crucial for informed decision-making.
How can Descriptive Analytics be improved?
Tools like EMMA RPA from Creatum GmbH can automate data collection processes, ensuring the information used for descriptive analytics is accurate and timely.
What does Diagnostic Analytics do?
Diagnostic Analytics builds on descriptive insights by uncovering the reasons behind specific outcomes. It identifies correlations and patterns, allowing organizations to understand the factors influencing past events.
How does Diagnostic Analytics assist organizations?
It helps pinpoint areas for improvement and optimize processes, particularly in addressing issues like task repetition fatigue and staffing shortages, often streamlined through RPA solutions.
What is Predictive Analytics?
Predictive Analytics uses historical data to forecast future trends and outcomes, enabling organizations to anticipate changes in the market or operational environment for proactive adjustments.
What enhances Predictive Analytics capabilities?
The integration of AI, such as Small Language Models, can improve the quality of information and the efficiency of analysis, enhancing predictive capabilities.
What is Prescriptive Analytics?
Prescriptive Analytics is the most advanced level that offers actionable recommendations based on comprehensive data evaluation, helping entities make informed choices by assessing different scenarios and their potential effects.
How does Prescriptive Analytics improve an organization?
When combined with descriptive, diagnostic, and predictive analytics, it significantly enhances an organization’s analytical strategy, leading to operational improvements.
Can you provide an example of the effectiveness of these analytics levels?
A notable case study showed that a mid-sized company improved efficiency by automating data entry and software testing, achieving a 70% reduction in data entry errors and an 80% improvement in workflow efficiency.
Why is alignment of KPIs important in analytics?
Aligning key performance indicators (KPIs) across departments is critical as misalignment can undermine the efforts of data teams, impacting overall effectiveness.
How do analytics drive operational efficiency?
Analytics help identify inefficiencies, enhance decision-making, optimize resources, and drive continuous improvement, ultimately leading to more strategic and efficient operations.
What are some real-world examples of companies benefiting from analytics?
A major airline reduced delays by 25% using real-time information analysis, and a mid-sized firm enhanced efficiency by automating processes, significantly decreasing manual entry errors by 70%.
