Overview
The DAX SUMMARIZE function in Power BI is a pivotal tool for creating summary tables that group data based on specified columns. This capability mirrors SQL’s GROUP BY statement, making it essential for effective data analysis. Understanding its importance is crucial; consider practical applications like calculating total sales by product category. Such insights not only enhance operational efficiency but also bolster decision-making through improved data organization. Embrace the potential of this function to transform your data analysis processes.
Introduction
In the realm of data analytics, effective summarization is paramount for extracting actionable insights from complex datasets. Power BI’s SUMMARIZE function emerges as an essential tool for crafting summary tables, empowering users to group and aggregate data with remarkable precision. Similar to the SQL GROUP BY statement, this function amplifies the analytical prowess of organizations, facilitating informed decision-making grounded in clear performance metrics.
With the enhancements introduced in 2025, SUMMARIZE has evolved into an even more formidable resource, delivering improved performance and new functionalities tailored to intricate data scenarios. This article delves into the nuances of the SUMMARIZE function, examining its syntax, practical applications, and best practices to optimize its implementation in business intelligence.
Whether assessing sales trends or refining reporting processes, mastering the effective use of SUMMARIZE can transform raw data into meaningful insights that propel strategic success.
Understanding the SUMMARIZE Function in Power BI
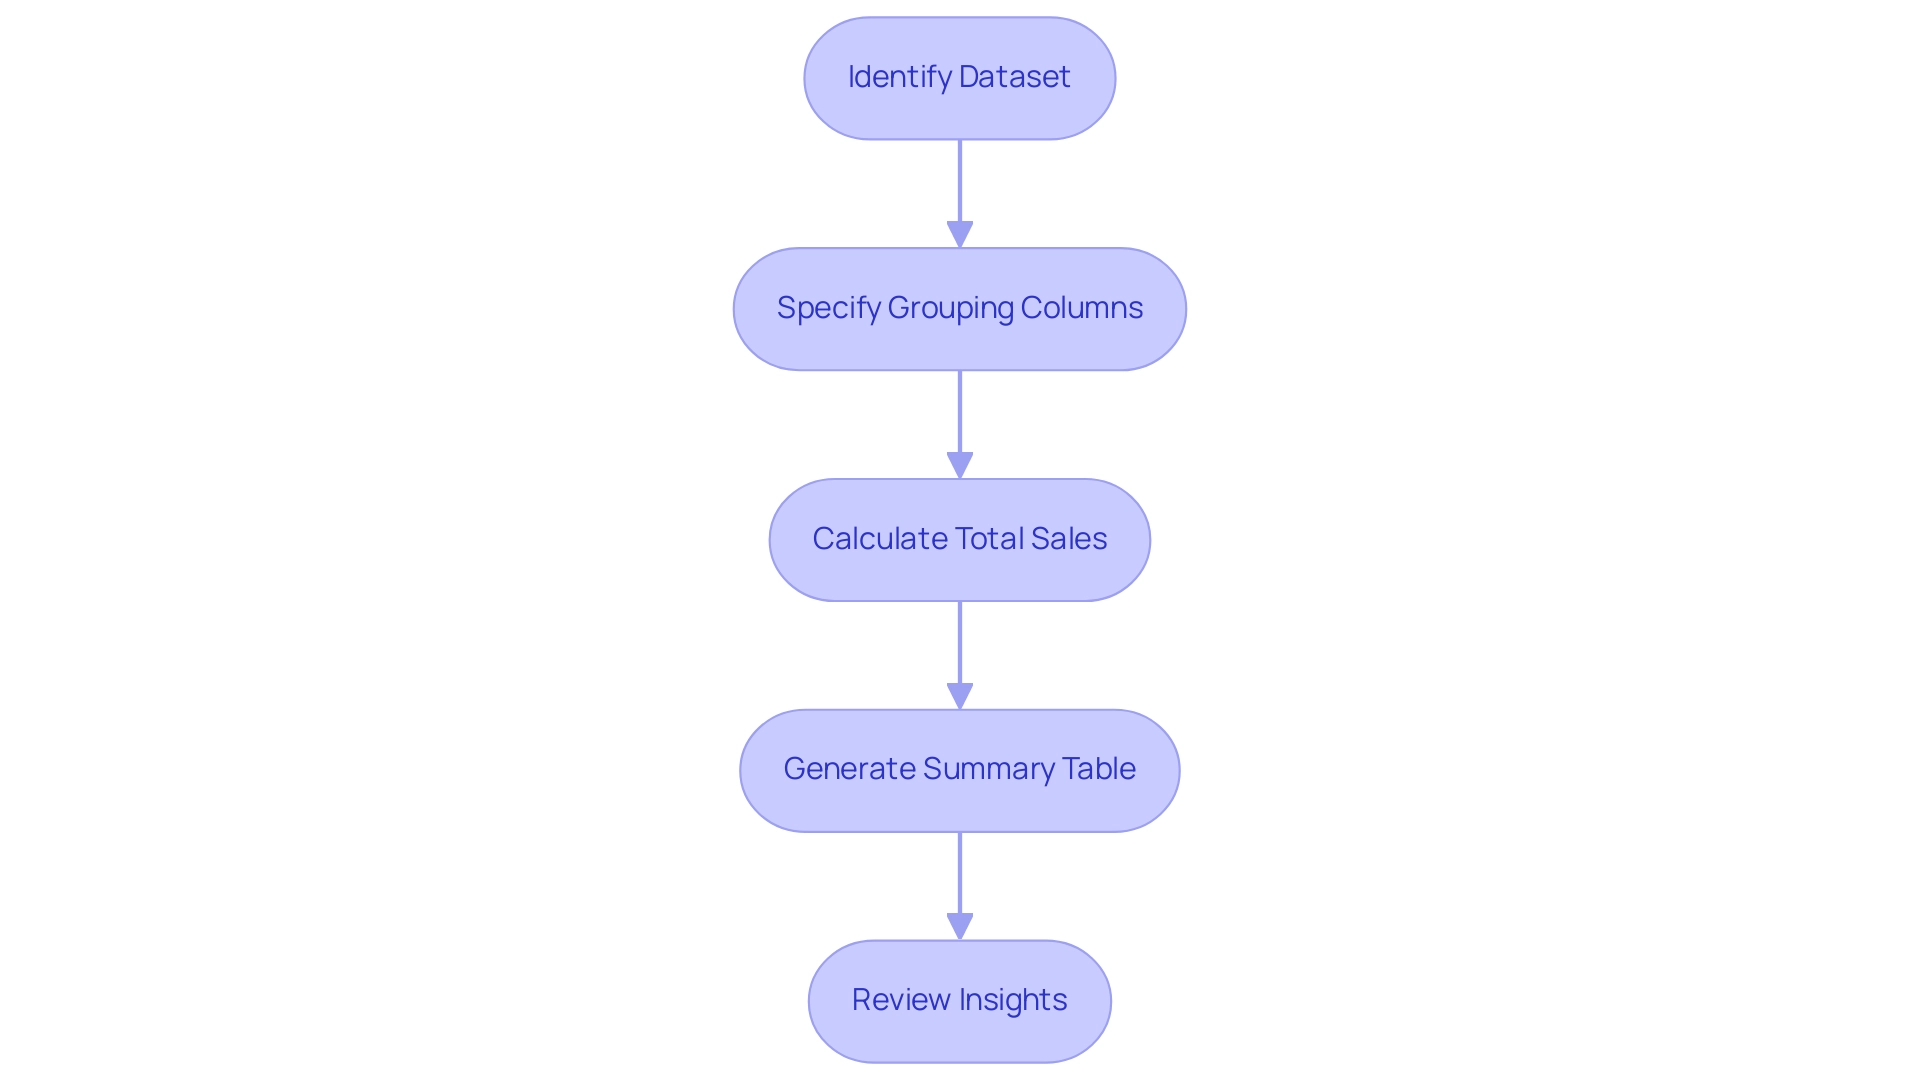
The summarization tool in Power BI leverages DAX’s powerful summarize function, enabling users to create summary tables by organizing data based on specified columns. This approach mirrors the SQL GROUP BY statement, making it crucial for effective analysis. By harnessing the DAX summarize feature, users can compile data and generate new tables tailored to their reporting and analytical needs.
Consider a dataset containing sales information; by grouping this data by product category, users can calculate total sales for each category, providing a clear and concise overview of performance across various segments.
In 2025, updates to the summarization tool introduced enhancements that streamline aggregation processes even further. These updates include improved performance metrics and additional features designed to address complex information scenarios. Recent statistics reveal a significant rise in the use of DAX tools, including aggregation, underscoring their growing importance in business intelligence and operational efficiency.
The identification of outliers, such as vehicles sold for over 180 thousand Reais, illustrates the necessity for robust analytical techniques in understanding dataset anomalies.
Practical applications of this function underscore its value in analysis. For instance, a financial analyst might employ DAX summarize to assess revenue streams by product line, facilitating informed decision-making and strategic planning. This capability not only aids in financial analysis but also enhances operational efficiency by allowing teams to focus on high-value tasks rather than manual data handling.
Moreover, the SUMX function serves as a potent tool for calculating the total of an expression evaluated for each row in a table, further boosting financial analysis capabilities.
Experts emphasize the significance of grouping data in Power BI, noting that effective organization leads to more insightful analyses and improved business outcomes. As Douglas Rocha, a statistics enthusiast, remarked, ‘Last but definitely not least is the Mode.’ This highlights the process’s role in fostering growth and innovation within organizations, particularly in a rapidly evolving AI landscape where RPA can automate manual workflows and enhance operational efficiency.
Additionally, the 3-Day Sprint for report creation is a pivotal feature of our Power BI services, enabling users to quickly generate professionally designed reports that address the challenges of labor-intensive report creation and data inconsistencies. By integrating the summarization feature within this framework, organizations can ensure better information governance and more reliable insights.
In conclusion, the DAX summarize tool stands out as a vital component of Power BI, empowering users to effectively group and analyze data, ultimately enhancing operational efficiency and supporting strategic decision-making. Continuous updates to DAX capabilities further reinforce its significance in the evolving landscape of Power BI, addressing issues of consistency and governance for improved decision-making.
Syntax and Parameters of the SUMMARIZE Function
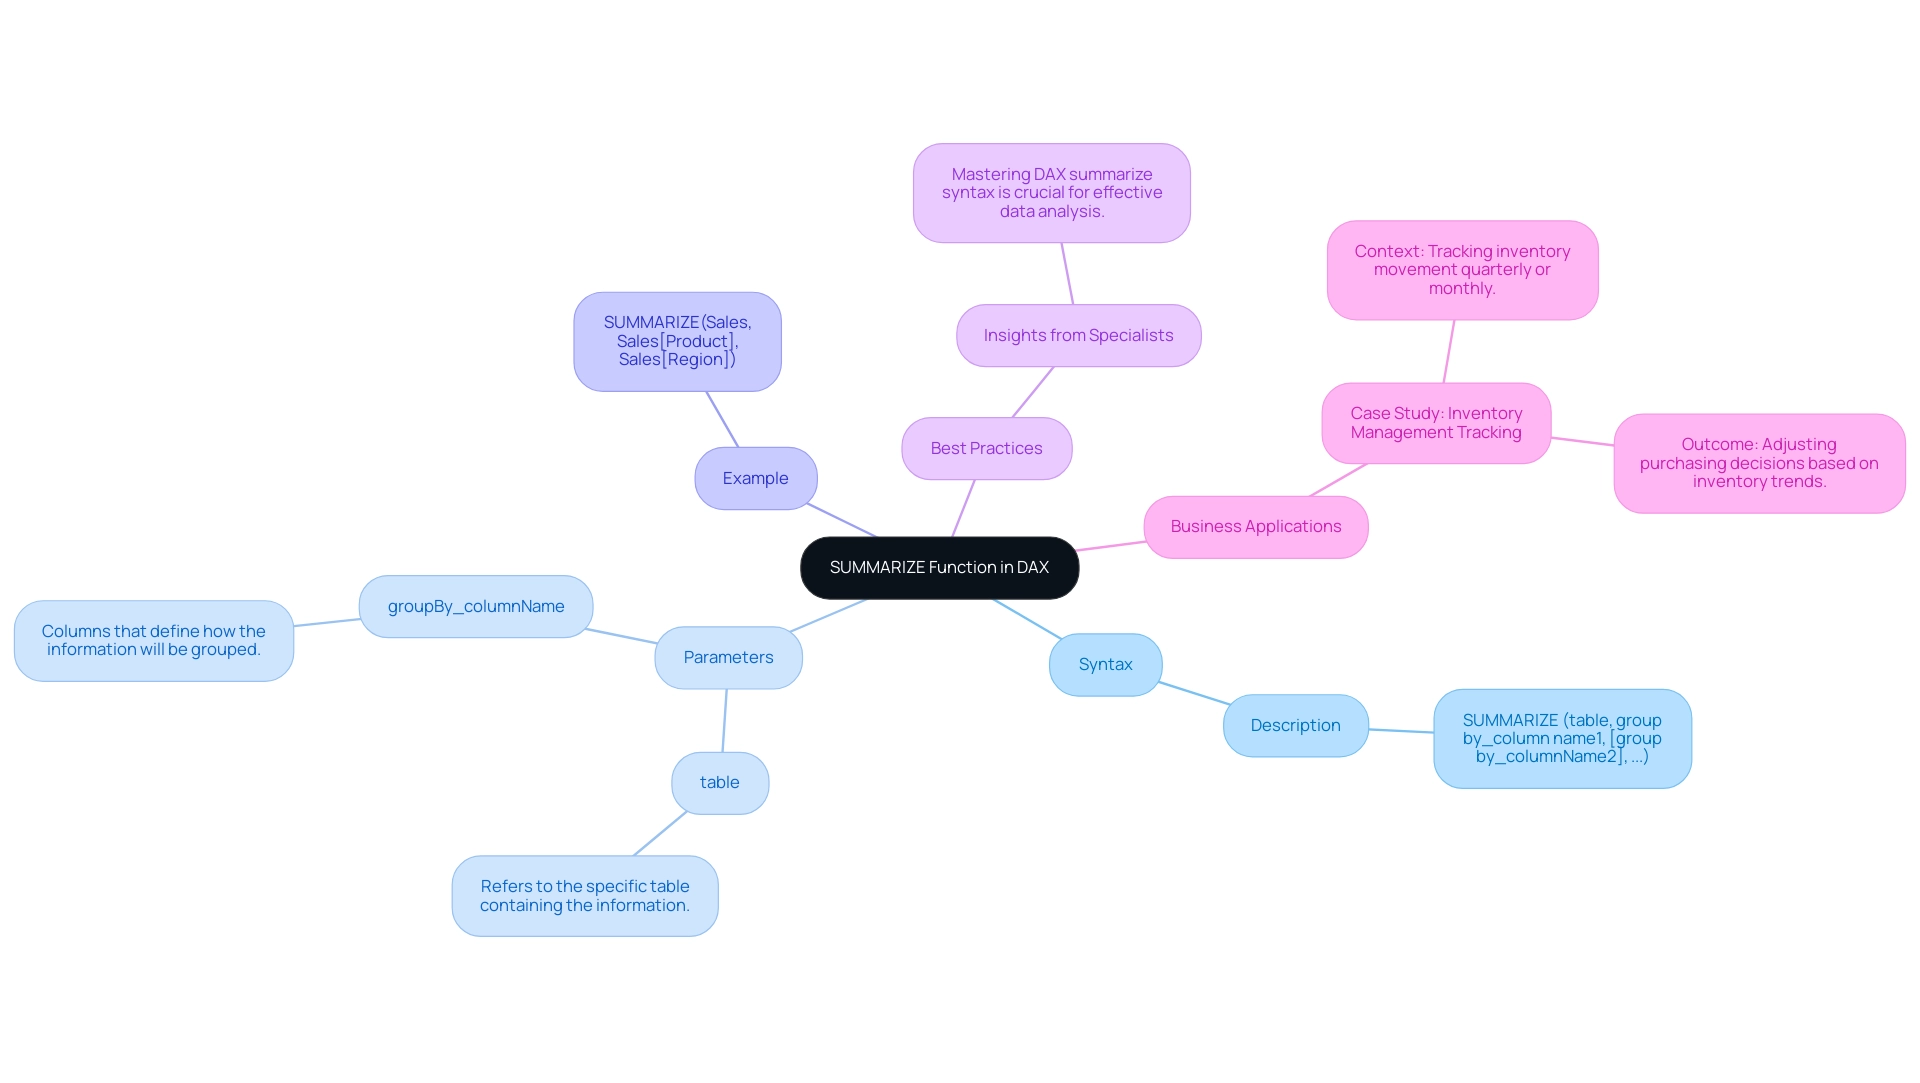
The syntax for the SUMMARIZE operation in DAX is organized as follows:
SUMMARIZE (table, group by_column name1, [group by_columnName2], ...)
- table: This parameter refers to the specific table that contains the information you wish to condense.
- groupBy_columnName: This can include one or more columns that define how the information will be grouped. By specifying multiple columns, you can achieve a multi-level grouping, which is particularly useful for detailed analysis.
For instance, if you want to summarize sales information by both product and region, the syntax would look like this:
SUMMARIZE(Sales, Sales[Product], Sales[Region])
This example illustrates how the SUMMARIZE method can effectively aggregate information, allowing businesses to derive insights from their sales performance across different products and areas. In 2025, the best practices for utilizing DAX operations, particularly the dax summarize feature, highlight the significance of comprehending common parameters employed across different sectors. These parameters not only improve the precision of information grouping but also enable more informed decision-making, tackling issues such as inconsistencies and governance in business reporting.
Recent trends show that organizations are increasingly utilizing the dax summarize capability to optimize their business intelligence processes. For example, a case study on inventory management tracking demonstrated how businesses could adjust purchasing decisions based on summarized inventory trends, ultimately optimizing stock levels and reducing waste. In this case study, the summarization method was utilized to consolidate inventory data over specific intervals, enabling improved forecasting and inventory management.
As you examine the capabilities of this tool, reflect on the insights shared by specialists in the field, who emphasize the importance of mastering DAX summarize syntax to unlock the full potential of Power BI in transforming raw data into actionable insights. Furthermore, the DAX editor in Power BI Desktop contains a suggestions feature that helps users in constructing syntactically accurate formulas, simplifying the application of capabilities such as dax summarize.
In addition, utilizing customized AI solutions together with RPA from Creatum GmbH can further boost productivity and optimize operations, enabling your team to concentrate on strategic, value-enhancing tasks. Our RPA solutions specifically address task repetition fatigue and operational inefficiencies, ensuring that your business can thrive in a competitive landscape.
Lastly, thank you for reading this article! If you enjoyed this article, you can help me share this knowledge with others by clapping, commenting, and be sure to follow me. Remember, accessing resources like articles on Medium, which costs $5 per month, can further enhance your understanding of DAX concepts and their applications.
Return Values of the SUMMARIZE Function
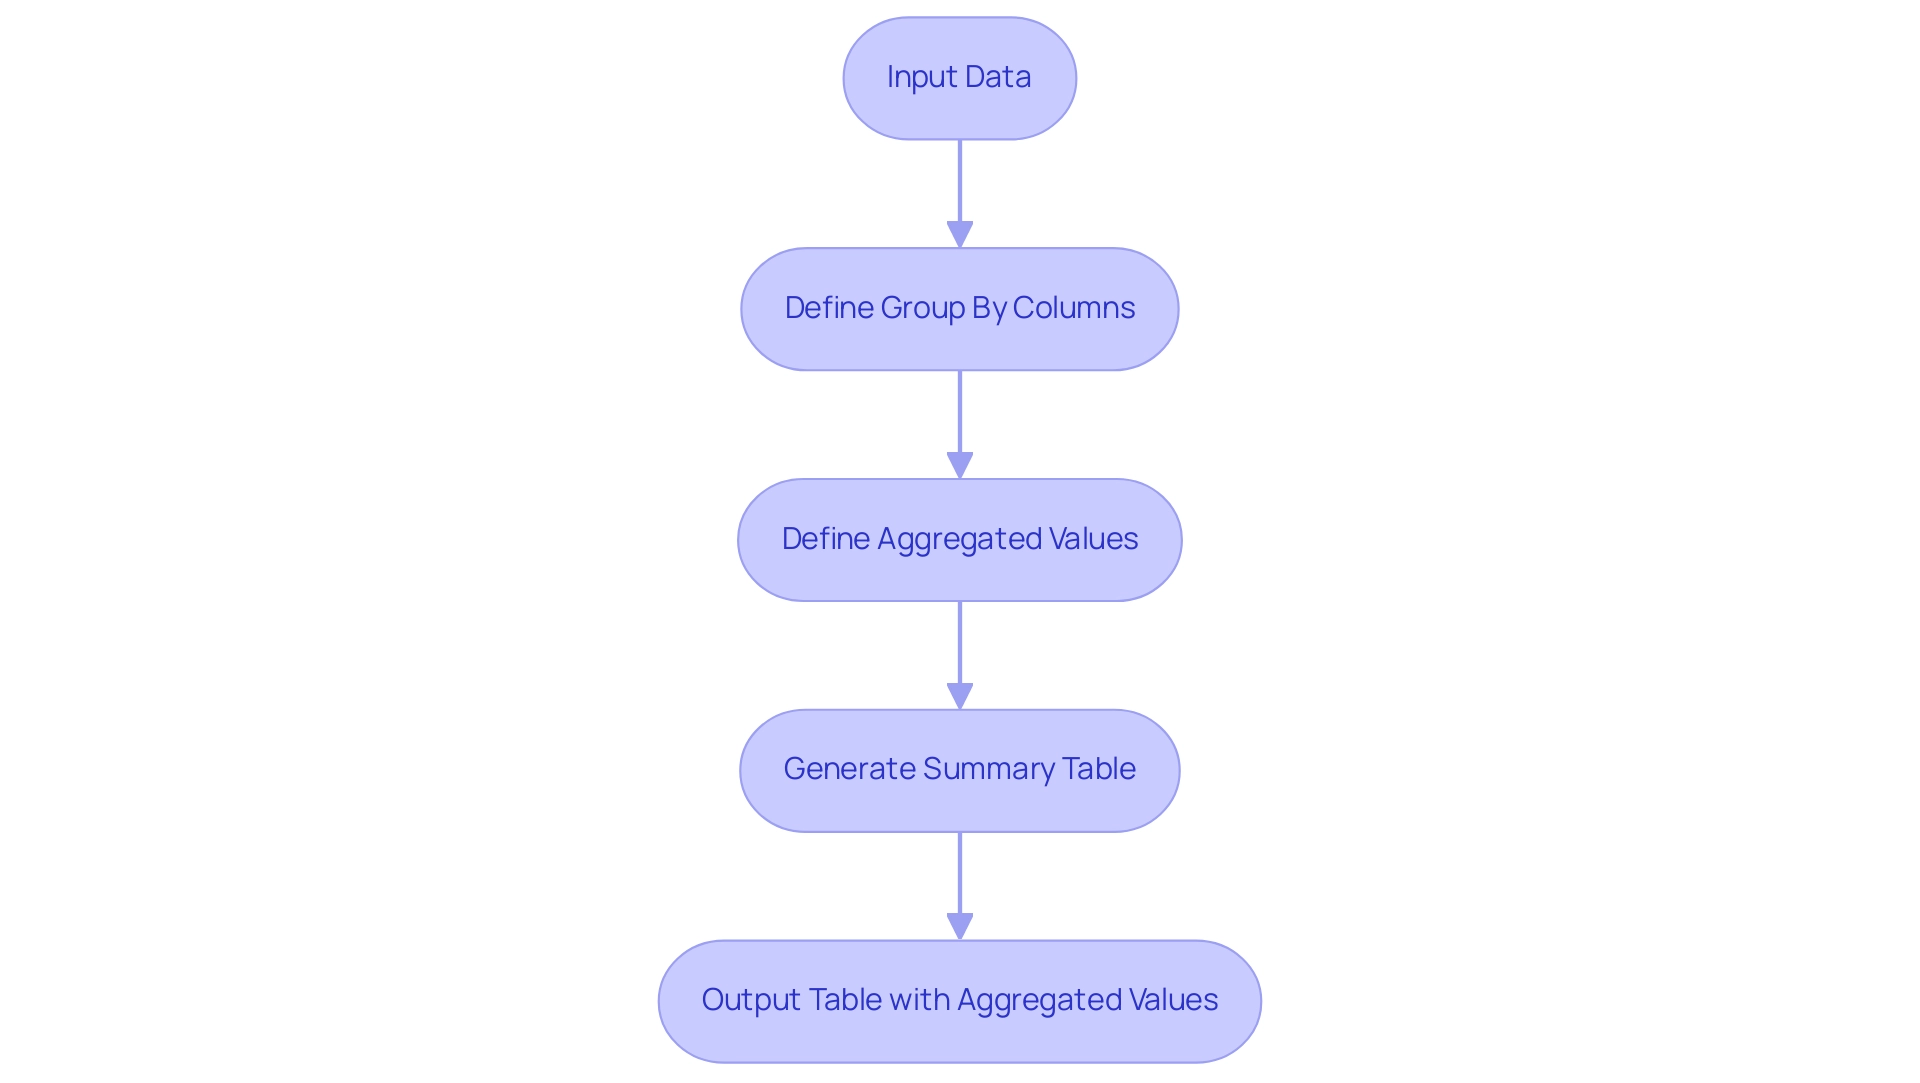
The DAX SUMMARIZE function is an essential tool that returns a table containing grouped information based on specified columns. Each distinct combination of the groupBy columns yields a single row in the output table, making this function vital for effective analysis. To enhance the output, you can include aggregated values by defining expressions for new columns.
For example:
SUMMARIZE(Sales, Sales[Product], "Total Sales", SUM(Sales[Amount]))
This expression generates a table that lists each product alongside its corresponding total sales amount, demonstrating how SUMMARIZE facilitates insightful data aggregation.
The significance of output tables in information analysis cannot be overstated. Analysts recognize that these tables serve as the foundation for deriving actionable insights, enabling businesses to make informed decisions based on comprehensive evaluations. Moreover, incorporating aggregated values into the summary output enhances analytical depth, providing a clearer understanding of performance metrics across various categories.
For instance, the average rating for ID 1 would inaccurately appear as 4.75 if duplicates were included, underscoring the importance of precise information aggregation.
In practical applications, businesses leverage DAX SUMMARIZE to analyze sales information, customer behavior, and operational efficiency. A retail company might utilize DAX SUMMARIZE to aggregate sales figures by region and product category, revealing trends that inform inventory management and marketing strategies. This aligns with the broader context of overcoming technology implementation challenges, where Business Intelligence (BI) tools like Power BI from Creatum GmbH streamline reporting processes and enhance consistency.
As Jihwan Kim, a Super User, advises, “In the measure, if you created a virtual table (temp_table) and wanted to use this virtual table, try writing the measure with average, something like below: average(temp_table, [Monthly Sales]).” Such expert insights reinforce the practical applications of DAX techniques in real-world scenarios.
Furthermore, the case study titled “Business Intelligence for Data Insights” illustrates how Creatum GmbH aids companies in transforming raw information into actionable insights for informed decision-making. This aligns with the tutorial’s focus on practical uses of the summarization tool. Additionally, the training module ‘Get started with data analytics’ is available, which is part of a certification for Microsoft Certified: Power BI Data Analyst Associate, showcasing methods and best practices for modeling, visualizing, and analyzing insights with Microsoft Power BI.
These practical illustrations highlight the efficiency of the tool in converting raw information into valuable insights, ultimately steering strategic decision-making in business analytics. By addressing challenges in data reporting and governance, organizations can enhance operational efficiency and leverage insights for sustained growth. Moreover, Creatum GmbH’s tailored AI solutions assist businesses in navigating the complex AI landscape, ensuring they identify the right technologies that align with their specific goals.
The Role of Context in SUMMARIZE: Row and Filter Contexts
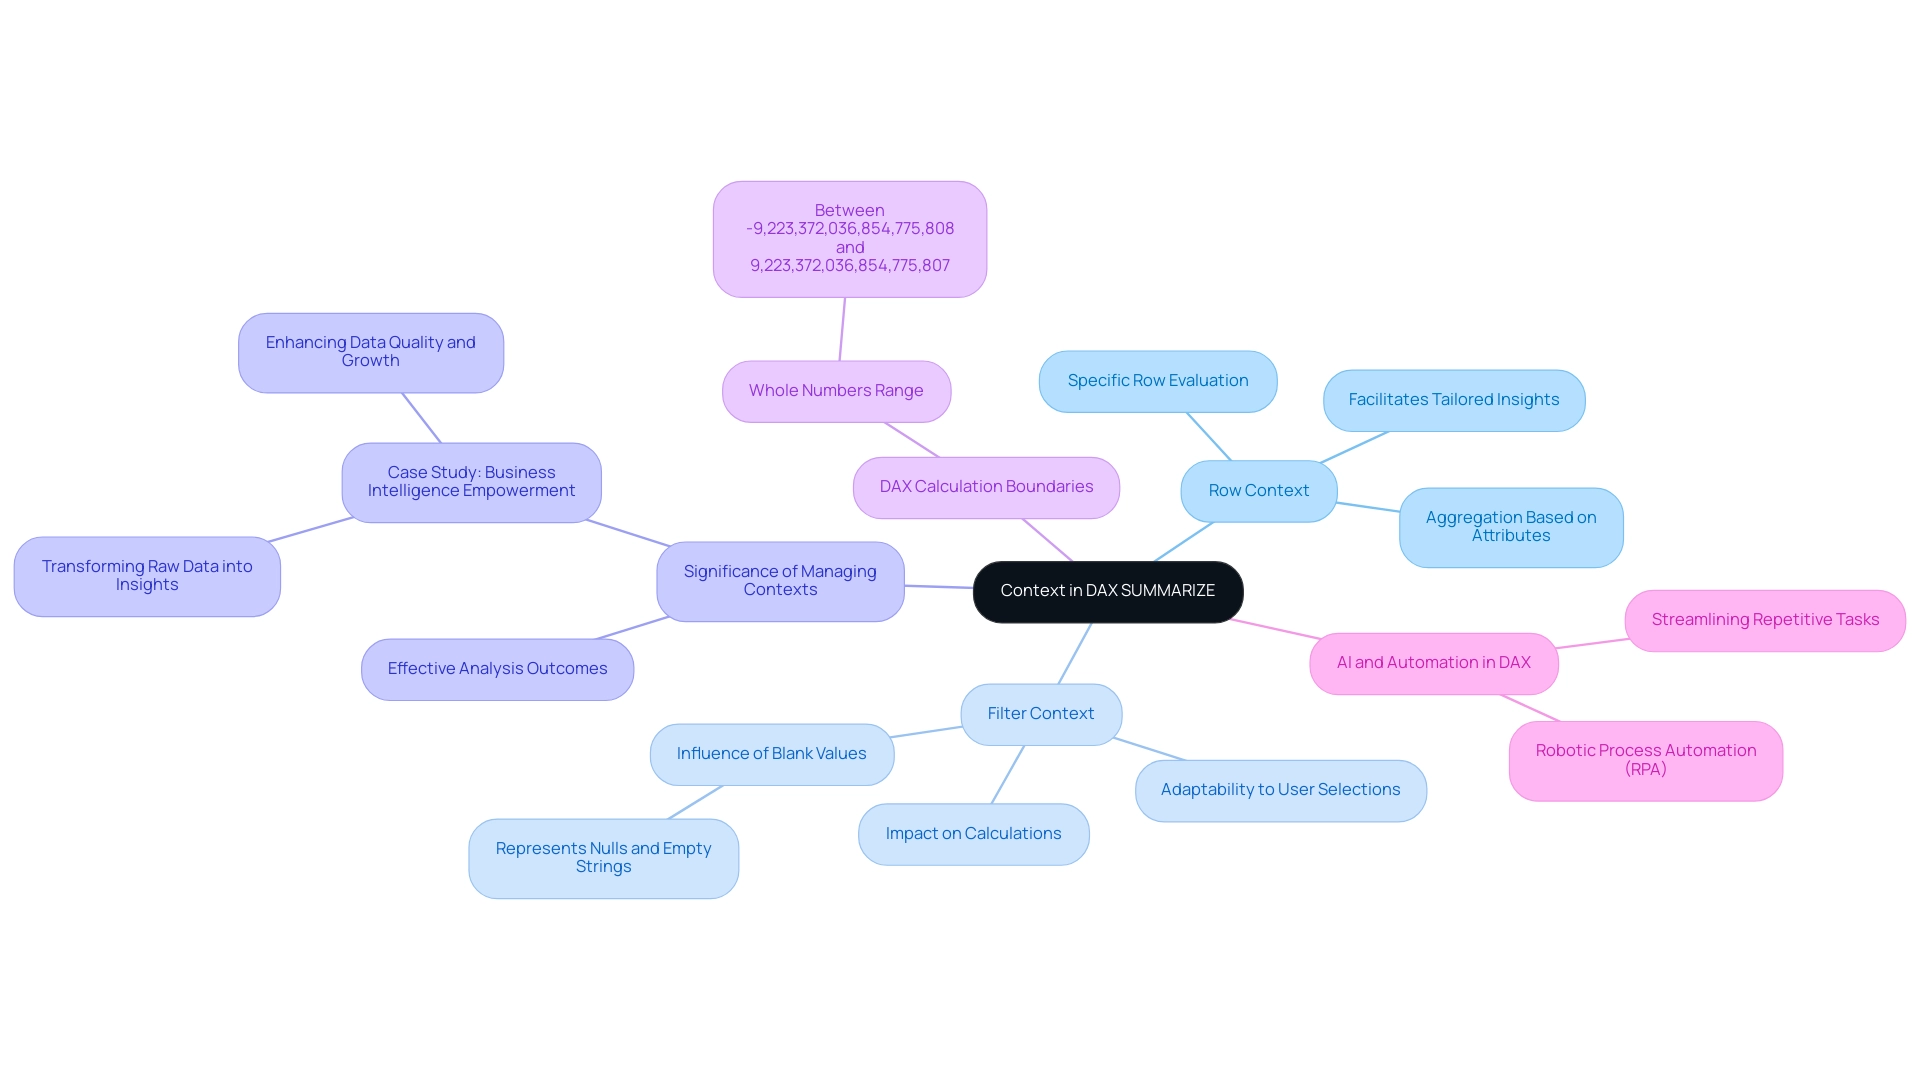
In DAX, context is essential for determining how calculations are executed, particularly within a specific tool that operates under two primary contexts: row context and filter context.
-
Row Context: This pertains to the specific row currently being evaluated. When utilizing the DAX SUMMARIZE function, each row in the resulting output table corresponds to a unique combination of the specified group columns. This enables precise aggregation based on the distinct attributes of each row, facilitating tailored insights that align with specific business objectives.
-
Filter Context: This encompasses the filters applied to the model, which can significantly impact the outcomes of calculations. In the context of SUMMARIZE, any existing filters will dynamically shape the output, allowing for flexible analysis that adapts to user selections. This adaptability is crucial for effective information analysis, as it empowers users to derive insights based on varying criteria. Furthermore, it is important to recognize that blank values in Power Pivot tables represent nulls, empty strings, and other missing values, which can further influence filter context and the resulting calculations.
Understanding the interplay between row and filter contexts is vital for achieving accurate analysis outcomes. For instance, a case study on business intelligence empowerment revealed that organizations overwhelmed by information transformed raw data into actionable insights by effectively managing these contexts. This not only enhanced information quality but also propelled growth and innovation, underscoring the significance of Business Intelligence in operational efficiency.
Moreover, experts assert that the impact of context on DAX SUMMARIZE cannot be overstated. As Darshika Srivastava states, ‘DAX (data analysis expression) is essential for effective information manipulation.’ The context shapes the outcomes of calculations, making it imperative for analysts to comprehend how context influences their analyses.
By mastering row and filter contexts, analysts can unlock the full potential of DAX, leading to more informed decision-making and strategic insights. It is also crucial to remember that whole numbers in DAX must lie between -9,223,372,036,854,775,808 and 9,223,372,036,854,775,807, establishing a boundary for the calculations performed.
Additionally, tailored AI solutions can further enhance the effectiveness of DAX by equipping teams with the necessary tools to navigate the overwhelming AI landscape. Implementing Robotic Process Automation (RPA) can streamline repetitive tasks, enabling teams to concentrate on strategic analysis and decision-making, thereby improving operational efficiency.
Comparing SUMMARIZE and SUMMARIZECOLUMNS: Key Differences
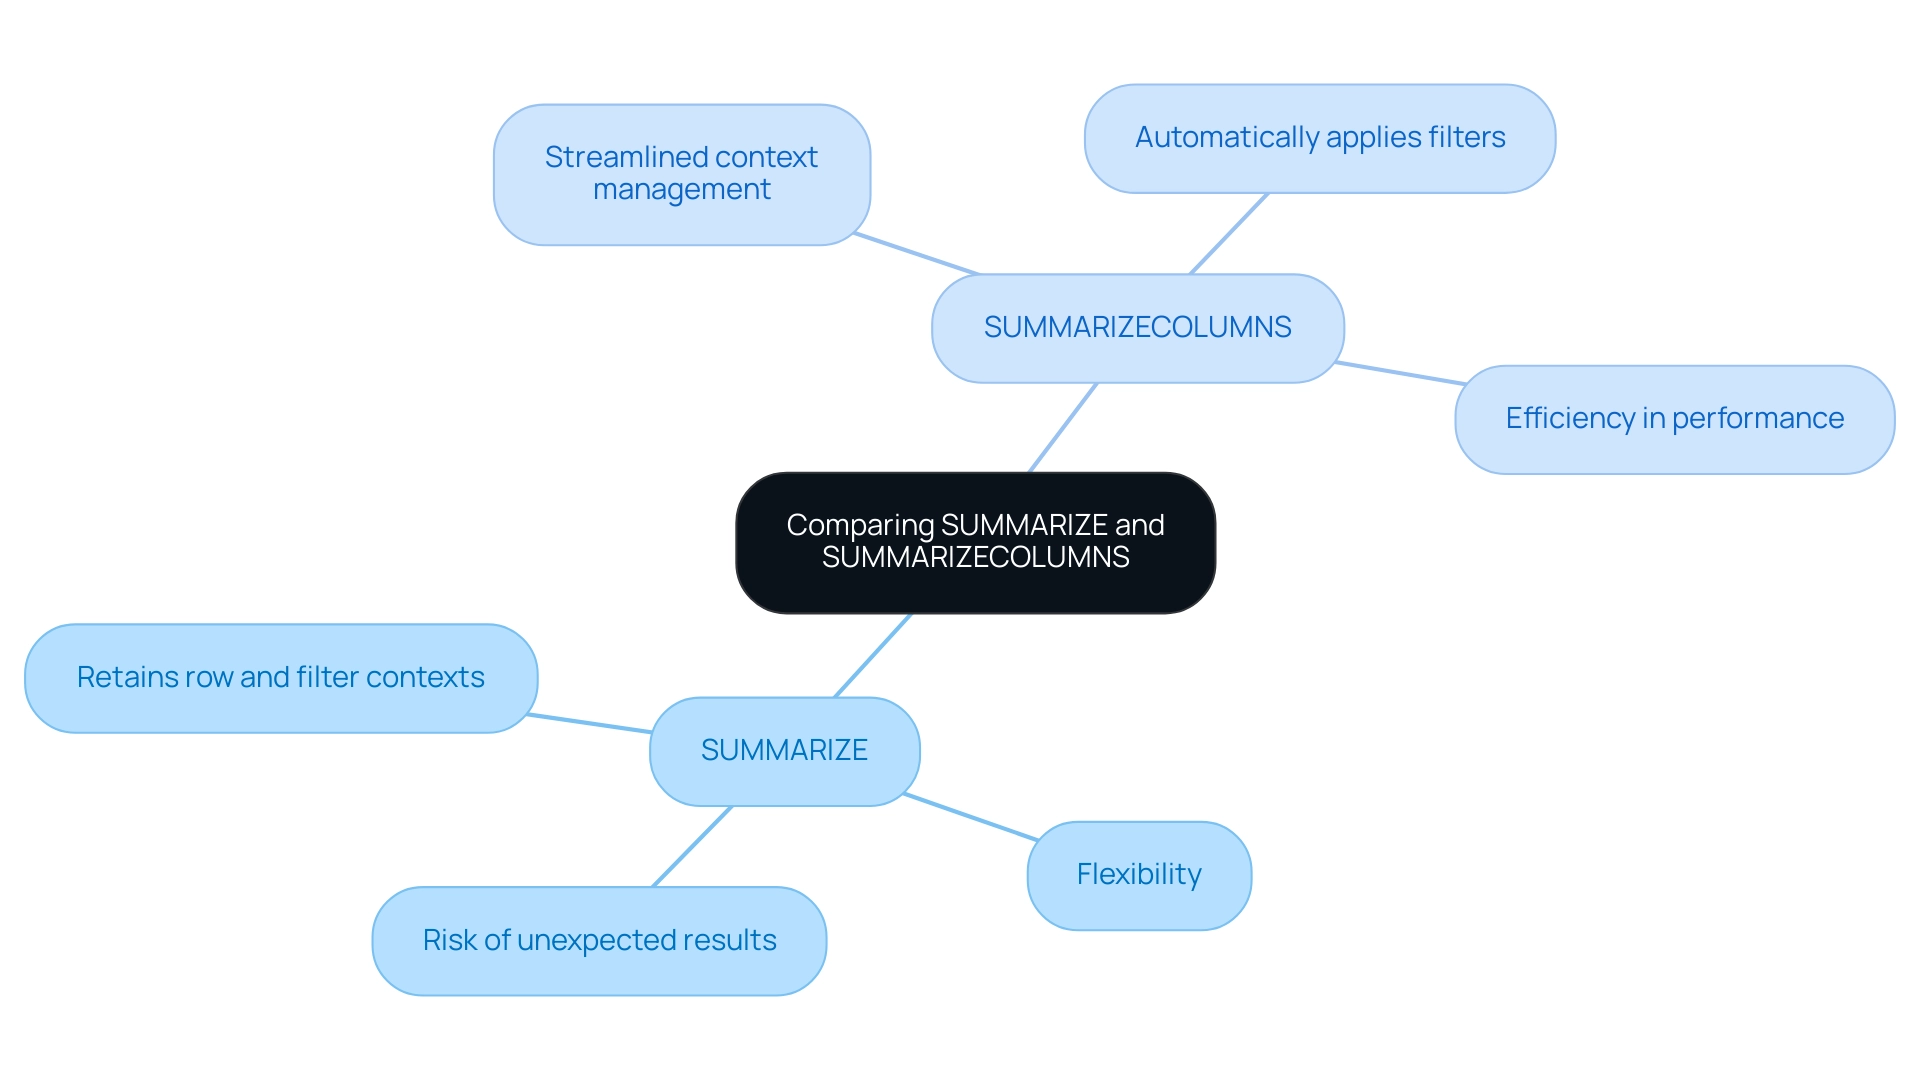
While both SUMMARIZE and SUMMARIZECOLUMNS serve the purpose of creating summary tables, they exhibit significant differences that can impact data analysis outcomes.
-
SUMMARIZE retains both row and filter contexts, which can lead to unexpected results if not managed with precision. This function provides flexibility but necessitates careful management to avoid complications in aggregation.
-
SUMMARIZECOLUMNS, in contrast, streamlines context management by automatically applying filters, making it generally more efficient for performance. It is particularly advantageous in scenarios where strict filtering is necessary, as it focuses solely on filter context.
For instance, when summarizing sales data by product and region, utilizing SUMMARIZECOLUMNS can significantly enhance performance:
SUMMARIZECOLUMNS(Sales[Product], Sales[Region], "Total Sales", SUM(Sales[Amount]))
Statistics indicate that the equivalent syntax of SUMMARIZE returns only 47 combinations of year and color used by at least one row of the Sales table, highlighting the efficiency gains achievable with SUMMARIZECOLUMNS.
A case study titled “Demystifying DAX: Understanding the Difference between a specific function and DAX SUMMARIZE” illustrates these concepts, clarifying that while the former manages both row and filter contexts, SUMMARIZECOLUMNS is tailored for scenarios requiring strict filtering, thus optimizing performance.
Experts in the Power BI community, including Giotto Zhi, emphasize the significance of selecting the appropriate operation for performance optimization. It is usually advised to use SUMMARIZECOLUMNS to add columns instead of SUMMARIZE. This insight underscores the importance of grasping the subtleties between these two roles to facilitate effective analysis.
In the context of operational efficiency, organizations can benefit from tailored solutions that improve information quality and simplify AI implementation. By utilizing the appropriate DAX features, companies can enhance their analysis abilities, ultimately fostering growth and innovation. Furthermore, integrating Robotic Process Automation (RPA) into these processes can automate manual workflows, allowing teams to focus on strategic initiatives that contribute to overall business success.
Practical Examples of Using the SUMMARIZE Function
The DAX SUMMARIZE function serves as a powerful tool for aggregating information in Power BI, playing a crucial role in harnessing Business Intelligence for actionable insights. At Creatum GmbH, we recognize the challenges businesses face in navigating the overwhelming AI landscape, and our tailored AI solutions are designed to help you leverage such tools effectively. Below are several practical examples that illustrate the versatility of the SUMMARIZE function:
-
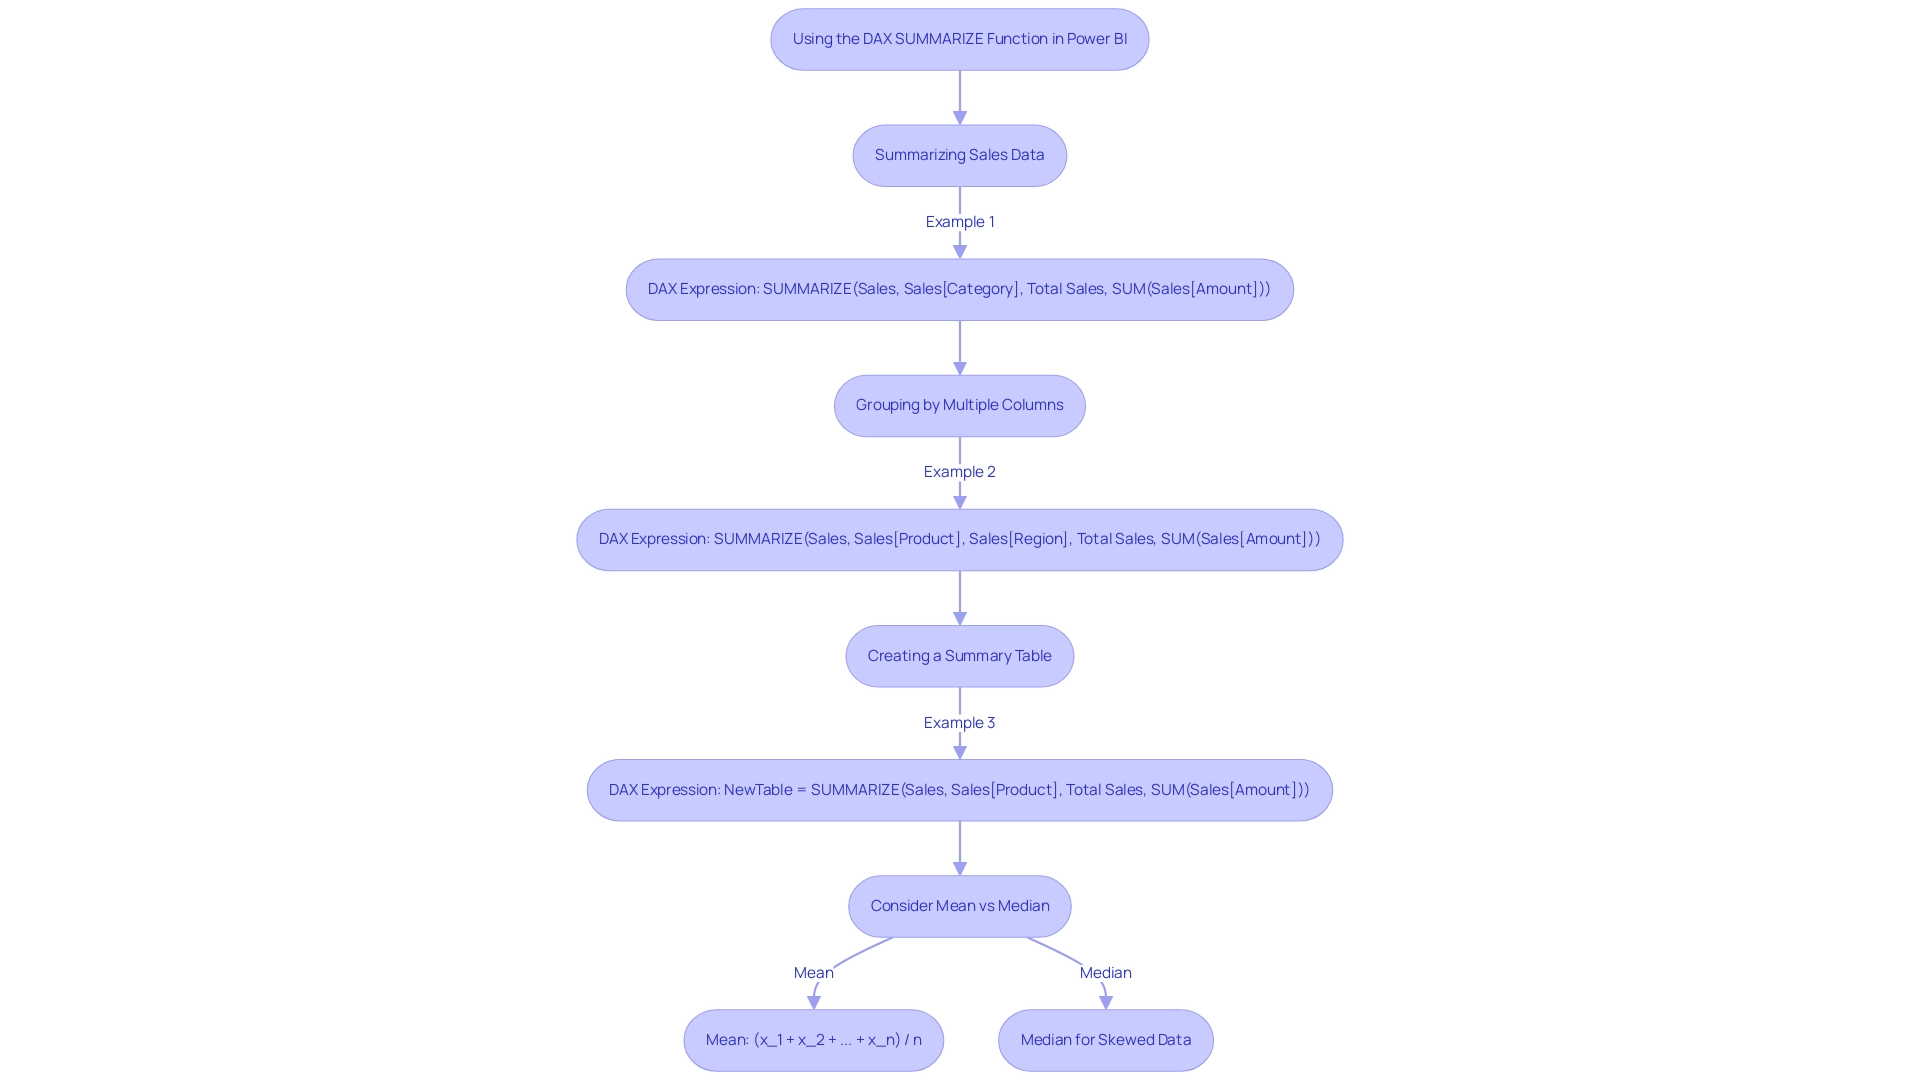
Summarizing Sales Data: To generate a summary of total sales categorized by product, you can use the following DAX expression:
SUMMARIZE(Sales, Sales[Category], "Total Sales", SUM(Sales[Amount]))This expression groups the sales data by product category and calculates the total sales amount for each category. It provides a clear overview of sales performance, enabling informed decision-making.
-
Grouping by Multiple Columns: When analyzing sales data across different dimensions, such as product and region, the SUMMARIZE function can be extended as follows:
SUMMARIZE(Sales, Sales[Product], Sales[Region], "Total Sales", SUM(Sales[Amount]))This allows for a more granular view, helping stakeholders understand how sales vary by both product and geographical region, which is essential for operational efficiency.
-
Creating a Summary Table: In scenarios where you want to create a new table encapsulating summarized sales data, you can implement:
NewTable = SUMMARIZE(Sales, Sales[Product], "Total Sales", SUM(Sales[Amount]))This command generates a new table that consolidates sales data by product, facilitating visualization and analysis of trends. This approach addresses data inconsistency and governance challenges in business reporting.
These examples demonstrate how the DAX SUMMARIZE function effectively groups and summarizes sales information, thereby facilitating better decision-making and operational efficiency. In summarizing sales information, it’s crucial to consider the mean as a measure of central tendency, calculated as the total of all sales amounts divided by the number of sales entries. When information is normally distributed, the mean provides a good summary; however, if the information is skewed, the median may be a more appropriate measure, as highlighted in the case study titled “Understanding Mean and Median.”
By utilizing such DAX capabilities, organizations can transform unrefined information into actionable insights, ultimately fostering growth and innovation. This aligns with our unique value proposition at Creatum GmbH, offering customized solutions, including our 3-Day Power BI Sprint and General Management App, designed to enhance data quality and simplify AI implementation, ensuring businesses can effectively manage their data for strategic decision-making.
Best Practices for Implementing the SUMMARIZE Function
To effectively implement the SUMMARIZE function in Power BI, adhere to the following best practices:
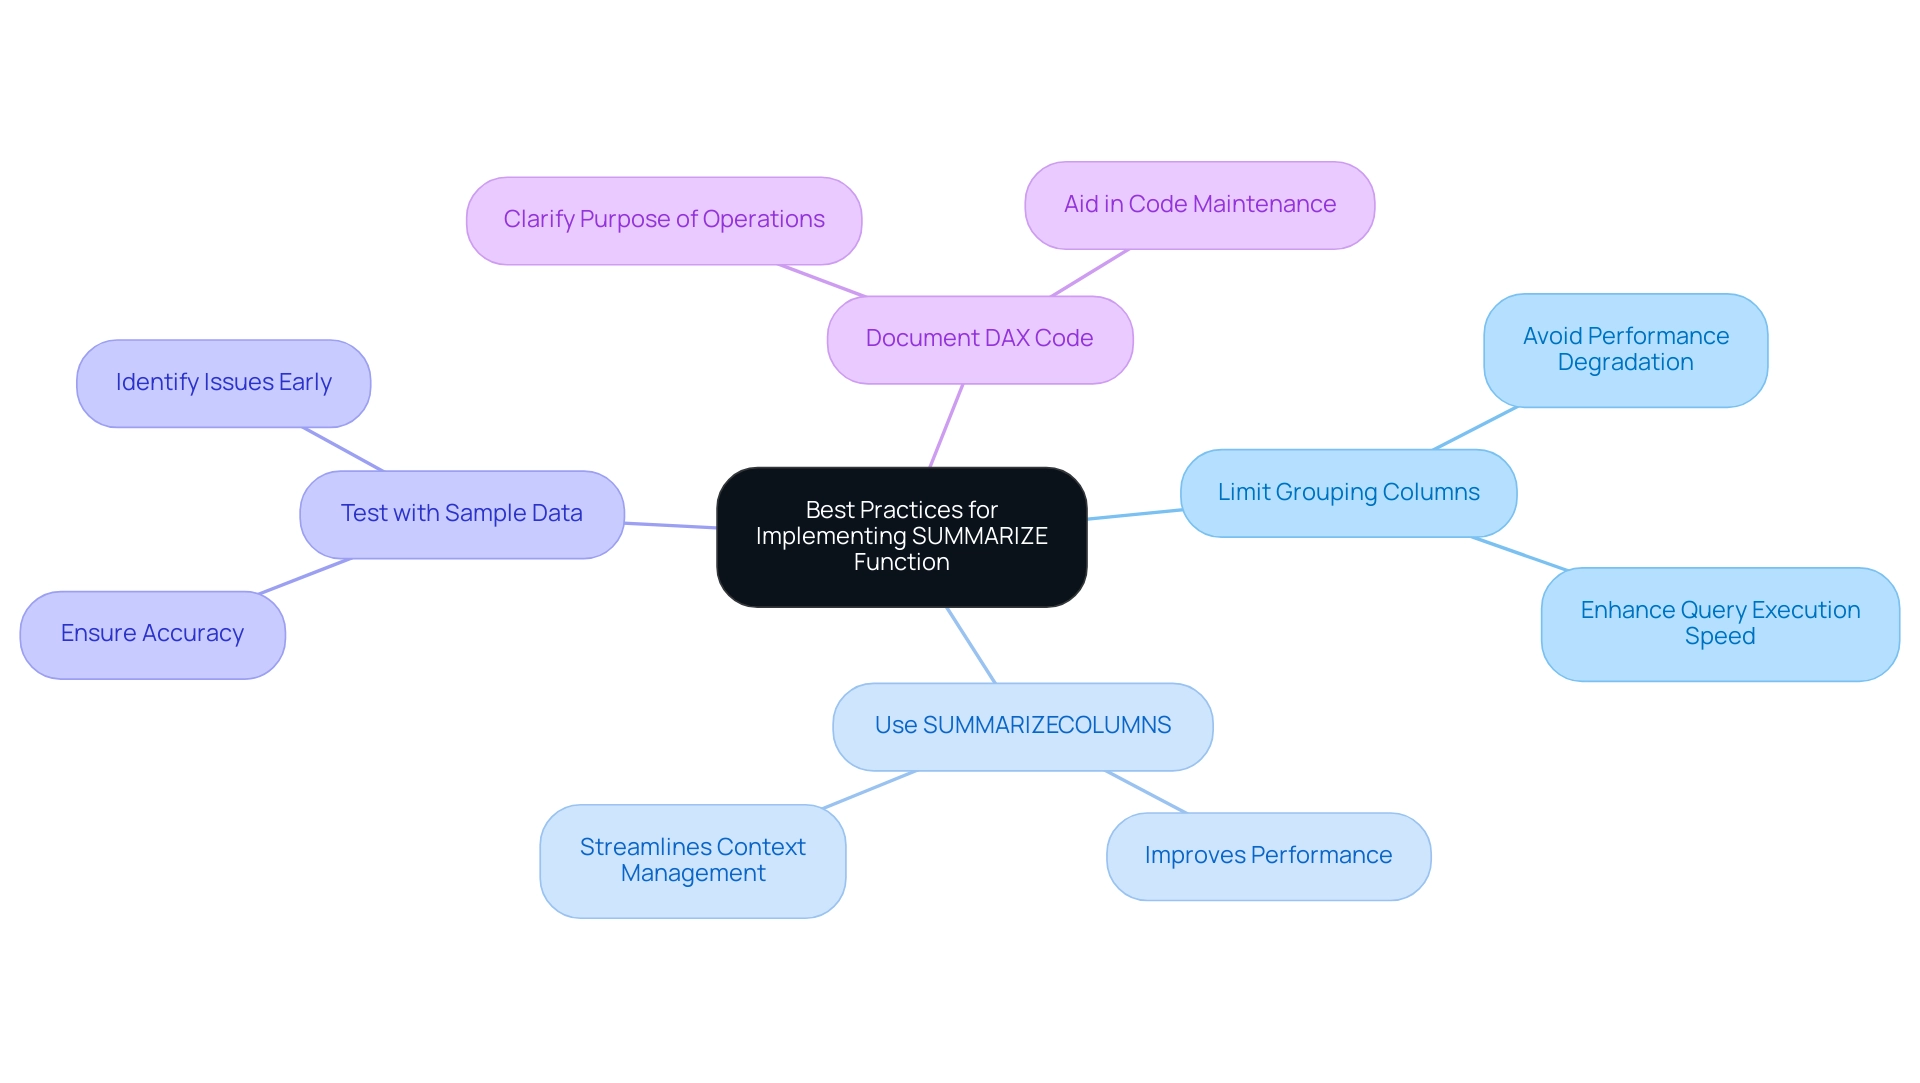
- Limit the Number of Grouping Columns: Including only essential columns is crucial to avoid performance degradation. Research indicates that reducing the number of grouping columns can significantly enhance query execution speed, making your reports more responsive. This aligns with findings from the case study ‘Leveraging Power BI DAX for Business Insights,’ which illustrates how organizations can enhance their analytical abilities through dax summarize processes, ultimately promoting operational efficiency through streamlined workflows.
- Use SUMMARIZECOLUMNS When Possible: Opt for SUMMARIZECOLUMNS instead of SUMMARIZE whenever feasible. This procedure not only enhances performance but also streamlines context management, enabling more efficient information handling. Understanding context in DAX is crucial for mastering how formulas are evaluated, which further supports the use of SUMMARIZECOLUMNS. Leveraging RPA can automate repetitive tasks associated with data preparation, enhancing the overall efficiency of your reporting processes and allowing your team to focus on more strategic initiatives.
- Test with Sample Data: Before running intricate queries, it is recommended to test your summarization capability with a smaller dataset. This practice ensures accuracy and helps identify potential issues early in the development process, reducing the time spent on troubleshooting and enhancing the reliability of your insights.
- Document Your DAX Code: Incorporate comments within your DAX code to clarify the purpose of each dax summarize operation. This documentation is invaluable for future reference and aids in maintaining code clarity, especially in collaborative environments. As Reza Azizi observed, “The FILTER capability enables engineers to generate a new table based on specified criteria,” emphasizing the significance of context and conditions in DAX expressions. This practice not only supports effective collaboration but also aligns with the broader goal of utilizing Business Intelligence to drive informed decision-making.
By following these best practices, organizations can optimize their use of DAX functions, leading to enhanced analytical capabilities and more effective data-driven decision-making. This approach not only enhances information quality but also streamlines AI implementation, aligning with the organization’s mission to drive growth and innovation through the integration of RPA and Business Intelligence. Furthermore, tackling challenges such as time-consuming report generation and inconsistencies can further improve the effectiveness of insights obtained from Power BI dashboards.
At Creatum GmbH, we are committed to helping you leverage these tools for operational excellence.
Common Challenges and Solutions When Using SUMMARIZE
When utilizing the SUMMARIZE function in Power BI, users often encounter several challenges that can hinder their data analysis efforts.
-
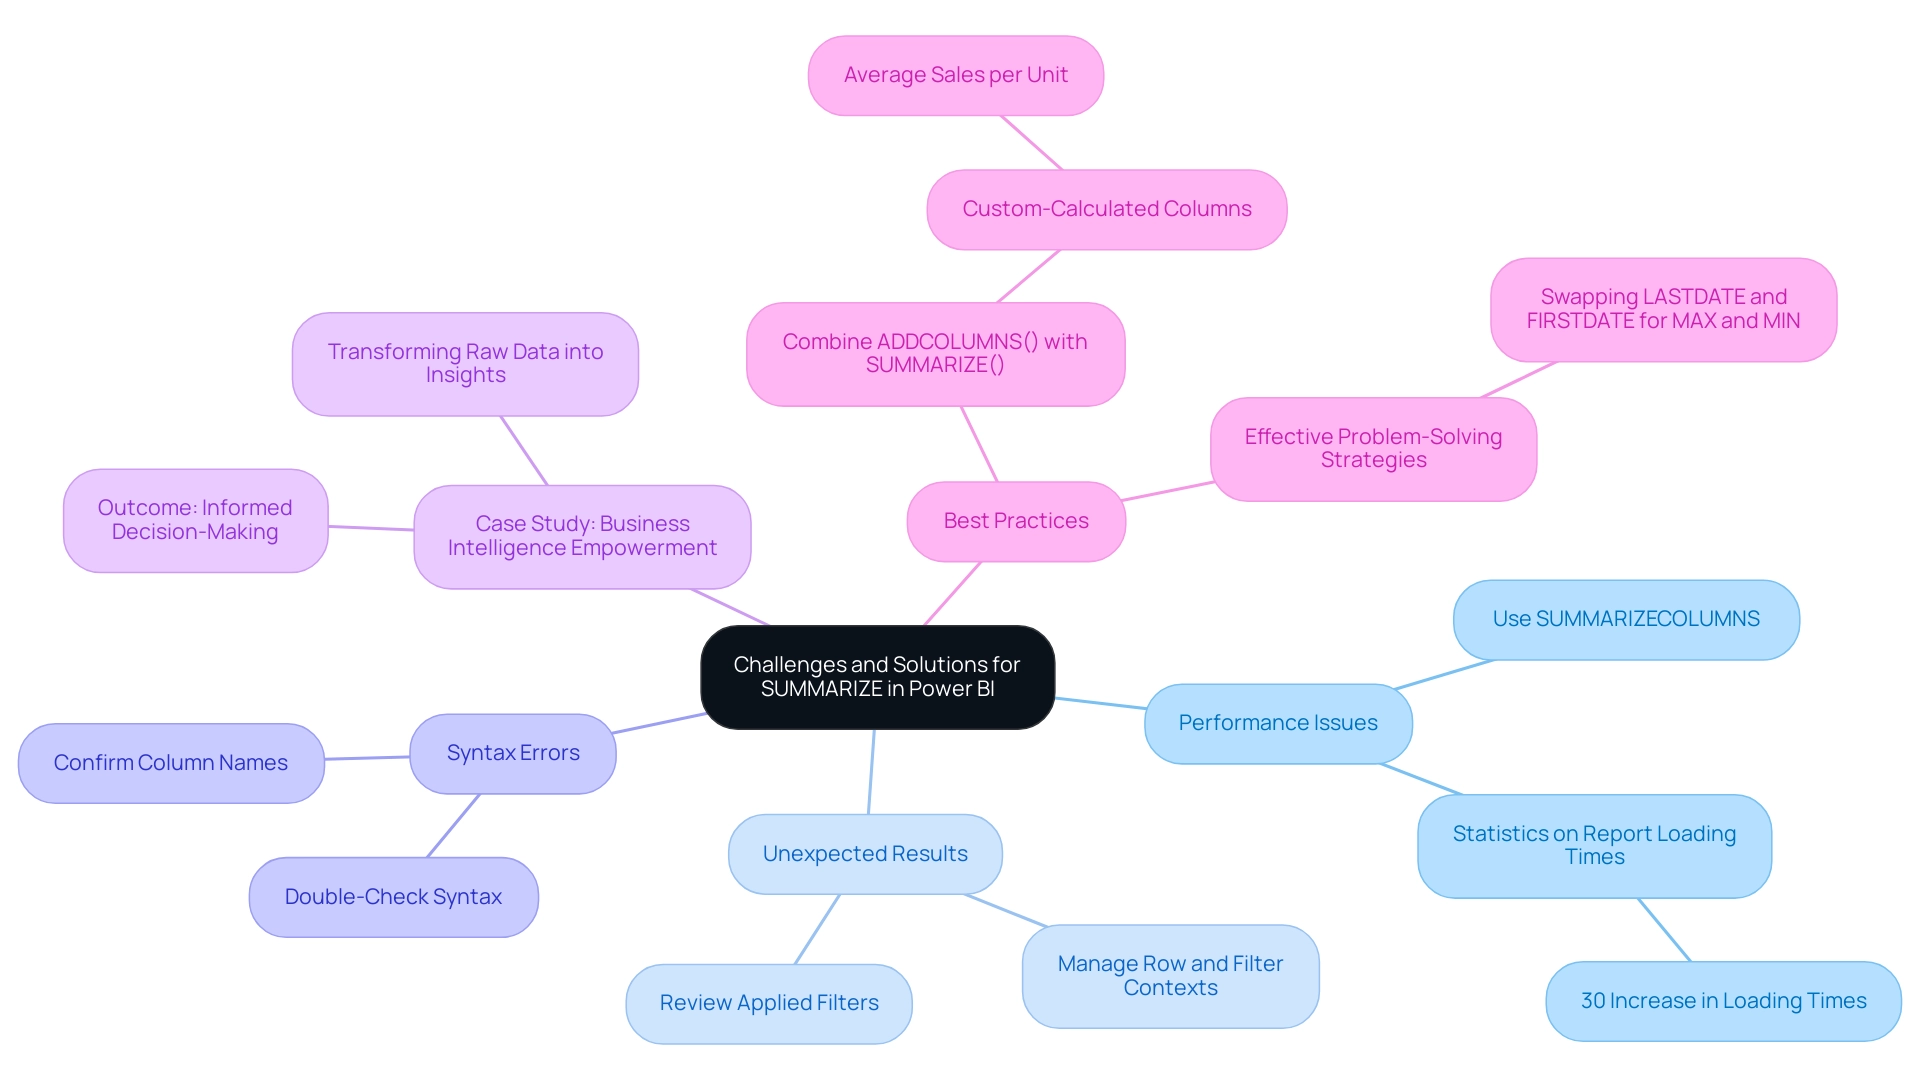
Performance Issues: Large datasets can significantly slow down report performance when using SUMMARIZE. To enhance efficiency, consider using the SUMMARIZECOLUMNS feature, which is optimized for better performance with large datasets. Statistics indicate that performance issues related to large datasets in DAX can lead to a 30% increase in report loading times, underscoring the need for optimized methods like SUMMARIZECOLUMNS.
-
Unexpected Results: Users may experience unexpected outcomes due to context-related issues. To mitigate this, it is crucial to manage row and filter contexts meticulously. Reviewing the applied filters can help ensure that the results align with expectations. This challenge is common in the realm of Business Intelligence, where extracting actionable insights from information can be complex and time-consuming.
-
Syntax Errors: Syntax errors are a common hurdle, often stemming from incorrect column names or missing parameters. To resolve these issues, thoroughly double-check the syntax and confirm that all referenced columns exist within the specified table. This attention to detail is essential for leveraging the full capabilities of BI tools.
In a recent case study titled ‘Business Intelligence Empowerment,’ organizations encountered similar challenges with DAX functions, particularly regarding how to effectively summarize data. By implementing structured troubleshooting methods, they transformed raw information into actionable insights, significantly improving decision-making processes and enhancing overall quality. This illustrates the importance of addressing these common challenges effectively, especially in a data-rich environment where the lack of data-driven insights can leave businesses at a competitive disadvantage.
Moreover, incorporating DAX summarize with ADDCOLUMNS() can allow for custom-calculated columns, such as Average Sales per Unit, further optimizing analysis. As Laiba Siddiqui, a content strategist, notes, “I love simplifying complex topics,” which resonates with the need for clarity in navigating these challenges. By adopting these best practices, users can unlock the full potential of grouping in Power BI, driving growth and innovation in their operations.
Furthermore, a practical troubleshooting example is evident in a user’s experience where swapping LASTDATE and FIRSTDATE operations for MAX and MIN resolved their issue, showcasing effective problem-solving strategies. Moreover, Creatum GmbH’s RPA solutions can further improve operational efficiency by automating repetitive tasks, enabling teams to concentrate on analysis and strategic decision-making.
Key Takeaways from the DAX SUMMARIZE Tutorial
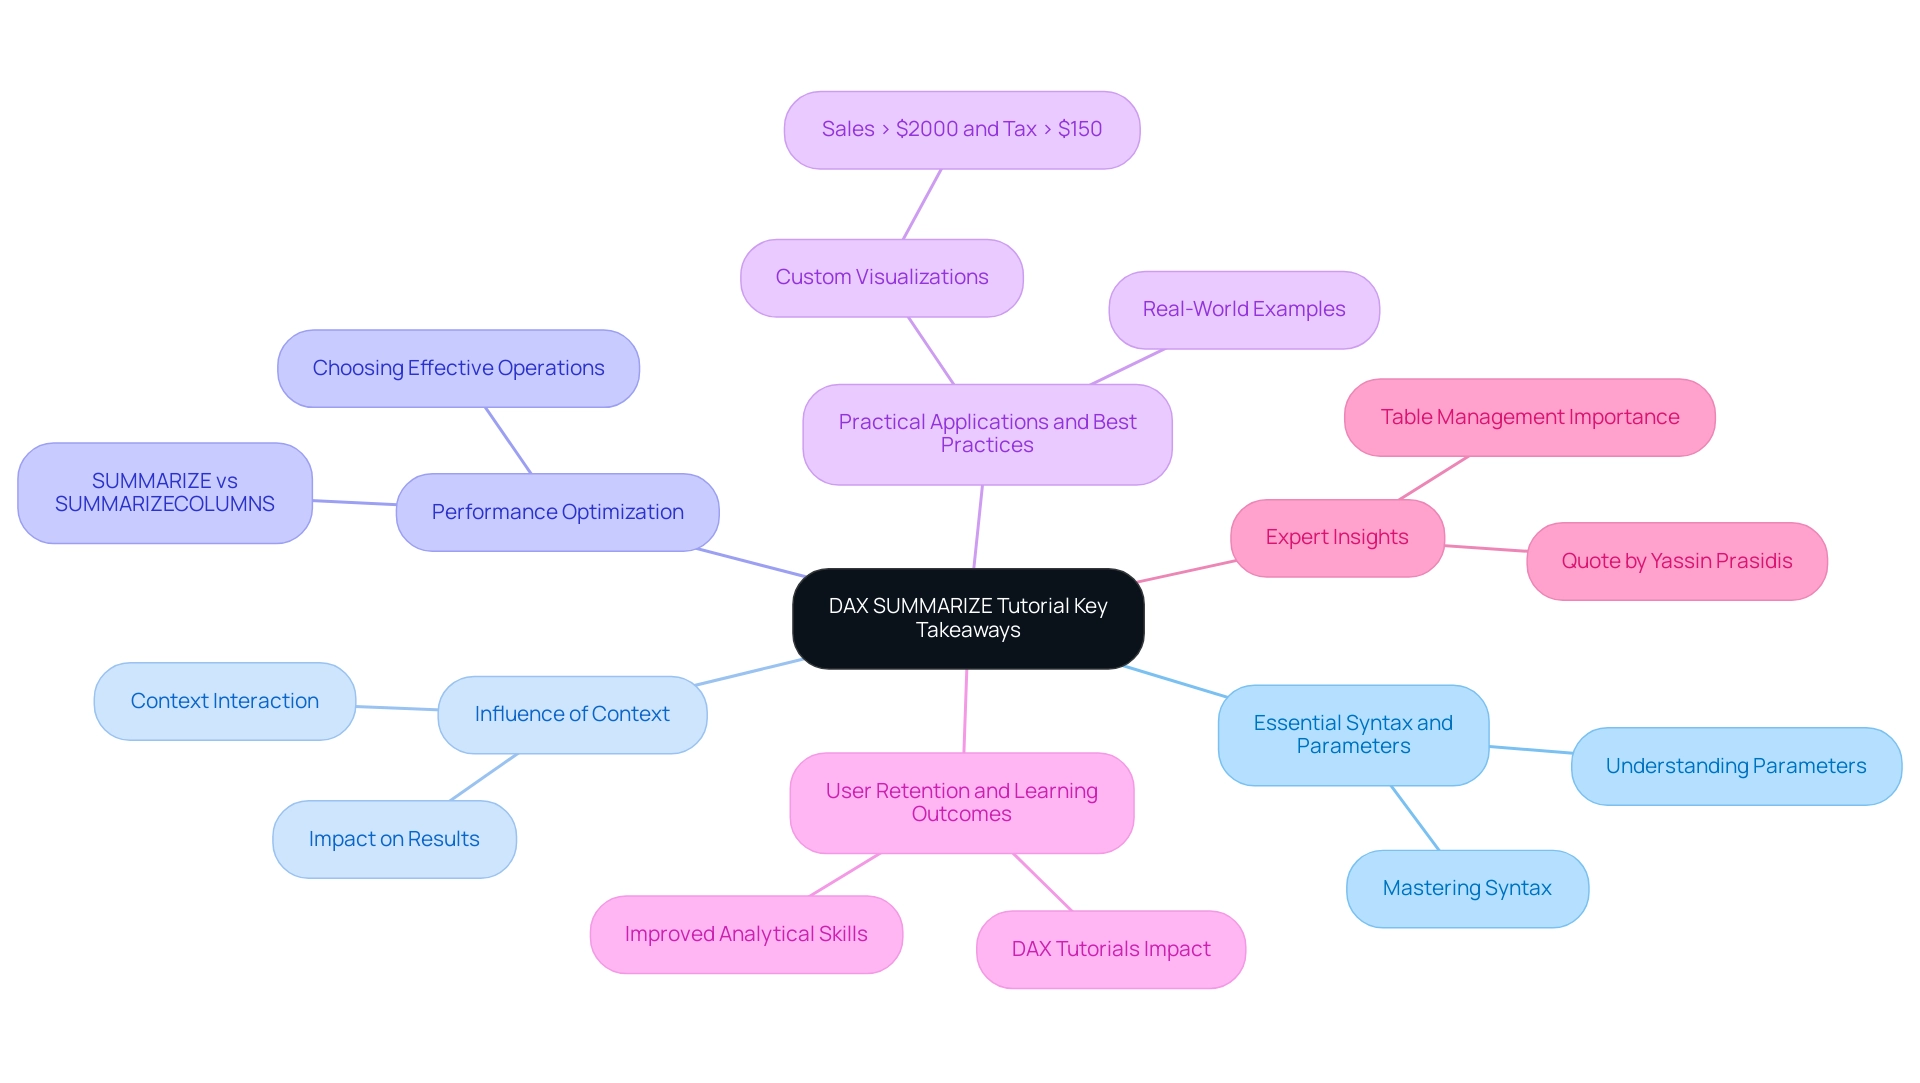
The DAX aggregation tool emerges as an indispensable asset for summarizing and organizing information within Power BI, delivering numerous advantages for analysis. Key takeaways include:
- Essential Syntax and Parameters: Mastering the syntax and parameters is vital for unlocking the full potential of the SUMMARIZE function. Understanding how to structure your queries leads to more efficient information manipulation.
- Influence of Context: The context in which summarization is applied significantly impacts the results. Grasping how context interacts with your data can enhance the accuracy of your analyses.
- Performance Optimization: Evaluating the summary function alongside SUMMARIZECOLUMNS can provide insights into performance optimization. This comparison empowers users to choose the most effective operation for their specific needs, ensuring faster information processing.
- Practical Applications and Best Practices: Real-world examples demonstrate the effective use of SUMMARIZE in business intelligence. For instance, organizations have successfully utilized this capability to create custom visualizations that uncover critical insights from their data, ultimately supporting informed decision-making. A specific application could involve generating a table that displays sales exceeding $2000 and a tax amount greater than $150, showcasing the feature’s utility.
- User Retention and Learning Outcomes: Statistics reveal that users who engage with DAX tutorials, particularly those centered on the SUMMARIZE function, experience improved retention rates and enhanced analytical skills. This underscores the importance of continuous education in mastering analysis tools.
- Expert Insights: Analysts assert that effective management of tables not only facilitates accurate reporting but also amplifies overall analytical capabilities in Power BI. As Yassin Prasidis, a Business Intelligence Content Developer, articulates, “Proper table management not only facilitates accurate reporting but also enhances the overall analytical capabilities of Power BI, enabling users to derive meaningful insights from their information.” This insight highlights the necessity of mastering DAX operations, including how to summarize data effectively.
Moreover, the transformative impact of Creatum’s Power BI Sprint has been underscored by clients such as Sascha Rudloff from PALFINGER Tail Lifts GMBH, who remarked that the sprint not only delivered an immediately usable Power BI report and gateway setup but also significantly expedited their Power BI development. This success story exemplifies how leveraging advanced business intelligence tools can drive operational efficiency and enhance data-driven decision-making.
Additionally, Creatum’s Power BI services, including the 3-Day Power BI Sprint and the General Management App, are tailored to address inconsistency and governance challenges, ensuring that users can trust the insights derived from their data. By integrating these elements, including the case study titled “Business Intelligence for Data Insights,” which illustrates how the organization aids businesses in transforming raw data into actionable insights, users can unlock the full potential of the DAX SUMMARIZE function—essential for revolutionizing their approach to data analysis and driving operational efficiency.
Conclusion
The SUMMARIZE function in Power BI stands as an essential tool for data analysts, facilitating the aggregation and grouping of data to extract meaningful insights. By mastering its syntax, parameters, and applicable contexts, users can significantly enhance their data analysis capabilities. The recent enhancements introduced in 2025 further reinforce its relevance in modern business intelligence, effectively addressing performance issues and bolstering data governance.
Adopting best practices, such as limiting the number of grouping columns and utilizing SUMMARIZECOLUMNS when appropriate, can lead to more efficient data processing and superior analytical outcomes. Real-world applications demonstrate how organizations leverage the SUMMARIZE function to guide strategic decision-making, optimize operational efficiency, and generate actionable insights from their data.
The necessity of mastering DAX functions like SUMMARIZE cannot be overstated. As businesses navigate an increasingly complex data landscape, the ability to transform raw data into clear, actionable insights becomes vital for sustained growth and innovation. By embracing these practices and harnessing the capabilities of Power BI, organizations can ensure they remain competitive in a data-driven world, ultimately driving success through informed decision-making.
Frequently Asked Questions
What is the DAX summarize function in Power BI?
The DAX summarize function in Power BI is a powerful tool that allows users to create summary tables by organizing data based on specified columns, similar to the SQL GROUP BY statement.
How can the summarize function be applied to sales data?
Users can group sales data by product category using the summarize function to calculate total sales for each category, providing a clear overview of performance across different segments.
What updates were made to the summarization tool in 2025?
The 2025 updates introduced enhancements that streamline aggregation processes, improve performance metrics, and add features to address complex information scenarios.
Why is identifying outliers important in data analysis?
Identifying outliers, such as unusually high sales figures, is crucial as it helps analysts understand anomalies in datasets and apply robust analytical techniques.
How does the DAX summarize function aid financial analysts?
Financial analysts can use the DAX summarize function to assess revenue streams by product line, facilitating informed decision-making and improving operational efficiency.
What is the syntax for the SUMMARIZE operation in DAX?
The syntax for the SUMMARIZE operation is: SUMMARIZE (table, group by_column name1, [group by_columnName2], …), where ‘table’ is the data source and ‘group by_column’ specifies the columns for grouping.
Can you provide an example of how to use the SUMMARIZE function?
An example of using the SUMMARIZE function is: SUMMARIZE(Sales, Sales[Product], Sales[Region]), which aggregates sales information by both product and region.
What is the significance of output tables generated by the SUMMARIZE function?
Output tables generated by the SUMMARIZE function serve as the foundation for deriving actionable insights, enabling businesses to make informed decisions based on comprehensive evaluations.
How can businesses leverage DAX SUMMARIZE in practice?
Businesses can use DAX SUMMARIZE to analyze sales information, customer behavior, and operational efficiency, such as aggregating sales figures by region and product category to inform inventory management.
What role do aggregated values play in the summarization process?
Aggregated values enhance the analytical depth of summary outputs, providing clearer insights into performance metrics across various categories.
What is the relevance of continuous updates to DAX capabilities?
Continuous updates to DAX capabilities reinforce the significance of the summarize tool in addressing issues of consistency and governance, ultimately improving decision-making in Power BI.

