Overview
The article “How to Do a Cluster Analysis: A Step-by-Step Guide for Beginners” serves as an essential resource for professionals seeking to master cluster analysis. It lays out a comprehensive framework that includes:
- Defining objectives
- Preparing data
- Selecting suitable algorithms
- Interpreting results
Crucially, it underscores the significance of data preparation and highlights the integration of automation tools, such as Robotic Process Automation (RPA), to boost efficiency and accuracy throughout the clustering process.
Introduction
In a world awash with data, extracting meaningful insights has never been more crucial. Cluster analysis emerges as a dynamic statistical tool that groups similar items, unveiling hidden patterns across diverse sectors such as marketing, healthcare, and finance. By harnessing this technique, organizations can enhance operational efficiency and drive strategic decision-making through targeted insights.
As businesses increasingly integrate technologies like Robotic Process Automation (RPA) and advanced AI solutions, mastering cluster analysis becomes paramount. This article delves into the fundamentals of cluster analysis, its real-world applications, and the evolving algorithms shaping its future, providing a comprehensive guide for organizations aiming to thrive in today’s data-centric landscape.
Understanding Cluster Analysis: An Overview
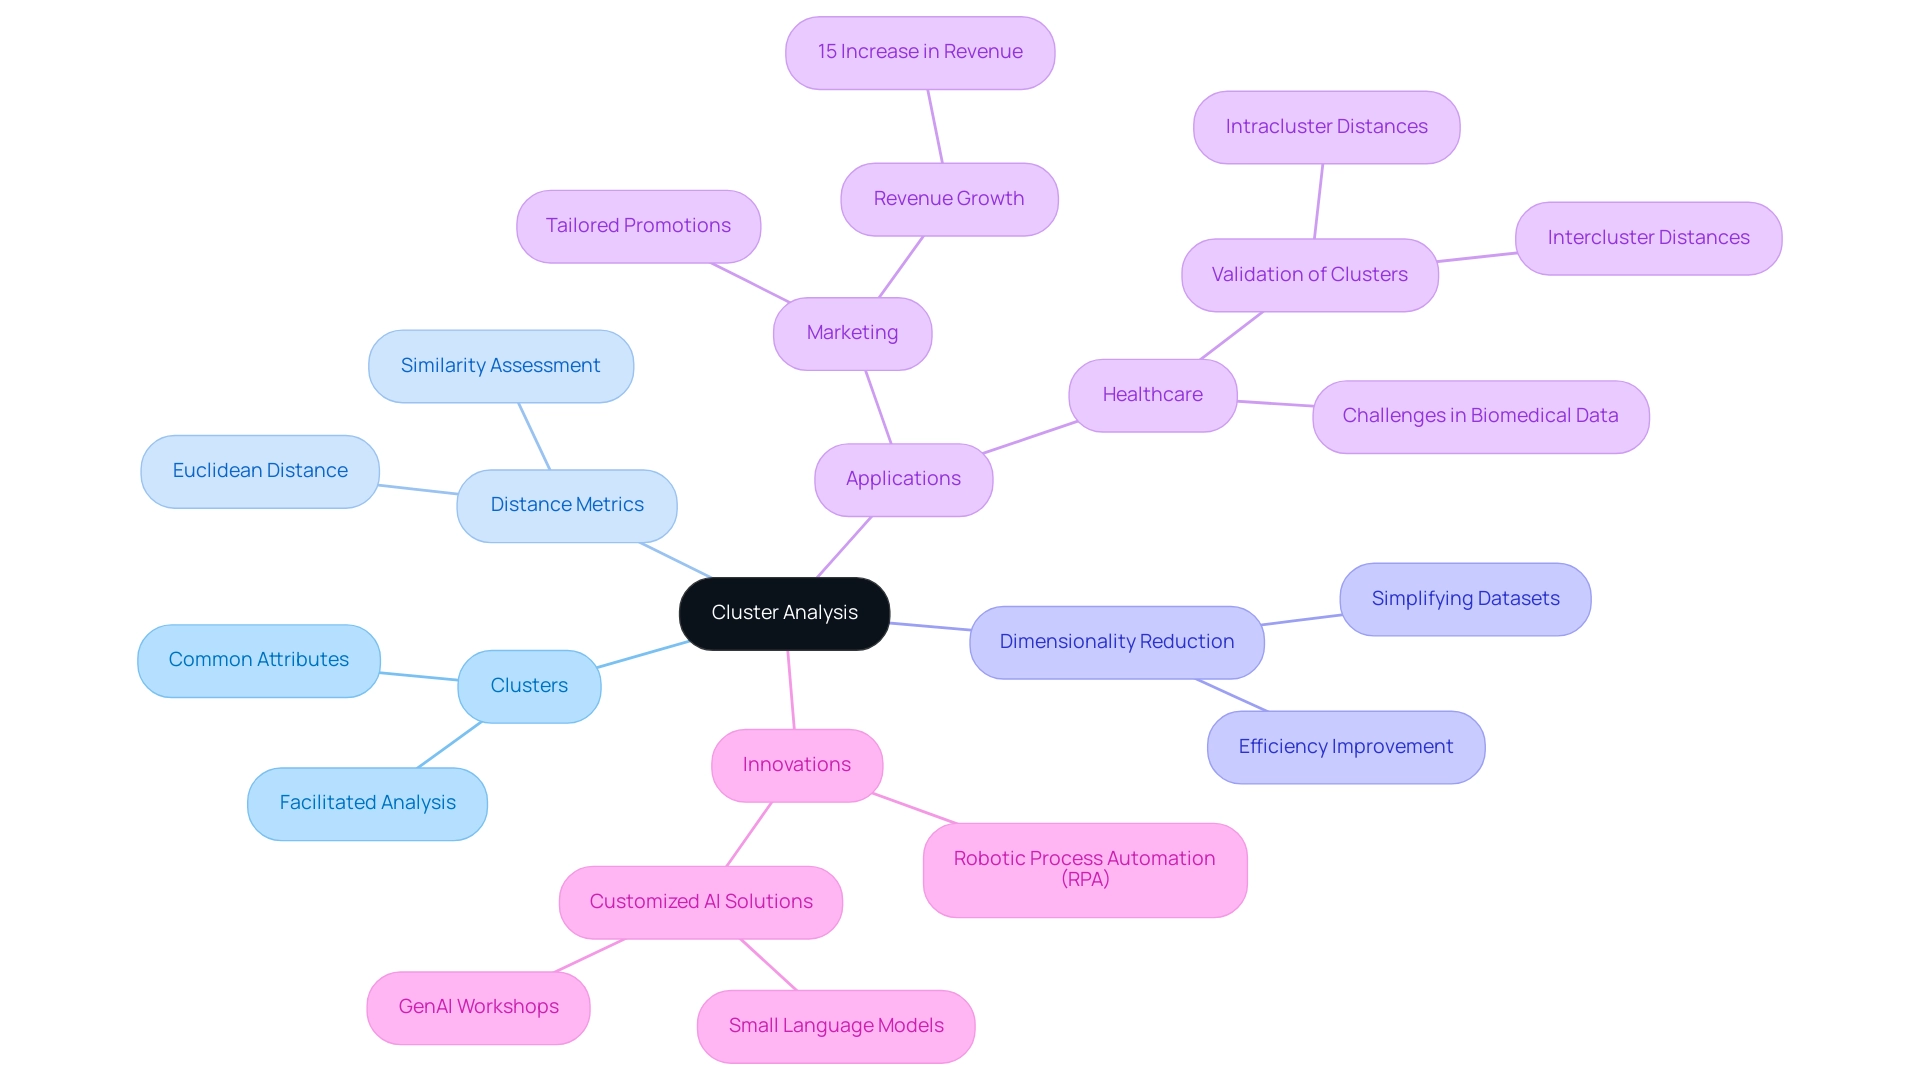
Grouping techniques represent a powerful statistical method that organizes similar items into groups based on shared characteristics. This method finds extensive application across various domains, including marketing, biology, and social sciences, where it serves to identify patterns and relationships within complex datasets. By arranging information into distinct groups, analysts can uncover concealed structures and insights that may otherwise remain hidden, ultimately enhancing operational efficiency through the integration of Robotic Process Automation (RPA) and customized AI solutions from Creatum GmbH.
Grasping the fundamentals of cluster analysis is crucial for efficiently utilizing information in decision-making processes. Key concepts include:
- Clusters: Groups of similar data points that share common attributes, facilitating easier analysis and interpretation.
- Distance Metrics: Critical measures used to assess the similarity between data points. Common metrics include Euclidean distance, quantifying the straight-line distance between points in a multidimensional space.
- Dimensionality Reduction: Techniques that simplify the dataset by reducing the number of variables considered, making the clustering process more manageable and efficient.
The importance of grouping techniques, particularly cluster analysis, in data-driven decision-making cannot be overstated. For instance, a worldwide retail chain effectively utilized group assessment to customize promotions for specific customer segments, resulting in an impressive 15% increase in revenue over just 12 months. This example underscores how targeted strategies, informed by group evaluation, can drive significant business growth, especially when paired with RPA to automate the evaluation process.
Furthermore, understanding cluster analysis is essential in fields such as healthcare, where researchers face challenges due to overlapping information distributions. A study highlighted the practical methods required when employing grouping techniques for biomedical information, emphasizing the importance of thorough validation of groups through intragroup and intergroup distance assessments. This ensures that identified groups are internally consistent and distinct from one another, addressing inconsistencies and governance challenges in business reporting for improved decision-making.
As advancements in group assessment methods continue, incorporating flexible adjustments to information changes enhances the grouping procedure. As Sarah Lee noted, “This integration enhances the clustering process by enabling dynamic adaptation to variations during both training and deployment phases.” This relevance is increasingly pronounced in today’s data-rich environment.
By mastering group evaluation, organizations can transform unprocessed information into actionable insights, fostering informed decision-making and promoting innovation. Moreover, Creatum GmbH’s unique value proposition lies in offering tailored solutions, such as Small Language Models and GenAI Workshops, which enhance quality and simplify AI implementation, ultimately assisting businesses on their journey toward insight-driven success.
Applications of Cluster Analysis in Real-World Scenarios
Cluster analysis serves as a powerful tool across multiple sectors, enabling organizations to derive actionable insights from complex datasets while enhancing operational efficiency through automation.
-
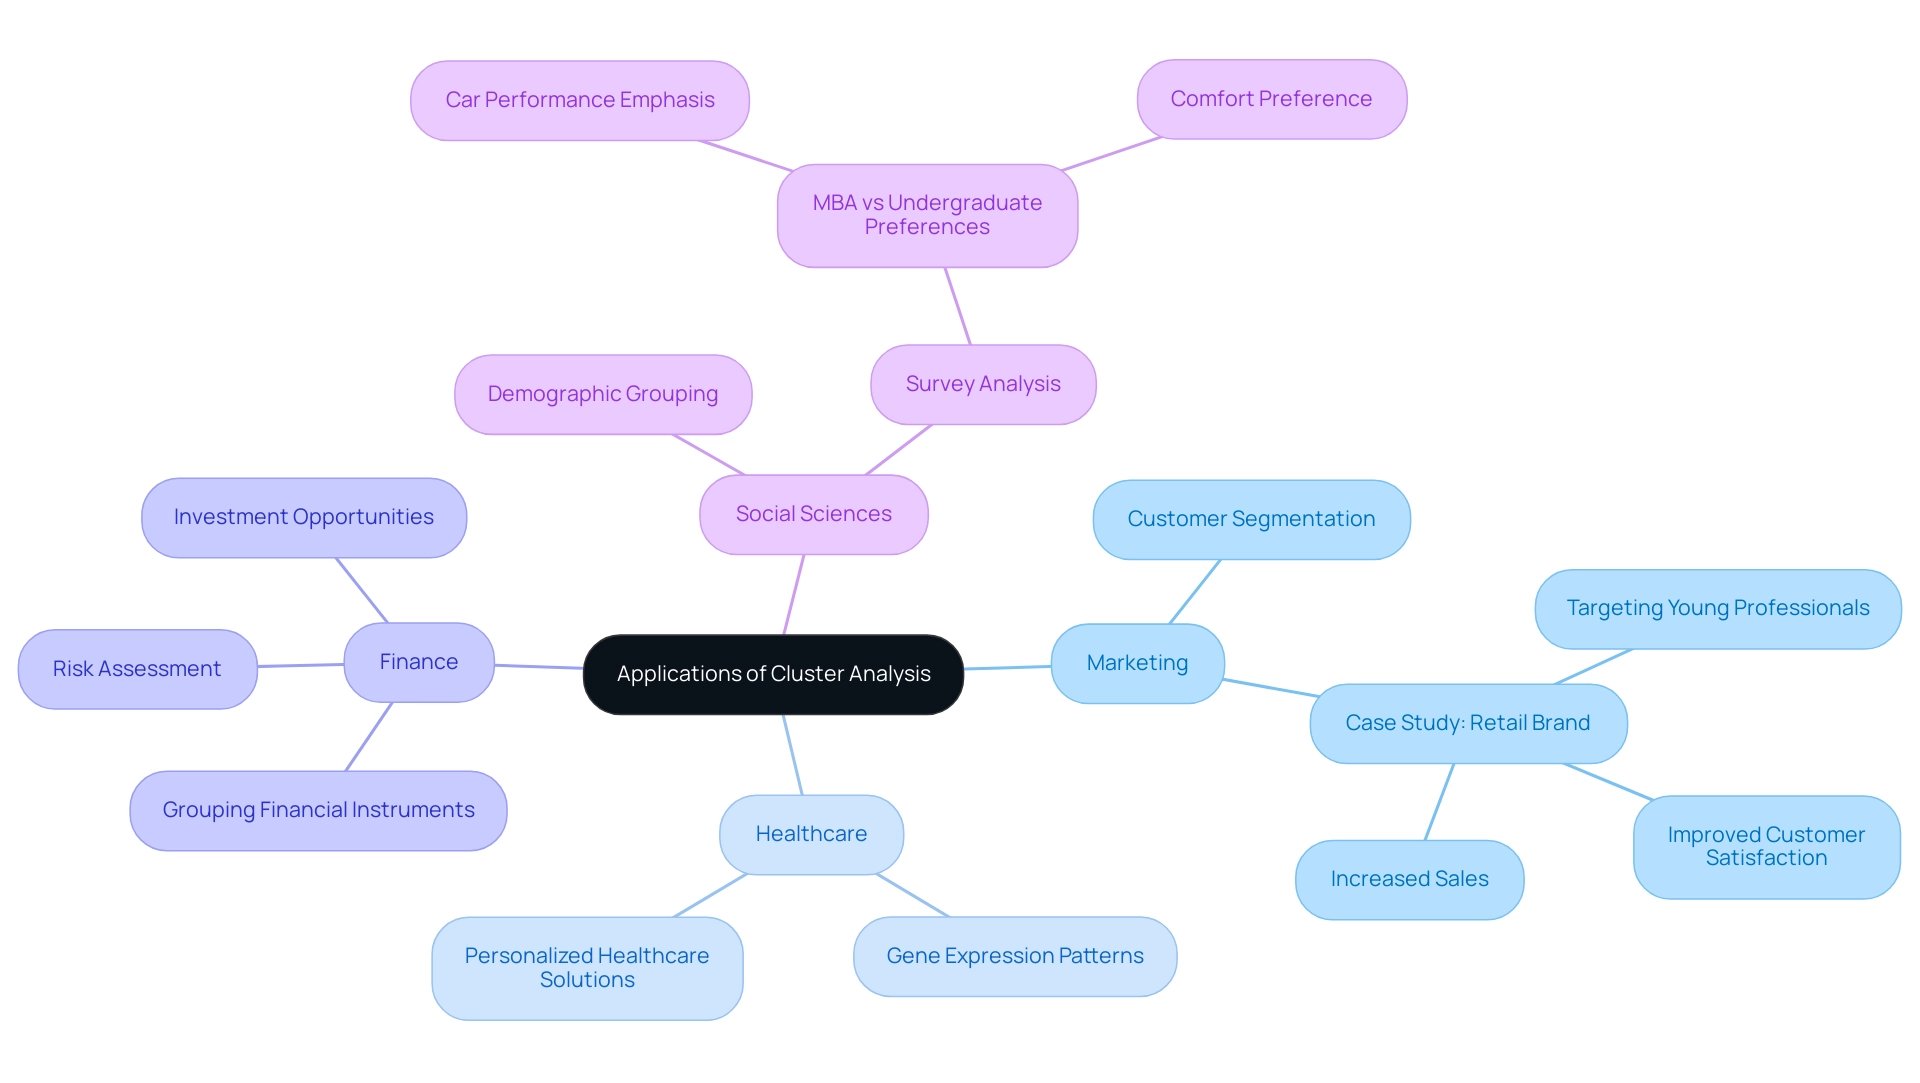
Marketing: Businesses leverage cluster analysis to segment customers based on purchasing behaviors, facilitating the development of targeted marketing strategies. For instance, a retail brand discovered that a significant portion of their frequent shoppers were busy young professionals. This insight led to enhancements in their online shopping experience, resulting in improved customer satisfaction and increased sales by better catering to the needs of their high-value customers. Additionally, in a recent survey of 32 individuals in the Comfort segment, 10 chose Mercedes, representing around 31% of that segment, highlighting how demographic preferences can influence marketing strategies. RPA can further enhance this process by automating information gathering and evaluation, minimizing mistakes, and allowing marketing teams to concentrate on strategic initiatives.
-
Healthcare: In the field of genomics, researchers utilize clustering techniques to identify gene expression patterns. This application is crucial for advancing disease diagnosis and treatment, as it allows for the categorization of patients based on genetic similarities, ultimately leading to more personalized healthcare solutions. The incorporation of RPA can further optimize information processing in this sector, enabling quicker and more precise evaluations while minimizing the likelihood of human error.
-
Finance: Financial analysts utilize cluster evaluation to group similar financial instruments, assisting in recognizing investment opportunities and assessing risk. This method enhances portfolio management by allowing analysts to recognize patterns and correlations among various assets, thereby informing better investment decisions. RPA can automate the data collection and evaluation processes, significantly reducing the time required for these tasks and allowing analysts to concentrate on strategic decision-making.
-
Social Sciences: In social research, clustering is used to group survey respondents based on demographics or opinions. This approach not only facilitates a deeper understanding of social trends but also helps in tailoring policies and programs to meet the needs of specific population segments. For example, recent findings indicate that MBA students are more likely to prioritize car performance compared to undergraduate students, with 11 out of 24 MBA students emphasizing performance, while only 7 out of 49 undergraduate students did. This demonstrates how demographic elements can affect preferences and results in group evaluation. RPA can support researchers by automating survey information processing, thus improving the effectiveness of their evaluations.
These varied applications demonstrate how to conduct a cluster analysis, highlighting the adaptability of cluster methodologies in converting raw information into significant insights, which propels growth and innovation across sectors. By utilizing RPA, organizations can automate manual workflows related to information assessment, thereby improving operational efficiency and allowing teams to concentrate on strategic initiatives. As Juan Felipe Ly noted, “the results of both clustering techniques are almost similar to the same dataset,” emphasizing the reliability of these methods in various contexts.
Furthermore, as the AI landscape continues to evolve, RPA can help organizations navigate these challenges by providing scalable solutions that adapt to changing business needs.
Exploring Different Clustering Algorithms: K-means, Hierarchical, and More
Grouping algorithms serve as vital instruments in information analysis, each offering unique methods tailored to diverse data characteristics and analytical objectives.
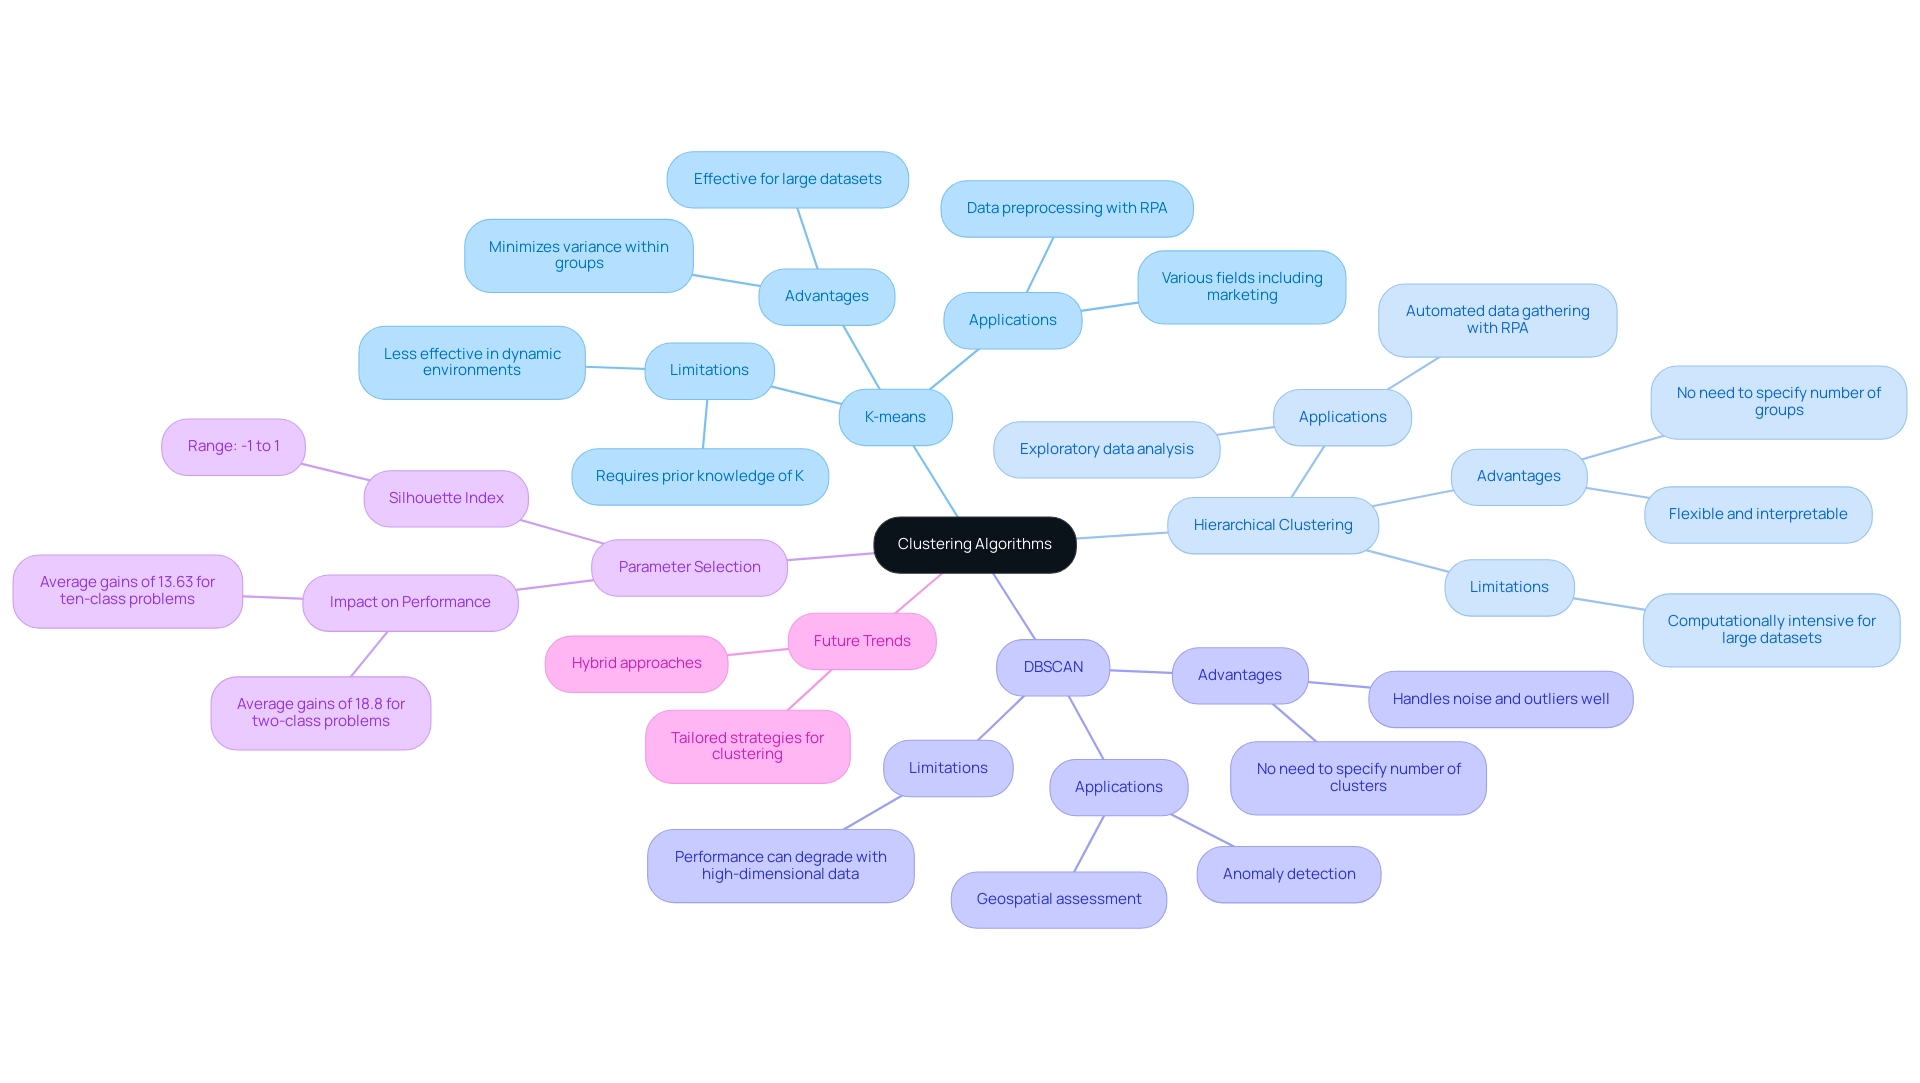
K-means Grouping: This widely utilized algorithm partitions data into K distinct groups by minimizing the variance within each group. It excels with large datasets, though it necessitates prior knowledge of the number of groups, which can pose limitations in dynamic environments. Recent advancements in K-means have focused on optimizing initialization techniques and enhancing convergence speed, rendering it more robust for various applications. Employing Robotic Process Automation (RPA) can streamline the preprocessing of data for K-means, ensuring it is tidy and well-organized for examination, thereby minimizing errors and freeing team resources for more strategic tasks.
Hierarchical Clustering: This method constructs a tree-like structure of groups, providing a more nuanced approach to data grouping. It can be executed in two ways: agglomerative (bottom-up) and divisive (top-down). Hierarchical clustering is advantageous when the number of groups is uncertain, as it allows for the examination of data at different levels of detail. Current trends indicate a growing preference for hierarchical methods in exploratory data analysis due to their interpretability and flexibility. RPA can assist in automating data gathering and preparation processes, enhancing the effectiveness of hierarchical clustering and enabling teams to focus on higher-level analysis.
DBSCAN (Density-Based Spatial Clustering of Applications with Noise): This algorithm excels at identifying clusters based on the density of data points, making it particularly effective for datasets with noise and clusters of arbitrary shapes. DBSCAN’s ability to handle outliers and its independence from the number of clusters make it a popular choice in complex environments. Real-world applications have demonstrated its effectiveness in areas such as geospatial assessment and anomaly detection. By integrating RPA, organizations can automate the identification of relevant datasets for DBSCAN, thus improving the speed and accuracy of analysis while minimizing manual errors.
When selecting a clustering algorithm, it is essential to consider the specific characteristics of the data, such as distribution, scale, and the presence of noise. For instance, K-means may perform well with spherical clusters, whereas DBSCAN is preferable for irregularly shaped clusters. A recent study emphasized that varying parameters in clustering algorithms, such as ‘modelName’ and ‘minPts’ in the EM method, can lead to significant accuracy improvements—averaging gains of 18.8% for two-class problems and 13.63% for ten-class problems.
This underscores the importance of parameter selection in achieving optimal clustering performance. Furthermore, silhouette index values, which range from -1 to 1, serve as a quantitative measure of clustering effectiveness, offering insights into the quality of the groups formed.
As we look towards 2025, the landscape of clustering algorithms continues to evolve, with a notable emphasis on hybrid approaches that combine the strengths of multiple algorithms. Data scientists stress the importance of conducting cluster analysis with a tailored strategy, asserting that the choice of clustering algorithm should align with the specific goals of the evaluation and the inherent characteristics of the dataset. As Absalom E. Ezugwu noted, this survey paper will be beneficial for both practitioners and researchers, highlighting the relevance of these methodologies in practical applications.
Moreover, the distinctive value of tailored solutions provided by Creatum GmbH enhances data quality and streamlines AI implementation, fostering growth and innovation in data evaluation.
Step-by-Step Guide to Conducting Cluster Analysis
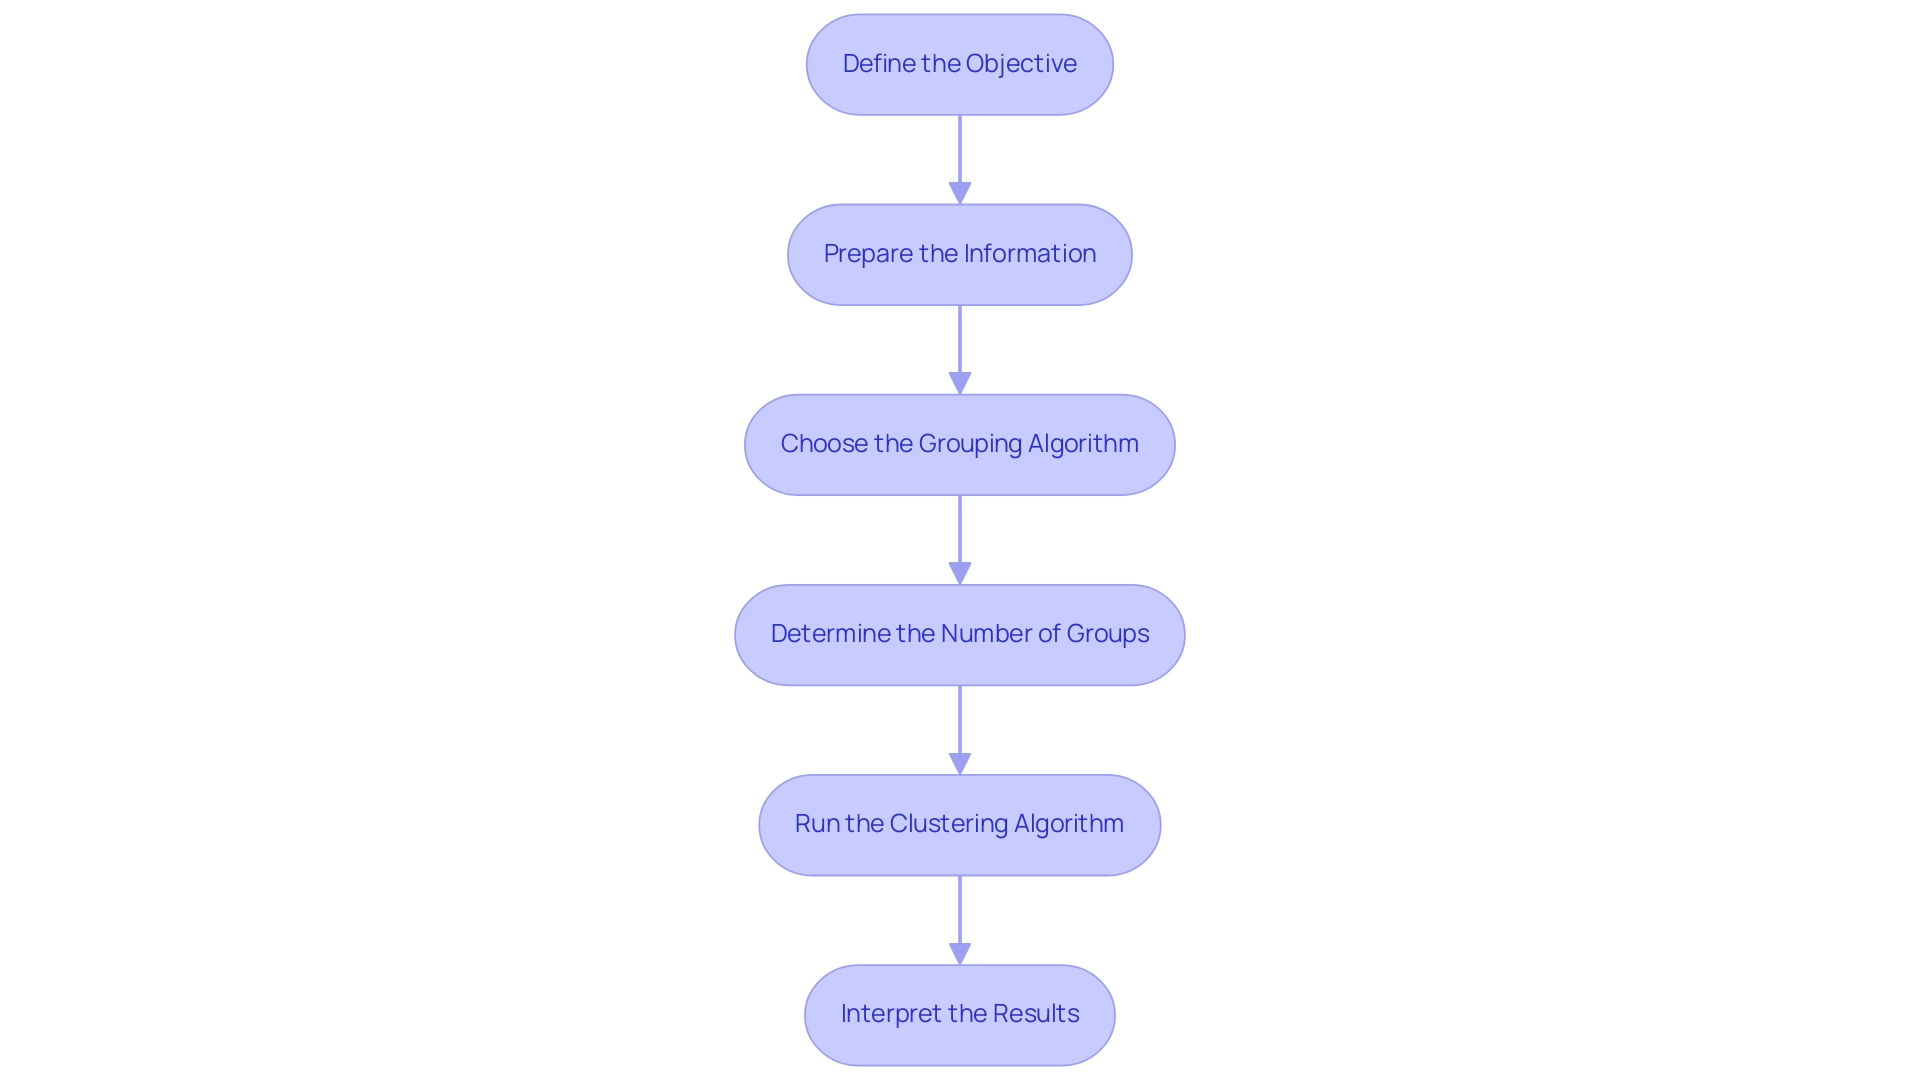
To effectively conduct a grouping evaluation in 2025, follow this comprehensive step-by-step guide:
-
Define the Objective: Clearly outline how to perform a cluster analysis and the goals you aim to achieve. Understanding your objectives is essential as it directs the entire process, ensuring that the evaluation aligns with your business aims.
-
Prepare the Information: Thoroughly clean and preprocess your data to facilitate a successful cluster analysis. This step is crucial for eliminating errors and missing values that could skew your results. Robotic Process Automation (RPA) can streamline this preparation phase by automating tasks such as data cleaning, thus saving time and minimizing manual errors.
-
Choose the Grouping Algorithm: Select an appropriate grouping algorithm based on your data characteristics and analysis goals. Common types include hierarchical grouping, K-means, density-based grouping, and model-based grouping, each suited for different scenarios.
-
Determine the Number of Groups: If you opt for K-means, deciding on the number of groups (K) is vital. Employ techniques like the elbow method or the Gap Statistic to identify the ideal number of groups by comparing outcomes to random data. For example, a case study demonstrated that the Gap Statistic identified the optimal number of clusters as 2, based on the maximum gap between consecutive values.
-
Run the Clustering Algorithm: Apply your chosen algorithm to the prepared dataset. This step involves executing the algorithm and allowing it to group the data based on defined parameters.
To evaluate the groups, assess the quality of the resulting clusters using metrics such as the silhouette score or the Davies-Bouldin index. These metrics help determine how well-defined your groups are against random distributions. As sahilgupta19 pointed out, by statistically evaluating the formation of your groups, you can make informed decisions that enhance model performance.
- Interpret the Results: Analyze the characteristics of each group to derive actionable insights. Understanding the distinct features of each group can inform strategic decisions and highlight areas for improvement. The integration of RPA can further enhance this process by automating insight extraction, allowing your team to focus on strategic initiatives. To visualize the groups, utilize visualization tools within Power BI to graphically represent the clusters. Effective visualization aids in understanding data distribution and improves communication of results to stakeholders.
By adhering to these best practices and avoiding common pitfalls, such as neglecting data preparation or failing to set clear objectives, you can significantly improve the accuracy and relevance of your grouping evaluation. Successful projects often underscore the importance of a clearly defined goal, as analysts emphasize clarity in the evaluation process. Additionally, keep in mind that the number of samples required for grouping varies based on data complexity, the number of groups, and desired precision, with no fixed minimum requirement.
Common Challenges in Cluster Analysis and How to Overcome Them
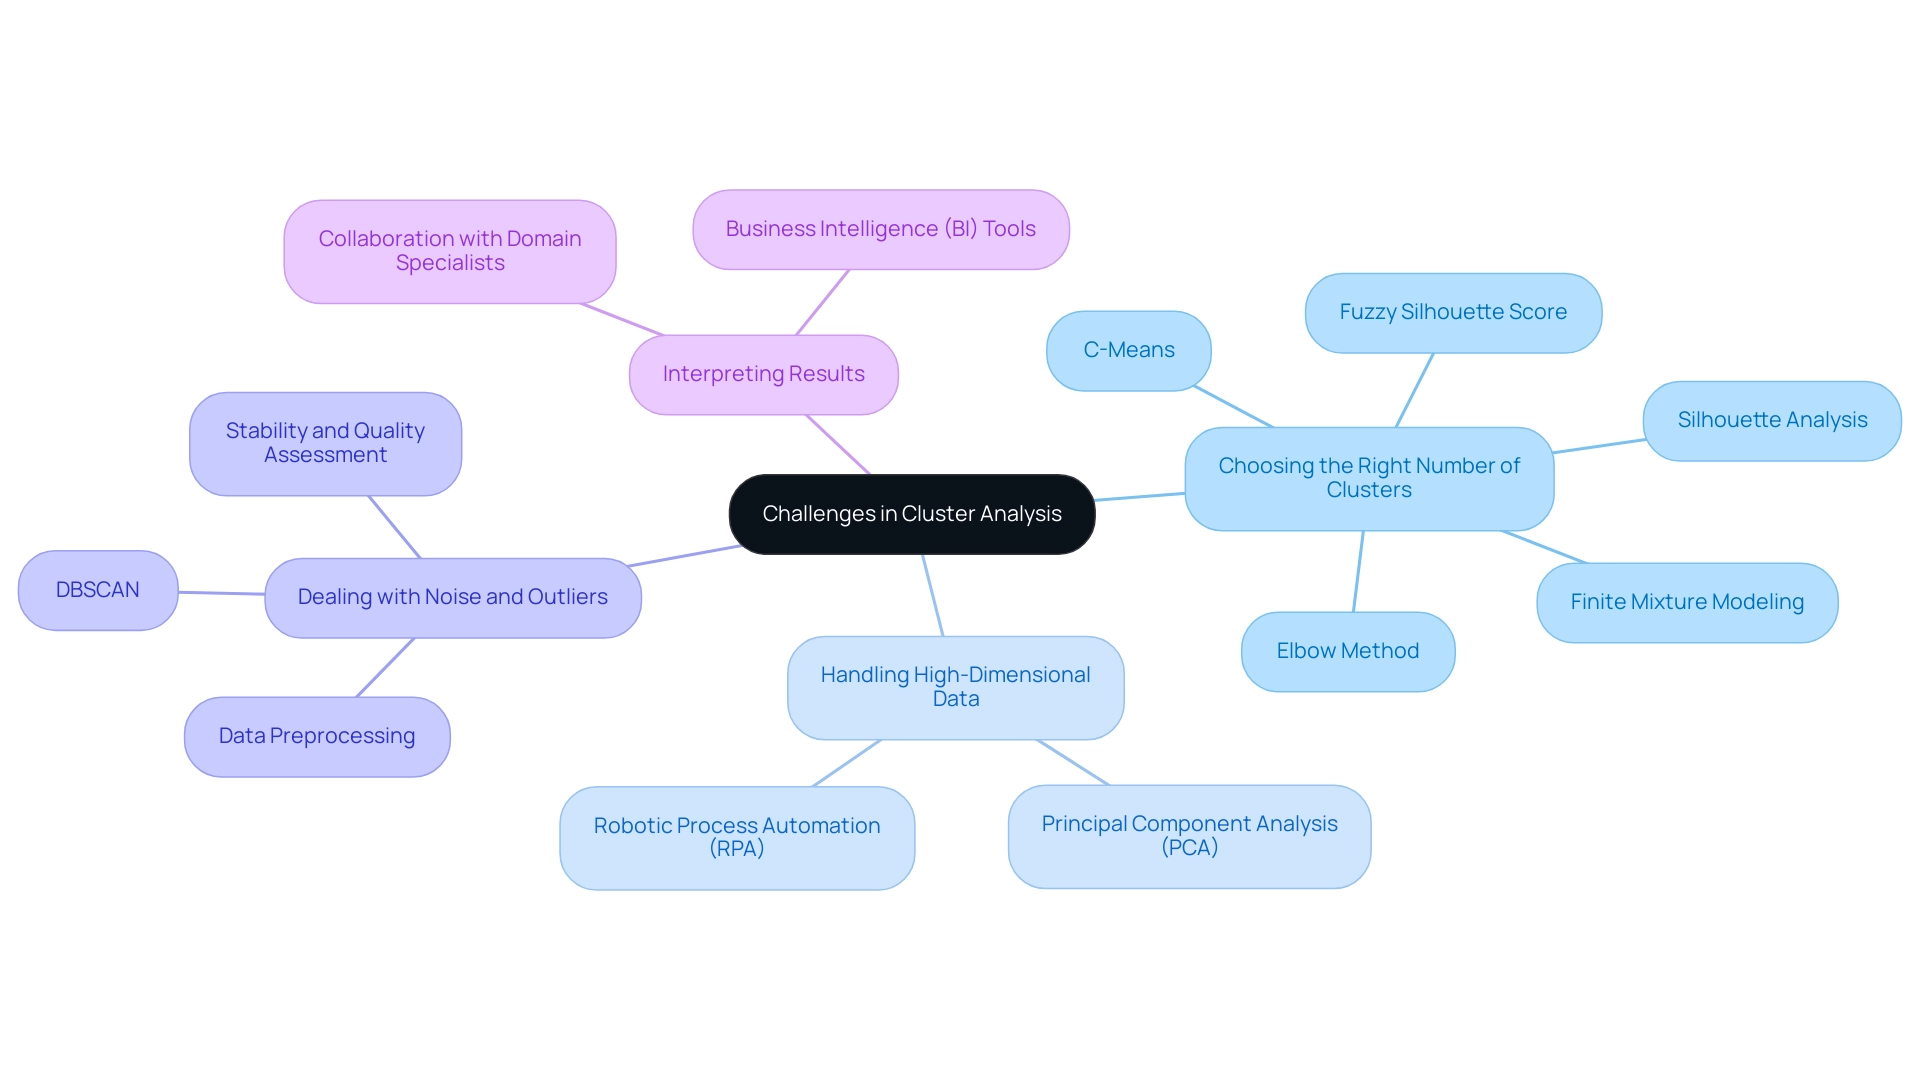
Cluster analysis presents several significant challenges that analysts must navigate to achieve meaningful insights:
-
Choosing the Right Number of Clusters: Determining the optimal number of clusters is often complex. Techniques such as the elbow method and silhouette analysis serve as valuable tools in this decision-making process. As we approach 2025, it is crucial to consider advanced methods like the fuzzy silhouette score, which enhances grouping power without increasing the false positive rate. Additionally, employing non-discrete methods, such as c-means or finite mixture modeling, can further improve grouping outcomes. Utilizing Business Intelligence (BI) tools from Creatum GmbH can provide deeper insights into these methodologies, ensuring that the chosen grouping strategy aligns with business objectives.
-
Handling High-Dimensional Data: The presence of high-dimensional datasets complicates the grouping process, making it challenging to identify patterns. Dimensionality reduction methods, such as Principal Component Analysis (PCA), simplify the information and enhance clustering results. Organizations have successfully navigated these challenges by leveraging techniques that illustrate how to conduct cluster analysis to extract meaningful insights from complex datasets. Professor Jai Li emphasizes that “advancing methodologies to address challenges raised by the current big and complex information” is essential for effective analysis. Integrating Robotic Process Automation (RPA) from Creatum GmbH can also streamline data preparation processes, enhancing overall efficiency and reducing errors.
-
Dealing with Noise and Outliers: Outliers can significantly skew clustering results, making it essential to employ robust algorithms. For instance, DBSCAN effectively handles noise and can identify groups of varying shapes and sizes, thus providing more reliable results. The case study titled ‘Recommendations for Future Studies’ highlights the importance of meticulous data preprocessing and assessing the stability and quality of results to mitigate the effects of noise and outliers. Utilizing BI tools from Creatum GmbH can assist in identifying and managing these anomalies effectively, providing a competitive advantage.
-
Interpreting Results: Understanding the implications of each group can be particularly challenging, especially in high-dimensional spaces. Collaborating with domain specialists can enhance the interpretation process, ensuring that insights obtained from the groups are actionable and relevant to business objectives. By harnessing the power of BI from Creatum GmbH, organizations can transform these insights into strategic actions that drive growth and innovation.
By acknowledging these challenges and utilizing strategic solutions, including RPA and BI from Creatum GmbH, analysts can proactively mitigate their impact, resulting in more precise and insightful evaluations. The support from the UK Medical Research Council further underscores the importance of rigorous methodologies in this field.
Data Preparation: The Key to Successful Cluster Analysis
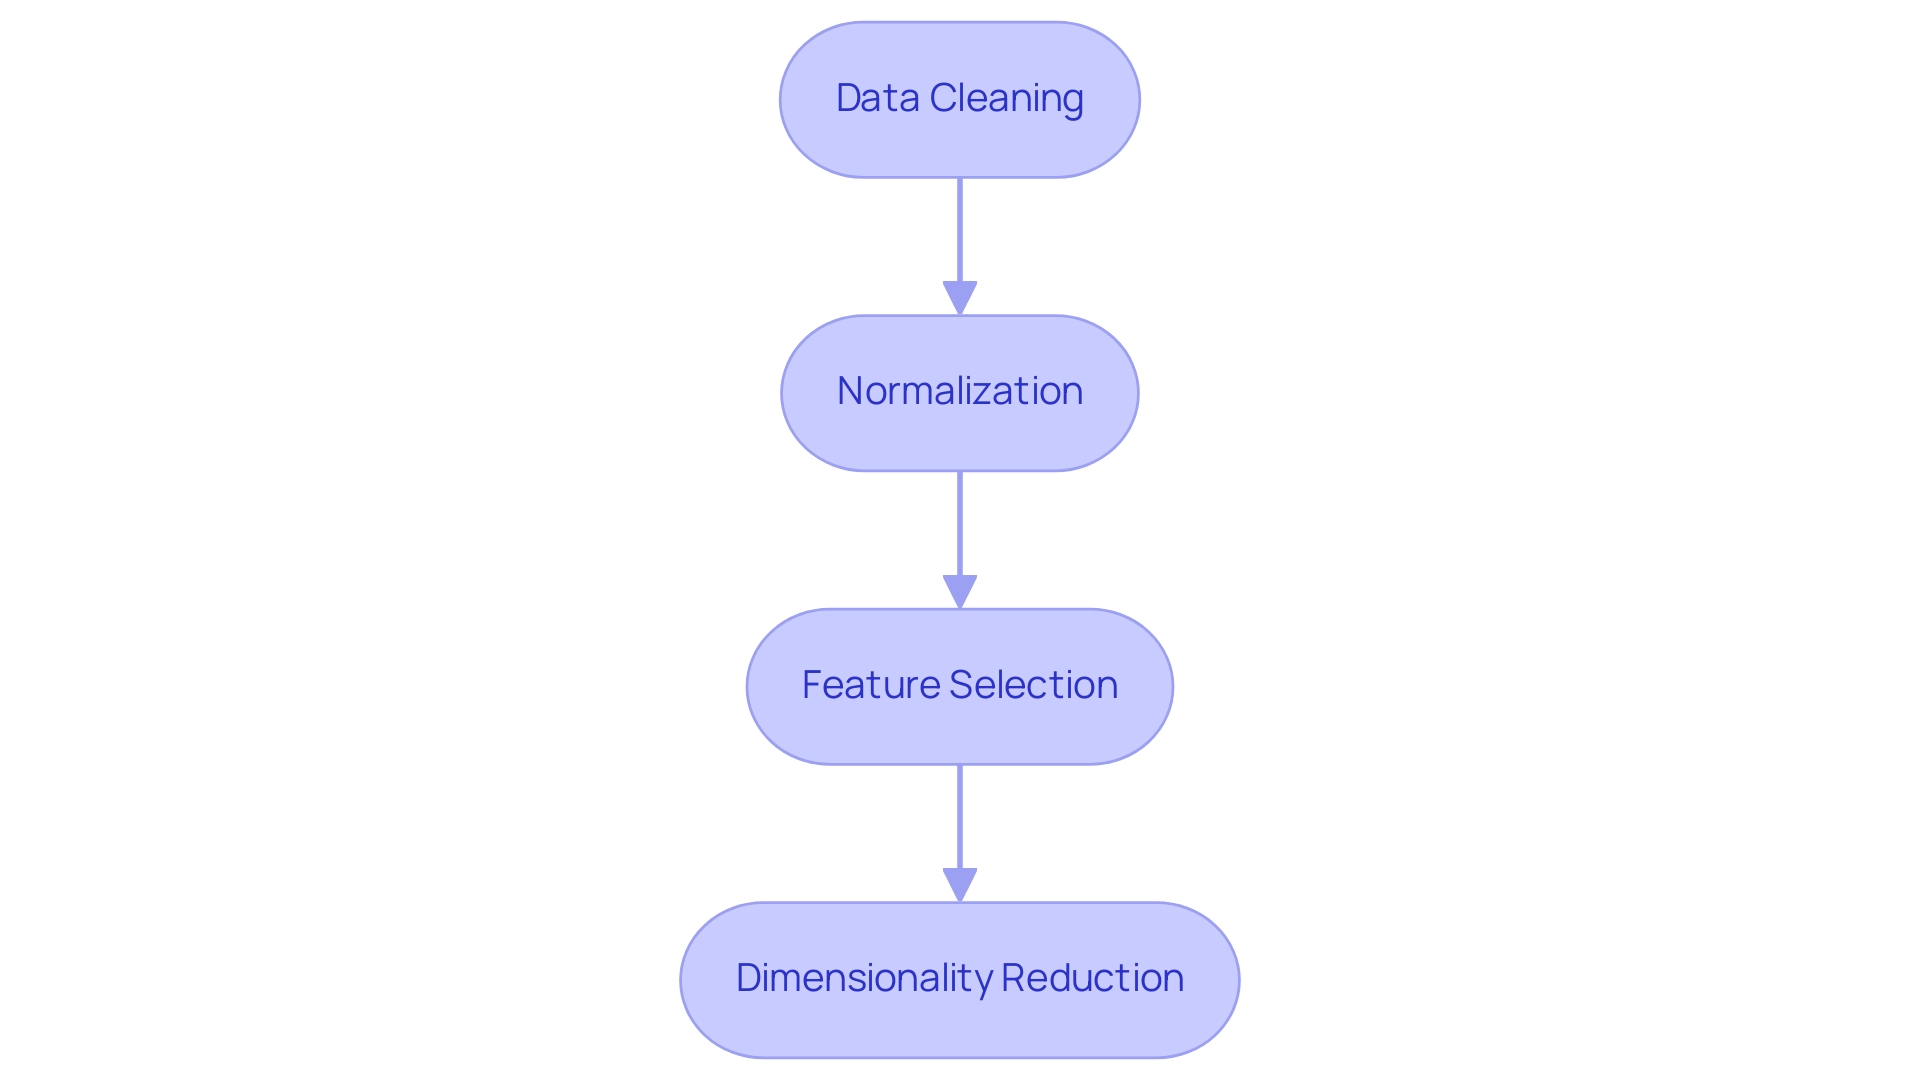
Data preparation stands as a vital cornerstone for effective cluster assessment, particularly within the realms of Business Intelligence (BI) and Robotic Process Automation (RPA) at Creatum GmbH. By implementing key practices, organizations can significantly elevate the quality and reliability of their results, thereby driving data-driven insights that promote operational efficiency and business growth.
- Data Cleaning: Initiate the process by eliminating duplicates, addressing missing values, and rectifying any errors within the dataset. This step is crucial; the integrity of your information directly influences clustering outcomes. Poor master information quality can obstruct effective analysis, underscoring the necessity for thorough cleaning to achieve dependable results.
- Normalization: Scale your data to ensure all features contribute equally to distance calculations. Techniques such as Min-Max scaling and Z-score normalization help mitigate the effects of varying scales among features. As Anony-Mousse articulated, “Data normalization is about numerical representation and also scale of the Jacobian. So when numbers are very near to 1.0 the current double-precision representation has the least roundoff error.”
- Feature Selection: Diligently identify and select relevant features that will enhance the clustering process. The inclusion of irrelevant features can introduce noise, ultimately diminishing the effectiveness of the analysis. The analytical approach chosen for clustered information can significantly influence results, making feature selection a critical step in overcoming barriers to AI adoption.
- Dimensionality Reduction: For high-dimensional datasets, consider employing techniques like Principal Component Analysis (PCA) to reduce the number of features while preserving essential information. This approach can streamline the grouping process and enhance interpretability, aligning with the objectives of BI and RPA initiatives.
Investing time in these preparation steps not only improves the methodology for conducting cluster analysis but also leads to more precise and actionable insights. Organizations prioritizing cleaning and normalization often witness significant advancements in their clustering outcomes. This is exemplified in the case study titled ‘Comparative Analysis of Synaptic Boutons,’ where appropriate statistical methods and preparation influenced clustering results. Such examples underscore the critical impact of these practices on research and operational efficiency, particularly in fields like neuroscience and beyond.
Neglecting to implement these practices can leave organizations at a competitive disadvantage, grappling to extract meaningful insights from their data.
Interpreting Cluster Analysis Results: Making Sense of Your Data
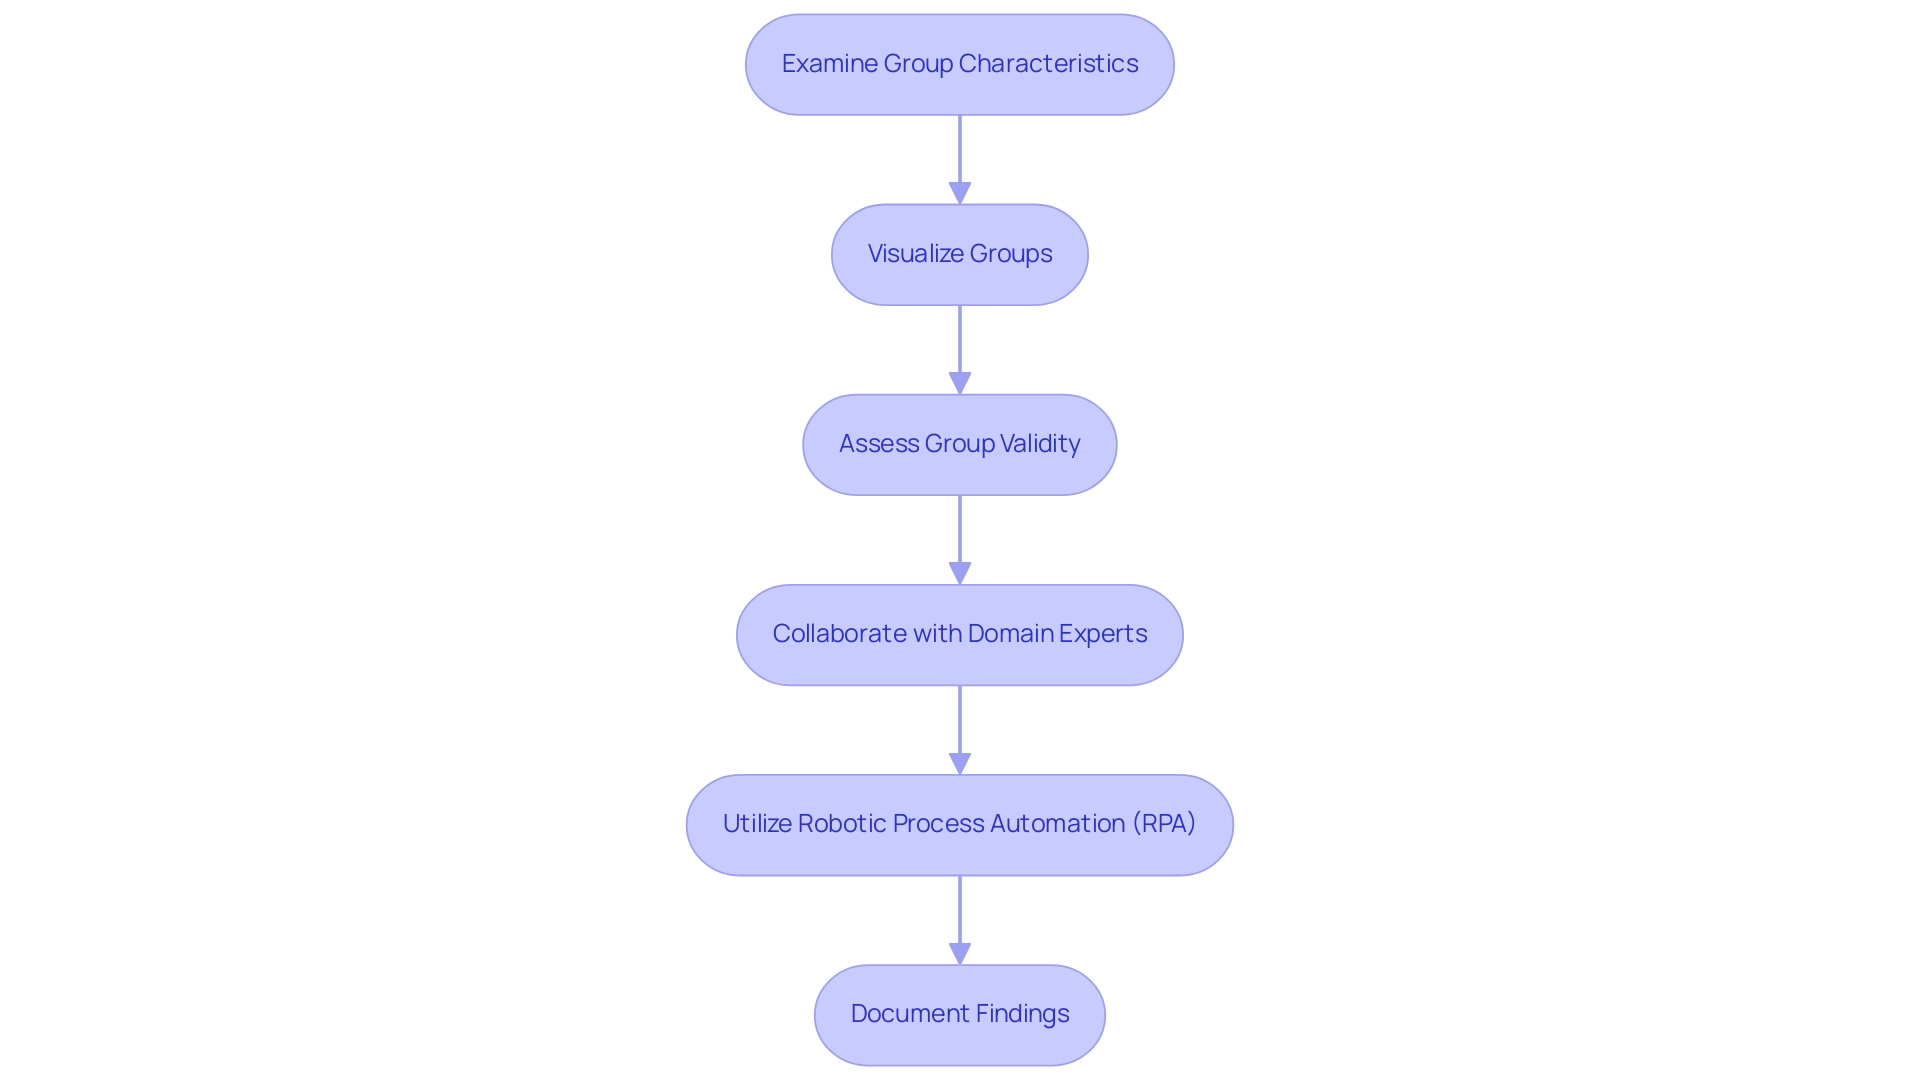
Interpreting the outcomes of grouping techniques is a vital process that significantly impacts decision-making, particularly in the context of utilizing Business Intelligence (BI) for actionable insights. To effectively interpret these results, follow these essential steps:
-
Examine Group Characteristics: Begin by analyzing the mean or median values of the variables within each group. This examination assists in recognizing the defining characteristics of each group, uncovering patterns and trends that may not be readily apparent. For instance, notable p-values for species like Holly (0.0082), Sweetgum (0.0002), and Magnolia (0.0033) underscore the significance of statistical relevance in comprehending group characteristics, ultimately guiding decision-making.
-
Visualize Groups: Visualization plays a pivotal role in interpreting group analysis. Employing tools like scatter plots, heat maps, or dendrograms offers a visual depiction of the groups, facilitating an understanding of relationships and distinctions between them. Effective visualizations not only enhance comprehension but also aid in communicating findings to stakeholders. Significantly, identifying the optimum number of groups can be accomplished by locating a breakpoint in the dendrogram, which is essential for evaluating group validity.
-
Assess Group Validity: To ensure the robustness of your groups, evaluate their quality using metrics like silhouette scores or internal validation indices. These metrics assist in assessing how well-separated the groups are and whether they accurately reflect the underlying data structure. This step is crucial for overcoming technology implementation challenges and ensuring that your evaluation is trustworthy.
-
Collaborate with Domain Experts: Engaging with subject-matter experts provides valuable insights into the practical implications of the identified groups. Their expertise helps contextualize the information, ensuring that the evaluation aligns with real-world applications and strategic objectives. As noted by Edwin S. Dalmaijer, “All authors read and approved the final manuscript,” emphasizing the importance of collaboration in the analytical process.
-
Utilize Robotic Process Automation (RPA): Implementing RPA simplifies the process of interpreting group evaluation results, enhancing operational efficiency. By automating repetitive tasks related to data evaluation, organizations can reduce errors and free up resources for more strategic initiatives.
-
Document Findings: Clearly recording the characteristics and implications of each group is crucial. This documentation serves as a reference for future evaluations and decision-making processes, ensuring that insights are preserved over time. For example, the case study titled “ANOVA Analysis of Cluster Species” illustrates how to conduct a cluster analysis that yields significant insights regarding species distribution across clusters, providing a practical application of these steps.
By following these steps, analysts can effectively translate grouping results into actionable insights, driving informed decision-making and strategic initiatives. The integration of visualization techniques not only aids in interpretation but also enhances the overall understanding of complex relationships, ultimately leading to better business outcomes. Furthermore, by harnessing the power of RPA alongside BI, organizations can streamline workflows, reduce errors, and focus on strategic initiatives that drive growth.
The Future of Cluster Analysis: Trends and Innovations
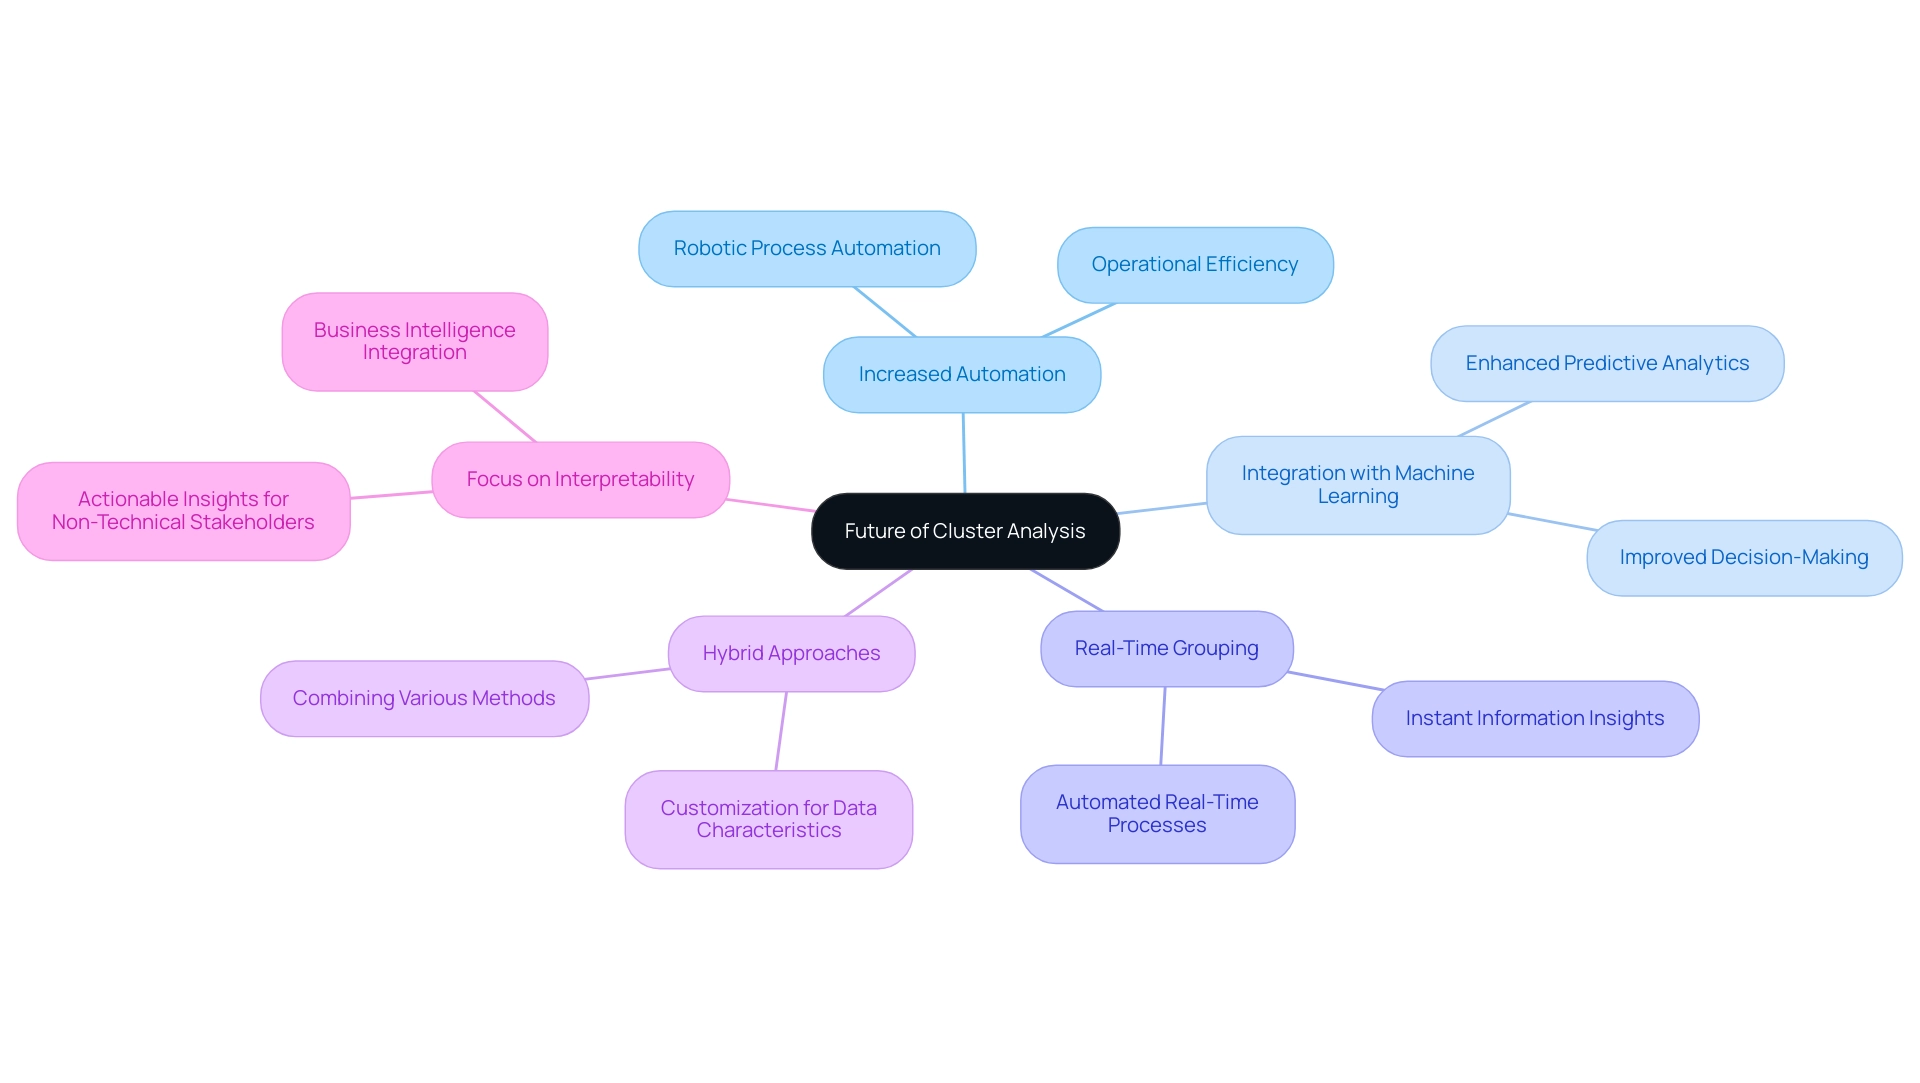
The future of cluster analysis is being significantly influenced by several pivotal trends that are reshaping how organizations approach data analysis:
-
Increased Automation: With the exponential growth of data volumes, automated clustering algorithms are becoming essential. These algorithms facilitate faster and more efficient analysis, allowing organizations to derive insights without the bottlenecks associated with manual processes. Leveraging Robotic Process Automation (RPA) from Creatum GmbH can further streamline these workflows, enhancing operational efficiency, reducing errors, and freeing up resources for more strategic tasks. For instance, RPA can automate data collection and preprocessing, ensuring that analysts spend less time on repetitive tasks and more on interpreting results.
-
Integration with Machine Learning: The synergy between grouping and machine learning is enhancing predictive analytics and decision-making capabilities. By combining machine learning models with grouping techniques, organizations can uncover deeper insights and improve the accuracy of their analyses. As Sarah Lee observes, “As organizations keep navigating a progressively intricate information environment, the significance of advanced grouping methods cannot be overstated.”
-
Real-Time Grouping: The increasing need for instant information insights is driving advancements in grouping algorithms capable of handling information in real-time. This capability is crucial for businesses that need to respond swiftly to changing conditions and make informed decisions based on the latest information. RPA can play a crucial role in automating these real-time processes, ensuring that information is continuously analyzed and insights are readily available, thus minimizing the risk of errors in decision-making.
-
Hybrid Approaches: The adoption of hybrid grouping techniques is gaining momentum, allowing analysts to combine various methods for more robust and flexible analysis. This approach enables organizations to customize their grouping strategies to specific data characteristics and business needs, further supported by RPA to automate the integration of diverse data sources.
-
Focus on Interpretability: As grouping methodologies become increasingly sophisticated, there is a heightened emphasis on making results interpretable and actionable for non-technical stakeholders. Ensuring that insights obtained from grouping are understandable is vital for driving strategic decisions across the organization. The combination of Business Intelligence and RPA from Creatum GmbH can enhance this interpretability, providing clear, actionable insights that support business growth.
Furthermore, merging grouping examination with deep learning techniques has demonstrated to enhance evaluation results, emphasizing the progress in clustering methods. Additionally, as organizations adopt AI technologies, the importance of governance becomes evident, as illustrated in the case study on risk management for Gen AI, which emphasizes the need for a robust governance structure to manage associated risks.
Staying informed about these trends will empower analysts to learn how to do cluster analysis effectively, enhancing operational efficiency and supporting data-driven decision-making in their organizations.
Conclusion
Mastering cluster analysis is essential for organizations striving to excel in today’s data-driven landscape. This statistical technique not only facilitates the grouping of similar items but also reveals hidden patterns that can significantly enhance decision-making across various sectors, including marketing, healthcare, and finance. By leveraging advanced technologies such as Robotic Process Automation (RPA) and machine learning, businesses can automate data processes, streamline workflows, and ultimately drive growth through targeted insights.
This article has explored the fundamental concepts of cluster analysis, its diverse applications, and the various algorithms available for effective data segmentation. From K-means to hierarchical clustering, each method possesses unique strengths that cater to different data characteristics and analytical goals. Moreover, addressing common challenges—such as determining the optimal number of clusters and managing high-dimensional data—is crucial for achieving meaningful insights.
As the future of cluster analysis unfolds, trends like increased automation, real-time processing, and a focus on interpretability will shape how organizations approach their data strategies. By staying informed and adopting these innovations, businesses can transform raw data into actionable insights, fostering a culture of informed decision-making and continuous improvement.
In conclusion, embracing cluster analysis not only empowers organizations to make data-driven decisions but also positions them to navigate the complexities of modern data landscapes effectively. By investing in the right tools and methodologies, businesses can unlock the full potential of their data, leading to enhanced operational efficiency and sustainable growth.
Frequently Asked Questions
What are grouping techniques and their primary purpose?
Grouping techniques, particularly cluster analysis, are statistical methods that organize similar items into groups based on shared characteristics. They help identify patterns and relationships within complex datasets across various domains like marketing, biology, and social sciences.
Why is cluster analysis important in decision-making?
Cluster analysis is crucial for efficiently utilizing information in decision-making processes. It allows analysts to uncover hidden structures and insights in data, which can enhance operational efficiency, especially when integrated with Robotic Process Automation (RPA) and customized AI solutions.
What are the key concepts in cluster analysis?
The key concepts in cluster analysis include: Clusters: Groups of similar data points that share common attributes. Distance Metrics: Measures of similarity between data points, such as Euclidean distance. Dimensionality Reduction: Techniques that simplify datasets by reducing the number of variables, making clustering more manageable.
How has cluster analysis been applied in marketing?
In marketing, cluster analysis is used to segment customers based on purchasing behaviors, enabling targeted marketing strategies. For example, a retail brand improved their online shopping experience for busy young professionals, leading to increased customer satisfaction and sales.
What role does cluster analysis play in healthcare?
In healthcare, particularly in genomics, cluster analysis helps identify gene expression patterns, allowing for the categorization of patients based on genetic similarities. This leads to more personalized healthcare solutions and optimizes information processing through RPA.
How is cluster analysis utilized in finance?
Financial analysts use cluster evaluation to group similar financial instruments, aiding in the recognition of investment opportunities and risk assessment. This enhances portfolio management and informs better investment decisions, with RPA automating data collection and evaluation.
What is the significance of cluster analysis in social sciences?
In social sciences, clustering groups survey respondents based on demographics or opinions, helping to understand social trends and tailor policies to specific population segments. RPA can enhance the efficiency of survey information processing in this context.
How does RPA enhance the clustering process?
RPA enhances the clustering process by automating manual workflows related to information assessment, reducing errors, and allowing teams to focus on strategic initiatives. It supports various sectors by providing scalable solutions that adapt to changing business needs.
What are the benefits of mastering group evaluation?
Mastering group evaluation allows organizations to transform unprocessed information into actionable insights, fostering informed decision-making and promoting innovation, ultimately driving business growth.

