Overview
This article delves into the essential tools required for integrating Python with Power BI, aiming to elevate business intelligence capabilities. It captures attention by highlighting the significance of tools such as Pandas for data manipulation and Matplotlib for custom visualizations. These tools not only enhance data analysis but also streamline reporting processes. Consequently, organizations can achieve more informed decision-making and improved operational efficiency.
Consider how effectively your current data practices align with these advancements. By leveraging Python’s capabilities, businesses can transform their analytical processes. The integration of these tools fosters a data-driven culture, empowering teams to derive actionable insights from complex datasets.
In conclusion, adopting these technologies is not merely an option but a necessity for organizations striving for excellence in data analysis. Embrace the potential of Python and Power BI to unlock new levels of operational efficiency and strategic decision-making.
Introduction
In the dynamic landscape of data analytics, the integration of Python with Power BI is revolutionizing how organizations approach business intelligence. By combining Python’s powerful data manipulation libraries with Power BI’s robust visualization capabilities, users can unlock new levels of analytical depth and creativity. This synergy not only streamlines complex data processes but also enhances the storytelling aspect of data presentations, enabling more informed decision-making.
As businesses increasingly recognize the value of this integration, understanding its benefits, tools, and best practices becomes essential for leveraging data effectively and driving strategic growth. Dive into the world of Python and Power BI to explore how this powerful combination can transform data analysis and reporting within organizations.
Understanding Python BI Integration with Power BI
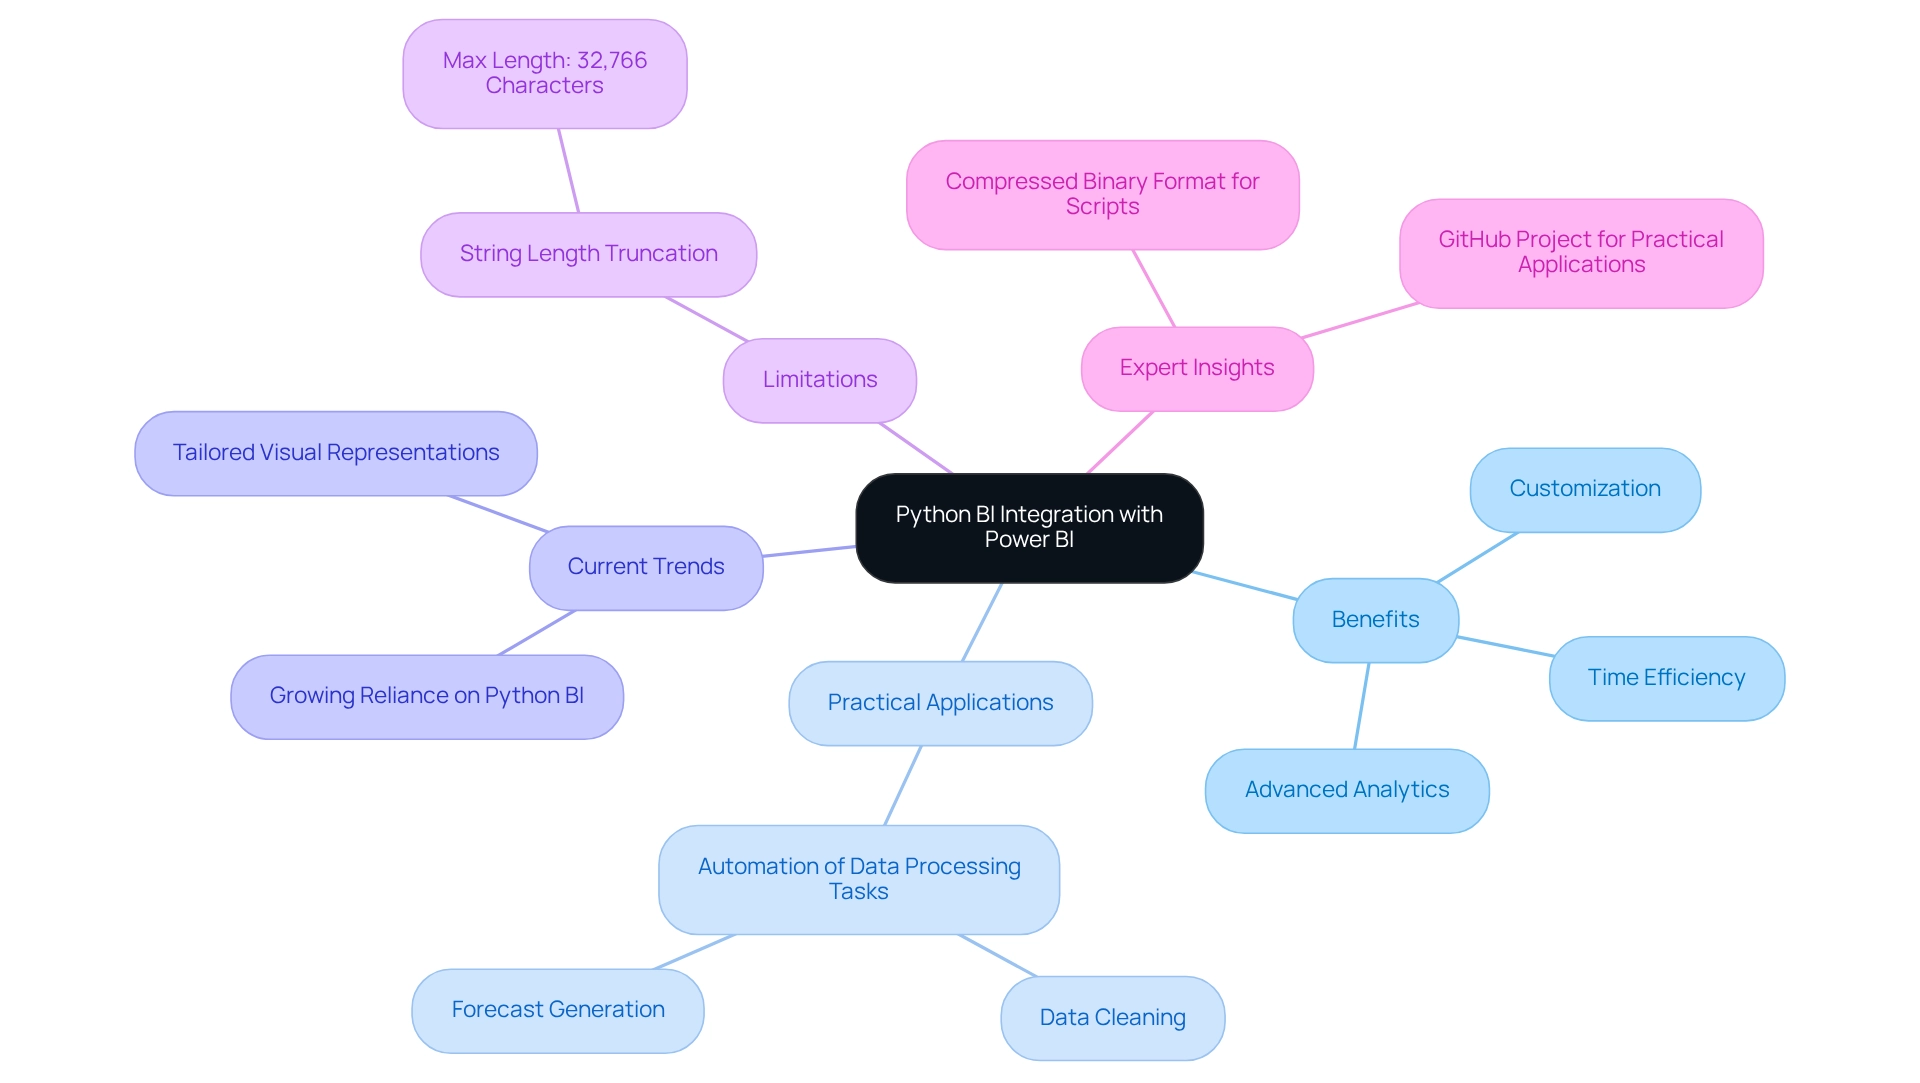
Integrating Python BI with a programming language empowers users to leverage the full potential of robust manipulation and visualization libraries, such as Pandas and Matplotlib. This powerful synergy facilitates complex analyses and the creation of custom visualizations that exceed the standard capabilities of BI. By embedding scripting directly within Python BI reports, analysts can significantly elevate their presentations through advanced analytics and machine learning models.
This integration streamlines the analysis process and promotes more informed, evidence-based decision-making, addressing prevalent challenges like time-consuming report creation and inconsistencies.
Practical applications of the programming language within Python BI are evident in various case studies, particularly in automating information processing tasks. By utilizing the scripting features, teams can automate repetitive tasks like data cleaning and forecasting, ultimately saving time and enhancing operational efficiency. As we approach 2025, the benefits of integrating Python BI into business intelligence are increasingly recognized, with organizations reporting improved information quality and faster insights, which are crucial for effective governance and decision-making.
Current trends indicate a growing reliance on Python BI for data visualization within BI tools, as users strive to create more advanced and tailored visual representations of their data. The executable file for Microsoft BI Desktop is approximately 400 megabytes, reflecting its extensive capabilities and the potential for integration with a programming language.
Experts in the field emphasize that the ability to store scripts in a compressed binary format within BI reports allows for effortless modifications and updates, thereby enhancing user experience. Additionally, it is important to note that ‘Strings longer than 32,766 characters will be truncated,’ highlighting certain limitations within BI. As the landscape of business analytics evolves, the combination of a programming language with Python BI emerges as a critical component for organizations aiming to utilize information effectively and drive strategic growth.
Furthermore, an extensive project demonstrating the integration of a programming language with BI tools is available on GitHub, providing practical applications for users.
The Benefits of Integrating Python with Power BI
Integrating Python with Power BI presents a multitude of advantages that significantly enhance business intelligence capabilities:
-
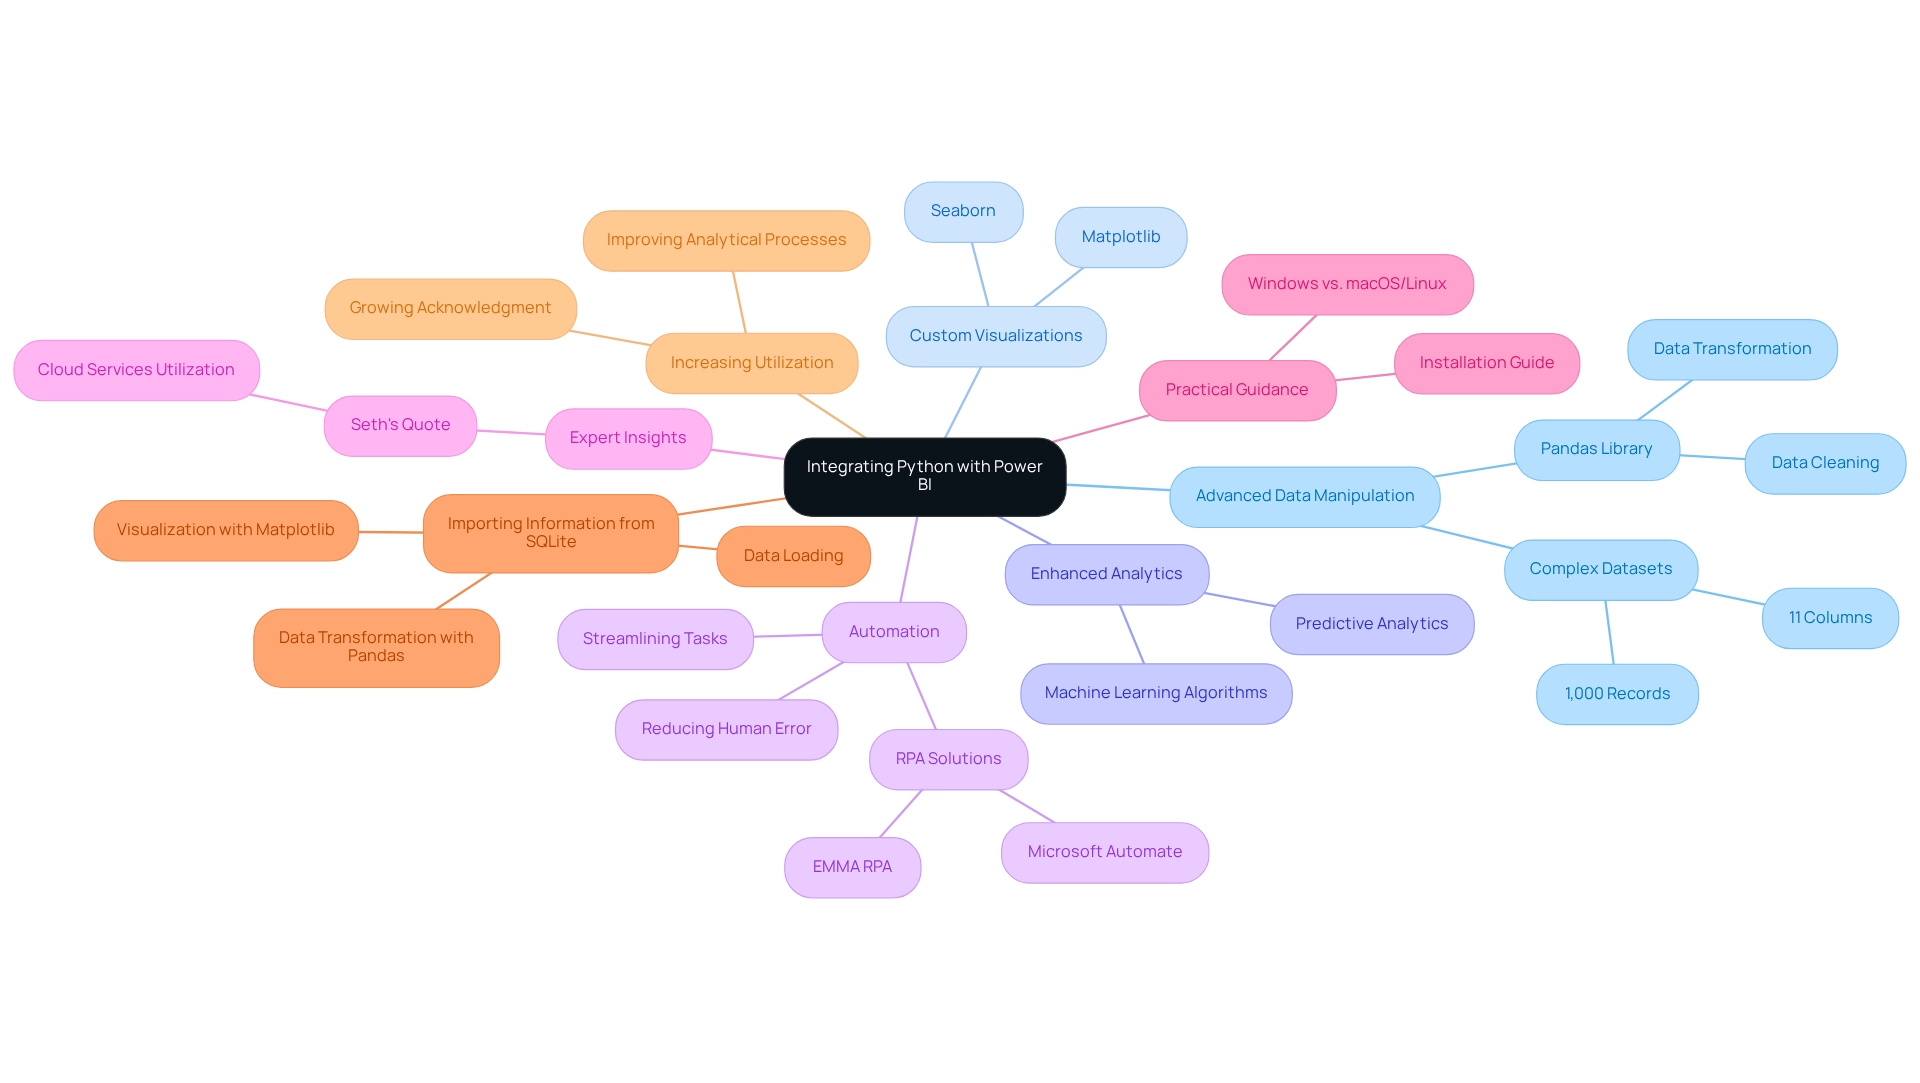
Advanced Data Manipulation: Python’s powerful libraries, particularly Pandas, facilitate sophisticated data cleaning and transformation processes. This capability simplifies the preparation of information for analysis, enabling users to manage complex datasets effortlessly. For instance, a collection comprising 1,000 records and 11 columns related to sold cars can be efficiently manipulated to extract meaningful insights, showcasing Python’s strength in managing intricate structures.
-
Custom Visualizations: With libraries such as Matplotlib and Seaborn, users can create tailored visual representations that surpass the standard offerings of BI. This flexibility empowers organizations to present information in ways that best meet their specific analytical requirements, enhancing the overall storytelling aspect of information presentation.
-
Enhanced Analytics: The incorporation of Python into BI enables the direct application of machine learning algorithms within Business Intelligence. This capability empowers users to conduct predictive analytics, uncovering deeper insights that can drive strategic decision-making.
-
Automation: Scripts can streamline repetitive tasks within BI, significantly reducing processing time and minimizing the risk of human error. This automation not only boosts operational efficiency but also frees up valuable resources for more strategic initiatives. Our Robotic Process Automation (RPA) solutions from Creatum GmbH, including EMMA RPA and Microsoft Automate, further enhance this efficiency by addressing task repetition fatigue and staffing shortages, ultimately improving employee morale.
-
Expert Insights: Analysts have observed that employing a programming language alongside BI tools can result in more effective information handling methods. As Seth noted in a recent podcast, “Using this programming language to create a visual, I believe that more of it is utilized in cloud services,” emphasizing its increasing significance in contemporary data settings.
-
Practical Guidance: A case study titled “Installing and Configuring the BI and Programming Environment” demonstrates the straightforward installation procedure for Windows users. However, it also notes that those on macOS or Linux must use a virtual machine to run Windows, adding complexity to the setup. This understanding is essential for users contemplating the combination of a programming language with Business Intelligence.
-
Importing Information from SQLite: Recent tutorials instruct users on importing information from a SQLite database into BI using a programming language, transforming it with Pandas, and visualizing it with Matplotlib. This practical application illustrates how Python BI can enhance information handling and visualization within Power BI.
-
Increasing Utilization: Recent statistics indicate that a notable proportion of companies are now utilizing the programming language for information manipulation within their business intelligence systems. This trend highlights the growing acknowledgment of the language’s value in improving analytical processes.
In summary, the combination of the programming language with Python BI tools not only enhances information handling and visualization but also enables organizations to leverage advanced analytics and automation, ultimately leading to improved business results. By leveraging tailored AI solutions alongside RPA from Creatum GmbH, businesses can navigate the overwhelming AI landscape and unlock actionable insights that propel growth and innovation.
Top Tools for Python Integration with Power BI
Here are some of the top tools for integrating Python with Power BI:
-
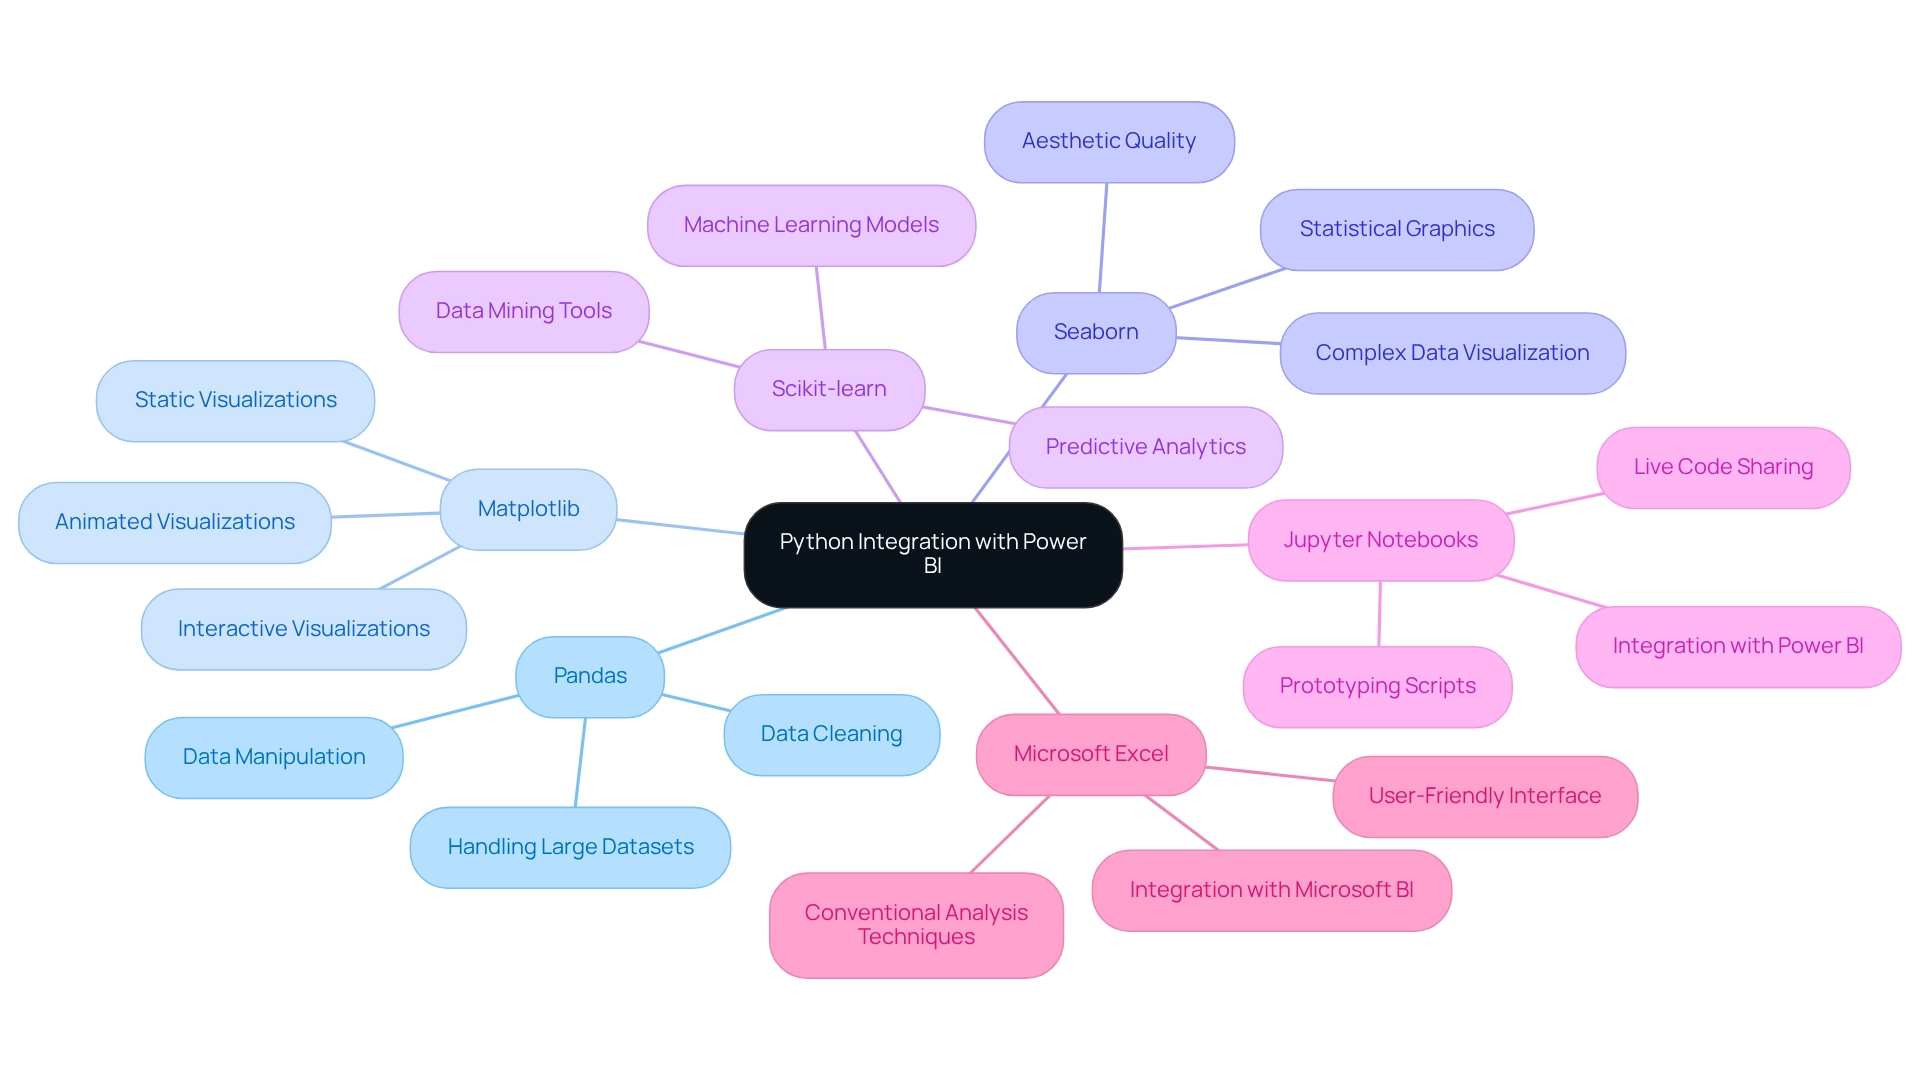
Pandas: This powerful data manipulation library is essential for simplifying data cleaning and transformation tasks. Its capability to manage extensive datasets effectively establishes it as a staple for analysts, particularly in settings where 328.77 million terabytes of information are produced daily. Utilizing Pandas can greatly improve the preparation phase in Python BI, tackling common issues such as inconsistencies that frequently occur in BI reporting.
-
Matplotlib: Renowned for its versatility, Matplotlib allows users to create static, animated, and interactive visualizations. The integration of Python BI enhances the visual storytelling of information, making complex insights more reachable and actionable, which is essential for informed decision-making.
-
Seaborn: Built on top of Matplotlib, Seaborn offers a high-level interface for drawing attractive statistical graphics. It is especially beneficial for visualizing intricate datasets and can greatly enhance the aesthetic quality of visualizations in Python BI, thus aiding better communication of insights.
-
Scikit-learn: This machine learning library provides simple and efficient tools for data mining and analysis. Its connection with Python BI allows users to utilize machine learning models directly within their reports, enhancing predictive analytics capabilities and boosting operational efficiency through data-driven insights.
-
Jupyter Notebooks: As an open-source web application, Jupyter Notebooks allows users to create and share documents that contain live code, equations, visualizations, and narrative text. This creates a perfect setting for prototyping scripts that can be integrated into Power BI, facilitating a seamless workflow and addressing the time-consuming nature of report creation.
-
Microsoft Excel: Despite forecasts of its decrease, Excel continues to be an essential tool for analysis because of its user-friendly interface and integration with the Microsoft BI stack. It enhances tools by offering a familiar environment for information manipulation and analysis, ensuring that analysts can utilize both conventional and contemporary techniques effectively.
These tools not only improve the functionality of Power BI but also enable analysts to utilize Python BI for more advanced analysis and visualization. Furthermore, Creatum GmbH’s Robotic Process Automation (RPA) solutions can further streamline these processes, enhancing operational efficiency and tackling the challenges of extracting valuable insights from information. As Tom Gadsby, a data specialist, observes, ‘A proficient data analyst possesses extensive knowledge of various languages and software,’ emphasizing the significance of mastering both modern programming languages and conventional tools like Excel in maneuvering through the intricacies of the AI domain and optimizing the capabilities of Business Intelligence.
Setting Up Python in Power BI: A Step-by-Step Guide
Configuring the programming language Python BI in Power BI involves several essential steps that ensure seamless integration and address common challenges faced by users. Here’s a detailed guide:
-
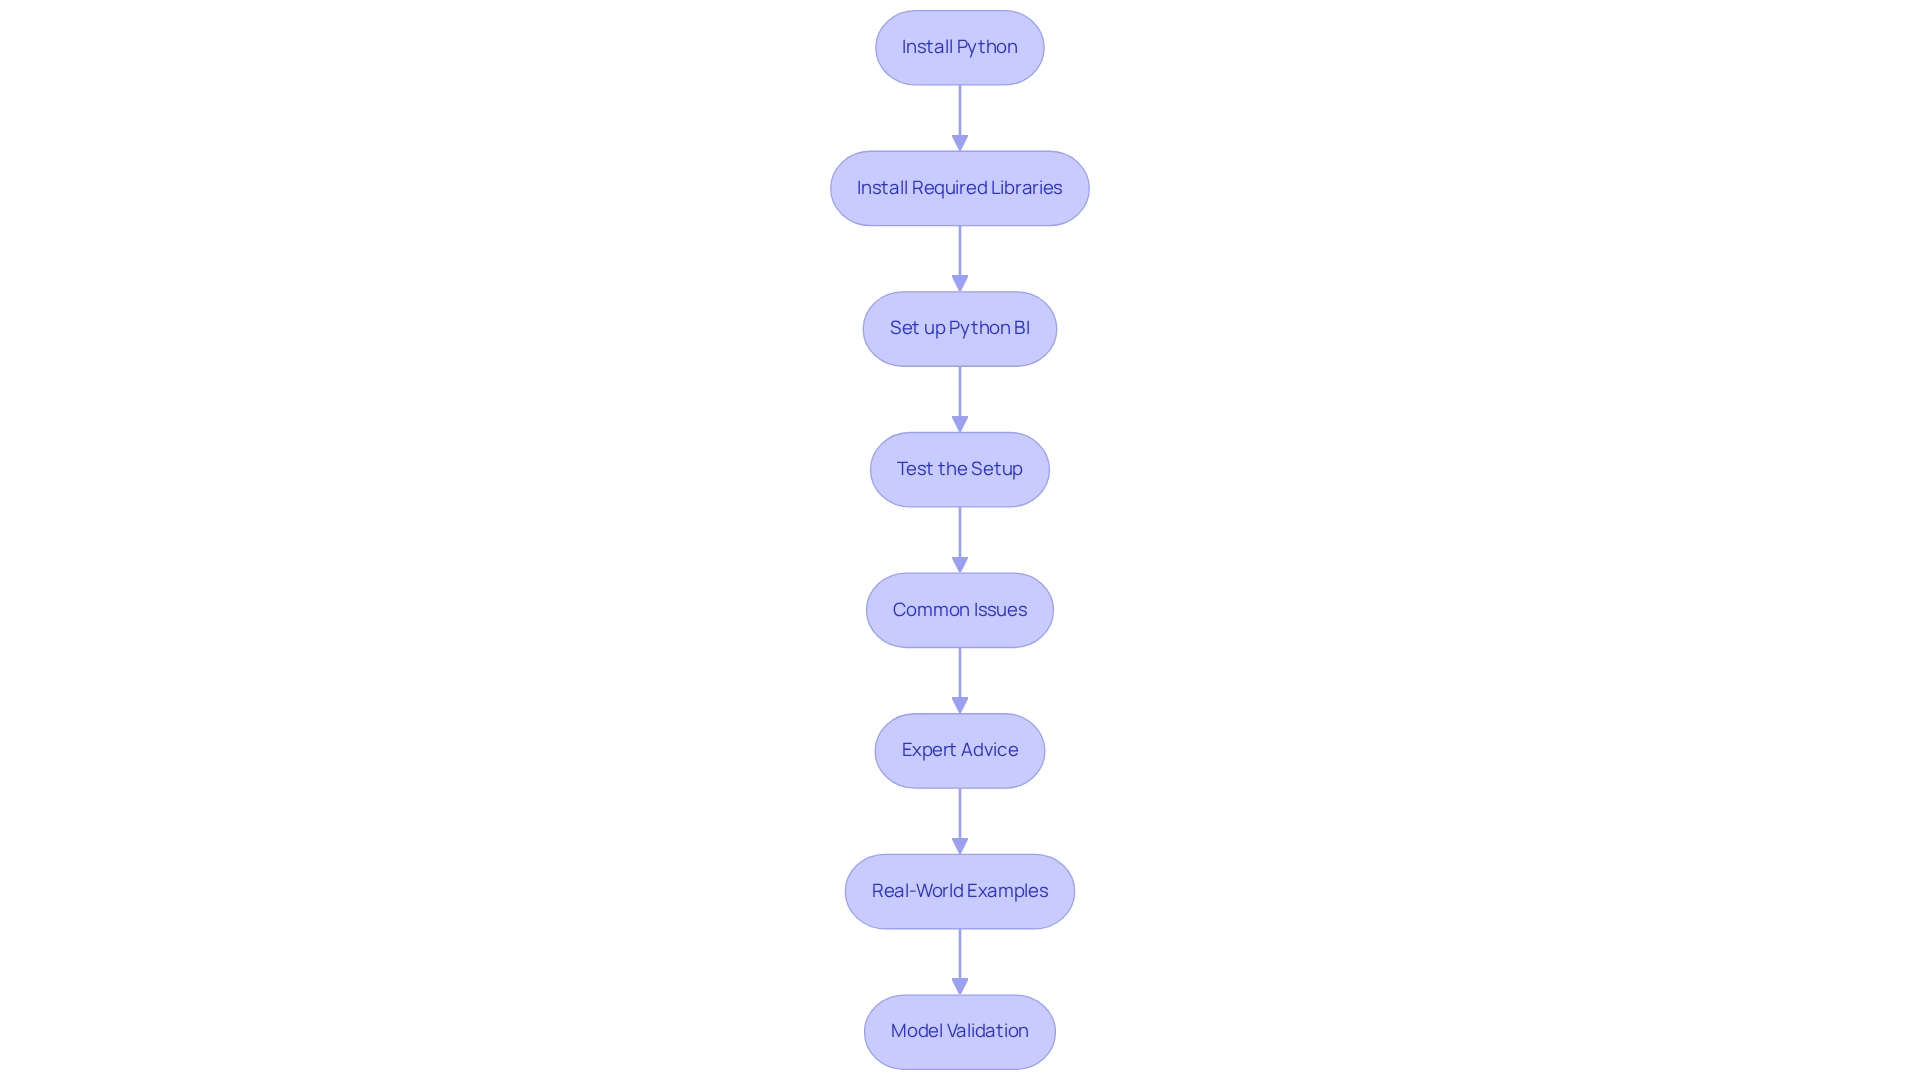
Install the programming language: Start by downloading and installing it from the official website, ensuring you select the version compatible with your operating system.
-
Install Required Libraries: After installation, open your command prompt and execute the command
pip install pandas matplotlibto install essential libraries like Pandas for data manipulation and Matplotlib for data visualization. -
Set up Python BI: Launch BI Desktop, navigate to
File > Options and settings > Options, and selectscripting with Python BI. Here, indicate the path to your programming installation, allowing the application to access scripts. -
Test the Setup: To confirm your setup is functioning correctly, create a simple Python script within Power BI. For example, write a script to import a dataset and display it in a table format, ensuring that the integration works as intended.
-
Common Issues: Be mindful of potential issues during installation, such as incorrect library versions or path misconfigurations. If errors arise, double-check your installation paths and library versions. Addressing these common pitfalls is crucial to prevent the frustrations associated with time-consuming report creation and inconsistencies that can stem from improper setups. Furthermore, the absence of a governance strategy can exacerbate these issues, leading to confusion and mistrust in the information provided.
-
Expert Advice: Data professionals underscore the importance of a robust setup. As highlighted in industry discussions, for every three analysts, there is a need for at least ten engineers, emphasizing the critical role of proper configuration in information projects. This underscores the significance of a well-organized programming environment like Python BI to facilitate efficient information analysis and deliver practical insights, rather than merely presenting figures and charts.
-
Real-World Examples: Numerous organizations have successfully integrated a programming language with Python BI to enhance their information analysis capabilities. For instance, utilizing Python BI in a programming language for advanced analytics has empowered teams to derive deeper insights from their information, ultimately fostering improved decision-making. Moreover, the model developed by learning from historical information is vital in this context, as it highlights the importance of information quality and preparation in achieving accurate results.
-
Model Validation: After training your models, it is essential to assess their performance through a validation report. This process provides insights into the model’s performance, including leading predictors and statistical performance indicators, ensuring that your integration yields trustworthy outcomes and actionable advice for stakeholders.
By following these steps, you can effectively configure a programming language in Business Intelligence, unlocking robust analysis and visualization capabilities while addressing the typical challenges of report generation, information governance, and the need for clear, actionable guidance.
Using Python Scripts for Enhanced Data Analysis in Power BI
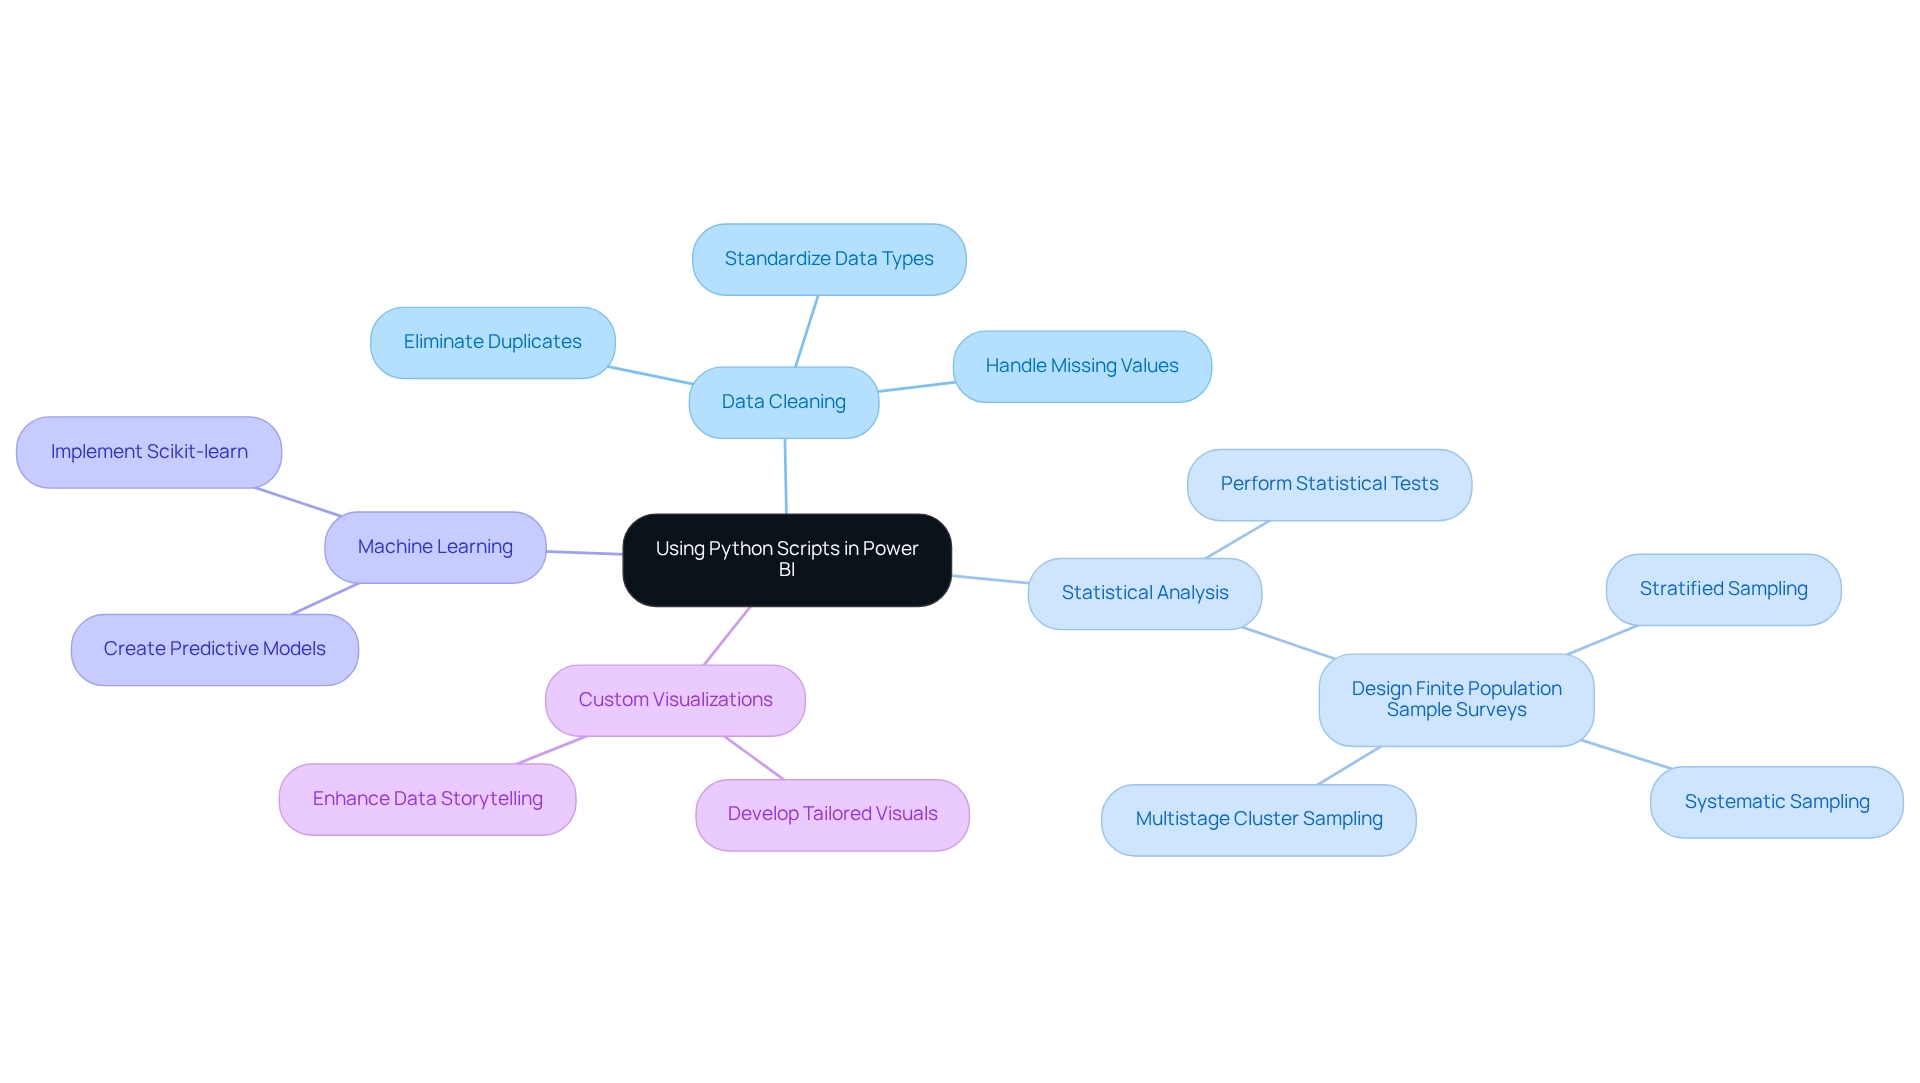
Scripts in the programming language serve as an effective resource within Python BI, enabling a variety of analysis tasks that significantly enhance operational efficiency and address common issues in business reporting. Key applications include:
-
Data Cleaning: Python excels in preprocessing data, allowing users to effectively handle missing values, eliminate duplicates, and standardize data types. This foundational step is crucial for ensuring high-quality information, essential for precise analysis and mitigating inconsistencies that can lead to confusion and mistrust in reporting.
-
Statistical Analysis: By leveraging libraries such as SciPy, analysts can perform a variety of statistical tests and calculations. This capability enables the extraction of meaningful insights from datasets, facilitating informed decision-making based on robust statistical evidence. Importantly, the course addresses the design of finite population sample surveys, including stratified, systematic, and multistage cluster sampling designs, which are crucial for effective analysis.
-
Machine Learning: BI users can create and implement machine learning models directly within the Python BI platform using Scikit-learn. This integration enables sophisticated predictive analytics, empowering organizations to anticipate trends and make proactive business decisions, thus improving the actionable insights obtained from information.
-
Custom Visualizations: Python scripts within Python BI allow for the development of custom visualizations, extending features beyond typical offerings. These tailored visuals enhance the storytelling aspect of data presentations, making complex insights more accessible and engaging for stakeholders. Reports are not just filled with numbers and graphs; they provide clear, actionable guidance.
As Matt Crabtree, Senior Editor in the AI and EdTech Space, notes, “Created by Microsoft, BI is another robust tool for generating interactive reports and dashboards.” The effectiveness of this programming language is underscored by case studies, such as those from LaGuardia Community College’s Data Analytics program. Students reported significant improvements in their analytical capabilities and efficiency in report preparation after mastering tools like SQL, this programming language, and Tableau. This real-world application emphasizes the transformative potential of Python BI scripts in improving analysis outcomes within Business Intelligence, especially as students utilize their skills in practical scenarios.
Overcoming Challenges in Python BI Integration with Power BI
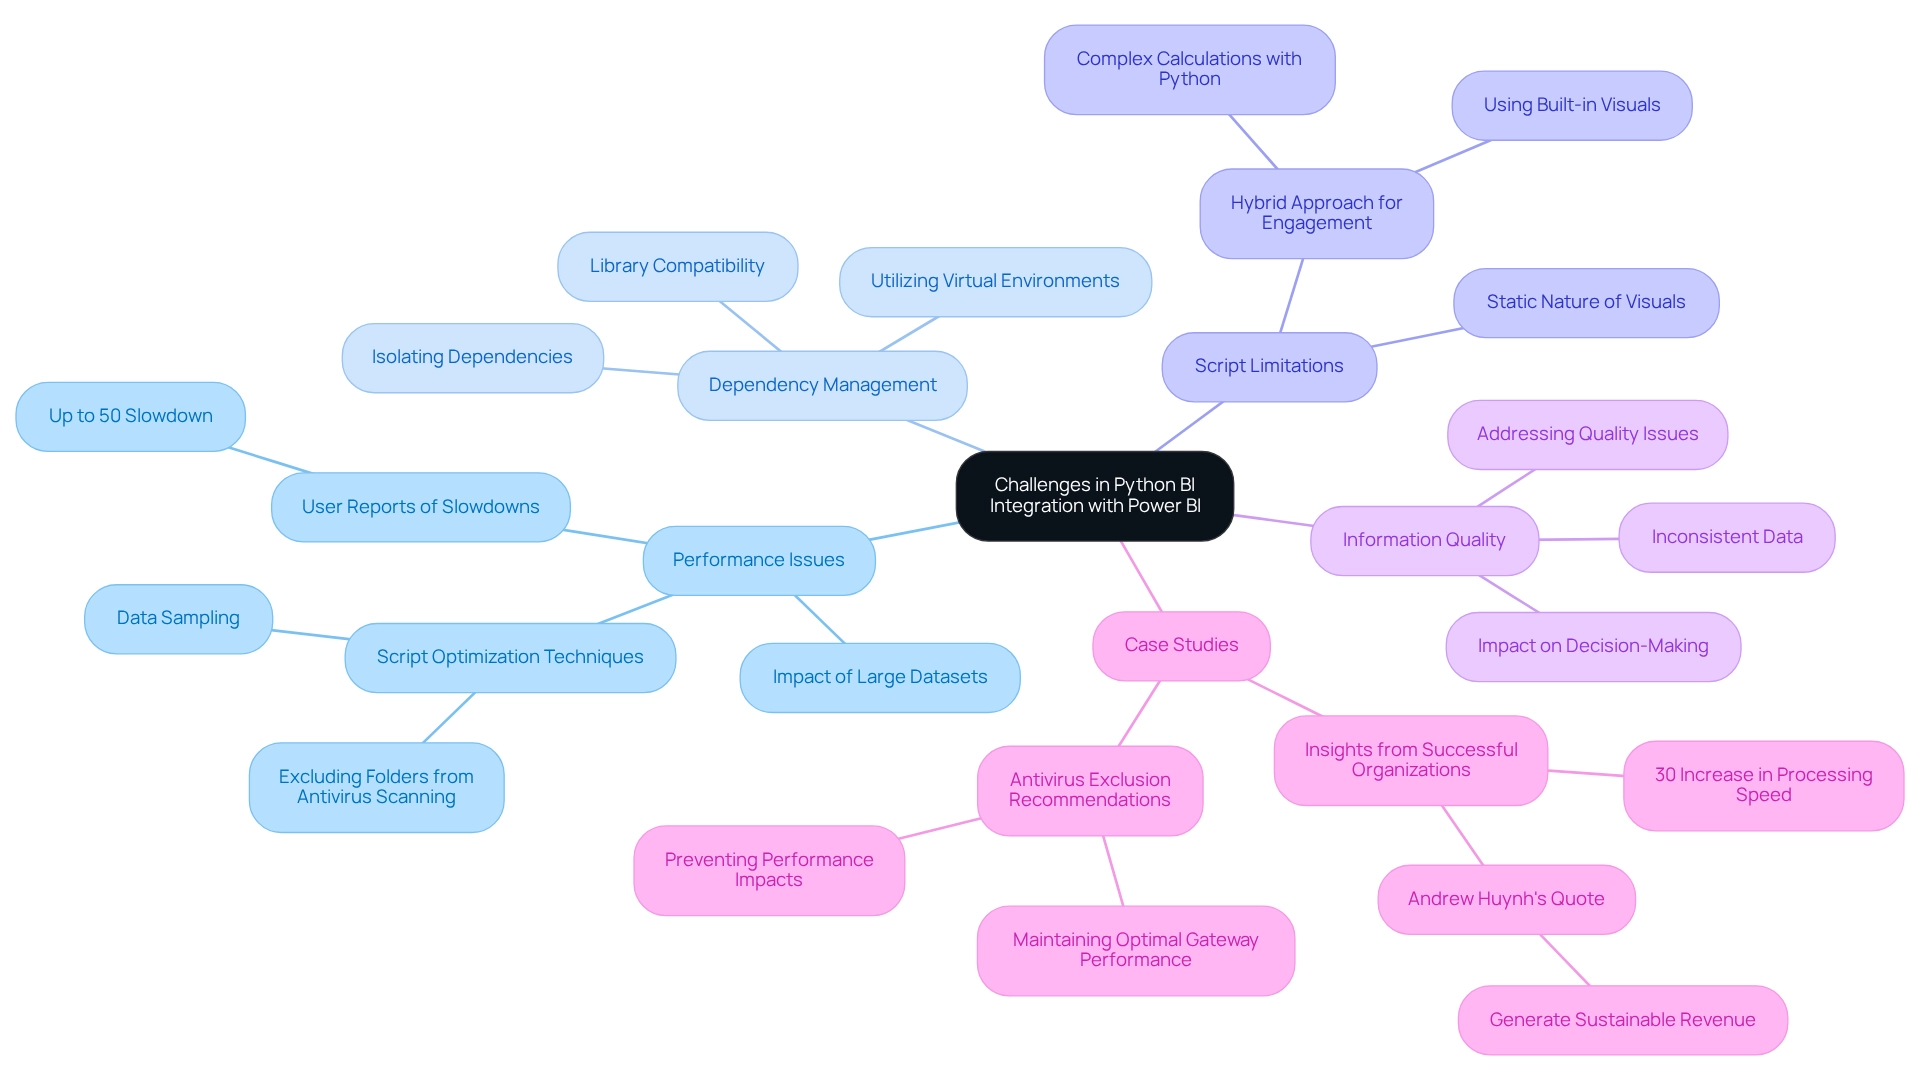
Common challenges in Python BI integration with Power BI include:
- Performance Issues. When managing large datasets, executing Python BI scripts can considerably hinder Power BI’s performance. Statistics indicate that inadequately optimized scripts can lead to performance declines, with users reporting slowdowns of up to 50%. To mitigate this, optimizing scripts using Python BI techniques, such as data sampling, is essential. This approach allows for processing smaller, representative subsets of data without compromising the integrity of your analysis.
Moreover, excluding specific folders from antivirus scanning can prevent performance issues on the gateway, as these folders experience high write operations.
-
Dependency Management. Effectively managing programming libraries is crucial for seamless integration. Ensure that all necessary libraries are installed and compatible with BI. Utilizing virtual environments in Python BI can help isolate dependencies and avoid conflicts, which is particularly important as the landscape of programming libraries evolves. This method not only simplifies dependency handling but also enhances the stability of your BI solutions.
-
Script Limitations. A notable drawback of visuals in business intelligence is their static nature, which restricts interactivity. To maximize user engagement, it is vital to plan visualizations thoughtfully. Consider leveraging BI’s built-in visuals for interactive components while employing a programming language for complex calculations or manipulations that enhance overall analysis. This hybrid approach can help overcome the limitations of static visuals while fully utilizing Python BI’s capabilities.
-
Challenges of Poor Master Information Quality. Organizations often grapple with inconsistent, incomplete, or erroneous information, leading to inefficient operations and flawed decision-making. Addressing these information quality issues is critical for effective Python BI integration and can significantly enhance the insights derived from Power BI dashboards.
Looking ahead to 2025, as the integration of a programming language like Python BI with Power BI evolves, new challenges are emerging. Data engineers have observed that maintaining performance during Python script integration remains a significant obstacle. Experts suggest that continuous monitoring and iterative enhancement of scripts are crucial to keep pace with the increasing complexity of information environments.
- Case Studies on Overcoming Challenges. Organizations that have successfully navigated these obstacles often share valuable insights on best practices. For example, a recent case study highlighted how a company improved its BI performance by implementing a robust dependency management strategy, resulting in a 30% increase in processing speed. Additionally, Andrew Huynh, Senior BI Engineer, emphasizes the importance of creating sustainable revenue by utilizing Embedded Applications with Sigma to market information as a product to existing clients. Such examples offer valuable learning opportunities for others facing similar challenges in system integration.
By understanding these challenges and implementing strategic solutions, organizations can enhance their BI connectivity with Power BI, ultimately leading to more effective data analysis and informed decision-making.
Best Practices for Sustaining Python Integration with Power BI
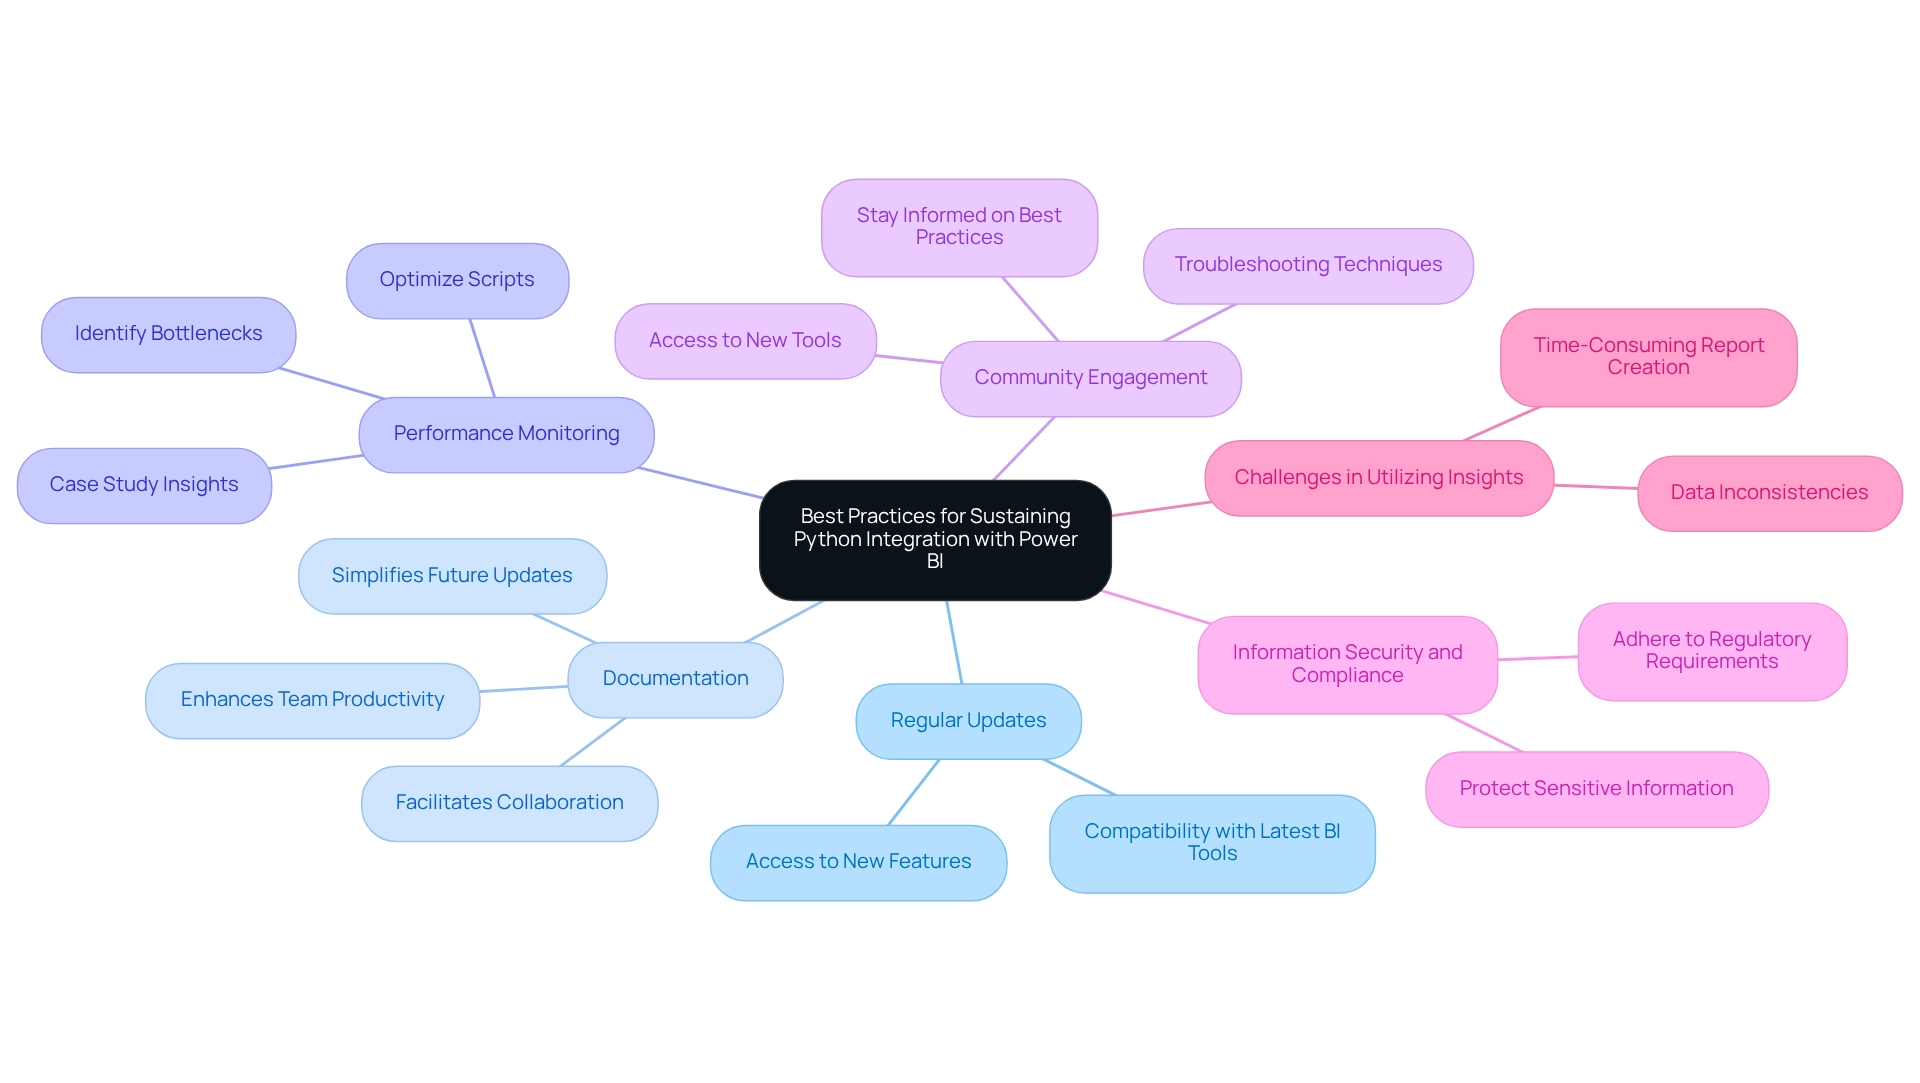
To maintain efficient integration with BI and automate manual workflows, consider the following best practices:
-
Regular Updates: Regularly update your installation and libraries to benefit from new features and improvements. This practice is essential for preserving compatibility with the latest versions of BI tools, including Python BI, which is crucial for leveraging the most recent capabilities in Business Intelligence.
-
Documentation: Clear and comprehensive documentation of your scripts is vital. It facilitates collaboration among team members and simplifies future updates, ensuring that everyone understands the functionalities and purposes of the scripts. This is especially crucial in the context of RPA, where well-documented processes can significantly enhance operational efficiency.
-
Performance Monitoring: Regularly evaluate the performance of your scripts in Python BI within Business Intelligence. Monitoring with Python BI allows you to identify bottlenecks and optimize scripts for effective information processing, which is critical for sustaining operational efficiency. For instance, a case analysis on setting up and configuring the Python BI tool emphasizes the significance of performance monitoring to guarantee seamless integration. This case study illustrates how effective observation with Python BI can lead to substantial improvements in information processing times and overall user satisfaction, ultimately fostering better insight generation.
-
Community Engagement: Actively participate in forums and communities dedicated to Power BI and programming. Engaging in these groups keeps you informed about best practices, new tools, and troubleshooting techniques, greatly enhancing your implementation efforts with Python BI and aiding navigation through the rapidly evolving AI landscape.
-
Information Security and Compliance: When managing sensitive information in Python BI scripts, prioritize information security and compliance. This is essential to protect your organization from potential information breaches and to adhere to regulatory requirements. Emphasizing this aspect ensures it remains a critical factor in your integration strategy, particularly when automating workflows with RPA.
-
Challenges in Utilizing Insights: Be aware of the challenges in utilizing insights from BI dashboards, such as time-consuming report creation and data inconsistencies. Addressing these challenges is vital for optimizing the performance of your solutions in Python BI and ensuring that your team can make informed decisions based on accurate data.
-
Importance of Documentation: Statistics indicate that thoroughly documented projects in programming languages significantly enhance team productivity and reduce onboarding time for new developers. This underscores the necessity of maintaining comprehensive documentation. A recent message on this topic garnered 41,244 views, highlighting the relevance and interest in effective documentation practices.
Regular updates for programming in Python BI are essential for leveraging the latest capabilities and ensuring optimal performance in Business Intelligence. Frequent updates can prevent compatibility issues and enhance the overall performance of your BI solutions, which is crucial for fostering business growth.
- API Integration: As noted by expert Amitchandak, if you need to call the BI API from a programming language, you will need to utilize the BI REST APIs. This integration is vital for enhancing the capabilities of your Python scripts within the Python BI environment, enabling more sophisticated data analysis and reporting. Additionally, consider how tailored AI solutions can assist in overcoming these challenges, providing targeted technologies that align with your specific business goals.
Conclusion
Integrating Python with Power BI signifies a transformative shift in organizational approaches to data analytics and business intelligence. By harnessing the advanced capabilities of Python’s libraries, such as Pandas and Matplotlib, users can manipulate data more effectively and create custom visualizations that elevate storytelling within reports. This integration streamlines complex processes, automates repetitive tasks, and empowers users to apply machine learning techniques directly within Power BI, resulting in more informed decision-making and enhanced operational efficiency.
The benefits of this integration are extensive, encompassing improved data quality, advanced analytics, and the capacity to generate deeper insights that drive strategic growth. As businesses increasingly adopt Python for data manipulation and visualization, understanding best practices and tools becomes essential. Organizations can maximize their data’s potential by focusing on regular updates, comprehensive documentation, and performance monitoring, ensuring their BI solutions remain efficient and relevant.
Ultimately, the synergy of Python and Power BI enriches analytical capabilities and positions businesses to navigate the complexities of today’s data landscape. Embracing this powerful combination enables organizations to unlock actionable insights, foster innovation, and maintain a competitive edge in an ever-evolving market. As the integration of these tools continues to advance, staying informed and adaptable will be crucial for leveraging their full potential and achieving sustained business success.
Frequently Asked Questions
What are the main advantages of integrating Python with Power BI?
The integration of Python with Power BI enhances business intelligence capabilities through advanced data manipulation, custom visualizations, enhanced analytics, automation of repetitive tasks, and expert insights.
How does Python improve data manipulation in business intelligence?
Python’s libraries, particularly Pandas, enable sophisticated data cleaning and transformation processes, simplifying the preparation of complex datasets for analysis.
What types of visualizations can be created using Python in BI?
Users can create tailored visual representations with libraries such as Matplotlib and Seaborn, allowing for more advanced and specific visualizations than standard BI offerings.
In what ways does Python enhance analytics within BI tools?
Python allows for the direct application of machine learning algorithms within BI, enabling predictive analytics and uncovering deeper insights for strategic decision-making.
How does automation through Python scripts benefit BI processes?
Automation reduces processing time and minimizes human error by streamlining repetitive tasks, which boosts operational efficiency and frees up resources for strategic initiatives.
What insights have analysts provided regarding Python’s role in BI?
Analysts have noted that using a programming language alongside BI tools leads to more effective information handling, highlighting its increasing significance in contemporary data settings.
What challenges might users face when setting up Python with BI on different operating systems?
Windows users may find the installation straightforward, while macOS or Linux users must use a virtual machine to run Windows, adding complexity to the setup.
Can you provide an example of how Python is used to import and visualize data in BI?
Recent tutorials demonstrate how to import information from a SQLite database into BI using Python, transform it with Pandas, and visualize it with Matplotlib.
What is the current trend regarding the use of Python in business intelligence?
There is a growing trend among companies utilizing Python for information manipulation within their business intelligence systems, reflecting its increasing value in improving analytical processes.
How does the integration of Python with BI tools impact business results?
The combination enhances information handling, visualization, advanced analytics, and automation, ultimately leading to improved business results and more informed decision-making.

