Overview
This article serves as a comprehensive guide for operations leaders, detailing effective communication of data. It underscores the importance of audience understanding, clarity, and engagement strategies. By outlining practical steps—such as audience segmentation, storytelling techniques, and the careful selection of visualizations—it aims to enhance comprehension. Ultimately, these strategies foster informed decision-making in today’s data-driven environment.
Introduction
In an era characterized by information overload, the capacity to communicate data effectively has become paramount. Organizations face an overwhelming influx of data, yet many find it challenging to articulate insights in ways that resonate with their audiences.
By understanding audience preferences, leveraging storytelling techniques, and utilizing clear visualizations, data can be transformed from mere numbers into compelling narratives that drive decision-making. As businesses navigate the complexities of the digital landscape, mastering these communication strategies is essential—not only for engagement but also for cultivating a culture of data-driven innovation.
This article delves into the key elements of effective data communication, providing actionable insights designed to enhance clarity, engagement, and, ultimately, organizational success.
Understanding Your Audience: The Key to Effective Data Communication
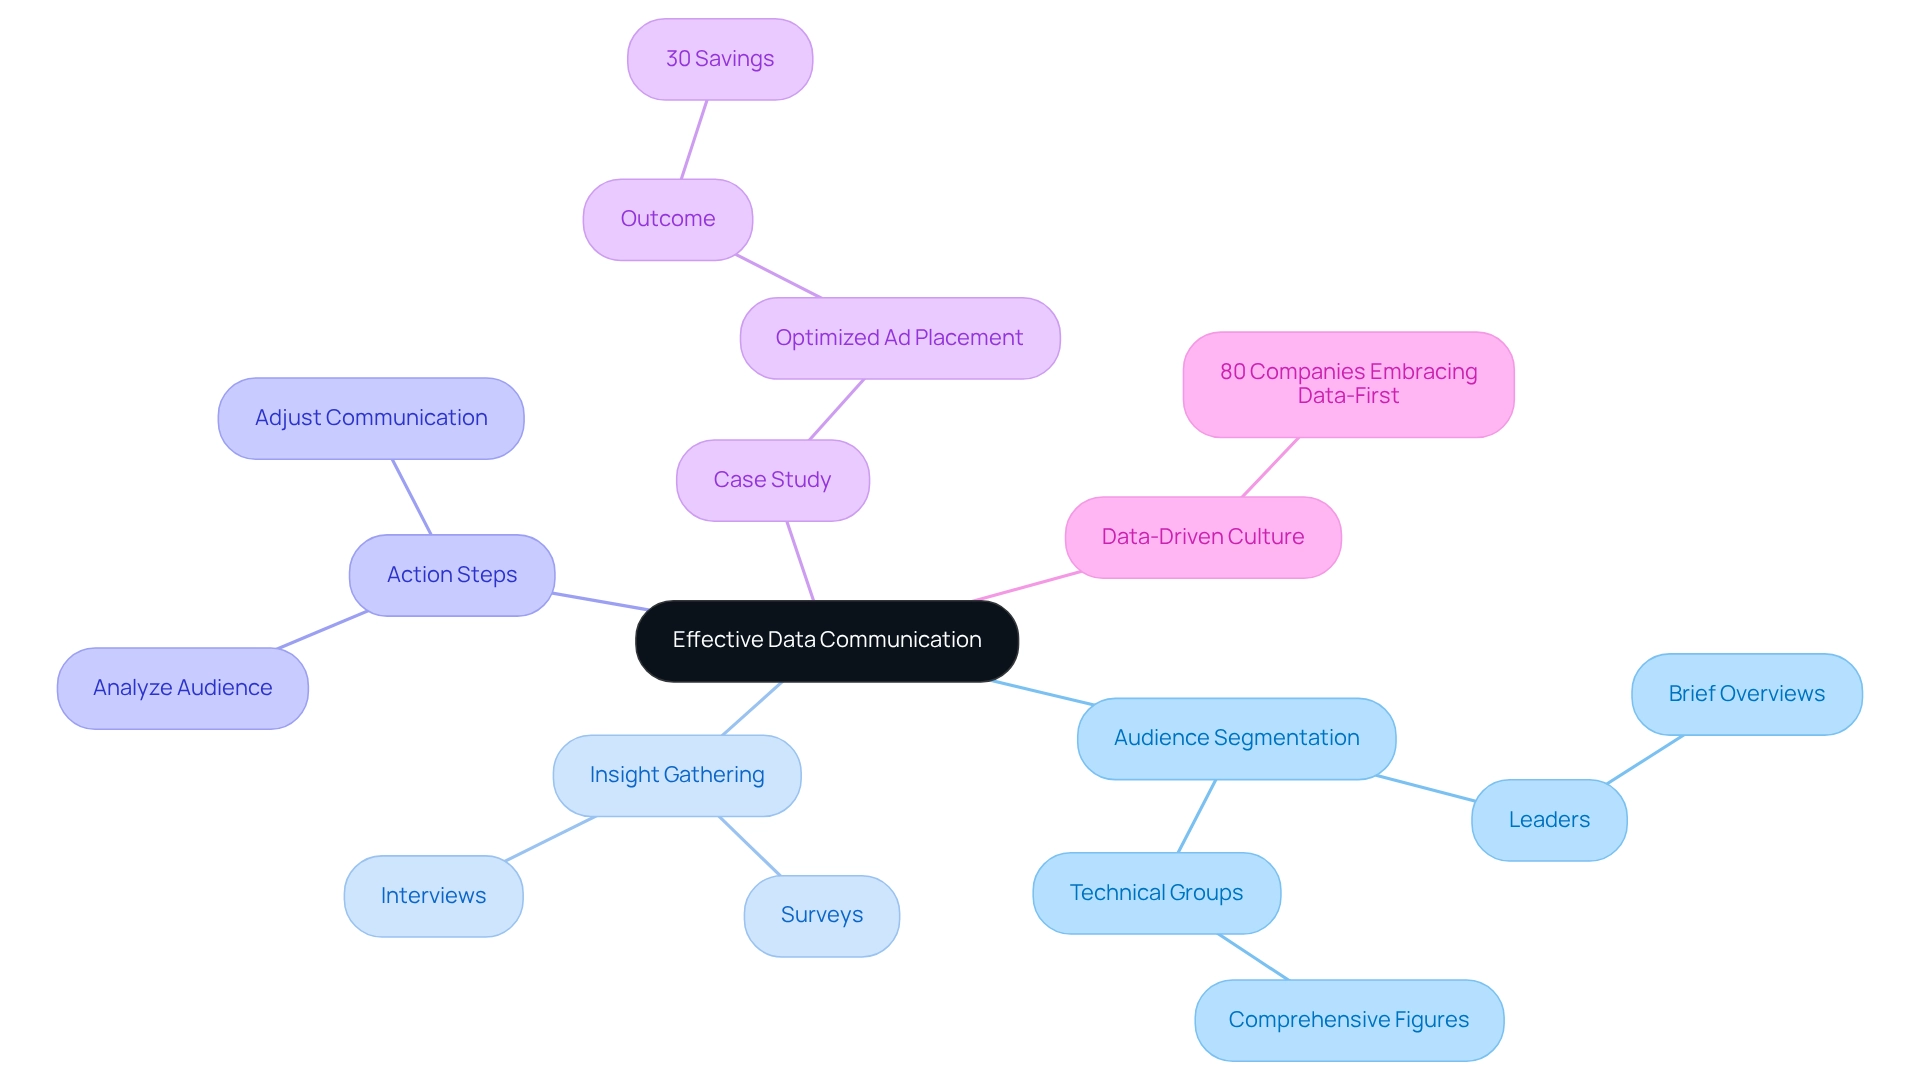
Successful information exchange begins with the ability to communicate data effectively to your audience. Identifying their roles, expertise, and interests is crucial for this purpose. Leaders, for instance, often prefer brief, high-level overviews that emphasize essential information, while technical groups may require comprehensive figures and analyses to inform their decisions.
To gather valuable insights about your audience’s preferences and knowledge levels, consider utilizing tools like surveys or interviews. This approach is fundamental to understanding how to communicate data effectively.
Segmentation of your audience plays a vital role in enhancing your presentations. By categorizing groups based on their information literacy and specific interests, you can tailor your communication strategies to resonate with each segment. This method not only makes your message more relevant but also boosts engagement and comprehension, illustrating the importance of effective data communication in today’s rapidly evolving AI landscape, where tailored solutions must align with specific business goals.
Creatum GmbH provides customized AI solutions designed to assist businesses in navigating the overwhelming array of available options. By leveraging Business Intelligence (BI), organizations can transform raw data into actionable insights, facilitating informed decision-making that drives growth and innovation. For example, a multinational company successfully optimized its digital ad placements by employing predictive models to forecast conversion rates, significantly reducing marketing waste.
This strategic analysis of the target group resulted in a remarkable 30% reduction in unnecessary expenditures while simultaneously enhancing overall ad performance. This case exemplifies how effective target group analysis, combined with BI and tailored solutions from Creatum GmbH, directly contributes to achieving substantial results.
To effectively evaluate preferences for information communication, follow these action steps:
- Conduct an analysis of your audience through surveys or interviews to gather insights. Segment your audience based on their data literacy and interests.
- Adjust your communication approach to suit each segment, which is essential for understanding how to communicate data effectively while ensuring clarity and relevance.
As the environment evolves, remaining knowledgeable and adaptable is crucial for enhancing strategies through data-informed understanding. With over 80% of companies embracing a data-first culture, leveraging data-driven insights has never been more critical. Embrace the power of numbers and let information guide your path to success.
By converting raw data into actionable insights, organizations can inform strategic decisions and propel their journey toward success.
The Power of Storytelling: Engaging Stakeholders with Data Narratives
Integrating storytelling methods into your presentations can significantly enhance engagement and understanding, particularly when communicating data effectively in the overwhelming AI landscape. Start by embedding your information within a narrative that clearly outlines the issue, the resolution, and the resulting effect. For example, when showcasing sales figures, narrate a story that illustrates how a specific strategy led to increased revenue, thereby making the statistics more relatable and impactful.
To effectively convey your message, follow these action steps:
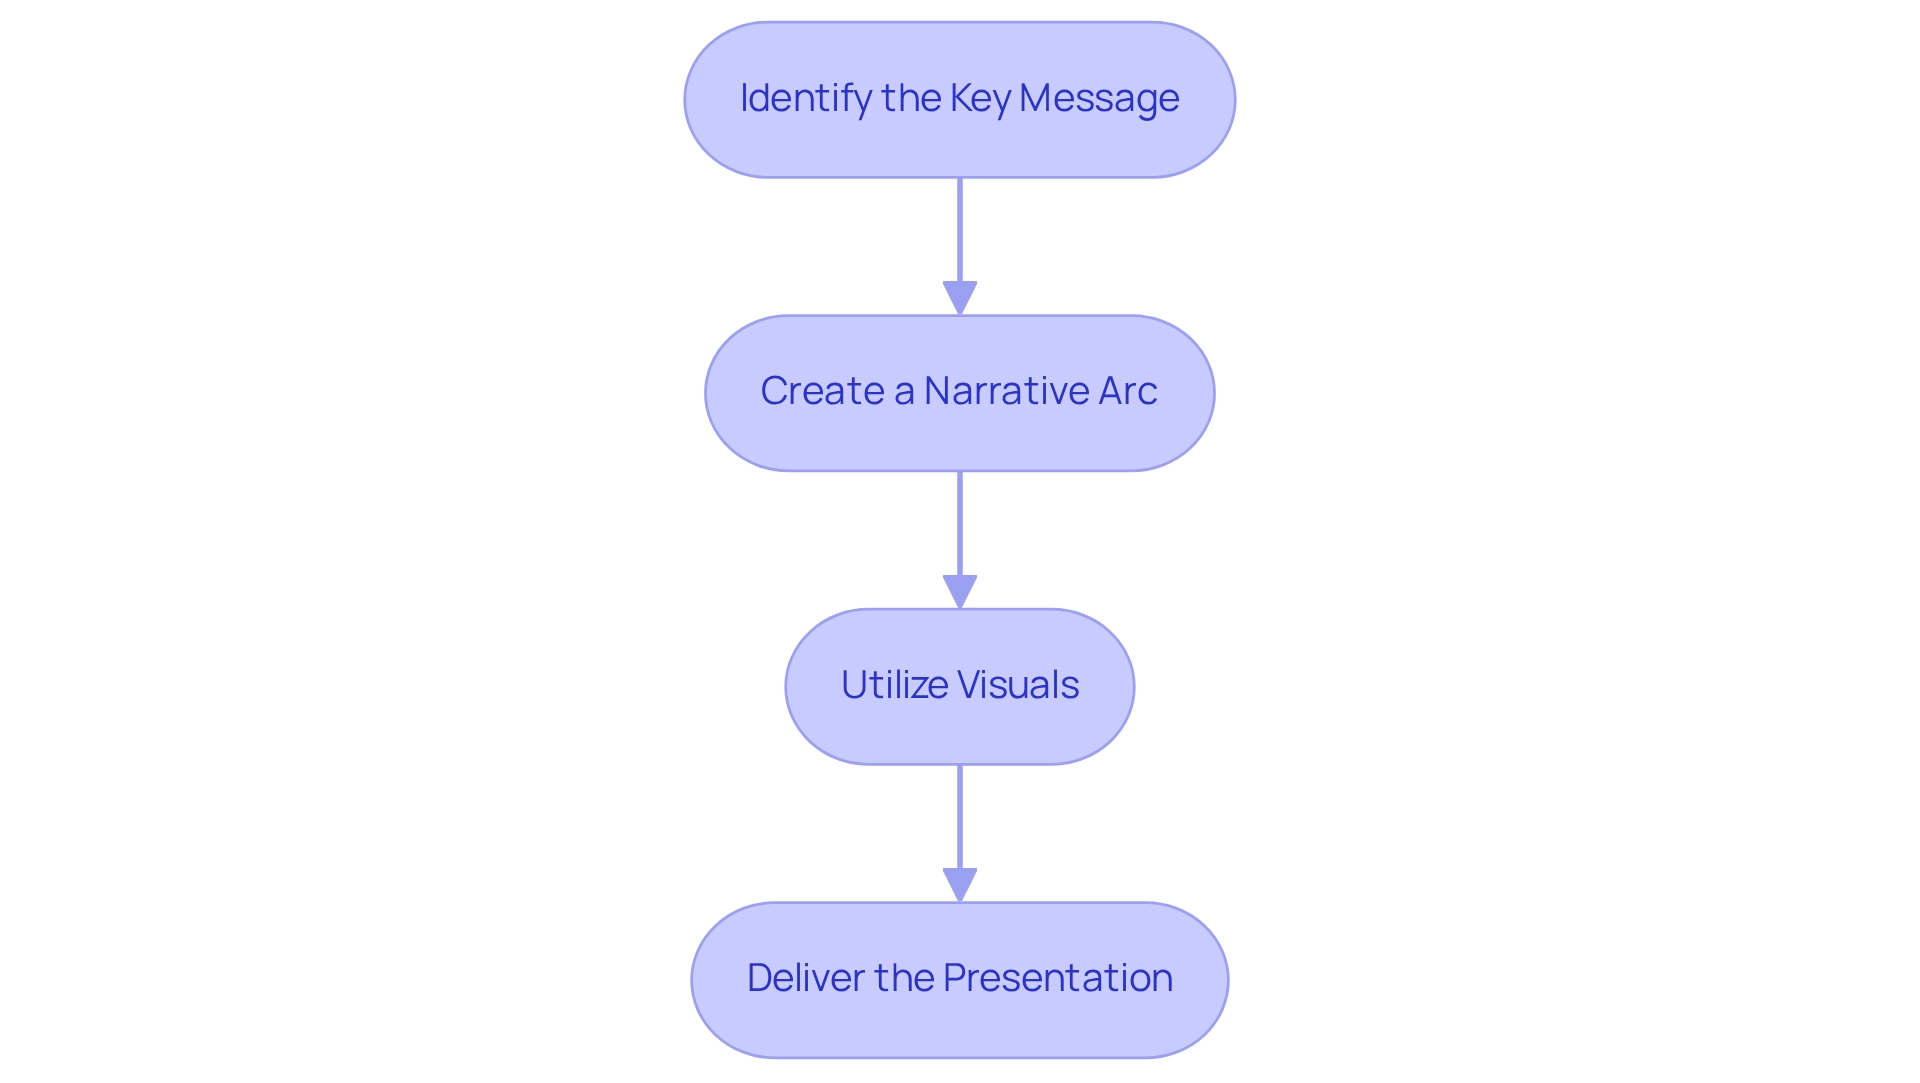
- Identify the Key Message: Determine the core insight you wish to convey to your listeners, ensuring it aligns with their interests and needs, especially in the realm of Business Intelligence and AI solutions.
- Create a Narrative Arc: Organize your presentation by introducing the challenge, presenting the pertinent information, and concluding with the implications of your findings. This logical progression helps maintain audience engagement and facilitates understanding, particularly when discussing the transformative impact of tailored solutions like Creatum’s Power BI Sprint.
- Utilize Visuals: Support your narrative with compelling visuals, such as infographics or charts, which can help clarify complex information and reinforce your message.
Statistics reveal that branded narratives can lead to a 4% increase in trust, often translating into improved conversion rates. Furthermore, a substantial 73.67% of individuals employ narrative techniques to convey sales information effectively, according to Venngage. This underscores the growing acknowledgment of narrative techniques as an essential proficiency in analysis, particularly regarding effective data communication, where the ability to convey findings persuasively is as crucial as the examination itself.
Real-world instances demonstrate that impactful narratives can significantly enhance stakeholder involvement. For instance, a case study titled ‘Data Storytelling: How to Effectively Tell a Story with Data’ illustrated how a company addressed a sales decline by weaving a narrative around environmental concerns, ultimately inspiring action and fostering a deeper connection with stakeholders. By mastering how to communicate data effectively through narrative, operations leaders can transform raw figures into memorable insights that drive informed decision-making and strategic initiatives.
Effective corporate storytelling should be simple, structured, and considerate of the audience’s perspective, reinforcing the importance of these elements in your narrative. Moreover, leveraging insights from Creatum’s Power BI Sprint can expedite your information analysis and reporting success, further enhancing your operational efficiency. As Sascha Rudloff, Teamleader of IT and Process Management at PALFINGER Tail Lifts GMBH, stated, ‘The outcomes of the Power BI Sprint have surpassed our expectations and were a significant enhancement for our analysis strategy.’
This testimonial highlights the real-world impact of Creatum’s solutions in addressing the challenges businesses face in the AI landscape.
Clarity and Simplicity: Making Data Accessible to All
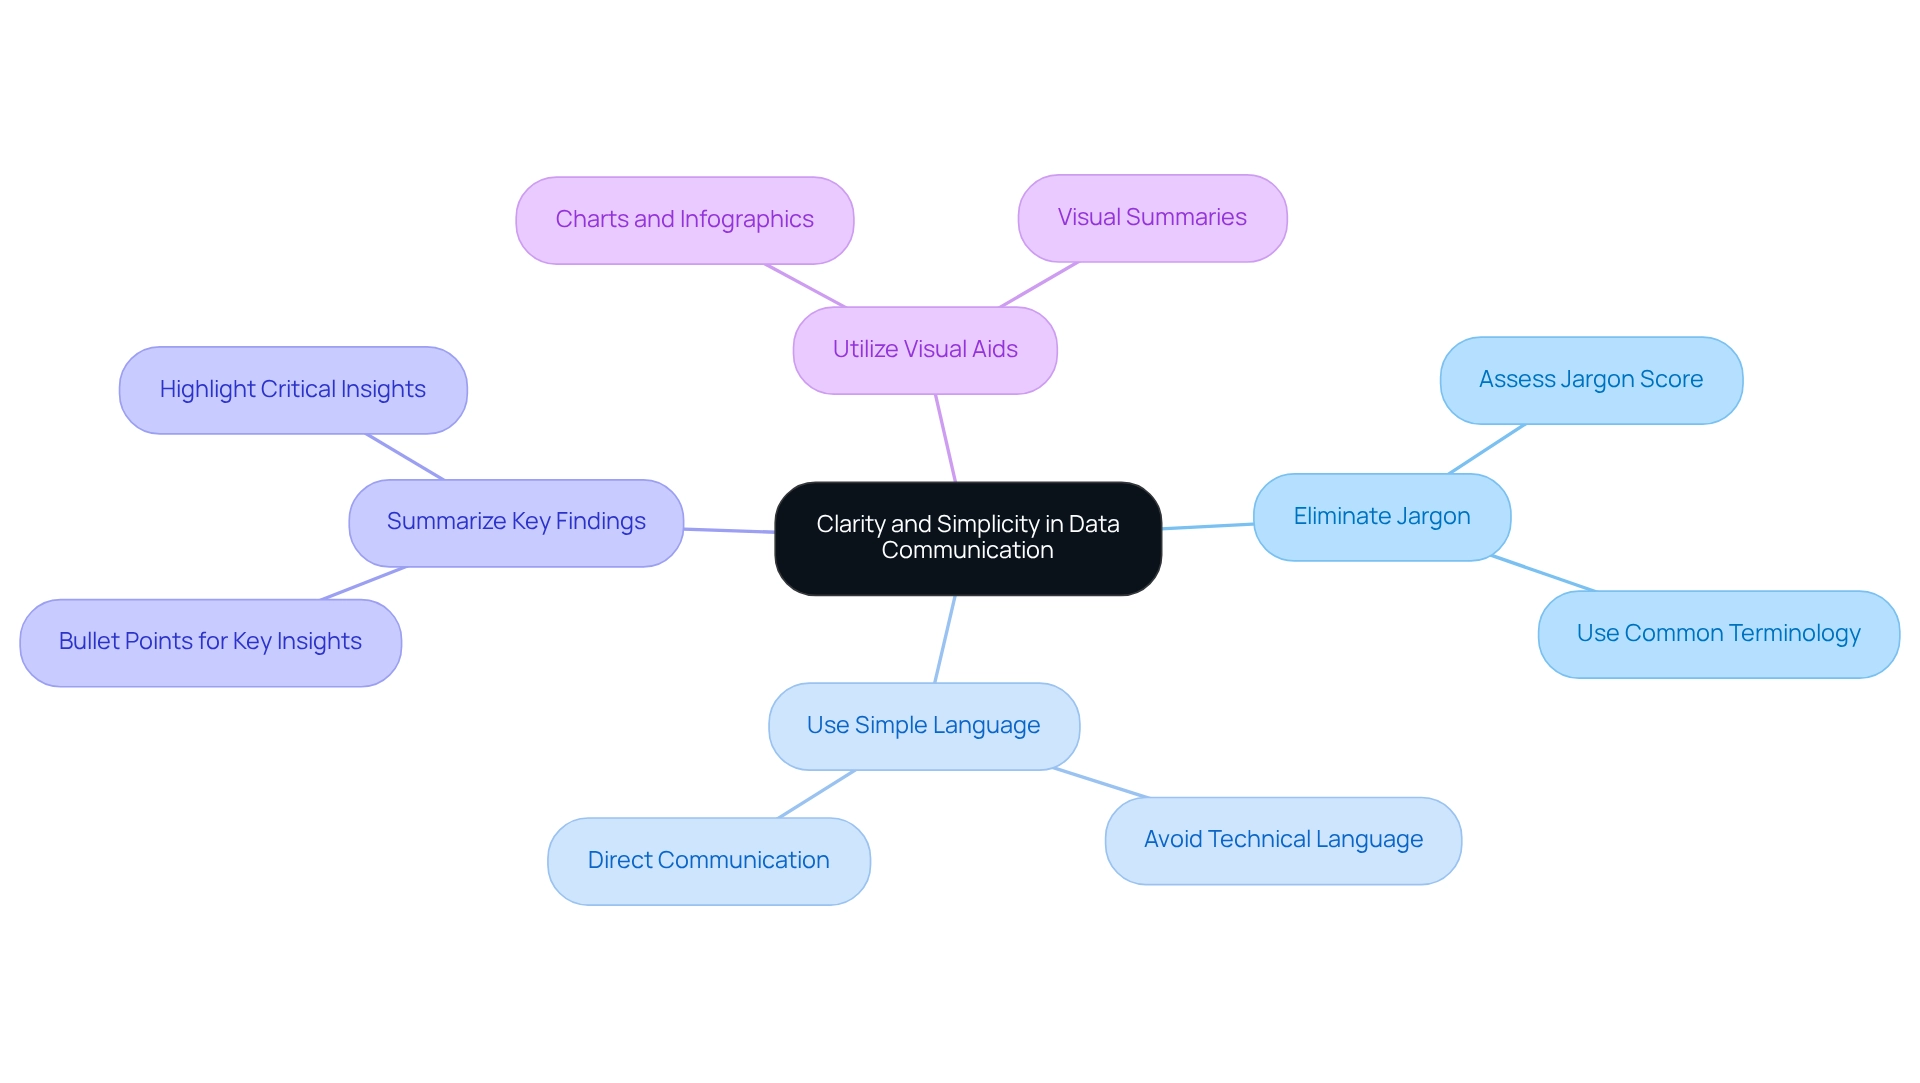
To enhance clarity in data communication, it is crucial to understand how to communicate data effectively by eliminating jargon and overly technical language. Utilizing simple, direct language is essential when learning to convey data among diverse audiences. Instead of presenting dense tables filled with numbers, consider summarizing key findings using bullet points or straightforward charts.
This approach not only makes the information more accessible but also demonstrates effective data communication by highlighting the most critical insights.
Research indicates that the use of jargon can significantly hinder understanding; a recent study found that 65% of respondents with higher education levels still struggled with complex terminology in data presentations. Furthermore, a case study conducted during the early COVID-19 lockdown revealed that jargon negatively impacted persuasion, particularly for non-urgent topics. This underscores the necessity of context in messaging strategies, especially in understanding how to communicate data effectively, as clarity can enhance engagement and decision-making.
As Thomas Holtgraves, an Academic Editor, remarked, ‘We look forward to receiving your revised manuscript,’ emphasizing the significance of clear interaction in academic and professional environments.
The jargon score of the examined paper was 89.6, aligning with the average of 2019 documents, suggesting a notable occurrence of jargon in information presentations. Additionally, the vocabulary of articles from 1999/2000 may not align well with current standards, potentially overestimating the percentage of rare words compared to more recent publications. This evolution emphasizes how to communicate data effectively by simplifying language in information communication.
To simplify complex data presentations and leverage Business Intelligence effectively, follow these strategies:
- Break down information into digestible parts, using bullet points to emphasize key insights.
- Offer background to assist your audience in comprehending the importance of the information, ensuring they recognize its relevance to their operations and how it can be improved through RPA.
- Utilize visual aids, like charts and infographics, to illustrate information visually, facilitating easier interpretation.
By prioritizing clarity and simplicity in how to communicate data effectively, operations leaders can foster better understanding and facilitate informed decision-making across their teams, ultimately driving operational efficiency and business growth. Furthermore, integrating Robotic Process Automation (RPA) into these strategies can streamline processes, reduce errors, and allow teams to focus on more strategic tasks. Customized AI solutions can also improve information analysis, offering deeper insights that assist in effective decision-making.
Choosing Effective Visualizations: Enhancing Data Comprehension
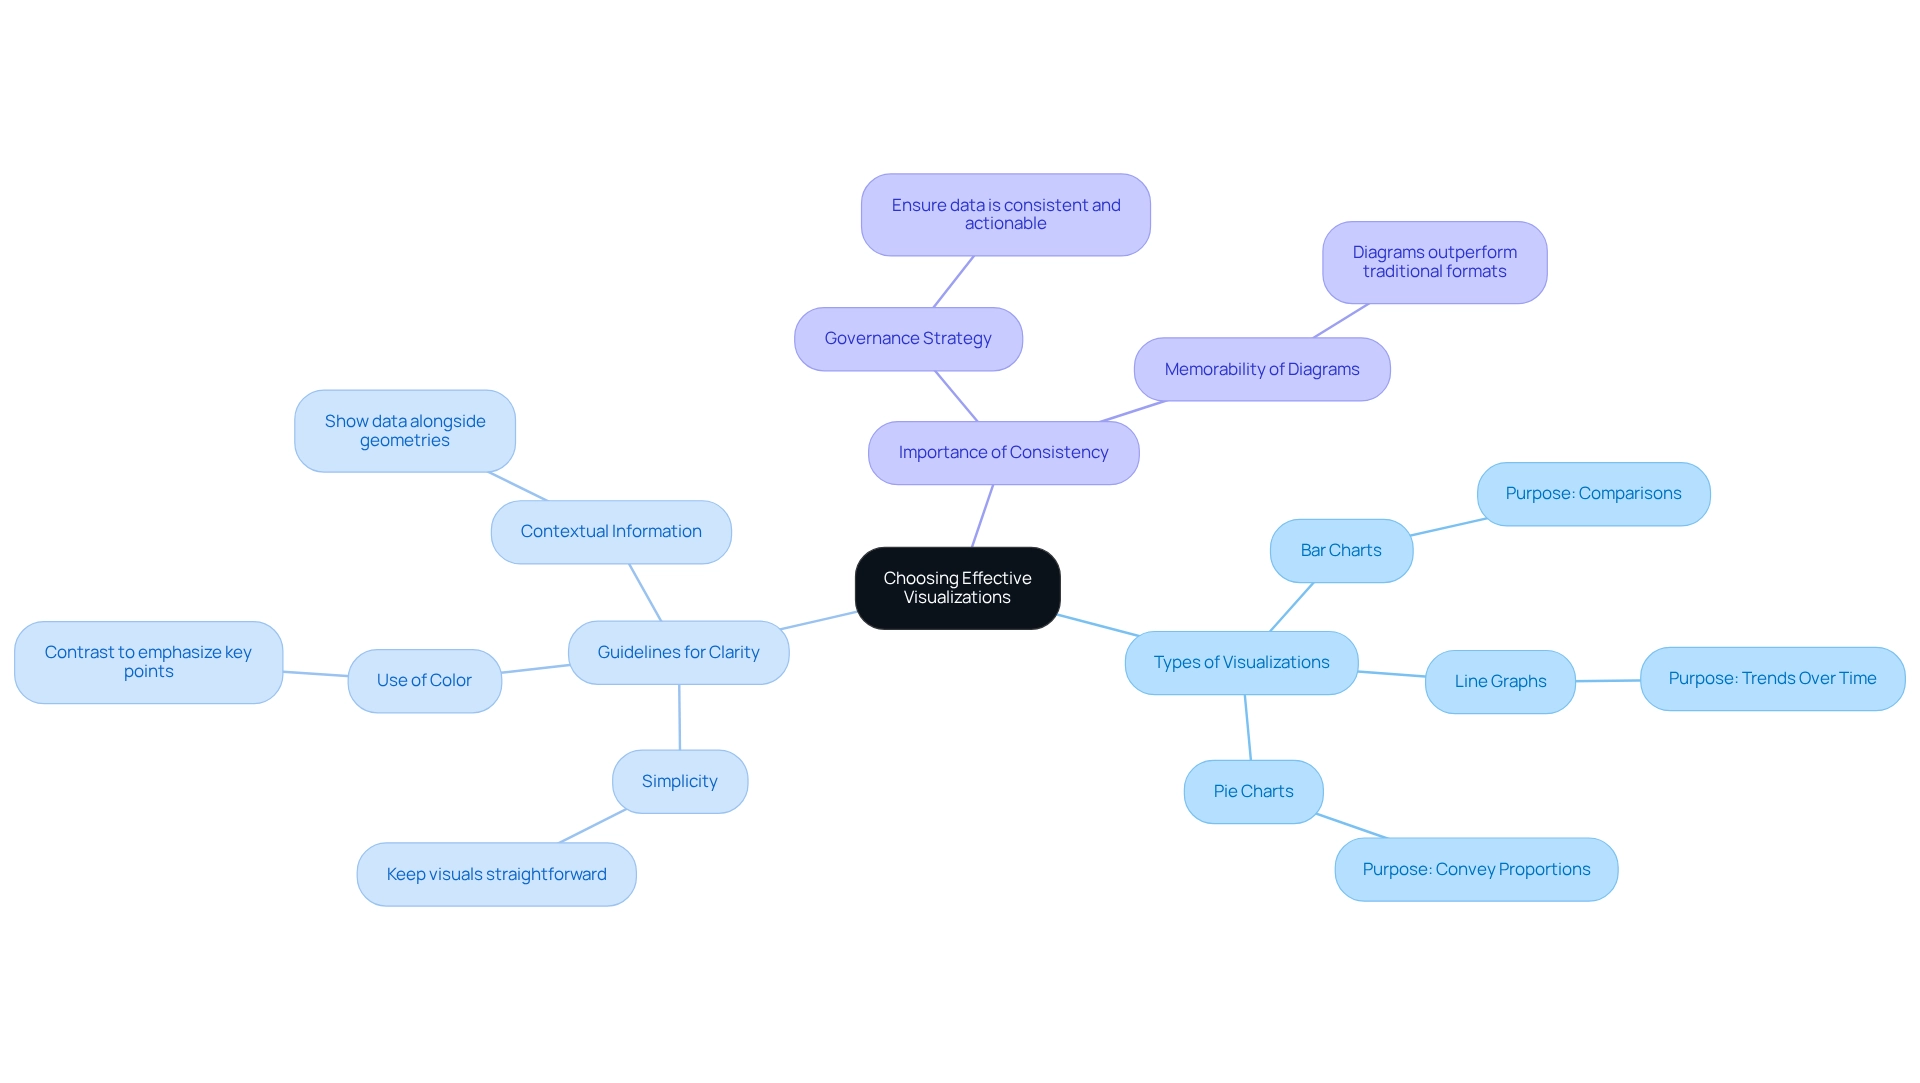
Choosing the appropriate visualizations is essential for effectively communicating data and enhancing your narrative, especially when navigating inconsistencies and governance issues. Different types of visualizations serve unique purposes: bar charts excel in comparisons, line graphs illustrate trends over time, and pie charts convey proportions effectively. However, reports plagued by inconsistent information due to a lack of governance strategy can lead to confusion and mistrust in the presented content.
To enhance clarity, avoid clutter in your visuals and utilize color strategically to emphasize key points. For instance, contrasting colors can help distinguish between sets of information, facilitating comprehension for your audience.
- Identify the Type of Information: Begin by understanding the nature of the information you are working with. This foundational step will guide your choice of visualization and ensure that you are addressing any inconsistencies.
- Choose an Appropriate Visualization Type: Select a visualization that corresponds with your information type and the message you wish to convey. For example, if monitoring changes over time, a line graph might be the most efficient option, provided that the foundational information is consistent and trustworthy.
- Maintain Simplicity: Keep your visuals straightforward and focused on the most critical insights. Excessively intricate visuals can obscure the message and confuse the audience, particularly when the information lacks clear, actionable guidance.
Current trends in information visualization underscore the importance of clarity and memorability. Research indicates that diagrams significantly outperform traditional formats like points, bars, and tables in terms of retention. As Bang Wong, Creative Director of MIT’s Broad Institute, observes, ‘Plotting the information enables us to perceive the underlying structure that you wouldn’t otherwise notice if you’re examining a table.’
This highlights the transformative power of effective visual communication, particularly in conveying data when it is based on consistent information.
Incorporating best practices, such as displaying information alongside geometries, can provide essential context and enhance the overall message. For instance, geographical information can be effectively represented using choropleth maps and cartograms, which allow for a deeper understanding of spatial relationships and distributions. By adhering to these guidelines and ensuring consistency, you can guarantee that your visualizations not only convey information but also demonstrate how to communicate data effectively, enhancing understanding and promoting informed decision-making.
At Creatum GmbH, we provide solutions that specifically address these governance challenges, ensuring that your data is not only consistent but also actionable, empowering you to make informed decisions.
Creating Feedback Loops: Ensuring Understanding and Engagement
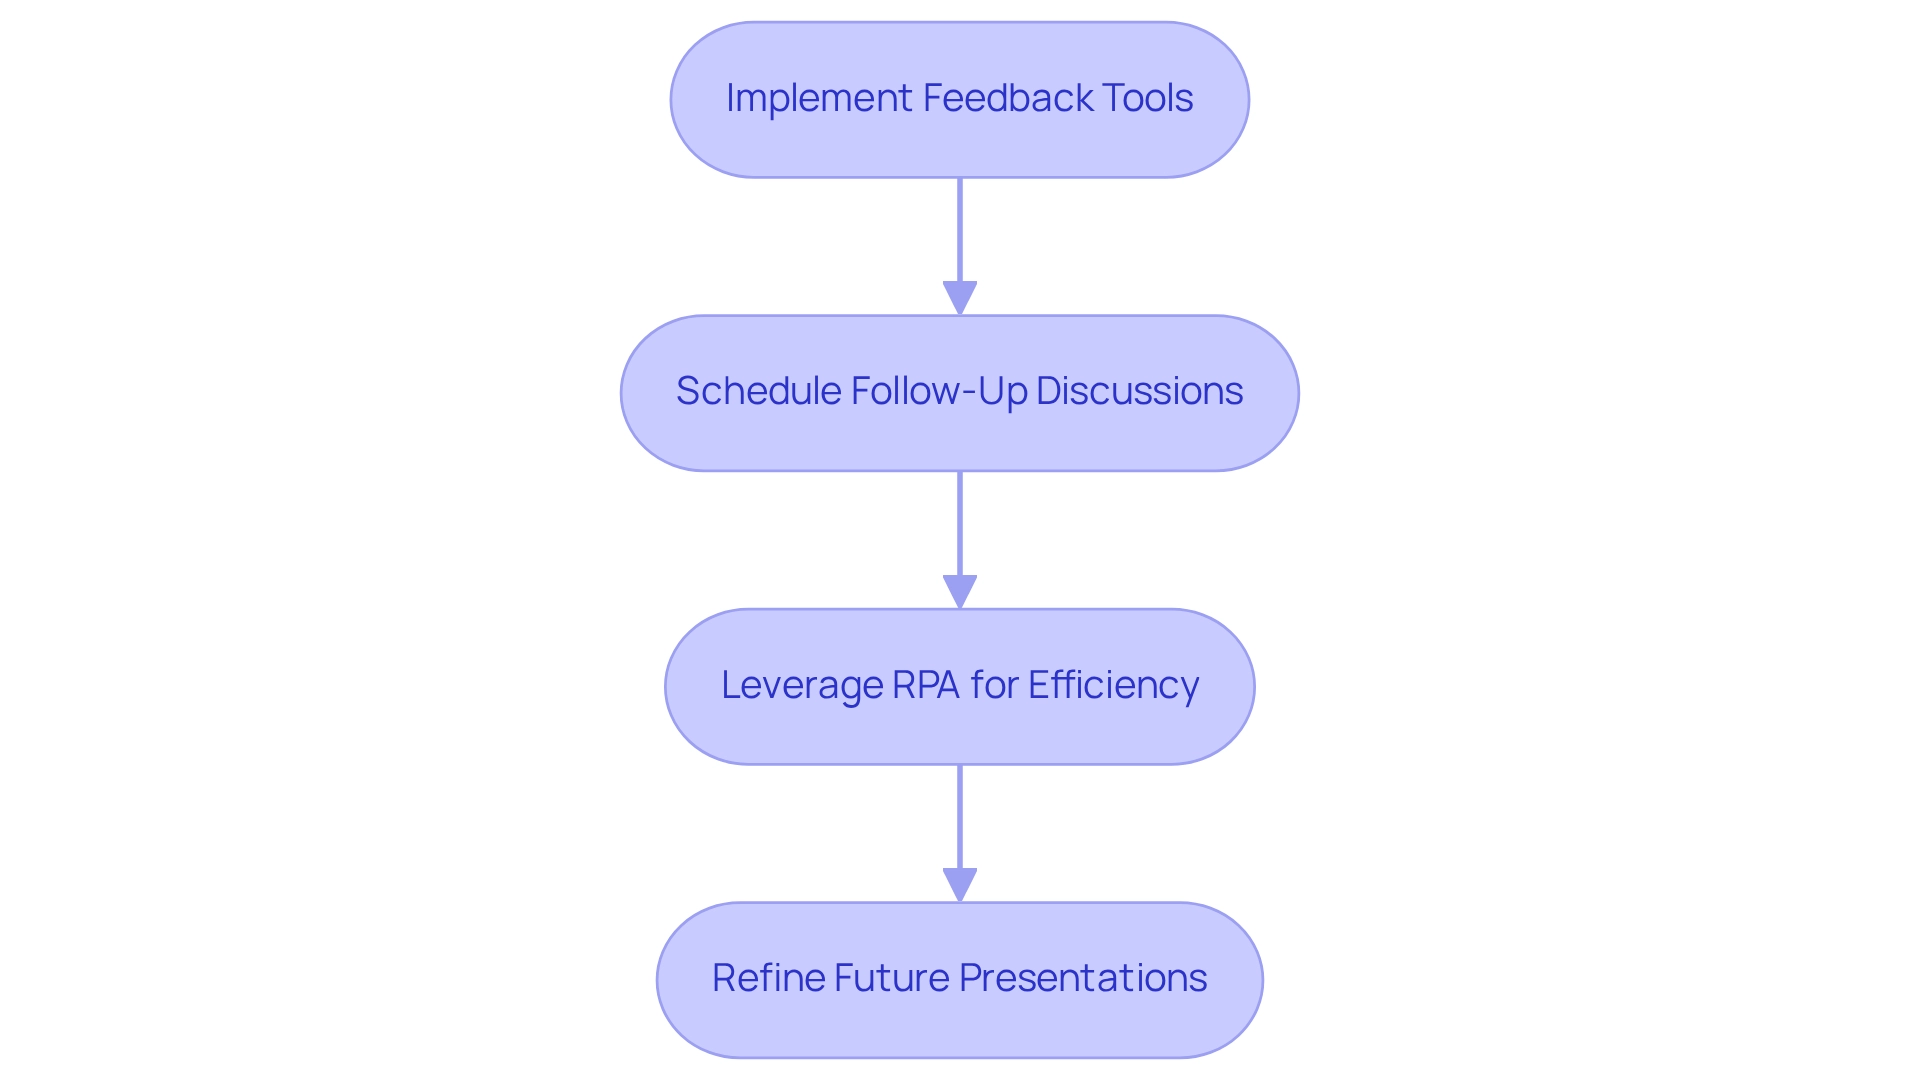
To effectively gauge audience understanding and engagement, establishing robust feedback mechanisms is essential. This can be achieved through various methods such as follow-up surveys, interactive Q&A sessions, or informal discussions following presentations. Motivating stakeholders to express their opinions and inquiries not only promotes a culture of transparency but also yields valuable perspectives for enhancing future communications.
For instance, after presenting information, encouraging participants to summarize their main takeaways can highlight areas of clarity and confusion.
- Implement feedback tools: Utilize surveys or polls to collect immediate reactions and insights from your audience. Statistics indicate that organizations employing structured feedback mechanisms see a significant improvement in engagement and retention of information.
- Schedule follow-up discussions: Arrange sessions to address any lingering questions or concerns. This not only reinforces the material presented but also demonstrates a commitment to stakeholder input, reflecting the open-minded approach that is essential for effective leadership.
- Leverage RPA for efficiency: Consider how Robotic Process Automation (RPA) can streamline manual workflows, allowing your team to focus on strategic discussions that arise from feedback. This aligns with Creatum GmbH’s commitment to enhancing operational efficiency in a rapidly evolving AI landscape.
- Refine future presentations: Use the feedback gathered to enhance the quality and effectiveness of subsequent presentations. A case study from Celadon Trucking illustrates that by actively listening to employee feedback, they reduced attrition by 68%, highlighting the power of feedback in fostering a supportive environment. Furthermore, as Denise McLain, Senior Strategic Consultant at Gallup, states, “Build a development-focused culture that values feedback,” which is crucial for creating an environment where employees feel recognized and engaged. Additionally, the relationship between employee recognition and feedback is evident, as employees who feel unrecognized are more likely to seek new opportunities.
Integrating these strategies will not only enhance how to communicate data effectively but also reinforce connections with stakeholders, ensuring that their opinions are acknowledged and appreciated in the decision-making process. For further collaboration or inquiries, please feel free to reach out through our structured contact form. At Creatum GmbH, we are committed to hiring passionate technology professionals in a dynamic, supportive environment that offers competitive salaries and flexible schedules.
Measuring Communication Effectiveness: Metrics for Success
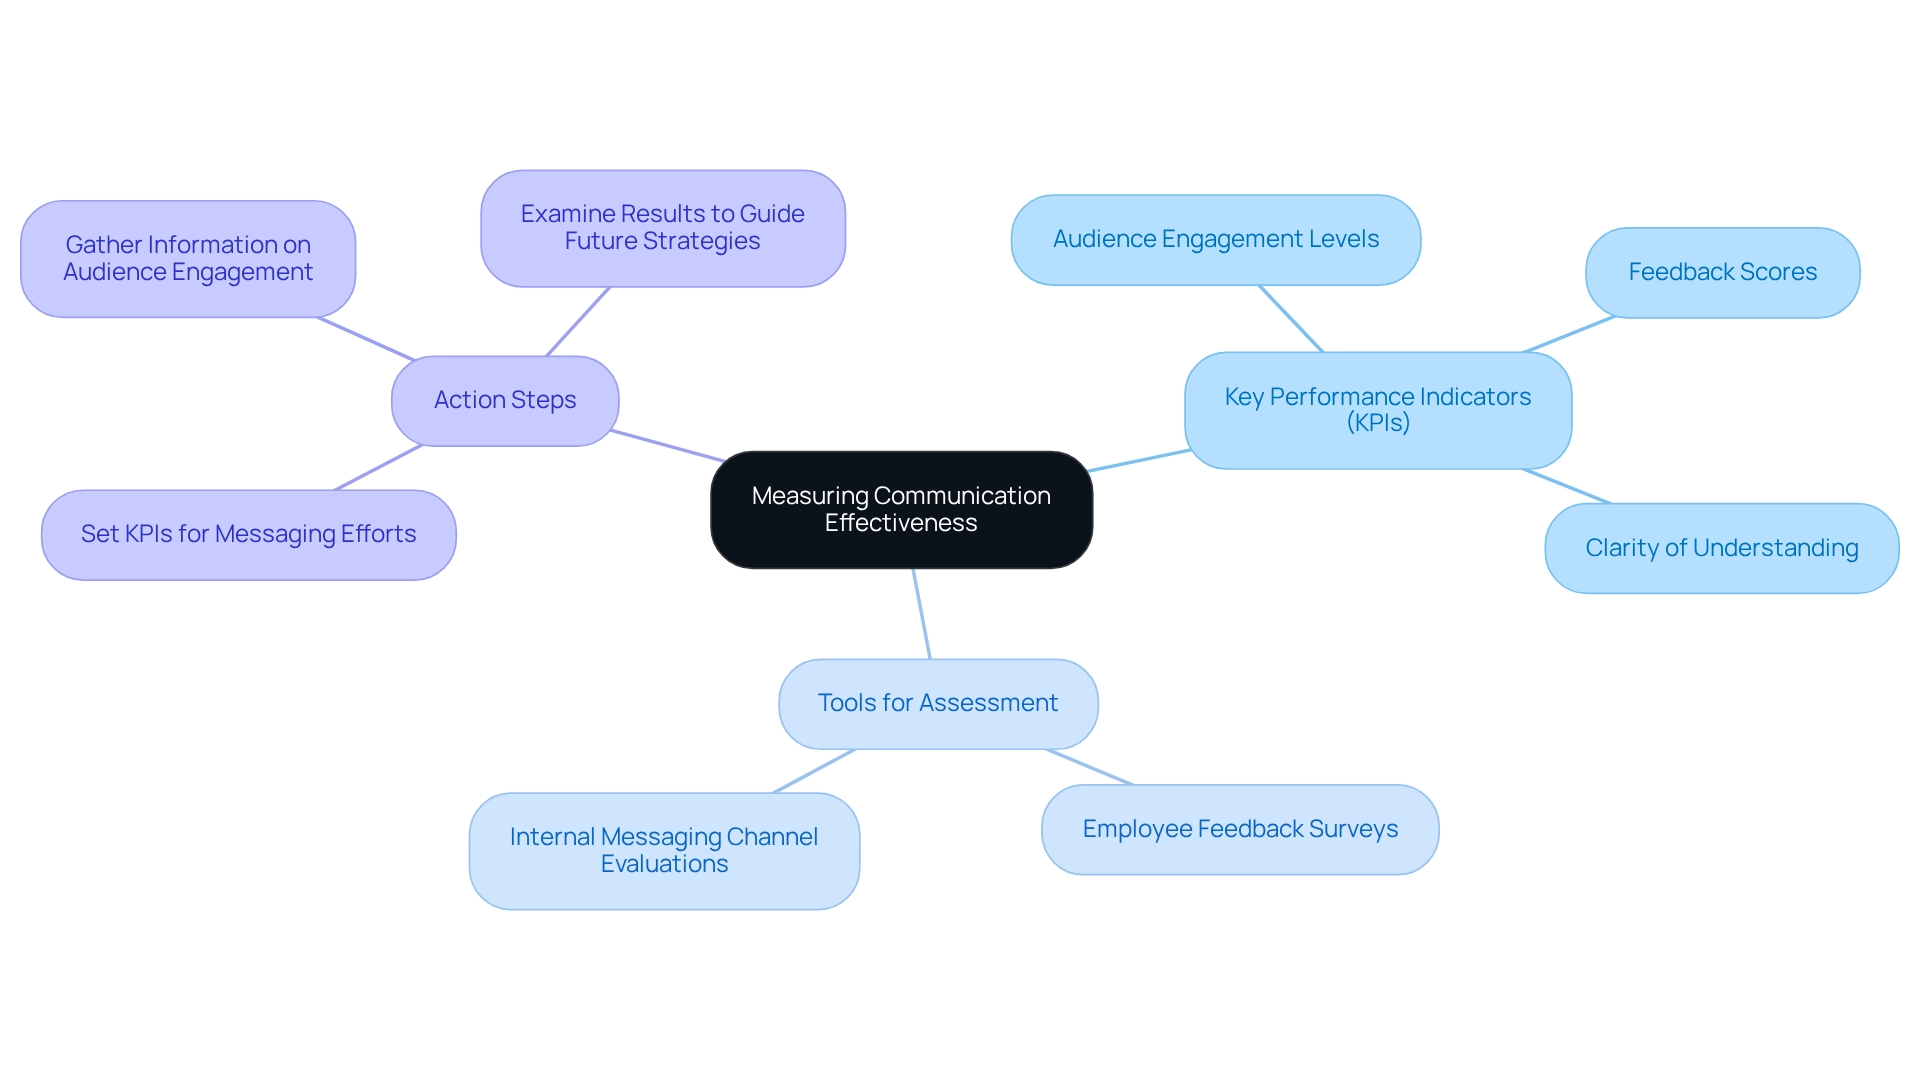
To measure the success of your data exchange, understanding how to communicate data effectively is essential. This begins with defining key performance indicators (KPIs) that align with your organizational goals. These KPIs may include metrics such as audience engagement levels, feedback scores, and clarity of understanding, which can be evaluated through follow-up surveys. For instance, organizations frequently employ tools like employee feedback surveys and internal messaging channel evaluations to assess the effectiveness of their messaging.
Such assessments provide valuable insights into employee perceptions and assist in enhancing interaction channels, ultimately leading to increased engagement and productivity. Regularly reviewing these metrics is crucial for learning how to communicate data effectively, identifying areas that require improvement. By analyzing audience engagement data, you can refine your communication strategies to assess how well your messages resonate with your team and make necessary adjustments. A recent study emphasized that highly engaged teams are more likely to attract top talent, underscoring the significance of effective interaction in nurturing a motivated workforce.
Furthermore, targeted messages can significantly boost engagement. As one expert remarked, “We can send specific messages solely to pilots, or in-flight tech ops, or airports, and also focus by city or region—slice and dice the content so it’s suitable for the team member.”
Additionally, the case study titled ‘Tools for Evaluating Interaction Effectiveness’ discusses various tools utilized by internal communicators to assess interaction effectiveness, including employee feedback surveys and internal messaging channel audits. Employing these tools enables organizations to gain insights into employee perceptions and enhance their interaction methods, resulting in greater engagement and productivity.
Action Steps:
- Set KPIs for your messaging efforts, concentrating on metrics that indicate engagement and comprehension.
- Gather information on audience engagement and feedback through surveys and audits.
- Examine results to guide future messaging strategies, ensuring they align with organizational priorities and improve overall business outcomes.
Overcoming Challenges: Strategies for Effective Data Communication
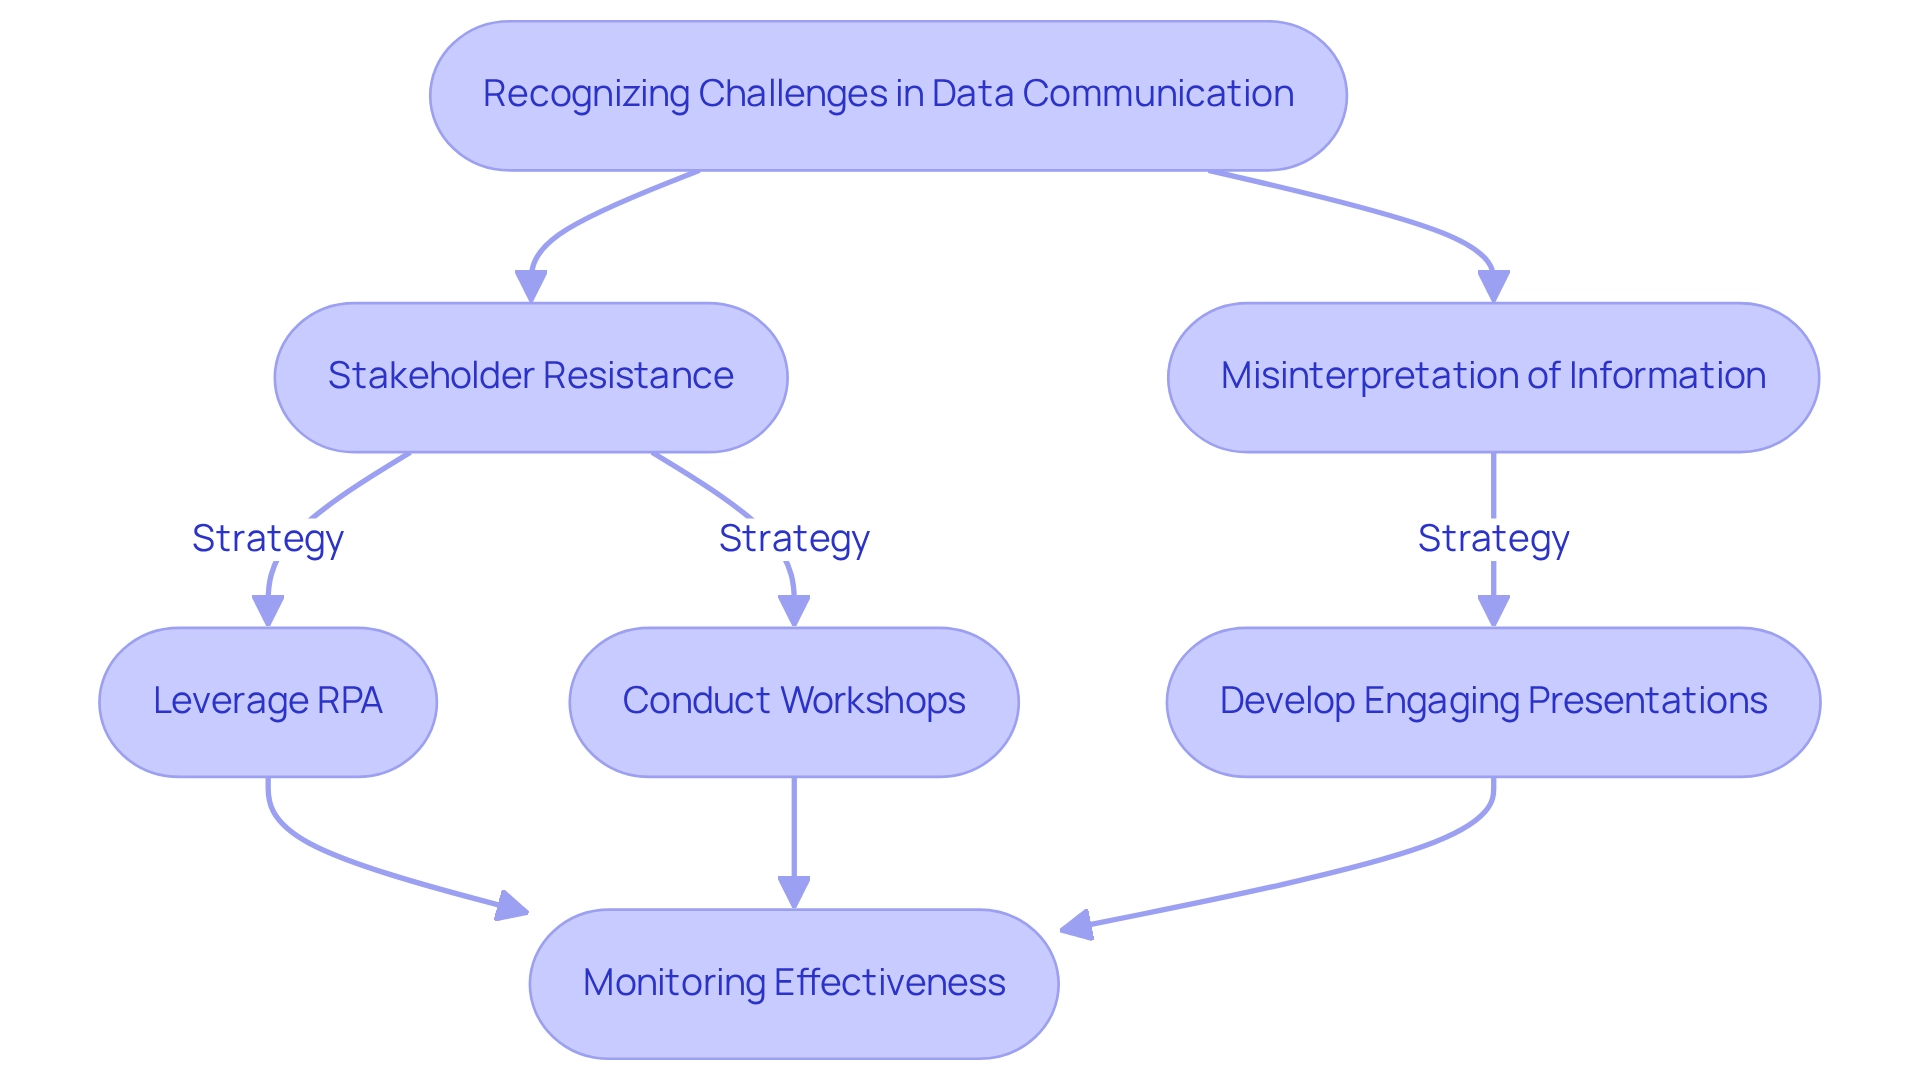
Recognizing common challenges in communicating data effectively is essential for improving operational efficiency. Stakeholders often resist new information initiatives due to a lack of understanding or fear of change. Additionally, misinterpretation of information leads to misguided choices and wasted resources.
To effectively address these challenges, organizations can implement targeted strategies, such as leveraging Robotic Process Automation (RPA) to automate manual workflows and enhance operational efficiency. RPA streamlines processes, reduces errors, and frees up teams for more strategic work, ultimately driving data-driven insights and operational efficiency for business growth.
Studies show that 40% of workers believe that understanding how to communicate data effectively greatly enhances team creativity and innovation, highlighting the significance of efficient information presentation. For instance, if stakeholders are reluctant to adopt new information initiatives, arranging workshops proves to be a useful strategy. These sessions illustrate the concrete advantages of information-driven decision-making and highlight user-friendly tools that ease interaction with information.
Moreover, developing captivating presentations that emphasize important findings can aid in understanding how to communicate data effectively, making intricate information sets more approachable and useful.
As noted by Spaulding Ridge, ‘99% of the clients Spaulding Ridge collaborates with struggle with isolated information,’ emphasizing the prevalent nature of communication challenges. Case studies reveal that organizations lacking dedicated information teams face significant hurdles in extracting actionable insights. The case study titled ‘Challenge 6: No Information Team‘ emphasizes the essential roles required for an information team and recommends collaboration with consulting firms.
By doing so, businesses can quickly assemble skilled professionals who enable smoother information exchange and implementation processes. This approach not only accelerates information initiatives but also alleviates the challenge of building an internal team from scratch.
To ensure the success of these strategies, it is essential to continuously monitor their effectiveness. Leveraging website analytics, email click-through rates, and intranet information can assist organizations in comprehending staff interactions and collecting feedback from stakeholders. Examining engagement metrics offers vital insights regarding the effects of training programs and outreach initiatives.
By cultivating a culture of information literacy and transparent communication, organizations can learn how to communicate data effectively, overcome resistance, and enhance their overall information communication strategies. At Creatum GmbH, we emphasize the importance of Business Intelligence in transforming raw data into actionable insights, enabling informed decision-making that drives growth and innovation.
Conclusion
Effective data communication is crucial for organizations striving to thrive in today’s information-saturated environment. By understanding audience preferences, organizations can tailor their messaging to resonate with different stakeholders—executives seeking high-level insights or technical teams needing detailed data. This targeted approach, combined with storytelling techniques, transforms raw data into compelling narratives that engage audiences and drive informed decision-making.
Clarity and simplicity play significant roles in effective data communication. Avoiding jargon and utilizing straightforward language makes data presentations more accessible to diverse audiences. Selecting the right visualizations enhances comprehension, making complex information easier to interpret. Implementing feedback loops ensures that communication efforts are continuously refined, fostering an environment where stakeholder input is valued and utilized.
Ultimately, measuring the effectiveness of data communication through defined metrics is essential for ongoing improvement. Establishing clear key performance indicators and regularly analyzing engagement data allows organizations to adapt their strategies to better meet audience needs. As businesses navigate the complexities of the digital landscape, mastering these communication strategies is not just beneficial; it is imperative for cultivating a culture of data-driven innovation and achieving long-term success. Embracing these principles empowers organizations to harness the full potential of their data, driving growth and fostering a more informed decision-making process.
Frequently Asked Questions
Why is understanding the audience important for effective information exchange?
Understanding the audience is crucial because it allows communicators to tailor their messages based on the audience’s roles, expertise, and interests, ensuring the information is relevant and comprehensible.
What are some effective methods to gather insights about the audience’s preferences?
Effective methods include conducting surveys or interviews to gather insights about the audience’s preferences and knowledge levels.
How does audience segmentation enhance presentations?
Audience segmentation enhances presentations by allowing communicators to categorize groups based on their information literacy and specific interests, leading to tailored communication strategies that improve relevance, engagement, and comprehension.
What role does Business Intelligence (BI) play in data communication?
Business Intelligence (BI) helps organizations transform raw data into actionable insights, facilitating informed decision-making that drives growth and innovation.
Can you provide an example of how effective data communication led to business success?
Yes, a multinational company optimized its digital ad placements using predictive models to forecast conversion rates, leading to a 30% reduction in unnecessary expenditures while enhancing overall ad performance.
What are the recommended action steps for evaluating preferences in information communication?
The recommended action steps are to analyze your audience through surveys or interviews, segment them based on data literacy and interests, and adjust your communication approach to suit each segment.
How can storytelling methods improve data presentations?
Storytelling methods can improve data presentations by embedding information within a narrative that outlines the issue, resolution, and effect, making statistics more relatable and impactful.
What are the key components of an effective narrative in presentations?
The key components include identifying the core message, creating a narrative arc that introduces the challenge, presents information, and concludes with implications, and utilizing visuals to support the narrative.
What impact do branded narratives have on audience trust and conversion rates?
Branded narratives can lead to a 4% increase in trust, which often translates into improved conversion rates.
How can effective corporate storytelling be characterized?
Effective corporate storytelling should be simple, structured, and considerate of the audience’s perspective, ensuring clarity and engagement.

