Overview
Mastering DAX window functions in Power BI is essential for enhancing reporting capabilities and conducting advanced data analysis. This skill empowers users to perform complex calculations such as:
- Running totals
- Moving averages
Understanding window functions like:
- INDEX
- OFFSET
- WINDOW
is crucial, as is grasping their applications and optimization techniques. These elements are key to transforming raw data into actionable insights that drive informed decision-making and operational efficiency.
Introduction
In the realm of data analytics, DAX (Data Analysis Expressions) window functions emerge as indispensable tools for unlocking deeper insights and enhancing reporting capabilities within Power BI. These powerful functions empower users to execute complex calculations across related rows, facilitating essential tasks such as running totals, moving averages, and data ranking. As organizations increasingly rely on data-driven decision-making, mastering DAX window functions is crucial for optimizing analysis and boosting operational efficiency.
With the introduction of advanced functions like INDEX, OFFSET, and WINDOW, users can navigate the complexities of their datasets with greater agility, ultimately driving growth and innovation. This article delves into the significance of DAX window functions, their practical applications, and strategies for overcoming common challenges. By doing so, it paves the way for enhanced data analysis in an ever-evolving digital landscape.
Understanding DAX Window Functions: Definition and Importance
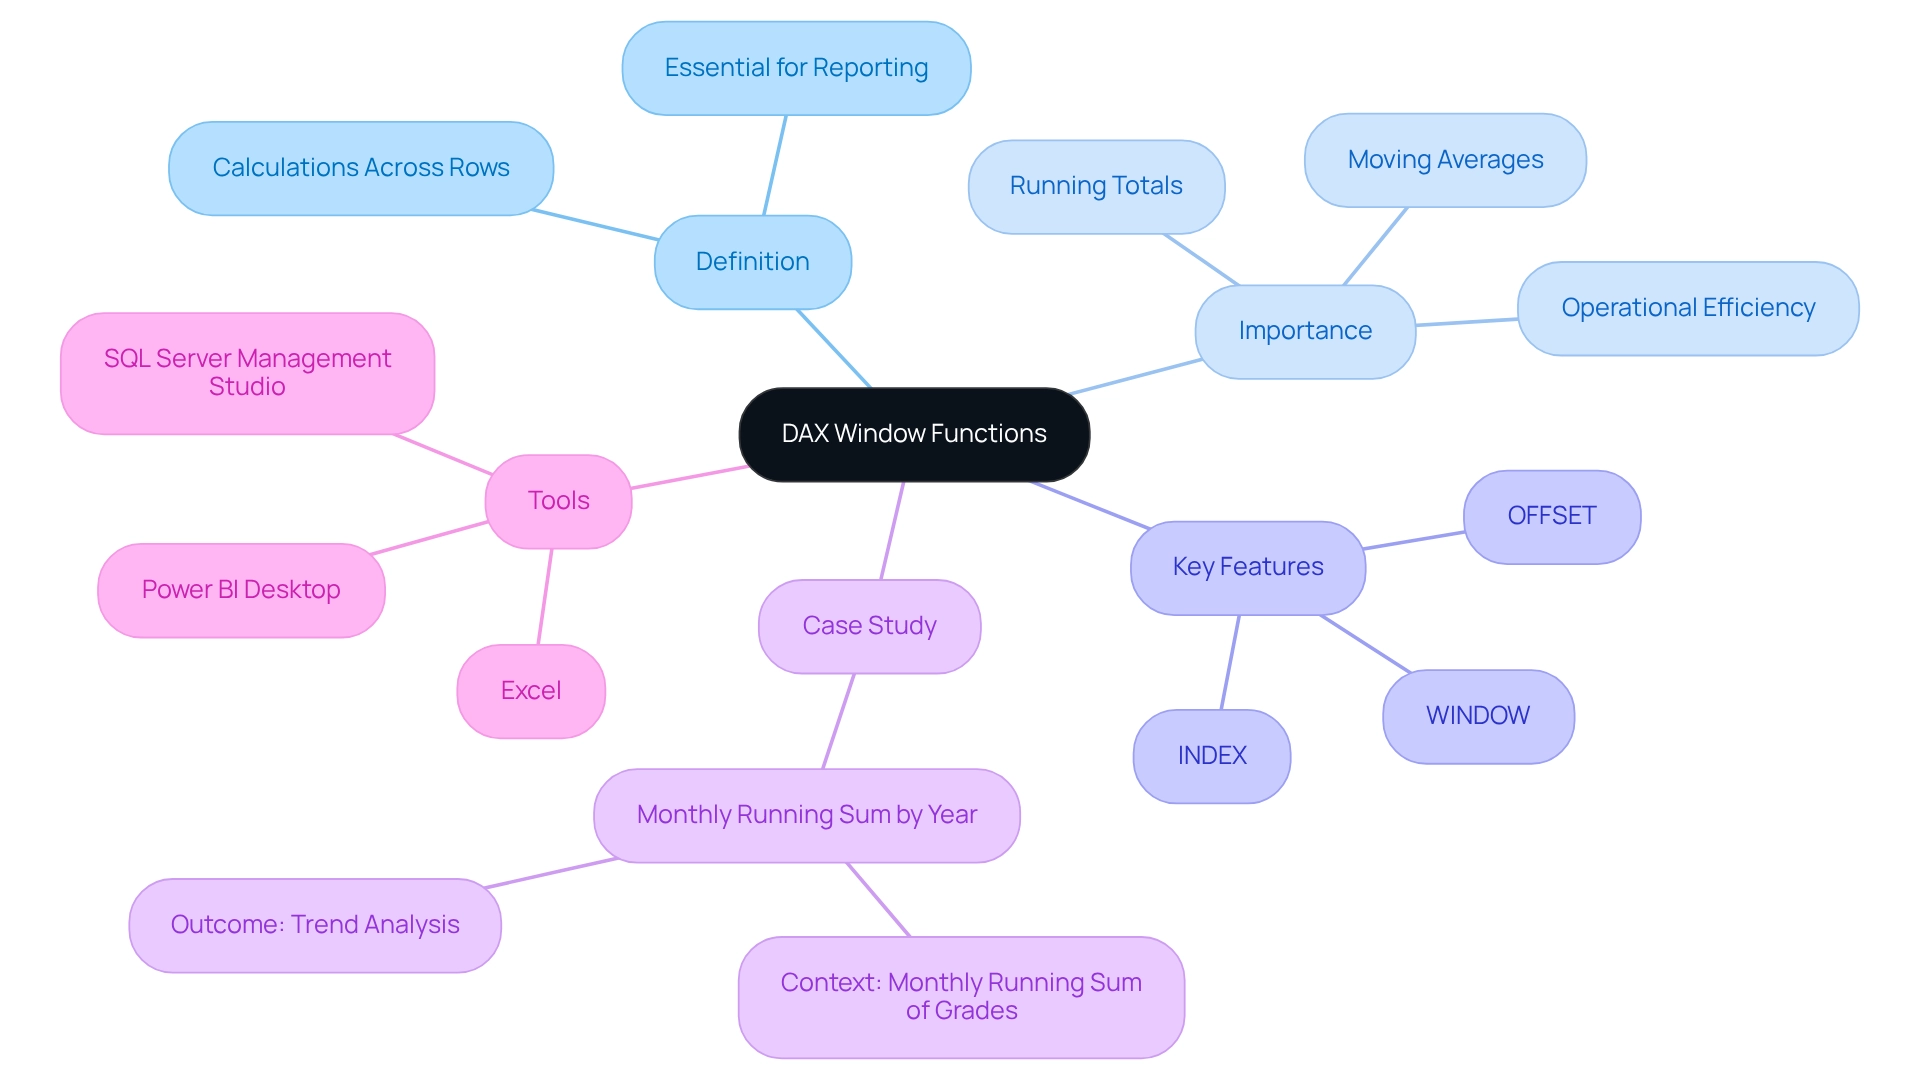
The DAX window function provides powerful capabilities that enable users to perform calculations across a group of rows related to the current row. This makes them essential for tasks such as computing running totals, moving averages, and ranking information. The introduction of advanced window features like INDEX, OFFSET, and WINDOW in Power BI has significantly enhanced the analytical capabilities of DAX, allowing users to derive deeper insights from their datasets with increased efficiency.
The significance of the DAX window function in Power BI is particularly pronounced for data analysis in 2025. These operations facilitate intricate calculations vital for precise reporting and informed decision-making. For instance, a recent case study on calculating a monthly running total of grades illustrates how these operations can reset at the beginning of each year, enabling effective trend analysis over time.
This capability not only supports fiscal reporting but also deepens the understanding of long-term performance trends. Organizations utilizing the DAX window function, such as Contoso, have reported substantial results, with sales figures reaching 2,000,000, underscoring the tangible advantages of efficient analysis.
Moreover, the benefits of employing DAX window function capabilities extend beyond basic calculations. They significantly enhance reporting efficiency by optimizing analysis processes, allowing teams to focus on strategic insights rather than manual data manipulation. Current statistics reveal that organizations leveraging the DAX window function experience a notable increase in operational efficiency, with many reporting improved information quality and actionable insights.
Tools like Power BI Desktop, Excel, and SQL Server Management Studio provide essential resources for crafting and managing DAX formulas, further empowering individuals in their analytical endeavors.
As the analytics landscape continues to evolve, staying informed about recent advancements in DAX window capabilities is crucial. Experts emphasize that the quality of insights derived from data is paramount, highlighting that it is not merely the volume of information that matters, but the ability to transform that information into meaningful knowledge. By mastering the DAX window function, Power BI users can elevate their analytical capabilities, driving growth and innovation within their organizations.
This aligns with our distinctive value proposition at Creatum GmbH, which is to deliver tailored solutions that enhance information quality and streamline AI implementation, ultimately assisting businesses in achieving their strategic objectives. Furthermore, our Power BI services, featuring the 3-Day Sprint for swift report generation and the General Management App for comprehensive oversight, are designed to address issues such as inconsistencies and governance, ensuring that decision-makers have access to clear, actionable insights.
Exploring Different Types of DAX Window Functions in Power BI
In Power BI, the primary DAX window functions are essential tools for data analysis, each serving distinct purposes:
-
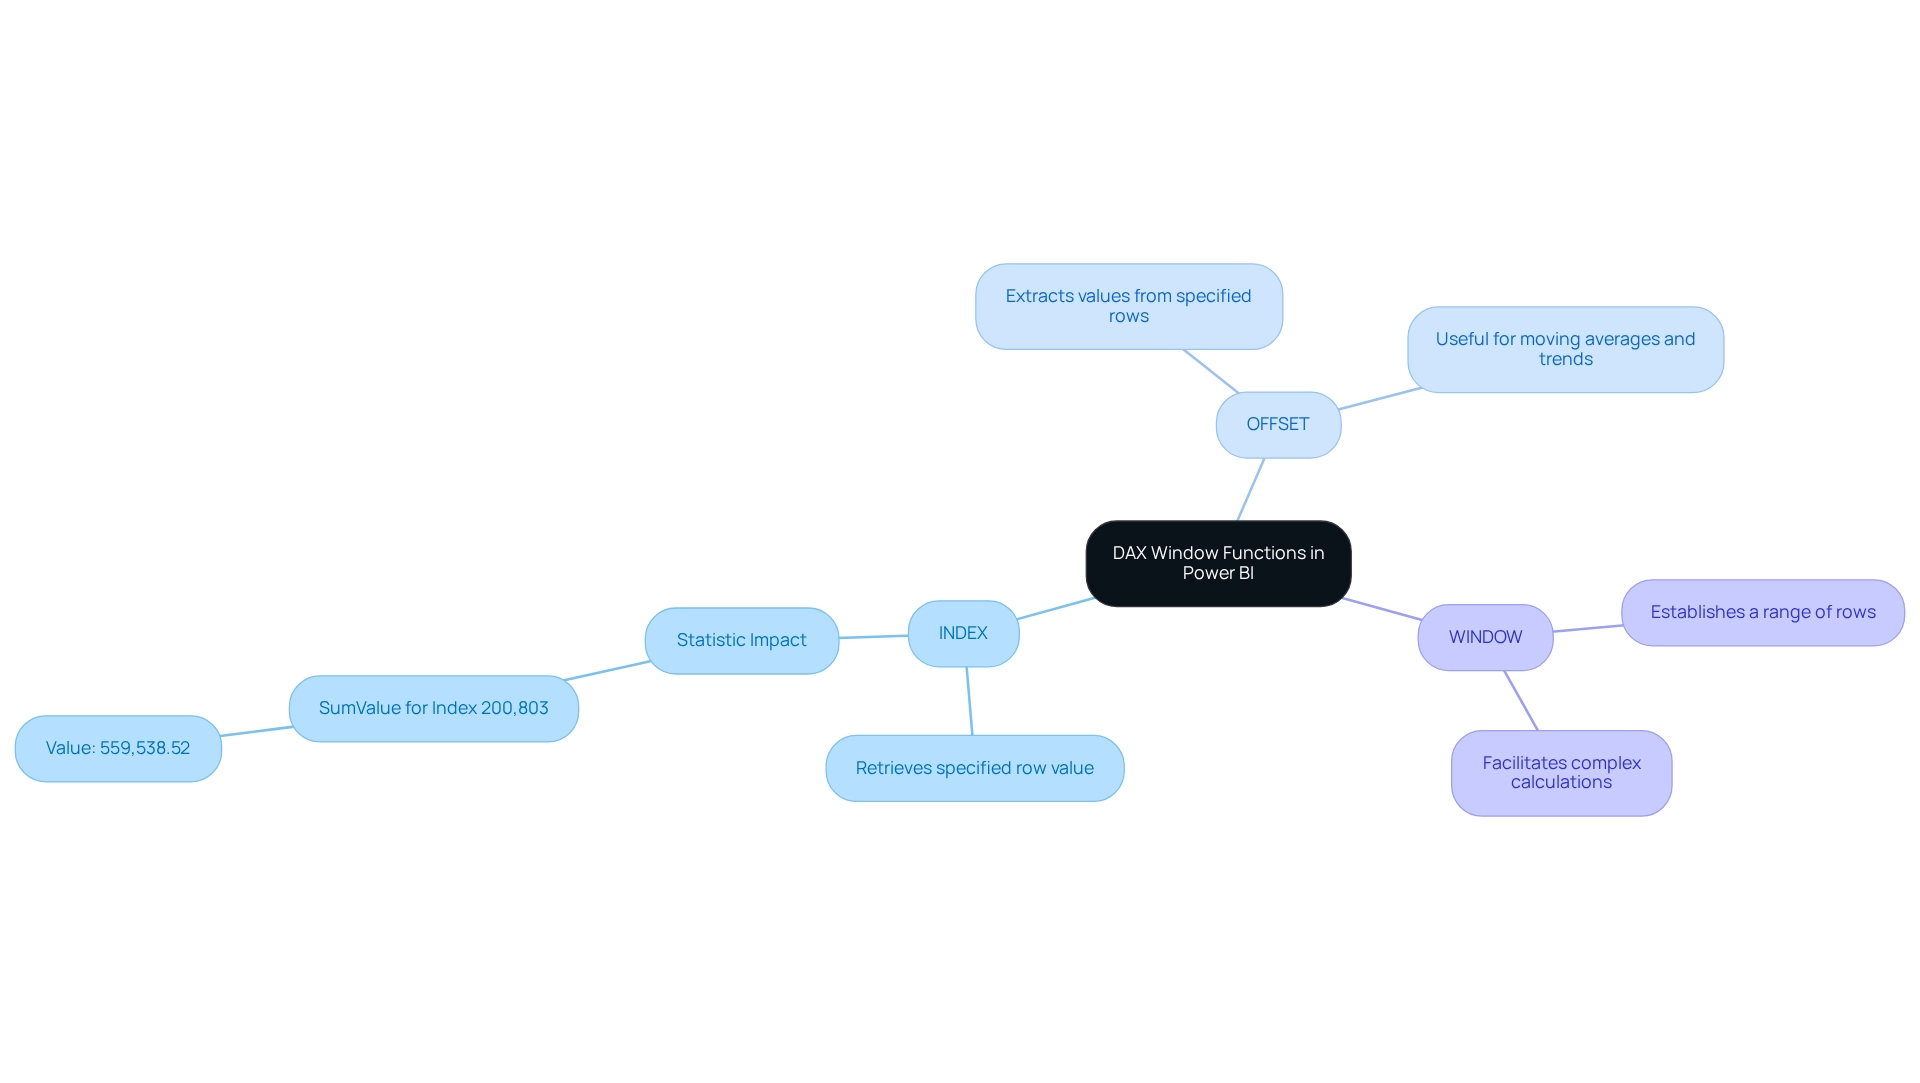
INDEX: This function retrieves the value of a specified row within a partitioned table, enabling users to access data relative to the current row. Its utility is especially clear in situations where accurate information referencing is essential for analysis. Significantly, the efficacy of the INDEX operation is underscored by a statistic indicating a SumValue for Index 200,803 at 559,538.52, showcasing its considerable influence on information retrieval.
-
OFFSET: The DAX window function OFFSET allows individuals to extract values from a specified number of rows before or after the current row. This feature is particularly advantageous for computing moving averages or recognizing trends over time, offering a dynamic perspective on fluctuations.
-
WINDOW: This DAX window function allows users to establish a range of rows within a specified partition, arranged by a defined order. This capability is invaluable for executing complex calculations that require context from multiple rows, facilitating deeper insights into information patterns.
These operations can be efficiently integrated to conduct advanced analyses, enhancing Power BI’s ability to convert raw information into actionable insights. As organizations increasingly encounter challenges such as time-consuming report creation, information inconsistencies, and a lack of actionable guidance, understanding and utilizing the DAX window function becomes crucial for driving growth and innovation.
The transformative impact of Creatum’s Power BI Sprint, as emphasized by Sascha Rudloff from PALFINGER, demonstrates how clients can accelerate their analysis and reporting success, ultimately resulting in a more efficient information-driven decision-making process. Sascha noted, “The outcomes of the Sprint surpassed our expectations and provided a considerable enhancement for our analysis strategy.”
Additionally, the case study titled “Business Intelligence Empowerment” illustrates how organizations can leverage these capabilities to convert raw information into practical insights, ultimately fostering growth and innovation.
Practical Applications: Implementing DAX Window Functions in Power BI
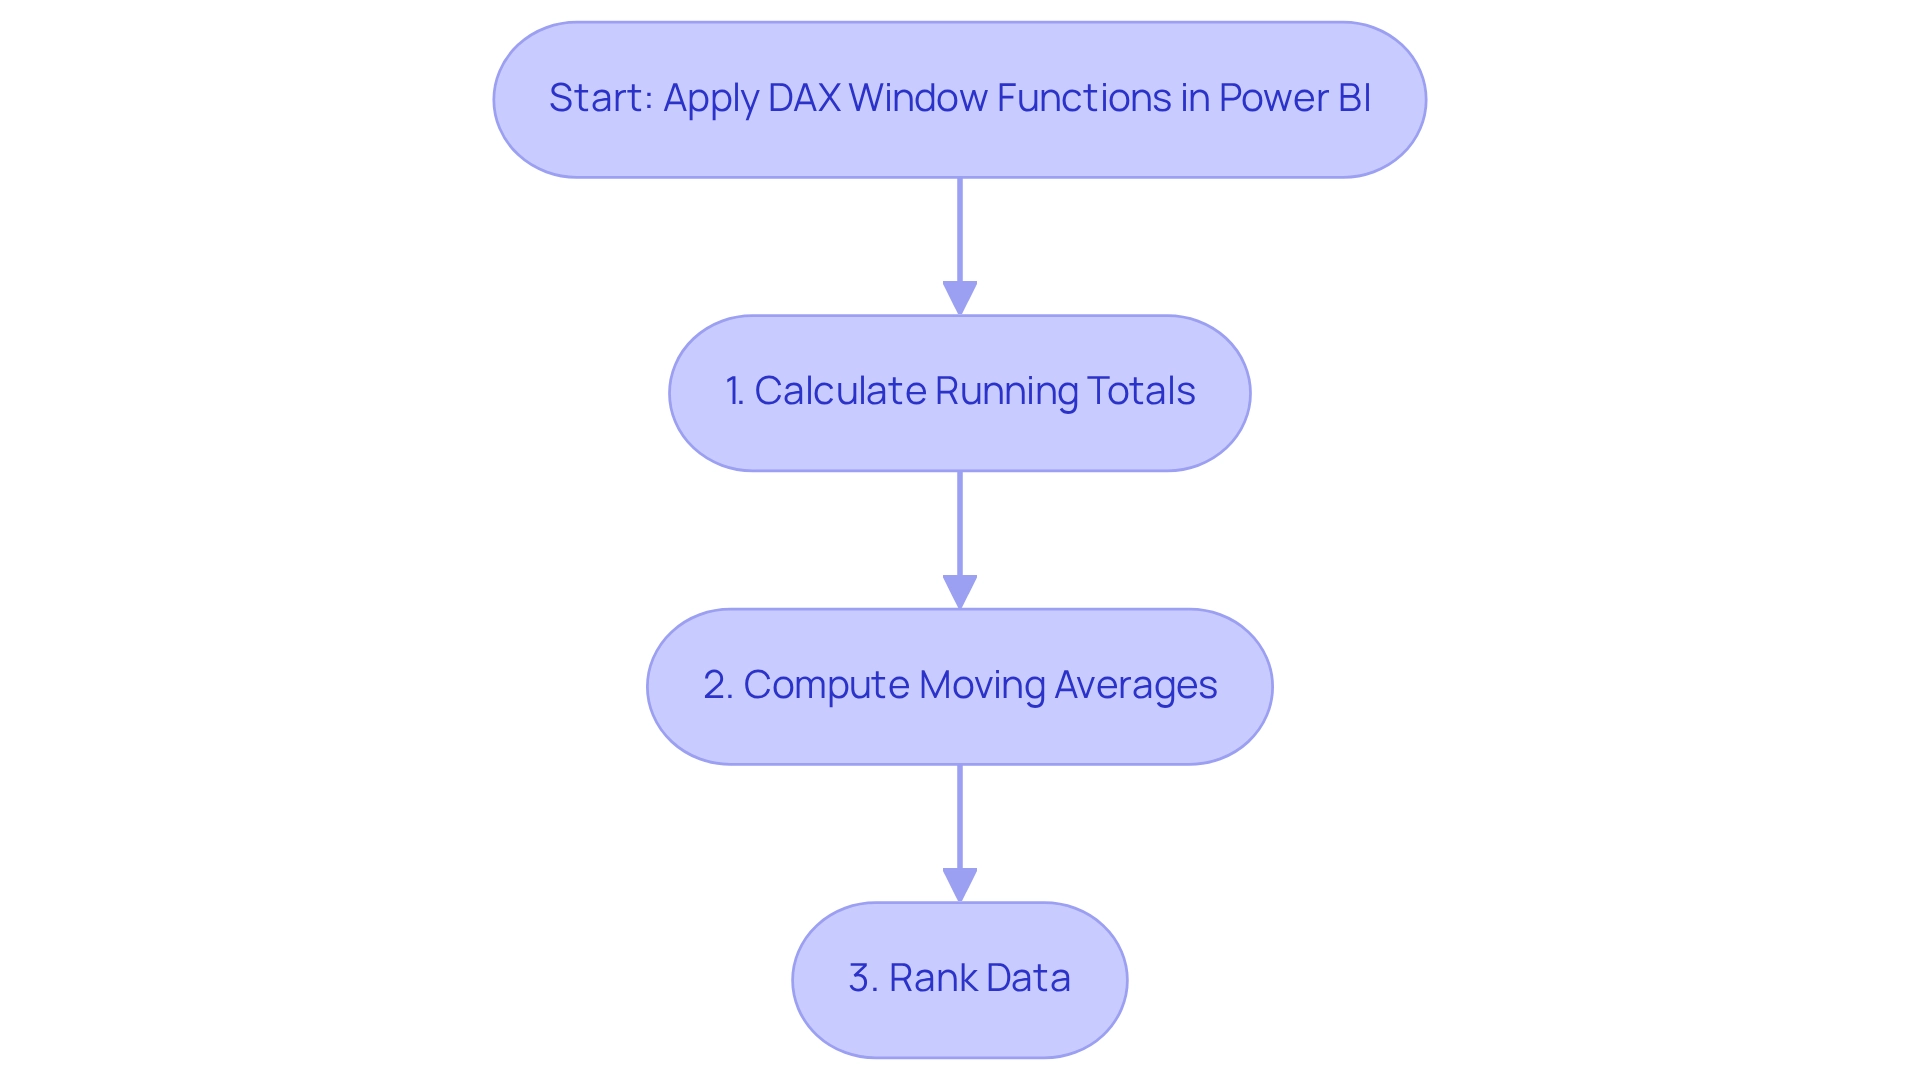
Applying the DAX window function can significantly enhance your Power BI reports by providing deeper insights and more dynamic analytics. This approach addresses common challenges such as time-consuming report generation and inconsistencies, particularly those arising from a lack of governance strategy. Consider these practical applications:
-
Calculating Running Totals: By leveraging the
CALCULATEandFILTERmethods alongside a time dimension, users can generate a running total of sales over time. This visualization of cumulative sales performance aids stakeholders in better forecasting and strategic planning, ultimately minimizing the time spent on manual report creation. -
Moving Averages: The
AVERAGEXformula is instrumental in computing moving averages, which smooth out data variations and reveal underlying trends over specified periods. This technique is invaluable for identifying seasonal patterns and making informed decisions based on historical performance. For instance, a recent calculation of a rolling average of sales figures with a window size of 3 highlighted how this method can provide a clearer perspective on sales trends, thereby enhancing the actionable insights available to stakeholders. -
Ranking Data: The
RANKXmethod enables users to rank products or categories based on sales figures or other metrics. This functionality empowers companies to quickly identify top performers and areas needing improvement, fostering targeted strategies for growth and addressing discrepancies in reporting.
To execute these operations effectively, users can create calculated columns or measures in Power BI, utilizing the DAX window function to specify their calculations. This approach not only enhances report insights but also simplifies the analysis process, allowing teams to focus on strategic initiatives rather than manual data handling.
Real-world applications of these DAX functions have proven their effectiveness in improving business reporting. Companies that have integrated running totals and moving averages into their dashboards report greater clarity in performance tracking and decision-making. As Sharin Fritz noted, “For information engineering & analytics, these take-home assignments we were doing ourselves are a bit time-consuming, so we wanted to automate that.”
This statement underscores the importance of efficiency in information analysis, especially in rapidly growing enterprises like Daraz.pk, which has expanded significantly since its inception in 2012 and currently employs between 51-200 individuals. By adopting these techniques, organizations can transform their data into actionable insights, driving operational efficiency and leveraging Business Intelligence for sustained growth. Creatum GmbH is dedicated to assisting businesses in navigating these challenges effectively.
Common Challenges and Solutions When Using DAX Window Functions
DAX window functions provide substantial capabilities, yet users frequently encounter challenges that can undermine their effectiveness.
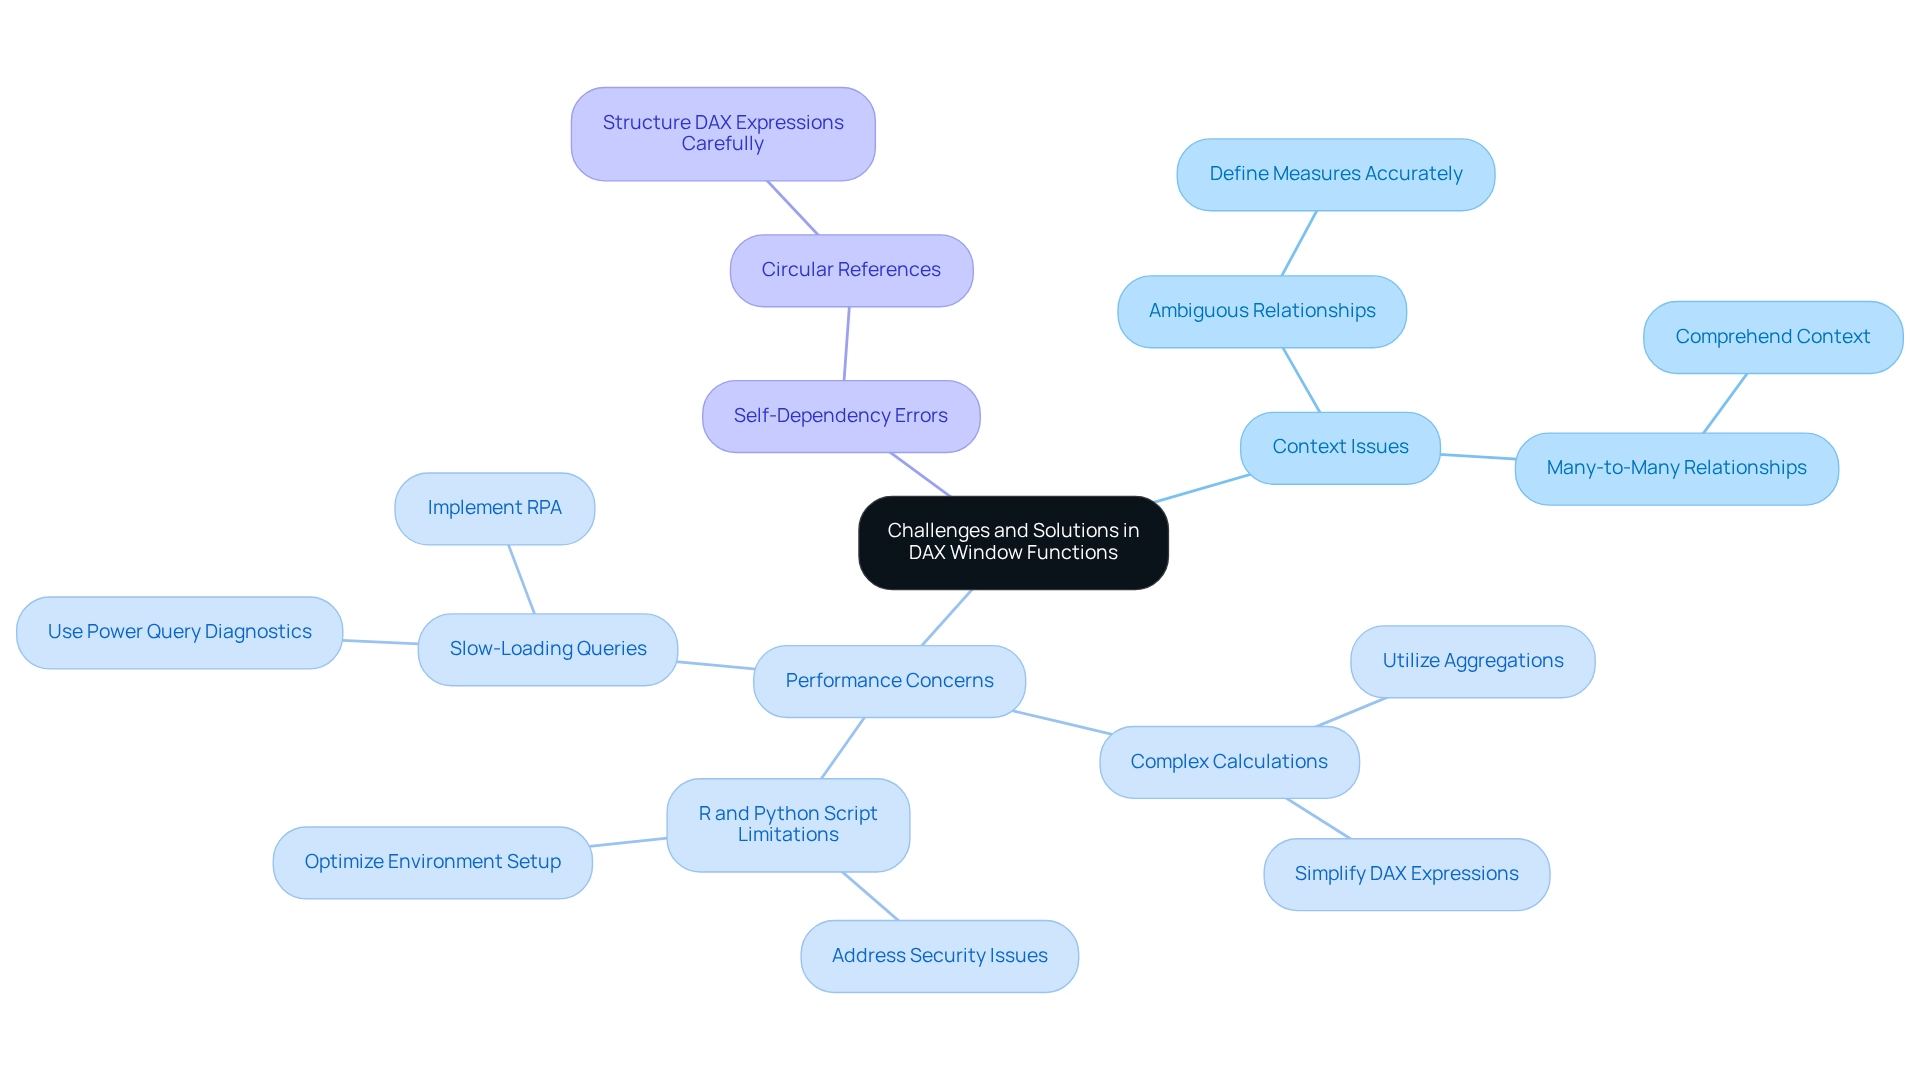
Context Issues: DAX operates within a specific filter context, potentially leading to unexpected results if not properly managed. Statistics reveal that ambiguous relationships or many-to-many relationships often result in incorrect outcomes, underscoring the necessity of managing context diligently. To mitigate these issues, it is essential to define measures accurately and fully comprehend the context in which they function. This understanding is vital to prevent skewed results, particularly in complex data models.
Performance Concerns: The application of complex calculations with window functions can negatively impact report performance. Statistics indicate that intricate DAX expressions may cause slower report loading times, particularly when many-to-many relationships are present. Moreover, executing R and Python scripts in Power BI is limited to individuals with personal gateways, which can hinder performance and introduce security and environmental setup challenges. To enhance efficiency, consider simplifying DAX expressions or utilizing aggregations where feasible. Implementing Power Query’s Diagnostics feature can help identify slow-loading queries. For instance, advanced troubleshooting methods can uncover inefficiencies, enabling individuals to take corrective actions to improve report speed. By integrating Robotic Process Automation (RPA), organizations can streamline workflows, minimizing the time spent on manual report creation and allowing teams to concentrate on strategic analysis. Furthermore, tailored AI solutions can assist in optimizing DAX calculations and automating data preparation processes, effectively addressing performance concerns.
Self-Dependency Errors: Functions such as INDEX may lead to self-dependency errors if they reference themselves within the calculation. To resolve these issues, it is crucial to structure DAX expressions to avoid circular references. This careful structuring not only prevents errors but also enhances the overall reliability of calculations.
As v-rzhou-msft noted, “According to your statement, I think you want to develop a report by Power BI. Here I will give you some suggestions.” By acknowledging these prevalent challenges and applying the proposed solutions—including leveraging Business Intelligence for informed decision-making and customized AI solutions to enhance DAX performance—users can navigate the complexities of DAX window function operations more efficiently, ultimately improving their reporting capabilities in Power BI.
Performance Optimization: Enhancing Efficiency with DAX Window Functions
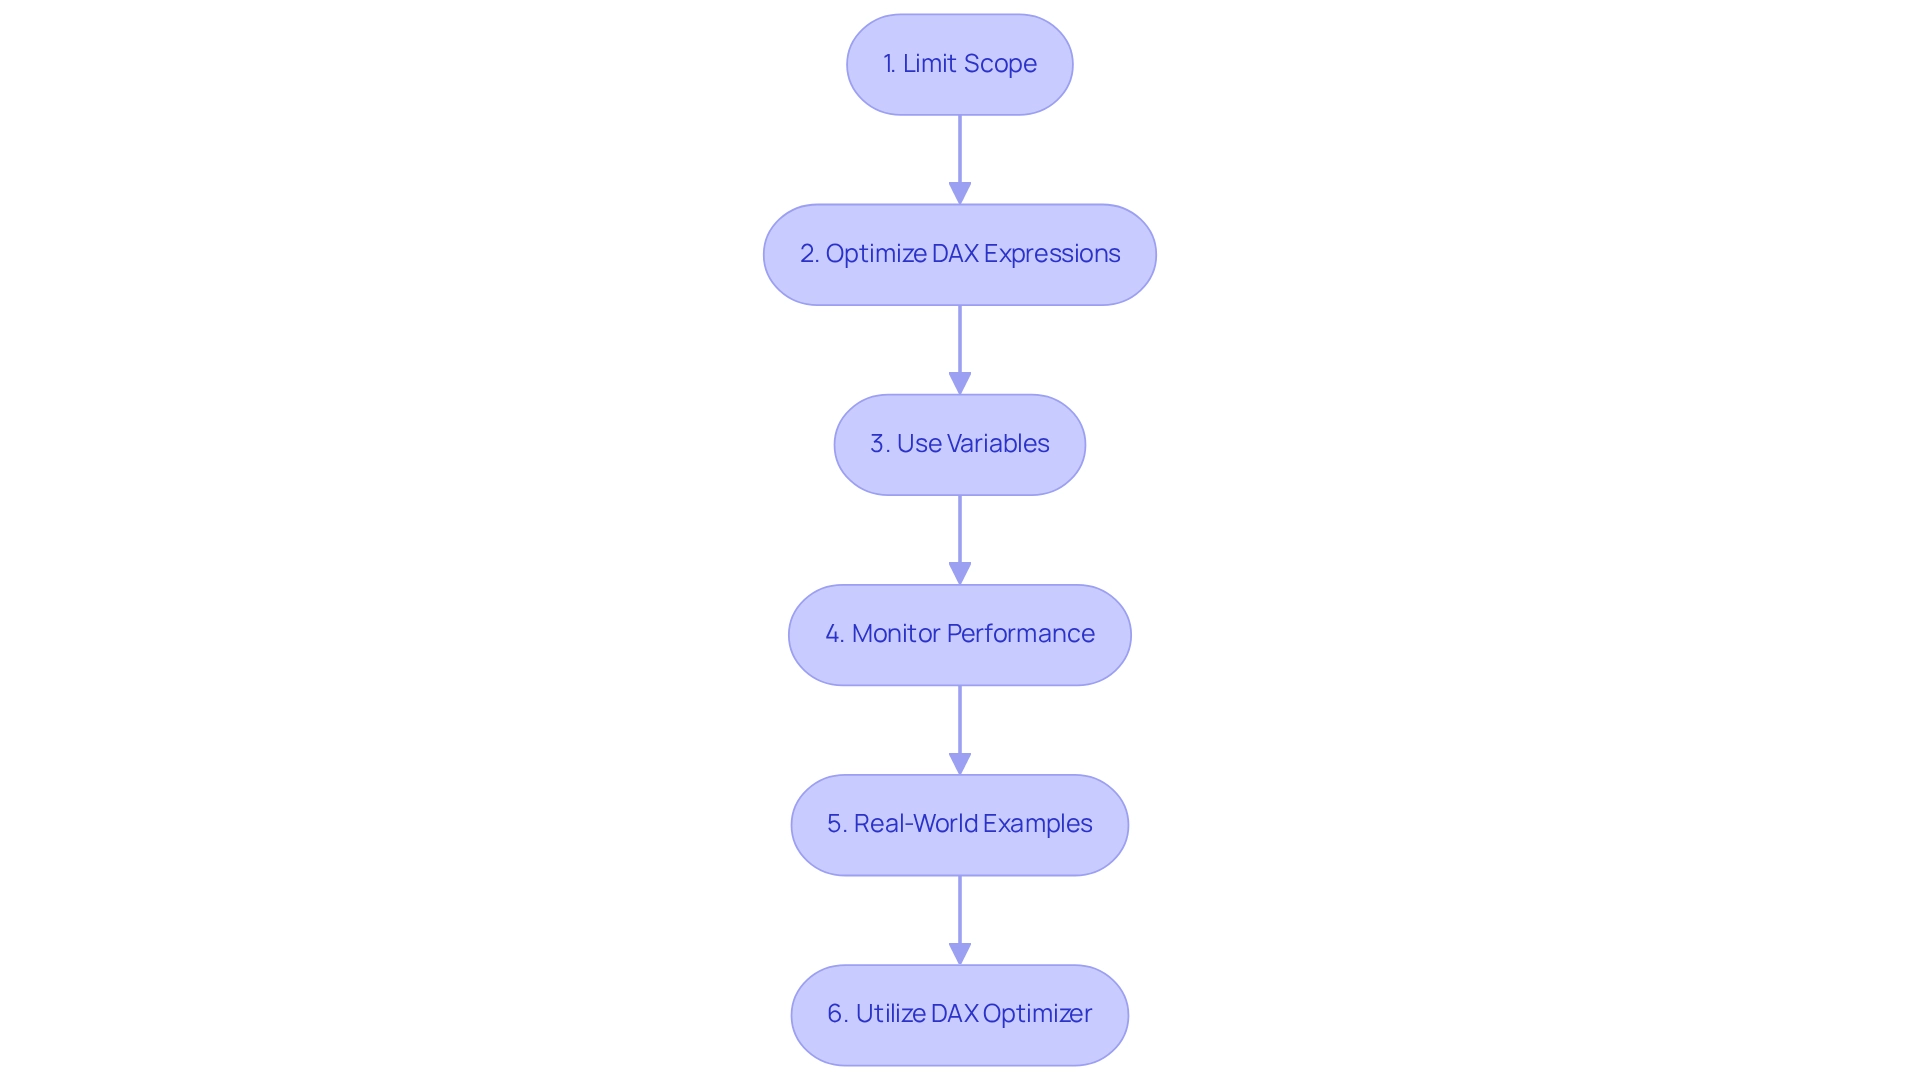
To significantly enhance the performance of the DAX window function in Power BI while leveraging Robotic Process Automation (RPA) for operational efficiency, consider implementing the following strategies:
-
Limit the Scope: By applying filters to restrict the information processed by your DAX expressions, you can effectively reduce the computational load. This approach not only streamlines calculations but also enhances overall report performance.
-
Optimize DAX Expressions: Simplifying complex DAX formulas by breaking them into smaller, more manageable components can lead to improved readability and performance. As the AccountingInsights Team notes, choosing between calculated columns and measures is critical in DAX, as it impacts both performance and functionality. This practice allows for easier debugging and maintenance, which is crucial for long-term efficiency.
-
Use Variables: Incorporating variables within your DAX calculations to store intermediate results can significantly boost performance. This technique not only enhances execution speed but also contributes to cleaner, more understandable code, making it easier for teams to collaborate and innovate.
-
Monitor Performance: Leverage Power BI’s performance analyzer to identify slow-running queries. By pinpointing these bottlenecks, you can optimize them effectively, ensuring that your reports remain responsive and efficient, even when handling large datasets. Understanding DAX engine behavior and avoiding row-by-row iterations can further enhance the speed and maintainability of your reports. RPA can assist in monitoring these performance metrics in real-time, providing actionable insights for continuous improvement.
-
Real-World Examples: Consider case studies that demonstrate the impact of these strategies. For example, the accessible interface created for DAX optimizations aids straightforward implementation, promoting wider adoption of the tool and allowing more individuals to utilize DAX optimizations efficiently. Incorporating RPA into these case studies can demonstrate how automation has revolutionized information management and reporting procedures.
-
Utilize DAX Optimizer: For those new to DAX, the DAX Optimizer can be a valuable tool to quickly improve proficiency and understanding of best practices. Combined with RPA, this tool can simplify the learning process, enabling users to concentrate on strategic insights instead of manual information manipulation.
By utilizing these optimization techniques and leveraging RPA, users can ensure their Power BI reports are not only efficient but also capable of providing actionable insights quickly, thereby supporting informed decision-making in an information-rich environment.
Advanced Techniques for Mastering DAX Window Functions
To effectively master DAX window functions in Power BI, consider implementing the following advanced techniques:
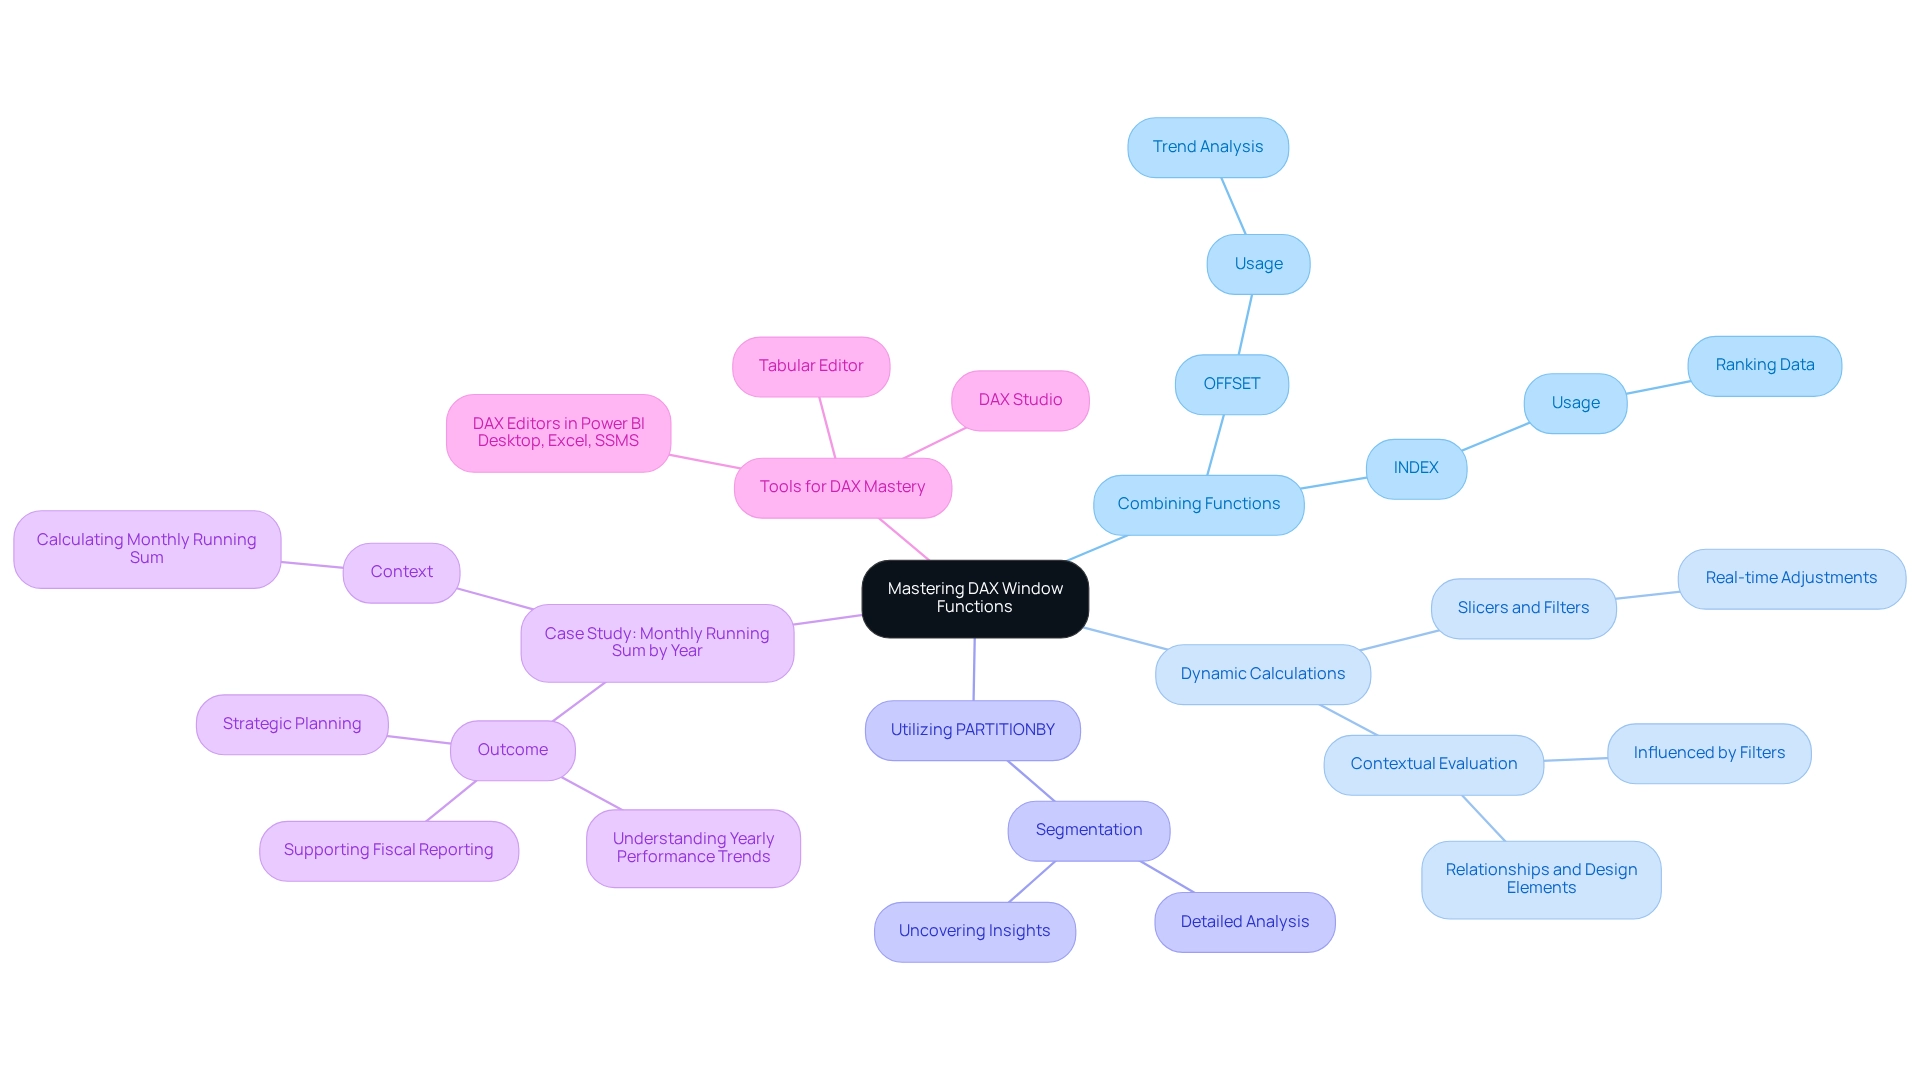
- Combining Functions: Utilize multiple window functions in tandem to develop intricate calculations. For instance, pairing
OFFSETwithINDEXallows for a comprehensive analysis of trends over time while simultaneously ranking data, providing a multifaceted view of performance metrics. This approach is particularly useful in performance measurement, as illustrated by Anna, who scored 93, showcasing how DAX can quantify and analyze results effectively. - Dynamic Calculations: Create dynamic measures that adjust according to interactions within reports. This can be accomplished by integrating slicers and filters into your DAX expressions, enabling real-time adjustments that reflect user selections and enhance the interactivity of your dashboards. Remember that formulas can be assessed in various contexts, shaped by filters, relationships, and design elements, which is essential for precise information representation.
- Utilizing PARTITIONBY: When using the
WINDOWoperation, thePARTITIONBYclause is invaluable for segmenting your information into relevant groups. This segmentation facilitates more detailed analysis, allowing you to uncover insights that may be obscured in a broader dataset.
These advanced techniques not only enhance your analytical skills within Power BI but also enable you to derive deeper insights from your information. For example, a case study on calculating a monthly running sum of grades illustrates how these techniques can be applied to track performance trends over time, supporting strategic planning and fiscal reporting. As noted by Mirko Peters, “They provide a way to perform advanced analytics and calculations without the need for complex subqueries or multiple database queries.”
By mastering the DAX window function operations, you can significantly improve your analysis skills and promote informed decision-making. Additionally, tools like DAX Studio and Tabular Editor, along with DAX editors in Power BI Desktop, Excel, and SQL Server Management Studio (SSMS), are available to assist you in implementing these techniques effectively.
Key Takeaways: Mastering DAX Window Functions for Enhanced Power BI Reporting
Mastering the DAX window function is essential for Power BI professionals aiming to enhance their reporting capabilities and fully leverage the potential of Business Intelligence. Here are the main takeaways:
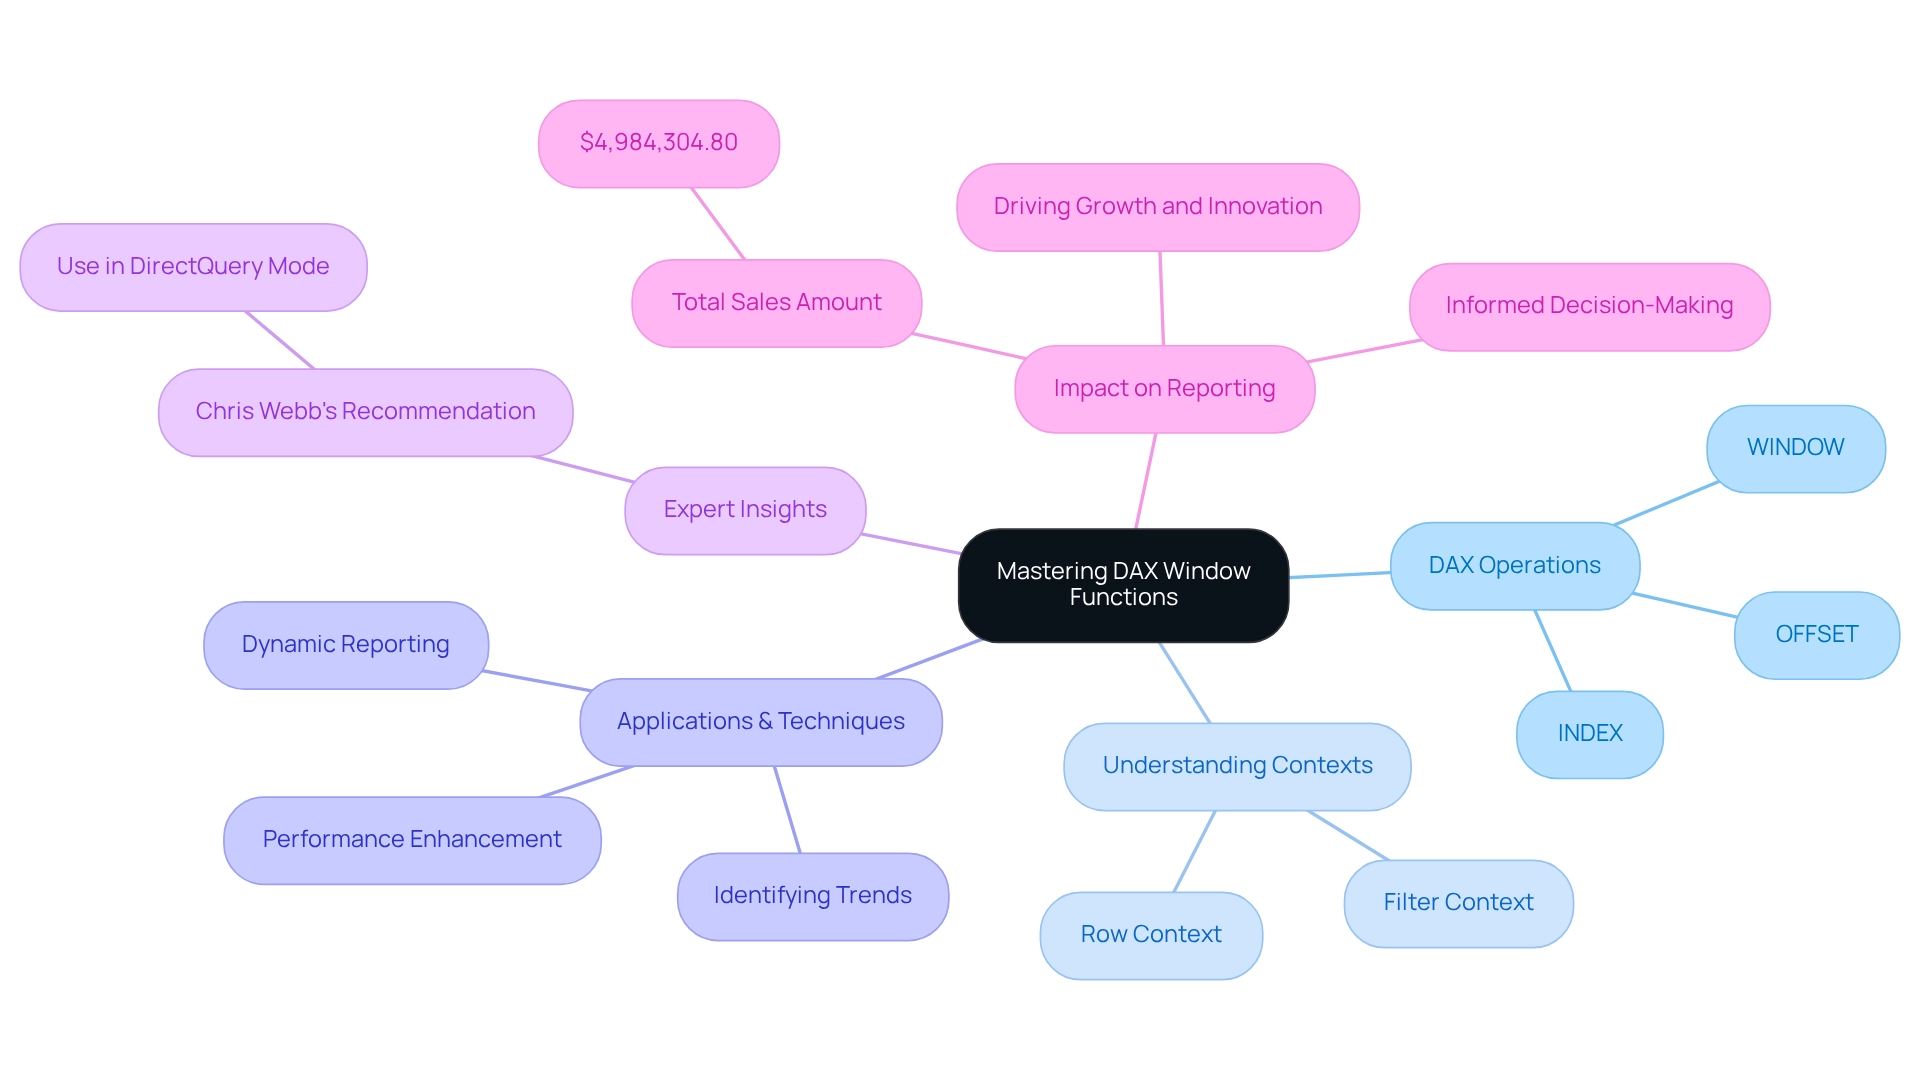
- DAX window operations such as
INDEX,OFFSET, andWINDOWserve as powerful tools for advanced data analysis. They enable users to perform intricate calculations and derive deeper insights from their datasets. DAX operates on tables and columns rather than individual cells, utilizing two types of context: Row Context and Filter Context. Understanding these contexts is crucial for effectively employing these operations. - A comprehensive grasp of the various types of window operations and their specific applications is vital for successful implementation. This knowledge allows individuals to tailor their analyses to meet particular business needs, aligning with the customized AI solutions from Creatum GmbH that navigate the extensive market options. Being aware of common challenges associated with the DAX window function, along with performance enhancement techniques, can help users avoid potential pitfalls and increase the effectiveness of their reports. For instance, optimizing calculations can lead to significant improvements in report loading times and responsiveness, which are critical for operational efficiency. Advanced techniques utilizing the DAX window function can unveil new analytical opportunities, fostering more dynamic reporting and enabling users to identify trends and patterns that support informed decision-making. As highlighted in the case study ‘Business Intelligence Empowerment,’ transforming raw data into actionable insights through effective DAX application drives growth and innovation.
- Practically speaking, the total sales amount calculated using DAX was 4,984,304.80, illustrating the tangible impact of effective DAX application on business performance.
- Chris Webb, a member of the Fabric CAT team at Microsoft, advocates for using window methods in DirectQuery mode, whether aggregations are present or not, offering valuable expert insights on DAX window methods.
By leveraging these insights, users can significantly enhance their Power BI reports, ultimately leading to better business decisions and fostering a culture driven by information within their organizations. As the landscape of data analytics evolves, staying informed about current trends in the use of the DAX window function will be essential for maximizing reporting effectiveness in 2025 and beyond. Additionally, understanding how to navigate the complex AI landscape will empower the Director of Operations Efficiency to implement effective BI practices that drive operational success.
Conclusion
Mastering DAX window functions is essential for enhancing reporting capabilities and unlocking the full potential of Business Intelligence within Power BI. These powerful tools, including functions like INDEX, OFFSET, and WINDOW, enable users to perform complex calculations across related rows, facilitating deeper insights and more dynamic data analysis. Understanding how to effectively utilize these functions, along with their specific applications, is crucial for tailoring analyses to meet unique business needs.
Moreover, awareness of common challenges and performance optimization techniques can significantly improve the efficiency of reports. By simplifying calculations and leveraging advanced techniques, users can uncover valuable trends and patterns that inform strategic decision-making. The real-world impact of implementing DAX window functions is evident, with organizations experiencing enhanced operational efficiency and clearer insights into their data.
As the landscape of data analytics continues to evolve, staying current with advancements in DAX window functions will be vital for maximizing reporting effectiveness. Embracing these tools not only supports informed decision-making but also fosters a data-driven culture that drives growth and innovation within organizations. Ultimately, mastering DAX window functions positions users to navigate the complexities of data analysis, ensuring they remain competitive in an increasingly data-centric world.
Frequently Asked Questions
What is the DAX window function and its significance in Power BI?
The DAX window function allows users to perform calculations across a group of rows related to the current row, essential for tasks like computing running totals, moving averages, and rankings. Its significance in Power BI is particularly pronounced for data analysis in 2025, facilitating intricate calculations vital for precise reporting and informed decision-making.
What are the primary DAX window functions in Power BI?
The primary DAX window functions in Power BI are INDEX, OFFSET, and WINDOW. INDEX retrieves the value of a specified row within a partitioned table, OFFSET extracts values from a specified number of rows before or after the current row, and WINDOW establishes a range of rows within a specified partition, allowing for complex calculations.
How does the DAX window function enhance reporting efficiency?
The DAX window function enhances reporting efficiency by optimizing analysis processes, allowing teams to focus on strategic insights rather than manual data manipulation. Organizations leveraging this function report improved operational efficiency and better information quality.
Can you provide an example of how the DAX window function is used in practice?
A case study on calculating a monthly running total of grades illustrates how DAX window functions can reset at the beginning of each year, enabling effective trend analysis over time and supporting fiscal reporting.
What tools are essential for using DAX window functions?
Essential tools for crafting and managing DAX formulas include Power BI Desktop, Excel, and SQL Server Management Studio. These tools empower users in their analytical endeavors.
How does mastering the DAX window function benefit organizations?
Mastering the DAX window function allows Power BI users to elevate their analytical capabilities, driving growth and innovation within organizations by transforming data into meaningful insights.
What is the role of Creatum GmbH in enhancing DAX window function capabilities?
Creatum GmbH delivers tailored solutions that enhance information quality and streamline AI implementation, assisting businesses in achieving their strategic objectives through services like the 3-Day Sprint for swift report generation and the General Management App for oversight.
