Overview
This article delves into the distinctions between calculated columns and measures in Power BI, highlighting their unique functionalities and applications in data analysis.
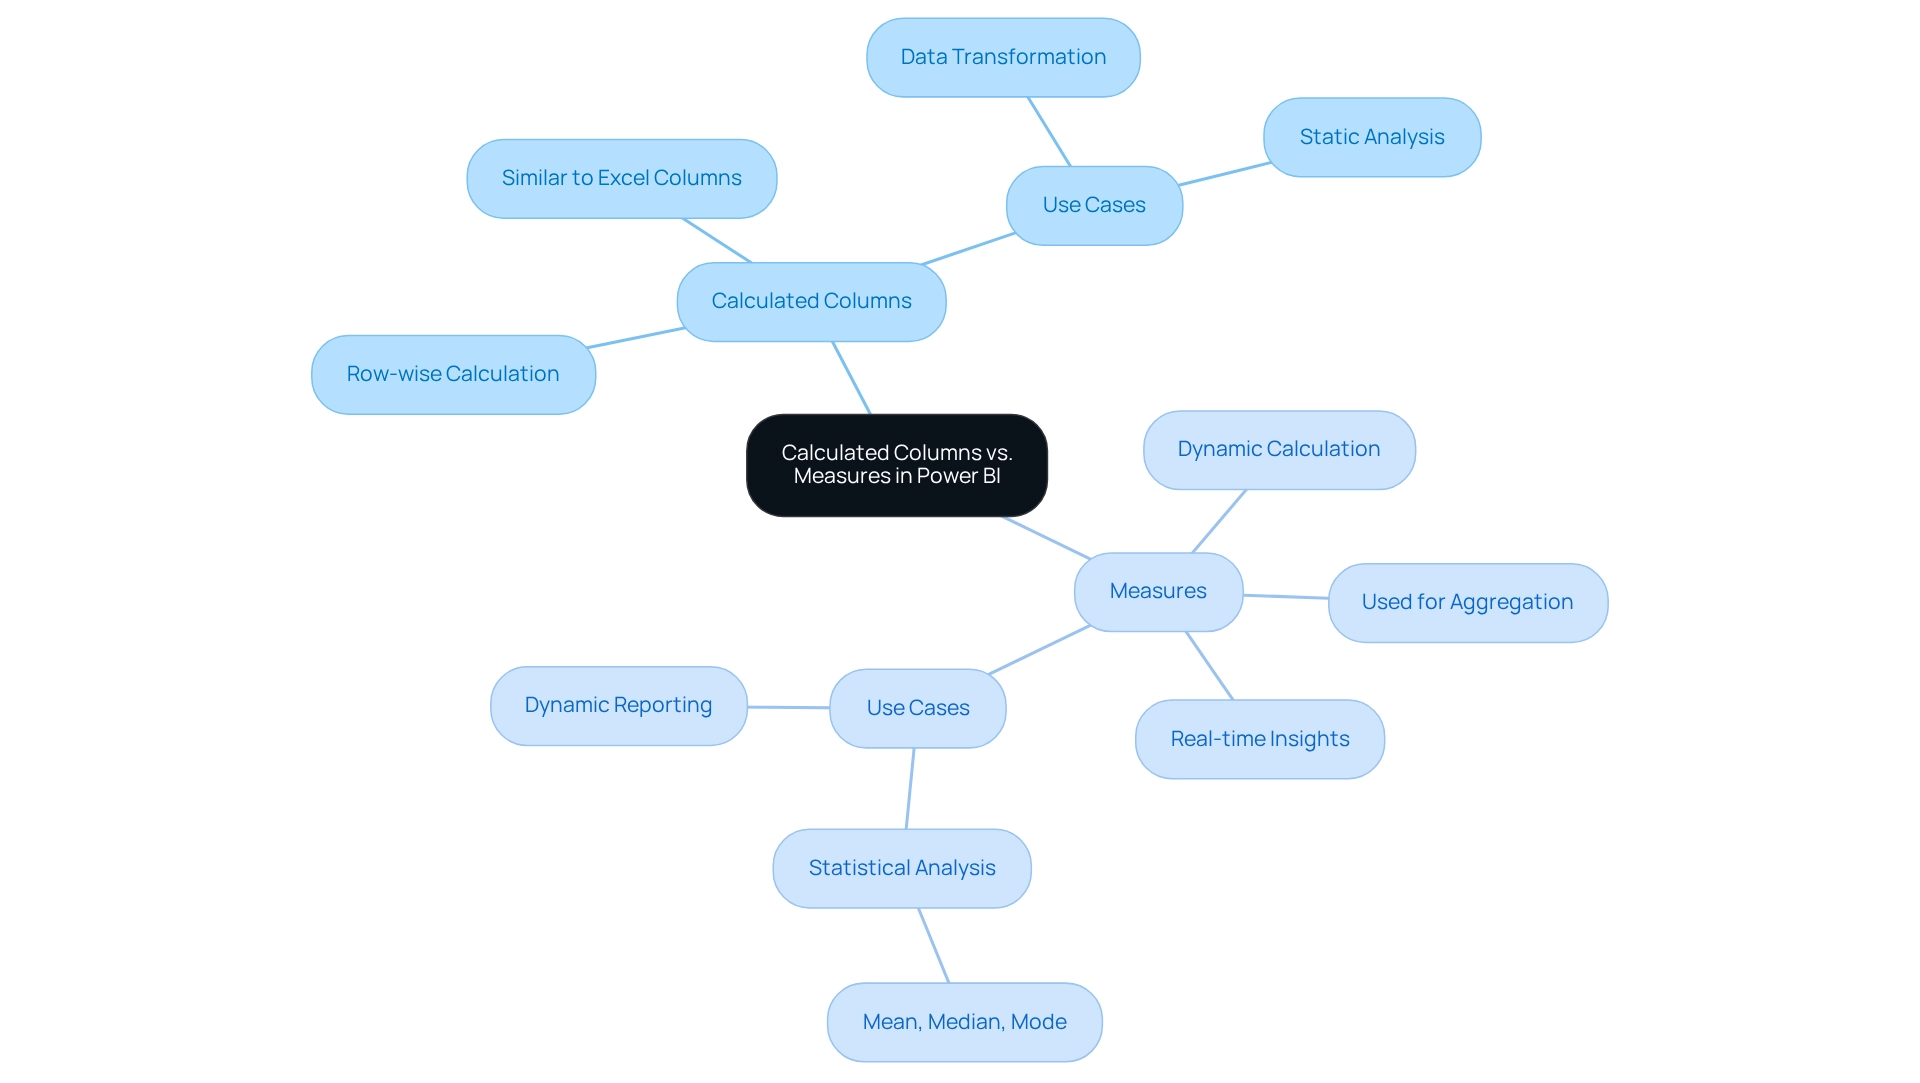
- Calculated columns operate on a row-by-row basis, stored in the data model for static calculations.
- In contrast, measures are dynamic, calculated at query time, facilitating real-time data analysis based on user interactions.
This distinction is crucial for effective business intelligence, as it allows organizations to leverage data more efficiently. Understanding these differences empowers professionals to enhance their data analysis strategies and make informed decisions.
Introduction
In the realm of data analysis, Power BI emerges as a formidable tool that empowers organizations to convert raw data into actionable insights. At the heart of its functionality lie calculated columns and measures—two essential features serving distinct purposes in data modeling.
- Calculated columns enable users to create new data fields based on existing information, while measures offer dynamic calculations that adapt to user interactions, significantly enhancing the analytical prowess of reports.
Understanding the nuances between these two elements is vital for maximizing efficiency and effectiveness in data visualization. As businesses endeavor to harness their data for strategic decision-making, mastering calculated columns and measures becomes imperative for navigating the complexities of modern data landscapes.
This article explores the definitions, applications, performance considerations, and best practices associated with calculated columns and measures in Power BI, equipping users with the knowledge to optimize their data analysis processes.
Defining Calculated Columns and Measures in Power BI
In Power BI, a calculated field represents a new entry created within a table using DAX (Data Analysis Expressions) formulas. Each value in this calculated section is computed on a row-by-row basis, evaluating the expression for every individual row in the table. This process mirrors the addition of a new column in Excel, where each entry is determined independently.
Conversely, a metric signifies a computation assessed across the entire framework, primarily utilized for aggregation. Measures are dynamic; they are calculated at query time and adapt to the filters applied in reports. This characteristic enables actions to provide insights that reflect the current context of the information being examined, which is crucial for companies aiming to leverage data efficiently in a competitive landscape.
Recent statistics indicate that a significant percentage of BI users employ calculated columns; however, metrics remain the preferred choice for dynamic analysis due to their ability to respond to real-time interactions. For instance, in the case study titled “Using Statistical Techniques in Power BI,” Douglas Rocha explores the application of statistical techniques in Power BI, underscoring their importance in analysis. He utilizes a Car Sales dataset to demonstrate how to evaluate sale values using statistical methods, including the mean, median, and mode.
The mode can be calculated using the expression:
Mode = MINX ( TOPN( ADDCOLUMNS( VALUES (CarSales[Sale Value]), 'Frequency', CALCULATE(COUNT(CarSales[Sale Value])) [Frequency], CarSales[Sale Value]) )
This example illustrates how strategies can enhance data analysis, providing actionable insights for decision-making and addressing challenges such as inconsistencies and the need for practical guidance.
Furthermore, the latest updates in BI 2025 have introduced features that allow users to classify metrics, design dedicated tables for them, and customize their visual presentation using dynamic format strings. This evolution highlights the growing significance of metrics in data analysis, as emphasized by Kevin, a BI Consultant, who states, “BI enables organizations to transform their data into valuable insights.” It is also essential to note that for binary-typed fields, Min and Max statistics will yield BLANK values.
A thorough understanding of the distinction between calculated columns and measures is vital for effectively utilizing BI, particularly in enhancing operational efficiency through RPA and BI solutions offered by Creatum GmbH, such as EMMA RPA and Automate, which tackle task repetition fatigue and staffing shortages.
Key Differences Between Calculated Columns and Measures
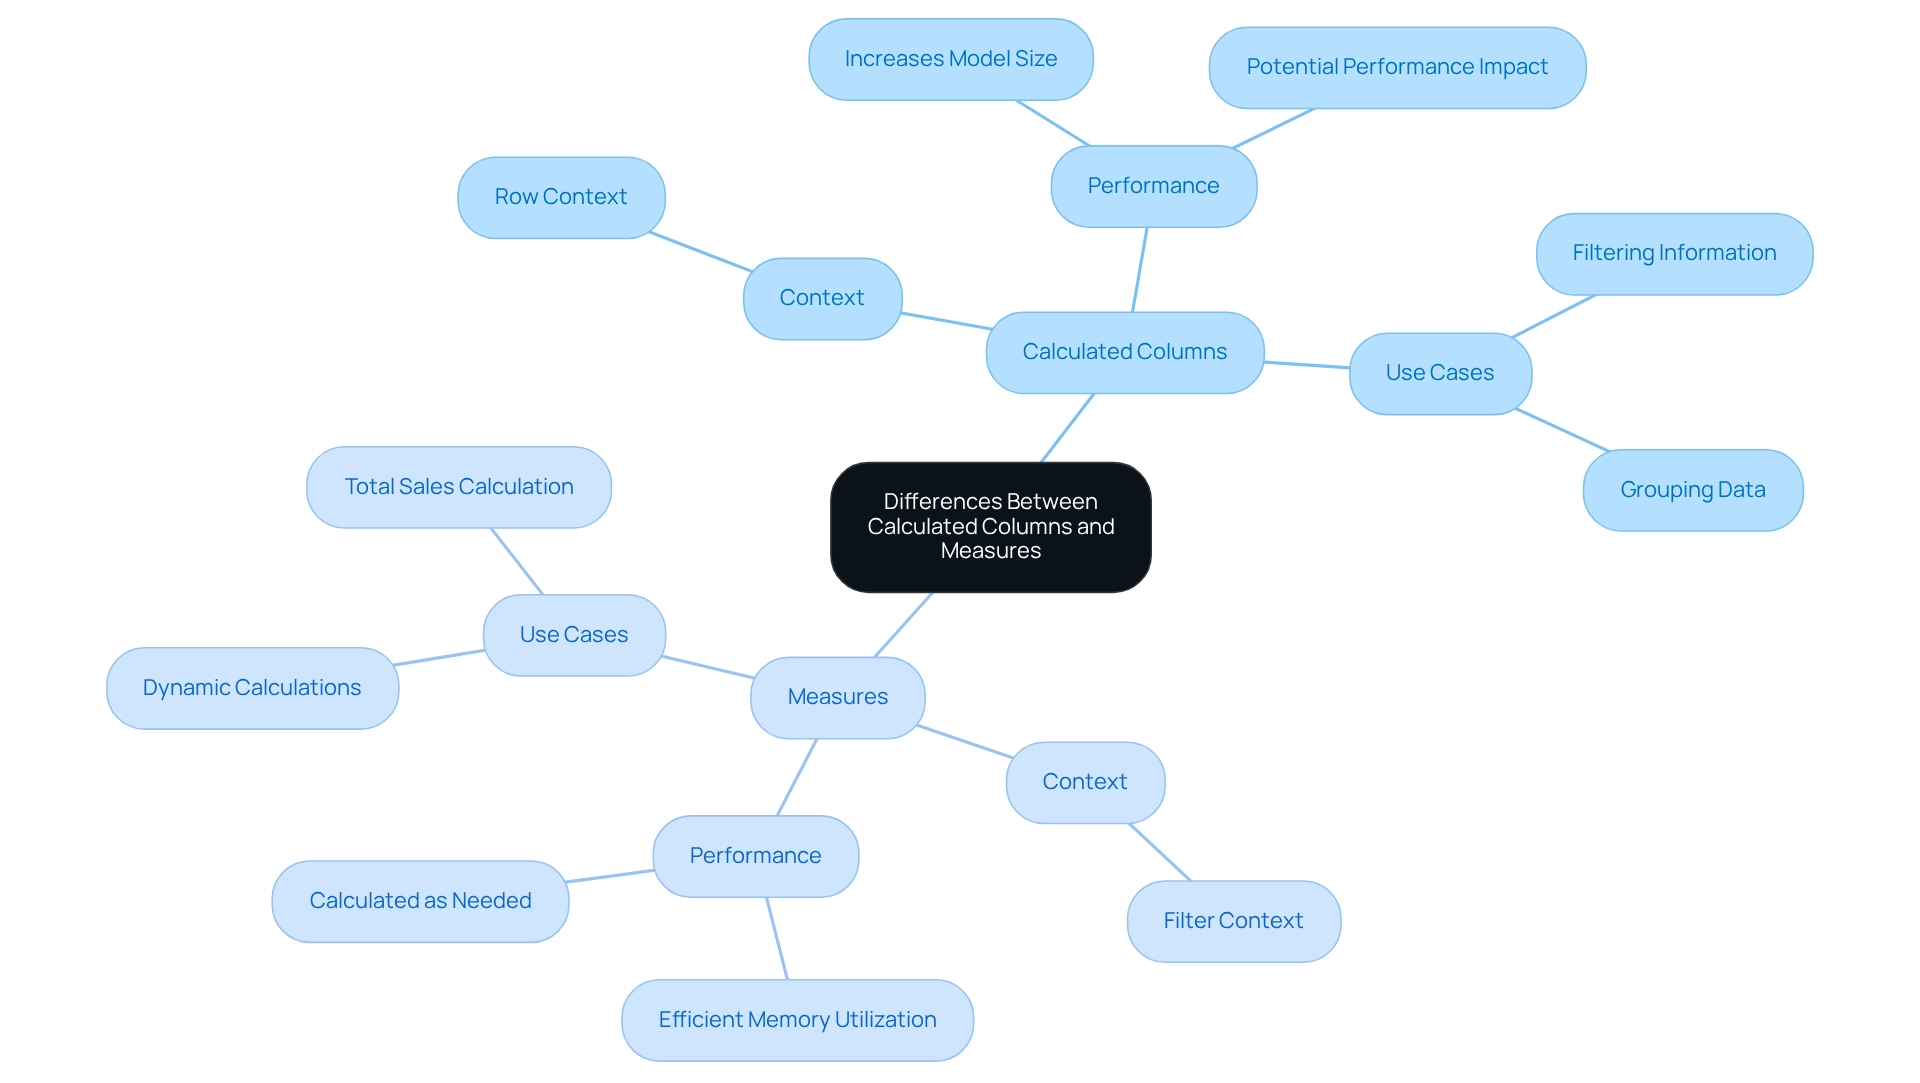
In Power BI, calculated columns operate within a row context, meaning each row is processed independently. This functionality allows for the creation of new information fields based on existing row values. Conversely, measures are assessed in a filter context, enabling them to compile information dynamically based on the filters implemented in reports.
Understanding the difference between calculated columns and measures is essential for comprehending how information is manipulated and presented in your visualizations. However, many users find themselves spending more time creating reports than utilizing insights from BI dashboards. This often results in inconsistencies in information and a lack of actionable guidance. With 2,986 users online, the significance and popularity of Power BI as a tool for data visualization are evident, underscoring the necessity of mastering these concepts to address these frequent challenges.
Calculated attributes are stored directly in the data model, which can lead to an increase in the model’s size and potentially affect performance adversely. In contrast, metrics are not saved; they are calculated as needed, typically leading to more efficient memory utilization. This efficiency is particularly advantageous when managing large datasets, as it helps sustain optimal performance and facilitates the pursuit of operational effectiveness critical for business expansion.
The decision regarding the difference between calculated columns and measures primarily hinges on the distinct needs of your analysis. Calculated columns are especially beneficial when creating new fields for filtering or grouping information, such as categorizing sales figures by region. Measures, on the other hand, are ideal for calculations that must adapt dynamically based on user interactions with the report, such as calculating total sales or average revenue per user.
As noted by Matt Snively, despite numerous new challengers over the years in the realm of information visualization, the right tools remain crucial for effective analysis. Understanding these use cases can significantly enhance your reporting capabilities in Power BI, empowering you to unlock the power of Business Intelligence and drive informed decision-making. Furthermore, establishing a robust governance strategy can help mitigate inconsistencies, while leveraging the General Management App and Microsoft Copilot Integration can further elevate your operational efficiency.
When to Use Calculated Columns vs. Measures
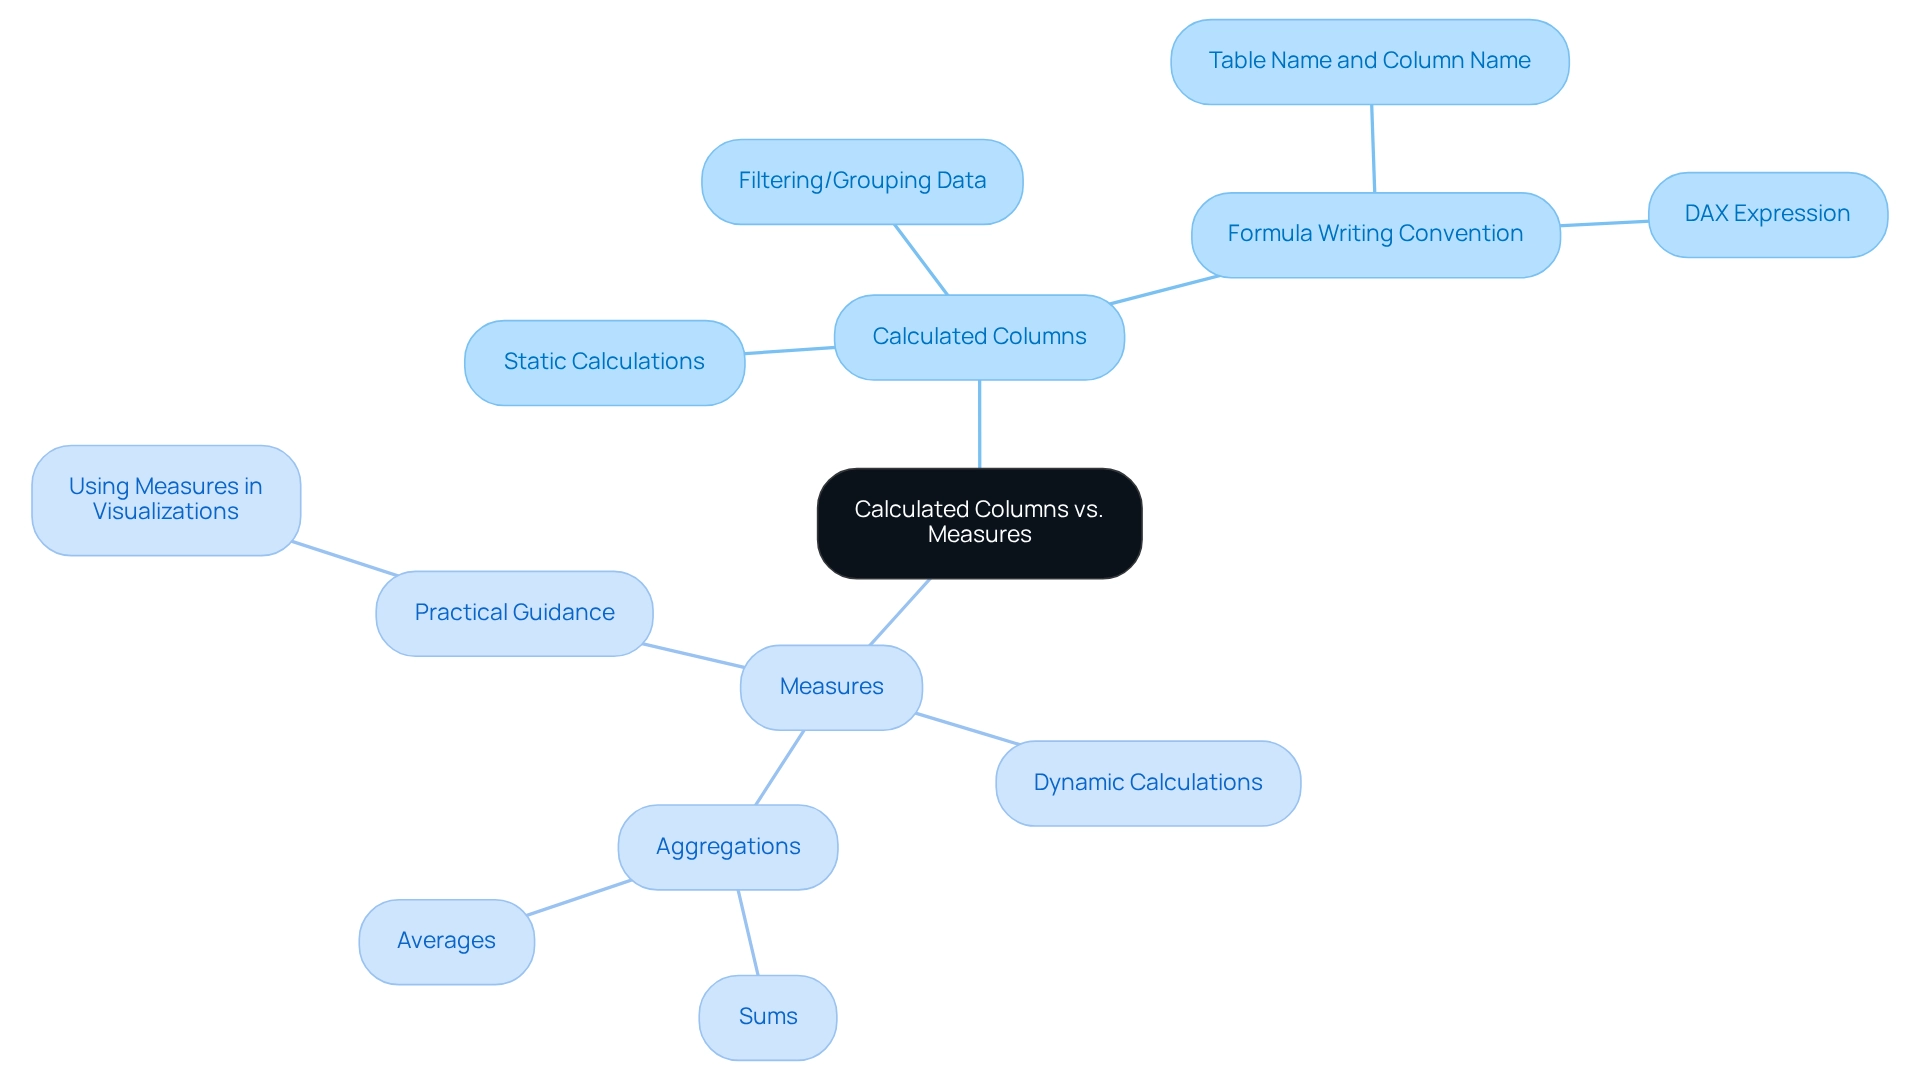
Utilize calculated columns in the following scenarios:
- When you need to create a new field for filtering or grouping data. For example, if you wish to classify sales information by region, a computed field can assist you in accomplishing this.
- When the calculation is static and does not require adjustments based on user interactions. An example would be a section that calculates a fixed tax rate applied to sales, which remains constant regardless of the report context.
Guideline for Writing Calculated Column Formulas: The convention for writing calculated column formulas includes the table name and column name followed by the DAX expression.
On the other hand, employ measures when:
- You need dynamic calculations that adapt to filters and slicers within your reports. For instance, if you wish to compute total sales that vary according to chosen time frames or product categories, metrics are vital.
- You are executing aggregations, such as sums or averages, that rely on the present context of the information. For example, if Janice, a sales manager at Contoso, wishes to forecast future sales based on the information from the previous year with a six percent rise, she would develop a formula to dynamically compute these forecasts as filters are applied. This practical application demonstrates how techniques can improve information analysis.
Practical Guidance: To use a metric in a visualization, select the visualization and drag the metric from the Fields pane to the appropriate field well.
Understanding the difference between calculated column and measure is vital for efficient analysis in Power BI. As Douglas Rocha, a statistics enthusiast, observes, “Even though one can assume it is the simpler of all statistical measures since it is only the most common value in the dataset, there isn’t a native DAX function to calculate it.” Adhering to these guidelines will assist in guaranteeing that your reports are both effective and informative, tackling issues such as information inconsistencies and improving decision-making abilities, ultimately fostering business growth.
At Creatum GmbH, we provide BI services that include a 3-Day Sprint for quick report generation and the General Management App for thorough oversight and intelligent evaluations.
Performance Considerations: Calculated Columns vs. Measures
When assessing performance in Power BI, understanding the difference between calculated columns and measures is essential. This distinction addresses frequent challenges such as time-consuming report generation, inconsistencies in information, and the absence of actionable advice.
-
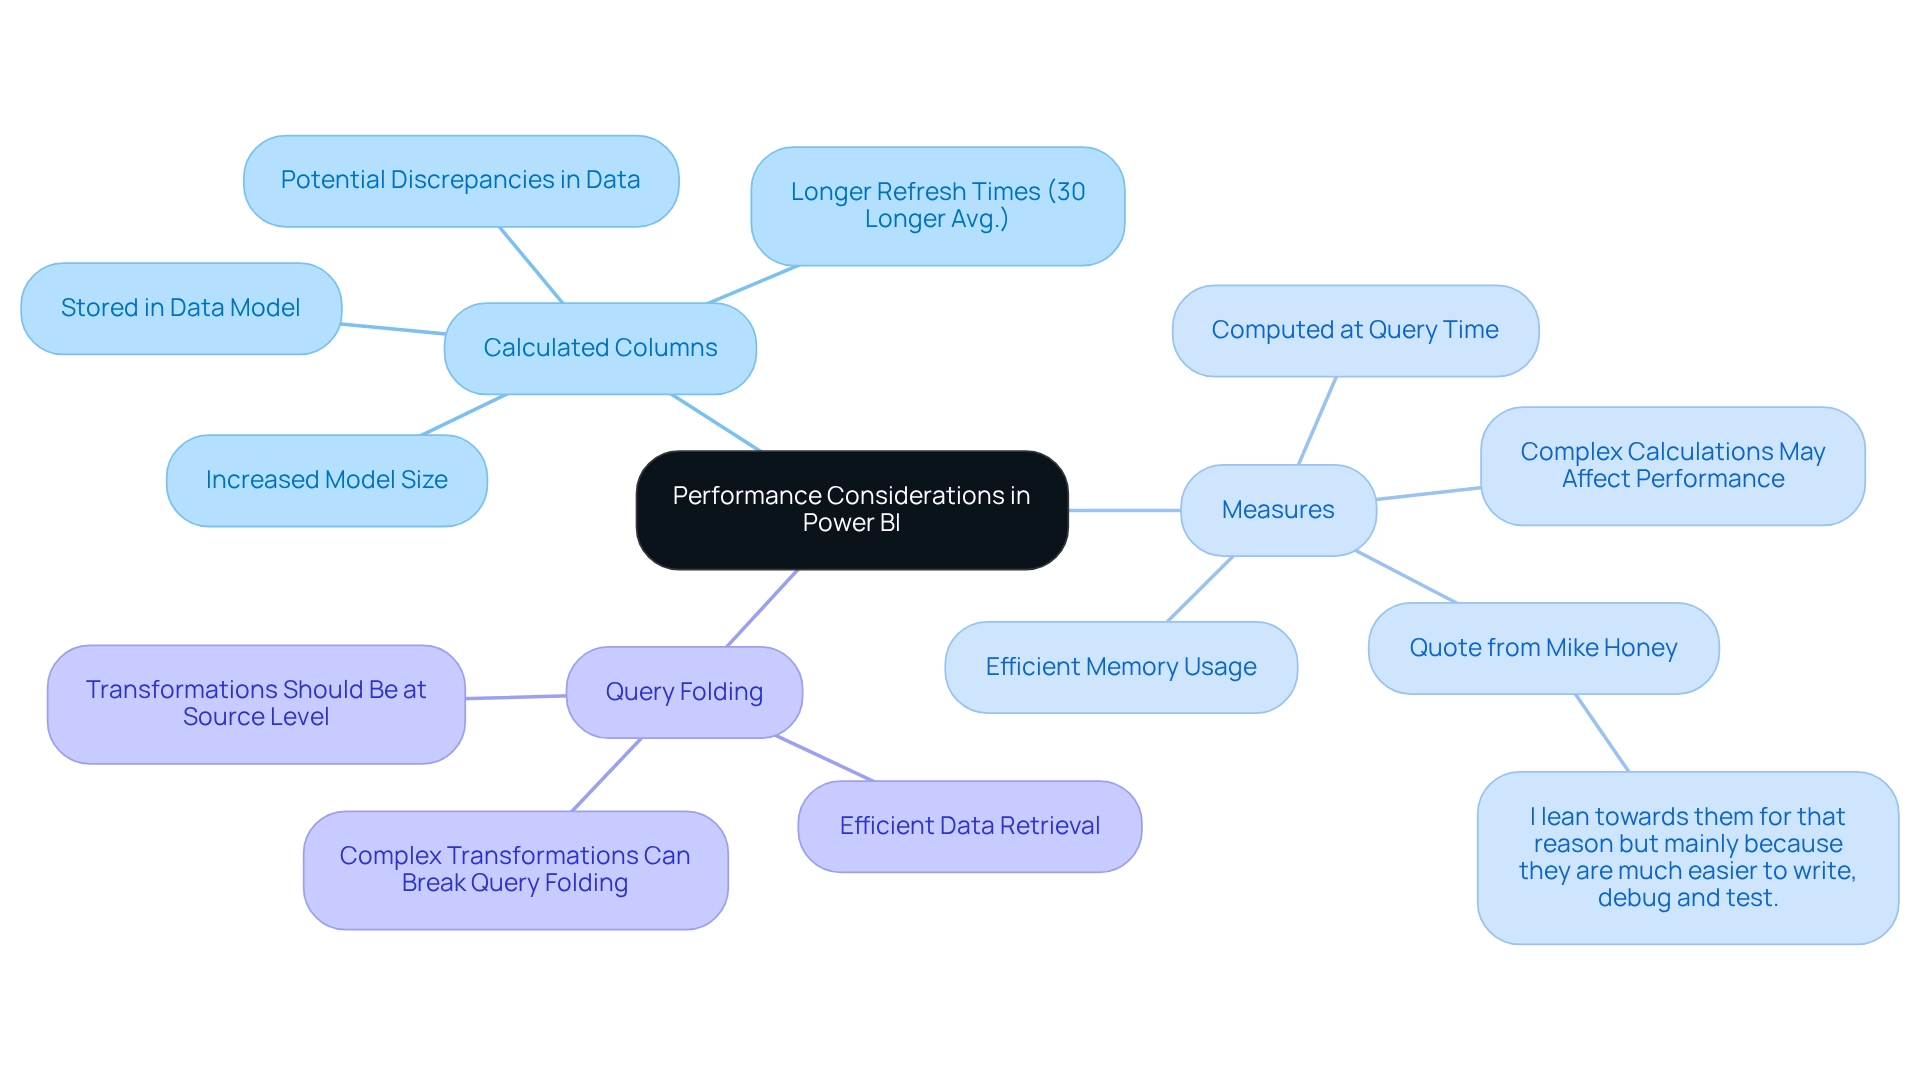
Calculated Columns: These are stored directly in the data model, which can lead to increased model size and longer refresh times. Since calculated fields are pre-calculated, they occupy memory, presenting a significant concern when working with large datasets. A recent analysis indicated that models utilizing computed fields experienced refresh times that were, on average, 30% longer compared to those using measures. This performance decline is especially noticeable in large tables where numerous calculated fields are utilized. The challenge of overseeing these sections is heightened by the possibility of discrepancies in data across different reports, leading to confusion and distrust among stakeholders. Notably, this topic has garnered significant interest, as evidenced by 5,001 views on related discussions.
-
Metrics: Conversely, metrics are computed at query time, indicating they do not utilize memory in the same way as calculated columns. This characteristic allows for more efficient memory usage, especially in scenarios involving large datasets. However, it is essential to note that intricate actions can still adversely affect performance. Measures involving complex calculations or aggregating large volumes of data may lead to slower query responses. As Mike Honey, a notable member of the BI community, remarked, “I lean towards them for that reason but mainly because they are much easier to write, debug and test.”
To illustrate the significance of enhancing performance, consider the case study on query folding in Business Intelligence. Query folding enables efficient information retrieval by sending a single request to the source, significantly improving performance. However, if complex transformations are applied within Power BI, it can disrupt query folding, leading to slower refresh times.
This situation often arises when reports are filled with numbers and graphs yet lack clear, actionable guidance, leaving stakeholders without a clear direction on the next steps. Therefore, it is advisable to execute transformations at the source level whenever feasible to maintain query folding and ensure quicker, more efficient processing.
In summary, while the difference between calculated columns and measures can streamline model construction, careful thought is required regarding their effect on model size and refresh durations. Measures, while more efficient in terms of memory usage, require optimization to prevent performance bottlenecks. Balancing the use of both features is essential for achieving optimal performance in Business Intelligence.
Furthermore, tackling issues related to evaluating computed fields performance is essential for users aiming to improve their BI experience and navigate the difficulties of report generation and data management. At Creatum GmbH, we encourage you to explore these insights further to optimize your reporting processes.
Common Pitfalls and Solutions in Using Calculated Columns and Measures
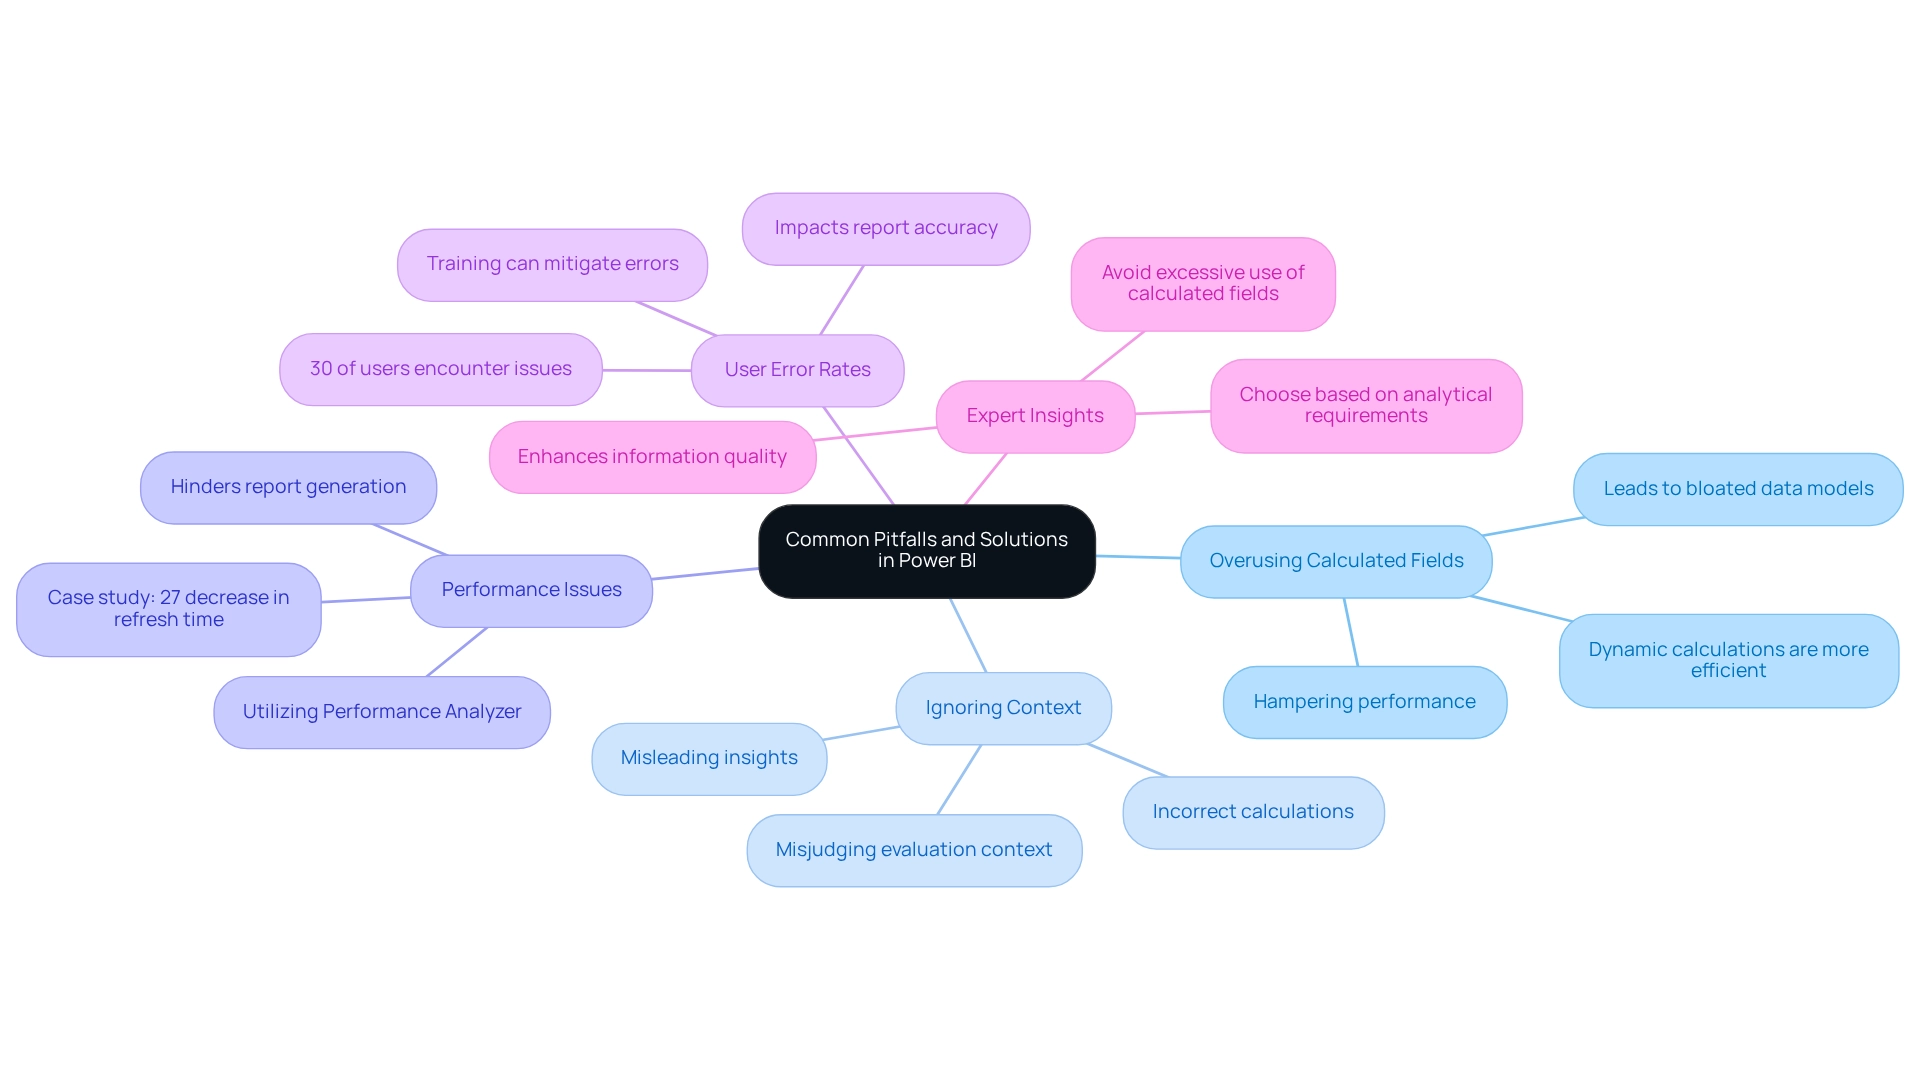
Common pitfalls in using calculated columns and measures in Power BI include:
-
Overusing Calculated Fields: A prevalent error among users is the excessive creation of calculated fields for every required calculation. This practice can lead to bloated data models, ultimately hampering performance and complicating report creation. Instead, utilizing methods for dynamic calculations is often more efficient, as these do not consume memory resources like calculated fields do. As Rico Zhou explains, “When we complete the DAX code of a computed field, it will consume resources like memory.” However, an action won’t consume resources when it is completed.
-
Ignoring context is another critical mistake. Understanding the evaluation context is essential when discerning the difference between a calculated column and a measure. Misjudging this can lead to incorrect calculations and misleading insights, further complicating the reporting process. It is vital to assess the specific requirements of your analysis to determine the most suitable approach.
-
Performance Issues: Users frequently overlook the performance effects of calculated columns, which can significantly hinder report generation and exacerbate inconsistencies. Utilizing the Performance Analyzer tool in Power BI can assist in pinpointing bottlenecks and enhancing performance. For instance, a case study on optimizing Power Query showcased a 27% decrease in refresh time by reducing transformation steps, underscoring the importance of efficient information processing in enhancing overall performance in Power BI.
-
User Error Rates: Statistics indicate that user error rates associated with calculated fields and measures can be elevated, particularly among those unfamiliar with DAX functions. Studies reveal that nearly 30% of users encounter issues due to misunderstandings of these concepts. This not only impacts the accuracy of reports but also contributes to confusion and mistrust in the information presented. Training and resources can mitigate these errors, ensuring users make informed decisions when implementing calculations.
-
Expert Insights: Power BI specialists emphasize the importance of avoiding excessive use of calculated fields. As highlighted by industry experts, the distinction between a calculated column and a measure should depend on specific analytical requirements, as each serves a distinct role in modeling. This strategic choice can enhance information quality and simplify AI implementation, ultimately driving growth and innovation in analytics.
By recognizing these typical traps and applying strategic solutions, users can enhance their BI experience, resulting in improved information quality, more efficient decision-making, and a streamlined reporting process.
Practical Examples: Using Calculated Columns and Measures in Power BI
Example of a Calculated Column
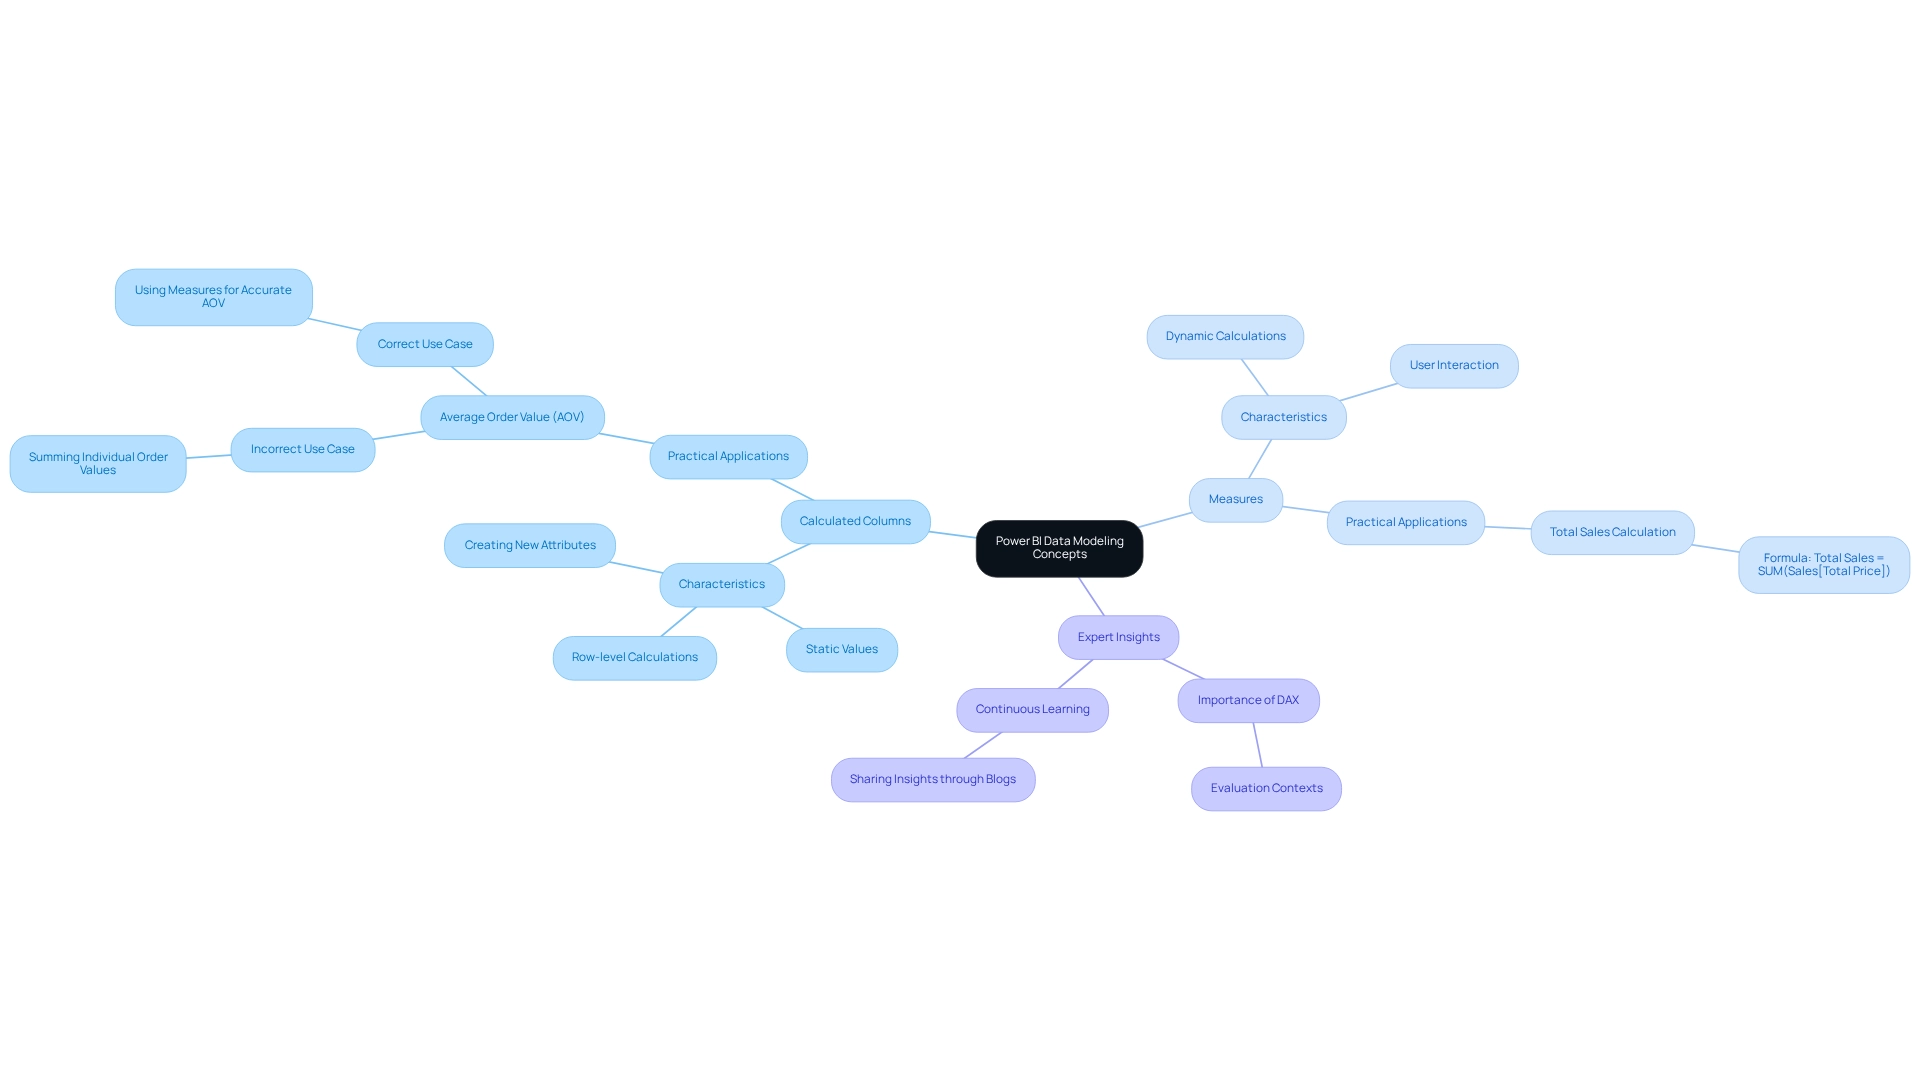
In Power BI, calculated columns serve as a powerful tool for creating new attributes derived from existing data. For instance, when analyzing a sales table, you may want to compute the total price for each transaction. By defining a calculated field with the formula: Total Price = Quantity * Unit Price, you can derive static values that are instrumental in further analysis or reporting.
Calculated columns excel in generating static values, creating new attributes, and executing calculations at the row level. This capability is essential for addressing challenges like data inconsistencies in reporting.
Example of a Measure
On the other hand, measures are crafted for dynamic calculations that adapt to user interactions within reports. For example, to calculate total sales that adjust based on filters applied by users, you would use the formula: Total Sales = SUM(Sales[Total Price]). This method provides a versatile approach to examining sales information, ensuring that the results reflect the current context of the report. Consequently, this enhances the actionable insights derived from your BI dashboards.
Practical Applications and Case Studies
Grasping the distinction between calculated columns and measures is vital for effective data modeling in Power BI. A significant case study revolves around calculating the Average Order Value (AOV). If one incorrectly utilizes a calculated field, they might sum individual order values, resulting in inaccurate outcomes.
Instead, employing a method that accurately combines total sales and total orders will yield a true average. This reinforces the principle that summing ratios does not equate to averaging. This case study underscores the necessity of utilizing measures over calculated columns for precise data analysis, which is crucial for leveraging insights effectively and propelling business growth.
Expert Insights
Experts highlight the importance of mastering DAX (Data Analysis Expressions) to optimize formula results in Power BI. As noted by Elisenda Gascon, ‘Explore DAX query language in Business Intelligence: learn about Evaluation Contexts and their impact on code for improved formula results.’ A deep understanding of evaluation contexts can significantly enhance the effectiveness of your calculations, leading to more insightful data analysis.
Moreover, the continuous sharing of insights through blogs and thought leadership in the Power BI domain fosters a culture of ongoing learning and improvement. This culture is essential for overcoming the challenges associated with time-consuming report creation.
Best Practices for Using Calculated Columns and Measures
-
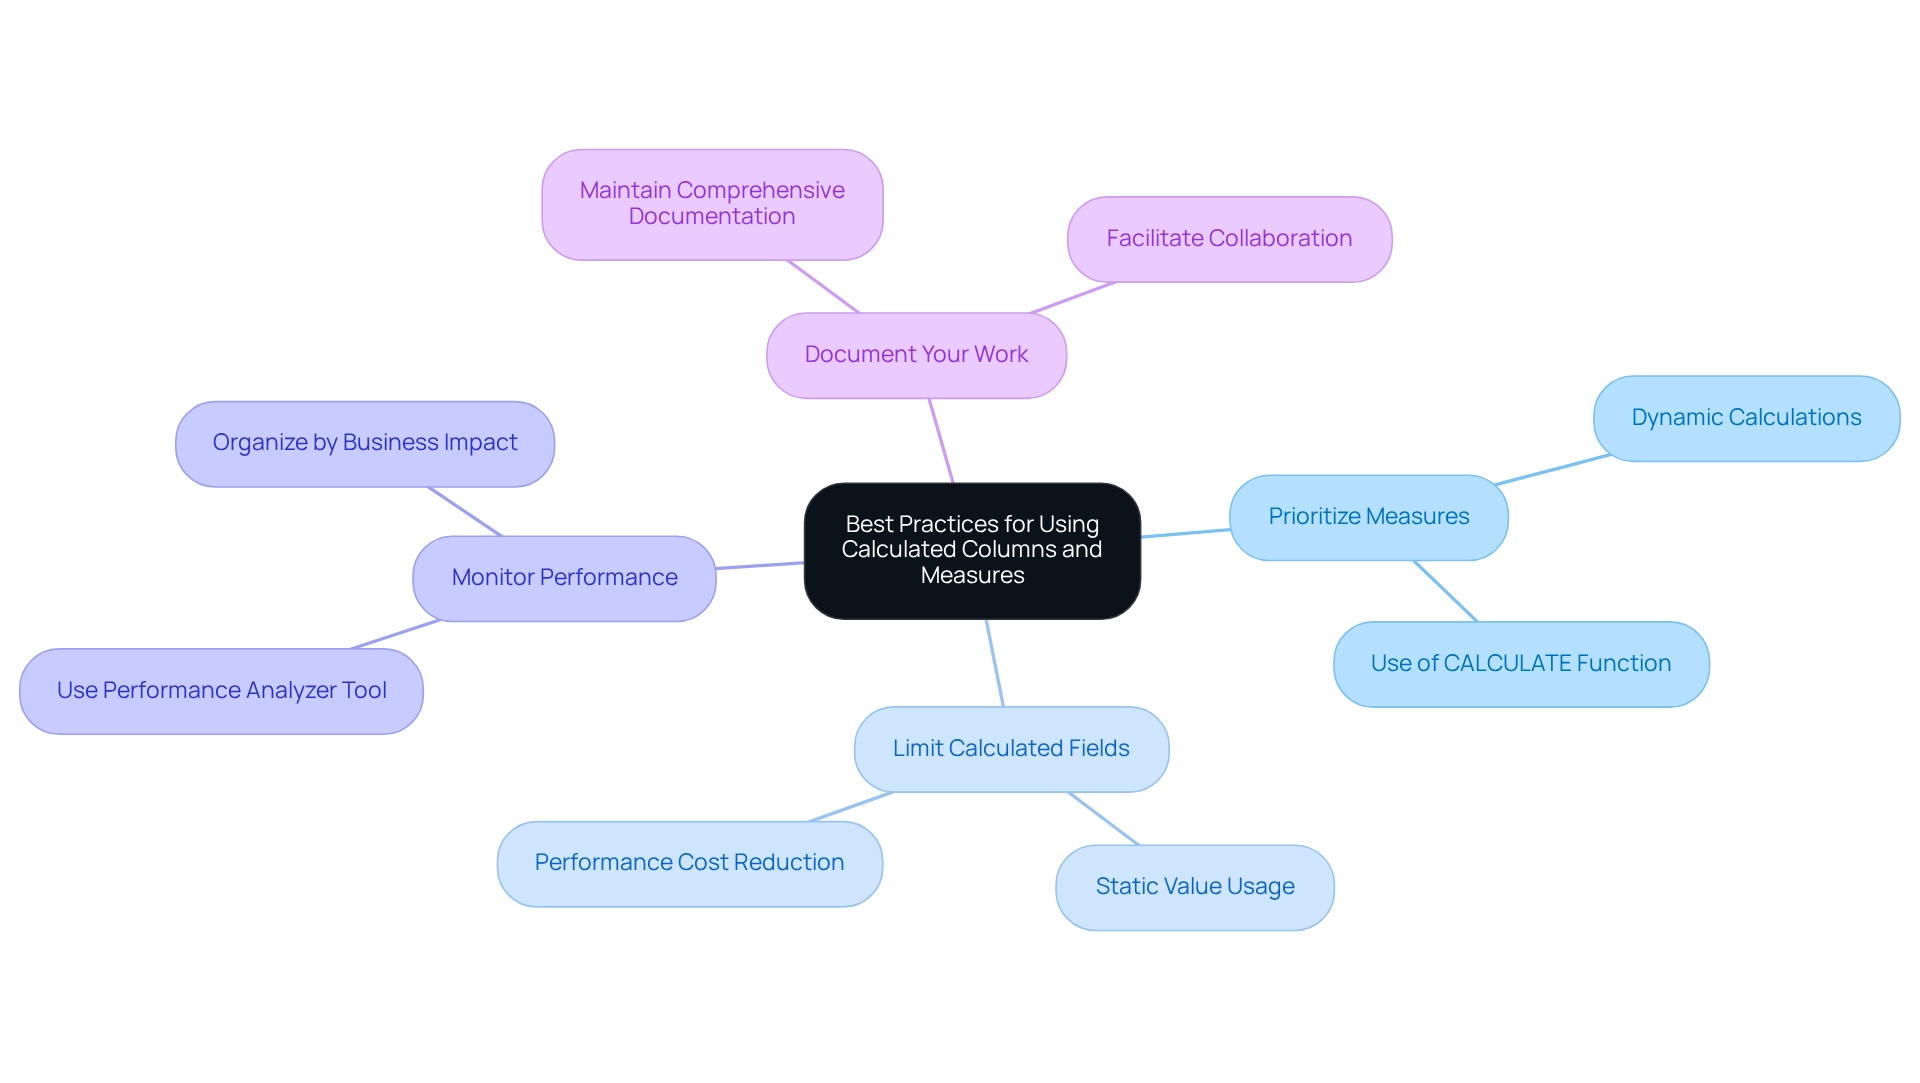
Prioritize Measures: Leverage measures for dynamic calculations whenever possible. Calculated at query time, measures optimize performance and minimize memory usage, making them ideal for real-time data analysis. By effectively utilizing the CALCULATE function, users can perform complex calculations and create insightful visualizations that aid in decision-making processes. This ultimately drives growth and innovation through actionable insights.
-
Limit Calculated Fields: Reserve calculated fields for scenarios where a static value is essential for filtering or grouping. Excessive use can lead to unnecessary memory usage and reduced performance, so they should be employed judiciously. Utilizing report backgrounds for static images can significantly reduce performance costs compared to multiple visuals, which is crucial for optimizing reports and enhancing operational efficiency.
-
Monitor Performance: Regularly use the Performance Analyzer tool to identify and address performance issues related to computed fields and metrics. This proactive approach helps maintain optimal performance, ensuring your reports run efficiently. Additionally, organizing report data by business impact through sensitivity labels enhances data security awareness, essential for effective data management and leveraging insights from BI dashboards.
-
Document Your Work: Maintain comprehensive documentation of your calculated columns and measures. Clear documentation not only aids in the maintainability of your Power BI reports but also clarifies the distinction between calculated columns and measures for future users, facilitating smoother collaboration and knowledge transfer. As highlighted in case studies on initiating AI projects, strategic planning and documentation are pivotal to achieving impactful outcomes, especially in navigating the complex AI landscape with tailored solutions.
Key Takeaways: Mastering Calculated Columns and Measures
-
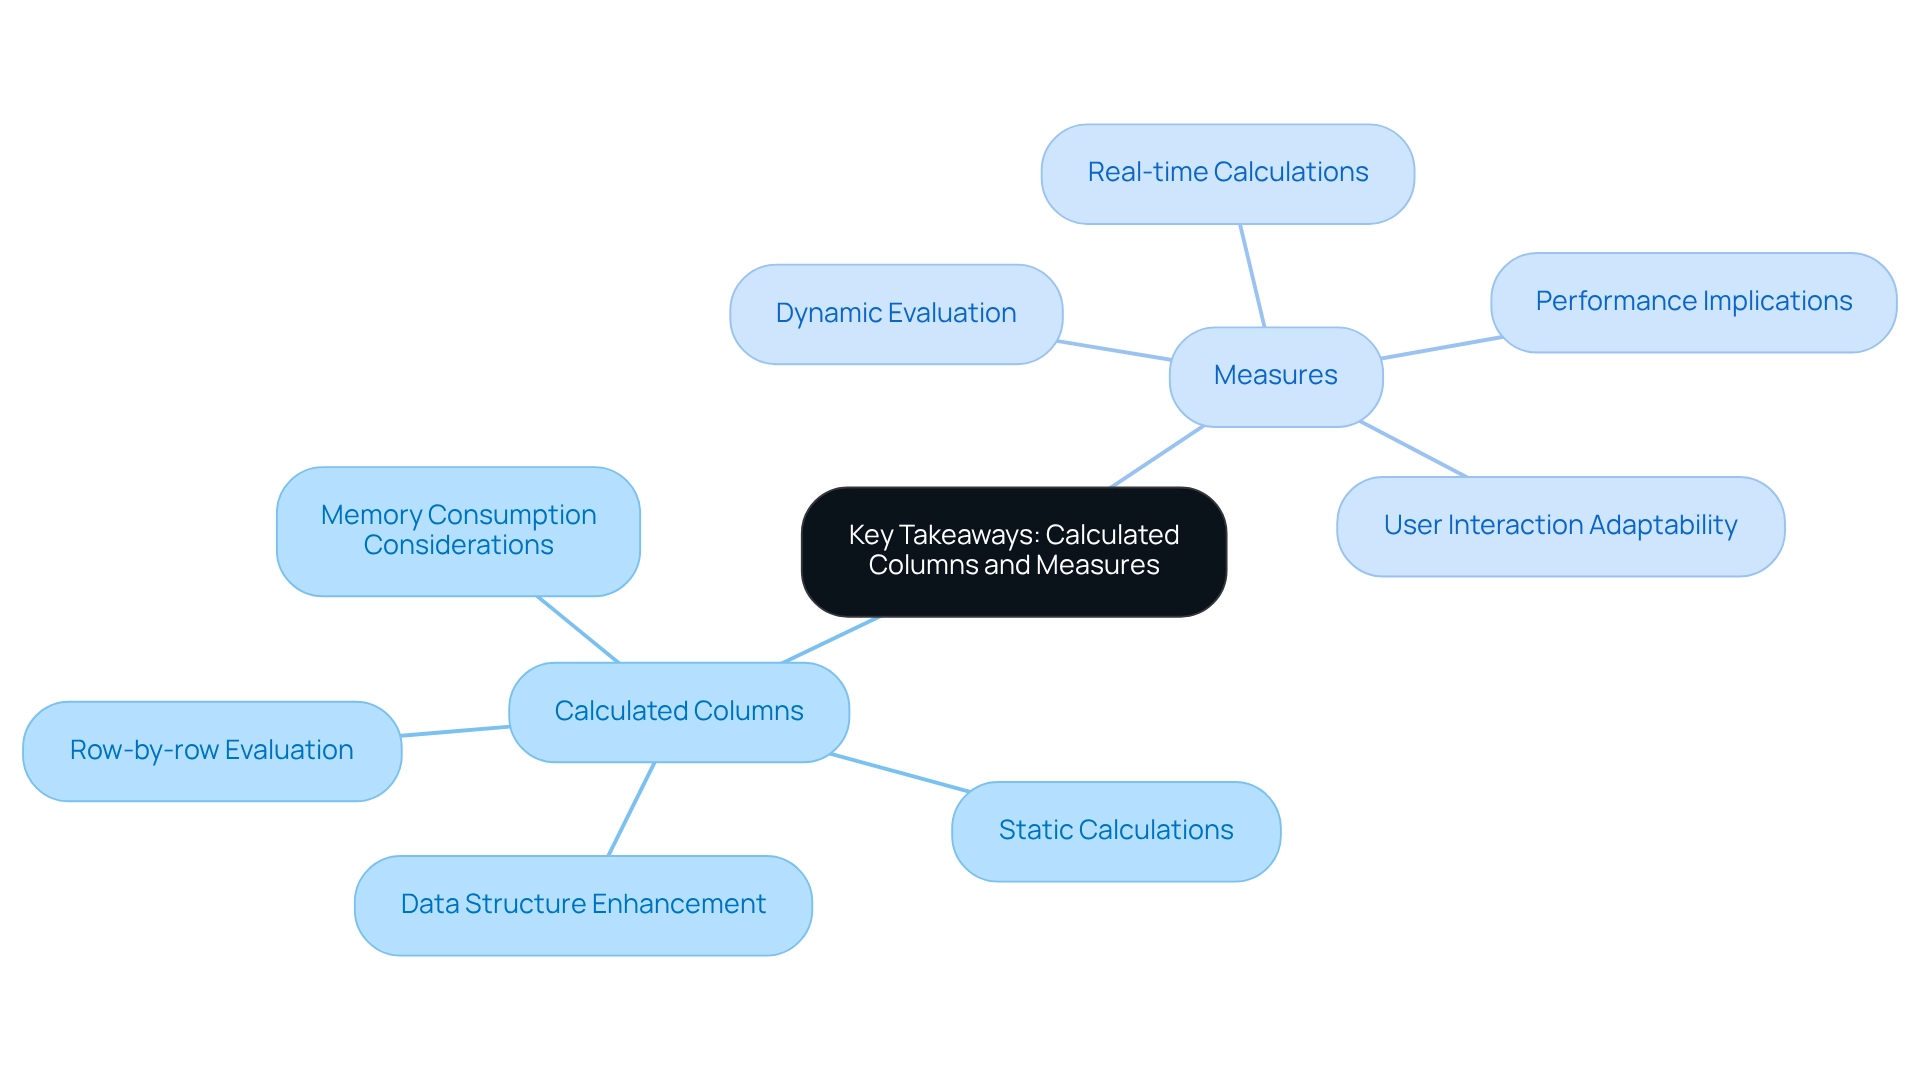
Calculated Columns are evaluated on a row-by-row basis and retained within the model, making them particularly effective for static calculations. They empower users to create new data fields for filtering and grouping, thereby enhancing the dataset’s structure. This capability is crucial for users aiming to extract basic statistics from their dataset using BI. As highlighted by Sascha Rudloff, Teamleader of IT- and Processmanagement at PALFINGER Tail Lifts GMBH, the implementation of Creatum’s Power BI Sprint not only delivered an immediately usable Power BI report but also significantly expedited their own Power BI development, showcasing the transformative impact of such services on business intelligence.
-
In contrast, Measures are dynamic and assessed in the context of the entire data model. This feature makes them ideal for performing aggregations and calculations that must adapt based on user interactions with reports. For example, tools can dynamically compute the percentage of calls per wait time bin, providing prompt insights based on user input. Practically, wait times can be categorized as ‘Low’ for waitTime < 20, ‘Average’ for waitTime < 100, and ‘High’ otherwise, illustrating how criteria can be applied in real scenarios.
-
When deciding between the two, understanding the distinction between calculated columns and measures is vital; calculated columns are best suited for filtering or grouping information, while measures should be employed for calculations requiring real-time responsiveness to user-selected filters. The case study titled “Measures in Business Intelligence” underscores that measures are utilized for calculations needing adjustment based on user interaction with reports, reinforcing their dynamic nature. However, many organizations face challenges in leveraging insights from Power BI dashboards due to time-consuming report generation and inconsistencies across various reports, which can lead to confusion and mistrust in the information presented.
-
Performance implications must be considered when using calculated columns. Since they are stored in the data model, excessive use can result in increased memory consumption. Therefore, it is advisable to favor methods for dynamic calculations, as they are computed on-the-fly and do not occupy additional storage space in the model. As noted by Douglas Rocha, although one might assume it is the simplest of all statistical measures, being merely the most common value in the dataset, there is no native DAX function to calculate it. This further emphasizes the importance of understanding the difference between calculated columns and measures.
Conclusion
Understanding the differences between calculated columns and measures in Power BI is essential for optimizing data analysis and enhancing reporting capabilities.
- Calculated columns facilitate the creation of new fields based on existing data, making them ideal for static calculations and filtering.
- In contrast, measures provide dynamic calculations that adapt to user interactions, rendering them invaluable for real-time data analysis.
The decision between these two features should be guided by specific analytical needs, with a strong emphasis on utilizing measures whenever feasible to enhance performance and minimize memory consumption.
Performance considerations are pivotal in effective data modeling.
- Overuse of calculated columns can lead to increased model size and extended refresh times, while measures are calculated at query time, offering a more efficient strategy for managing large datasets.
- Being aware of common pitfalls—such as over-reliance on calculated columns and misinterpretation of evaluation contexts—can significantly enhance the effectiveness of Power BI reports.
Ultimately, mastering the use of calculated columns and measures is crucial for leveraging Power BI’s full potential.
By implementing best practices—such as prioritizing measures, monitoring performance, and maintaining clear documentation—users can enhance data quality and streamline reporting processes. This strategic approach not only fosters informed decision-making but also propels business growth in an increasingly data-driven landscape.
Frequently Asked Questions
What is a calculated field in Power BI?
A calculated field in Power BI is a new entry created within a table using DAX (Data Analysis Expressions) formulas, where each value is computed on a row-by-row basis, similar to adding a new column in Excel.
How does a metric differ from a calculated field in Power BI?
A metric represents a computation assessed across the entire framework and is primarily used for aggregation. Metrics are dynamic, calculated at query time, and adapt to filters applied in reports, providing insights based on the current context.
Why are metrics preferred for dynamic analysis in Power BI?
Metrics are preferred for dynamic analysis because they respond to real-time interactions, making them more suitable for providing insights that reflect the current data context, which is essential for efficient data utilization in a competitive landscape.
What is the significance of the case study “Using Statistical Techniques in Power BI” by Douglas Rocha?
The case study emphasizes the application of statistical techniques in Power BI using a Car Sales dataset to demonstrate how to evaluate sale values through methods like the mean, median, and mode, highlighting the importance of these techniques in data analysis.
Can you provide an example of how to calculate the mode in Power BI?
The mode can be calculated using the expression: Mode = MINX ( TOPN( ADDCOLUMNS( VALUES (CarSales[Sale Value]), 'Frequency', CALCULATE(COUNT(CarSales[Sale Value])) [Frequency], CarSales[Sale Value]) ).
What recent updates in BI 2025 enhance the functionality of metrics?
Recent updates in BI 2025 allow users to classify metrics, design dedicated tables for them, and customize their visual presentation using dynamic format strings, highlighting the growing significance of metrics in data analysis.
How do calculated columns and measures operate differently in Power BI?
Calculated columns operate within a row context, processing each row independently, while measures are assessed in a filter context, compiling information dynamically based on report filters.
What are the implications of storing calculated attributes in the data model?
Storing calculated attributes directly in the data model can increase the model’s size and potentially affect performance adversely, while metrics are calculated as needed, leading to more efficient memory utilization.
When should you use calculated columns versus measures in Power BI?
Calculated columns are beneficial for creating new fields for filtering or grouping information, while measures are ideal for calculations that must adapt dynamically based on user interactions with the report.
How can understanding the differences between calculated columns and measures improve reporting capabilities in Power BI?
Mastering the distinctions helps users create more effective reports, enhances data analysis, and empowers informed decision-making, ultimately driving operational efficiency and business expansion.