Overview
This article serves as a comprehensive guide to the DAX EXCEPT function in Power BI, highlighting its essential role in identifying unique records through the comparison of two tables. It outlines the syntax and practical applications, while also addressing common pitfalls to avoid. Furthermore, advanced techniques are discussed, illustrating how the DAX EXCEPT function significantly enhances data analysis and operational efficiency in business intelligence scenarios.
Introduction
In the realm of data analysis, discerning unique records from overlapping datasets is paramount. The DAX EXCEPT function in Power BI stands out as a powerful tool, enabling users to extract rows from one table that are absent in another. This functionality is invaluable in various scenarios, such as:
- Identifying customers who made purchases without any returns
- Comparing sales figures across different periods
As organizations strive for operational efficiency and data-driven decision-making, mastering the intricacies of DAX EXCEPT becomes essential. This article will delve into the syntax, practical applications, common pitfalls, and advanced techniques associated with the DAX EXCEPT function, equipping professionals with the knowledge to enhance their data analysis capabilities and drive business success.
Understanding DAX EXCEPT: An Overview
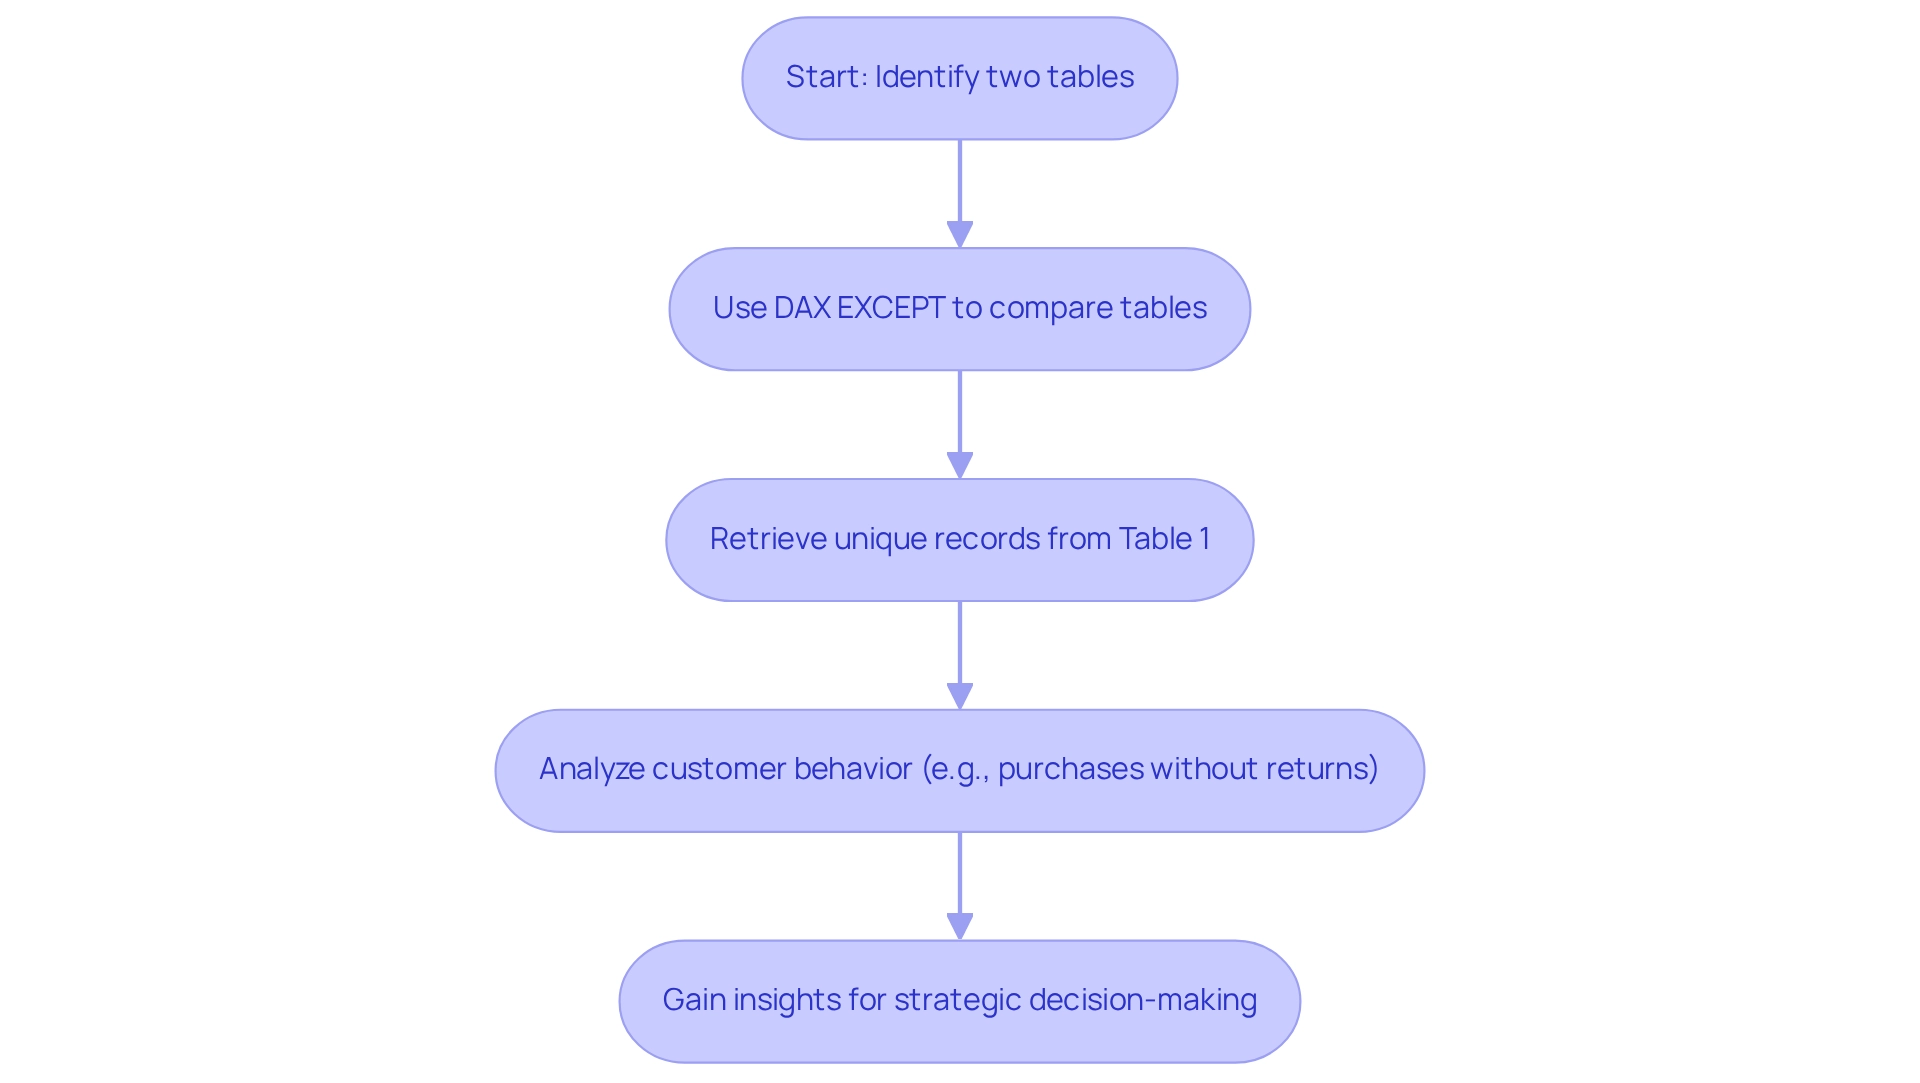
The DAX exclusion mechanism serves as a vital tool in Power BI, enabling users to compare two tables and retrieve rows from the first table that are absent in the second. This feature is particularly beneficial in data analysis scenarios where identifying unique records is crucial. For example, imagine having a list of customers who made purchases alongside another list of customers who returned items.
By leveraging the exclusion capability, you can swiftly identify which customers made purchases without returning any items, thus gaining valuable insights into customer behavior. The outcome of the EXCLUDE operation distinctly presents the rows unique to the first table in relation to the second, underscoring its practicality.
The importance of the DAX EXCEPT feature extends beyond mere information comparison; it plays a pivotal role in enhancing operational efficiency. By facilitating the identification of unique records, organizations can streamline their reporting processes and concentrate on strategic decision-making. In fact, employing such functions can significantly reduce the time spent on manual reconciliation, allowing teams to dedicate resources to more value-adding activities.
This aligns with the overarching goals of our Power BI services, which aim to enhance reporting and provide actionable insights through initiatives like the 3-Day Power BI Sprint and the General Management App.
Moreover, integrating Robotic Process Automation (RPA) can further optimize workflows, enhancing operational efficiency by automating repetitive tasks related to information management. Statistics indicate that the effective application of DAX operations such as EXCLUDE can lead to improved information quality and precision in reporting. As organizations increasingly depend on data-driven insights, grasping and implementing the DAX EXCEPT function becomes essential for achieving operational excellence.
Addressing inconsistency and governance challenges in business reporting is crucial for maintaining integrity and supporting informed decision-making.
As highlighted by the upcoming AI Skills Fest from April 8 to May 28, 2025, continuous learning and mastery of tools like Power BI are vital for professionals striving to stay ahead in the evolving landscape of data analysis. This event will provide an in-depth exploration and practical applications, emphasizing the necessity of mastering DAX capabilities to foster business success. As noted in Power BI Docs, comprehending these capabilities is indeed essential for operational excellence.
DAX EXCEPT Syntax and Structure
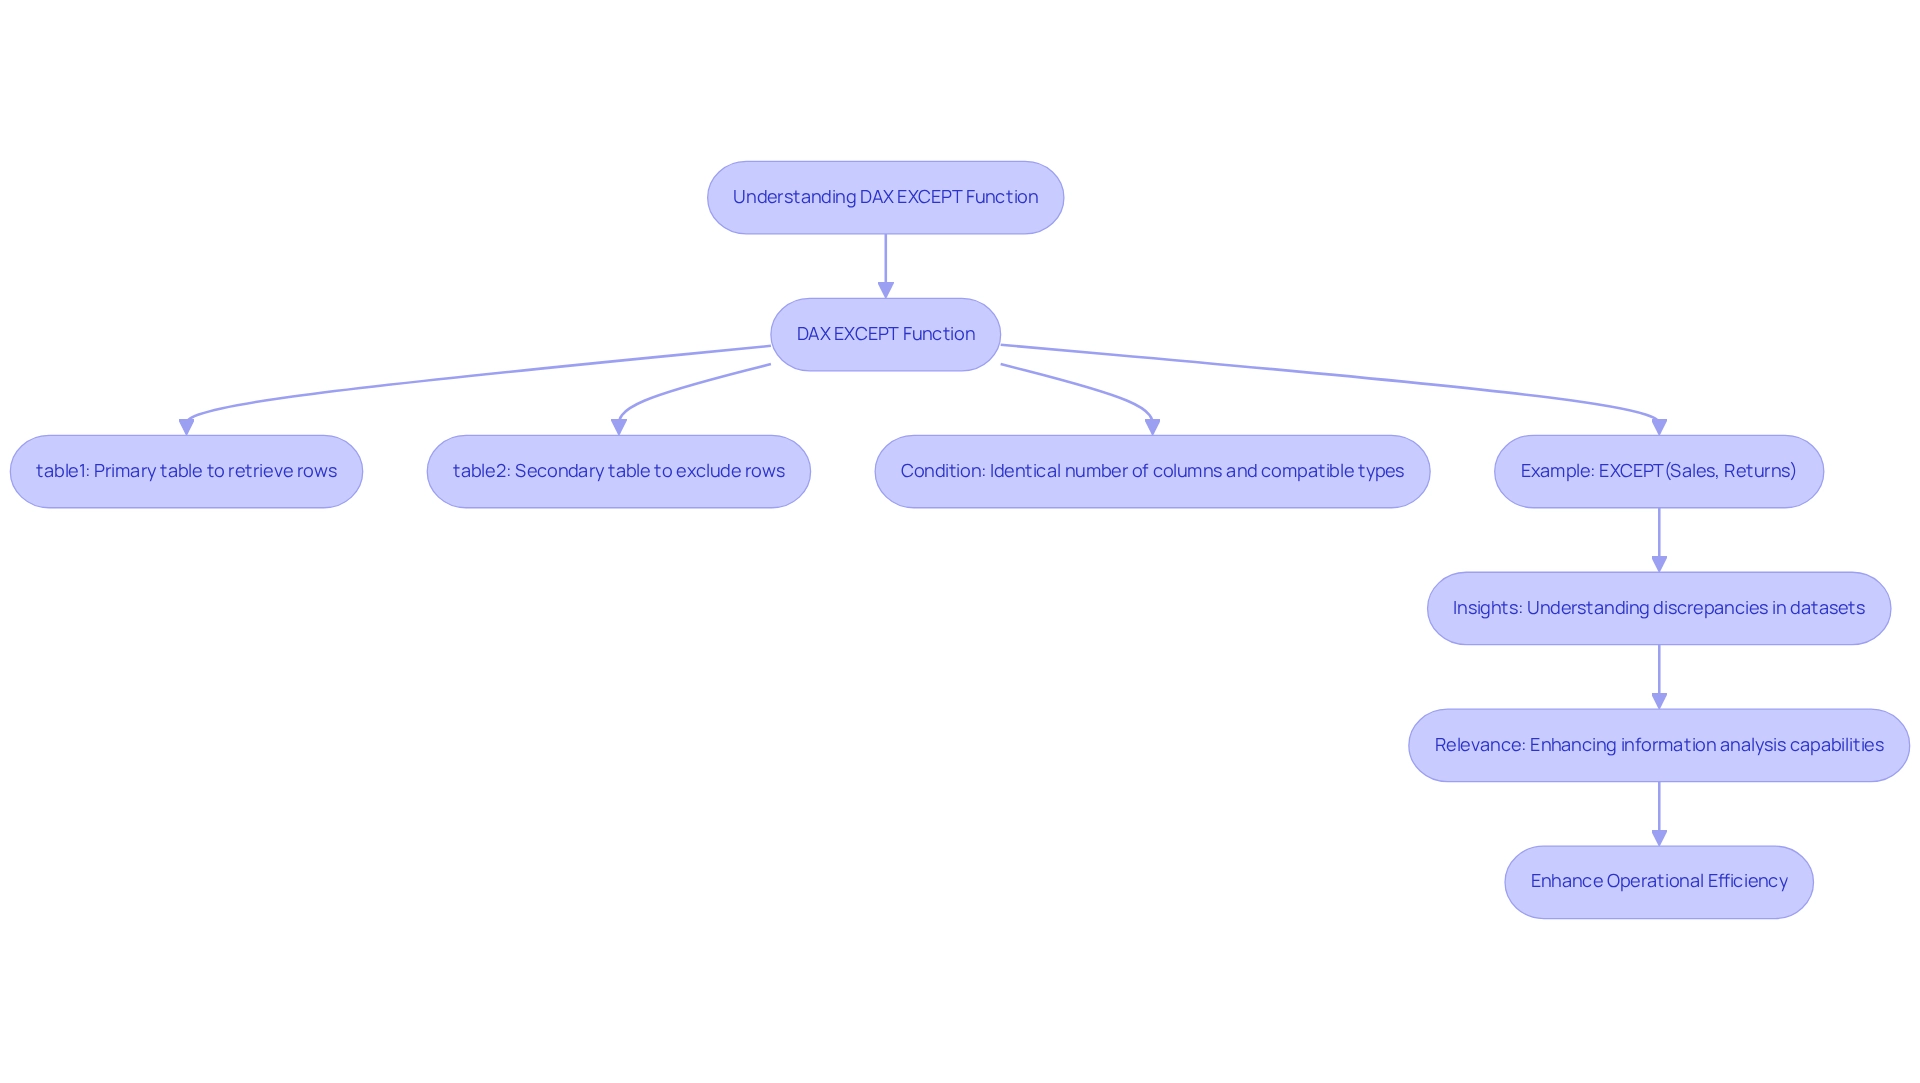
The DAX EXCEPT function is structured as follows:
EXCEPT(<table1>, <table2>)
- table1: This is the primary table from which you want to retrieve rows.
- table2: This is the secondary table from which you want to exclude rows using DAX EXCEPT.
It is crucial that both tables have an identical number of columns and that the types of these columns are compatible. For instance, consider two tables named Sales and Returns. To identify sales records that do not have corresponding return records, you would use the following formula:
EXCEPT(Sales, Returns)
This function is particularly useful in business intelligence scenarios where understanding discrepancies between datasets is crucial for informed decision-making. By utilizing DAX EXCEPT, organizations can enhance their information analysis capabilities, ultimately fostering growth and innovation in a resource-rich environment. Furthermore, the availability of a training module for Power BI users equips them to add calculated tables and columns, which is essential for mastering DAX functions.
For example, consider a recent sales amount of $4,433,004.10 for a Friday. Examining such information using DAX EXCEPT can offer insights into sales performance compared to returns, emphasizing the significance of converting raw information into actionable insights. This aligns with the challenges encountered in utilizing insights from Power BI dashboards, such as time-consuming report creation and inconsistencies in information.
The case study titled “Business Intelligence Empowerment” illustrates how organizations can effectively utilize information analysis to drive growth and innovation, showcasing the critical role of Business Intelligence and RPA in enhancing operational efficiency.
Practical Applications of DAX EXCEPT in Power BI
The DAX function, DAX EXCEPT, which excludes certain values, offers various practical applications that can significantly enhance data analysis skills, especially in today’s complex AI landscape. Here are some key examples:
-
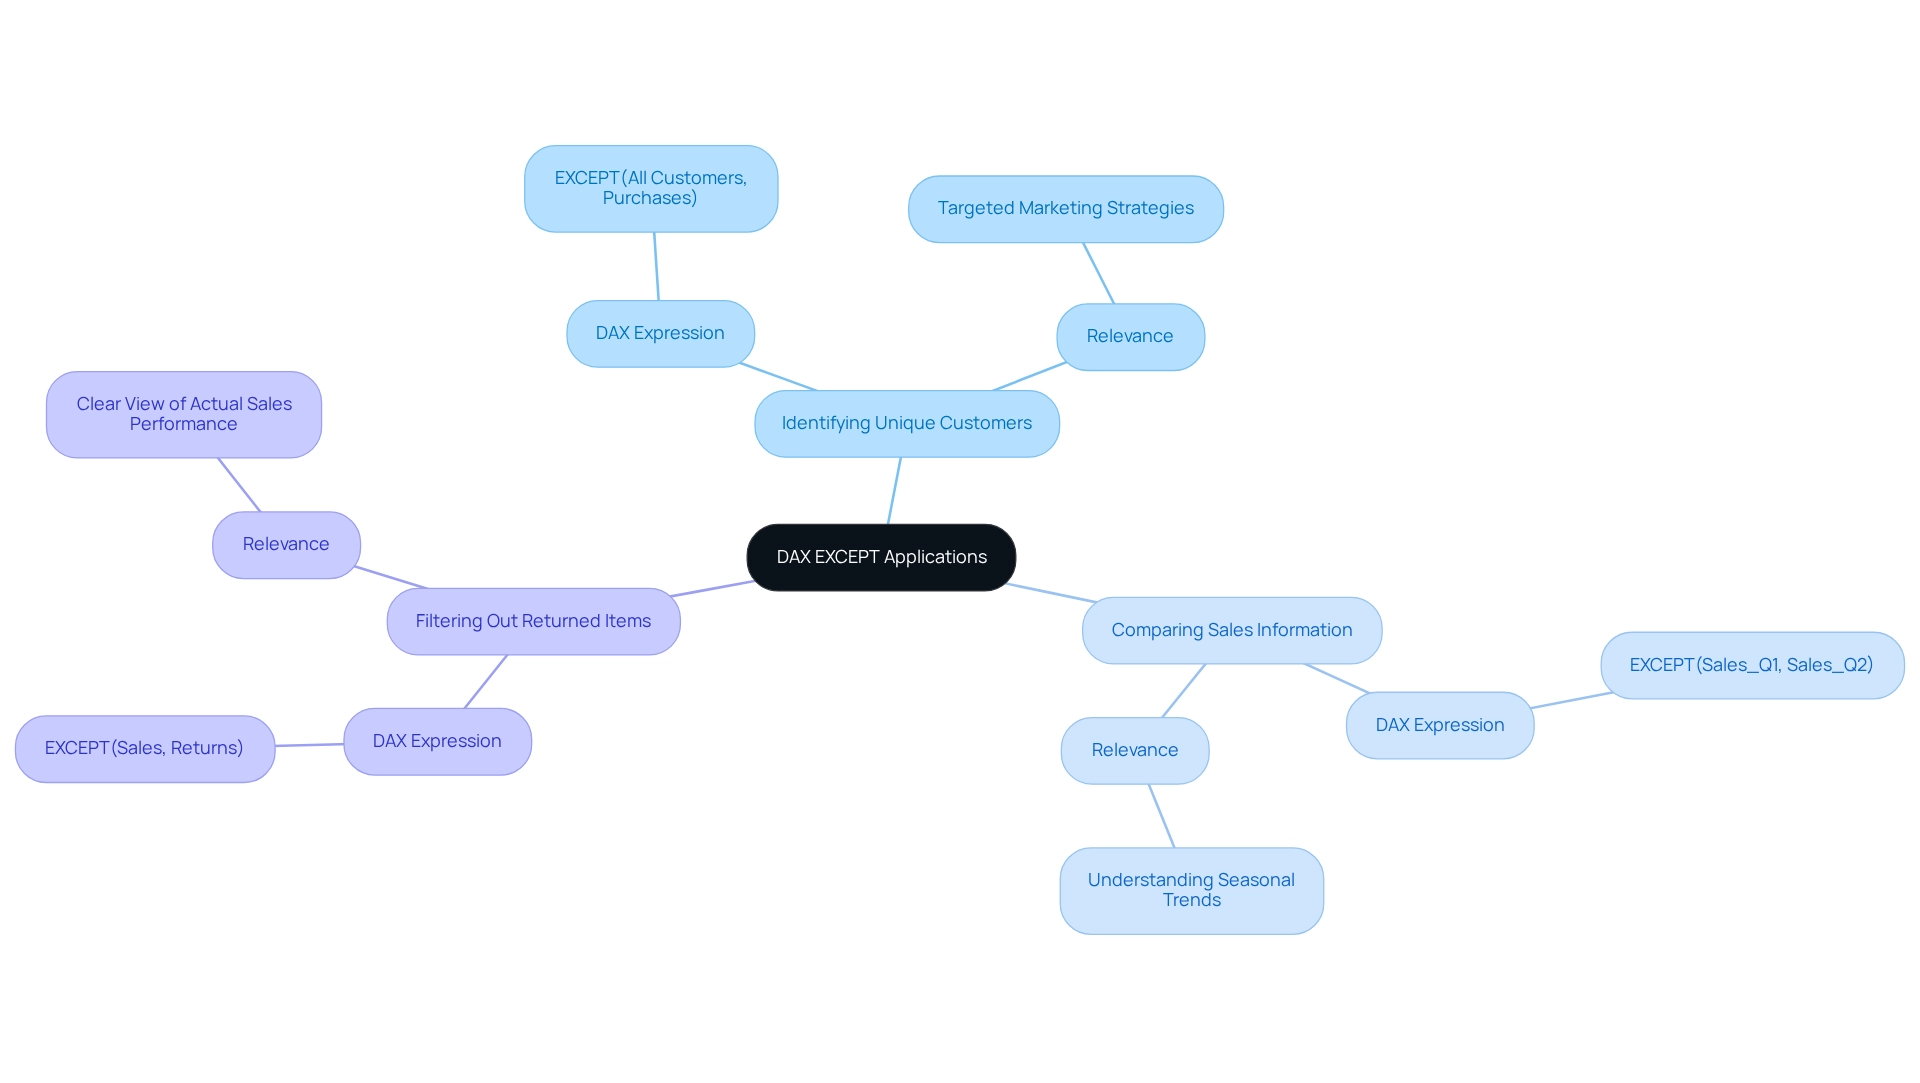
Identifying Unique Customers: By utilizing DAX EXCEPT, businesses can easily pinpoint customers who have not made any purchases. For instance, with a comprehensive table of all customers alongside a separate table for those who have made purchases, the following DAX expression highlights the unique customers:
EXCEPT(All Customers, Purchases)This application is vital for targeted marketing strategies, enabling businesses to engage with potential customers who have yet to convert.
-
Comparing Sales Information: DAX EXCEPT can also be employed to compare sales figures across different periods. For example, to identify which sales records are unique to the first quarter, you can use:
EXCEPT(Sales_Q1, Sales_Q2)This comparison aids in understanding seasonal trends and evaluating the effectiveness of sales strategies over time.
-
Filtering Out Returned Items: Another practical application of DAX EXCEPT is examining sales information without the impact of returned items. By applying the following DAX formula, you can focus on net sales:
EXCEPT(Sales, Returns)This approach ensures that decision-makers have a clearer view of actual sales performance, free from the distortions caused by returns.
These examples illustrate how the DAX EXCEPT function can streamline data analysis by isolating unique records, ultimately enhancing the decision-making process. In a landscape where data-driven insights are paramount, leveraging such capabilities can lead to more informed and strategic business decisions.
Moreover, businesses that struggle to extract meaningful insights may find themselves at a competitive disadvantage. Creatum GmbH’s customized AI solutions can assist in navigating this overwhelming AI environment, improving analytical capabilities and facilitating informed decision-making. Learning DAX functions can be efficient; for instance, the ‘Excel Basics Cheat Sheet’ can be completed in just 18 minutes, emphasizing the ease of acquiring essential skills for operational efficiency.
Furthermore, platforms like TIBCO Spotfire demonstrate the strength of analytical tools, allowing users to effectively examine both historical and real-time information. As Richie Cotton aptly puts it, he spends all day discussing information, highlighting the importance of effective management of information in decision-making. In this context, DAX provides a vital tool for various professionals, including data analysts and business analysts, who rely on data analysis tools to convert raw data into valuable insights that drive decision-making and innovation, ultimately supporting business growth.
Explore how Creatum GmbH can assist you in integrating these insights into your operations.
Common Mistakes to Avoid with DAX EXCEPT
When utilizing the DAX EXCEPT function, it is crucial to be aware of several common pitfalls that can lead to errors and inefficiencies, particularly when leveraging insights from Power BI dashboards.
-
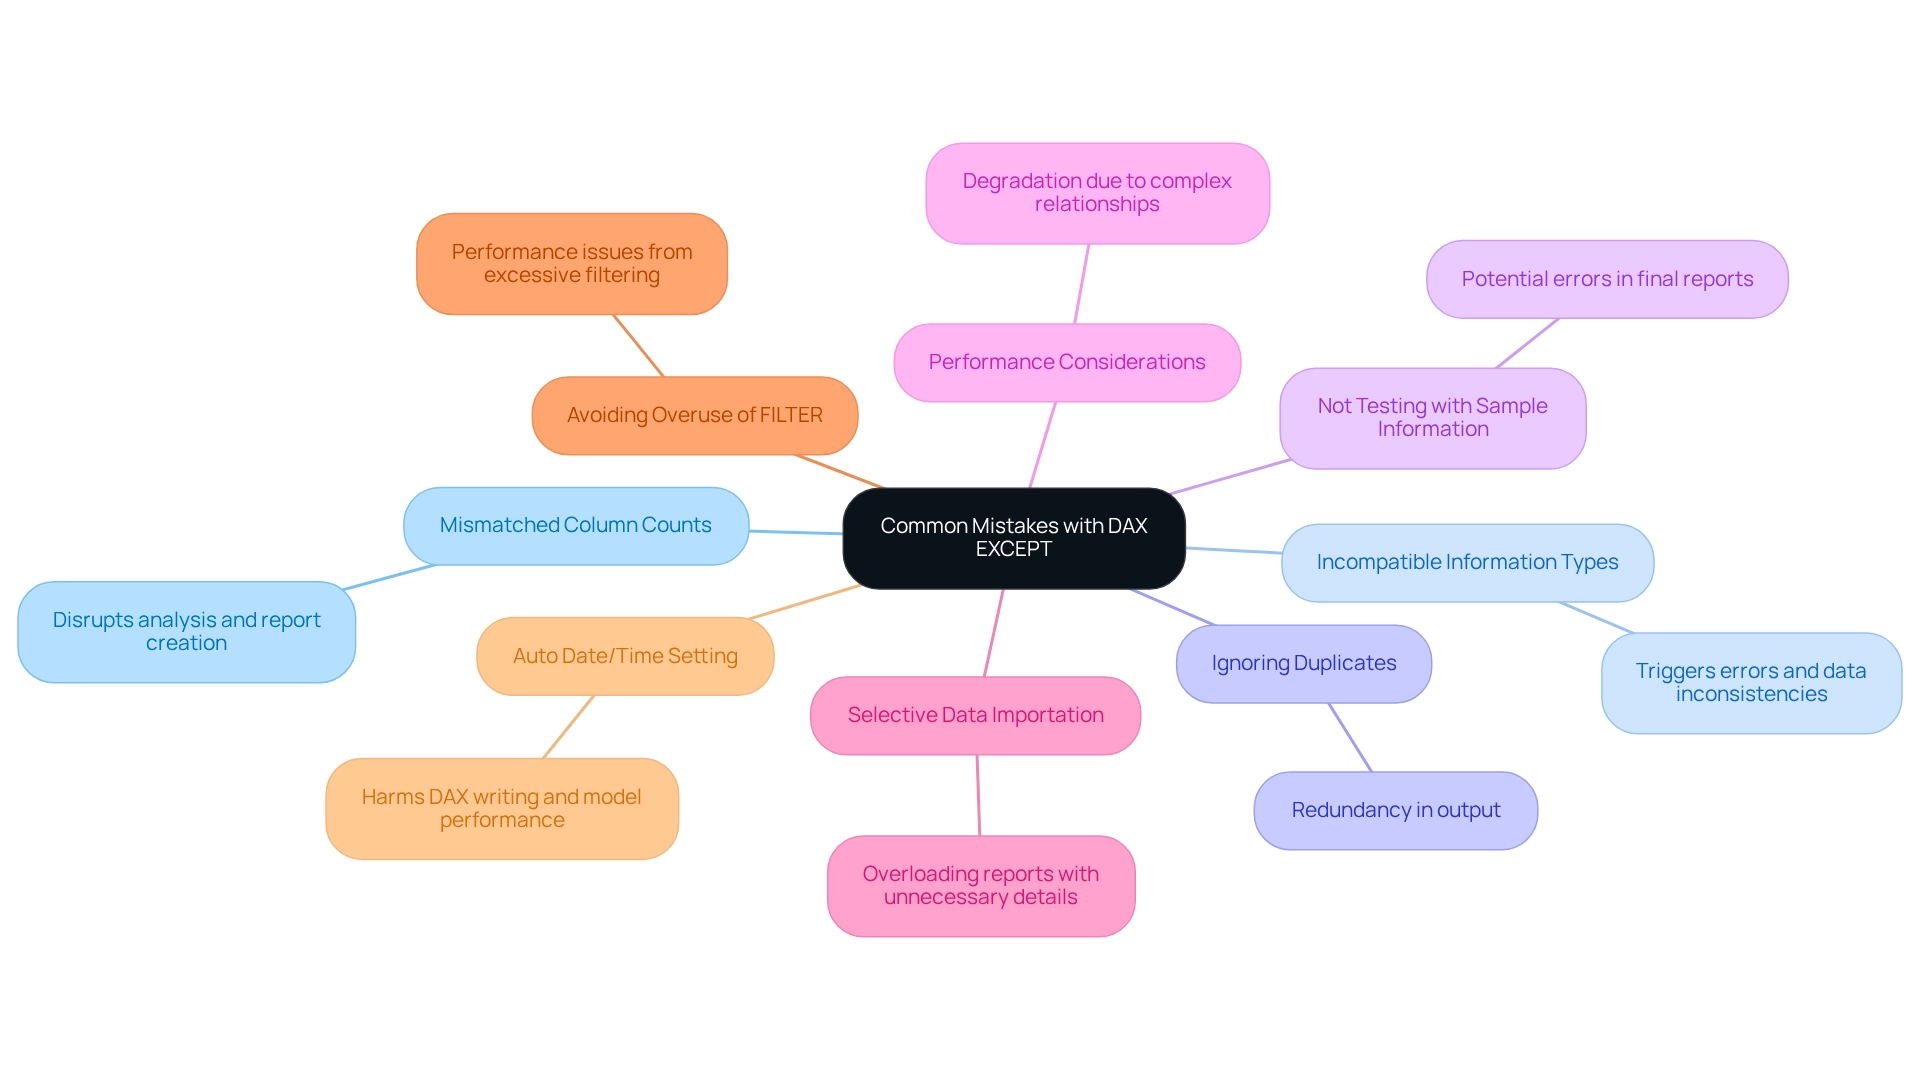
Mismatched Column Counts: Both tables involved in the EXCEPT function must have the same number of columns. A discrepancy in column count will result in an error, disrupting your analysis and potentially leading to time-consuming report creation.
-
Incompatible Information Types: Ensure that the columns being compared share compatible information types. For example, attempting to compare a text column with a numeric column will trigger errors, undermining the integrity of your results and contributing to data inconsistencies across reports.
-
Ignoring Duplicates: The exclusion method keeps duplicates from the initial table. If your analysis necessitates unique outcomes, it is recommended to utilize the DISTINCT function along with the alternative. For instance:
DISTINCT(EXCEPT(Sales, Returns))
This approach ensures that your output is free from redundancy, enhancing the clarity of your data and providing actionable guidance for stakeholders.
-
Not Testing with Sample Information: Before utilizing DAX expressions on larger datasets, always conduct tests with sample information. This practice allows you to verify that your expressions yield the expected results, thereby preventing potential errors in your final reports and ensuring that insights are effectively leveraged.
-
Performance Considerations: Be mindful of Bi-Di and M2M relationships, as they can lead to performance degradation by requiring the engine to navigate more pathways and verify more information points. This highlights the significance of information integrity and effective DAX application in enhancing operational efficiency.
-
Selective Data Importation: As noted by Power BI Expert Mark Endicott, “Do not think it’s ok to import every table from your relational database into your model.” This emphasizes the necessity for careful choice of information to enhance performance and prevent overloading your reports with superfluous details. This selective approach also ties into the need for a governance strategy to maintain data quality and consistency.
-
Avoiding Overuse of FILTER: A case study on filtering a column reveals that excessive use of the FILTER tool can lead to performance issues. Instead, consider alternative methods for filtering that improve performance, such as using direct column filtering or KEEPFILTERS, which can streamline your reporting process.
-
Auto Date/Time Setting: The Auto Date/Time setting can harm DAX writing, model size, and performance; it lacks flexibility for complex reporting needs. Being aware of this can help you make more informed decisions when designing your DAX models, ultimately enhancing the effectiveness of your insights.
By being mindful of these common mistakes, you can significantly reduce error rates associated with DAX functions, especially DAX EXCEPT, and improve the overall performance of your Power BI reports. Grasping these subtleties is crucial as information volumes continue to increase, ensuring that your reporting stays effective and efficient, thereby aiding informed decision-making that fosters growth and innovation. Furthermore, leveraging Business Intelligence effectively can transform raw data into actionable insights, reinforcing the importance of a robust governance strategy in your reporting processes.
Advanced Techniques for Using DAX EXCEPT
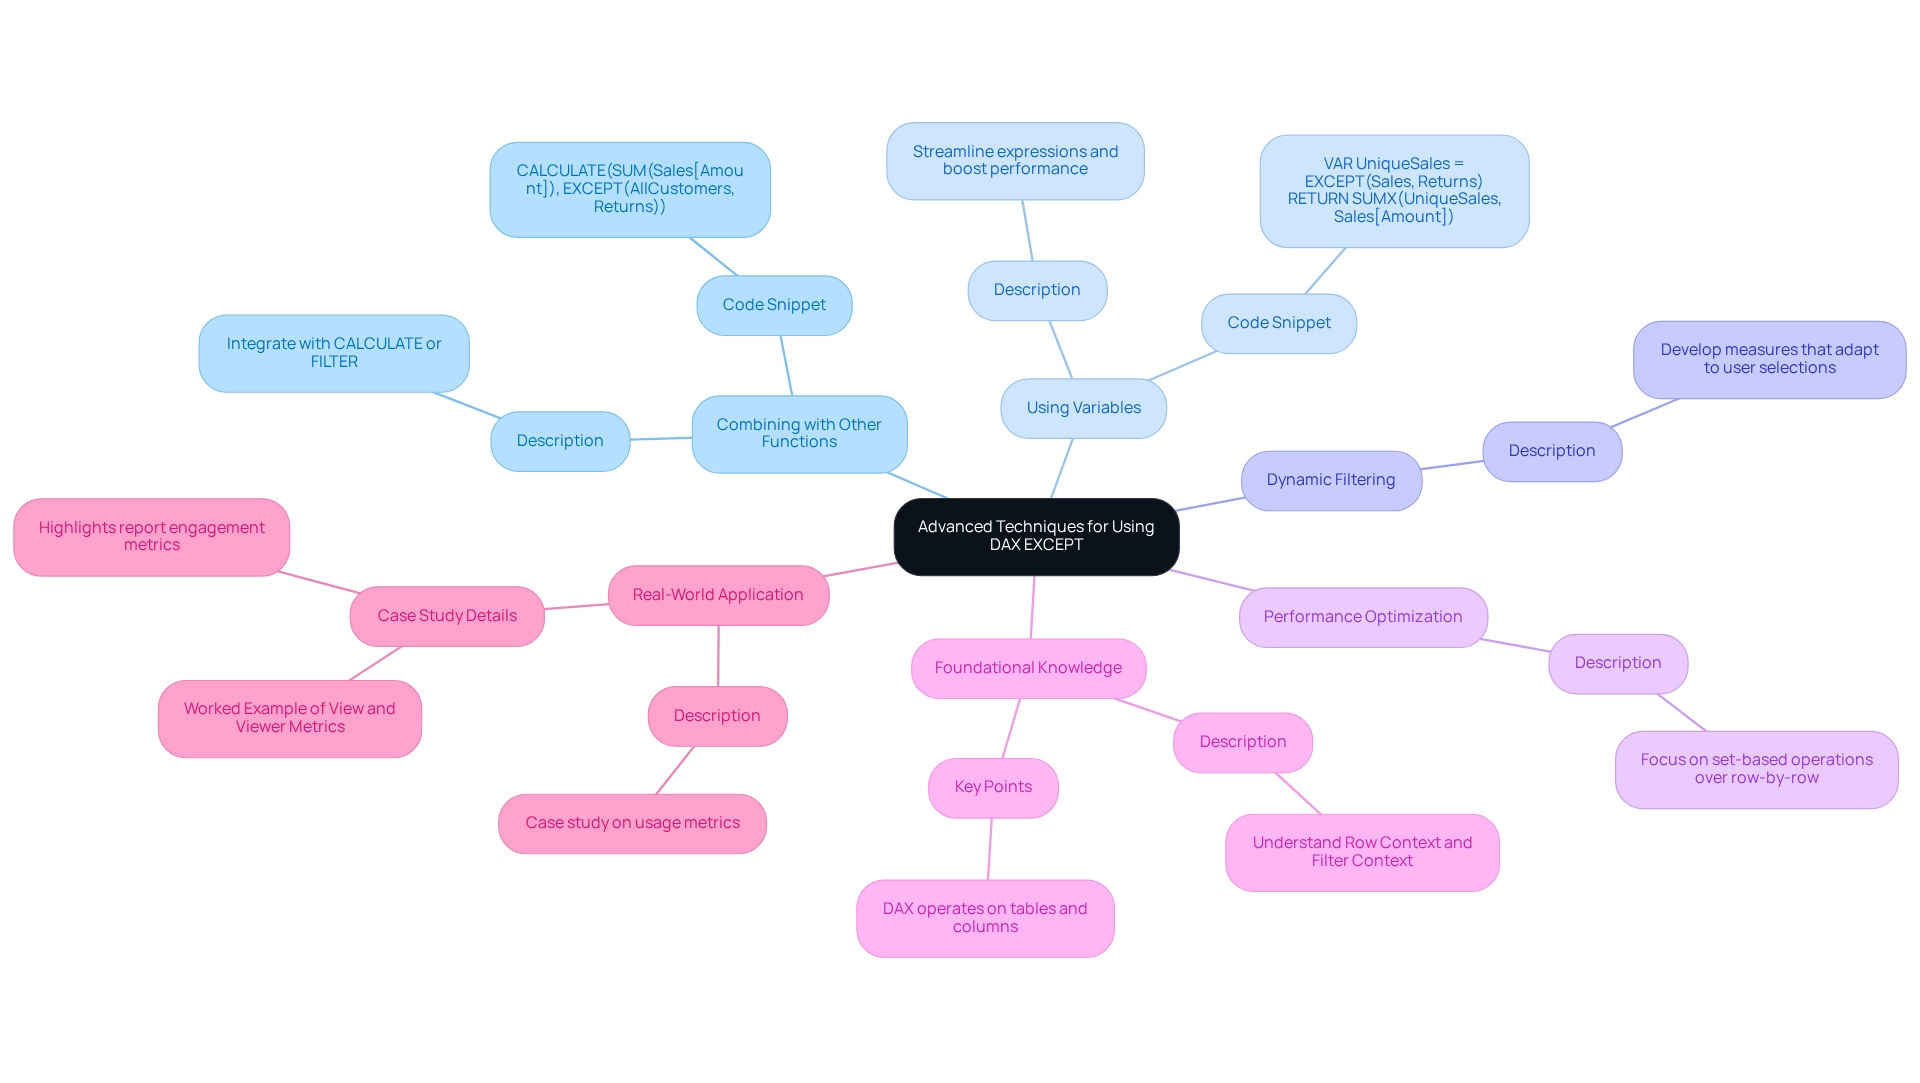
To fully leverage the DAX EXCEPT function, consider implementing advanced techniques that can significantly enhance your analytical capabilities:
-
Combining with Other Functions: Elevate the power of the EXCEPT function by integrating it with other DAX functions such as CALCULATE or FILTER. This strategy facilitates the creation of intricate queries that yield more insightful results. For instance:
CALCULATE(SUM(Sales[Amount]), EXCEPT(AllCustomers, Returns)) -
Using Variables: Streamline complex expressions and boost performance by defining variables. By storing intermediate results, you simplify your calculations. An example of this technique is:
VAR UniqueSales = EXCEPT(Sales, Returns) RETURN SUMX(UniqueSales, Sales[Amount]) -
Dynamic Filtering: Develop dynamic measures that adapt based on user selections within reports. This not only enhances interactivity but also significantly improves user experience, making information exploration more intuitive.
-
Performance Optimization: When managing large datasets, optimizing your DAX queries is crucial. Focus on reducing row-by-row operations and instead utilize set-based operations. This shift can lead to substantial performance improvements, particularly in environments with high data volume.
-
Foundational Knowledge: DAX operates on tables and columns, governed by two types of context: Row Context and Filter Context. A solid understanding of these concepts is essential for effectively applying advanced techniques.
-
Real-World Application: Consider the case study titled “Worked Example of View and Viewer Metrics,” which illustrates how usage metrics are calculated based on user interactions with multiple reports. This example clarifies the metrics involved in tracking report engagement, enabling users to interpret usage information effectively and apply it to enhance report accessibility and relevance.
Integrating these advanced techniques will not only improve the functionality of your DAX usage but also facilitate more efficient analysis and reporting in Power BI. Additionally, as the AI Skills Fest runs from April 8 to May 28, 2025, it serves as a timely reminder of the importance of continuous learning in DAX and AI, ultimately driving growth and innovation. By leveraging tailored AI solutions, you can navigate the complexities of the AI landscape, while Business Intelligence and Robotic Process Automation (RPA) can further enhance operational efficiency and address the challenges posed by manual, repetitive tasks, enabling data-driven decisions that propel your business forward.
Key Takeaways and Best Practices for DAX EXCEPT
-
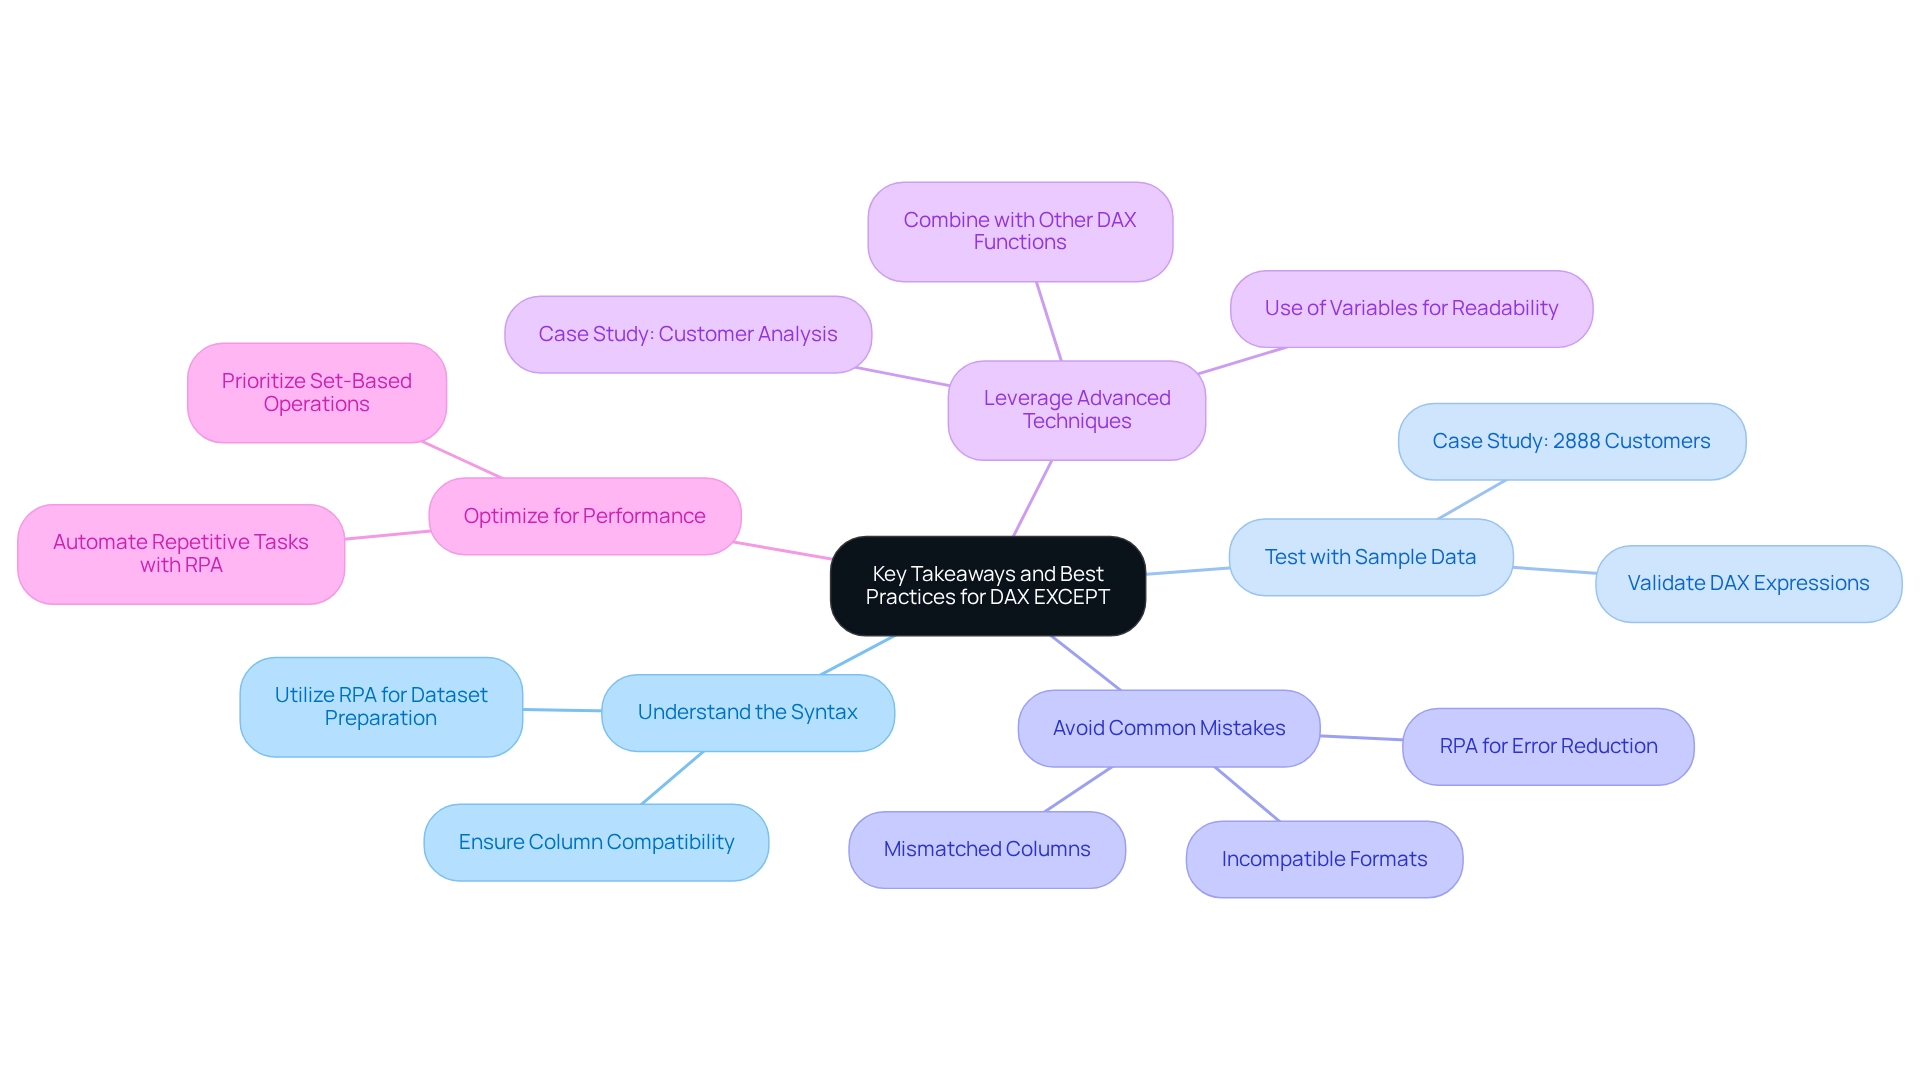
Understand the Syntax: Mastering the syntax of DAX EXCEPT is crucial. Ensure that both tables involved have the same number of columns and that their types are compatible to avoid errors. Utilizing Robotic Process Automation (RPA) can assist in automating the preparation of these datasets, ensuring uniformity and precision in your analysis procedures.
-
Test with Sample Data: Always validate your DAX expressions using sample datasets. This practice helps confirm the accuracy of your calculations before applying them to larger datasets. For example, in a case study, the organization identified 2888 customers who bought in both 2012 and 2013, emphasizing the significance of precise information analysis for customer retention strategies. RPA can facilitate this testing phase by automating information extraction and validation, allowing for quicker insights.
-
Avoid Common Mistakes: Be vigilant about common pitfalls, such as mismatched columns and incompatible formats, which can lead to unexpected results and hinder your analysis. Implementing RPA can help reduce these risks by automating checks and ensuring that your sets are correctly formatted before analysis.
-
Leverage Advanced Techniques: Enhance your analyses by combining the EXCEPT function with other DAX functions. Utilizing variables can also simplify complex calculations and improve readability. A practical application of this is demonstrated in the case study named “Identifying Customers Who Purchased in 2012 but Not in 2013,” where the organization altered their analysis method to distinguish between returning and new customers, offering insights into customer retention. RPA can optimize this process by automating the information manipulation needed for such analyses.
-
Optimize for Performance: Prioritize set-based operations to boost performance, particularly when working with large datasets. This approach can significantly reduce processing time and improve overall efficiency. By incorporating RPA into your workflow, you can automate repetitive tasks, enabling your team to concentrate on strategic analysis instead of manual information processing.
Furthermore, consider participating in the forthcoming AI Skills Fest from April 8 to May 28, 2025, which provides 50 days of learning opportunities that could enhance your grasp of DAX capabilities and analysis. By adhering to these best practices and leveraging customized solutions that enhance data quality and simplify AI implementation, you can maximize the effectiveness of DAX EXCEPT, thereby enhancing your data analysis capabilities in Power BI.
Conclusion
The DAX EXCEPT function stands as a vital asset for data analysts aiming to elevate their analytical capabilities within Power BI. By enabling users to pinpoint unique records from overlapping datasets, DAX EXCEPT reveals essential business insights, such as identifying customers who made purchases without returns and comparing sales data across different periods. The practical applications of this function highlight its role in streamlining reporting processes, ultimately fostering more strategic decision-making.
However, to effectively harness DAX EXCEPT, one must grasp its syntax and structure while being mindful of common pitfalls. Challenges like mismatched column counts and incompatible data types can result in errors that obstruct analysis. By steering clear of these issues and adhering to best practices—such as testing with sample data and integrating advanced techniques—organizations can maximize their utilization of DAX EXCEPT to enhance operational efficiency.
As businesses increasingly depend on data-driven insights, mastering DAX functions like EXCEPT becomes essential. Continuous learning opportunities, exemplified by the upcoming AI Skills Fest, underscore the necessity of staying abreast of these tools in the dynamic realm of data analysis. By leveraging DAX EXCEPT in conjunction with other DAX functions, organizations can convert raw data into actionable insights that drive innovation and support informed decision-making, ultimately propelling business growth.
Frequently Asked Questions
What is the DAX exclusion mechanism in Power BI?
The DAX exclusion mechanism, specifically the DAX EXCEPT function, allows users to compare two tables and retrieve rows from the first table that are absent in the second. This is useful for identifying unique records in data analysis scenarios.
How can the DAX EXCEPT function be applied in a practical scenario?
For example, if you have a list of customers who made purchases and another list of customers who returned items, you can use the DAX EXCEPT function to quickly identify which customers made purchases without returning any items, providing insights into customer behavior.
What are the benefits of using the DAX EXCEPT function?
The DAX EXCEPT function enhances operational efficiency by identifying unique records, streamlining reporting processes, and reducing the time spent on manual reconciliation, allowing teams to focus on more strategic activities.
What is the structure of the DAX EXCEPT function?
The DAX EXCEPT function is structured as follows: EXCEPT(
What are the requirements for using the DAX EXCEPT function?
Both tables used in the DAX EXCEPT function must have an identical number of columns, and the types of these columns must be compatible.
Can you provide an example of using the DAX EXCEPT function?
To identify sales records that do not have corresponding return records, you would use the formula: EXCEPT(Sales, Returns).
How does the DAX EXCEPT function contribute to business intelligence?
By utilizing DAX EXCEPT, organizations can enhance their information analysis capabilities, helping to identify discrepancies between datasets, which is crucial for informed decision-making and driving growth and innovation.
What additional resources are available for mastering DAX functions in Power BI?
There are training modules available for Power BI users that equip them to add calculated tables and columns, which are essential for mastering DAX functions.
What challenges does the DAX EXCEPT function help address in Power BI?
The DAX EXCEPT function helps address challenges such as time-consuming report creation and inconsistencies in information, ultimately leading to improved information quality and precision in reporting.
What event emphasizes the importance of mastering tools like Power BI?
The upcoming AI Skills Fest from April 8 to May 28, 2025, highlights the necessity of continuous learning and mastery of tools like Power BI for professionals in the evolving landscape of data analysis.

