Overview
This article delves into the effective utilization of the DAX GROUPBY function, a critical tool for data analysts aiming to summarize and analyze datasets in Power BI and Excel. By examining the function’s syntax and practical applications, it lays a foundation for understanding its pros and cons.
The discussion emphasizes best practices, highlighting the necessity of grasping grouping techniques to enhance data insights and operational efficiency. Moreover, it addresses how this understanding can be significantly augmented when paired with Robotic Process Automation (RPA), streamlining data handling processes for better outcomes.
Introduction
In the realm of data analysis, the DAX GROUPBY function stands out as a pivotal tool that empowers analysts to distill vast datasets into meaningful summaries. By grouping data according to specified columns, this function facilitates not only the aggregation of information but also enhances the clarity of insights drawn from complex data structures.
As organizations increasingly adopt data-driven strategies, mastering GROUPBY becomes essential for those aiming to optimize workflows and make informed decisions. In a landscape where efficiency is paramount, understanding the intricacies of this function—alongside its practical applications and potential pitfalls—can significantly elevate the analytical capabilities of professionals in fields such as business intelligence and operational management.
Understanding the DAX GROUPBY Function
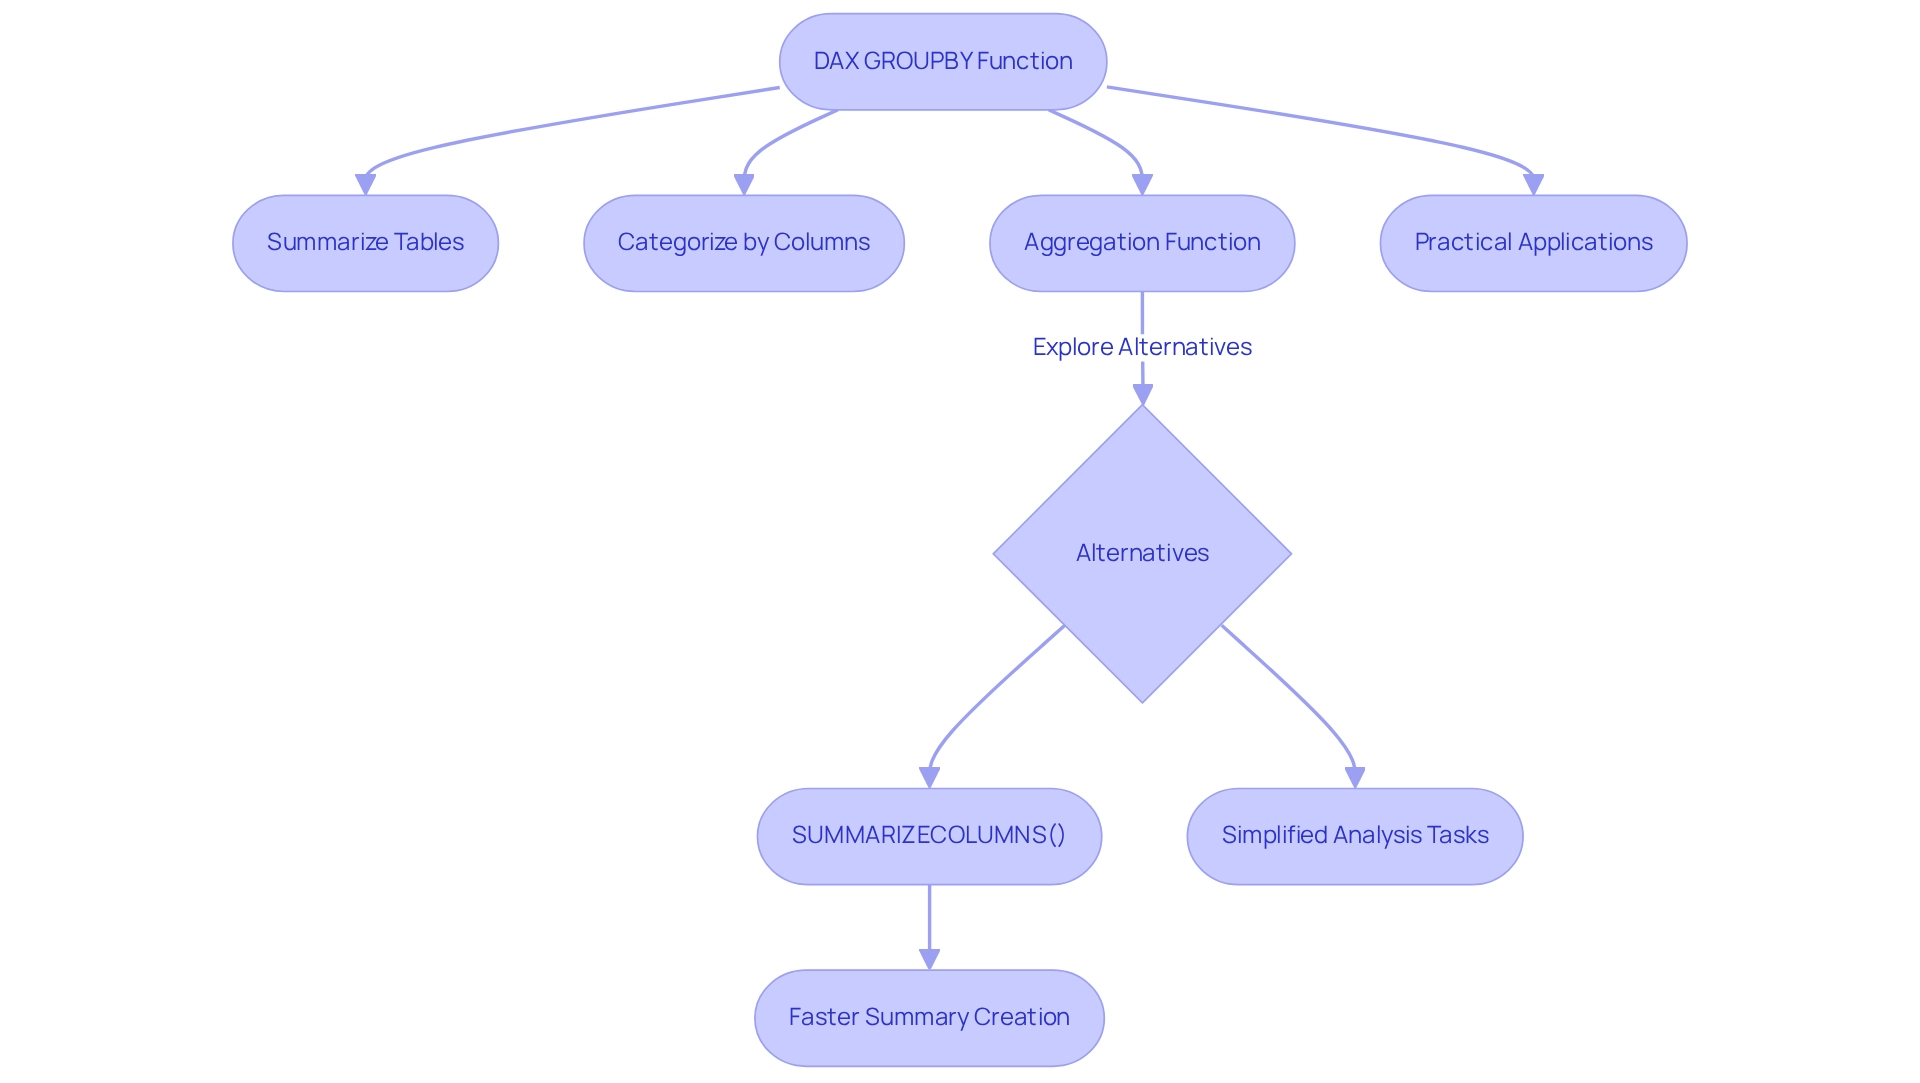
The DAX GROUPBY feature stands as a cornerstone in analysis within Power BI and Excel, empowering users to summarize tables by categorizing them based on specified columns. This feature is vital for consolidating insights and performing computations on grouped datasets, making it an essential tool for analysts aiming to enhance their information manipulation processes, especially in an environment increasingly influenced by Robotic Process Automation (RPA).
Consider a sales table where the goal is to analyze sales information by product category. By employing the aggregation function, a new table can be created that succinctly summarizes sales figures for each category, thereby facilitating clearer insights into performance metrics. This capability is crucial in a rapidly evolving AI landscape, where the ability to extract actionable insights from data significantly boosts operational efficiency.
Statistics reveal that mastering Excel basics can be accomplished in just 18 minutes, underscoring the accessibility of tools like DAX for improving operational efficiency. Additionally, alternatives to DAX GROUPBY, such as SUMMARIZECOLUMNS(), offer faster summary table creation, while DAX GROUPBY excels in straightforward grouping operations. It is imperative for analysts to weigh these alternatives to choose the most suitable option for their specific needs, particularly when faced with challenges like time-consuming report generation and data inconsistencies.
As Laiba Siddiqui, a content strategist, notes, “I’m a content strategist who enjoys clarifying intricate subjects,” which resonates with the goal of making data analysis more approachable through effective DAX expression usage. Practical applications of the aggregation function highlight its versatility. For instance, a case study demonstrated that utilizing a grouping technique allowed analysts to efficiently summarize complex datasets, resulting in improved performance and expedited decision-making processes.
This aligns with expert perspectives emphasizing the importance of categorization in simplifying analysis tasks and driving business growth through enhanced insights.
Moreover, RPA solutions from Creatum GmbH can automate the manual tasks associated with DAX operations, addressing the challenges of report generation and data inconsistencies. As the field of analysis evolves, staying abreast of the latest advancements in the DAX GROUPBY feature in Power BI is crucial. These updates not only enhance operational capabilities but also empower analysts to extract deeper insights from their data, ultimately fostering informed decision-making and strategic growth.
Furthermore, guidelines on organizing rows and columns, inserting values, and applying filtering in spreadsheets are essential skills that enhance the use of DAX tools in analysis, further supported by RPA solutions that automate repetitive tasks and improve overall efficiency.
Syntax and Parameters of GROUPBY
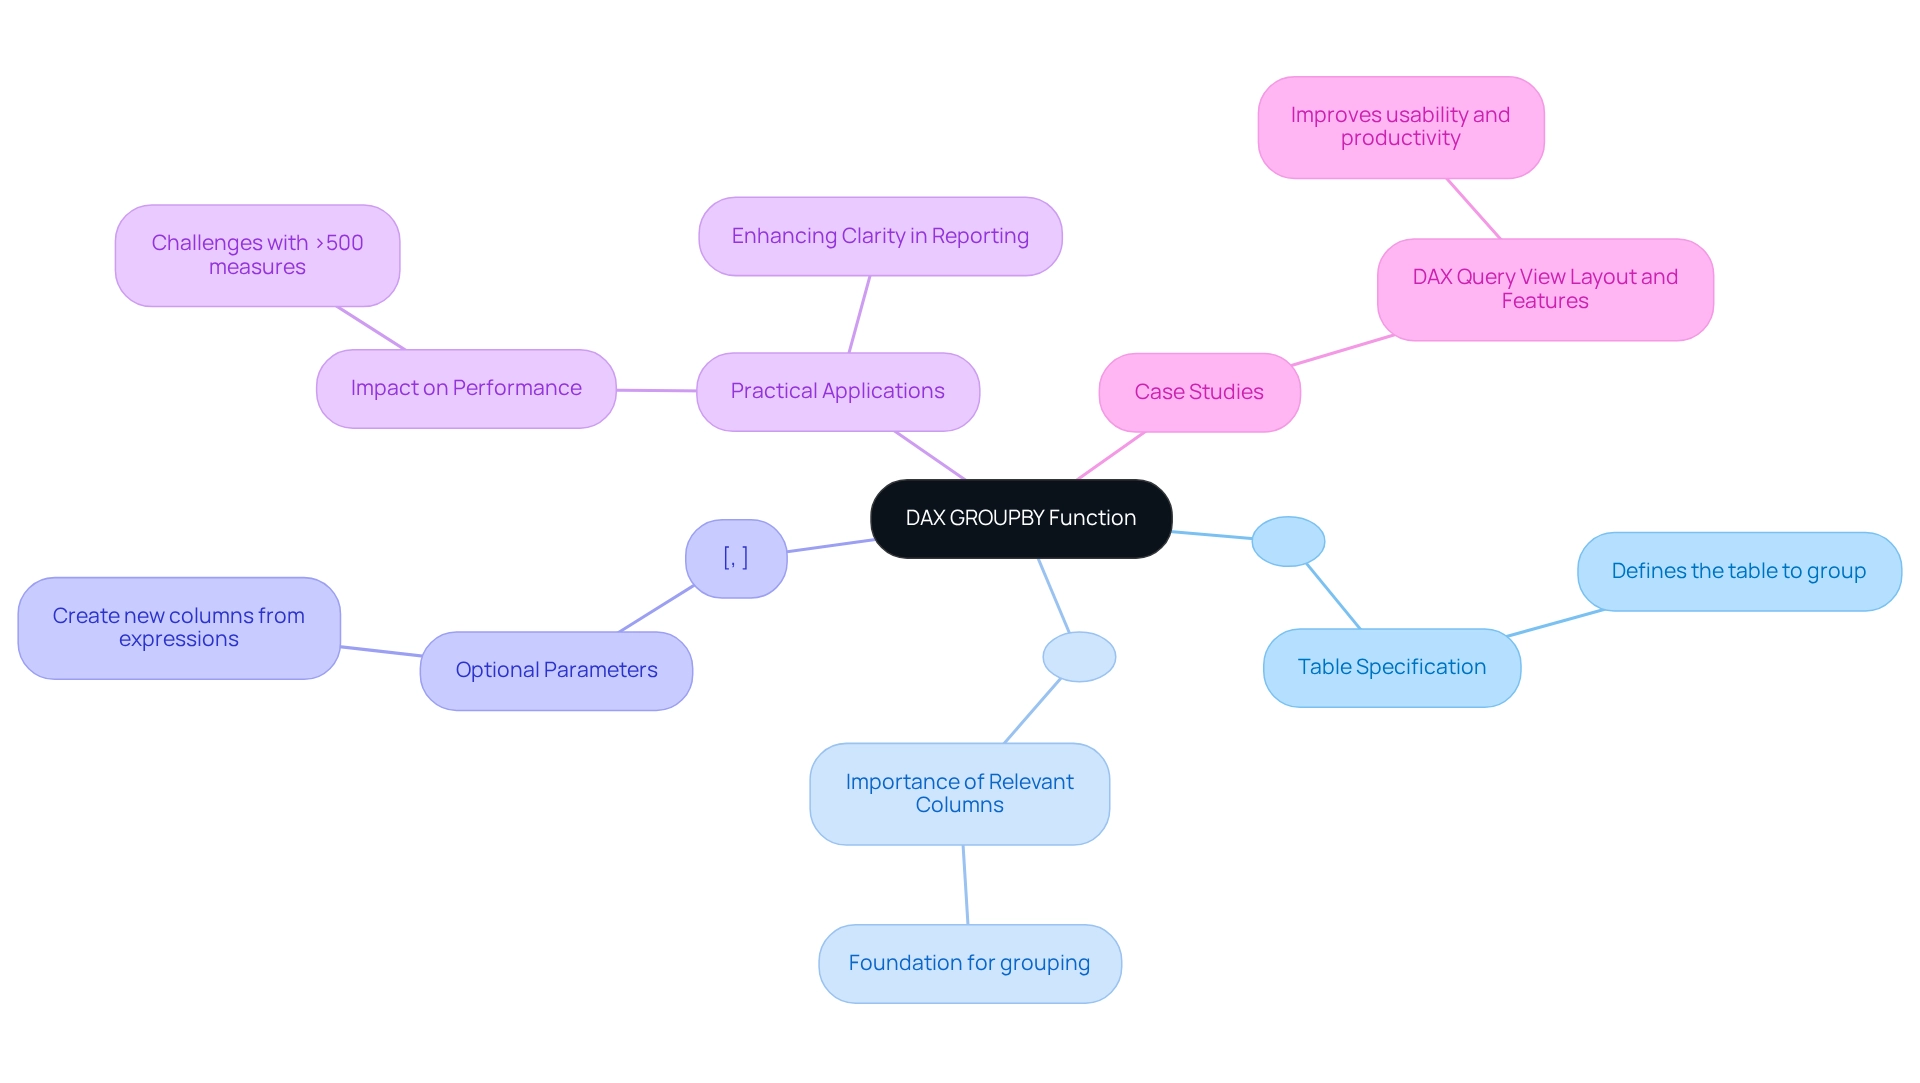
The syntax for the GROUPBY function in DAX is structured as follows:
group by(<table>, <group by_column name>, [<name>, <expression>])
: This parameter specifies the table you wish to group.
- <groupBy_columnName>: Here, you specify the column(s) that will act as the foundation for grouping the information using DAX GROUPBY.
- [
, : These optional parameters facilitate the creation of new columns derived from specified expressions, allowing for more intricate analysis.]
Example: To group a sales table by ‘ProductCategory’, the syntax would be:
GROUPBY(Sales, Sales[ProductCategory])
Utilizing the GROUPBY function effectively can significantly enhance your data modeling capabilities, particularly in the context of Business Intelligence at Creatum GmbH. In today’s information-rich environment, where extracting meaningful insights is crucial for maintaining a competitive edge, effective grouping can streamline analysis and enhance the clarity of insights derived from Power BI dashboards.
When organizing information, it is crucial to ensure that the columns utilized for grouping are clearly defined and pertinent to the analysis at hand. This practice not only improves operational efficiency but also addresses common challenges such as time-consuming report generation and inconsistencies, which can be alleviated through RPA solutions provided by Creatum GmbH.
In terms of usage statistics, it is noteworthy that defining measures in a model becomes challenging when exceeding 500 measures. This limitation underscores the significance of efficient grouping with DAX GROUPBY to sustain performance and manageability in your models. Furthermore, recent updates to the DAX syntax have introduced enhancements that facilitate better organization and readability of queries, making it simpler for analysts to manage complex datasets.
As Aditya Sharma observes, “Discover how to utilize the RELATED DAX feature in Power BI to streamline information modeling and create insightful reports.” This emphasizes the significance of comprehending different DAX capabilities, including aggregation, to improve data analysis and foster business expansion.
For practical applications, consider a case study where the DAX query view features, such as commenting and uncommenting lines of code, have been employed to improve query management. This functionality allows users to write cleaner and more organized queries, ultimately boosting productivity and enabling more insightful reporting. The DAX query view includes a ribbon with common actions for writing DAX queries, which aids in query management and enhances overall productivity.
Return Values of the GROUPBY Function
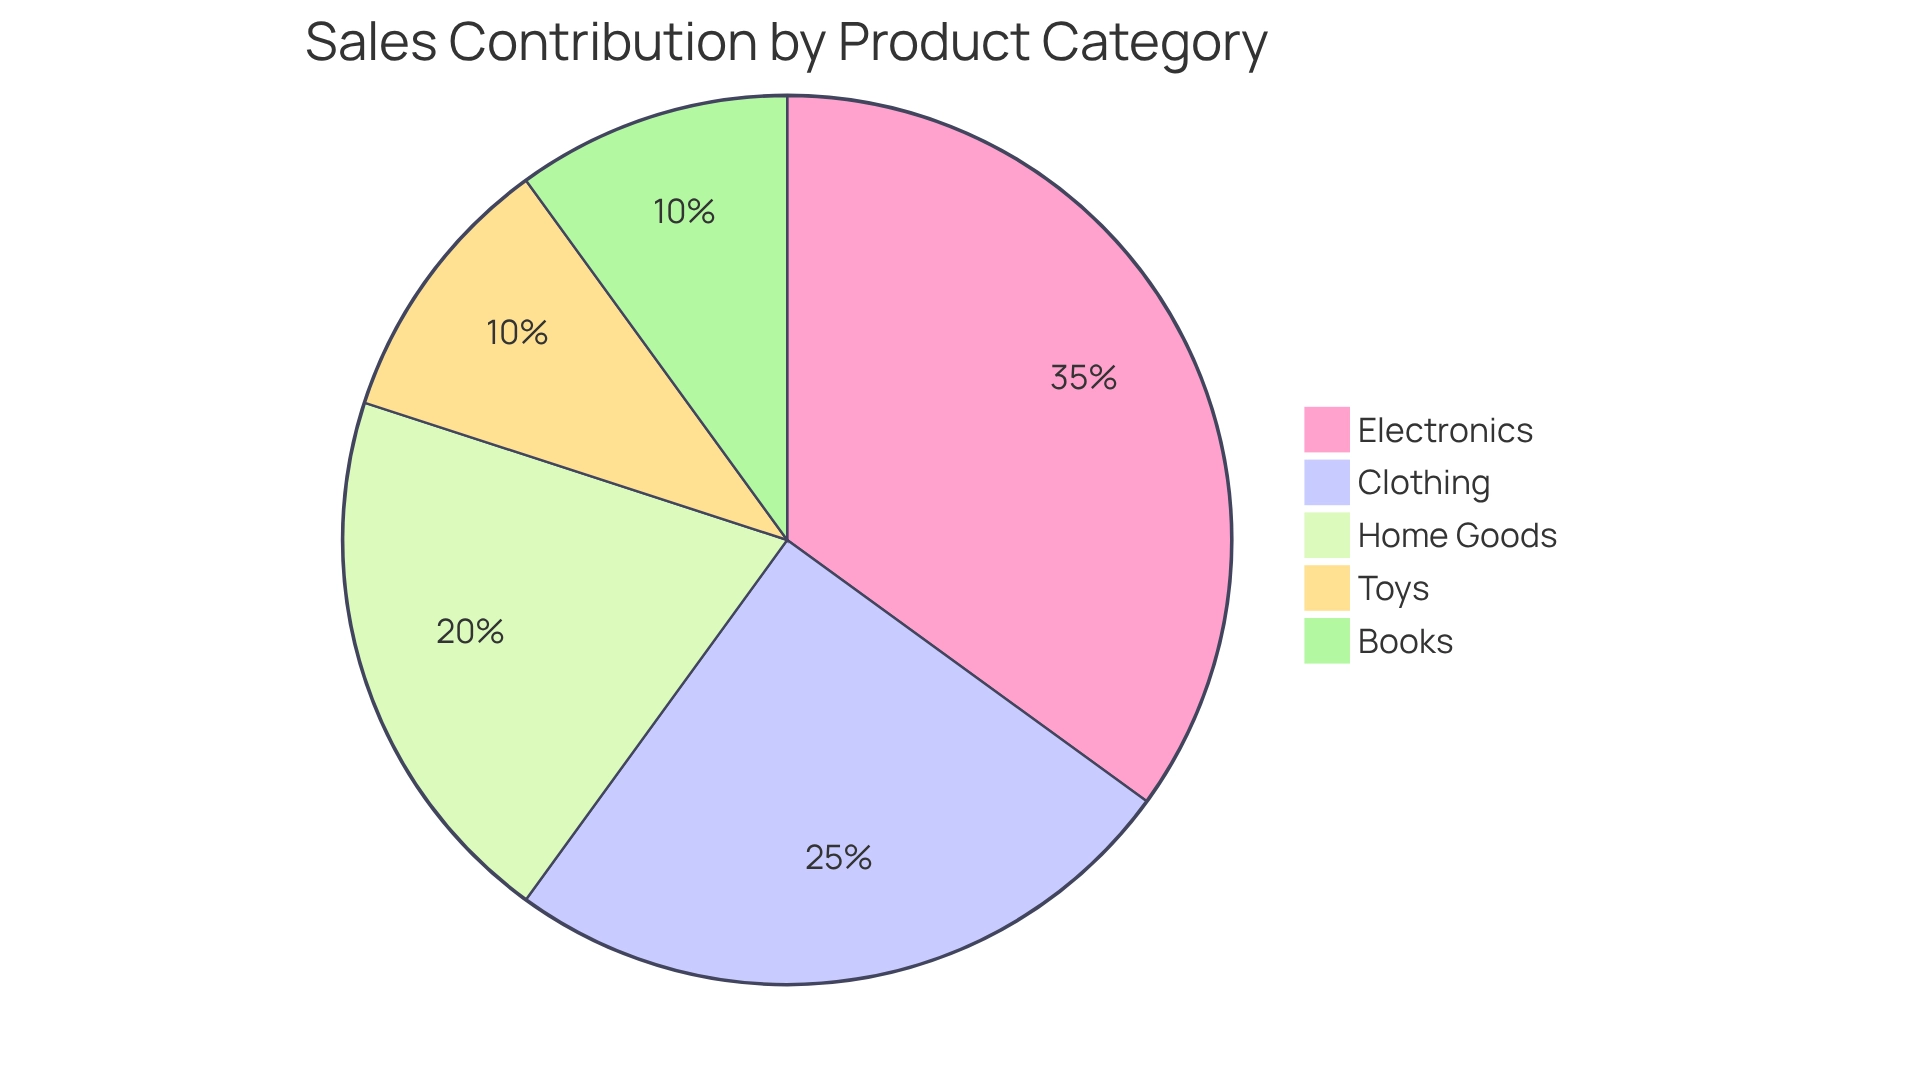
The DAX aggregation tool employs dax groupby to generate a table that features one row for each distinct combination of values in the designated group columns. Consequently, each row in the resulting table signifies a distinct group, while any additional columns defined within the function will present the outcomes of the specified expressions.
For instance, utilizing dax groupby to aggregate data by ‘ProductCategory’ and incorporating a calculation for the sum of ‘SalesAmount’ will yield a result table displaying distinct product categories alongside their corresponding total sales figures. This functionality is essential for analysts, as it offers a clear perspective on how various categories contribute to overall sales performance, ultimately fostering insights that are vital for business growth.
Understanding the return values of the aggregation method is crucial for efficient information analysis. Recent statistics indicate that leveraging DAX capabilities, such as aggregation, can significantly enhance data insights, with numerous analysts reporting improved clarity in their reports. Notably, the Excel Basics Cheat Sheet can be mastered in just 18 minutes, highlighting the accessibility of learning DAX techniques, which resonates effectively with the intended audience.
Moreover, expert opinions emphasize that mastering the return values of data grouping can bolster your Power BI skills, enabling you to extract valuable insights from complex datasets. Joleen Bothma asserts, “Learn what DAX is and explore the essential DAX syntax and features you’ll need to elevate your Power BI skills to the next level.”
In practical applications, the dax groupby function can be pivotal in identifying unique combinations within datasets, which is crucial for making informed business decisions. However, it is important to recognize that when connected live to a published Power BI semantic model, users are unable to view or edit model measures, potentially limiting the functionality of DAX queries.
For example, a case study on the application of dax groupby in sales analysis revealed that organizations could uncover trends and patterns previously concealed in raw data, leading to more strategic operational decisions. Additionally, the DAX query view permits users to comment out lines in their queries, facilitating debugging or temporarily disabling parts of the query without deletion, thus aiding in clarity and organization within complex queries. This aligns with the necessity for enhanced reporting and actionable insights, addressing challenges in consistency and governance for improved decision-making.
To further elevate your information reporting capabilities, consider our Power BI services, including the 3-Day Sprint for rapid report creation and the General Management App for comprehensive management and intelligent reviews. Book a free consultation to discover how our solutions can drive operational efficiency and data-driven insights for your business.
Practical Use Cases for GROUPBY in Data Analysis
The DAX GROUPBY function is a powerful tool that can be effectively utilized in various analytical scenarios, including:
-
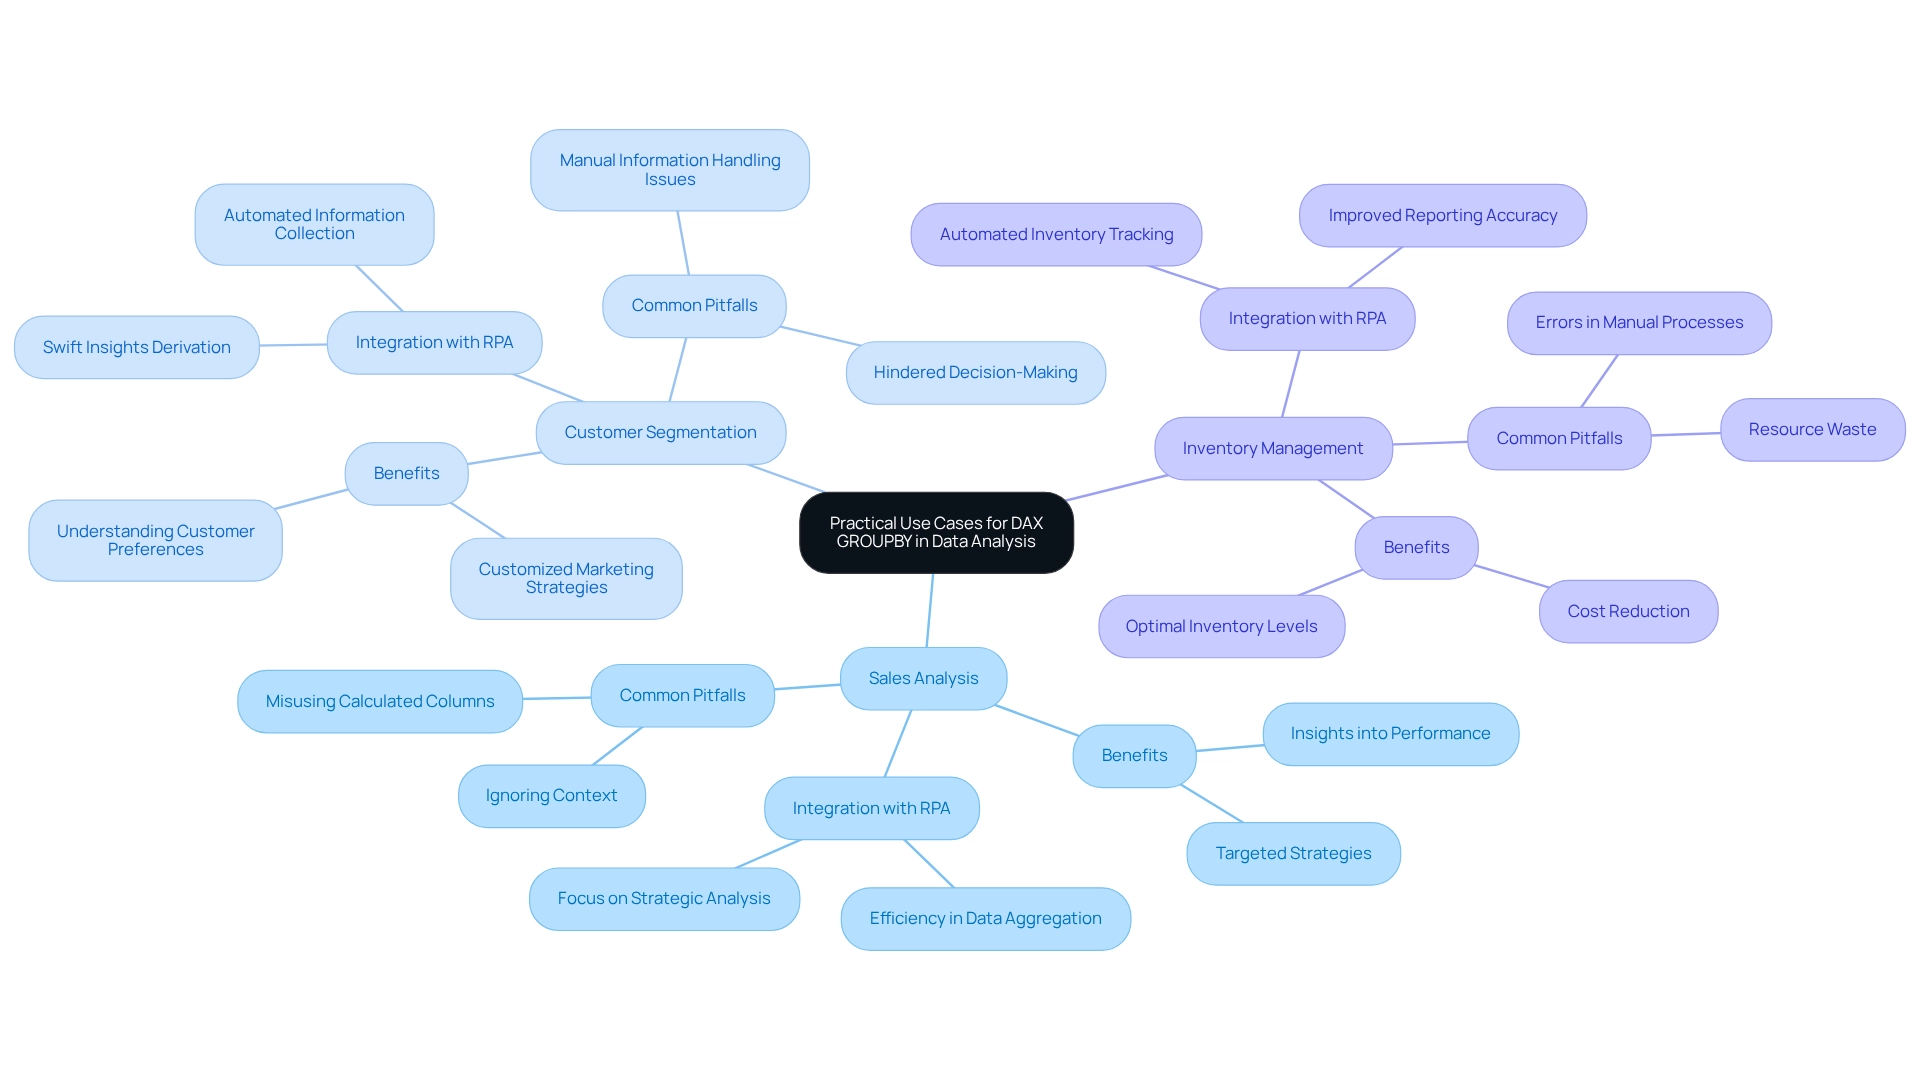
Sales Analysis: By categorizing sales information by region, analysts gain insights into performance across different geographical areas. For instance, summarizing total sales by ‘Region’ and ‘ProductCategory’ enables the identification of high-performing regions and products. This facilitates targeted strategies to boost sales.
Integrating Robotic Process Automation (RPA) enhances this process, reducing the time spent on manual information aggregation and allowing teams to focus on strategic analysis. Manual workflows often lead to wasted time and resources, making RPA an essential tool for efficiency.
-
Customer Segmentation: DAX GROUPBY can classify customer information based on demographics, enabling businesses to customize their marketing strategies. This segmentation aids in understanding customer preferences and behaviors, leading to more effective campaigns. RPA can automate the information collection and segmentation process, ensuring insights are derived swiftly and precisely, thus enhancing operational efficiency. The challenges of manual information handling can hinder timely decision-making, which RPA effectively addresses.
-
Inventory Management: In inventory analysis, organizing product information by category aids in evaluating stock levels and identifying reorder requirements. This application ensures that businesses maintain optimal inventory levels, reducing costs associated with overstocking or stockouts. By integrating RPA, organizations can automate inventory tracking and reporting, further improving efficiency and accuracy. The potential for errors in manual processes can lead to significant resource waste, underscoring the need for automation.
Common Pitfalls: A case study on common pitfalls associated with the GROUPBY function highlights mistakes such as ignoring context, misusing calculated columns, and overlooking relationships. Analysts can enhance report precision and performance by understanding DAX evaluation context and optimizing models. Approaches to avoid these traps include pre-filtering information and simplifying DAX expressions, which can be improved by RPA tools that automate information preparation tasks. Identifying these obstacles is crucial, as they frequently arise from manual procedures that can be optimized through automation.
Real-World Application: A case study on customer segmentation using a grouping method revealed that companies efficiently dividing their customer base experienced a 20% rise in targeted marketing response rates. By grasping the nuances of DAX evaluation context and employing DAX GROUPBY to optimize models, analysts can sidestep common pitfalls, such as misusing calculated columns or overlooking relationships, which can hinder report accuracy and performance. RPA plays a crucial role in this process by automating segmentation and reporting tasks, allowing analysts to focus on deriving actionable insights. The incorporation of RPA not only improves efficiency but also mitigates the risks linked to manual information handling.
Statistics: Recent analyses indicate that organizations investing between $30K and $50K to enhance sales processes have significantly benefited from implementing DAX operations, bolstering their information-driven decision-making capabilities. Furthermore, the introduction of quick measures in Power BI has simplified the calculation process for users unfamiliar with DAX, promoting further exploration and training in DAX functionalities. As one analyst noted, ‘It saves us a ton of time we would otherwise be spending in churning out the code.’ Incorporating RPA into this workflow can further enhance efficiency, enabling teams to leverage insights more effectively and minimize time wasted in manual processes.
In summary, the DAX aggregation tool is a formidable resource for analysts, offering essential insights that drive strategic decisions across sales, customer engagement, and inventory management, particularly when paired with RPA to automate manual workflows and address inefficiencies.
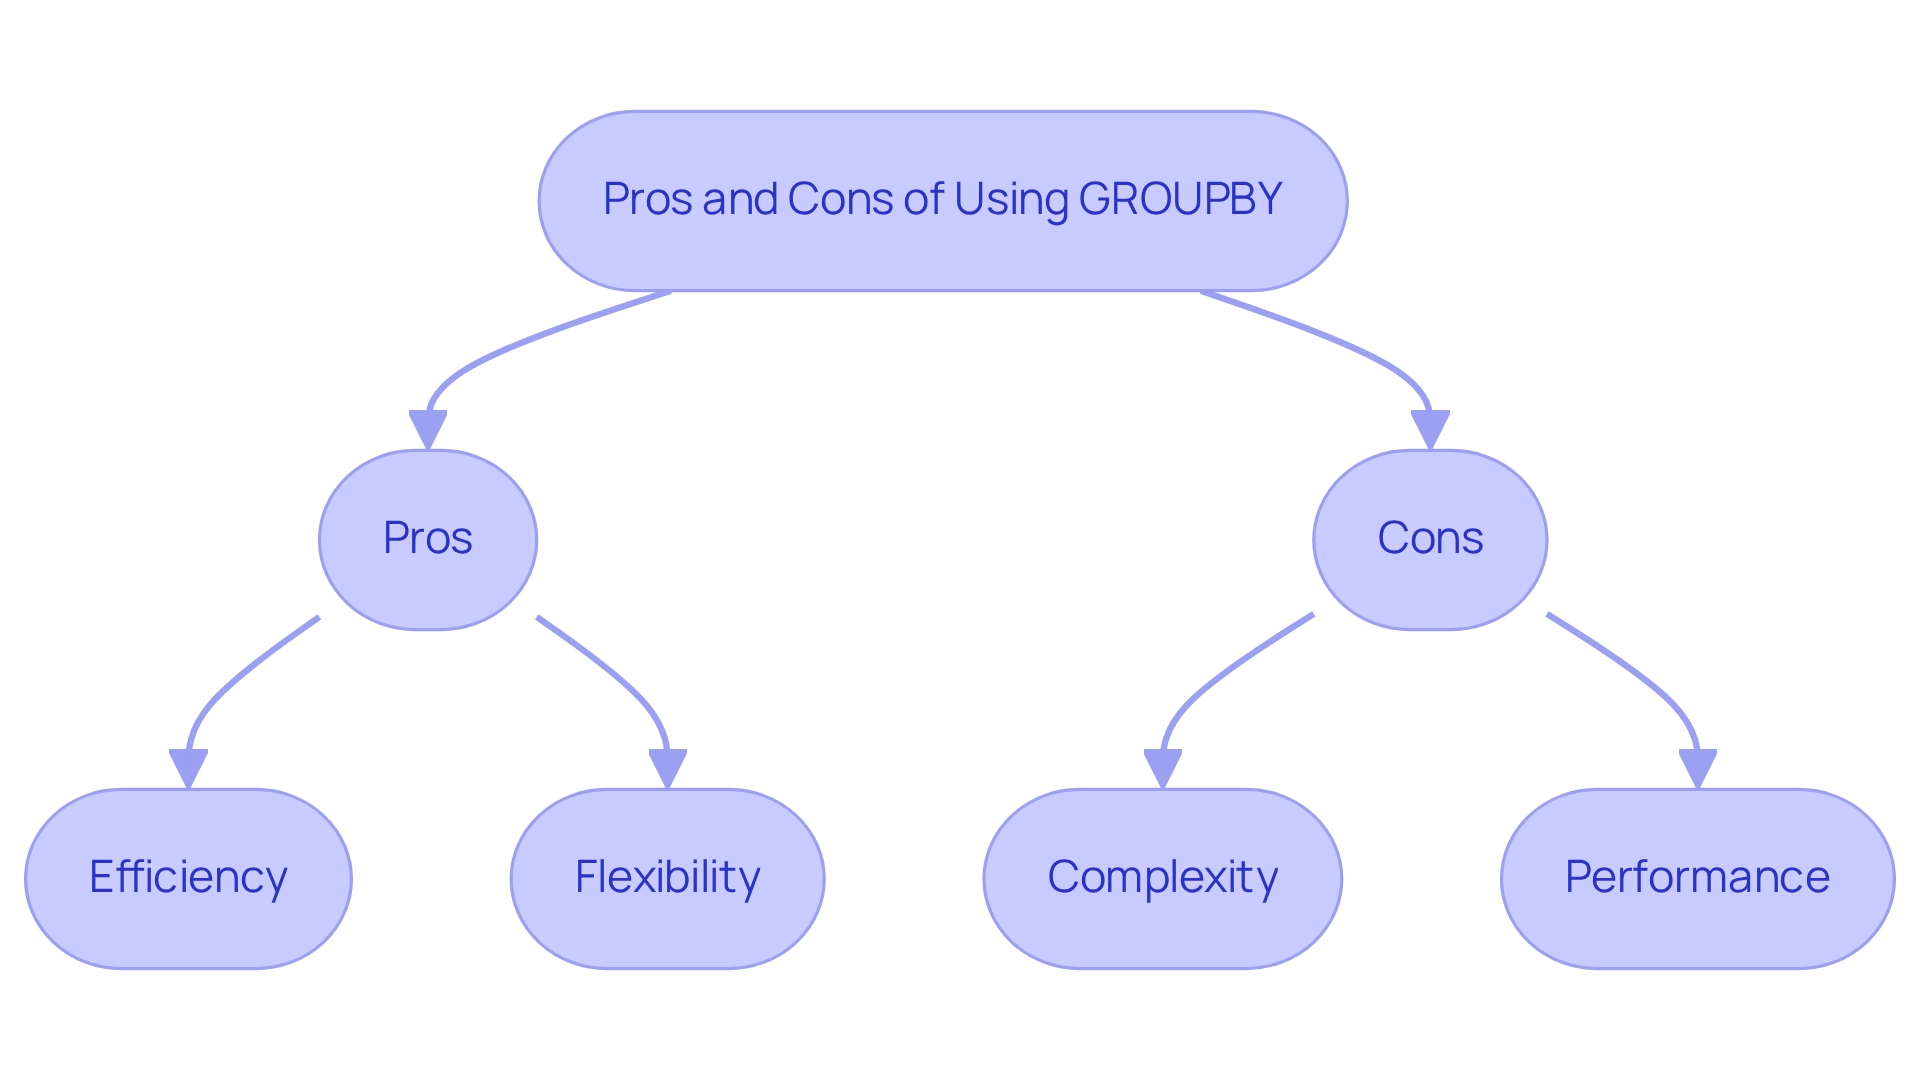
Pros and Cons of Using GROUPBY
Pros:
-
Efficiency: The DAX GROUPBY function frequently surpasses alternatives like SUMMARIZE, especially when managing large datasets. Its streamlined data processing capabilities can drastically reduce computation time, making it a favored option for analysts dealing with extensive data. Users can define all measures within a model to construct comprehensive DAX queries for analysis, further boosting efficiency. This efficiency is critical in an era where Robotic Process Automation (RPA) is increasingly employed to automate manual workflows, allowing teams to concentrate on strategic initiatives. By alleviating the burden of manual, repetitive tasks, RPA empowers analysts to leverage DAX functions more effectively.
-
Flexibility: This function offers remarkable flexibility, enabling users to execute complex aggregations and calculations directly within the grouping. Such capabilities facilitate tailored data analysis that can adapt to specific business needs, enhancing the overall analytical process. As Zoe Douglas, a Product Manager, noted, “Now I have an understanding of how DAX queries function, I can develop my own,” underscoring the ease of use this feature provides. When paired with Business Intelligence tools, this flexibility can drive data-driven insights that support informed decision-making. Tailored AI solutions can further assist users in navigating the complexities of DAX, ensuring they maximize the potential of their analyses.
Cons:
-
Complexity: Despite its power, the syntax of GROUPBY can be daunting for newcomers to DAX. This complexity may lead to errors if users are not meticulous, particularly when crafting intricate queries that necessitate a comprehensive understanding of the function’s mechanics. As organizations increasingly adopt AI solutions to navigate complex data environments, grasping these nuances becomes essential. The challenges posed by manual workflows can complicate this process, making it vital for teams to possess the right tools and support.
-
Performance: Although GROUPBY is typically efficient, its performance can decline if not implemented correctly. In scenarios involving large datasets, improper utilization may result in slower execution times, emphasizing the importance of understanding the subtleties of the process. The integration of the DAX query view with the Performance Analyzer feature in Power BI enables users to record and analyze the performance of visuals and their underlying DAX queries, offering insights into optimizing reports and dashboards. This optimization is critical for effectively leveraging Business Intelligence, ensuring that data insights are both timely and actionable. Failing to extract valuable insights can place companies at a competitive disadvantage, highlighting the importance of mastering DAX functions such as aggregation.
Conclusion:
Evaluating the advantages and disadvantages of DAX GROUPBY is essential for analysts aiming to leverage its capabilities effectively. By considering these elements, analytics experts can make informed decisions about when to utilize aggregation to enhance efficiency and precision in their analyses. The DAX query view also establishes a block to define all measures within a model, further enhancing the flexibility and efficiency of utilizing aggregation functions, particularly in conjunction with RPA and Business Intelligence strategies.
Challenges and Considerations When Using GROUPBY
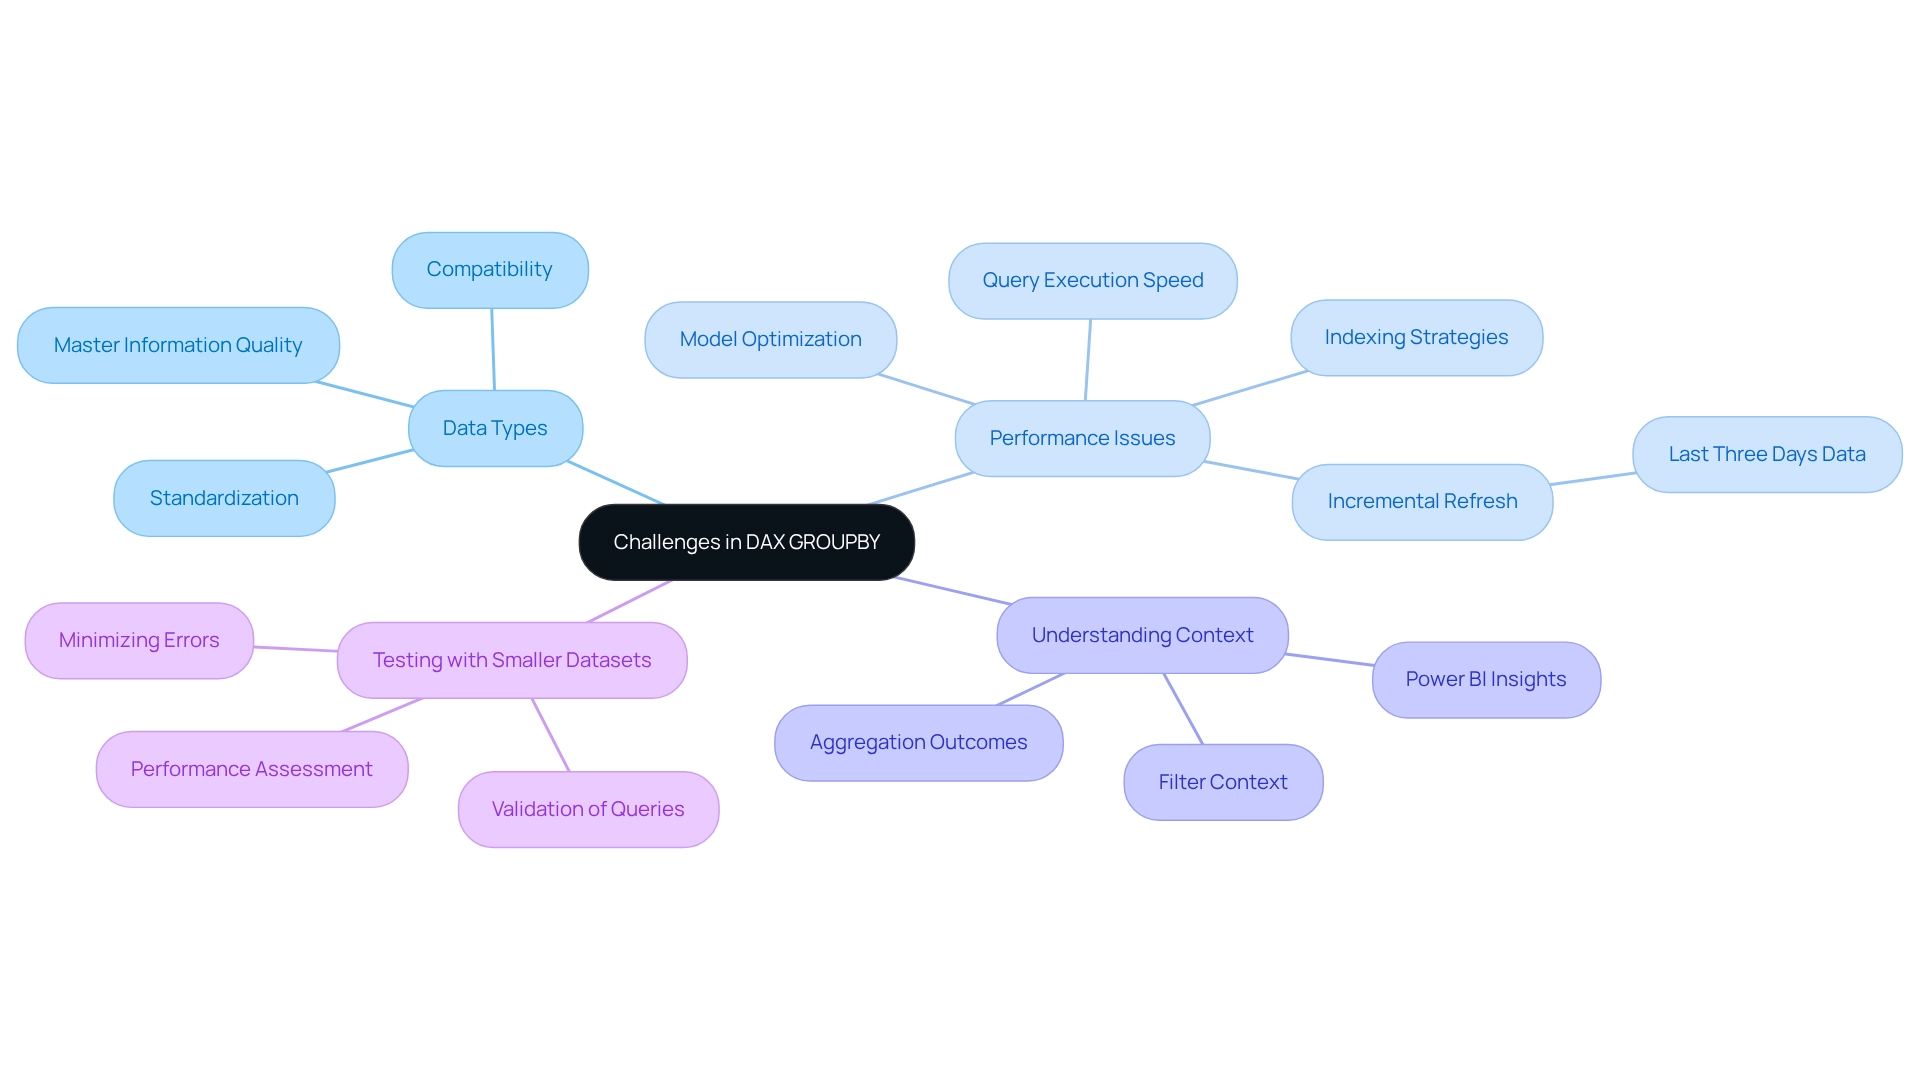
When utilizing the DAX GROUPBY function, analysts face several key challenges that must be navigated to ensure effective data analysis.
-
Data Types: Verifying that the columns designated for grouping are of compatible data types is crucial. Incompatible types can lead to errors that disrupt the analysis process. Therefore, standardizing types before executing GROUPBY queries is essential. Poor master information quality can exacerbate these issues, resulting in inefficient operations and flawed decision-making. Addressing these challenges is vital, as Robotic Process Automation (RPA) can assist in optimizing information management processes, ensuring improved quality and consistency.
-
Performance Issues: Analysts should closely monitor performance, especially when working with large datasets. The DAX GROUPBY function can significantly slow down query execution if not properly optimized. Implementing effective indexing and model optimization strategies can enhance performance, ensuring efficient query execution even with substantial information volumes. Notably, incremental refresh can query and update information for the last three days, which is advantageous for managing large datasets effectively. Utilizing Business Intelligence tools can further streamline this process, converting raw information into actionable insights. Customized AI solutions can also enhance performance by automating repetitive tasks and increasing processing efficiency.
-
Understanding Context: A thorough understanding of filter context is vital, as it directly influences the results produced by GROUPBY. Analysts must recognize how filters applied in the information model can affect aggregation outcomes, potentially leading to unforeseen results if not managed carefully. This comprehension is essential for effectively utilizing insights from Power BI dashboards, where discrepancies can obstruct efficient analysis. RPA can play a significant role in addressing these inconsistencies by automating information validation and cleansing processes.
-
Testing with Smaller Datasets: It is advisable to test aggregation queries on smaller datasets first. This practice allows analysts to validate the functionality and accuracy of their queries, including those using DAX GROUPBY, before scaling them up to larger datasets. This approach minimizes the risk of errors and performance issues. By tackling these challenges, analysts can unlock the full potential of the aggregation method, enhancing their analytical capabilities and ensuring more dependable results.
In the words of Errin O’Connor, “Power BI’s DAX GROUPBY feature enables a range of aggregation operations, including sum, average, count, min, max, and more, offering flexibility in analysis.” For instance, the case study titled ‘Using DAX GROUPBY for Simple Grouping Operations’ demonstrates how the DAX GROUPBY method efficiently computes Total Revenue by Category, highlighting its effectiveness in managing simple grouping activities. Furthermore, this function enhances data analysis by enabling various types of analysis, including time series, cohort, comparative analysis, and data cleaning, further underscoring its value in the analytical process.
Best Practices for Effective Use of GROUPBY
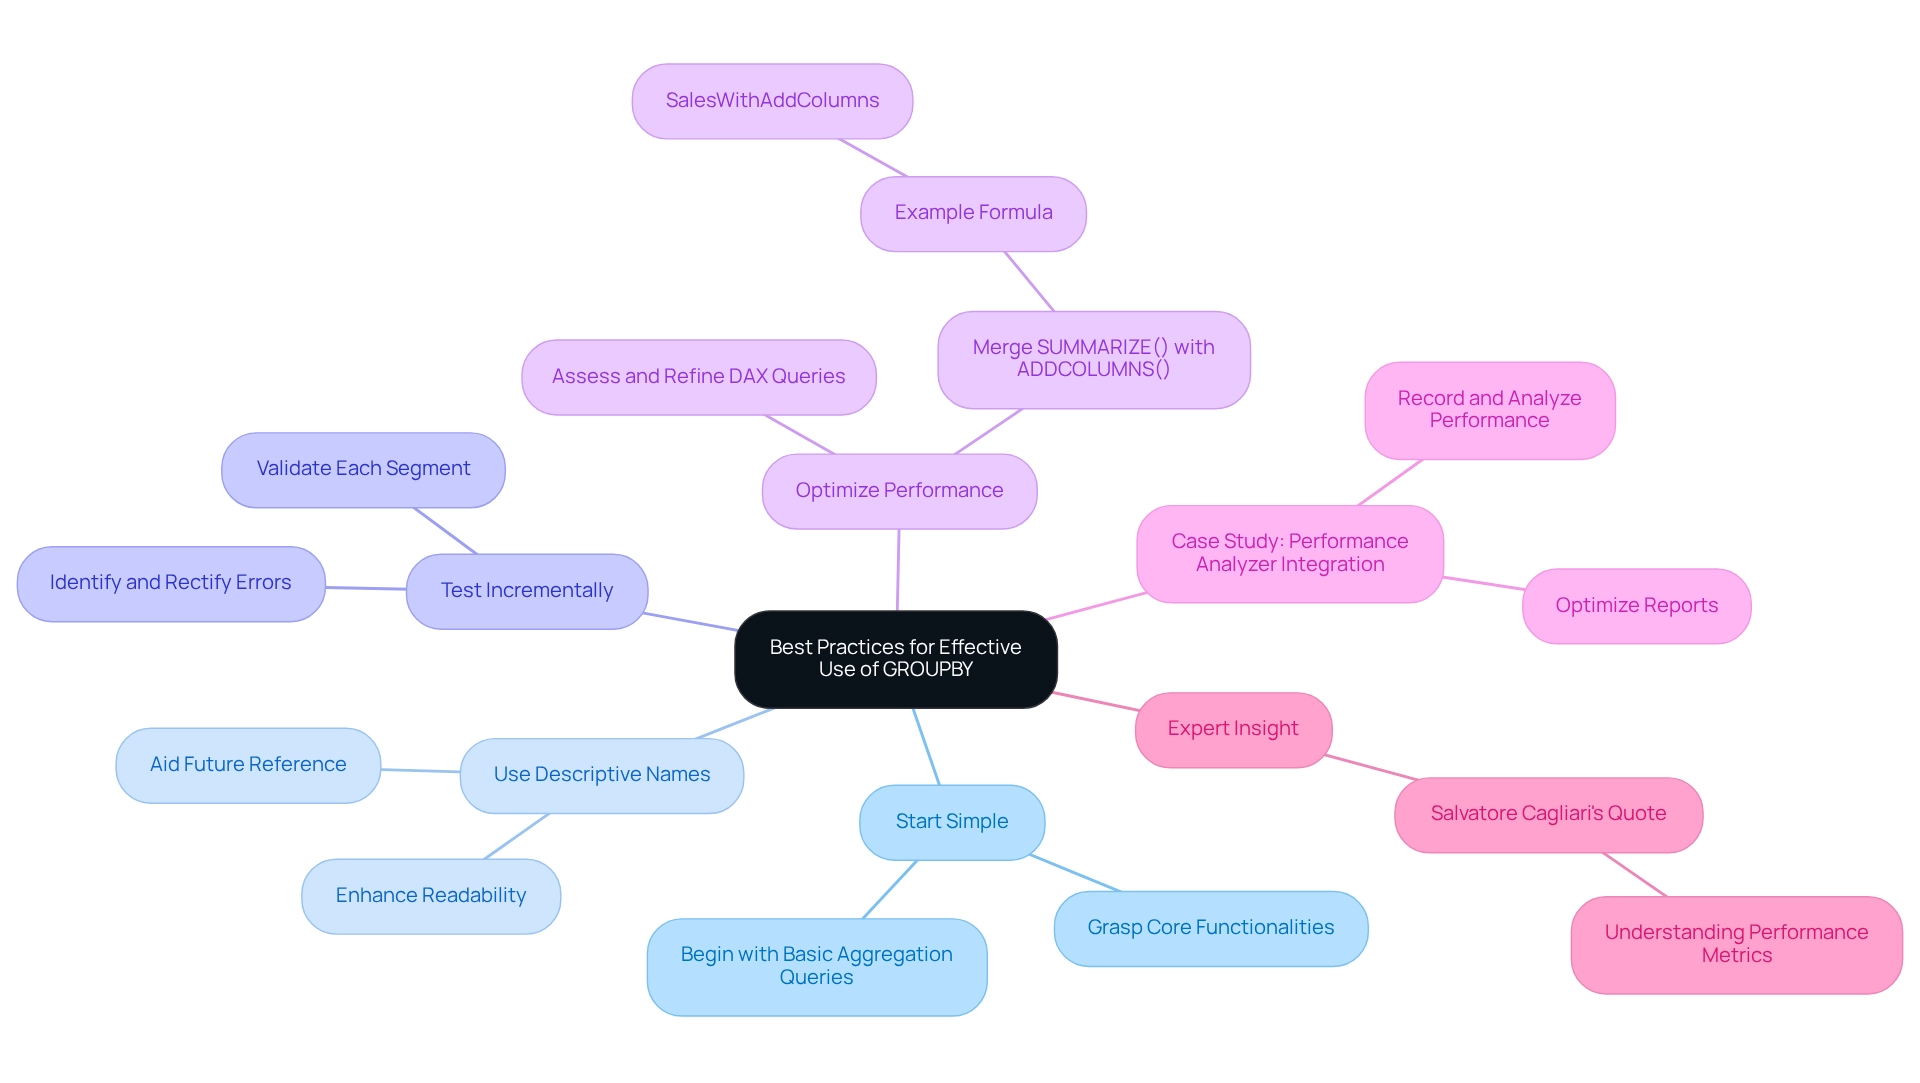
To effectively leverage the GROUPBY function in DAX, adhere to the following best practices:
-
Start Simple: Begin with basic aggregation queries. This foundational approach allows you to grasp core functionalities before progressing to more intricate scenarios, ensuring a solid understanding of the function’s mechanics.
-
Use Descriptive Names: When creating new columns within GROUPBY, opt for clear and descriptive names. This practice enhances the readability of your code and aids in maintaining clarity for future reference, making it easier for others (or yourself) to understand the logic behind your queries.
-
Test Incrementally: Adopt an incremental testing strategy for your queries. By validating each segment of your DAX code as you build it, you can swiftly identify and rectify errors, gaining insights into how modifications impact your results. This method is particularly beneficial in complex queries where the interplay of multiple components can lead to unexpected outcomes.
-
Optimize Performance: Regularly assess and refine your DAX queries to ensure optimal performance, especially when working with large datasets. For example, merging
SUMMARIZE()withADDCOLUMNS()can greatly improve your analysis abilities by permitting the addition of custom-calculated columns within grouped information. A practical application of this is the formula:
sales with addcolumns = ADDCOLUMNS(SUMMARIZE(sales_roll up, sales_roll up[Region], sales_roll up[Product], 'Total Sales', SUM(sales_average[total]), 'Quantity', SUM(sales_average[Quantity])), 'Average total per Unit', DIVIDE(SUM(sales_average[total]), SUM(sales_rollup[Quantity]), 0))
This formula not only calculates total sales and quantities but also derives the average sales per unit, showcasing the power of combining these functions for enhanced data insights.
Example: Before finalizing a complex DAX GROUPBY query, it is advisable to decompose it into smaller, manageable parts. Test each segment to ensure accuracy and performance, which can lead to more efficient and effective queries overall.
Case Study: The integration of the DAX query view with the Performance Analyzer in Power BI allows users to record and analyze the performance of visuals by examining the underlying DAX queries. This integration helps users optimize their reports by providing insights into the performance of DAX queries, enabling them to make informed adjustments to improve efficiency. This is especially pertinent in tackling challenges such as time-consuming report generation and inconsistencies in information.
Expert Insight: As Salvatore Cagliari notes, “Sometimes we have a slow report, and we need to figure out why. I will demonstrate how to gather performance information and what these metrics signify.” This highlights the importance of understanding performance metrics in optimizing DAX queries, which is crucial for leveraging Business Intelligence effectively.
By adhering to these best practices, analysts can enhance their use of the DAX GROUPBY function, leading to improved performance and more insightful analysis. Furthermore, customized solutions that enhance data quality can drive growth and innovation in data analysis, making the effective use of GROUPBY even more critical.
Conclusion
The DAX GROUPBY function stands as a cornerstone in data analysis, particularly for professionals aiming to distill intricate datasets into actionable insights. Its capability to summarize data by specified columns not only enhances clarity but also facilitates informed decision-making across diverse domains, ranging from sales analysis to inventory management. By effectively leveraging GROUPBY, analysts can pinpoint trends, optimize workflows, and drive strategic growth—an essential endeavor in today’s fast-paced data landscape.
However, navigating the intricacies of the GROUPBY function necessitates careful adherence to best practices. Starting with simple queries, employing descriptive naming conventions, and optimizing performance are foundational steps. Moreover, understanding potential pitfalls—such as data type compatibility and filter context—is crucial for maximizing the effectiveness of this powerful tool. As organizations increasingly integrate Robotic Process Automation (RPA) into their workflows, the efficiency gained from automating repetitive tasks further underscores the importance of mastering DAX functions like GROUPBY.
Ultimately, proficiency in utilizing the GROUPBY function not only enhances analytical capabilities but also empowers professionals to harness the full potential of data-driven strategies. By staying abreast of updates and best practices, analysts can elevate their data analysis skills, ensuring their organizations maintain a competitive edge in an ever-evolving market. Embracing these insights paves the way for more effective decision-making and fosters a culture of continuous improvement in data analysis practices.
Frequently Asked Questions
What is the DAX GROUPBY feature used for?
The DAX GROUPBY feature is used to summarize tables by categorizing them based on specified columns, allowing analysts to consolidate insights and perform computations on grouped datasets.
How can the DAX GROUPBY feature enhance operational efficiency?
By enabling users to extract actionable insights from data, the DAX GROUPBY feature improves operational efficiency, particularly in environments influenced by Robotic Process Automation (RPA).
Can you provide an example of how DAX GROUPBY is applied?
For instance, in a sales table, DAX GROUPBY can be used to analyze sales information by product category, creating a new table that summarizes sales figures for each category, thereby providing clearer performance metrics.
What are some alternatives to DAX GROUPBY?
Alternatives to DAX GROUPBY include SUMMARIZECOLUMNS(), which offers faster summary table creation, while DAX GROUPBY is better suited for straightforward grouping operations.
What is the syntax for the DAX GROUPBY function?
The syntax for the GROUPBY function in DAX is as follows: GROUPBY(
What challenges can DAX GROUPBY help address?
DAX GROUPBY can help address challenges like time-consuming report generation and data inconsistencies by improving the organization and clarity of data analysis.
What are some recent updates to the DAX syntax?
Recent updates have introduced enhancements that improve the organization and readability of queries, making it easier for analysts to manage complex datasets.
How does RPA relate to the use of DAX GROUPBY?
RPA solutions can automate manual tasks associated with DAX operations, helping to alleviate challenges related to report generation and data inconsistencies.
Why is understanding DAX capabilities important for analysts?
Understanding DAX capabilities, including aggregation functions like GROUPBY, is crucial for improving data analysis and fostering business growth through enhanced insights.
What practical applications can improve query management in DAX?
Practical applications include using DAX query view features, such as commenting and uncommenting lines of code, which enhance query management and boost productivity.

