Overview
Calculating standard deviation in Power BI is a critical skill for data professionals. Users can efficiently achieve this by employing DAX functions such as STDEV.P and STDEV.S, tailored for population and sample data respectively. This article provides a clear, step-by-step guide that underscores the importance of understanding the data context, ensuring data cleanliness, and implementing effective visualization techniques. By following these guidelines, users can derive accurate insights that inform sound decision-making.
Introduction
In the realm of data analysis, grasping the nuances of standard deviation is crucial for extracting valuable insights from complex datasets. This vital statistical measure not only underscores the variability within data but also functions as an essential tool in risk assessment and predictive modeling. As businesses increasingly depend on data-driven decisions, mastering standard deviation becomes imperative for evaluating performance metrics and identifying trends.
Within the context of Power BI, organizations can leverage the power of standard deviation to enhance reporting capabilities, streamline operations, and propel strategic initiatives. This article explores the significance of standard deviation, provides practical guidance on its calculation using DAX functions, and examines its real-world applications across various sectors. Ultimately, it empowers businesses to navigate the intricacies of data with confidence.
Understanding Standard Deviation: Definition and Importance
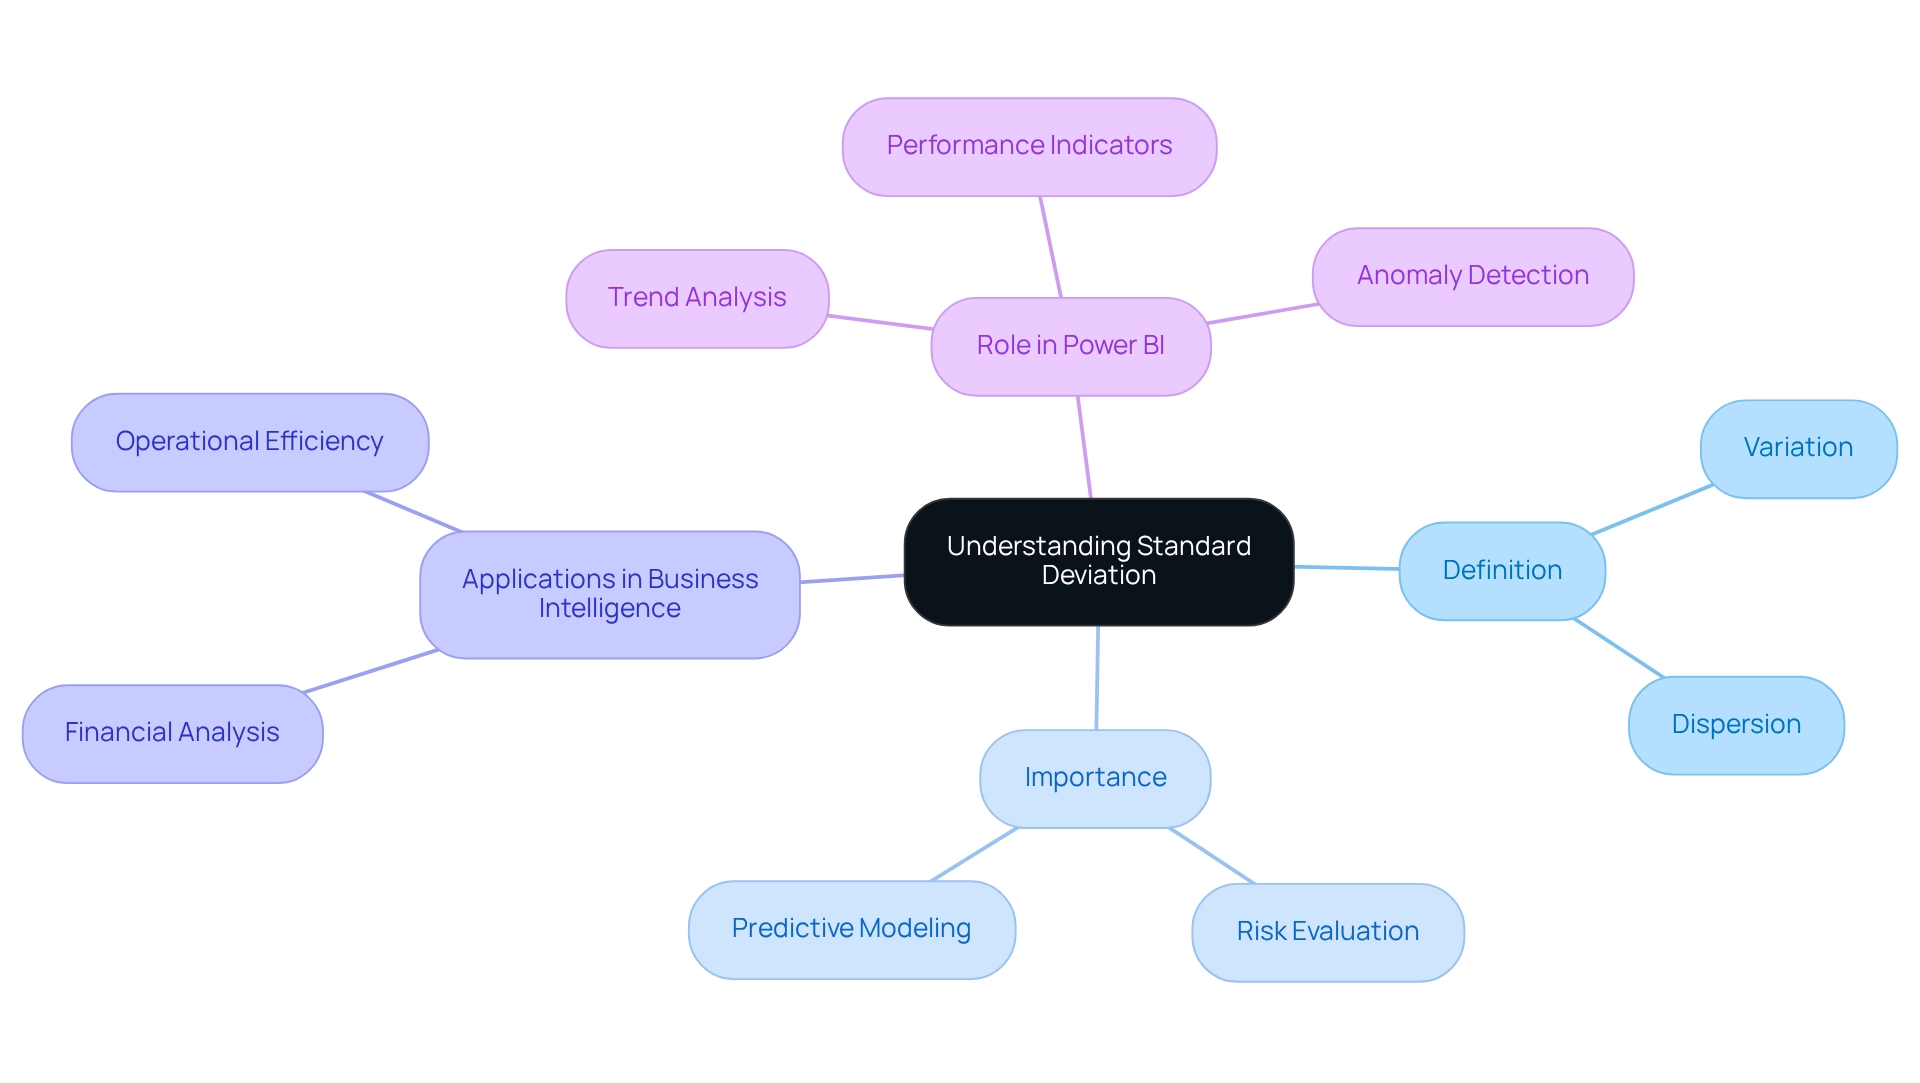
Standard variation is a crucial statistical measure that quantifies the variation or dispersion within a dataset. A small variation in values signifies that the points are grouped closely around the average, indicating consistency. In contrast, a large variation shows a broader range of values, suggesting greater variability. This measure is essential in analysis, as it aids in evaluating the reliability of information and plays a vital role in risk evaluation and predictive modeling based on historical trends.
Moreover, the interquartile range (IQR) signifies the central 50% of values, offering additional context for understanding variability alongside typical variation.
In the domain of Power BI, a strong understanding of standard deviation is crucial for precisely analyzing trends and making informed, analytical decisions. Companies can utilize variation to assess performance indicators, recognize anomalies, and improve forecasting precision. Recent statistics highlight the significance of standard deviation in Power BI analysis, especially in 2025, when organizations increasingly depend on accurate metrics to direct strategic initiatives.
Creatum GmbH’s Power BI services, including the 3-Day Power BI Sprint and the General Management App, enable organizations to enhance their reporting capabilities and obtain actionable insights. This service facilitates the rapid creation of professionally designed reports while addressing data inconsistency and governance challenges, ultimately supporting enhanced decision-making processes.
Professional insights emphasize that grasping standard deviation in Power BI is essential for efficient decision-making in business intelligence. As Alex Dos Diaz points out, “Standard variation calculates all uncertainty as risk, even when it’s in the investor’s favor—such as above-average returns.” This perspective underscores the importance of variation in measuring uncertainty and facilitating better decisions, ultimately fostering growth and innovation.
Practical applications of statistical variation in business decision-making encompass financial analysis, assisting investors in evaluating risk and return profiles, and operational efficiency evaluations that help identify process variations.
Case studies demonstrate the revolutionary effect of variation on information insights. For instance, in the case analysis titled ‘Business Intelligence for Insights,’ companies that effectively employ typical variation in their analytical frameworks report better quality information and enhanced decision-making abilities. Furthermore, feedback from customers who have engaged with Creatum’s Power BI Sprint emphasizes significant improvements in their information evaluation capabilities. This demonstrates how incorporating standard deviation in Power BI not only elucidates fundamental patterns but also enables organizations to navigate the complexities of an information-rich environment with confidence.
To explore how Creatum GmbH can enhance your reporting and decision-making processes, schedule a complimentary consultation today.
Step-by-Step Guide to Calculating Standard Deviation in Power BI
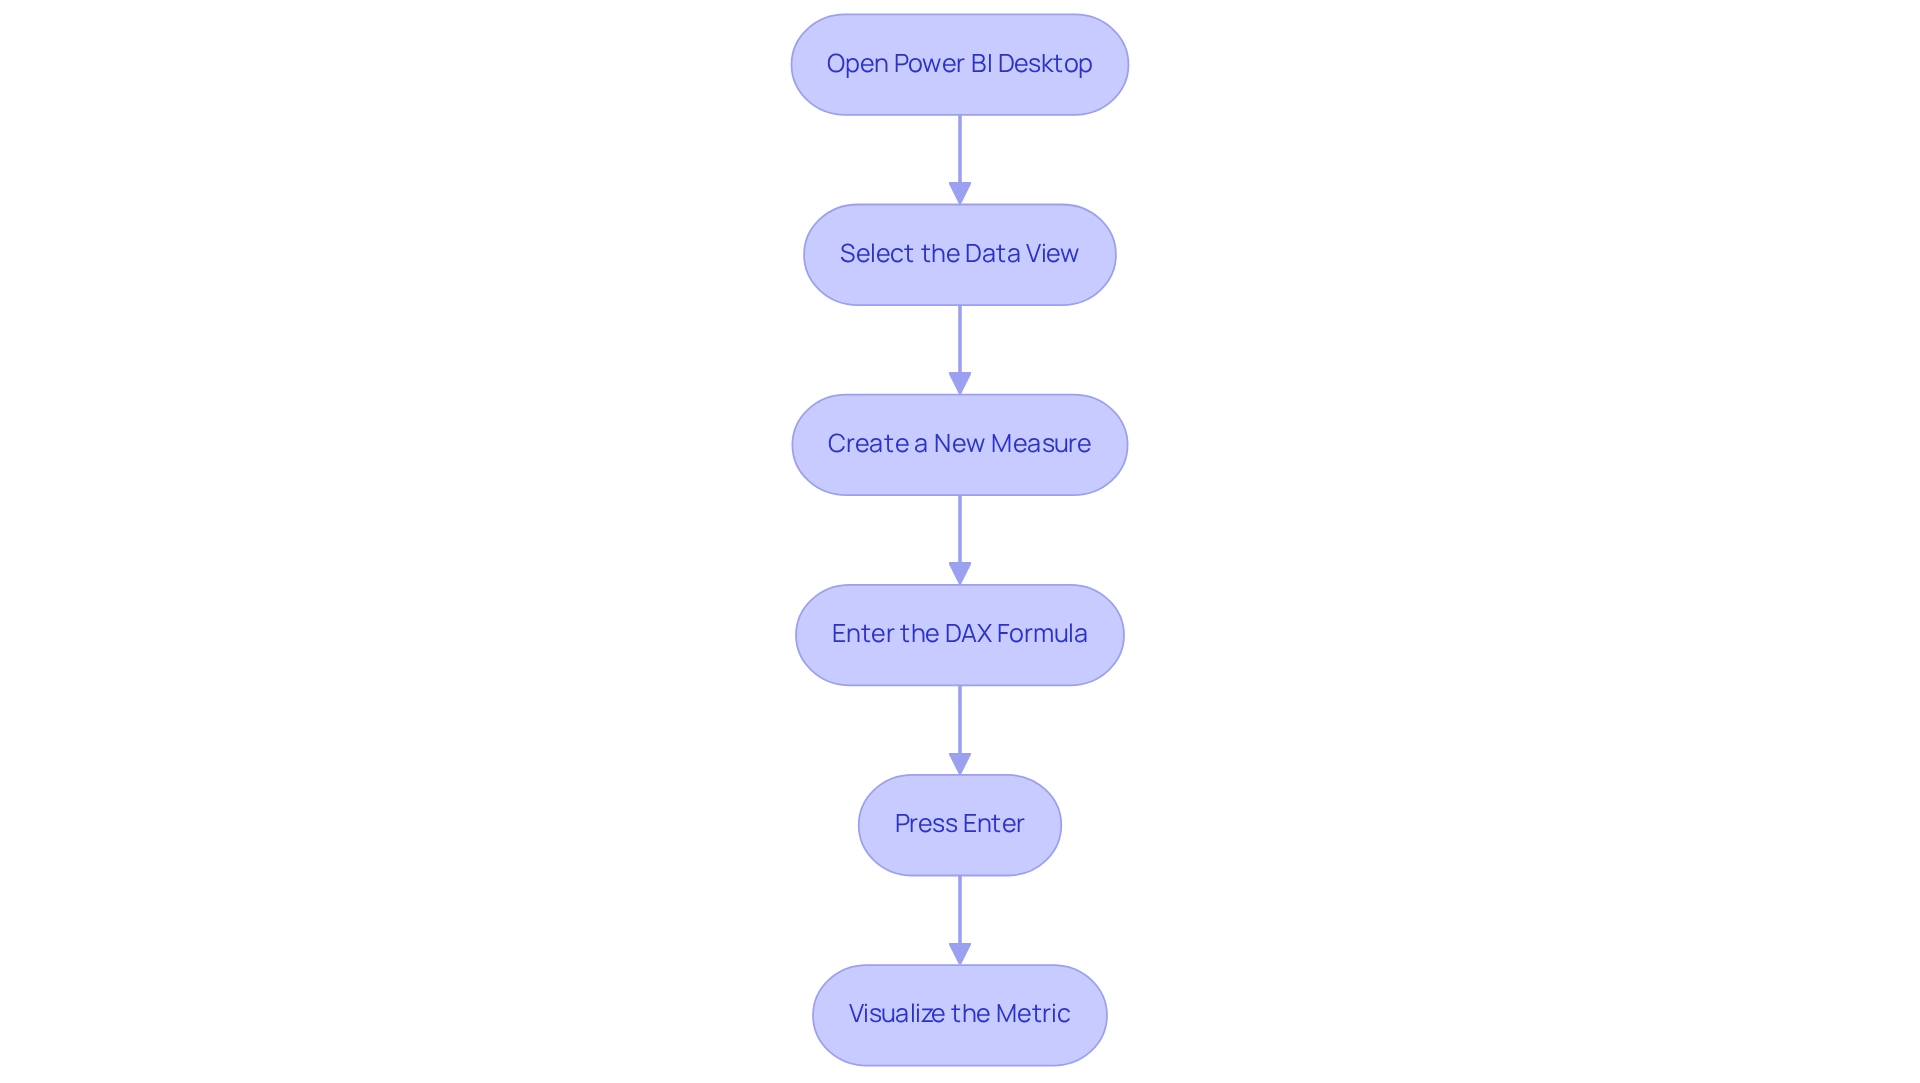
Calculating the standard deviation in Power BI is a straightforward process that can significantly enhance your data analysis skills, particularly in leveraging Business Intelligence for informed decision-making. Follow these steps to effectively calculate the typical variation using DAX functions:
- Open Power BI Desktop: Start by launching the application and loading your dataset.
- Select the Data View: Click on the table icon located in the left sidebar to navigate to the Data view.
- Create a New Measure: Go to the ‘Modeling’ tab and select ‘New Measure’ to initiate the creation of a new calculation.
- Enter the DAX Formula: In the formula bar, input the appropriate DAX formula for typical variation. For population standard deviation, use:
StdDev_Pop = STDEV.P('YourTable'[YourColumn])For sample standard deviation, the formula is:
StdDev_Sample = STDEV.S('YourTable'[YourColumn]) - Press Enter: After entering the formula, press Enter to finalize the creation of the measure.
- Visualize the Metric: Drag the newly created metric into a visual to examine the typical variation within your dataset.
Utilizing Power BI for information analysis is increasingly popular, with user satisfaction ratings reflecting its effectiveness—Power BI boasts a score of 4.7 out of 5, surpassing competitors like Tableau at 4.4 and Excel at 3.8. This highlights Power BI’s superiority in user satisfaction. As organizations continue to recognize the value of data-driven insights, the demand for skilled professionals in business intelligence is on the rise.
Indeed, the need for Business Intelligence experts, especially analytics specialists, is increasing swiftly. Analytics specialists rank as the #3 position on Glassdoor’s Top 50 Jobs in America list, providing a median salary of $102,000. By mastering DAX functions for calculating standard deviation in Power BI, you position yourself to extract deeper insights from your information, ultimately driving informed decision-making. Moreover, the incorporation of Robotic Process Automation (RPA) can improve operational efficiency by automating repetitive tasks, addressing issues such as time-consuming report generation and inconsistencies.
This ensures that your organization remains competitive and efficient while transforming raw information into actionable insights. The governance market was valued at $3.02 billion in 2022, underscoring the growing significance of governance in relation to analysis tools like Power BI.
Utilizing DAX Functions for Standard Deviation in Power BI
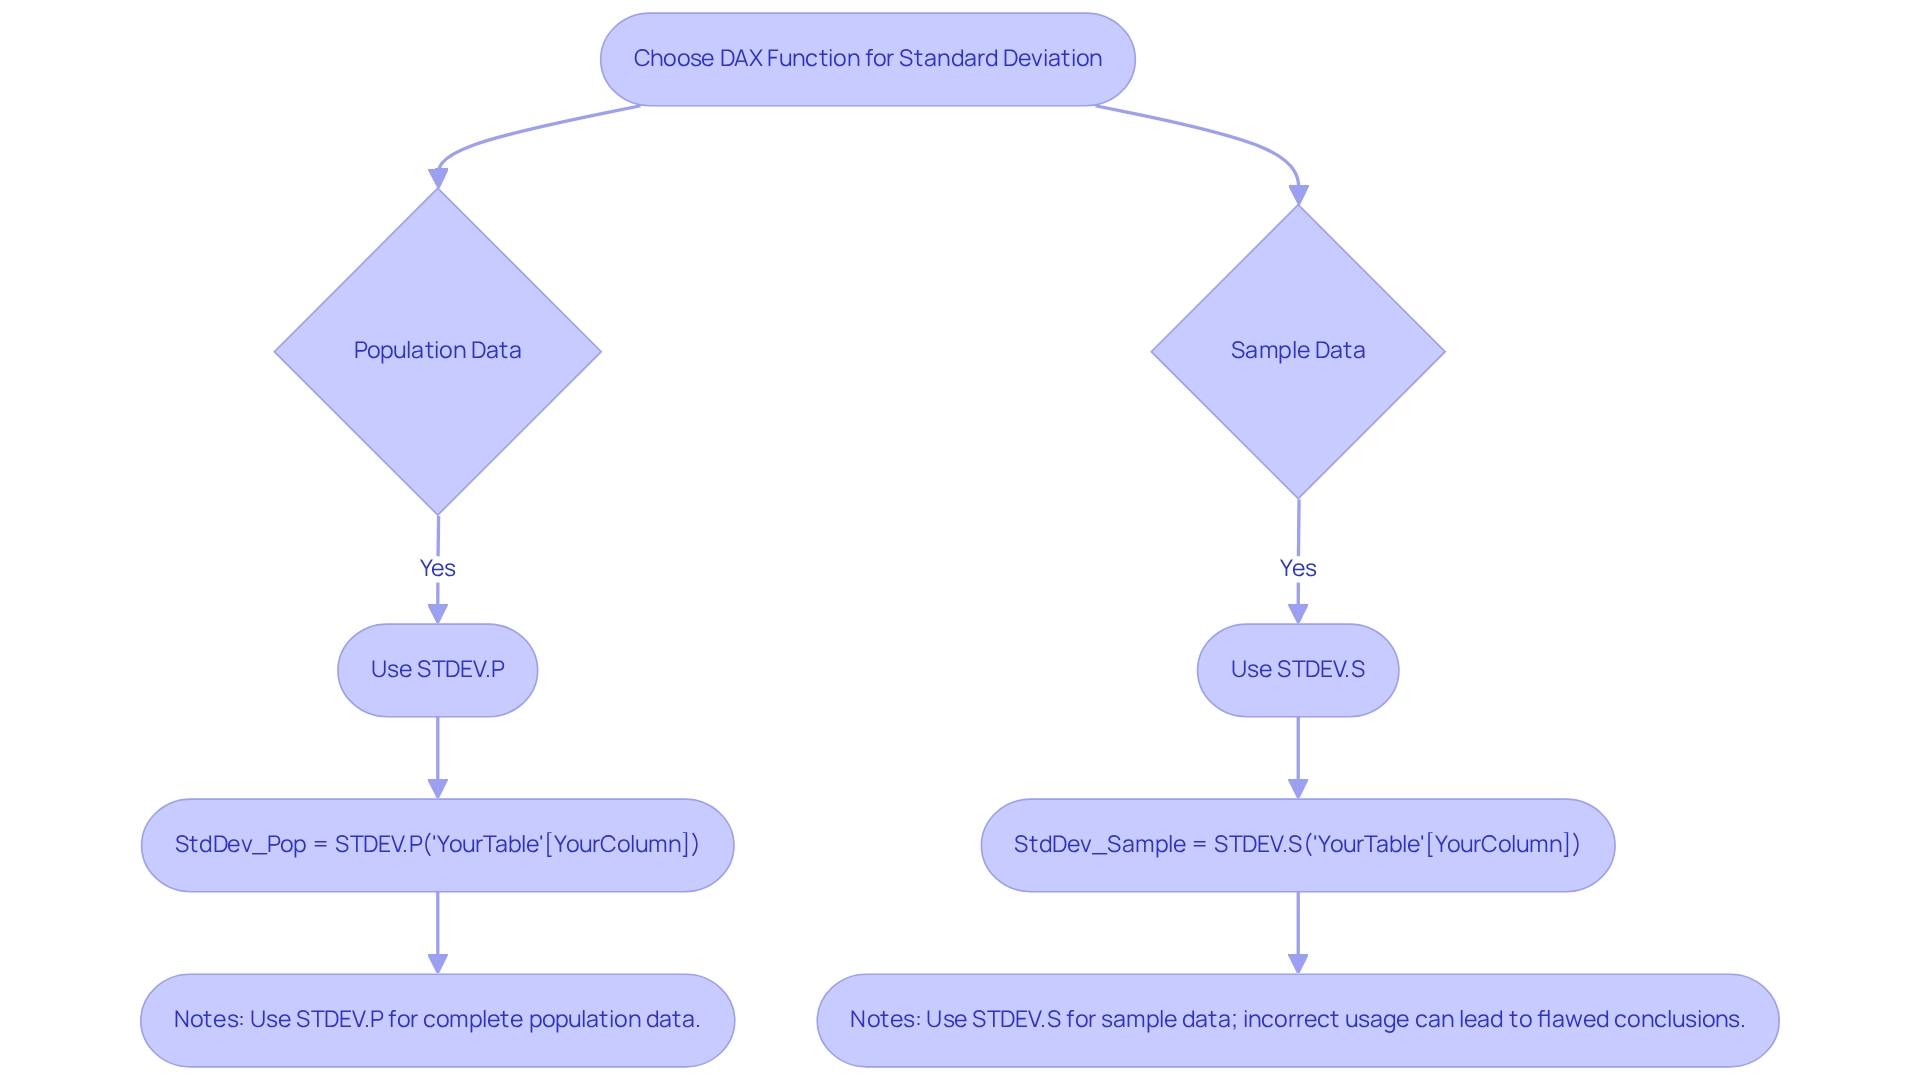
Power BI employs DAX (Data Analysis Expressions) to execute a variety of calculations, including the critical analysis of variance, which is essential for understanding data variability and fostering analytics-driven decision-making. The two primary functions for calculating standard deviation are:
-
STDEV.P: This function calculates the standard deviation based on the entire population. It is applicable when you possess data for the complete group under examination. The syntax for this function is:
StdDev_Pop = STDEV.P('YourTable'[YourColumn]) -
STDEV.S: Conversely, this function estimates the standard deviation from a sample of the population. It proves particularly useful when your dataset represents a subset of a larger group. The syntax for this function is:
StdDev_Sample = STDEV.S('YourTable'[YourColumn])
Accurate application of these functions is vital for obtaining precise calculations of variability in your data, which is crucial for effective analysis and operational efficiency. Recent statistics indicate that the population variability is approximately 8.896, underscoring the importance of precise calculations in data-informed decision-making. This statistic illustrates how understanding variability can significantly influence strategic decisions within organizations, especially in a data-rich environment where insights drive growth and innovation.
In practice, utilizing STDEV.P and STDEV.S can yield different insights based on the context of your data. For example, a case study on statistical guidelines in biomedical journals revealed that numerous articles misreported statistical measures, leading to flawed conclusions and impacting data-driven decisions in that field. This emphasizes the necessity for accurate standard deviation calculations to enhance the reliability of published research and improve operational outcomes.
Experts in the field advocate for the appropriate use of these functions, noting their significant role in reducing the time to insights. As Ram Ravichandran, Google Analytics Manager, remarked, “An invaluable tool for analysts, the platform’s self-driven analytics reduce time to insights significantly.” The choice between STDEV.P and STDEV.S can greatly affect data analysis, highlighting the necessity of understanding the underlying structure before selecting the appropriate function. By mastering these DAX functions, analysts can ensure their analyses are both robust and reliable, ultimately driving growth and innovation in their organizations while overcoming challenges such as time-consuming report creation and inconsistencies.
At Creatum GmbH, we underscore the importance of these analytical tools in our Business Intelligence and Robotic Process Automation solutions. To explore how our services can enhance your data-driven decision-making, we invite you to book a free consultation.
Troubleshooting Common Issues in Standard Deviation Calculations
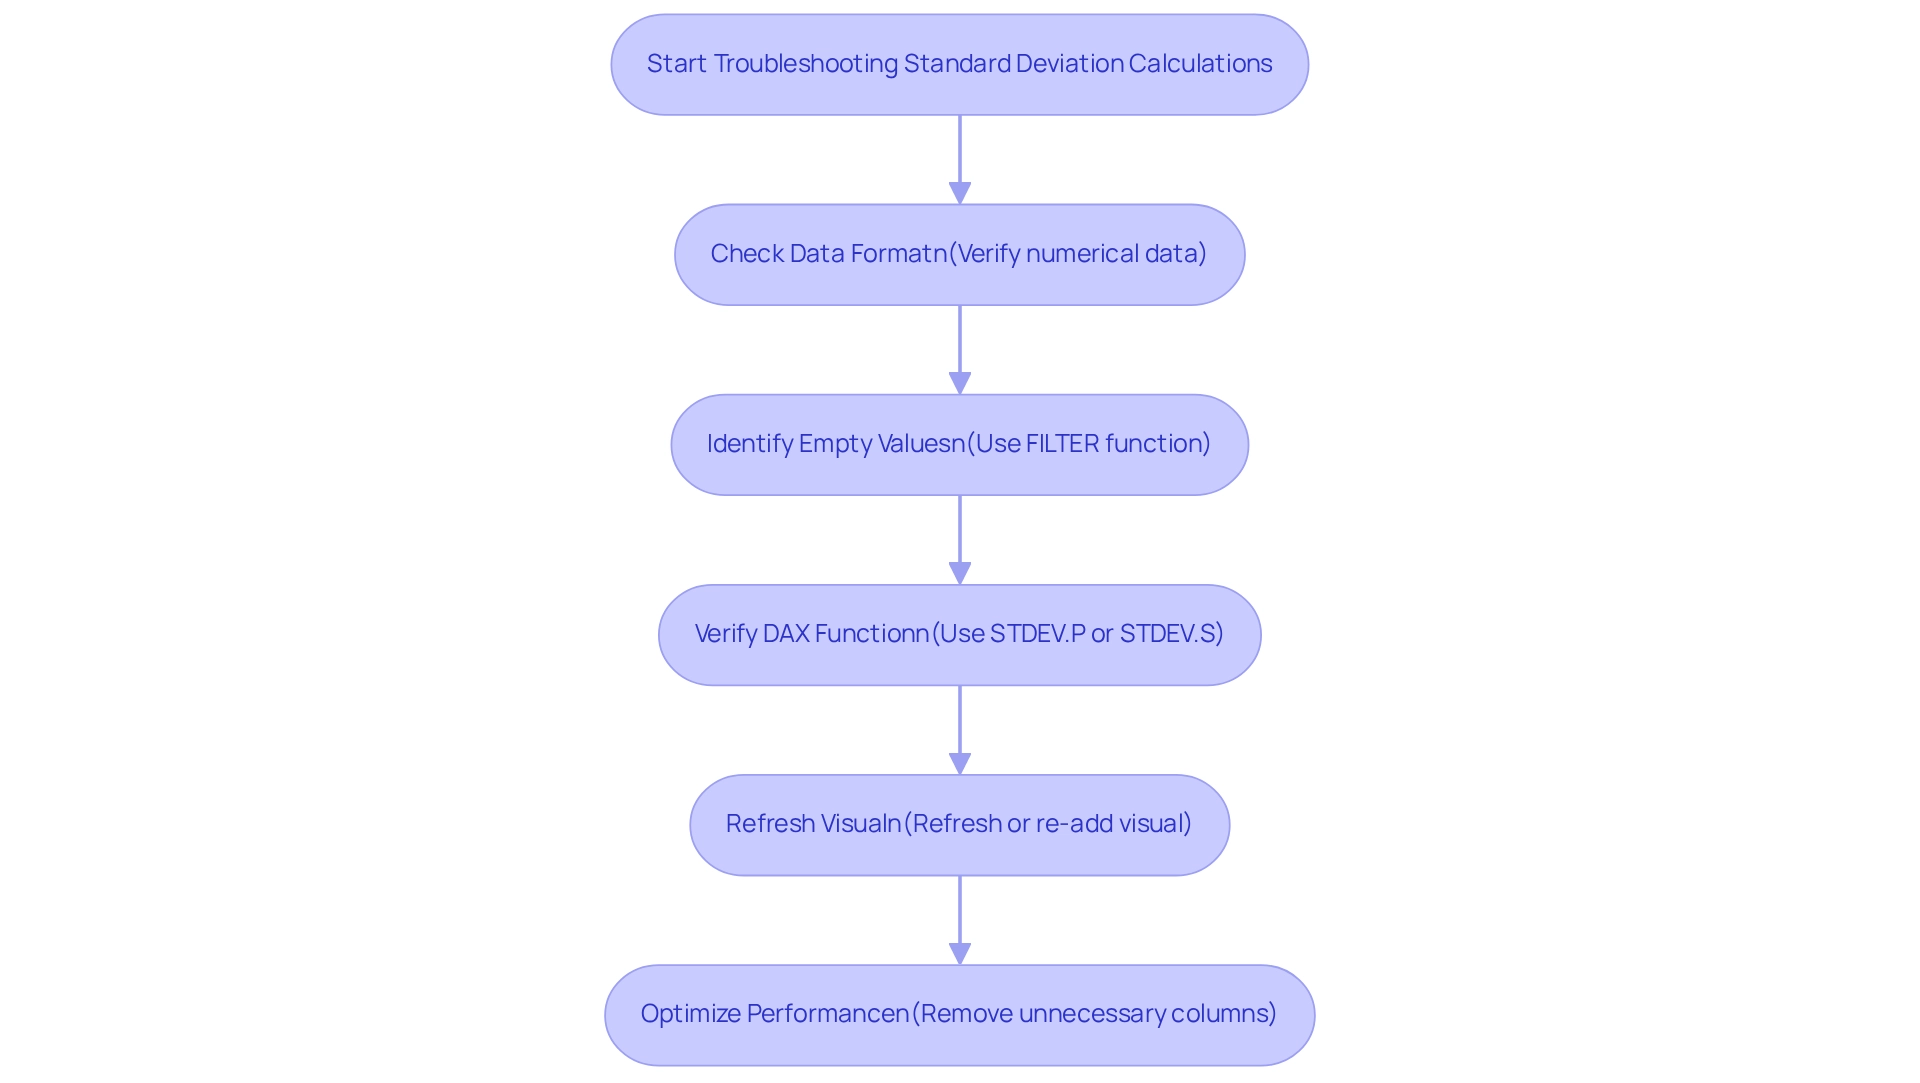
Calculating typical variation in Power BI presents several challenges that users must navigate to achieve precise results. This is particularly vital when aiming to enhance operational efficiency through data-driven insights with Creatum GmbH’s solutions.
Incorrect Formats: It is essential to confirm that the column under examination contains numerical data. If the information type is incorrectly set, Power BI will be unable to compute the standard deviation, resulting in misleading insights. Always verify the type settings in the model to ensure they align with your evaluation requirements.
Empty Values: The presence of empty or null values within your dataset can severely affect the accuracy of your calculations. To mitigate this, utilize the FILTER function to exclude these values from your evaluation. This step is crucial for maintaining the integrity of your statistical calculations, ensuring that your insights are actionable.
Using the Wrong Function: Selecting the correct DAX function is vital. Ensure you are using STDEV.P for population data and STDEV.S for sample data. Misapplication of these functions can lead to incorrect standard deviation results, skewing your analysis and potentially hindering informed decision-making.
Visual Not Refreshing: Should your visual fail to represent the newly calculated measure, refreshing the information or re-adding the visual to the report canvas may be necessary. This guarantees that all modifications are accurately depicted in your visualizations, enabling effective storytelling and operational insights.
Performance Issues: Working with large datasets can lead to performance bottlenecks, slowing down calculations. To enhance performance, consider optimizing your information model by removing unnecessary columns or employing aggregations. This approach not only accelerates computations but also improves the overall user experience in Power BI, aligning with RPA objectives to simplify workflows.
By addressing these common issues, users can refine their skills in calculating standard deviation in Power BI, ultimately leading to more reliable analysis and decision-making. Proactive management of Power BI challenges, including regular performance tuning and robust modeling, has been shown to bolster an organization’s capacity to extract meaningful insights from information. This is evidenced by forward-looking enterprises that prioritize these practices. Effectively utilizing Business Intelligence tools can transform raw information into actionable insights, fostering growth and innovation.
Applications of Standard Deviation in Data Analysis and Visualization
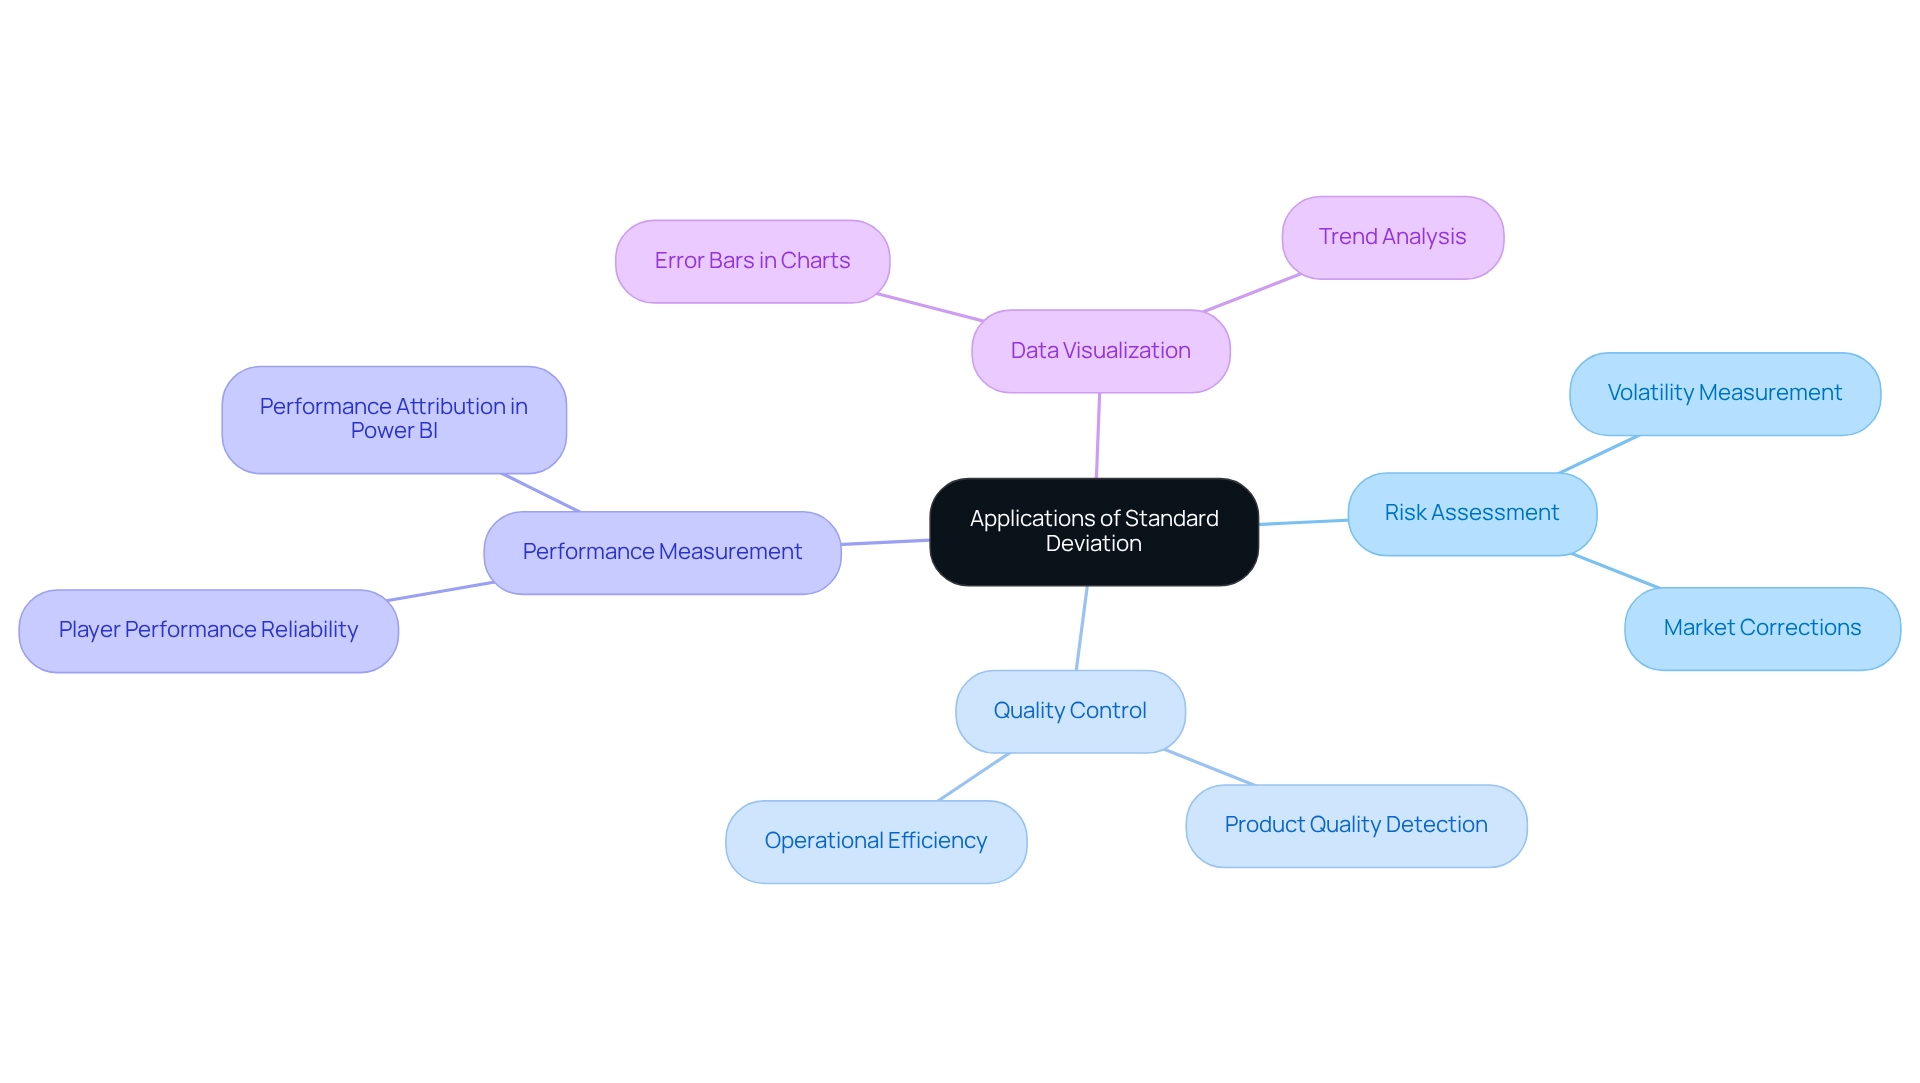
Standard deviation plays a crucial role in data analysis and visualization, with applications spanning multiple domains.
Risk Assessment: In the financial sector, standard deviation serves as a key metric for measuring the volatility of asset prices. Many advanced financial models and investment strategies depend on the accurate measurement of volatility to balance risk and reward effectively. An increased variation signifies greater risk, making it crucial for investors to evaluate potential fluctuations in their portfolios. Historical examination suggests that times of increased variability frequently precede market adjustments, emphasizing its significance in proactive investment approaches. A case study named ‘Historical Trends and Market Corrections’ illustrates that investors who tracked these statistical indicators were more equipped to modify their strategies, highlighting the essential function of variability in investment decision-making.
Quality Control: Within manufacturing, variability is essential in detecting differences in product quality. By establishing acceptable ranges, manufacturers can identify products that fall outside these parameters, signaling potential quality issues. This application not only enhances product reliability but also minimizes waste and rework, ultimately driving operational efficiency.
Performance Measurement: In the field of sports analytics, variability is employed to assess the reliability of player performance. A reduced variability suggests more reliable performance, which can be essential for coaches and managers when making strategic choices regarding player usage and growth. As mentioned by the AccountingInsights Team, in performance attribution, the standard deviation in Power BI helps pinpoint the sources of return variability, further emphasizing its importance in performance assessment.
Data Visualization: The standard deviation in Power BI can be effectively represented through error bars in charts, which convey the variability of information points. This visualization assists stakeholders in making educated choices based on observed trends, enabling a clearer comprehension of potential risks and opportunities.
Incorporating variability in data examination not only improves the precision of insights but also enables organizations to make data-informed choices that align with their strategic objectives, ultimately fostering growth and innovation.
Best Practices for Implementing Standard Deviation in Power BI
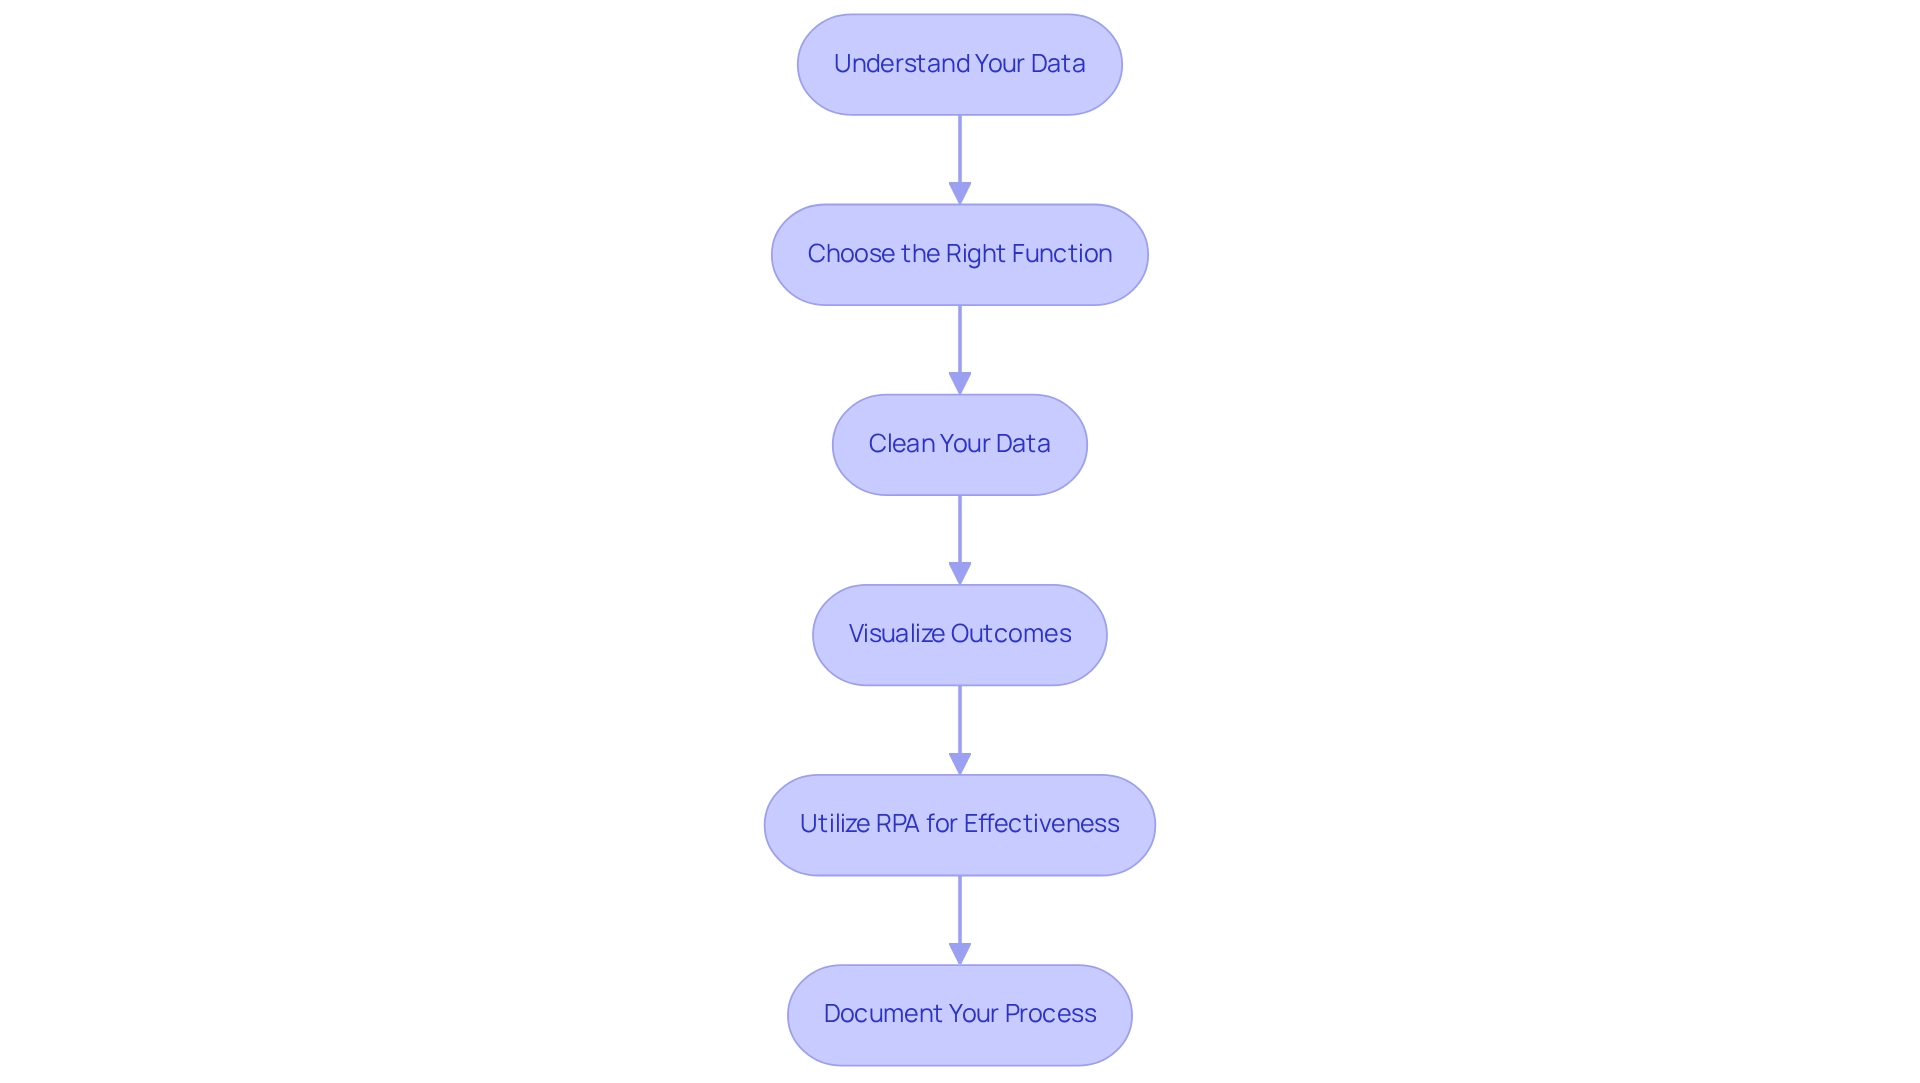
To effectively implement standard deviation in Power BI, consider the following best practices:
-
Understand Your Data: A comprehensive understanding of your dataset and the context of your analysis is crucial. This foundational knowledge allows for more accurate interpretations and insights. In today’s information-rich environment, utilizing Business Intelligence (BI) is essential for converting raw information into actionable insights that foster growth and innovation.
-
Choose the Right Function: Selecting the appropriate function is essential for accurate calculations. Utilize
STDEV.Pfor population andSTDEV.Sfor sample to ensure your results reflect the correct statistical context, which is vital for informed decision-making. -
Clean Your Data: Data cleaning is vital for accurate standard deviation calculations. Eliminate outliers and incorrect points that could distort your results. Techniques such as filtering, normalization, and validation checks can significantly enhance information quality, leading to more reliable analyses. For instance, in a case study named ‘Baseball Team Age Analysis,’ a group of 25 players was examined, showing an average age of 30.68 years and a typical variation of 6.09 years, illustrating how effective information management can produce significant insights. This step is crucial in overcoming challenges such as inconsistencies that frequently occur in Power BI dashboards, particularly when analyzing standard deviation.
-
Visualize Outcomes: Efficient representation of variation is essential for conveying variability. Utilize visuals such as scatter plots or line charts with error bars to represent standard deviation clearly, making it easier for stakeholders to grasp the implications of the information. This aligns with the objective of BI to present information in a manner that is actionable and insightful.
-
Utilize RPA for Effectiveness: Incorporating Robotic Process Automation (RPA) can greatly improve your information evaluation process. By automating repetitive tasks associated with information collection and cleaning, tools like EMMA RPA and Power Automate can liberate valuable time for analysts, enabling them to concentrate on deriving insights instead of becoming overwhelmed by manual processes.
-
Document Your Process: Maintaining thorough documentation of your calculations and the rationale behind your choices is important. This practice not only promotes transparency but also serves as a useful reference for future evaluations and for colleagues assessing your work. As Jim aptly stated, “Congratulations! May you continue to increase your survival Z-score!” This underscores the importance of grasping standard deviation in the realm of information evaluation.
Integrating these best practices will enhance the precision and efficiency of your analysis in Power BI, particularly in calculating standard deviation, ultimately resulting in more informed decision-making. Furthermore, merging clinical expertise with statistical understanding, as emphasized in evidence-based medicine, is essential for accurate data interpretation. By leveraging BI and RPA, organizations can automate repetitive tasks and improve operational efficiency, thus driving business growth.
To learn more about how our solutions can help you achieve operational excellence, book a free consultation with Creatum GmbH today.
Conclusion
Understanding standard deviation is fundamental for any organization aiming to harness the power of data analysis in today’s competitive landscape. This article has explored the essential role standard deviation plays in quantifying data variability, assessing risk, and enhancing decision-making processes. From its calculation using DAX functions in Power BI to its applications in various sectors such as finance, manufacturing, and sports analytics, the significance of standard deviation cannot be overstated.
By mastering the techniques for calculating standard deviation and implementing best practices in Power BI, organizations can improve the accuracy and reliability of their data insights. This improvement supports informed decision-making and strategic planning, ultimately driving growth and innovation. The challenges associated with standard deviation calculations can be effectively navigated through proactive data management and the integration of automation tools, ensuring that businesses remain agile and data-driven.
In conclusion, embracing the principles of standard deviation equips organizations with the necessary tools to interpret complex datasets confidently. As businesses continue to rely on data-driven insights, understanding and applying standard deviation will be pivotal in unlocking the full potential of their analytics capabilities. This fosters a culture of informed decision-making that leads to sustainable success.
Frequently Asked Questions
What is standard deviation and why is it important?
Standard deviation is a statistical measure that quantifies the variation or dispersion within a dataset. It indicates how closely data points are grouped around the average. A small standard deviation signifies consistency, while a large standard deviation indicates greater variability. It is essential for evaluating the reliability of information, risk evaluation, and predictive modeling based on historical trends.
What does the interquartile range (IQR) represent?
The interquartile range (IQR) signifies the central 50% of values in a dataset, providing additional context for understanding variability alongside standard deviation.
How is standard deviation used in Power BI?
In Power BI, understanding standard deviation is crucial for analyzing trends and making informed decisions. It helps companies assess performance indicators, recognize anomalies, and improve forecasting precision.
What services does Creatum GmbH offer related to Power BI?
Creatum GmbH offers Power BI services, including the 3-Day Power BI Sprint and the General Management App, which help organizations enhance their reporting capabilities and obtain actionable insights while addressing data inconsistency and governance challenges.
How does standard deviation relate to business decision-making?
Standard deviation helps in financial analysis by assisting investors in evaluating risk and return profiles, as well as in operational efficiency evaluations to identify process variations. It plays a vital role in measuring uncertainty and facilitating better decision-making.
What are some practical applications of statistical variation in business?
Practical applications include financial analysis for evaluating risk and return profiles, operational efficiency evaluations to identify process variations, and enhancing decision-making abilities through better quality information.
How can standard deviation be calculated in Power BI?
To calculate standard deviation in Power BI, follow these steps: 1. Open Power BI Desktop and load your dataset. 2. Select the Data View. 3. Create a New Measure in the ‘Modeling’ tab. 4. Enter the appropriate DAX formula: For population standard deviation: StdDev_Pop = STDEV.P(‘YourTable'[YourColumn]) For sample standard deviation: StdDev_Sample = STDEV.S(‘YourTable'[YourColumn]) 5. Press Enter to finalize the measure. 6. Visualize the metric in your report.
What is the user satisfaction rating for Power BI compared to its competitors?
Power BI has a user satisfaction rating of 4.7 out of 5, which surpasses competitors like Tableau (4.4) and Excel (3.8).
What is the significance of governance in relation to analysis tools like Power BI?
The governance market was valued at $3.02 billion in 2022, highlighting the growing importance of governance in data analysis and decision-making processes using tools like Power BI.

