Introduction
In the realm of data management, the integration of Excel and Power BI stands as a transformative solution for organizations striving to enhance operational efficiency and decision-making. As businesses grapple with the complexities of report creation and data inconsistencies, understanding the foundational steps and best practices for utilizing the Excel Power BI add-in becomes paramount. This article delves into essential techniques for setting up, analyzing, and visualizing Power BI data within Excel, while also addressing common challenges that users may encounter. By equipping teams with practical strategies and insights, organizations can unlock the full potential of their data, driving growth and fostering a culture of informed decision-making.
Getting Started with the Excel Power BI Add-In: Prerequisites and Setup
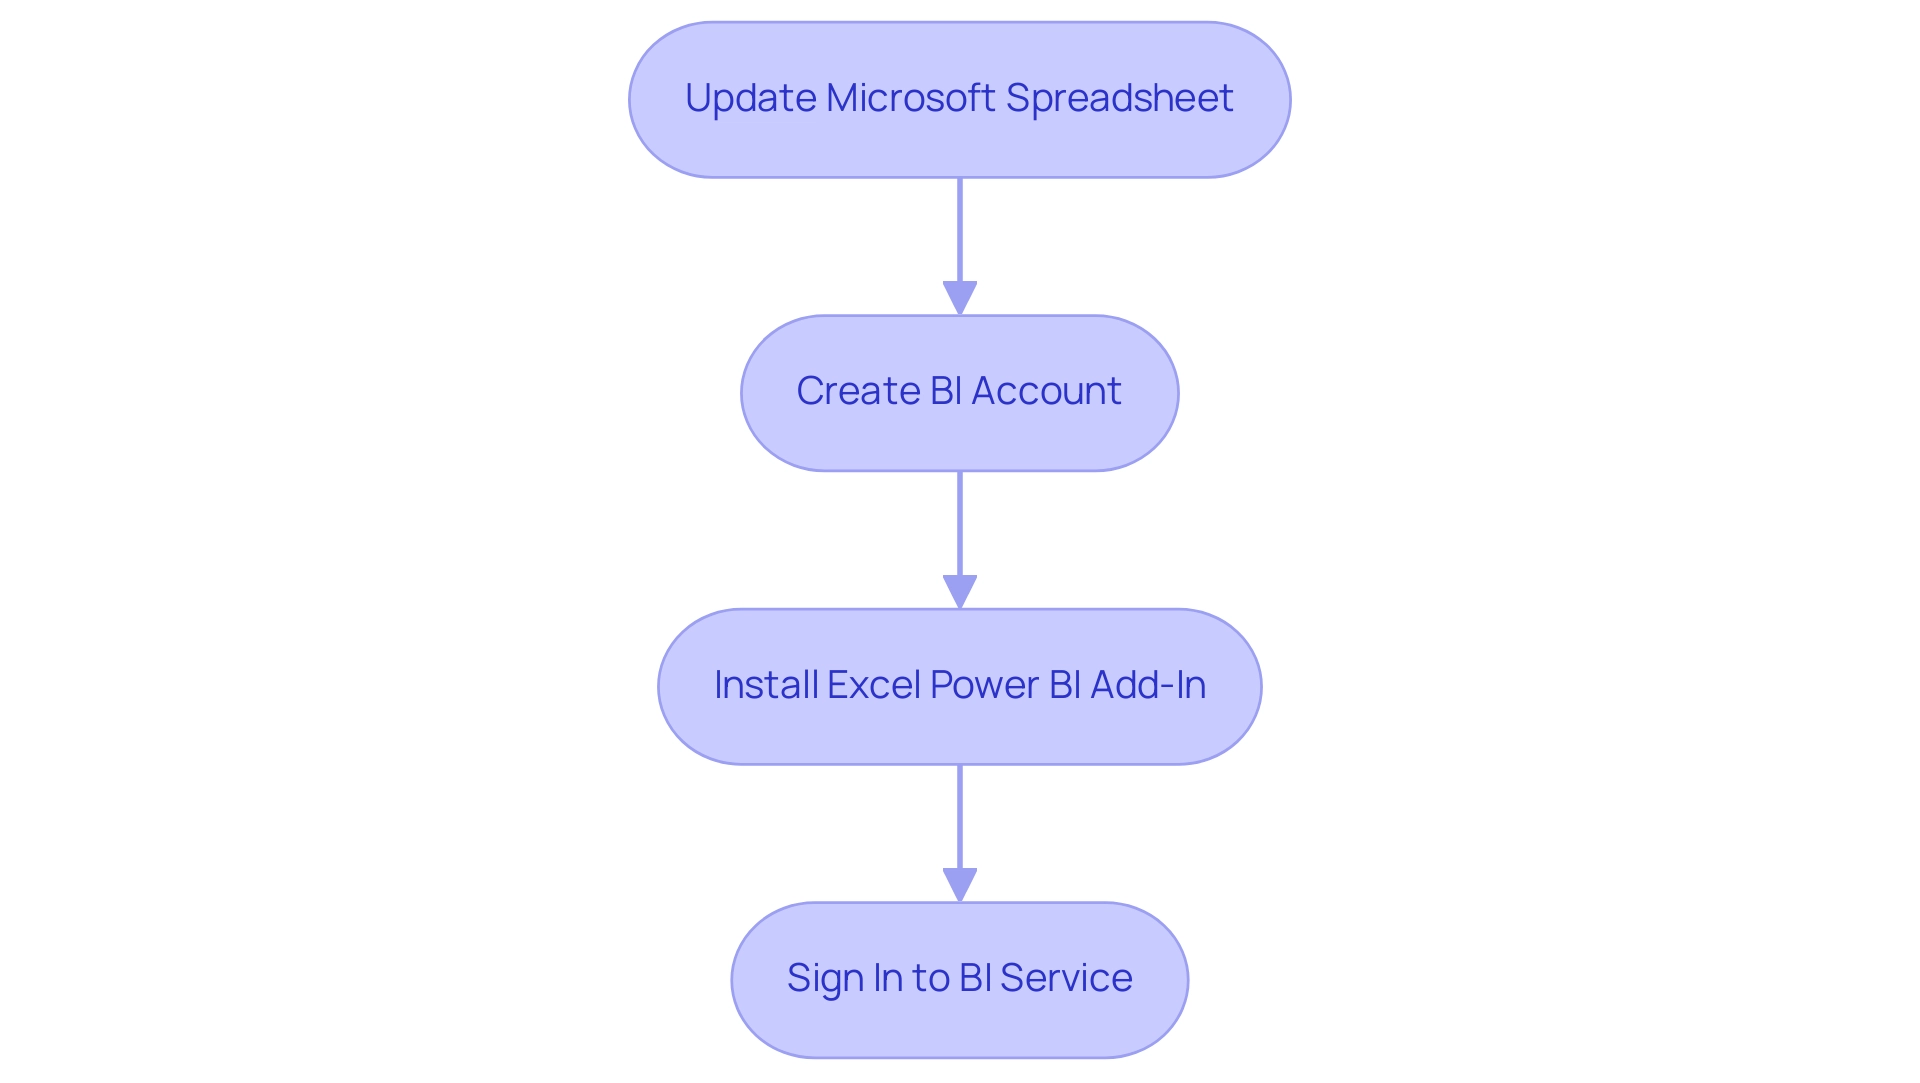
To effectively employ the BI add-in and overcome common obstacles such as time-consuming document creation and data inconsistencies, it’s essential to establish the following prerequisites:
- Updated Microsoft Spreadsheet: Ensure you are using a version of the program that supports the Power BI add-in, preferably the 2024 version or later, which offers enhanced speed and stability. Keeping your software updated helps prevent issues that can slow down report generation and ensures compatibility with the latest features. Notably, 63% of advanced Excel users are aware that they can leverage AI functionalities within Excel, emphasizing the importance of staying current with software updates.
- BI Account: A valid BI account is essential for information access and integration. This guarantees that you possess a trustworthy source of information, minimizing inconsistencies that can occur from utilizing outdated or incorrect datasets.
- Proper Permissions: Verify that you have the necessary permissions to access the datasets within BI. Proper governance is crucial, as inconsistencies can arise from improper access rights, leading to mistrust in the data presented.
- Installation of the Excel Power BI Add-In: Navigate to the ‘Insert’ tab in the spreadsheet application, click on ‘Get Add-ins’, search for ‘Excel Power BI Add-In’, and proceed to install it. This step is essential for combining the spreadsheet application with Business Intelligence, simplifying the document creation process.
- Sign In: After installation, log in to the BI service within Excel using your credentials. This connection enables real-time information updates and ensures that your reports reflect the most current details available.
A case study on PowerExcel.ai illustrates that only 13% of overall users have utilized this add-in; however, over one-third of advanced users have found it beneficial, showcasing its appeal to this demographic. By following these fundamental steps, you will create the environment for a productive and efficient experience with the Excel Power BI add-in, ensuring that you utilize its full capability for your operations. As research expert Lionel Sujay Vailshery notes, ‘Get in touch with us now’ to explore how these tools can enhance your information management capabilities and provide clear, actionable insights tailored to your operational needs.

Analyzing Power BI Data in Excel: Techniques and Best Practices
To enhance the effectiveness of examining business intelligence information in a spreadsheet, apply the following techniques:
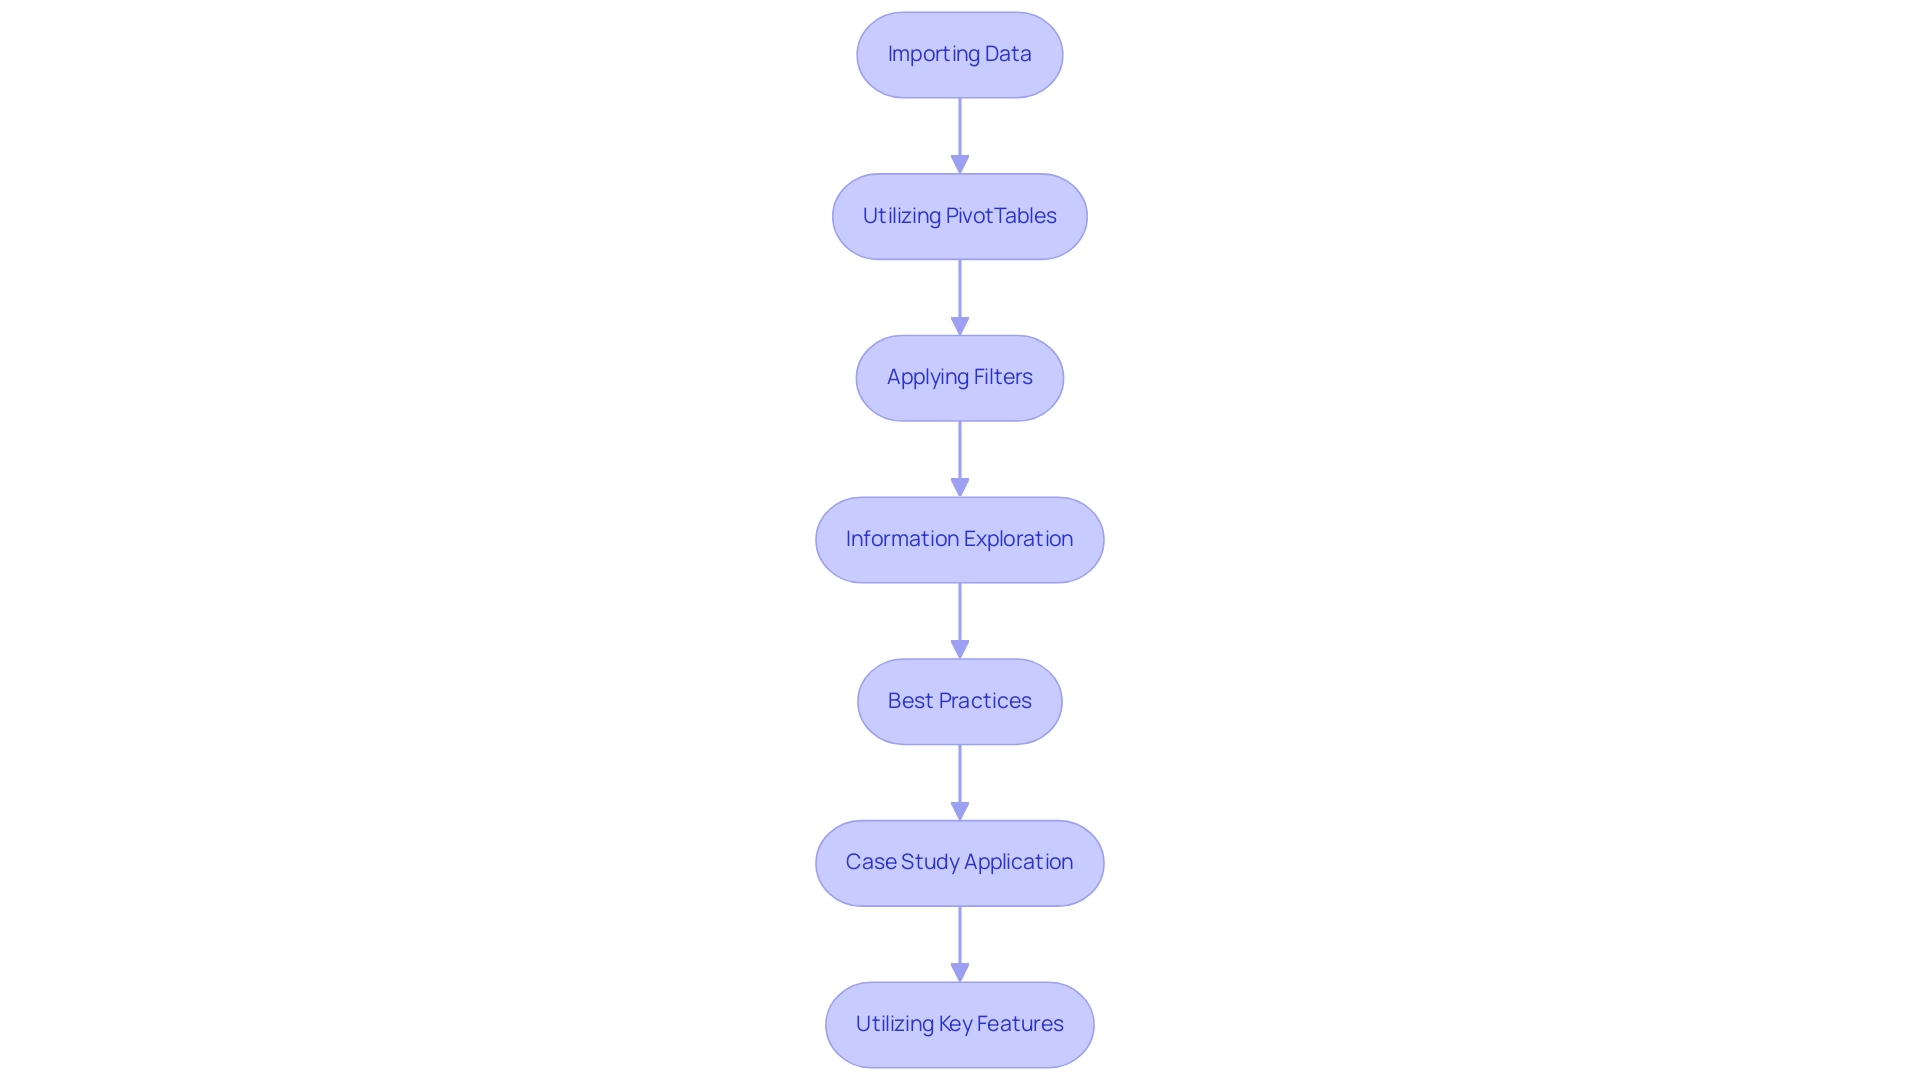
- Importing Data: Utilize the Excel Power BI add-in to effortlessly bring datasets into the spreadsheet. Simply select the desired dataset from the Power BI service, streamlining the retrieval process and enhancing the overall effectiveness of your Business Intelligence initiatives.
- Utilizing PivotTables: The PivotTable feature is essential for summarizing and analyzing imported information. This feature not only enhances your analysis capabilities but also supports the fact that built-in PivotTables are the most popular analytic tool, significantly simplifying complex interpretation and making it easier to derive actionable insights.
- Applying Filters: Utilize Excel’s robust filtering options to narrow down specific segments, enabling deeper insights and more focused analyses that drive operational efficiency.
- Information Exploration: Participate in exploratory information analysis by utilizing charts and graphs to visualize trends and patterns. This visual depiction of information can lead to a more intuitive comprehension and quicker decision-making, showcasing the power of effective visualization.
-
Best Practices: Adhere to visualization best practices by ensuring charts remain simple and clear, utilizing appropriate scales, and effectively labeling axes. Integrating visualization techniques with analytical functions enhances clarity and improves the communication of data-driven insights.
-
Case Study Application: Consider a case study on geospatial analysis, where Excel’s map charts and external geocoding tools enhance geographical information visualization. This real-world application illustrates how effective information analysis techniques can offer actionable insights, emphasizing the value of combining the Excel Power BI add-in with BI capabilities.
- Utilizing Key Features: Integrate the ‘3-Day BI Sprint’ to quickly create professionally designed reports that improve your reporting capabilities. Furthermore, utilize the ‘General Management App’ for thorough oversight and intelligent evaluations, ensuring that your analytics conforms to best practices.
By applying these methods, you can optimize your analysis process and reveal actionable insights from BI information, ultimately enhancing operational efficiency. As Rand Owens, VP of Marketing at Polymer Search, states,
Analyzing information on Polymer is several times quicker and more effective than traditional spreadsheets, and best of all, you won’t encounter information fatigue.
This emphasizes the significance of incorporating robust tools such as EMMA RPA and Automate into your analysis efforts, ensuring a risk-free ROI evaluation and professional execution while boosting productivity.

Creating Reports and Visualizations with Power BI Data in Excel
Generating meaningful reports and visual representations with BI information in a spreadsheet is a simple procedure that can greatly improve your information storytelling, ultimately fostering growth and operational effectiveness. Follow these essential steps:
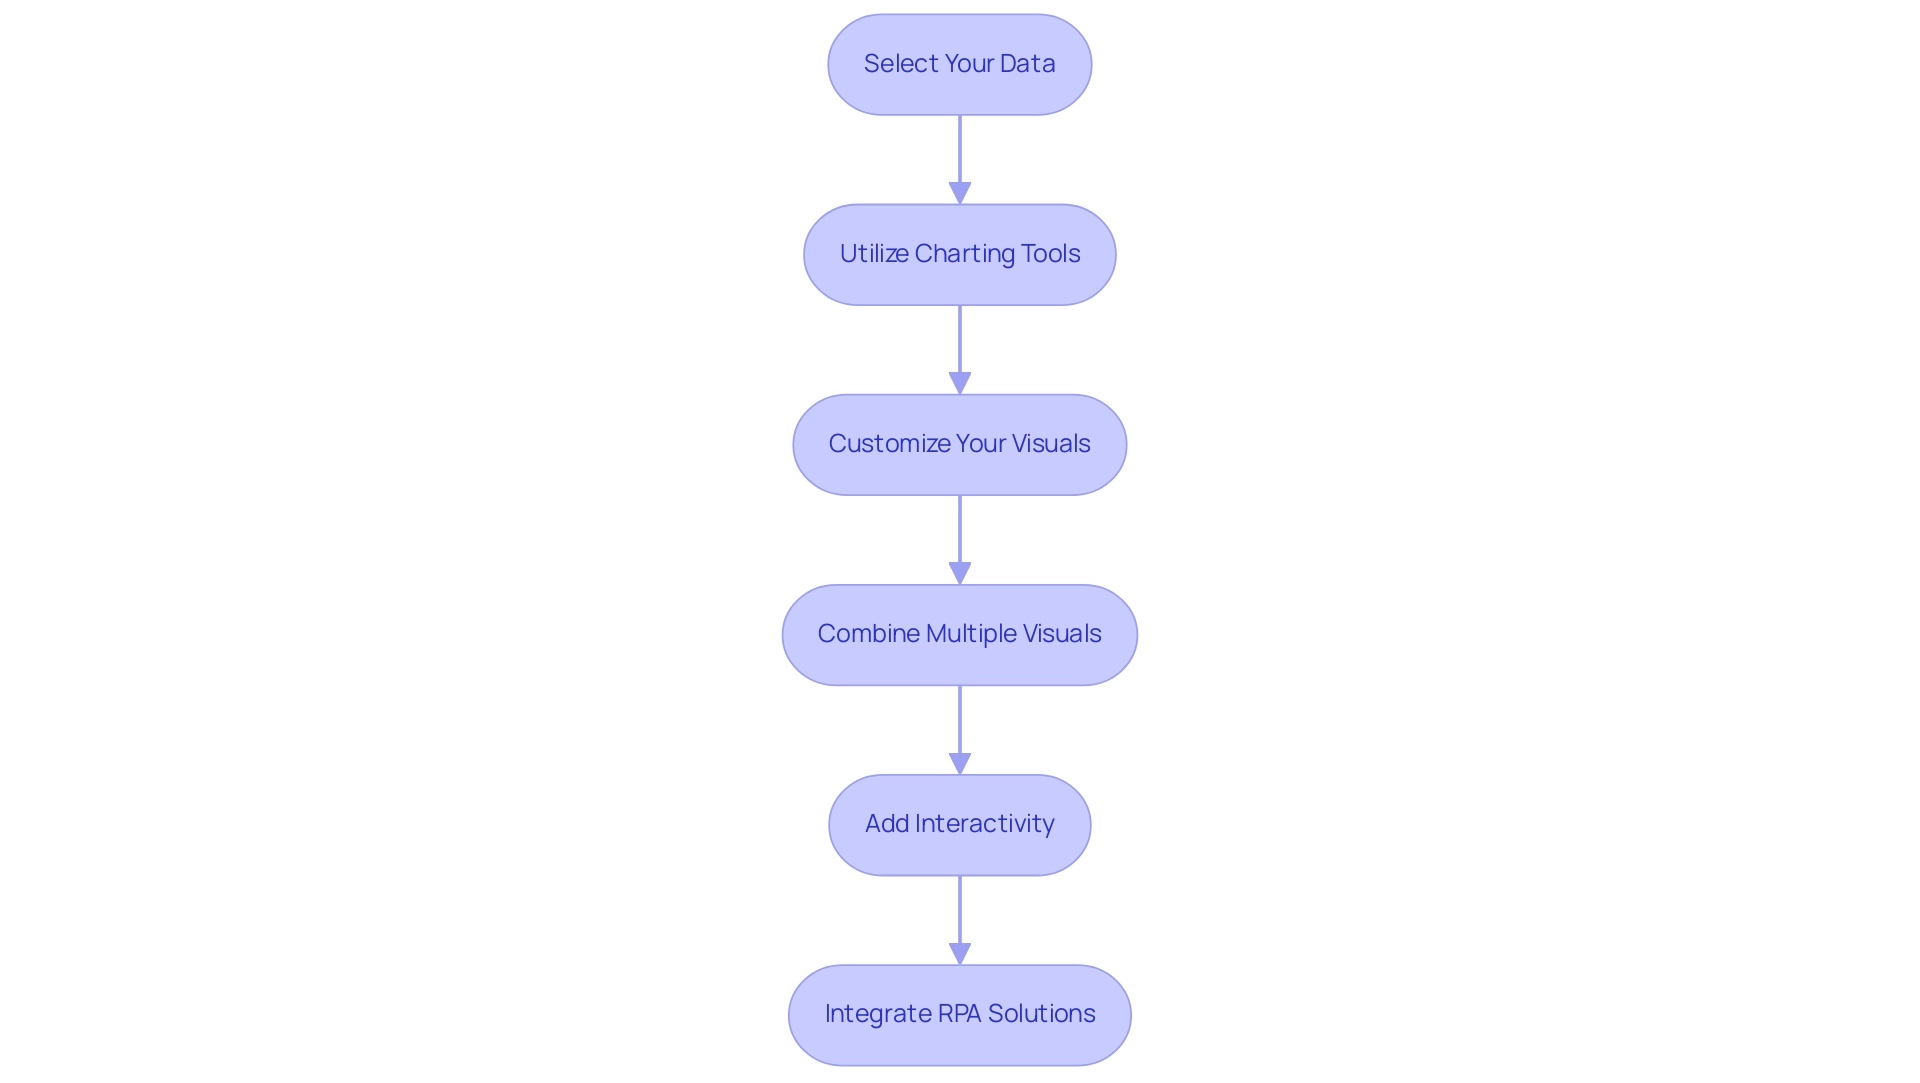
- Select Your Data: Begin by importing the relevant dataset using the Excel Power BI add-in into a spreadsheet, ensuring you have access to the most current and comprehensive information.
This foundational step is crucial in addressing challenges related to information inconsistencies.
- Utilize Charting Tools: Leverage the advanced charting capabilities of this software, which have seen significant improvements recently. You can create dynamic visualizations such as bar charts, line graphs, and pie charts that effectively represent your data trends.
Notably, content related to spreadsheet charting tools has garnered significant interest, as evidenced by Natasha’s content receiving 100k views.
- Customize Your Visuals: Tailor your visuals for maximum impact. Adjust colors, labels, and titles to enhance clarity and engage your audience more effectively.
The customization options available in Excel, especially when using the Excel Power BI add-in, allow for a high degree of personalization, making your documents more relatable and actionable.
- Combine Multiple Visuals: To provide a comprehensive view of your information, consider assembling a dashboard by integrating multiple charts and tables onto a single worksheet. This approach enables thorough analysis at a glance, tackling the time-consuming nature of document creation.
For instance, the case study on ‘Customer Information Improvement Tracking’ illustrates how corrections in customer details for 10 customers were visually represented in a line chart, showing a trend of improvement over time.
- Add Interactivity: Elevate your reports by incorporating interactivity. Utilize slicers and timelines to enable users to filter and explore the information dynamically.
This feature empowers your audience to interact with the information on their terms, enhancing their understanding and retention of the content presented.
- Integrate RPA Solutions: To further enhance operational efficiency, consider utilizing RPA tools like EMMA RPA and Power Automate. These tools can automate repetitive tasks involved in information extraction and documentation generation, addressing staffing shortages and outdated systems.
By automating these processes, you can free up valuable time for your team to concentrate on strategic decision-making.
As Salvador, a Responsive Resident, noted, ‘Hi, I’ve just posted it http://community.powerbi.com/t5/Desktop/Storing-and-using-information-from-a-dynamic-data-source-usi…’—community engagement can provide additional insights into effective practices.
By following these steps, you will be equipped to produce professional, engaging documents and visualizations that clearly communicate the narrative behind your information with the Excel Power BI add-in. With the right tools and techniques, including the power of Business Intelligence and RPA, you can transform raw information into valuable insights, reinforcing the importance of insight-driven decision-making.

Maintaining and Sharing Your Power BI Reports in Excel
To efficiently manage and distribute your BI analysis in spreadsheet format, consider adopting the following recommended strategies, as emphasized in our 3-Day BI Sprint initiative:
-
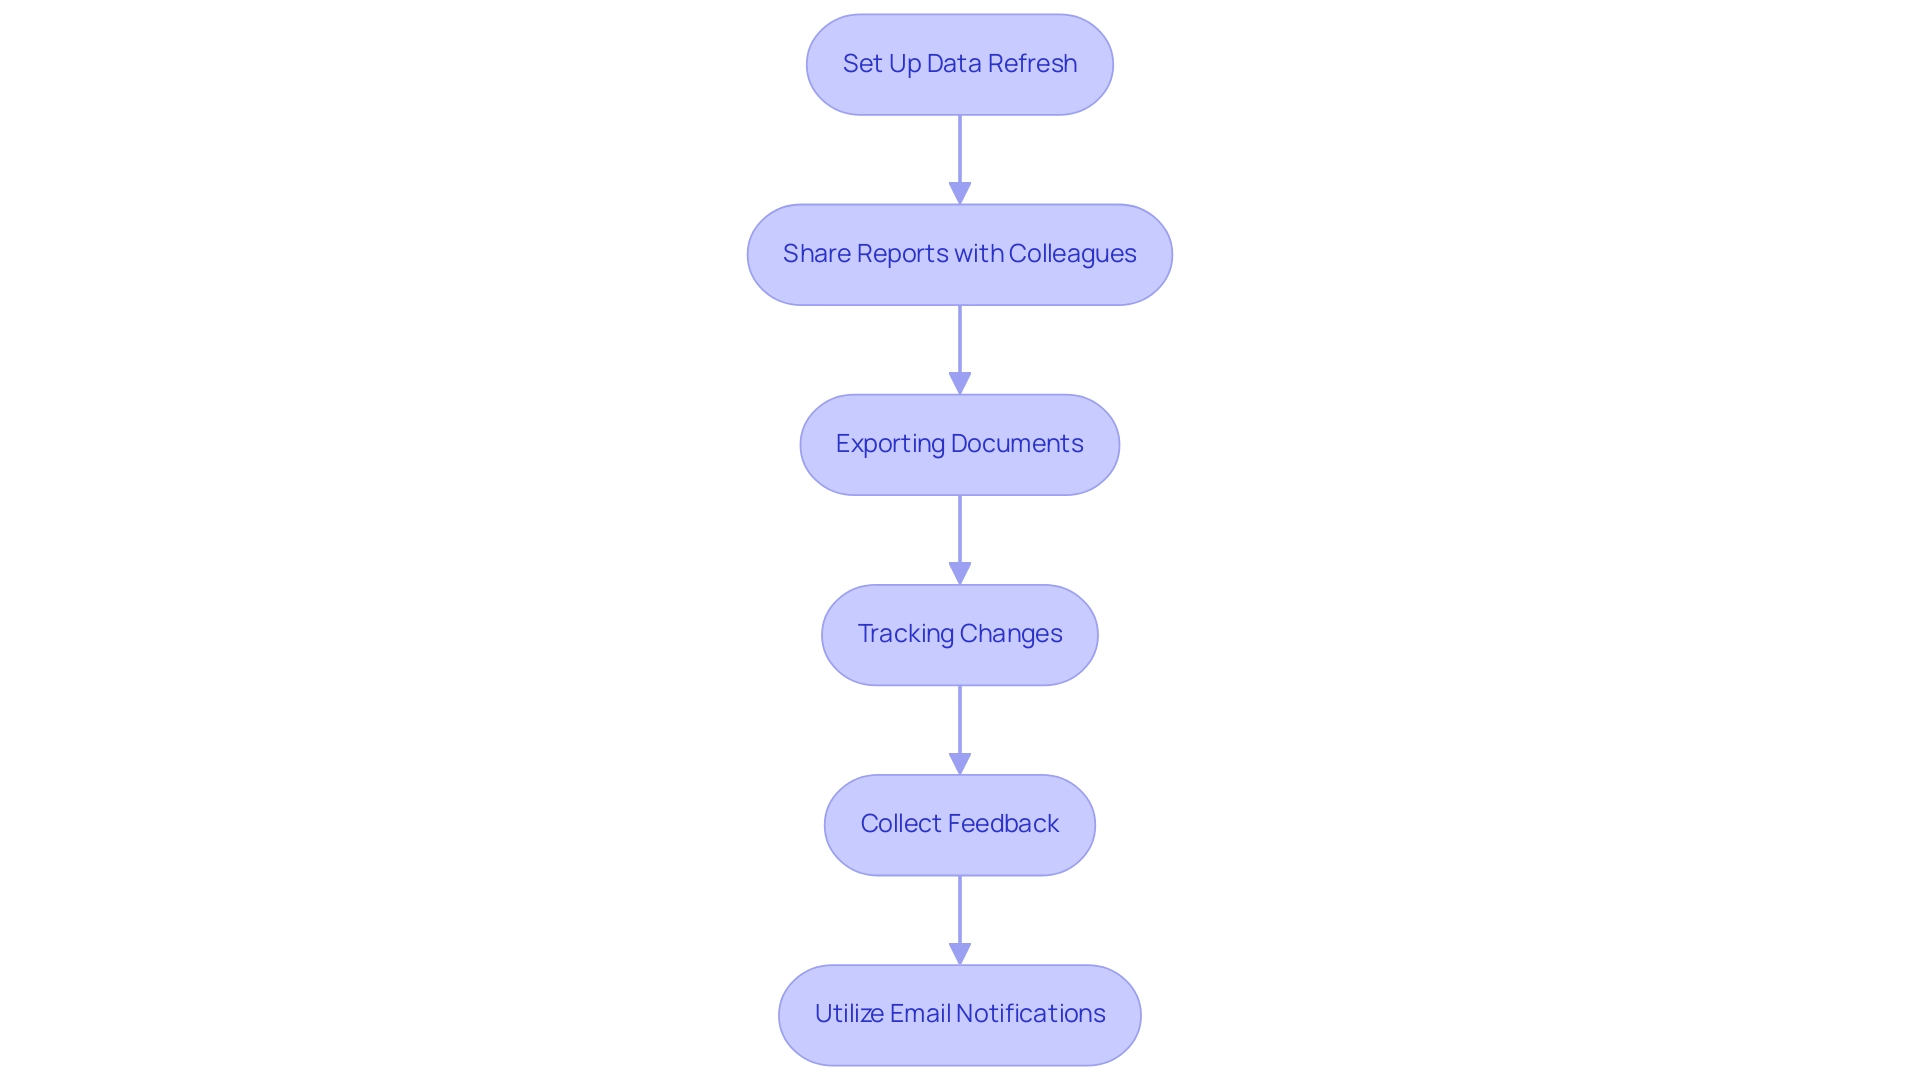
Set Up Data Refresh: Enable automatic data refresh in the spreadsheet application to ensure your documents always reflect the most current data from Power BI. This practice enhances accuracy and builds trust in your reporting, allowing you to focus on leveraging insights for impactful decisions using the excel power bi add in.
-
Share Reports with Colleagues: Utilize the software’s robust sharing capabilities to foster collaboration among team members. Platforms like OneDrive or SharePoint enable seamless sharing of workbooks, ensuring everyone has access to the latest insights and can contribute to actionable outcomes.
-
Exporting Documents: For wider communication, consider exporting your documents to formats such as PDF or PowerPoint. This approach simplifies presenting insights to larger audiences, making your findings accessible to all stakeholders and driving informed decision-making.
-
Tracking Changes: Utilize Excel’s version control features to meticulously monitor alterations made to your documents. This is crucial for maintaining a clear record of modifications, ensuring all collaborators are aligned and informed, which is vital for operational efficiency.
-
Collect Feedback: Actively seek input from your team on the documents. Fostering positive feedback improves document quality and guarantees they stay pertinent and actionable, which is a key aspect of our Comprehensive BI Services.
-
Utilize Email Notifications: Consider the case of a user who sought a method to receive notifications for dataset refresh failures without having to log in to the service. By establishing a communal email account for notification forwarding, alerts regarding dataset problems can be efficiently handled, enhancing responsiveness.
By implementing these strategies, including timely information refreshes and efficient communication practices, you can ensure your BI outputs remain current and effectively conveyed among all stakeholders by utilizing the excel power bi add in, fostering a culture of transparency and collaboration that drives growth and innovation. Remember, with our 3-Day Business Intelligence Sprint, you can achieve a fully functional, professionally designed report on a topic of your choice in just three days, addressing common challenges like time-consuming report creation and data inconsistencies.

Troubleshooting Common Issues with the Excel Power BI Add-In
Utilizing the Excel Power BI add-in can present various challenges, but with effective troubleshooting strategies, you can significantly enhance your workflow. Here are common problems and solutions to help you overcome technology implementation challenges:
-
Connection Errors: If you experience connectivity issues with Power BI, first verify your internet connection and ensure you are logged into your Power BI account with the necessary permissions.
This foundational check often resolves issues quickly and efficiently, allowing you to focus on strategic tasks rather than getting bogged down by technical difficulties. -
Data Refresh Failures: Data refresh failures are a prevalent challenge, often stemming from permissions or dataset status. Confirm that you have the right access to the datasets and check that they haven’t been deleted or relocated.
Statistics related to Issue ID 447 underscore the importance of permissions management, emphasizing the need for tailored solutions in your information governance strategy. -
Performance Issues: If Excel is sluggish, consider reducing the amount of information you’re importing. Streamlining your use of PivotTables can significantly enhance performance, ensuring that you can leverage Business Intelligence insights effectively without delays.
Additionally, implementing Robotic Process Automation (RPA) can help automate repetitive tasks, further improving efficiency and allowing your team to focus on more strategic initiatives. -
Visualization Problems: If your visual representations fail to display correctly, ensure that your types align with the chart types you’ve selected. Compatibility issues often lead to frustrating visualization errors, making it crucial to pay attention to detail for clear and actionable reporting.
-
Error Messages: Error messages often provide critical insights into underlying issues. For additional context, the Microsoft support site offers explanations for specific errors, guiding you through troubleshooting effectively.
Recent discussions regarding the Data Factory issue highlight the importance of staying updated with changes that could impact your workflows and decision-making processes. By implementing these troubleshooting tips, you can resolve issues swiftly and maintain a seamless experience with the Excel Power BI add-in.
As one user, Mike Honey, noted, > Thanks Tom – that worked! < This reinforces the idea that with the right approach, common challenges can be efficiently addressed. Furthermore, recognizing the challenges of time-consuming report creation and data inconsistencies emphasizes the need for a robust governance strategy to ensure data reliability and actionable insights.
The case study related to temp tables in the Data Warehouse and SQL analytics endpoint serves as a reminder of the real-world implications of these issues, providing practical context for the solutions discussed.

Conclusion
By effectively integrating the Excel Power BI add-in into data management workflows, organizations can overcome common challenges such as report creation delays and data inconsistencies. Establishing a solid foundation with updated software, proper permissions, and a valid Power BI account is crucial for maximizing the benefits of this powerful tool. Techniques for importing data, utilizing PivotTables, and applying filters enhance the analysis process, while best practices in data visualization ensure clear communication of insights.
Creating impactful reports and visualizations becomes a straightforward endeavor when leveraging Excel’s advanced capabilities. By selecting relevant datasets, customizing visuals, and incorporating interactivity, teams can craft engaging narratives that drive informed decision-making. Furthermore, maintaining and sharing these reports through effective collaboration and timely updates fosters a culture of transparency and innovation.
Troubleshooting common issues with the Excel Power BI add-in is essential for maintaining operational efficiency. By addressing connection errors, data refresh failures, and performance issues proactively, organizations can ensure a seamless experience that empowers teams to focus on strategic initiatives rather than technical difficulties.
Ultimately, the integration of Excel and Power BI not only streamlines data management but also unlocks the potential for data-driven decision-making. By following the outlined strategies, organizations can harness the full power of their data, leading to enhanced growth and operational success. Embracing these tools will transform challenges into opportunities, fostering a culture of informed insights that propel organizational effectiveness.

