Introduction
In the realm of data analysis, the ability to merge multiple tables into a single dataset is not just a convenience—it’s a transformative strategy that can elevate operational efficiency and enhance decision-making. Table appending in Power BI stands at the forefront of this evolution, addressing common challenges such as time-consuming report creation and data inconsistencies. As organizations increasingly rely on Business Intelligence to drive growth, mastering the art of table appending becomes essential.
This guide delves into the practical steps of executing this process, highlighting how to:
- Import tables
- Append queries
- Refine your datasets to unlock deeper insights
By embracing these techniques and leveraging tools like Robotic Process Automation, businesses can streamline their workflows and position themselves for success in a data-driven landscape.
Understanding Table Appending in Power BI
The ability to append tables in Power BI is a robust feature that allows users to combine multiple sets into a single cohesive dataset, significantly improving the efficiency of analysis and reporting. In an era where Business Intelligence is crucial for driving growth, this process addresses common challenges such as time-consuming report creation and inconsistencies. By adding data sets, you form a cohesive collection that not only enhances your workflow but also encourages greater understanding and informed choices.
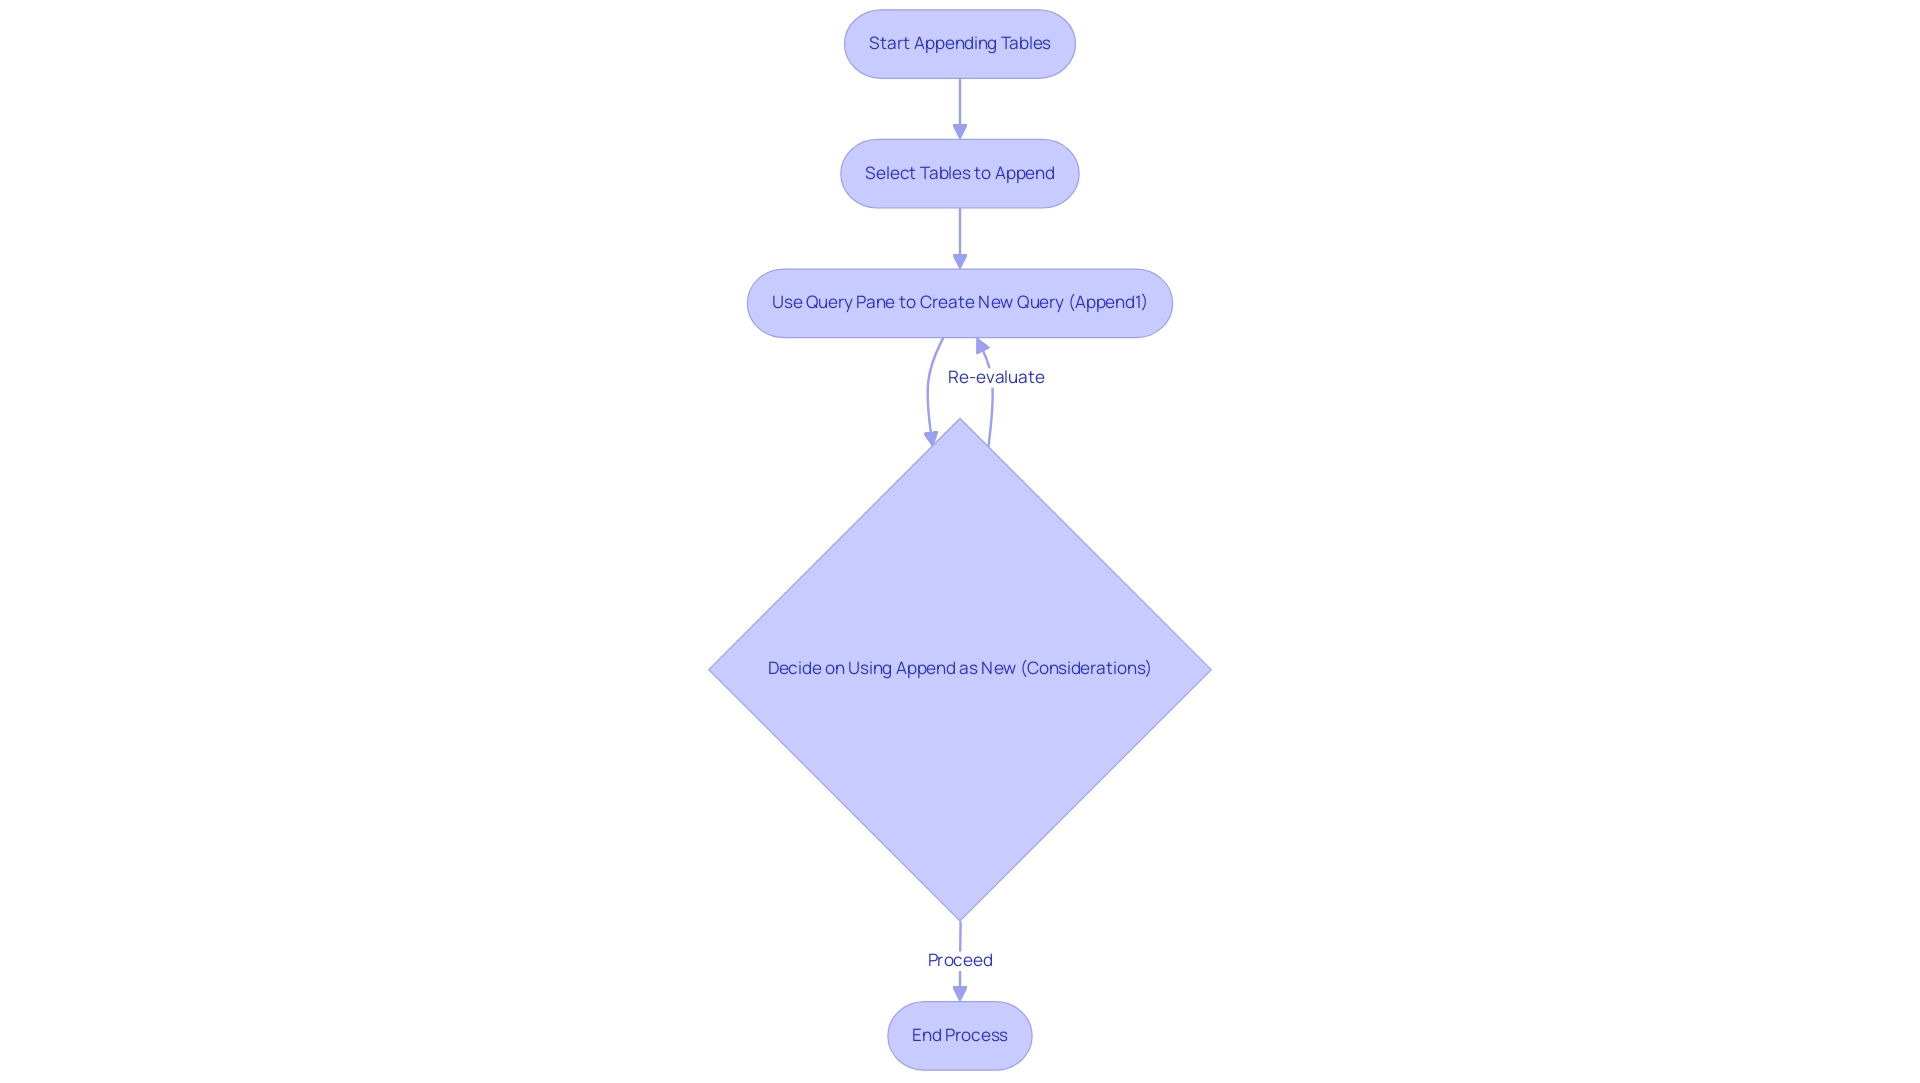
Furthermore, our General Management App complements this process by providing comprehensive management tools and intelligent reviews, further enhancing reporting and actionable insights. Carrying out the appending operation introduces a new query called ‘Append1’ in the query pane, streamlining the management process. As edhans, a Super User, aptly puts it, ‘DAX is for Analysis.
Query is for Data Modeling; this viewpoint emphasizes the significance of mastering data modeling techniques, including how to append tables in Power BI. It is essential to note that ‘Append as New‘ should only be used if there is a reason to re-use the query in another query, as it complicates the Query Dependency View. Mastering this concept is crucial, as it lays the groundwork for the practical steps outlined in this guide, enabling you to harness the full potential of BI and RPA in your operations, ultimately driving data-driven insights and operational efficiency.
Moreover, utilizing Automate can further streamline your workflows, ensuring a risk-free ROI assessment and professional execution.

Step 1: Importing Multiple Tables into Power BI
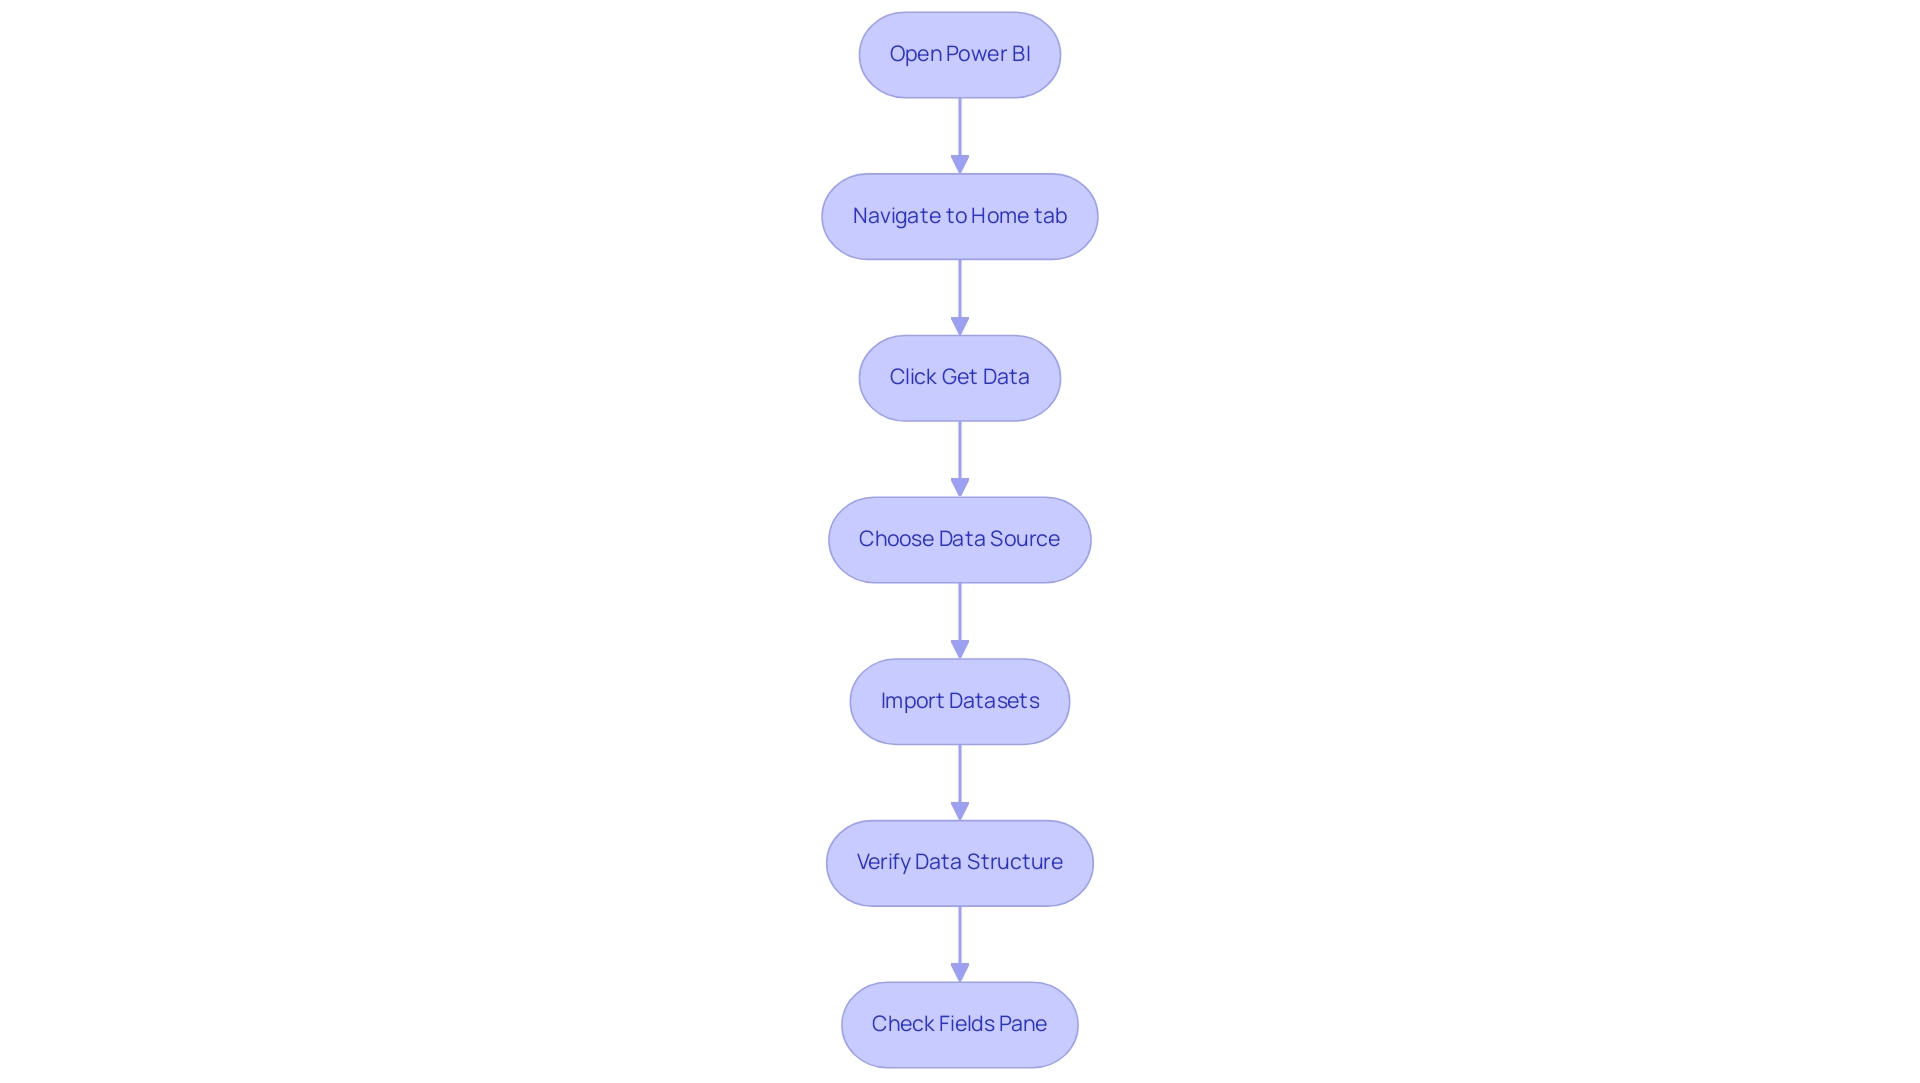
To begin adding data sets in Power BI, open the application and navigate to the ‘Home’ tab. Click on ‘Get Data’ to choose the source of your datasets, such as Excel or SQL Server. Import each dataset by following the prompts carefully.
It’s essential to verify that the structures you import possess similar columns and compatible formats; this uniformity promotes a smoother process to append table in Power BI and reduces possible errors. After importing, you’ll find the tables listed in the ‘Fields’ pane on the right side of the BI interface. This approach not only simplifies your workflow but also conforms to best practices seen in the current trends of information sources used in BI 2024.
As Praveen, a Digital Marketing Specialist with over three years of experience, advises, concentrating on consistency can significantly enhance your reporting efficiency. Indeed, balancing user inquiries with query scale-out is crucial for enhancing performance in BI, especially as new sources of information arise. Furthermore, incorporating Robotic Process Automation (RPA) can automate repetitive tasks related to preparation, such as cleaning and transformation, which decreases errors and allows your team to concentrate on more strategic initiatives.
Leveraging the latest features in Power BI, including new connectors like the OneStream Power BI Connector and the Zendesk Data Connector, can further enhance your ability to append table in Power BI and improve your integration process. Moreover, the case study on ‘Automated Information Discovery’ illustrates how leveraging AI for automatic pattern discovery can lead to deeper insights with minimal effort, reinforcing the significance of effective management practices in driving insight-driven results and operational efficiency for business growth. Addressing challenges like data inconsistencies and time-consuming report creation through RPA can significantly enhance your team’s productivity and decision-making capabilities.

Step 2: Appending Queries in Power BI
Upon importing your datasets into Power BI, navigate to the ‘Home’ tab and select ‘Transform Data’ to access the Power Query Editor. Here, identify the first chart you wish to append. To append a table in Power BI, click on the ‘Append Queries’ option found in the ‘Home’ tab.
You’ll have two options:
1. Select ‘Append Queries as New’ to maintain the original records
2. Choose ‘Append Queries’ to merge them directly.
Carefully choose the additional items you wish to append and click ‘OK’. This process produces a new query that seamlessly merges the data from the selected sources.
Be aware that if the lists have differing column names, adding a custom column such as ‘Company’ to the Sales list may result in NULL values for entries from Sales, as the software recognizes these as separate columns. Participating in the BI community is priceless, with 3,372 users currently online, showcasing a lively exchange of ideas. As a BI Analyst for Ontiyj Retail Store stated, ‘Thank you for your time!
Hope you find this insightful,’ underscoring the real-world utility of these processes. Moreover, a case study named ‘Appending Information in Query’ outlines the essential steps to append a table in Power BI from various tables, reinforcing the significance of utilizing the Query editor for efficient management. Tackling issues like lengthy report generation and inconsistencies in information is essential for utilizing insights from BI dashboards.
Following these steps will not only enhance your data management capabilities but also empower you to tackle these challenges, ultimately driving growth and operational efficiency. Furthermore, integrating tools like EMMA RPA and Automation can streamline these processes, ensuring your organization remains competitive in a data-driven landscape.

Step 3: Configuring Append Options for Tables
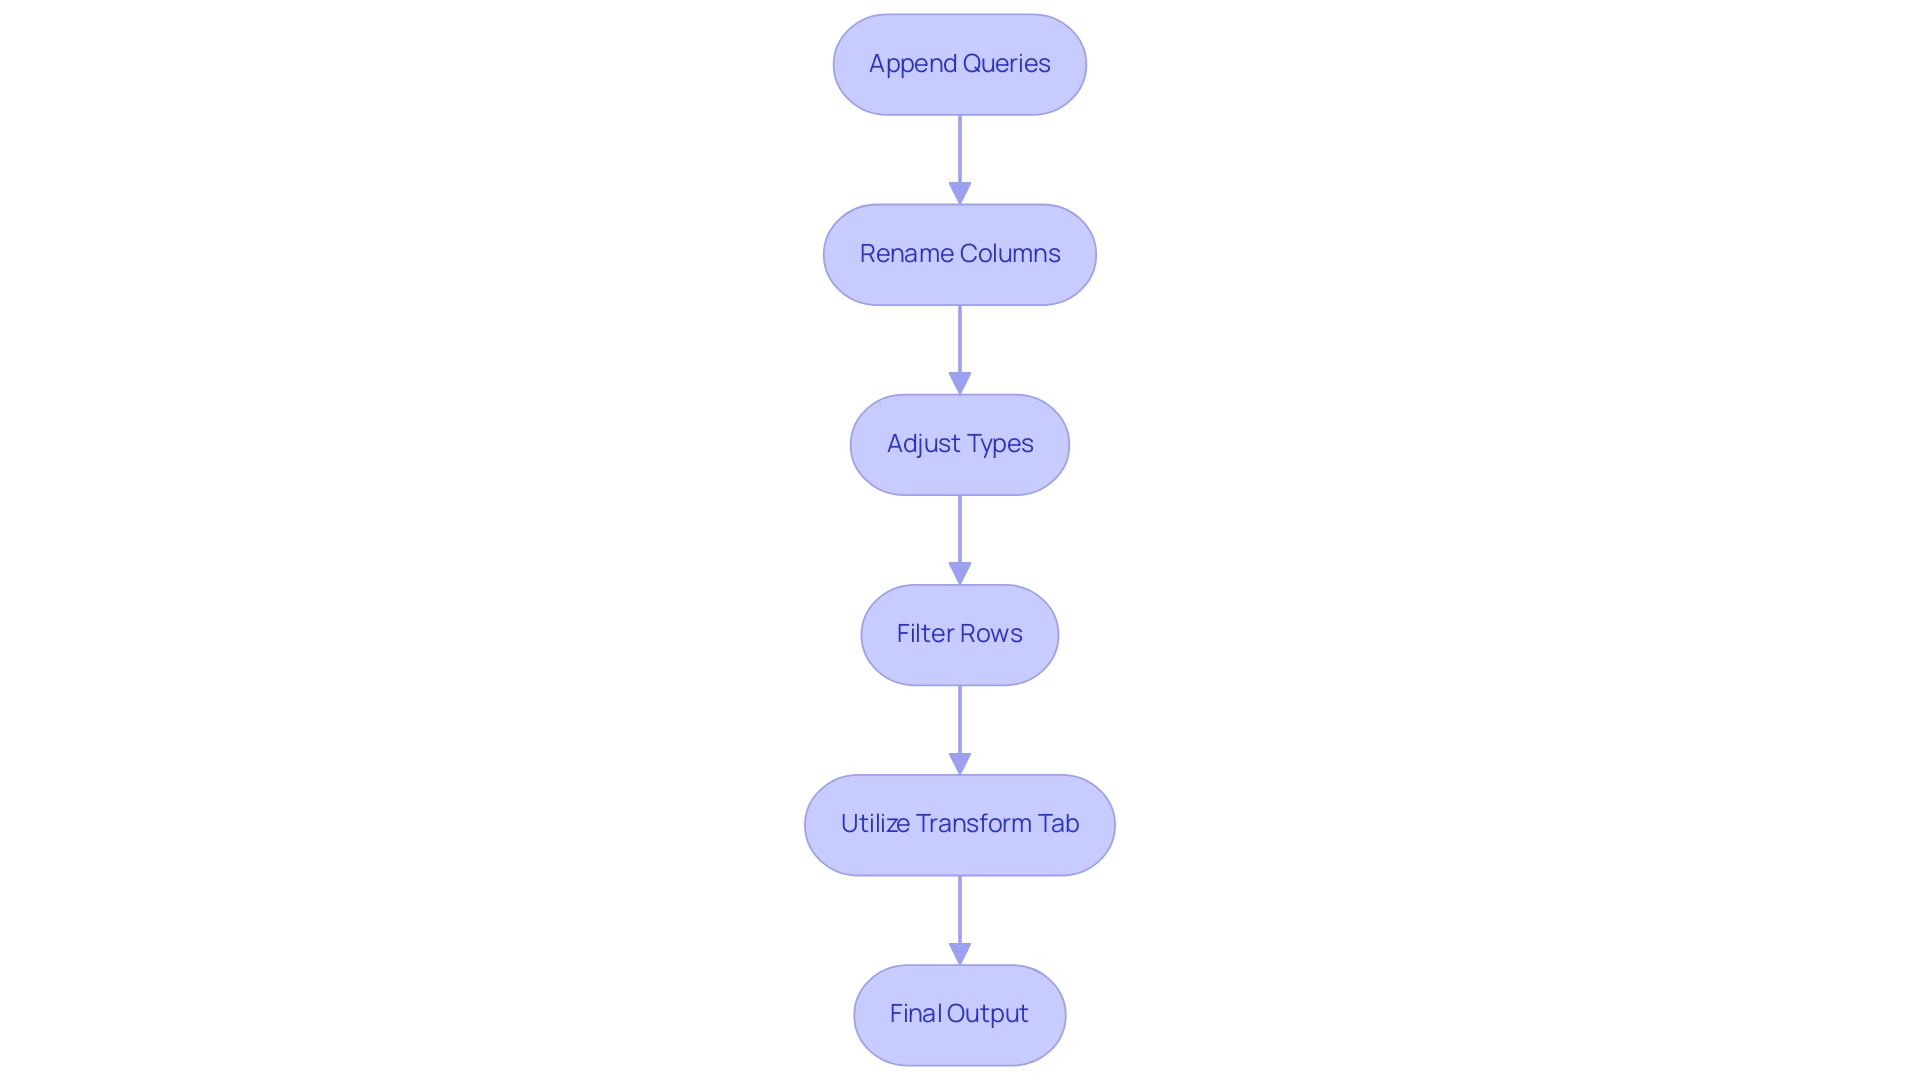
After appending your queries, it’s essential to refine the appended table within the Power Query Editor. Here, you can easily rename columns, adjust types, and filter rows according to your analytical requirements. The ‘Transform’ tab presents a variety of transformation options, providing the flexibility needed to customize your dataset effectively, enhancing the relevance of your analysis and ensuring that the final output is actionable.
As Denys Arkharov, a BI Engineer at Coupler.io, notes,
A notable achievement in my career was my involvement in creating Risk Indicators for Ukraine’s ProZorro platform, a project that led to my work being incorporated into the Ukrainian Law on Public Procurement.
This highlights the potential impact of well-transformed information in driving significant outcomes. In the context of operational efficiency, leveraging RPA can further streamline these processes, reducing manual effort and enhancing productivity, especially in repetitive tasks that slow down operations.
Furthermore, it’s essential to remember that BI refreshes the semantic model once daily, highlighting the significance of timely updates for precise analysis. By carefully arranging your added tables, as shown in the case study on ‘Usage Metrics in National/Regional Clouds,’ you prepare for deeper understanding and more informed decision-making while ensuring compliance with local regulations. Moreover, although this software does not inherently support Boxplots for visualizing percentiles and quartiles, alternative methods like plotting quartiles in a Column chart can offer valuable perspectives on your data distribution.
Embracing these tools and methodologies ultimately supports your goal of driving data-driven insights for business growth. Additionally, utilizing the General Management App can facilitate comprehensive management and smart reviews, further enhancing operational efficiency. This holistic approach ensures that your team can focus on strategic, value-adding work, maximizing the benefits of both BI and RPA.

Append vs. Append as New: Choosing the Right Method
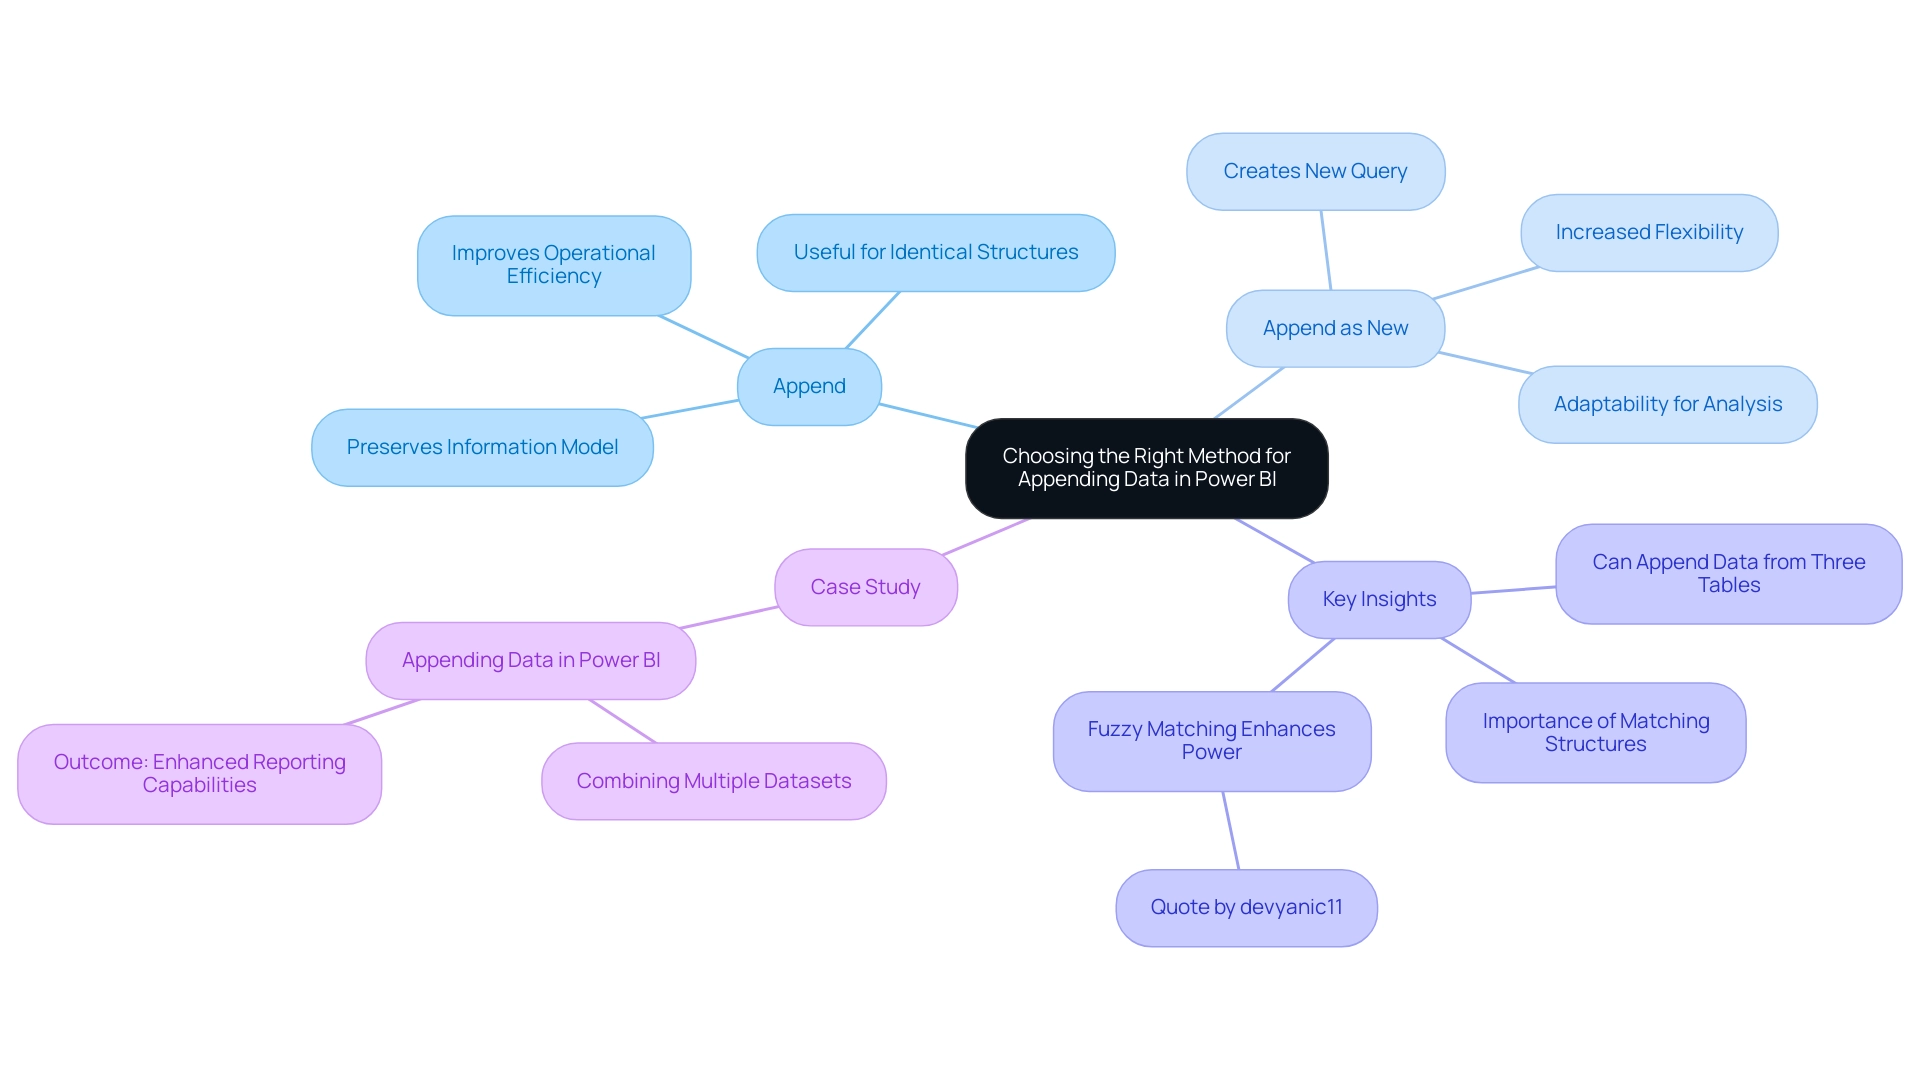
When using BI, you have two main choices for adding datasets to append table in Power BI: ‘Append’ and ‘Append as New’. Choosing ‘Append’ combines the selected sets into the existing query, which is beneficial for preserving a streamlined information model that improves operational efficiency. On the other hand, ‘Append as New’ creates a new query, maintaining the original structures and providing increased flexibility for analysis—essential in addressing the difficulties of lengthy report generation and inconsistencies frequently faced in BI dashboards.
This choice is especially significant as it aligns with effective information management strategies essential for leveraging insights for growth. Remarkably, you can add information from three sources in Power BI, greatly improving your capacity to handle larger datasets effectively. Adding information is particularly beneficial when the structures are the same, with matching column names and types, ensuring smooth integration.
According to recent insights, many users favor the ‘Append as New’ approach for its adaptability in complex analytical environments. A case study on how to append table in Power BI demonstrated that combining multiple datasets into a single unified entity greatly improved management and reporting capabilities, illustrating that using ‘Append’ allowed for a more efficient analysis, while ‘Append as New’ provided the flexibility needed for varied analytical scenarios. Furthermore, as noted by devyanic11,
When merge queries contain the fuzzy matching feature, which joins two tables based on partial matches, they become far more powerful.
Ultimately, consider your information management strategy carefully and select the method that best suits your analytical workflow, as this decision plays a vital role in unlocking the full potential of Business Intelligence and driving operational success. Remember, failing to extract meaningful insights can leave your business at a competitive disadvantage. Explore how RPA solutions can further enhance your data management capabilities and drive efficiency in your operations.

Conclusion
Mastering the process of table appending in Power BI is a fundamental step toward achieving operational efficiency and enhancing data-driven decision-making. By importing multiple tables, appending queries, and refining datasets, organizations can transform their data management practices and unlock deeper insights. Each step in this process not only simplifies workflows but also addresses common challenges such as data inconsistencies and time-consuming report creation.
The choice between ‘Append’ and ‘Append as New’ is critical, impacting how datasets are managed and analyzed. Selecting the right method allows for streamlined data models or flexible analysis, catering to the unique needs of each analytical scenario. Embracing these techniques, along with integrating tools like Robotic Process Automation, can significantly enhance productivity and empower teams to focus on strategic initiatives.
In a world increasingly driven by data, the ability to leverage Power BI effectively is essential for staying competitive. By adopting these best practices, organizations can position themselves for growth, ensuring that their data not only informs but also drives strategic decisions. The journey toward operational excellence begins with mastering the art of data integration, setting the stage for a future of informed decision-making and sustainable success.

