Overview:
The article addresses how to fix issues with Power BI table visuals not displaying data, highlighting common causes such as source connectivity problems, applied filters, and information model relationships. It provides a systematic troubleshooting guide that includes checking data source connections, reviewing filters, and ensuring data type compatibility, thereby equipping users with actionable steps to resolve these visualization challenges effectively.
Introduction
In the dynamic landscape of data analytics, Power BI stands out as a powerful tool for visualizing and interpreting data. However, users often encounter frustrating moments when their table visuals fail to display the expected data. Understanding the common culprits behind these issues is essential for harnessing the full potential of Power BI.
From connectivity problems and filter configurations to data type mismatches, the journey to effective data visualization can be fraught with challenges. This article delves into practical troubleshooting steps and solutions, empowering users to overcome these obstacles and elevate their reporting capabilities.
By following a structured approach, organizations can ensure that their data-driven insights are not only visible but also actionable, driving informed decision-making and operational efficiency.
Common Reasons for Power BI Table Visuals Not Displaying Data
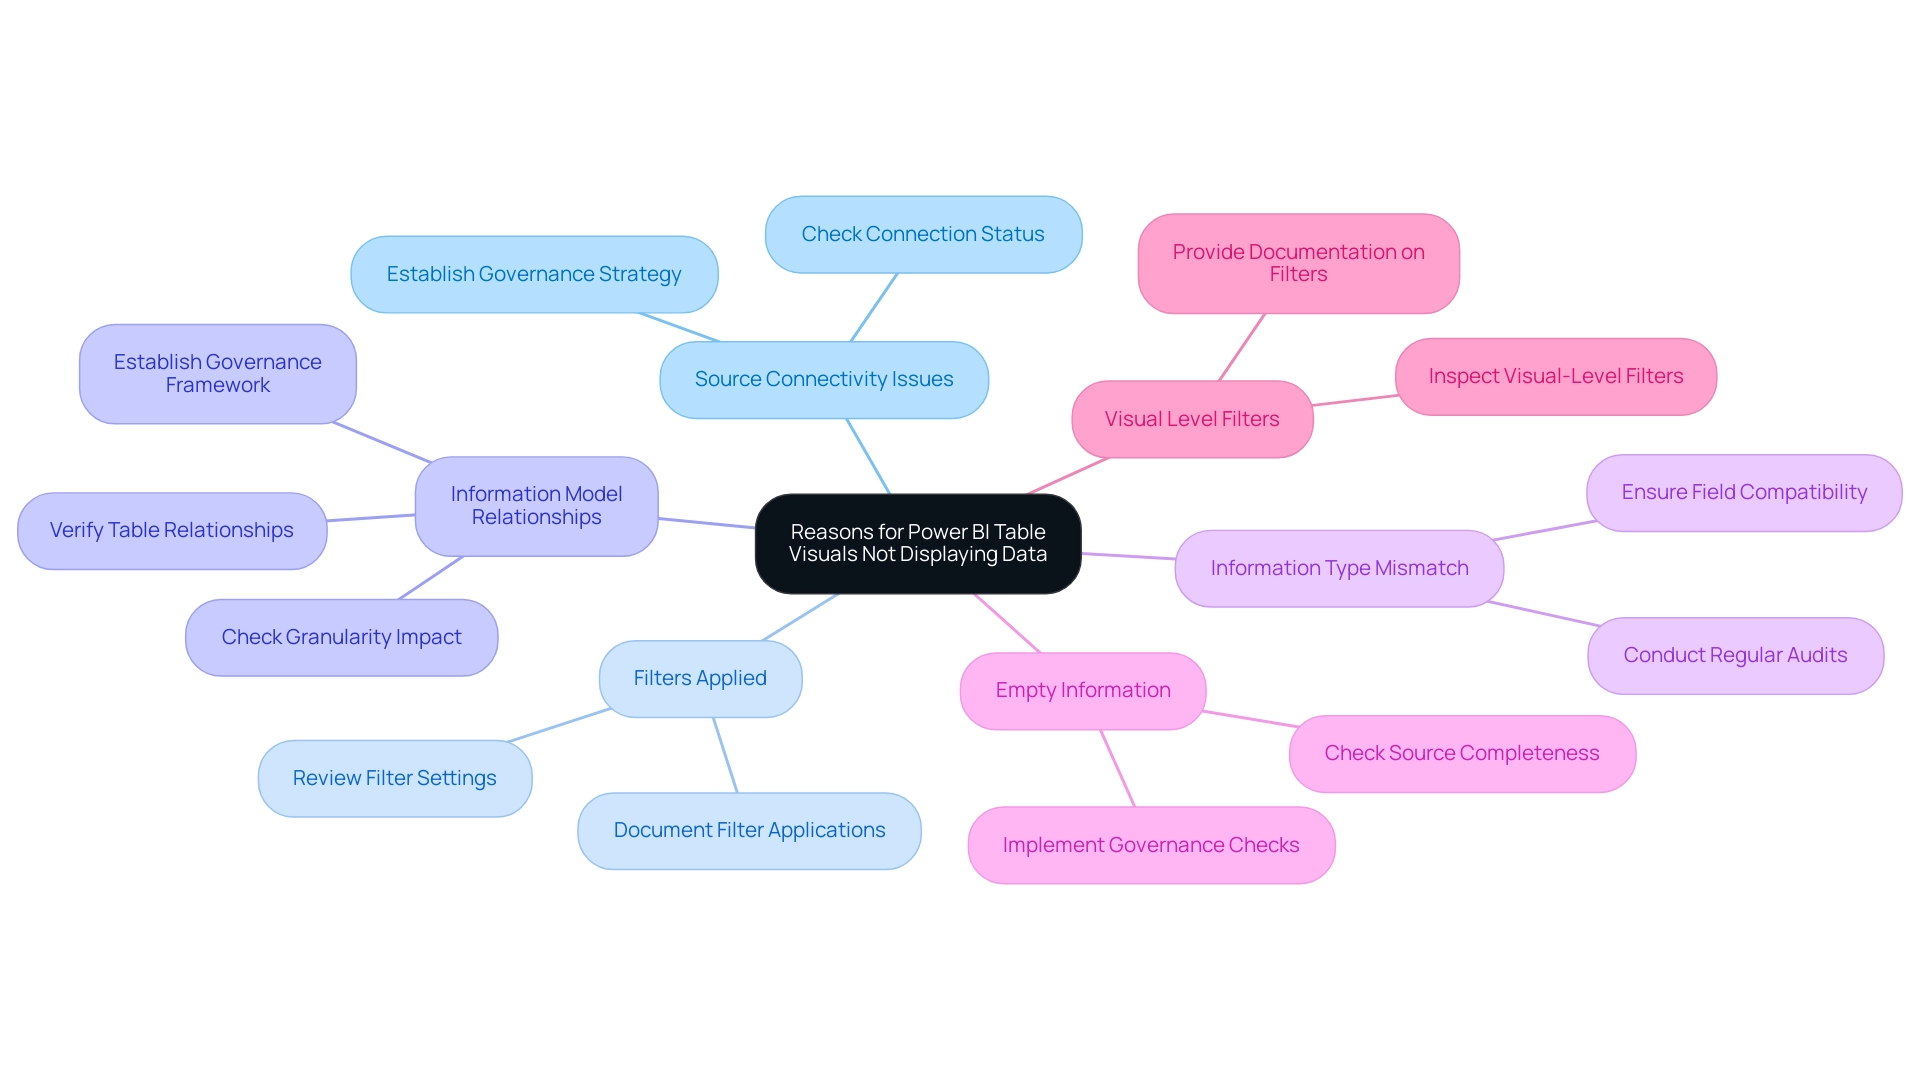
The issue of a Power BI table visual not showing data can arise from several typical challenges that obstruct your ability to utilize insights effectively. Here are key causes to consider, along with actionable guidance to address them:
- Source Connectivity Issues: Confirm that your Power BI is effectively connected to the source. Ensure it is online and accessible to prevent disruption. If issues persist, consider establishing a governance strategy to monitor source connections regularly.
- Filters Applied: Filters applied to the visual or report can inadvertently restrict the information shown. It’s essential to review these filters to confirm they are not unintentionally excluding necessary information. Documenting filter settings can provide clarity and guidance for future reference.
- Information Model Relationships: Incorrectly configured relationships within your information model can block visibility. Take the time to verify that relationships between tables are accurately defined, as this can greatly impact visual outcomes. For example, a user encountered a visibility challenge where a specific product group from the PRODUCTS table was visible during transformation but not in the final visualization. Troubleshooting revealed that checking and adjusting table relationships was crucial, hinting at the potential impact of granularity on visibility. Establishing a governance framework can help maintain these relationships over time.
- Information Type Mismatch: Mismatched information types within the fields used in your table can lead to display issues. Ensure all fields are compatible in terms of type to avoid complications. Regular audits can assist in maintaining information integrity.
- Empty Information: If the underlying content lacks substance or fails to meet the visual criteria, it will not display any information. A thorough check of the source information for completeness is vital. Implementing checks within your information governance strategy can help identify gaps in information.
- Visual Level Filters: Lastly, inspect any visual-level filters that may be applied, as these can prevent information from appearing in the visual. Providing clear documentation on filter applications can guide users in troubleshooting.
By recognizing these frequent concerns and adhering to the recommended measures, you can take the initial step toward resolving the issue of Power BI table visual not showing data. In today’s analytics environment, addressing these concerns effectively is essential for optimizing reporting capabilities. As Xiaoxin Sheng from the Community Support Team notes, “please provide more detail information to help us clarify these?”
This highlights the significance of comprehensive troubleshooting and understanding the context of your information sources. The broad interest in these subjects, with over 277,761 views on associated discussions, clearly shows that these matters resonate widely within the BI user community.
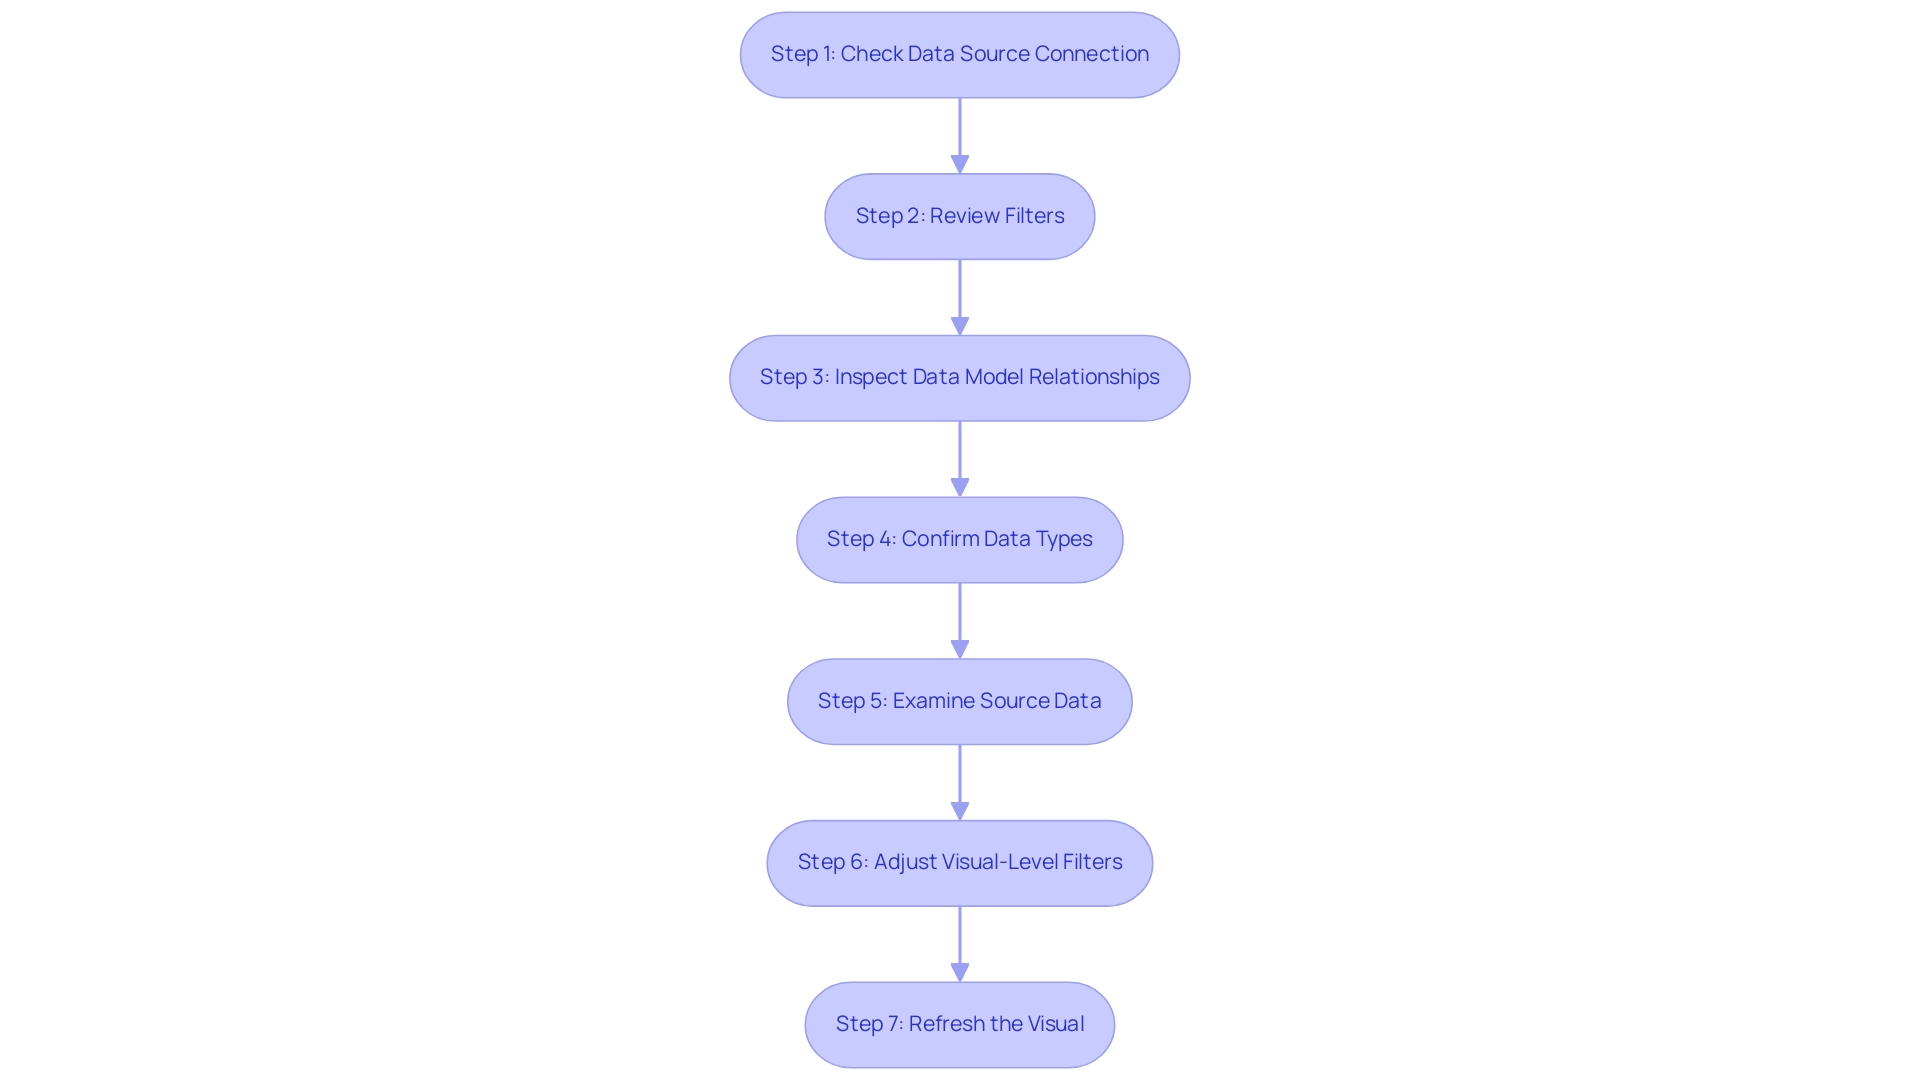
Step-by-Step Troubleshooting Guide for Power BI Table Visuals
To troubleshoot issues with Power BI table visuals not displaying data, follow this systematic approach, which addresses common challenges such as time-consuming report creation and data inconsistencies due to a lack of governance strategy:
- Check Data Source Connection:
- Launch Power BI Desktop and navigate to the ‘Home’ tab.
- Click on ‘Transform Data’ to open the Power Query Editor.
-
Verify that your information source is properly connected, and refresh the connection if needed.
-
Review Filters:
- In the report view, select the table visual.
-
Examine the ‘Filters’ pane located on the right side of the screen. Adjust or remove any filters that may exclude important information.
-
Inspect Data Model Relationships:
- Switch to the ‘Model’ view within Power BI.
-
Scrutinize the relationships between tables to ensure they are correctly established. Look for any broken or inactive relationships that might disrupt information display.
-
Confirm Data Types:
- Within the Power Query Editor, verify the data types of the columns utilized in the table visual.
-
Ensure that these types align with the expected formats (e.g., text, number) and make adjustments as necessary to avoid discrepancies.
-
Examine Source Data:
- Access the original data source (such as Excel or SQL database) to confirm it contains the anticipated data.
-
Investigate for any empty fields or rows that could disrupt the visual’s output.
-
Adjust Visual-Level Filters:
- With the table visual selected, inspect the ‘Visual Level Filters’ in the ‘Filters’ pane.
-
Remove any filters that may limit the information being shown in the visual.
-
Refresh the Visual:
- After making the necessary adjustments, click on the ‘Refresh’ button in the ‘Home’ tab to update the visual with the current data.
By carefully following these troubleshooting steps, individuals can effectively recognize and correct issues that cause the Power BI table visual not showing data, thus improving their analytical abilities and tackling frequent challenges. As emphasized by BI Super User Amit Chanda, ‘You have to create those measures and later split them for visual table’ to achieve accurate representations in your visuals. This highlights the importance of actionable guidance in report creation.
Furthermore, maintaining information visibility and user engagement is essential, as indicated by the count of dashboards or reports in the organization that had at least one view in the past 90 days. Comprehending the importance of examining content from the workspace at least once guarantees that information is linked accurately in the Usage Metrics Report, thus enhancing the overall performance of your BI dashboards.
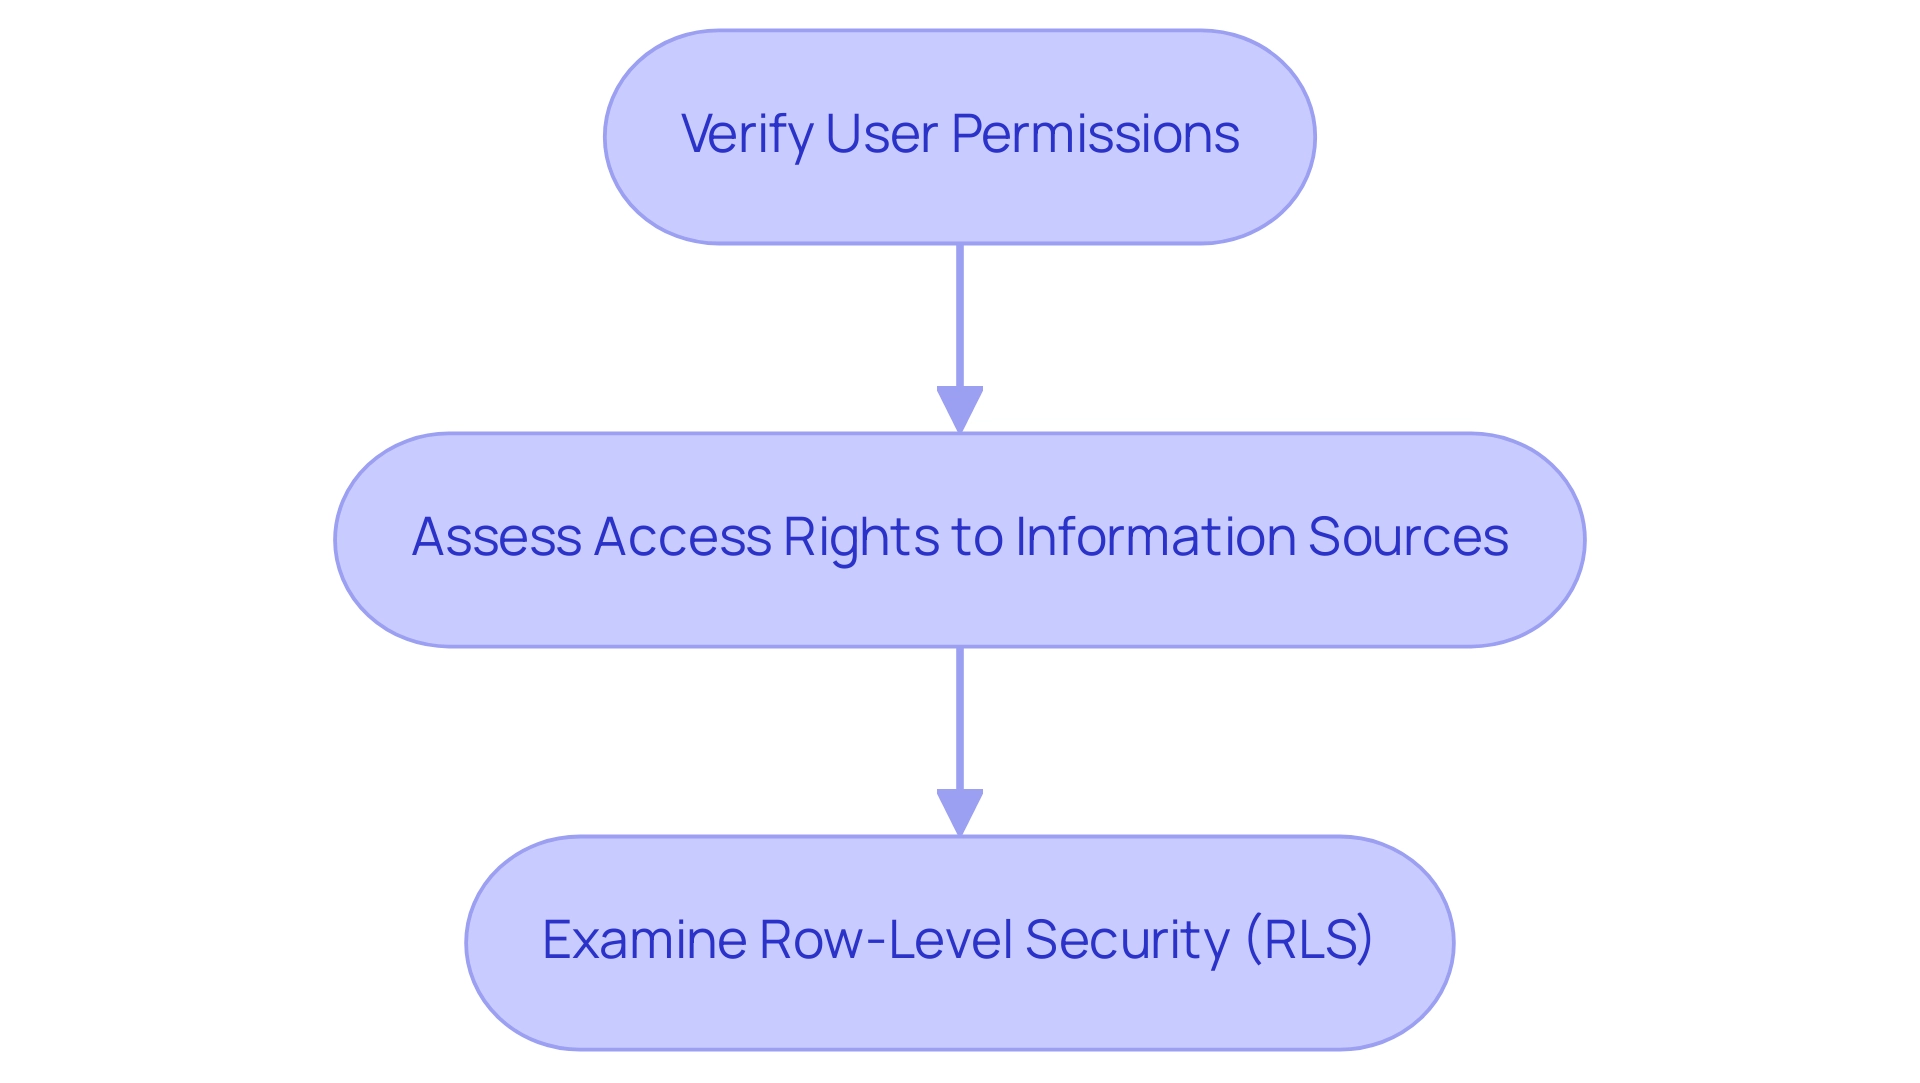
Verifying Permissions and Access Rights
-
Verify User Permissions: Ensure that you possess the necessary permissions to access the information within BI. If there’s any uncertainty regarding your access levels, don’t hesitate to reach out to your administrator for clarification. Proper permissions are crucial for effective information visibility and operational efficiency. By implementing Robotic Process Automation (RPA), you can streamline these permission checks, significantly reducing the time spent on manual verifications and enhancing overall efficiency in your operations. With over 2,911 views on this topic, it’s clear that many are seeking clarity on permissions in Power BI.
-
Assess Access Rights to Information Sources: Confirm that you have the appropriate access rights to the underlying information sources. Whether your information is stored in a database or a cloud service, it’s essential to verify that your user account has been granted the necessary permissions. This step is fundamental to preventing issues that could lead to a Power BI table visual not showing data and impede performance. Tailoring AI solutions can help automate the verification of access rights, ensuring that your team has the insights they need without unnecessary delays. Addressing these access rights can also mitigate common challenges such as inconsistencies and time-consuming report creation.
-
Examine Row-Level Security (RLS): If Row-Level Security is in place, it’s vital to review the RLS settings to ensure they permit access to the information you need. As mentioned by individual ‘jimmyfromus’, comprehending who has access to dashboards and reports, particularly those who may have departed the company, is crucial for preserving information integrity. Should adjustments be required, do not hesitate to modify the RLS settings, or seek assistance from your administrator. Addressing RLS properly can significantly improve your information visibility and resolve issues such as the Power BI table visual not showing data, which many organizations encounter. Additionally, IT leaders utilize tools like Syskit Point’s templates for managing Teams and Microsoft 365 Groups, ensuring security within the M365 environment, which can serve as a practical example of effective user permission management. Leveraging Business Intelligence tools can further transform these insights into actionable guidance, driving operational efficiency and growth while overcoming the challenges of report creation and data visibility.
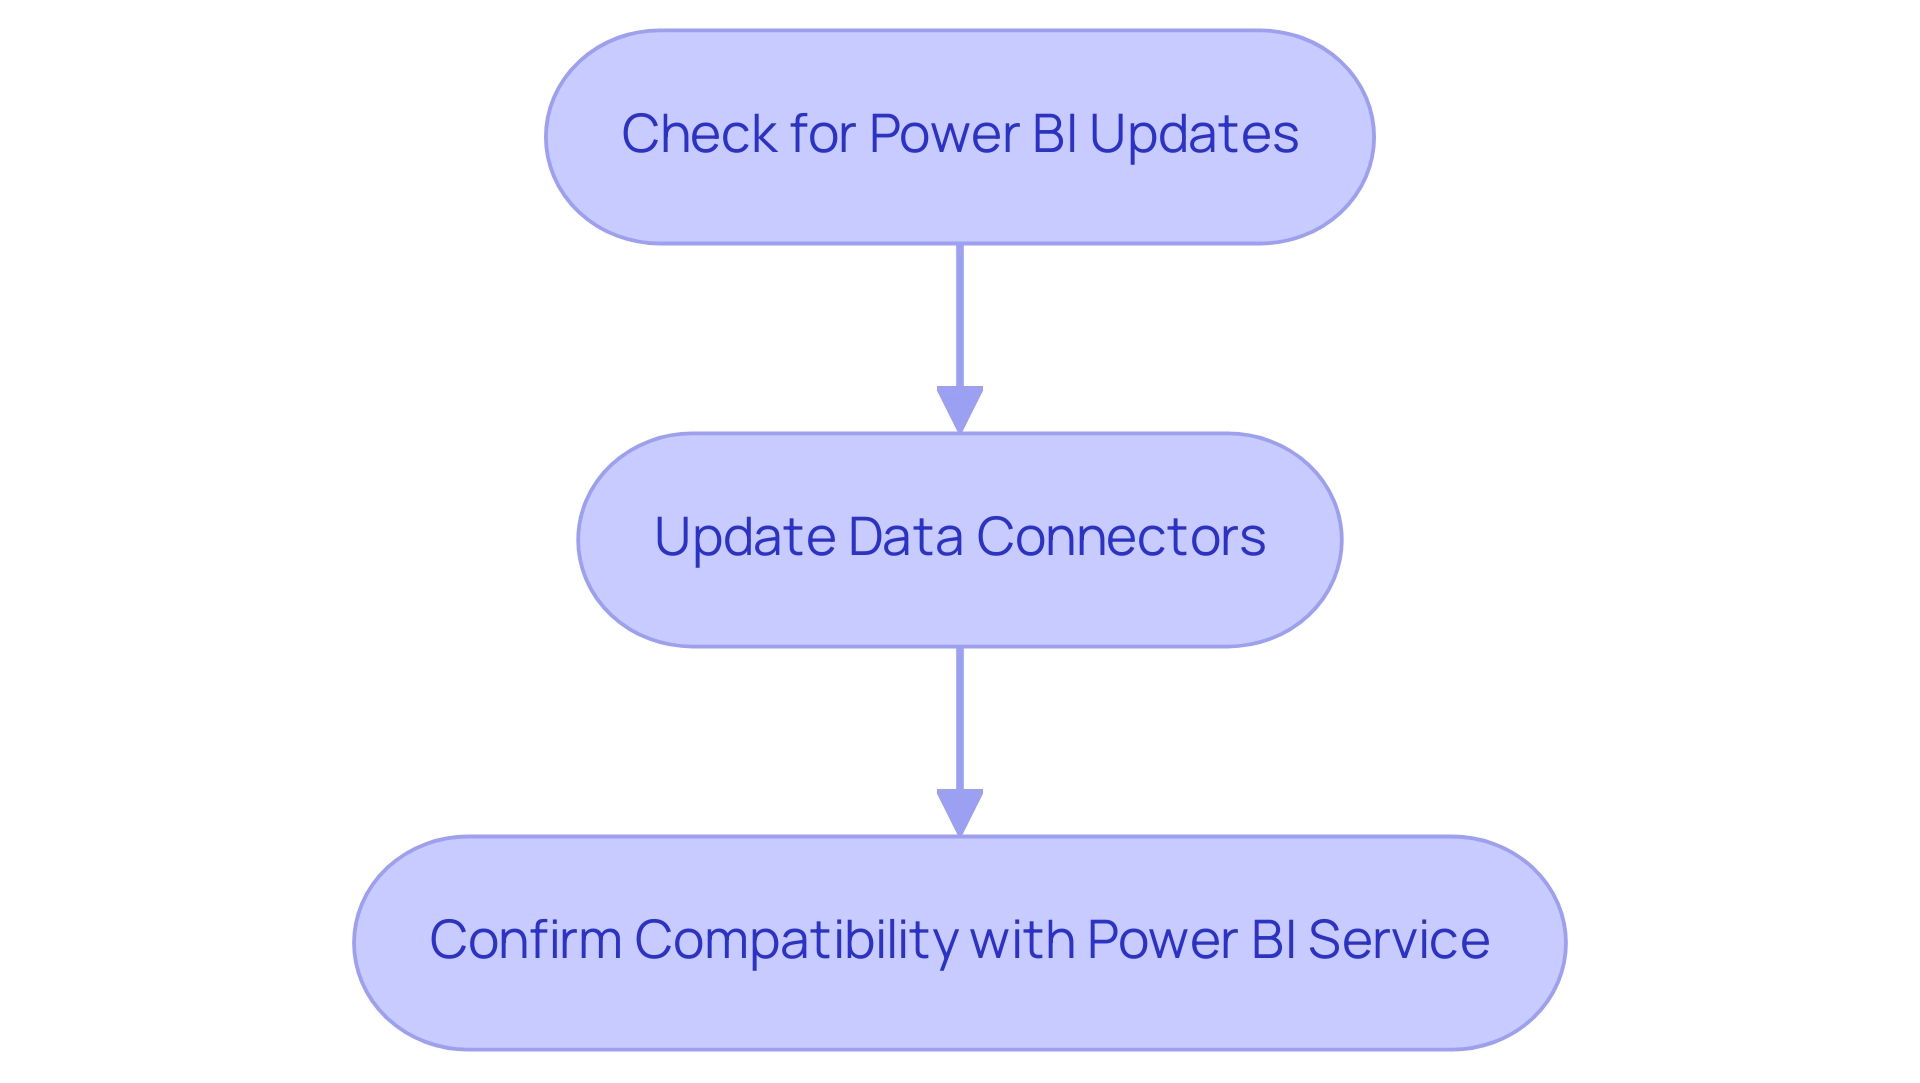
Checking for Updates and Version Compatibility
- Check for Power BI Updates:
-
Regularly verifying updates for Power BI Desktop is crucial for maintaining optimal functionality and leveraging the latest Business Intelligence features. To do this, navigate to the ‘File’ menu, select ‘Options and settings,’ and click on ‘Options.’ Under the ‘Updates’ section, review any available updates to ensure you are utilizing the most effective tools for informed decision-making that drives growth. Keeping your software current not only enhances performance but also aligns with best practices for compliance. Additionally, users can make a copy of the usage metrics report in the Power BI service, providing valuable insights into report usage and performance.
-
Update Data Connectors:
- It is essential to ensure that all data connectors in use are updated regularly. Outdated connectors can lead to significant compatibility issues, negatively impacting visibility and analysis. Regular updates help mitigate risks associated with data retrieval, enhance the overall efficiency of your BI reports, and align with the goal of unlocking actionable insights for your organization.
Compatibility with Power BI Service:
– For those utilizing Power BI Service, it is vital to confirm that your version of Power BI Desktop is compatible with the service. Incompatible versions can cause issues like a Power BI table visual not showing data, which can impede the experience for individuals. As highlighted in a recent experience testing case study, ensuring continuous availability of Power BI content is fundamental to maximizing satisfaction and driving consumption. This case study demonstrated that addressing compatibility issues directly impacts participant engagement and operational efficiency. Moreover, Tom notes,
> Maybe there is some kind of tracking application that can be ingested to the device of the individual, so make sure that you are compliant with any existing regulations of your clients.
Keeping abreast of version compatibility can significantly enhance your operational efficiency and empower your team to leverage data effectively, particularly to resolve issues such as Power BI table visual not showing data. As a reminder, prices for the upcoming conference will rise on February 11th, highlighting the significance of staying informed on BI updates and user compliance, which are essential to maintaining operational efficiency and maximizing the value of data-driven insights.
Testing with a New Report
-
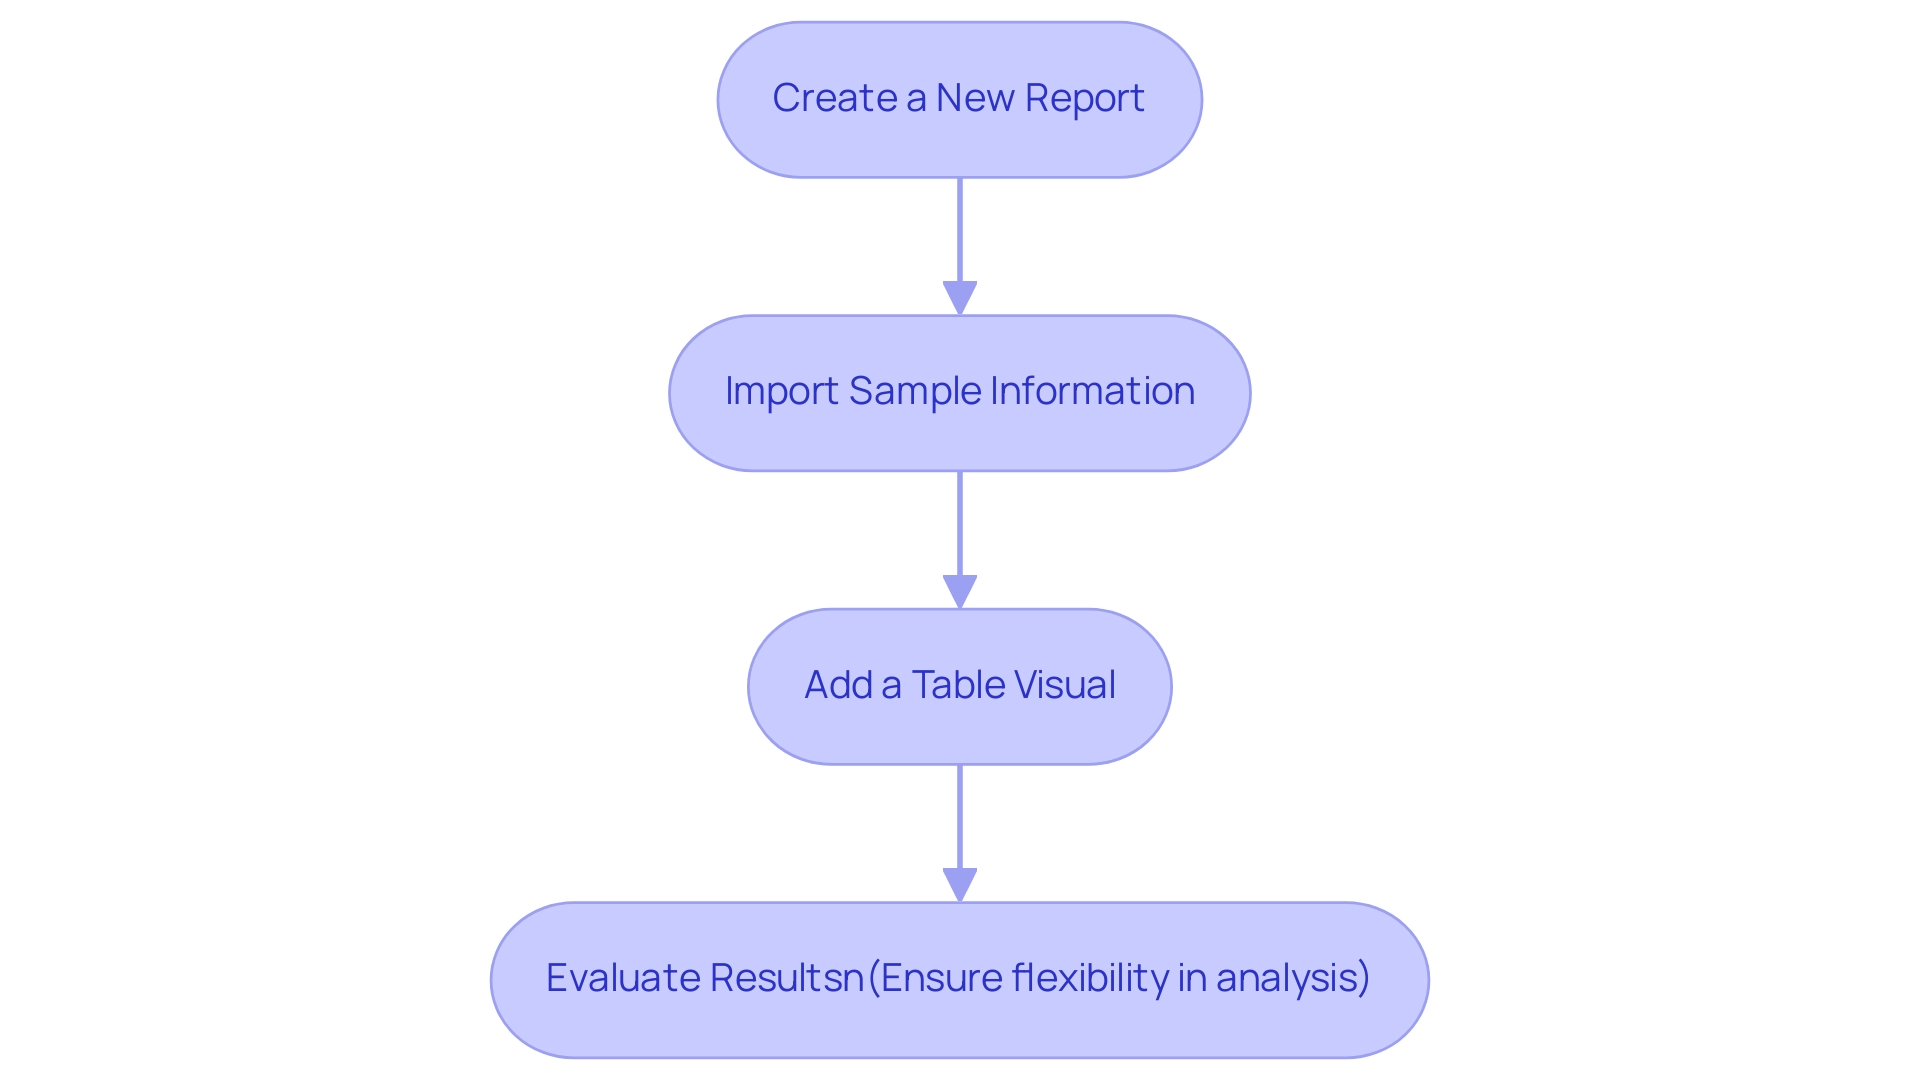
Create a New Report: Open Power BI Desktop and initiate a new report by selecting ‘New Report’ from the ‘File’ menu. This foundational step prepares the ground for effective analysis and emphasizes the significance of Business Intelligence in generating insights that promote business growth, particularly in a landscape where extracting meaningful information is essential to avoid competitive disadvantages.
-
Import Sample Information: Utilize sample information to populate your new report. You can either access sample datasets directly within Power BI or choose a straightforward Excel file containing familiar information. Working with sample information allows for a more controlled environment when troubleshooting, addressing common challenges such as inconsistencies that can impede effective insights.
-
Add a Table Visual: Integrate a table visual into your report, populating it with the imported sample information. This visual depiction is crucial for evaluating whether the information presents accurately and aids in recognizing any possible challenges in your setup, facilitating operational efficiency through streamlined reporting procedures. Incorporating RPA solutions at this stage can further automate information handling and enhance the reporting process.
-
Evaluate Results: Carefully assess the results in the table visual. If the information appears correctly, the underlying issue may reside in the original report. However, if the Power BI table visual is not showing data, it indicates a need for further investigation into the broader Power BI configuration. Recent statistics show that, as of September 14, 2020, with 23 test cases, only 9 tests passed, yielding a success rate of 39.13%. Such insights underline the importance of thorough testing in ensuring that your reports function as intended. To illustrate this, consider the DAX measure used to calculate the passed percentage:
DAX

   Passed Percentage = DIVIDE(COUNTROWS(FILTER(SampleData, SampleData[Status] = "Passed")), COUNTROWS(SampleData), 0)
This measure highlights the significance of accurately defining test statuses. Additionally, an individual named Jere shared, “Now everything works. Thank you very much!” reinforcing the value of addressing and resolving issues systematically. Furthermore, the case study on modifying DAX for multiple statuses demonstrates the need for flexibility in analysis, as users may require adjustments to include additional statuses like ‘N/A’. Lastly, remember to explore the option of connecting Power BI with OData queries for enhanced data integration and reporting capabilities, which can further bolster your decision-making processes and mitigate the risks associated with insufficient insights.
Conclusion
Navigating the complexities of Power BI can often present challenges, especially when table visuals do not display the expected data. By understanding the common reasons behind these issues—such as:
- Connectivity problems
- Filter configurations
- Data type mismatches
- User permissions
users can take proactive steps to ensure their data is visible and actionable.
Implementing a structured troubleshooting approach is crucial. From:
- Verifying data source connections
- Reviewing filters
- Confirming data types
- Examining user permissions
each step plays a vital role in enhancing data visibility. Moreover, keeping Power BI updated and testing with new reports using sample data can further streamline the process and identify underlying issues efficiently.
Ultimately, overcoming these obstacles is essential for leveraging the full potential of Power BI. By applying the insights and solutions outlined in this article, users can transform their data analytics experience, driving informed decision-making and fostering operational efficiency. Embracing these practices not only enhances reporting capabilities but also empowers organizations to navigate the data-driven landscape with confidence and clarity.

