Overview
Mastering Power Automate dashboards enhances operational efficiency by automating repetitive tasks and streamlining workflows, which significantly reduces errors and improves productivity. The article provides a detailed tutorial that includes statistics on time savings, successful case studies demonstrating measurable outcomes, and best practices for dashboard design, all reinforcing the effectiveness of Power Automate in modern business operations.
Introduction
In the digital age, where efficiency is paramount, organizations are increasingly turning to automation tools like Power Automate to transform their operations. This powerful solution not only alleviates the burden of repetitive tasks but also enhances productivity by streamlining workflows across various applications.
As companies grapple with challenges such as staffing shortages and manual data entry errors, the ability to automate processes becomes a game changer. Recent statistics highlight the significant time savings and operational improvements that can be achieved, making it clear that understanding and implementing Power Automate is essential for any organization looking to thrive in today’s competitive landscape.
From integrating with Power BI for enhanced reporting to designing effective dashboards, the journey toward operational excellence through automation is both compelling and impactful.
Understanding Power Automate: A Key to Operational Efficiency
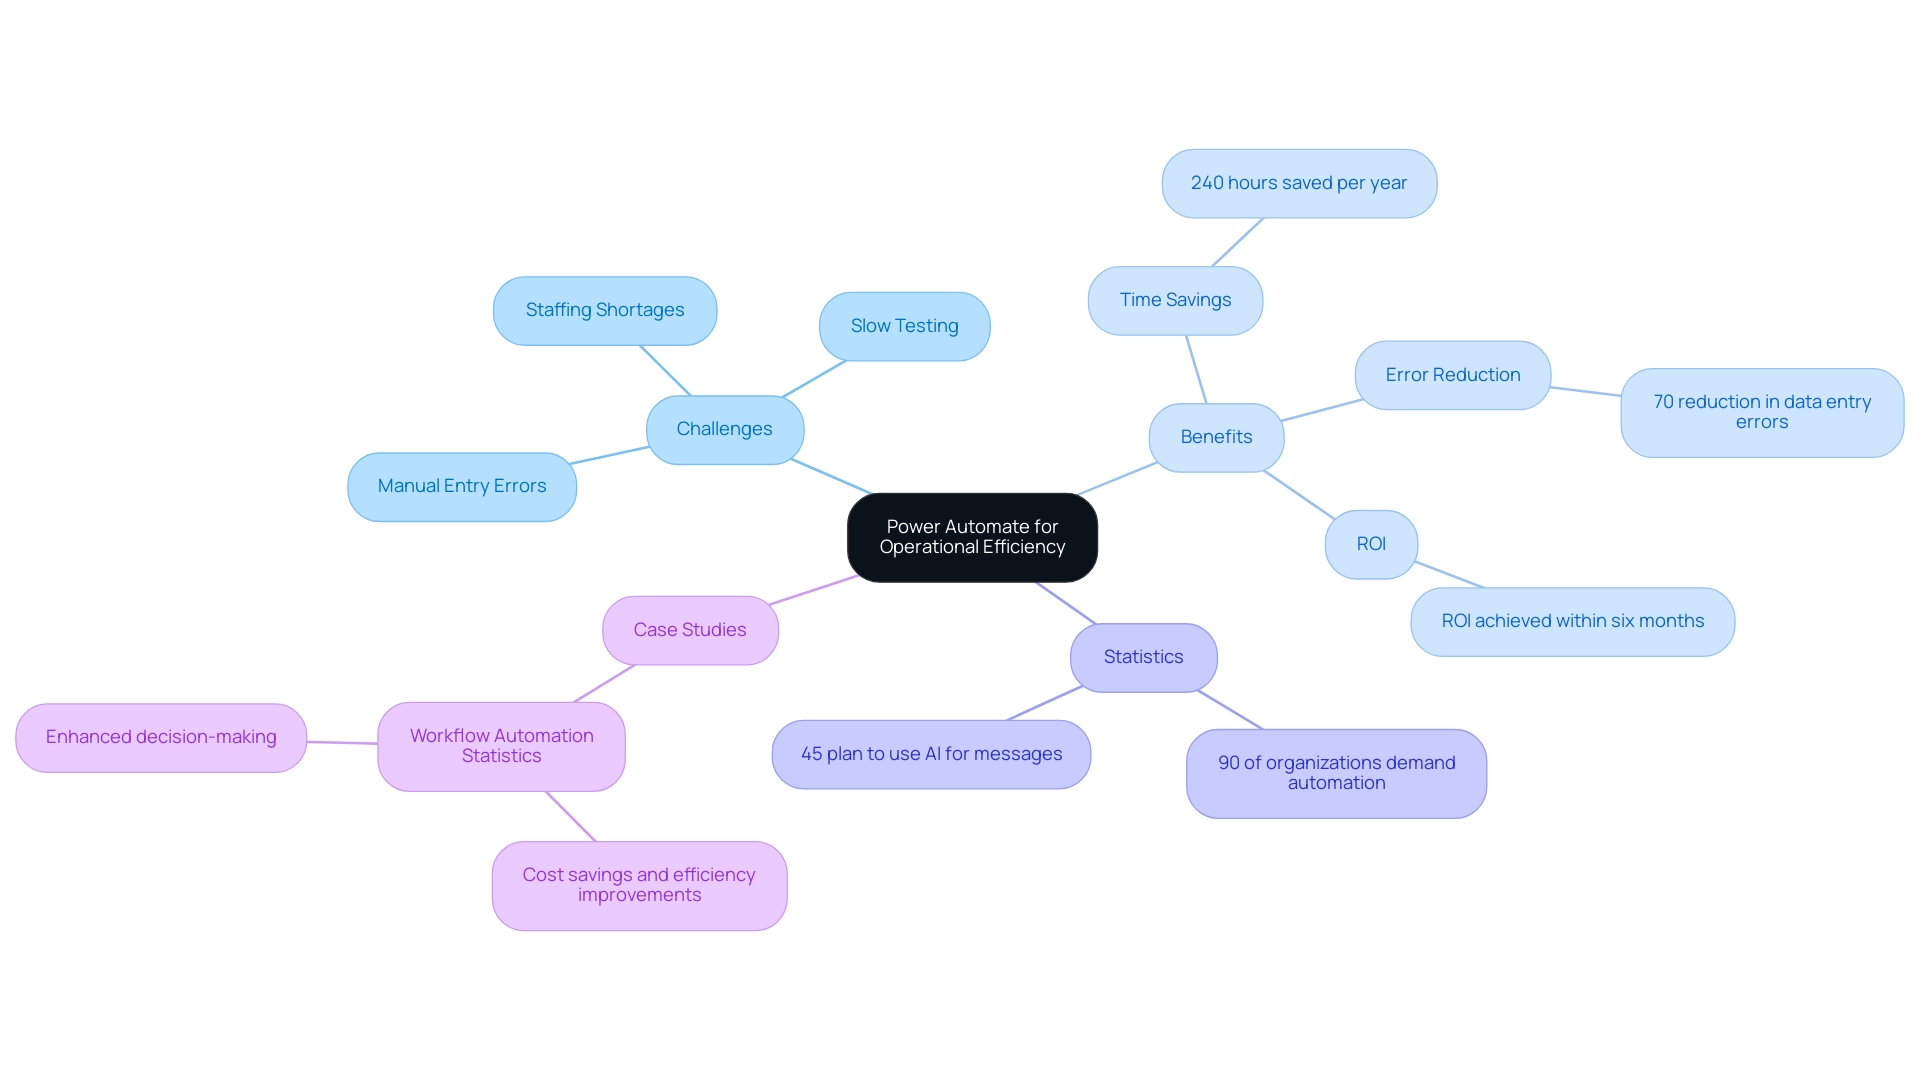
This automation tool stands out as a transformative resource designed to automate repetitive tasks and streamline workflows across various applications and services. This innovative solution addresses challenges such as manual information entry errors, slow software testing, and staffing shortages, enhancing operational efficiency significantly. With its user-friendly interface, even those without extensive coding knowledge can create automated workflows, reducing the risk of errors and inefficiencies.
Recent statistics reveal that employees estimate a potential time saving of approximately 240 hours per year through task automation, underscoring the tool’s effectiveness in enhancing productivity. Additionally, a 2022 study from Salesforce indicated that over 90% of organizations experienced an increased demand for automation across different departments, reflecting a broader shift towards efficiency-driven solutions. Significantly, 45% of individuals intend to use AI for replying to messages and emails, emphasizing the increasing dependence on automation tools such as Flow in daily business activities.
The case study titled ‘Streamlining Operations with GUI Automation’ illustrates how implementing GUI automation has led to a 70% reduction in data entry errors and a 50% acceleration in testing processes, showcasing measurable outcomes that resonate with the goals of directors of operations efficiency. Furthermore, the implementation achieved a return on investment (ROI) within six months, emphasizing the financial benefits of automation. The smooth integration of Microsoft’s automation tools with other applications and third-party services enhances the power automate dashboard, optimizing business processes and enabling organizations to link diverse systems while promoting improved operational efficiency.
Moreover, the 2024 Global State of IT Automation report emphasizes the importance of understanding the evolving landscape of automation tools, encouraging IT leaders to adapt to current trends. For companies striving to enhance their task management efficiency, comprehending and utilizing the features of automation tools and RPA solutions like EMMA RPA is crucial for attaining a risk-free ROI and better employee morale.
Integrating Power Automate with Power BI for Enhanced Dashboards
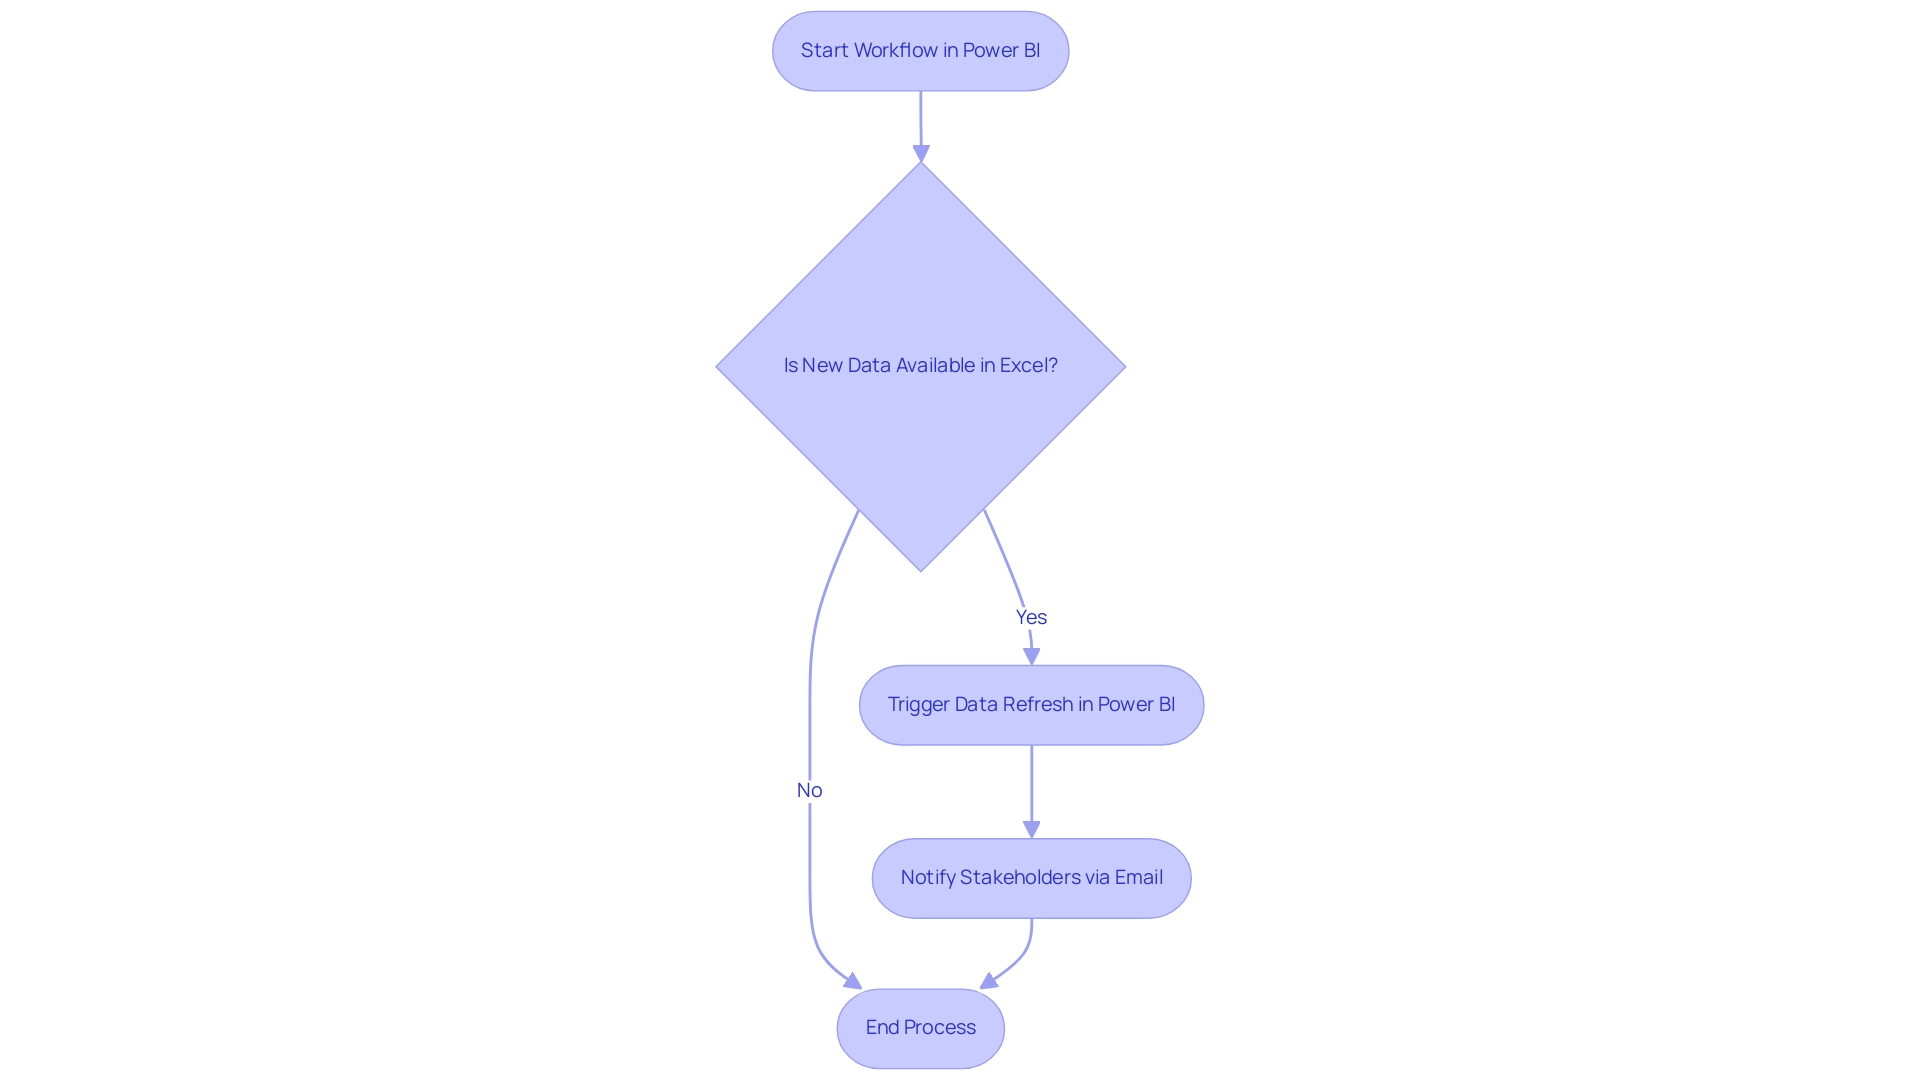
Integrating Flow with Business Intelligence enables organizations to automate refreshes, greatly simplifying reporting procedures while tackling typical workplace issues. For example, by creating a flow in Automate that triggers updates in BI, organizations can combat repetitive tasks that often burden teams. Creating a flow that automatically refreshes your BI dataset whenever new information is entered into a linked Excel file ensures that your dashboards are consistently updated with the most recent insights, enhancing decision-making capabilities and responsiveness to operational changes.
According to Bianca Barragan,
In our example, we’ll start our workflow from BI, where the trigger will always be a button within the BI report.
Moreover, this integration addresses staffing shortages by reducing the manual effort required for data handling, allowing teams to focus on more strategic tasks. Additionally, BI test plans can be scheduled, and key stakeholders are automatically notified by email, further demonstrating the efficiency of this integration.
This synergy between the automation tool and BI not only enhances the effectiveness of the power automate dashboard but also offers crucial insights at a glance, promoting a data-driven environment vital for long-term success. A case study titled ‘Optimizing Business Processes with Automation’ illustrates how integrating these tools accelerates decision-making and improves productivity. The case study reveals that by implementing these automation strategies, the company achieved a 30% reduction in reporting time and a 25% increase in data accuracy, demonstrating the tangible benefits of modernization.
Furthermore, the recent development of automatically storing BI test results in a centralized repository enhances collaboration and sharing across teams, making it a crucial strategy for operational efficiency, especially in sectors like healthcare, where timely information can revolutionize service delivery. Importantly, by alleviating the burden of repetitive tasks, organizations can improve employee morale, allowing teams to engage in more meaningful work and fostering a positive workplace culture.
Step-by-Step Guide to Creating Power Automate Dashboards
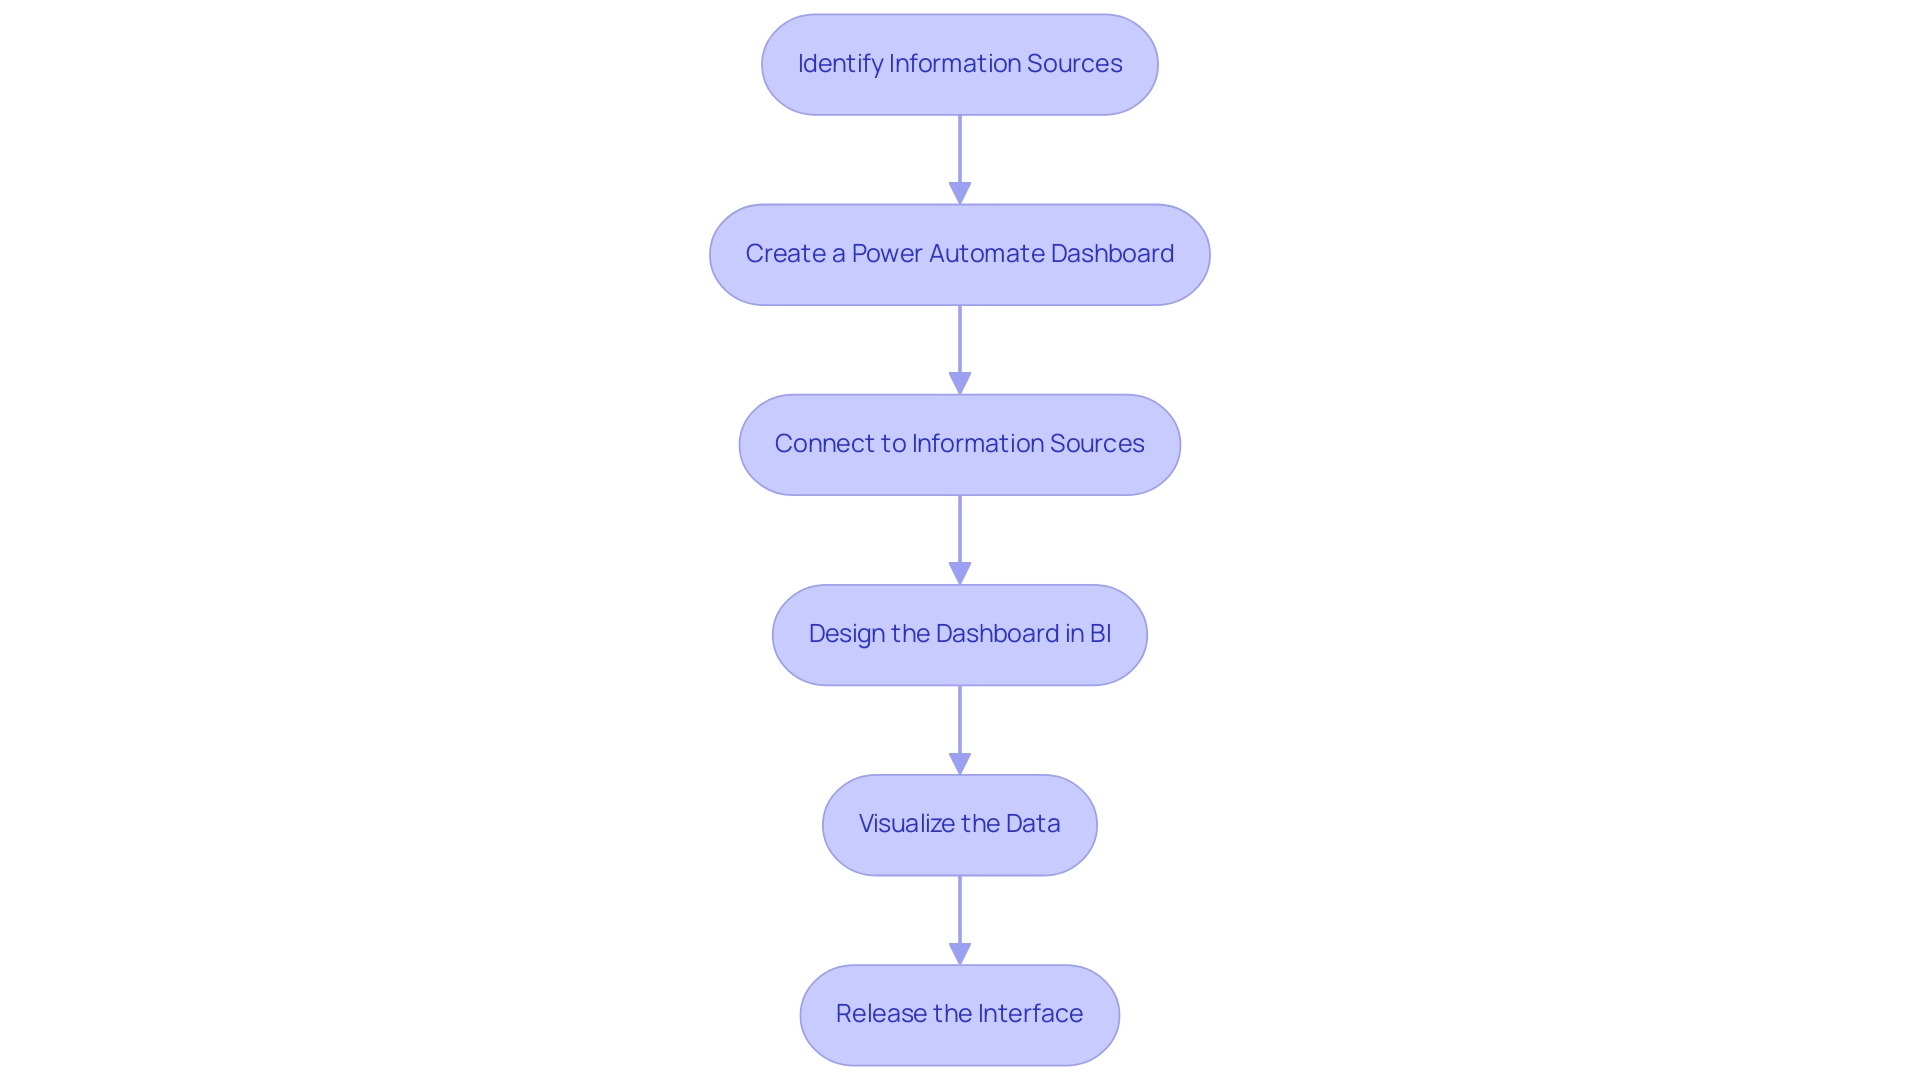
Creating a power automate dashboard involves several key steps that streamline the process and enhance operational efficiency while addressing common workplace challenges. Here’s a detailed guide:
-
Identify the Information Sources: Begin by determining the information sources to include in your dashboard.
Common options are SharePoint lists, Excel files, or various databases. A comprehension of your information landscape is crucial for effective visualization, especially as outdated systems can stifle innovation and hinder productivity. -
Create a Power Automate dashboard: Navigate to Power Automate and set up a new flow.
Choose the type of flow that aligns with your operational needs, whether it’s automated, instant, or scheduled. This foundational step ensures that your power automate dashboard updates consistently with new information, ultimately reducing the repetitive tasks that burden your team and allowing them to focus on higher-value tasks to address staffing shortages. -
Connect to Information Sources: Integrate the chosen information sources by adding appropriate connectors.
Ensure you verify each connection to maintain security and reliability, followed by testing to confirm that transfers are accurate. This step is pivotal in modernizing your operations, particularly in overcoming challenges posed by outdated systems. -
Design the Dashboard in BI: Open BI and create a new report.
Import the information from your Power Automate dashboard, facilitating a seamless transition from information collection to visualization. By utilizing BI’s capabilities, you can improve reporting and gain actionable insights that guide decision-making processes. -
Visualize the Data: Utilize BI’s robust visualization tools to craft meaningful charts, graphs, and tables.
This step is essential as it converts raw information into insights, assisting in decision-making processes. For instance, ClickUp Dashboards can visualize task statuses, workload, and productivity, providing valuable insights into team performance and highlighting the efficiency gains from RPA implementation. -
Release the Interface: Once your interface is refined and prepared, release it to the BI service.
This action grants access to your team and stakeholders, ensuring that everyone is aligned with operational metrics. By doing so, you not only improve operational visibility but also promote efficiency throughout business processes.
By following these steps, you can create a practical and informative display using a power automate dashboard that enhances your analytical capabilities. As Douglas Rocha, a statistics enthusiast, emphasizes,
Can you perform analytics in BI without DAX? Yes, you can, you can do it without measures as well and I will teach you how at the end of this tutorial.
Furthermore, consider the statistics from projects A, B, C, and D, which provide a quantitative foundation for your dashboard design. Moreover, the case study on visualizing statistical measures in Business Intelligence illustrates practical applications and alternative methods for information representation, enriching your instructional content and demonstrating how these tools can significantly enhance productivity and operational efficiency through effective information utilization.
Automating Reports and Dashboards in Power BI
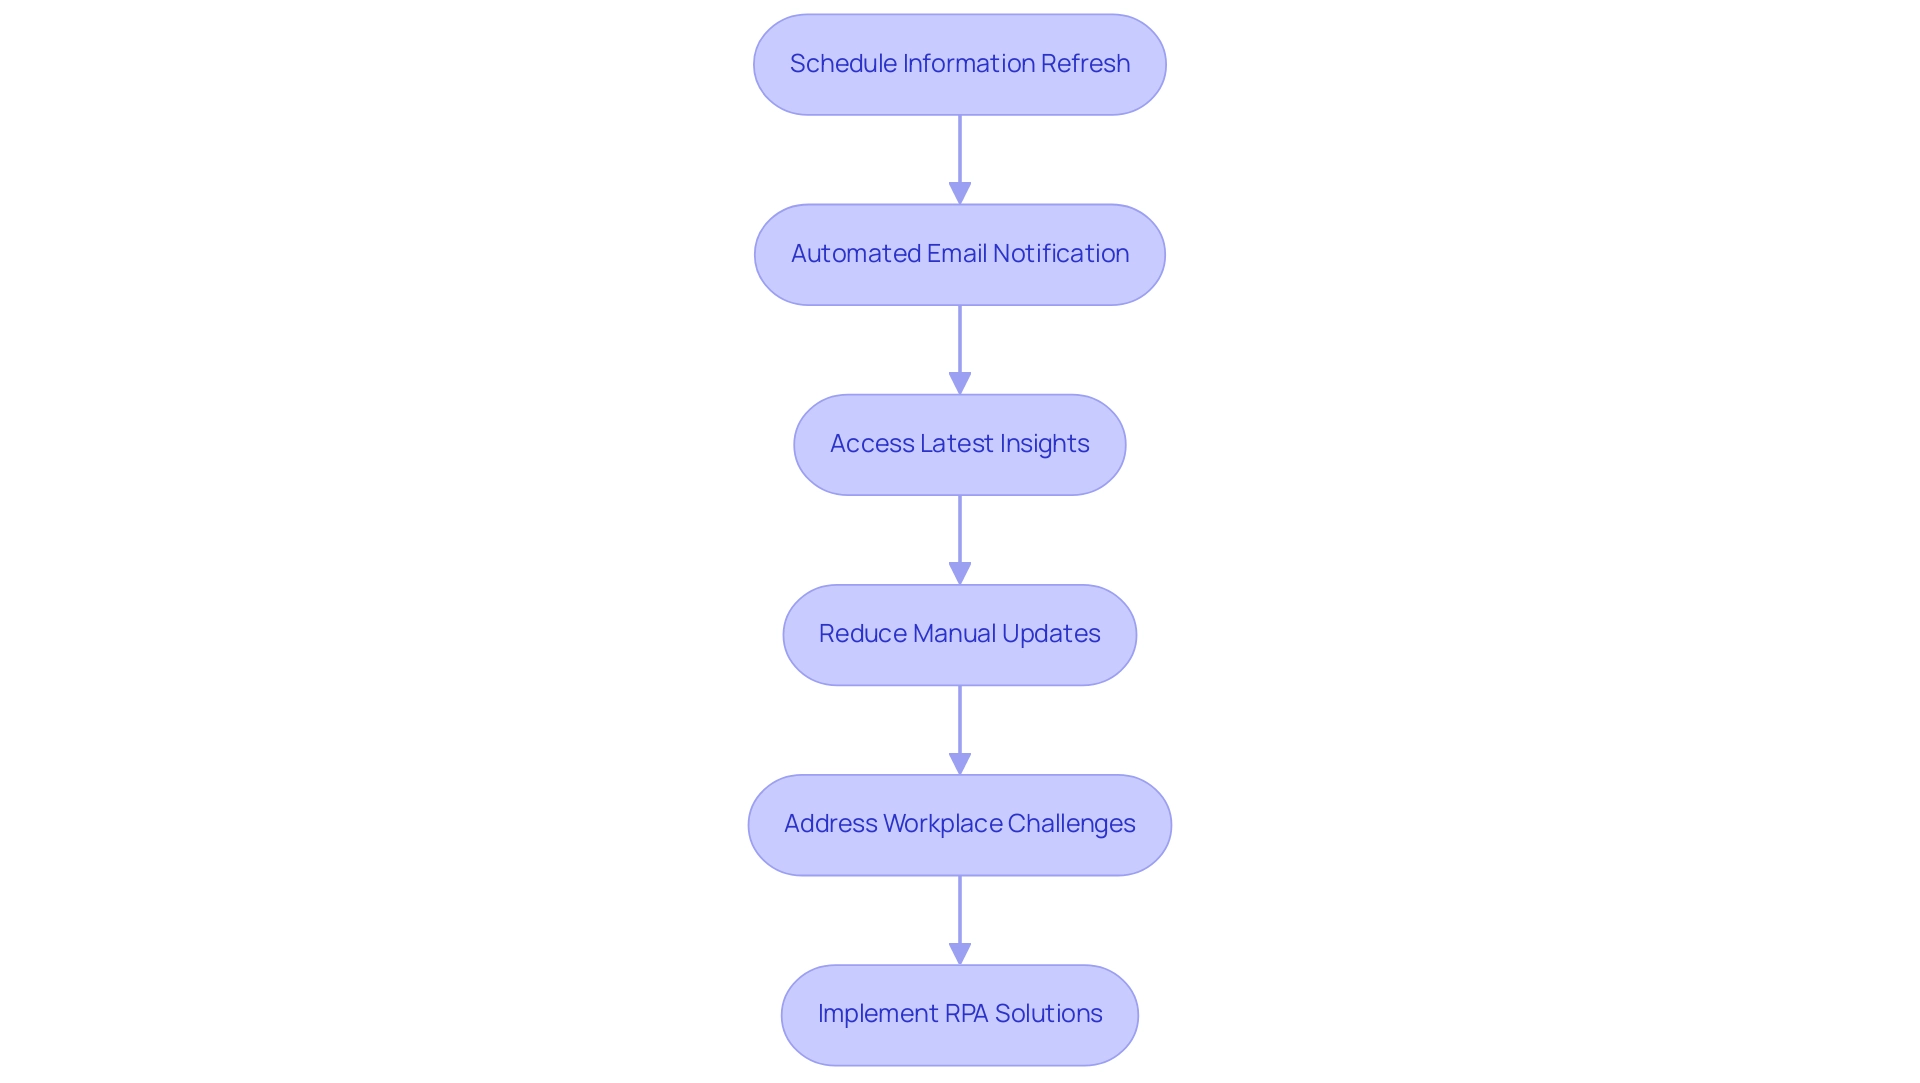
Automating reports in BI is a game changer for enhancing operational efficiency, significantly reducing the time traditionally spent on manual report generation. By utilizing Automation tools, companies can effortlessly schedule information refreshes and alerts, streamlining the reporting process. For example, organizations can configure a flow that automatically refreshes a Power BI dataset daily at a specified time, coupled with an automated email notification sent to stakeholders once the refresh is complete.
This approach not only guarantees that all team members have immediate access to the latest insights but also eliminates the need for manual updates, combating the exhaustion caused by repetitive tasks. Consequently, teams can shift their attention towards analysis and informed decision-making, instead of being hindered by collection. Furthermore, addressing workplace challenges such as staffing shortages and outdated systems is crucial for maintaining morale and productivity.
Contemporary RPA solutions can effectively address these challenges; for example, a mid-sized firm enhanced efficiency by automating entry processes and other repetitive tasks using GUI automation, leading to a 70% reduction in entry errors and an 80% improvement in workflow efficiency. It’s essential to remember that to ensure information is accurately represented in the Usage Metrics Report, users must access the content from within the workspace at least once; otherwise, the information will not be processed. The ‘total count’ in usage metrics represents unique reports viewed over 90 days, highlighting the effectiveness of automated reporting.
In this landscape of automated reporting, the emphasis on efficiency becomes paramount, paving the way for organizations to harness their data effectively. As Arish Siddiqui aptly states, ‘If you need any help, don’t hesitate to reach out to us,’ underscoring the support available for users navigating automated reporting and addressing the challenges of implementing RPA solutions.
Best Practices for Designing Effective Power Automate Dashboards
When creating effective Power Automate displays, it’s crucial to adhere to several best practices:
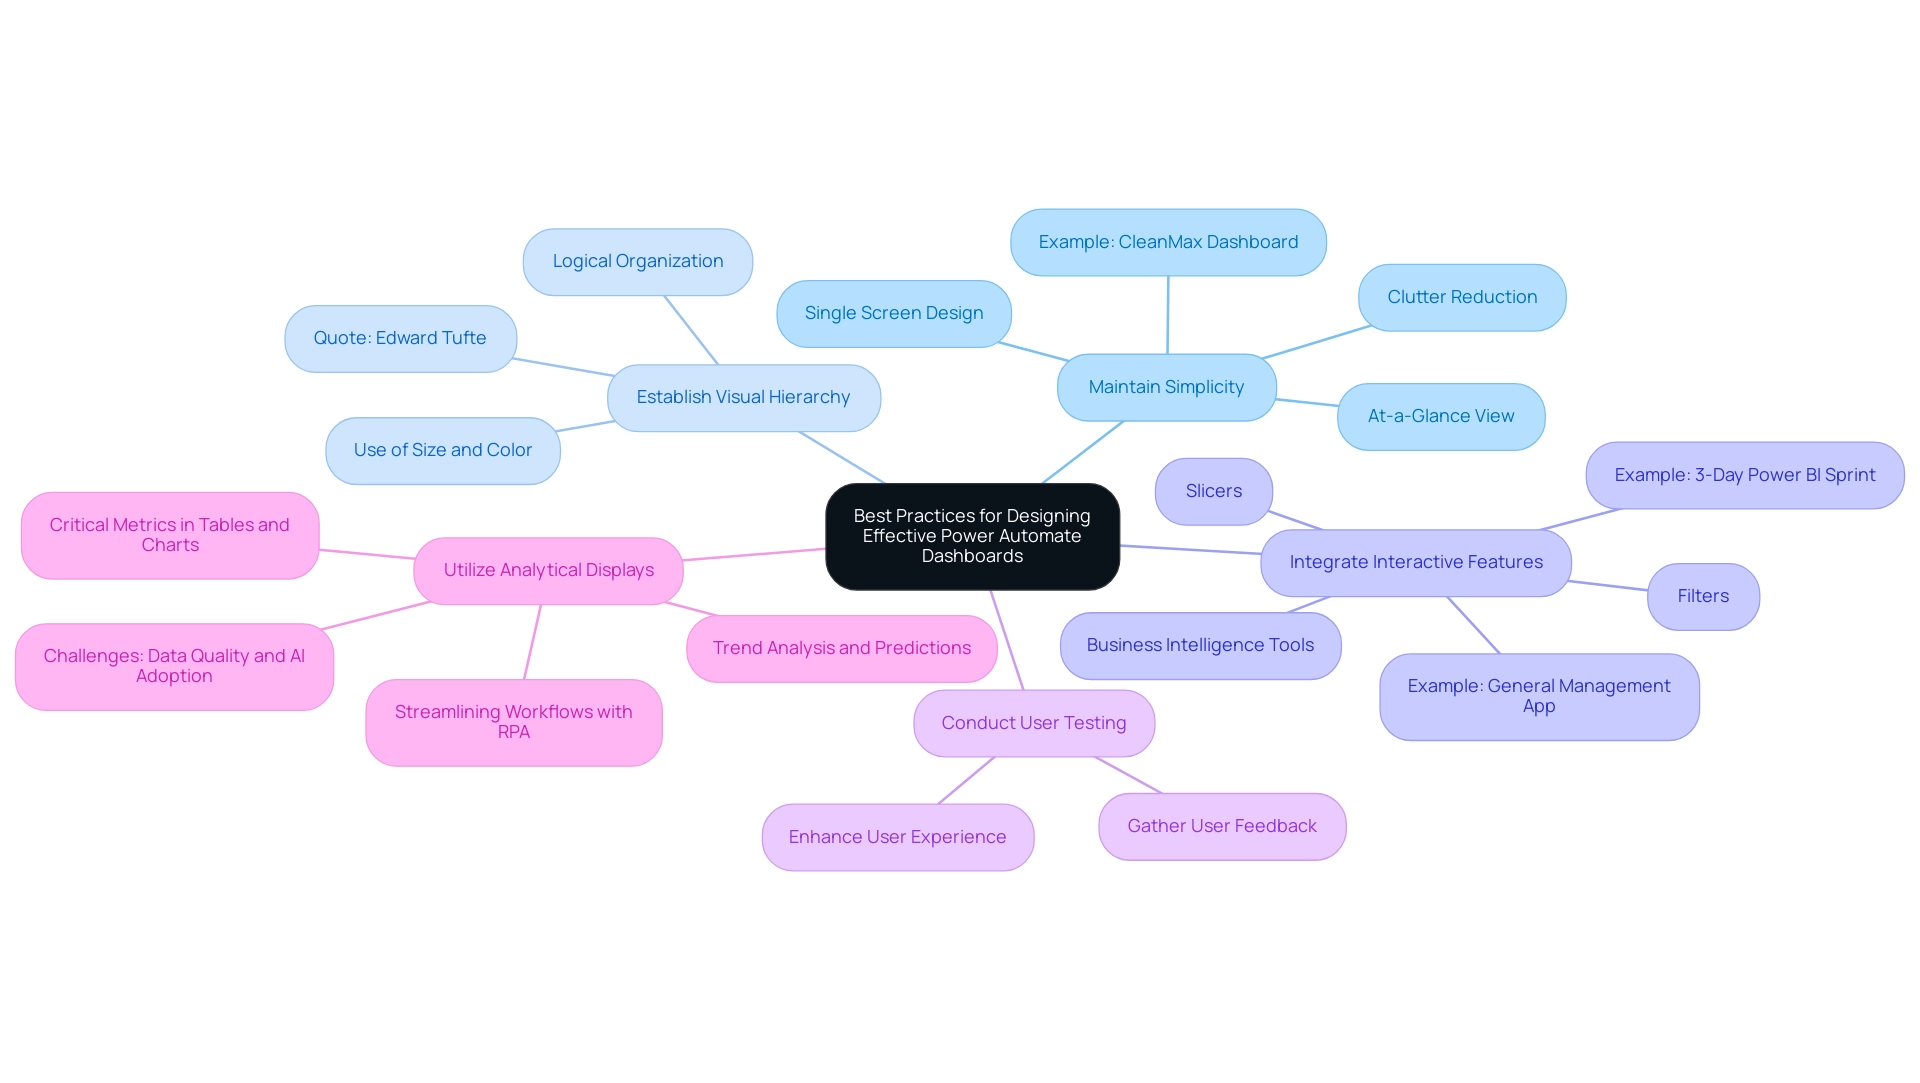
- Maintain Simplicity: Clutter can overwhelm users, so prioritize a clean design that showcases only the key metrics aligned with your operational objectives. Studies suggest that display panels should ideally present an at-a-glance view and fit within a single screen, facilitating quick comprehension. For instance, the CleanMax dashboard exemplifies how a simple design can help users easily manage memory and usage without feeling overwhelmed.
- Establish Visual Hierarchy: Organizing information logically is vital. Utilize size, color, and layout strategically to highlight the most critical information points, as Edward Tufte aptly noted,
[the visual representation of the information](https://rib-software.com/en/blogs/bi-dashboard-design-principles-best-practices) should be directly proportional to the numerical quantities represented. - Integrate Interactive Features: Incorporate slicers and filters to allow users to explore data dynamically. This interactivity not only enhances user engagement but also fosters deeper insight discovery, making the Power Automate dashboard a more effective tool. Utilizing Business Intelligence tools such as BI can further enhance this aspect by providing actionable insights through well-structured reporting. Notably, the ‘3-Day Power BI Sprint’ offers a rapid way to create professionally designed reports, while the ‘General Management App’ supports comprehensive management and smart reviews.
- Conduct User Testing: Engaging with actual users to gather feedback on usability and effectiveness is essential. Adjustments made based on user input can significantly enhance the overall user experience.
- Utilize Analytical Displays: Ensure that your displays showcase critical metrics in tables and charts for trend analysis and predictions. This approach offers users a thorough understanding of their information and supports informed decision-making. By incorporating insights from RPA, organizations can streamline manual workflows, thus significantly boosting operational efficiency. However, it is essential to address challenges such as poor master data quality and barriers to AI adoption, which can hinder the effective implementation of visual displays. By following these best practices, you can create visual displays that effectively meet operational needs while ensuring a positive experience for users.
Overcoming Challenges in Implementing Power Automate Dashboards
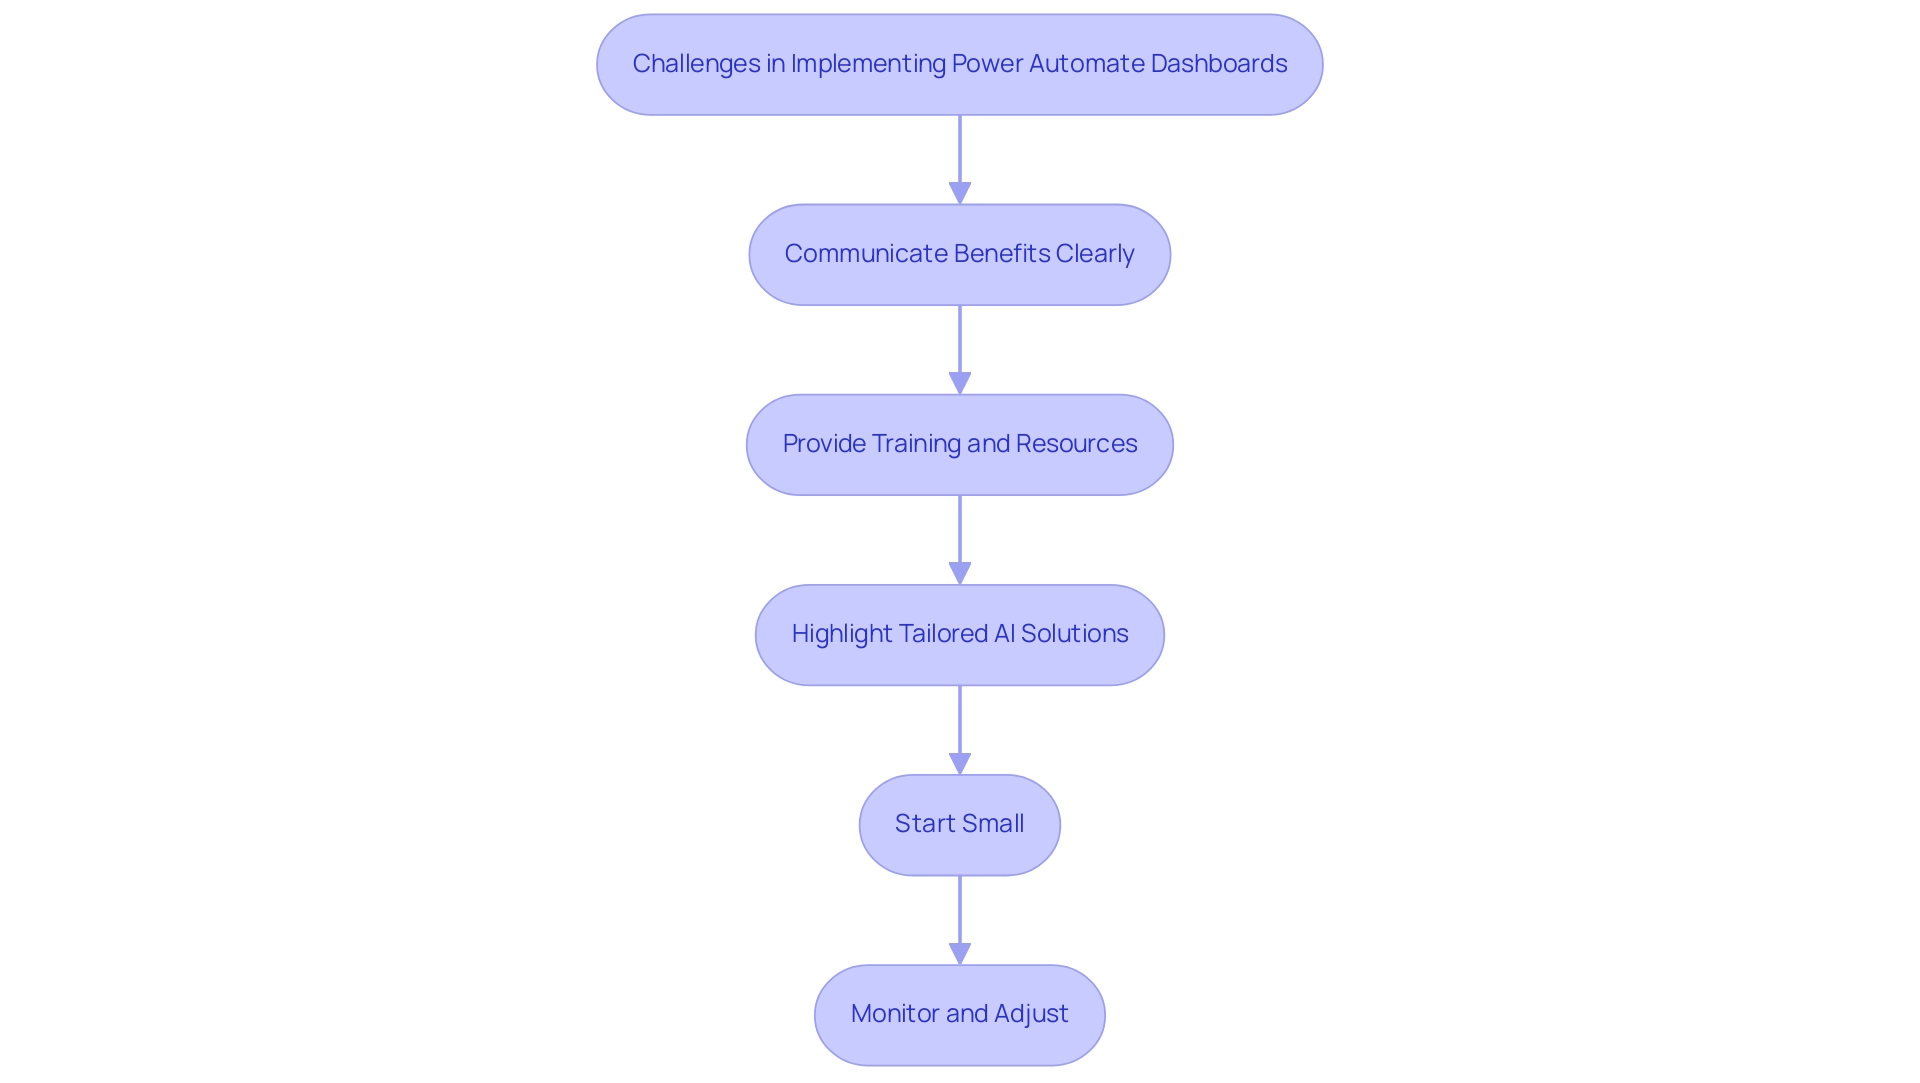
The execution of automation displays is frequently faced with several difficulties, particularly staff opposition to change and technical barriers. Addressing these issues effectively is crucial for fostering a smooth transition, especially in the context of leveraging Robotic Process Automation (RPA) to automate manual workflows and enhance operational efficiency. According to the case study titled ‘Challenges in Business Process Automation,’ decision-makers frequently cite time constraints and budget limitations as significant barriers to successful implementation.
Here are some strategies to consider:
- Communicate Benefits Clearly: Articulating the advantages of RPA and visual displays is vital. Clearly explain how these tools can alleviate workloads, reduce errors, and enhance efficiency, significantly fostering buy-in from team members.
- Provide Training and Resources: Comprehensive training sessions are essential. Ensuring that all users are well-acquainted with the new tools and processes will help build confidence and reduce anxiety associated with technological changes. Our 3-Day BI Sprint can be an excellent starting point, enabling teams to create fully functional, professionally designed reports that facilitate informed decision-making.
- Highlight Tailored AI Solutions: Consider integrating tailored AI solutions that can help your organization identify the right technologies to streamline processes and enhance productivity. These solutions can cut through the noise of the rapidly evolving AI landscape, aligning with your specific business goals.
- Start Small: Initiating a pilot program with a small team allows organizations to gather valuable feedback and make necessary adjustments before a full-scale rollout. This approach minimizes disruption and builds a foundation for broader adoption.
- Monitor and Adjust: Post-implementation, it is important to regularly check in with users to identify any issues and adapt processes as needed. By keeping open channels of communication, organizations can quickly tackle issues and improve user experience.
These proactive strategies not only reduce opposition but also establish a foundation for successful implementation of automated visual displays. Given that 51% of companies are currently utilizing marketing automation, embracing these strategies can lead to significant operational efficiency gains. Moreover, insights from the G2 Buyer Behavior Report indicate that 78% of respondents across various regions expect to see a return on investment within six months of software implementation, further emphasizing the potential benefits of overcoming initial implementation challenges.
As advancements in AI, machine learning, robotics, and the Internet of Things (IoT) continue to evolve, organizations that effectively implement power automate dashboards will be better positioned to leverage these technologies for improved business processes.
Conclusion
The integration of Power Automate into organizational workflows marks a significant shift towards greater operational efficiency and productivity. By automating repetitive tasks and streamlining processes, this tool addresses crucial challenges such as staffing shortages and data entry errors, enabling employees to focus on more strategic initiatives. The evidence speaks volumes, with statistics indicating that employees can save approximately 240 hours annually through automation, thereby allowing organizations to reap substantial benefits.
Moreover, the synergy between Power Automate and Power BI fosters a data-driven environment that enhances decision-making capabilities. By automating data refreshes and report generation, businesses can ensure that they are always working with the most up-to-date information, which is essential for agile responses in today’s fast-paced market. The case studies presented highlight the tangible success stories of organizations that have embraced these automation strategies, showcasing significant reductions in reporting times and improvements in data accuracy.
As organizations navigate the complexities of implementing Power Automate dashboards, adherence to best practices and proactive strategies can mitigate challenges and foster user acceptance. By clearly communicating the benefits, providing comprehensive training, and starting with pilot programs, businesses can effectively overcome resistance to change. The future of operational efficiency lies in the ability to leverage automation tools like Power Automate, which not only enhance productivity but also contribute to a positive workplace culture.
In summary, embracing automation through Power Automate is not merely a trend but a necessity for organizations aiming to thrive in a competitive landscape. By integrating these technologies and fostering a culture of innovation, organizations can unlock new levels of efficiency and drive sustainable growth.

