Overview
Power BI allows users to effectively compare dates through various techniques, including the use of built-in and custom calendar tables, DAX functions, and visualizations, which enhance data analysis and reporting efficiency. The article emphasizes that mastering these methods is crucial for addressing common challenges such as data inconsistencies and time-consuming report creation, ultimately enabling organizations to derive actionable insights for informed decision-making.
Introduction
In the world of data analysis, the ability to compare dates effectively in Power BI is not just a technical skill; it is a vital component that can transform raw data into strategic insights. As organizations strive to harness the power of their data, understanding the nuances of date comparison becomes essential for identifying trends, forecasting outcomes, and making informed decisions.
With challenges such as time-consuming report generation and data inconsistencies, mastering date functions can empower users to navigate these complexities. This article delves into the critical aspects of date comparison in Power BI, exploring practical techniques, best practices, and the role of DAX functions in enhancing data analysis capabilities.
By unlocking these tools, decision-makers can drive operational efficiency and derive actionable insights that propel their organizations forward.
Understanding Date Comparison in Power BI
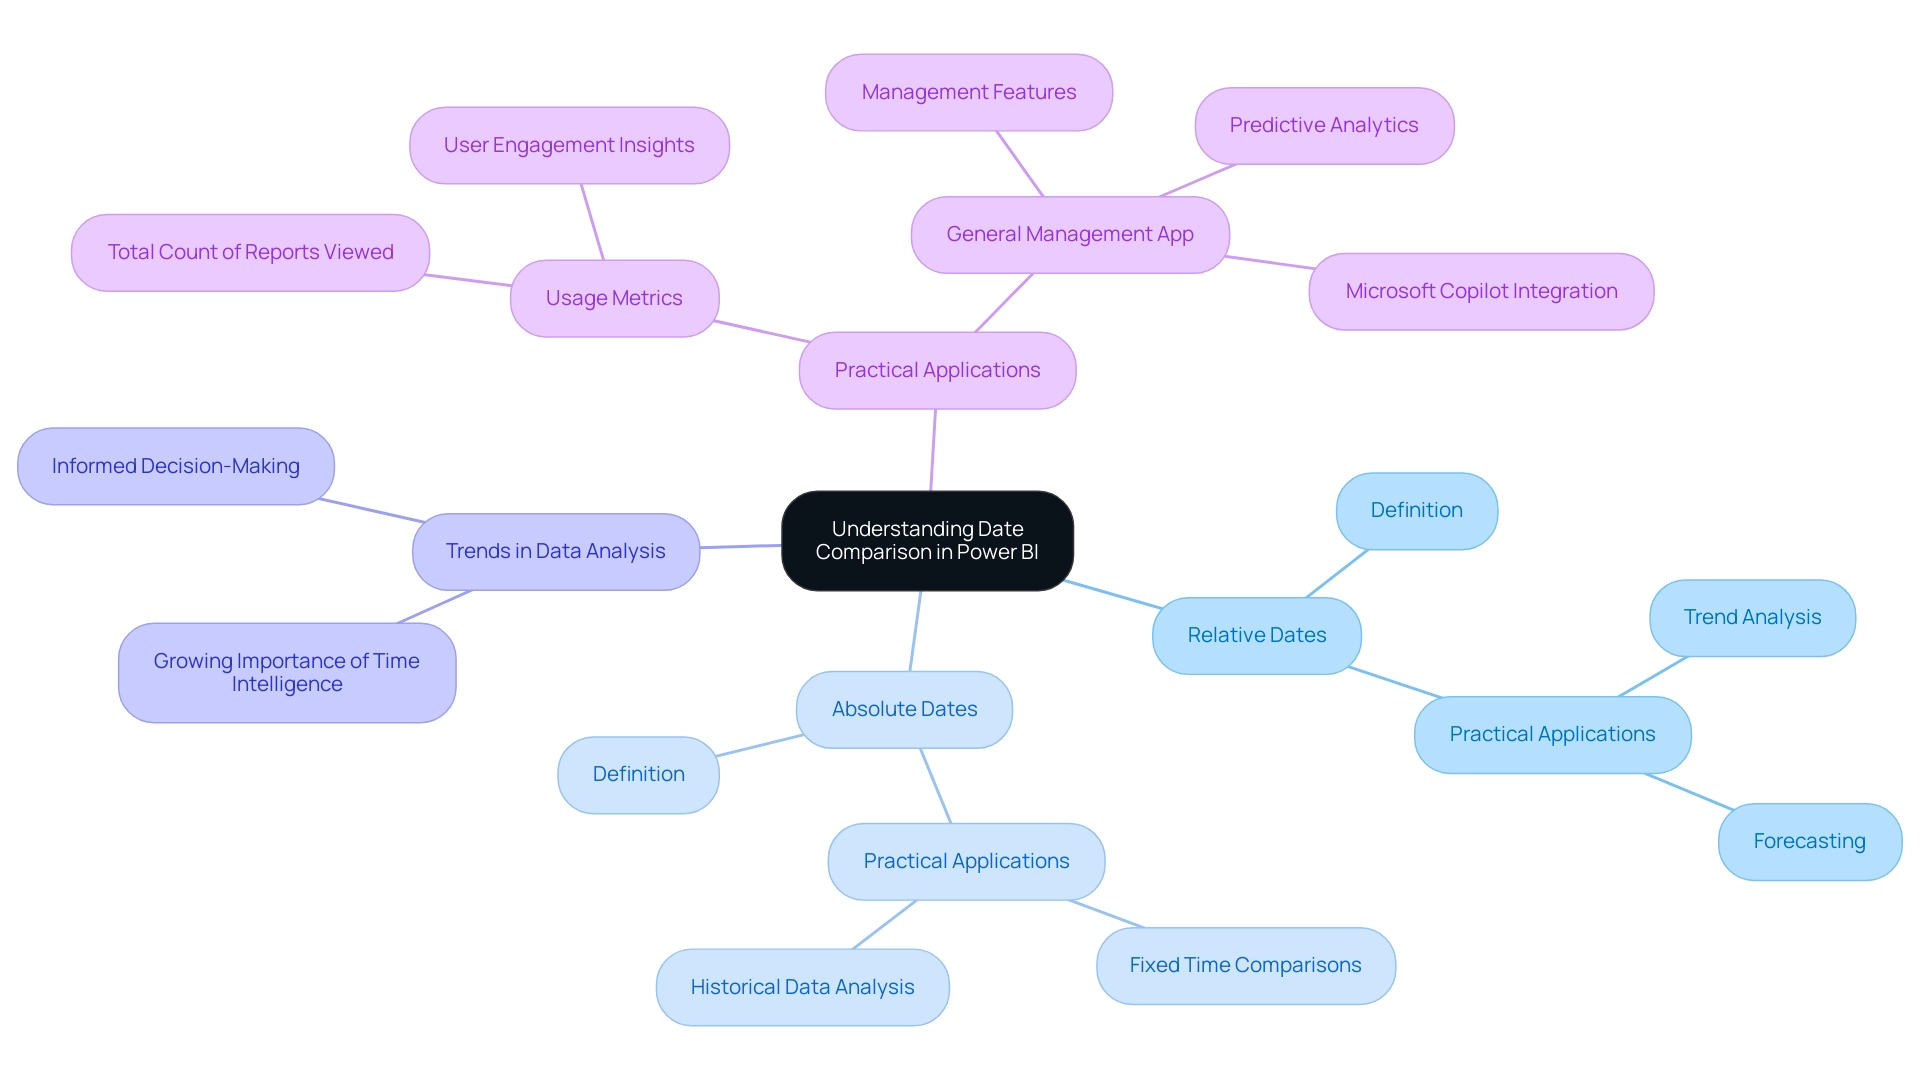
In Power BI, the feature to compare dates is a fundamental capability that empowers users to analyze and contrast information across various time periods. Mastery of time functions is essential, as it facilitates the identification of trends, enables accurate forecasting, and provides critical insights into performance over time. This is especially crucial considering the typical obstacles encountered by organizations, such as the time-intensive process of creating documents, inconsistencies in information that can result in mistrust, and the absence of practical advice in findings.
Key concepts in Power BI compare dates include:
- Relative dates: which enable comparisons based on current time frames.
- Absolute dates: which indicate fixed points in time.
Grasping these differences is essential for analyzing time-related information efficiently and tackling the absence of practical advice frequently seen in documents. Recent trends underscore the growing importance of time intelligence in data analysis, with organizations increasingly recognizing its value for informed decision-making.
For instance, the ‘total count’ in usage metrics represents unique entries viewed over a span of 90 days, illustrating user engagement. As emphasized in a case study named ‘Worked Example of View and Viewer Metrics,’ various users engage with numerous reports, illustrating how usage metrics are determined and the knowledge they offer regarding user behavior. Furthermore, the platform tracks the technology used by viewers to access reports—whether via PowerBI.com, mobile, or embedded solutions—further illuminating user engagement patterns over time.
By utilizing Power BI to compare dates, decision-makers can obtain practical knowledge that enhances operational efficiency. The General Management App specifically tackles these challenges by providing comprehensive management features, enhanced by Microsoft Copilot integration and predictive analytics, ensuring users can navigate and utilize information effectively for better outcomes.
Creating Effective Date Tables for Comparison
Creating an effective time table in Power BI is essential for accurately comparing dates in data analysis and reporting, especially when categorizing report data by business impact using sensitivity labels for data security. In today’s data-rich environment, the ability to extract meaningful insights from Power BI dashboards can significantly drive business growth and operational efficiency. There are two primary methods to achieve this: utilizing the built-in calendar function or constructing a custom time table.
Here’s a detailed guide to both approaches:
-
Using the Built-in Calendar Function:
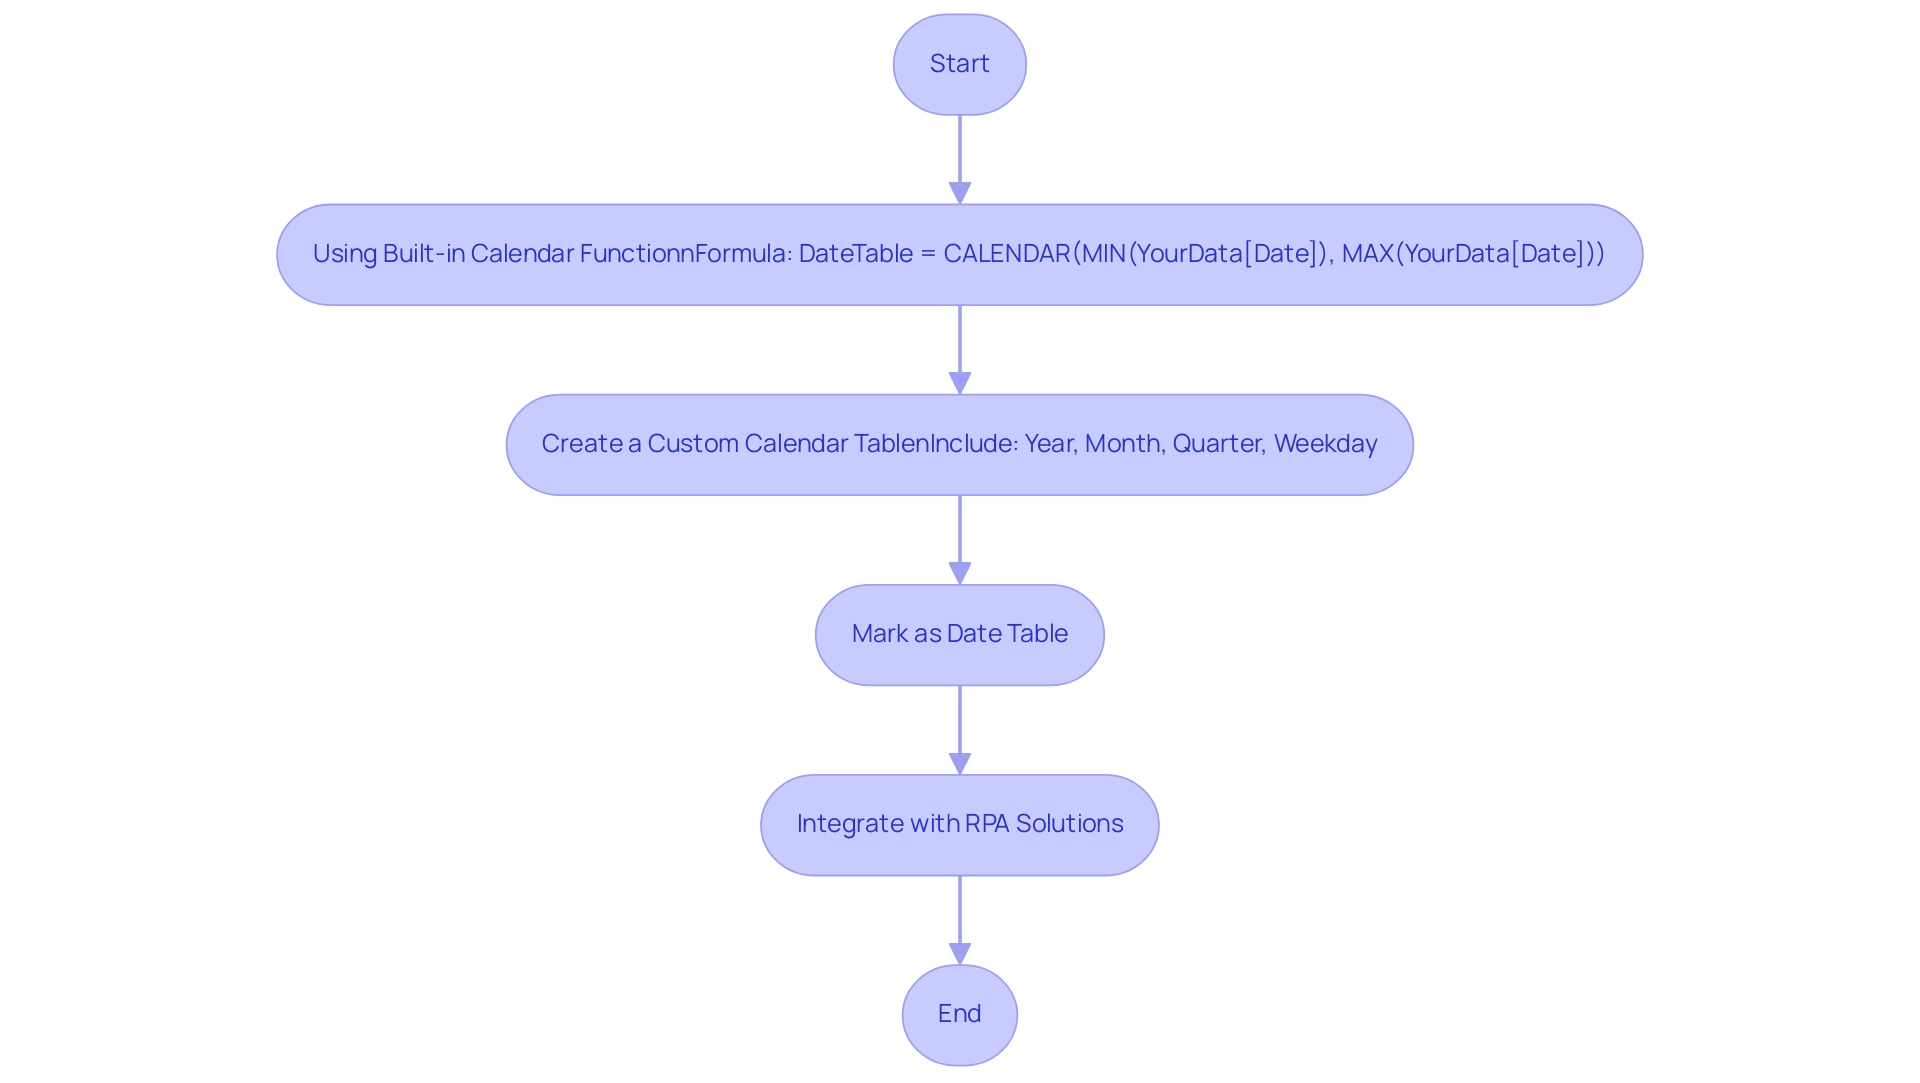
Navigate to the ‘Modeling’ tab and select ‘New Table’. Enter the following formula:
DateTable = CALENDAR(MIN(YourData[Date]), MAX(YourData[Date])).This command generates a thorough time range that corresponds to the information present in your dataset, which is essential when you want to power bi compare dates, helping mitigate challenges like data inconsistencies and time-consuming report creation.
-
Creating a Custom Calendar Table:
Alternatively, you can create a calendar table manually in Excel, which allows for greater customization. When designing your table, ensure it includes critical columns such as Year, Month, Quarter, and Weekday.This approach facilitates more granular analysis tailored to specific reporting needs, ultimately enhancing operational efficiency through better data-driven insights.
-
Marking as a Time Table:
Once your time table is prepared, it is crucial to mark it as a time table in Power BI. Do this by selecting ‘Mark as Date Table’ and choosing the suitable column for dates.This step is crucial, as it enables Power BI to efficiently employ time intelligence functions, which enhances its ability to compare dates and improve overall data analysis capabilities.
Integrating effective temporal tables can greatly enhance interactivity and user experience in documents, as Power BI can compare dates to tackle the challenges faced by many organizations in utilizing insights. Additionally, integrating Robotic Process Automation (RPA) solutions can streamline the generation process, reducing the burden of staffing shortages and outdated systems. As evidenced by case studies demonstrating the optimization of visual interactions, effective schedules enhance report relevance to the audience.
A Principal Consultant for 3Cloud Solutions, who focuses on Business Intelligence and Power BI, emphasizes that ‘the proper arrangement of time tables is foundational to unlocking the full potential of your insights.’ This content has resonated with many, receiving 2,394 views, underscoring the importance of mastering temporal tables in Power BI.
Leveraging DAX Functions for Date Comparison
DAX (Data Analysis Expressions) serves as a powerful formula language in Power BI, enabling users to perform advanced calculations, particularly when they need to power bi compare dates. However, it is important to note that not all DAX functions are supported or included in earlier versions of Power BI Desktop, Analysis Services, and Power Pivot in Excel, which can affect their usability in various scenarios. These limitations can exacerbate common challenges such as time-consuming report creation and data inconsistencies, ultimately hindering the generation of actionable insights.
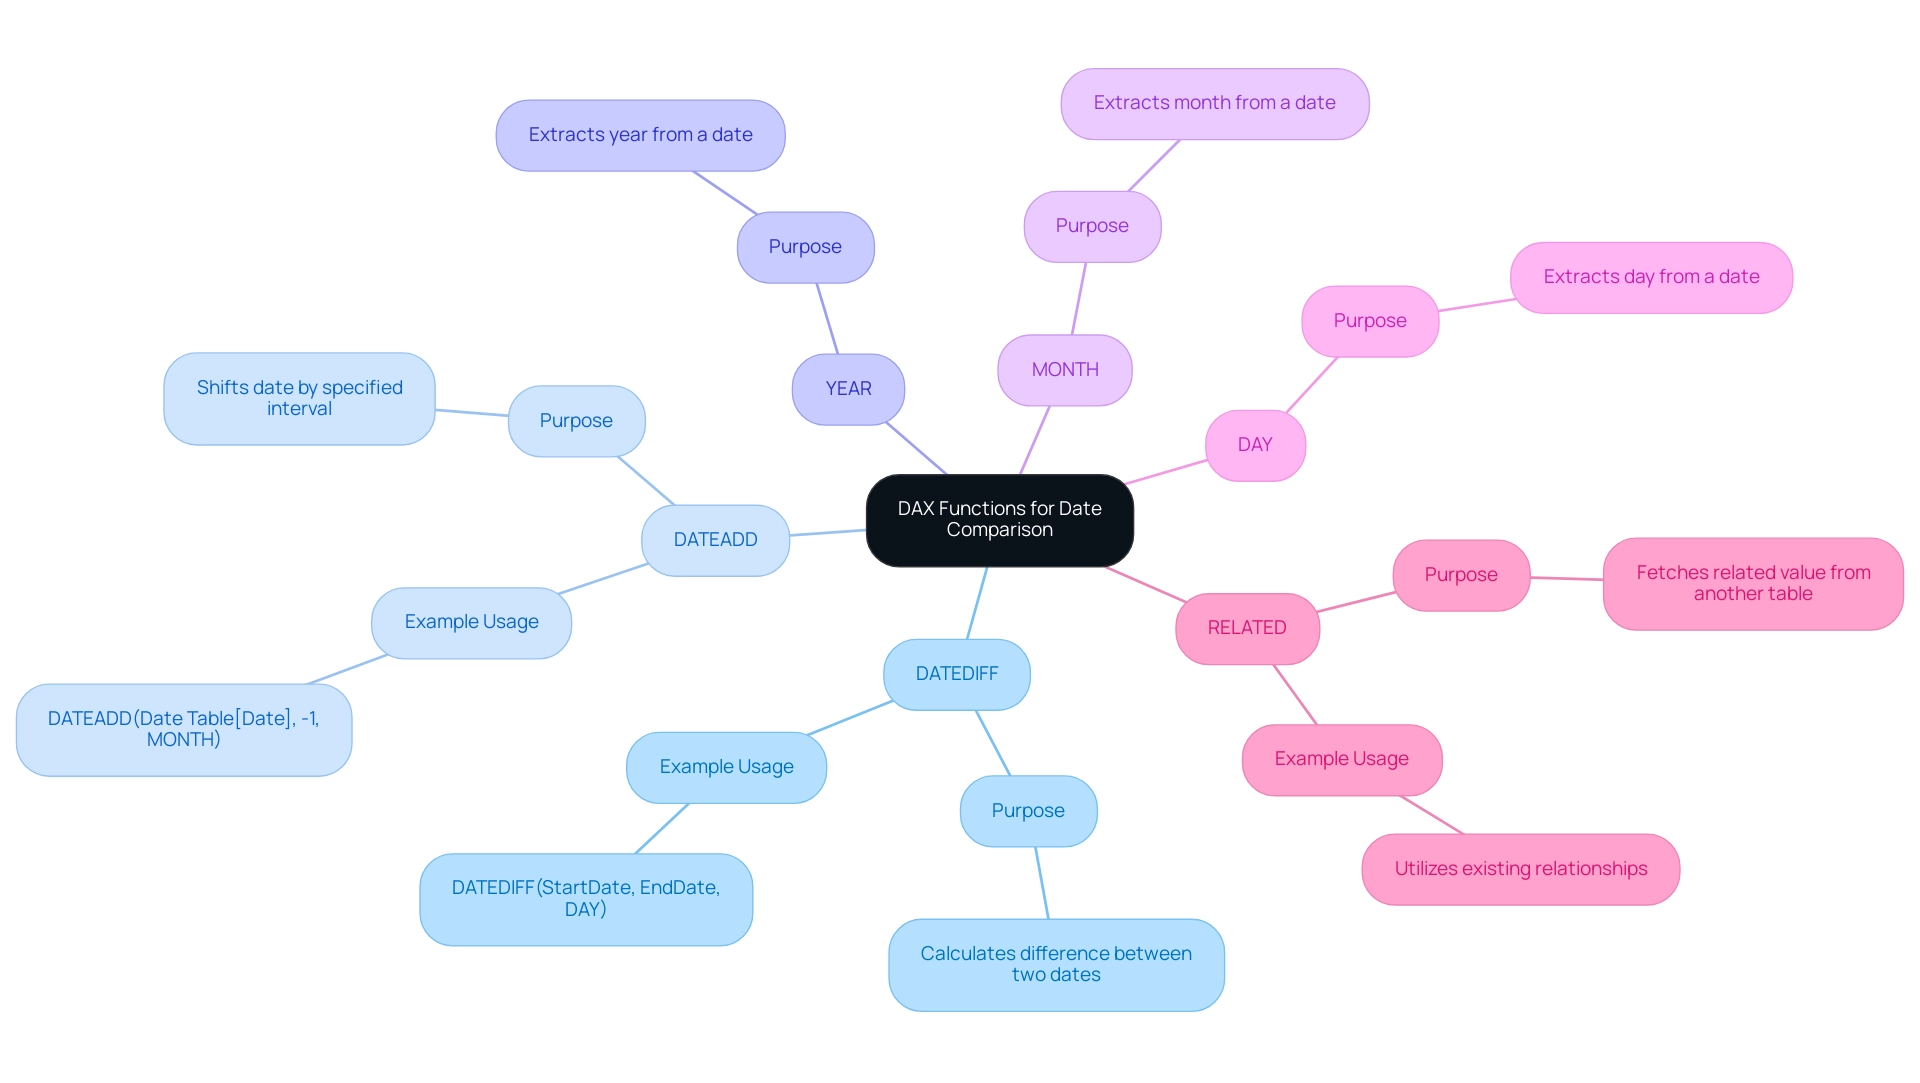
Several DAX functions are essential for power bi compare dates.
-
DATEDIFF: This function calculates the difference between two points in time. For instance,
DATEDIFF(StartDate, EndDate, DAY)will return the total number of days separating the two specified points in time, allowing analysts to assess time intervals effectively.This can provide actionable insights by utilizing Power BI to compare dates and highlight trends over specific periods.
-
DATEADD: This function allows users to modify timestamps by a specified interval. A case in point would be
DATEADD(Date Table[Date], -1, MONTH), which shifts the entries back by one month, facilitating the ability to power bi compare dates across different time periods and aiding in providing clearer guidance on performance changes. -
YEAR, MONTH, DAY: These functions extract specific elements from a timestamp, serving as critical components for creating calculated columns that enable more nuanced comparisons.
Mastery of these functions not only enhances analytical capabilities but also addresses the challenges of report creation and clarity, particularly when using Power BI to compare dates, fostering the development of dynamic reports that reflect evolving trends. As Joleen Bothma notes, ‘Learn what DAX is and discover the fundamental DAX syntax and functions you’ll need to take your Power BI skills to the next level,’ emphasizing the importance of understanding these tools.
Furthermore, recent case studies demonstrate that the RELATED function in DAX effectively retrieves associated values from other tables, which can be invaluable when making comparisons across different datasets.
By utilizing the RELATED function, analysts can improve their capacity to extract understandings from interconnected information, directly tackling problems of inconsistencies and delivering actionable findings that enhance analysis, drive operational efficiency, and provide clearer guidance for stakeholders.
Practical Techniques for Comparing Dates in Power BI
To effectively compare dates in Power BI and enhance operational efficiency through actionable insights, several techniques stand out for improving user engagement and data analysis:
-
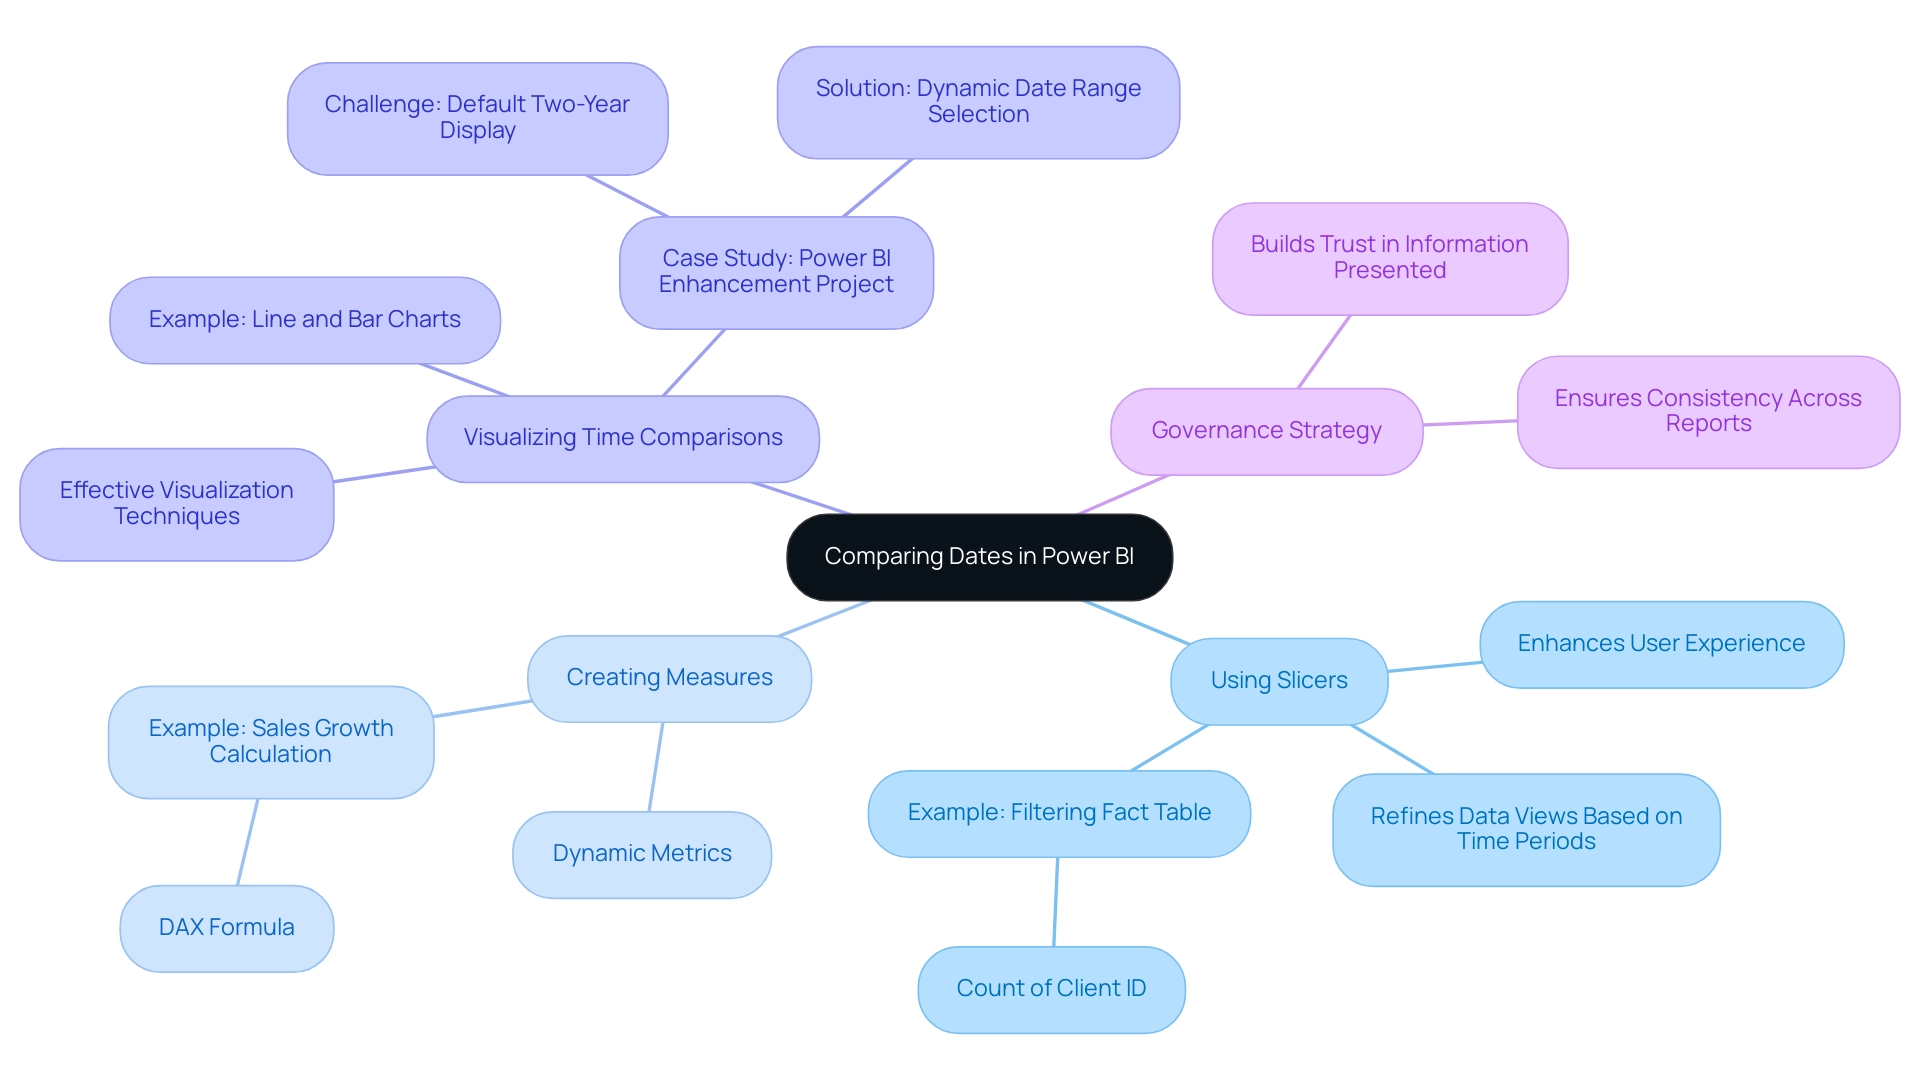
Using Slicers: Implementing time slicers allows users to filter data by specific time ranges seamlessly. This interactivity not only enhances user experience but also significantly boosts report engagement. As mentioned by a Data Insights Super User,
The concept is to filter Fact Table for the rows that correspond to the time slicer and then calculate the count of Client ID in the context of the filtered Fact Table.
This emphasizes the usefulness of slicers in refining data views based on user-chosen time periods. Importantly, the overall tally in usage metrics signifies distinct documents viewed over the past 90 days, highlighting the significance of efficient time filtering. -
Creating Measures: Develop measures using Data Analysis Expressions (DAX) to calculate performance metrics across different time periods. For example, calculating sales growth over the previous year can be achieved with the following DAX measure:
sales growth = (SUM(Sales[Current Year]) - SUM(Sales[Previous Year])) / SUM(Sales[Previous Year]).
This approach enables dynamic metrics that adjust to the chosen time periods, allowing for the use of Power BI to compare dates, which offers valuable insights into performance trends and tackles the challenge of time-consuming report creation. -
Visualizing Time Comparisons: Utilize line charts or bar charts for effective visualization of time comparisons. By configuring the x-axis to the time field, trends over time can be clearly illustrated. This visual depiction not only assists in the rapid understanding of information patterns but also improves the overall efficiency of comparisons in reports, particularly when using Power BI to compare dates. A pertinent case study, the ‘Power BI Enhancement Project,’ demonstrates how the Apps team encountered challenges in providing a default display of the last two years’ information while allowing users to select alternative time ranges. The solution required utilizing DAX and a calculated column to allow dynamic range selection while preserving the default view. Additionally, the recent integration of two Power BI slicers allows users to switch between default and custom date ranges seamlessly.
Furthermore, it is crucial to tackle the issue of dedicating additional time to creating documents instead of utilizing information from Power BI dashboards. This shift can lead to inefficiencies and hinder decision-making. Implementing a governance strategy is crucial to ensure consistency across reports, thereby building trust in the information presented.
The combination of these techniques not only simplifies data analysis but also corresponds with recent advancements in Power BI visualization methods, ensuring that users can extract valuable information effectively and tackle the prevalent problems of data inconsistencies and absence of actionable guidance.
Best Practices and Common Pitfalls in Date Comparison
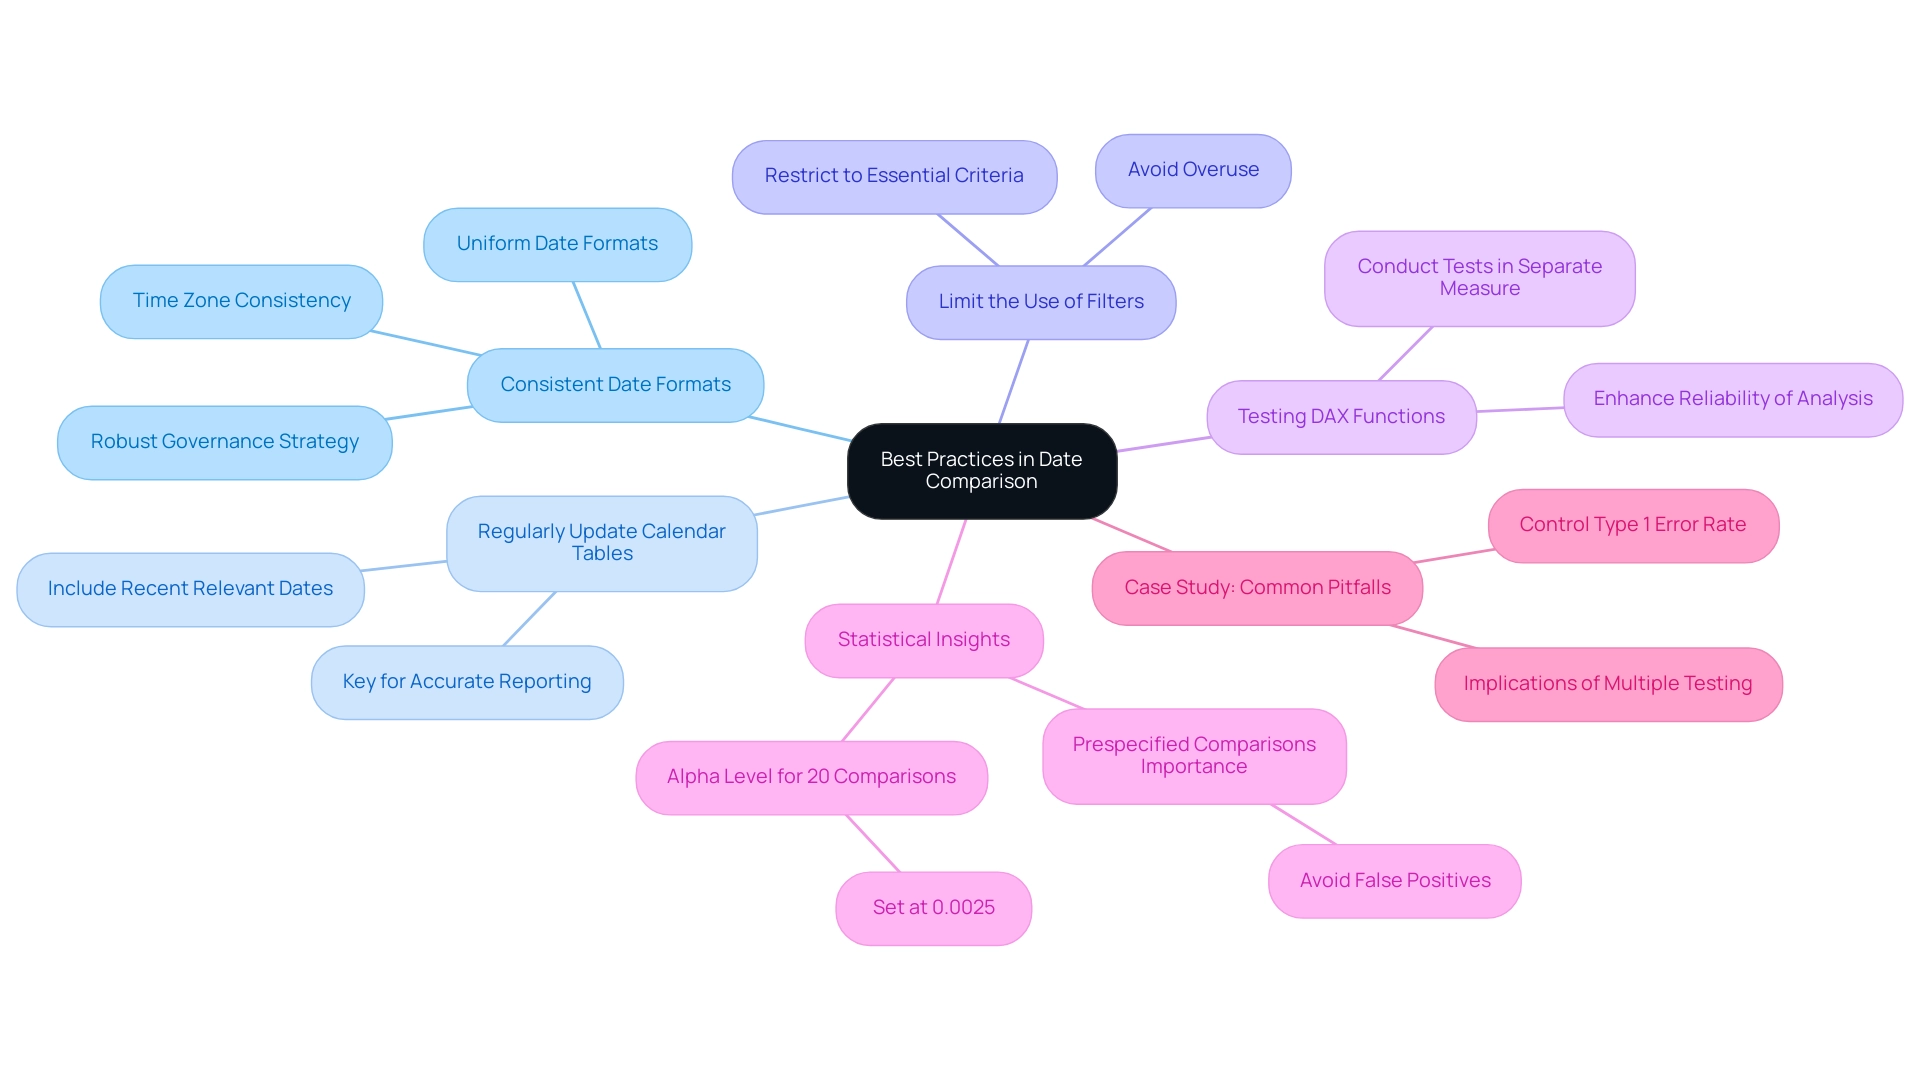
To optimize date comparisons in Power BI and effectively leverage insights from your dashboards, it is essential to follow these best practices:
-
Consistent Date Formats: Maintaining uniform date formats across all fields is critical to prevent errors during comparisons. Equally important is using the same time zone to ensure accuracy in your data analysis, addressing common inconsistencies that can lead to confusion. Implementing a robust governance strategy can help maintain these standards across reports.
-
Regularly Update Calendar Tables: For those utilizing custom calendar tables, it is vital to update these tables consistently. This ensures that your analyses include the most recent relevant dates, which is key for accurate reporting and decision-making.
-
Limit the Use of Filters: While filters are useful for refining datasets, overusing them can lead to confusion and misinterpretation of results. It is advisable to restrict filters to essential criteria to maintain clarity, thus providing actionable guidance for stakeholders.
-
Testing DAX Functions: Before applying any DAX functions in your documents, conduct tests in a separate measure. This practice ensures that the functions yield the expected results, enhancing the reliability of your analysis and reducing the time spent on report creation.
In the context of statistical analysis, Ranganathan P. emphasizes the importance of prespecifying comparisons to avoid serious problems—”It is to avoid these serious problems that all intended comparisons should be fully prespecified in the research protocol, with appropriate adjustments for multiple testing.” This principle is particularly relevant as, with 20 comparisons, the alpha level for significance should be set at 0.0025 to control for false positives effectively.
The case study titled “Common pitfalls in statistical analysis: The perils of multiple testing” highlights the implications of multiple testing in data analysis. It underscores the necessity of prespecified comparisons to mitigate the risk of false-positive findings, reinforcing the importance of these best practices.
By unlocking the power of Business Intelligence, you can transform raw data into practical knowledge, enabling informed decision-making that drives growth and innovation. Furthermore, integrating RPA solutions can improve operational efficiency by automating repetitive tasks, enabling your team to concentrate on utilizing information instead of report generation. By adhering to these guidelines, you can significantly improve the reliability and effectiveness of how you Power BI compare dates, while also addressing the common challenges faced in leveraging insights effectively.
Conclusion
Mastering date comparison in Power BI is an indispensable skill that can significantly enhance data analysis and decision-making capabilities. By understanding the fundamental concepts of date comparison, such as relative and absolute dates, users can identify trends and generate insights that drive operational efficiency. The article highlighted practical techniques, including:
- The creation of effective date tables
- The utilization of DAX functions
These techniques empower users to perform advanced calculations and comparisons seamlessly.
Incorporating best practices, such as:
- Maintaining consistent date formats
- Regularly updating date tables
ensures that analyses remain accurate and relevant. It is crucial to limit the use of filters to avoid confusion and to rigorously test DAX functions to enhance the reliability of the insights derived. By addressing common pitfalls and following these guidelines, organizations can transform raw data into strategic insights that facilitate informed decision-making.
Ultimately, leveraging the full potential of date comparison in Power BI not only helps in overcoming challenges like data inconsistencies and time-consuming report generation but also paves the way for actionable insights that propel organizations forward. Embracing these techniques and best practices will lead to improved data analysis, fostering a culture of data-driven decision-making that is essential in today’s fast-paced business environment.

