Overview
Mastering DAX SUM with filters is crucial for professionals seeking to elevate their data analysis skills. This capability enables precise calculations tailored to specific criteria through the CALCULATE function. Various practical applications of DAX SUM with filters, such as:
- Sales performance analysis
- Year-over-year comparisons
illustrate its significance. These techniques not only drive informed decision-making but also enhance operational efficiency, underscoring their value in a competitive landscape.
Introduction
In the realm of data analysis, the DAX SUM function stands as a cornerstone for professionals seeking to derive meaningful insights from their datasets. As organizations increasingly rely on data-driven decision-making, understanding how to effectively utilize this powerful aggregation tool becomes paramount. With its straightforward syntax and crucial role in platforms like Power BI, mastering the DAX SUM function not only streamlines report creation but also enhances the accuracy of business intelligence efforts.
This article delves into the intricacies of DAX SUM, exploring its applications, the importance of filters, and practical strategies for overcoming common challenges. Ultimately, it equips data analysts with the knowledge to transform raw data into actionable insights.
Understanding DAX SUM: The Foundation of Data Analysis
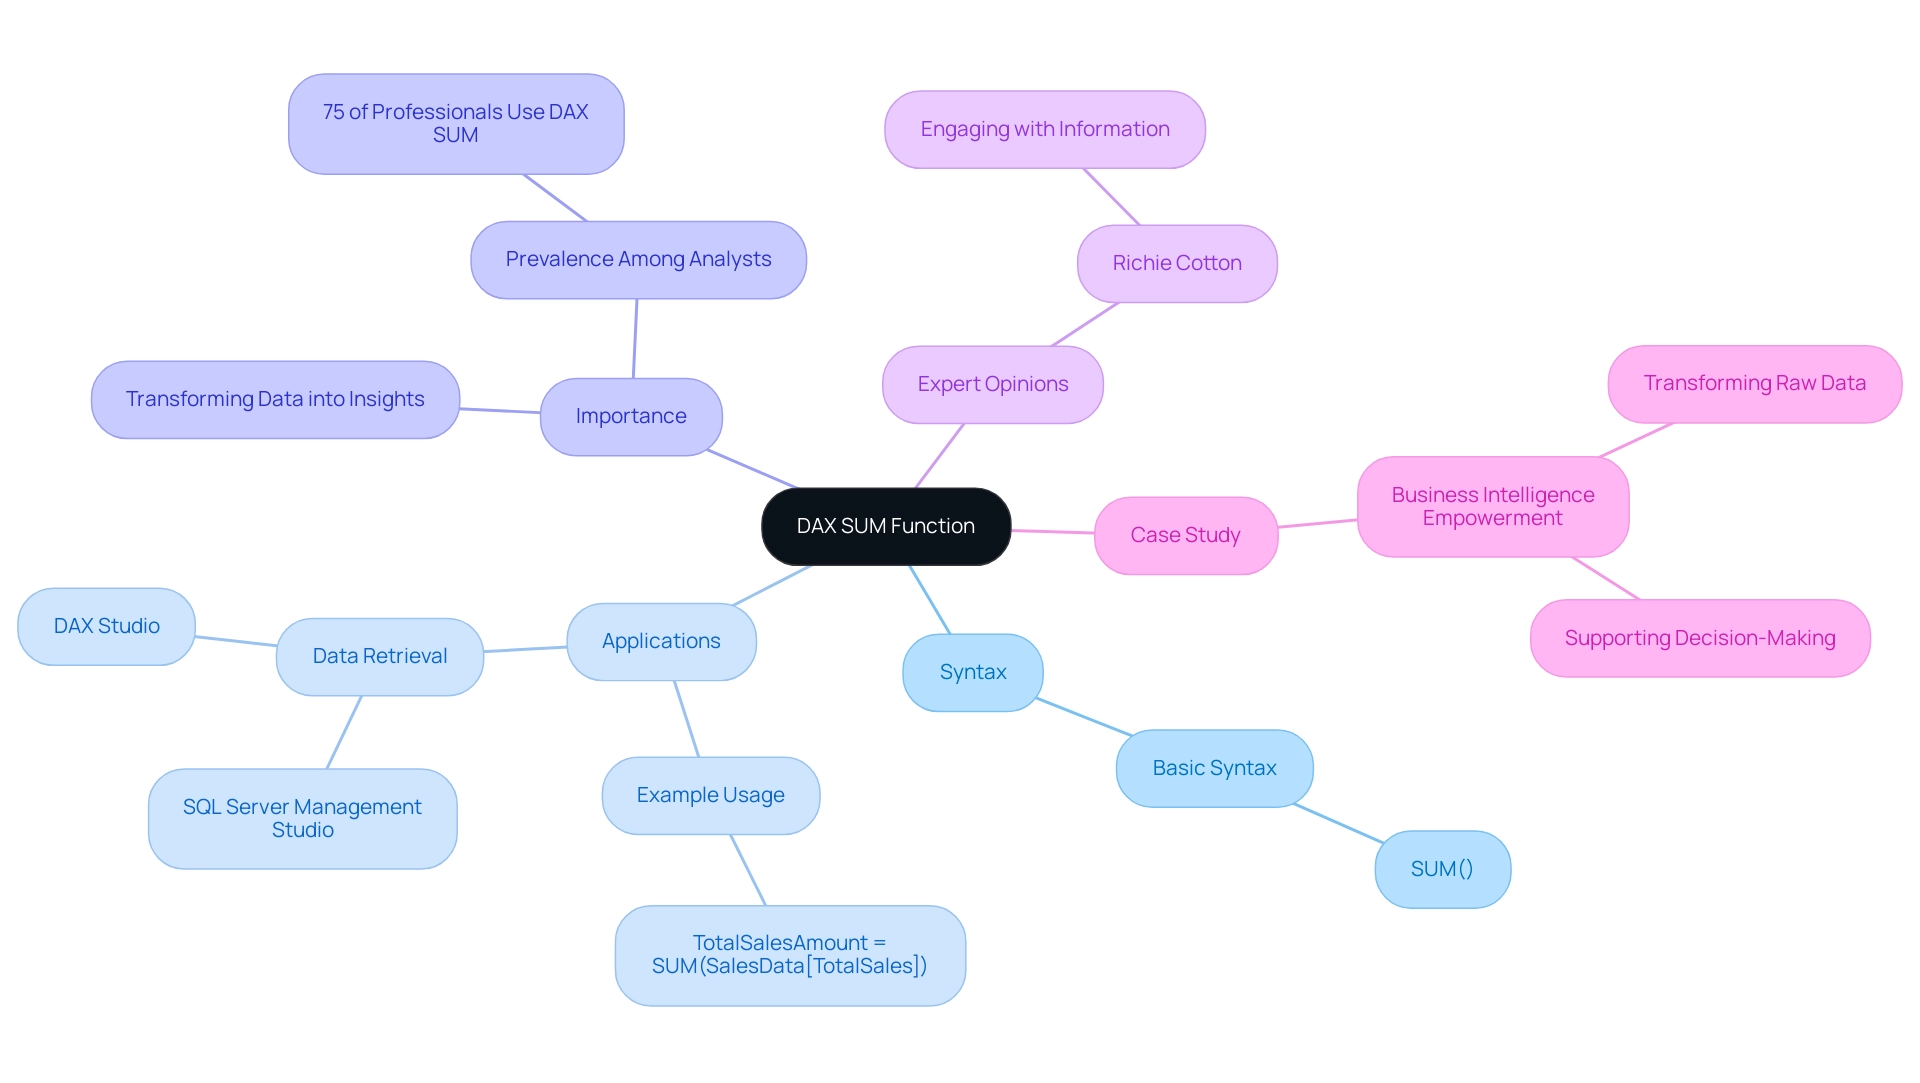
The DAX SUM formula serves as a fundamental tool for aggregating numerical data within a specified column, characterized by its straightforward syntax: SUM(<Column Name>). For example, to calculate total sales from a column named ‘Sales’, the formula SUM(Sales) is employed. This feature is essential for executing basic aggregations in Power BI, enabling users to effectively summarize information for insightful reports and dashboards. Addressing challenges such as time-consuming report creation and inconsistencies is critical in today’s data-driven environment.
As we look to 2025, the prevalence of the DAX SUM function among analysts remains significant, with approximately 75% of professionals relying on it for aggregation tasks. This underscores its importance in the realm of Business Intelligence, where transforming raw data into actionable insights is vital for informed decision-making and fostering growth. The ability to generate and execute DAX queries in applications like SQL Server Management Studio and DAX Studio further enhances its utility, facilitating effortless data retrieval and manipulation.
Mastering the effective use of DAX SUM with filters is crucial for those aiming to excel in DAX analysis. A pertinent case study, ‘Business Intelligence Empowerment’, illustrates how organizations leveraged DAX SUM with filters to convert raw sales data into actionable insights, significantly enhancing informed decision-making and supporting growth. This case study exemplifies the direct impact of the DAX SUM operation on business outcomes, aligning with the operational efficiency goals pursued by RPA solutions such as EMMA RPA from Creatum GmbH.
Expert opinions consistently highlight the significance of performing a DAX SUM with filter operation in Power BI, especially for information aggregation. Noted analytics expert Richie Cotton asserts, “Engaging with information is crucial for deriving meaningful insights.” This perspective reinforces the role of the DAX SUM with filter formula in streamlining the aggregation process, thereby enhancing the overall analytical capabilities of Power BI users.
Real-world applications of the DAX SUM capability in Power BI showcase its versatility. For instance, if you have a table named ‘SalesData’ with a column ‘TotalSales’, calculating the total sales amount can be accomplished with:
TotalSalesAmount = SUM(SalesData[TotalSales])
This straightforward implementation exemplifies how the DAX SUM function can be utilized to provide quick and accurate data summaries, solidifying its status as a cornerstone of effective data analysis. Furthermore, mastering DAX is best achieved through software designed for information modeling, ensuring users fully comprehend the nuances of these powerful capabilities. To explore how Creatum GmbH’s solutions can enhance your information analysis capabilities, book a free consultation today.
The Role of Filters in DAX SUM: Enhancing Data Accuracy
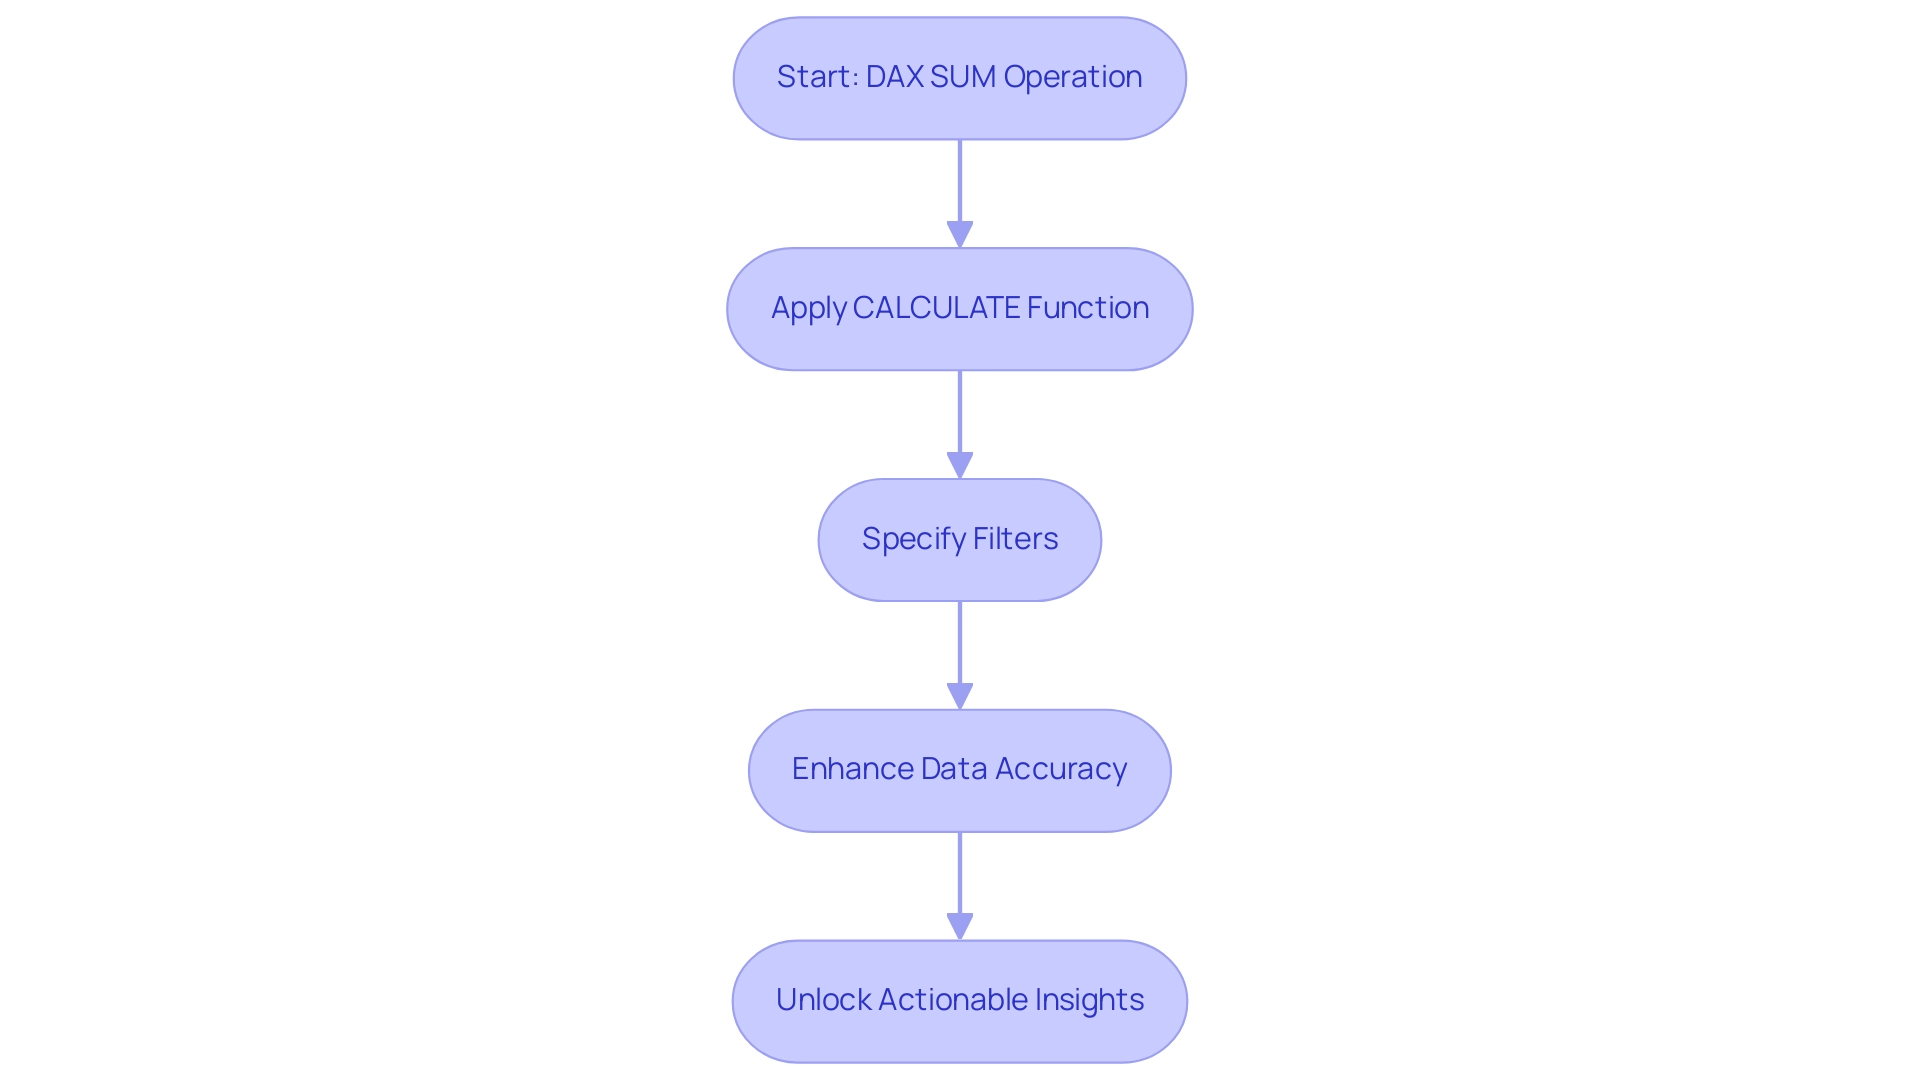
The DAX sum with filter is essential for refining the information processed by the SUM operation, enabling precise calculations tailored to specific criteria. By leveraging the CALCULATE function, users can effectively apply DAX sum with filter within their DAX formulas. For instance:
TotalSalesWest = CALCULATE(SUM(SalesData[TotalSales]), SalesData[Region] = "West")
This formula computes the total sales for the ‘West’ region, illustrating how targeted filtering enhances data accuracy. In 2025, the impact of filters on DAX calculations is underscored by the fact that well-structured filters significantly improve the reliability of insights obtained from analysis, which is crucial for driving business growth through informed decision-making.
Current trends in information filtering methods emphasize the importance of understanding filter context, as highlighted in a recent case study titled ‘Optimization Techniques for Filter Context in Power BI.’ This study reveals that employing strategies such as simplifying DAX calculations and utilizing tools like ALL, REMOVEFILTERS, and KEEPFILTERS can lead to substantial performance improvements in Power BI reports. By mastering these techniques, users can unlock actionable insights that drive informed decision-making, addressing challenges like time-consuming report creation and information inconsistencies.
Moreover, expert opinions in 2025 suggest that the CALCULATE function remains a cornerstone of effective DAX usage, particularly in scenarios requiring nuanced information analysis. The ability to manipulate filter context not only enhances calculation accuracy but also empowers professionals to derive meaningful insights from complex datasets. As Rutuja Dinde aptly notes, “With the right approach, filter context becomes a powerful tool for unlocking actionable insights.”
Incorporating the DAX sum with filter through slicers in Power BI visuals or directly within DAX formulas allows for focused analysis, ensuring that the information examined is relevant and actionable. This strategic use of filters is essential for optimizing information accuracy and enhancing overall operational efficiency, critical in today’s information-rich environment. Furthermore, for those eager to expand their knowledge, the forthcoming FabCon Vegas event from March 31 to April 2 offers a $400 discount with code FABINSIDER for conference registration, presenting a fantastic opportunity to learn more about DAX and analysis techniques.
Additionally, Creatum GmbH’s RPA solutions can enhance these DAX functions by automating repetitive tasks, thus improving efficiency and addressing staffing shortages, ultimately supporting better information management and insight generation.
Practical Applications: Using DAX SUM with Filters in Real Scenarios
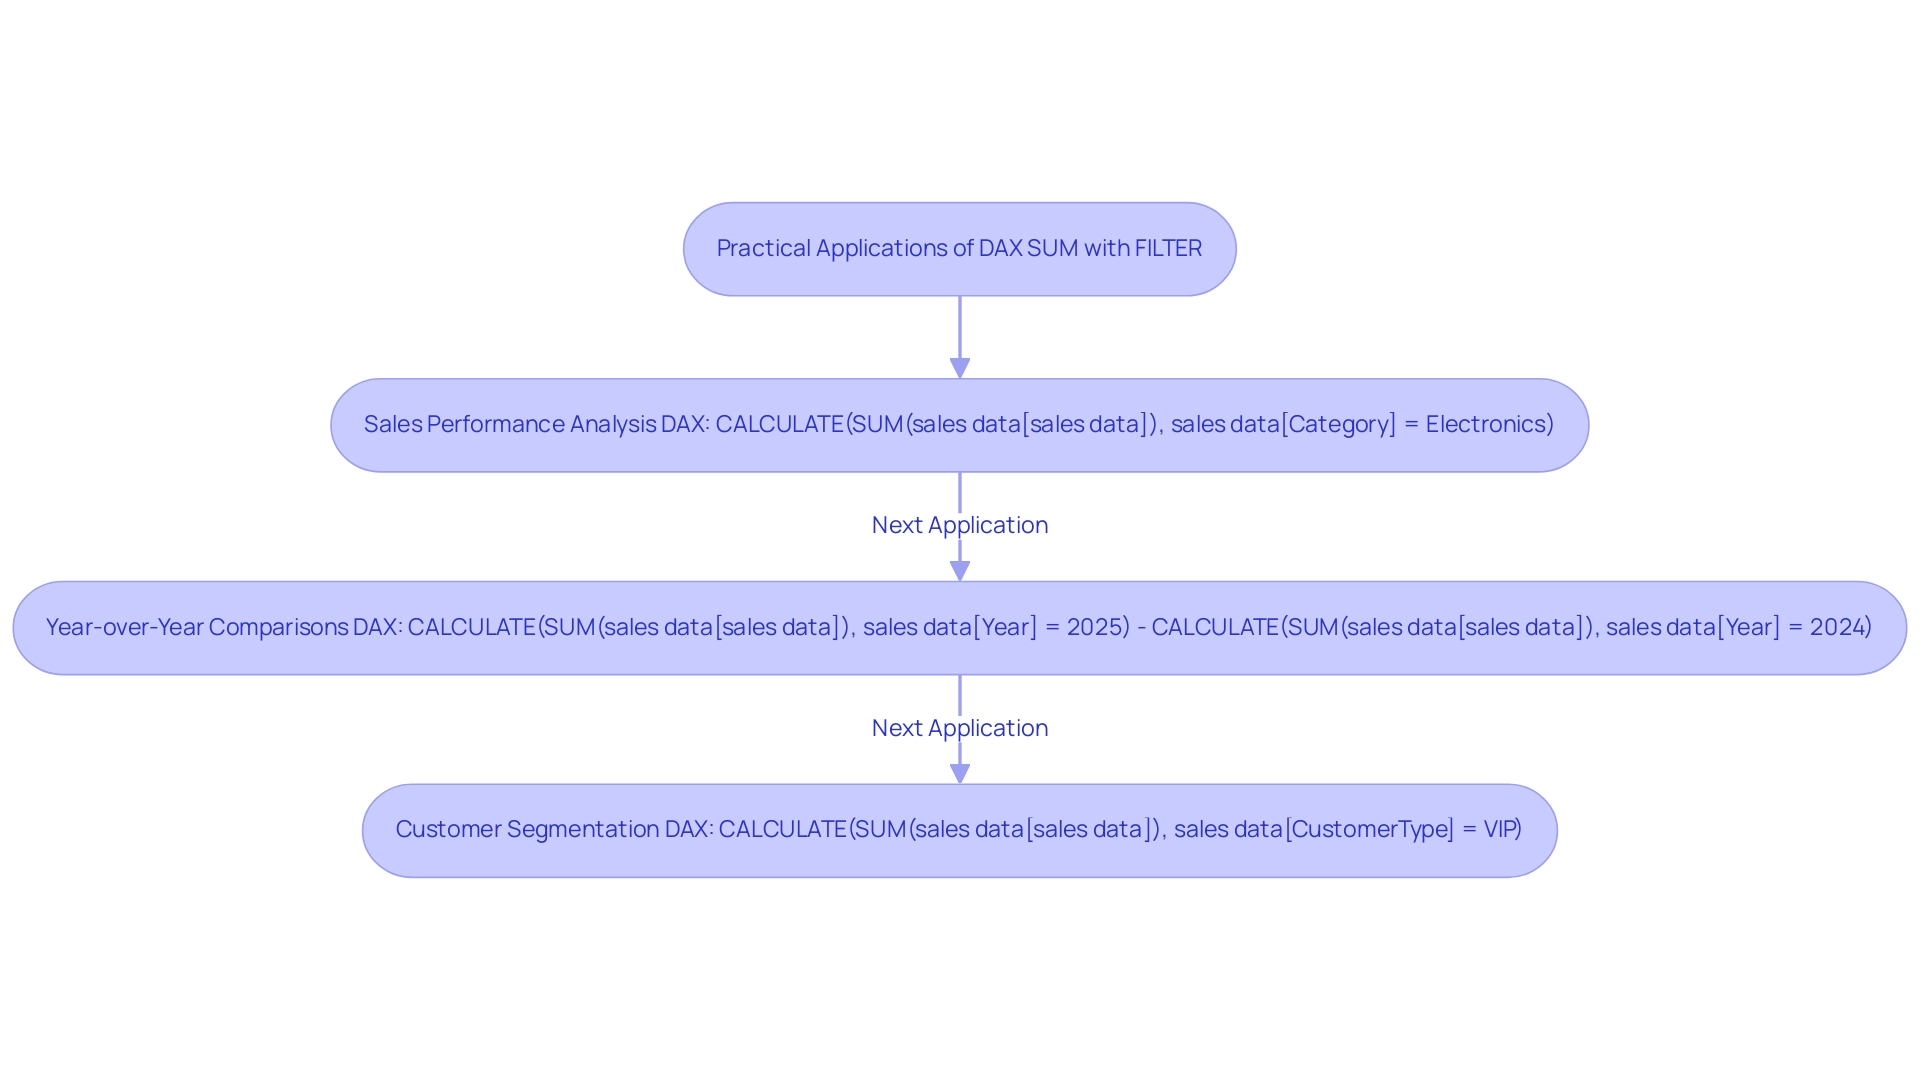
Utilizing DAX SUM with FILTER significantly enhances analytical capabilities, providing precise insights into sales performance and growth trends. In today’s data-rich environment, where extracting meaningful insights is crucial for maintaining a competitive edge, several practical applications emerge:
-
Sales Performance Analysis: Calculating total sales for specific products or categories allows businesses to focus on their most profitable segments. For instance:
total electronics sales = CALCULATE(SUM(sales data[sales data]), sales data[Category] = "Electronics")This formula enables analysts to isolate sales data for electronics, facilitating targeted marketing strategies and effective inventory management. Custom visual files in Power BI prove especially beneficial when prepackaged visuals fall short of business requirements, enabling tailored insights that address inaccuracies and enhance operational efficiency.
-
Year-over-Year Comparisons: Understanding sales growth is essential for strategic planning. By comparing current year sales to previous years, organizations can assess their performance trajectory:
sales growth = CALCULATE(SUM(sales data[sales data]), sales data[Year] = 2025) - CALCULATE(SUM(sales data[sales data]), sales data[Year] = 2024)This calculation provides a clear view of year-over-year growth, crucial for evaluating business health and forecasting future sales. Notably, the Y-axis of the graph illustrates the switchable measure, either Profit or Sales, highlighting the versatility of DAX SUM in performance analysis and the importance of actionable guidance in decision-making.
-
Customer Segmentation: Analyzing sales performance across different customer segments reveals valuable insights into purchasing behaviors. For example:
total sales vip = CALCULATE(SUM(sales data[sales data]), sales data[CustomerType] = "VIP")This measure aids businesses in understanding the contribution of VIP customers to overall sales, guiding loyalty programs and personalized marketing efforts. A Data Analyst with seven years of experience, who transitioned to an Associate Data Engineer role, found success through a Certification course, underscoring the importance of enhancing analytical skills to overcome challenges in leveraging insights.
Beyond these DAX applications, integrating RPA solutions like EMMA RPA and Power Automate significantly enhances operational efficiency. By automating repetitive information preparation tasks, organizations can free up valuable time for analysts to concentrate on deriving insights from their findings. These RPA tools optimize workflows and ensure information consistency, ultimately resulting in more precise and prompt decision-making.
These examples illustrate how DAX SUM with FILTER can effectively extract actionable insights from data, driving informed decision-making and enhancing operational efficiency. In 2025, organizations leveraging these techniques are expected to see significant improvements in year-over-year sales growth, reinforcing the importance of data-driven strategies in today’s competitive landscape. As professionals such as Business Analysts, Business Owners, and Business Developers increasingly utilize Power BI, mastering DAX functions alongside RPA solutions becomes essential for success.
Common Challenges in Implementing DAX SUM with Filters
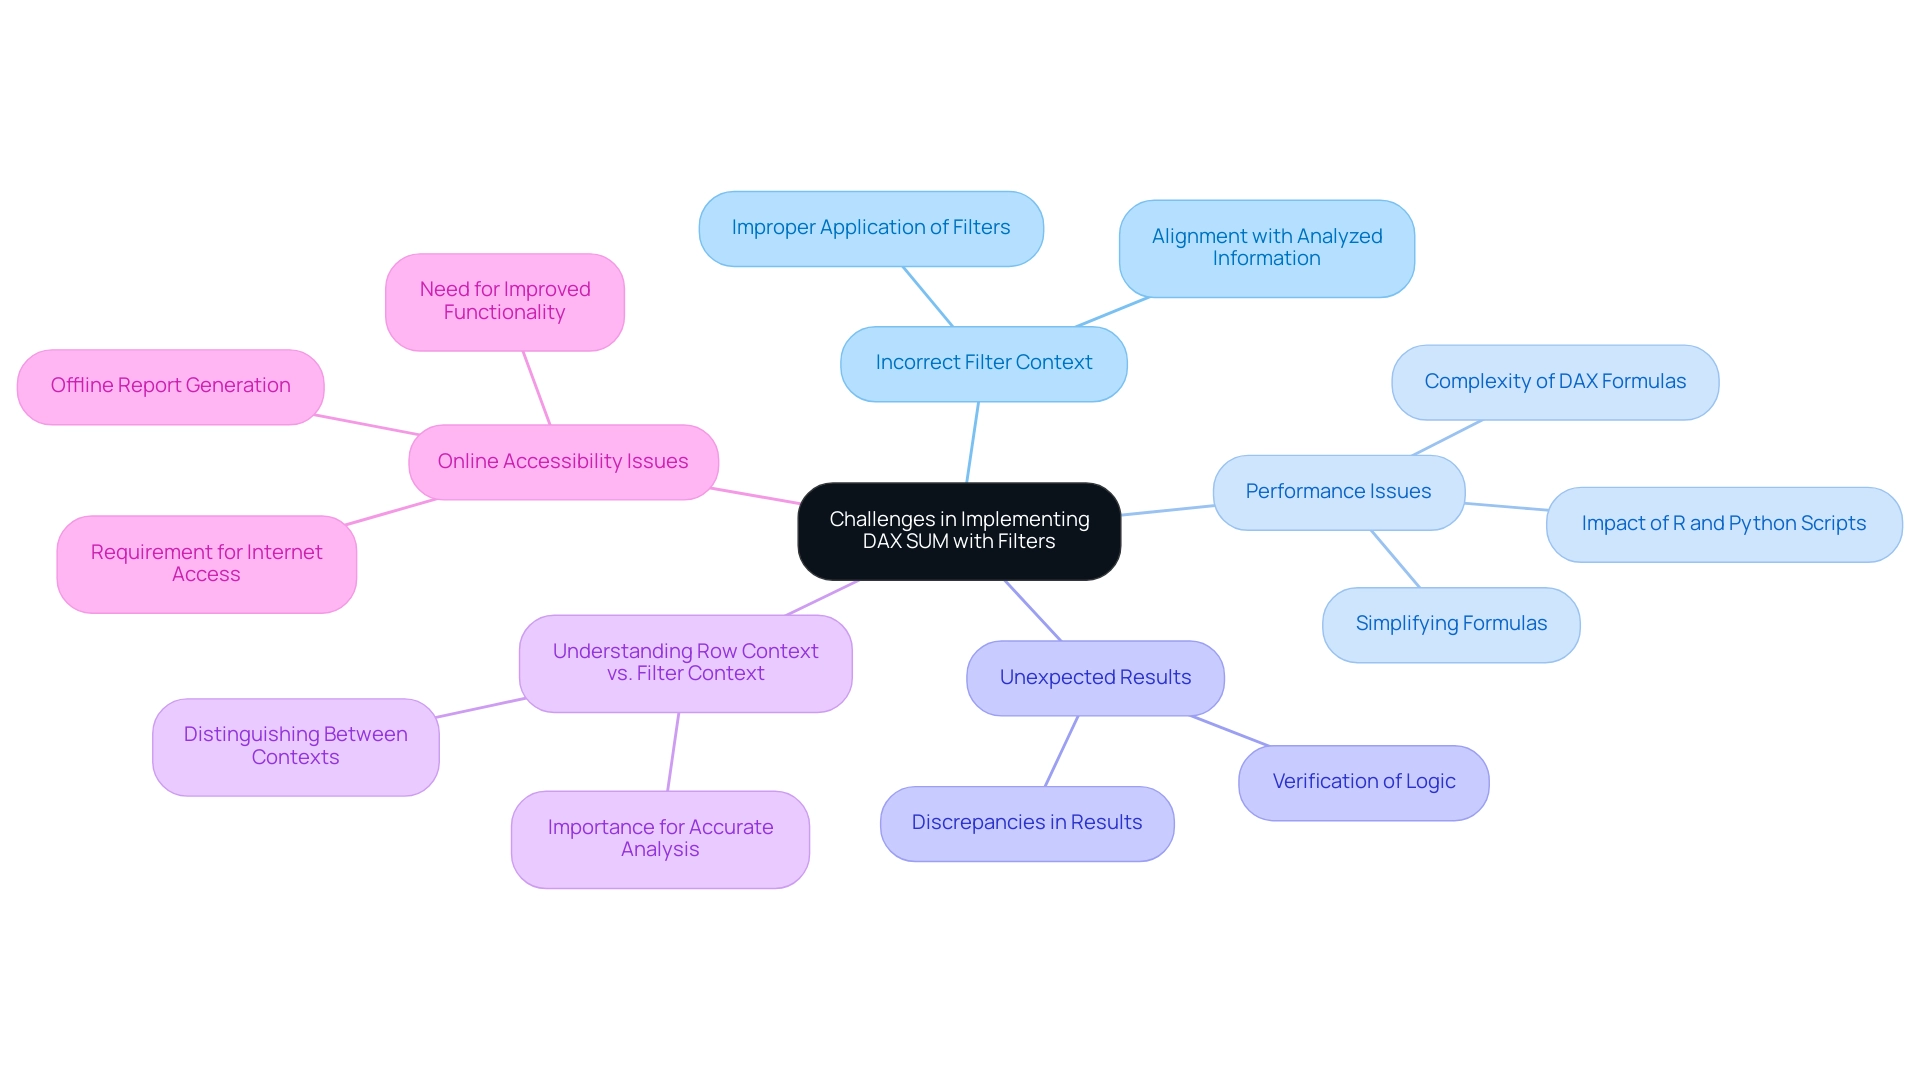
Utilizing DAX SUM in conjunction with filters can significantly enhance your data analysis capabilities. However, it is essential to be aware of several prevalent challenges:
-
Incorrect Filter Context: One of the most common pitfalls is the improper application of filters. If the filter context is not accurately established, the filters may yield unexpected results. To maintain accuracy in your calculations, ensure that your filters align with the specific information being analyzed for the DAX SUM with filter.
-
Performance Issues: The complexity of DAX formulas, particularly those incorporating multiple filters, can lead to performance degradation. Statistics indicate that intricate calculations can significantly slow down processing times. Additionally, running R and Python scripts in Power BI can further impact performance due to their resource-intensive nature. To mitigate this, consider simplifying your formulas or utilizing variables to streamline calculations. This approach aligns with the principles of Robotic Process Automation (RPA), which aims to boost operational efficiency by reducing manual, repetitive tasks.
-
Unexpected Results: Analysts often encounter discrepancies between expected and actual results, frequently due to overlapping filters or flawed logic within the DAX formula. It is advisable to rigorously verify your logic and conduct tests with sample datasets to ensure that your calculations produce the intended outcomes. This verification process is essential, particularly in the context of utilizing Business Intelligence tools to derive actionable insights from information.
-
Understanding Row Context vs. Filter Context: A common source of confusion lies in distinguishing between row context and filter context. Misunderstanding how DAX evaluates expressions in these different contexts can lead to calculation errors. Gaining a solid grasp of these concepts is vital for accurate information analysis and avoiding common mistakes, particularly when dealing with poor master quality that can hinder effective decision-making.
-
Online Accessibility Issues: As highlighted in a case study, Power BI requires internet access for its service, which can be problematic for users needing offline access or those with poor connectivity. This limitation can affect the implementation of DAX SUM with filter, leading users to generate reports in PDF or PPT format for offline sharing. Addressing these accessibility challenges is essential for ensuring that your analysis remains robust and reliable.
Utpal Kar noted, “This is one of the major Power BI drawbacks as Microsoft has designed Power BI in a very complex manner.” This complexity can worsen the challenges encountered by analysts when utilizing DAX operations. By tackling these challenges proactively, professionals can improve their proficiency in implementing DAX SUM with filter, leading to more reliable and insightful analysis that ultimately supports informed decision-making in their organizations.
Additionally, tailored AI solutions can play a crucial role in overcoming these challenges by providing targeted technologies that align with specific business goals. Organizations often face hurdles in adopting AI due to concerns about integration and resource allocation. By utilizing AI, companies can optimize their information processes, enhance information quality, and improve the overall efficiency of DAX operations in Power BI.
Best Practices for Mastering DAX SUM with Filters
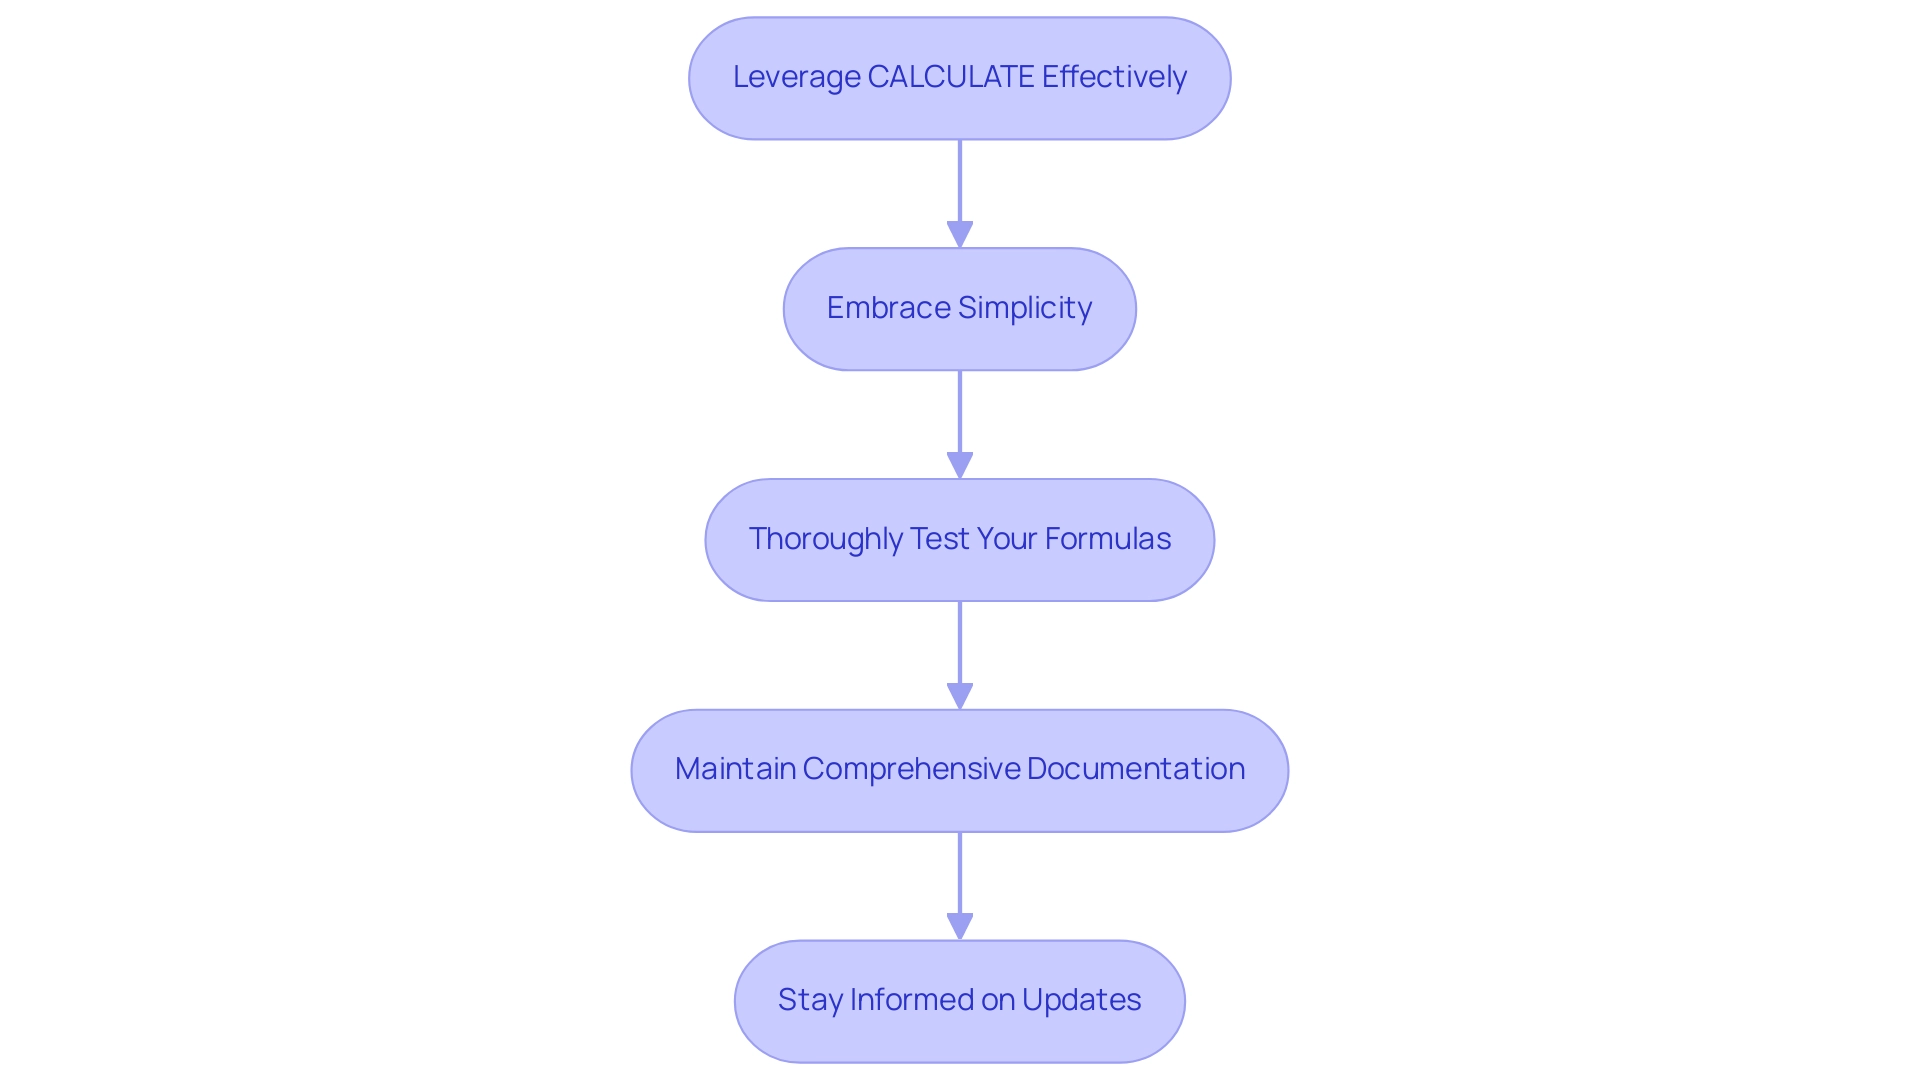
To effectively master DAX sum with filter, consider the following best practices:
-
Leverage CALCULATE Effectively: Always encapsulate your SUM operation within CALCULATE when applying filters. This ensures the correct context is applied, allowing for accurate calculations that reflect the intended data scope.
-
Embrace Simplicity: Begin with straightforward calculations, progressively introducing complexity as your confidence with DAX grows. This approach fosters a solid foundation and reduces the likelihood of errors.
-
Thoroughly Test Your Formulas: Utilize sample datasets to rigorously test your DAX formulas prior to deploying them on larger datasets. This practice not only helps identify potential errors early but also enhances overall performance. For instance, utilizing the DIVIDE method prevents Division by Zero Errors and enhances performance compared to the traditional division operator.
-
Maintain Comprehensive Documentation: Keep detailed notes on your DAX formulas and the underlying logic. This documentation serves as a valuable reference for both you and your colleagues, facilitating better understanding and collaboration in future projects.
-
Stay Informed on Updates: DAX is an evolving language, with new functions and features regularly introduced. Staying informed about these changes can significantly improve your analysis capabilities, enabling you to leverage the latest advancements in AI-driven insights and analytics. As mentioned in recent conversations, AI capabilities allow real-time insights and improve decision-making by delivering precise and prompt information for strategic outcomes.
By following these best practices, you can enhance your DAX skills and ensure that your analysis is both effective and efficient, ultimately driving better decision-making and strategic outcomes. Additionally, leveraging Robotic Process Automation (RPA) from Creatum GmbH can streamline your workflows, reduce errors, and free up your team for more strategic tasks, further enhancing operational efficiency. As Praveen, a Digital Marketing Specialist, emphasizes, mastering these skills is crucial for professionals looking to excel in data-driven environments. Furthermore, addressing challenges in utilizing insights from Power BI dashboards, such as time-consuming report creation and inconsistencies, is essential for maximizing the effectiveness of your analysis efforts.
Comparative Analysis: DAX SUM vs. Other DAX Functions
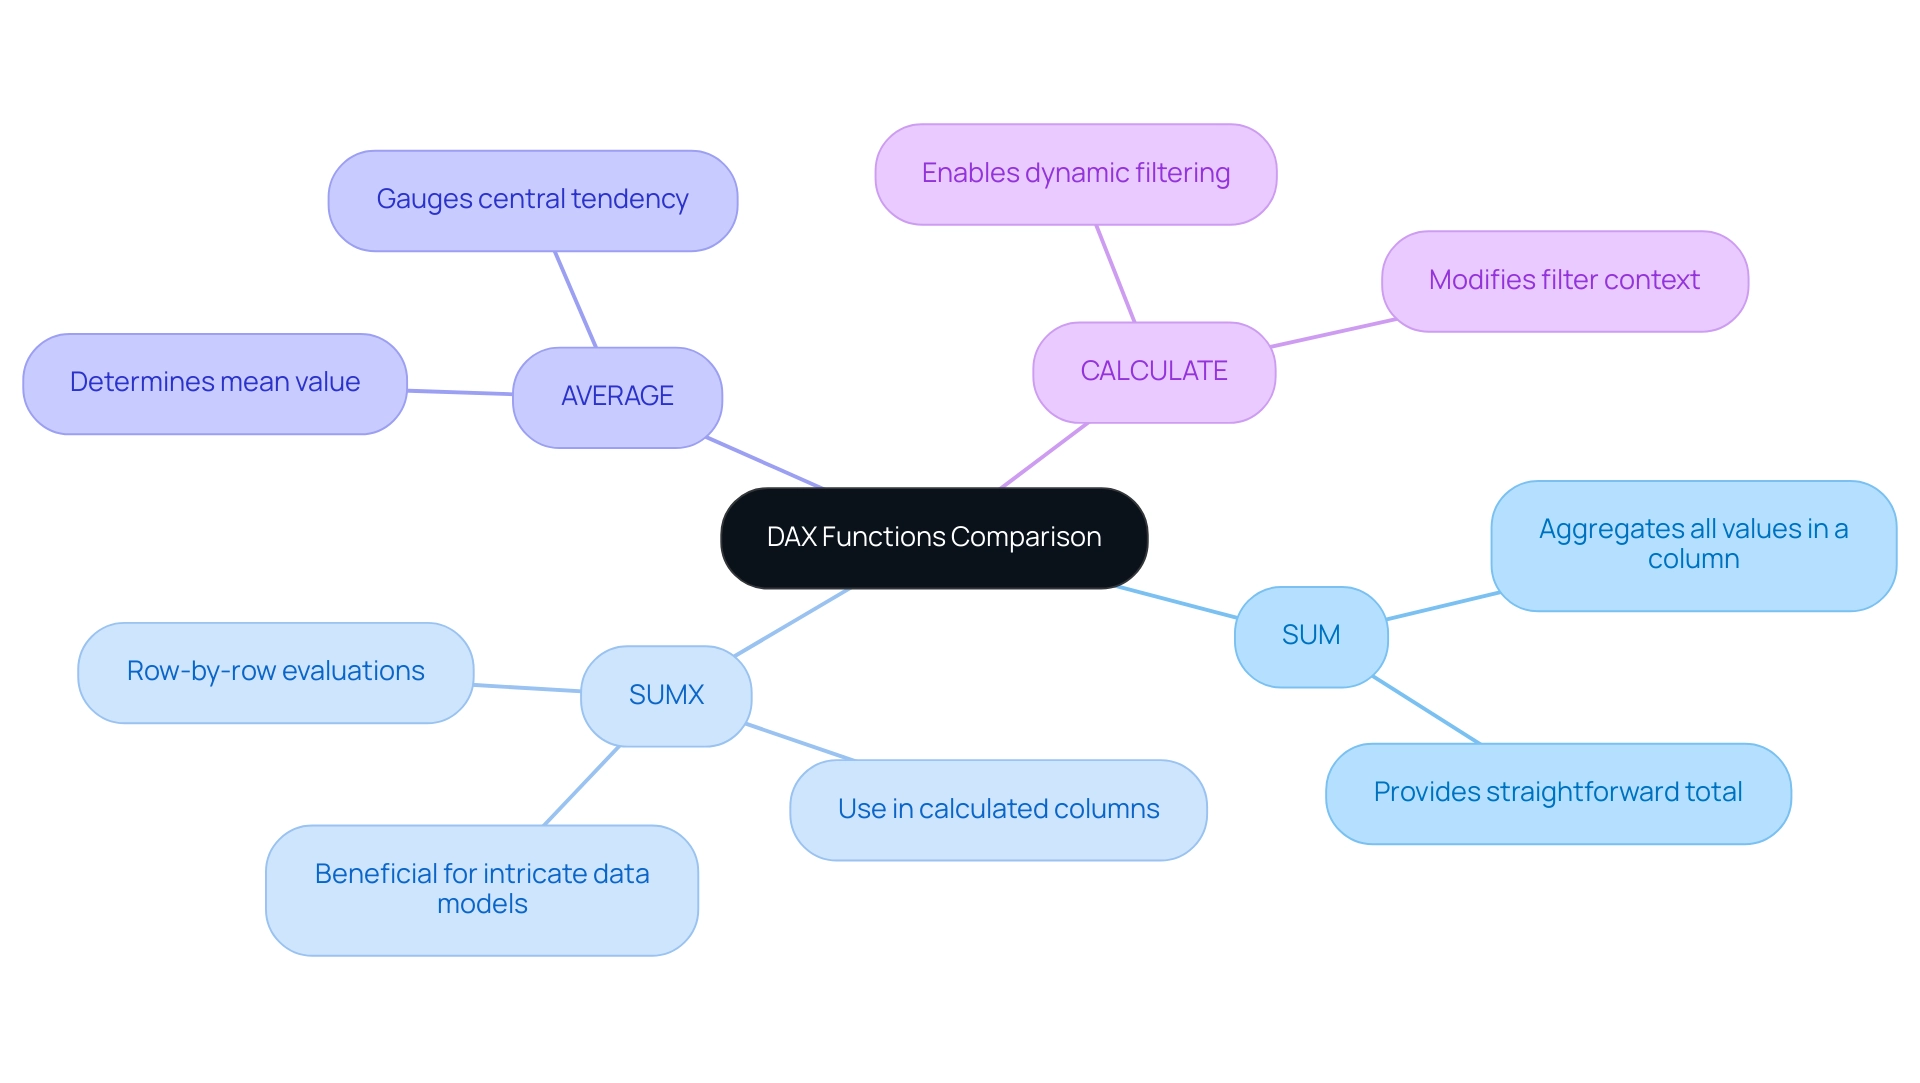
In Power BI, a nuanced comprehension of DAX operations is essential for effective analysis, particularly in a landscape where utilizing Business Intelligence can convert raw information into actionable insights. Here’s a comparative analysis of key DAX operations:
-
SUM vs. SUMX: The SUM operation aggregates all values in a specified column, providing a straightforward total. In contrast, SUMX performs row-by-row evaluations of an expression before summing the results. This makes SUMX especially beneficial for situations needing row-level calculations, like when handling calculated columns or intricate data models.
-
SUM vs. AVERAGE: While SUM provides the total of a column, the AVERAGE calculation determines the mean value. Utilizing AVERAGE is essential when you aim to gauge the central tendency of your dataset, offering insights into typical values rather than just totals.
-
SUM vs. CALCULATE: The CALCULATE operation is powerful for modifying the filter context of calculations. When utilizing DAX SUM with a filter, it allows for dynamic filtering, enabling users to apply specific conditions to their summation, which can significantly enhance the relevance of the results.
Understanding these distinctions is vital for selecting the most appropriate method for your analysis. By leveraging the appropriate DAX functions, you can enhance the accuracy and relevance of your insights, ultimately driving better decision-making in your organization.
Moreover, in today’s information-rich environment, challenges such as time-consuming report creation and inconsistencies can hinder effective analysis. Power BI enables users to tailor their workspace by organizing tools and panels to fit their workflow preferences, which can improve the efficiency of analysis. Best practices in modeling information, such as using the Power Query Editor for preparation and defining relationships between tables, are essential for structuring and organizing content effectively.
A case study on information modeling highlights that effective practices ensure accurate, efficient, and understandable structures, enabling better insights and decision-making.
As Paul Turley, a Microsoft Data Platform MVP, notes, ‘The term ‘architecture’ is more commonly used in the realm of engineering and warehouse project work, but the concept applies to BI and analytic reporting projects of all sizes.’ This highlights the significance of a well-organized method for analysis, particularly when employing DAX capabilities, to address the common challenges of report creation and to offer clear, actionable guidance for stakeholders.
Moreover, incorporating Robotic Process Automation (RPA) solutions, such as EMMA RPA, can further boost operational efficiency by automating repetitive tasks and enabling teams to concentrate on strategic analysis instead of time-consuming report generation. Failing to extract meaningful insights from your information can place your organization at a competitive disadvantage. To learn more about how RPA can complement your BI efforts, consider booking a consultation with Creatum GmbH.
Continuous Learning: Staying Ahead in DAX Function Mastery
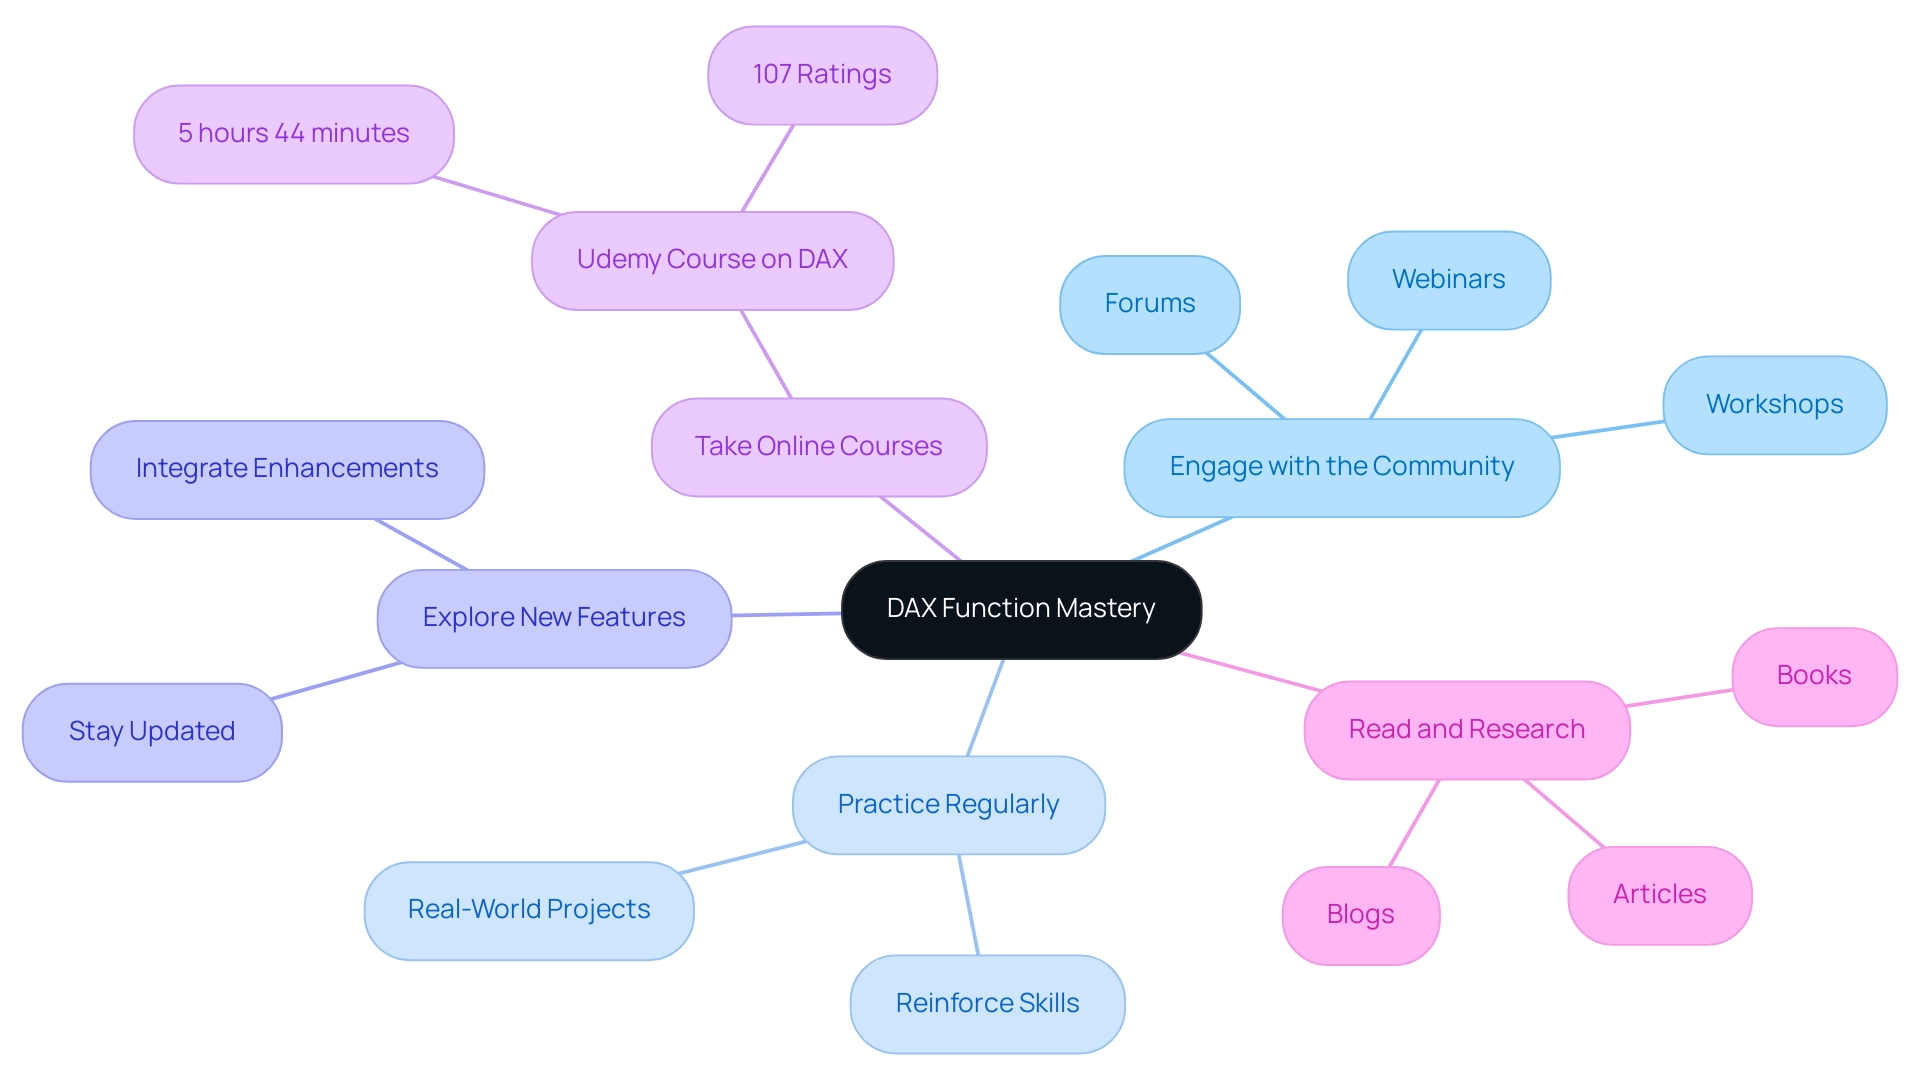
To excel in mastering DAX functions and overcoming common challenges in leveraging insights from Power BI dashboards, professionals should adopt the following strategies:
-
Engage with the Community: Actively participating in forums, webinars, and workshops fosters a collaborative learning environment. Interacting with colleagues boosts understanding and offers opportunities to exchange insights and effective methods, assisting in addressing issues such as inconsistencies while enhancing the clarity of actionable guidance.
-
Practice Regularly: Mastery of DAX is achieved through consistent practice. Tackling real-world projects allows individuals to apply theoretical knowledge, reinforcing their skills and understanding while addressing the time-consuming nature of report creation.
-
Explore New Features: Staying updated on the latest enhancements in Power BI and DAX is crucial. New functions can significantly enhance analytical capabilities, making it essential to integrate these advancements into daily workflows to streamline reporting processes and improve governance.
-
Take Online Courses: Investing in online courses, such as the comprehensive 5-hour 44-minute course on optimizing DAX code available on platforms like Udemy, can deepen understanding and skills. With over 107 ratings, such courses are designed to enhance performance and maintainability in DAX, making them a valuable resource for professionals seeking to improve their DAX skills and address the lack of actionable insights in their reports.
-
Read and Research: Continuous learning is vital. Consistently reading articles, blogs, and books on DAX and analysis helps professionals stay updated on the latest trends and techniques, broadening their knowledge base and allowing them to produce more effective reports.
Furthermore, implementing a robust governance strategy is essential to tackle inconsistencies, ensuring that all reports are accurate and reliable. Statistics indicate that organizations with active community engagement in DAX learning see a marked improvement in their analytical capabilities. For instance, dashboards and reports viewed in the past 90 days reflect the growing interest and utilization of DAX across various sectors.
As Bruno, a data consultant, aptly puts it, “Well there you have it, 5 years later and even more reasons to deep dive into DAX.” Case studies demonstrate that DAX not only enhances reporting and analytics but also empowers professionals, including business analysts and finance experts, to unlock the full potential of Power BI. The case study titled “DAX in Power BI” illustrates how DAX enhances reporting and analytics capabilities, reinforcing the practical benefits of mastering DAX for various professionals.
By embracing these strategies, individuals can ensure they remain at the forefront of DAX mastery, supported by the expertise of Creatum GmbH.
Conclusion
Mastering the DAX SUM function is essential for any data analyst aiming to derive meaningful insights from their datasets. This article has explored the foundational role of the SUM function in Power BI, emphasizing its straightforward syntax and significance in effective data aggregation. The inclusion of filters, particularly through the CALCULATE function, enhances calculation accuracy and allows for nuanced data analysis. By employing practical applications, such as sales performance analysis and year-over-year comparisons, analysts can leverage DAX SUM to drive informed decision-making and foster business growth.
However, challenges such as incorrect filter context, performance issues, and the distinctions between row and filter context can hinder effective implementation. By adhering to best practices—such as leveraging CALCULATE appropriately and maintaining thorough documentation—data professionals can overcome these obstacles and enhance their analytical capabilities. Continuous learning through community engagement and online courses further empowers analysts to stay ahead in the ever-evolving landscape of data analysis.
In conclusion, the DAX SUM function, when utilized effectively alongside filters, serves as a powerful tool for transforming raw data into actionable insights. As businesses increasingly rely on data-driven strategies, mastering DAX functions becomes not just beneficial but essential for achieving operational efficiency and fostering strategic growth. Embracing these techniques will undoubtedly place organizations on a path toward success in today’s competitive environment.
Frequently Asked Questions
What is the DAX SUM formula used for?
The DAX SUM formula is used for aggregating numerical data within a specified column, allowing users to perform basic aggregations in Power BI.
What is the syntax for the DAX SUM formula?
The syntax for the DAX SUM formula is SUM(<Column Name>). For example, to calculate total sales from a column named ‘Sales’, the formula would be SUM(Sales).
How prevalent is the DAX SUM function among analysts as of 2025?
Approximately 75% of professionals rely on the DAX SUM function for aggregation tasks, highlighting its significance in Business Intelligence.
How can DAX SUM be enhanced with filters?
DAX SUM can be enhanced with filters using the CALCULATE function, which allows for precise calculations tailored to specific criteria. For example, TotalSalesWest = CALCULATE(SUM(SalesData[TotalSales]), SalesData[Region] = "West") calculates total sales for the ‘West’ region.
Why is mastering DAX SUM with filters important?
Mastering DAX SUM with filters is crucial for effective DAX analysis, as it helps refine the information processed and improves the reliability of insights obtained from analysis.
What techniques can improve the performance of DAX calculations?
Techniques such as simplifying DAX calculations and utilizing tools like ALL, REMOVEFILTERS, and KEEPFILTERS can lead to substantial performance improvements in Power BI reports.
What role does the CALCULATE function play in DAX?
The CALCULATE function is a cornerstone of effective DAX usage, particularly for nuanced information analysis, as it allows users to manipulate filter context and enhance calculation accuracy.
How can filters be applied in Power BI visuals?
Filters can be applied through slicers in Power BI visuals or directly within DAX formulas, allowing for focused analysis and ensuring the information examined is relevant and actionable.
What support does Creatum GmbH offer for DAX functions?
Creatum GmbH offers RPA solutions that can enhance DAX functions by automating repetitive tasks, improving efficiency, and supporting better information management and insight generation.

