Overview
The three primary areas of analytics—descriptive, diagnostic, and predictive—play distinct roles in understanding and leveraging data for organizational decision-making.
- Descriptive analytics summarizes historical data, providing a foundation for insight.
- Diagnostic analytics delves into the reasons behind past outcomes, uncovering valuable lessons.
- Predictive analytics, on the other hand, forecasts future trends, allowing organizations to anticipate shifts in the market.
Together, these analytics enhance operational efficiency and inform strategic initiatives, ultimately driving better decision-making.
Consider how these analytics can be integrated into your current practices to elevate your organization’s performance.
Introduction
In a world increasingly driven by data, harnessing analytics stands as a cornerstone of operational success for organizations across all sectors. Understanding historical trends and predicting future outcomes, various forms of analytics—descriptive, diagnostic, predictive, and prescriptive—provide powerful tools that empower businesses to make informed decisions. As the landscape evolves, integrating these analytics types not only enhances efficiency but also fosters a culture of continuous improvement.
With the rise of AI and automation, organizations are now better equipped to navigate the complexities of vast data landscapes, driving innovation and strategic growth. This article delves into the multifaceted role of analytics in shaping operational efficiency and explores the trends that are redefining how businesses leverage data for competitive advantage.
Understanding Analytics: An Overview
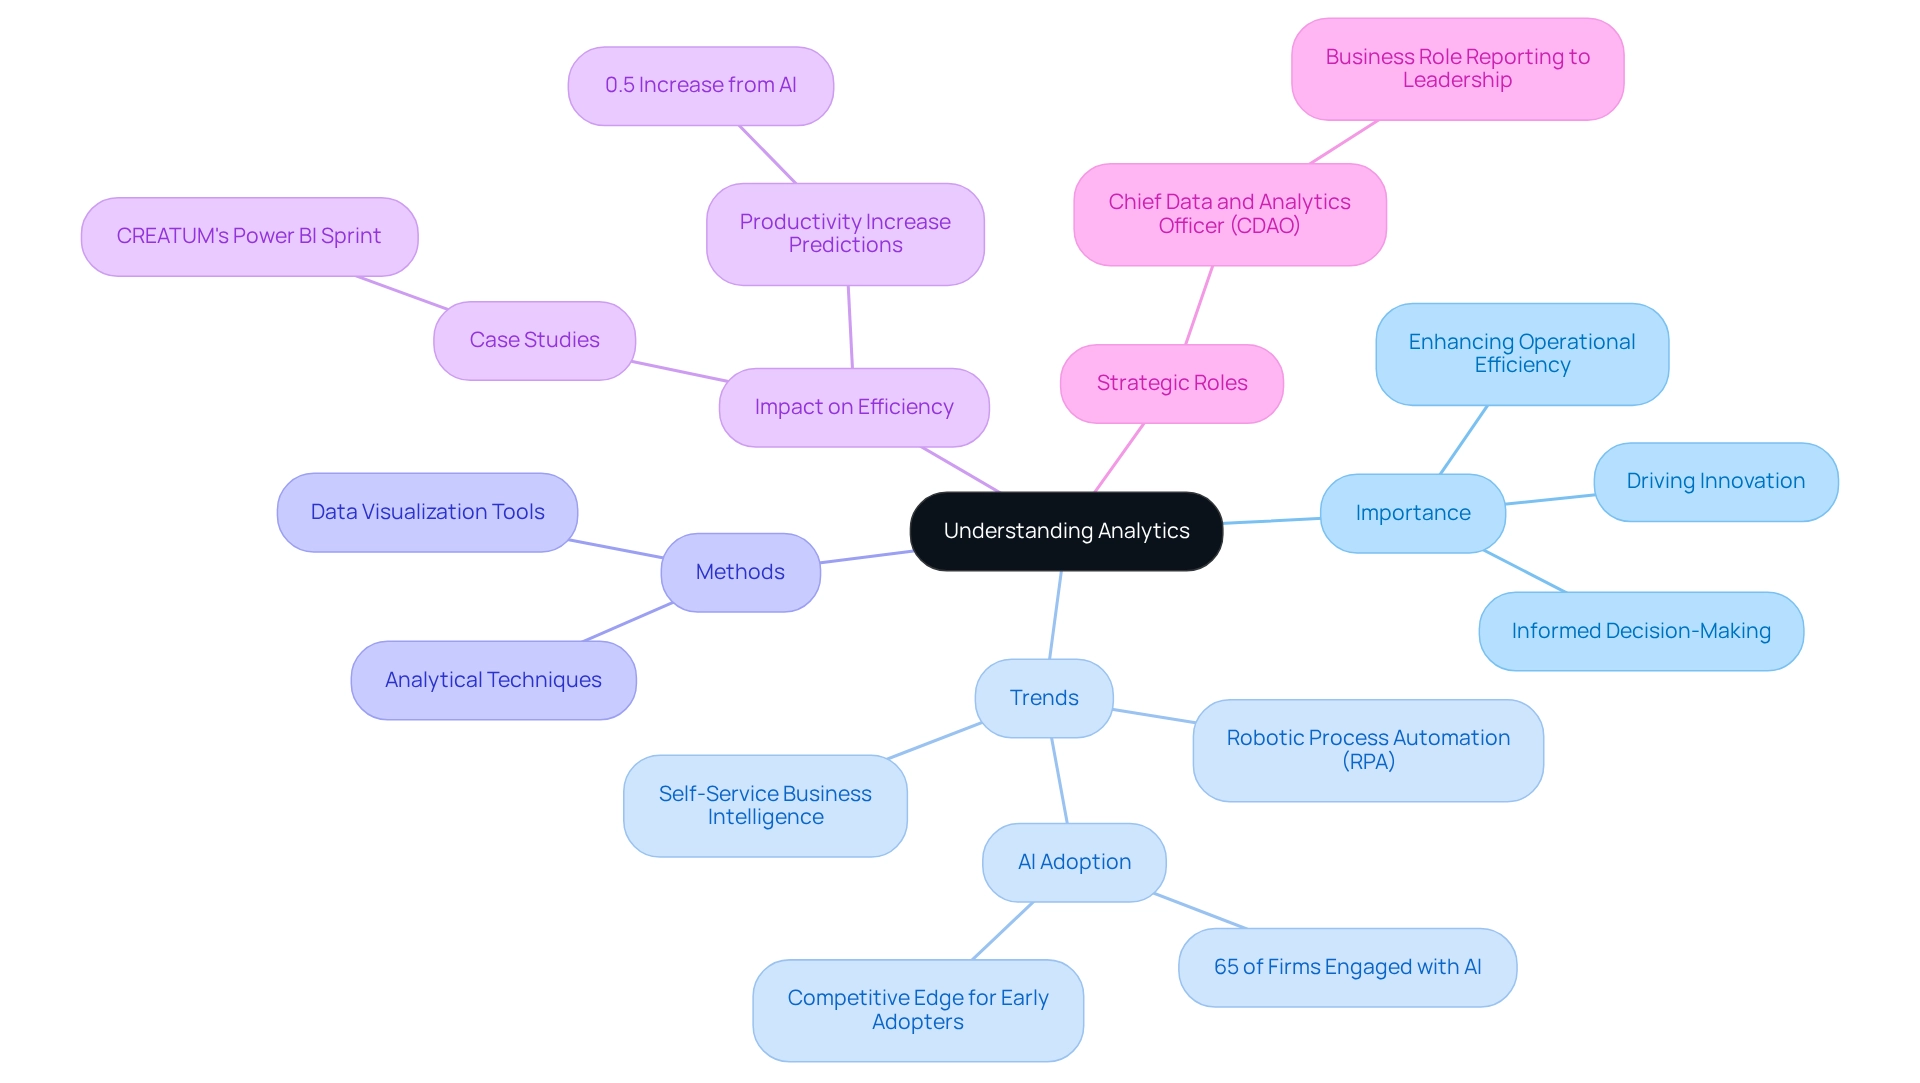
Analytics encompasses the systematic computational examination of information and statistics, serving as a crucial process for entities aiming to navigate the complexities of extensive information landscapes. By employing various analytical methods, organizations can identify patterns, trends, and connections within their data, facilitating informed decision-making. In 2025, the importance of data analysis in enhancing operational efficiency is paramount; it stands as a key driver of innovation and strategic goal achievement.
Current trends reveal a significant shift towards self-service business intelligence tools, which simplify performance tracking and empower organizations to swiftly monitor relevant performance indicators. This evolution allows teams to focus on strategic initiatives rather than being bogged down by manual data analysis. Moreover, the integration of Robotic Process Automation (RPA) can further enhance operational efficiency by automating manual workflows, thereby freeing valuable resources for more strategic tasks.
The impact of data analysis on operational efficiency is evident in numerous case studies. For instance, a notable 65% of firms are currently engaged with AI in data and analytics, with early adopters reporting a competitive edge. This trend underscores the necessity for businesses to adapt rapidly to the evolving data landscape to thrive in an increasingly data-driven environment.
As MIT’s Daron Acemoglu predicts, AI may lead to a 0.5% increase in productivity over the next decade, further highlighting the importance of integrating AI into analytical strategies. Real-world examples illustrate how organizations are transforming raw data into actionable insights. For example, ‘CREATUM’s Power BI Sprint has significantly bolstered analytical capabilities for clients like PALFINGER, enabling them to generate professional reports and leverage insights effectively.
By establishing robust assessment frameworks, companies can enhance data quality and optimize operations, ultimately fostering growth and innovation. As Randy emphasizes, the role of Chief Data and Analytics Officer (CDAO) should be a commercial position reporting to organizational leadership, reflecting the growing importance of data management in achieving strategic objectives. As the landscape continues to evolve, the role of data analysis in operational efficiency will remain vital, empowering organizations to make informed decisions that align with their strategic goals.
Descriptive Analytics: Summarizing Historical Data
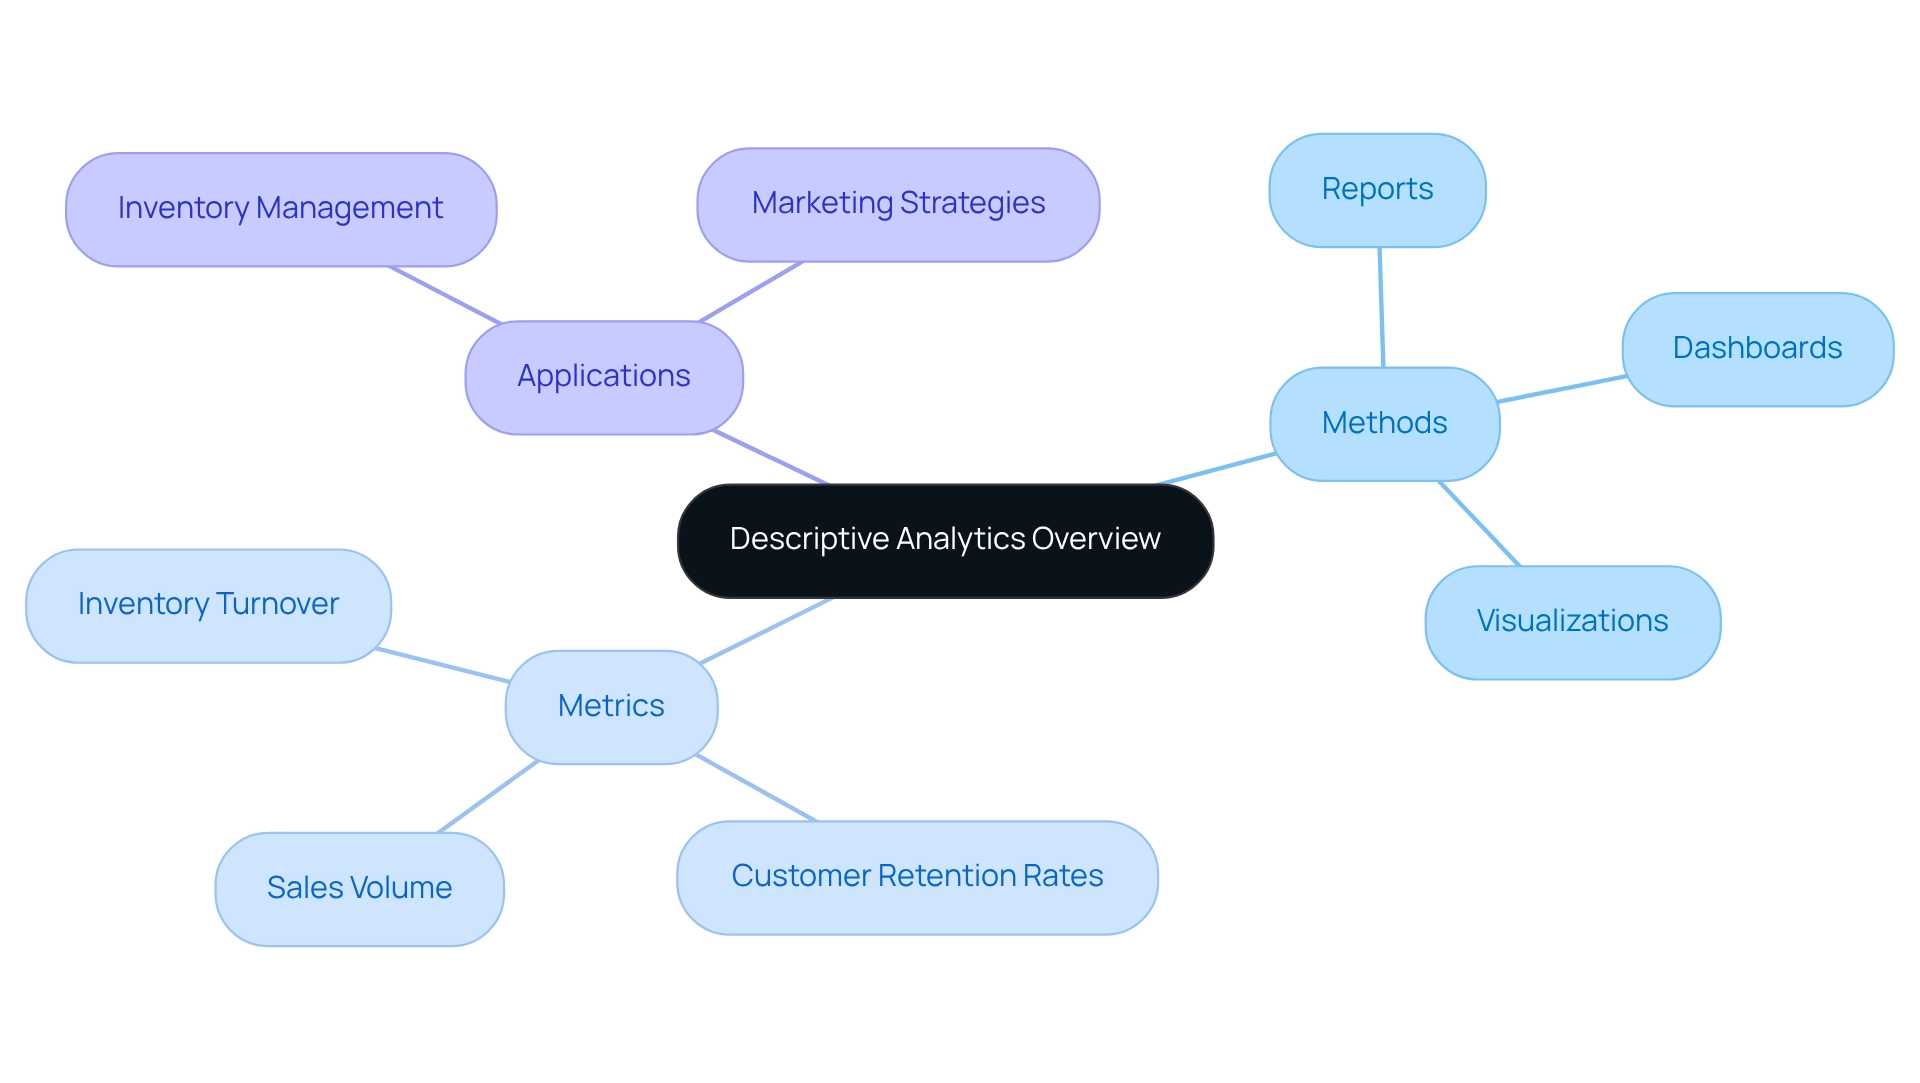
Descriptive analysis plays a vital role in interpreting historical information, enabling companies to summarize past occurrences and obtain actionable insights. This analytical method employs various metrics and visual representations, including reports, dashboards, and visualizations, to present information in an accessible manner. For instance, a retail firm may utilize descriptive analysis to examine sales data from prior years, uncovering seasonal patterns and consumer buying behaviors.
Such insights empower organizations to make informed decisions regarding inventory management and marketing strategies.
In 2025, the average metrics used in descriptive analysis will include key performance indicators (KPIs) such as sales volume, customer retention rates, and inventory turnover. The precision of market trend assessments has significantly enhanced by almost 20% through the use of descriptive analysis, enabling companies to modify their strategies and capitalize on new opportunities.
Catherine Cote, Marketing Coordinator at Harvard Business School Online, states, “Data analysis is a valuable tool for businesses aiming to increase revenue, enhance products, and retain customers.” This underscores the significance of descriptive analysis in addressing operational efficiency challenges, as it provides the insights necessary for optimizing processes and improving decision-making.
A notable case study highlighting the effectiveness of descriptive analytics is the adoption of analytics dashboards, which have surged by over 45% among leading firms. These dashboards, particularly those created through Power BI services, offer a centralized platform for data visualization, streamlining decision-making and enhancing oversight of market dynamics. The 3-Day Power BI Sprint enables organizations to swiftly create professionally designed reports that facilitate this process.
Additionally, the General Management App enhances comprehensive management and smart reviews, further supporting effective decision-making.
Companies employing descriptive data analysis for inventory management have reported substantial benefits. For example, retailers can analyze previous sales information to optimize stock levels, ensuring that popular items are readily available while minimizing excess inventory. This strategic approach not only enhances operational efficiency but also contributes to improved customer satisfaction.
As the Internet of Things (IoT) continues to expand, with projections indicating 20.3 billion connected devices generating 79.4 zettabytes of information by 2025, the significance of descriptive analytics will only increase. Businesses that effectively harness these insights, alongside leveraging Robotic Process Automation (RPA) to automate manual workflows, will be better positioned to navigate the complexities of the market and drive growth, particularly in managing the vast amounts of data generated by IoT devices. To explore how our actions portfolio can assist your organization, we invite you to book a free consultation.
Diagnostic Analytics: Uncovering the ‘Why’ Behind Data
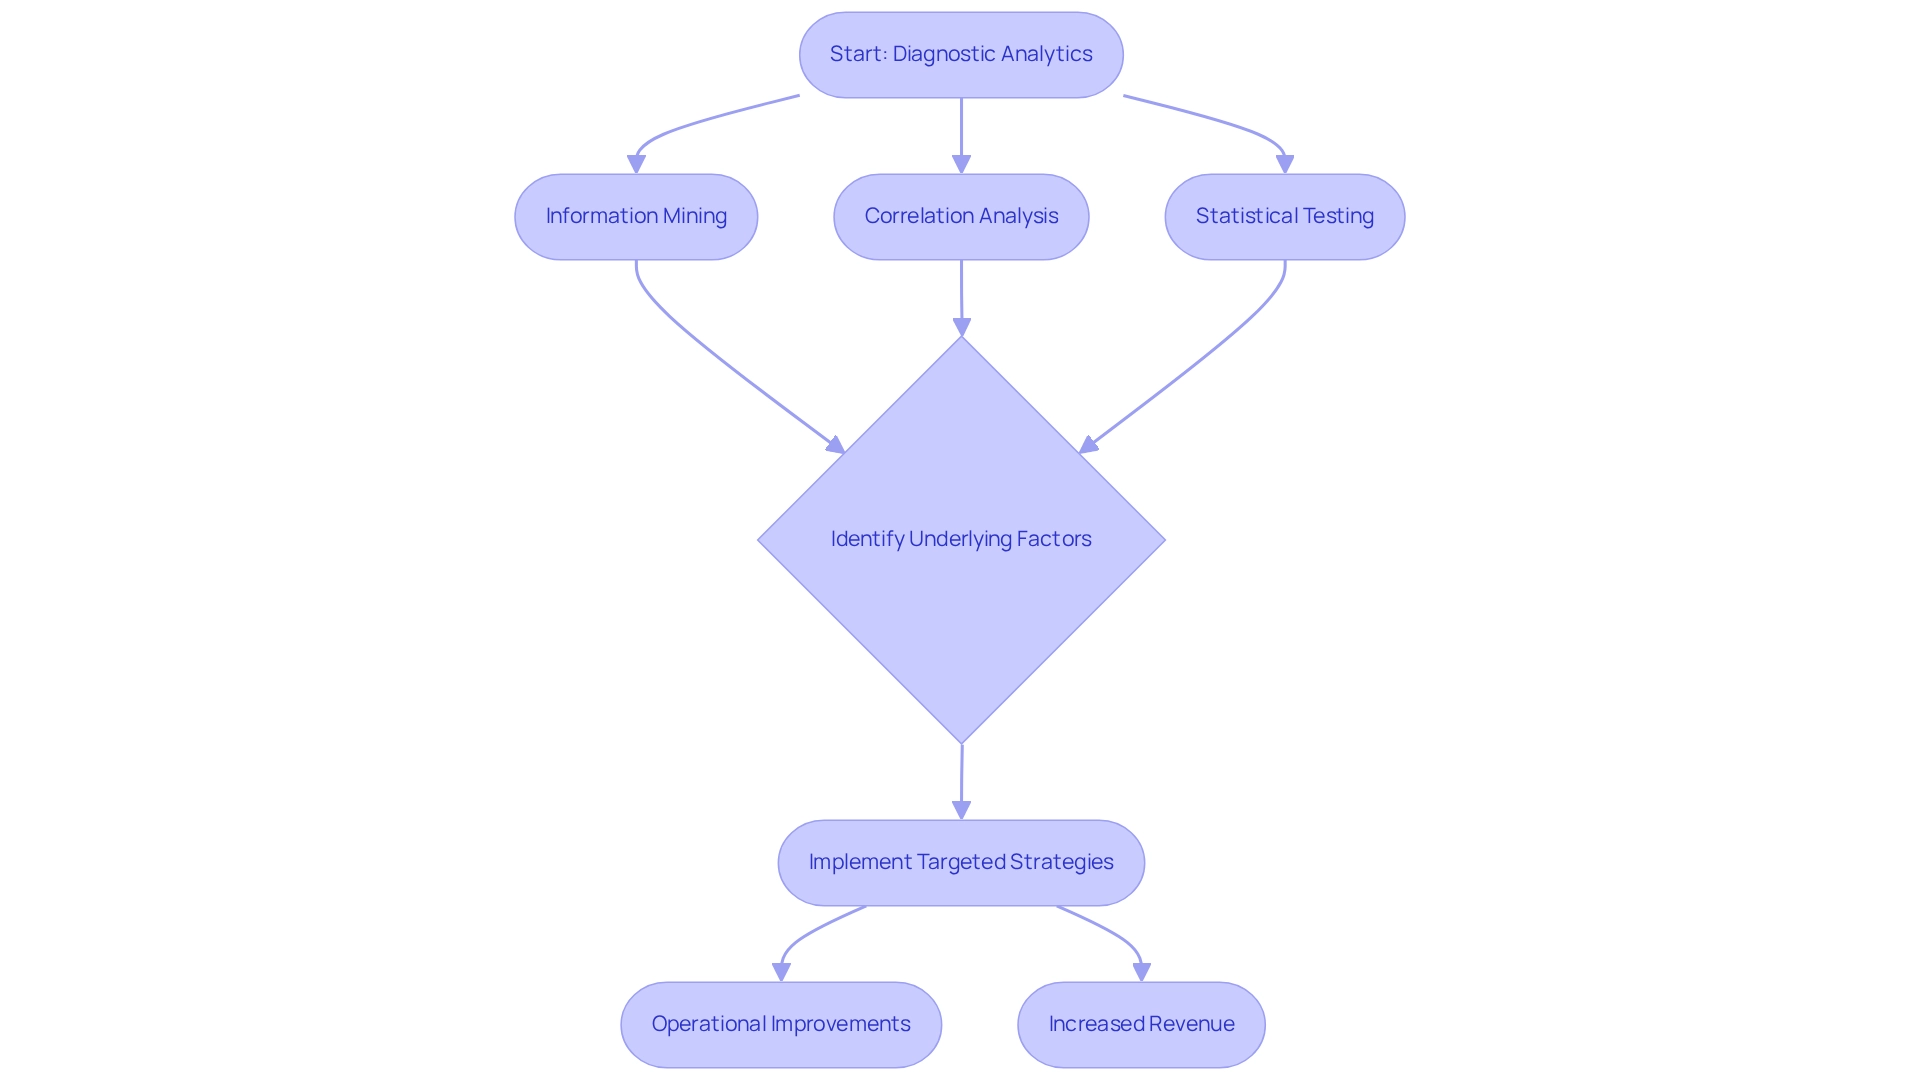
Diagnostic analysis transcends descriptive analysis by delving into the reasons behind previous results, effectively addressing critical inquiries such as ‘Why did this occur?’ and ‘What factors contributed to this result?’ This analytical approach employs a variety of techniques, including information mining, correlation analysis, and statistical testing, to unveil actionable insights.
For example, when a company experiences a sudden decline in sales, diagnostic evaluations can pinpoint whether the downturn stems from shifts in consumer behavior, heightened competition, or operational inefficiencies.
The significance of diagnostic evaluations in 2025 is paramount. It plays a vital role in enhancing operational efficiency, with studies indicating potential revenue boosts of up to 20% in marketing and sales processes. Organizations leveraging diagnostic analytics can identify common factors that lead to performance issues, such as customer dissatisfaction or supply chain disruptions, allowing them to implement targeted strategies to address these challenges.
A compelling case study illustrates this point: a mid-sized firm faced challenges like manual entry errors, sluggish software testing, and difficulties in integrating legacy systems without APIs. By adopting GUI automation, the company significantly improved efficiency by automating data entry, software testing, and legacy system integration. This initiative resulted in a 70% reduction in data entry errors, a 50% acceleration in testing processes, and an 80% enhancement in workflow efficiency, achieving ROI within six months.
Such examples underscore the capacity of diagnostic analysis to deliver substantial business outcomes.
Expert opinions further affirm the importance of this analytical method. Industry experts assert that diagnostic analysis is essential for uncovering insights that facilitate informed decision-making and operational improvements. Techniques like root cause analysis are crucial for understanding the underlying issues affecting performance, empowering organizations to devise effective solutions.
In an environment abundant with data, the ability to extract meaningful insights through diagnostic analysis is critical for enterprises aiming to thrive in a competitive landscape.
Additionally, the Analytics & Insights team at Seer employs both diagnostic and predictive analysis to enhance marketing strategies for clients, showcasing how diagnostic analysis fits within a broader analytical framework. Furthermore, AI platforms in healthcare enhance physicians’ access to the latest research and treatment methods, demonstrating the extensive impact of data analysis across various sectors. In 2025, the common elements identified through diagnostic analysis will continue to play a vital role in addressing operational inefficiencies, ensuring companies maintain their competitive edge.
Moreover, the implementation of Robotic Process Automation (RPA) can further streamline these processes, enabling organizations to automate repetitive tasks and focus on strategic initiatives.
Predictive Analytics: Forecasting Future Trends
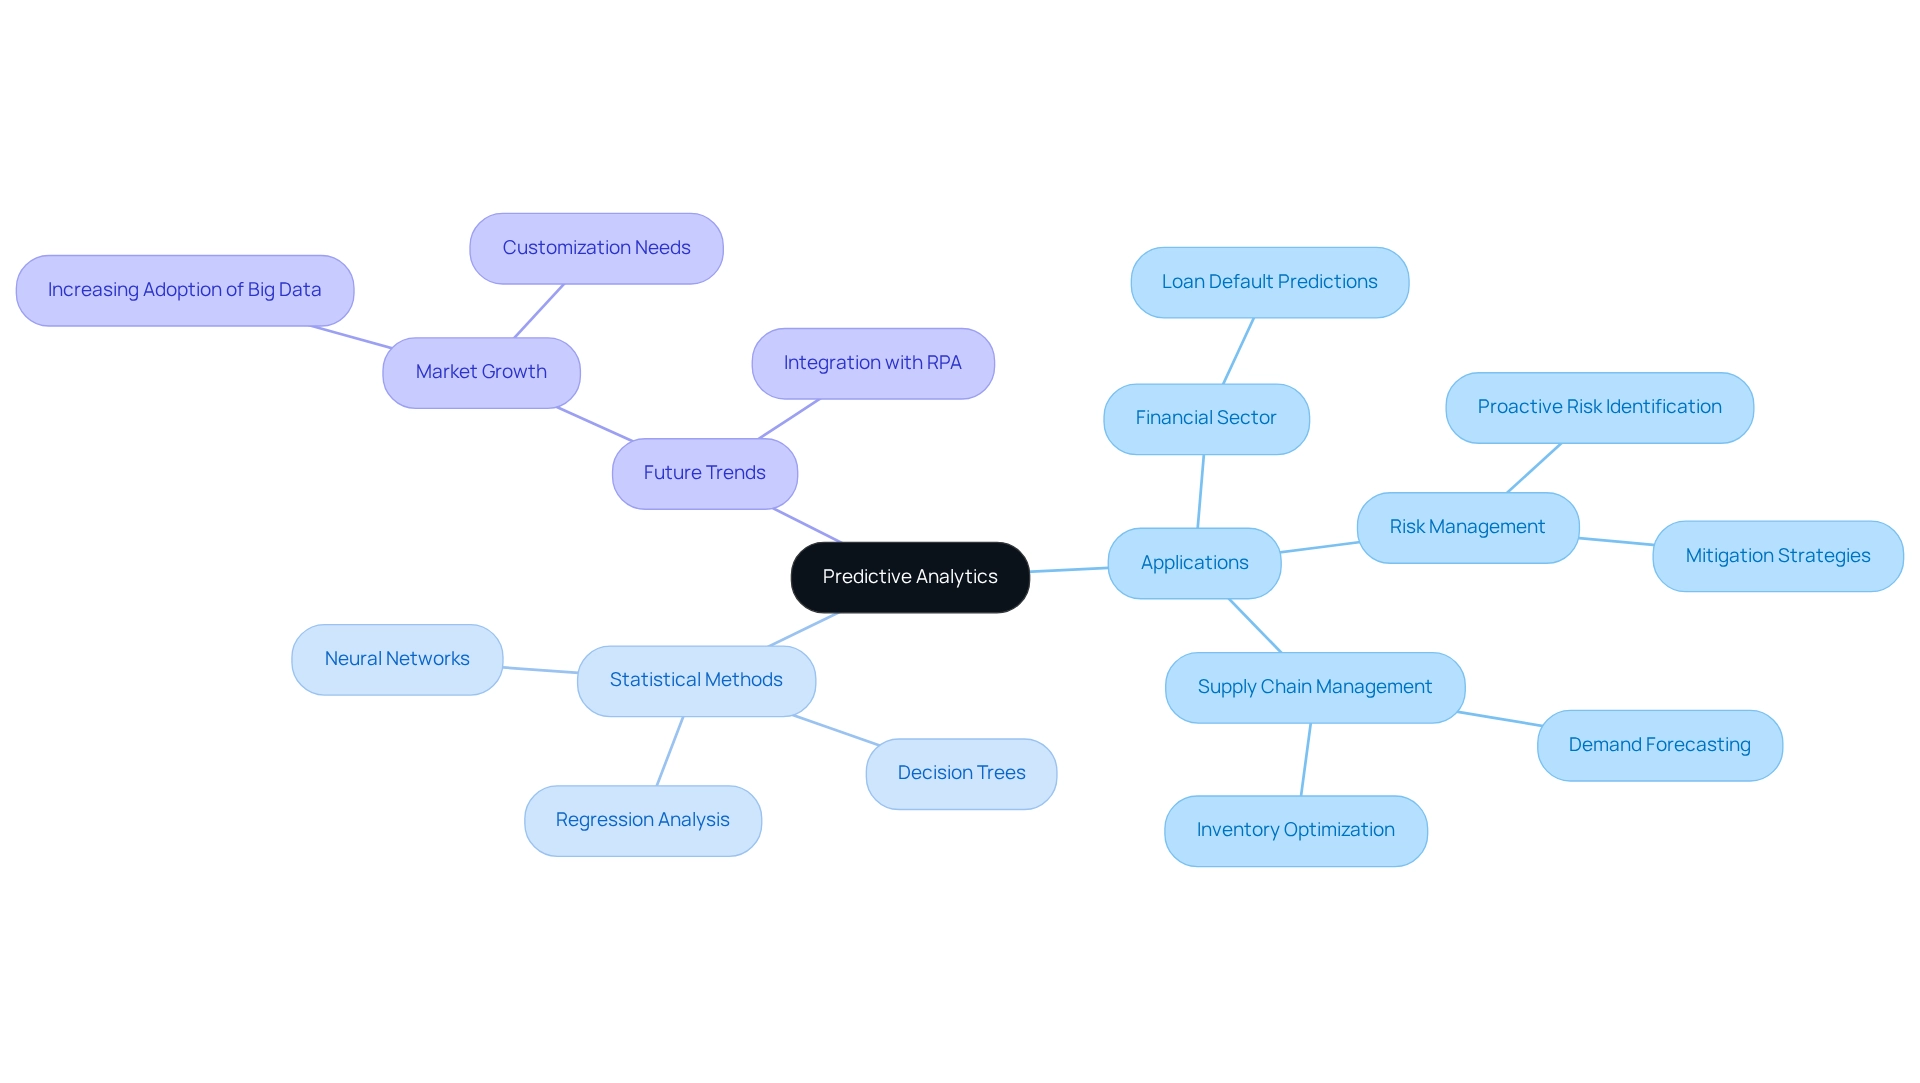
Predictive analysis harnesses historical information, statistical algorithms, and machine learning methods to forecast future results, playing a pivotal role in shaping business strategies. By meticulously examining patterns and trends from past data, organizations can make informed predictions about upcoming events. For example, financial institutions increasingly rely on predictive modeling to evaluate the likelihood of loan defaults, leveraging historical borrower behavior to refine decision-making processes.
By 2025, the adoption of predictive data analysis across various sectors has surged, with an impressive 76% of organizations integrating these technologies into their operations. This growth is primarily fueled by the escalating reliance on big data technologies and the demand for tailored solutions that tackle specific business challenges. The accuracy rates of predictive modeling systems have also improved significantly, with many organizations reporting precision levels exceeding 85% in their forecasts.
Expert insights underscore the importance of predictive analysis in risk management, where organizations can proactively identify potential risks and implement mitigation strategies. For instance, companies in the finance sector are utilizing predictive analysis to enhance their risk assessment frameworks, enabling them to navigate uncertainties more effectively.
Current trends indicate that predictive analysis is not only revolutionizing financial institutions but also extending its impact into supply chain management, empowering manufacturers to anticipate demand and optimize inventory levels. Organizations like Planet Fitness have recently partnered with Coherent Solutions to leverage advanced data analysis for enhancing customer insights, showcasing the flexibility of predictive modeling across diverse industries.
Common statistical algorithms employed in predictive modeling include:
- Regression analysis
- Decision trees
- Neural networks
Each contributing to the robustness of predictive models. As companies continue to embrace these technologies, the potential for predictive analysis to forecast future trends and shape strategic decision-making will only expand. As Coherent Solutions states, “Coherent Solutions is your reliable tech partner providing sophisticated information analysis services to reveal historical insights, patterns, and relationships that guide strategic decision-making.”
Moreover, the predictive insights market is expected to grow substantially, driven by increasing adoption of large-scale information technologies and customization needs, highlighting the dynamic nature of this sector. By integrating predictive insights with Robotic Process Automation (RPA) and customized AI solutions, enterprises can enhance their operational efficiency and make data-driven decisions that propel business growth.
Prescriptive Analytics: Guiding Decision-Making
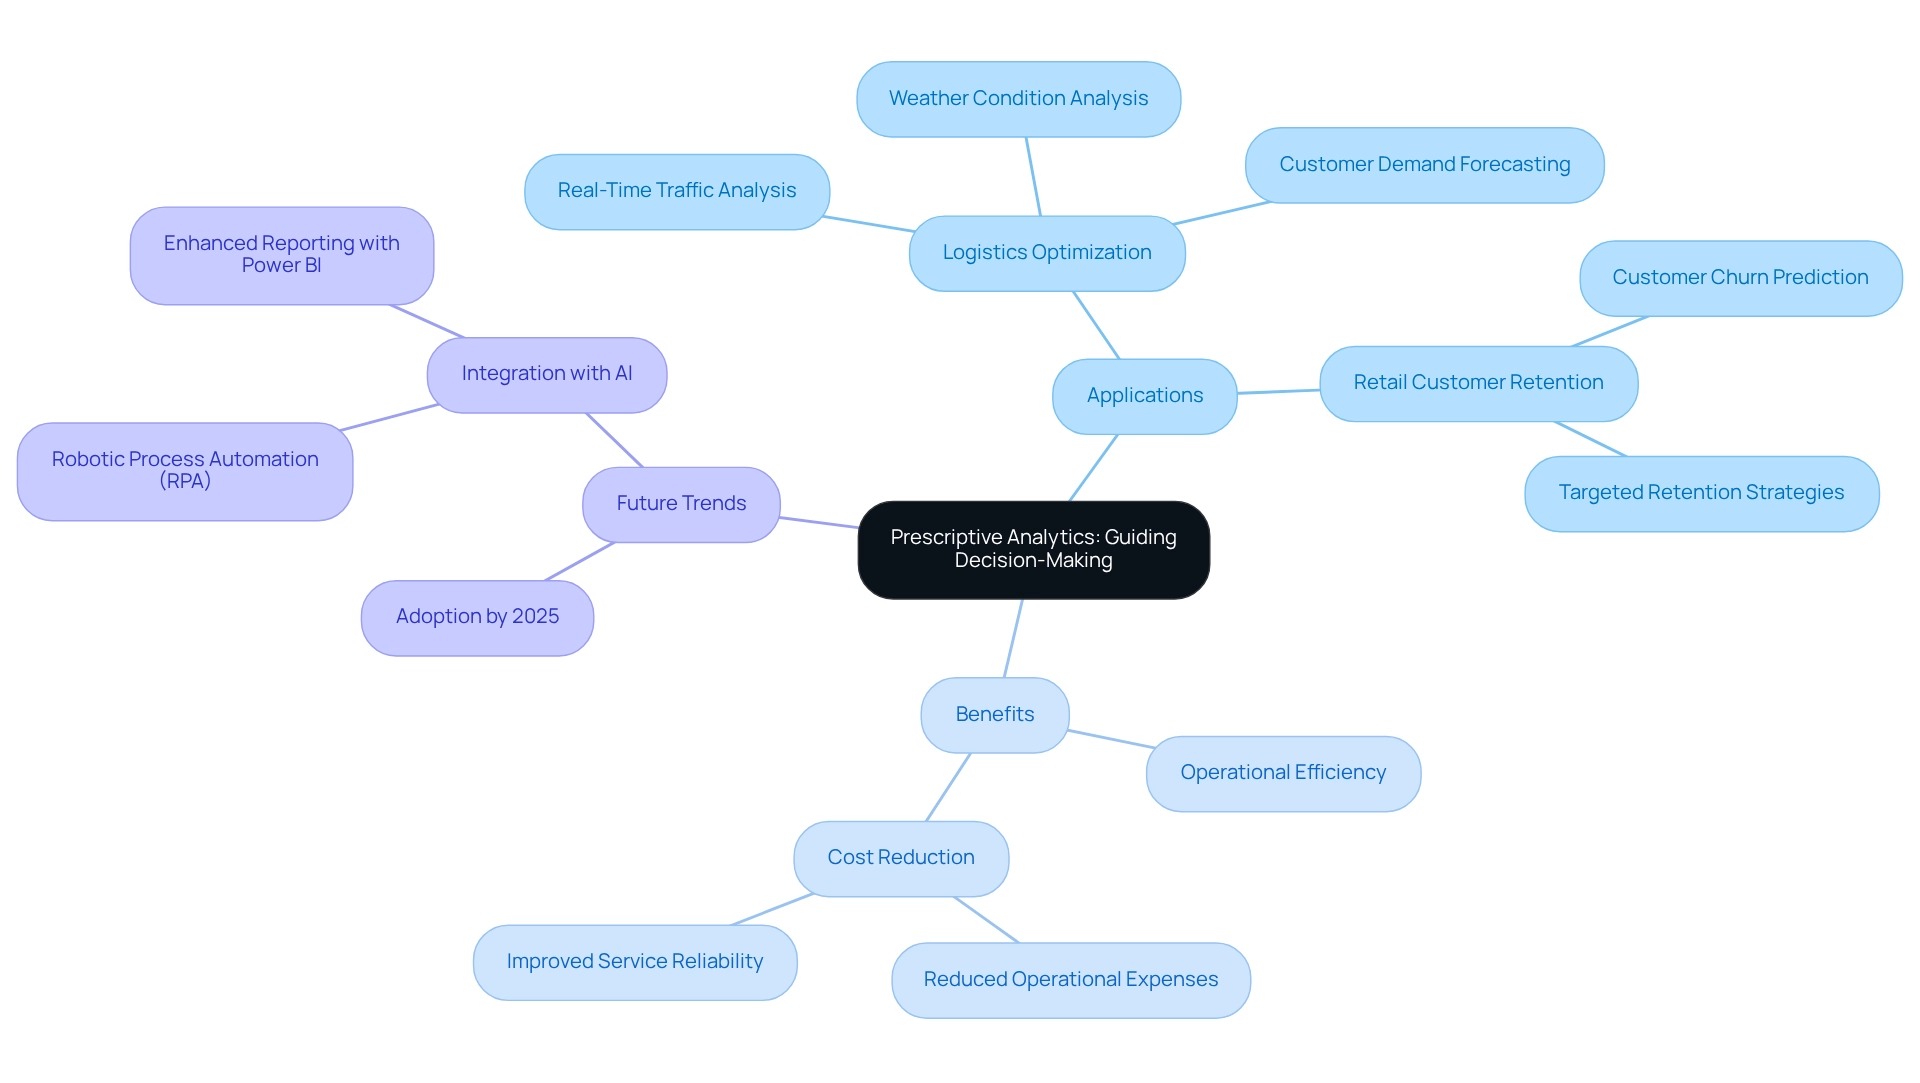
Prescriptive analysis represents the pinnacle of analytical capabilities, delivering actionable recommendations derived from comprehensive data examination. By leveraging insights from the three primary areas of analytics—descriptive, diagnostic, and predictive—organizations can identify the most effective courses of action. For example, in the logistics sector, prescriptive methods can optimize delivery routes by analyzing real-time traffic patterns, weather conditions, and customer demand.
This sophisticated analytical approach not only streamlines operations but also significantly enhances decision-making processes.
Looking ahead to 2025, the adoption of prescriptive data analysis in logistics is anticipated to increase. Studies indicate that firms utilizing these insights can reduce operational expenses by up to 15% while improving service reliability. This is particularly vital as businesses strive to maintain competitiveness in a data-driven environment. Additionally, organizations can track supplier performance and adjust procurement strategies through data analysis, further decreasing costs and enhancing service reliability.
Moreover, prescriptive data analysis empowers organizations to make informed decisions by providing tailored recommendations. For instance, it can propose inventory adjustments based on predictive models of customer behavior, ensuring that supply aligns with demand efficiently. A notable case study involves a retail company that successfully implemented prescriptive analytics to anticipate customer churn.
By identifying at-risk clients and recommending customized retention strategies, the firm significantly reduced churn rates, illustrating the tangible benefits of this analytical approach.
To enhance reporting and derive actionable insights, integrating Power BI services can be crucial. The 3-Day Power BI Sprint enables organizations to swiftly generate professionally designed reports, while the General Management App facilitates comprehensive management and intelligent reviews. Additionally, employing AI through Small Language Models and GenAI Workshops can improve information quality and provide practical training, ensuring that teams are equipped to effectively utilize these advanced insights.
Expert opinions underscore the necessity of integrating information science, domain expertise, and business acumen for the successful implementation of prescriptive insights. Davenport emphasizes that the effective execution and utilization of prescriptive analysis require this unique skill set. Continuous improvement of prescriptive models is essential, as maintaining information quality enhances their accuracy and relevance, ultimately driving operational efficiency and strategic decision-making in 2025 and beyond.
Furthermore, adopting Robotic Process Automation (RPA) can automate manual workflows, further boosting operational efficiency in an ever-evolving AI landscape, allowing teams to concentrate on more strategic, value-adding tasks.
Integrating Analytics for Operational Efficiency
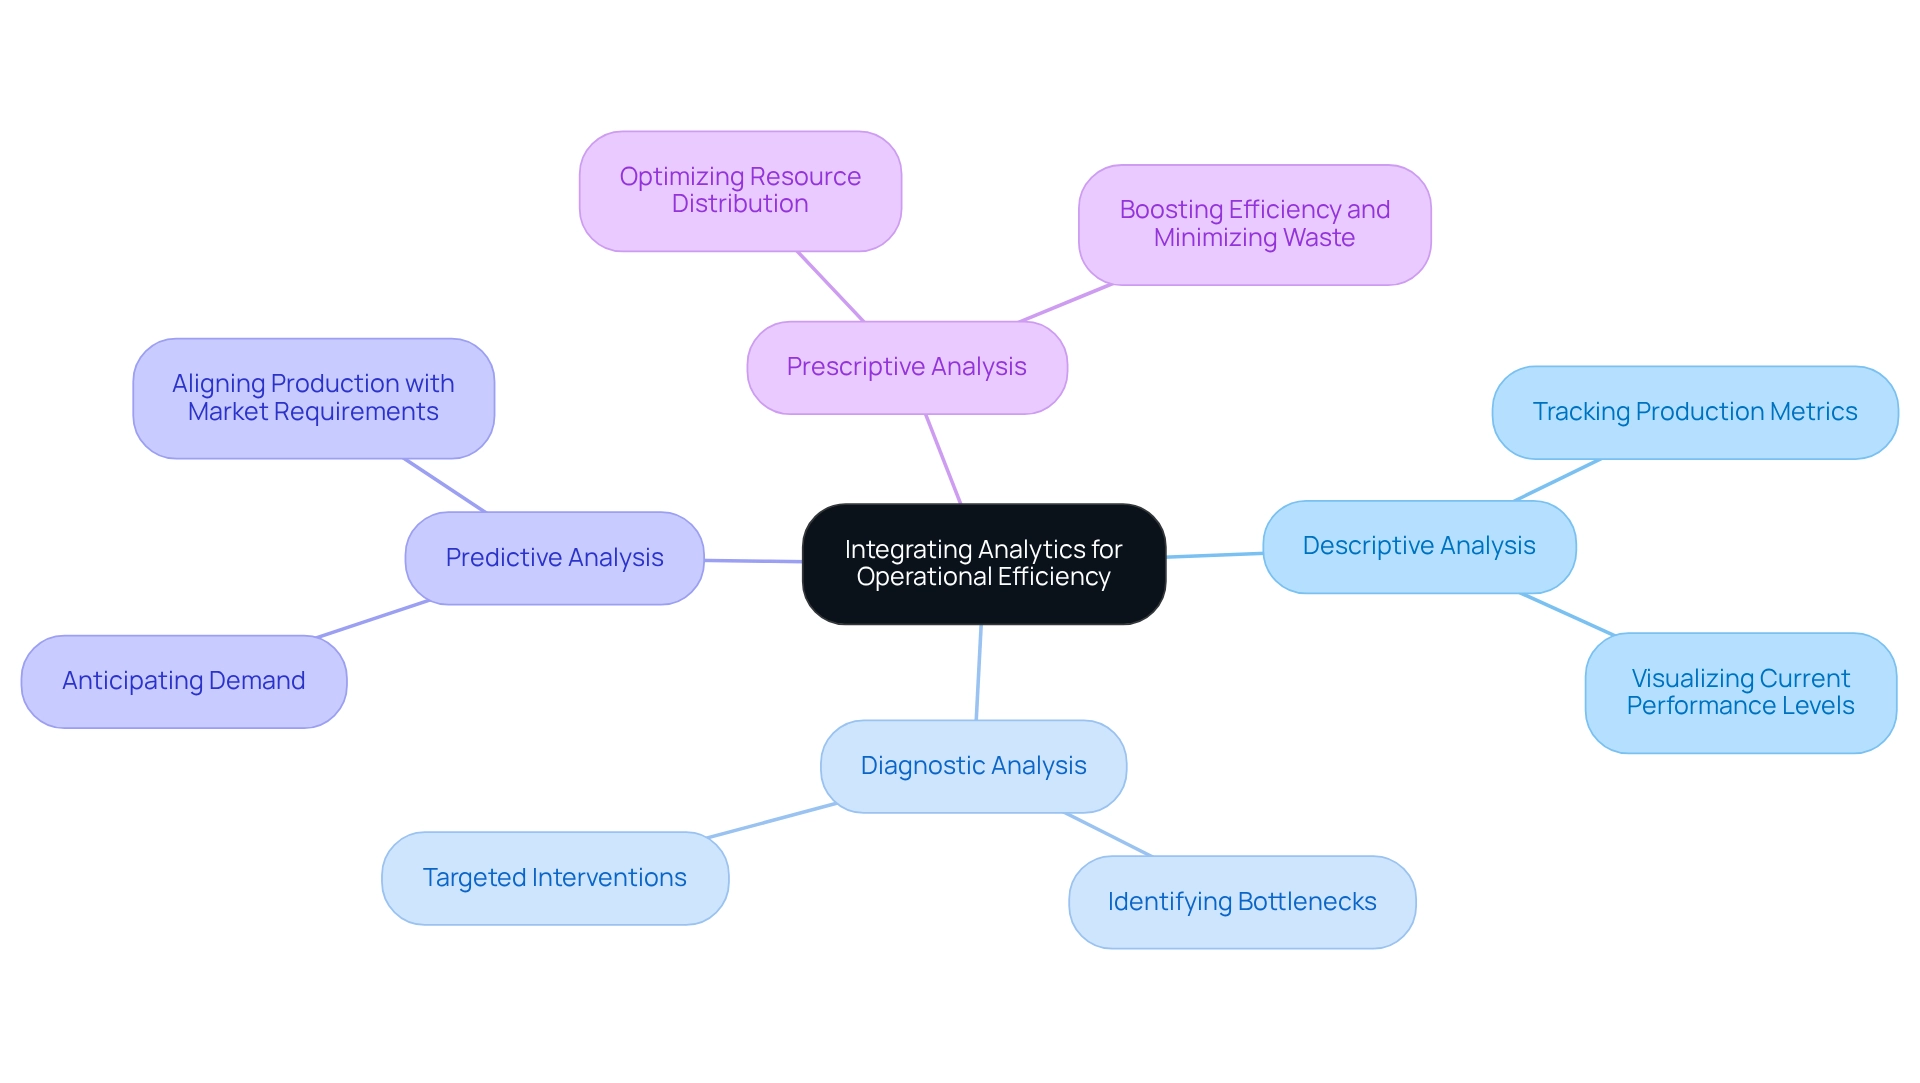
Integrating different types of analytics—descriptive, diagnostic, predictive, and prescriptive—forms the backbone of a comprehensive analytics framework. This prompts an essential question: what are the three primary areas of analytics that empower organizations to unlock deeper insights into their operations? This method not only aids in recognizing inefficiencies but also promotes the execution of evidence-based strategies that can significantly enhance operational effectiveness.
Consider a mid-sized company grappling with challenges such as manual information entry mistakes, slow software testing, and difficulties integrating outdated systems. By automating data entry, software testing, and legacy system integration through GUI automation, the company enhanced its operational efficiency. Utilizing descriptive analysis, it tracked production metrics, enabling visualization of current performance levels.
Employing diagnostic analysis allowed the identification of specific bottlenecks, leading to targeted interventions. Predictive analysis enabled the company to anticipate demand accurately, ensuring production aligned with market requirements. Ultimately, prescriptive analytics provided practical recommendations for optimizing resource distribution, effectively boosting efficiency and minimizing waste.
The combination of these analytics forms is increasingly crucial, especially as the number of Internet of Things (IoT) devices is projected to rise from 16 billion in 2023 to 20.3 billion by 2025, generating an impressive 79.4 zettabytes of data. This surge presents both opportunities and challenges for businesses, which must effectively manage and analyze the complex information generated to remain competitive. Organizations that adeptly navigate this information landscape will be better positioned to leverage insights for operational improvements.
However, a report indicates that 61% of employees perceive their organization’s information analysis approach as siloed, potentially leading to missed collaboration opportunities. Customized solutions, such as Robotic Process Automation (RPA), can help dismantle these barriers, ensuring information flows seamlessly between departments and enhancing overall efficiency.
Practical examples illustrate the success of a comprehensive analytical framework. Companies that have effectively integrated various forms of analysis report improved decision-making processes and enhanced operational efficiency. For instance, the aforementioned mid-sized firm reduced entry mistakes by 70%, accelerated testing procedures by 50%, and increased workflow productivity by 80% through automation.
Aligning data initiatives with broader objectives can mitigate the risk of failure—evident in studies showing that 70% of data projects do not achieve their intended outcomes due to misalignment. This alignment is vital for ensuring that analytical efforts contribute significant value to strategic goals.
In conclusion, incorporating diverse forms of analysis not only enhances operational efficiency but also fosters a culture of continuous improvement, enabling organizations to adapt swiftly to evolving market conditions and promote sustainable growth.
Leveraging Analytics for Business Intelligence
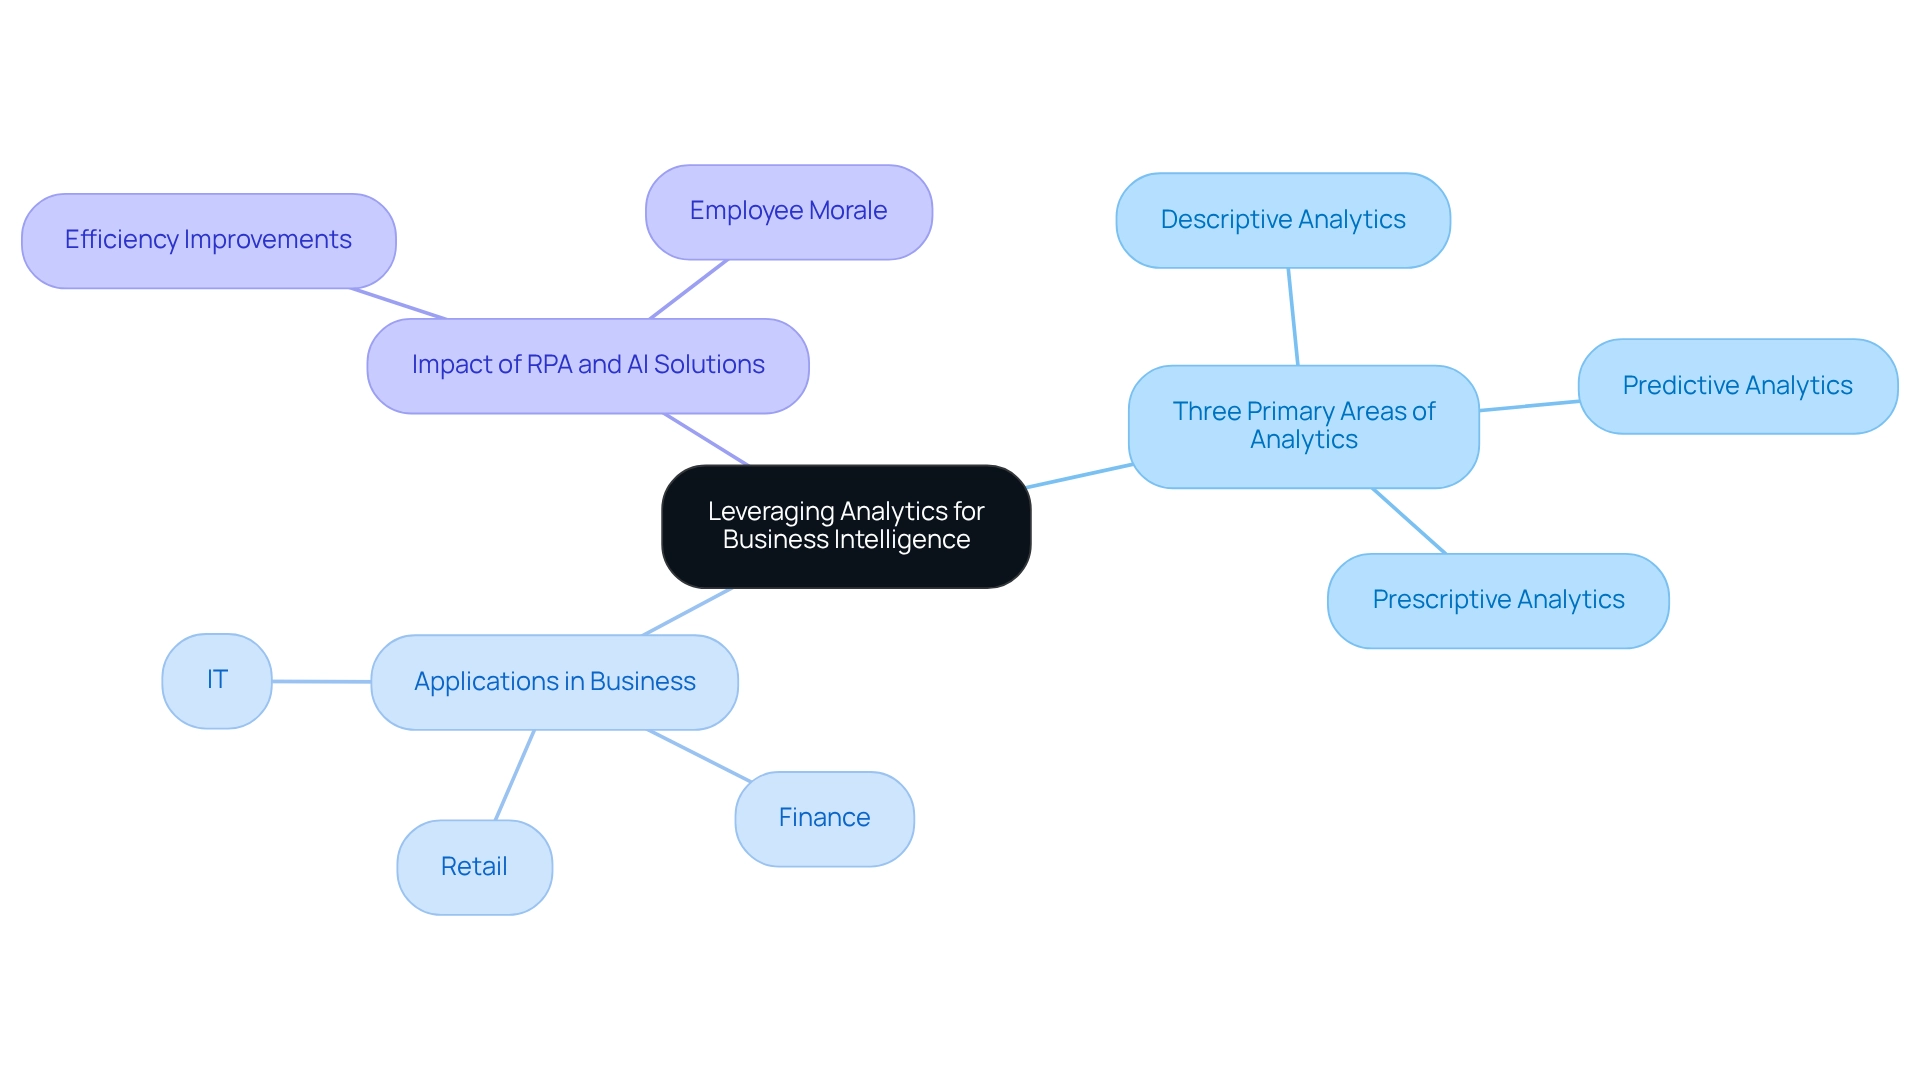
Analytics serves as a fundamental pillar of organizational intelligence (BI), offering essential insights that empower entities to understand the three primary areas of analytics and make informed choices. Data analysis enables businesses to reveal trends, evaluate performance, and direct strategic initiatives. For instance, retail chains utilize data analysis to scrutinize customer purchasing behaviors, directly influencing inventory management and marketing strategies.
This analytical approach not only enhances operational efficiency but also fosters a competitive advantage in the marketplace. It raises the question of what the three primary areas of analytics should be considered, especially with the integration of Robotic Process Automation (RPA) solutions like EMMA RPA and Microsoft Power Automate. These tools significantly enhance efficiency and employee morale by automating repetitive tasks. EMMA RPA specifically tackles task repetition fatigue, while Microsoft Power Automate alleviates staffing shortages, enabling organizations to concentrate on strategic initiatives.
Furthermore, edge computing plays a vital role in monitoring safety risks and enhancing project management, prompting further reflection on the three primary areas of analytics that can improve operational processes. As the demand for information engineers is expected to expand at an impressive rate of 50% each year, this highlights the significance of understanding the three primary areas of analytics in the sector. According to IBM, finance and insurance, professional services, and IT sectors represent 59% of job demand for science and analysis, emphasizing the importance of these analytics areas.
Organizations are increasingly embracing cloud-based BI solutions, such as the Power BI services provided by Creatum, which offer scalability and adaptability. A recent testimonial from Sascha Rudloff, Team Leader of IT and Process Management at PALFINGER Tail Lifts GMBH, emphasizes the transformative influence of Creatum’s Power BI Sprint. This solution not only provided a readily usable Power BI report but also accelerated their analysis strategy. This success narrative illustrates how sophisticated analysis and customized AI solutions, including Small Language Models and GenAI Workshops, can enhance information quality and address governance challenges in business reporting, ultimately improving decision-making.
As entities increasingly embrace sophisticated analysis, they become better equipped to react to market dynamics and promote sustainable growth. This aligns with the entity’s emphasis on implementing robotic process automation (RPA) and customized AI solutions. To explore how these solutions can benefit your company, book a free consultation today.
Overcoming Challenges in Analytics Implementation
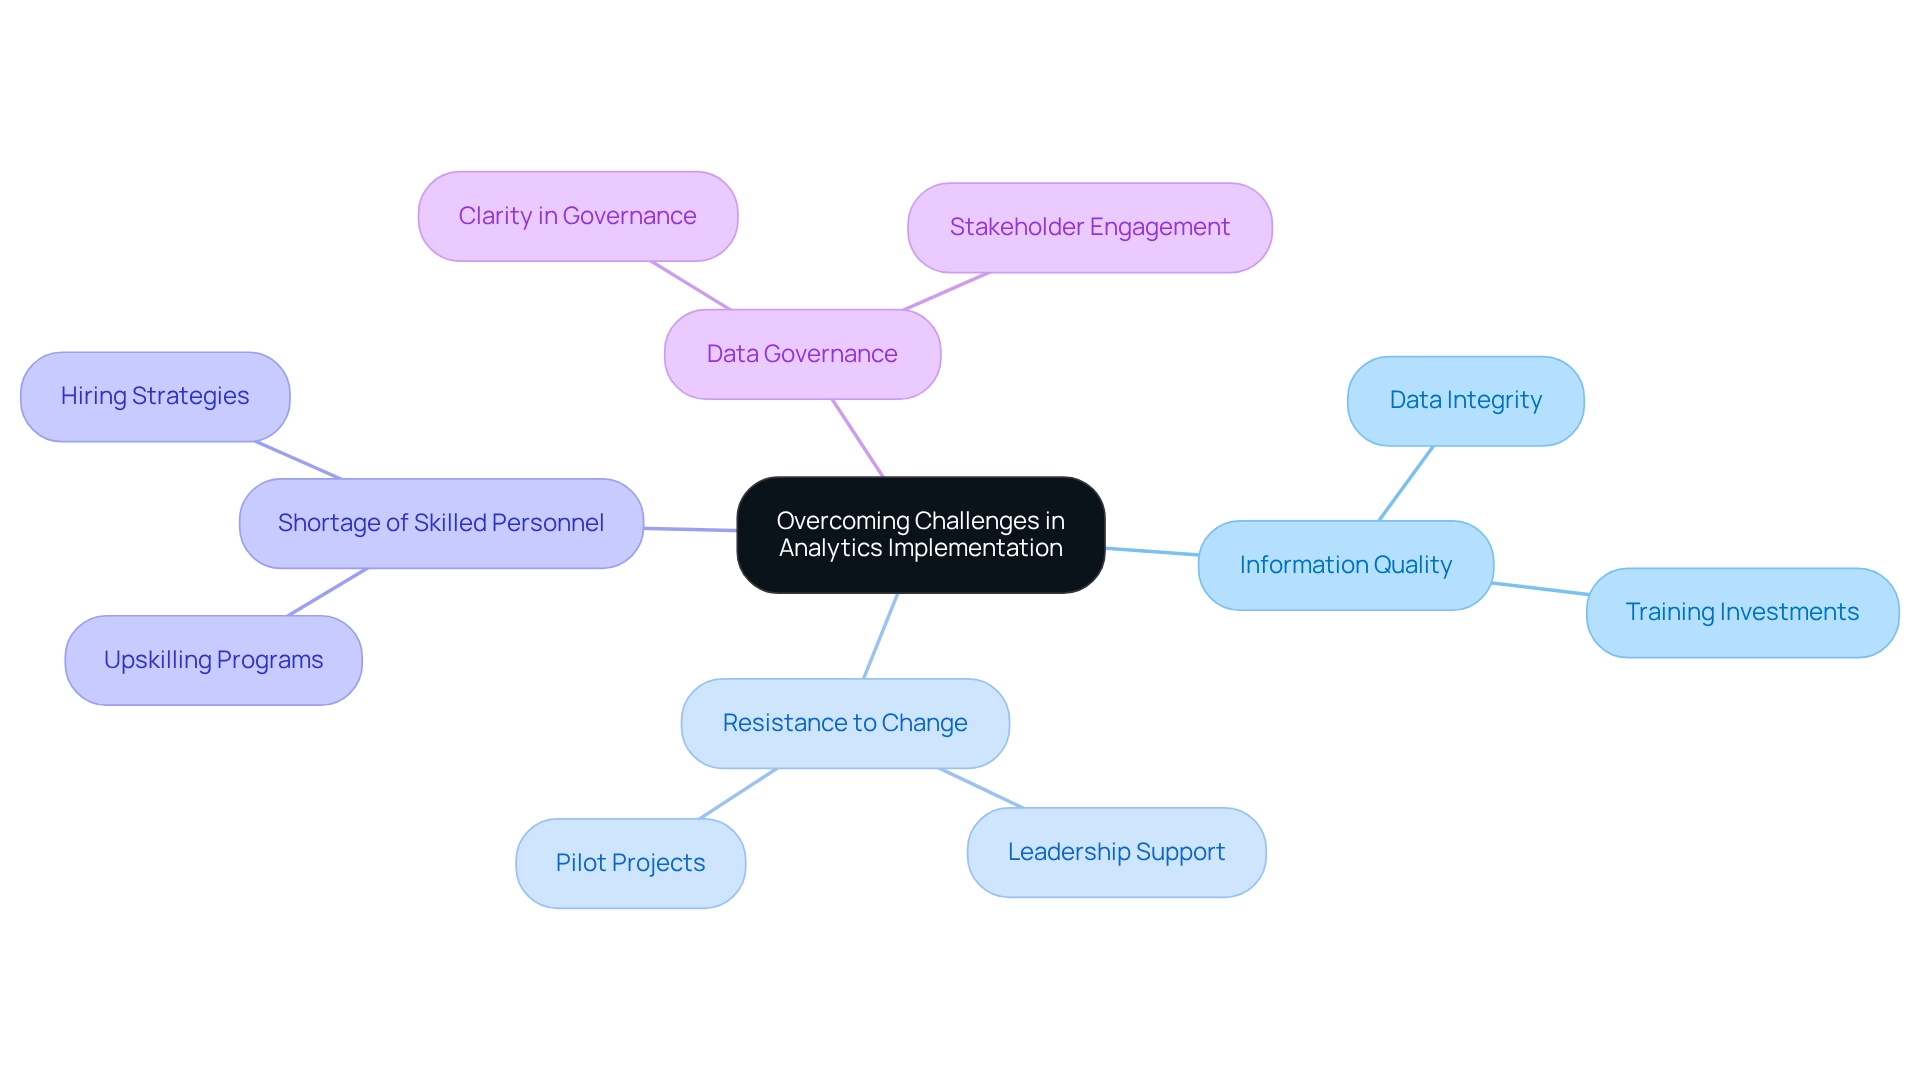
Integrating analysis within a company often encounters significant challenges, particularly concerning information quality, resistance to change, and a shortage of skilled personnel. As we approach 2025, the impact of information quality on analytics success is increasingly critical; disorganized information can undermine even the most well-intentioned AI implementation strategies. To overcome these challenges, organizations must foster a strong culture of data-driven decision-making.
This necessitates not only investing in training to bolster skills but also ensuring data integrity at every level of the organization. Leadership is pivotal in this transformation. By championing analytics adoption through pilot projects and highlighting success stories, leaders can effectively illustrate the tangible benefits of data-driven strategies. For instance, organizations that have successfully cultivated a data-driven culture often report enhanced operational efficiency and improved decision-making capabilities.
The integration of generative AI technologies, such as multi-agent AI systems and graphical neural networks, has the potential to revolutionize operational processes, offering practical applications that strengthen core competencies. Statistics reveal that by 2026, over three-quarters of businesses’ standard information architectures will incorporate streaming information and event processing, underscoring the urgency for organizations to adapt. However, many initiatives falter due to an internal focus that fails to deliver substantial value, as highlighted in recent discussions about the challenges surrounding information products. This reassessment of effectiveness calls for a renewed commitment to aligning data initiatives with broader business objectives.
As Amani Undru, a BI & Data Strategist at ThoughtSpot, observed, “In contrast, just 11% of planners feel they are ahead of the competition, emphasizing the urgency for them to take action.”
Common obstacles in data implementation include a lack of clarity in data governance and insufficient stakeholder engagement. By addressing these issues head-on and leveraging expert insights, organizations can overcome barriers and unlock the full potential of their analytics initiatives. The adoption of Robotic Process Automation (RPA) can streamline workflows, enhancing efficiency and minimizing errors, while customized AI solutions can assist organizations in identifying the right technologies that align with their specific business goals.
Ultimately, fostering a culture that prioritizes data-driven decision-making is essential for driving growth and innovation in today’s data-rich landscape. Tailored solutions that enhance information quality and facilitate AI implementation are crucial in this endeavor.
The Future of Analytics: Trends and Innovations
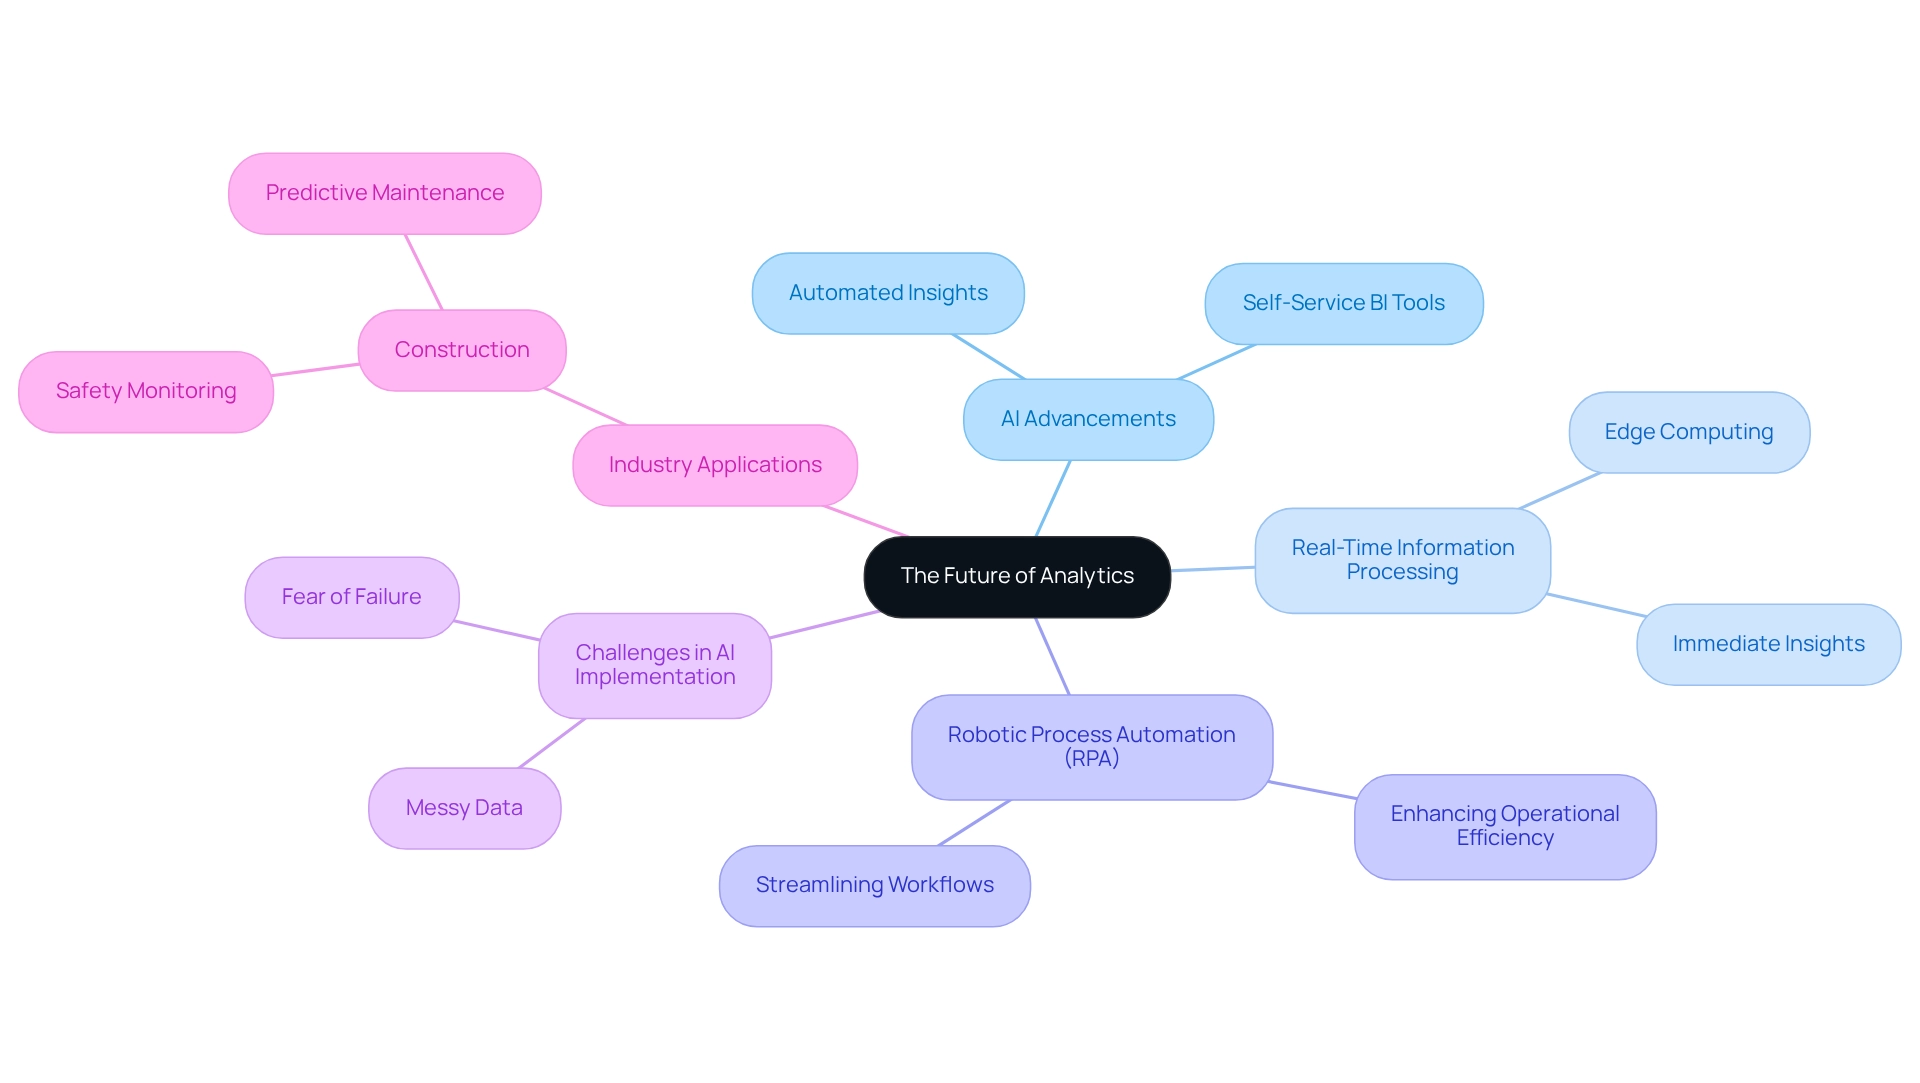
The terrain of analysis is on the verge of a significant transformation, primarily driven by advancements in artificial intelligence, machine learning, and large-scale information technologies. Key trends such as enhanced analysis and real-time information processing are emerging as crucial influences that will reshape how companies employ information. However, obstacles such as messy data and fear of failure can derail AI implementation plans, making it crucial for companies to tackle these challenges.
For instance, Robotic Process Automation (RPA) from Creatum GmbH can significantly streamline manual workflows, enhancing operational efficiency by reducing errors and freeing up teams for more strategic tasks. The incorporation of AI into data analysis tools is allowing companies to automate insights, greatly improving their decision-making abilities. As companies embrace these innovations, they can anticipate enhanced operational efficiency and a stronger competitive stance in their sectors.
In 2025, the influence of AI on data analysis will be significant, with a remarkable transition towards self-service business intelligence (BI) tools that streamline performance monitoring. This evolution is underscored by the fact that 48% of early adopters in the U.S. and Canada cite increased data-analyst efficiency as their primary motivation for embracing generative AI. Additionally, contemporary self-service BI tools enhance performance monitoring by elucidating the distinctions between KPIs and metrics, enabling entities to assess success more efficiently.
Real-time information processing will also play a vital role in forming the future of analysis, especially in industries that require immediate insights, such as construction. For example, edge computing enables the processing of user information close to its origin, facilitating quicker decision-making and improving project management through better safety oversight and predictive maintenance.
As organizations keep utilizing augmented analytics for innovation, they will not only improve their information quality but also ease the complexities related to AI implementation. By embracing these emerging trends, including tailored AI solutions and RPA from Creatum GmbH, businesses can transform raw data into actionable insights, driving growth and fostering a culture of informed decision-making. To see how these technologies can be applied in real-world scenarios, explore our case studies that highlight successful implementations.
Conclusion
Integrating various forms of analytics—descriptive, diagnostic, predictive, and prescriptive—profoundly enhances operational efficiency and fosters a culture of continuous improvement within organizations. Leveraging these diverse analytical approaches enables businesses to identify inefficiencies and implement data-driven strategies that propel growth and innovation. As organizations increasingly adopt self-service BI tools and embrace AI technologies, the transformation of raw data into actionable insights becomes more accessible, allowing teams to make informed decisions swiftly.
Moreover, the importance of cultivating a data-driven culture cannot be overstated. Leadership plays a critical role in championing analytics adoption, ensuring that data integrity and quality are prioritized across all levels. By addressing common challenges—such as data governance and stakeholder engagement—organizations can unlock the full potential of their analytics initiatives. This enables them to navigate the complexities of a rapidly evolving data landscape and remain competitive.
Looking ahead, the future of analytics is poised for significant advancements driven by innovations in AI and machine learning. The emergence of augmented analytics and real-time data processing will redefine how organizations utilize data, enhancing decision-making capabilities and operational efficiency. By embracing these trends and leveraging tailored solutions, businesses can improve their analytics frameworks and drive sustainable growth in an increasingly data-centric world. In this evolving landscape, the ability to harness analytics effectively will be a key differentiator for organizations aiming to thrive in the years to come.
Frequently Asked Questions
What is analytics and why is it important for organizations?
Analytics involves the systematic examination of information and statistics, helping organizations navigate complex data landscapes. It is crucial for informed decision-making, enhancing operational efficiency, driving innovation, and achieving strategic goals.
What are the current trends in data analysis for businesses?
There is a significant shift towards self-service business intelligence tools that simplify performance tracking. Additionally, the integration of Robotic Process Automation (RPA) helps automate manual workflows, allowing teams to focus on strategic tasks.
How does data analysis impact operational efficiency?
Data analysis improves operational efficiency by identifying patterns and trends, which helps organizations make informed decisions. Case studies show that companies using AI in data analytics gain a competitive edge, with potential productivity increases predicted by experts.
What role does descriptive analysis play in business decision-making?
Descriptive analysis interprets historical data to summarize past occurrences and provide actionable insights. It uses metrics and visual representations to help organizations understand trends, such as sales patterns, which can inform inventory management and marketing strategies.
What are the key metrics used in descriptive analysis?
Common metrics in descriptive analysis include key performance indicators (KPIs) such as sales volume, customer retention rates, and inventory turnover.
How has the adoption of analytics dashboards impacted firms?
The use of analytics dashboards has surged by over 45% among leading firms, providing a centralized platform for data visualization that streamlines decision-making and enhances oversight of market dynamics.
What is diagnostic analysis and how does it differ from descriptive analysis?
Diagnostic analysis goes beyond descriptive analysis by exploring the reasons behind past results. It employs techniques like information mining and correlation analysis to answer questions about performance issues, such as declines in sales.
What benefits can organizations gain from diagnostic analysis?
Organizations can potentially boost revenue by up to 20% in marketing and sales processes through diagnostic analysis. It helps identify common factors leading to performance issues, allowing targeted strategies to be implemented.
Can you provide an example of how diagnostic analysis has improved efficiency?
A mid-sized firm improved efficiency by adopting GUI automation to address manual entry errors and sluggish processes, resulting in a 70% reduction in data entry errors and a 50% acceleration in testing processes.
What is the future significance of data analysis in business?
As data continues to grow, the importance of data analysis will increase, enabling organizations to extract meaningful insights and maintain a competitive edge. The integration of RPA will further streamline processes, allowing a focus on strategic initiatives.

