Overview
SSAS performance monitoring in Power BI is essential for enhancing operational efficiency and ensuring timely report generation. By tracking key metrics such as query execution times and report load durations, organizations can gain valuable insights. Effective monitoring not only identifies performance bottlenecks but also supports data-driven decision-making. This, in turn, drives business growth and improves user experience through real-time insights. \n\nConsider the impact of not monitoring these metrics. How can businesses make informed decisions without understanding their data performance? By prioritizing SSAS monitoring, companies can harness the power of their data, leading to improved operational outcomes and strategic advantages. \n\nIn conclusion, implementing robust SSAS performance monitoring is not merely an option; it is a necessity for organizations aiming to thrive in a data-driven landscape. Take action now to ensure your reporting processes are optimized and aligned with business objectives.
Introduction
In the dynamic landscape of data analytics, the integration of SQL Server Analysis Services (SSAS) with Power BI stands as a pivotal advancement for organizations aiming to refine their decision-making processes. This robust combination not only facilitates the development of sophisticated data models but also empowers real-time analytics, enabling businesses to fully harness their data’s potential. As companies increasingly depend on data-driven insights to sustain a competitive edge, grasping the complexities of SSAS and Power BI becomes imperative.
From optimizing performance to resolving common integration challenges, organizations can markedly enhance their operational efficiency by embracing best practices and leveraging cutting-edge technologies. This article explores the essential elements of SSAS and Power BI integration, providing valuable insights and strategies for businesses striving to excel in an ever-evolving digital landscape.
Understanding SQL Server Analysis Services and Power BI Integration
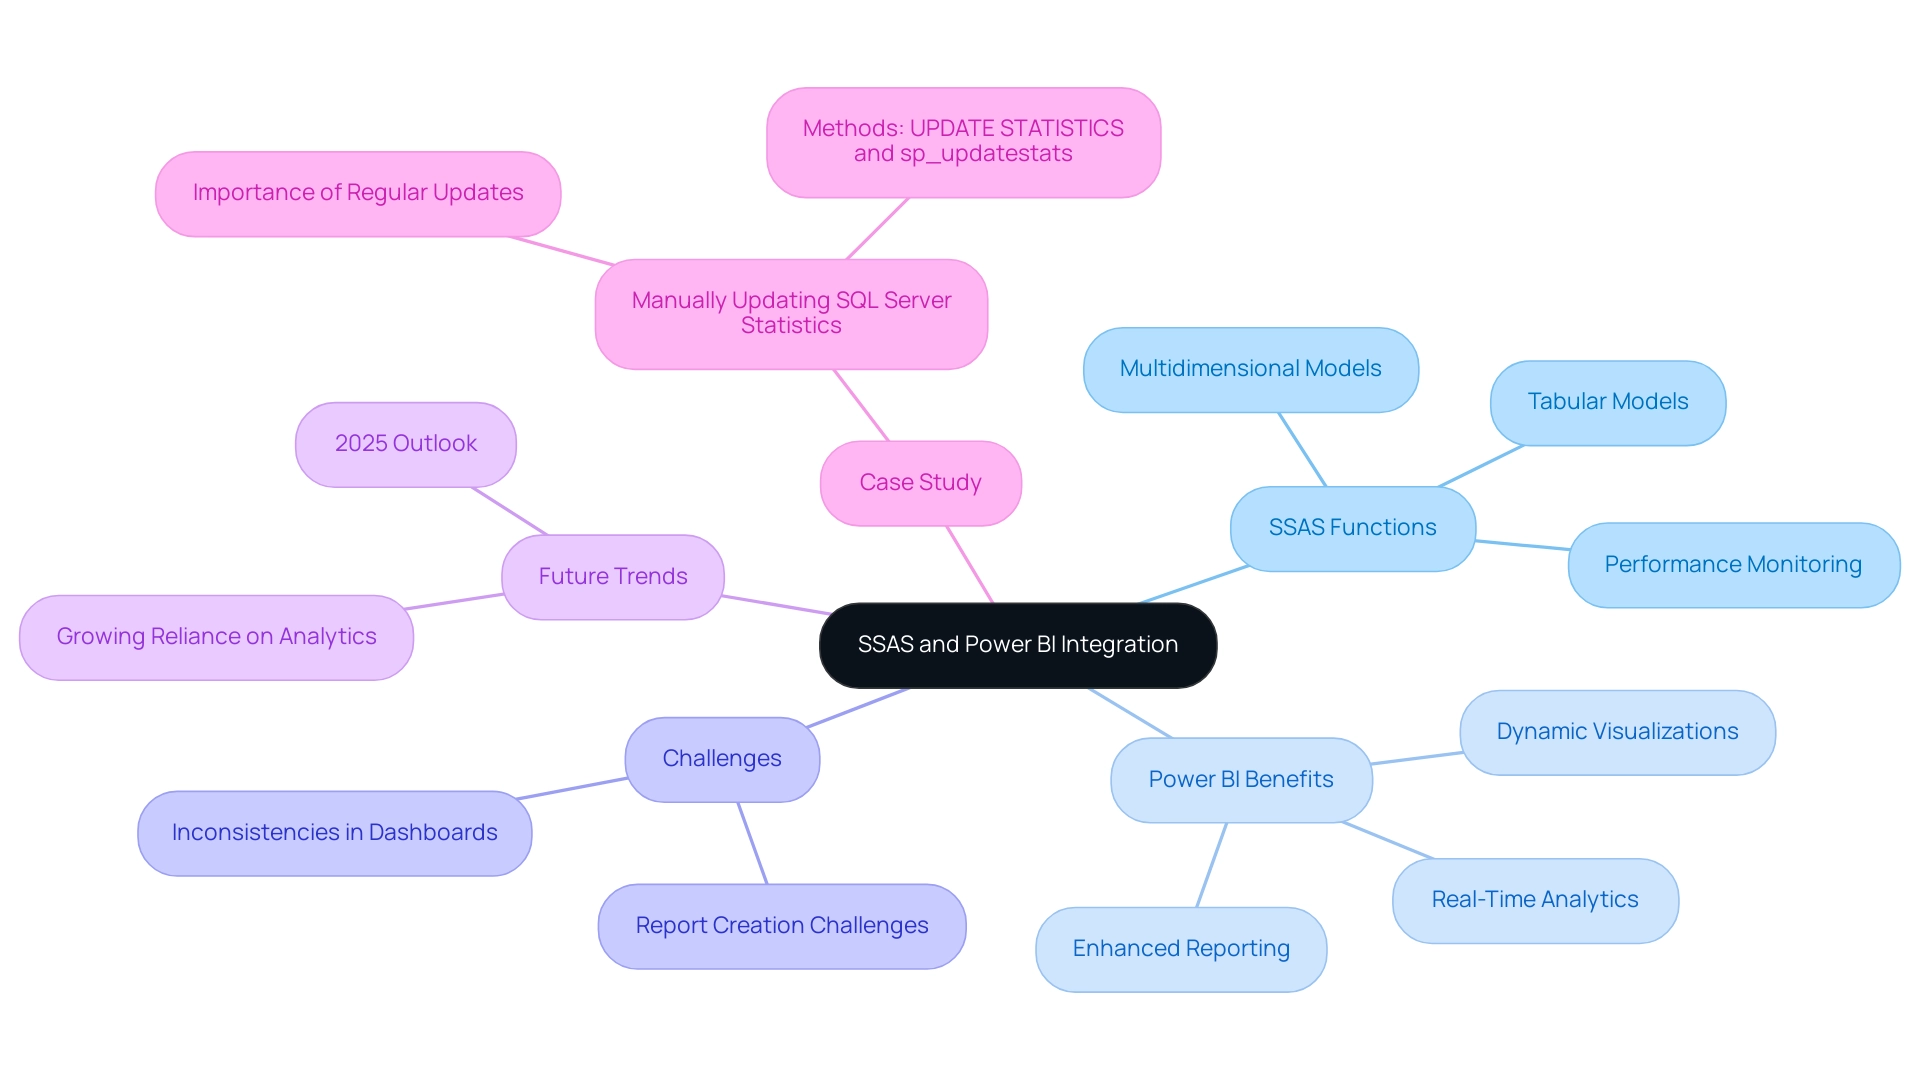
SQL Server Analysis Services (SSAS) serves as a powerful analytical engine, expertly designed to bolster decision-making and business analytics. It empowers users to construct both multidimensional and tabular information models, which can be seamlessly integrated with Business Intelligence (BI) to enhance reporting and analytics capabilities. This integration is crucial for efficient SSAS performance monitoring through Power BI, enabling organizations to fully leverage their information’s potential.
By linking BI to SSAS, users can adeptly query extensive datasets, facilitating intricate analyses and dynamic visualizations. Notably, the 3-Day Business Intelligence Sprint offers a rapid solution for generating professionally crafted reports, significantly improving the speed and effectiveness of reporting processes. Additionally, the General Management App provides comprehensive management and intelligent reviews, ensuring that actionable insights are readily available for informed decision-making.
This integration supports real-time analytics, positioning it as an invaluable asset for organizations seeking to enhance their data-driven decision-making processes via SSAS performance monitoring in Power BI. Moreover, with Automate, businesses can streamline workflows, delivering risk-free ROI assessments and professional execution for operational efficiency. However, challenges remain in harnessing insights from BI dashboards, particularly the time-consuming nature of report creation and inconsistencies that can hinder effective decision-making.
As part of our offerings, we present an Actions portfolio and encourage you to schedule a free consultation to explore how we can assist you in overcoming these challenges. As Paul Turley, a Microsoft Data Platform MVP, aptly notes, ‘Same best practice guidelines… different scale, and different focus,’ emphasizing the adaptability of these practices across diverse organizational contexts. Looking ahead to 2025, the integration of SSAS with Business Intelligence is increasingly relevant, especially given that a significant portion of Microsoft SQL Server Analysis Services customers are medium to large enterprises, with 1,036 companies employing between 1,000 and 4,999 employees.
This trend underscores the growing reliance on robust analytics solutions to drive business success. Furthermore, a case study on manually refreshing SQL Server statistics illustrates the importance of routinely updating statistics to ensure that the query optimizer possesses the most current data distribution details, which is essential for maintaining optimal query efficiency.
The Importance of Performance Monitoring in Power BI
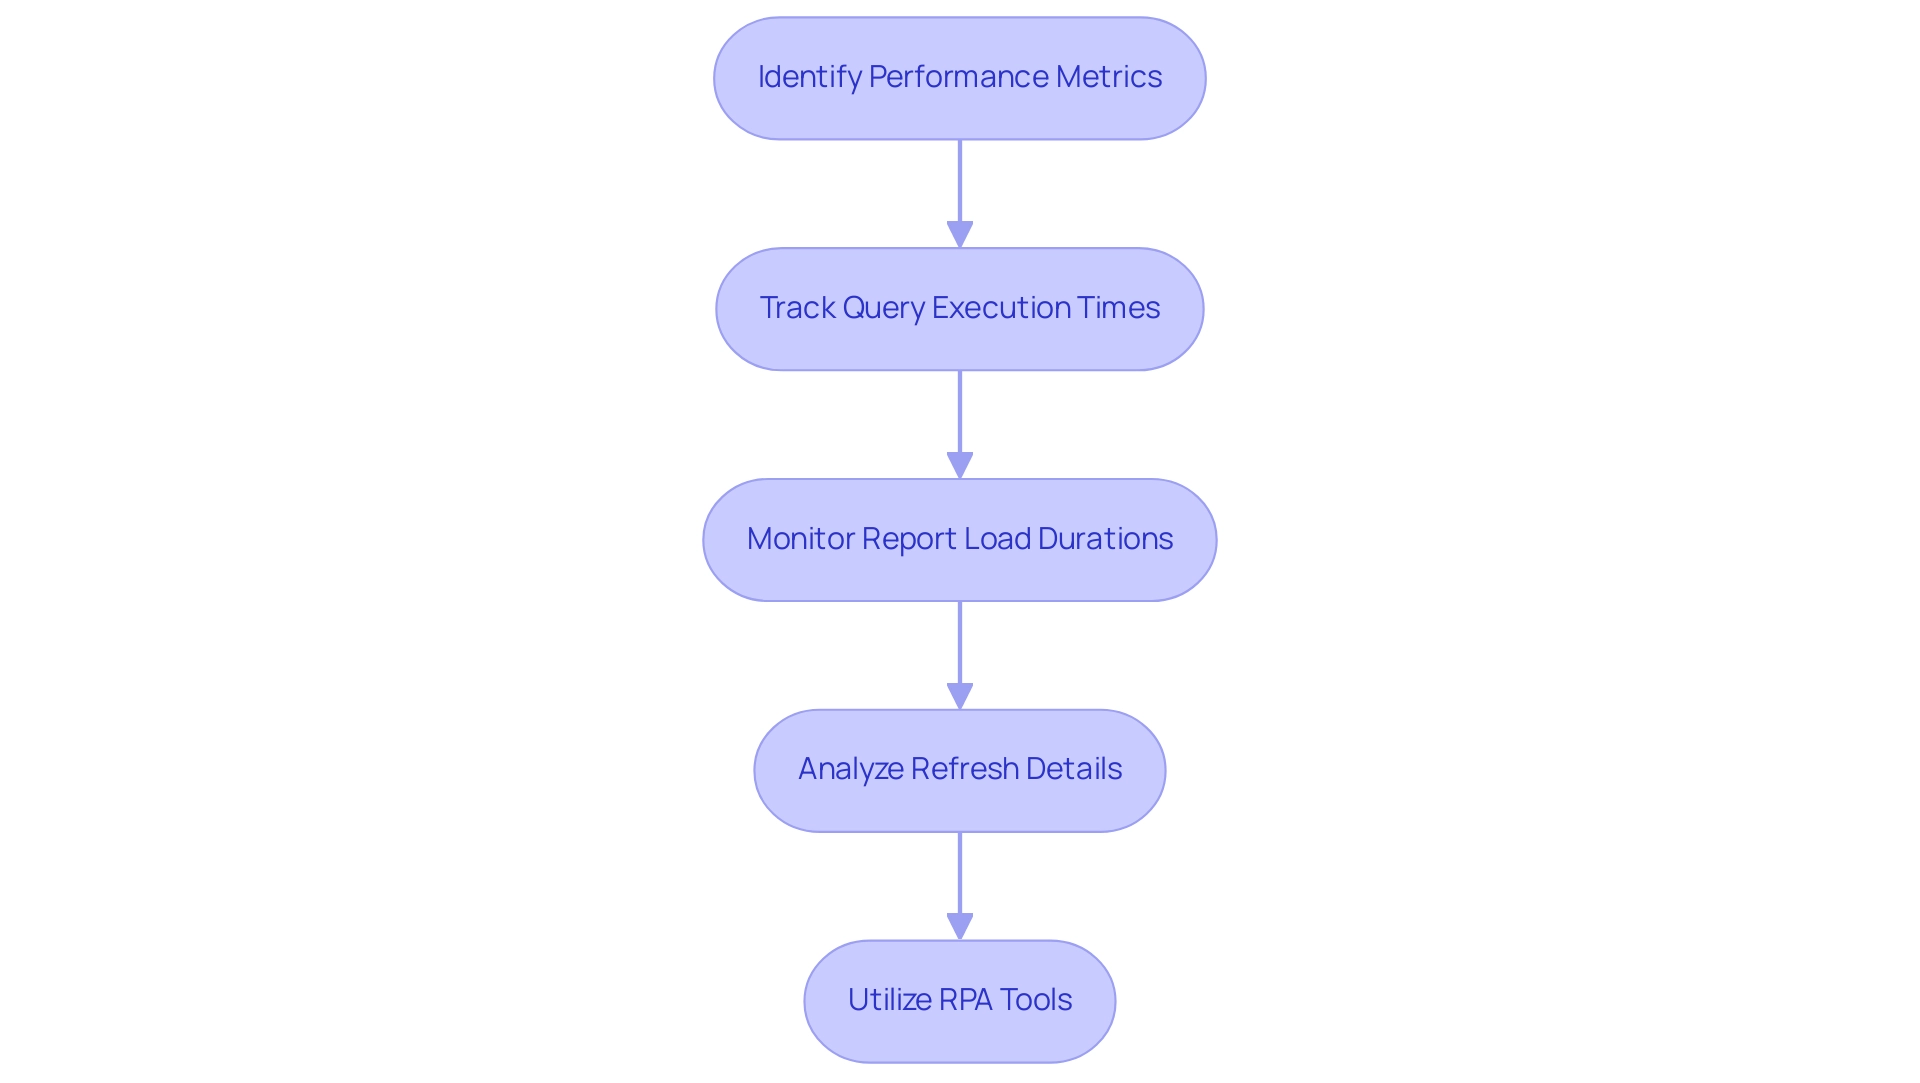
Monitoring SSAS performance in Power BI is crucial for ensuring that reports are generated swiftly and efficiently, particularly in a landscape where data-driven insights are vital for maintaining a competitive edge. By meticulously tracking various effectiveness metrics—such as query execution times and report load durations—organizations can swiftly identify issues that may compromise user experience. This is especially pertinent when utilizing SQL Server Analysis Services (SSAS) as a data source, where SSAS performance monitoring in Power BI can help pinpoint efficiency bottlenecks that may arise.
Effective SSAS performance monitoring in Power BI not only enhances report responsiveness but also empowers organizations to make informed decisions based on real-time data insights, thereby driving business growth. Furthermore, incorporating RPA solutions, such as EMMA RPA and Automate, can streamline processes, reduce task repetition, and enhance operational efficiency. As emphasized by the new Semantic model refresh detail page, comprehensive details of refresh activities—including capacity, gateway, start and end times, and error details—significantly assist in SSAS performance monitoring in Power BI.
As Hubert Ferenc, Practice Lead of the Platform at TTMS, highlights, ‘the appropriate tools can fulfill all operational requirements flawlessly,’ underscoring the essential nature of selecting efficient solutions for tracking outcomes. In 2025, as organizations strive to enhance their data-focused strategies, the importance of these metrics in BI cannot be overstated. A recent case study on SSAS performance monitoring in Power BI demonstrates how the Fabric Monitoring Hub’s detailed insights aid users in troubleshooting and optimizing their semantic model refresh processes, further emphasizing the critical nature of robust monitoring in achieving operational excellence.
Employing RPA tools alongside BI not only improves reporting efficiency but also provides a comprehensive framework for addressing the challenges of information management and operational workflows.
Identifying Common Performance Issues with SSAS in Power BI
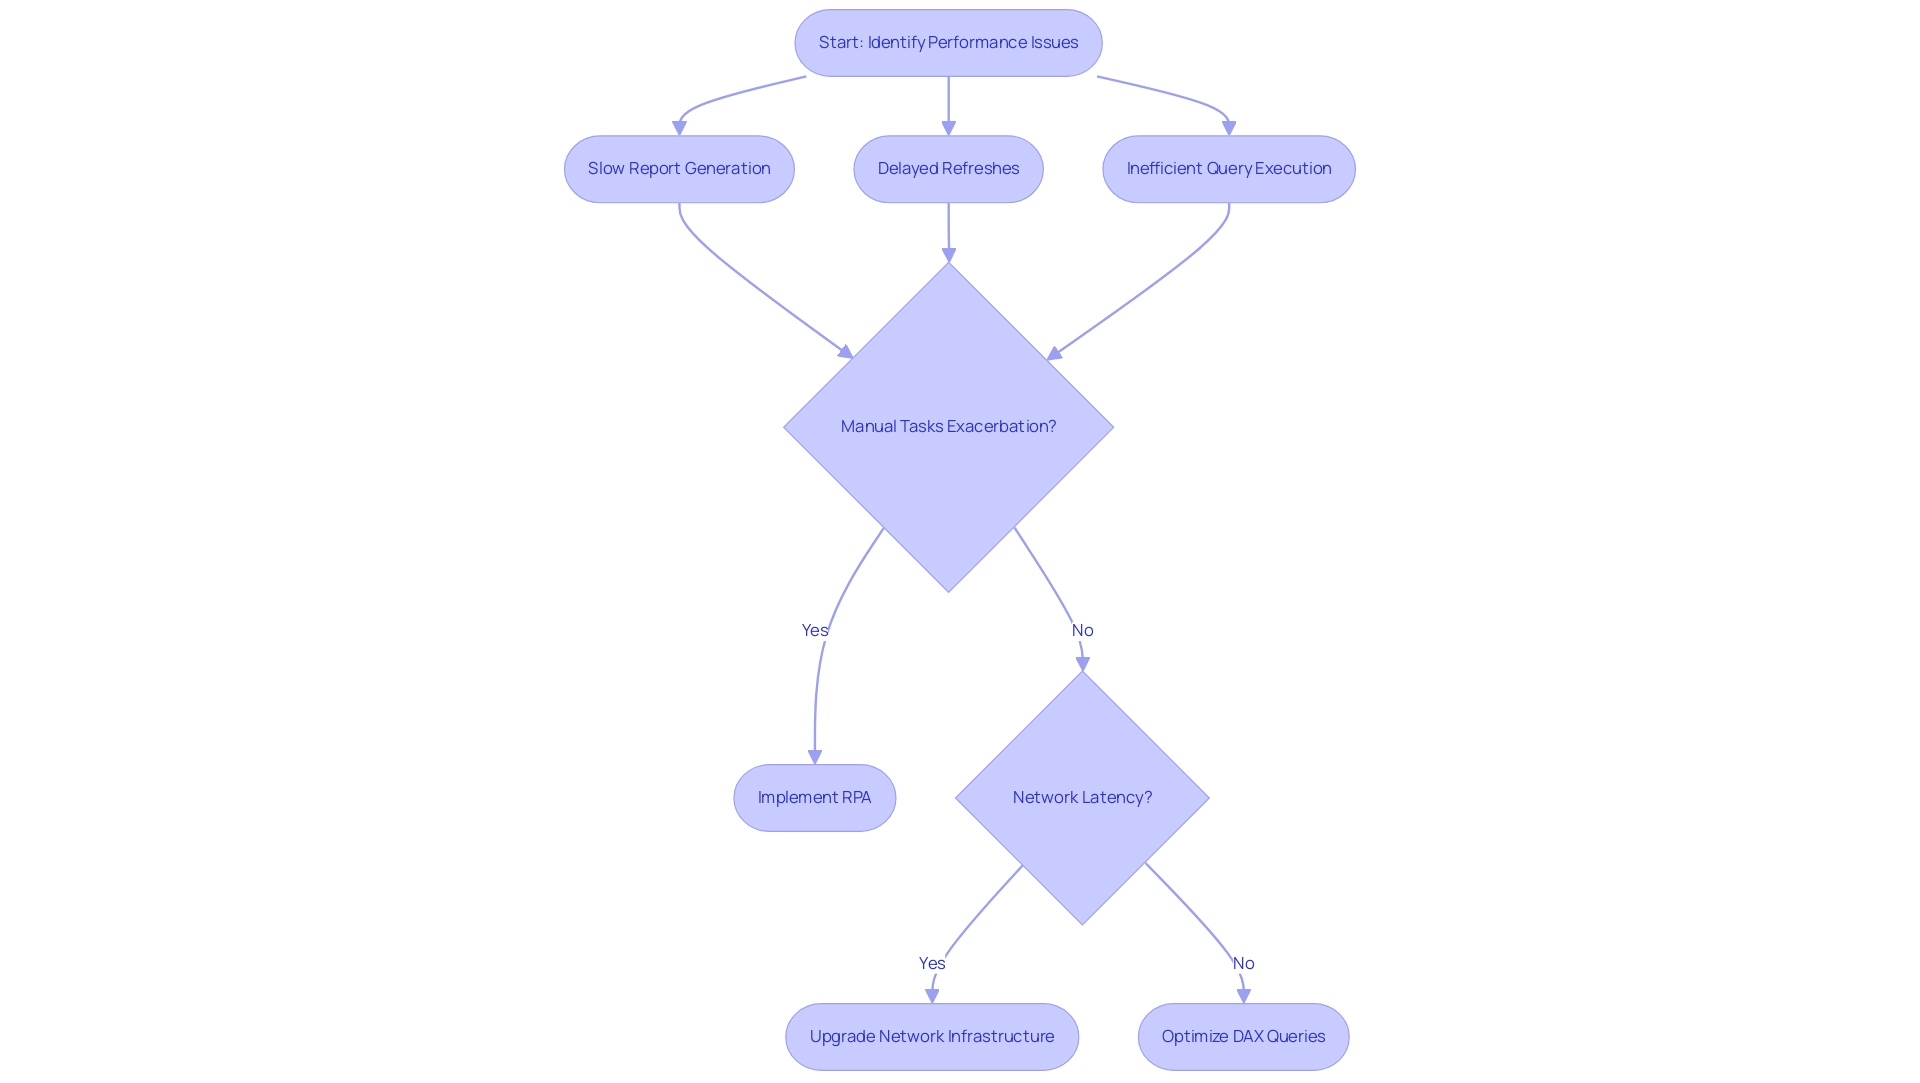
Integrating SQL Server Analysis Services with Power BI involves performance monitoring, which presents various challenges organizations must navigate. Among the most prevalent issues are:
- Slow report generation
- Delayed refreshes
- Inefficient query execution
Manual, repetitive tasks significantly exacerbate these challenges, leading to wasted time and resources.
For instance, reports utilizing complex DAX queries often experience extended load times, particularly when the underlying model lacks optimization. A recent analysis revealed users reported hundreds of thousands of records in their final queries, underscoring the need for efficient information handling. The potential benefits of implementing Robotic Process Automation (RPA) to streamline these workflows are clear, as it reduces manual tasks and enhances operational efficiency.
Network latency is another crucial element negatively impacting efficiency, especially when retrieving SSAS information from a distance. This latency can lead to significant delays in data retrieval, complicating the reporting process. Identifying these efficiency bottlenecks early is essential for organizations aiming to enhance their BI solutions with performance monitoring.
By implementing optimizations such as simplifying DAX queries or upgrading network infrastructure, businesses can significantly enhance report efficiency. Moreover, customized AI solutions can improve analytics and Business Intelligence functionality, aligning with the organization’s aim of enhancing operational efficiency.
Expert opinions emphasize the significance of monitoring and adjusting the ‘Is Available in MDX’ property, as disabling it can affect the efficiency of operations like DISTINCT COUNT, MIN, and MAX on columns. As Anders noted in a recent discussion, ‘setting this to false on all columns would mean none of the columns would be available for the Excel users, right?’ This highlights the need for a balanced approach that considers both developer access and user experience, making it a critical consideration for operational efficiency.
Additionally, a subsequent evaluation revealed that after employing the analytical services, the effectiveness of the BI solution enhanced considerably, implying that the BI tool was utilized in an unintended manner. Case studies illustrate these challenges; one user evaluated the effectiveness of both SUM and SUMX functions in their measures, ultimately concluding that SUMX delivered superior results in their specific scenario despite initial concerns about its speed compared to SUM. Such insights are essential for organizations aiming to address challenges related to performance monitoring and enhance their BI reports effectively.
By leveraging RPA and BI, businesses can drive data-driven insights and operational efficiency, avoiding the competitive disadvantage that comes from struggling to extract meaningful insights from their data.
Best Practices for Optimizing SSAS Performance in Power BI
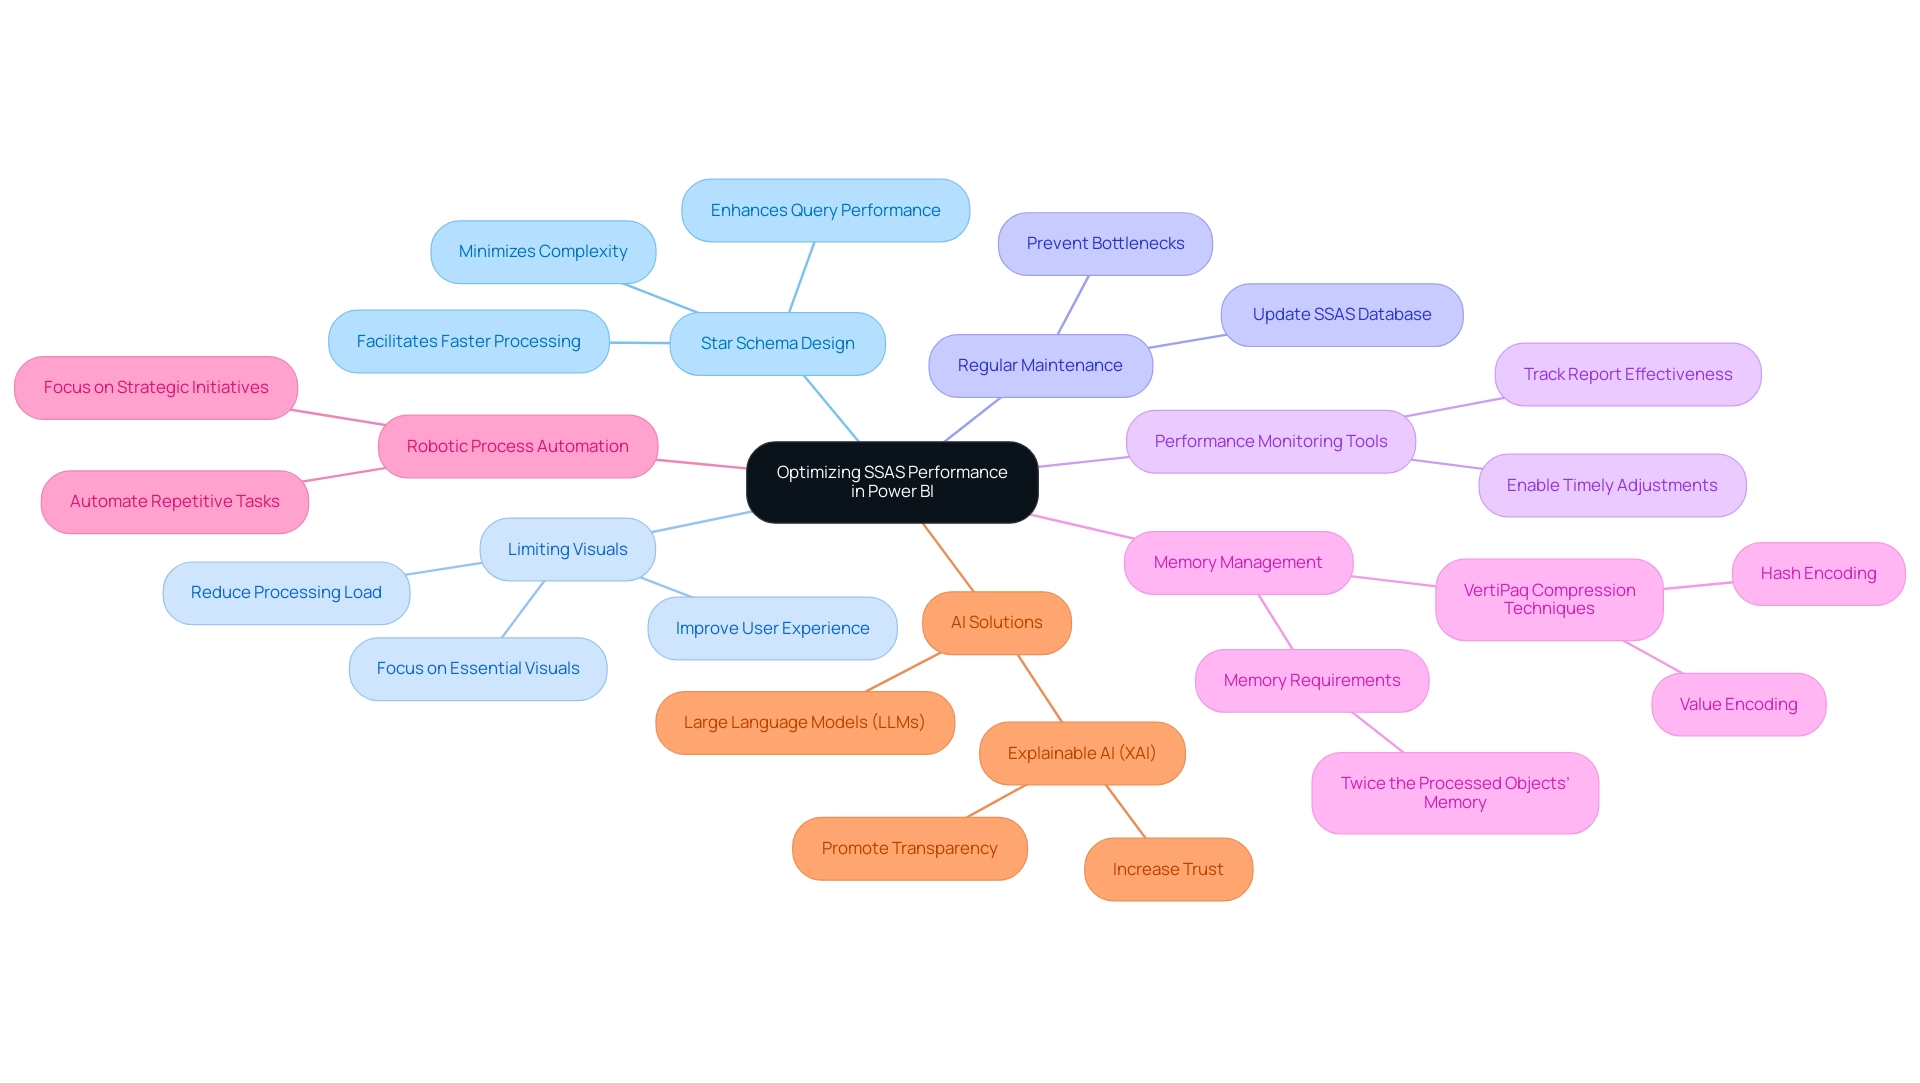
To enhance data analysis effectiveness in Power BI, organizations must adopt a set of best practices for SSAS performance monitoring that optimize operations and improve efficiency. A critical foundational step is the effective design of the SSAS model, with a preference for star schema designs whenever feasible. This approach minimizes complexity and enhances query performance, as star schemas have been proven to significantly improve retrieval times.
Utilizing a star schema can lead to a more efficient model, facilitating faster processing and better scalability.
Another vital strategy involves limiting the number of visuals per report. By focusing on essential visuals and leveraging compiled information, organizations can substantially reduce processing load, resulting in quicker report generation and an improved user experience. Regular updates and maintenance of the SSAS database are equally crucial for effective performance monitoring; outdated information can create bottlenecks and inefficiencies that hinder functionality.
Moreover, employing performance monitoring tools is essential for tracking and analyzing report effectiveness. These tools provide insights that enable timely adjustments to the model, ensuring it remains optimized for current needs. As industry experts note, “Every column included in an AS tabular model will be compressed and stored by the Vertipaq engine using either one of these techniques: value encoding or hash encoding.”
This compression technique is vital for enhancing performance and managing memory effectively. Notably, during processing, the VertiPaq memory required could be twice that of the processed objects’ memory, underscoring the importance of efficient memory management.
Incorporating Robotic Process Automation (RPA) can further boost operational efficiency by automating repetitive tasks, allowing teams to concentrate on more strategic initiatives. Recent advancements, such as the Power Fabric update, exemplify the benefits of integrating information processes within Power BI. This update has streamlined workflows, improved information accessibility, and enhanced visualization capabilities, ultimately supporting better decision-making for organizations.
Additionally, leveraging AI solutions through GenAI workshops can enhance data quality and improve training methods. Integrating Explainable AI (XAI) and Large Language Models (LLMs) can further transform operational efficiency by increasing trust and promoting transparency in data handling and analysis. By adopting these best practices, companies can ensure that their analytics efficiency in Business Intelligence is not only enhanced but also aligned with their strategic objectives for 2025.
Troubleshooting Common SSAS and Power BI Integration Issues
Troubleshooting integration issues between SQL Server Analysis Services and Power BI is crucial for SSAS performance monitoring to ensure operational efficiency. Frequent challenges such as connection timeouts, authentication failures, and slow query execution can significantly hinder productivity. Manual, repetitive tasks exacerbate these issues, causing delays and wasting valuable time and resources.
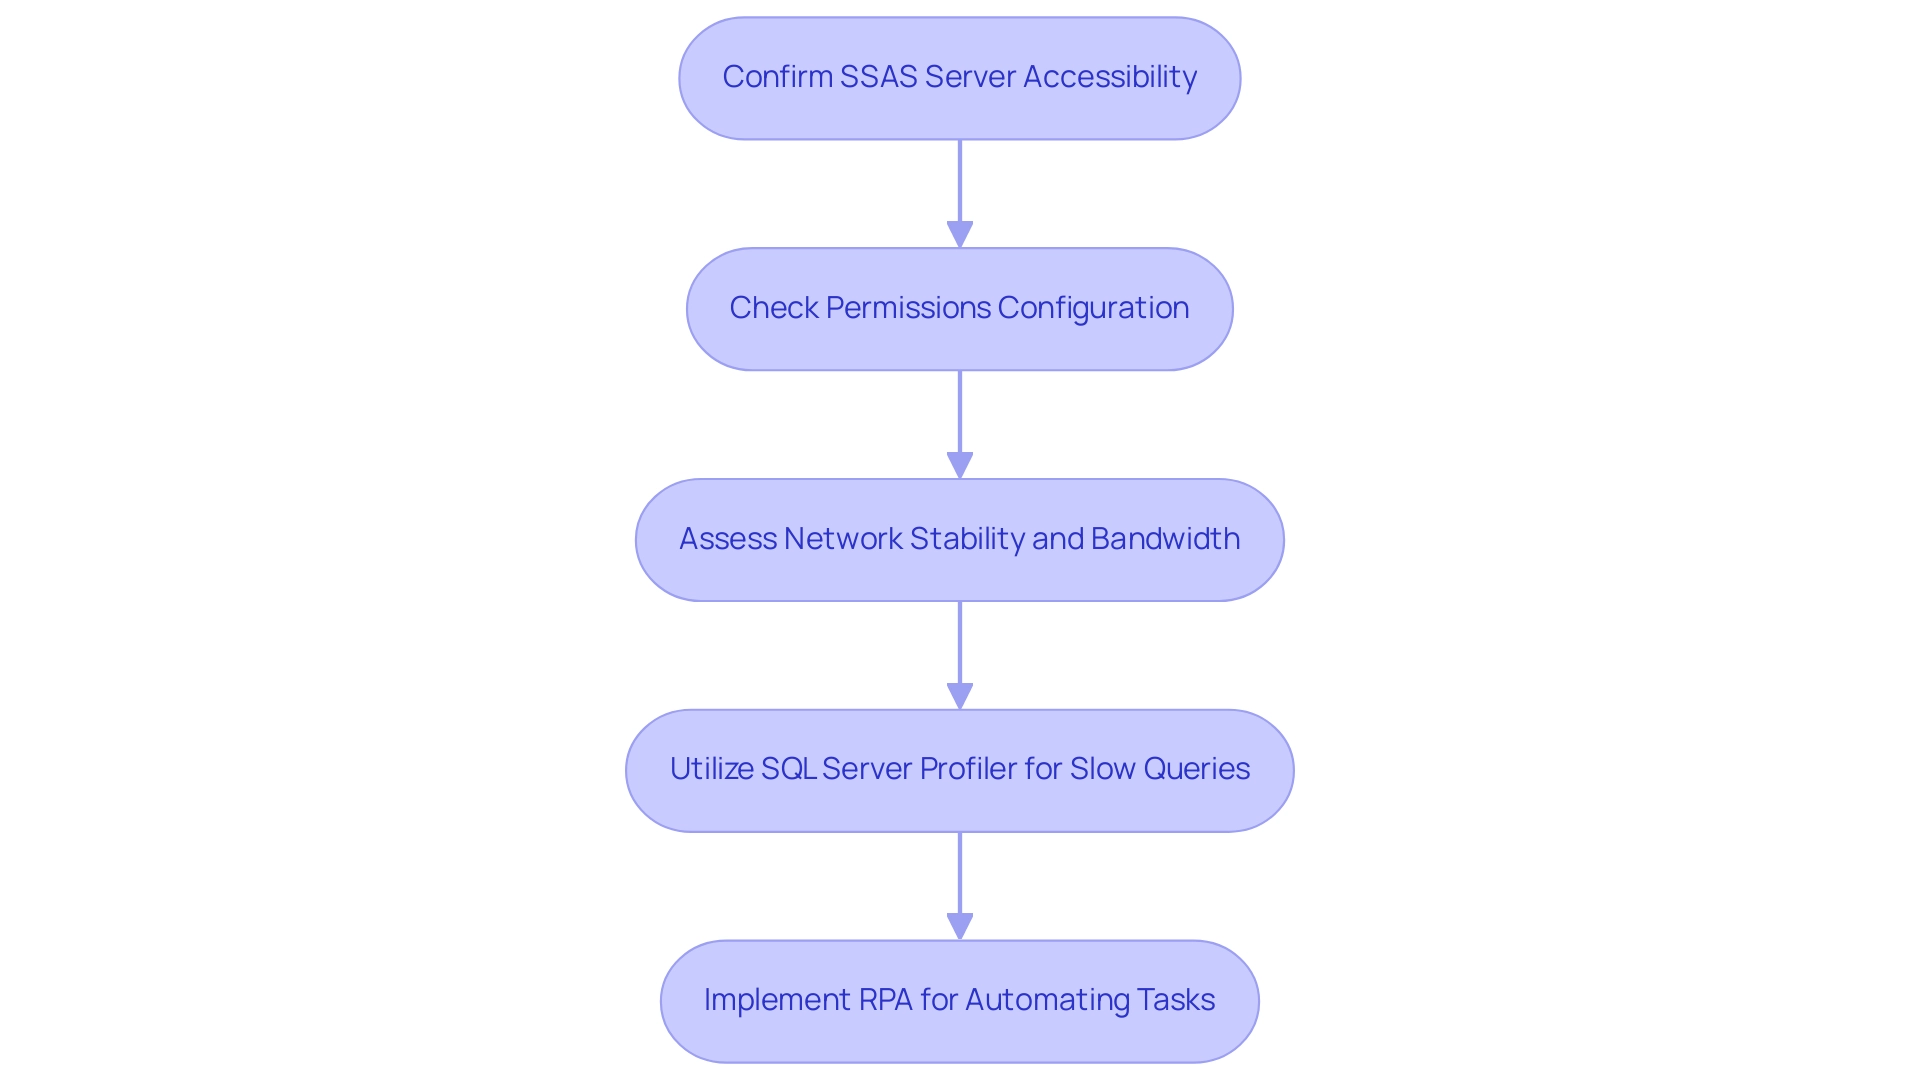
To effectively address these integration challenges, it is essential to confirm that the SSAS server is accessible and that all necessary permissions are configured correctly. Stability in network conditions and sufficient bandwidth are also critical; fluctuations can greatly affect functionality.
Utilizing tools like SQL Server Profiler can be instrumental in identifying slow queries and performance bottlenecks. This analysis guides informed adjustments to data models or Power BI reports, thereby enhancing overall efficiency in SSAS performance monitoring. Moreover, the integration of Robotic Process Automation (RPA) can streamline workflows by automating repetitive tasks, allowing your team to focus on strategic initiatives, ultimately driving growth.
For instance, RPA can automate the extraction and transformation processes, significantly reducing the time spent on manual handling.
Recent statistics indicate that a considerable percentage of organizations experience common SSAS connection issues, with authentication failures being a leading cause of integration problems. A case study titled “Information Transformation Performance Comparison” highlights the efficiency of various transformation methods, providing insights that can guide organizations in selecting the best approach for reporting and analysis needs. This case study also emphasizes the importance of understanding visibility limitations, as loading DB tables over Visual Studio in Excel shows measures, while loading via server connection only displays values until December 2024.
Furthermore, experiments comparing information load and transformations between CSV files and a Fabric lakehouse have yielded current insights into performance comparisons relevant to your interests. As Paul Turley, a Microsoft Data Platform MVP and Principal Consultant for 3Cloud Solutions, states, “All models and reports will use managed information and will be certified by the business.” This underscores the importance of upholding information integrity throughout the integration process, leading to more reliable insights and informed decision-making.
To further enhance your operations, our tailored AI solutions can identify specific integration challenges and provide targeted recommendations. For those looking to deepen their understanding, utilizing code MSCUST for a $150 discount on conference registration can offer valuable opportunities to learn more about these critical topics.
Leveraging Business Intelligence for Operational Efficiency
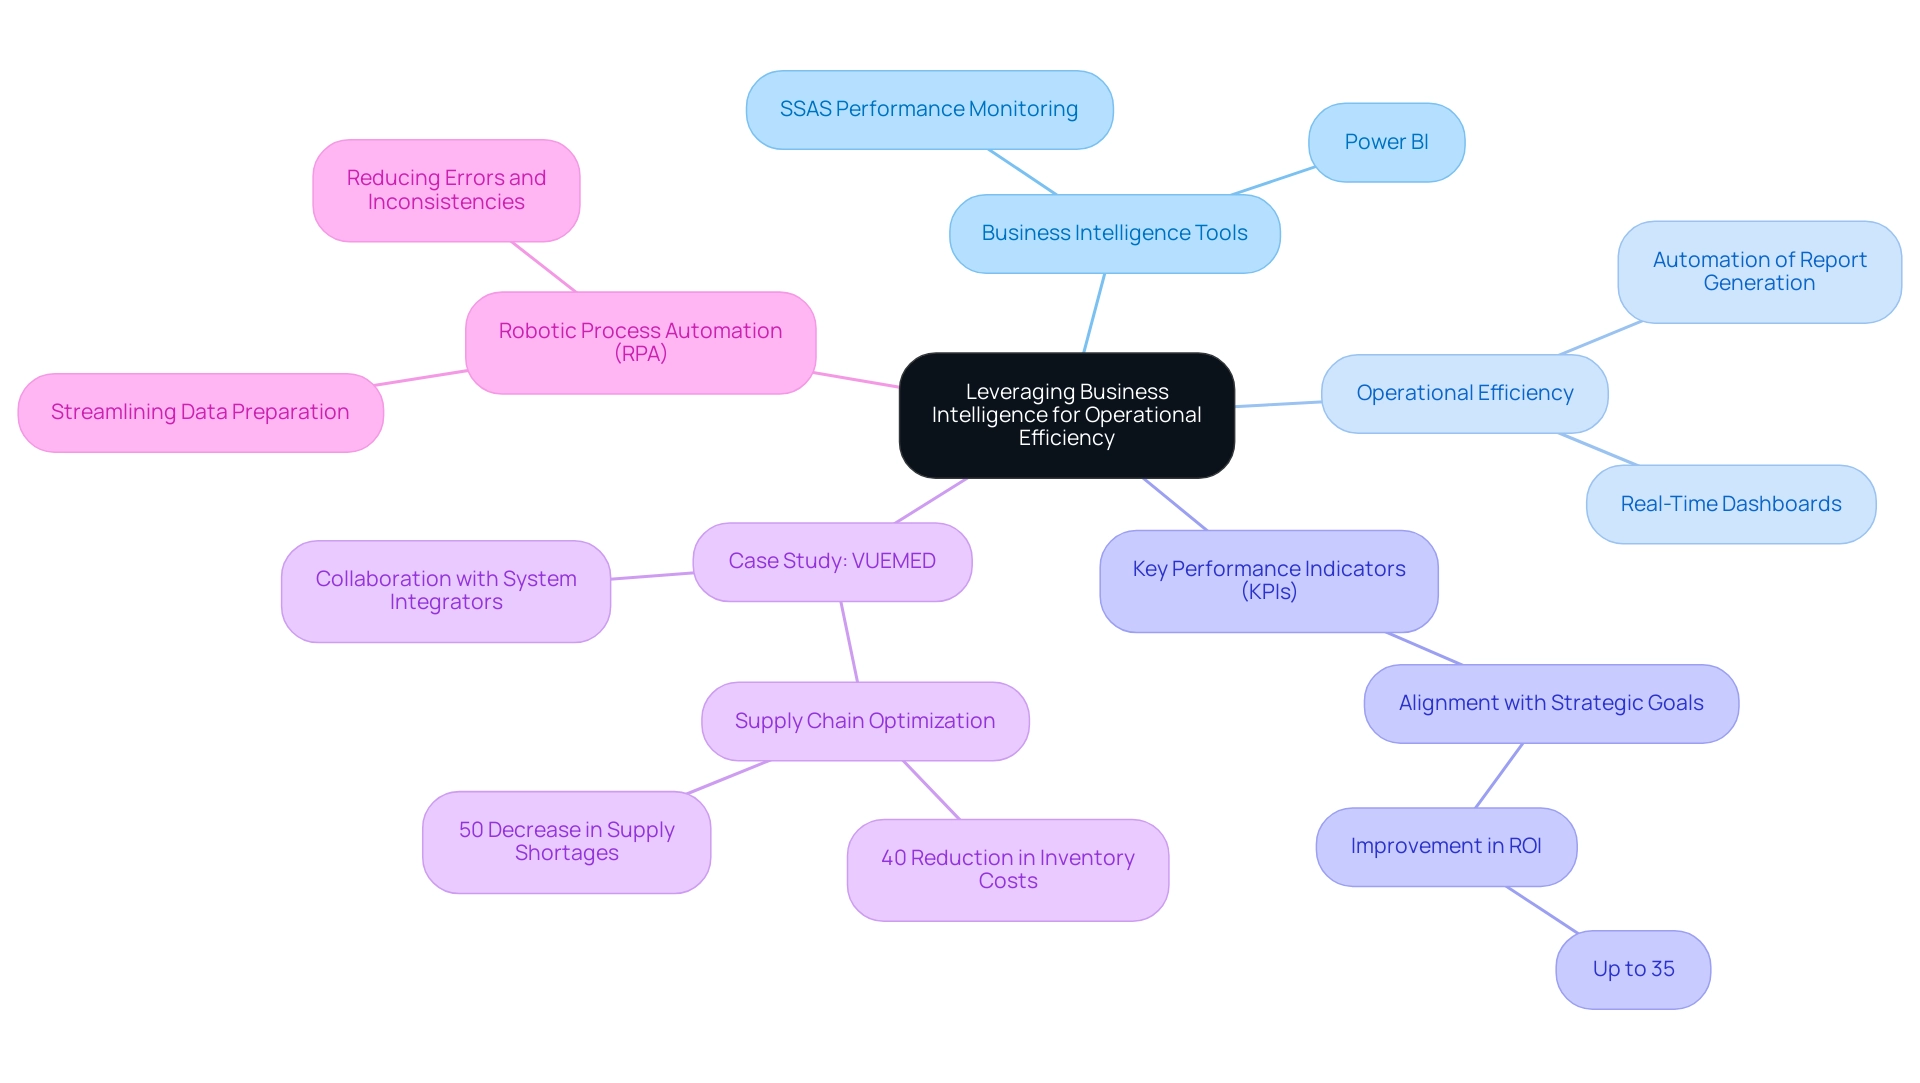
Utilizing business intelligence tools such as SSAS performance monitoring and Power BI can significantly enhance operational efficiency by converting raw data into actionable insights. This transformation empowers organizations to make informed decisions that drive growth and innovation. The effective application of BI tools, combined with Robotic Process Automation (RPA), facilitates the identification of inefficiencies within business processes, allowing for targeted improvements and the automation of labor-intensive report generation.
For instance, real-time dashboards deliver critical insights into key performance indicators (KPIs), enabling teams to swiftly adjust strategies and operations. Aligning KPIs with strategic business goals has been shown to improve ROI by as much as 35%. Moreover, RPA can streamline the preparation process, reducing errors and mitigating inconsistencies, thus freeing up valuable time for teams to focus on analysis rather than data entry.
As Mykhailo Kulyk notes, ‘When evaluating the best BI tools in 2025, many organizations lean towards solutions that offer flexibility, real-time analytics, and deep integration capabilities.’ This is crucial as organizations navigate the complexities of a rapidly evolving business landscape. A notable case study is VUEMED, which utilized BI to optimize their supply chain operations. By analyzing usage patterns and integrating real-time monitoring into their inventory management processes, they achieved a remarkable 40% reduction in inventory costs and a 50% decrease in supply shortages over nine months.
Their success was further bolstered by collaboration with system integrators and data analysts, demonstrating the effectiveness of combining BI with IoT and agile methodologies. This underscores the significant benefits of business intelligence and RPA for operational efficiency in 2025, particularly in creating actionable reports for SSAS performance monitoring and Power BI that are visually easy to interpret and regularly updated. Furthermore, as organizations face an overwhelming AI landscape, tailored AI solutions can assist in navigating these challenges, ensuring that businesses leverage the right technologies for actionable insights.
Conclusion
Integrating SQL Server Analysis Services (SSAS) with Power BI offers a transformative opportunity for organizations aiming to elevate their data analytics and decision-making capabilities. By harnessing SSAS, businesses can develop sophisticated data models that seamlessly connect with Power BI, facilitating efficient querying and dynamic reporting. This integration not only enables real-time analytics but also empowers organizations to monitor performance effectively, ensuring that insights are timely and actionable.
However, as highlighted throughout the article, organizations must confront common performance challenges linked to this integration. From slow report generation to inefficient query execution, recognizing and resolving these issues is essential for maximizing the benefits of SSAS and Power BI. Implementing best practices, such as:
- adopting star schema designs
- optimizing DAX queries
- utilizing performance monitoring tools
can significantly enhance operational efficiency and user experience.
Ultimately, the combination of SSAS and Power BI represents a pivotal strategy for organizations striving to remain competitive in a data-driven landscape. By embracing a proactive approach to performance monitoring and troubleshooting, businesses can unlock the full potential of their data, driving growth and innovation. As the digital landscape continues to evolve, investing in these advanced analytics solutions will be crucial for achieving long-term success and operational excellence.
Overview
This article underscores the critical importance of effectively managing the first row in data sources. This row serves as the title row, containing essential labels that define the data columns. Proper management of this row is paramount, as it enhances clarity and minimizes errors in data processing. Such diligence ultimately leads to improved decision-making and operational efficiency. Furthermore, the integration of automation tools, such as Robotic Process Automation (RPA), supports this endeavor, streamlining processes and driving better outcomes.
Introduction
In the realm of data management, the significance of the first row in any dataset is paramount. This crucial header row not only sets the stage for understanding the data it encapsulates but also guides users through the intricacies of columns filled with vital information. As organizations navigate the complexities of data analysis and reporting, the clarity provided by a well-structured header becomes essential.
In today’s fast-paced digital landscape, where Robotic Process Automation (RPA) is transforming operational workflows, effectively managing this foundational element can dramatically enhance data accuracy and decision-making. Consider the common pitfalls, such as header duplication, alongside innovative techniques for leveraging automation. The journey toward mastering data management begins with recognizing the power of that first row.
1. Name: Understanding the Significance of the First Row in Data Sources
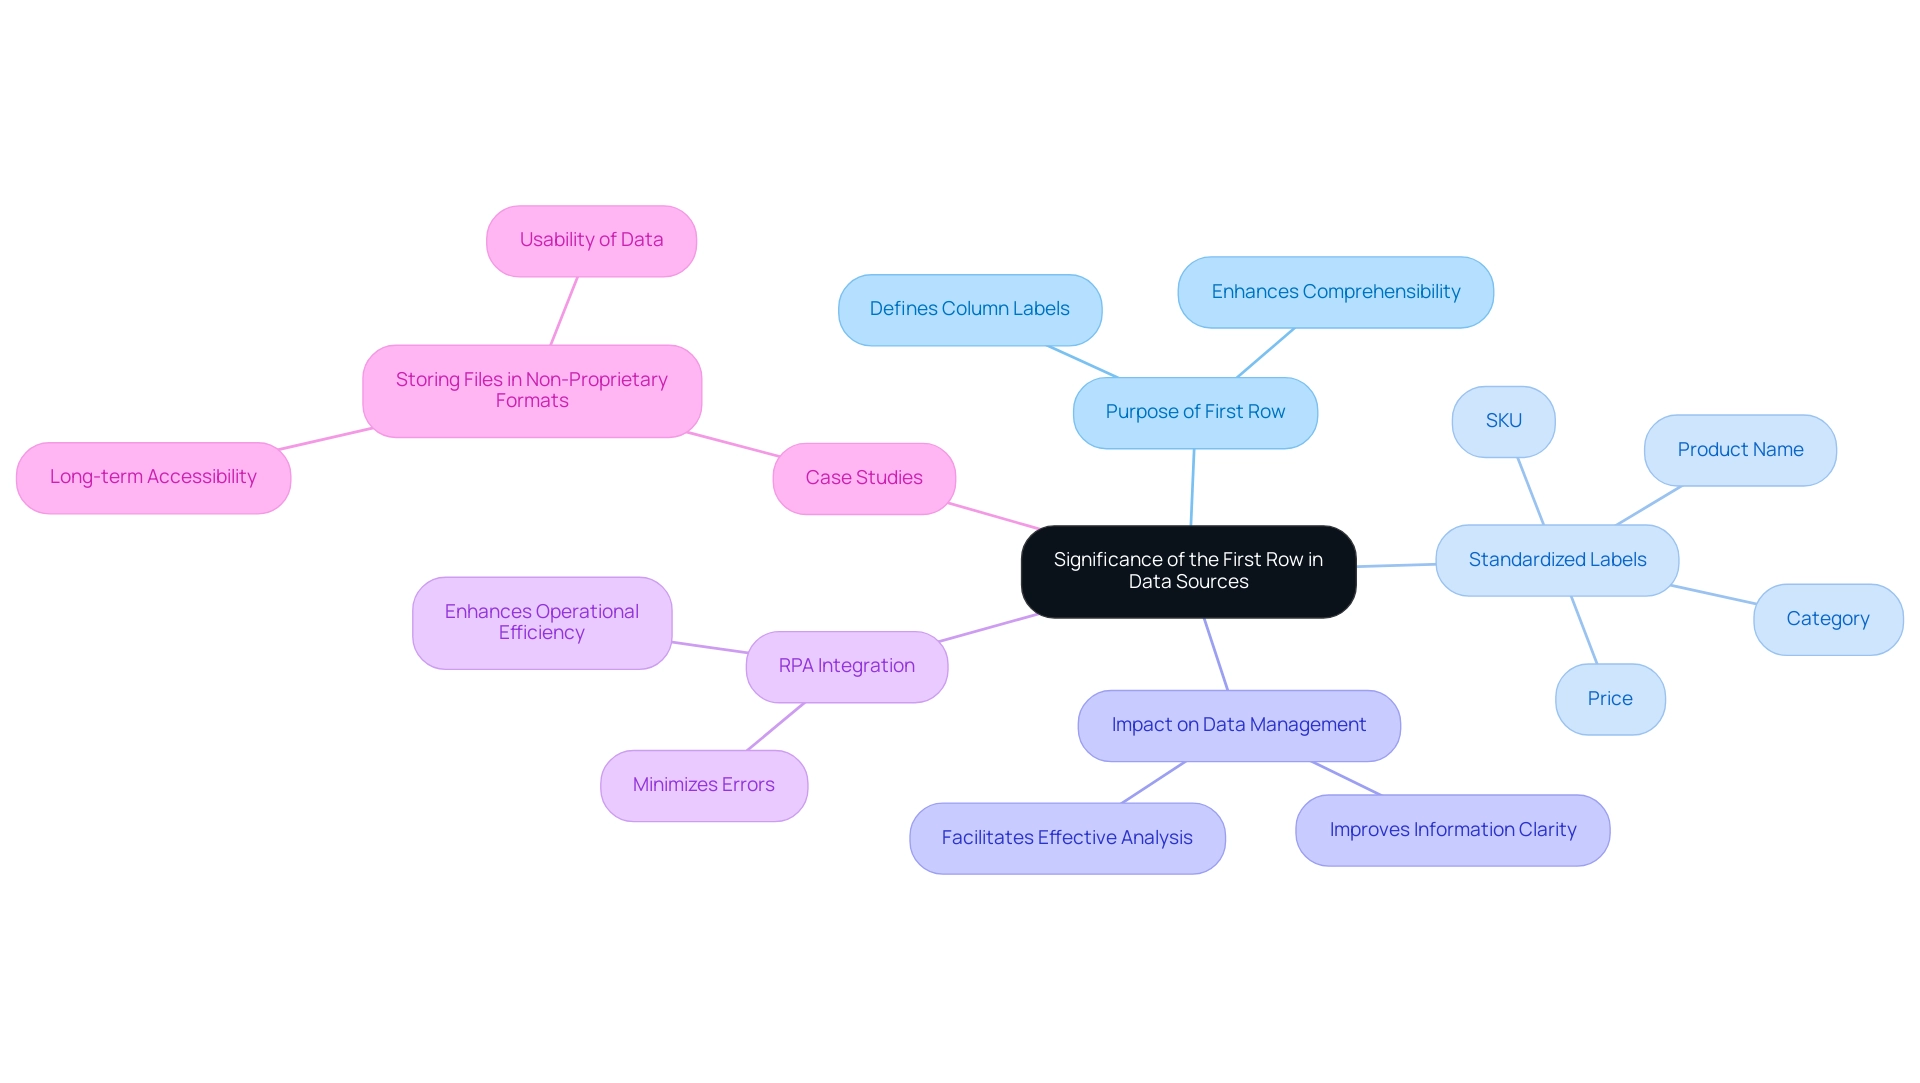
The first row in a data source, whether it is a spreadsheet or a database, is essential as it typically serves as the title row. This first row contains the labels that define each column, enabling users to grasp the essence of the information presented. For instance, in a sales dataset, the first row might include crucial labels such as ‘Date’, ‘Product’, ‘Quantity’, and ‘Price’.
Proper management of the first row in a data source is vital for ensuring that information is easily comprehensible and modifiable, which in turn fosters more effective analysis and reporting.
In today’s rapidly evolving AI landscape, leveraging Robotic Process Automation (RPA) to automate manual workflows is crucial for enhancing operational efficiency. RPA can significantly minimize errors and liberate team resources for more strategic tasks, making it a formidable tool in management. The significance of a distinct title in the first row cannot be overstated; without it, information can become ambiguous, leading to processing errors that ultimately impact decision-making.
As noted by Kara H. Woo from the Information School at the University of Washington, “It is important to ensure that the process is as error-free and repetitive-stress-injury-free as possible.” This underscores the necessity of maintaining high-quality title rows, recognized as the first row in a data source, to reduce confusion and enhance operational efficiency through RPA.
Recent studies have shown that standardized row labels, such as ‘SKU’, ‘Product Name’, ‘Category’, and ‘Price’, serve as the first row in a data source, contributing to a clearer inventory database and improving overall information management practices. Moreover, implementing RPA alongside multi-column statistics can significantly boost performance when multiple columns are accessed together. This suggests that by structuring information with clear titles, users can leverage analytical tools more effectively, resulting in enhanced insights and decision-making.
In practical terms, the lack of clear headers can lead to interpretation challenges, as evidenced by case studies that highlight the importance of storing files in non-proprietary formats. These studies reveal that using standard file formats not only enhances accessibility but also ensures long-term usability of information. Furthermore, instead of emphasizing questionable data in spreadsheets, incorporating an indicator variable in a separate column can provide clarity and improve information handling practices.
Consequently, the quality of title rows, particularly the first row in a data source, directly influences the effectiveness of information analysis. It is essential for organizations to prioritize this aspect in their information management strategies while utilizing RPA to drive insight-driven decisions and enhance operational efficiency.
2. Name: Common Challenges in Managing the First Row of Data
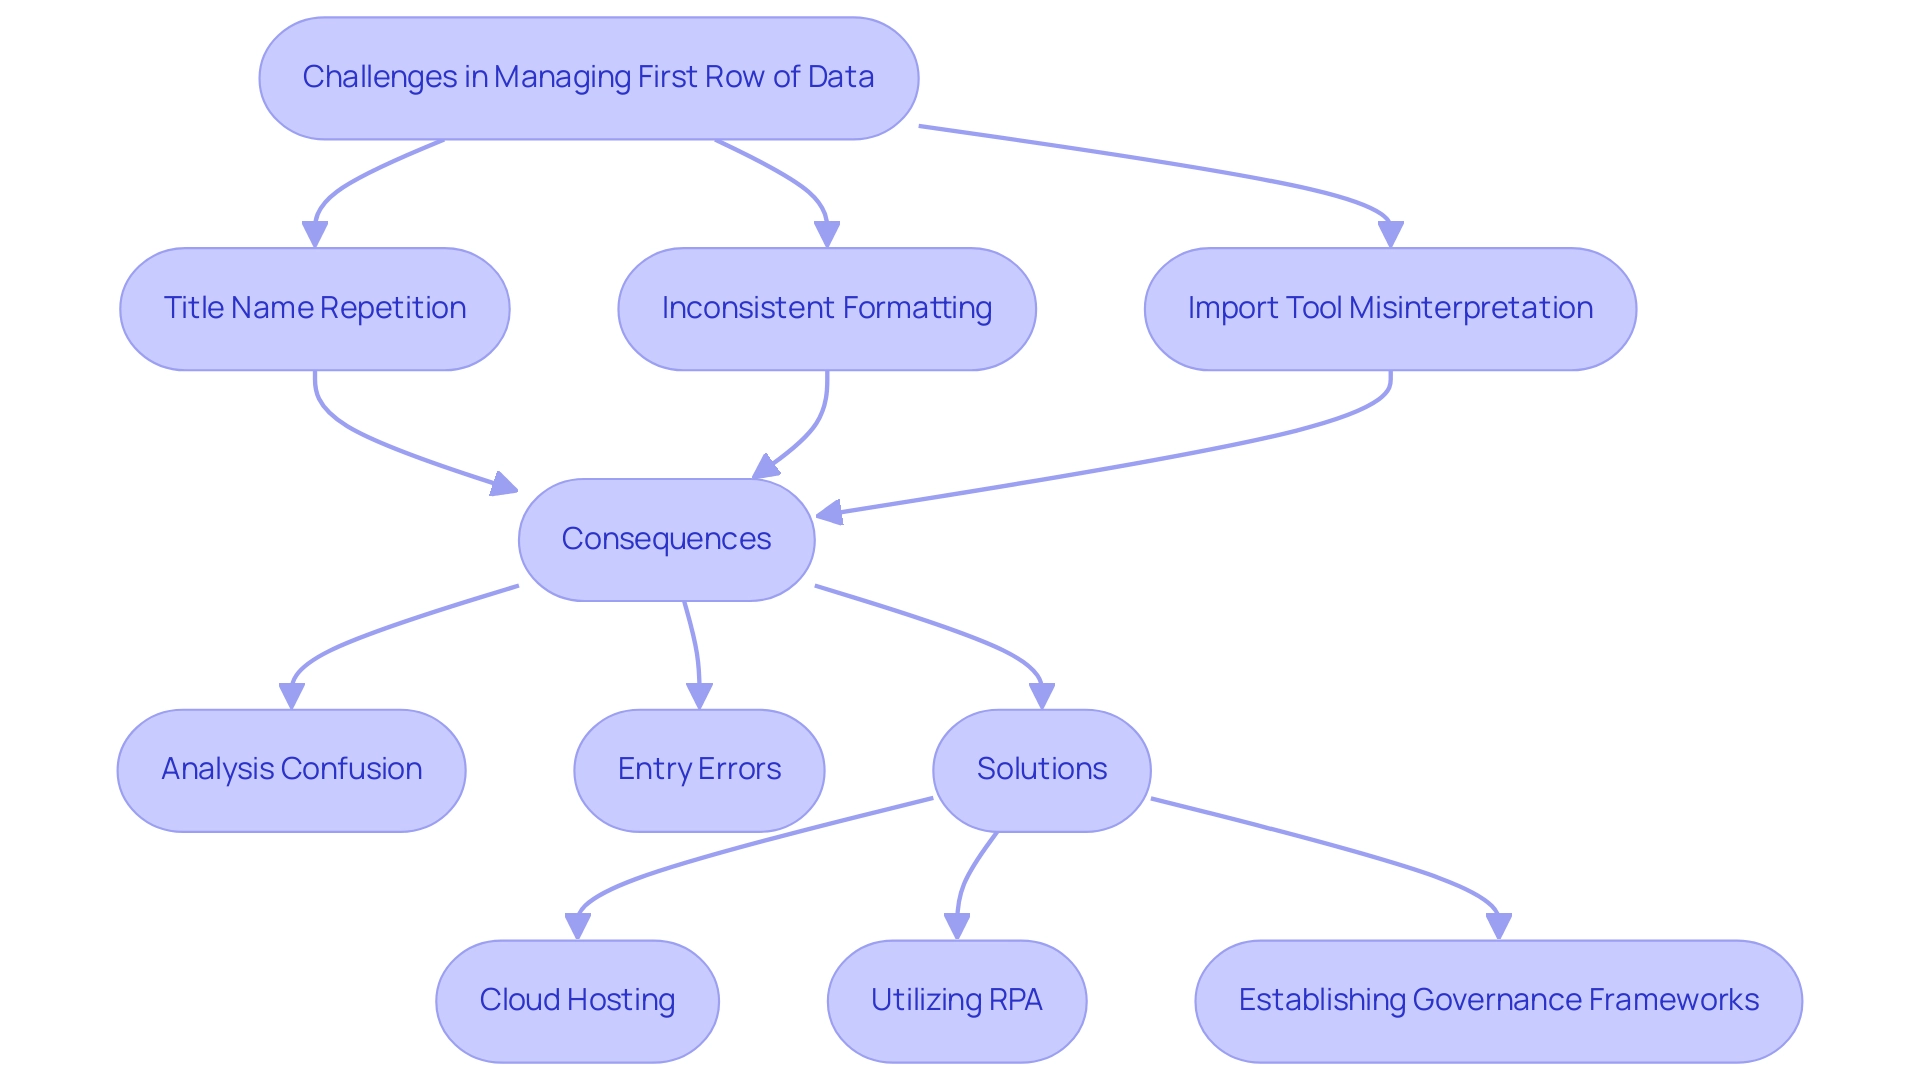
Managing the first row in a data source presents significant challenges that impact overall integrity and analysis. A common issue arises from the unintentional repetition of title names, leading to confusion during analysis and potentially incorrect conclusions. For example, if a dataset contains multiple columns labeled ‘Date’ and ‘date’, processing tools may treat these as distinct entities, complicating queries and analyses.
This inconsistency can result in critical errors, as emphasized by industry experts who stress the importance of maintaining uniform formatting.
As organizations navigate 2025, they encounter additional hurdles, such as inconsistent formatting across datasets. Variations in date formats, capitalization, and even spacing can hinder effective processing. Moreover, import tools may misinterpret the first row in a data source, failing to recognize it as titles, which can lead to inaccurate parsing and subsequent analysis mistakes.
Recent statistics indicate that approximately 30% of entry errors are linked to header row issues, underscoring the need for robust management practices.
To illustrate these challenges, consider the case of a logistics provider grappling with information silos. The CIO, Daragh Mahon, emphasized the necessity of isolating the correct information to derive actionable insights, stating, “By hosting all relevant information in the cloud, companies can capture and store information and leverage AI and machine learning technology for quick analysis to inform decision-making.” By adopting a cloud-first strategy and utilizing Robotic Process Automation (RPA), including tools like Power Automate, the organization centralized its information storage, facilitating quicker analysis through AI and machine learning technologies.
This approach not only addressed problems associated with repetition but also enhanced overall information quality.
Understanding these challenges is essential for organizations striving to adopt best practices in information entry and oversight. By prioritizing clarity and consistency in header oversight and employing RPA tools to automate manual workflows, such as information entry and reporting processes, businesses can significantly reduce the risk of input errors and enhance the reliability of their analysis efforts. Furthermore, establishing governance frameworks and ensuring leadership buy-in, as proposed by Pat Romano, can further strengthen an organization’s information management strategy, driving insight-driven conclusions and supporting business growth.
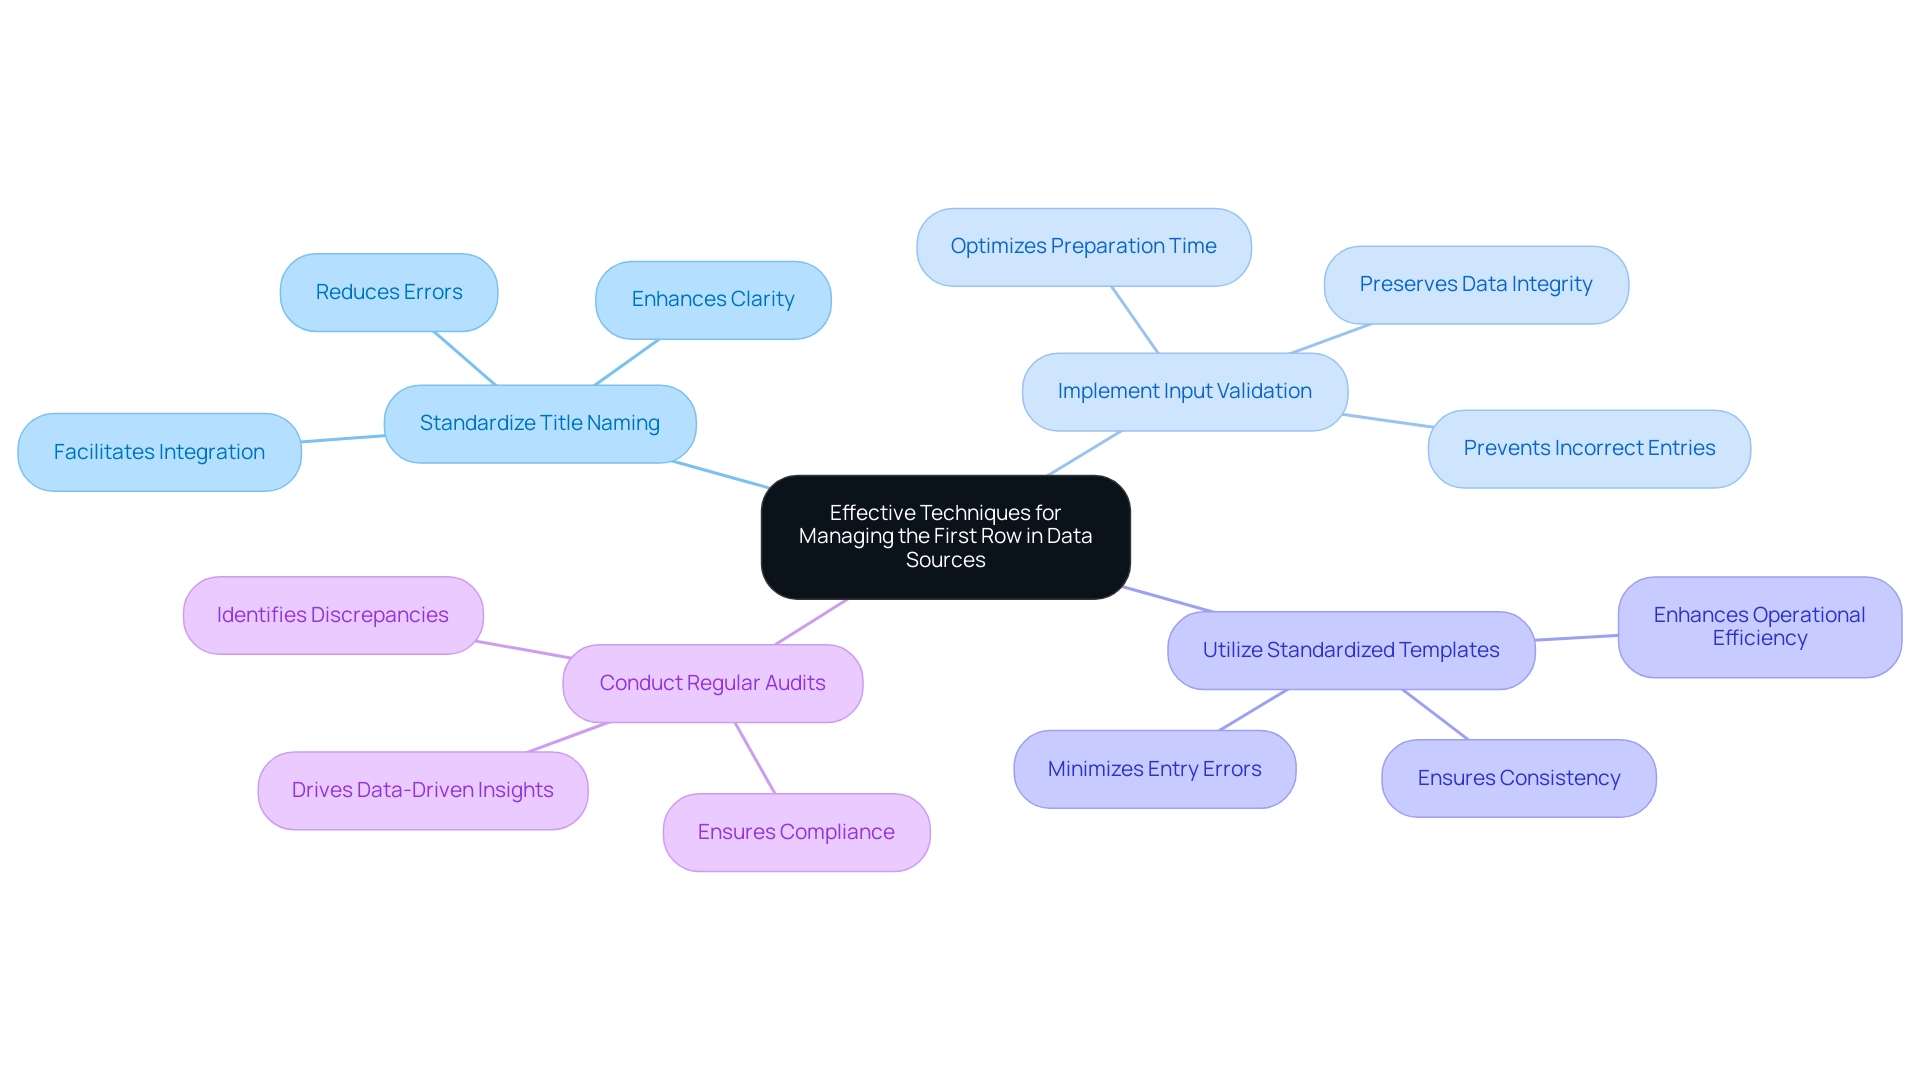
3. Name: Effective Techniques for Managing the First Row in Data Sources
To effectively manage the first row in data sources and leverage technology for operational efficiency, organizations must adopt the following techniques:
-
Standardize Title Naming: Establish unique and consistently formatted title names across all datasets. Avoid spaces and special characters, as these can lead to confusion and mistakes in processing. Uniform title names not only enhance clarity but also facilitate simpler information integration and analysis, which is essential in a setting where RPA can automate tasks associated with information management.
-
Implement Input Validation: Utilize validation rules to ensure that only correct entries are permitted in the first row of a data source. This practice is vital for preserving the integrity of the information, as incorrect entries can jeopardize the entire collection. As noted by Cindy Turner, SAS Insights Editor, “Most of them spend 50 to 80 percent of their model development time on preparation alone,” underscoring the importance of accuracy from the outset, which can be optimized through RPA solutions like EMMA RPA and Power Automate.
-
Utilize Standardized Templates: Create and employ standardized templates for information entry that include predefined titles. This strategy minimizes the risk of errors and ensures consistency across various datasets, making it easier to manage and analyze information effectively, thereby enhancing operational efficiency in a rapidly evolving AI landscape.
-
Conduct Regular Audits: Implement a routine audit process to assess compliance with established header standards. Regular audits help identify and correct discrepancies swiftly, ensuring that the information remains trustworthy and usable for analysis. Coupled with Business Intelligence tools, these audits can drive data-driven insights that propel business growth. RPA tools can assist in automating parts of this auditing process, ensuring efficiency and accuracy.
By applying these techniques, organizations can significantly simplify their information handling processes. Effective header oversight not only enhances the reliability of analysis but also contributes to better decision-making and a higher return on investment in information initiatives. This structured approach safeguards integrity and confidentiality, ultimately driving growth and innovation.
4. Name: Leveraging Automation for Efficient Data Row Management
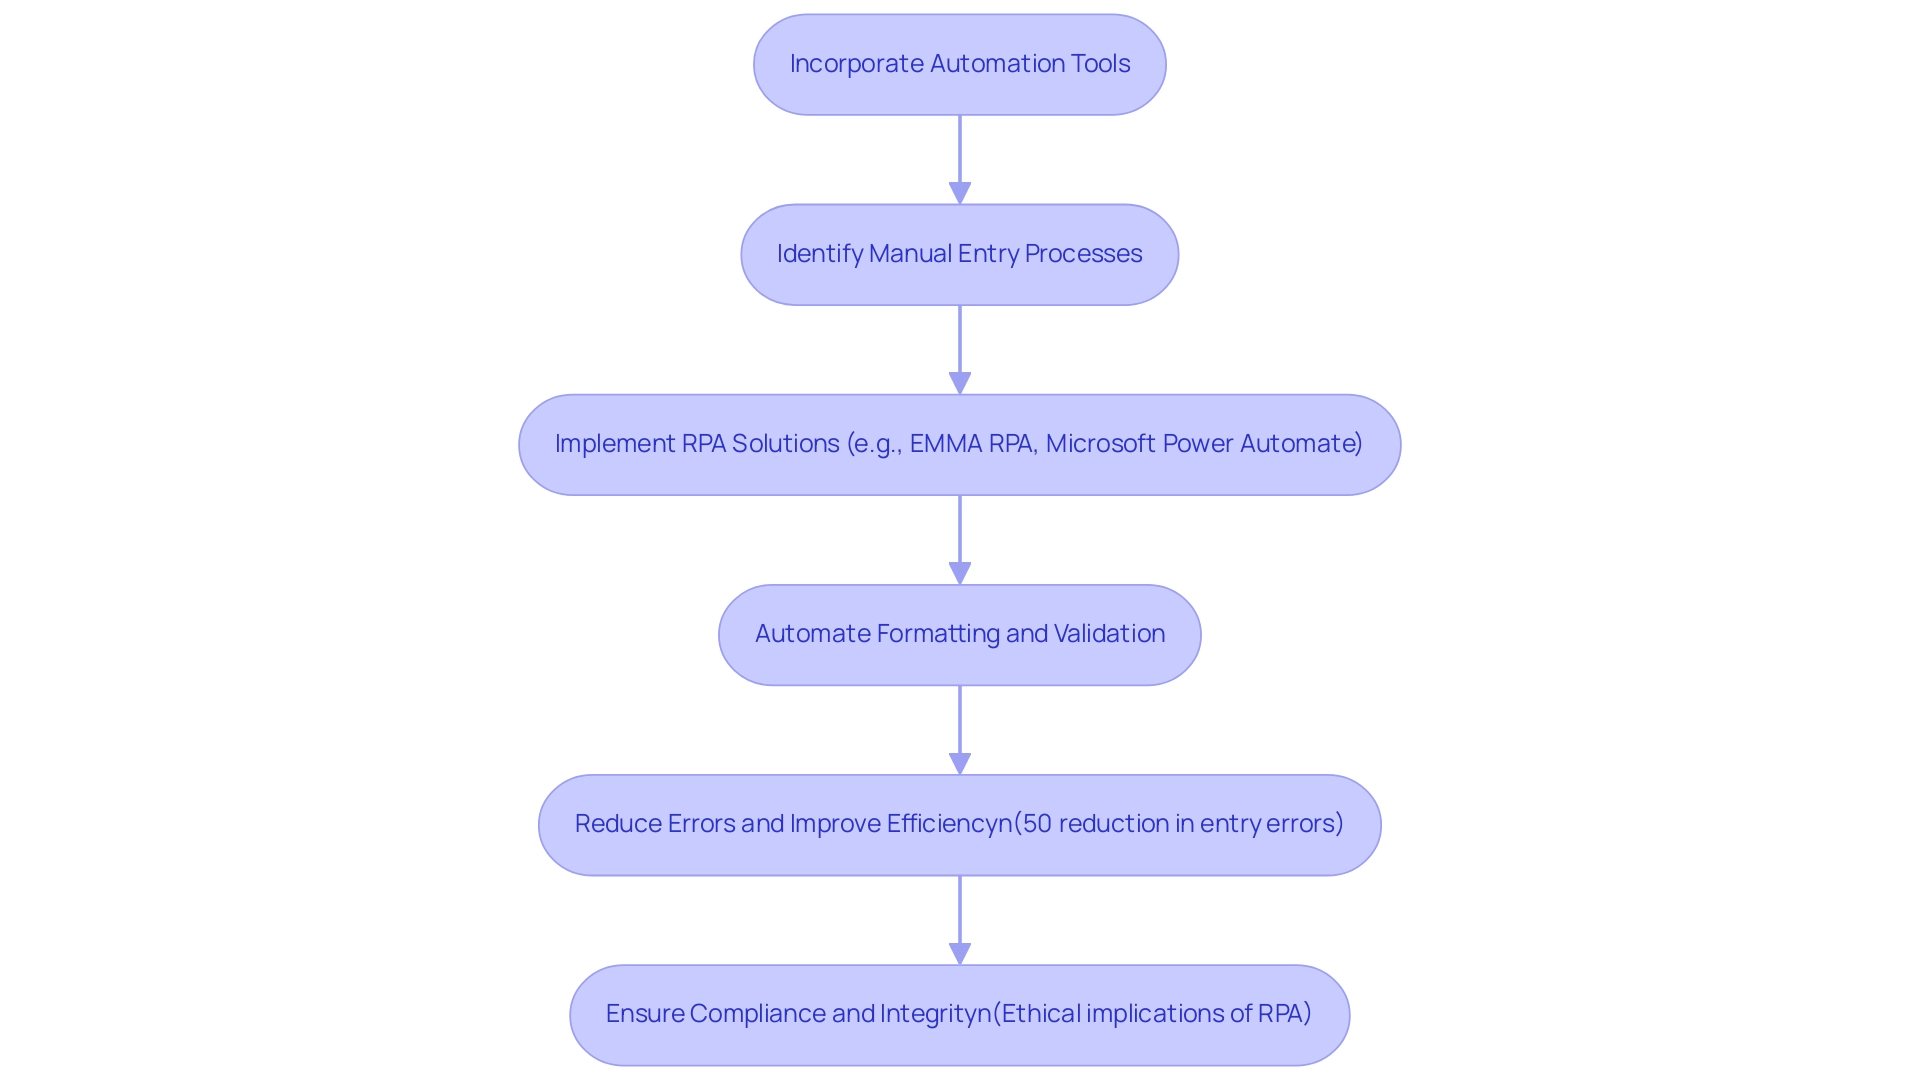
Incorporating automation tools into information management processes significantly enhances efficiency and accuracy. Robotic Process Automation (RPA) solutions, such as EMMA RPA and Microsoft Power Automate, streamline the formatting and validation of information upon import. This effectively reduces the time spent on manual entry and minimizes the potential for errors. For instance, RPA tools can be programmed to identify and rectify duplicate headers or inconsistent formatting before finalizing the information.
This proactive approach ensures that information is consistently structured, which is crucial for effective analysis and reporting. The application of such automation not only enhances operational efficiency but also leads to substantial improvements in information accuracy. Statistics indicate that organizations leveraging RPA can reduce errors in entry by up to 50%, showcasing the technology’s potential to transform management practices.
Among RPA adopters, robots could contribute as much as 52% of work capacity, further emphasizing the significant impact of RPA on operational efficiency. As Dmitriy Malets observes, ‘RPA tools can be programmed to adhere to regulatory compliance standards, ensuring that all processes are compliant.’ This highlights the importance of automation in preserving information integrity. Furthermore, a case study on a mid-sized company demonstrates how automating repetitive tasks through GUI automation resulted in a 70% decrease in entry mistakes and an 80% enhancement in workflow efficiency, underscoring the quantifiable results of such implementations.
The company faced challenges like manual information entry errors and slow software testing, which were effectively addressed through automation. However, it is essential to consider the ethical implications of RPA, particularly regarding employment and information privacy, as these factors will increasingly shape the landscape of automation. With industry organizations striving to set standards for RPA implementations, the future of information handling is poised for a revolution propelled by automation, ensuring that best practices and security are prioritized.
5. Name: Transforming Data Management with Business Intelligence Insights
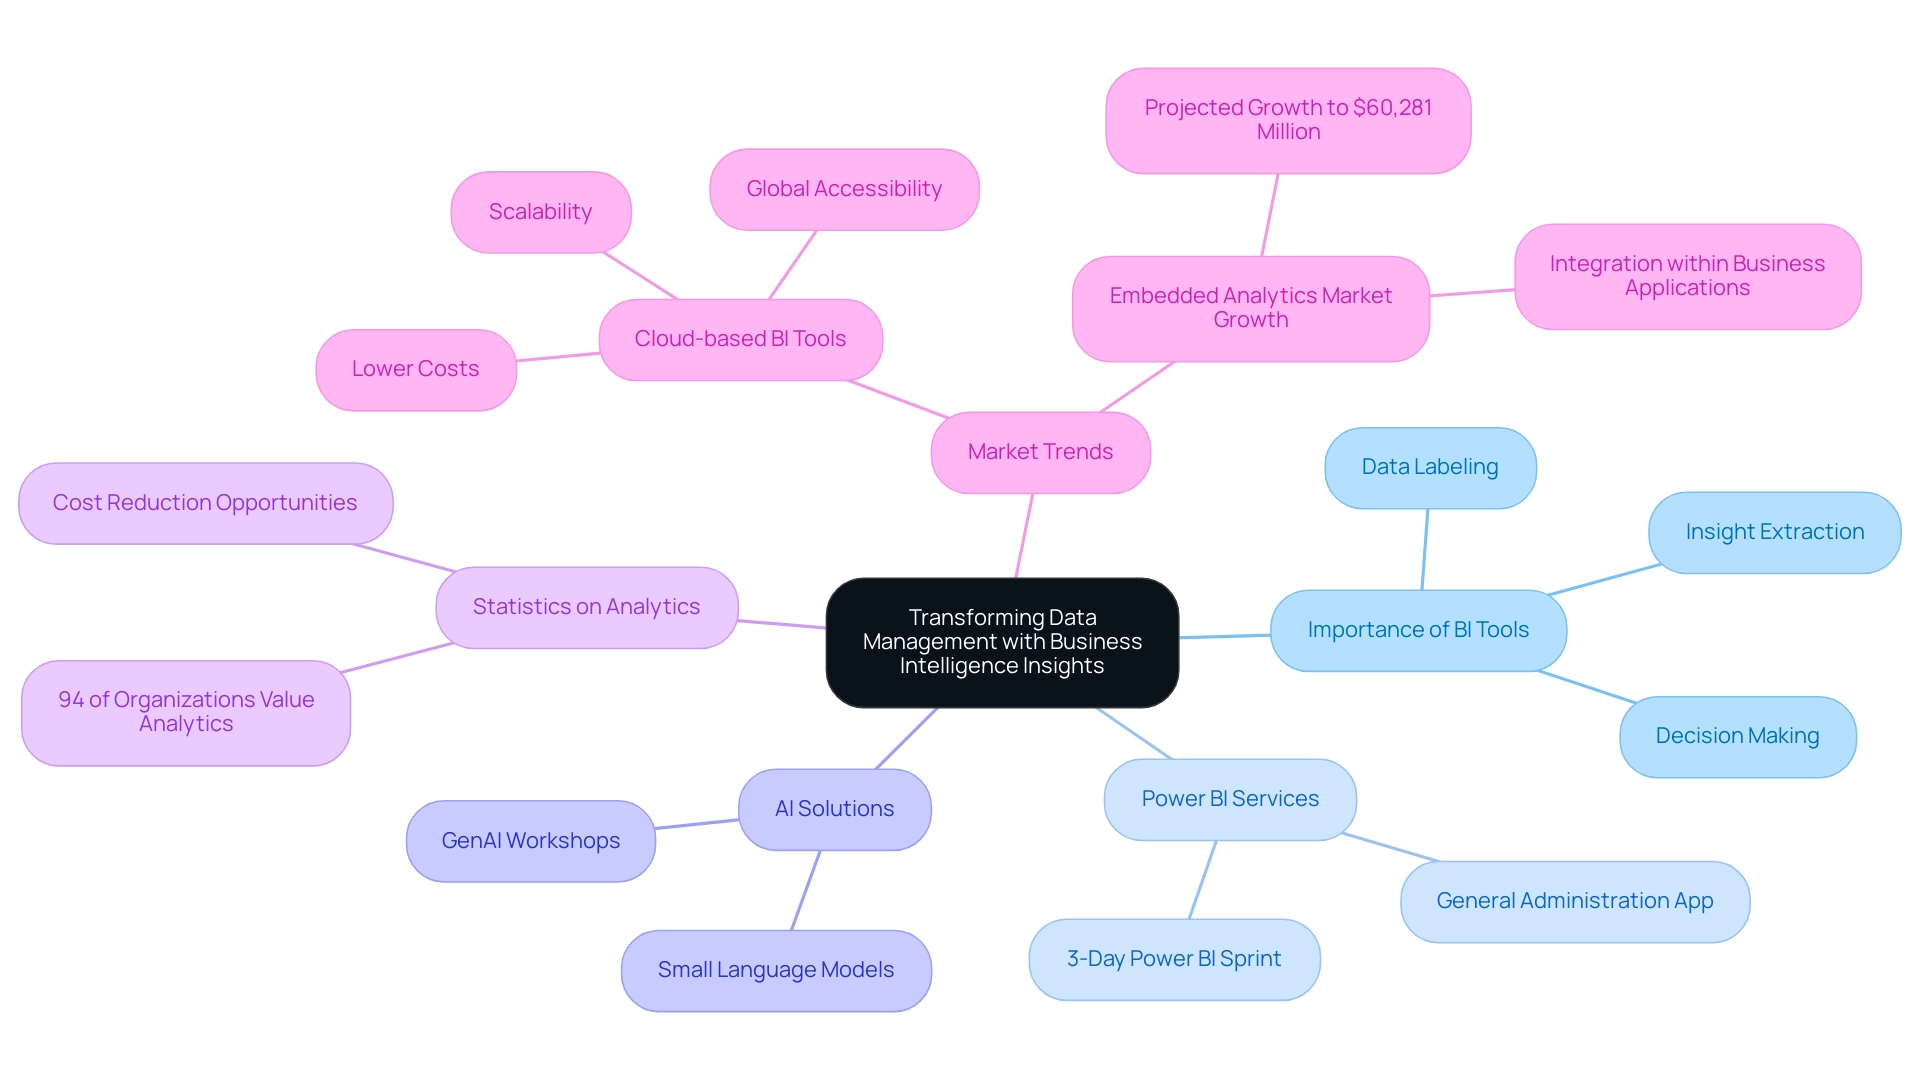
Business Intelligence (BI) tools are pivotal in revolutionizing information management practices, particularly regarding the initial row of information. Properly labeling and formatting the first row in a data source allows organizations to harness the full potential of BI tools, enabling the extraction of valuable insights. For instance, BI dashboards can effectively visualize trends, relying on the accurate categorization provided by the header row, which empowers teams to make informed decisions.
Moreover, our Power BI services simplify the reporting process through offerings like the 3-Day Power BI Sprint, facilitating quick creation of professional reports that improve consistency and actionable guidance. Additionally, the General Administration App offers extensive oversight and intelligent evaluations, further supporting operational efficiency. Prioritizing the effective management of the first row in a data source not only strengthens an organization’s information strategy but also drives improved operational insights and strategic growth.
As Ivan Blagojevic points out, ‘94% of organizations regard analytics solutions as essential for their growth,’ highlighting the crucial role of well-organized information in attaining business goals. Furthermore, our customized AI solutions, including Small Language Models for efficient information analysis and GenAI Workshops for practical training, can navigate the overwhelming AI landscape, addressing challenges such as poor master information quality and perceived complexities. BI tools can assist organizations in identifying bottlenecks and revealing opportunities for cost reduction, underscoring the practical advantages of efficient information handling.
The growing popularity of cloud-based BI tools reinforces this trend, providing lower costs, scalability, and global information accessibility—essential for modern enterprises aiming to optimize their management practices. Additionally, the projected growth of the embedded analytics market, expected to reach $60,281 million by 2023, signifies a trend towards more integrated data solutions within enterprise applications, reinforcing the relevance of BI tools in today’s data-driven environment.
Conclusion
The management of the first row in data sources represents a foundational aspect of effective data management that cannot be overlooked. This header row serves as a critical guide for interpreting and analyzing data, with its clarity directly influencing data accuracy and decision-making processes. By standardizing header naming conventions, implementing data validation, and utilizing templates for consistency, organizations can mitigate common challenges such as header duplication and inconsistent formatting—issues that are known to result in significant data entry errors.
Moreover, the integration of Robotic Process Automation (RPA) into data management practices enhances efficiency by automating repetitive tasks, reducing manual entry errors, and ensuring compliance with regulatory standards. The transformative power of RPA, combined with Business Intelligence (BI) tools, allows organizations to unlock valuable insights from their data, driving informed decision-making and strategic growth.
In a rapidly evolving digital landscape, prioritizing the meticulous management of the first row not only safeguards data integrity but also positions organizations to harness the full potential of their data assets. As businesses continue to navigate the complexities of data analysis, recognizing and optimizing the role of the header row will be essential for achieving operational excellence and fostering innovation in data-driven environments.
Overview
This article delves into mastering the SUMMARIZE function in DAX, highlighting its essential role in crafting summary tables that streamline data analysis and reporting. It presents a detailed examination of the syntax, practical applications, and best practices for effectively employing SUMMARIZE. By illustrating its impact on operational efficiency and decision-making within business intelligence contexts, the article provides valuable insights for professionals seeking to enhance their analytical capabilities.
Introduction
In the realm of data analysis, distilling vast amounts of information into actionable insights is more crucial than ever. The SUMMARIZE function in DAX emerges as a powerful ally for analysts, enabling the creation of summary tables that streamline the aggregation process, akin to SQL’s GROUP BY clause. As organizations increasingly turn to Business Intelligence solutions to navigate the complexities of data, understanding how to leverage this function becomes essential. With its capacity to enhance reporting efficiency and clarity, SUMMARIZE not only addresses common challenges such as time-consuming report generation but also plays a pivotal role in driving strategic decision-making. As the landscape of data analytics continues to evolve, mastering DAX functions like SUMMARIZE will be key to unlocking the full potential of data-driven insights.
Understanding the SUMMARIZE Function in DAX
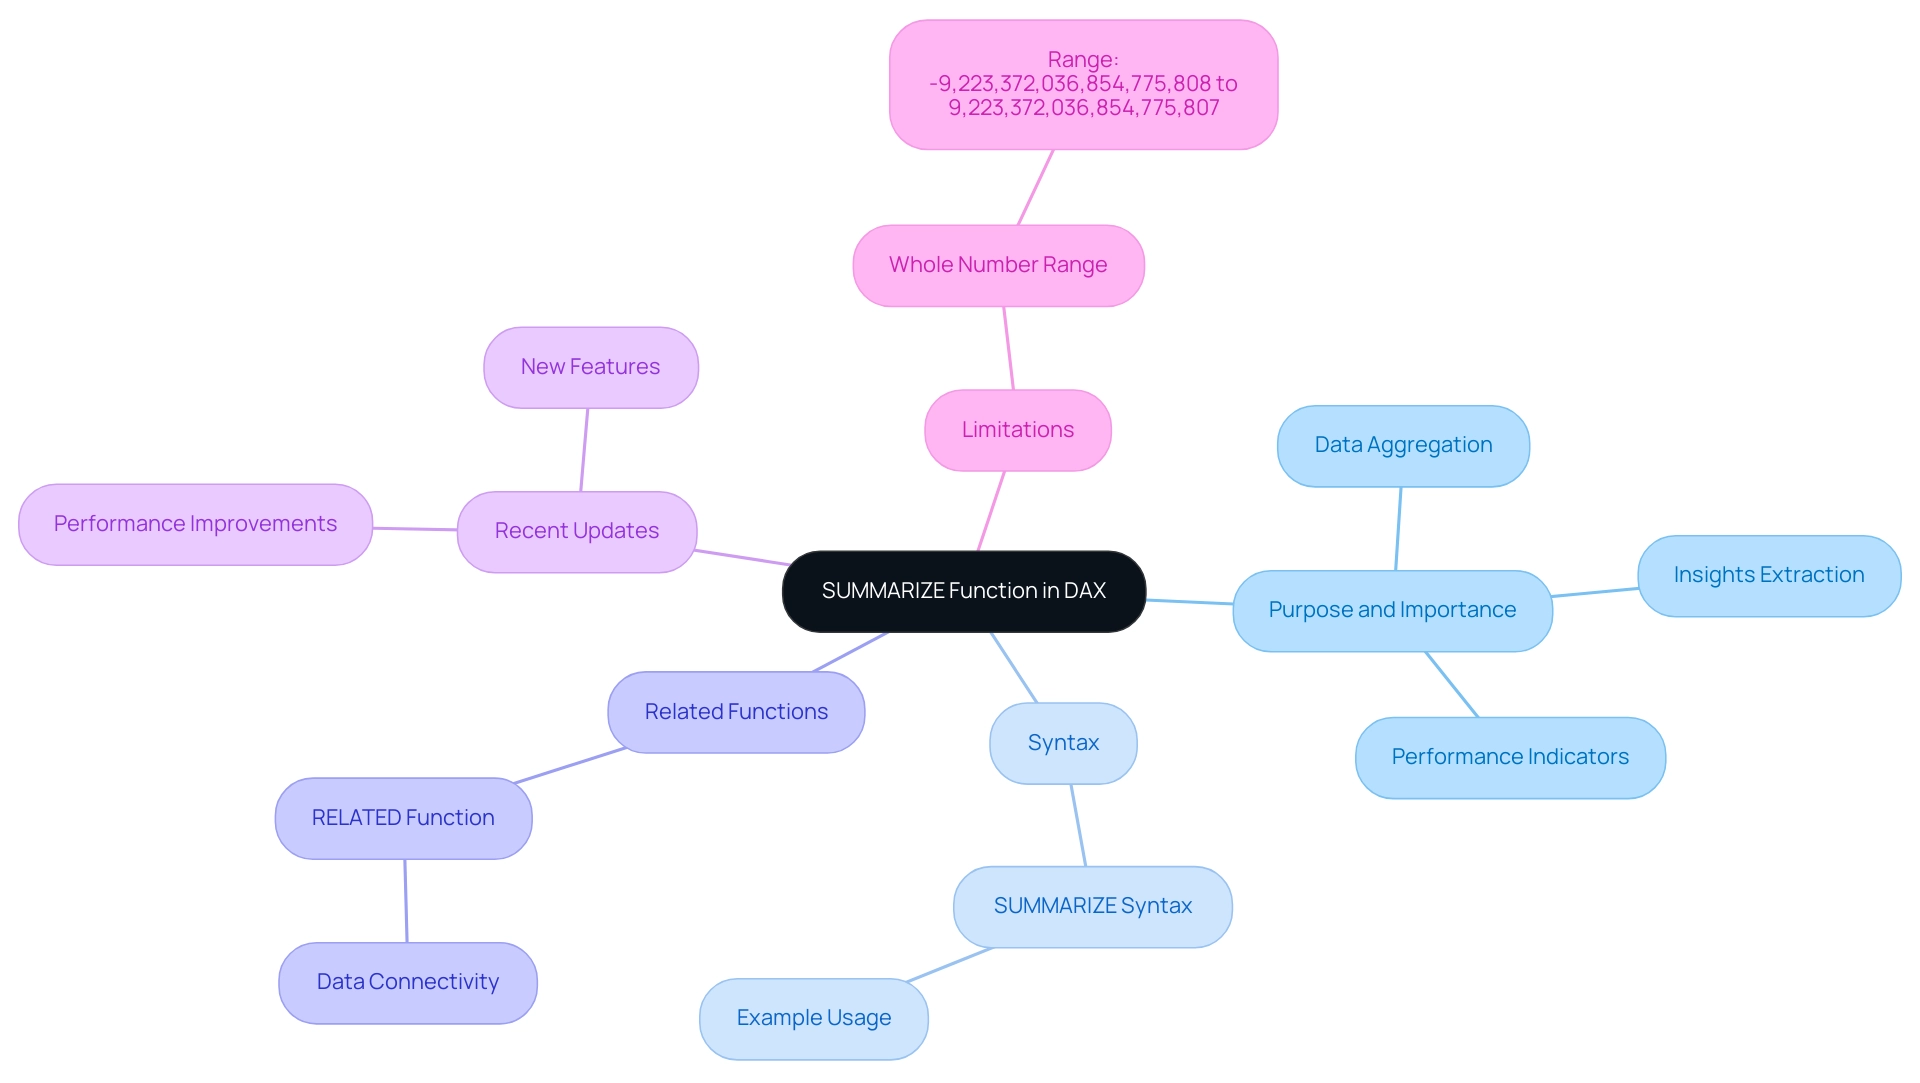
The capability to summarize in DAX serves as a crucial resource for generating summary tables by organizing information based on designated columns. Functioning similarly to a GROUP BY clause in SQL, it enables users to aggregate information efficiently. The syntax for the SUMMARIZE operation is as follows:
SUMMARIZE(<table>, <groupBy_columnName>[, <groupBy_columnName>]…)
In today’s data-driven environment, swiftly extracting meaningful insights is essential for maintaining a competitive edge. This operation proves vital in scenarios where summarizing information for reporting is necessary, allowing for rapid insights extraction from extensive collections. As we look ahead to 2025, organizations increasingly depend on Business Intelligence to drive growth and innovation, underscoring the expanding importance of DAX in analytics and its rising adoption across various industries.
Statistics indicate that DAX operations, including SUMMARIZE, are utilized in over 70% of analysis tasks, highlighting their essential role in effective management and operational efficiency.
It’s important to note that whole numbers in DAX must reside within the range of -9,223,372,036,854,775,808 to 9,223,372,036,854,775,807, a crucial limitation to consider when working with DAX operations.
Understanding the operation to summarize in DAX is vital for anyone aiming to harness its power for analysis, as it lays the groundwork for more intricate calculations and manipulations. For instance, this feature can be employed to create summary reports that highlight key performance indicators, facilitating informed decision-making. This aligns with the need for practical guidance in addressing issues related to time-consuming report creation and inconsistencies in information.
Moreover, the RELATED feature is essential for retrieving information from interconnected tables, enhancing connectivity in Power BI. This function complements the SUMMARIZE function by allowing users to pull in relevant information from other tables, thereby enriching the summary reports generated.
Recent updates in 2025 have further enhanced the capabilities of the SUMMARIZE function, making it even more robust for those looking to summarize in DAX. These updates include improved performance and additional features that streamline the summarization process. Real-world examples demonstrate its effectiveness in generating concise reports that drive strategic insights, solidifying its importance in analysis and the ongoing evolution of tailored AI solutions.
In addition, RPA solutions like EMMA RPA and Power Automate can significantly enhance operational efficiency by automating repetitive tasks involved in preparation and reporting. This not only decreases the time spent on these tasks but also minimizes errors, allowing organizations to concentrate on deriving actionable insights from their information. As businesses navigate the overwhelming AI landscape, tailored AI solutions can assist them in identifying the right technologies that align with their specific needs, ensuring they leverage Business Intelligence effectively for informed decision-making.
Syntax and Parameters of SUMMARIZE
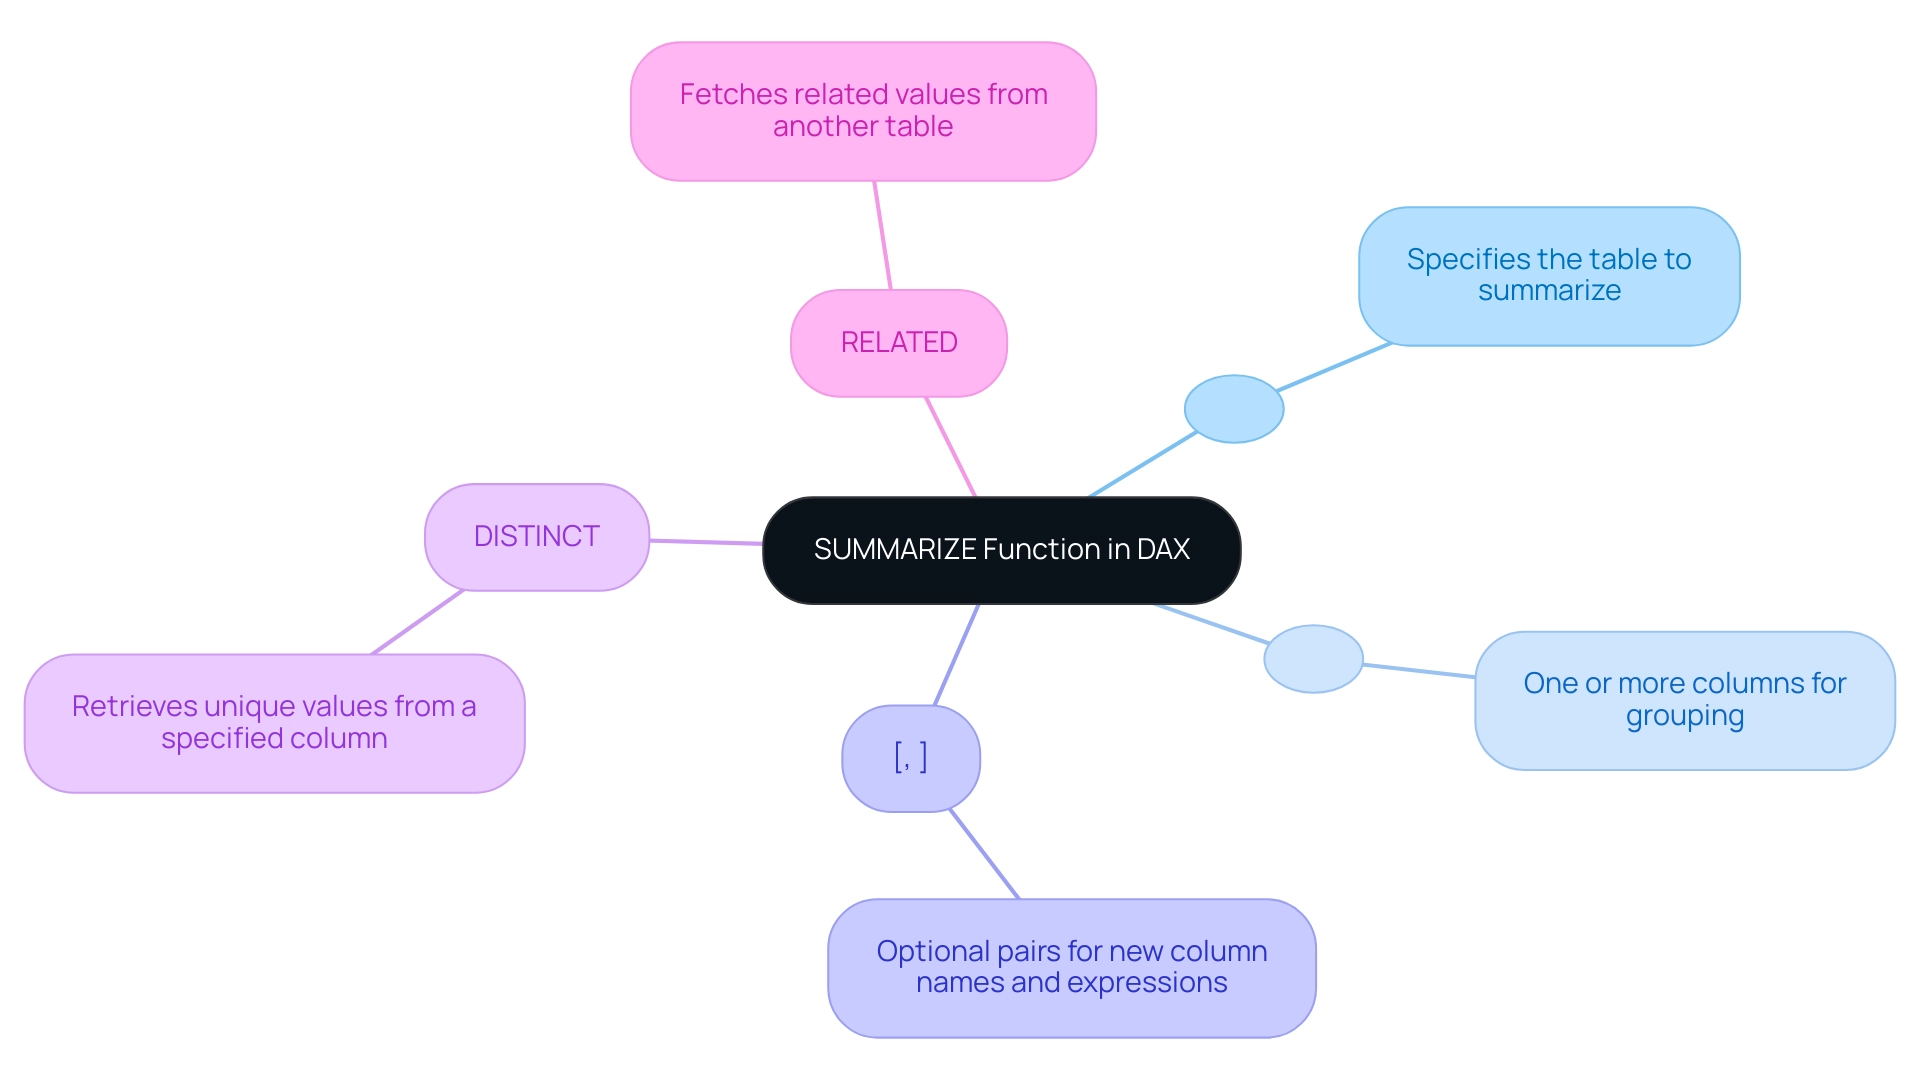
To summarize in DAX, the SUMMARIZE function stands out as a powerful tool that necessitates specific parameters for effective operation within the broader context of DAX queries, which are designed to retrieve, filter, and analyze information in Power BI. This capability facilitates custom calculations and aggregations, making it indispensable for effective summarization and addressing challenges such as time-consuming report creation and inconsistencies. Below is a detailed breakdown of its syntax:
SUMMARIZE(<table>, <group by_column name>[, <group by_column name>]…, [<name>, <expression>]…)
: This parameter specifies the table you wish to summarize.
- <groupBy_columnName>: You can include one or more columns that will serve as the basis for grouping the information.
- [
, : These are optional pairs that allow you to define a new column name alongside the corresponding DAX expression to compute its value.] For instance, consider a sales table where you want to summarize sales information by product category. The DAX expression would look like this:
SUMMARIZE(Sales, Sales[Category], "Total Sales", SUM(Sales[Amount]))This command generates a new table that organizes sales by category while calculating the total sales for each category, thereby unlocking the power of Business Intelligence for informed decision-making. Mastering these parameters is essential to summarize in DAX effectively, enabling you to derive meaningful insights from your information and drive business growth and innovation.
Moreover, understanding the DISTINCT operation is crucial, as it retrieves unique values from a specified column, enhancing the summarization process. For instance, if you wish to summarize sales data while ensuring that each product category is included only once, you would utilize the DISTINCT feature along with a summarization method.
Additionally, consider how the RELATED feature can work alongside SUMMARIZE. This method retrieves related values from another table, enabling deeper analysis in reports. For example, if you summarize sales information by category and also want to include related product details, using RELATED can enhance your report’s depth.
RPA (Robotic Process Automation) can further enhance the efficiency of utilizing DAX capabilities by automating the report generation process. This approach not only reduces the time spent on manual tasks but also minimizes the risk of errors, effectively addressing staffing shortages and outdated systems. By integrating DAX with RPA, businesses can streamline their analysis workflows, ensuring that insights are generated quickly and accurately.
As Yana Khare, a student, aptly puts it, “Happiness can be found even in the darkest of times if one remembers to turn on the light.” This quote resonates with the journey of mastering DAX capabilities and RPA, reminding us that comprehending these tools can illuminate the path to insightful analysis.
Interpreting Return Values from SUMMARIZE
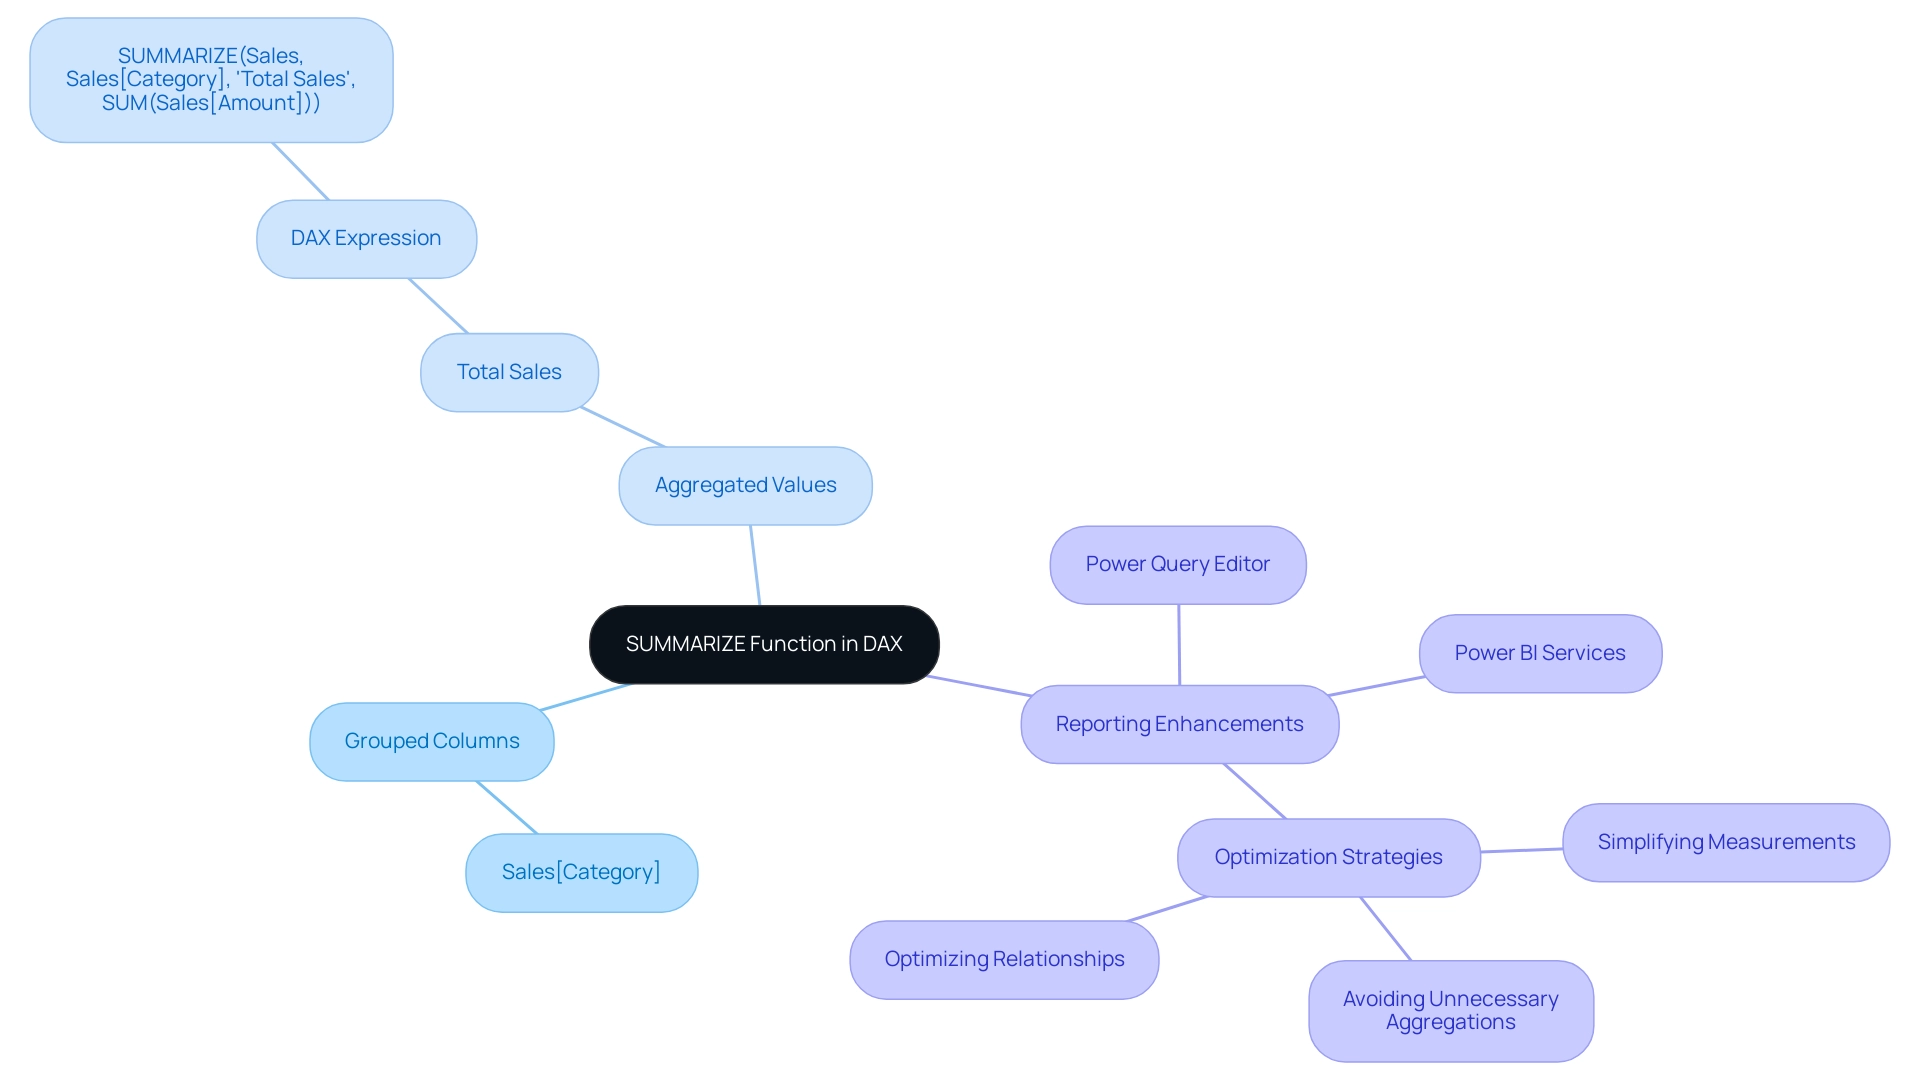
The capability to summarize in DAX serves as a powerful tool, creating a summary table based on the specified
groupBy_column Namearguments and any additional calculated columns defined in the expression pairs. The output is structured as a table, where each row represents a unique combination of the grouped columns, accompanied by aggregated values as specified.For example, consider the following DAX expression:
SUMMARIZE(Sales, Sales[Category], "Total Sales", SUM(Sales[Amount]))This command produces a table that lists each product category alongside its corresponding total sales amount. Grasping the output of the SUMMARIZE function is essential for effective visualization and interpretation in DAX, empowering users to derive actionable insights that facilitate informed decision-making.
To enhance your reporting capabilities, our Power BI services ensure efficient reporting and consistency. We offer a 3-Day Power BI Sprint that enables the quick creation of professionally designed reports, alongside a General Management App for comprehensive management and smart reviews. However, challenges such as time-consuming report creation and inconsistencies can hinder effective decision-making.
Regular updates to Power BI tools enhance user experience and system stability, making it essential for organizations to stay current with these improvements. Additionally, leveraging the Power Query Editor in Power BI allows for cleansing, shaping, and enrichment before loading, ensuring quality for analysis. This aligns with our focus on improving information quality through AI solutions, including Small Language Models and GenAI Workshops, which facilitate hands-on training and tailor-made AI tools for enhanced analysis.
A case study titled “Speeding Up DAX Query Execution” underscores the significance of optimizing DAX queries. By simplifying measurements and avoiding unnecessary aggregations, organizations can enhance query performance, leading to faster execution times and improved analysis efficiency in Power BI. As Utpal Kar aptly states, “Measurements should be simplified, surplus-to-requirements aggregations avoided, and relationships should be optimized.”
This method not only streamlines information processing but also enhances the overall quality of insights derived from the information. It reinforces the importance of Business Intelligence and RPA in driving insight-driven analysis and operational efficiency for business growth. Moreover, cooperation with stakeholders is essential for developing high-performing, scalable information solutions, ensuring that the implementation of tools is effective and aligned with organizational objectives.
Practical Use Cases for SUMMARIZE in DAX
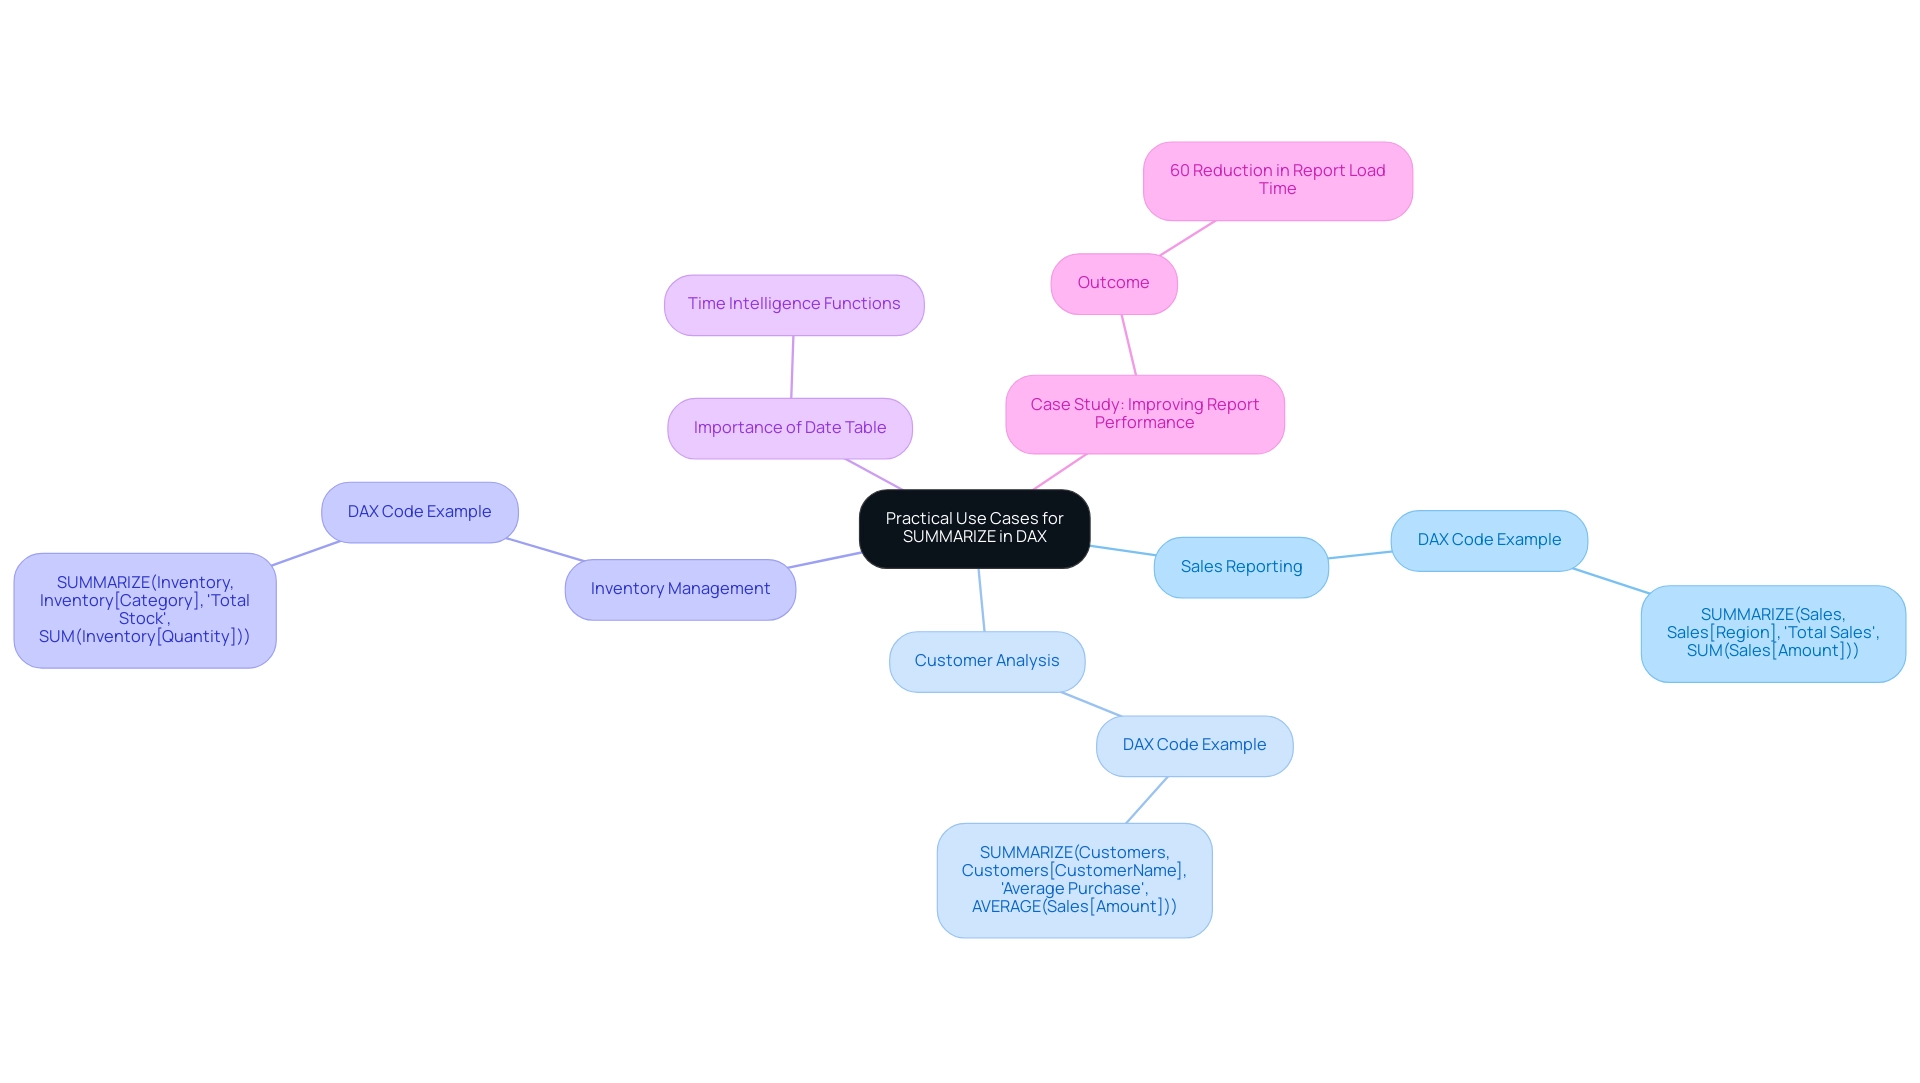
The SUMMARY function in DAX stands as a powerful tool, adept at summarizing across various practical scenarios, thereby significantly enhancing information analysis capabilities while addressing key challenges in data handling. Consider these pivotal applications:
-
Sales Reporting: By summarizing sales information by region or product line, organizations gain invaluable insights into performance metrics. For instance:
SUMMARIZE(Sales, Sales[Region], "Total Sales", SUM(Sales[Amount]))This method enables businesses to pinpoint high-performing areas, effectively tackling the common challenge of time-consuming report creation and allowing for strategic adjustments.
-
Customer Analysis: Understanding customer behavior is essential for driving sales. The SUMMARIZE function can group customer data to calculate average purchase amounts per customer, revealing insights into spending patterns:
SUMMARIZE(Customers, Customers[CustomerName], "Average Purchase", AVERAGE(Sales[Amount]))This analysis is instrumental in tailoring marketing efforts to boost customer engagement and overcome data inconsistencies.
-
Inventory Management: Effective inventory management is crucial for operational efficiency. By summarizing stock levels by product category, businesses can swiftly identify low stock items:
SUMMARIZE(Inventory, Inventory[Category], "Total Stock", SUM(Inventory[Quantity]))This functionality supports the maintenance of optimal stock levels and the prevention of stockouts, showcasing how RPA can streamline these processes.
These examples illustrate the adaptability of the capability to summarize in DAX, making it an essential resource for analysts utilizing Power BI or Excel. As organizations increasingly rely on data-driven decision-making in 2025, the ability to efficiently summarize in DAX and analyze data will be paramount. A well-organized Date table is crucial for the effective operation of time intelligence operations in DAX, ensuring precise calculations over time.
A recent case study highlighted how one organization enhanced report performance by 60% by replacing complex nested iterators with straightforward measures and aggregated tables, specifically employing the summarizing technique. This transition resulted in a more responsive dashboard, underscoring the significance of mastering the summarization process in DAX to improve operational efficiency and facilitate informed decision-making. Furthermore, the integration of RPA solutions, such as EMMA RPA and Power Automate, can automate the summarization process, minimizing manual effort and enhancing the effectiveness of these analyses.
By synergizing Business Intelligence strategies with RPA, businesses can unlock the full potential of their data, transforming insights into actionable results.
Best Practices and Common Challenges with SUMMARIZE
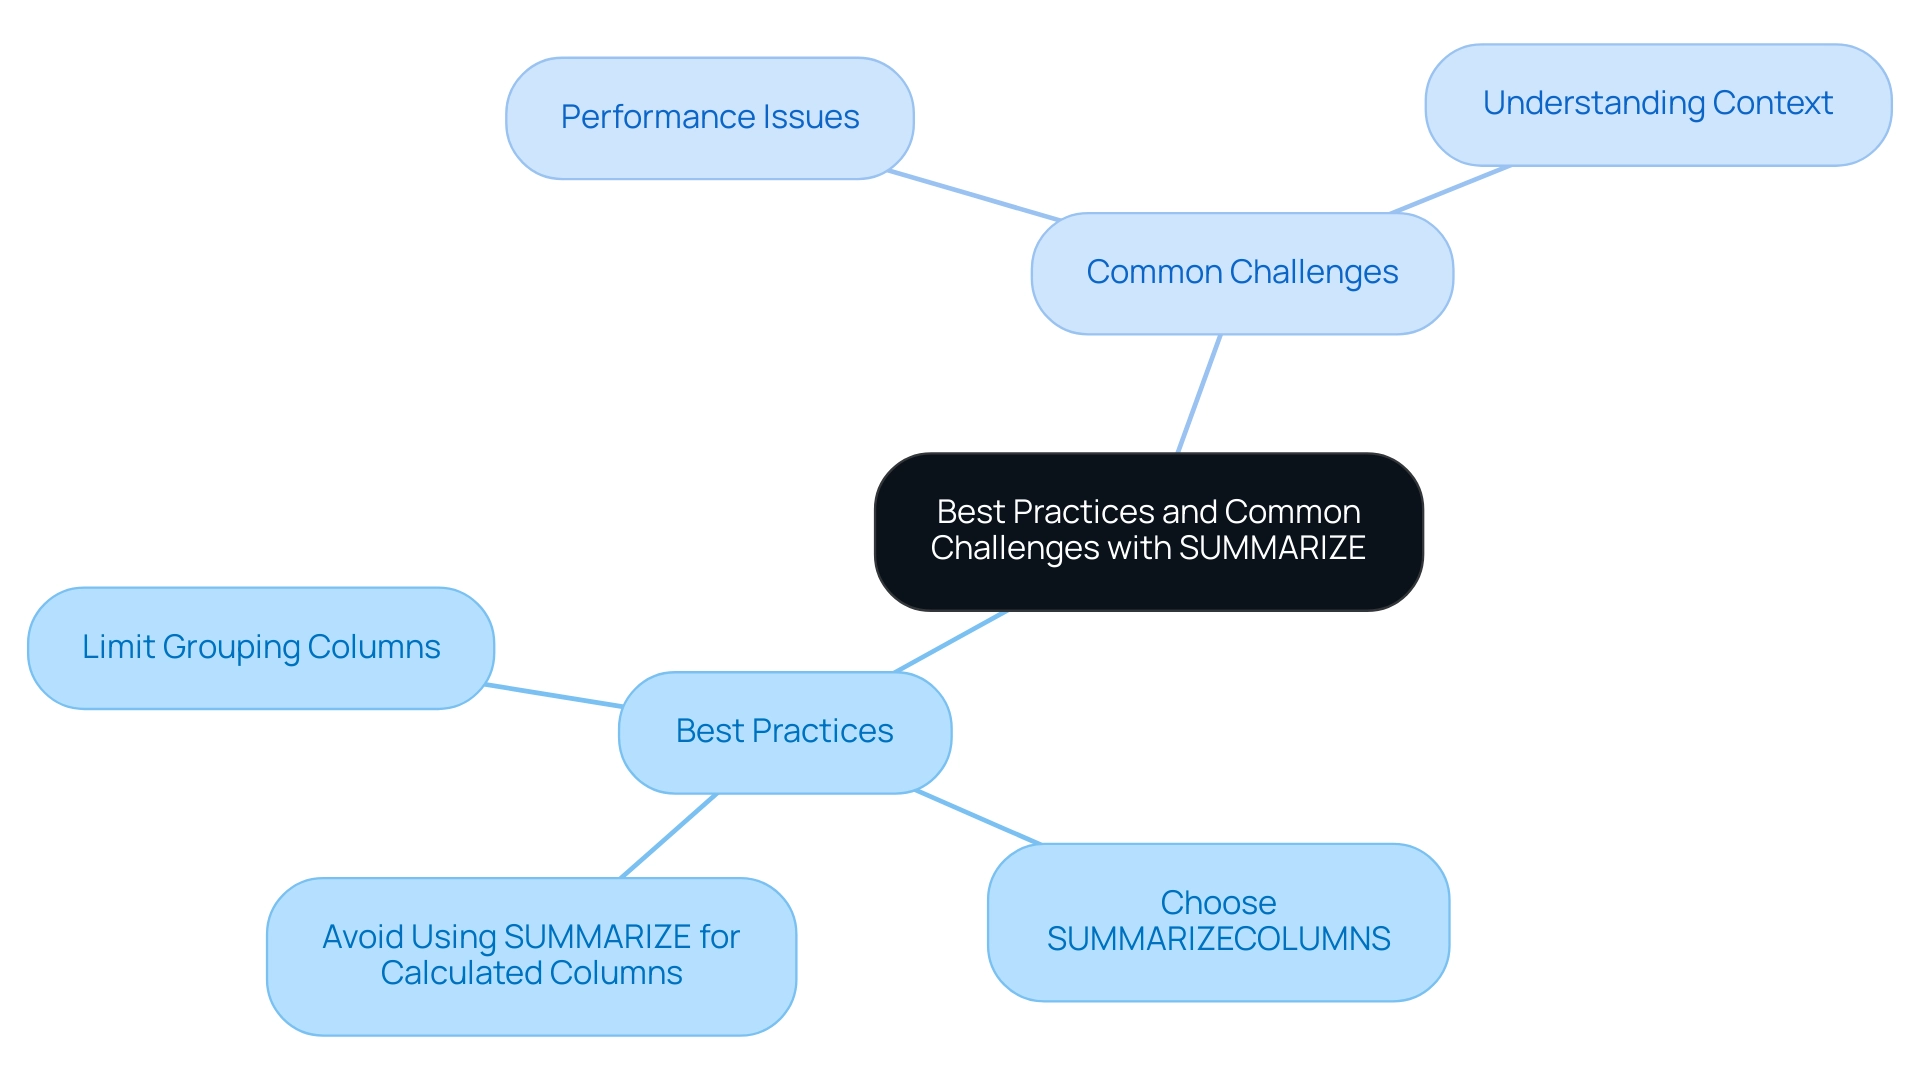
When utilizing the SUMMARIZE function in DAX, adhering to best practices can significantly enhance performance and clarity, particularly when leveraging Business Intelligence tools like Power BI for data-driven insights.
- Limit the Number of Grouping Columns: Excessive groupBy_columnName arguments can lead to performance degradation. Concentrate on the most pertinent columns to streamline calculations and facilitate quicker insights that drive business growth.
- Choose SUMMARIZECOLUMNS: For enhanced performance, SUMMARIZECOLUMNS is suggested instead of the alternative, as it is specifically optimized for querying, leading to quicker execution times. This alleviates some challenges of time-consuming report creation, enabling efficient analysis.
- Avoid Using SUMMARIZE for Calculated Columns: Instead, pair ADDCOLUMNS with GROUP BY to enhance both clarity and performance, ensuring your model remains efficient and actionable.
RPA solutions are crucial for automating repetitive information processes, greatly improving the effectiveness of DAX operations. By integrating RPA, businesses can streamline data handling, reduce manual errors, and free up valuable resources for more strategic tasks.
Common challenges encountered when using the SUMMARIZE function include:
- Performance Issues: Working with large datasets can hinder calculation speeds. Implementing filtering and aggregations judiciously is crucial to maintain efficiency, which is vital for operational effectiveness when summarizing in DAX.
- Understanding Context: It is essential to recognize that summarizing in DAX operates within a context-sensitive framework. A thorough comprehension of row and filter context is necessary to avoid unexpected results, especially when aiming for actionable insights from Power BI dashboards.
In the context of training and expertise, the ‘Improving Real World RAG Systems’ course has received a commendable rating of 4.7, showcasing the quality of training available for mastering DAX capabilities. As Eusebio Kickel aptly noted, “You have a way of making even the most challenging topics seem approachable and understandable,” which resonates with the common challenges faced by users in making data-driven decisions.
Furthermore, the case study on the ‘Power BI Training Partnership’ demonstrates how effective training can empower businesses to improve their analytical skills and make informed, insight-driven decisions through effective visualizations and dashboards. It emphasizes the practical use of the summarization tool in real-life situations, especially in addressing inconsistencies in information.
It’s also important to note that restrictions exist on DAX expressions permitted in measures and calculated columns, which can influence how users utilize the summarization capability. Recent advancements allow users to add new measures to the model directly from the DAX query view, enabling them to test changes without affecting the model until they choose to update it.
By implementing these best practices and remaining cognizant of potential challenges, users can effectively summarize in DAX, elevating their data analysis capabilities and ultimately leading to more informed decision-making and the transformation of raw data into actionable insights.
Conclusion
The SUMMARIZE function in DAX is a cornerstone for effective data analysis, enabling the creation of summary tables that distill vast datasets into manageable insights. By leveraging its capabilities, analysts can group and aggregate data efficiently, akin to SQL’s GROUP BY clause. This streamlines report generation and enhances operational efficiency. Notably, this function is essential for producing concise reports that highlight key performance indicators and plays a crucial role in driving informed decision-making within organizations.
Understanding the nuances of the SUMMARIZE function, including its syntax and practical applications, empowers users to tackle common challenges such as time-consuming report creation and data inconsistencies. Implementing best practices—like limiting the number of grouping columns and considering alternatives like SUMMARIZECOLUMNS—allows analysts to optimize performance and clarity in their data models.
Moreover, integrating RPA solutions further enhances the functionality of DAX, automating repetitive tasks and enabling analysts to focus on deriving actionable insights. As organizations navigate the complexities of data in an increasingly AI-driven landscape, mastering tools like the SUMMARIZE function is pivotal in unlocking the full potential of data-driven decision-making.
In conclusion, the SUMMARIZE function stands out as an indispensable tool in the realm of data analytics. Its ability to facilitate efficient summarization and analysis positions it at the forefront of Business Intelligence strategies. As data continues to grow in volume and complexity, harnessing the capabilities of DAX functions remains essential for organizations striving to maintain a competitive edge and drive strategic growth.
Overview
This article delves into the effective use of the PREVIOUSMONTH DAX function in Power BI, a crucial tool for time-based data analysis. It serves as a comprehensive guide, detailing the function’s syntax and its practical applications within business intelligence. Additionally, it addresses common challenges users may encounter and offers advanced techniques to enhance analytical capabilities. Mastering these tools is emphasized as a means to significantly improve reporting efficiency and decision-making processes.
Introduction
In the realm of data analysis, mastering the intricacies of Data Analysis Expressions (DAX) is pivotal for professionals seeking to unlock the full potential of their data. Among its many capabilities, time intelligence functions, such as PREVIOUSMONTH, stand out as essential tools for performing insightful temporal analyses. This article delves into the significance of DAX functions, particularly how the PREVIOUSMONTH function can transform reporting practices within business intelligence. By enabling comparisons across different time frames, analysts can effectively track trends, streamline reporting processes, and make informed decisions that drive organizational success.
Furthermore, with the integration of Robotic Process Automation (RPA), these functionalities become even more powerful. Automating repetitive tasks allows analysts to focus on strategic insights rather than manual data compilation. As organizations strive for greater efficiency and accuracy in their data analysis, understanding and applying these advanced techniques is crucial for staying ahead in a competitive landscape.
Understanding DAX Functions and Time Intelligence
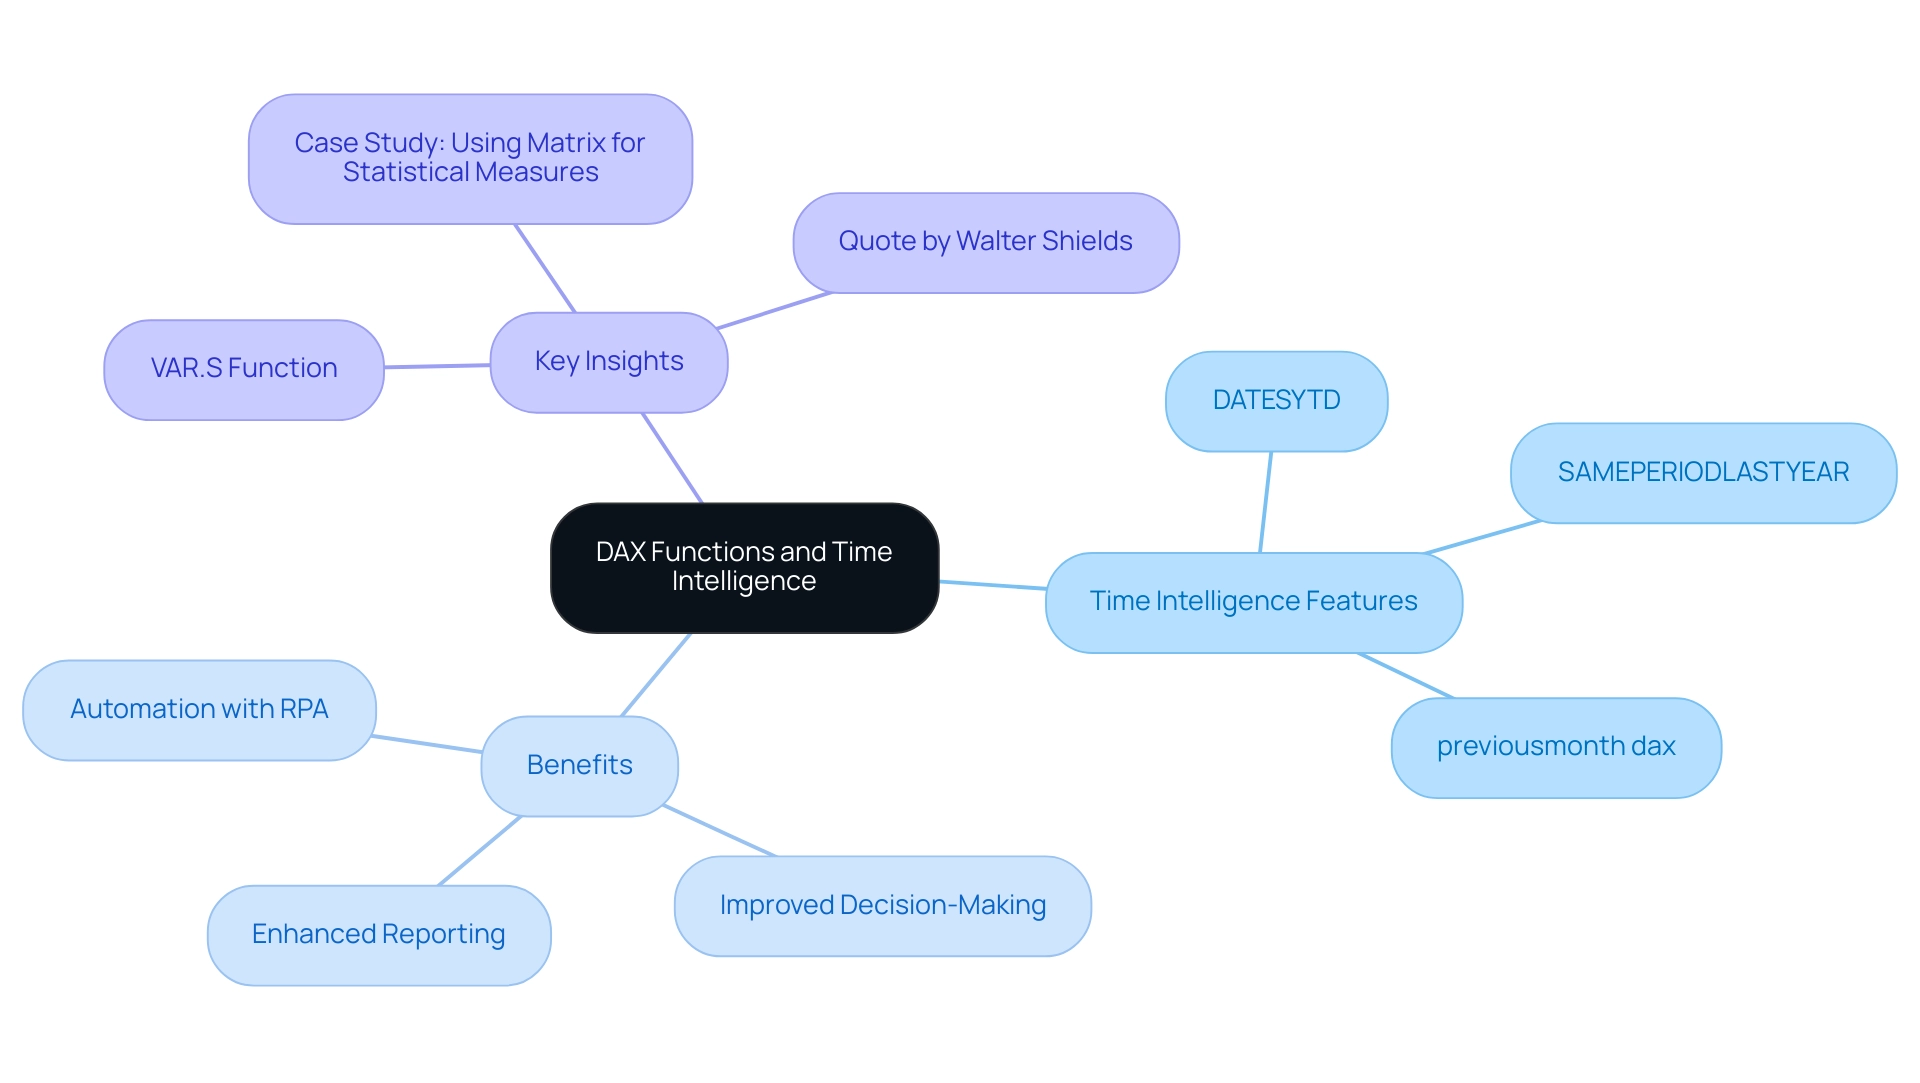
Analysis Expressions (DAX) is an essential formula language utilized in Power BI and other Microsoft platforms, designed for modeling and analysis. A vital component of DAX is time intelligence, empowering users to execute calculations that involve dates, enabling comparisons across various time periods, such as months, quarters, and years. Proficiency in DAX and its time intelligence functionalities is crucial for deriving actionable insights from information and overcoming common challenges in reporting, such as time-consuming report creation and inconsistencies that lead to confusion and mistrust in the information presented.
Significant features within this subset include:
- DATESYTD
- SAMEPERIODLASTYEAR
- previousmonth dax
Each serving unique purposes that enable analysts to monitor and evaluate trends effectively. Additionally, the VAR.S formula returns the variance of a sample population, further enhancing the analytical capabilities of DAX.
Walter Shields, in his work on starting a career in analytics from the ground up, emphasizes that ‘mastering DAX operations is essential for anyone aiming to excel in analysis.’ By mastering these time management capabilities, analysts can significantly streamline their reporting processes, reduce the time spent on report creation, and improve consistency across reports. This leads to enhanced decision-making abilities and more impactful information presentations. Furthermore, integrating RPA solutions can automate repetitive tasks related to report generation, allowing analysts to concentrate on interpreting information rather than compiling it.
Consider the case study titled ‘Using Matrix for Statistical Measures.’ This illustrates how to utilize the Matrix visualization in Power BI to present various statistical metrics, demonstrating how analysts can leverage DAX techniques alongside RPA to enhance their presentation abilities while ensuring that stakeholders receive clear, actionable advice.
Exploring the PREVIOUSMONTH DAX Function: Syntax and Usage
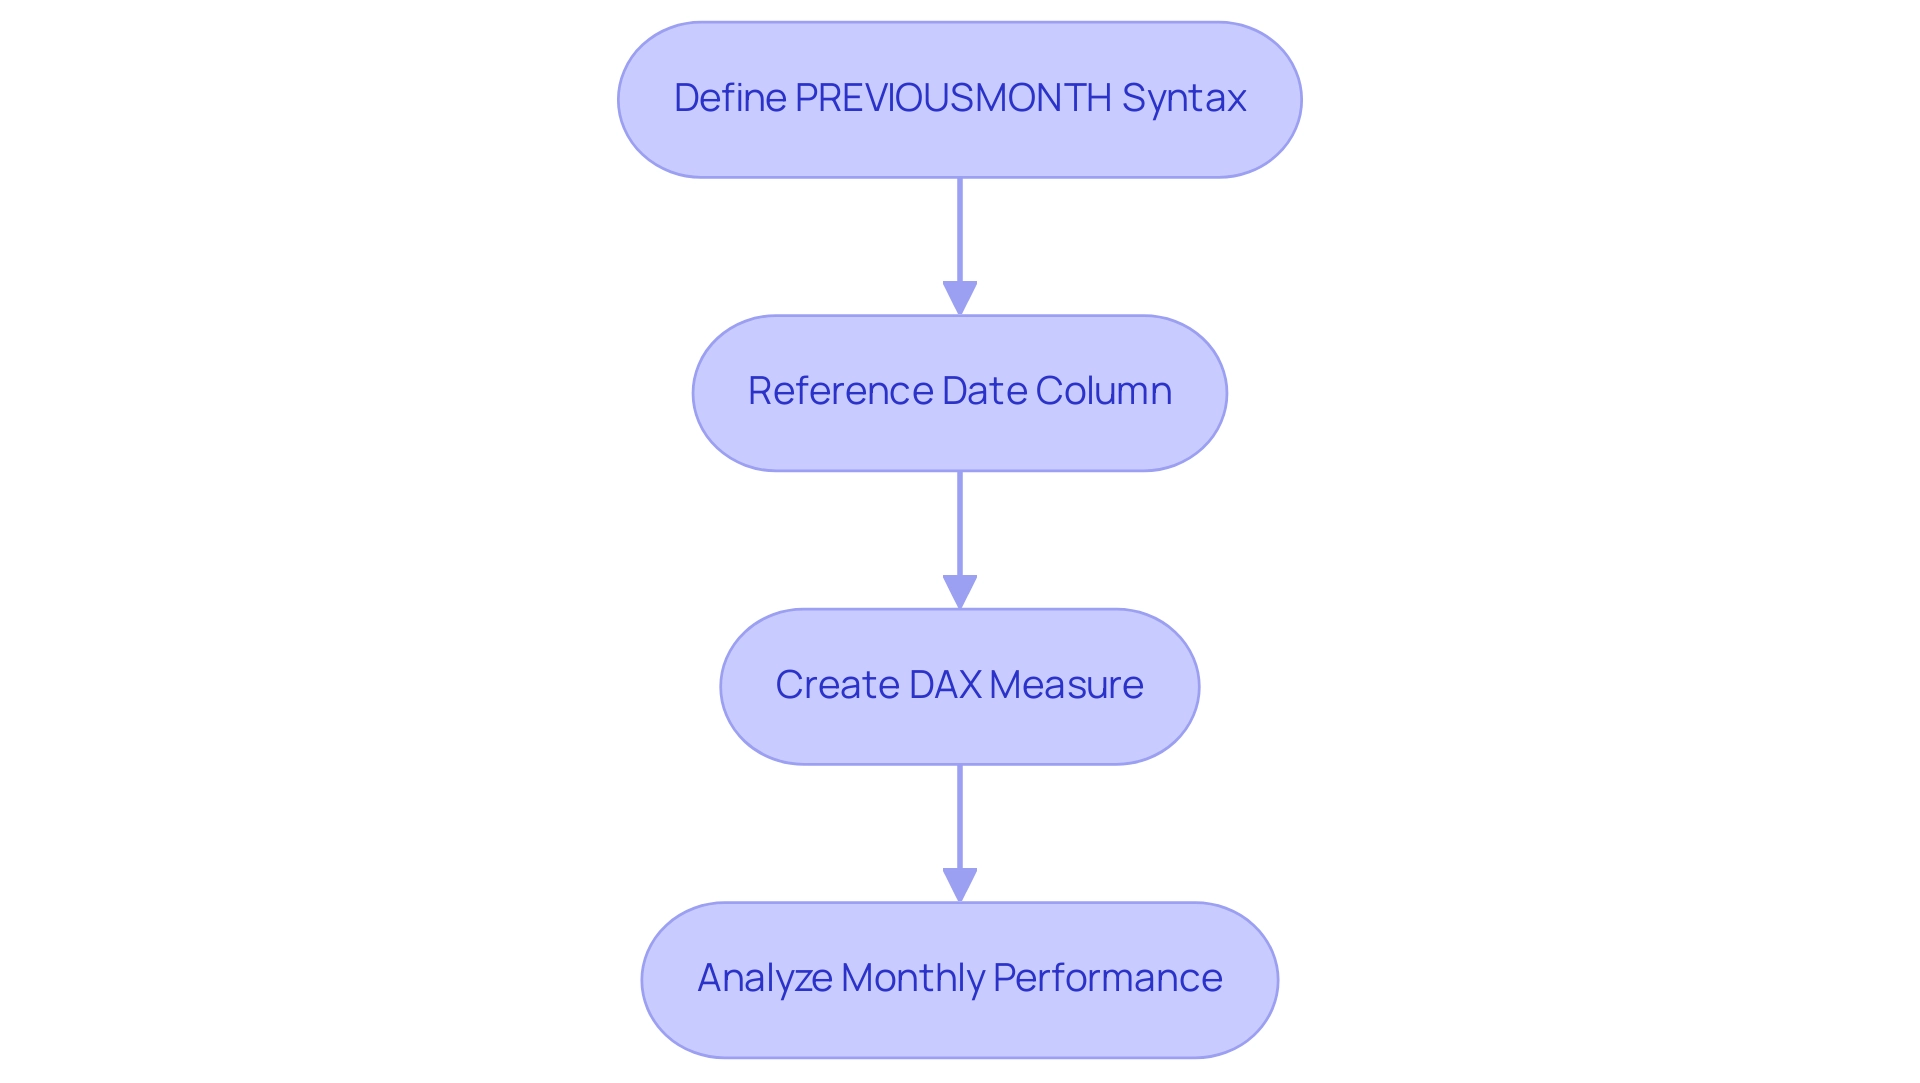
The syntax for the PREVIOUSMONTH DAX formula is straightforward, enabling effective analysis of temporal data and facilitating essential data-driven insights for operational efficiency. The function is defined as follows:
PREVIOUSMONTH(<Dates>)
Here, <Dates> must reference a column that contains date values. This procedure yields a table with a single column of dates from the prior month, starting from the earliest date in the specified column. For instance, if you have a date column named ‘Sales[Date]’, you can create a DAX measure to ascertain total sales from the previous month with the following code:
Total Sales Previous Month = CALCULATE(SUM(Sales[Amount]), PREVIOUSMONTH(Sales[Date]))
This measure dynamically computes the total sales for the month preceding the current context defined by the date filter applied in your report. Utilizing the PREVIOUSMONTH DAX function empowers analysts to conduct insightful evaluations of monthly performance, fostering a nuanced understanding of sales trends. Recent discussions among information analysts emphasize the tool’s simplicity and effectiveness, as noted by Janet: “Ok, I figured it out. It’s actually pretty simple; you just explicitly tell PBI what to do.”
Moreover, this functionality addresses common challenges in leveraging insights from Power BI dashboards, such as time-consuming report creation and inconsistencies. By streamlining the reporting process, it ensures uniformity in analysis, ultimately contributing to improved operational efficiency.
A case study on calculating order counts for the current month and previous month DAX emphasizes the practical application of this tool, demonstrating its utility in examining sales information effectively. Furthermore, it’s crucial to acknowledge that some users have raised concerns about the operation’s effectiveness, highlighting the importance of maintaining proper relationships and column references in DAX formulas. In the broader context of Business Intelligence, applying the prior month method illustrates how analytical techniques can drive growth and innovation by transforming raw data into actionable insights.
Practical Applications of the PREVIOUSMONTH Function in Business Intelligence
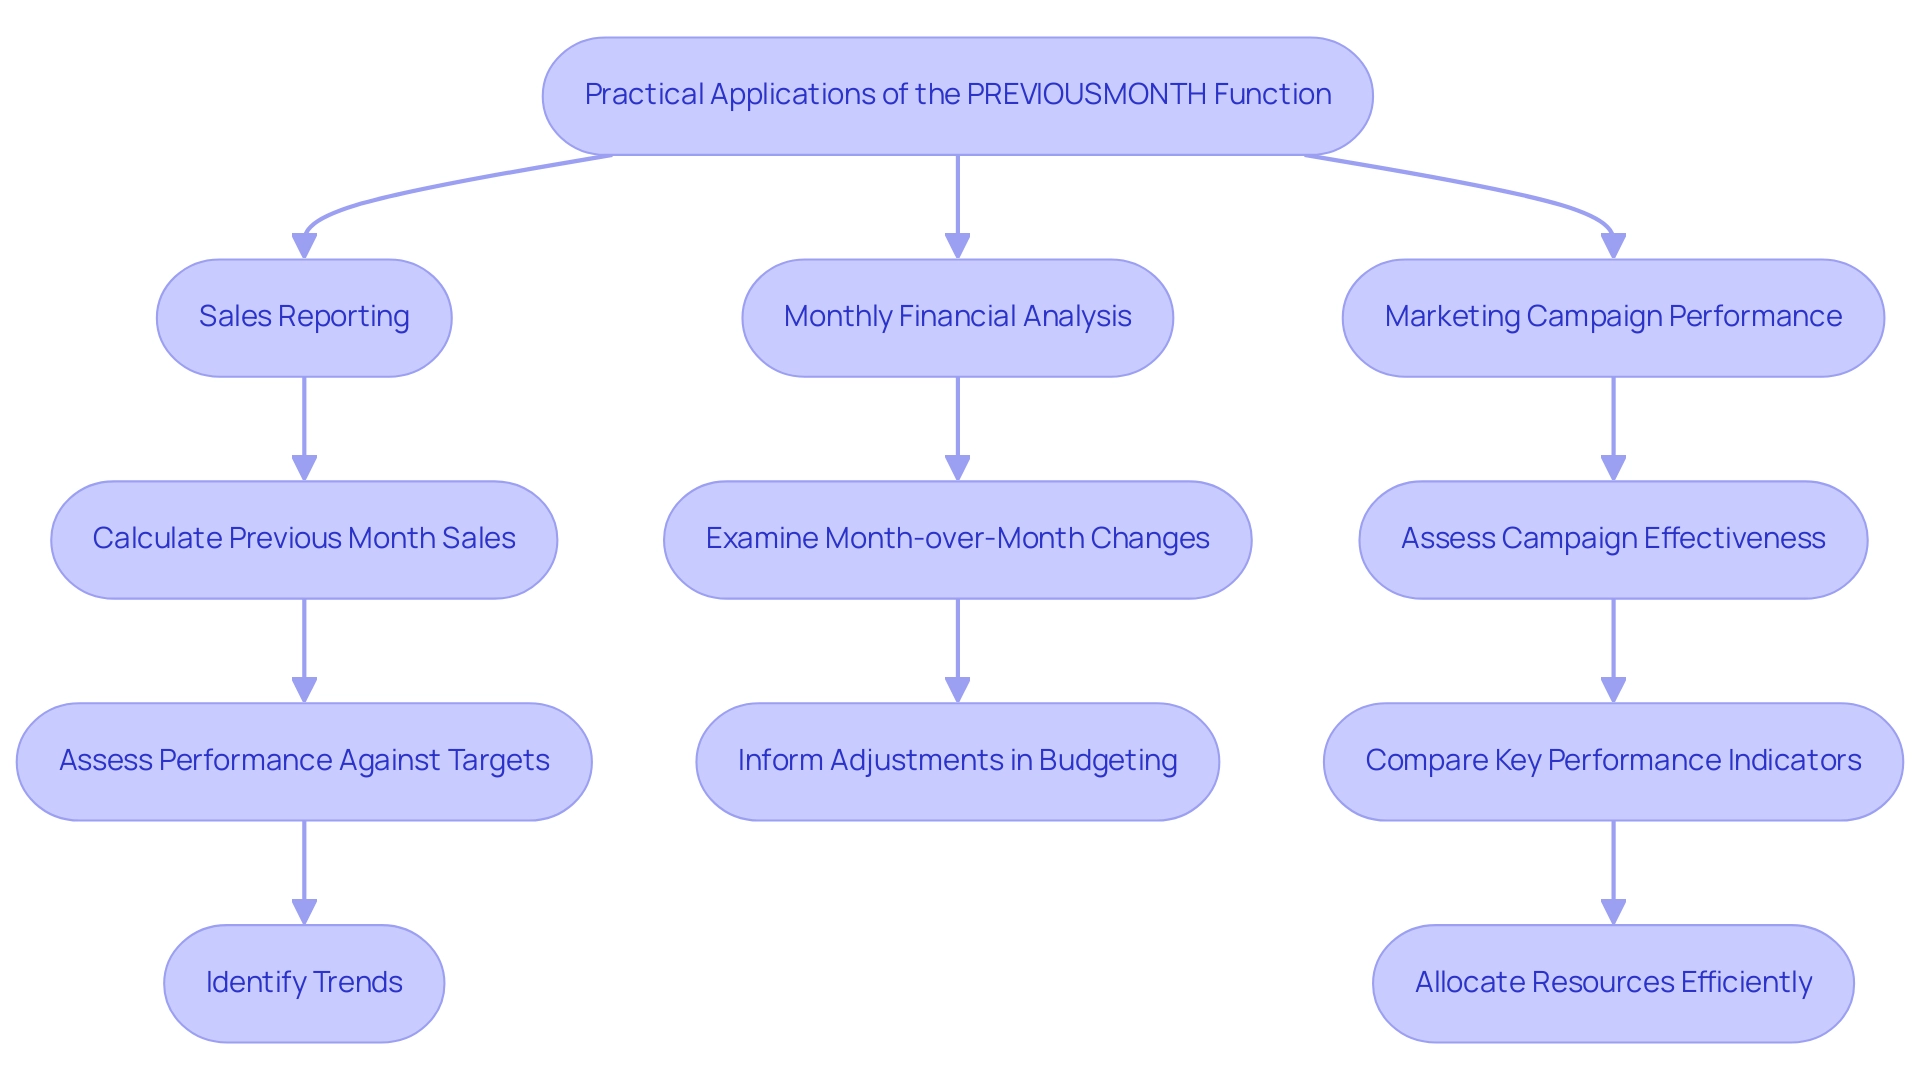
The PREVIOUSMONTH capability emerges as a crucial asset in diverse business intelligence scenarios, significantly enhancing analytical capabilities and decision-making processes, particularly when integrated with Robotic Process Automation (RPA). Notable applications include:
-
Sales Reporting: By calculating the previous month DAX sales figures, organizations can effectively assess performance against established targets. For instance, a retail business may leverage this capability in conjunction with RPA to improve information gathering and reporting, contrasting last month’s sales with current figures to identify emerging trends that could influence inventory and sales strategies. RPA not only automates these processes, minimizing the risk of human error but also liberates team members to focus on strategic initiatives rather than manual entry.
-
Monthly Financial Analysis: Financial analysts can utilize the previousmonth DAX function to examine month-over-month changes in critical metrics such as revenue, expenses, and profit margins. This analysis, enhanced by RPA for automating information aggregation, provides insights into the overall financial health of the organization, informing adjustments in budgeting and forecasting. Recent studies underscore the capacity of individual investors to time the market, highlighting the necessity of thorough information evaluation for informed decision-making. By reducing errors in information handling, RPA contributes to more accurate financial assessments.
-
Marketing Campaign Performance: Marketers can assess the effectiveness of their campaigns by comparing key performance indicators—such as leads generated or conversion rates—from the previous month DAX to current results. The integration of RPA here facilitates seamless information extraction from various platforms, ensuring that resources are allocated efficiently based on comparative analysis. This automation lessens the risk of oversight, empowering teams to direct their efforts more effectively.
Moreover, analyzing a sample of 3,036 investors reveals that understanding investor flows can enhance predictions of market trends. The case study titled “Bear Market Predictions Using Investor Flows” illustrates how a significant negative difference in flows between favorable and unfavorable periods nearly doubles the likelihood of negative market returns in the subsequent month. This insight can be further refined through RPA, which streamlines the information gathering process, simplifying the analysis of investor behavior and trends.
By integrating the previous month capability into their reports and employing RPA, organizations not only facilitate more informed decision-making but also bolster strategic planning efforts. In a rapidly evolving AI landscape, RPA stands as an essential tool for navigating complexities, minimizing errors, and ultimately driving operational efficiency.
Common Challenges and Solutions When Using PREVIOUSMONTH
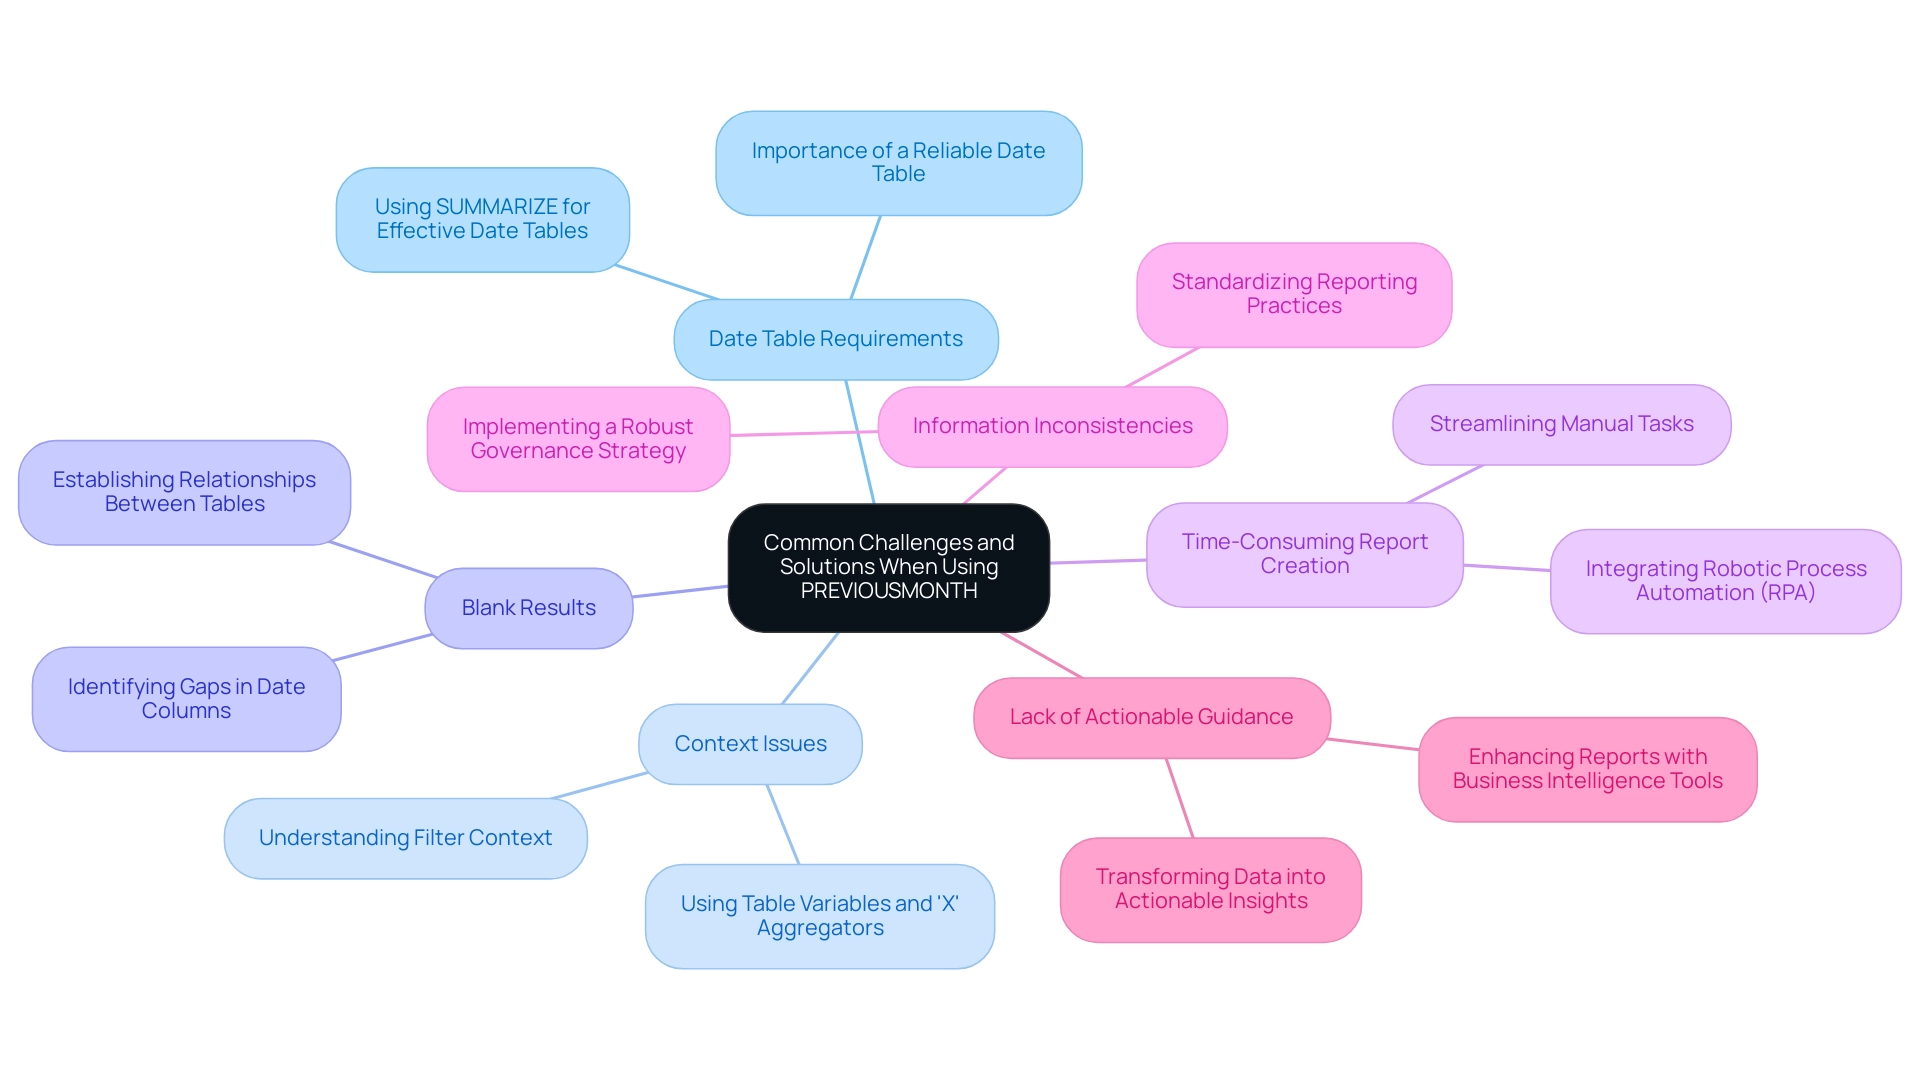
While the PREVIOUSMONTH function serves as a powerful tool for time-based data analysis, users must navigate certain challenges effectively:
-
Date Table Requirements: A well-organized date table is crucial for the accurate application of the PREVIOUSMONTH operation. This procedure depends on a continuous and complete date range; without it, users may encounter inaccurate results or blanks. Establishing a reliable date table significantly enhances the precision of your analysis. As highlighted in the case study ‘Key Concepts in DAX for Power BI’, understanding the granularity of fact tables and employing methods such as SUMMARIZE can facilitate the creation of effective date tables that support the prior month capability.
-
Context Issues: Grasping the filter context in which the PREVIOUSMONTH operation is utilized is essential. If your report includes slicers or other filters, the output may not meet expectations. To mitigate this, consider using table variables and ‘X’ aggregators, which often prove more effective than relying solely on CALCULATE for modifying the filter context. This strategy ensures that the intended data is accurately represented in the results.
-
Blank Results: Users may encounter scenarios where the previous month’s operation yields blank outcomes. This typically arises from gaps in the date column or an unsuitable context for previous month DAX calculations. Establishing a relationship between your date table and the fact table can resolve these issues, enabling accurate monthly comparisons. According to Mitchell Pearson, a Data Platform Consultant at Pragmatic Works, “A well-defined date table not only supports time-based functions like previousmonth DAX but also enhances overall reporting accuracy.”
-
Time-Consuming Report Creation: Many users find themselves dedicating excessive time to report construction rather than extracting insights from Power BI dashboards. This common challenge diverts focus from analysis to report creation, resulting in inefficiencies. Manual, repetitive tasks significantly contribute to this issue, wasting valuable resources. By integrating Robotic Process Automation (RPA) into your workflow, you can streamline these tasks, freeing up time for strategic analysis and decision-making.
-
Information Inconsistencies: Discrepancies across various reports due to a lack of governance can create confusion and erode trust in the information presented. Implementing a robust governance strategy is vital for ensuring information integrity and reliability, facilitating more confident insights. A well-defined governance framework can standardize reporting practices and mitigate discrepancies.
-
Lack of Actionable Guidance: Frequently, reports filled with numbers and graphs fail to deliver clear, actionable guidance, leaving stakeholders directionless regarding next steps. Enhancing your reports with targeted Business Intelligence tools can transform raw data into actionable insights, fostering growth and informed decision-making.
By proactively addressing these common obstacles, including the impact of manual processes and the necessity for governance strategies, users can fully leverage the capabilities of the prior month feature and enhance their overall information evaluation skills within Power BI.
Advanced Techniques: Combining PREVIOUSMONTH with Other DAX Functions
To enhance your analytical capabilities in Power BI, integrating the prior month method with various DAX tools can yield valuable insights. This approach is especially effective when you streamline manual processes through Robotic Process Automation (RPA). By automating tasks such as report generation and data cleaning, analysts can concentrate on strategic decision-making. Consider these advanced techniques:
-
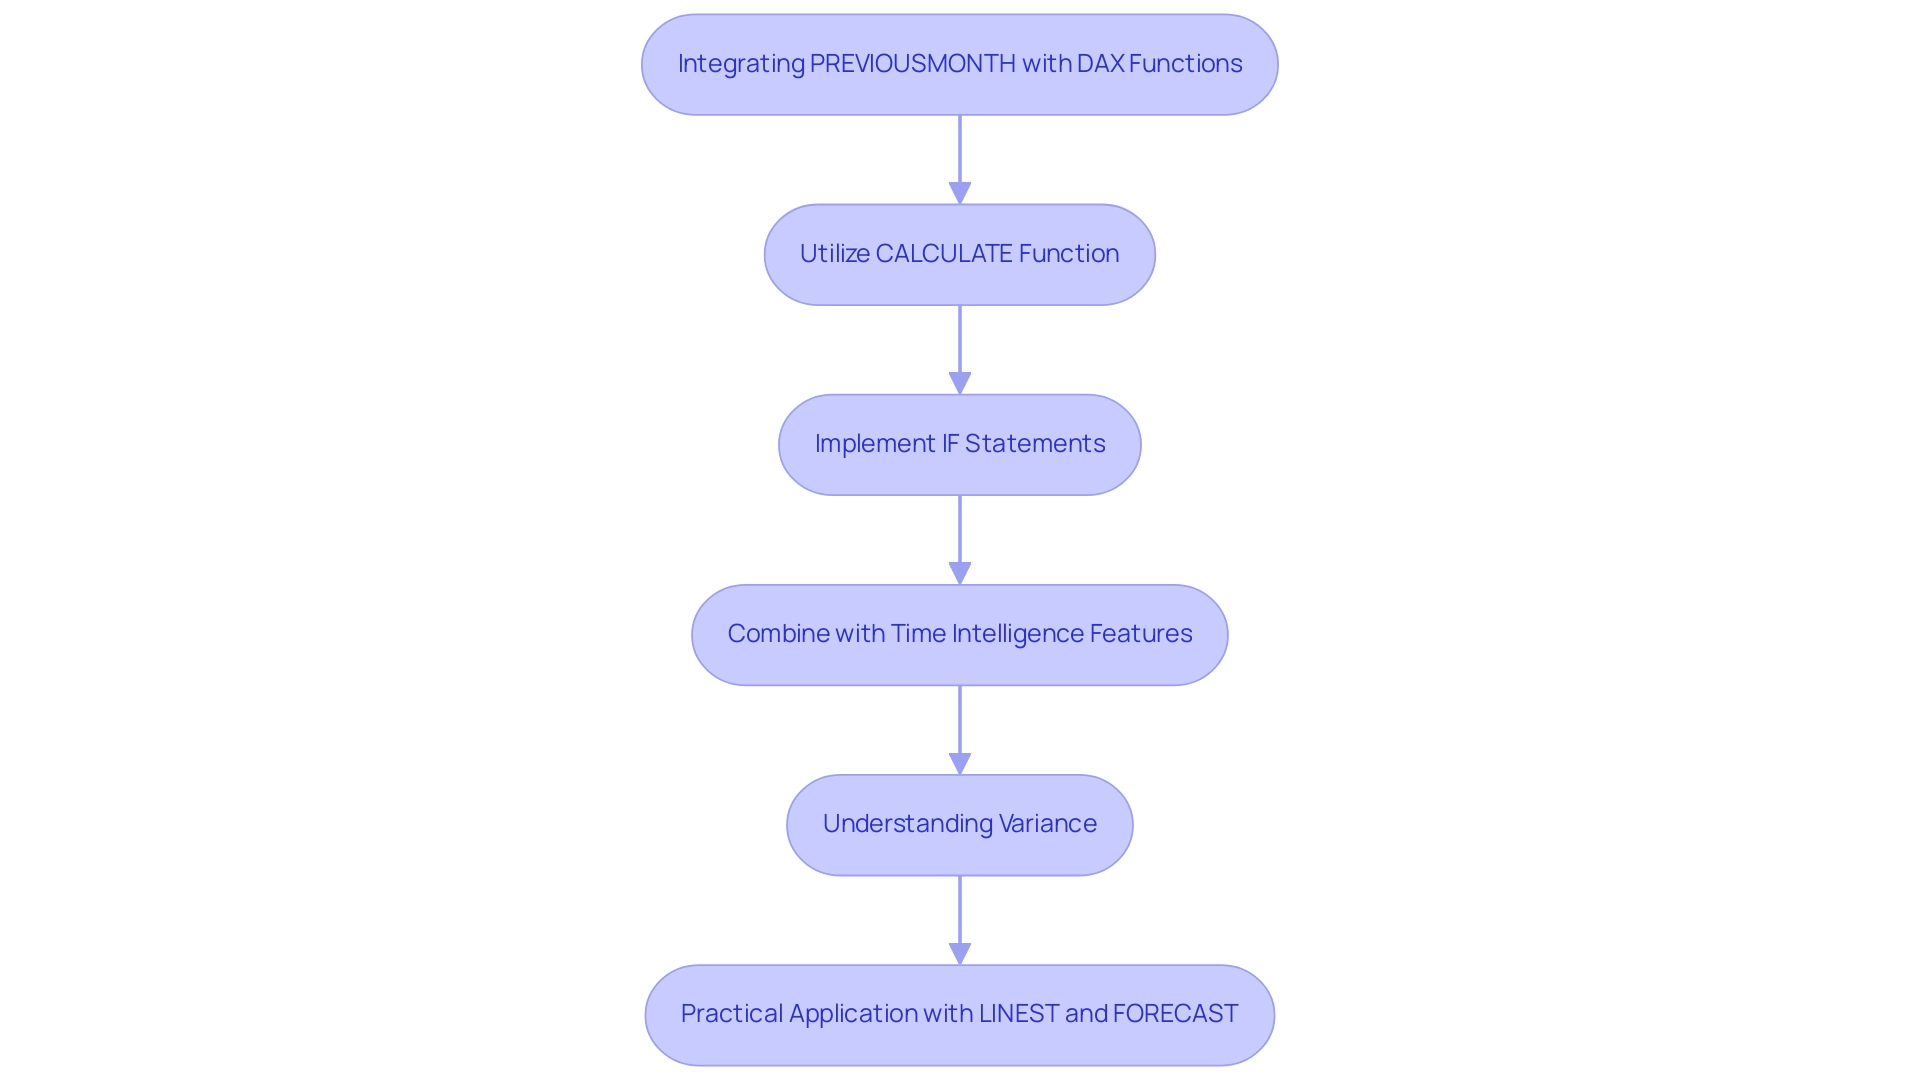
Utilize the CALCULATE function: Adjust the filter context while applying the previous month DAX. For example:
Sales Growth = CALCULATE(SUM(Sales[previous month]), PREVIOUSMONTH(Sales[Date])) - SUM(Sales[previous month])This formula effectively measures sales growth compared to the previous month, offering a clear perspective on performance trends and supporting data-driven decision-making.
-
IF Statements: Implement conditional logic using IF statements to handle scenarios where data may be missing. For instance:
Previous Month Sales = IF(ISBLANK(CALCULATE(SUM(Sales[previous month]), PREVIOUSMONTH(Sales[Date]))), 0, CALCULATE(SUM(Sales[previous month]), PREVIOUSMONTH(Sales[Date])))This ensures that if sales data from the previous month is absent, the formula returns zero instead of a blank, promoting clearer reporting and minimizing inconsistencies.
-
Time Intelligence Features: Enhance your analysis by combining PREVIOUSMONTH with other time intelligence features, such as DATESYTD or SAMEPERIODLASTYEAR. This strategy allows for comprehensive reporting that compares various time frames, providing richer context for decision-making, which is vital in a rapidly changing AI landscape.
-
Understanding Variance: It’s crucial to recognize that the VAR.S formula returns the variance of a sample population, essential for analyzing variability and making informed decisions.
-
Practical Application: As illustrated in a case study on regression, DAX offers functions like LINEST and FORECAST for conducting linear regression, modeling the relationship between a dependent variable and one or more independent variables. This capability facilitates predictive modeling, trend analysis, and forecasting based on historical data, further enhancing your analytical prowess and operational efficiency.
As Aaron, the Lead Power BI instructor at Maven Analytics, emphasizes, “Trust me; you won’t want to miss it!” By mastering these advanced DAX techniques in conjunction with RPA, analysts can uncover deeper insights and drive impactful business decisions, ultimately fortifying operational efficiency and strategic planning within your organization.
Conclusion
The exploration of Data Analysis Expressions (DAX) and its time intelligence functions, particularly the PREVIOUSMONTH function, underscores their vital role in enhancing data analysis and reporting practices. By facilitating comparisons across different time periods, this function empowers analysts to track performance trends, streamline reporting processes, and make informed decisions that drive organizational success. Moreover, the integration of Robotic Process Automation (RPA) significantly amplifies these capabilities, enabling analysts to concentrate on strategic insights rather than the manual compilation of data.
Practical applications of the PREVIOUSMONTH function span various domains, including:
- sales reporting
- financial analysis
- marketing performance evaluation
Harnessing this function allows organizations to gain valuable insights that inform strategy and operational efficiency. However, to fully leverage its potential, challenges such as the need for a well-structured date table, context issues, and potential data inconsistencies must be addressed.
Incorporating advanced techniques, such as combining the PREVIOUSMONTH function with other DAX functions, enhances analytical capabilities and supports robust decision-making. As the landscape of data analysis continues to evolve, mastering DAX functions and integrating RPA will be essential for professionals aiming to unlock the full potential of their data. Embracing these tools not only streamlines processes but also fosters a culture of data-driven decision-making, positioning organizations for sustained growth and innovation.
Overview
This article provides an authoritative overview of mastering the MERGE statement in Spark SQL, focusing on its syntax, best practices, and advanced techniques for effective data manipulation. By leveraging Delta Lake and Robotic Process Automation (RPA), operational efficiency and performance can be significantly enhanced. This is evidenced by the strategies outlined for optimizing merge operations and addressing common challenges. Professionals seeking to improve their data handling capabilities will find actionable insights that can transform their current practices.
Introduction
In the realm of data manipulation, the MERGE statement in Spark SQL emerges as a powerful and versatile tool. It enables organizations to perform conditional updates, inserts, and deletes seamlessly. As businesses increasingly rely on data-driven insights, integrating Robotic Process Automation (RPA) into these operations not only enhances efficiency but also minimizes human error. When paired with Delta Lake, the MERGE statement becomes even more formidable, optimizing the handling of massive datasets.
This article delves into the intricacies of the MERGE statement, exploring its syntax, best practices, and advanced techniques that can elevate data operations to new heights. By gaining a comprehensive understanding of join types, setup requirements, and troubleshooting strategies, organizations can harness the full potential of Spark SQL. This knowledge is crucial for navigating the complexities of today’s data landscape effectively.
Understanding the MERGE Statement in Spark SQL
The JOIN command in Spark SQL serves as a powerful tool for executing conditional updates, inserts, and deletions in a unified manner, greatly enhancing the efficiency of information manipulation. By incorporating Robotic Process Automation (RPA) into this process, organizations can automate these operations, thereby reducing manual intervention and minimizing errors. This effectiveness is especially evident when using Delta Lake, which optimizes the management of large datasets.
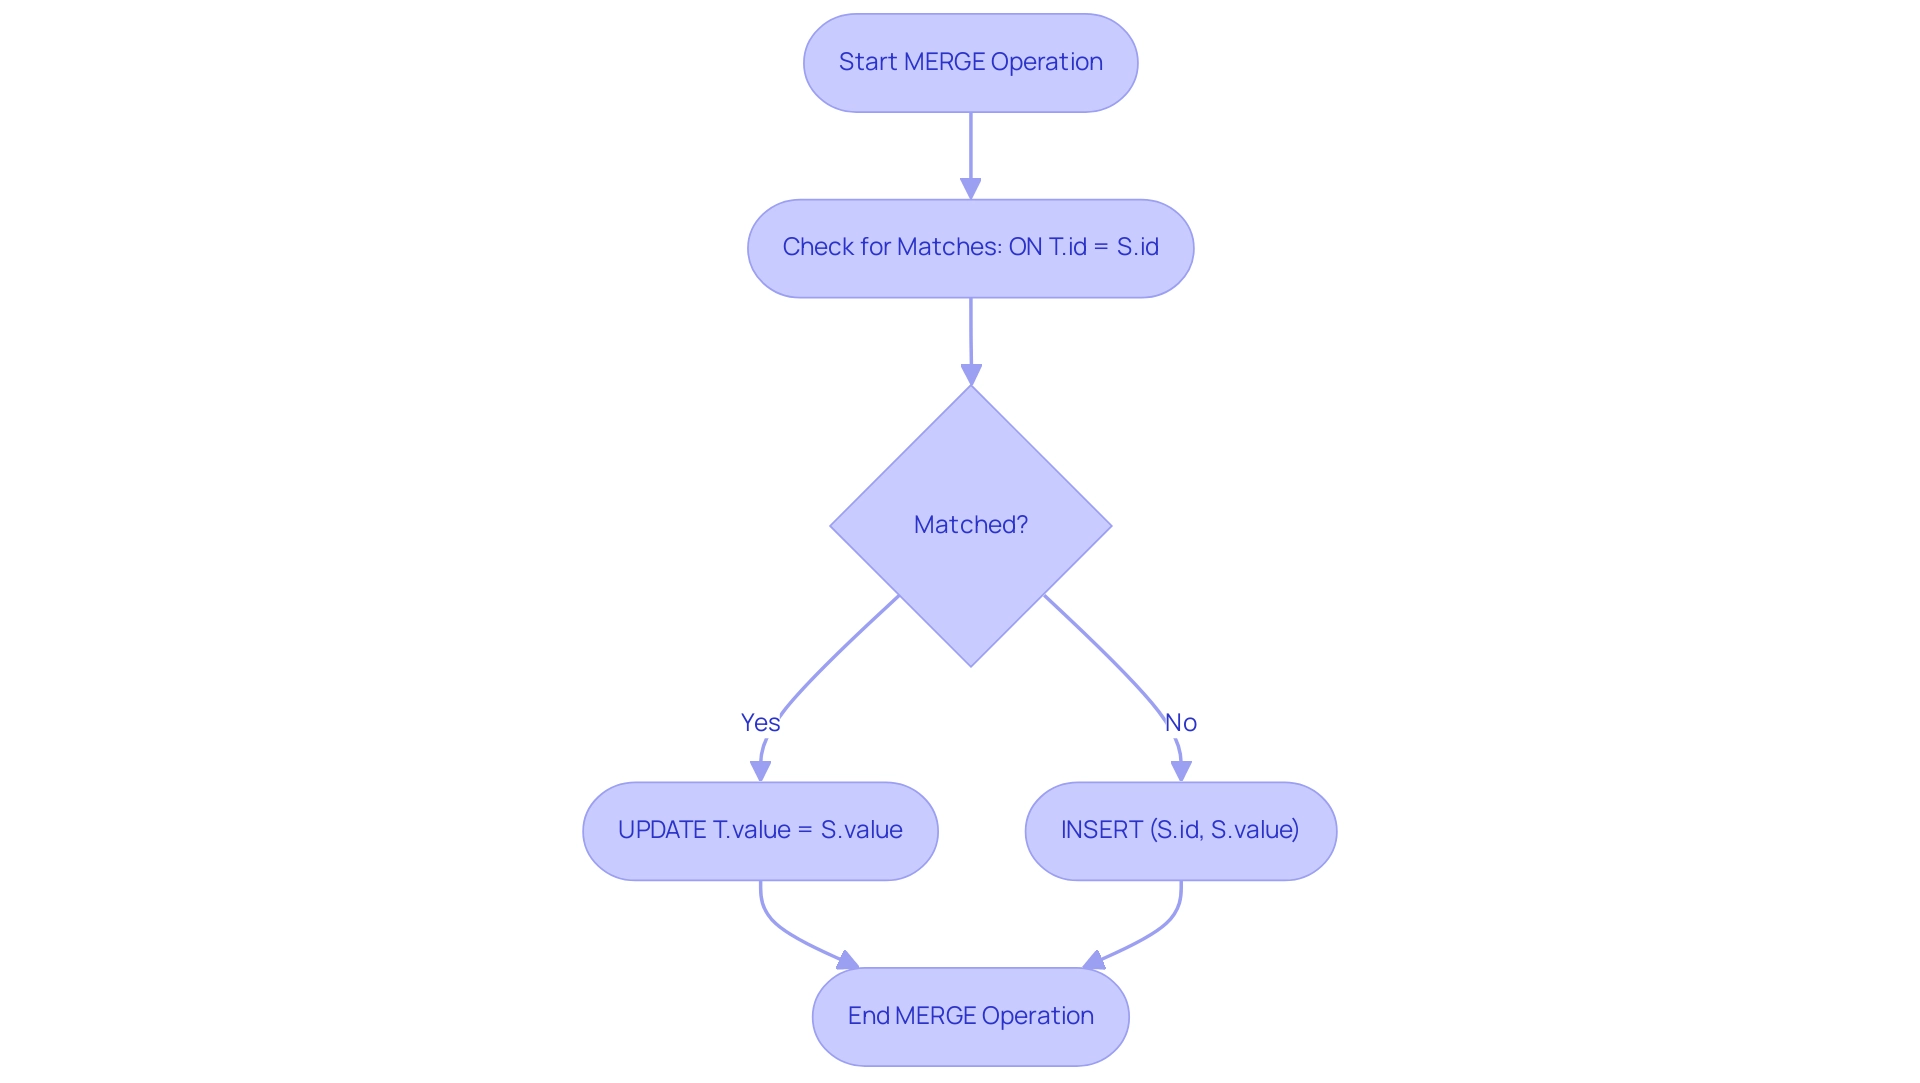
The syntax for a MERGE operation is as follows:
MERGE INTO target_table AS T
NATURAL JOIN source_table AS S
ON T.id = S.id
WHEN MATCHED THEN
  UPDATE SET T.value = S.value
WHEN NOT MATCHED THEN
  INSERT (id, value) VALUES (S.id, S.value);
This command assesses specified conditions to identify matches between the target and source tables, executing the necessary actions accordingly. In environments handling substantial volumes of data—such as those where combining operations can be sluggish with 30-50 million staging records versus billions of records—leveraging Delta Lake’s capabilities can result in significant performance improvements. Furthermore, cost-based optimization (CBO) is crucial in Spark SQL merge operations, enabling the use of statistical information to craft more efficient execution plans. As highlighted in case studies analyzing various recommendations for enhancing Spark SQL merge performance, many complex solutions often fall short, while simple, foundational practices are frequently overlooked.
Alex Ott, an experienced user, succinctly stated, > But you can pull necessary information using the History on the Delta table <. This functionality not only streamlines operations but also underscores the importance of foundational practices, steering clear of ineffective complex solutions.
By focusing on these essential strategies and integrating RPA to automate information manipulation processes, organizations can markedly enhance their operational efficiency.
Exploring Join Types in Spark SQL
In Spark SQL, various join types are available, each tailored to fulfill specific purposes in data manipulation. A comprehensive understanding of these joins is essential for crafting effective statements that utilize Spark SQL’s merge functionality to accurately capture desired relationships. Alex Ott underscores the importance of selecting appropriate file formats, noting that features like Data Skipping and Bloom filters can significantly enhance join performance by reducing the number of files accessed during operations.
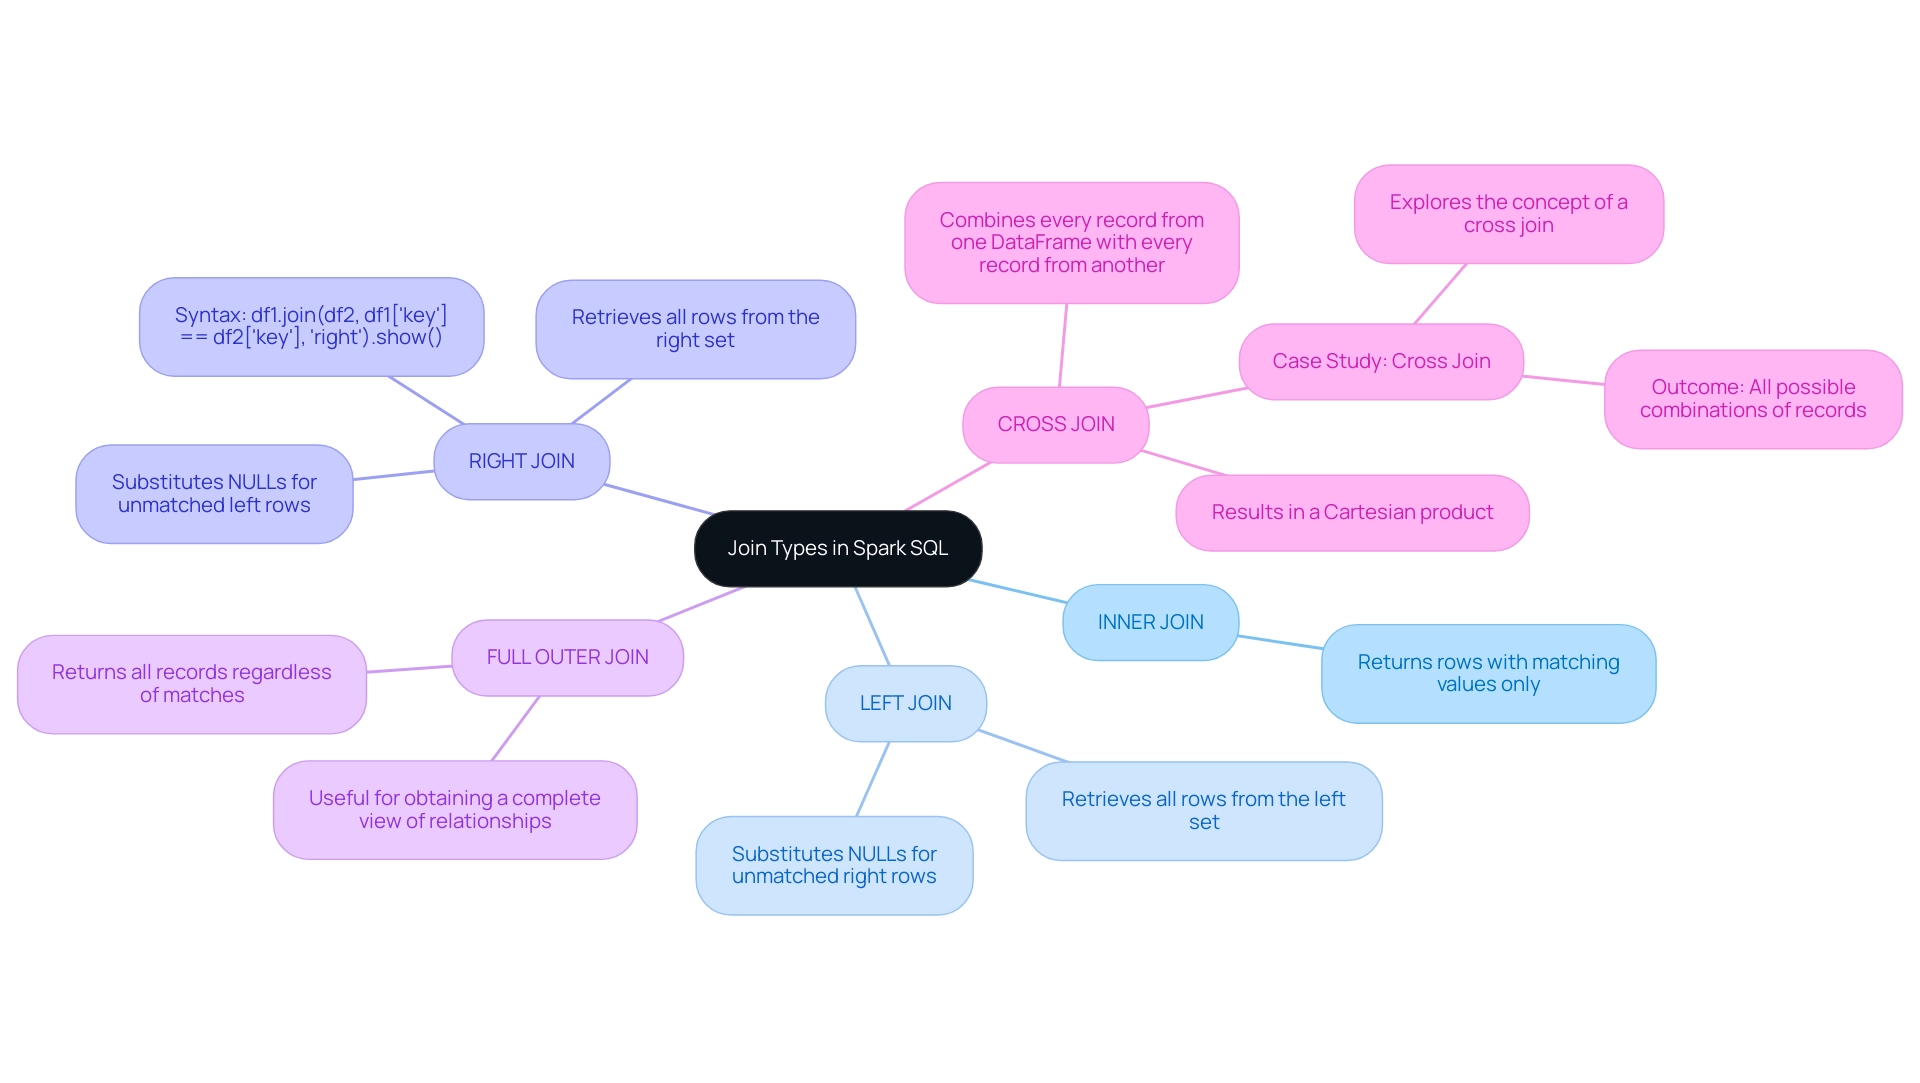
The key join types include:
- INNER JOIN: This join returns only those rows with matching values in both sets, ensuring that only relevant information is included in the result set.
- LEFT JOIN: This retrieves all rows from the left set alongside the matched rows from the right set, substituting NULLs for any unmatched rows from the right, thereby preserving all information from the left.
- RIGHT JOIN: Conversely, this join returns all rows from the right set along with the matched rows from the left set, filling in NULLs for any unmatched left-side rows. The syntax for a Right Outer Join is
df1.join(df2, df1['key'] == df2['key'], 'right').show(). - FULL OUTER JOIN: This comprehensive join type ensures that all records are returned, regardless of matches in either the left or right table. This is particularly beneficial for obtaining a complete view of relationships. Furthermore, the concept of a Cross Join, where every record from one DataFrame merges with every record from another, illustrates the practical application of join types. Understanding the distinctions among these join types not only aids in precise data retrieval but also enhances the performance and efficiency of data operations when utilizing Spark SQL’s merge functionality.
Setting Up Your Spark SQL Environment for MERGE Operations
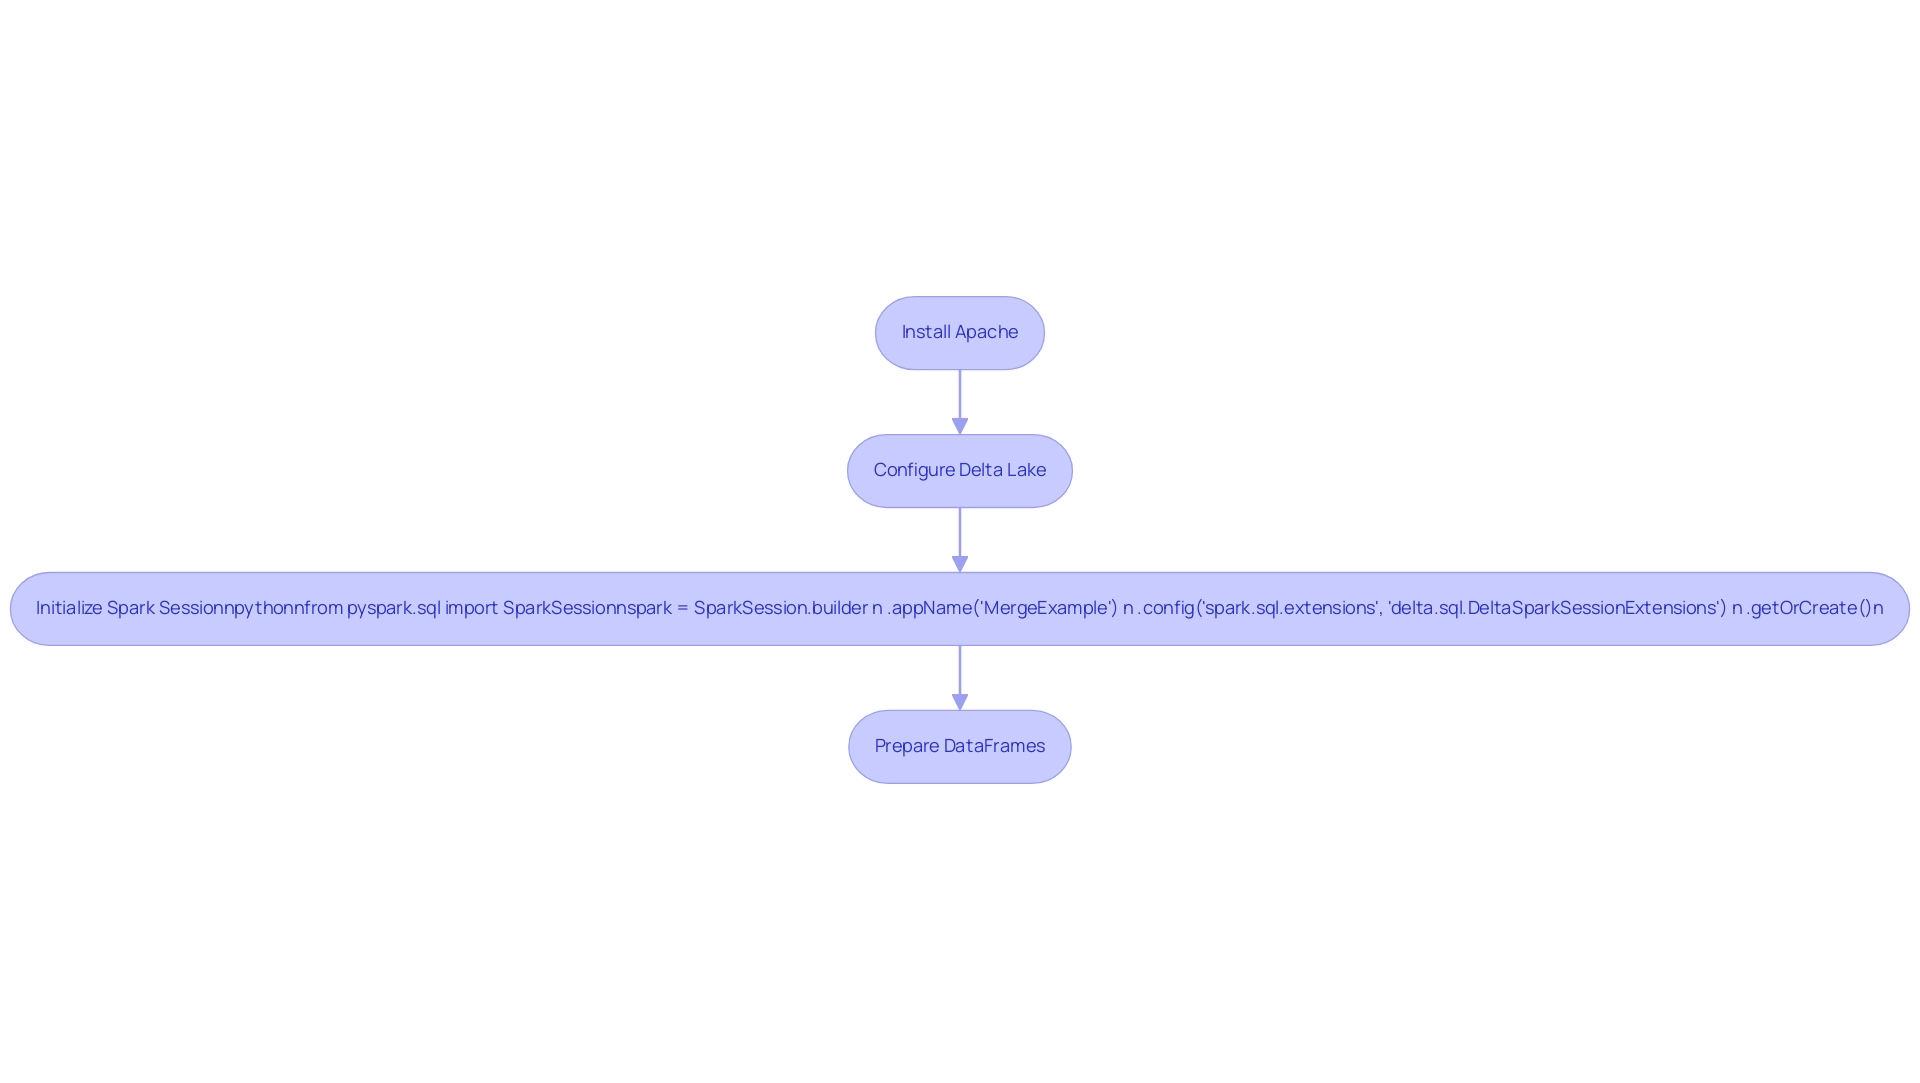
To effectively execute MERGE operations in Spark SQL, establishing a robust setup is essential. This setup includes several key components:
-
Apache: Start by installing Apache and ensuring it is correctly configured in your development environment.
-
Delta Lake: Utilize Delta Lake as your storage format. Combining operations are exclusively compatible with Delta structures, enhancing performance and reliability through automation.
-
Spark Session: Initialize your Spark session to support Delta functionality with the following code:
from pyspark.sql import SparkSession spark = SparkSession.builder \ .appName('MergeExample') \ .config('spark.sql.extensions', 'delta.sql.DeltaSparkSessionExtensions') \ .getOrCreate() -
Data Preparation: Before executing the combination statement, prepare your source and target tables by loading them into DataFrames.
Incorporating Robotic Process Automation (RPA) into this setup can significantly streamline Spark SQL merge operations. For instance, RPA can automate preparation steps, ensuring that DataFrames are consistently loaded and ready for processing without manual intervention. This approach not only reduces the potential for human error but also accelerates workflow, allowing your team to focus on more strategic tasks.
This comprehensive setup enables you to harness the full potential of SQL for advanced manipulation while aligning with the increasing demand for operational efficiency in a rapidly evolving AI landscape. As organizations increasingly adopt tools like SQL and Delta Lake—driven by the projected $68.9 trillion growth of the Analytics as a Service (AaaS) market by 2028—leveraging RPA can enhance data-driven insights and operational efficiency for business growth. According to Deloitte, “MarkWide Research is a trusted partner that provides us with the market insights we need to make informed decisions.”
This underscores the critical role of utilizing reliable tools and insights in navigating the evolving data landscape. Furthermore, the supremacy of Google in web analytics, evidenced by its 30.35% market share, highlights the necessity for organizations to implement robust analytics solutions such as SQL and Delta Lake to remain competitive in this expanding market.
Executing MERGE Operations: Syntax and Best Practices
To perform a MERGE operation in Spark SQL, you can follow this syntax:
MERGE INTO target_table AS T
USING source_table AS S
ON T.id = S.id
WHEN MATCHED THEN
  UPDATE SET T.value = S.value
WHEN NOT MATCHED THEN
  INSERT (id, value) VALUES (S.id, S.value);
Best Practices:
- Utilize Delta Lake: For optimal performance, ensure your tables are in Delta format. Delta Lake supports ACID transactions and unifies batch and streaming paradigms, simplifying complex transactions involving incremental information. As highlighted by Prashanth Babu Velanati Venkata, Lead Product Specialist, “Delta Lake supports ACID transactions and unifies batch and streaming paradigms, simplifying delete/insert/update operations on incremental information.”
- Optimize Your Data: Regularly use OPTIMIZE commands on Delta structures to enhance read and write performance, especially for large datasets. This aligns with the principles of Business Intelligence, allowing for better data management and informed decision-making.
- Effective Partitioning: Implement partitioning based on frequently queried columns to significantly boost efficiency and reduce processing time. This strategy, in conjunction with RPA, can streamline workflows and reduce manual intervention, addressing the challenges posed by repetitive tasks.
- Thorough Testing: Before executing combining statements on larger datasets, conduct tests with smaller groups of data to verify accuracy and performance outcomes. This practice is crucial in a rapidly evolving AI landscape where precision is key.
Additionally, consider the benefits of pre-bucketing and pre-sorting tables in the framework, which allow for colocating joinable rows. This method minimizes shuffling during joins, significantly speeding up operations and enabling the handling of large joins on smaller clusters without running into out-of-memory issues. By utilizing RPA to automate these manual workflows, and recognizing that over 50% of Fortune 500 firms employ Databricks, you can perform combination operations in SQL more efficiently.
Tailored AI solutions can further enhance this process by providing specific technologies that align with your business goals, ensuring both performance and reliability while driving operational efficiency.
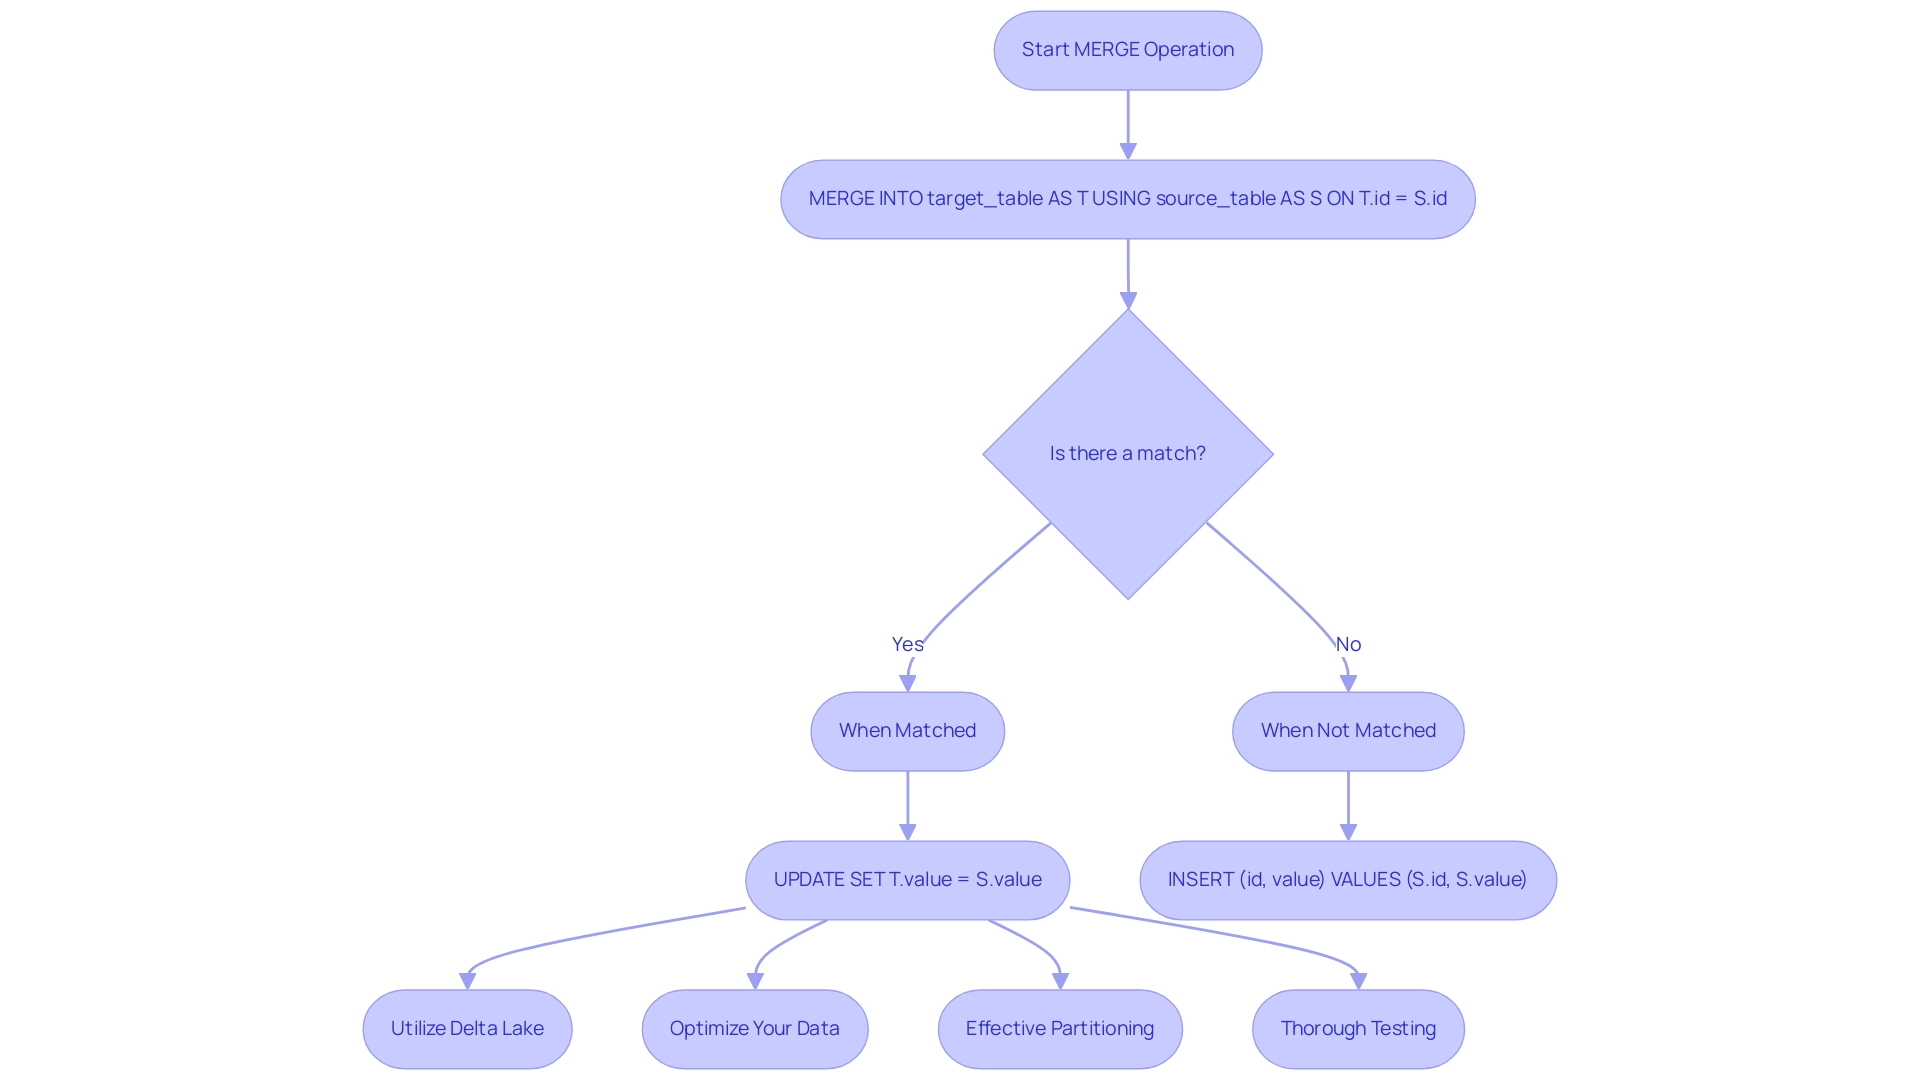
Advanced MERGE Techniques: Schema Evolution and Complex Scenarios
Advanced techniques in Spark SQL, such as MERGE INTO, offer powerful capabilities for data manipulation, particularly in managing schema evolution and navigating complex scenarios.
Schema Evolution: This feature enables the target table schema to automatically adapt to changes in the source table schema. To activate schema evolution, incorporate the WHEN NOT MATCHED THEN INSERT ... clause, along with setting the appropriate parameters like delta.minWriterVersion to ‘5’. Additionally, enhancing the Delta Lake protocol may be vital to support advanced functionalities such as column mapping, ensuring that your operations are both flexible and effective.
Complex Scenarios: In situations that require intricate logic for updates and inserts, the MERGE statement can be expanded to accommodate multiple conditions. Consider the following SQL example:
MERGE INTO target_table AS T
USING source_table AS S
ON T.id = S.id
WHEN MATCHED AND T.status = 'inactive' THEN
  UPDATE SET T.value = S.value
WHEN NOT MATCHED AND S.new_column IS NOT NULL THEN
  INSERT (id, value, new_column) VALUES (S.id, S.value, S.new_column);
This example illustrates how to effectively manage updates based on specific conditions, thereby enhancing the power of data manipulation within Spark SQL.
Real-world applications of these techniques can be observed in Delta Lake’s schema enforcement. A recent case study demonstrates that Delta Lake rigorously checks all new writes against the target table’s schema, canceling transactions when mismatches are detected. This process is crucial for maintaining data integrity, preventing incompatible information from being written, and avoiding potential corruption or loss. By integrating these advanced techniques, organizations can adeptly navigate complex information scenarios with enhanced precision and effectiveness.
As Pranav Anand noted, ‘We’d also like to thank Mukul Murthy and Pranav Anand for their contributions to this blog.’ This acknowledgment reflects the collaborative effort in deepening our understanding of these advanced techniques.
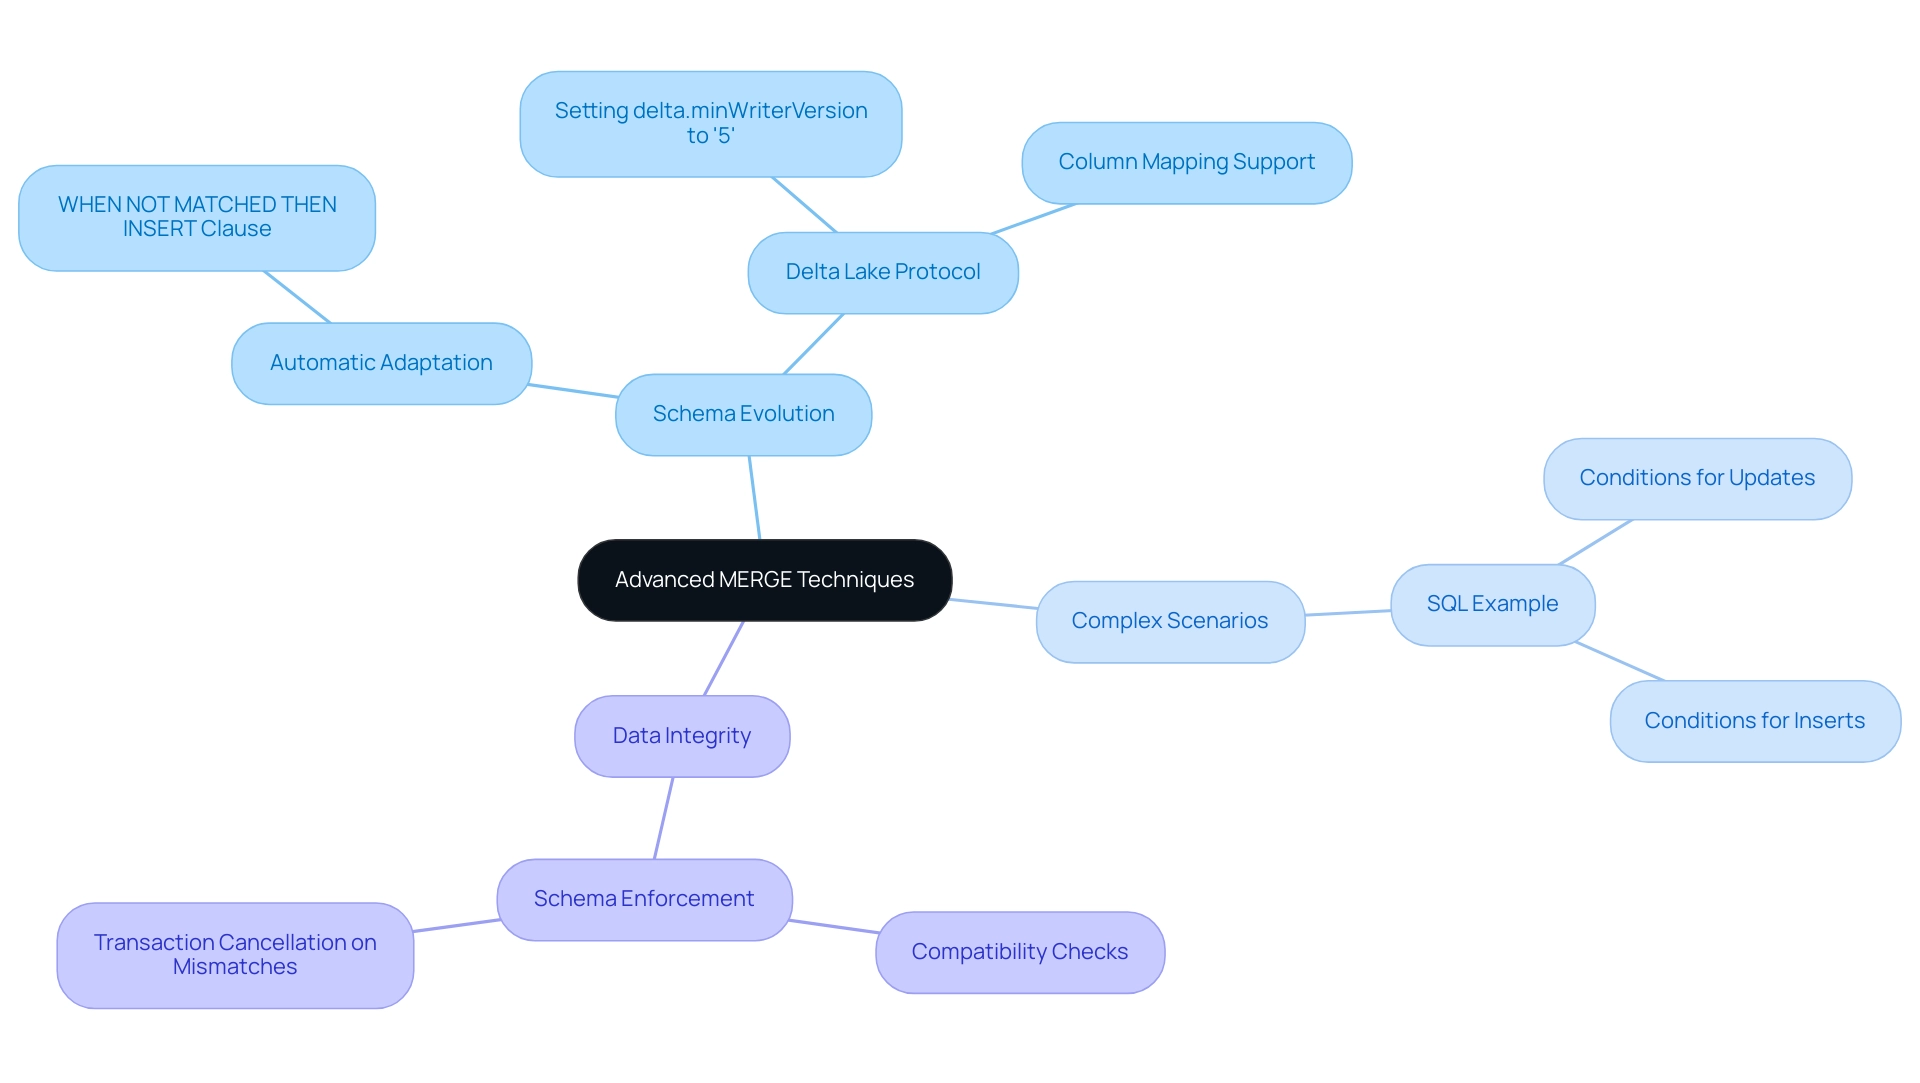
Troubleshooting MERGE Operations: Common Challenges and Solutions
Combine operations in Spark SQL can present several challenges that, if not addressed, may hinder data processing efficiency. Among the most common issues are:
-
Duplicate Rows: A primary obstacle is the presence of duplicate rows in the source dataset, leading to conflicts during the MERGE process. To mitigate this, utilizing commands like
DISTINCTorGROUP BYis advisable to eliminate duplicates before performing a Spark SQL merge. -
Schema Mismatch: Another frequent issue arises from schema incompatibility between the source and target tables. It is crucial to ensure that the dataset structures align. When necessary, schema evolution can accommodate changes in structure.
-
Performance Issues: Slow MERGE operations may indicate underlying inefficiencies. To enhance performance, consider optimizing your Delta tables, tuning configurations, or appropriately partitioning your information. These steps can significantly reduce execution time and improve operational efficiency. Additionally, integrating Robotic Process Automation (RPA) can automate manual tasks—often repetitive and time-consuming—further streamlining workflows in a rapidly evolving AI landscape. Utilizing cloud-based storage facilities can also provide scalability and cost-effectiveness, making them appealing choices for hosting merged collections.
-
Internal Errors: Should internal errors occur, meticulously reviewing your SQL syntax and validating your Spark environment setup is essential. Misconfigurations can lead to unexpected failures; thus, ensuring all parameters are correctly defined is vital.
Addressing these challenges proactively not only boosts the reliability of your operations using Spark SQL merge but also enhances overall processing efficiency. Utilizing Business Intelligence can convert raw information into actionable insights, enabling informed decision-making that drives growth and innovation. A case study titled “Hosting Merged Information” underscores the importance of selecting an appropriate hosting solution to maintain optimal performance, scalability, and integrity.
This case study illustrates how the right environment can mitigate the issues discussed above. Furthermore, the significance of tailored AI solutions in addressing these challenges cannot be overlooked, as they offer targeted technologies that align with specific business needs. As Syed Danish, a data science enthusiast, states, “I am a data science and machine learning enthusiast,” reflecting the growing importance of mastering these operations for effective data management.
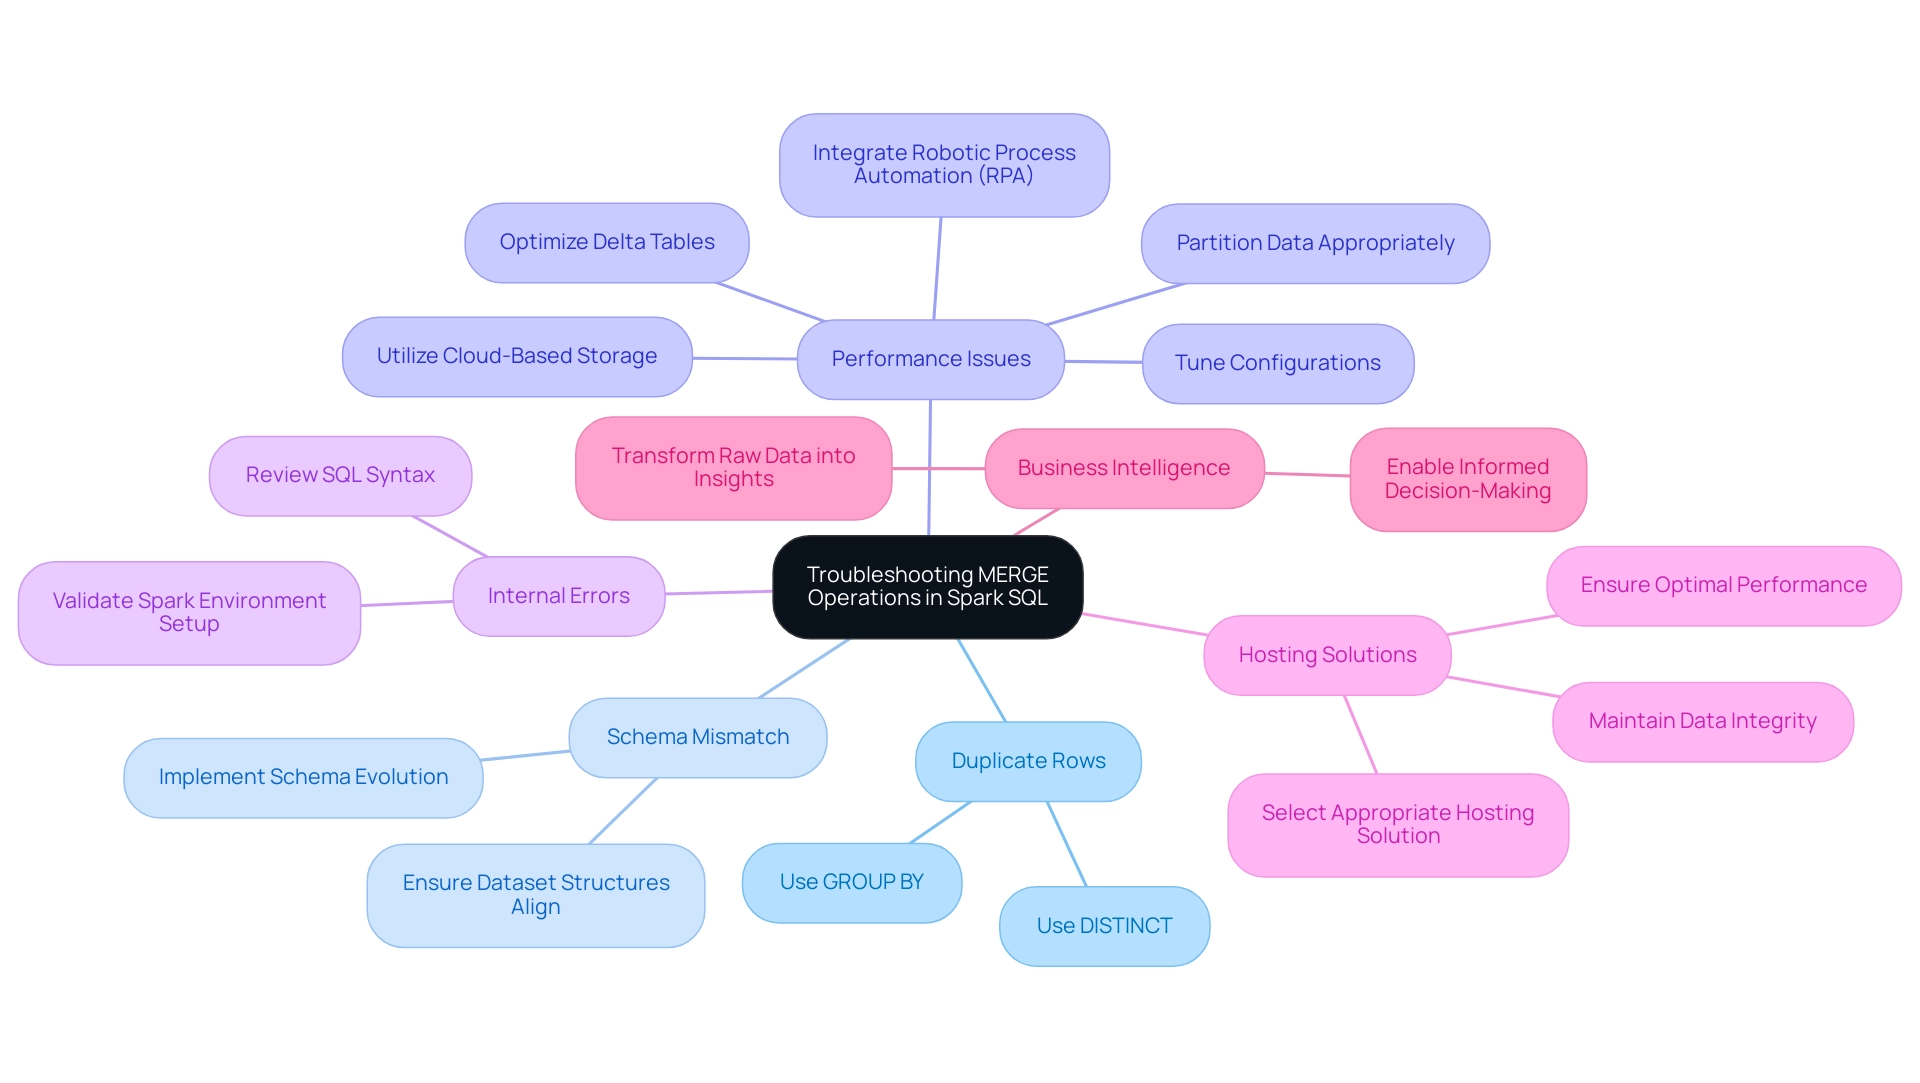
Conclusion
The MERGE statement in Spark SQL emerges as an essential tool for organizations seeking to elevate their data manipulation capabilities. By facilitating conditional updates, inserts, and deletes, it streamlines operations and reduces human error, particularly when integrated with Robotic Process Automation (RPA) and Delta Lake. Mastering the syntax, best practices, and advanced techniques related to the MERGE operation is crucial for effectively navigating the intricacies of modern data management.
Successfully executing MERGE operations necessitates incorporating various join types and establishing a robust Spark SQL environment. By harnessing the strengths of Delta Lake, organizations can enhance performance and ensure data integrity. Moreover, identifying common challenges—such as duplicate rows and schema mismatches—offers valuable insights for troubleshooting and maintaining operational efficiency.
Ultimately, mastering the MERGE statement and its related practices empowers businesses with the necessary tools to leverage data-driven insights effectively. As the realm of data analytics evolves, organizations that prioritize these strategies will not only improve their operational efficiency but also maintain a competitive edge in an increasingly data-centric landscape. Embracing these methodologies transcends technical necessity; it represents a strategic imperative for fostering growth and innovation.
Overview
This article delves into best practices for establishing privacy levels for data sources, highlighting the critical need to categorize information as Public, Organizational, or Private. Such classification is essential for ensuring compliance with regulations such as GDPR and CCPA. By outlining effective data management strategies, the article emphasizes the necessity of robust security measures, comprehensive employee training, and the integration of automation and AI to bolster privacy protection. Collectively, these strategies foster trust and safeguard sensitive information in an increasingly scrutinized digital landscape. Are your current practices aligned with these standards? Reflect on how these insights can enhance your organization’s approach to data privacy.
Introduction
In an age where data serves as the lifeblood of organizations, grasping the nuances of data privacy is more critical than ever. Businesses are navigating the complexities of data management and face an urgent need to classify data into distinct privacy levels:
- Public
- Organizational
- Private
Each category carries its own access protocols and security measures, particularly as concerns over data misuse and regulatory compliance intensify. With a staggering 91% of organizations recognizing the necessity of reassuring customers about their data practices, the stakes are undeniably high.
The emergence of technologies like artificial intelligence, coupled with increasing scrutiny over data handling practices, further complicates the landscape. It is essential for organizations to adopt comprehensive strategies that not only protect sensitive information but also foster consumer trust. This article delves into the intricacies of data privacy levels, explores the challenges of implementing these classifications, and outlines best practices for ensuring compliance in an ever-evolving digital environment.
Understanding Privacy Levels in Data Management
The privacy level setting for this data source represents a crucial framework for determining how information is accessed, shared, and protected within an organization. Information classifications typically fall into three categories: Public, Organizational, and Private.
- Public information is unrestricted and can be freely disseminated.
- In contrast, Organizational information is intended for internal use and may necessitate specific protective measures to ensure confidentiality.
- Most critically, Private information, which includes personally identifiable information (PII), is inherently sensitive and requires stringent access controls to comply with regulations such as GDPR and CCPA.
In a digital landscape where visitor interactions—such as comments on a website—can pose privacy risks, understanding these classifications becomes even more vital. When visitors leave comments, organizations collect information including the visitor’s IP address, browser user agent string, and the content of the comments, which aids in spam detection. Additionally, an anonymized string created from the email address may be sent to the Gravatar service to determine if the visitor is using it, introducing another layer of data collection that necessitates careful handling.
The Gravatar service’s confidentiality policy is accessible here: https://automattic.com/privacy/. Once comments are approved, profile pictures become visible to the public, raising further privacy concerns regarding the exposure of personal information.
The importance of these classifications cannot be overstated, especially considering recent findings indicating that 91% of entities recognize the need to reassure customers about the privacy level setting for this data source, particularly in the realm of generative AI. Cisco highlights that “60% of consumers are worried about businesses’ use of AI today, and 65% claim it’s already diminished their trust in those companies,” underscoring the necessity for entities to address these concerns proactively.
As organizations navigate the complexities of information management, effective classification—particularly the privacy level setting for this data source—not only aids in adhering to evolving regulations but also enhances risk management strategies.
For instance, information confidentiality levels have gained significant attention as nations like India (19,589 requests), Turkey (18,883 requests), and Brazil (11,502 requests) have made substantial requests for content removal, reflecting the urgent need for robust information protection practices. Furthermore, with statistics indicating that 60% of consumers express concern over AI usage and 65% feel their trust has weakened, it is imperative for companies to adopt comprehensive classification systems.
By systematically organizing information according to these confidentiality levels, organizations can implement tailored security measures that align with their privacy level setting for this data source while also addressing information collection practices linked to comment sections. This approach ultimately fosters trust and safeguards sensitive information in an increasingly scrutinized digital landscape. Moreover, the use of tools such as antivirus programs, ad blockers, and password managers—utilized by approximately 60% of internet users for safeguarding information—highlights a gap in comprehensive strategies among users, further emphasizing the significance of strong classification and security measures.
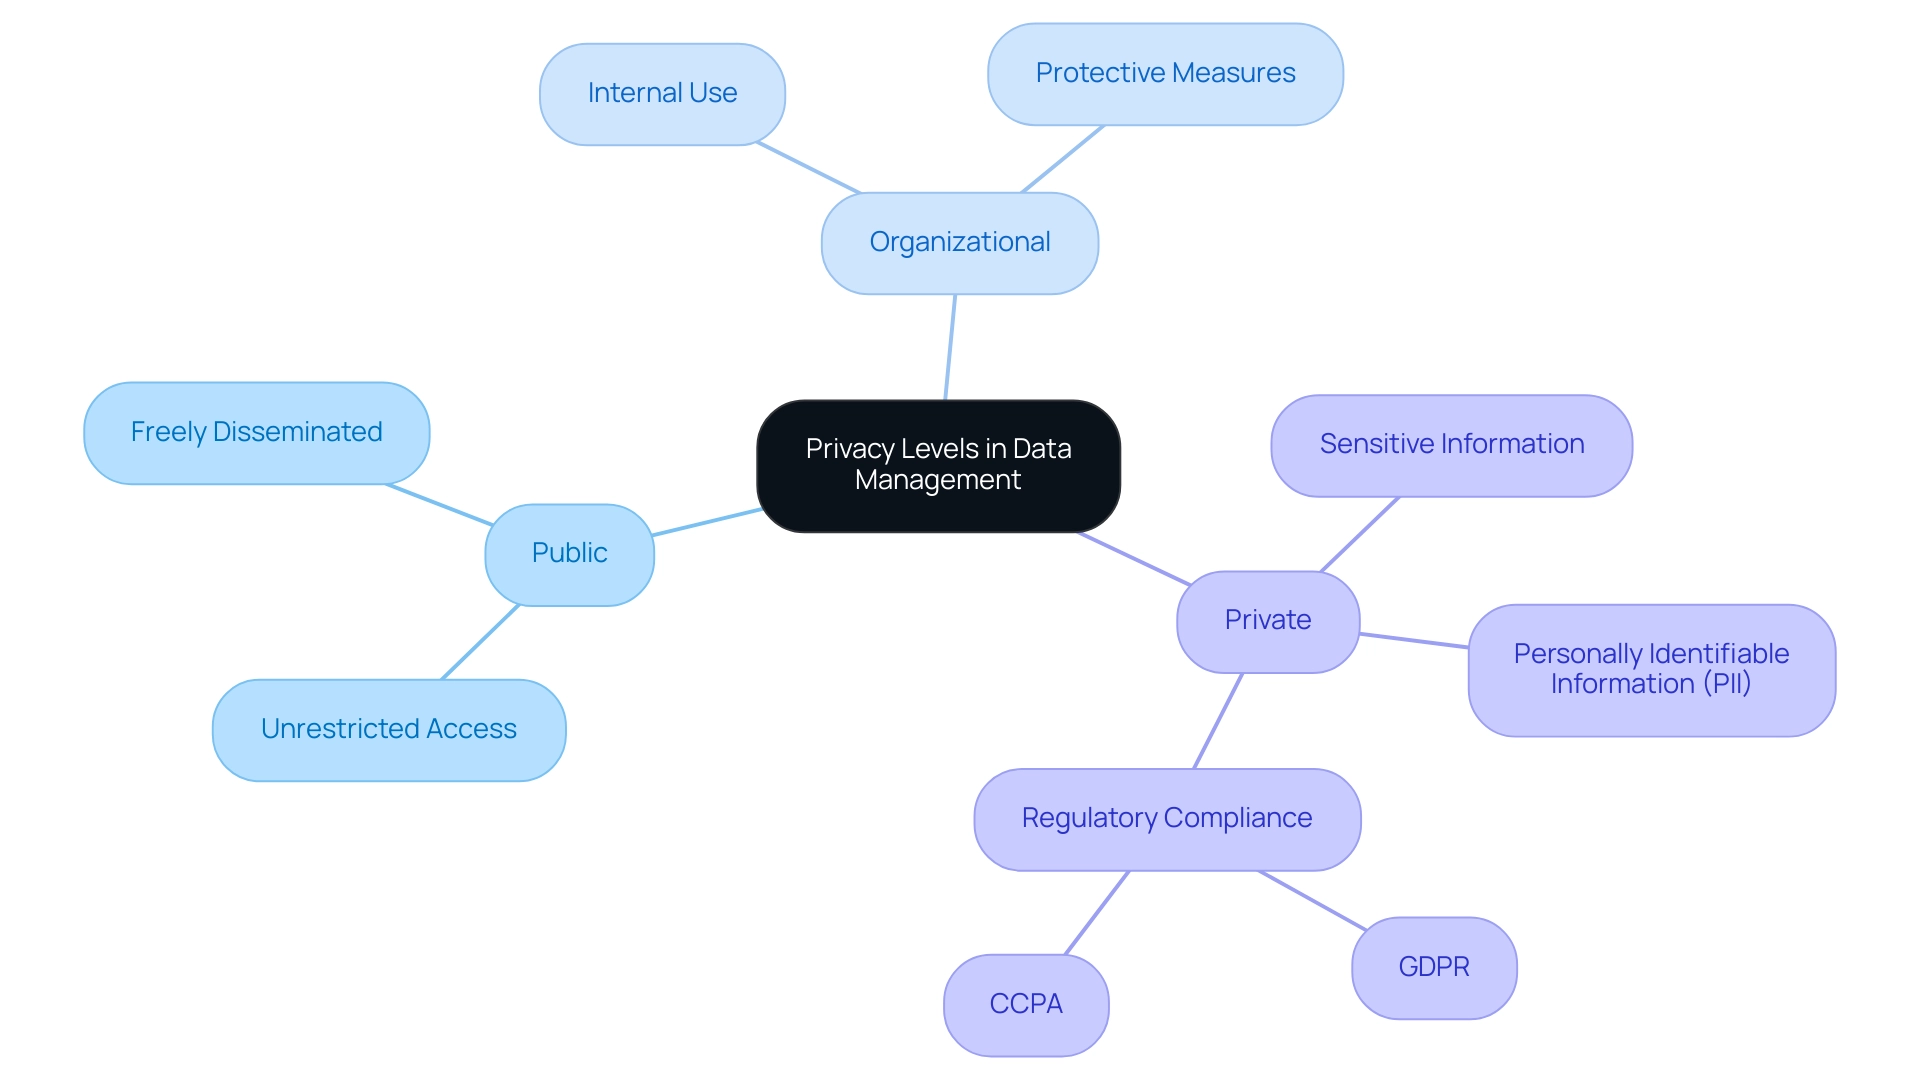
Setting Appropriate Privacy Levels for Data Sources
Establishing appropriate confidentiality levels for information sources in Power BI is crucial for protecting sensitive details and ensuring compliance with regulations. This process entails a comprehensive assessment of the information’s sensitivity, alongside the implementation of stringent access controls. Power BI empowers users to define the privacy level setting for their data sources by categorizing them into three distinct levels: Public, Organizational, and Private.
This classification not only enables effective isolation of information but also mitigates the risk of unintentional leaks during query folding, thereby reinforcing the privacy level setting essential for maintaining data integrity. As Rebecca Kappel aptly notes,
Businesses thrive by leveraging information for insights, product development, and personalization, but this comes with the responsibility to safeguard that information.
Additionally, the collection of user feedback on websites—where data such as IP addresses, browser user agent strings, and anonymized email hashes may be gathered—underscores the importance of robust information protection.
With 91% of organizations expressing concern that generative AI could jeopardize their legal rights and intellectual property, the stakes for information protection are higher than ever. A case study on obtaining customer consent for information usage reveals that effective consent management is vital for safeguarding information, ensuring individuals provide informed and voluntary agreement before their data is collected and processed. Furthermore, considering that 67% of Americans are unaware of their nation’s confidentiality and protection regulations, it is imperative for organizations to commit to regularly assessing and revising their security settings to adapt to any shifts in information sensitivity or compliance requirements.
This proactive strategy guarantees that sensitive information remains adequately protected, fostering trust and aligning with best practices for information management in 2024.
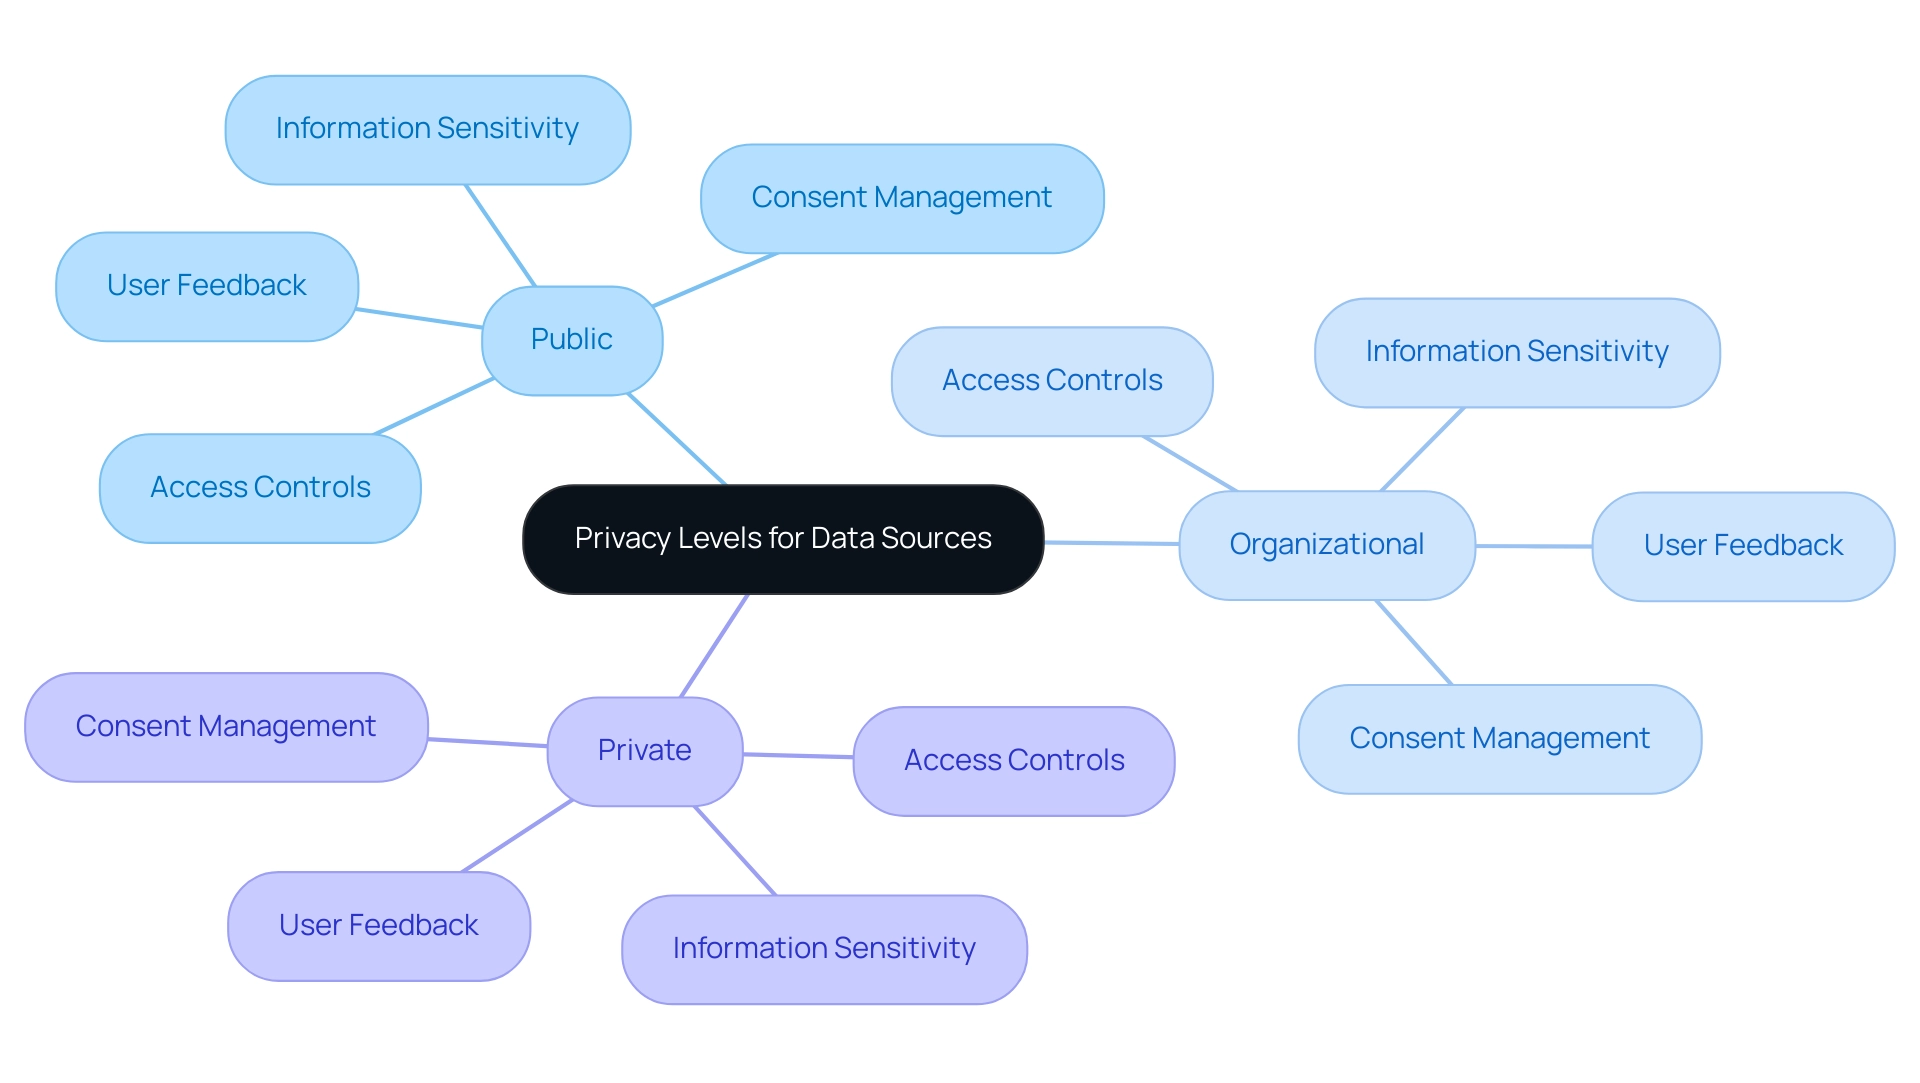
Overcoming Challenges in Privacy Level Implementation
The execution of confidentiality levels frequently encounters substantial challenges, such as employee resistance to change, misunderstandings regarding confidentiality policies, and the complexities of integrating new systems. To navigate these hurdles effectively, a proactive approach is essential. Organizations must prioritize extensive training and awareness initiatives that underscore the critical importance of information protection.
Engaging employees in the policy development process cultivates a culture of compliance and enhances cooperation. Cisco’s findings reveal that over 86% of consumers prioritize information security and seek greater control over their personal details, underscoring the necessity for companies to align with these expectations. Moreover, leveraging Robotic Process Automation (RPA) can streamline manual workflows, significantly enhancing operational efficiency and minimizing errors during implementation.
RPA not only automates repetitive tasks but also empowers teams to concentrate on strategic initiatives, thereby boosting productivity. The UNCTAD’s Data Protection and Privacy Legislation Worldwide resource provides a valuable overview of global information protection laws, crucial for entities striving to comply with diverse regulations. It is concerning that 67% of Americans remain unaware of their country’s data protection laws, highlighting the urgent need for employee training and public awareness.
Furthermore, continuous monitoring and feedback mechanisms are indispensable, enabling organizations to adapt their privacy level settings effectively for this data source. Investing in security AI and automation not only represents financial prudence but also assists organizations in managing regulatory requirements more adeptly. Research indicates that companies that fully implement these technologies report an average breach expense of $3.60 million, which is $1.76 million less than those lacking such capabilities.
The case study titled ‘Cost of Data Breaches with AI and Automation‘ exemplifies this argument, demonstrating how the deployment of security AI and automation can lower breach costs, thereby reinforcing the case for investing in advanced security technologies. By addressing these challenges head-on and integrating tailored AI solutions, companies can enhance their adherence to information security protocols, protect their profits, and achieve significant cost reductions alongside operational improvements.
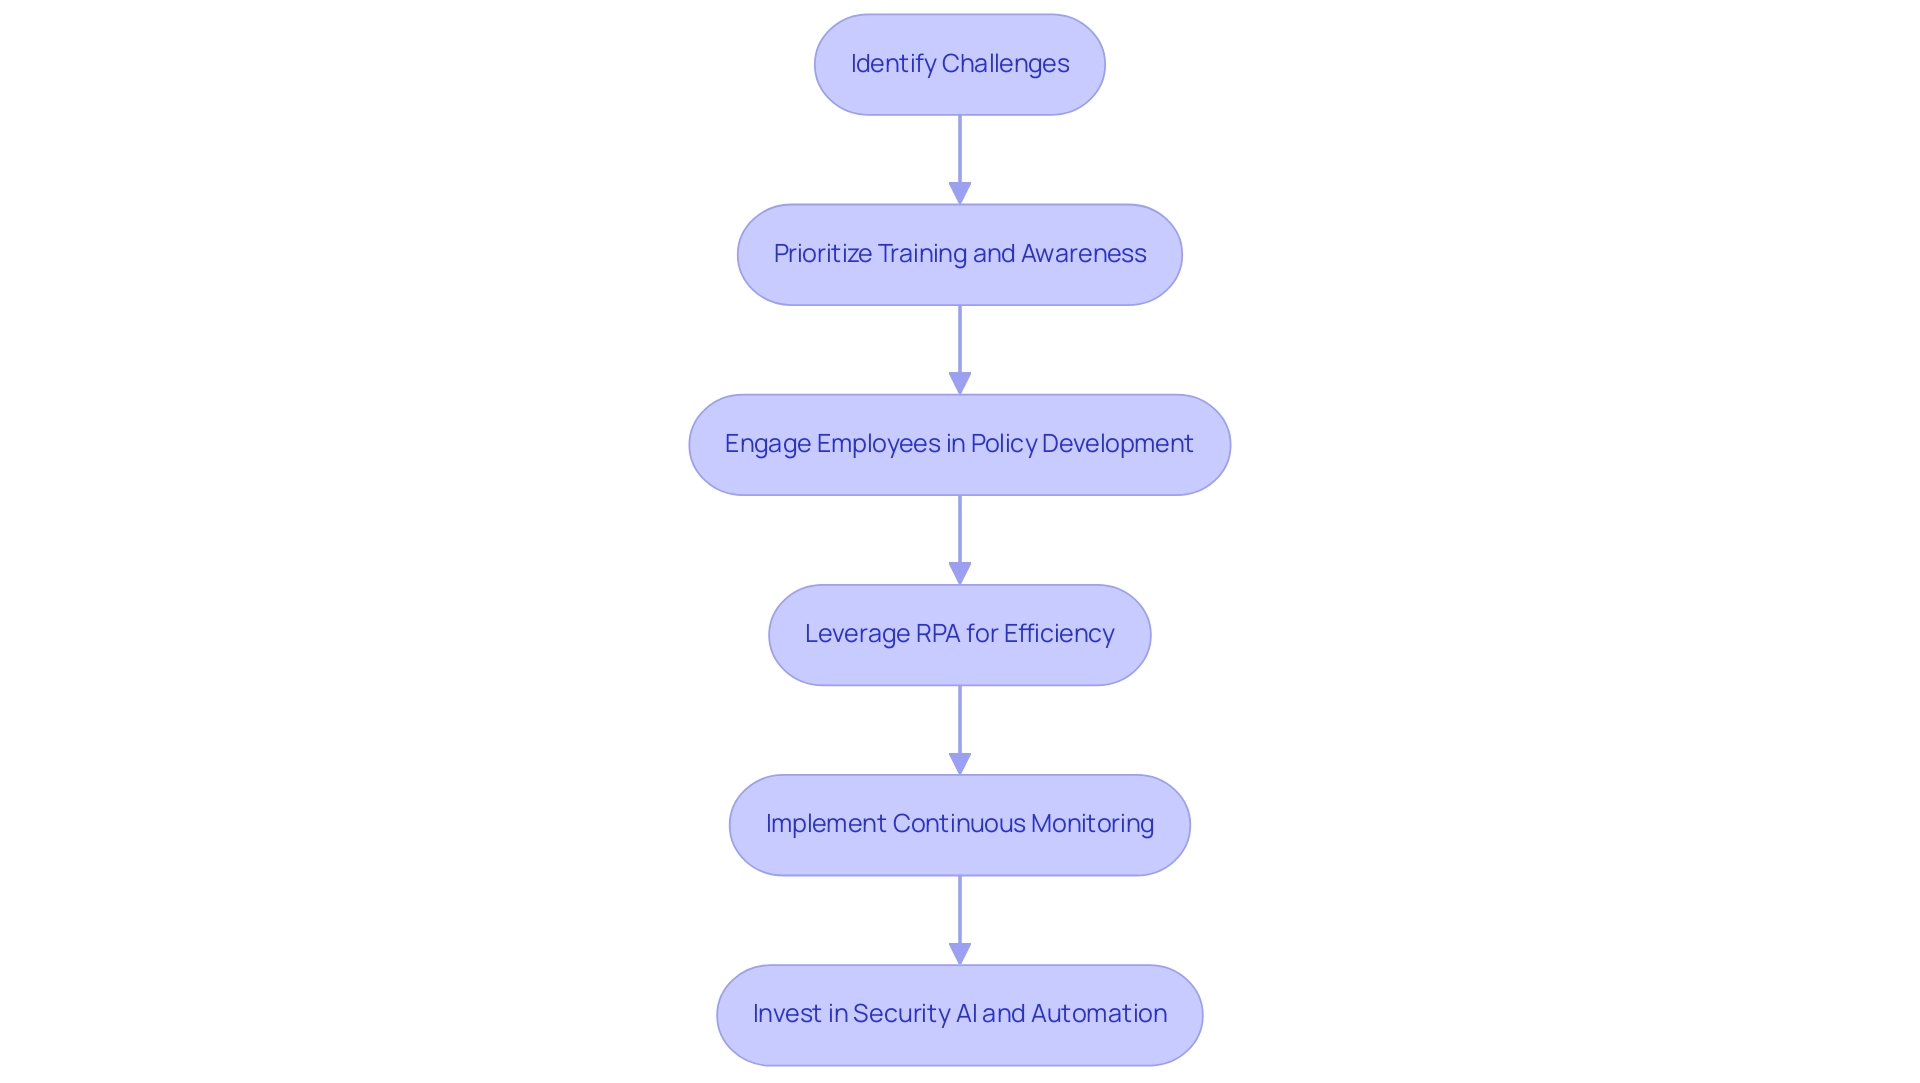
Best Practices for Ensuring Compliance with Privacy Regulations
Navigating the complexities of confidentiality regulations demands a proactive strategy that integrates privacy level settings for data sources alongside several critical practices. Regular audits of handling procedures are essential for identifying potential vulnerabilities, particularly regarding collection practices such as:
- IP address tracking
- The visibility of profile pictures linked to user comments
- The browser user agent string
To establish a robust privacy level setting, implementing information protection by design and by default is crucial, embedding privacy into the entity’s core processes.
Creating clear information retention guidelines is vital, especially given that 27% of security and IT experts cite alleviating internal audit fatigue from repeated evaluations as a significant regulatory challenge. Notably, organizations can save an average of $520,000 by establishing a formal governance charter, presenting a compelling financial incentive to adopt these measures. Transparency with users about information usage—including how comments and related details may be handled or shared—while securing explicit consent when necessary, fosters trust and supports adherence to the privacy level setting for this data source.
This approach may involve using an anonymized string created from email addresses (a hash) provided to the Gravatar service, enabling users to verify if they have a profile picture associated with their comments. Users can review the Gravatar service confidentiality policy for added assurance. Furthermore, regular training sessions aimed at informing employees about regulatory requirements and privacy principles reinforce an organization’s commitment to safeguarding user information.
As 67% of global executives find ESG regulation overly complex, consulting legal experts is essential for staying informed and ensuring ongoing compliance. This multifaceted approach not only enhances adherence efficiency but also addresses the increasing importance of information protection in organizational strategy, particularly as 91% of business leaders recognize their responsibility toward ESG issues.
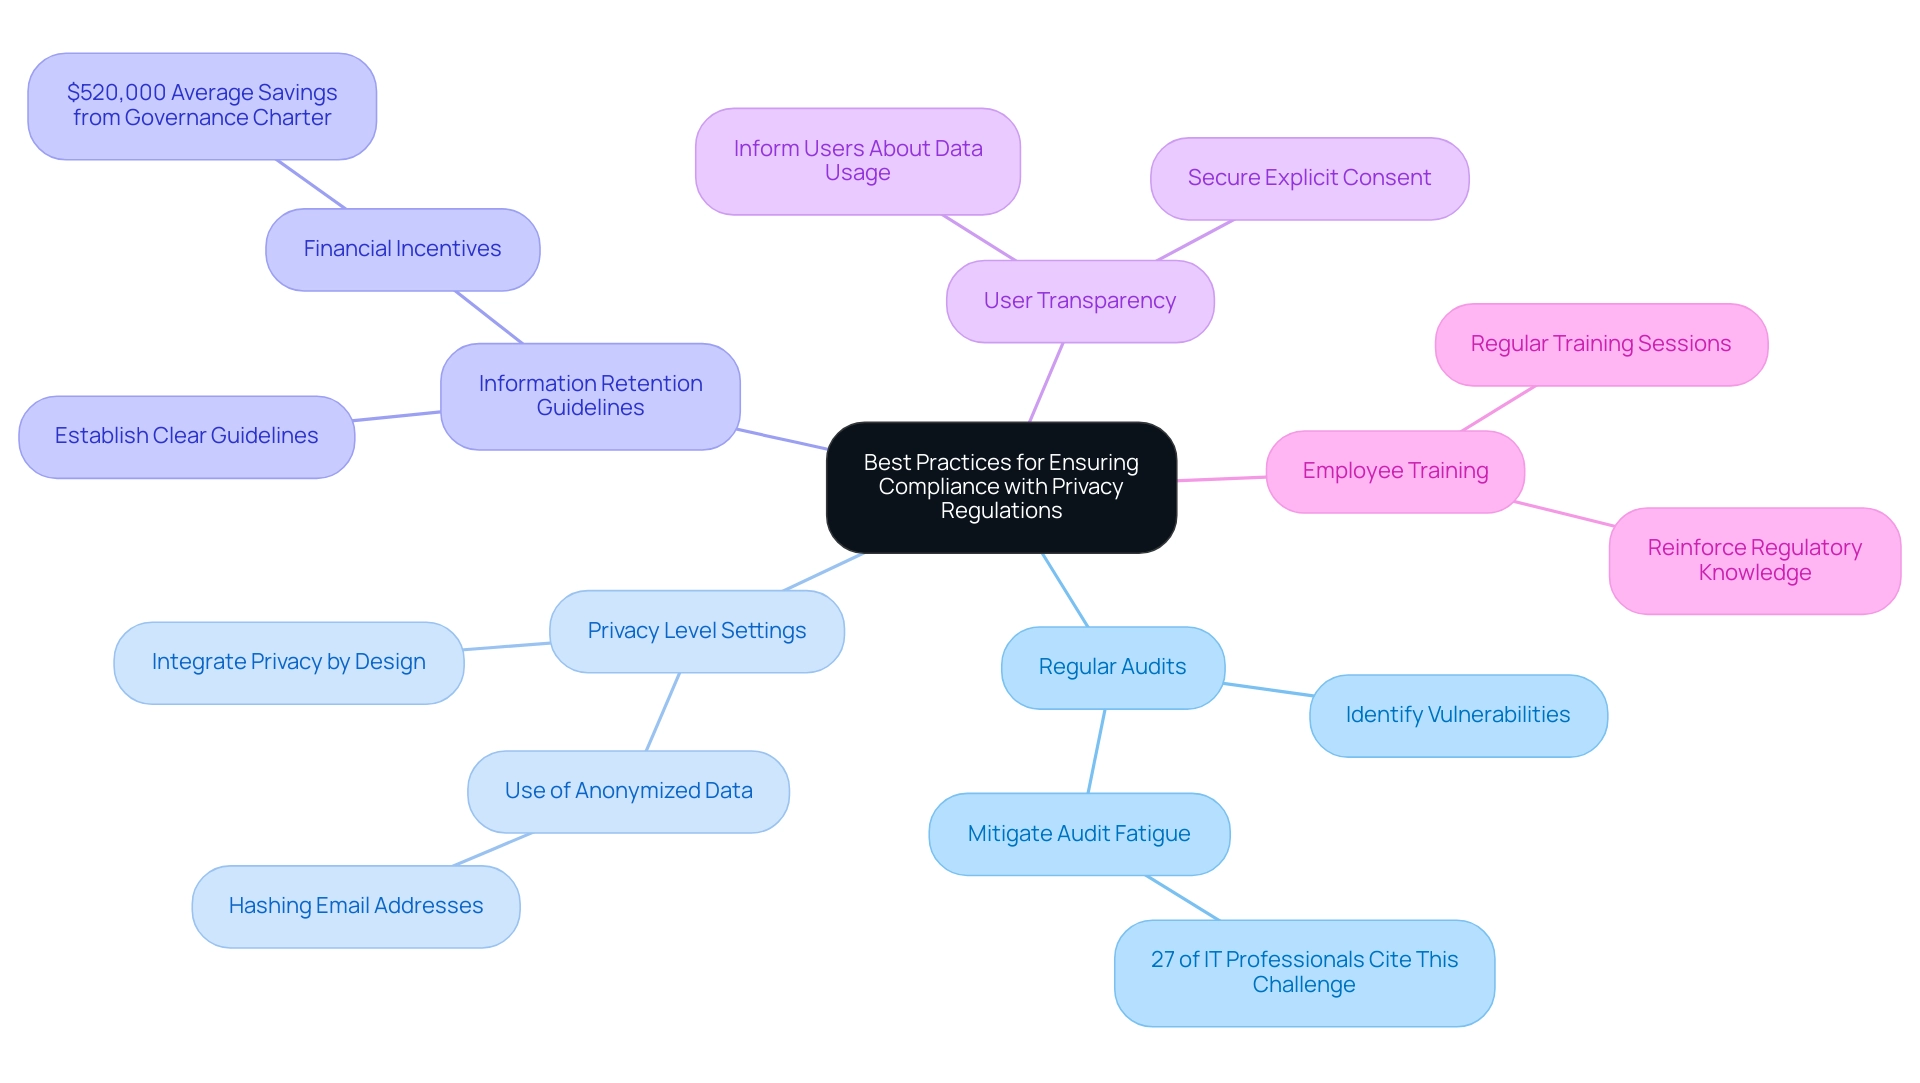
Leveraging Automation and AI for Enhanced Data Privacy Management
Organizations are increasingly adopting automation and artificial intelligence (AI) to enhance their information protection management strategies significantly. By utilizing advanced tools such as Robotic Process Automation (RPA) and tailored AI solutions—like Small Language Models for efficient data analysis and GenAI Workshops for hands-on training—businesses can automate oversight monitoring, streamline data classification, and conduct risk assessments. This not only improves operational efficiency but also positions them effectively within a rapidly evolving AI landscape. AI-driven solutions excel at analyzing vast datasets to identify sensitive information, ensuring privacy level settings for these data sources are managed in accordance with established privacy standards.
Automated workflows, for instance, can simplify the documentation of compliance activities, which is crucial for effectively addressing audits and regulatory inquiries. This approach enhances operational efficiency while strengthening an organization’s ability to identify and respond to potential breaches. Notably, IBM has indicated that phishing remains the primary infection vector, accounting for 41% of occurrences, underscoring the essential need for robust information protection measures.
Alarmingly, $17,700 is lost every minute due to phishing attacks, highlighting the urgency of addressing information protection and security. Furthermore, entities that have fully deployed security AI and automation experience an average data breach cost of $3.60 million—$1.76 million less than their counterparts that do not leverage such capabilities. By utilizing AI tools for regulatory monitoring and RPA for efficient workflow automation, organizations can foster a culture of transparency and trust, increasingly valued by consumers. A recent study revealed that only 29% of individuals find it easy to understand how well companies protect their personal information, yet 64% believe that clear data protection policies enhance trust.
This disparity in transparency presents a significant gap that organizations must address. Thus, incorporating AI into confidentiality strategies not only meets compliance requirements but also cultivates consumer trust by ensuring that privacy level settings for data sources are communicated clearly and effectively. Additionally, harnessing Business Intelligence can transform raw data into actionable insights, further supporting informed decision-making in data privacy management.
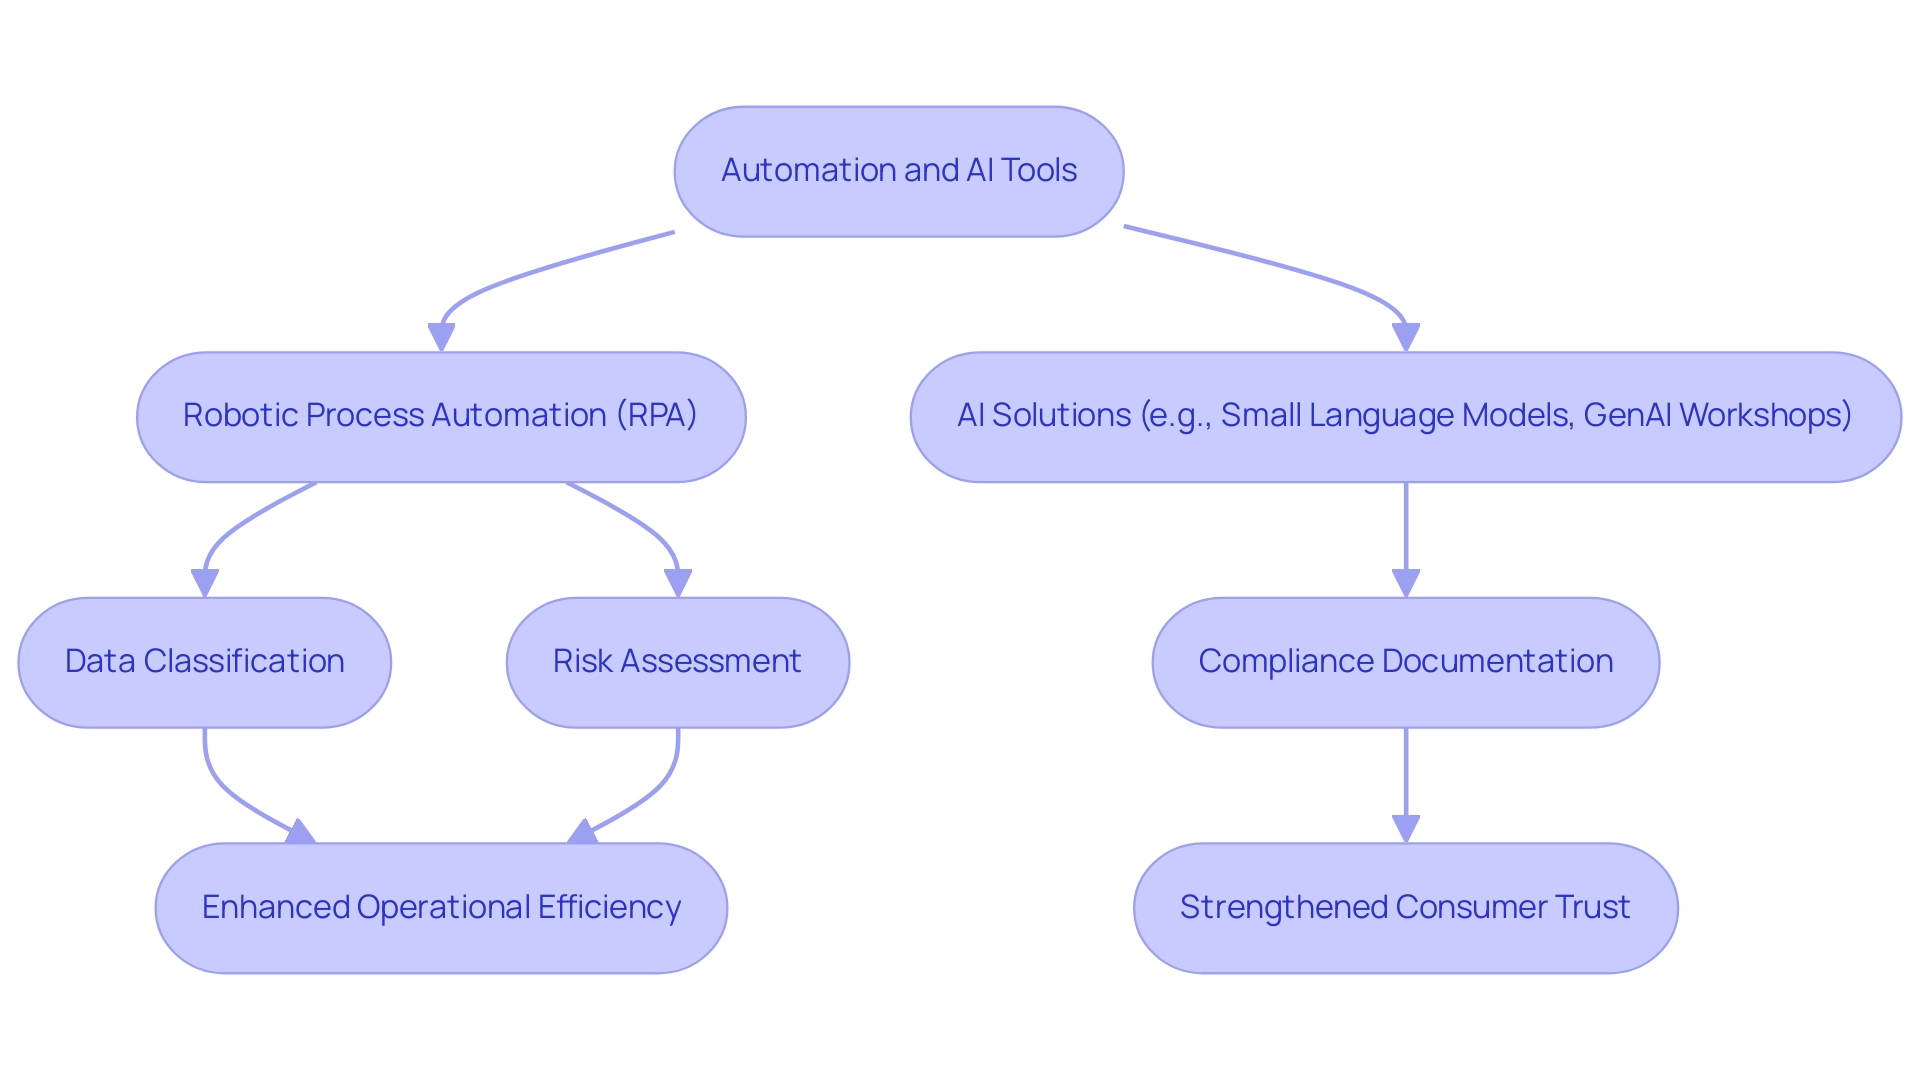
Conclusion
Data privacy represents a multifaceted challenge that organizations must adeptly navigate in today’s data-driven landscape. By understanding and implementing distinct privacy levels—Public, Organizational, and Private—businesses can establish effective protocols that safeguard sensitive information while fostering consumer trust. Each level carries its own set of access controls and security measures, crucial not only for compliance with regulations like GDPR and CCPA but also for mitigating risks associated with data misuse.
As organizations increasingly leverage technology, including artificial intelligence and automation, they must remain vigilant in their data management practices. Implementation challenges, such as employee resistance and the complexities of regulatory compliance, can be effectively addressed through comprehensive training and the integration of advanced tools that streamline processes and enhance operational efficiency. By prioritizing transparency and consent, organizations can cultivate a culture of trust with consumers, who are increasingly concerned about how their data is handled.
In conclusion, the stakes are high for organizations to adopt robust data privacy strategies that not only comply with evolving regulations but also align with consumer expectations. As data privacy becomes a cornerstone of organizational integrity, the commitment to safeguarding information will ultimately strengthen relationships with customers and enhance overall business resilience. Taking proactive steps today will pave the way for a secure and trustworthy digital environment tomorrow.
Overview
Premium capacity workspaces in Microsoft Power BI significantly enhance operational efficiency. By providing dedicated resources, these workspaces accommodate larger datasets and enable real-time data refreshes. Collectively, these features improve performance and elevate user experience. This article illustrates how such capabilities, coupled with automation and advanced sharing functionalities, empower organizations to make informed decisions and streamline workflows. In doing so, they drive growth and foster innovation within data-driven environments.
Introduction
In the realm of data analytics, Premium Capacity Workspaces in Microsoft Power BI emerge as a transformative solution for organizations aiming to elevate their data processing and reporting capabilities. These workspaces provide dedicated resources and advanced features, enabling businesses to manage larger datasets, refresh data more frequently, and enhance user access. As the demand for real-time insights intensifies, organizations are increasingly turning to these specialized environments to streamline operations and foster a data-driven culture.
With the impending transition to new Fabric F SKUs and the integration of Robotic Process Automation (RPA), the potential for improved efficiency and cost-effectiveness is greater than ever. This article delves into the key features, advantages, and best practices for implementing Premium Capacity Workspaces. It offers a comprehensive guide for organizations looking to harness the full power of their data in an ever-evolving landscape.
Understanding Premium Capacity Workspaces: An Overview
Premium Workspaces represent a significant advancement in Microsoft Power BI, offering specialized environments equipped with dedicated resources tailored for information processing and reporting. Organizations utilizing these workspaces can effectively manage larger datasets, refresh data more frequently, and optimize user access, which is essential for boosting operational efficiency. By designating a premium capacity workspace, businesses can transcend the limitations of shared capacities, ensuring enhanced performance and a superior user experience.
This capability is increasingly crucial for organizations seeking to leverage data-driven insights for informed decision-making, particularly in the rapidly evolving AI landscape. Here, Robotic Process Automation (RPA) plays a pivotal role by automating manual workflows, minimizing errors, and reallocating team resources to more strategic, value-adding tasks. Notably, with the transition to the new Fabric F SKUs mandated after January 1, 2025, organizations will experience improved cost efficiency, scalability, and AI capabilities. Features such as dynamic scaling and unlimited sharing without licensing will position them for future growth. Additionally, users can subscribe to reports on the last day of the month, further enhancing engagement and accessibility.
As Jason Himmelstein aptly stated,
This feature allows you to register and read BI items such as reports, scorecards, dashboards, or even a set of items like an app or workspace on NFC tags directly from the app.
This functionality exemplifies just one of the many ways a premium capacity workspace can empower businesses to enhance their processing and drive performance improvements. Moreover, the recent update enabling visual calculations by default illustrates how BI continually enhances usability and performance, providing users with improved formatting options and type settings that elevate the overall experience.
By integrating RPA and Business Intelligence within this framework, companies can tackle challenges such as time-consuming report creation and information inconsistencies, ultimately unlocking deeper insights that propel growth.
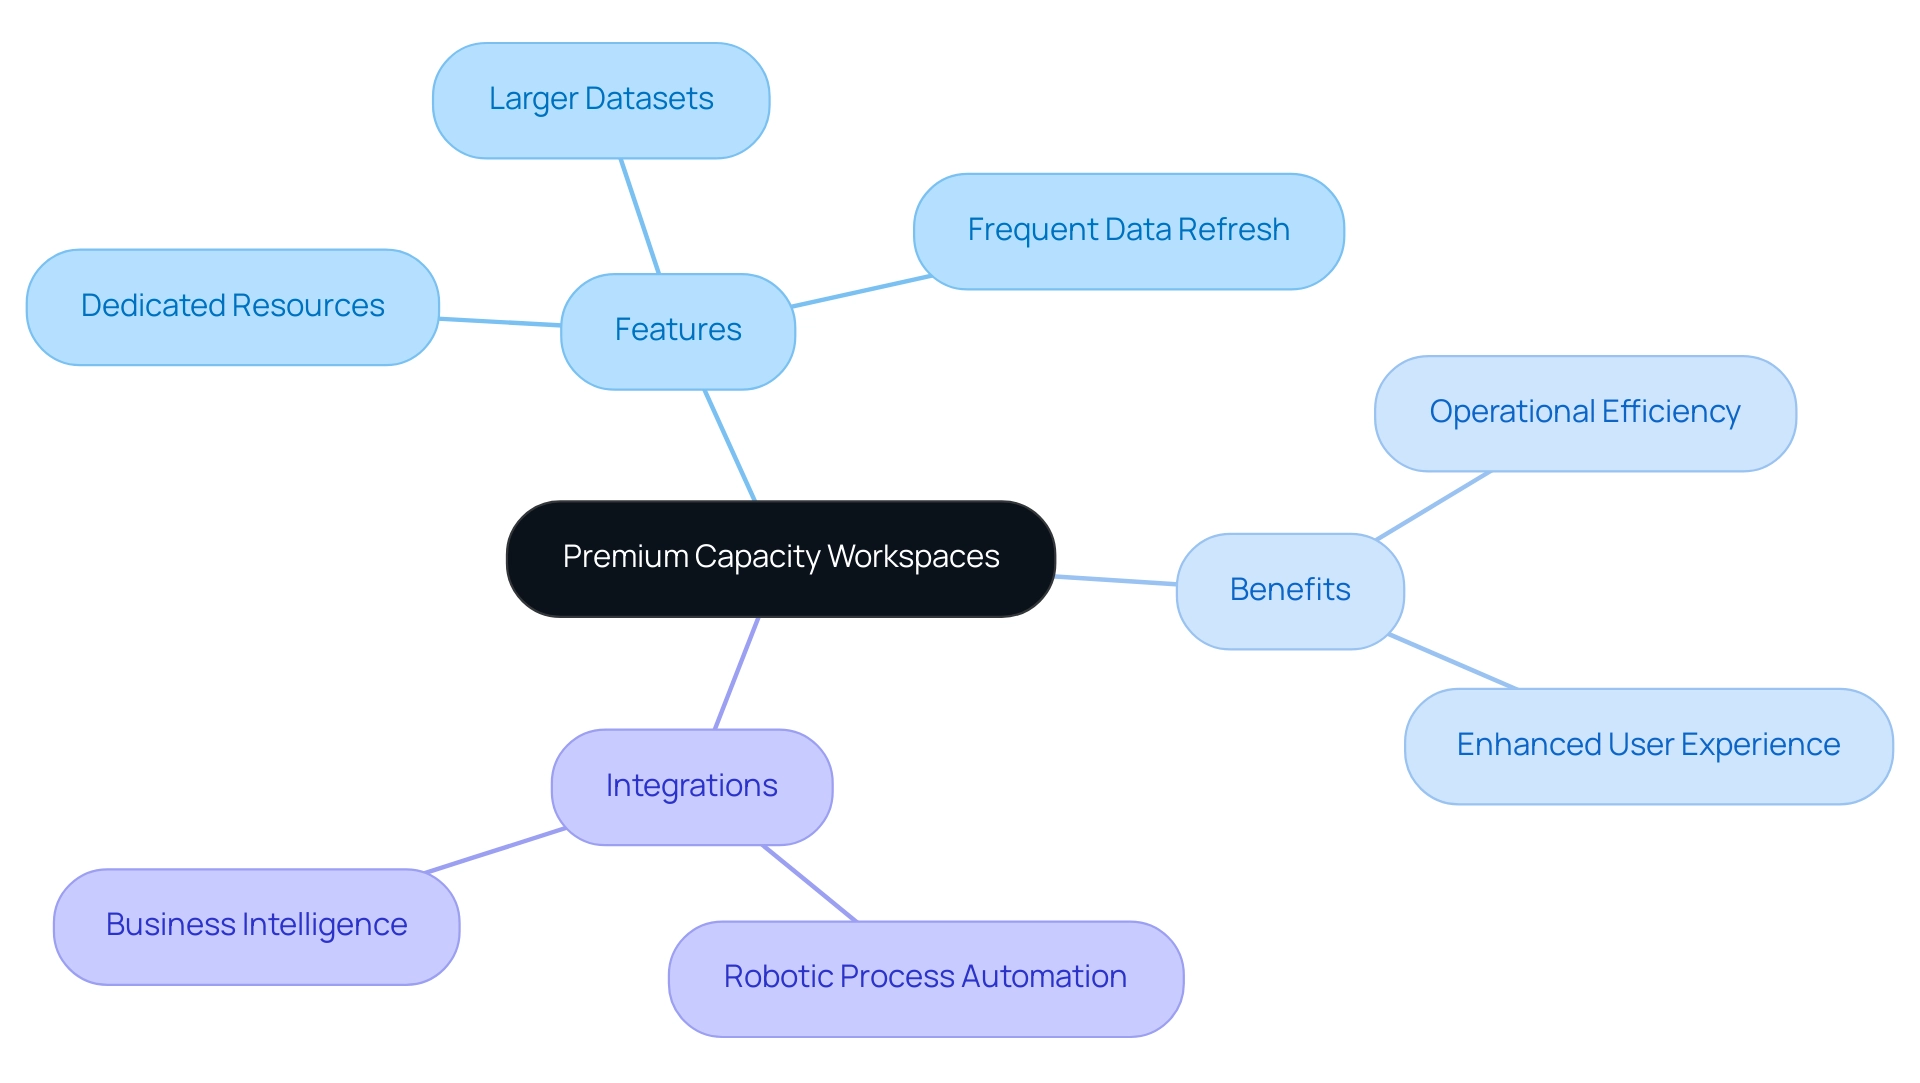
Key Features of Premium Capacity Workspaces
Premium capacity workspace in Power BI is distinguished by several key features that significantly enhance data management and reporting capabilities for businesses. Firstly, the Dedicated Resources aspect guarantees that users benefit from dedicated computing power, ensuring reliable performance even during peak usage periods. This reliability allows organizations to depend on consistent service, free from the interruptions often associated with shared capacities.
Moreover, Microsoft Fabric’s F2 capacity begins at approximately $262.80 monthly, providing a concrete financial context for organizations evaluating the advantages of premium capacity workspace.
Secondly, the Increased Dataset Sizes feature empowers users to analyze larger datasets, enabling more complex analyses and yielding richer insights that can drive strategic decisions. Additionally, the ability for Frequent Information Refreshes is a transformative advantage; it allows entities to conduct real-time reporting and analysis, keeping information current and actionable.
With dedicated resources, users also experience Enhanced Performance, characterized by quicker load times and improved responsiveness when interacting with reports and dashboards. This enhancement not only boosts user satisfaction but also optimizes workflow efficiency. The Advanced Sharing Options feature further democratizes insights by allowing users to share reports with individuals who do not hold Premium licenses, thus broadening access to critical information across the organization.
Organizations leveraging these capabilities can realize substantial operational benefits, as illustrated by the case study surrounding the connected tables feature in the BI Datasets Add-in for Excel. This integration facilitates the effortless incorporation of BI information into Excel workbooks, enhancing usability and optimizing workflows. Experts from Transition Technologies MS (TTMS) emphasize, “With their managed services approach, they handle all aspects of maintaining your BI tools – including necessary software updates – so you don’t have to worry about any interruptions to your business operations from unattended system latency issues or outdated versions.”
This statement underscores the critical role of managed services in ensuring optimal performance and reliability.
Additionally, the integration of Automation within these workspaces streamlines workflow processes, reducing time-consuming tasks and enhancing operational efficiency. This capability is vital for addressing the challenges companies face in leveraging insights from BI dashboards, such as lengthy report creation and inconsistencies. Furthermore, the 3-Day Power BI Sprint allows entities to quickly generate professionally designed reports, while the General Management App offers comprehensive management and smart reviews, further enriching the overall experience.
Collectively, these characteristics highlight the importance of investing in premium capacity workspace, as they not only enhance information processing and reporting but also foster growth and innovation through robust Business Intelligence solutions.
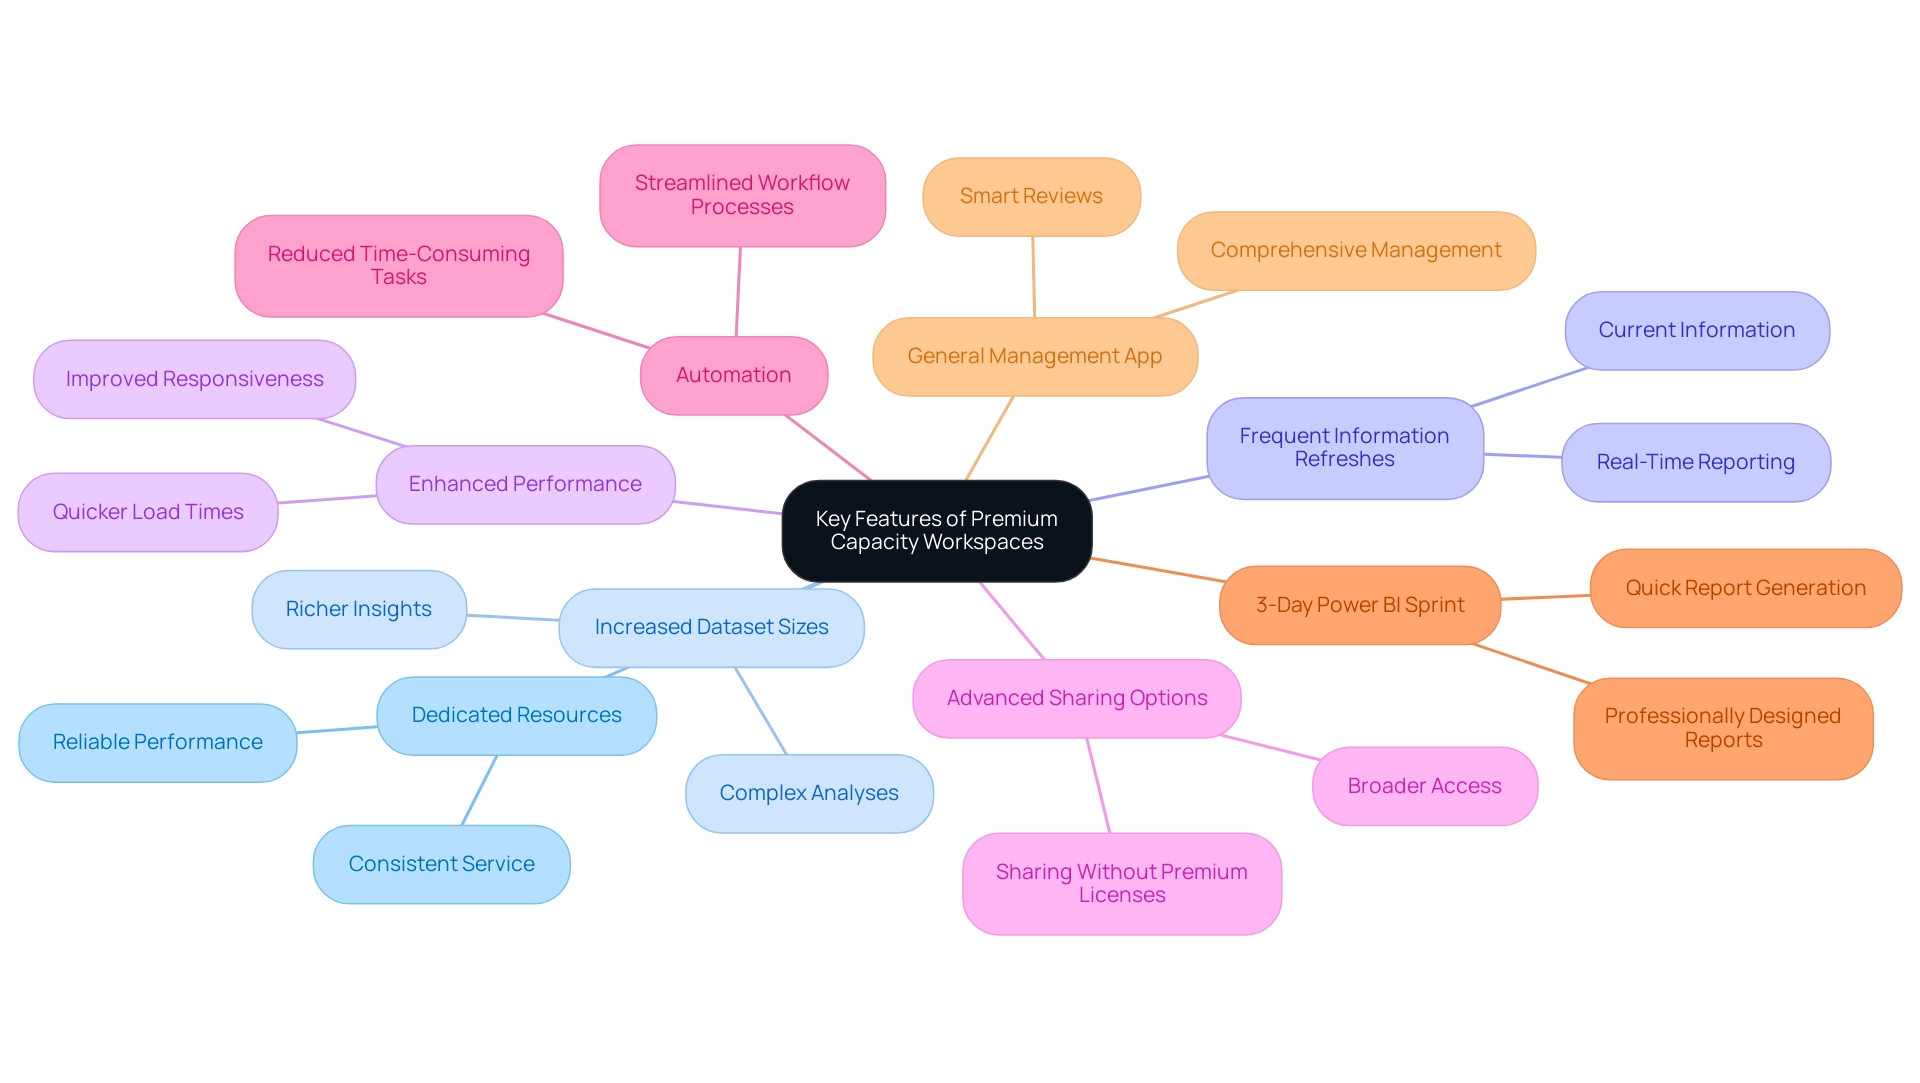
Advantages of Implementing Premium Capacity Workspaces
Implementing a premium capacity workspace presents a multitude of advantages for entities seeking to enhance their operational efficiency.
-
Improved Efficiency: Streamlining information processes through Robotic Process Automation (RPA) and allocating dedicated resources enables organizations to significantly reduce the time spent on management and analysis. This streamlined approach allows teams to focus more on strategic initiatives rather than becoming bogged down in repetitive tasks.
-
Cost-Effectiveness: While there is an initial investment of approximately $4,995 per month for the P1 SKU of BI Premium, the long-term savings generated from enhanced efficiency and decreased operational costs can be substantial. RPA automates manual workflows, resulting in reduced labor expenses as teams spend less time on management. Tailored AI solutions further enhance this by optimizing processes and reducing errors, thus contributing to overall cost savings. As Hubert Ferenc, Power Platform Practice Lead at TTMS, highlights,
Webcon would have been too large and costly a solution, which is why we chose Power Apps—it met all our needs perfectly.
This perspective underscores the importance of selecting the right tools, such as RPA and tailored AI solutions, to align with organizational needs. -
Scalability: Premium capacity workspaces are designed to expand alongside businesses, easily accommodating rising information volumes and user demands. This adaptability is crucial for businesses anticipating growth and needing to scale their operations seamlessly.
-
Enhanced Collaboration: Improved sharing capabilities foster a collaborative environment, allowing teams to work together more effectively and ensuring that insights are readily accessible to all stakeholders. This collaboration is vital for driving innovation and responsiveness within teams.
-
Better Decision-Making: By providing real-time data access and analysis through Business Intelligence, companies can make informed decisions rapidly, bolstering their competitive edge in a fast-paced market. The office provides a premium capacity workspace to enhance productivity.
Structured Implementation: A successful execution of a premium capacity workspace requires a systematic approach, including needs analysis, training, and regular feedback to ensure that the system meets the evolving requirements of the entity. This structured implementation is essential for overcoming technology implementation challenges and maximizing the benefits of RPA and tailored AI solutions. The strategic execution of premium capacity workspace not only enhances efficiency but also allows entities to thrive in 2024 and beyond.
For example, the integration of Adobe Experience Manager (AEM) with ChatGPT has transformed content management and customer engagement, automating content generation and enhancing personalization. This illustrates the potential for improved efficiency and collaboration using Premium resources.
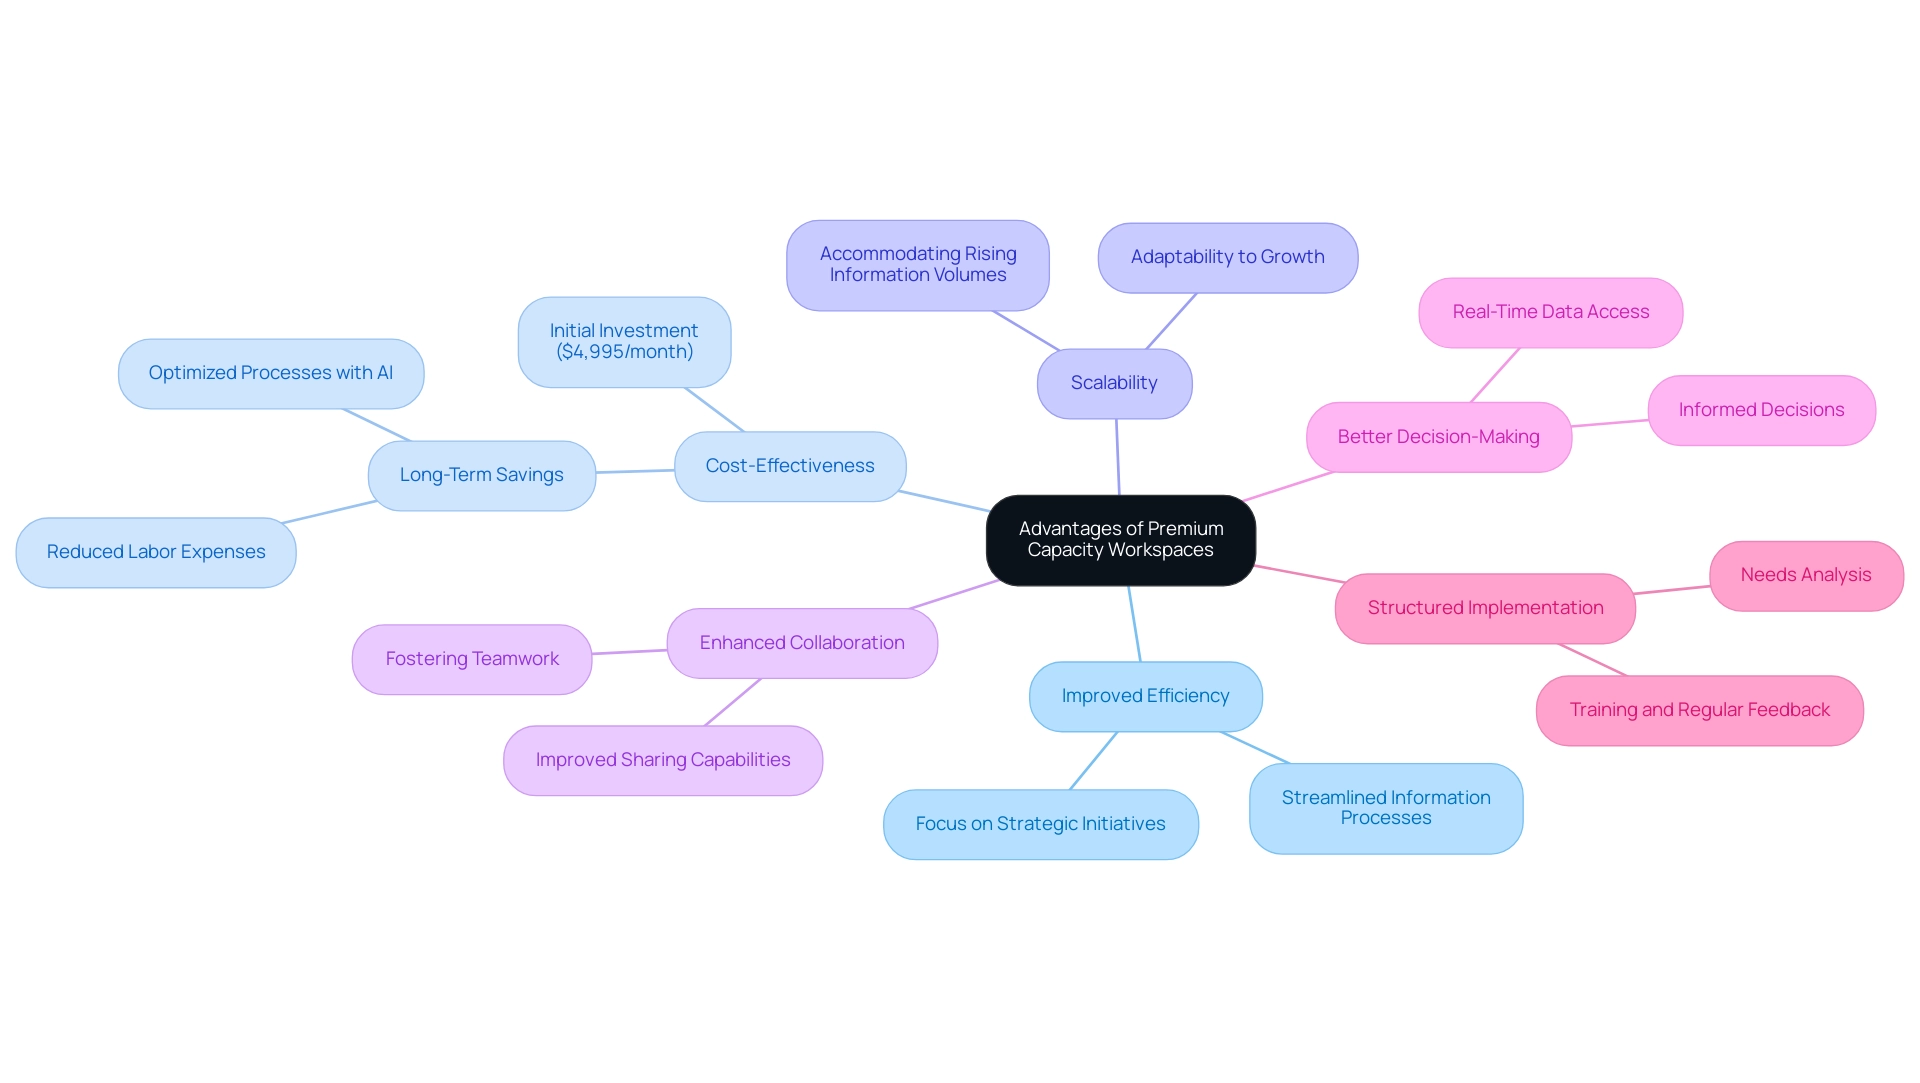
Comparing Premium Capacity with Other Power BI Licensing Options
A thorough comparison of Power BI Premium resources with other licensing options—such as Power BI Pro and Free licenses—reveals several critical distinctions essential for organizations aiming to leverage Business Intelligence and RPA for operational efficiency and addressing the lack of data-driven insights.
-
Resource Allocation: The premium capacity workspace is designed to offer dedicated resources, ensuring optimal performance even during peak usage times. In contrast, both Pro and Free licenses depend on shared resources, which can result in potential performance degradation when demand increases. This ultimately affects the ability to gain meaningful insights from information.
-
Data Limitations: Organizations leveraging a premium capacity workspace benefit from larger dataset sizes and more frequent refresh rates, positioning them favorably for data-intensive operations. This capability is crucial for effectively harnessing the power of BI to drive growth and combat challenges like time-consuming report creation and data inconsistencies. Pro licenses, however, impose stricter limits that could hinder performance for larger datasets and complicate insight extraction.
-
User Access: A significant advantage of the premium capacity workspace is its ability to facilitate report sharing with users who lack Pro licenses. This feature enhances accessibility for larger teams, promoting collaboration without requiring every team member to invest in a Pro license, thereby easing the challenges of disseminating data-driven insights across the entity.
-
Advanced Features: The premium capacity workspace encompasses advanced functionalities, including AI capabilities and enhanced modeling choices, which are not available with lower-tier licenses. These features enable businesses to leverage their data more effectively, driving better insights and decision-making, and complementing RPA initiatives aimed at improving efficiency.
-
Cost Structure: Although the premium capacity workspace involves a higher initial investment—BI Report Server commencing at approximately $18,900 for the first year—it can ultimately prove to be more economical for entities with extensive business intelligence needs. Its scalability and enhanced performance benefits can lead to significant long-term savings. Additionally, adopting F SKUs allows organizations to benefit from future enhancements and integrations within the Microsoft ecosystem.
In a recent user case study titled ‘Sharing Capabilities in Power BI,’ the shift in sharing capabilities highlighted the necessity of understanding these distinctions. The user’s clarification on sharing dashboards emphasized the limitations of the free version, reinforcing the advantages of Premium features. As entities evaluate their options, insights from experts like Steve, who emphasizes the importance of leveraging advanced data solutions effectively alongside RPA, become invaluable in guiding their decisions.
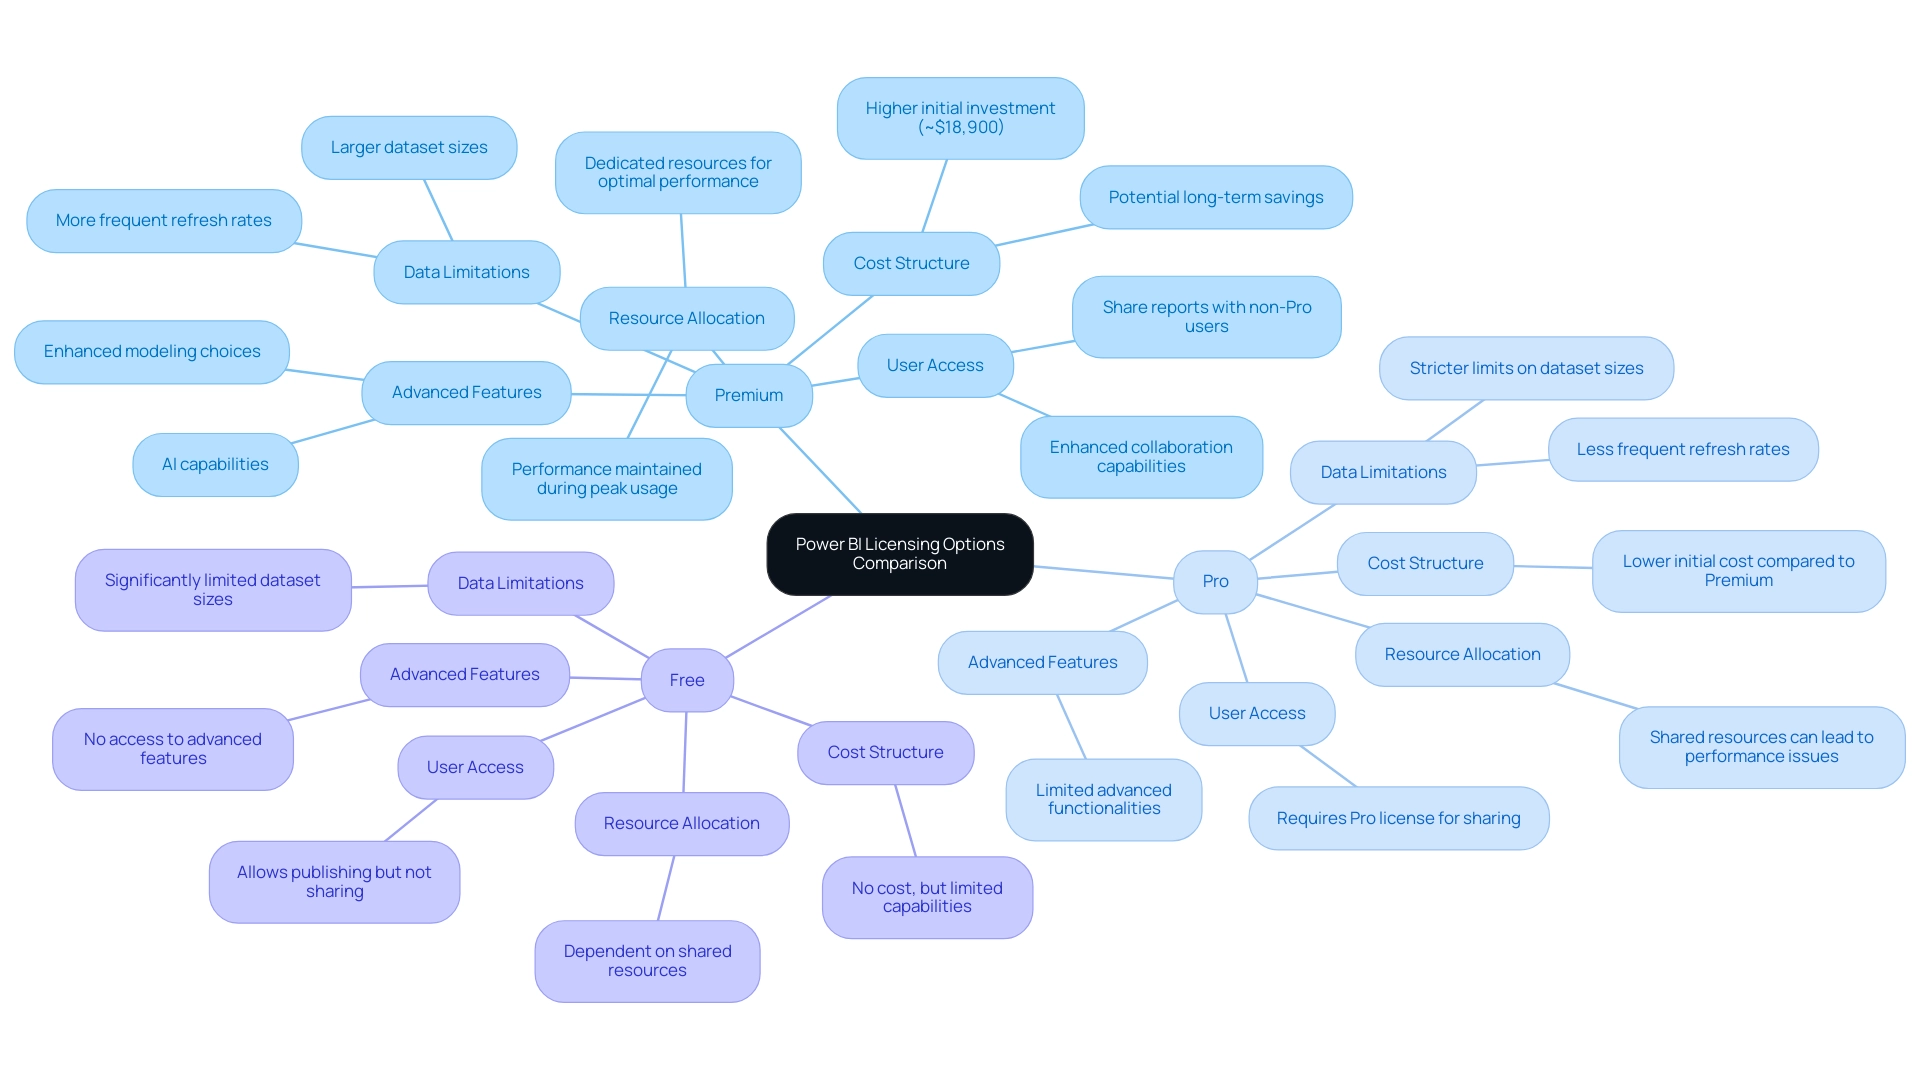
Best Practices for Managing Premium Capacity Workspaces
Successfully overseeing premium capacity workspace in Business Intelligence requires a strategic approach that integrates best practices to enhance performance and user experience. First, Regular Monitoring is essential; utilizing Power BI’s capacity metrics app enables businesses to closely track performance and resource utilization, facilitating timely adjustments to optimize operations. For instance, a team successfully reduced their dataset size from approximately 8 GB to 1.5 GB without significant performance degradation, illustrating the profound impact of effective management on performance.
Second, User Training is crucial for maximizing the capabilities of the premium capacity workspace. As highlighted by Brahmareddy, It allowed me to pinpoint which visuals or queries were the bottlenecks, emphasizing how training empowers users to identify and resolve performance issues. This concept underscores the importance of Business Intelligence in enabling effective decision-making.
Third, establishing Governance policies is vital for managing access and maintaining quality across the organization, which is critical for reliable insights. For example, the pattern for calculating running totals in DAX involves using CALCULATE and FILTER functions, providing a foundational approach for cumulative metrics in datasets.
Fourth, Capacity Planning is essential for anticipating future growth and preventing performance bottlenecks—organizations should assess their needs and prepare accordingly, acknowledging the challenges in leveraging insights from BI dashboards, such as time-consuming report creation and data inconsistencies.
The 3-Day Business Intelligence Sprint specifically addresses these challenges by providing a structured approach to streamline report creation, ensuring that users can concentrate on actionable insights rather than becoming bogged down by the intricacies of report design. Furthermore, entities should track licensing expenses to enhance their budget for BI usage, guaranteeing effective resource distribution.
Finally, creating Feedback Loops fosters continuous improvement by gathering user insights to enhance the workspace experience and proactively tackle challenges.
By implementing these best practices and leveraging services like our 3-Day Power BI Sprint, which also incorporates automation tools to mitigate staffing shortages and outdated systems, organizations can ensure that their premium capacity workspaces for Power BI are utilized to their fullest potential, driving business growth through actionable insights.
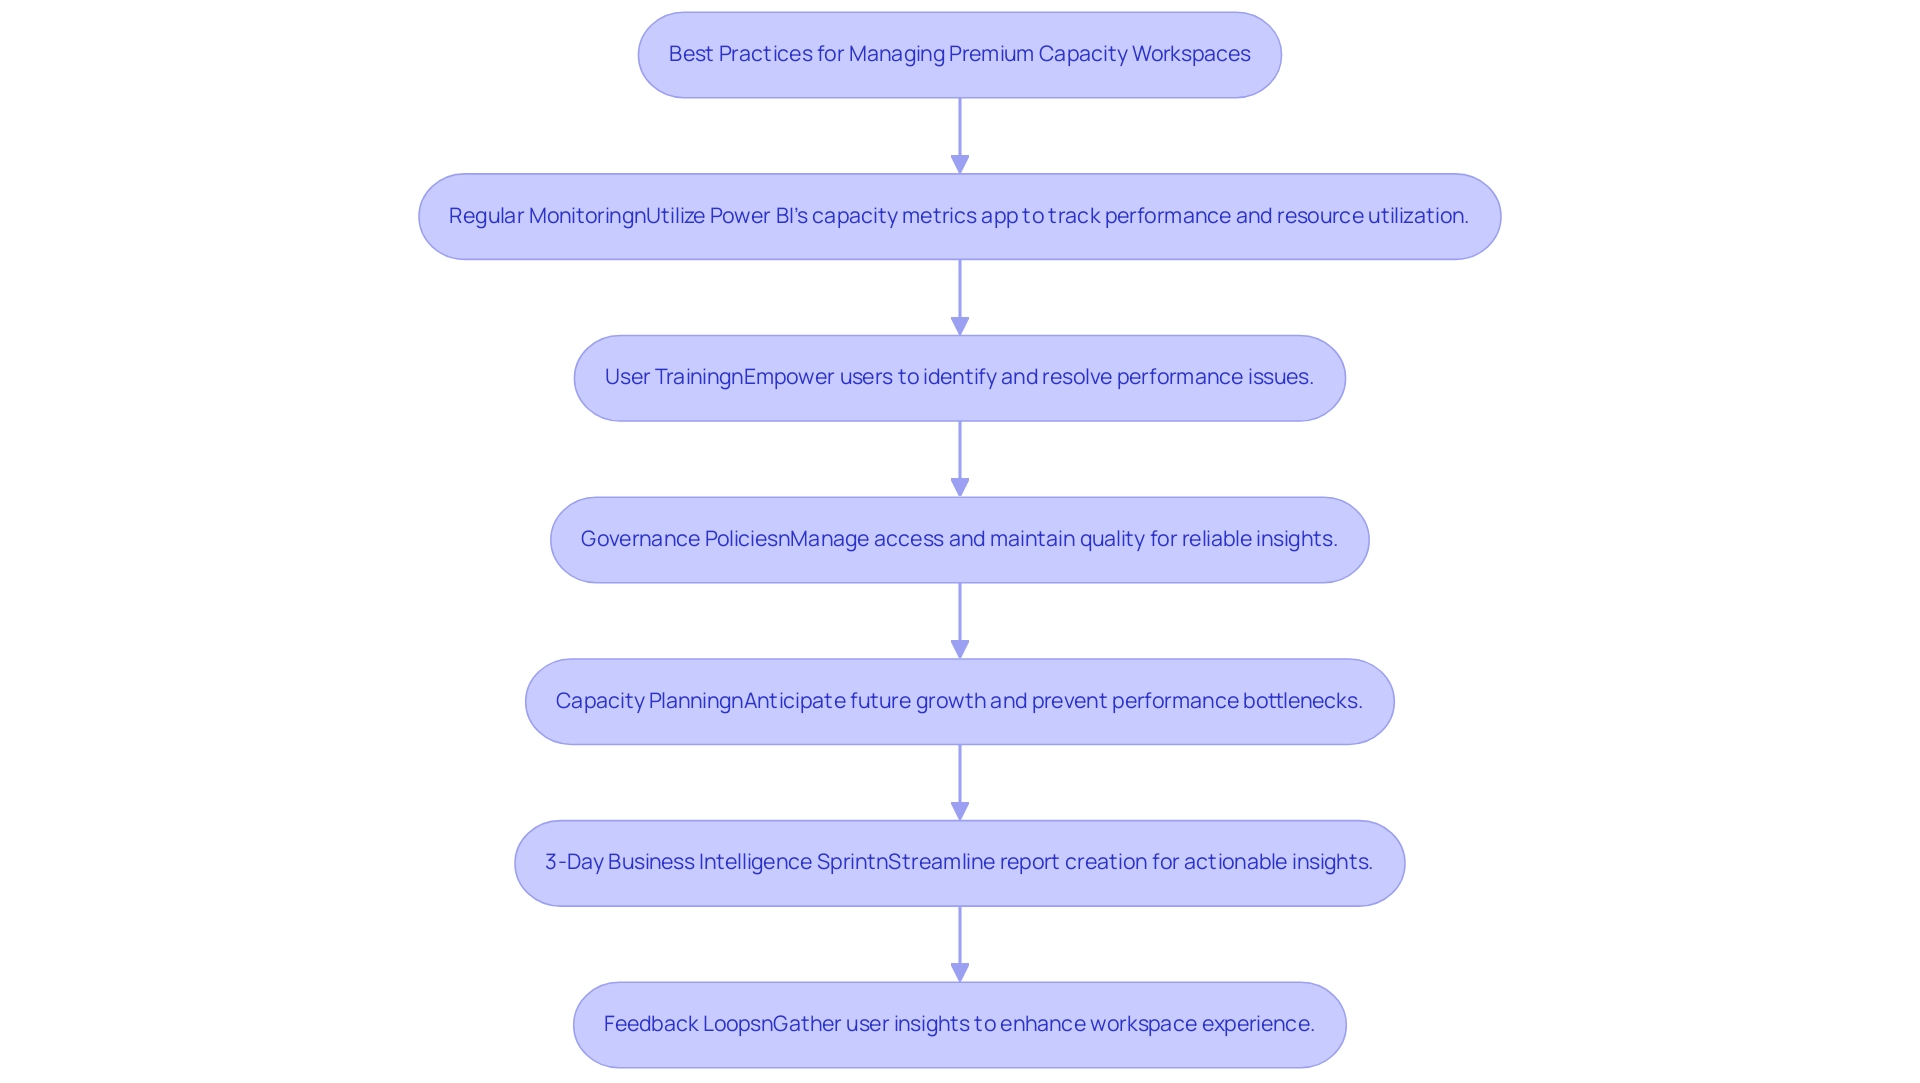
Conclusion
Premium Capacity Workspaces in Microsoft Power BI present a substantial opportunity for organizations to elevate their data processing and reporting capabilities. By leveraging dedicated resources, these workspaces facilitate the management of larger datasets and more frequent data refreshes, which are essential for fostering a data-driven culture.
The benefits extend beyond mere performance enhancements. The implementation of Premium Capacity Workspaces drives increased efficiency, cost-effectiveness, and scalability. Through the integration of Robotic Process Automation (RPA), organizations can streamline operations, allowing them to concentrate on strategic initiatives rather than repetitive tasks. This shift significantly enhances decision-making and bolsters competitive advantage.
To fully capitalize on these advantages, it is imperative to adopt best management practices, including:
- Regular monitoring
- User training
- Effective data governance
These components are vital for optimizing both performance and user experience. By nurturing a culture of continuous improvement, organizations can adeptly navigate the complexities of data management and unlock invaluable insights.
As the demand for real-time insights escalates, Premium Capacity Workspaces emerge as a critical resource for organizations striving to enhance their data capabilities. Investing in these specialized environments not only amplifies operational efficiency but also positions businesses for success in a data-centric landscape. Embracing this opportunity is essential for organizations intent on leveraging their data’s full potential and driving future growth.
Overview
The article emphasizes the critical process of effectively replacing blank values with nulls in Power Query, underscoring its significance for maintaining data integrity and enhancing Business Intelligence outcomes. It presents a comprehensive step-by-step guide, highlighting the necessity of understanding the distinction between blank and null values for accurate data analysis. This practice is essential, as it helps prevent misinterpretation of data during calculations and boosts overall operational efficiency.
Introduction
In the realm of data management, distinguishing between null and blank values in Power Query is not merely a technicality; it is a foundational skill that can profoundly impact the accuracy and reliability of business intelligence efforts. A null value signifies a complete absence of data, whereas a blank value typically represents an empty string, leading to divergent interpretations during data analysis. Given the escalating importance of data integrity in decision-making processes, grasping these nuances is essential for organizations aiming to optimize their data handling practices.
This article explores the intricacies of managing these values, offering a step-by-step guide for:
- Replacing blanks with nulls
- Troubleshooting common issues
- Sharing best practices that enhance operational efficiency
Whether leveraging robotic process automation or employing advanced data analytics techniques, mastering these concepts is critical for driving growth and innovation in today’s data-driven landscape.
Understanding Null vs. Blank Values in Power Query
In Power Query, grasping the distinction between a missing entry and an empty entry is crucial for effective information management. This understanding is particularly significant when employing the power query function to replace blank with null, thereby enhancing Business Intelligence capabilities. A nonexistent entry signifies a complete absence of information, while an empty entry typically appears as an empty string. Recognizing this difference is vital; utilizing power query to replace blank with null can mitigate inconsistent results during analysis and transformations.
For example, during calculations or aggregations, null values are usually ignored, whereas replacing blank with null in Power Query ensures that blank values are not misinterpreted as zeros or empty strings. This nuanced comprehension is essential for achieving accurate results in reports and analyses, which are fundamental for driving growth and innovation in today’s data-centric landscape. Acknowledging these distinctions facilitates better management of quality issues, thereby reducing the risk of analytical errors—an essential factor for operational efficiency.
Moreover, RPA solutions such as EMMA RPA and Power Automate can optimize information handling processes, boosting operational efficiency by automating repetitive management tasks. As industry experts assert, leveraging Python libraries to manage missing information can expedite and enhance the overall process in real-world applications. Statistics reveal that analytical errors arising from null versus blank entries can lead to significant inaccuracies, underscoring the importance of proper handling in BI initiatives, including the utilization of power query to replace blank with null. Additionally, the challenges posed by inadequate master information quality can hinder AI adoption, making it imperative to address these concerns.
For instance, the case study on Regression Imputation illustrates how creating a model to predict missing entries based on other observed variables can elevate the quality of the dataset, providing a practical application for managing these elements in analysis. To explore how RPA solutions can bolster your information management efforts, consider scheduling a consultation.
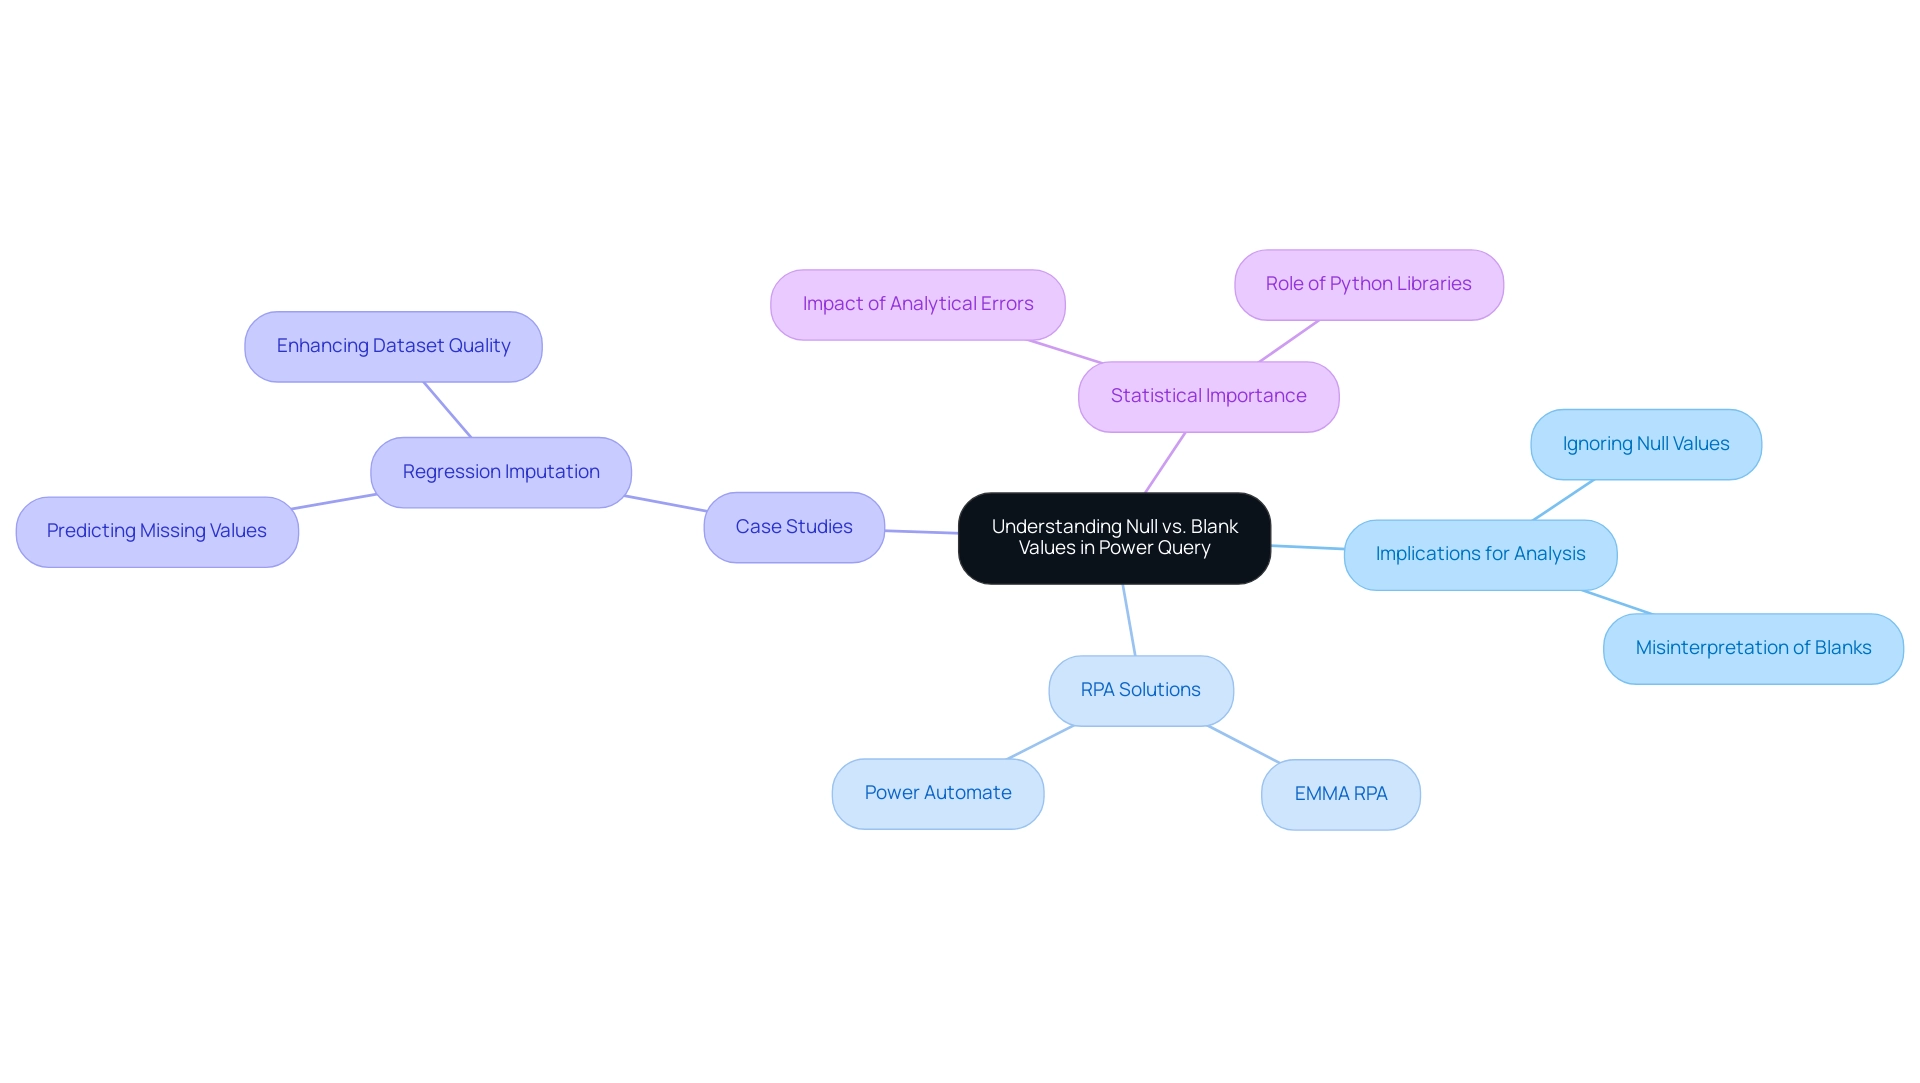
Step-by-Step Guide to Replacing Blank Values with Nulls
The essential procedure for preserving information integrity and ensuring precise analysis involves utilizing Power Query to replace blanks with null values, effectively substituting empty entries with indicators of absence. Given that 20% of respondents report either not having tested their disaster recovery plans or lacking them altogether, it is evident that meticulous information management can mitigate substantial risks and enhance overall efficiency. This process not only facilitates effective decision-making but also adheres to best practices in Business Intelligence and operational efficiency. Failing to extract meaningful insights can leave your business at a competitive disadvantage.
Moreover, employing Robotic Process Automation (RPA) can streamline this process, simplifying the management of null and empty entries. Follow these detailed steps to execute this transformation effectively:
- Load Your Data: Begin by opening Power Query and loading the dataset that requires modification. This prepares the ground for efficient information manipulation.
- Select the Target Column: Click on the header of the column where you intend to replace blank entries. Selecting the correct column is critical to ensure that your changes apply precisely where needed.
- Navigate to the Transform Tab: Head over to the ‘Transform’ tab located in the Power Query Editor. This is where you’ll find the tools necessary for data transformation.
- Click on Replace Values: Within the ‘Transform’ tab, locate and click on ‘Replace Values’. This action initiates the process of determining which principles to change.
- Set Up the Substitute: In the ‘Replace Items’ dialog box, leave the ‘Item to Locate’ field empty to indicate an empty entry. In the ‘Replace With’ field, enter nothing. This step is critical in ensuring that the conversion is recognized correctly by the system.
- Apply Changes: Click ‘OK’ to execute the changes. By using Power Query to replace blanks with nulls, your empty entries should now be successfully replaced, thereby enhancing the quality of your dataset.
- Close & Load: Once you are satisfied with the modifications, click ‘Close & Load’ to return to your Excel or Power BI environment with the newly updated information.
Implementing these steps not only improves the accuracy of your information but also aligns with best practices recommended by experts. As noted by Acock AC, > Working with absent data is essential to maintain the reliability of your analysis <. This insight is particularly relevant given the challenges posed by poor master data quality and the barriers to AI adoption, illustrating that neglecting data integrity can pose significant risks, as evidenced by the 20% of respondents who reported not having tested their disaster recovery plans.
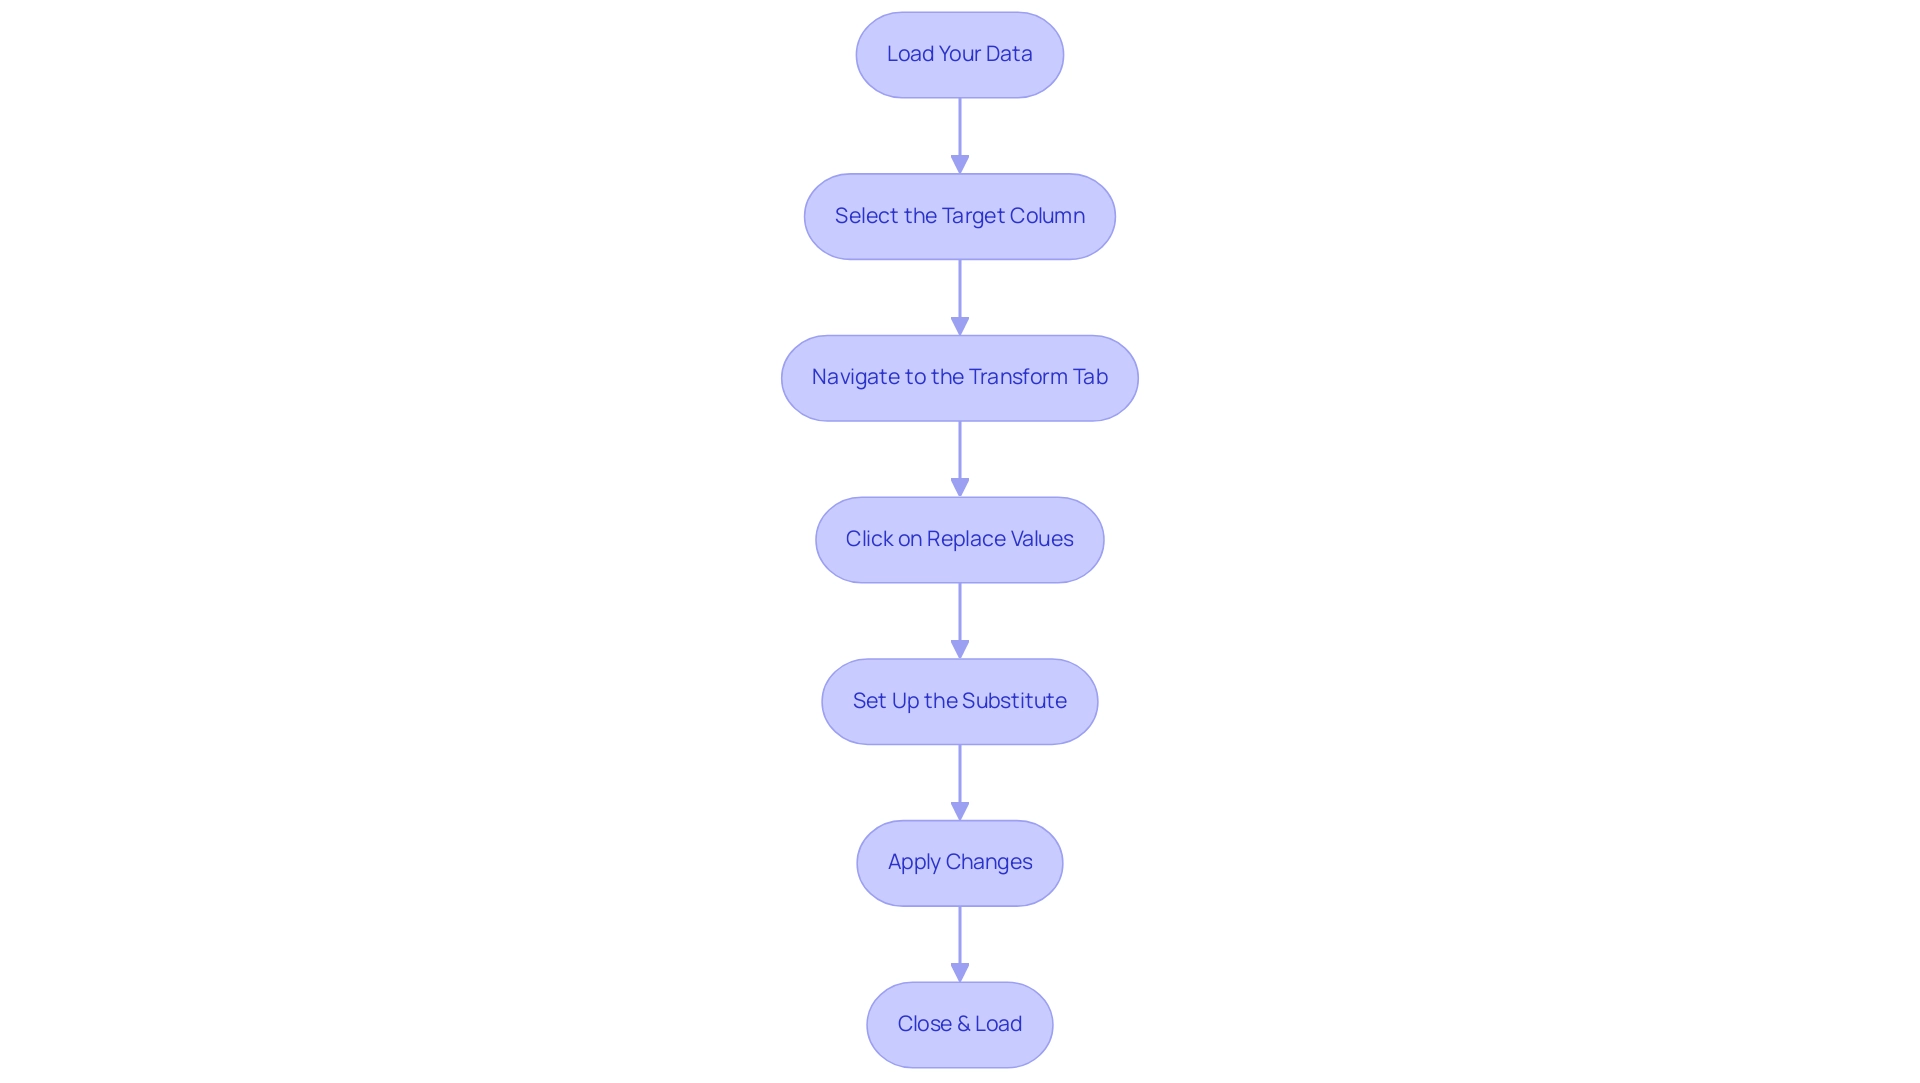
Troubleshooting Common Issues in Value Replacement
When replacing blank values with nulls in Power BI and Power Query, users often encounter several prevalent challenges that reflect broader themes in technology implementation:
-
No Change After Replacement: If the values appear unchanged post-replacement, it is crucial to verify that the targeted values are indeed blank. This can be accomplished by filtering the column to inspect the actual entries. Remember, a blank entry represents an empty string, which must be explicitly defined in the code, whereas a NULL indication signifies ‘Data was not provided’. Understanding the distinction between these elements is vital for efficient information management methods, as highlighted in the context of RPA, which can streamline processes by automating the recognition and substitution of these elements, ultimately enhancing operational effectiveness.
-
Encountering Error Messages: If an error message arises during the replacement process, examine the ‘Applied Steps’ pane for any previous actions that may conflict with your current request. Adjusting or removing these conflicting steps can resolve the issue and facilitate a successful replacement. This scenario mirrors the common hurdles organizations face when adopting new technologies like AI, where prior data management steps can complicate implementation.
-
Confusion Between Empty and Nil: Many users mistakenly interchange empty entries with nils. An empty entry denotes an empty string, while a void indicates that no information exists. Therefore, when utilizing Power Query to replace blank with null, ensure you specify the intended value correctly in the replacement dialog to avoid errors. As Andrew observes, “I utilize an archive database and remove triggers for soft deletes and have discovered that it has 3 significant advantages,” emphasizing the importance of clear information management practices relevant to leveraging Business Intelligence for informed decision-making.
By recognizing these common issues and employing effective troubleshooting strategies, users can enhance their efficiency in managing replacements and ensure higher integrity by utilizing Power Query to replace blank with null. Moreover, understanding the reasons for absent information is essential, as demonstrated in the case study on sensitivity analysis in incomplete records, which assesses how uncertainty in model outputs can be traced back to various sources of uncertainty in inputs. This comprehension can significantly aid in addressing the challenges of substituting empty entries with absent indicators, as organizations strive to overcome information quality obstacles.
Additionally, addressing poor master quality through tailored AI solutions can further empower organizations to leverage insights effectively and enhance overall decision-making.
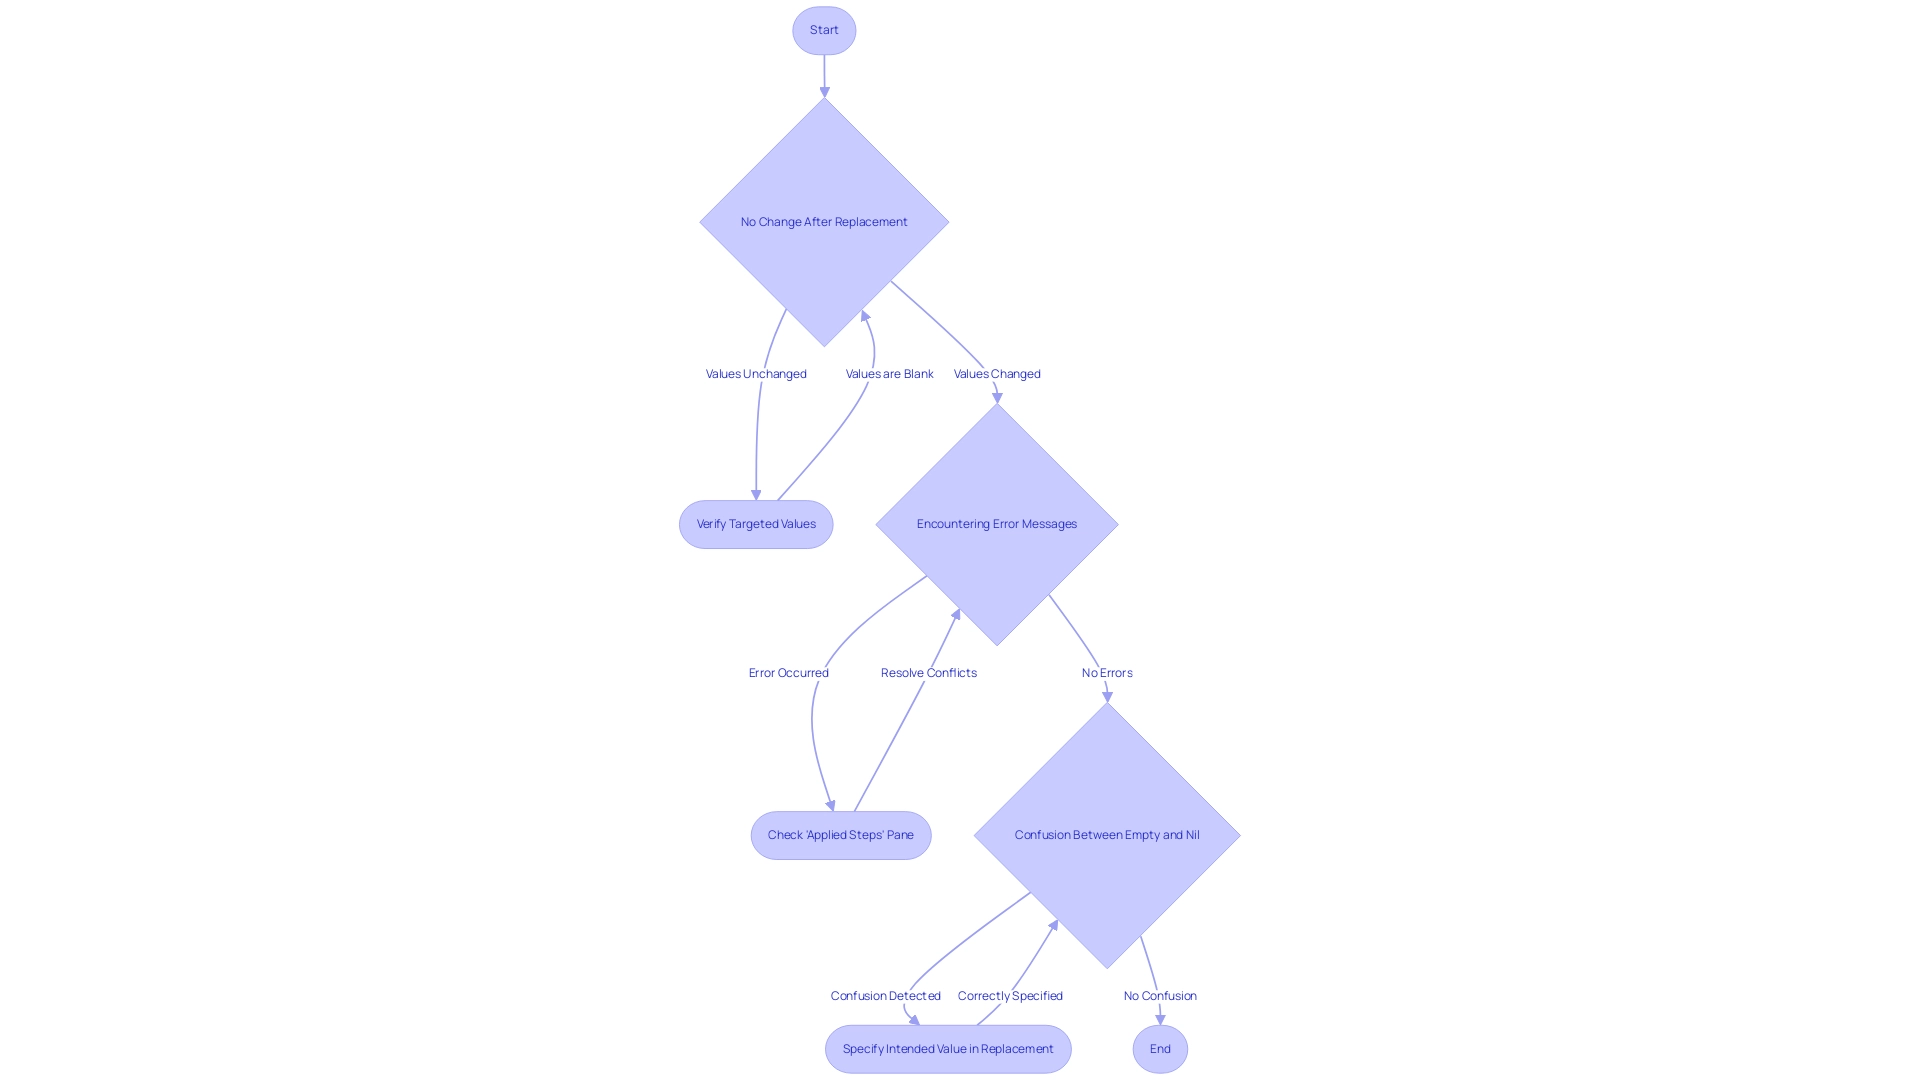
Best Practices for Managing Null and Blank Values
Effectively managing empty and missing entries in Power Query through the replacement of blanks with null values is crucial for maintaining the quality and integrity of information. This is essential for leveraging Business Intelligence and Robotic Process Automation (RPA) to generate insights and enhance operational efficiency. Inadequate master information quality can obstruct these initiatives, resulting in wasted time and resources, particularly in manual tasks. Consider implementing the following best practices:
- Regular Data Audits: Periodically review your datasets to identify and rectify empty or null values. This proactive strategy ensures that information integrity is preserved over time and aids in uncovering hidden insights that can drive operational efficiency.
- Consistent Information Input: Standardizing data entry procedures is vital for minimizing gaps and inconsistencies. Establishing clear standards for information input significantly reduces the occurrence of empty values in your datasets, thereby enhancing the quality of insights derived from BI tools.
- Use Conditional Columns: Leverage conditional logic to dynamically manage empty values and gaps. This adaptability allows for more nuanced information transformations, thereby increasing the overall utility of your reports, especially when employing RPA to automate repetitive tasks.
- Document Your Process: Keep comprehensive documentation of the steps undertaken to manage empty and missing values in your queries. This serves as a reference for future data cleaning efforts and ensures consistency in your approach, aligning with best practices for BI and RPA implementations.
- Train Your Team: Educate team members on the crucial distinctions between nulls and blanks, along with best practices for utilizing Power Query to replace blank values with null. As Grant Gamble aptly states,
Remember, every second saved in querying is a second gained in gaining insights!
This collective knowledge not only enhances information quality across the organization but also boosts overall operational efficiency. Furthermore, verifying the Assume Referential Integrity setting in relationships can optimize query performance in DirectQuery sources, aligning with emerging management trends for 2024.
A pertinent case study titled ‘Optimizing Visual Interactions’ reveals that every visual interacts with others on the page through cross-filtering or cross-highlighting. Evaluating relevant interactions is critical, and eliminating unnecessary interactions enhances report interactivity, particularly for DirectQuery reports.
By adopting these best practices, organizations can significantly bolster information integrity and streamline querying processes, ultimately fostering a more efficient operational environment while addressing the challenges posed by poor master information quality and barriers to AI adoption.
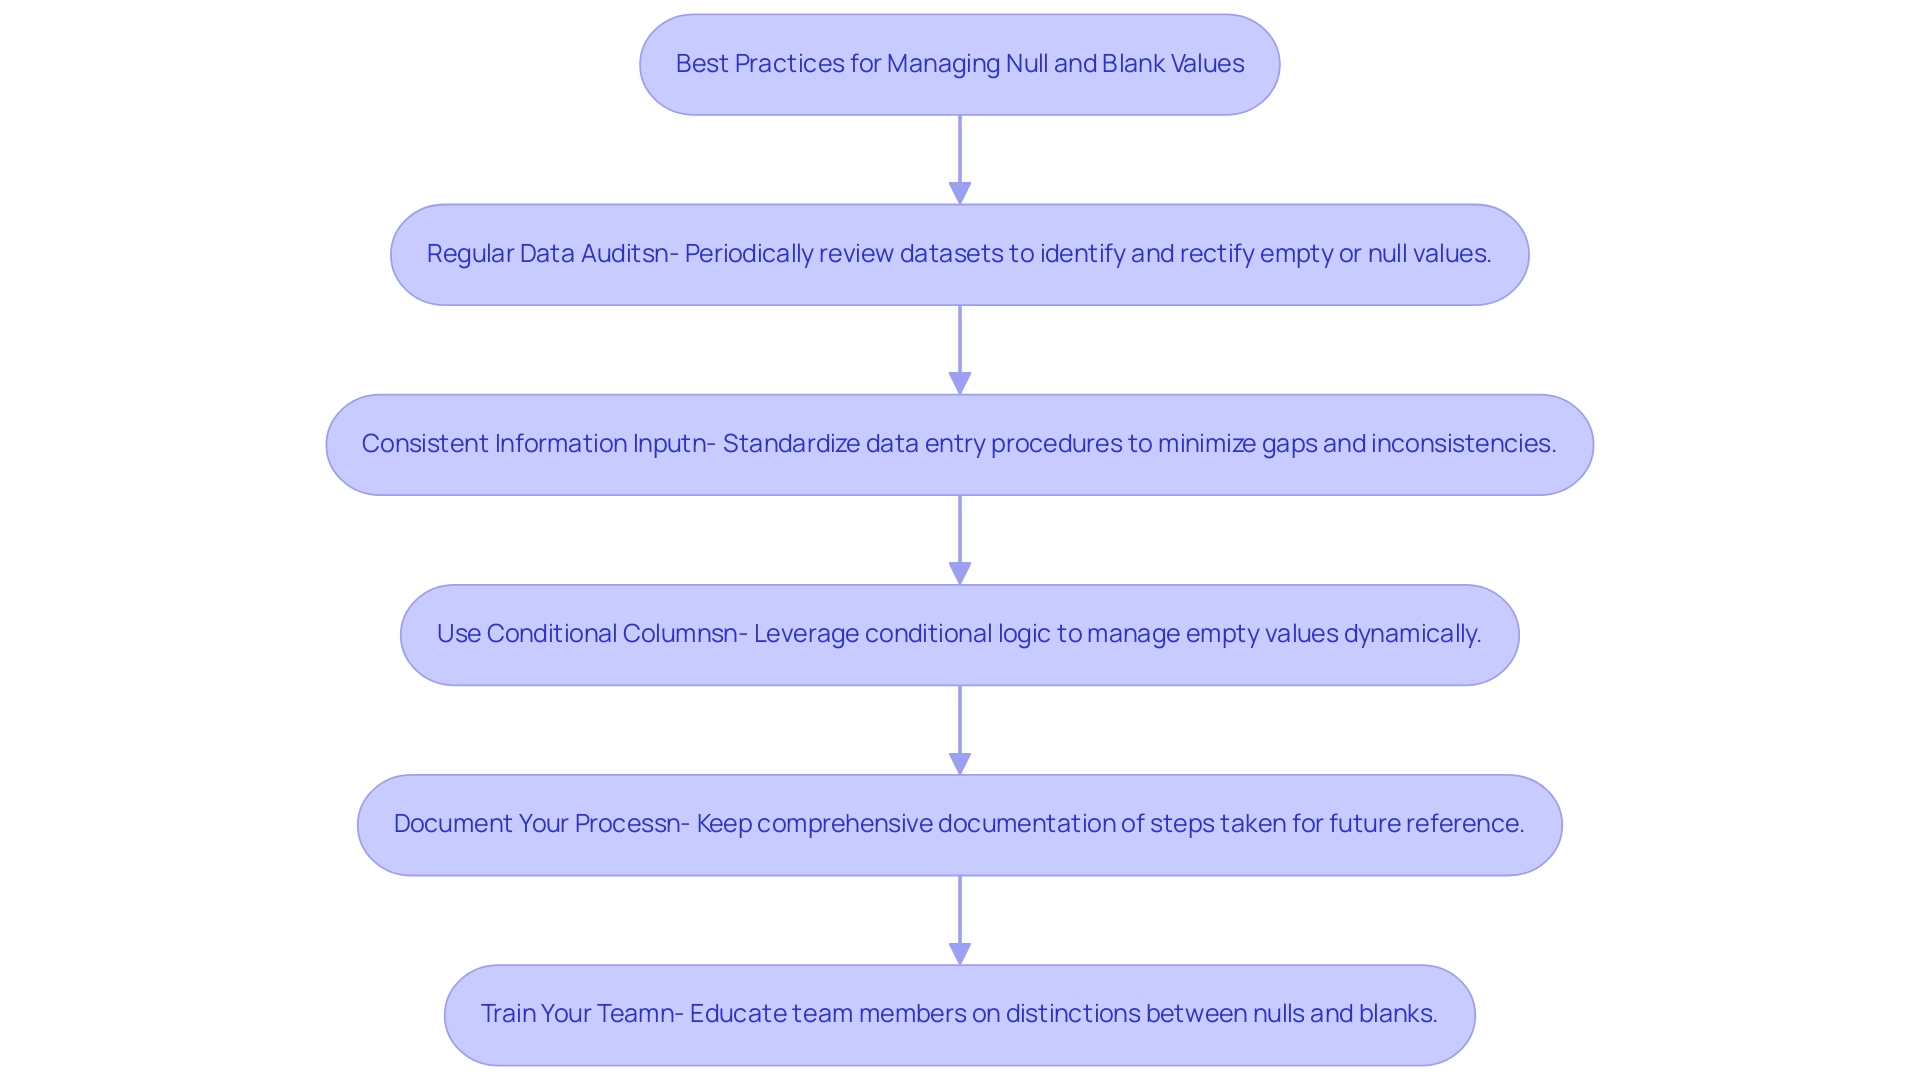
Additional Resources for Power Query Users
For those eager to deepen their expertise in Power Query, a wealth of resources is available to facilitate learning:
- Microsoft Documentation: The official Power Query documentation offers extensive guides and tutorials that serve as a foundational resource for all users.
- Online Courses: Structured courses on platforms like Udemy and LinkedIn Learning delve into multiple aspects of Power Query, catering to different learning styles and skill levels. According to user satisfaction ratings for these online courses, many learners report an increase in their information handling capabilities after completing structured training.
- YouTube Tutorials: Channels such as ExcelIsFun and Curbal provide visual tutorials that simplify complex concepts, making Power Query more accessible for visual learners.
- Community Forums: Engaging in forums like the Power BI Community and Stack Overflow can yield valuable insights and support from fellow users who share similar challenges and solutions.
- Blogs and Articles: Websites such as Excel Guru and DataChomp regularly publish articles focusing on Power Query tips and tricks, ensuring users remain informed of the latest best practices.
Additionally, it is crucial to recognize that the function to replace blanks with null in Power Query can also eliminate empty rows and columns from tables, including those with spaces or non-printing whitespace. This functionality is essential for effectively managing information sets by using Power Query to replace blank values with null. Furthermore, a relevant case study titled “Remove Text Between Delimiters – Power Query” illustrates how users can effectively clean their information by removing unnecessary text between specified delimiters, reinforcing the practical application of Power Query.
Douglas Rocha, a statistics science enthusiast, emphasizes this adaptability, stating,
Can you do statistics in Power BI without DAX? Yes, you can; you can do it without measures as well, and I will teach you how at the end of this tutorial.
This underscores the value of these resources, empowering users to effectively utilize Power Query while enhancing their overall data analysis skills.
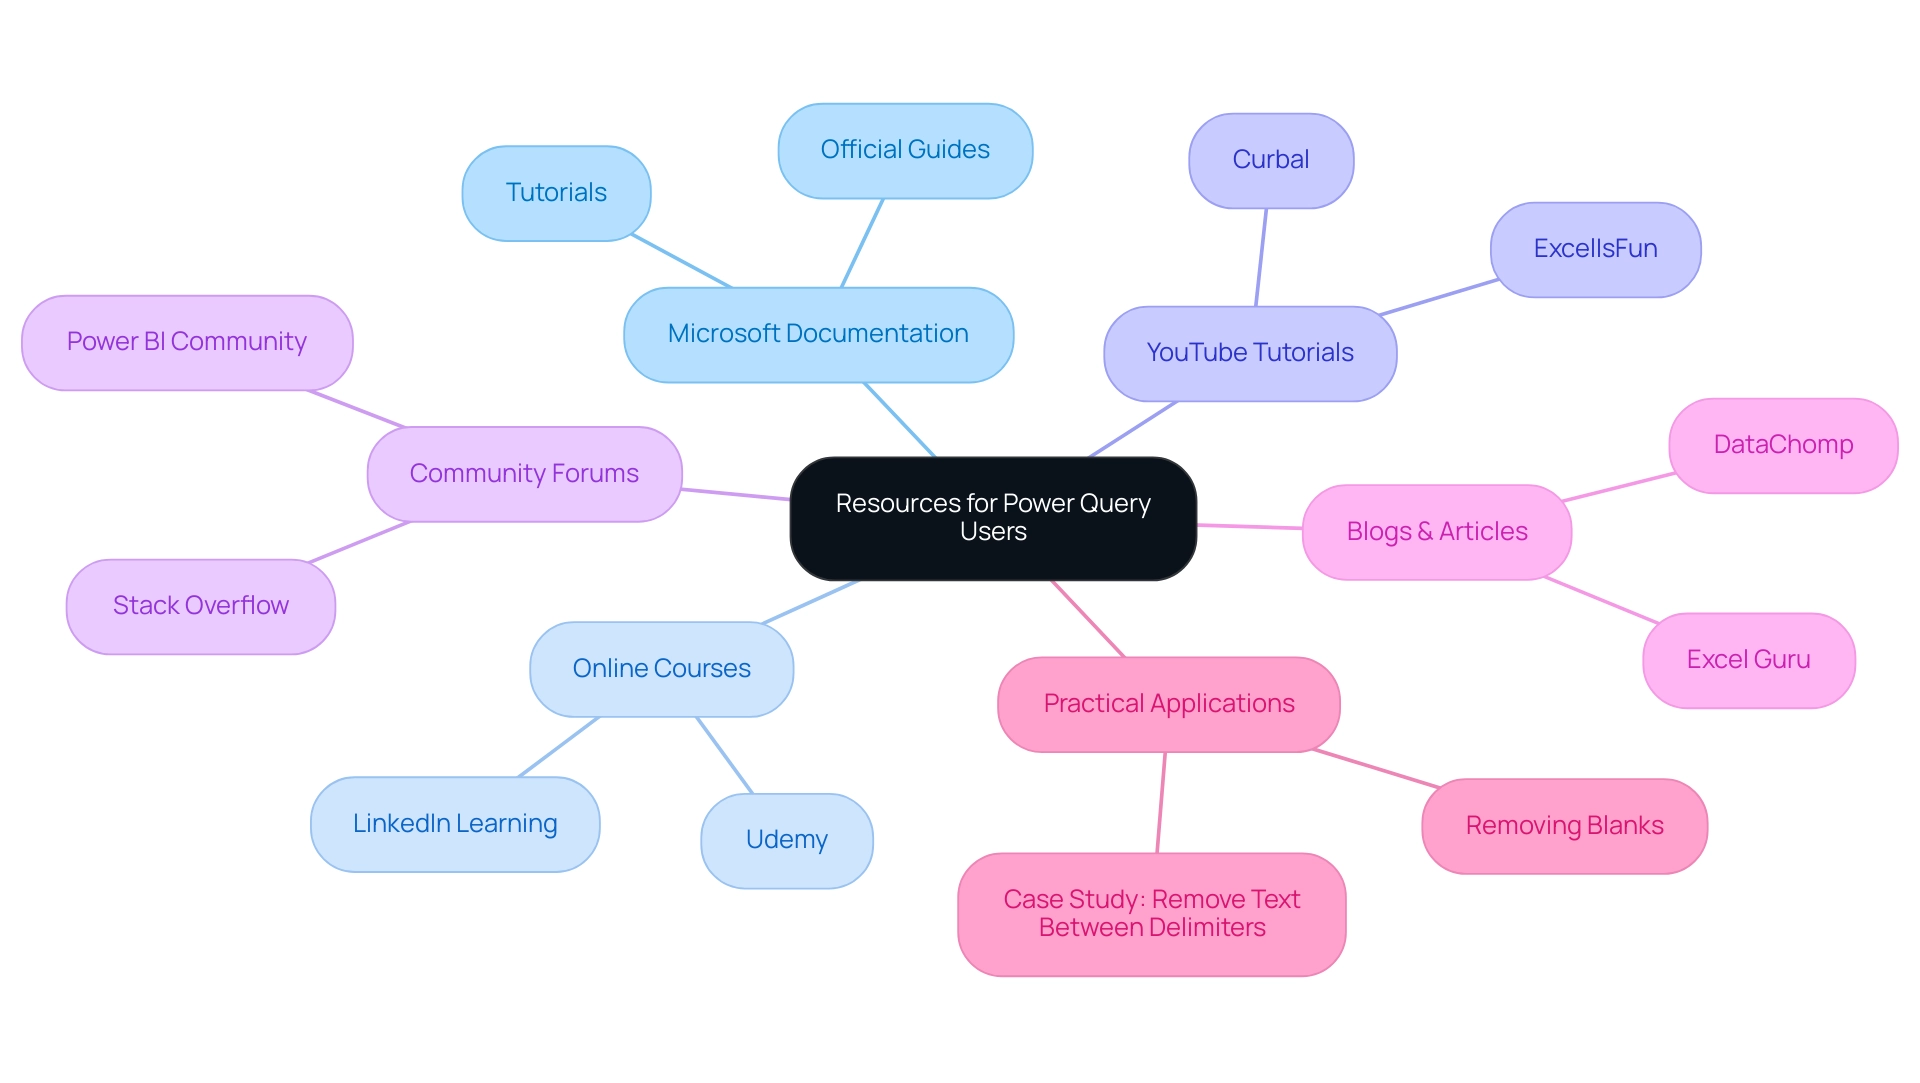
Conclusion
Understanding the distinction between null and blank values in Power Query is essential for ensuring the accuracy and reliability of data analysis. Mastering the techniques to replace blank values with nulls not only enhances data integrity but also empowers organizations to make informed decisions that drive growth. The step-by-step guide simplifies this process while underscoring the importance of meticulous data management practices.
Troubleshooting common issues during value replacement further emphasizes the need for clarity in data handling. Recognizing the differences between nulls and blanks significantly reduces errors and improves overall data quality. Implementing best practices—such as conducting regular audits and standardizing data entry—bolsters the effectiveness of data operations and supports robust Business Intelligence initiatives.
As the landscape of data management evolves, the ability to manage null and blank values effectively remains a cornerstone of operational efficiency. By leveraging available resources and committing to ongoing education, organizations can ensure they meet and exceed the standards necessary for success in a data-driven world. Prioritizing these practices empowers teams to harness the full potential of their data, ultimately leading to better insights and informed decision-making.
Overview
This article delves into the essential skills that Power BI developers must master to excel in their profession. It highlights key competencies such as data visualization, DAX proficiency, and familiarity with the Microsoft BI stack. These skills are not merely beneficial; they are crucial for effective data analysis and reporting. Ultimately, mastering these competencies drives operational efficiency and fosters business growth. \n\nConsider the impact of these skills on your current practices. Are you leveraging data visualization effectively? Is your DAX proficiency up to par? Familiarity with the Microsoft BI stack can significantly enhance your analytical capabilities. \n\nIn conclusion, developing these essential skills is imperative for any Power BI developer aiming to succeed in today’s data-driven landscape. Take action now to refine your expertise and elevate your contributions to your organization.
Introduction
In the dynamic realm of data analytics, Power BI developers are at the forefront, transforming raw data into actionable insights that drive business success. To excel in this competitive landscape, they must cultivate a diverse skill set, encompassing foundational knowledge in data analysis, proficiency in visualization techniques, and a deep understanding of the Microsoft BI stack. As organizations increasingly rely on data-driven strategies, the ability to harness tools like DAX and Power Query is essential for effective reporting and operational efficiency.
This article explores the critical skills and techniques that Power BI developers need to master—from:
- Data modeling
- Transformation
- Effective communication
- Continuous learning
Ensuring they remain invaluable assets in the ever-evolving world of business intelligence.
Essential Foundational Skills for Power BI Developers
To excel as a Power BI specialist, it is imperative to master essential foundational Power BI skills, particularly in the context of leveraging Business Intelligence (BI) and Robotic Process Automation (RPA) to drive operational efficiency. A strong comprehension of analysis concepts forms the bedrock of effective information management, enabling creators to extract significant insights that can propel business growth. Familiarity with Excel for data manipulation is equally crucial, as it empowers developers to prepare and cleanse information efficiently, addressing challenges such as time-consuming report creation and inconsistencies.
A fundamental understanding of databases and SQL is essential, as these skills facilitate effective querying and information retrieval. Moreover, being well-versed in data visualization principles is vital for effectively communicating insights derived from the data. An ideal BI reporting analyst, as noted by industry experts, should not only proficiently explain complex concepts to non-technical audiences through immersive BI dashboards but also engage effectively in in-person discussions.
This includes employing effective communication strategies such as active listening and audience adaptation, which are essential for fostering understanding. Additionally, familiarity with the Microsoft Business Intelligence stack—including Pivot, SSRS, SSIS, and SSAS—is advantageous for developers to fully leverage BI’s capabilities. Furthermore, integrating RPA tools such as EMMA RPA and Automate can streamline repetitive tasks, enhancing operational efficiency and allowing analysts to concentrate on generating insights rather than manual processes.
A case study on information security and compliance for BI analysts illustrates the significance of maintaining security and privacy. It highlights that analysts are responsible for implementing measures like row-level security and adhering to protection regulations. Cultivating these essential Power BI skills establishes a solid foundation for exploring more sophisticated methods and tools within BI, preparing creators for success in the evolving landscape of analytics.
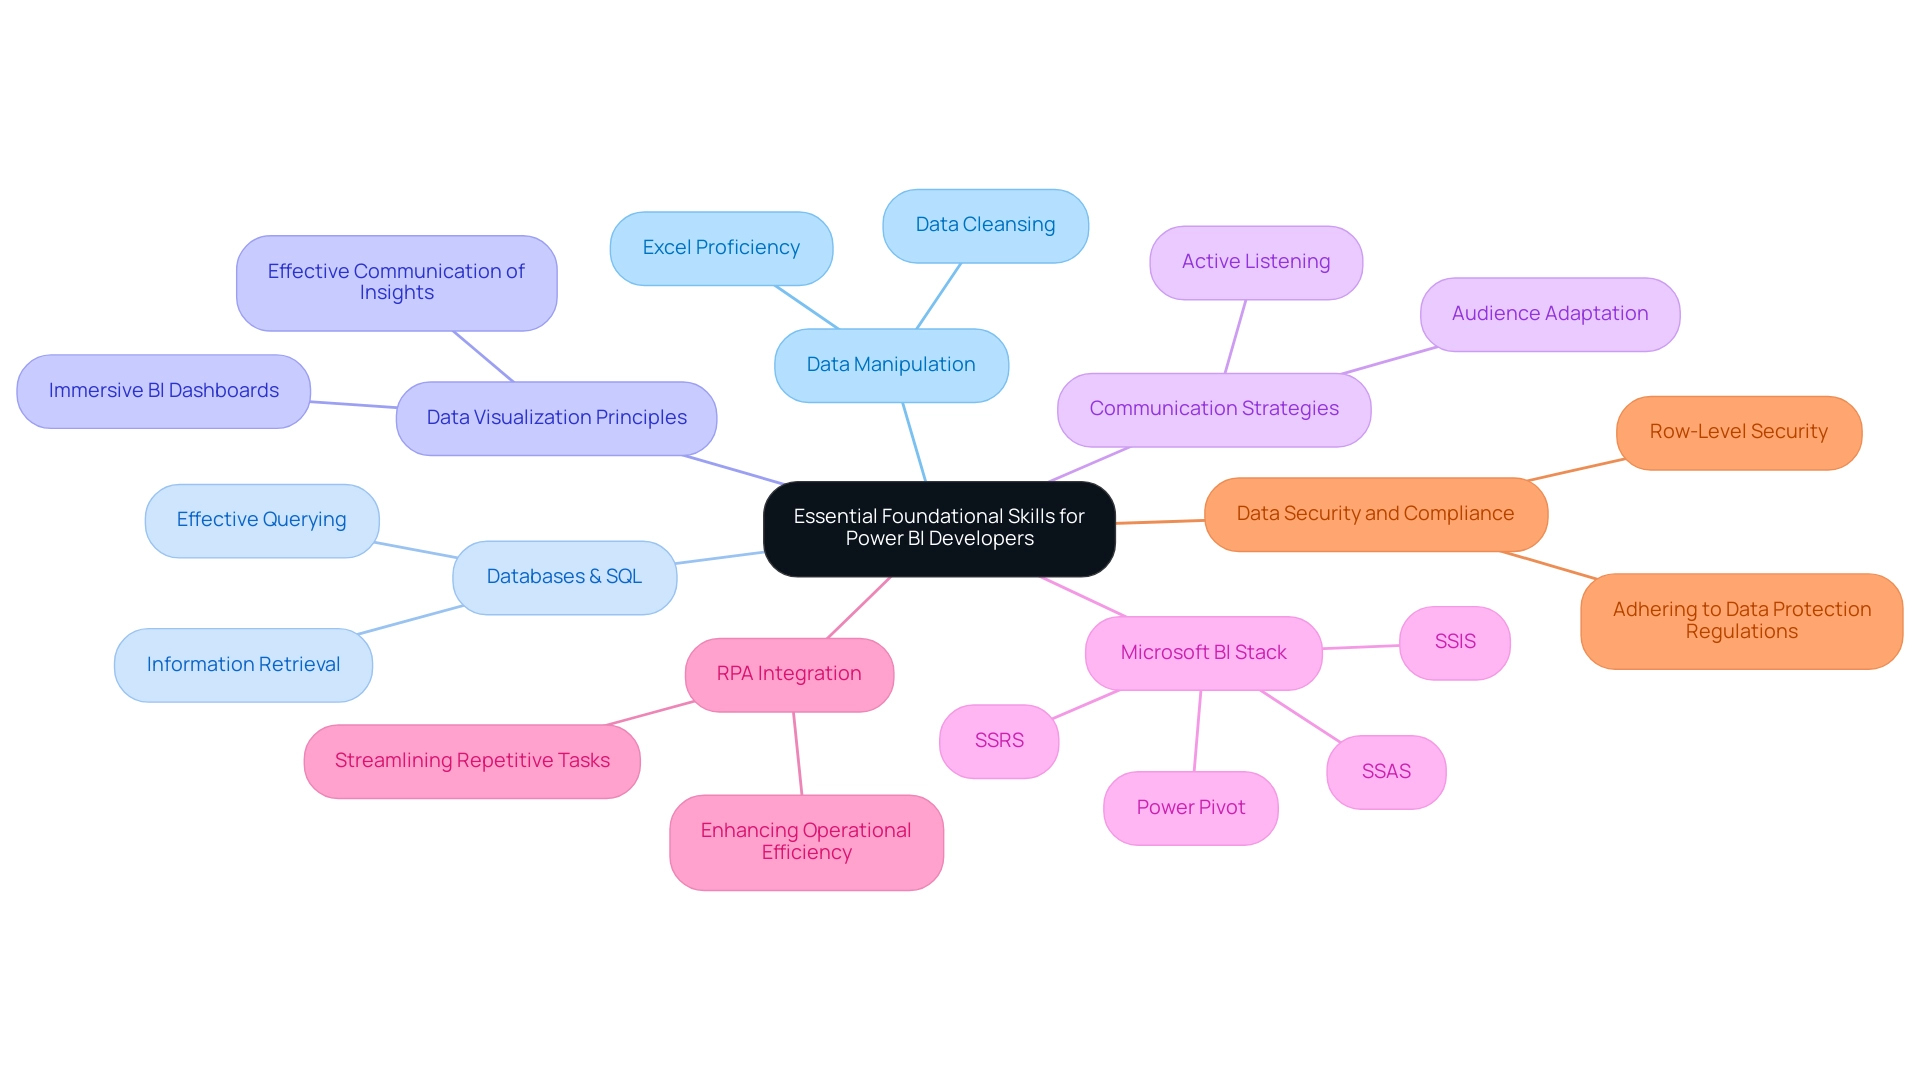
Mastering Data Visualization Techniques
Effective information visualization methods are crucial for Power BI developers aiming to enhance their skills in creating impactful dashboards. In an environment where deriving actionable insights can often feel overwhelming, key strategies emerge. Selecting appropriate chart types significantly enhances the clarity of the presented data. Furthermore, embracing a minimalist design strategy is essential; it prevents the audience from being inundated with superfluous information, a common pitfall when report creation diverts attention from understanding.
Customizing visualizations according to the distinct requirements of the audience ensures that the information resonates and fosters engagement. This approach addresses the frequent issue of reports filled with numbers yet lacking clear direction. Developers should adopt best practices, including:
- Strategically using color to highlight important information
- Providing sufficient context to guide interpretation
- Emphasizing key points for quick understanding
Ultimately, these practices lead to actionable insights for stakeholders.
A notable example of effective visualization techniques is illustrated in the case study titled ‘Gamification of Analysis.’ This innovative approach applies gamification techniques to enhance engagement and make information interpretation more interactive, particularly for non-experts. The outcome demonstrates how this method increases user engagement and encourages broader participation in information gathering and analysis, resulting in more comprehensive datasets.
This case study also underscores how effective visualizations can clarify governance issues by making information more accessible and understandable. Moreover, a quote from Meta underscores the importance of visual elements:
‘Facebook posts with images get 2.3 times more engagement than those without.’
This highlights the critical role that effective visualization plays in enhancing audience engagement, especially in light of the challenges posed by inconsistencies across various reports due to a lack of governance strategy.
It is also essential to acknowledge the drawbacks of traditional tools, which include high costs, steep learning curves, and limited customization options. Addressing these challenges through effective visualization methods not only helps overcome these barriers but also contributes to the broader trend within the visualization industry, projected to reach $19.20 billion by 2027. This reinforces the significance of Business Intelligence and RPA in driving operational efficiency and insight-driven growth.
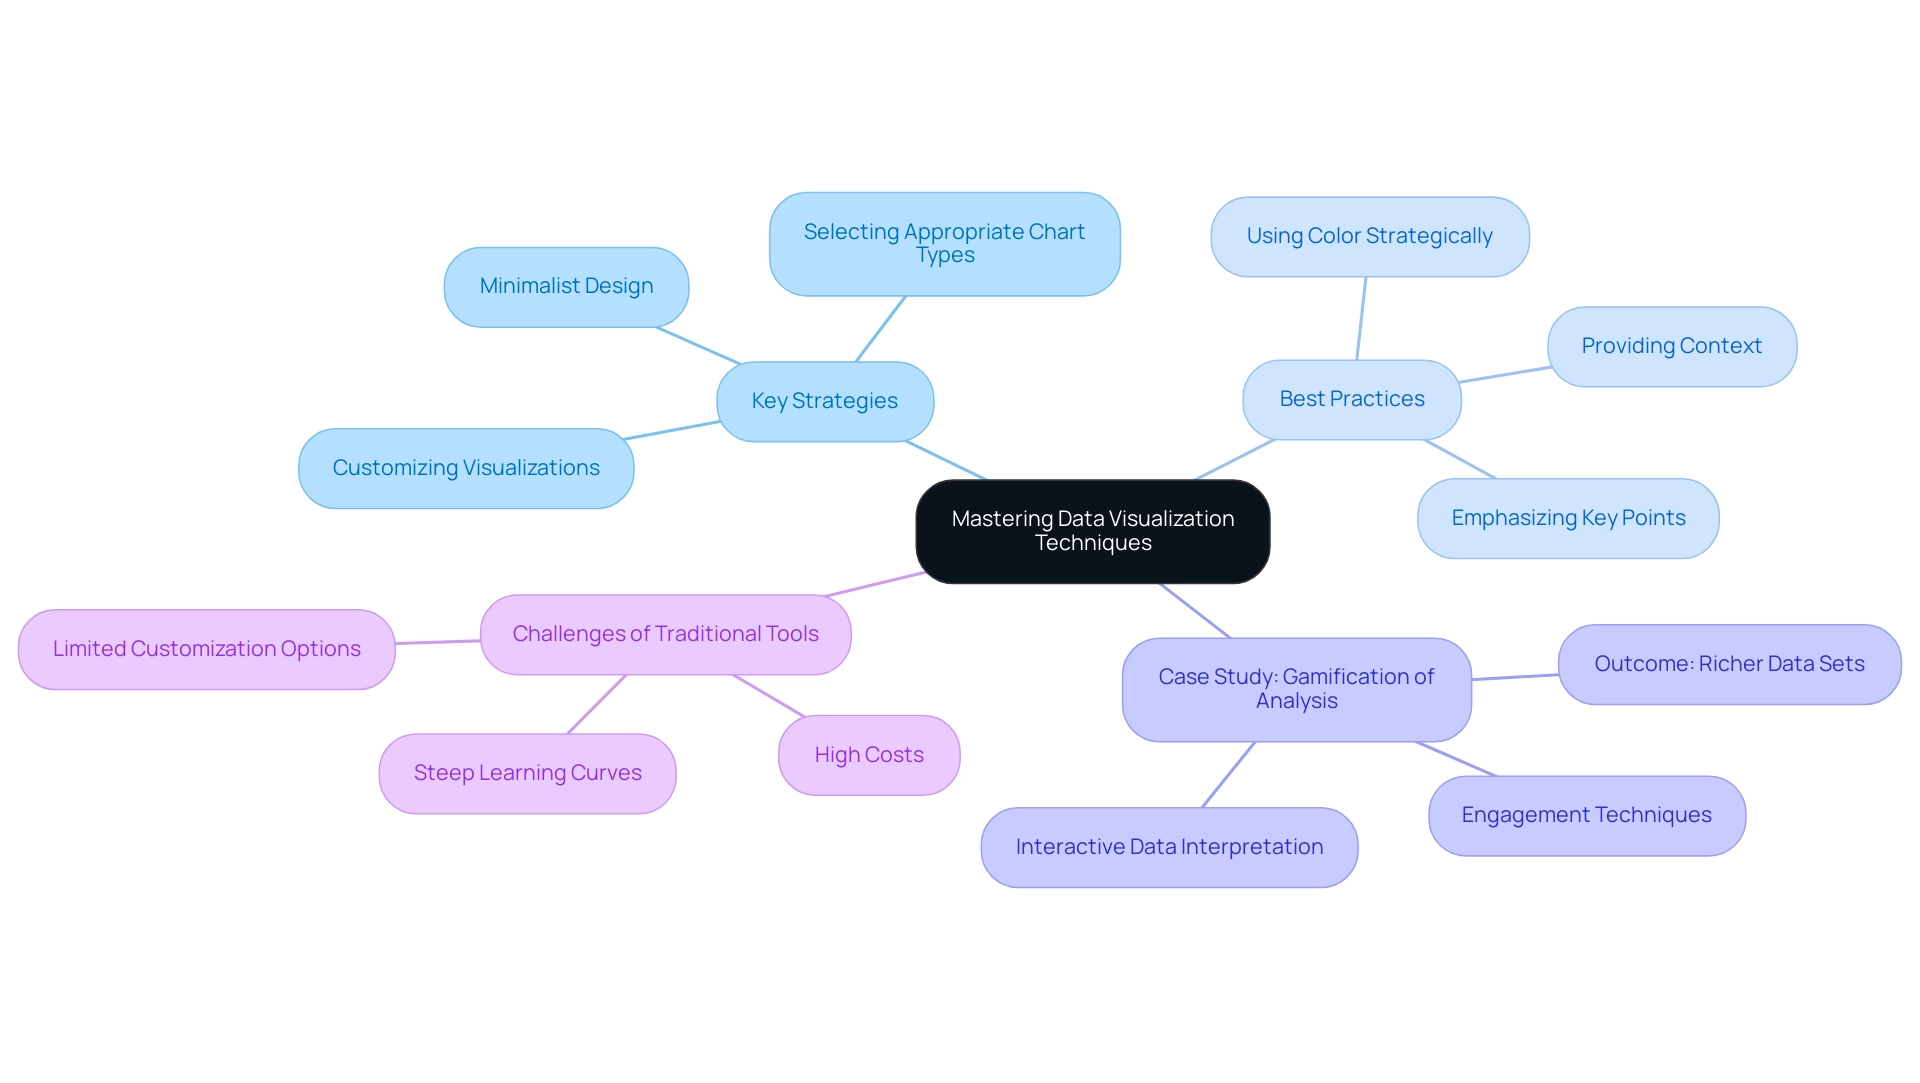
Understanding and Utilizing DAX for Advanced Analysis
DAX, or Data Analysis Expressions, is a powerful formula language meticulously crafted for modeling and analysis within Business Intelligence (BI). It addresses prevalent challenges faced by operations directors, such as the labor-intensive process of report generation and the potential for inconsistencies. Each Report ObjectId is distinctly represented by a 32 hexadecimal GUID, highlighting the precision and reliability of information management in Power BI. Understanding the syntax and functions of DAX is imperative for executing advanced calculations and developing dynamic reports, particularly in an environment where Power BI skills are essential to mitigate inconsistencies stemming from inadequate governance strategies.
Among the most vital DAX functions are CALCULATE, FILTER, and RELATED, which empower users to manipulate data contextually. This enhances both the analytical capabilities of their reports and the overarching governance strategy necessary for preserving data integrity. As indicated by the Platform, the technology utilized by a viewer to access a report—whether through PowerBI.com, Mobile, or Embedded—can significantly impact the practical application of DAX. Mastery of DAX not only streamlines the creation of complex metrics and key performance indicators (KPIs) but also bolsters Power BI skills, equipping developers with the tools required to extract deeper insights into business performance. This addresses the frequently reported concern of reports inundated with numbers yet devoid of clear, actionable guidance.
For example, the setup process for viewing usage metrics in BI promotes informed decision-making. Users can sign in, select a workspace, and choose the report to analyze its usage metrics, thereby enhancing their capacity to respond to user needs and trends. Furthermore, the integration of DAX with a comprehensive management application and Microsoft Copilot facilitates seamless information integration and predictive analytics. This combination can significantly elevate operational efficiency and decision-making capabilities, ensuring that organizations remain competitive in an analytics-driven landscape.
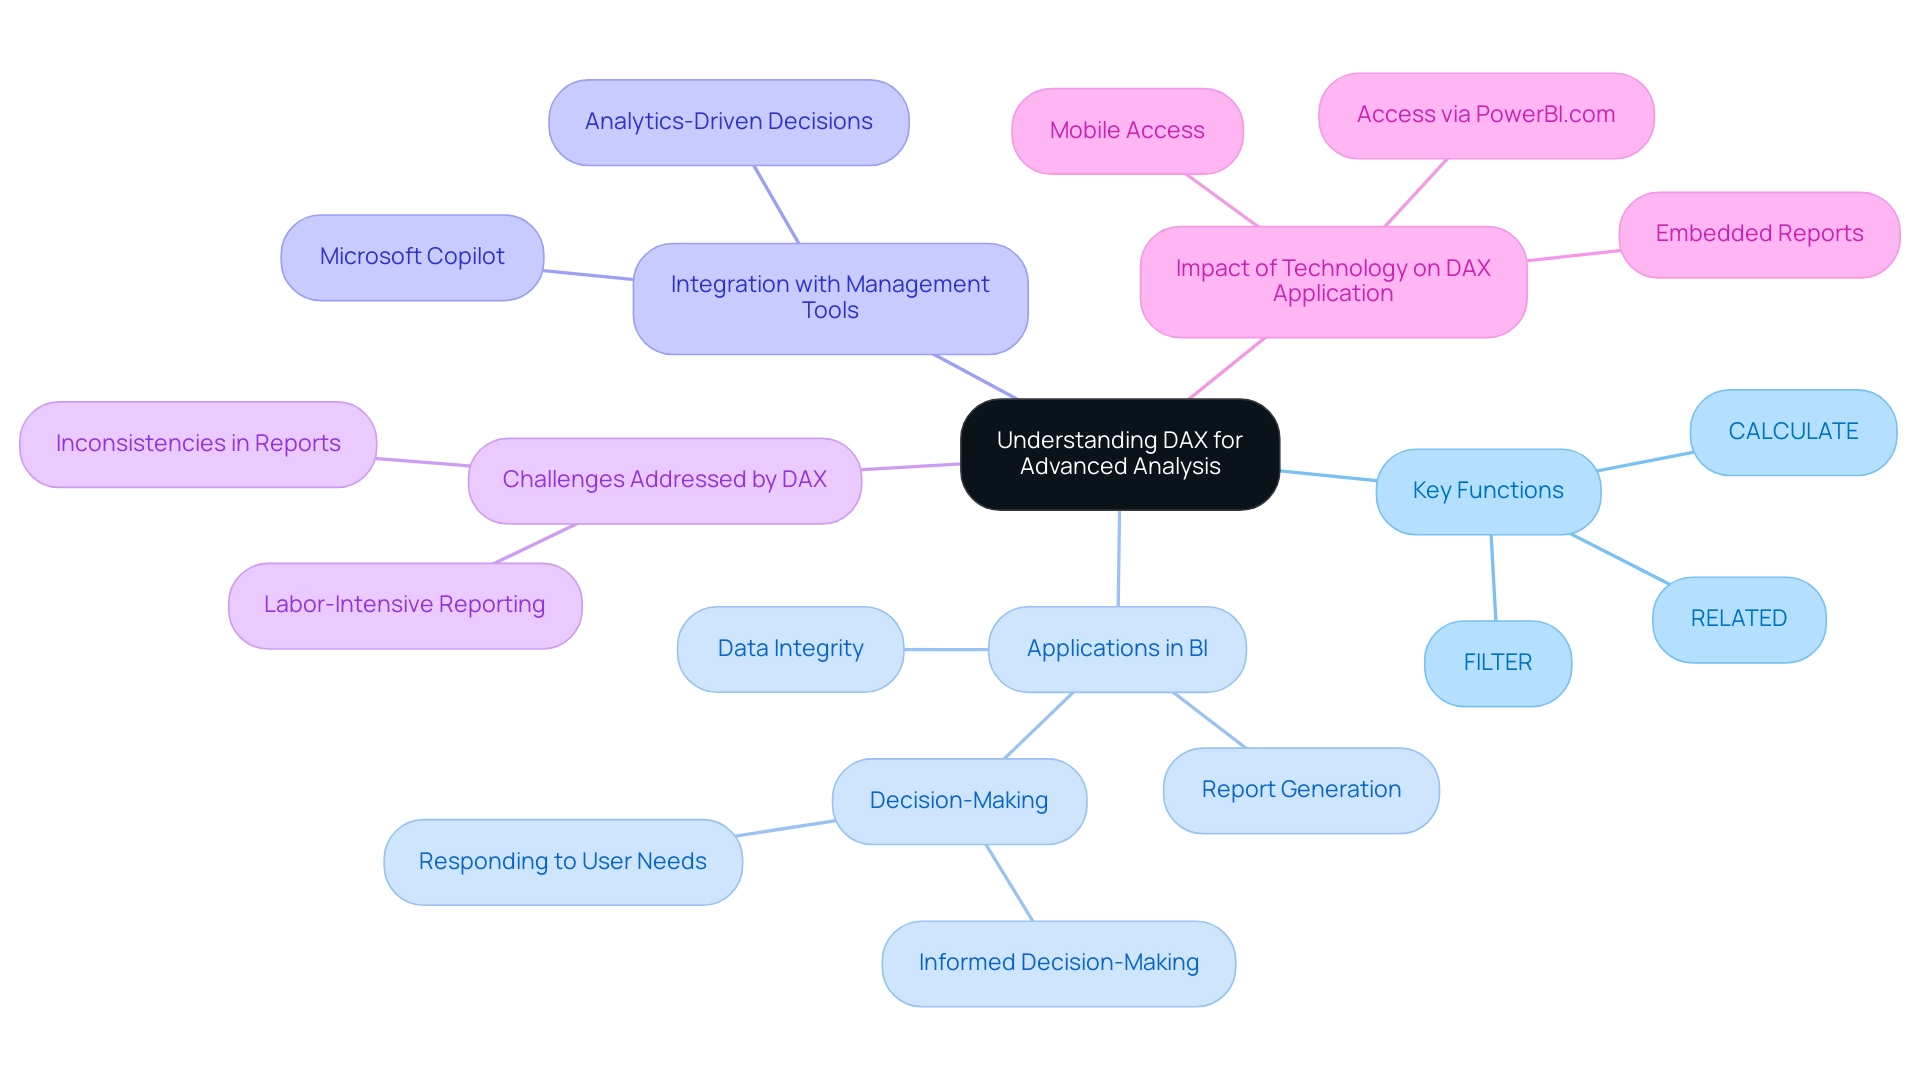
Proficiency in Data Modeling for Effective Reporting
Mastering information modeling is an essential competency for Power BI developers seeking to elevate their skills in producing impactful reports that drive insight-driven conclusions. This proficiency requires a comprehensive understanding of relationships among tables and the implementation of star schema designs to optimize data flow, which is critical for addressing challenges such as time-consuming report creation and data inconsistencies. For instance, aggregating information at the source level can effectively summarize daily sales figures into monthly totals when detailed data is unnecessary, illustrating how effective modeling can enhance performance and operational efficiency.
Recent insights underscore the significance of selecting appropriate information types, which can markedly improve report performance and mitigate bottlenecks in data access. Developers are encouraged to create calculated columns and measures that bolster analytical capabilities, further supporting informed decision-making. Adhering to best practices, such as employing active and inactive relationships and utilizing measure tables, can streamline the model and enhance report accuracy.
The case study titled ‘Best Practices for Data Relationships‘ provides valuable guidance on managing model relationships, emphasizing the necessity of a well-structured model in facilitating actionable insights. As Brahmareddy noted,
It allowed me to pinpoint which visuals or queries were the bottlenecks,
highlighting the importance of a robust model. Furthermore, leveraging BI Desktop’s Performance Analyzer enables developers to identify and optimize report performance bottlenecks effectively.
Moreover, integrating RPA tools such as EMMA RPA and Microsoft’s Automate can automate repetitive data preparation tasks, significantly reducing the time spent on report generation and enhancing overall operational efficiency. Ultimately, a well-structured information model not only improves report performance and operational efficiency but also strengthens integrity and accuracy, paving the way for more insightful analytics that drive business growth by leveraging Power BI skills.
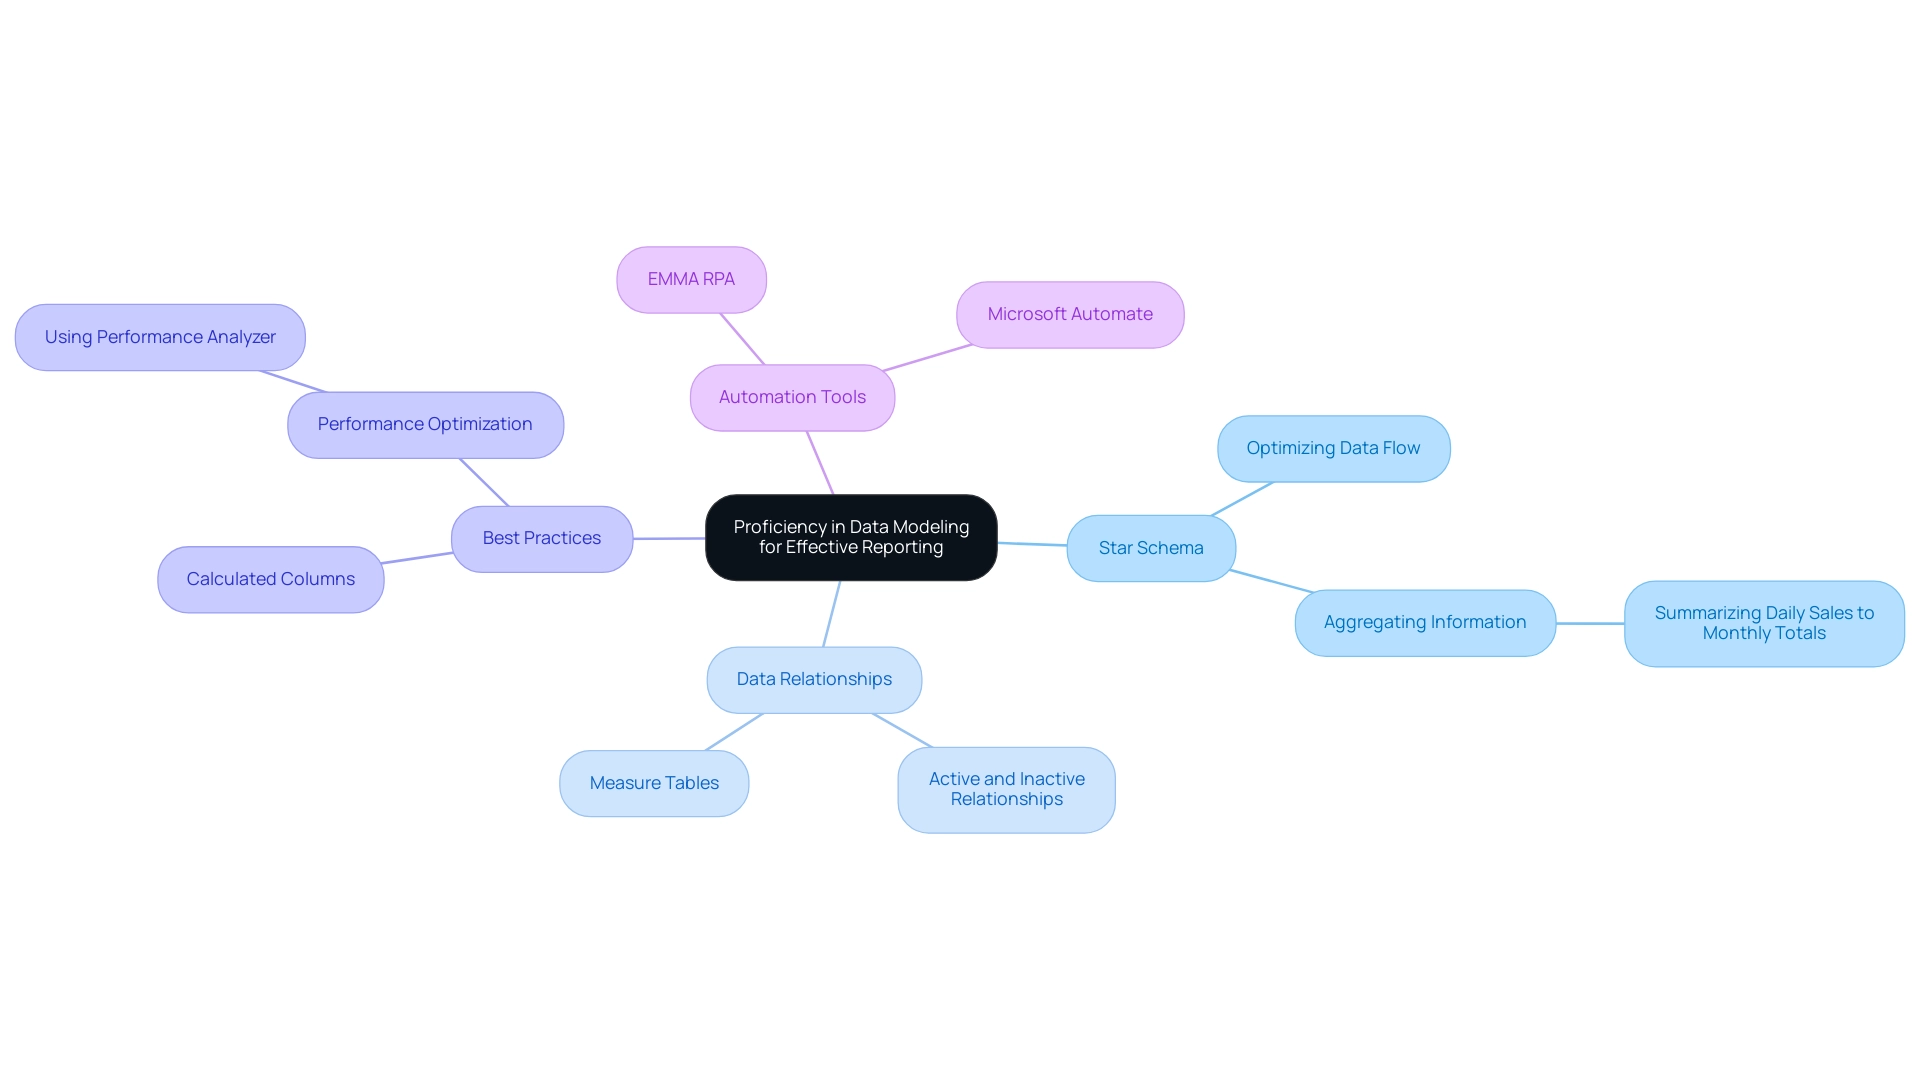
Leveraging Power Query for Data Transformation
Power Query stands as a cornerstone for data transformation in Power BI, significantly enhancing the skills of developers by empowering them to proficiently clean, reshape, and integrate data from a multitude of sources. In an era where the significance of Business Intelligence and RPA is paramount, these tools facilitate the extraction of actionable insights that drive operational efficiency and business growth. However, neglecting to leverage data-driven insights can position your business at a competitive disadvantage.
Among Power Query’s key functionalities are:
- Filtering rows
- Merging tables
- Creating custom columns tailored to specific analytical needs
Furthermore, users can convert information into a table or list utilizing the Convert to Table or Convert to List options under Number Tools, thereby enhancing the versatility of data handling. The challenges of time-consuming report creation, inconsistencies, and lack of actionable guidance are effectively mitigated through these features.
A notable addition is the ADD COLUMN / STATISTICS functionality, which allows for comprehensive statistical calculations across multiple columns—such as sums, averages, and even medians—thus enriching the analytical depth of the information. As one frequent visitor aptly stated,
The ADD COLUMN / STATISTICS idea is to perform statistics on several columns aggregation (not just two): sum of all columns, average of all, etc.
By effectively utilizing Query, developers can ensure that the information underpinning their reports is both accurate and relevant, ultimately enhancing the quality of observations derived from their analyses.
This capability underscores a growing dependence on Query for robust transformation in BI, highlighting the importance of developing Power BI skills, as emphasized by recent interactions with 3,149 users last month. Such reliance accentuates the essential role of Query in improving operational efficiency and cultivating Power BI expertise, enabling organizations to streamline their processes and obtain actionable insights more effectively, even amidst the overwhelming landscape of AI. Moreover, tools such as EMMA RPA and Automate can streamline the decision-making process by automating repetitive tasks, thereby facilitating a more targeted approach to analytics.
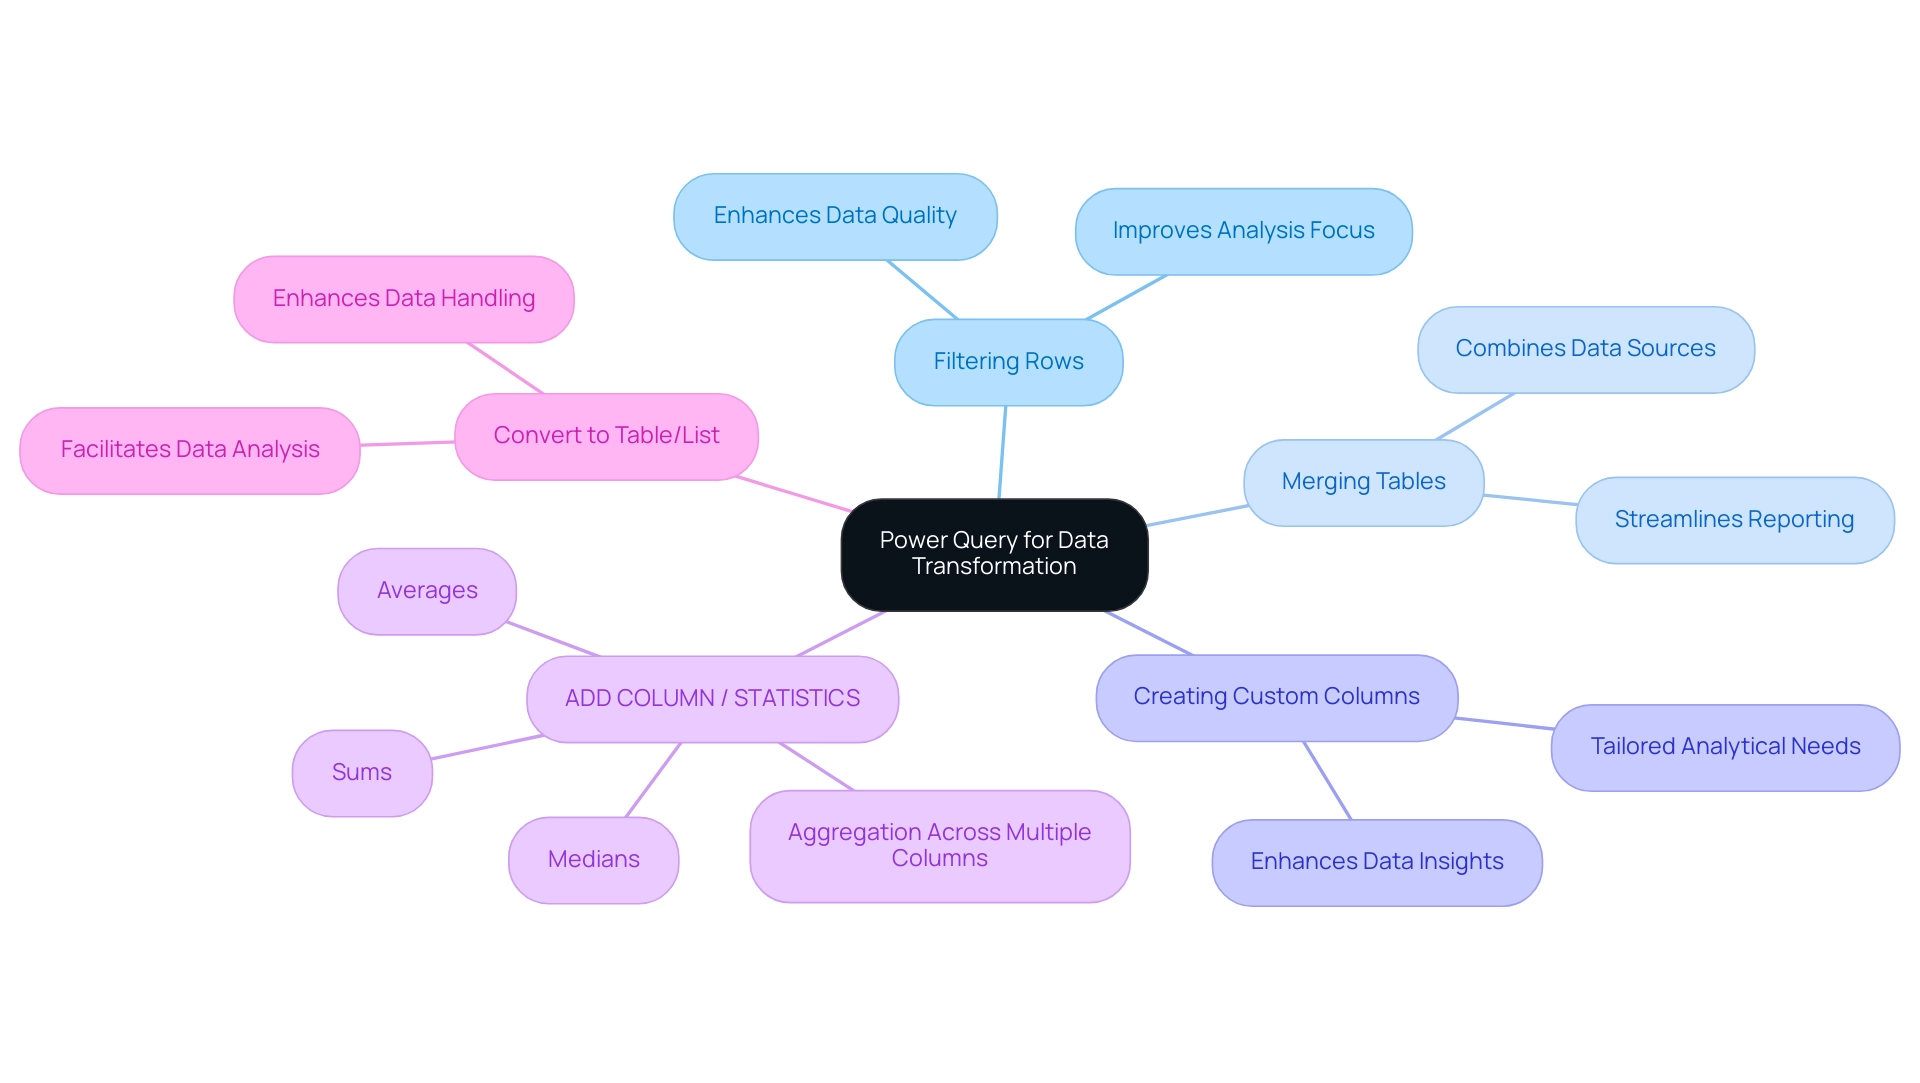
Familiarity with the Microsoft BI Stack
For Power BI developers, possessing strong Power BI skills alongside a comprehensive understanding of the Microsoft BI Stack—which includes essential tools such as Azure, SQL Server, and Excel—is imperative. This expertise enables the creation of integrated solutions that significantly enhance analysis and reporting capabilities, while also refining Power BI skills to tackle prevalent challenges like labor-intensive report generation and inconsistencies. Notably, recent statistics indicate that 60% of information leaders prioritize governance, underscoring the necessity for structured management within these tools.
As organizations progressively adopt a data-driven culture, the utilization of Robotic Process Automation (RPA) can streamline workflows and minimize errors, thereby allowing teams to focus on more strategic tasks. The incorporation of tailored AI solutions further aids organizations in navigating the complex AI landscape, ensuring alignment between technologies and specific business objectives. Moreover, the financial ramifications of information governance are highlighted by the accumulated other comprehensive loss at the end of the period, amounting to $5,590 million, reinforcing the need for robust strategies.
As highlighted in the case study titled ‘Chief Data Officers’ Focus on Insights and Analytics,’ 68% of Chief Data Officers are committed to enhancing the application of analytics within their organizations. This trend reflects a growing inclination towards information-driven decision-making and underscores the critical role of Business Intelligence in transforming raw data into actionable insights. Additionally, the recent issuance of a new standard for income tax disclosures by the FASB, effective for Microsoft starting fiscal year 2026, exemplifies the evolving regulatory landscape that organizations must adeptly navigate.
This context further emphasizes the necessity of integrating Azure and SQL Server with BI to construct effective business intelligence solutions, enabling organizations to leverage insights and analytics more efficiently. As Satya Nadella aptly noted, ‘It is not an exaggeration to say that what each of us does right now with the unique opportunity we have been given will shape the future.
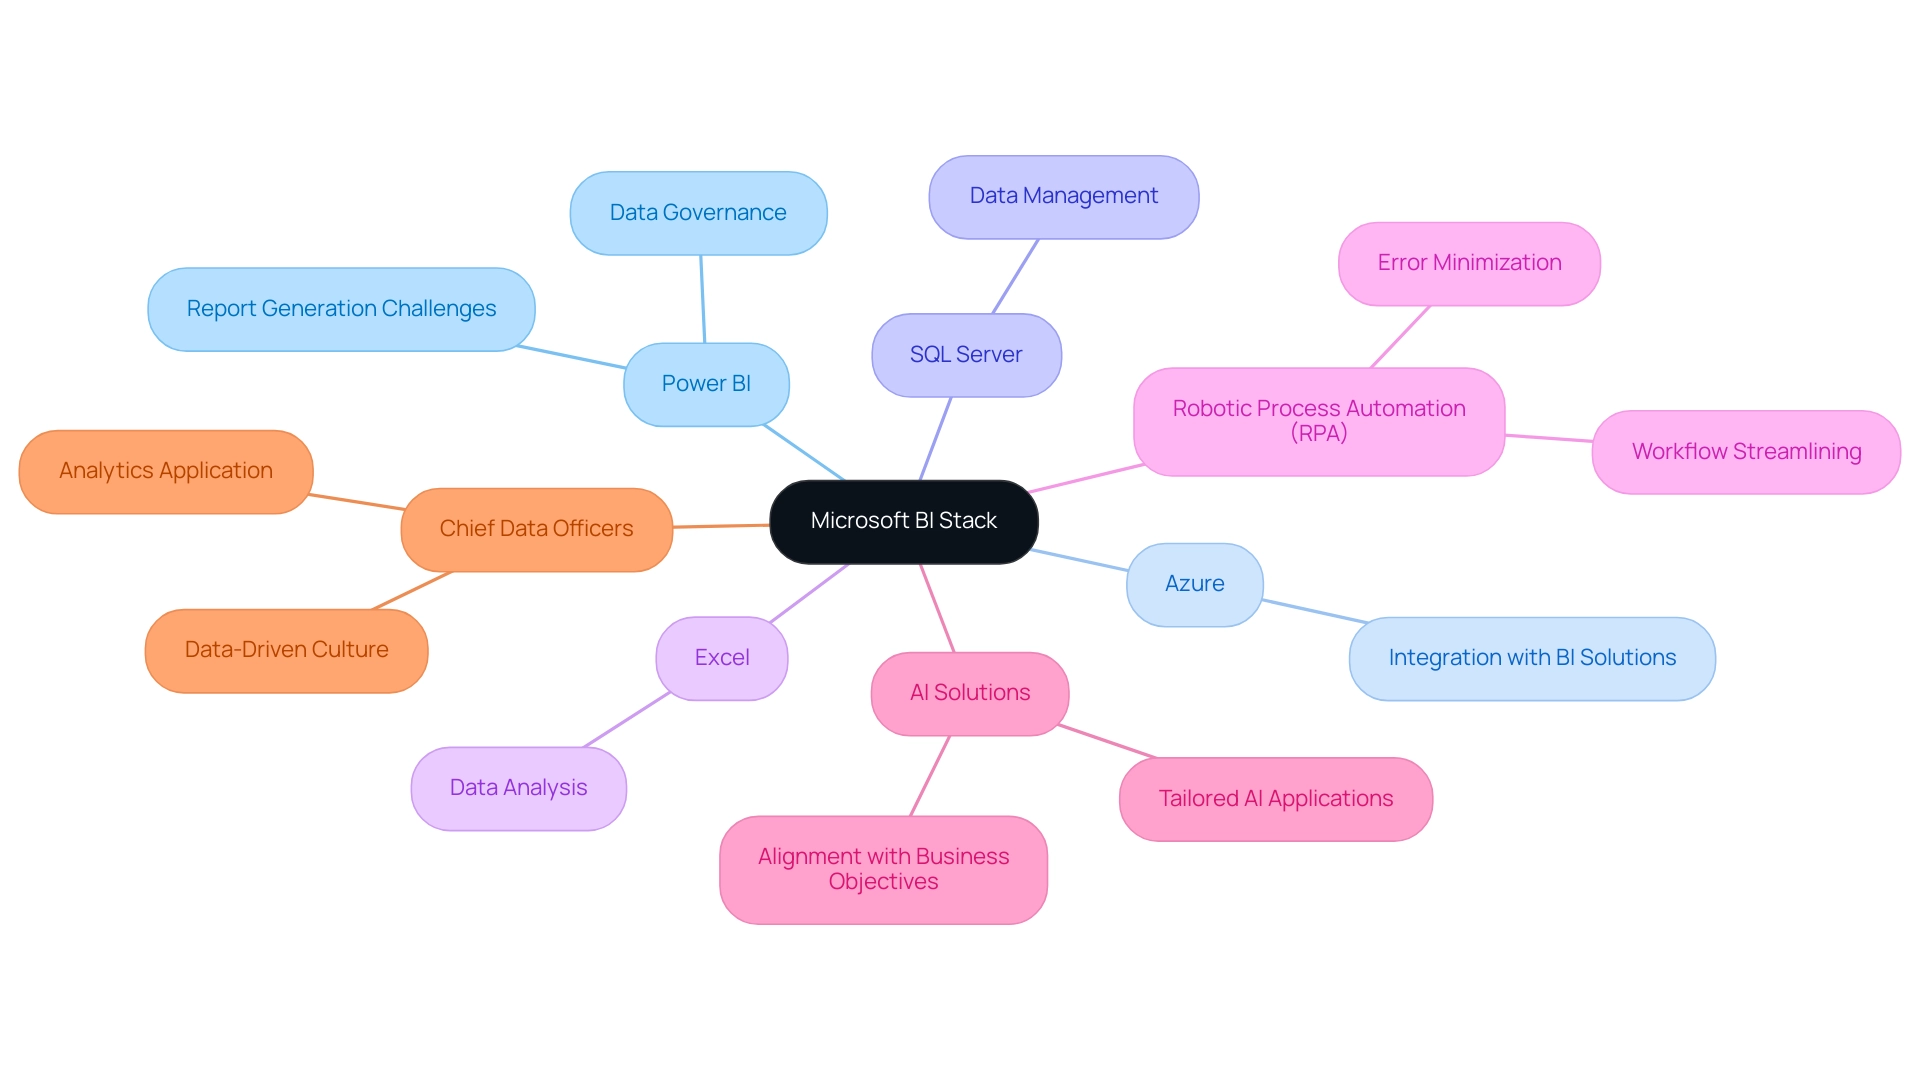
Commitment to Continuous Learning and Feature Updates
In the fast-paced realm of data analytics, a commitment to continuous learning is essential for BI specialists seeking to enhance their Power BI skills. As BI regularly introduces new features and improvements, developers must proactively engage with a variety of resources, including online courses, webinars, and community forums, to stay informed about the latest advancements and refine their expertise. For instance, an e-learning platform effectively utilized BI to analyze customer feedback, correlating it with engagement metrics to enhance course offerings, ultimately resulting in higher customer retention rates.
This illustrates that remaining current not only sharpens individual capabilities but also enhances Power BI skills, empowering organizations to leverage the full potential of BI for improved decision-making and operational efficiency. In today’s data-rich environment, unlocking the power of Business Intelligence and leveraging RPA solutions like EMMA RPA and Power Automate can help overcome challenges such as time-consuming report creation, data inconsistencies, and a lack of actionable guidance. Businesses that struggle to extract meaningful insights risk falling at a competitive disadvantage.
As Steve Adams aptly states, ‘Tableau is a Toolbox: Learn to use more tools,’ underscoring the necessity for programmers to broaden their expertise. The statistic that information in a streaming semantic model clears itself after one hour highlights the urgency for developers to stay informed about critical features; missing out on such updates could lead to inefficiencies in information handling. Moreover, while mastering BI and developing Power BI skills requires significant practice—an effort made easier by utilizing RPA to automate repetitive tasks—developers can overcome learning challenges by dedicating specific time blocks for education and employing micro-learning techniques to integrate knowledge into their daily routines.
The continuous quest for understanding in Business Intelligence, alongside the strategic application of BI and RPA, is not merely advantageous; it is essential for thriving in the evolving landscape of analytics.
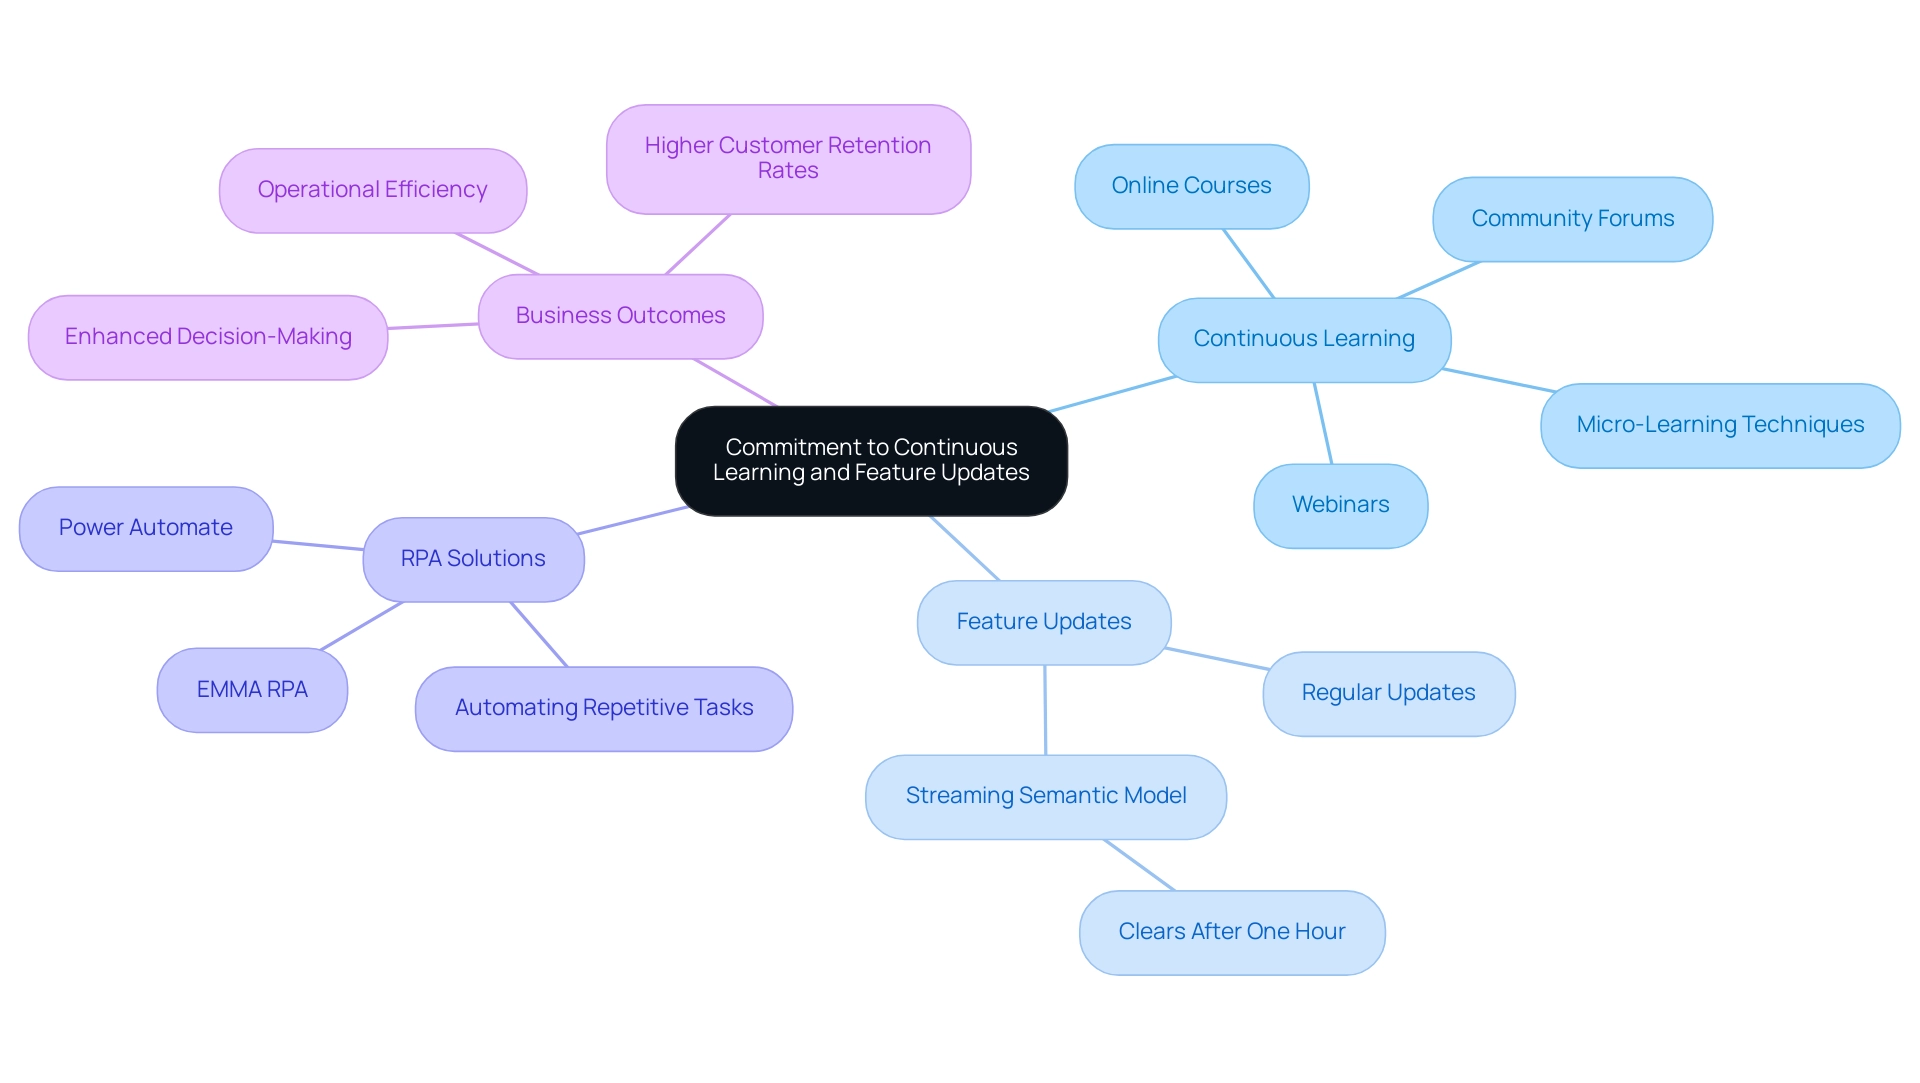
Collaboration and Communication Skills for Developers
Collaboration and communication skills are indispensable for BI developers, who regularly work within teams and present their findings to stakeholders. Effective communication transcends mere information conveyance; it requires the ability to distill complex insights into clear and concise narratives tailored to diverse audiences. At Creatum GmbH, we assert that technology should drive significant change. As Microsoft states, “You can enhance your Power BI skills by practicing regularly, exploring various features and functionalities of the tool… and seeking feedback from peers or mentors.”
This methodology cultivates an environment where team members share knowledge and innovate collaboratively, resulting in improved business outcomes. In 2024, statistics reveal that effective collaboration within information teams significantly enhances productivity and innovation, with studies indicating a 30% increase in project success rates among groups that prioritize communication. BI developers must prioritize collaboration skills, as these capabilities are crucial for ensuring that insights are effectively communicated and comprehended by stakeholders.
Nevertheless, BI developers face challenges such as time-consuming report creation and inconsistencies that can impede effectiveness. For example, a case study involving a leading retail company demonstrated that the Power BI team improved stakeholder engagement by 40% after implementing structured communication strategies, which also refined their Power BI skills to tackle these challenges through streamlined reporting processes. Real-world examples illustrate that successful stakeholder presentations hinge not only on the quality of the information but also on the presenter’s ability to engage their audience and facilitate discussions.
Communication specialist Dr. Jane Smith emphasizes, “The capacity to convey information effectively is vital; it converts raw figures into practical business intelligence.” By honing these communication strategies and addressing the challenges of report generation and information precision, BI specialists can align their insights with organizational objectives, thereby making a substantial impact on decision-making processes.
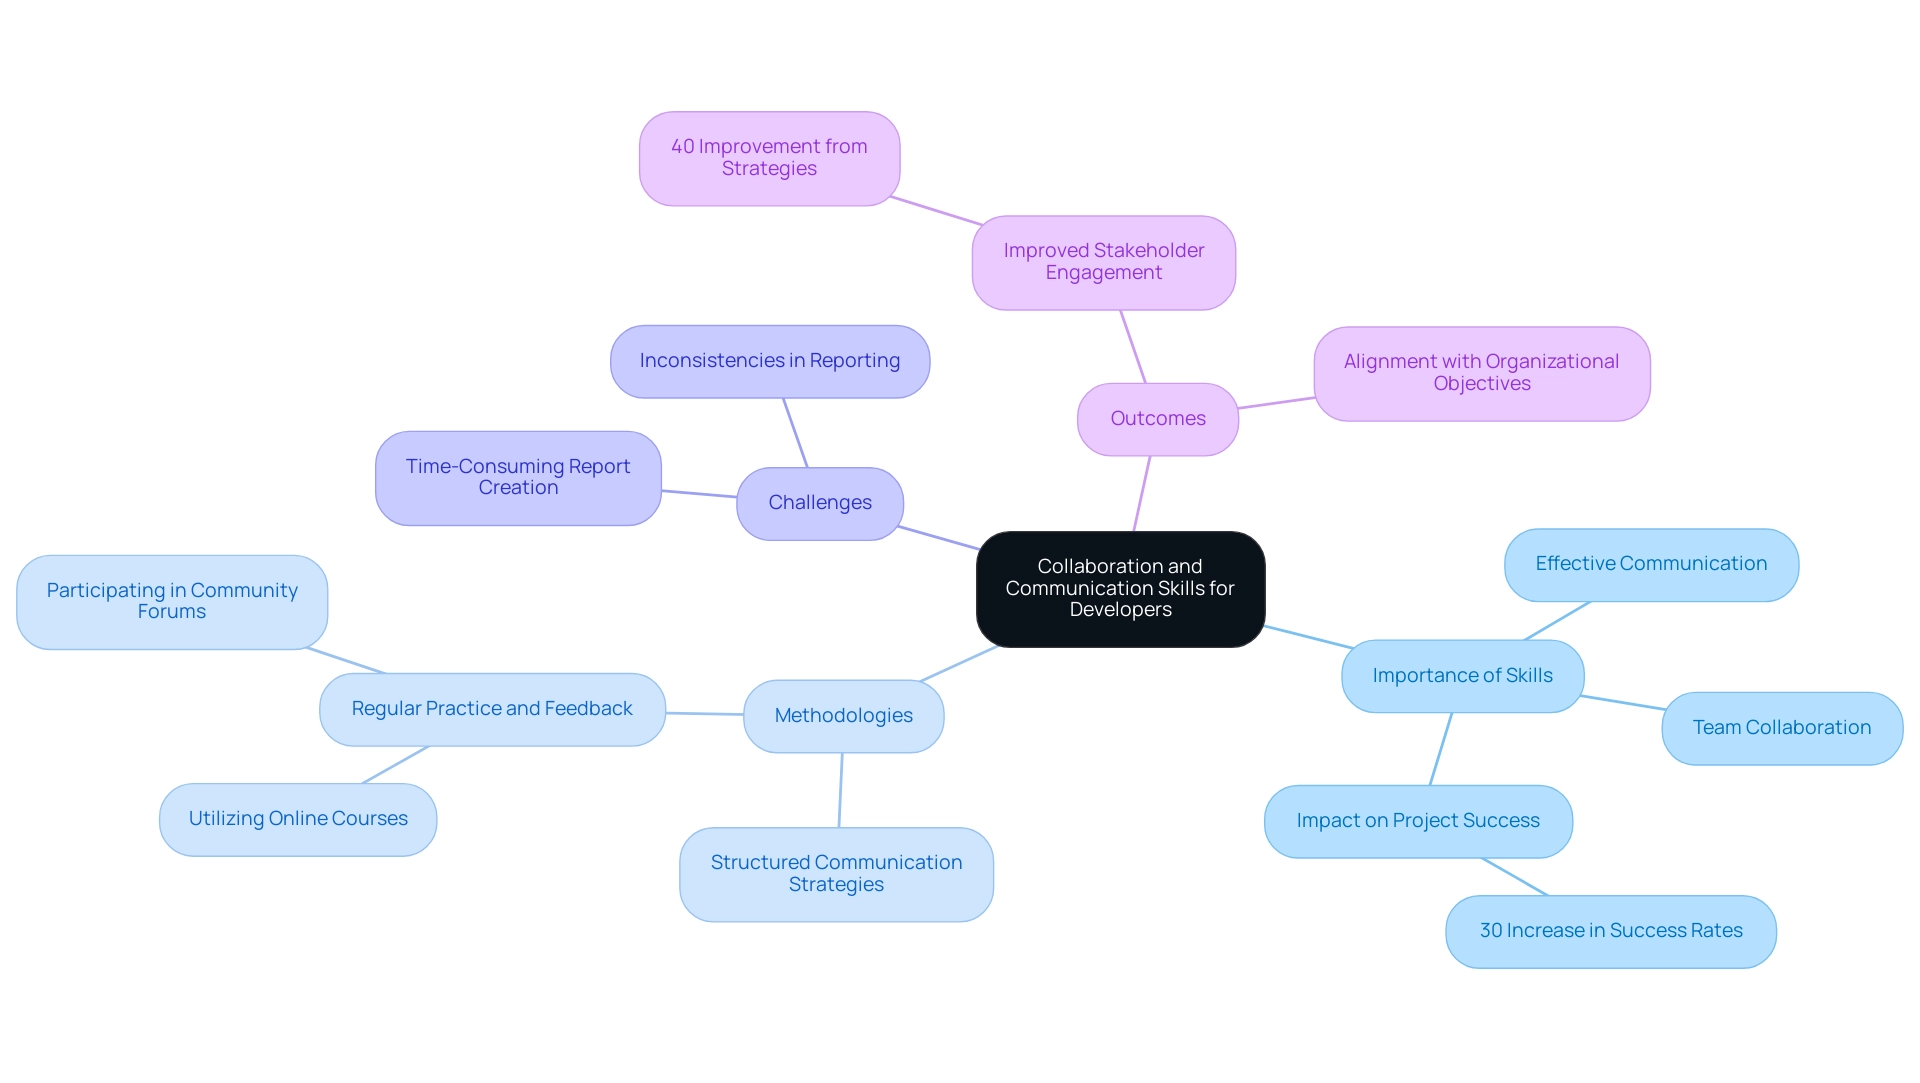
Grasping Business Intelligence Concepts
A solid grasp of business intelligence concepts is crucial for enhancing Power BI skills among practitioners, enabling them to effectively align their solutions with organizational objectives. In the swiftly changing AI landscape, understanding key BI principles such as governance, quality, and performance metrics is essential, as these elements collectively underpin the effectiveness of information-driven strategies. By mastering these concepts and honing their Power BI skills, individuals can create reports and dashboards that yield actionable insights, ultimately bolstering the strategic decision-making processes within their organizations.
For instance, in 2024, a notable 16% of healthcare organizations acknowledge the importance of cloud BI, reflecting a growing trend towards data-centric approaches amid the overwhelming options presented by AI. In the insurance and telecommunications sectors, leading companies plan to utilize an average of 11.4 cloud solutions, while enterprise companies average around 8 clouds, indicating a significant shift towards increased cloud adoption. However, creators must navigate challenges such as information integration and security, which account for 20% and 14% of issues faced in self-service business intelligence, respectively.
Furthermore, as highlighted by Grand View Research, companies like Netflix effectively leverage large datasets, realizing substantial savings of $1 billion annually. This underscores the profound impact that sound BI practices can have on operational efficiency and financial performance. To capitalize on these trends and mitigate the competitive disadvantage of failing to extract meaningful insights, programmers should focus on networking with peers and leveraging research to identify tailored AI solutions and best practices in information governance and quality. This approach ensures they cut through the noise of the AI landscape and harness the full potential of Business Intelligence.
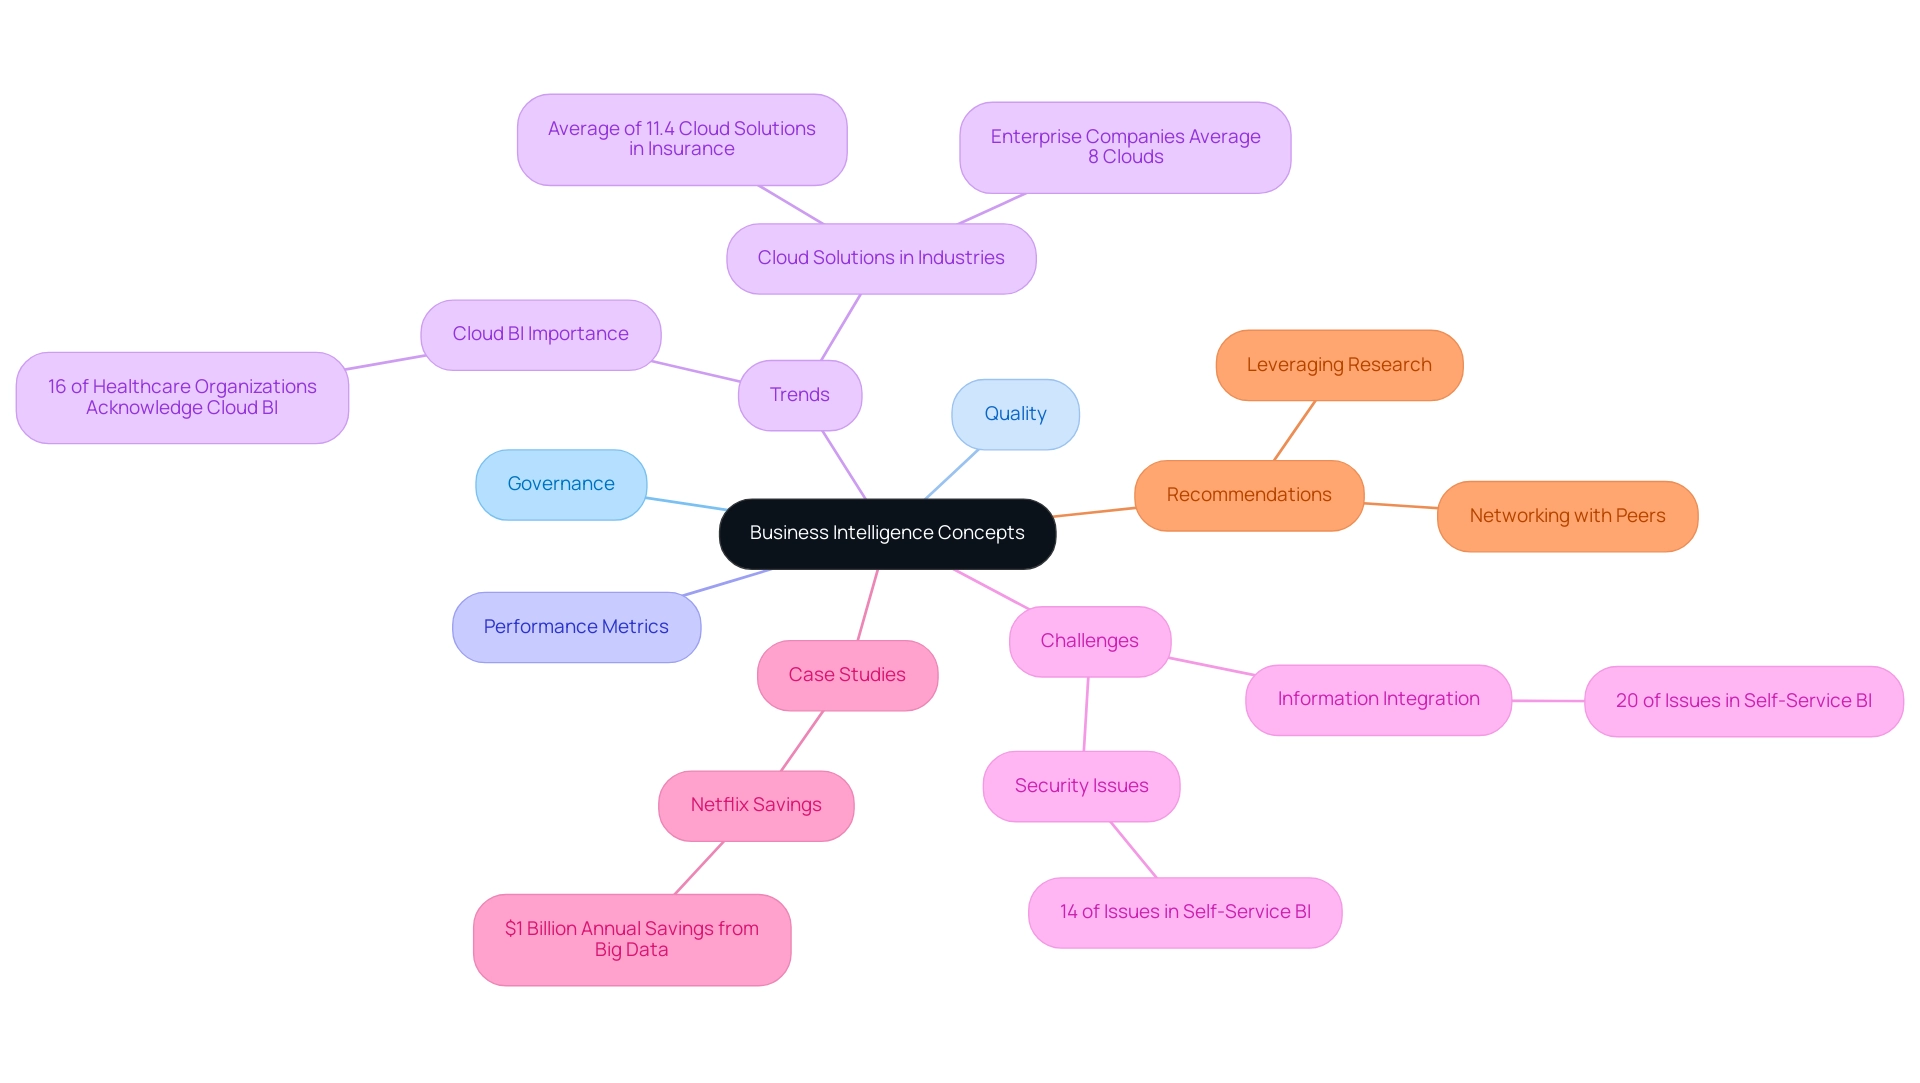
Building Practical Experience and a Strong Portfolio
For BI developers, cultivating practical experience and assembling a robust portfolio are vital steps in appealing to potential employers, particularly in today’s data-rich environment. Familiarizing oneself with Power BI’s core elements and enhancing technical abilities—such as analysis, SQL, and DAX—is crucial. Engaging in real-world projects, contributing to open-source initiatives, or developing personal projects can effectively demonstrate Power BI skills, showcasing proficiency in tools and techniques while overcoming challenges like time-consuming report creation and inconsistencies.
Moreover, incorporating Robotic Process Automation (RPA) solutions can significantly enhance operational efficiency by automating repetitive tasks and optimizing data processes. This focus allows programmers to concentrate on achieving practical outcomes. As industry leader Imenso highlights, ‘The project manager is responsible to keep you updated about the progress and make sure the deadlines are met.’ This collaborative approach not only showcases technical skills but also emphasizes the individual’s ability to deliver actionable insights and drive operational efficiency.
A thoughtfully curated portfolio serves as a testament to an individual’s capability to provide strategic solutions, making it an indispensable asset in today’s job market. Recent trends indicate that developers with hands-on experience and strong portfolios tend to enjoy better job prospects. In fact, statistics reveal that effective portfolios significantly enhance the chances of securing interviews, with the typical salary range for a BI architect falling between $113,000 and $167,000 per year.
Furthermore, certifications like the Microsoft Certified: Power BI Data Analyst Associate are invaluable for individuals pursuing a career in Business Intelligence, further underscoring the significance of Power BI skills alongside hands-on experience. Addressing the challenges of leveraging insights from Power BI dashboards necessitates a strategic approach that enhances these skills, where RPA can play a crucial role in mitigating issues related to data consistency and report generation times.
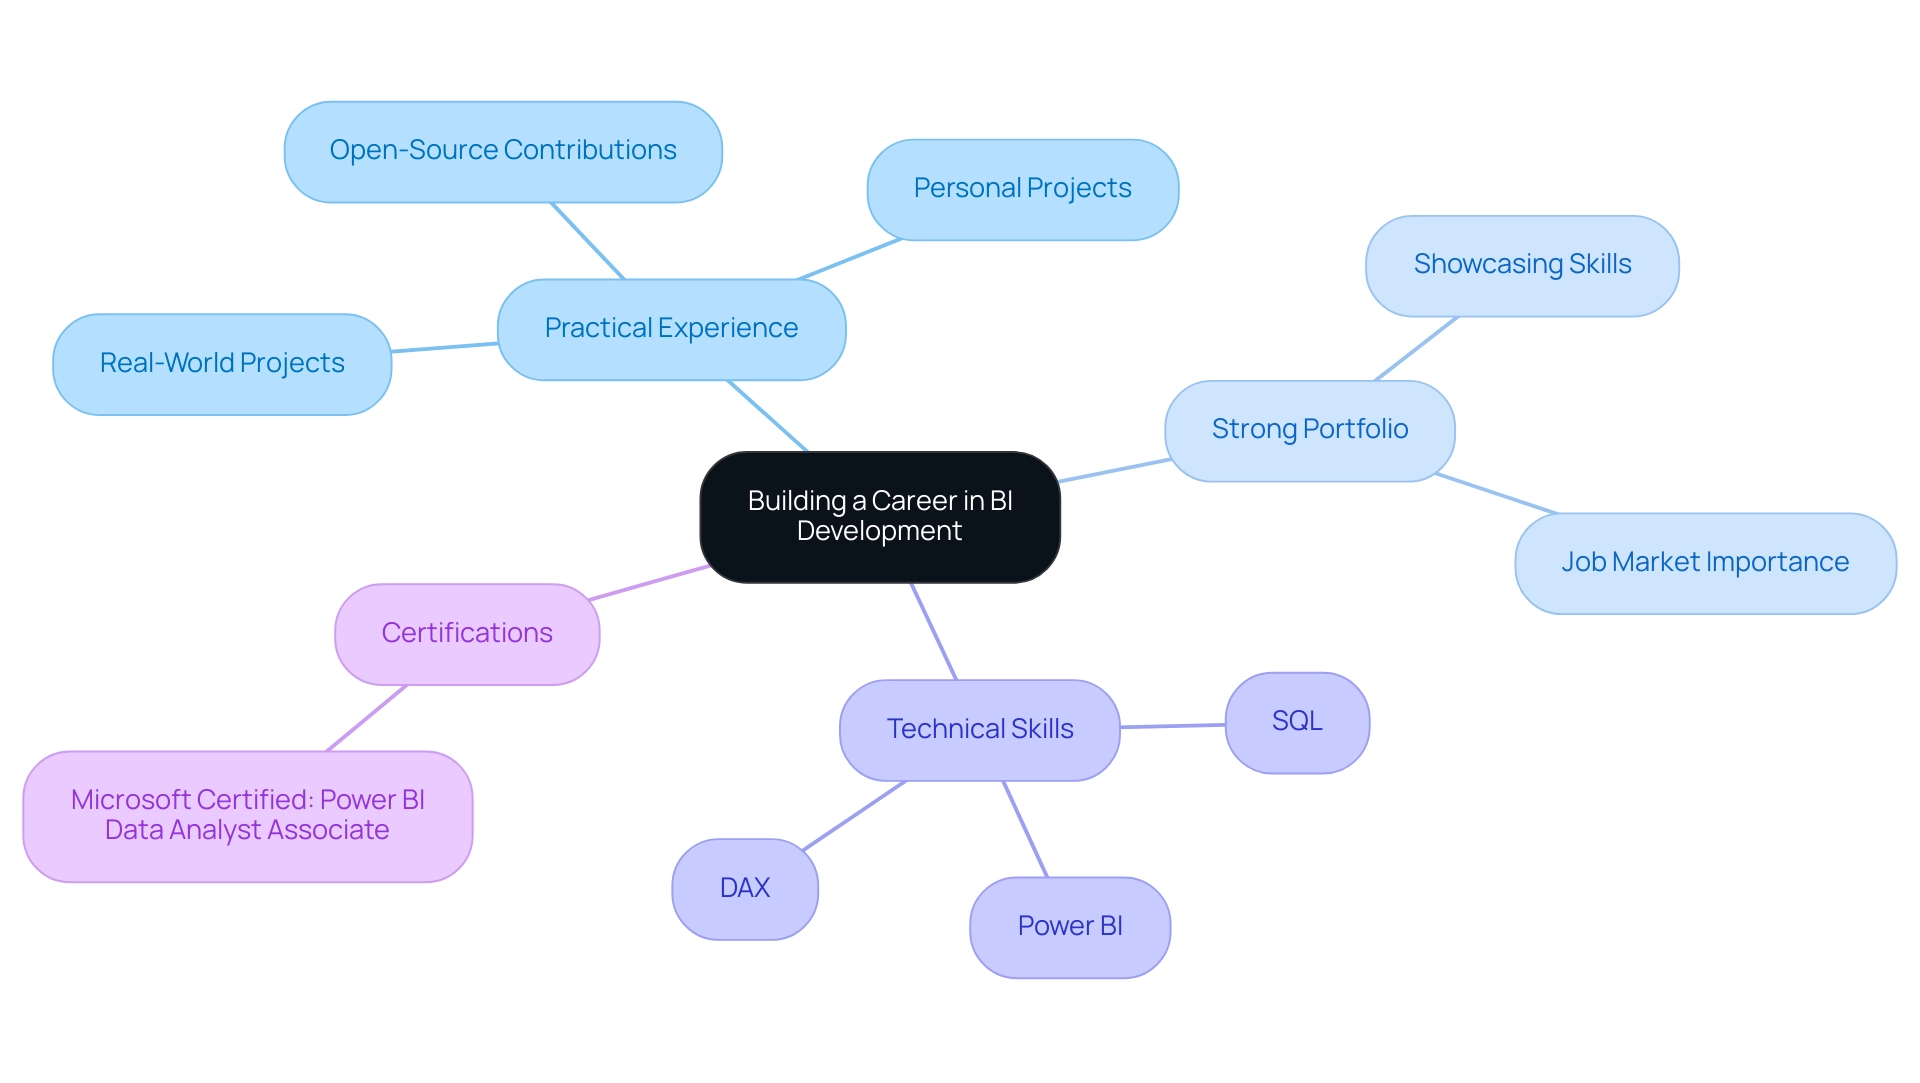
Conclusion
Power BI developers play a pivotal role in transforming raw data into actionable insights. Mastering a diverse skill set is essential for success in this field. Foundational knowledge in data analysis and visualization techniques, alongside proficiency in DAX and Power Query, equips developers to create impactful reports and dashboards. Understanding the Microsoft BI stack enhances their capacity to integrate various tools. Furthermore, a commitment to continuous learning ensures they remain at the forefront of an ever-evolving landscape.
The importance of effective communication and collaboration cannot be overstated; these skills are crucial for presenting insights clearly and engaging stakeholders in meaningful discussions. A firm grasp of business intelligence concepts, combined with practical experience and a strong portfolio, positions developers as invaluable assets in any organization.
As the demand for data-driven decision-making continues to grow, Power BI developers must embrace the challenges and opportunities presented by advancements in technology. By honing these essential skills and fostering a proactive approach to learning, they can significantly impact their organizations. This contribution is vital for cultivating a data-centric culture that drives operational efficiency and business growth.
Overview
To effectively sort months in order within Power BI, users should utilize techniques such as creating a calculated column with DAX that assigns numerical values to each month, ensuring a logical chronological sequence in reports. The article emphasizes that proper month sorting is crucial for accurate time series analysis, as incorrect sorting can lead to confusion and hinder decision-making, thereby highlighting the importance of consistent data types and best practices in report creation.
Introduction
In the realm of data analysis, the ability to sort months chronologically in Power BI is not merely a technical detail; it is a cornerstone of effective reporting and decision-making. Many users encounter the frustrating challenge of default alphabetical sorting, which muddles insights and obscures trends.
This article delves into the significance of proper month sorting, exploring common pitfalls, innovative DAX techniques, and best practices that empower users to harness the full potential of their data. By mastering these sorting methods, organizations can transform their data visualizations, enabling clearer insights and fostering a culture of informed decision-making that drives operational success.
Understanding the Importance of Month Sorting in Power BI
In this tool, it is essential to use Power BI to sort months in order for obtaining precise time series analysis. Wrong sorting techniques, such as not using Power BI to sort months in order and instead organizing periods alphabetically (e.g., April, August, December), can result in considerable confusion and mistrust in the information, ultimately hindering the capacity to derive actionable insights from it. This misrepresentation is especially problematic considering the common challenges many encounter with Power BI, such as time-consuming report creation and inconsistencies.
For instance, when using Power BI to sort months in order while examining sales information, displaying periods in their proper chronological sequence allows users to efficiently perceive trends and patterns over time. This alignment not only enhances understanding but also supports informed decision-making, addressing the pitfalls of report creation that often distract from leveraging insights. As Kelly Lautt observed, combining Business Intelligence with effective information presentation is crucial for generating insights, particularly in how Power BI can sort months in order.
Moreover, research indicates that visual representation can lessen cognitive load and enhance recall in comparison to text, emphasizing this categorization method’s essential function in Power BI, especially when using Power BI to sort months in order. The objectives of the Data Presentation Architecture emphasize delivering relevant and actionable information that minimizes complexity and ensures clarity for different audiences. Furthermore, establishing a strong governance strategy is crucial to uphold information consistency and reduce confusion stemming from ineffective categorization practices.
Therefore, mastering time organization methods in Power BI to sort months in order is crucial for developing effective visualizations that convey the correct insights clearly and enhance operational efficiency.
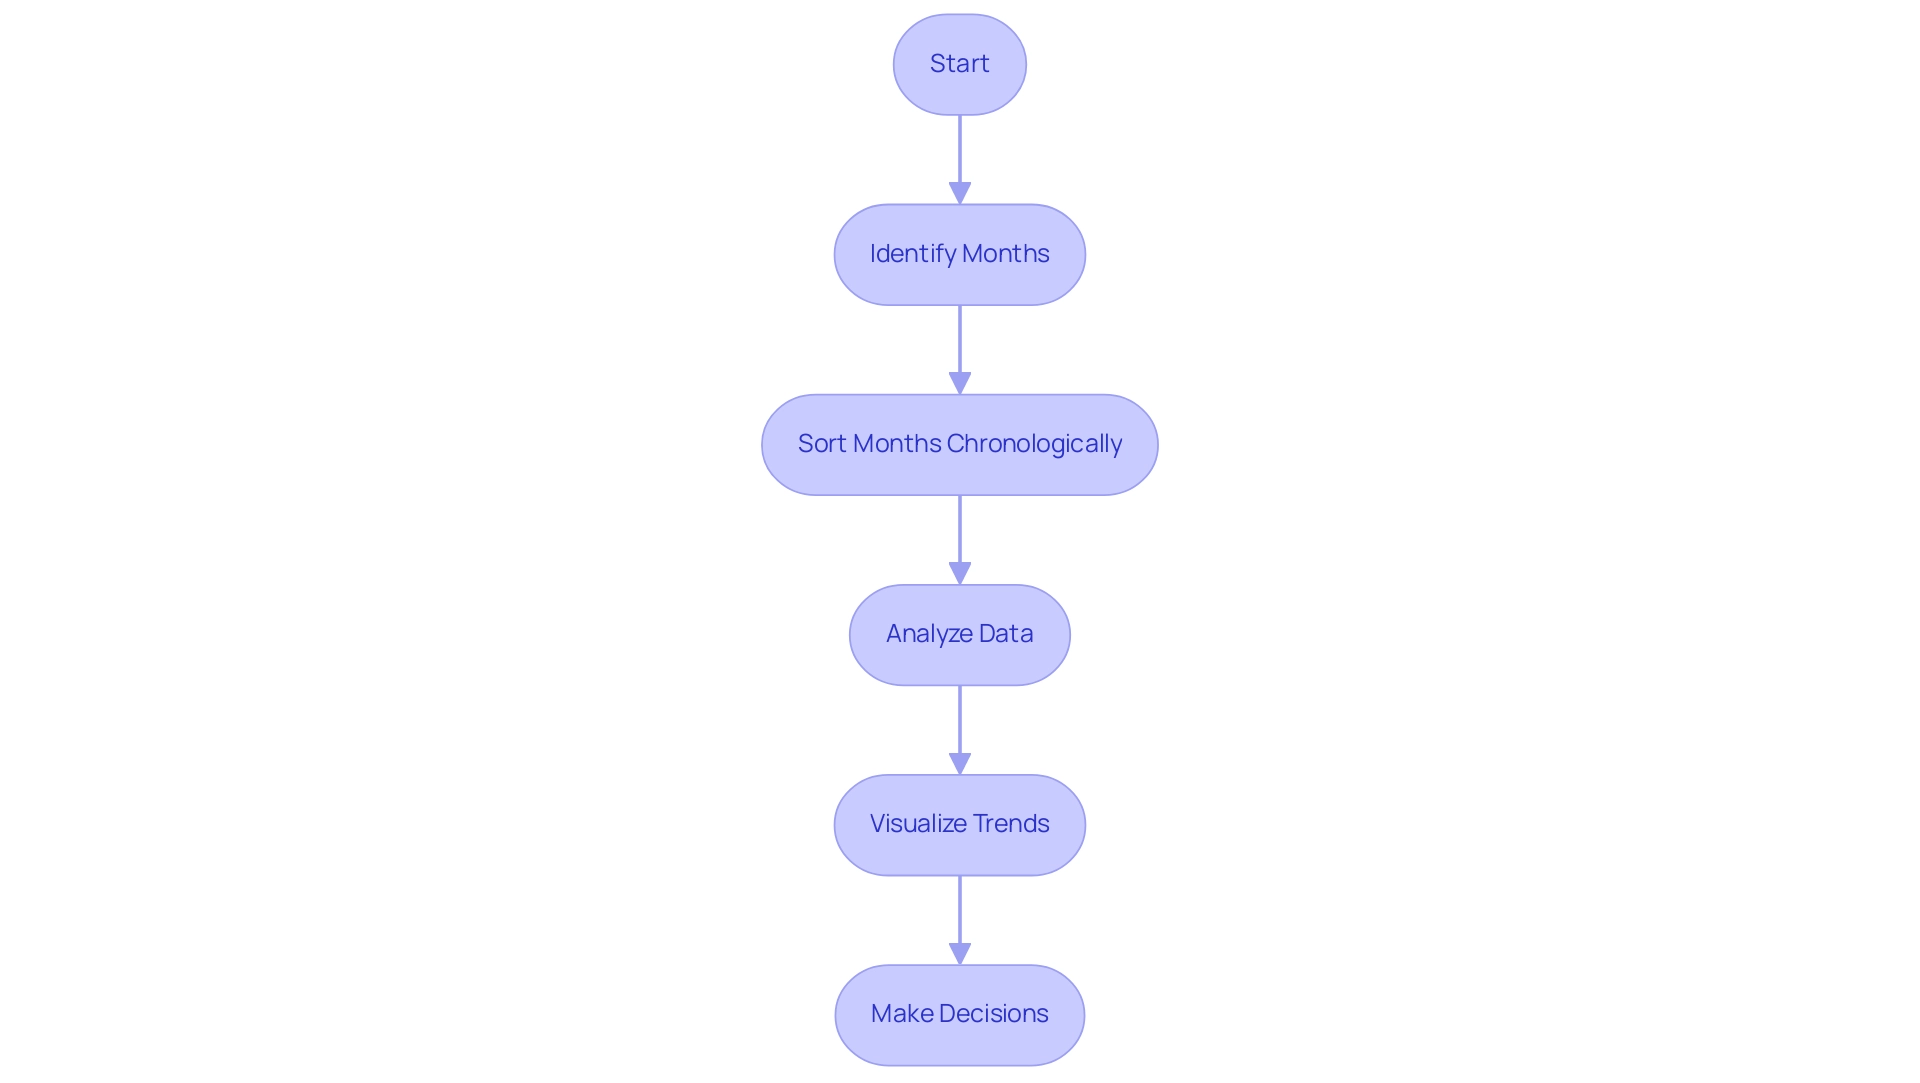
Common Challenges in Sorting Months in Power BI
One common problem faced by Power BI users is that they need to find a way to power BI sort months in order instead of having them arranged alphabetically, which can greatly impede analysis efficiency. This misalignment frequently occurs when the monthly information type is improperly set up, resulting in confusion and wasted time—issues that could be alleviated through the adoption of Robotic Process Automation (RPA) to optimize workflows. In fact, many of the 202 top kudoed authors report facing similar challenges that arise when attempting to power bi sort months in order, particularly when months are represented as text rather than recognized date values, complicating the arrangement process.
Furthermore, misconfigured connections between tables can hinder appropriate arrangement, leading to flawed information representation, which reduces the effectiveness of Business Intelligence tools. For instance, in the case study ‘Searching Documents in Elasticsearch,’ users faced similar sorting challenges that impacted their retrieval processes. Addressing these issues also requires a robust governance strategy to ensure consistency and reliability across reports.
Furthermore, customized AI solutions can be instrumental in navigating these challenges, providing users with the necessary tools to enhance their analytical capabilities. Understanding these obstacles is crucial, as it paves the way for tailored solutions that can cut through the noise of the rapidly evolving AI landscape, ensuring that stakeholders are equipped with actionable insights for informed decision-making. As one user aptly noted,
That did it, thank you!
illustrating the critical importance of addressing these common challenges to enhance the overall information analysis experience.
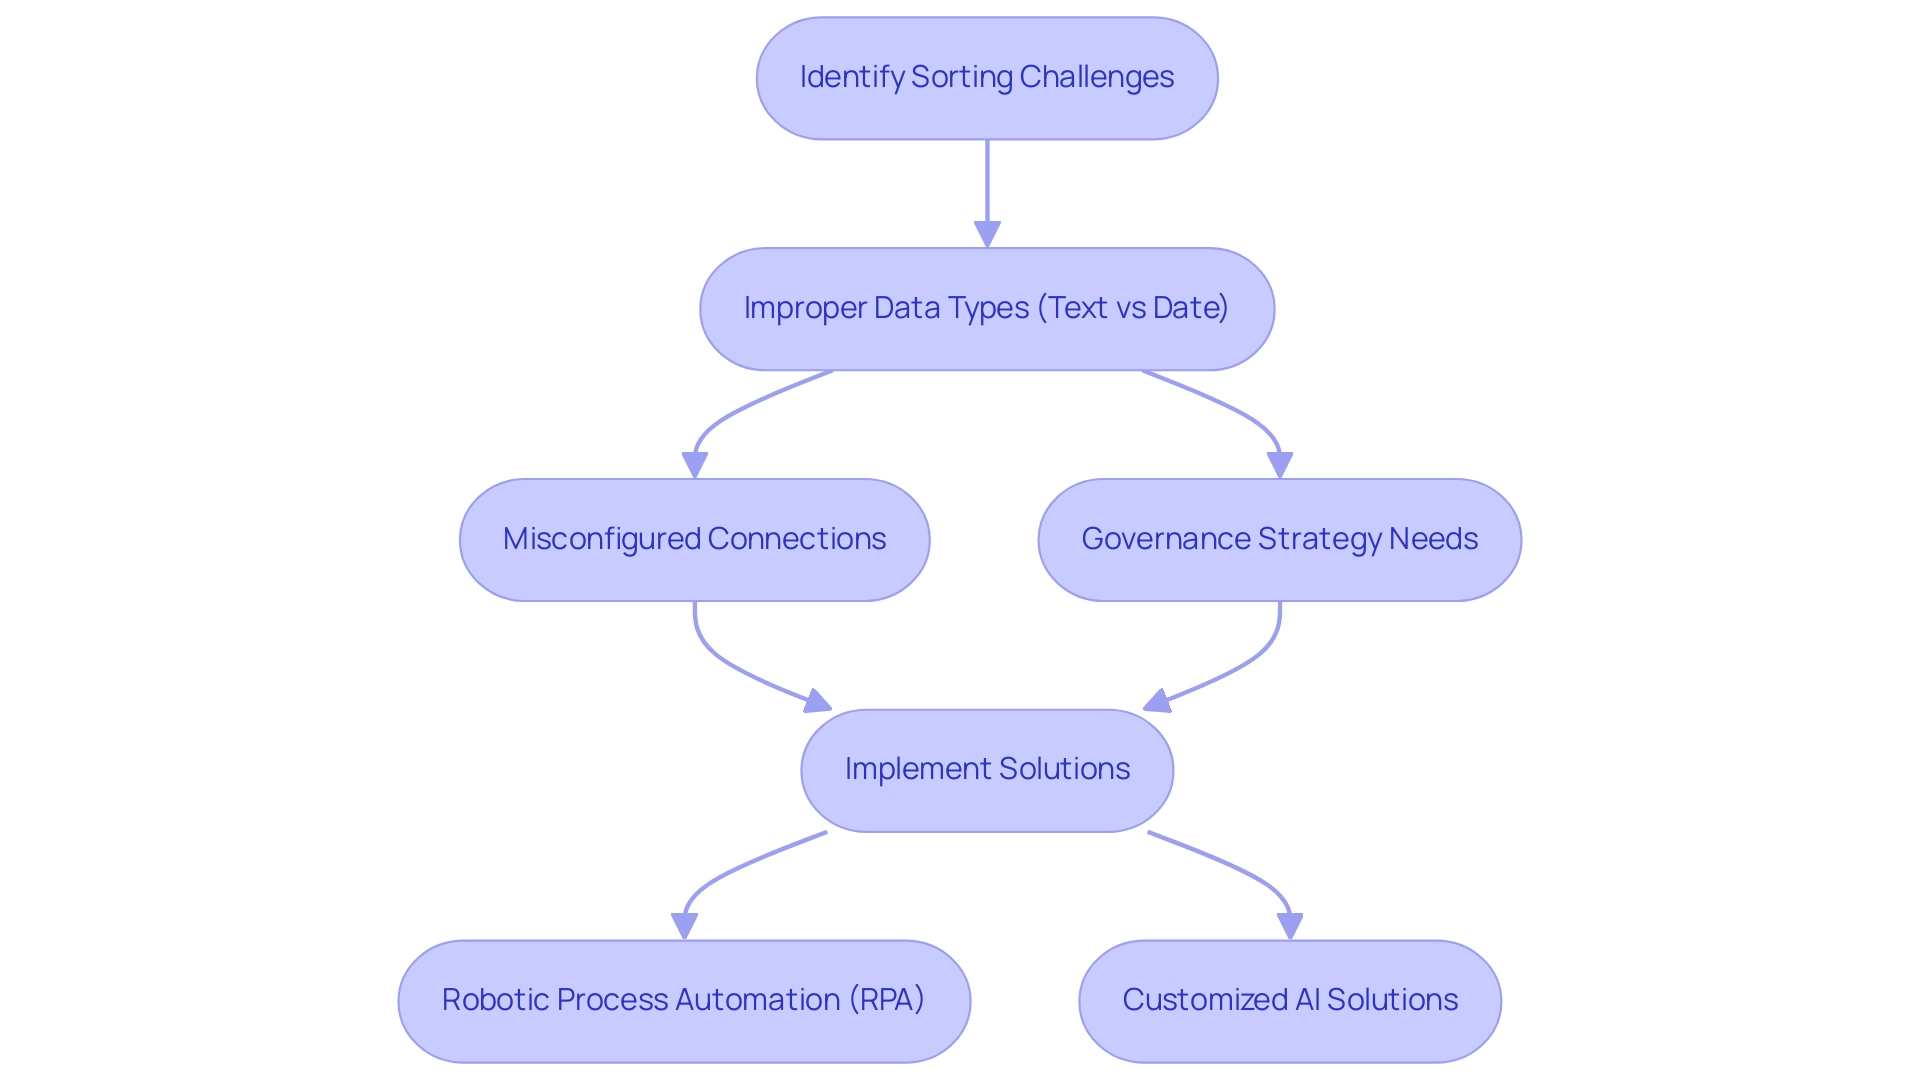
Methods for Sorting Months: DAX and Custom Techniques
To improve visualization in Power BI, it is essential to use techniques that can help you Power BI sort months in order efficiently. One of the most effective techniques involves utilizing Data Analysis Expressions (DAX) to create a calculated column that assigns a numerical value to each month—January as 1, February as 2, and so on. This numerical representation enables users to organize their information according to this column, which supports how Power BI sort months in order, ensuring a logical chronological order in reports.
This is particularly crucial in today’s data-rich environment where the ability to extract meaningful insights can determine a business’s competitive edge, making the role of Business Intelligence indispensable. Additionally, the OR function in DAX can be utilized in conjunction with these techniques to create more complex filtering and arrangement conditions, enhancing the analytical capabilities of the reports.
Additionally, another robust personalized arrangement method entails creating a distinct table that enumerates the periods in the preferred sequence and connecting it to the primary information table. This approach not only offers adaptability in scheduling but also improves the clarity of the visual representations. A significant example in this domain is the use of the CALENDARAUTO function, which automatically recalibrates date table parameters, ensuring that the month arrangement stays up-to-date with the model after each refresh.
This function’s capability to keep the information model updated is essential for maintaining precise and prompt analysis, particularly in tackling challenges like inconsistencies and time-consuming report creation.
Denys Arkharov, a BI Engineer at Coupler.io, emphasizes the significance of such techniques, stating, “A notable achievement in my career was my involvement in creating Risk Indicators for Ukraine’s ProZorro platform, a project that led to my work being incorporated into the Ukrainian Law on Public Procurement.” This emphasizes the real-world effect of effective DAX methods and custom arrangement techniques in visual representation, underpinning the vital role of RPA solutions like EMMA RPA and Automation streamlining operations and enhancing employee morale. EMMA RPA can automate repetitive information entry tasks, while Automate can facilitate the integration of BI with other applications, further enhancing efficiency.
These DAX methods and custom sorting techniques not only streamline the sorting process but also enable Power BI to sort months in order, contributing to more effective analysis and visualization, which allows for clearer insights and improved decision-making, critical for driving growth and innovation in any organization.
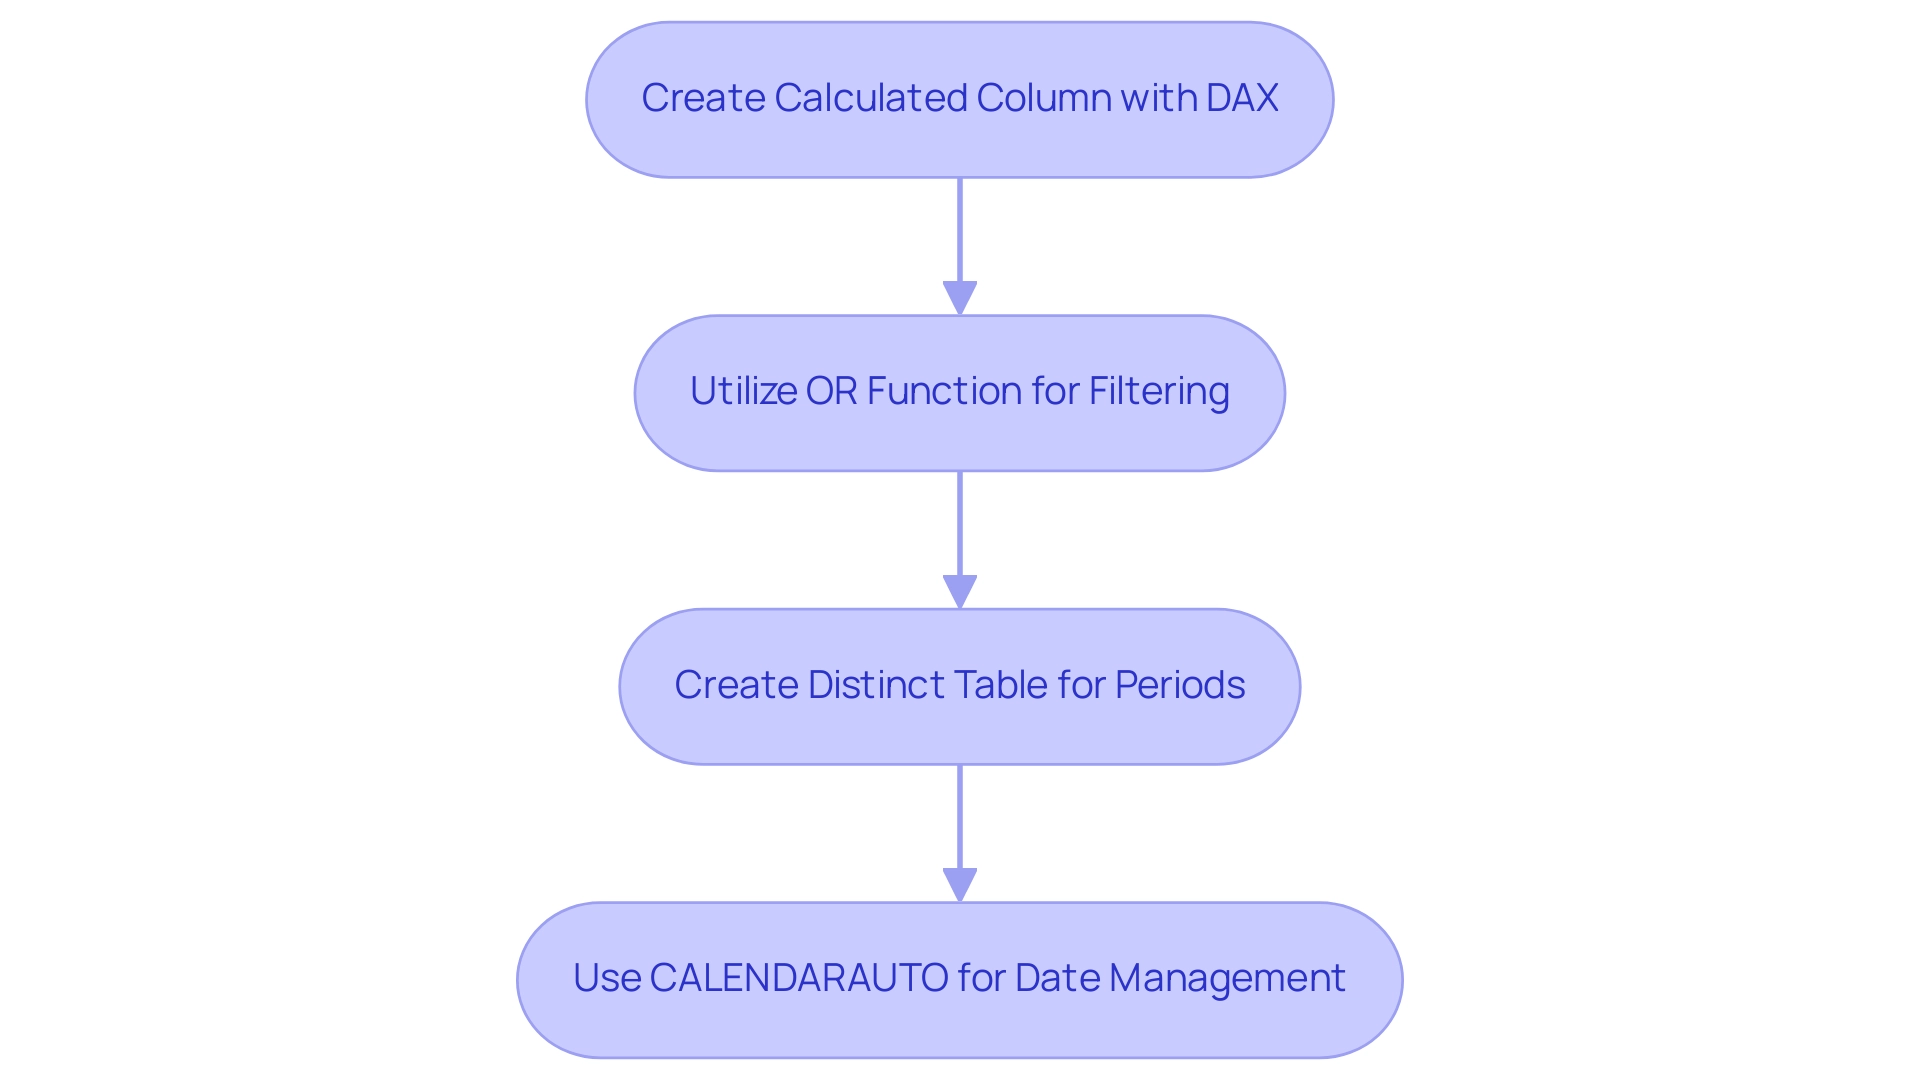
Step-by-Step Guide to Sorting Months in Power BI
- Open Power BI Desktop and load your information model to begin the process. In today’s data-rich environment, optimizing your reporting capabilities is crucial for informed decision-making.
- Create a New Calculated Column: Navigate to the data view, select your date table, and create a new column with the DAX formula:
Month Number = MONTH([Date]). This step is critical as it allows you to assign a numerical value to each period, which is essential to power BI sort months in order and facilitate accurate sorting. - Sort the Time Period Column: Select your designated time period column (e.g., ‘MonthName’). Go to the ‘Modeling’ tab, click on ‘Sort by Column,’ and choose the newly created ‘MonthNumber’ column. This action ensures that the names align correctly with their numerical order when you use Power BI to sort months in order.
- Create Visualizations: Incorporate your month column into visualizations. With the power bi sort months in order applied, your information should now display in the correct chronological order, enhancing clarity and insight. This structured approach not only simplifies report creation but also addresses common challenges such as data inconsistencies and task repetition, which can be mitigated by integrating RPA solutions.
- Verify Sorting: Thoroughly check your reports to confirm that months appear in chronological order. If discrepancies arise, revisit the setup of your calculated column and the sorting options to ensure you can effectively use Power BI to sort months in order. This attention to detail is crucial, as highlighted by community discussions on effective practices in Business Intelligence.
Furthermore, once the CSV file of audit logs is generated, it can be used as a source in BI, providing additional insights into your information. As Brian, an Enterprise DNA Expert, aptly states,
Thanks for the feedback – always wonderful to hear folks getting great value out of their memberships,
underscoring the importance of proper information management practices in driving operational efficiency and the potential of RPA to enhance these processes.
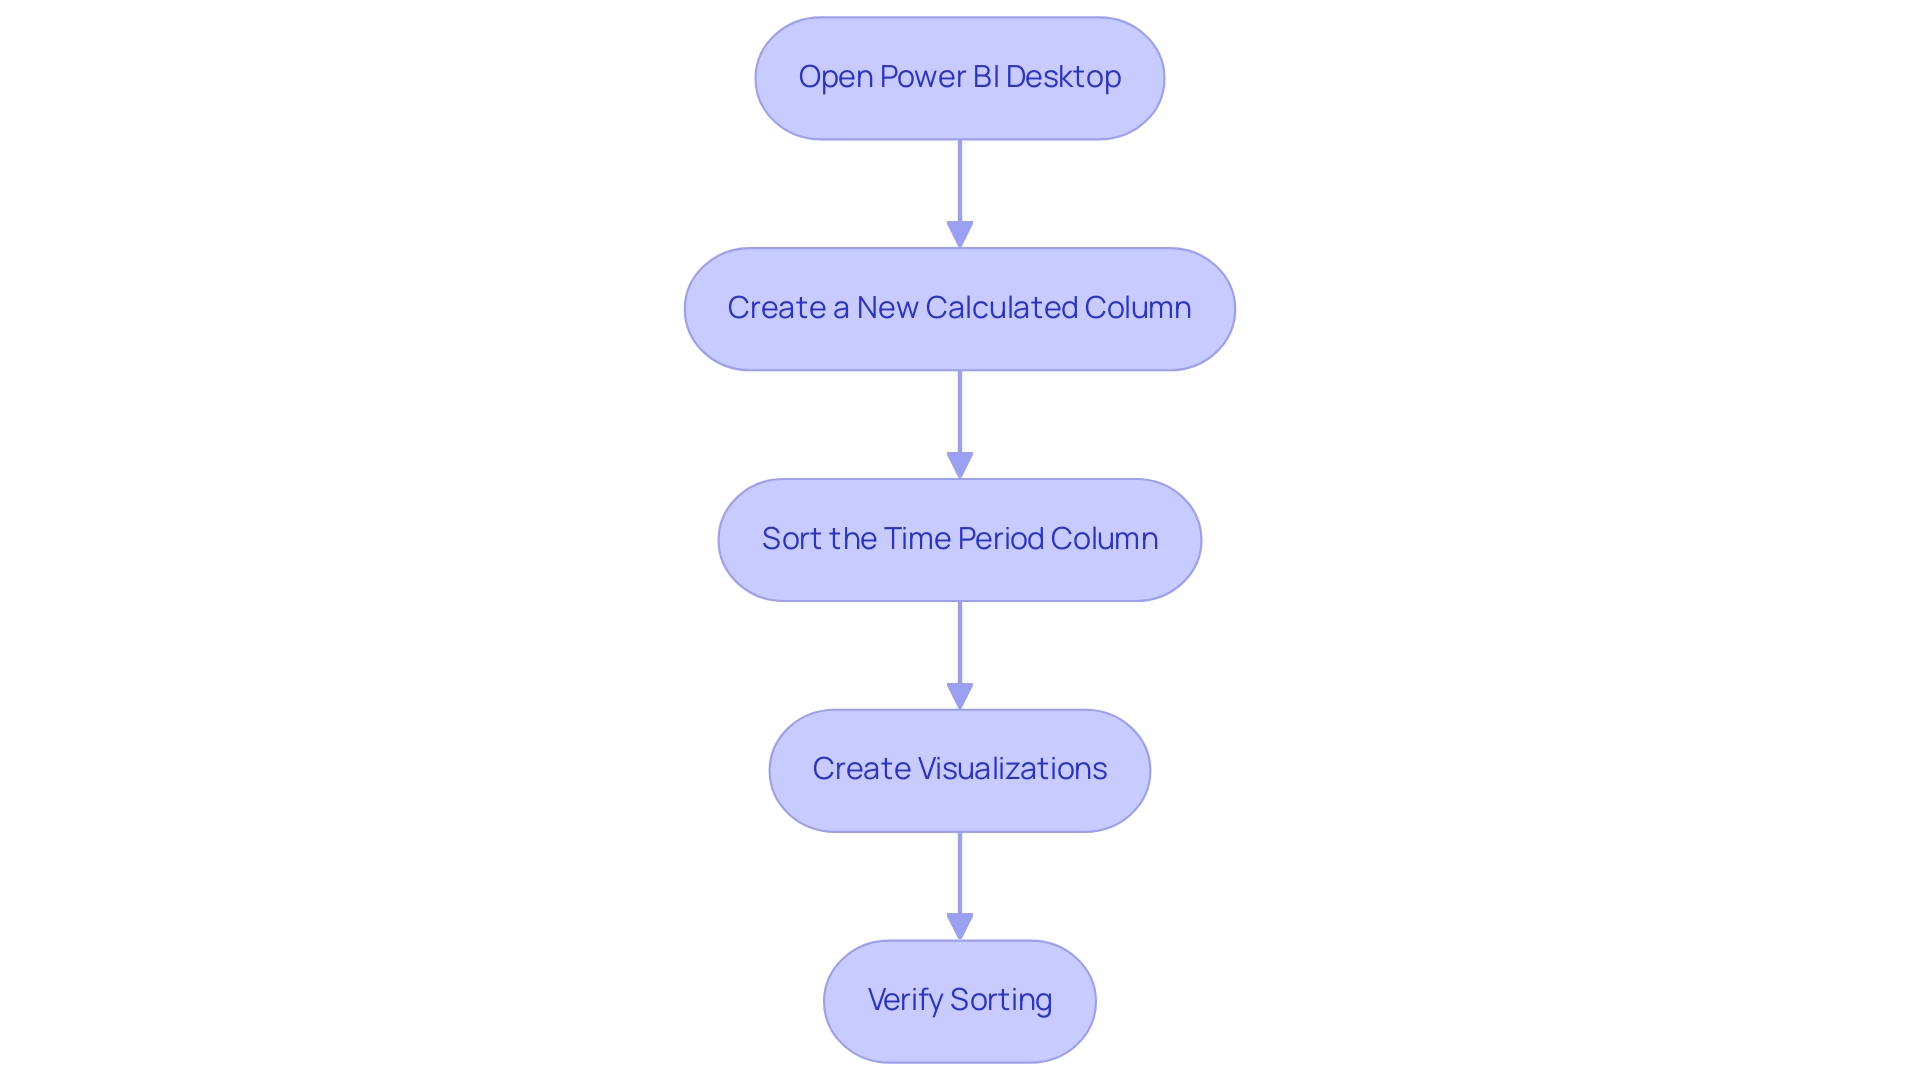
Best Practices for Effective Month Sorting in Power BI
To ensure effective arrangement of periods in Power BI, it is crucial to adopt the following best practices:
- Use Consistent Data Types: To avoid organization issues, ensure that your period and date columns are formatted as date types. Uniformity in information types is crucial, as it directly affects how Power BI sorts months in order with precision. For example, if a period is regarded as text, it may not allow Power BI to sort months in order accurately, resulting in deceptive visual representations that could obstruct business intelligence initiatives.
- Regularly Update DAX Calculations: It is crucial to revisit your DAX calculations whenever there are modifications in your information model. Updating these calculations guarantees that your reports stay precise and representative of the most current information, in line with the operational efficiency objectives of your organization.
- Document Your Organization Logic: Keeping thorough records of your organization logic is advantageous for future reference or for team members who might assume responsibility for the report. This practice not only supports continuity but also improves collaboration and understanding among team members, tackling potential challenges in utilizing insights effectively.
- Test Visualizations: Before finalizing reports, always confirm that your visualizations accurately represent the intended sequence. This proactive method aids in recognizing and correcting any inconsistencies early in the process, ensuring that your dashboards can use Power BI to sort months in order for actionable insights.
Integrating these practices not only simplifies the monthly organization process but also conforms to the recommendations of visualization specialists like Mateusz Mossakowski, who stated,
What we really need is to stick to a numeric measure and ‘push’ the formatting piece to where it belongs — meaning to a dynamic format string.
This perspective highlights the importance of suitable information management in achieving effective visualizations that drive growth and innovation. Additionally, another custom arrangement technique involves organizing segments in a bar chart based on categories that are not directly represented in the chart.
By including the category field in tooltips and arranging by the first category, users can efficiently classify segments into their corresponding categories, enhancing information visualization.
Moreover, Amir Netz remarked,
The rise and history of BI,
emphasizing the continuous evolution of the platform and its functionalities. This underscores the significance of remaining current with best practices and innovative techniques in Power BI to tackle the challenges of time-consuming report creation and inconsistencies. Moreover, integrating Robotic Process Automation (RPA) into your reporting processes can significantly enhance operational efficiency.
By automating repetitive tasks associated with data management and report generation, RPA can help mitigate the competitive disadvantages faced by businesses that struggle to extract actionable insights from their data.
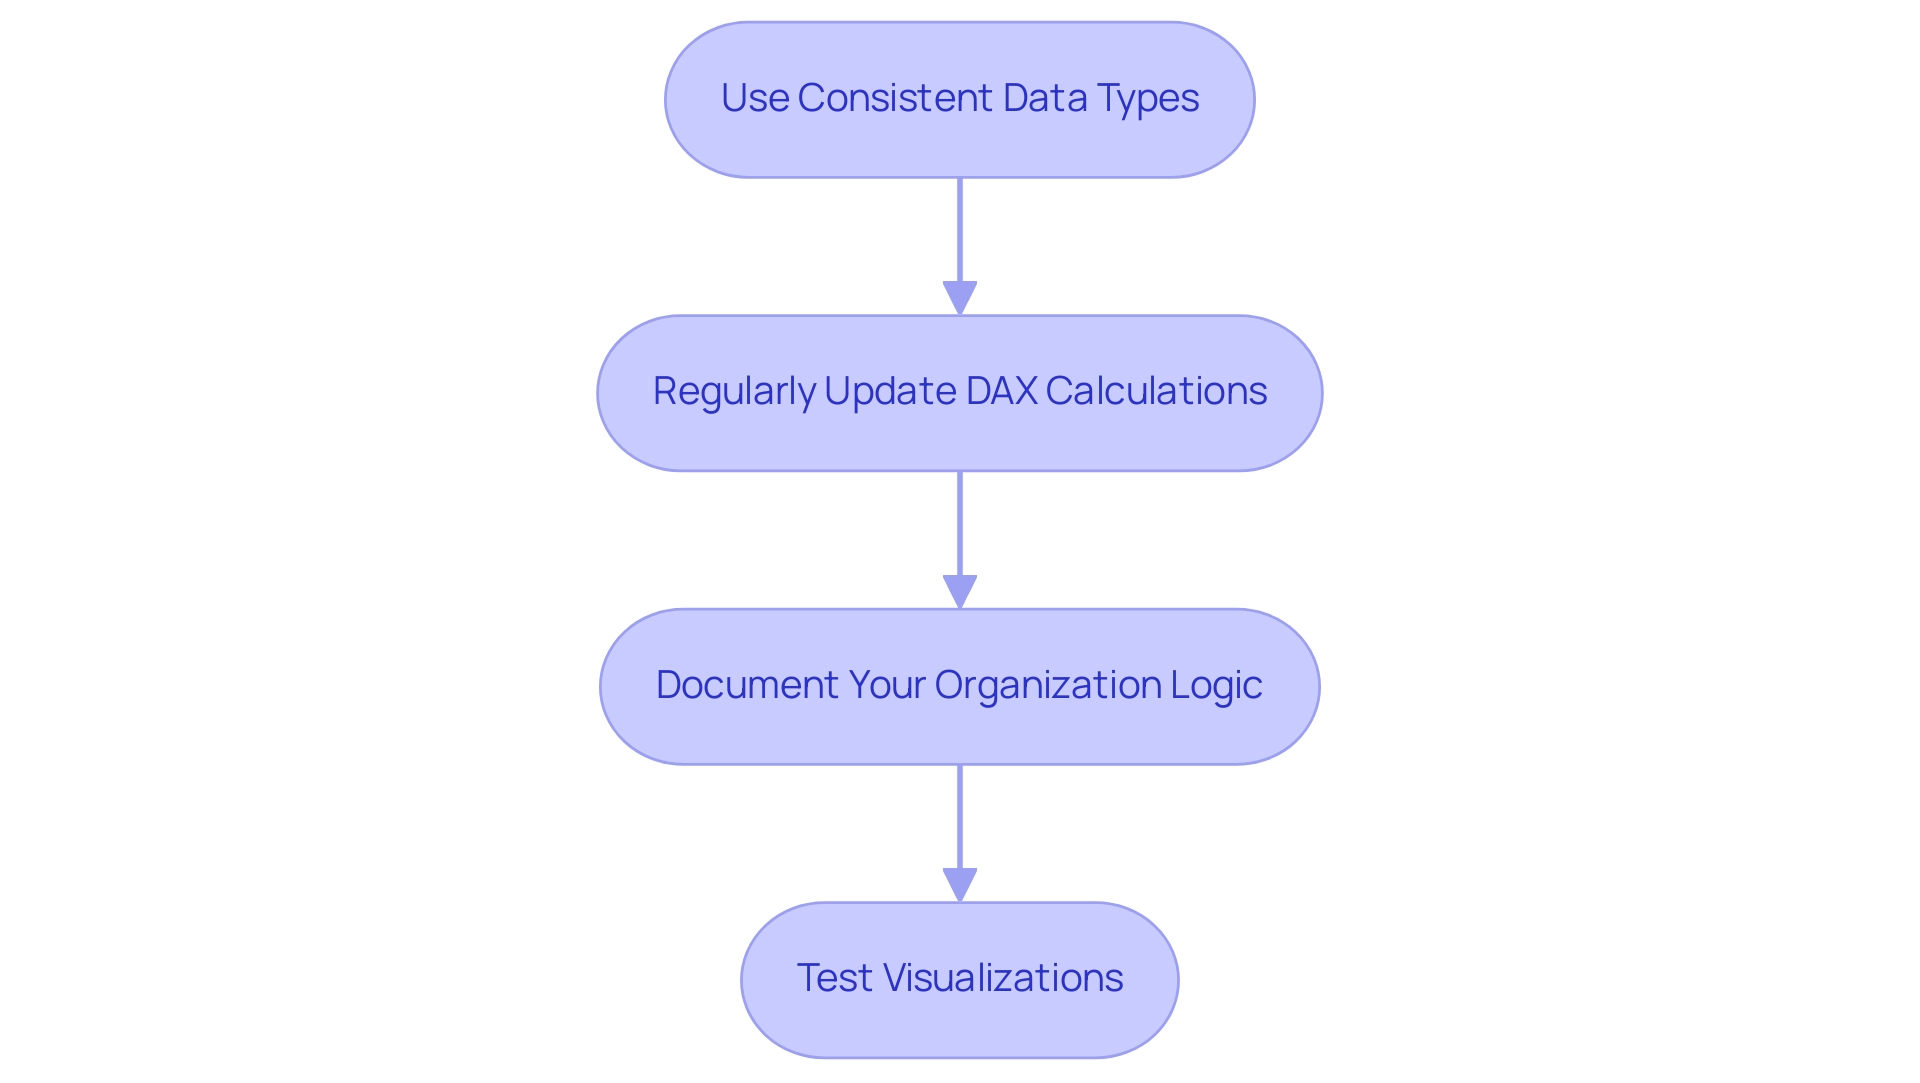
Conclusion
Mastering the art of sorting months chronologically in Power BI is not just a technical necessity; it is a vital component of effective data analysis and decision-making. The exploration of various sorting methods, including DAX techniques and custom approaches, highlights the importance of presenting data accurately to uncover meaningful insights. By addressing common challenges, such as default alphabetical sorting and misconfigured relationships, users can enhance the clarity and reliability of their reports.
Implementing best practices, such as maintaining consistent data types and regularly updating calculations, ensures that visualizations reflect the intended chronological order. This attention to detail not only simplifies the report creation process but also fosters a culture of informed decision-making within organizations. The integration of Robotic Process Automation (RPA) further streamlines operations, allowing teams to focus on deriving actionable insights rather than getting bogged down by repetitive tasks.
Ultimately, the ability to sort months correctly in Power BI empowers organizations to transform their data visualizations, turning raw data into clear narratives that drive operational success. Embracing these techniques and best practices is essential for anyone looking to leverage the full potential of Power BI and foster a data-driven culture that leads to enhanced performance and innovation.
