Overview
To update Power BI data effectively, users can choose between full updates, which replace all current information, and incremental updates, which modify only the changed content, thereby optimizing performance and reducing resource usage. The article emphasizes the importance of selecting the right update method based on operational needs and highlights best practices, such as automating processes with Robotic Process Automation (RPA) and monitoring refresh performance, to ensure reliable and timely access to accurate data.
Introduction
In the dynamic landscape of data-driven decision-making, ensuring that insights are timely and accurate is paramount for organizations striving to maintain a competitive edge. Power BI offers robust solutions for data refresh, enabling users to harness the latest information from their source systems effectively.
This article delves into the intricacies of data refresh in Power BI, exploring various methods such as:
- Manual refresh
- Scheduled refresh
- On-demand refreshes
While providing practical steps for setting up automatic refresh features. Additionally, it addresses common troubleshooting challenges and outlines best practices that can significantly enhance operational efficiency.
By understanding these concepts and implementing effective strategies, organizations can transform their data management processes, ultimately driving growth and innovation.
Understanding Data Refresh in Power BI
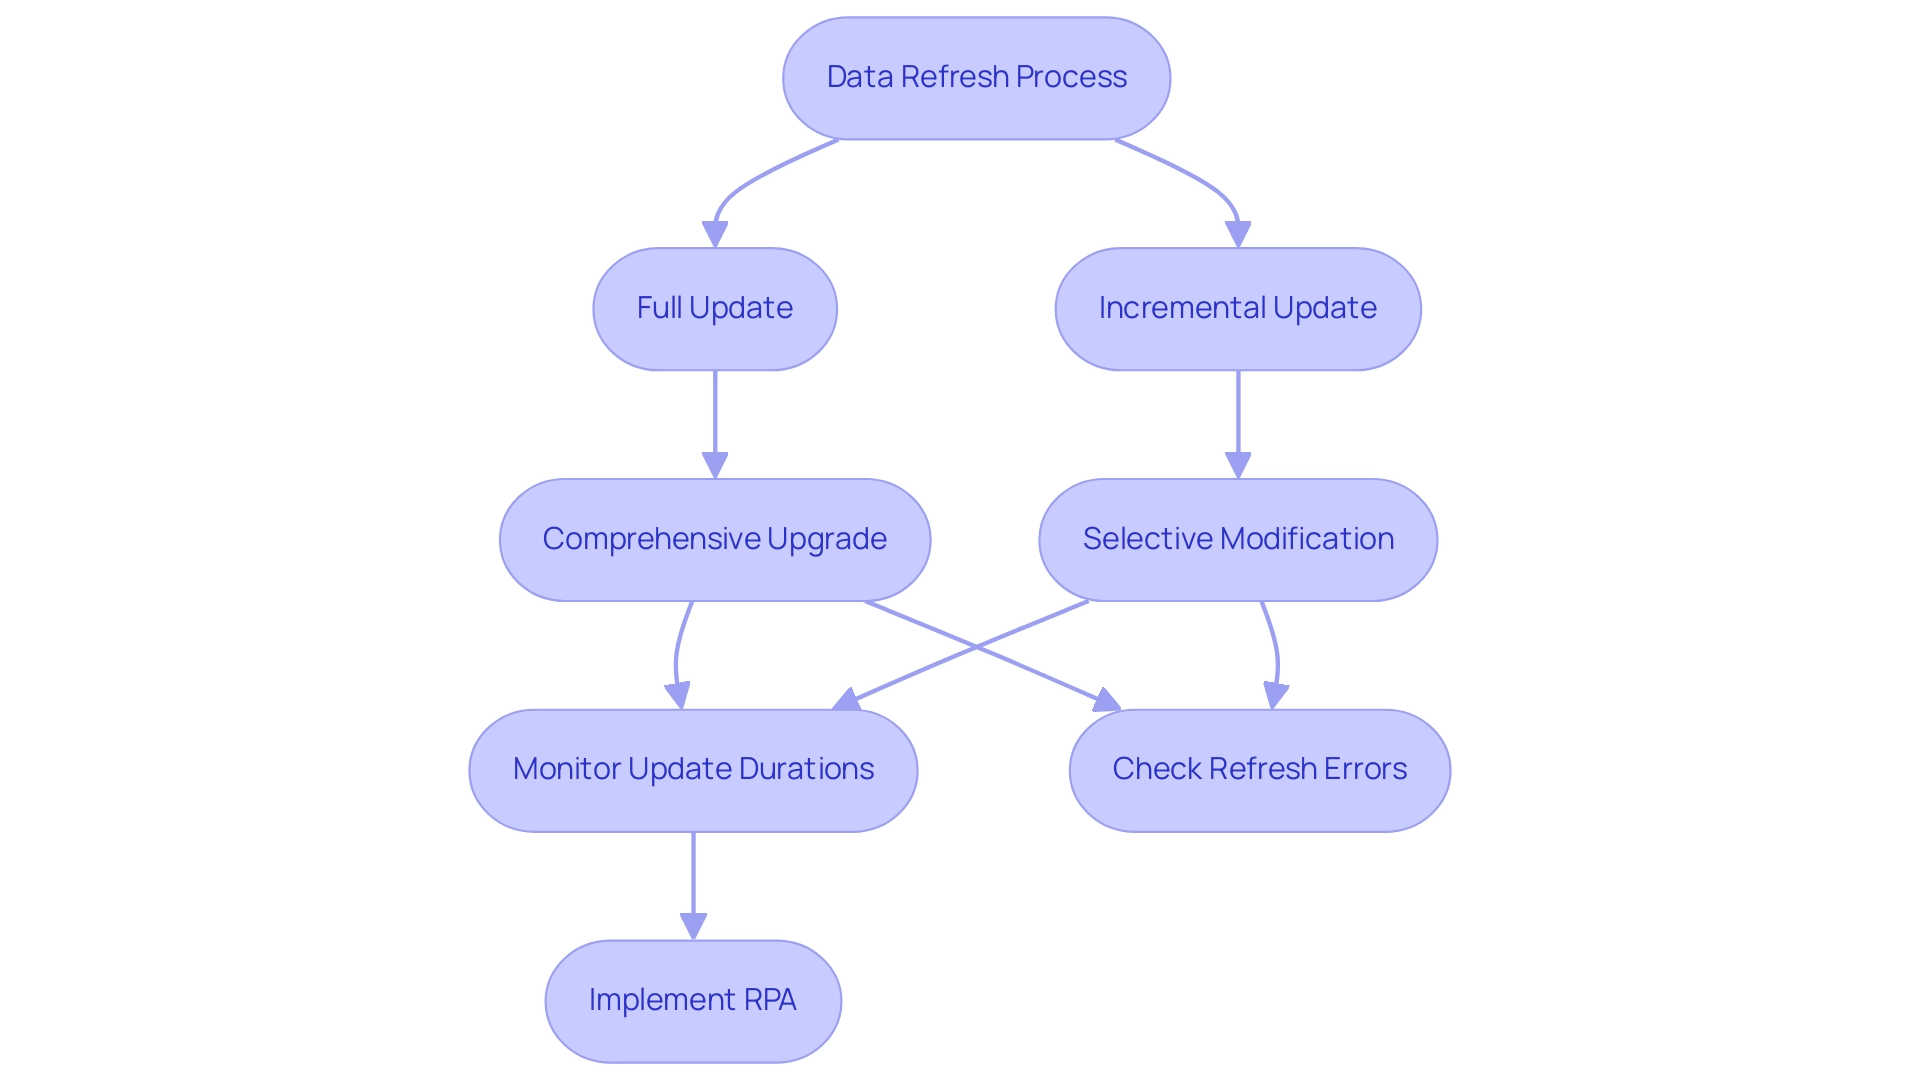
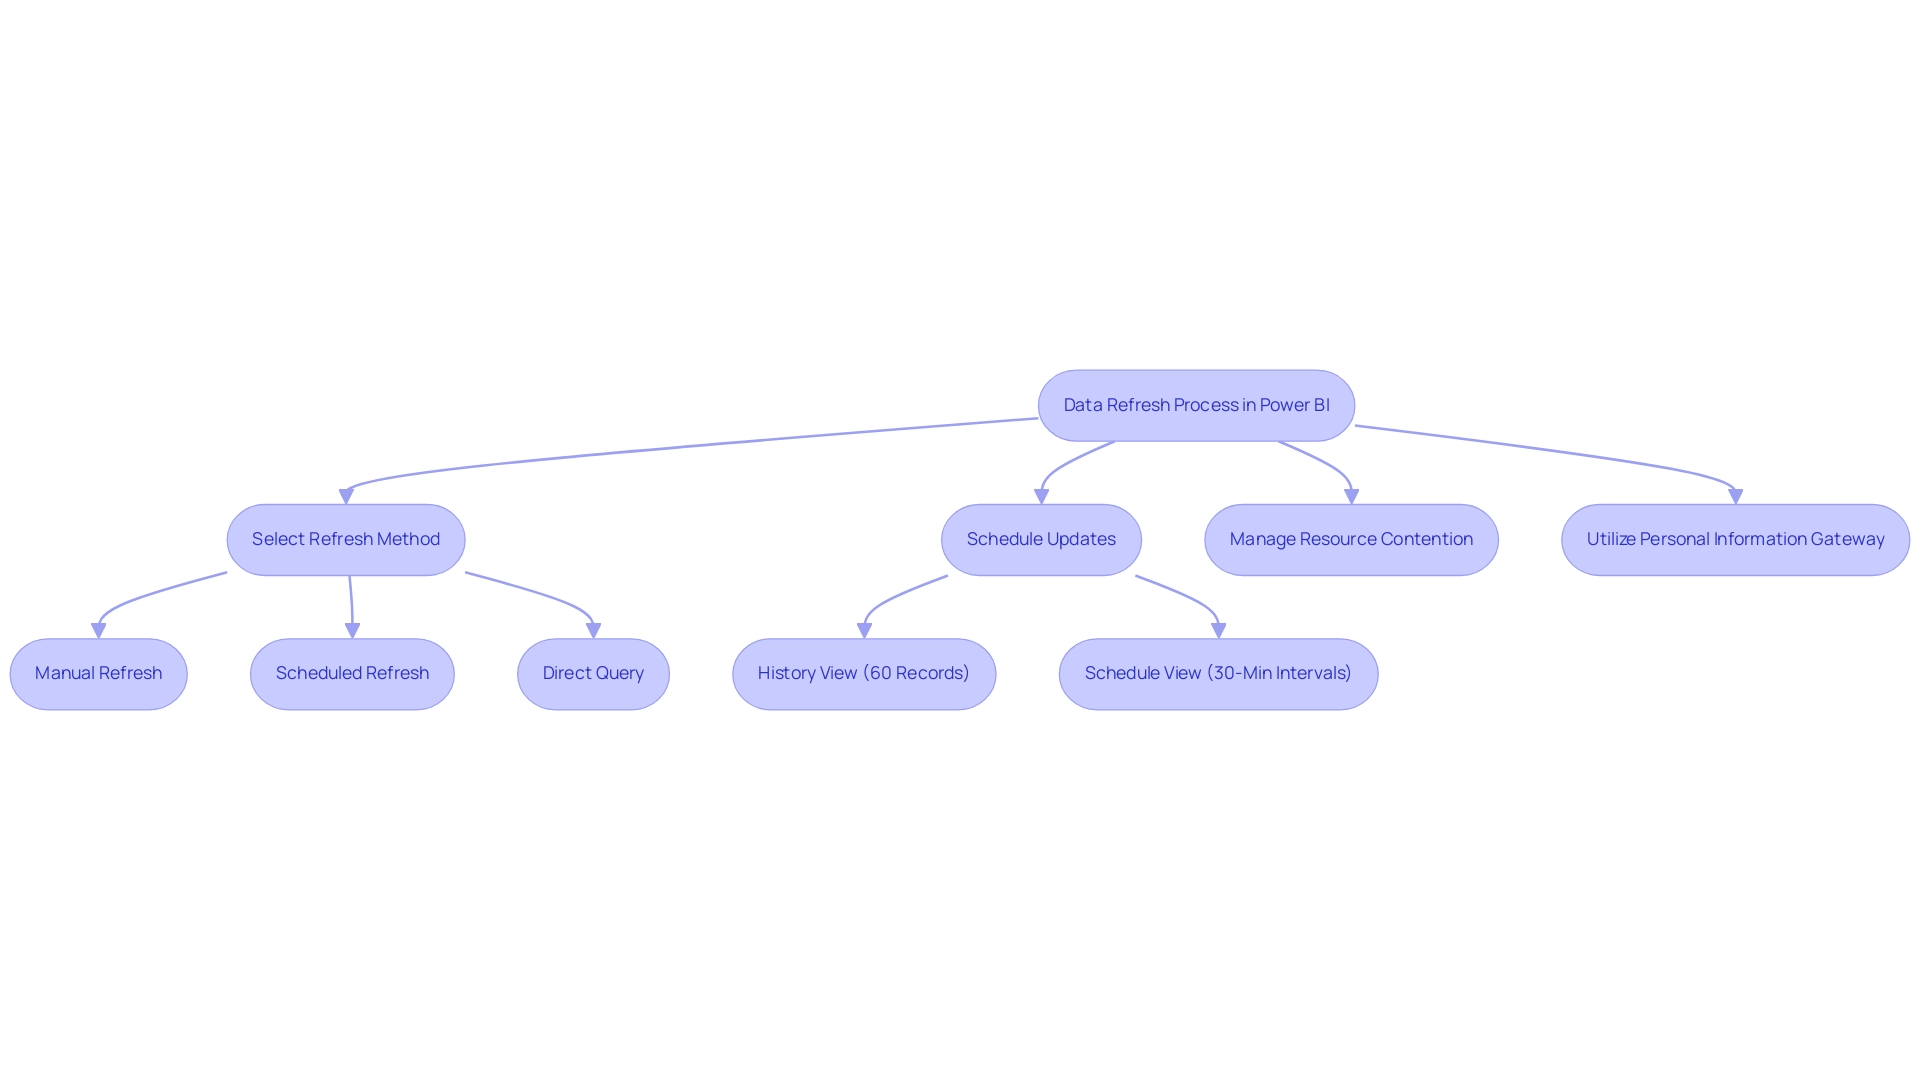
Understanding how to update Power BI data is an essential procedure that guarantees your reports and dashboards represent the most recent information from source systems, facilitating informed decision-making. This process primarily revolves around two types of updates:
- Full update
- Incremental update
A full update replaces all current information, offering a comprehensive upgrade, while an incremental update selectively modifies only the content that has altered since the previous update.
Understanding these distinctions is crucial for effective data management, particularly given the challenges organizations face, such as time-consuming report creation and data inconsistencies. As emphasized in recent discussions, it can take the business intelligence tool up to 60 minutes to update a semantic model when utilizing the ‘Refresh now’ option. This statistic highlights the significance of choosing the suitable update strategy to enhance performance.
As mjmowle noted, ‘We have BI Premium per-user licenses, and while we have found that up to 48 refreshes can be assigned in a 24-hour period, they still appear to be limited to 30-minute intervals.’ This insight offers a real-world viewpoint on the constraints and functionalities of update schedules in BI. Moreover, users are encouraged to monitor update durations closely; if update times exceed two hours, they may need to explore how to update Power BI data by transitioning models to Power BI Premium or implementing incremental updates for larger datasets.
Additionally, users can periodically check for refresh errors and review the refresh history of semantic models to monitor their status. By incorporating Robotic Process Automation (RPA) into your strategy, you can automate repetitive tasks related to information management, further enhancing operational efficiency and alleviating the competitive disadvantage of struggling to extract meaningful insights. Getting acquainted with these concepts will enable you to utilize BI more effectively, enhancing the accuracy of your insights and driving operational growth.
Exploring Refresh Methods: Manual, Scheduled, and On-Demand
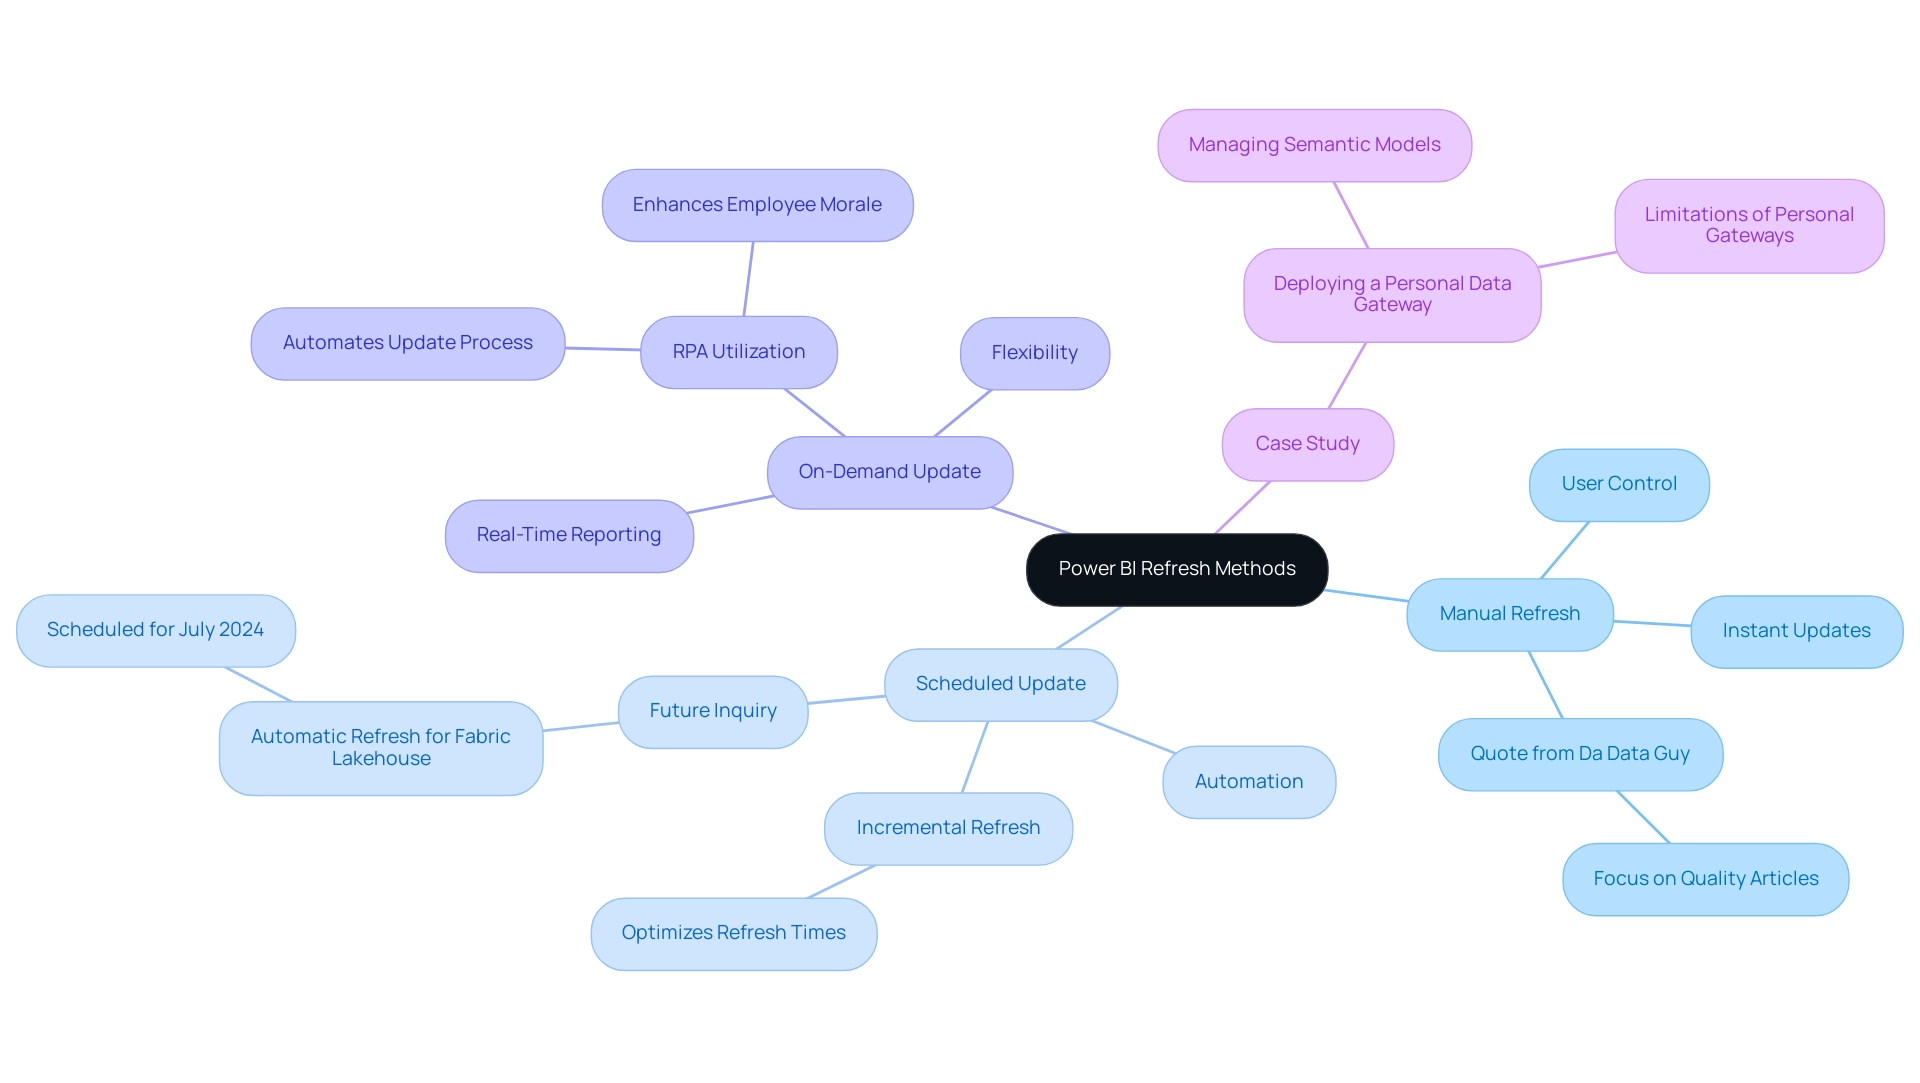
This tool provides three main approaches for how to update Power BI data: manual, scheduled, and on-demand, each customized for various operational requirements, ultimately fostering insights based on information and improving operational efficiency.
-
Manual Refresh: This approach allows users total control, enabling them to refresh their documents at their discretion. By simply clicking the ‘Refresh’ button in either Power BI Desktop or the Power BI Service, users can learn how to update Power BI data to instantly see the most recent information. As mentioned by Da Data Guy, comprehending this process is vital:
I concentrate on crafting high-quality articles that deconstruct each phase of the procedure so you can follow along and learn as well.
This enables teams to make informed choices based on the most up-to-date information. -
Scheduled Update: Perfect for guaranteeing that documents stay up-to-date without requiring user involvement, scheduled update allows individuals to establish specific times for automatic updates. This approach tackles typical obstacles like lengthy document generation and information discrepancies, enhancing update intervals by minimizing the volume of information handled. Incremental updates further improve this approach, reducing the information that requires updating, resulting in quicker update times. Recent statistics indicate that organizations typically schedule refreshes multiple times a day to maintain the accuracy of their reporting. Significantly, as companies prepare for future expansion, there is an imminent inquiry on how to update Power BI data automatically in a BI report linked to Fabric Lakehouse, set for July 2024, emphasizing the importance of scheduled update techniques in future strategies. Incorporating RPA tools such as EMMA RPA and Power Automate can further optimize these processes, improving efficiency and alleviating staffing shortages.
-
On-Demand Update: This approach is ideal for on-the-fly reporting needs, allowing users to update information in real-time based on urgent requirements. It provides flexibility to adapt to changing circumstances and is particularly useful in dynamic operational environments, ensuring that leaders can respond swiftly to new insights. By utilizing RPA, organizations can automate the update process, thus enhancing employee morale by decreasing manual workloads.
A practical example of update methods can be observed in the case study of deploying a personal information gateway. When an enterprise information gateway is unavailable, users can manage their own semantic models without sharing sources, although personal gateways have limitations. Selecting the appropriate update approach depends on your reporting requirements and understanding how to update Power BI data based on how often your information changes.
Optimal methods recommend evaluating your operational needs and adjusting the update strategy correspondingly to enhance efficiency and effectiveness, while also contemplating how RPA can simplify these procedures, converting raw information into actionable insights that foster growth and innovation.
Setting Up Automatic Data Refresh in Power BI
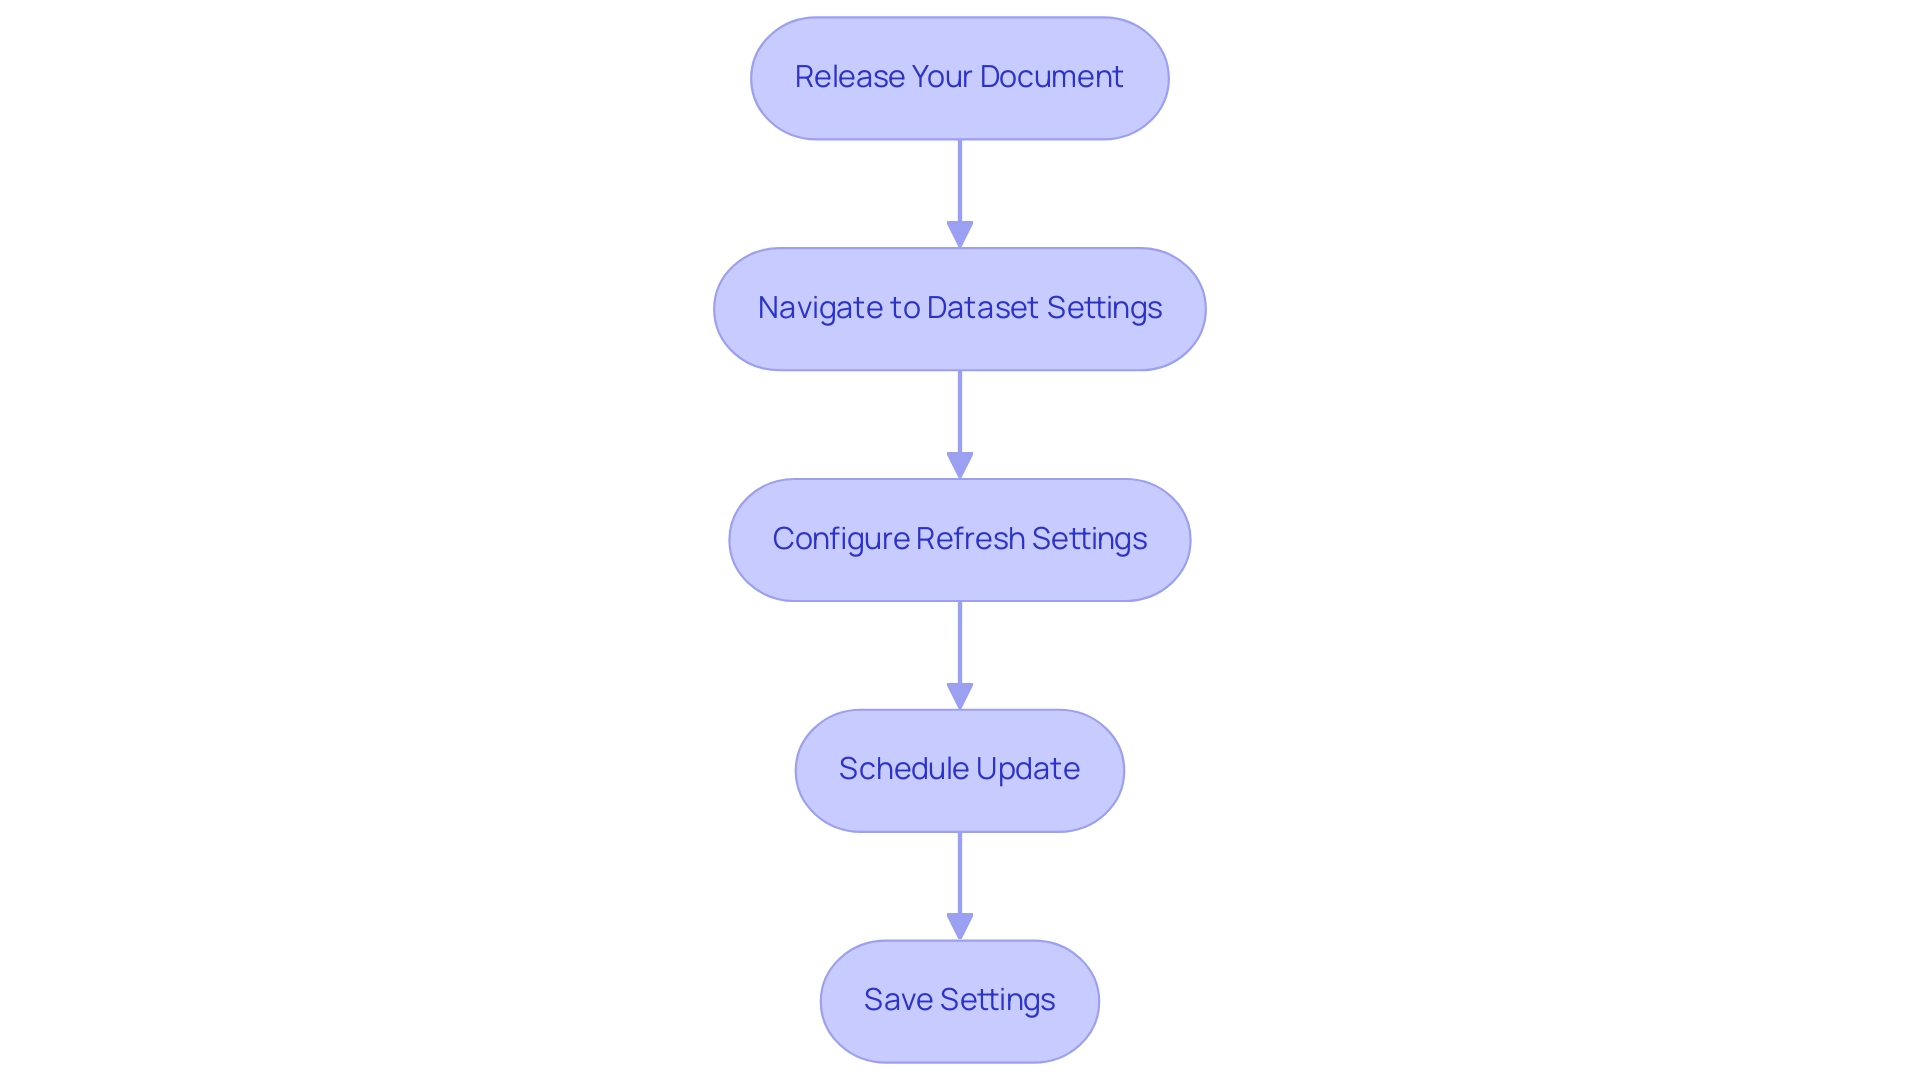
Establishing automated data updates in BI is crucial for sustaining current insights that can facilitate informed decision-making, especially when considering how to update power bi data to address issues such as time-intensive document creation and data discrepancies. Follow these steps to streamline the process:
-
Release Your Document: Start by confirming your BI analysis is shared with the BI Service.
This step is crucial as it enables the renewal functionality, allowing you to leverage the full potential of Business Intelligence. -
Navigate to Dataset Settings: In the Power BI Service, access ‘My Workspace’ or the relevant workspace housing your report. Click on ‘Datasets’ to locate the dataset you wish to refresh automatically.
This guarantees that your information remains consistent and reliable. -
Configure Refresh Settings: Click the ellipsis (…) next to the dataset and select ‘Settings’. Within the ‘Data source credentials’ section, confirm that your credentials are correctly configured to avoid any disruptions.
This step is vital to prevent inconsistencies across reports, which can often lead to confusion and mistrust. -
Schedule Update: Scroll to the ‘Scheduled update’ section. Activate the ‘Keep information updated’ toggle and define your preferred refresh frequency and time zone.
It is important to note that to view report metrics for all dashboards or reports in a workspace, filters must be removed from the report. This customization ensures the data aligns with your operational needs and provides clear, actionable guidance. -
Save Settings: Conclude by clicking ‘Apply’ to save your settings.
Your dataset is now set up to update automatically, enabling you to focus on analysis rather than manual updates.
Recent user feedback indicates that many BI users find documentation complex and often tailored for software engineers rather than end users. This highlights the necessity for clear, practical instructions, as expressed by frequent visitor wolf, who lamented, > I got so lost today!
By following these straightforward steps on how to update power bi data, you can reduce common frustrations and fully utilize BI’s automatic updating features. Utilizing these features not only improves efficiency but is progressively becoming standard, with a significant percentage of BI users choosing automatic refresh to maintain their insights updated.
Furthermore, incorporating RPA solutions like EMMA RPA and Automate can further enhance your reporting processes, alleviating the burden of manual report creation and ensuring information consistency. A case study titled ‘Configuring Scheduled Refresh in BI’ emphasizes how to update power bi data by establishing connectivity between BI and information sources, which is crucial for configuring scheduled refreshes to ensure information remains current.
Troubleshooting Data Refresh Issues in Power BI
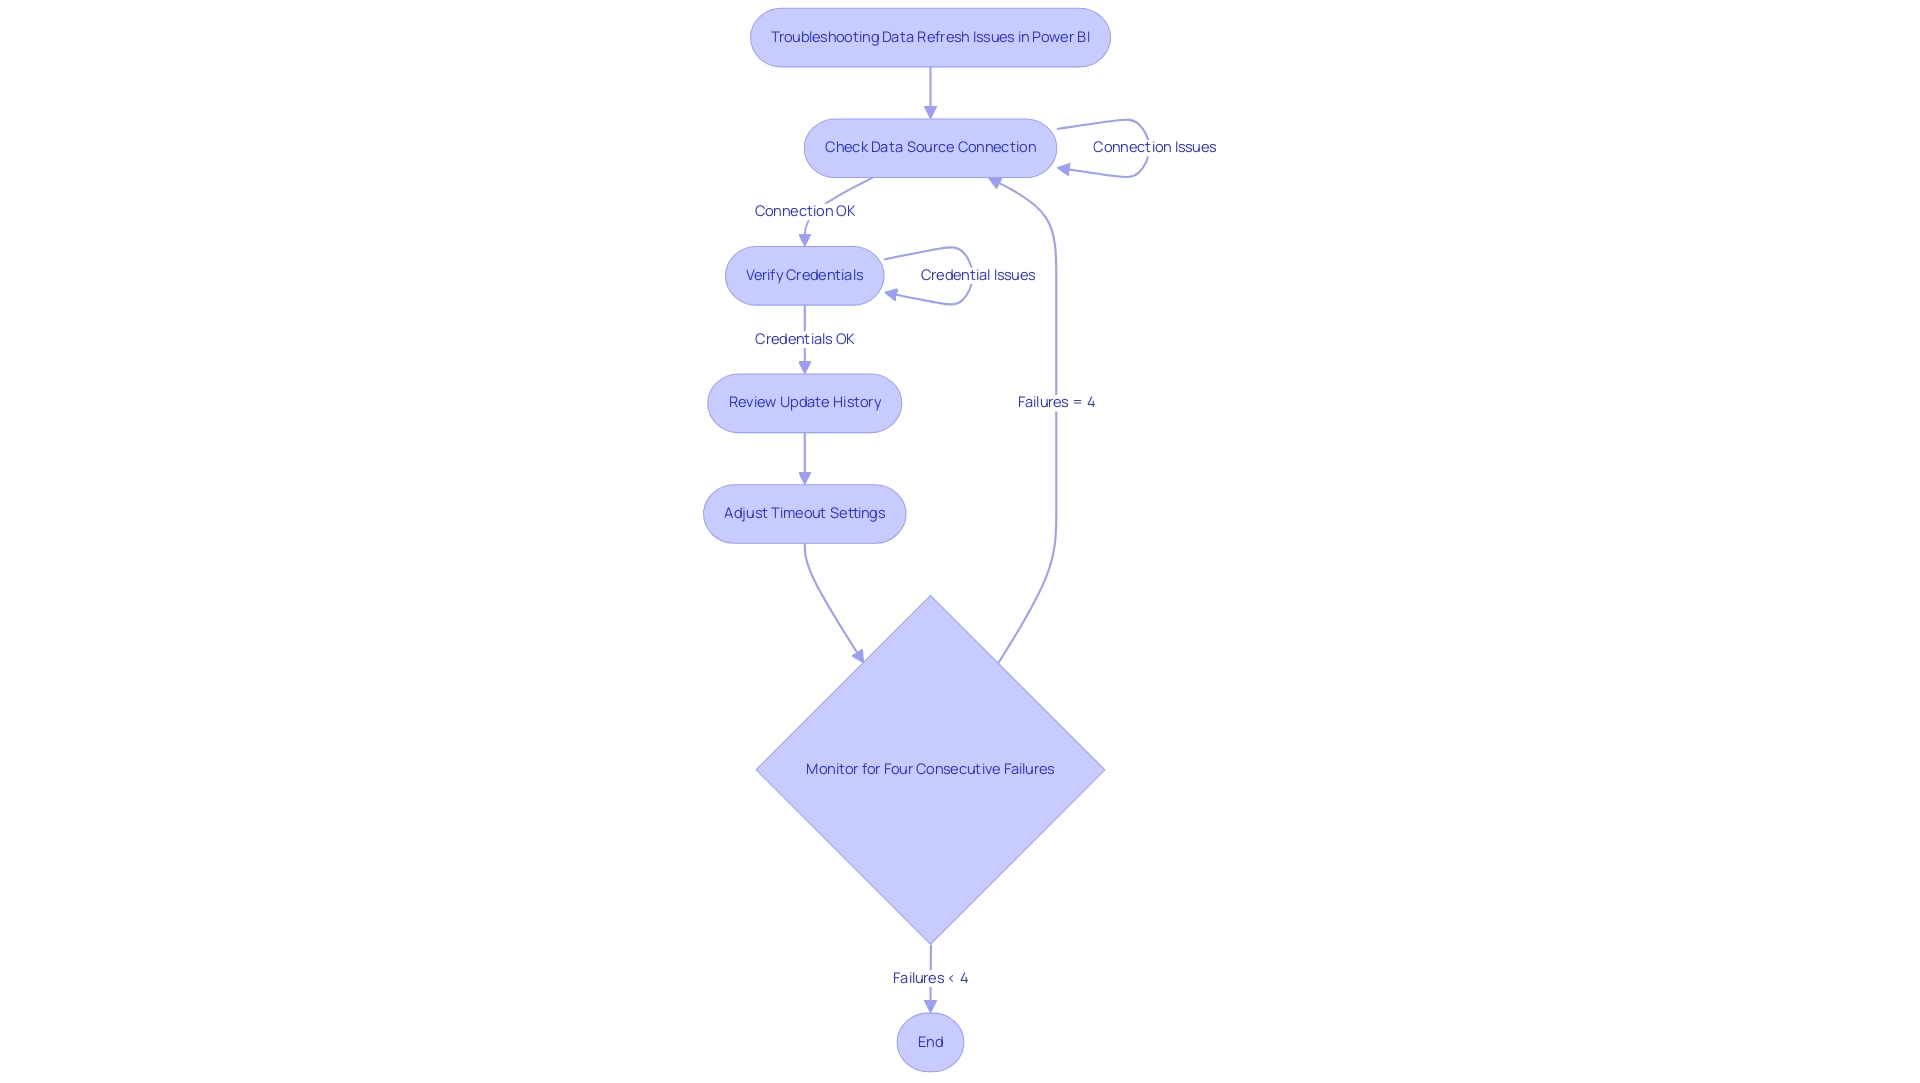
Data refresh in Power BI can often present challenges such as connection errors, credential issues, and timeout errors, which can hinder operational efficiency. Here are strategic steps to troubleshoot these common issues effectively while leveraging Business Intelligence and Robotic Process Automation (RPA) for informed decision-making:
- Check Data Source Connection: First and foremost, ensure that your data source is accessible. Network issues can frequently interrupt the connection, so verify that your information source is online and reachable. This foundational step is crucial for unlocking the full potential of your BI tools.
- Verify Credentials: Navigate to the dataset settings in Power BI Service to confirm that your data source credentials are accurate and have not expired. Keeping current credentials prevents failures and ensures a smooth workflow.
- Review Update History: Utilize the update history feature to monitor past synchronization cycles. This enables you to identify error messages that give vital information about what went wrong during the update. Understanding these errors is vital for improving operational efficiency and productivity.
- Adjust Timeout Settings: If you encounter timeout errors, consider increasing the timeout settings in your information source. Additionally, optimizing your queries can significantly reduce execution time, leading to smoother refresh operations. Efficient query management is a key component in maximizing the effectiveness of your information management strategy.
Moreover, it’s important to recognize that manual, repetitive tasks can significantly slow down your operations and lead to wasted time and resources. By integrating RPA into your data management processes, you can automate these repetitive tasks, enhancing overall efficiency and allowing your team to focus on more strategic initiatives.
It’s essential to note that the BI tool deactivates your update schedule after four consecutive failures, underscoring the importance of proactive monitoring. As BI Super User Uzi 2019 emphasizes, “If you make any changes in your BI desktop file (add a new chart, new column to your table, any DAX), you have to publish every time to BI service.” This reinforces the need for careful management of your Power BI environment.
Additionally, in cases where DirectQuery sources with enforced primary keys are used, adjusting the Assume Referential Integrity setting can optimize query performance. This adjustment can accelerate query execution by utilizing inner joins instead of slower outer joins, further enhancing the efficiency of your update operations.
By applying these troubleshooting measures and monitoring your update status closely, you can effectively address typical update problems and guarantee your operations function seamlessly, ultimately fostering growth and innovation by understanding how to update power bi data.
Best Practices for Effective Data Refresh in Power BI
To ensure effective data refresh in Power BI, consider implementing the following best practices:
-
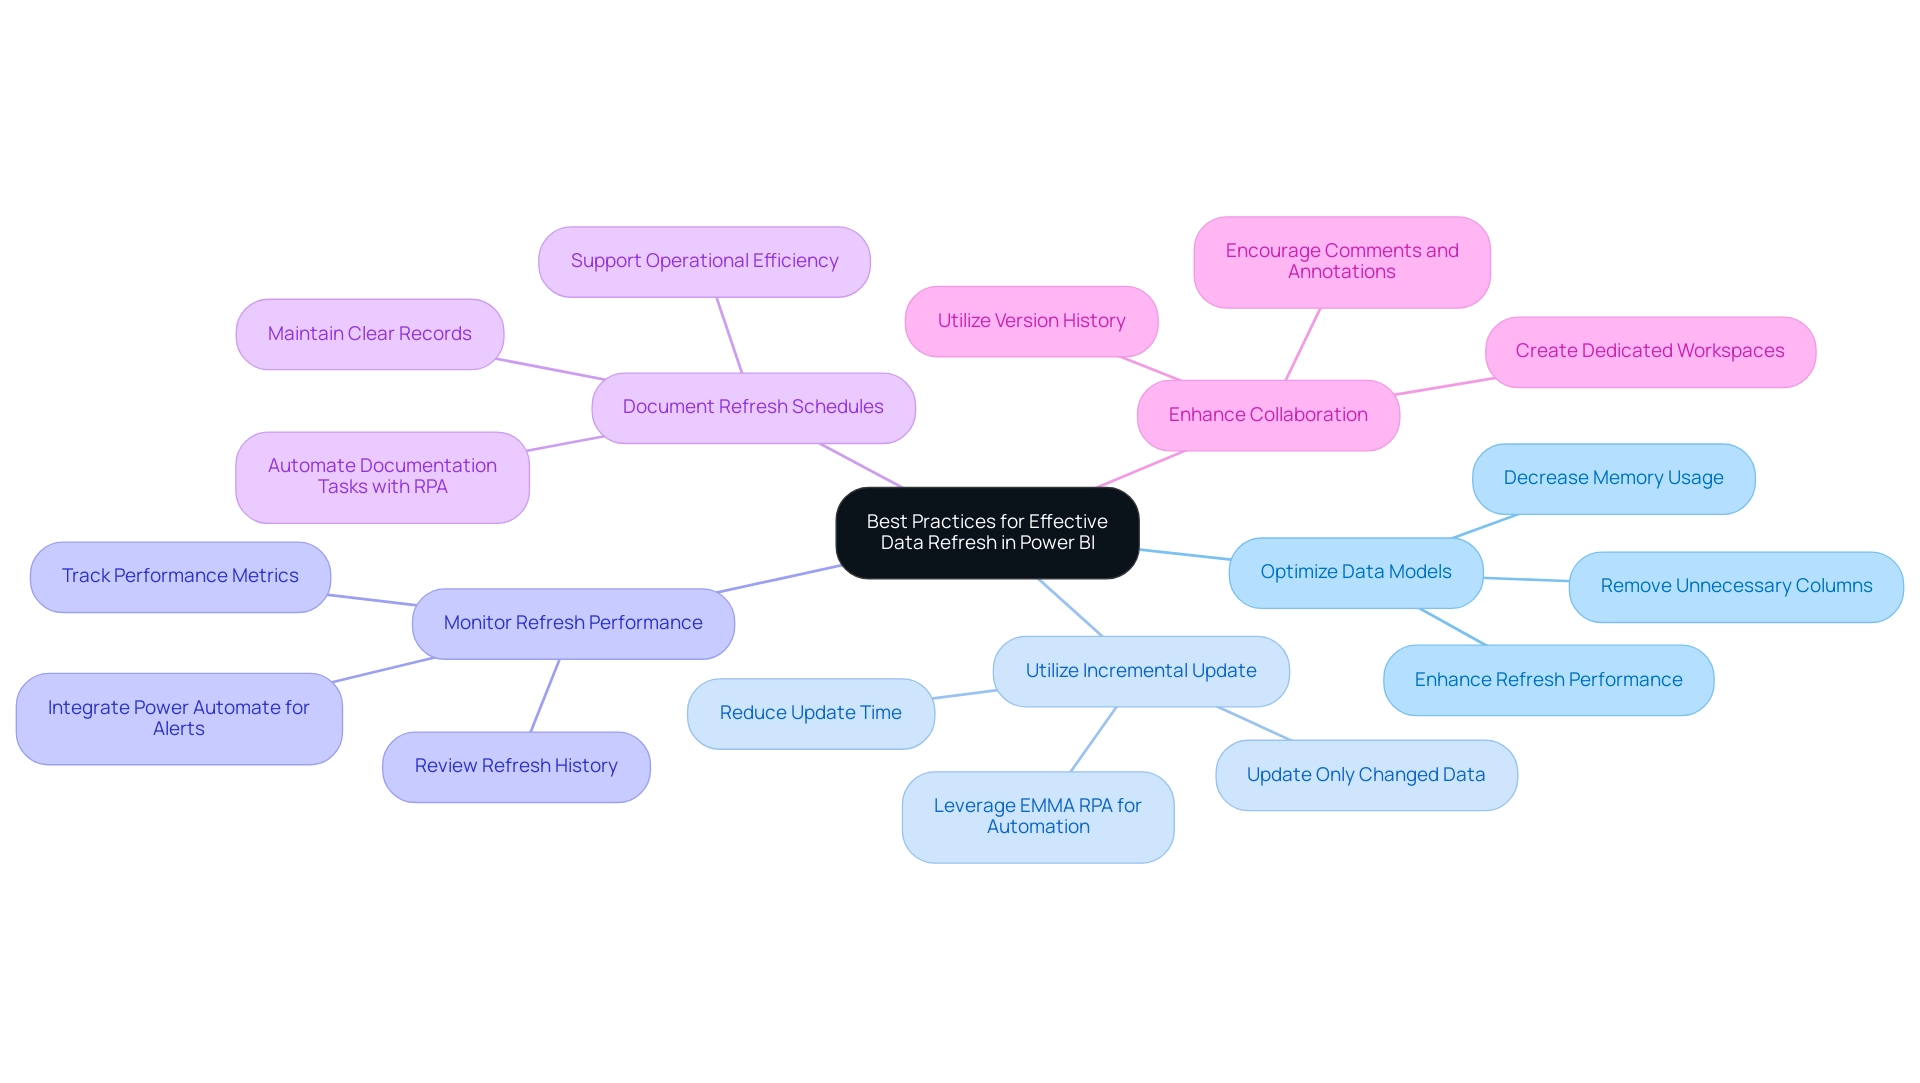
Optimize Data Models: Streamlining your data models is crucial for enhancing refresh performance. Begin by removing unnecessary columns and tables that do not add value to your reports. This not only decreases memory usage but also accelerates the update process. It is essential to remember that during a complete update, your system needs twice the amount of memory that the semantic model requires, making optimization critical for efficient information handling.
-
Utilize Incremental Update: For large datasets, adopting incremental update is a game-changer. This technique shows you how to update Power BI data by modifying only the information that has altered, significantly reducing update time and resource usage. Recent findings show that this approach can lead to substantial efficiency gains in information handling, which can be further enhanced by utilizing EMMA RPA to automate repetitive tasks, such as entry and report generation, ensuring that your team can focus on strategic analysis.
-
Monitor Refresh Performance: Regularly reviewing refresh history and performance metrics is vital. By keeping an eye on these metrics, you can proactively identify and address any issues that may arise, which is essential for understanding how to update Power BI data and ensuring consistent and reliable data availability. Integrating Power Automate can streamline this monitoring process, making it easier to track performance metrics automatically and alert your team to any anomalies in real time.
-
Document Refresh Schedules: Maintaining a well-documented record of your refresh schedules and settings is essential for consistency and easy reference. This practice supports operational efficiency and aids in maintaining a clear overview of your management processes, especially when combined with RPA solutions that automate documentation tasks, reducing the administrative burden on your team.
In the context of collaboration, encouraging comments and annotations within documents enhances teamwork. The case study focusing on collaborative practices illustrates that implementing dedicated workspaces and utilizing version history not only encourages meaningful discussions but also preserves a record of changes. By utilizing EMMA RPA and Automate, organizations can enhance these collaborative practices by automating notifications for updates and ensuring that all team members have access to the most recent information insights, ultimately improving the quality of shared insights.
Moreover, as PaulDBrown, a Community Champion, mentions, “If the Excel file is stored on OneDrive and you configure the source to link to the online file, the update will be automatic… so you can utilize the report online with current information, and thus don’t need to concern yourself with manually updating.” This practical advice emphasizes the significance of utilizing technology, such as EMMA RPA and Automate, to streamline processes related to how to update Power BI data and ensure that high-quality data is consistently available for informed decision-making. By adhering to these best practices, you can significantly enhance your Power BI experience and drive operational efficiency.
Conclusion
In the realm of data-driven decision-making, the significance of effective data refresh methods in Power BI cannot be overstated. This article has explored the key strategies for refreshing data, including:
- Manual refresh
- Scheduled refresh
- On-demand refresh
Each serving specific operational needs. Understanding the nuances of full and incremental refreshes is essential, as it enables organizations to optimize performance and maintain accurate reporting.
Setting up automatic data refresh is a crucial step in ensuring timely insights. By following straightforward steps for configuration and integrating Robotic Process Automation, organizations can streamline their reporting processes and alleviate the burdens of manual updates. Proactive troubleshooting of common data refresh issues ensures smooth operations, minimizing disruptions that can hinder efficiency.
Implementing best practices, such as:
- Optimizing data models
- Leveraging incremental refresh
can dramatically enhance the performance of Power BI reports. Regular monitoring of refresh performance and documenting schedules contribute to a sustainable data management strategy that supports operational efficiency.
Ultimately, by mastering these data refresh techniques and strategies, organizations are empowered to harness the full potential of their data, driving informed decision-making and fostering innovation. Embracing these practices not only enhances data accuracy but also positions organizations to thrive in an increasingly competitive landscape, transforming challenges into opportunities for growth.
Overview
The article provides a step-by-step guide on how to use the ‘Include in Report Refresh’ feature in Power BI, which allows users to specify which data sources are updated during a report refresh. This is crucial for maintaining data accuracy and operational efficiency, as the article emphasizes the importance of timely updates and offers best practices to optimize the refresh process while mitigating common issues.
Introduction
In the dynamic landscape of data analytics, the ability to maintain up-to-date and accurate reports is paramount for informed decision-making. Power BI offers a robust framework for report refresh, ensuring that stakeholders have access to the latest insights.
However, navigating the intricacies of data refresh processes can present challenges that, if left unaddressed, may hinder operational efficiency. This article delves into the essential components of report refresh in Power BI, from understanding the mechanics of scheduled updates to troubleshooting common issues.
By exploring best practices and practical solutions, organizations can enhance their reporting capabilities, streamline workflows, and ultimately drive strategic growth through data-driven insights.
Understanding Report Refresh in Power BI
In BI, the report update procedure is vital for ensuring your reports display the most recent information. This step is fundamental to maintaining integrity, as it guarantees that changes in underlying sources are accurately represented in your visualizations. As mjmowle, an advocate for information precision, noted,
With BI Premium, you can establish update schedules as often as every 15 minutes…
emphasizing the flexibility available to users.
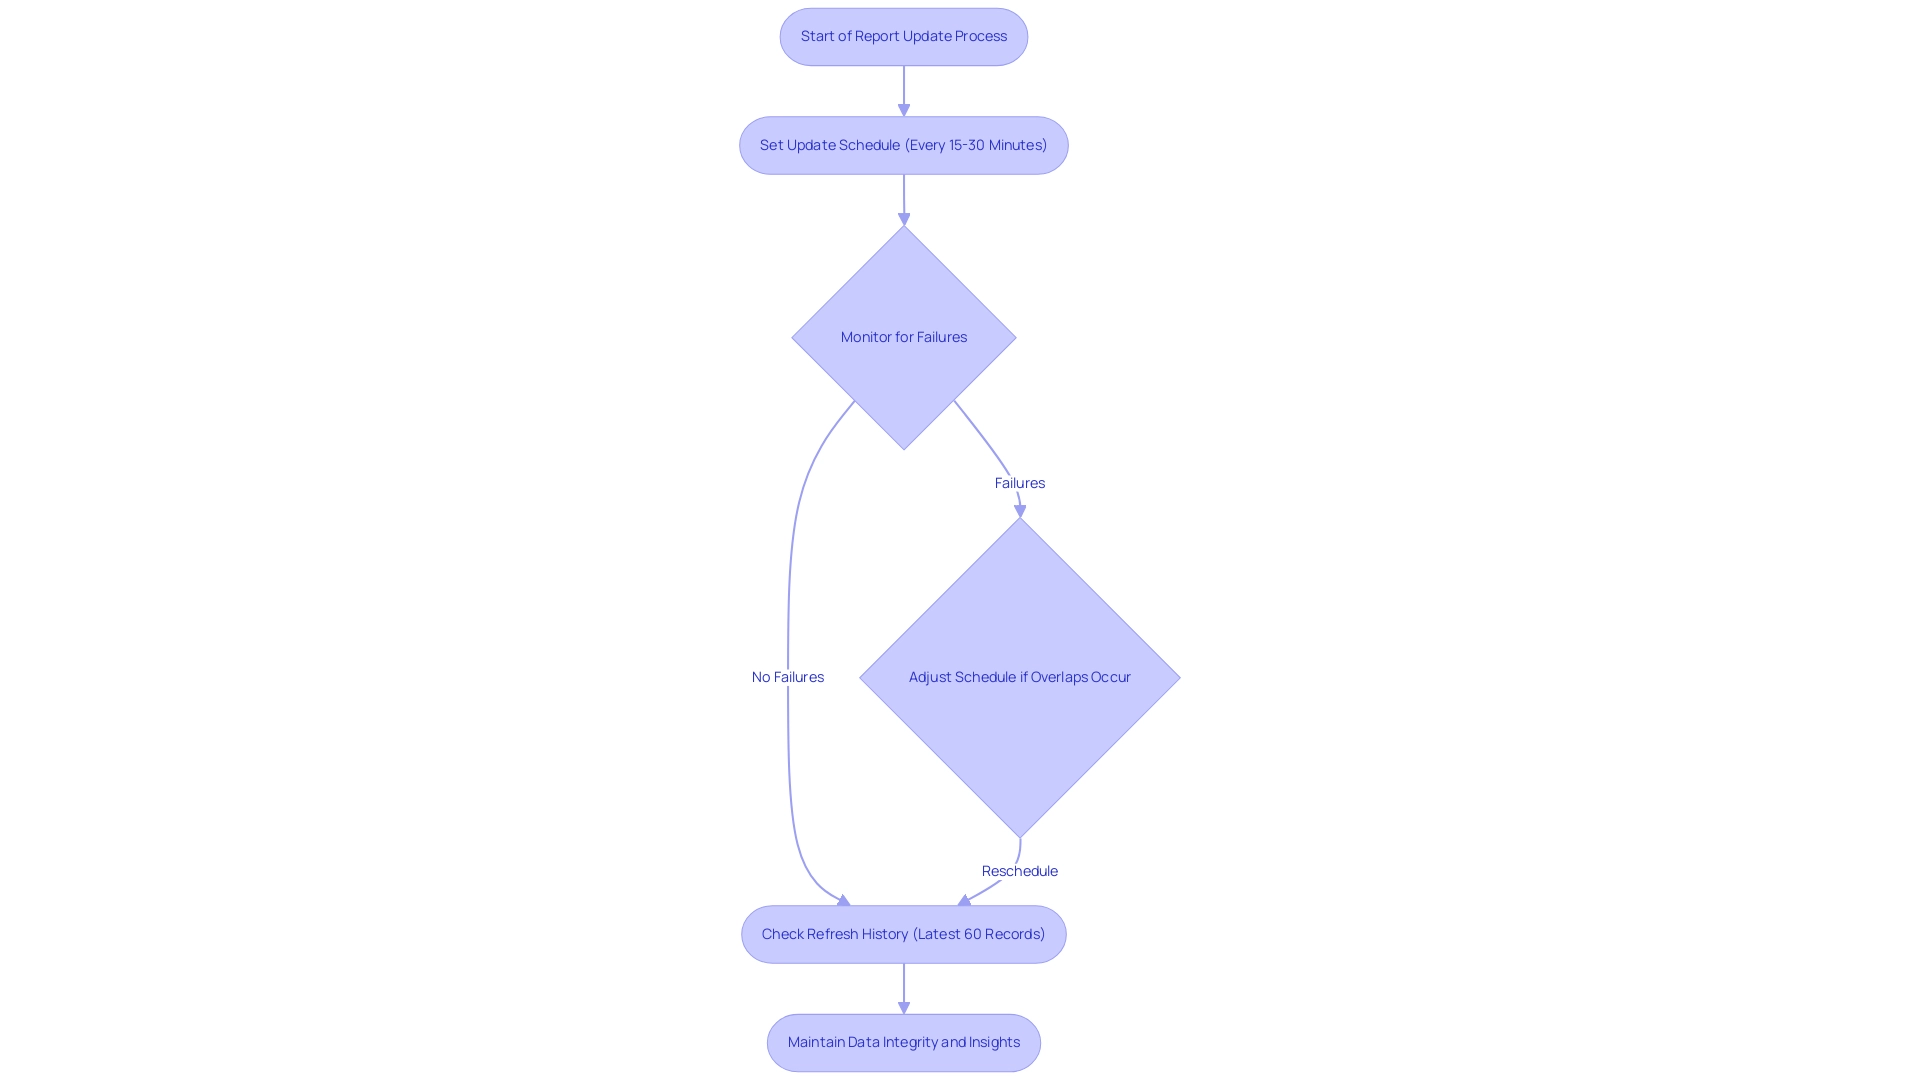
However, while up to 48 refreshes can be assigned within a 24-hour period, they remain confined to 30-minute intervals, highlighting the need for strategic scheduling to avoid time-consuming report creation and inconsistencies. Power BI also disables update schedules after four successive failures, highlighting the significance of overseeing update processes to preserve information integrity and offer practical insights. The lack of clear, actionable steps can leave stakeholders uncertain about the next actions, which reduces the significance of the information presented.
The effect of timely data updates on report accuracy cannot be overstated; it directly influences effective data analysis and informed decision-making. Recent updates to the BI tool’s update features, including a history view showing the latest 60 records of scheduled updates, enhance this process further. Moreover, case studies like ‘Example of Refresh Time Slot Analysis’ reveal how overlapping refresh events can occur when one refresh exceeds its designated time slot, prompting administrators to adjust schedules accordingly and prevent resource contention.
By prioritizing document updates and utilizing Automation software for streamlined workflow efficiency, organizations can ensure their analytics are strong, dependable, and indicative of the latest trends. Moreover, through our no-risk consultation process, we evaluate your automation requirements, calculate ROI, and implement the automation professionally, enabling you to concentrate on utilizing insights instead of dealing with document creation.
What Does ‘Include in Report Refresh’ Mean?
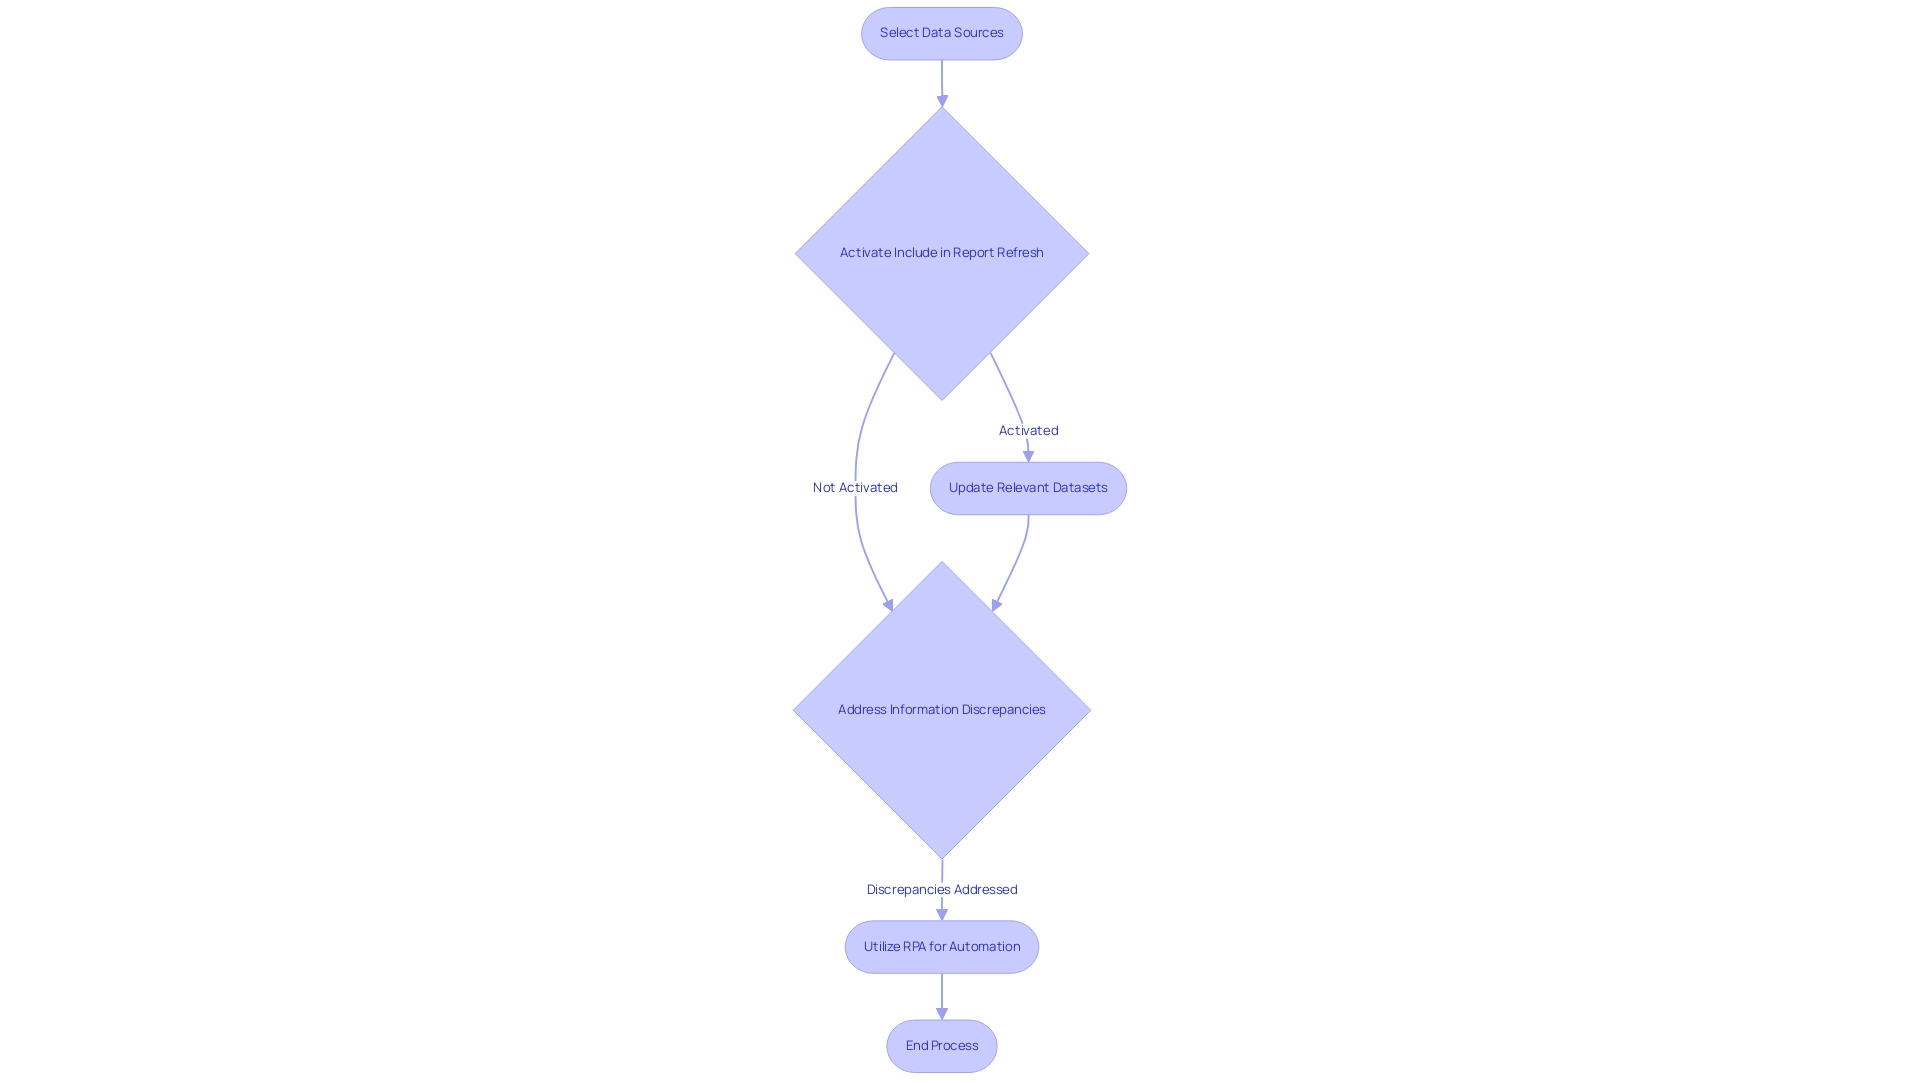
Include in Report Refresh Power BI’ is a pivotal feature that empowers users to dictate which sources are refreshed during a report update. By activating this option, users can ensure that all pertinent datasets receive updates together, facilitating a comprehensive view of the landscape. This becomes particularly advantageous for Directors of Operations Efficiency overseeing numerous information sources, as RPA can simplify this update process, improving operational effectiveness and enabling teams to concentrate on strategic initiatives.
Nonetheless, obstacles like information discrepancies and lengthy documentation processes can impede efficient decision-making. Usage metrics summaries generally update each day with new information, making it essential for operations leaders to remain in sync with the latest insights. If a document or dashboard is not shown, it likely hasn’t been utilized in over 90 days, highlighting the significance of keeping documents updated.
Denis Davydov notes that ‘to include in report refresh, it is used to maintain the old information; you will not extract the information from the source, and you can use it to join with another query if it is old information and you don’t keep fetching the information every time you perform a refresh.’ This capability not only enhances operational efficiency but also supports informed decision-making across the organization. Moreover, the integration of RPA solutions can help automate the report creation process, reducing errors and freeing up teams for more strategic work, ultimately driving business growth.
The case study on Admin Control Over Usage Metrics illustrates how BI administrators can enable or disable usage metrics, ensuring organizations manage data privacy and compliance while leveraging usage metrics for performance insights.
Step-by-Step Guide to Enable ‘Include in Report Refresh’
To effectively enable the ‘Include in Report Refresh’ feature in BI, follow these straightforward steps:
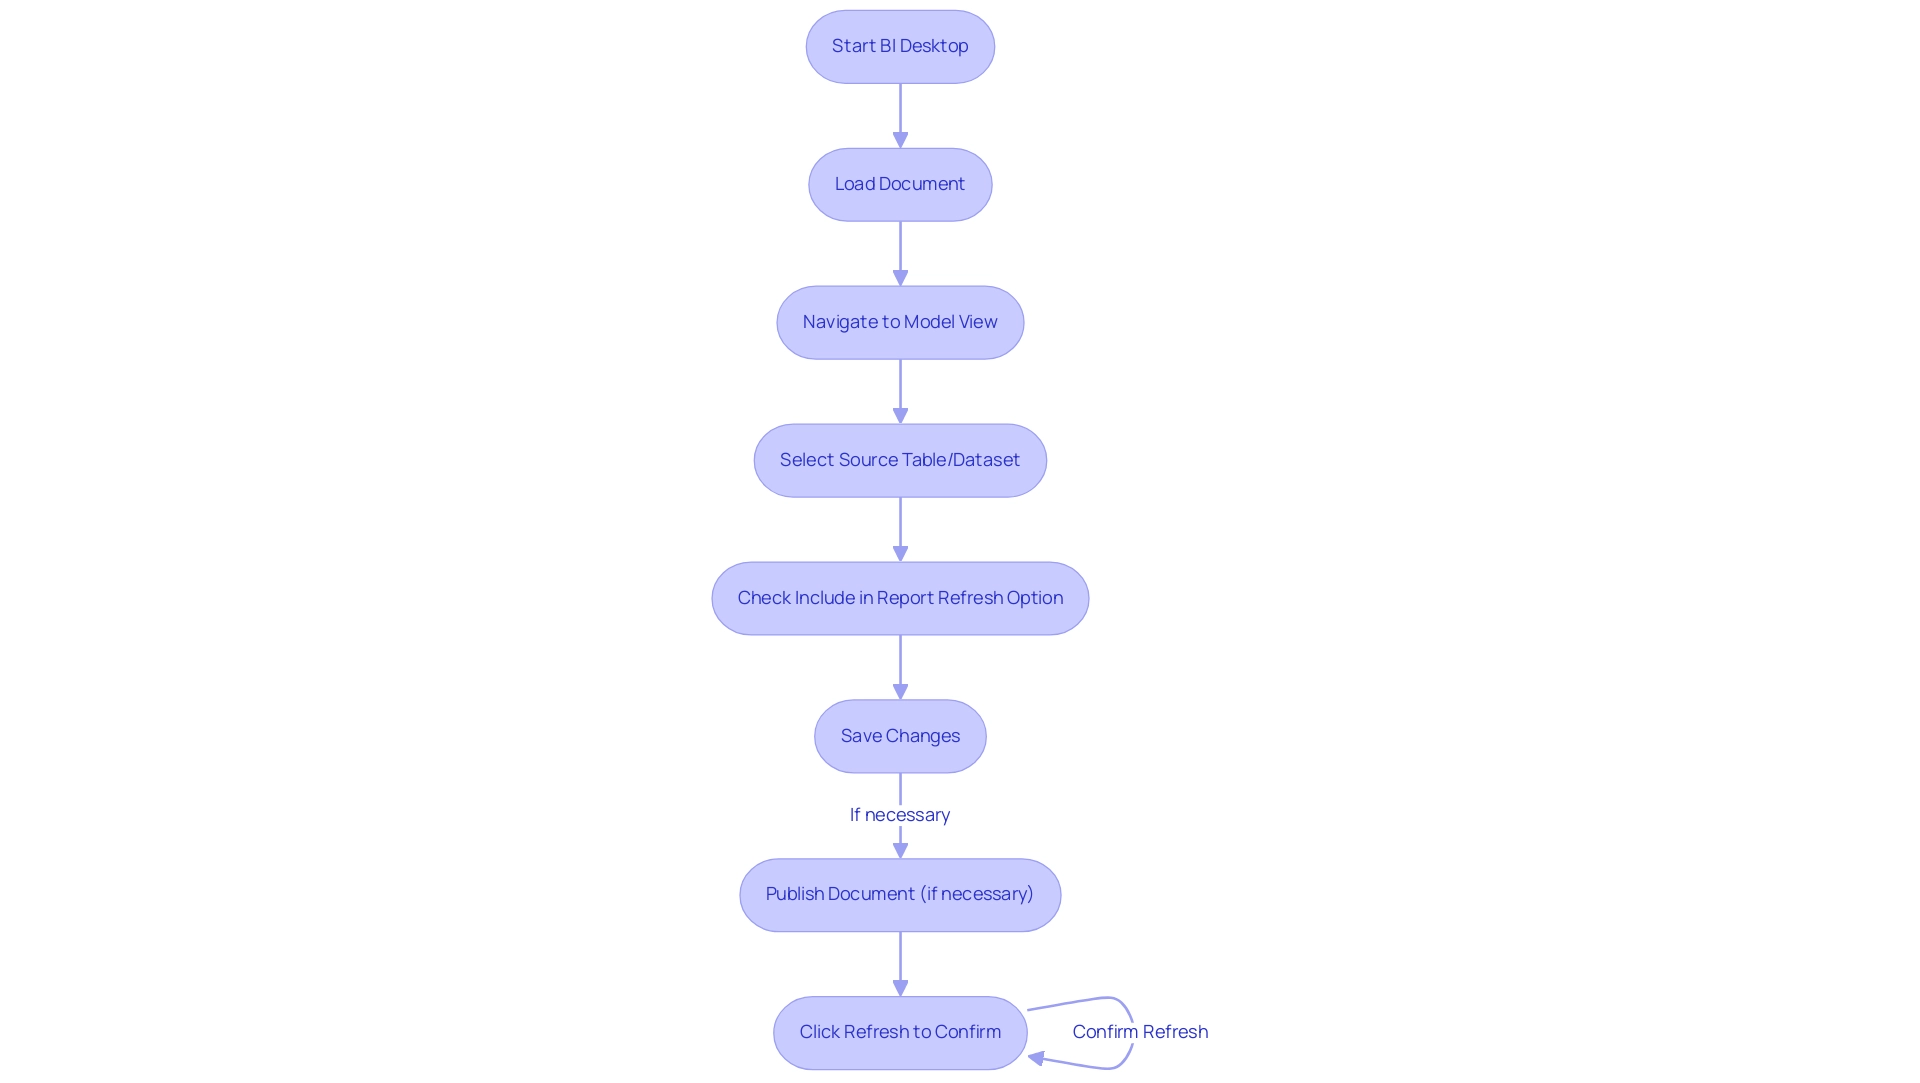
- Start your BI Desktop application and load the document you intend to modify. Click on the ‘Model’ icon located in the left sidebar to navigate to the ‘Model’ view.
- Choose the particular source you want to incorporate in the update by clicking on the relevant table or dataset. In the properties pane, locate the option to ‘include in report refresh power bi’ and check the box next to it to activate it. Save your changes and, if necessary, publish the document to Power BI Service to make it accessible. To confirm that the refresh operates as designed, go to the ‘Home’ tab and click on ‘Refresh’, making sure that the chosen information sources are updated appropriately.
By following these steps, you improve your reports’ precision and relevance, tackling common issues like inconsistencies and ensuring your insights are timely and actionable. This alignment with the latest information trends and insights supports informed decision-making that drives operational efficiency and business growth. Furthermore, think about checking the 12-minute tutorial on creating date tables in BI, which can further enhance your information management processes.
As Iason Prassides emphasizes, mastering features like DAX in Business Intelligence is crucial for customizing and optimizing key performance indicators (KPIs), especially when managing data refresh settings. Moreover, Douglas Rocha’s case study on utilizing statistical measures in Business Intelligence demonstrates how these concepts can be applied in real-world situations, emphasizing the significance of incorporating strong statistical analysis into your documents. To further enhance operational efficiency, consider leveraging RPA solutions like EMMA RPA and Automate, which can automate repetitive tasks and improve overall workflow, ensuring that your data-driven insights are not only accurate but also actionable.
Troubleshooting Common Refresh Issues in Power BI
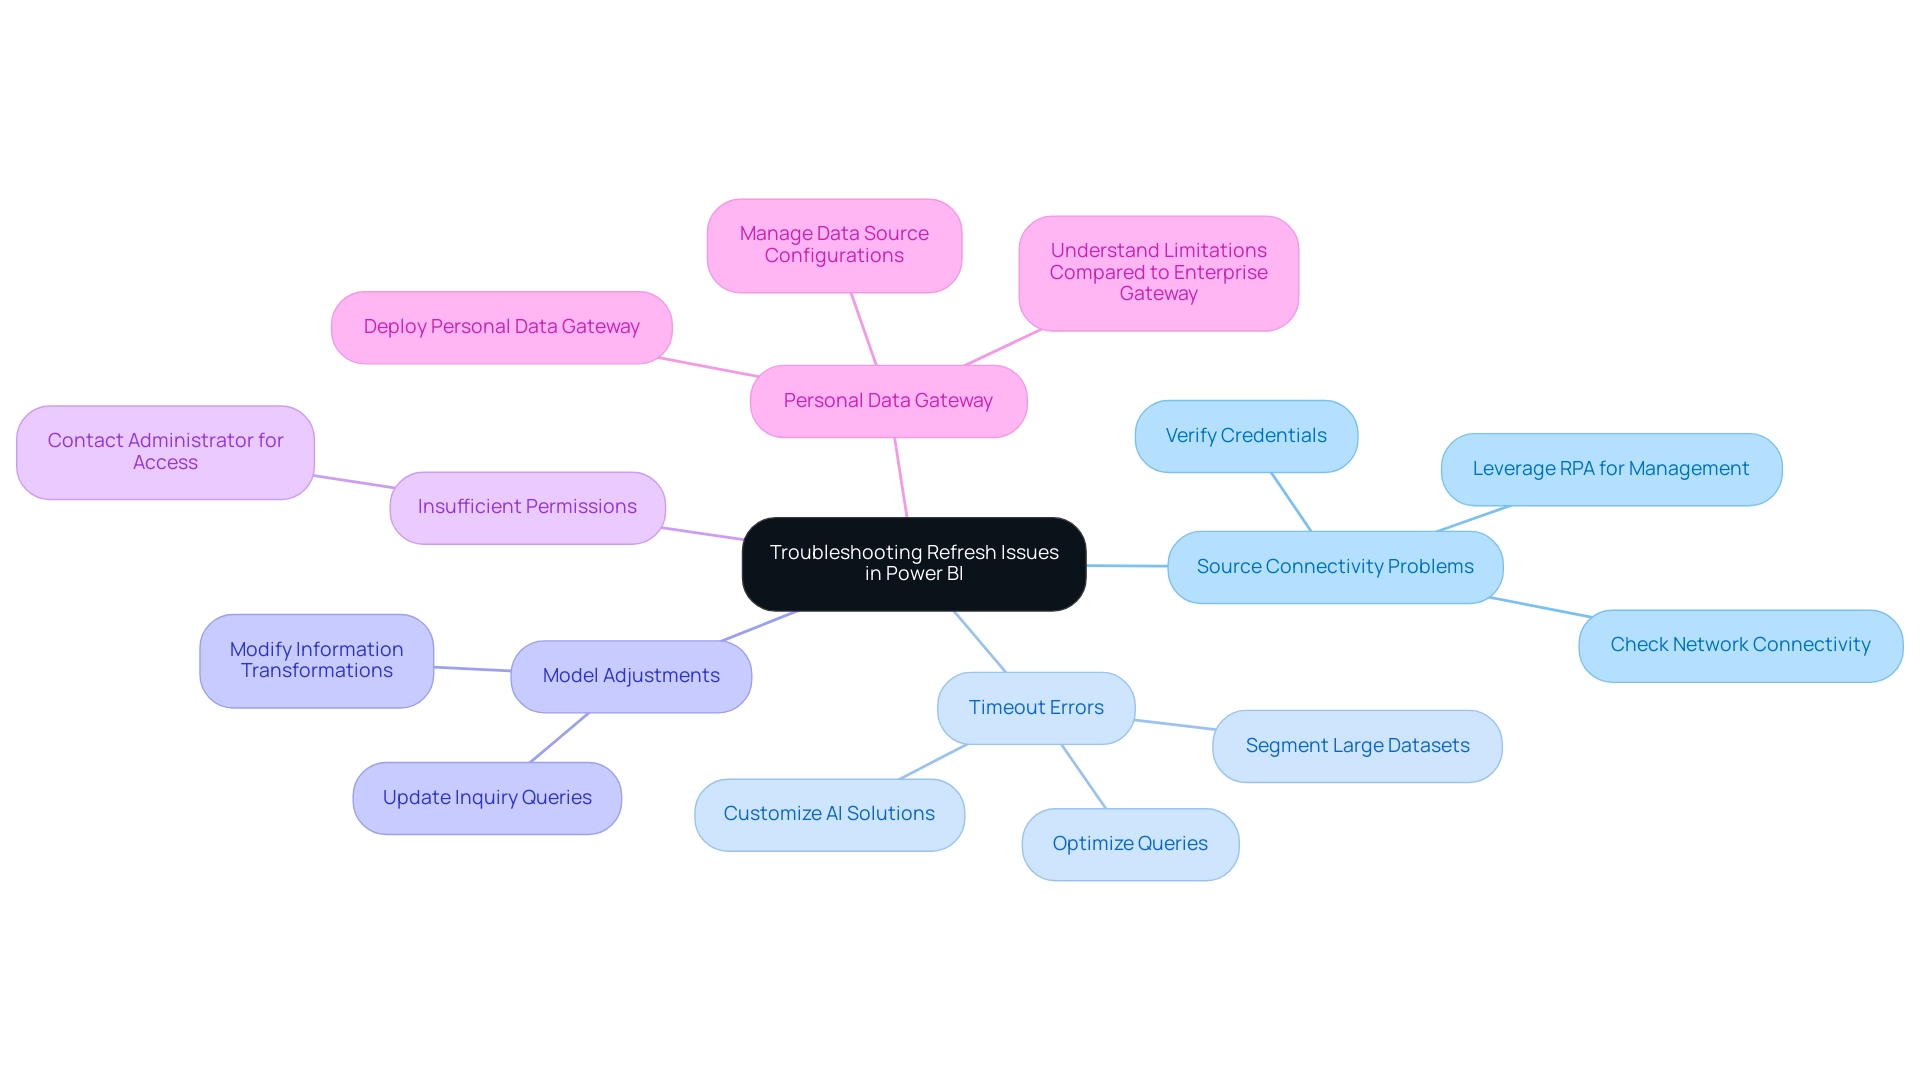
When working with BI, it is important to include in report refresh Power BI several common issues that users often encounter, as these can hinder efficiency and lead to wasted time and resources. Here are key challenges and effective solutions:
-
Source Connectivity Problems: Ensuring that all sources are accessible and credentials are correctly configured is crucial. If issues arise, check network connectivity and permissions, as Power BI may deem a semantic model inactive after just two months of inactivity. Maintaining regular user engagement with your dashboards is essential. By proactively managing access and connectivity, you can leverage Robotic Process Automation (RPA) to streamline these efforts and prevent interruptions in your information flow, thus mitigating the impact of manual, repetitive tasks.
-
Timeout Errors: Extended refresh times can lead to timeout errors. To address this, consider optimizing your queries or segmenting large datasets into smaller, more manageable chunks, enhancing performance and reliability. Customizing AI solutions can also help in improving these processes to better align with your business objectives.
-
Model Adjustments: Modifications to the underlying structure require corresponding updates to inquiry queries. It’s crucial to examine and modify information transformations to align with the updated model, ensuring consistency and precision in your documents, thus leveraging Business Intelligence for informed decision-making.
-
Insufficient Permissions: Lack of necessary permissions can obstruct access to information sources. If you encounter this issue, contact your administrator to secure the required access, enabling seamless data retrieval and allowing your team to focus on more strategic tasks.
-
Personal Data Gateway: For users without access to an enterprise gateway, deploying a personal data gateway can be a viable solution for managing data source configurations directly. While it has limitations compared to an enterprise gateway, it allows individual management of semantic models, helping to mitigate connectivity issues.
By identifying these common challenges and implementing the suggested troubleshooting strategies, you can effectively resolve refresh problems and include in report refresh Power BI to ensure that your reports remain accurate and up-to-date. Additionally, the difficulty in extracting meaningful insights from your BI dashboards can leave your business at a competitive disadvantage. Consider the insights of industry expert Jeff Shields, who emphasizes innovative approaches to data connectivity:
I wonder if you could ZIP them and read them into a dataflow from a OneDrive/SharePoint folder.
This emphasizes the potential for innovative solutions in optimizing your BI experience.
Best Practices for Efficient Report Refresh in Power BI
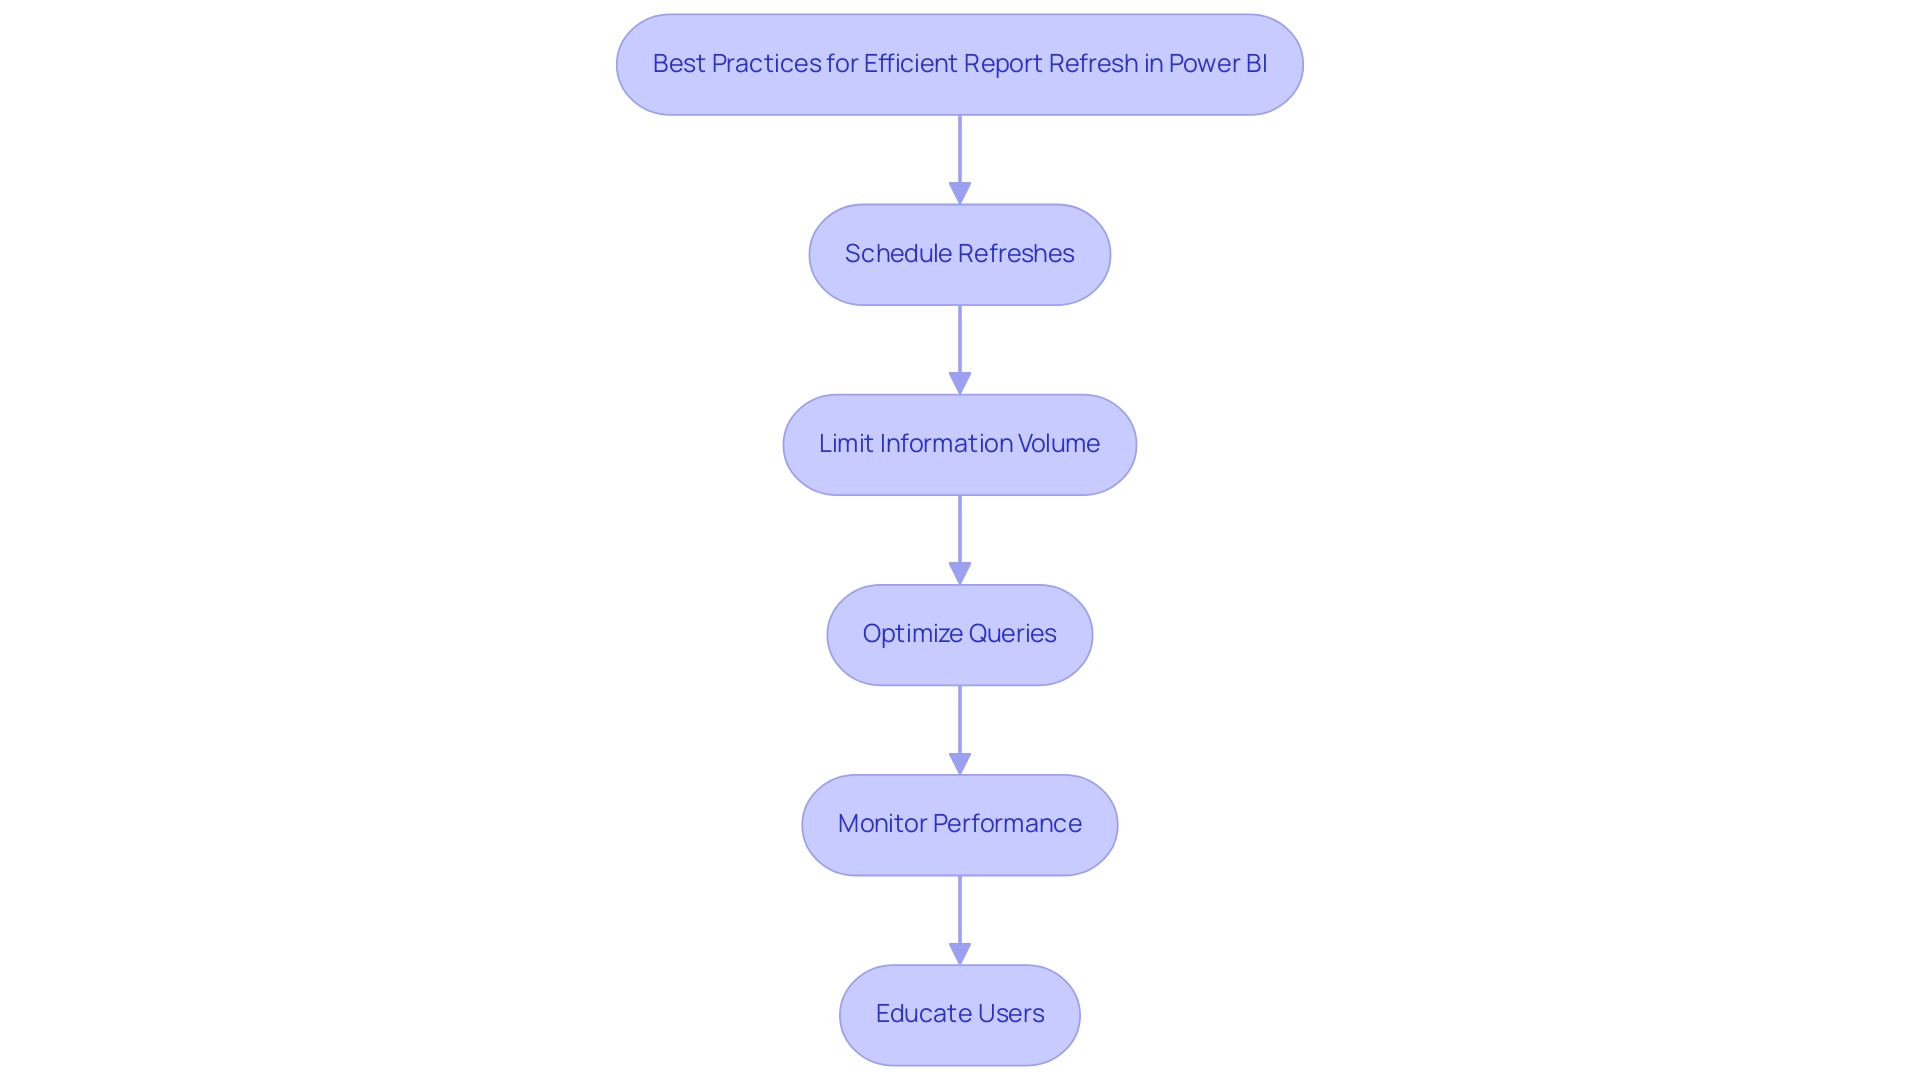
To optimize your refresh processes in Power BI, implementing the following best practices will significantly enhance efficiency while leveraging the power of Robotic Process Automation (RPA):
-
Schedule Refreshes: Conduct scheduled refreshes during off-peak hours to minimize performance impacts on users accessing documents. This approach not only improves performance but also enhances user experience, aligning with RPA’s goal of streamlining operations.
-
Limit Information Volume: Concentrate on including only the essential details in your reports. By utilizing filters to limit information where possible, you can dramatically decrease the quantity of content processed during refreshes, leading to quicker load times. For example, transforming the Matrix visual into a Table visual can decrease load time by around 15 seconds, showcasing the effect of visual optimization on update efficiency.
-
Optimize Queries: Carefully review your queries for efficiency. Leveraging query folding and avoiding complex transformations can prevent unnecessary delays in refresh times. As experts advise,
Before joining columns, always clean your information by trimming whitespace and ensuring the values are in a compatible format.
This practice alleviates issues that can arise during data processing and supports the data-driven insights necessary for business growth, while also minimizing errors that can stem from unoptimized queries. -
Monitor Performance: Regularly evaluate performance metrics in Power BI Service to identify any bottlenecks or areas that need enhancement. This proactive approach helps in maintaining optimal performance levels. For example, understanding row, query, and filter context in DAX can be challenging, but simplifying your explanations and using clear examples can demonstrate context behavior effectively, enhancing operational efficiency and reducing wasted resources.
-
Educate Users: Provide training to users on best practices for interacting with documents. This education aids in minimizing unnecessary update requests, ultimately sustaining overall system performance and ensuring that your organization can leverage insights effectively. By addressing common challenges associated with manual workflows, such as time-consuming report creation and data inconsistencies, you can further enhance the effectiveness of your reporting processes.
By adopting these strategies, you can significantly enhance the efficiency of your report refresh processes, ensuring that your Power BI reports remain timely and reliable while also integrating the principles of RPA and Business Intelligence, thus driving data-driven insights that contribute to your business growth and strategic objectives.
Conclusion
Maintaining up-to-date and accurate reports in Power BI is crucial for effective decision-making and operational efficiency. The article highlighted essential elements of the report refresh process, emphasizing the importance of scheduled updates and the utility of features like ‘Include in Report Refresh.’ By implementing a strategic approach to refresh scheduling, organizations can ensure that their reports reflect the latest data, thus enhancing the integrity of their insights.
Common challenges, such as data source connectivity issues and timeout errors, can disrupt the refresh process. However, the article provided practical solutions to troubleshoot these issues effectively. By prioritizing regular monitoring and optimizing data queries, teams can mitigate potential disruptions, ensuring that their data remains reliable and actionable.
Incorporating best practices, such as limiting data volume and educating users, can further streamline the report refresh process. These strategies not only improve performance but also empower teams to focus on strategic initiatives rather than administrative tasks. Ultimately, by leveraging the capabilities of Power BI and adopting a proactive approach to report refresh, organizations can drive growth through timely, data-driven insights that support informed decision-making and operational excellence.
Overview
To share Power BI reports outside your organization, several methods are available, including using the “Publish to Web” feature, exporting to PDF or PowerPoint, and sharing directly via the BI Service. Each method has unique considerations regarding security, interactivity, and audience needs, which are crucial for ensuring effective collaboration while protecting sensitive information.
Introduction
In the realm of data-driven decision-making, sharing insights from Power BI reports can be a game-changer for organizations seeking to enhance collaboration and transparency. With a myriad of methods available, from public links to secure email updates, each approach presents unique advantages and considerations that can significantly impact how data is utilized.
As businesses navigate the complexities of external sharing, understanding the nuances of permissions, roles, and best practices becomes essential. This article delves into effective strategies for sharing Power BI reports, empowering organizations to overcome common challenges while ensuring data security and fostering informed decision-making.
By exploring practical solutions and real-world examples, leaders can unlock the full potential of their data, driving growth and innovation in an increasingly competitive landscape.
Exploring Different Methods to Share Power BI Reports
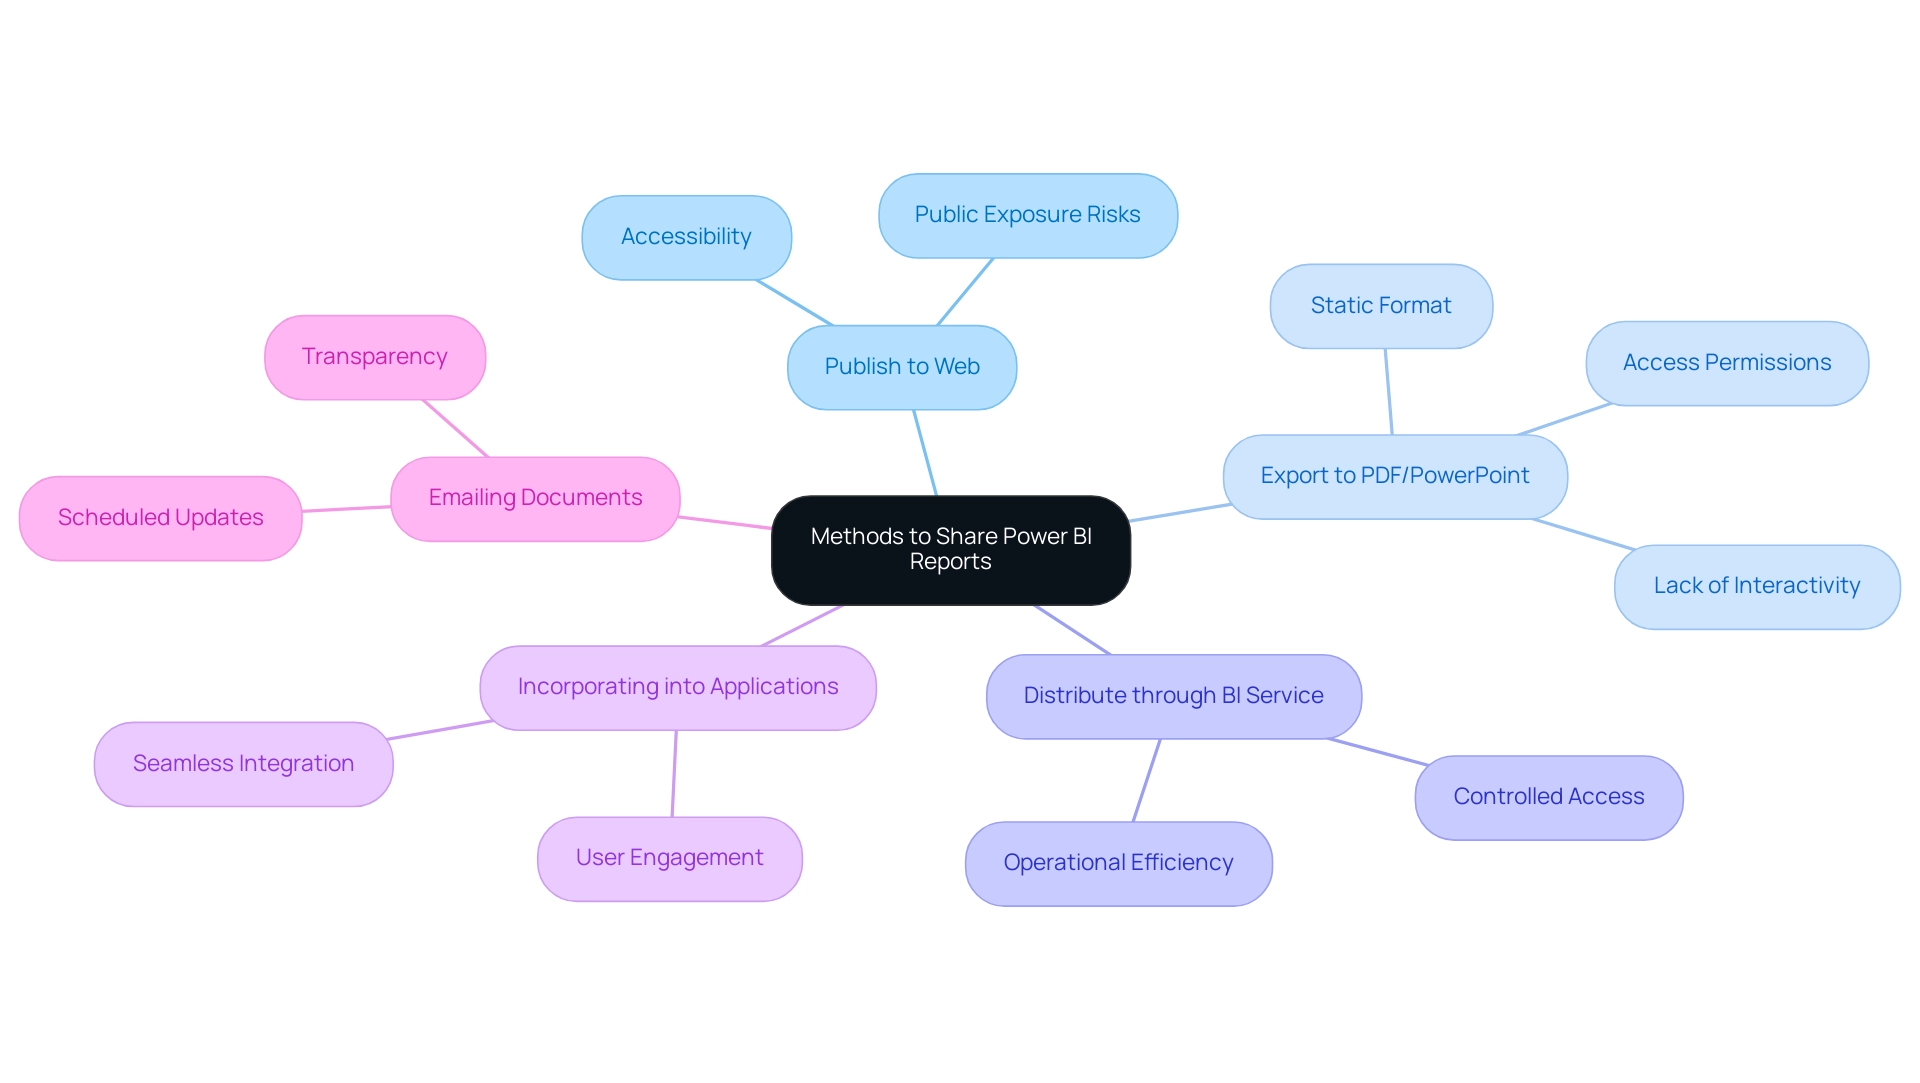
There are various methods on how to share Power BI report outside organization, each tailored to different needs and scenarios. Here’s a breakdown of the primary options available:
-
Publish to Web: This feature enables you to create a public link to your document, making it accessible to anyone.
While convenient, it’s crucial to be mindful that this method exposes your information to the public, which may not be suitable for sensitive content. -
Export to PDF or PowerPoint: Exporting your document to PDF or PowerPoint format is an effective way to share static formats.
However, this option lacks interactivity, limiting engagement with the data. It’s essential to recognize that individuals require access to the document to see it within the presentation software, and the same permissions apply as in Business Intelligence. -
Distribute through BI Service: For individuals who utilize BI, insights can be shared directly through the BI platform.
By including individuals or groups, you retain authority over who views the documents, ensuring that sensitive information stays secure. This method enhances operational efficiency by streamlining how data-driven decisions are made within your organization. -
Incorporating into Applications: Organizations can improve experience by integrating BI insights directly into custom applications utilizing the BI API.
This seamless integration enables individuals to engage with documents within familiar interfaces, fostering involvement and actionable insights without the necessity for additional navigation. -
Emailing Documents: The ‘Subscribe’ feature enables scheduled email updates of your documents to external users with Business Intelligence accounts.
This approach is beneficial for keeping stakeholders updated without needing them to access the BI service, thus fostering a culture of transparency and ongoing information sharing.
Each sharing method has unique use cases and considerations. For example, using BI shared datasets can centralize your data model for various documents, enhancing consistency and diminishing redundancy—crucial elements in addressing issues such as data inconsistencies and time-consuming document creation.
Moreover, by effectively addressing these challenges, organizations can leverage insights from BI dashboards to drive growth and innovation.
A pertinent case study is the creation and sharing of applications in BI, which enables report designers to share collections of reports and dashboards with specific user groups while maintaining control over the content.
As Grant Gamble, proprietor of G Com Solutions, highlights, “I operate a firm named G Com Solutions, focusing on BI training and consultancy, assisting businesses in mastering analytics.”
This mastery can significantly impact how effectively you share insights, leading to informed decision-making that drives growth and innovation.
Therefore, carefully evaluate your audience and information type when selecting the most appropriate sharing method.
Step-by-Step Guide to Sharing Power BI Reports Externally
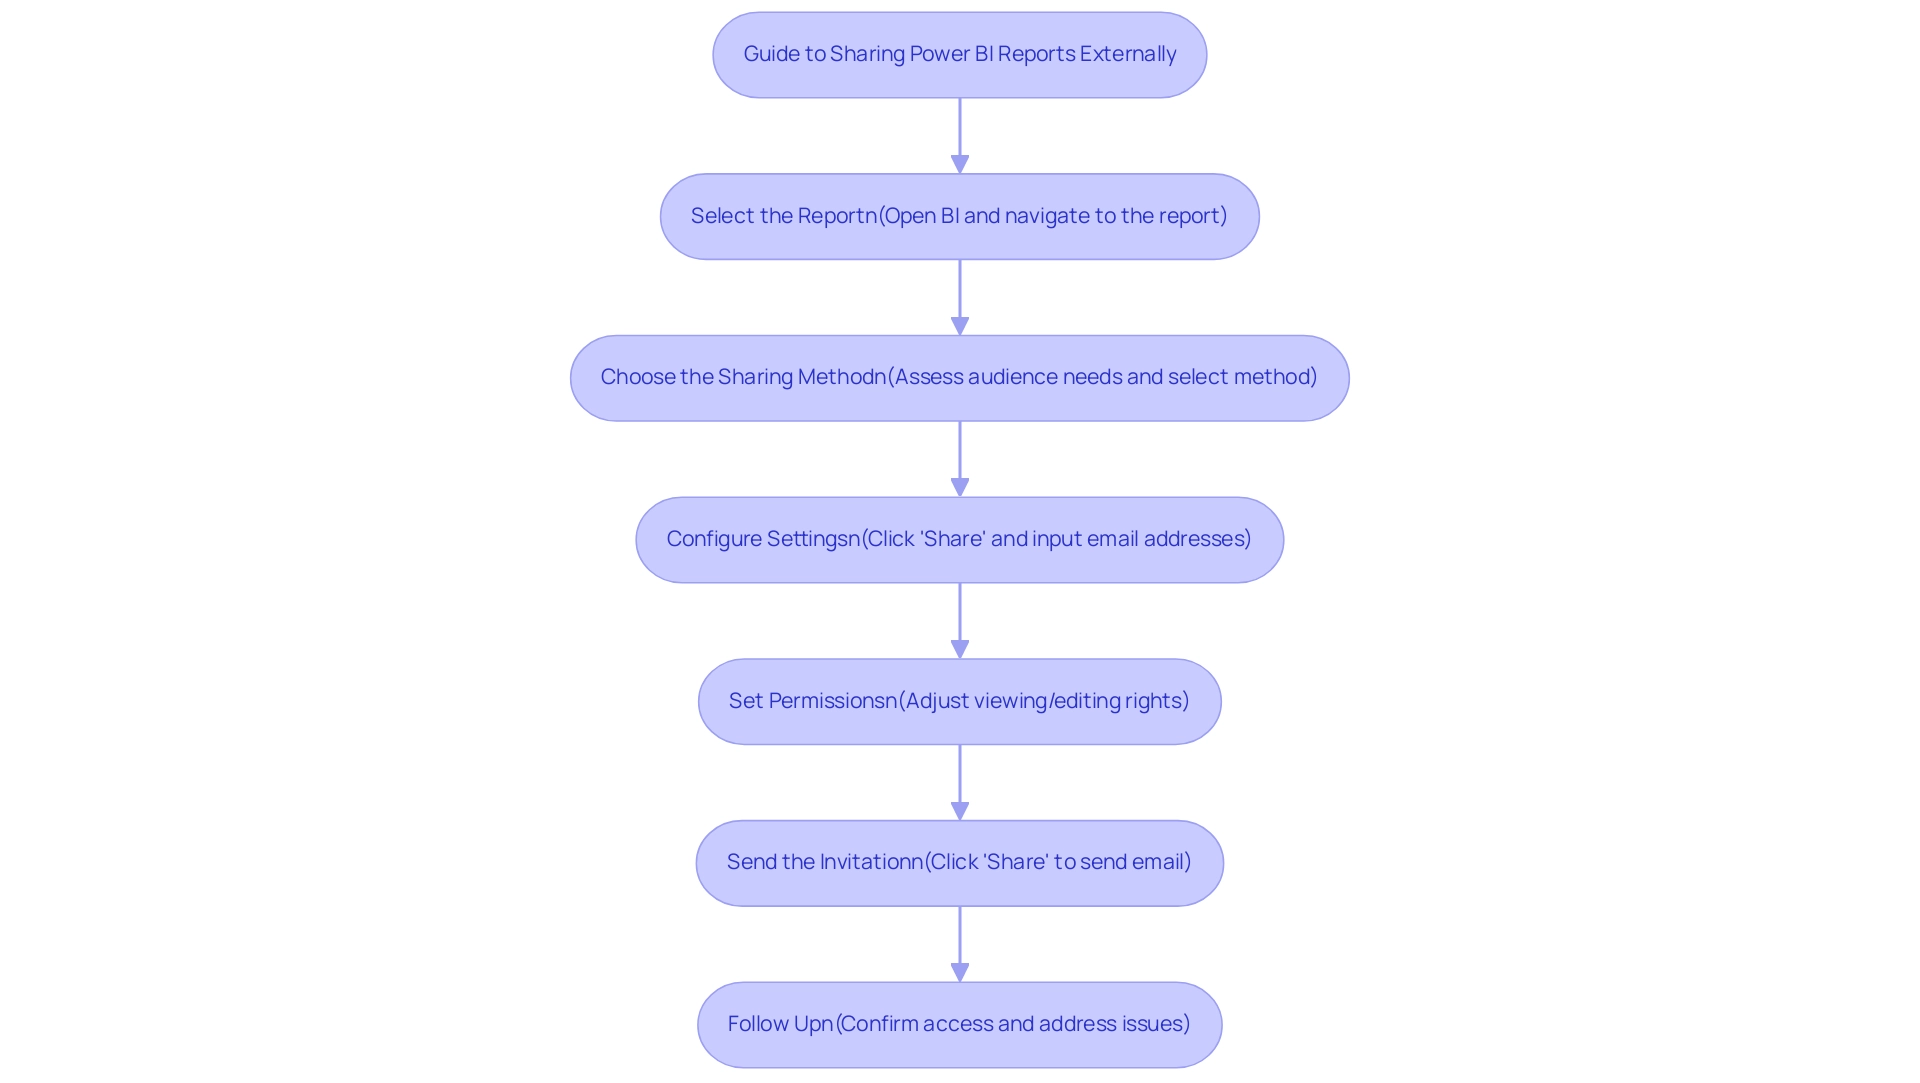
Distributing BI analyses externally requires understanding how to share Power BI report outside organization, which can greatly improve collaboration and data accessibility, yet it frequently presents challenges like time-consuming creation, data inconsistencies, and a lack of actionable guidance. To help you navigate this process effectively, here’s a straightforward guide:
-
Select the Report: Begin by opening BI and navigating to the specific report you wish to share, mindful of the time spent on report construction versus leveraging insights from dashboards.
-
Choose the Sharing Method: Assess your audience’s needs and decide on the most suitable sharing method—options include Publish to Web or sharing directly via BI Service. A thoughtful approach here can minimize inconsistencies, which can be addressed through a robust governance strategy that ensures accuracy and consistency across reports.
- Configure Settings: For those choosing to use BI Service, click the ‘Share’ button. Input the email addresses of the external recipients, ensuring they possess Power BI accounts for access, which helps reduce confusion around information access.
- Set Permissions: Carefully adjust permissions to define what recipients can do with the document, such as viewing or editing rights.
This practice ensures alignment with your project charter and helps meet key performance indicators effectively. As noted by industry professionals, this strategic alignment is crucial for achieving desired outcomes and providing clear, actionable guidance for stakeholders. Furthermore, make certain that documents contain clear subsequent actions, so stakeholders understand how to respond to the information provided.
-
Send the Invitation: Once everything is set, click ‘Share’ to dispatch an email invitation, granting access to the report.
-
Follow Up: It’s essential to confirm with your recipients that they received the invitation and can access the document as intended, addressing any potential issues proactively. Keep in mind that documents not accessed within the 90-day data retention period will not be visible, emphasizing the significance of prompt follow-up.
Integrating insights from case studies, such as the use of workspaces in Business Intelligence, demonstrates how collaborative areas improve sharing and permissions management. By implementing these steps, you can learn how to share Power BI report outside organization, facilitating collaborative efforts with external stakeholders while overcoming common challenges associated with outside sharing.
Understanding Permissions and Roles for Effective Sharing
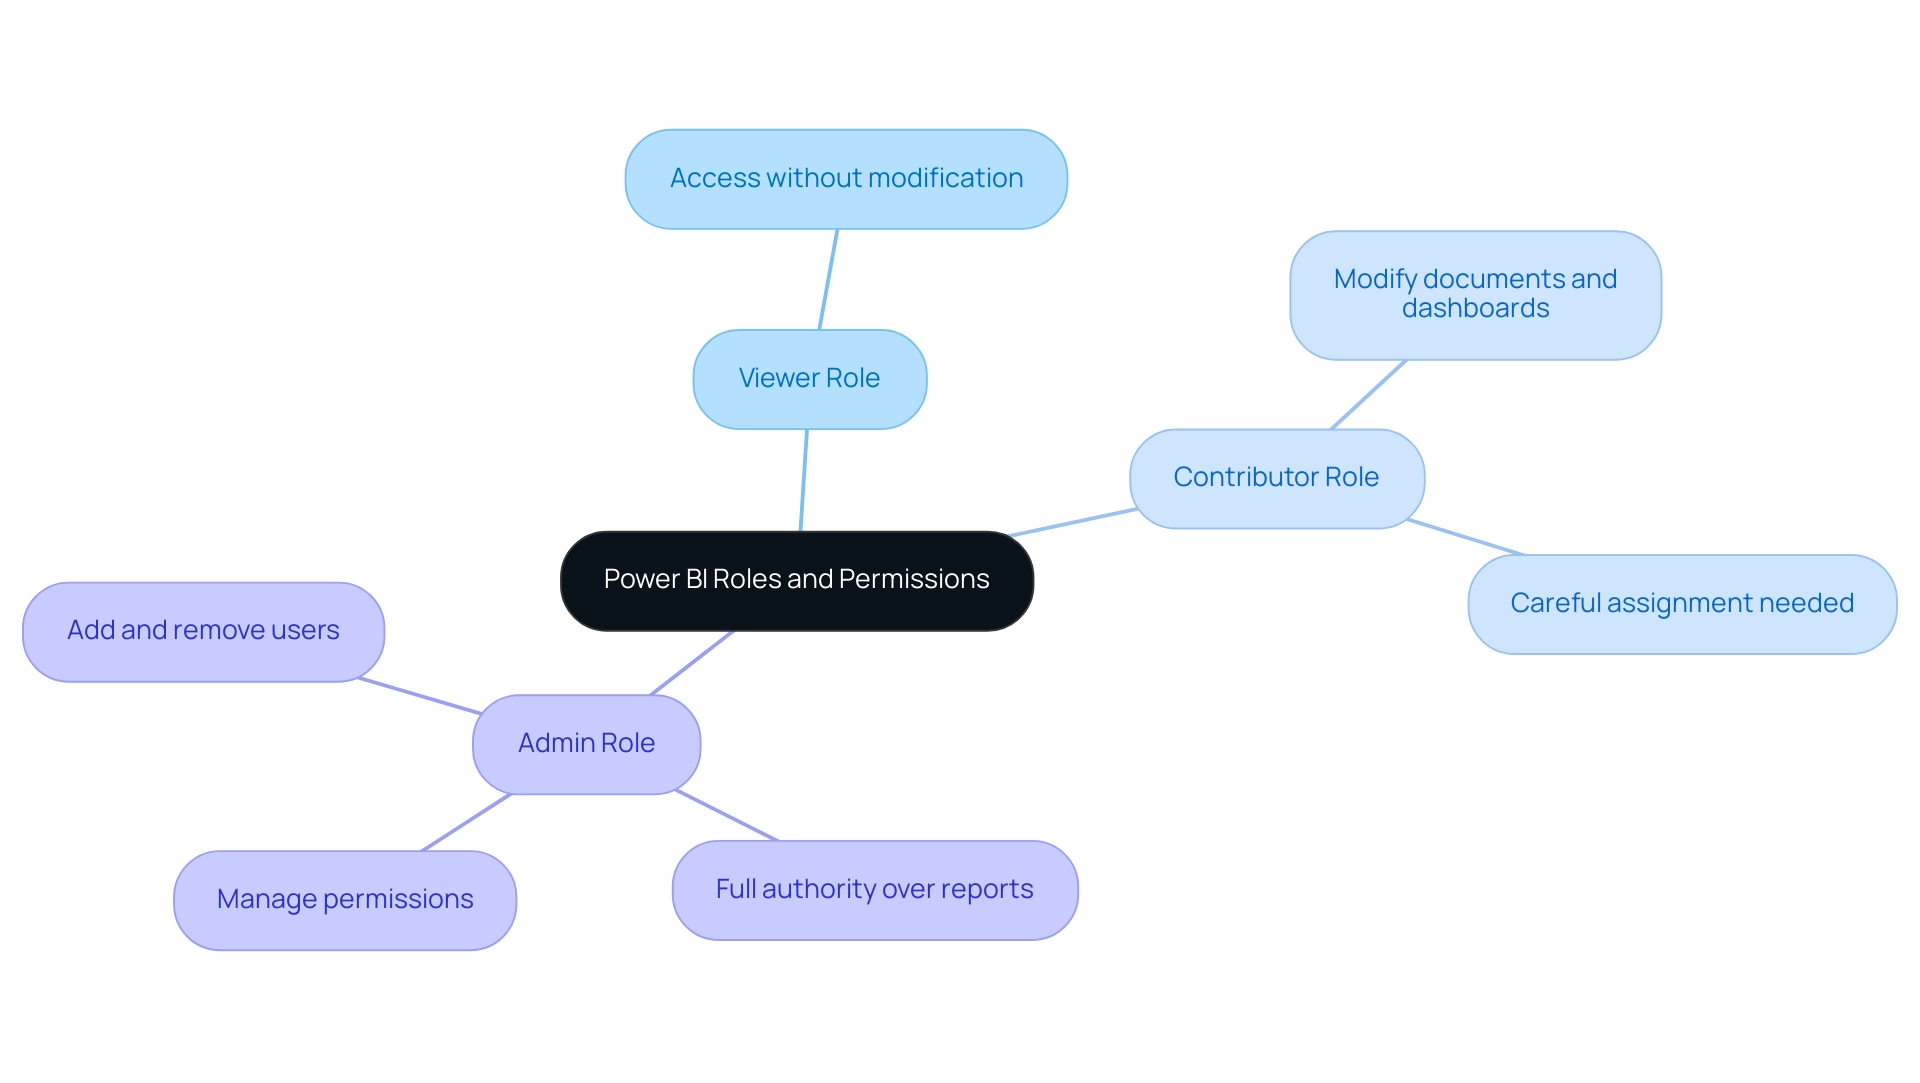
Comprehending the different permissions and roles in Power BI is crucial for efficiently understanding how to share Power BI reports outside the organization and utilizing insights to improve business operations. Here’s a breakdown of the key roles:
-
Viewer Role: This position enables individuals to access documents without modifying them, rendering it appropriate for external stakeholders who need entry to information without the capacity to change it.
-
Contributor Role: Contributors can modify documents and dashboards, so it’s essential to assign this role carefully, especially to external participants. Limiting this access helps maintain control over the content while enabling collaboration.
-
Admin Role: Admins possess full authority over reports and can manage permissions comprehensively. As noted, “This category can carry out all functions of the previous types as well as add and remove individuals, including other admins.” This role should typically be reserved for internal personnel to safeguard sensitive information.
Furthermore, when administrators turn off usage metrics for their whole organization, they can opt to remove all existing analyses and dashboard tiles. This demonstrates the significance of managing roles and permissions effectively.
To set permissions, navigate to the report settings in Power BI and adjust user roles as needed. Regularly reviewing these permissions is crucial to ensure that only authorized individuals have access, particularly when learning how to share Power BI reports outside the organization with sensitive data.
A relevant case study emphasizes that IT leaders often encounter challenges with BI workspace sprawl and seek solutions to maintain security within their Microsoft 365 environment. By employing customized provisioning templates, organizations can effectively manage and secure their environments.
In conjunction with our 3-Day BI Sprint, we tackle these challenges directly by producing a fully functional, professionally designed document on a subject of your choice. This service not only allows you to focus on utilizing insights but also provides a template for future projects, ensuring a professional design from the start. By maintaining a structured approach to user roles and leveraging our expertise, organizations can optimize their BI sharing effectiveness while enhancing security and overcoming challenges in utilizing insights from dashboards.
Best Practices for Sharing Power BI Reports Safely
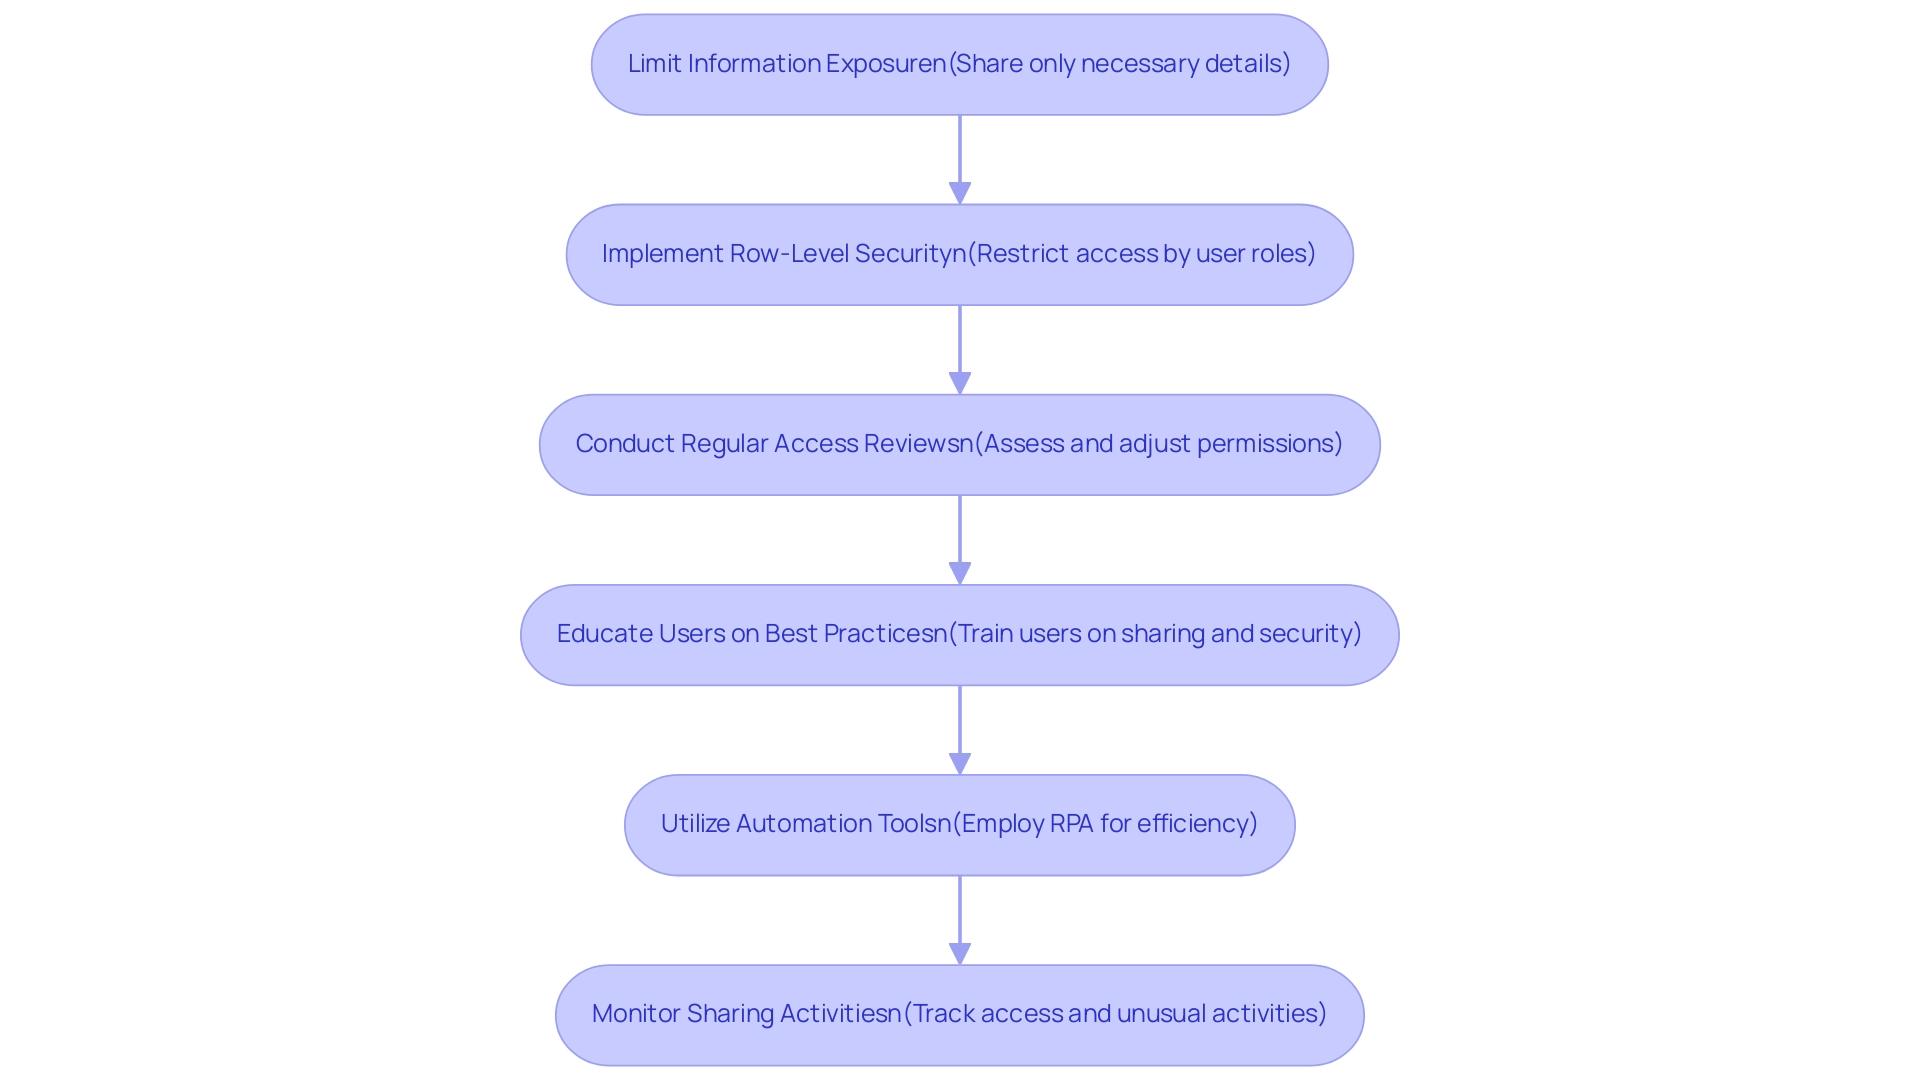
To effectively share Power BI reports while ensuring security, consider these essential best practices:
- Limit Information Exposure: Share only the details required for the report’s specific purpose. Be cautious to exclude sensitive or confidential information that is not essential.
- Implement Row-Level Security: Utilize row-level security to restrict access according to user roles, ensuring users can only view information pertinent to them. This approach not only mitigates risks but also improves governance, addressing challenges often faced in leveraging insights from Power BI dashboards.
- Conduct Regular Access Reviews: Periodically assess who has access to your reports, adjusting permissions as necessary, particularly after shifts in team structure or project requirements. Such vigilance is crucial, especially in light of the statistic that indicates around 46% of U.S. employees share passwords for work accounts, which can lead to security vulnerabilities. Additionally, it is important to note that less than 5% of current corporate information sharing programs can identify and locate trusted sources, highlighting the challenges faced in effective sharing.
- Educate Users on Best Practices: Provide comprehensive training for users on information sharing and security best practices, cultivating a culture of awareness and accountability regarding handling. As noted by experts, information quality refers to “the overall utility of a dataset(s) as a function of its ability to be easily processed and analyzed for other uses.” This underscores the importance of ensuring the information is not only shared but also of high quality, which is essential for driving growth and innovation.
- Utilize Automation Tools: Think about employing Robotic Process Automation (RPA) applications such as EMMA RPA and Automate to enhance the document creation process. Automating repetitive tasks can significantly reduce the time and effort required, addressing challenges such as data inconsistencies and enhancing operational efficiency.
- Monitor Sharing Activities: Utilize BI’s integrated monitoring tools to track access and identify any unusual activities. This proactive approach can help you respond swiftly to potential security issues.
By adhering to these best practices and integrating automation solutions, you can significantly enhance the security of your Power BI reports while understanding how to share Power BI report outside organization with external stakeholders. Moreover, embracing capacity building and training initiatives, particularly in regions like the Global South, can help integrate robust information sharing practices into organizational culture, paving the way for sustainable information use. Moreover, comprehending the policy environment, as demonstrated in the case study “Navigating the Sharing Policy Landscape,” is essential for successful sharing initiatives, ensuring compliance and addressing risks while leveraging opportunities for collaboration.
Navigating Limitations and Security Concerns in Report Sharing
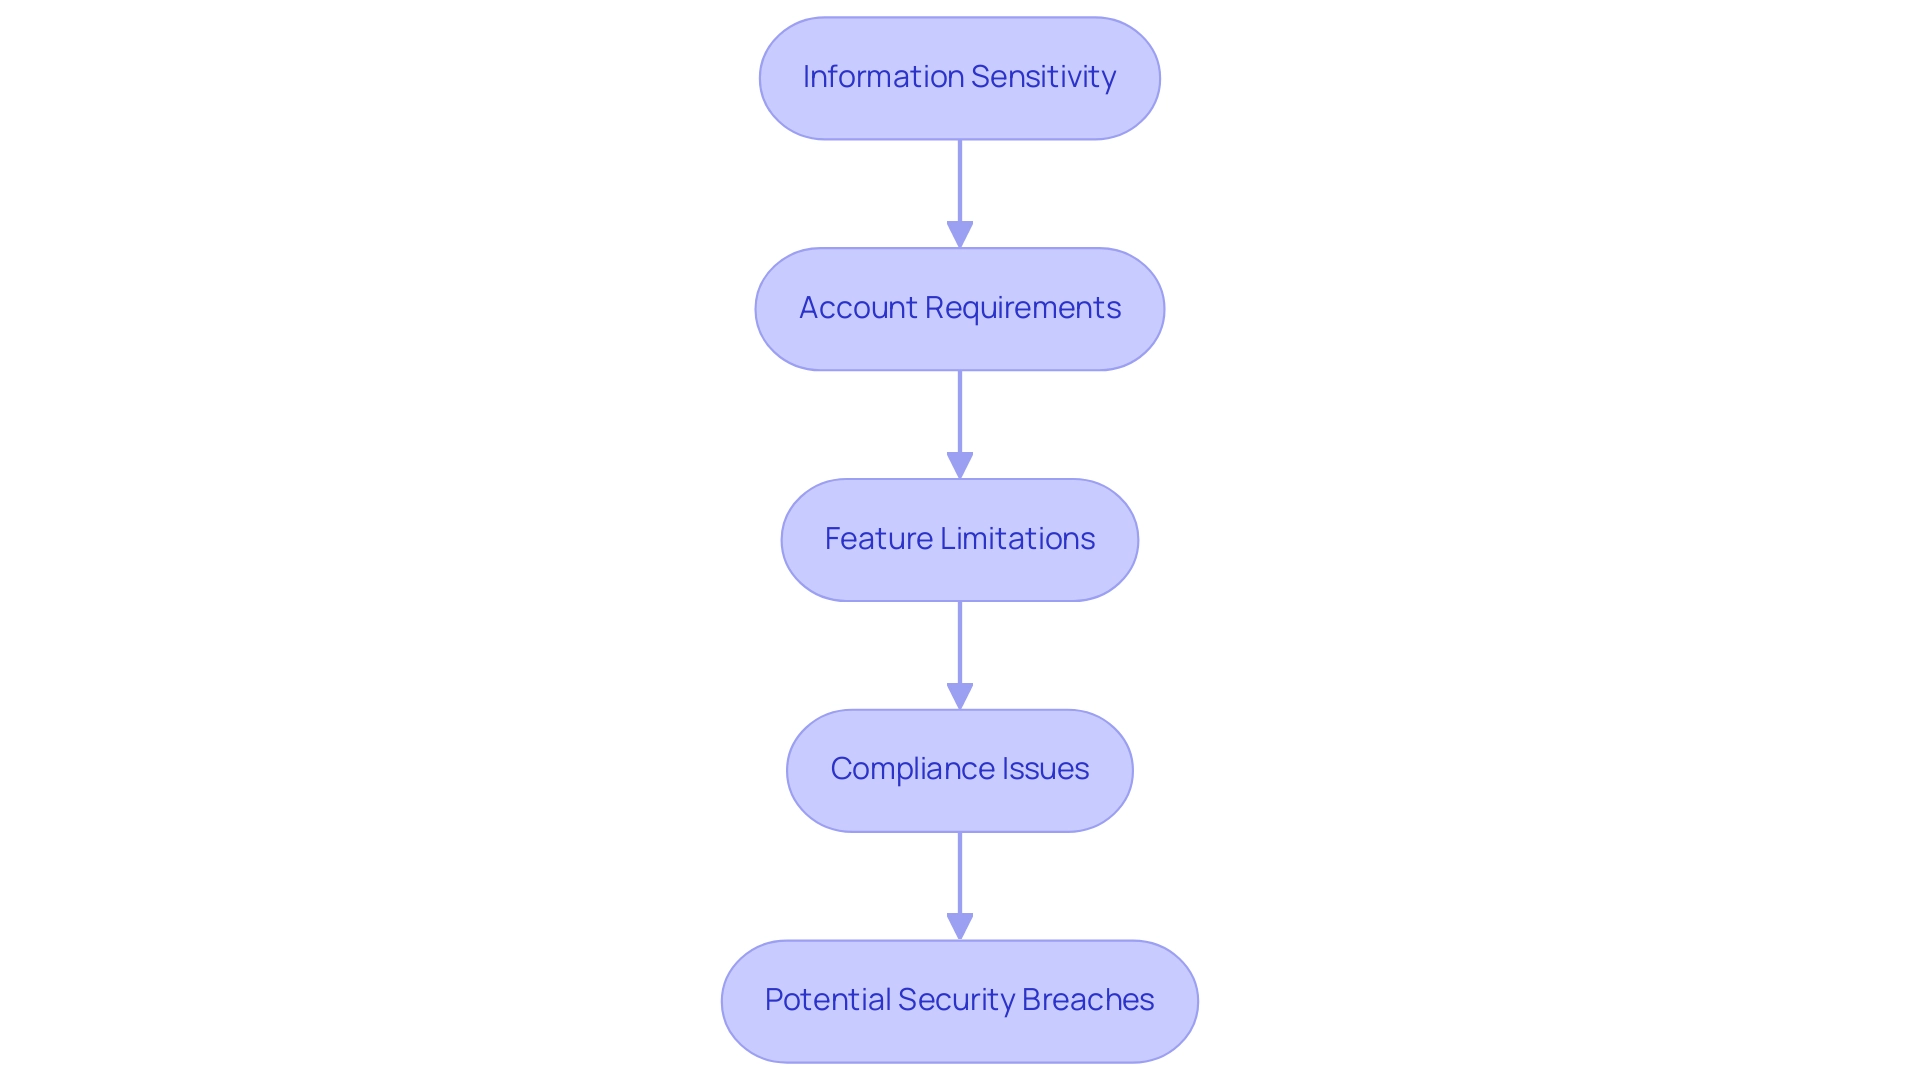
When distributing Power BI documents, it’s essential to address the related limitations and security issues effectively, especially in the context of streamlining document creation and improving information governance. Here are several key considerations:
-
Information Sensitivity: Evaluate the sensitivity of the information in your documents prior to sharing.
Public sharing methods, such as ‘Publish to Web’, can expose confidential information to a broad audience, which is often unsuitable for sensitive data, contributing to data inconsistencies due to a lack of governance strategy. -
Account Requirements: Be aware that external individuals may need to create Power BI accounts to access shared documents.
This requirement can pose accessibility challenges and limit the reach of your insights, ultimately consuming time that could be spent on deriving actionable insights. -
Feature Limitations: Certain features may be restricted when sharing reports externally.
For instance, some interactive capabilities might not function as intended, impacting user experience and engagement, thereby hindering effective decision-making. -
Compliance Issues: Ensure that your sharing practices align with organizational policies and legal regulations related to information protection and privacy.
With 72% of businesses now utilizing compliance solutions for privacy, adhering to these guidelines is paramount. The challenges in privacy compliance are considerable; only 25% of companies surveyed can fulfill the obligation to notify authorities of a breach within 72 hours, emphasizing the necessity for strong frameworks. The average cost of a data breach is significant, averaging around $3.60 million, emphasizing the importance of compliance. -
Potential Security Breaches: Regularly monitor your shared documents for any unauthorized access.
If security breaches are detected, it’s critical to take immediate action to mitigate risks. Masha Komnenic, an Information Security and Data Privacy Specialist, emphasizes the importance of vigilance, noting that effective compliance frameworks are essential for safeguarding sensitive data.
By understanding these limitations and security concerns, you can enhance your approach to how to share Power BI reports outside the organization, ensuring both effectiveness and security in your operations while leveraging insights for informed decision-making and driving growth.
Conclusion
Sharing Power BI reports effectively can transform organizational collaboration and data-driven decision-making. By exploring various methods such as:
- Publishing to the web
- Exporting to PDF
- Utilizing the Power BI Service
- Embedding reports
- Leveraging email subscriptions
organizations can tailor their sharing strategies to meet specific needs while maintaining data security.
Understanding permissions and roles is equally crucial. Assigning the right access levels—whether as a viewer, contributor, or admin—ensures that sensitive information is safeguarded while allowing necessary collaboration. Regular reviews of these permissions help maintain a secure environment, especially as team dynamics evolve.
Implementing best practices enhances the safety and effectiveness of report sharing. Key steps include:
- Limiting data exposure
- Utilizing row-level security
- Educating users about data handling
Moreover, leveraging automation tools can streamline report creation, reduce inconsistencies, and enhance operational efficiency.
Navigating the limitations and security concerns surrounding report sharing is vital for successful data governance. By being mindful of data sensitivity, compliance issues, and user access requirements, organizations can mitigate risks and enhance their overall approach to data sharing.
In conclusion, by adopting these strategies and best practices, organizations can unlock the full potential of their Power BI reports. This proactive approach not only fosters informed decision-making but also drives growth and innovation, positioning businesses for success in a competitive landscape. Embrace these insights to ensure that data sharing becomes a powerful ally in achieving operational efficiency and strategic objectives.
Overview
To update a Power BI dashboard with new data, users can either manually refresh their data sources or set up scheduled refreshes to automate this process, ensuring reports reflect the latest information. The article emphasizes the importance of understanding different data source capabilities and configuring refresh settings correctly, as these practices enhance data reliability and streamline reporting efficiency.
Introduction
In the ever-evolving landscape of data management, Power BI stands out as a powerful ally for organizations striving to harness their data effectively. By understanding the intricacies of data sources, refresh capabilities, and automation techniques, businesses can transform their reporting processes and drive operational efficiency.
This article delves into essential strategies for optimizing Power BI dashboards, including:
- Setting up scheduled refreshes
- Troubleshooting data source credentials
With practical insights and best practices, readers will discover how to elevate their data reporting capabilities, ensuring that their dashboards not only reflect real-time information but also empower decision-making and foster innovation. Embracing these techniques will pave the way for organizations to navigate the complexities of data management with confidence and agility.
Understanding Data Sources and Refresh Capabilities in Power BI
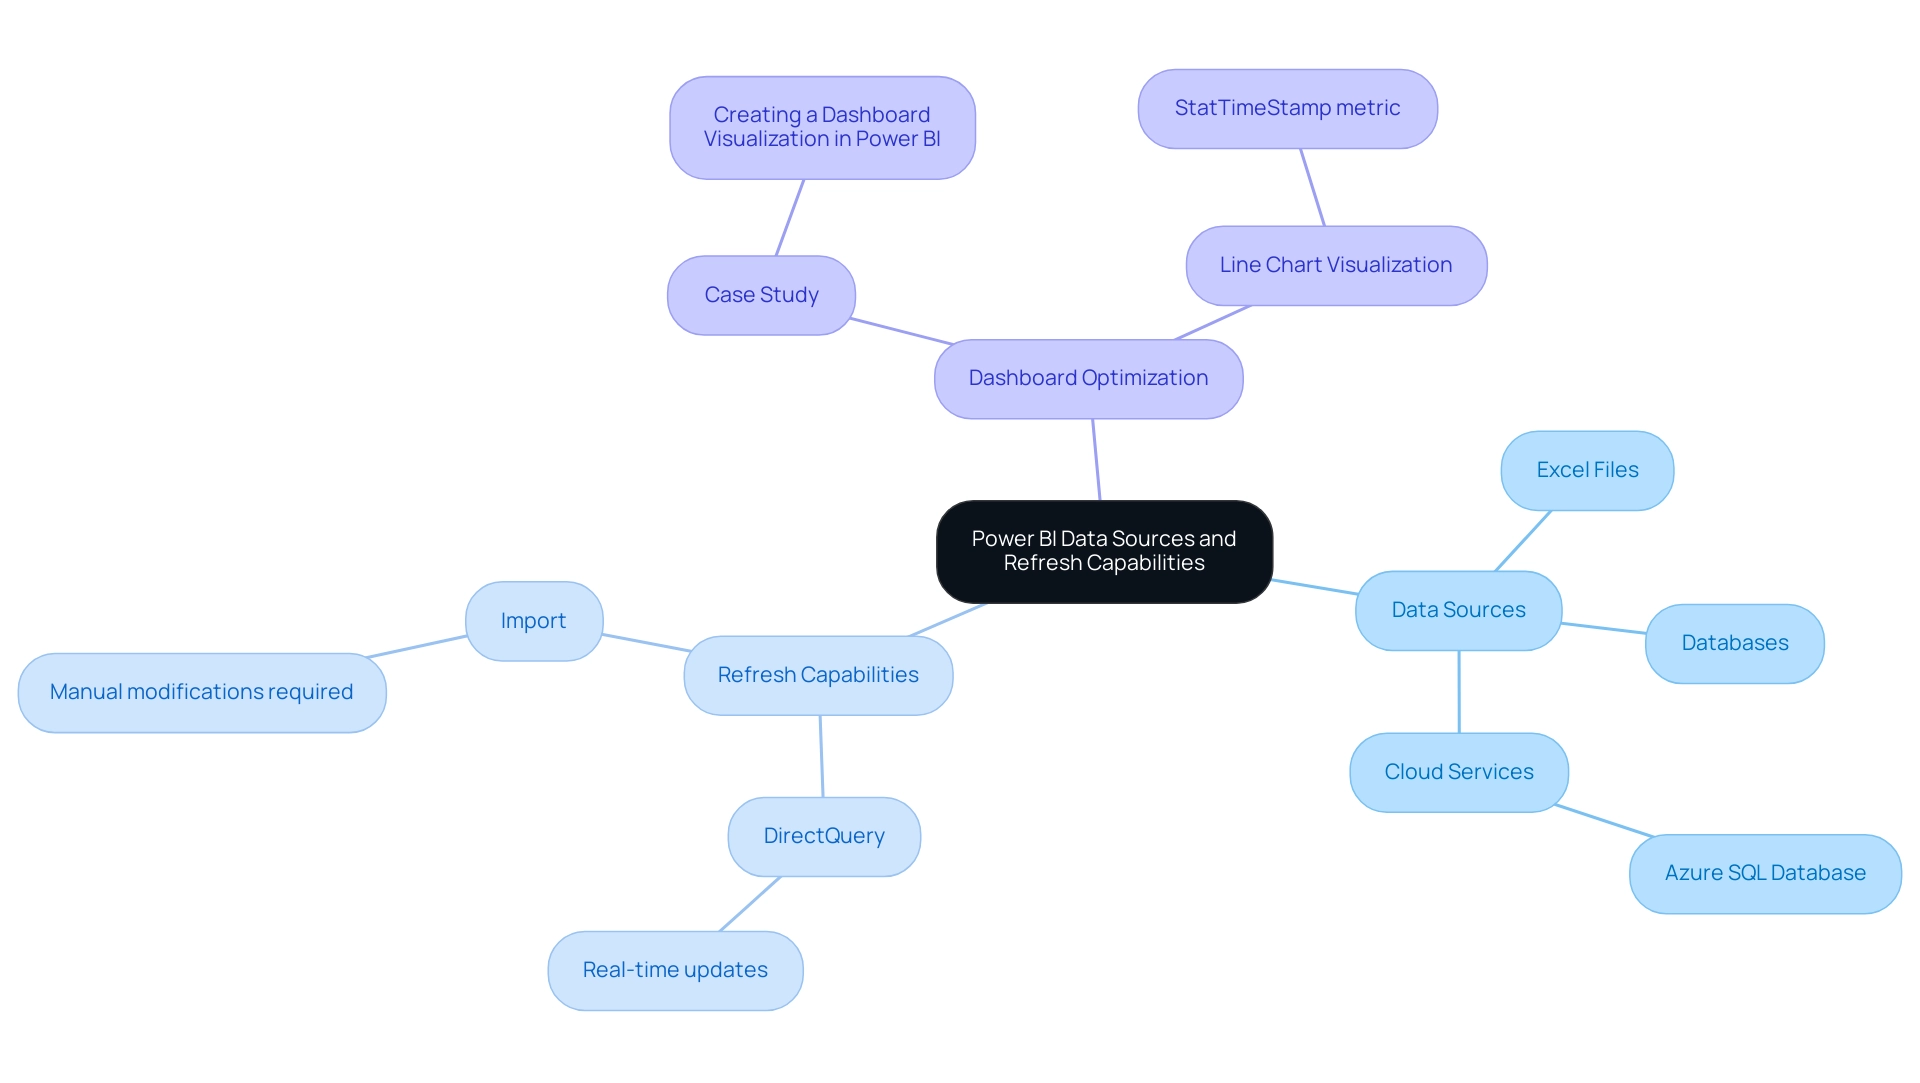
This tool provides a strong ability to link with various information origins, including Excel files, databases, and cloud services. Grasping how to update Power BI dashboard with new data is essential for efficiently refreshing your dashboard, especially during our 3-Day Power BI Sprint, which enables the swift production of professionally crafted reports. Various information origins have unique refresh functionalities; for example, cloud platforms like Azure SQL Database enable real-time updates, while knowing how to update Power BI dashboard with new data from Excel files usually requires manual modifications.
As mentioned by Fitrianingrum Seto, a software engineer with over 15 years of experience, “Comprehending information sources is vital for maximizing the efficiency of your reporting tools.” To enhance your dashboard performance, it is crucial to understand the kinds of connections available in BI, including:
- DirectQuery
- Import
Moreover, leveraging our General Management App can provide comprehensive management capabilities and smart reviews, further enhancing your reporting process.
A practical example of dashboard optimization is demonstrated in the case study titled ‘Creating a Dashboard Visualization in Power BI,’ where a line chart visualization is created using the StatTimeStamp metric. This process highlights the significance of choosing suitable measurements and ensuring visibility, ultimately enabling effective analysis. By unlocking the power of Business Intelligence and incorporating RPA for streamlined workflows, you can overcome challenges such as time-consuming report creation, inconsistencies, and lack of actionable guidance, ensuring that your dashboards remain relevant, actionable, and aligned with your operational efficiency goals.
Additionally, explore our Actions portfolio and schedule a free consultation to discover how we can further assist you in enhancing your reporting capabilities.
Setting Up Scheduled Refreshes for Your Power BI Dashboard
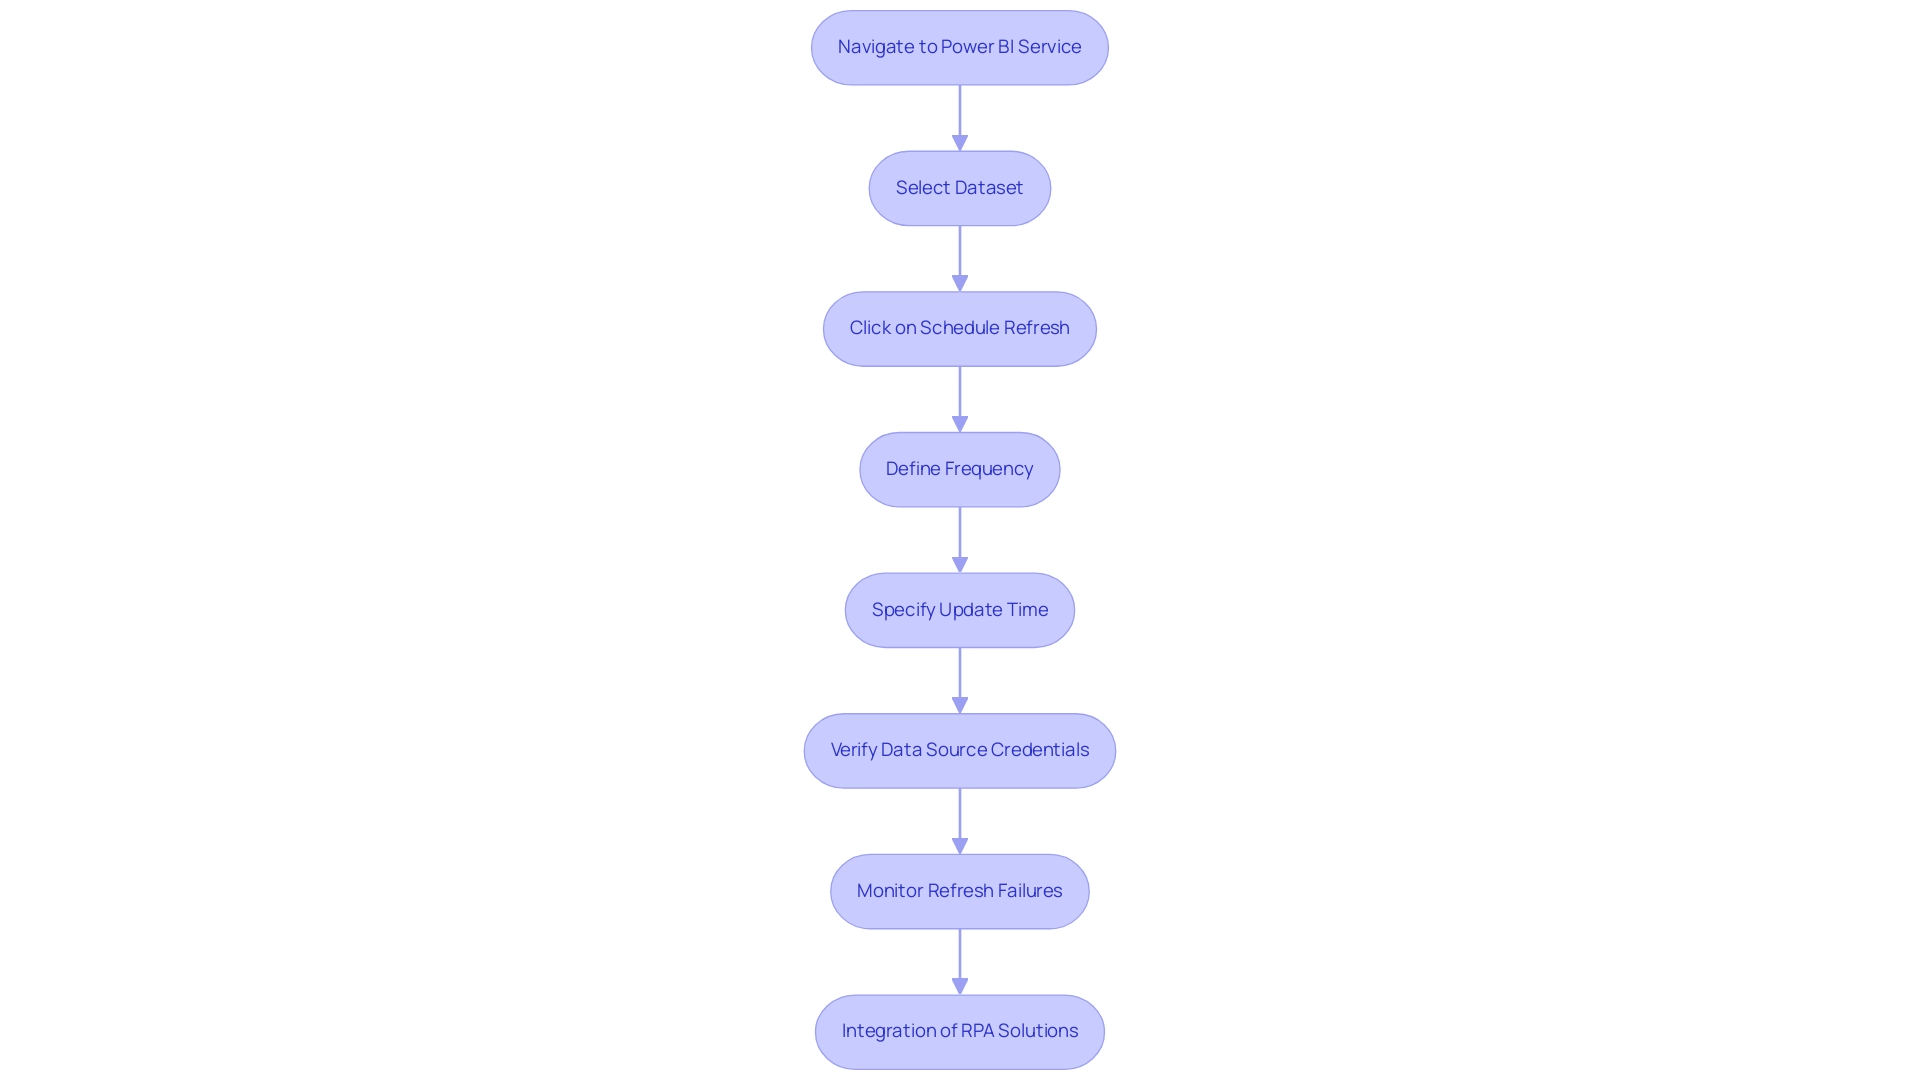
Configuring scheduled refreshes in BI is a straightforward process that teaches you how to update Power BI dashboard with new data without ongoing manual intervention, which is crucial for leveraging Business Intelligence effectively. Begin by navigating to the Power BI Service and selecting your dataset. Within the settings menu, click on ‘Schedule Refresh.’
This is where you can define the frequency of your updates—options include daily, weekly, or customized intervals to suit your operational needs. Additionally, you can specify the exact time for the update to align with your workflow, ensuring that your reports are always based on the latest information. It’s essential to verify that your data source credentials are up to date; obsolete credentials can result in update failures, which can interrupt your data flow and cause difficulties in report generation and data inconsistencies.
In fact, refresh failures may occur due to gateway issues, so it’s advisable to monitor these aspects closely. Once you’ve configured your settings, BI will handle the rest, automatically refreshing your dashboard according to the schedule you’ve established, which shows you how to update Power BI dashboard with new data. This automation not only saves you time but also enhances the reliability of your data.
As highlighted by mjmowle, BI Premium users can assign up to 48 refreshes in a 24-hour period, but they are limited to 30-minute intervals. This distinction is crucial for understanding the capabilities and constraints of scheduled refreshes. Furthermore, a user with BI Premium per-user licenses noted similar limitations, prompting inquiries about whether the 15-minute refresh option was exclusive to Premium Capacity licenses.
To further enhance your reporting procedures and address the challenges of inconsistencies, consider integrating RPA solutions like EMMA RPA and Automate. These tools can automate repetitive tasks, ensuring that your insights are not only timely but also actionable, ultimately driving operational efficiency and helping you avoid the competitive disadvantage associated with a lack of data-driven insights.
Managing Data Source Credentials and Troubleshooting Refresh Issues
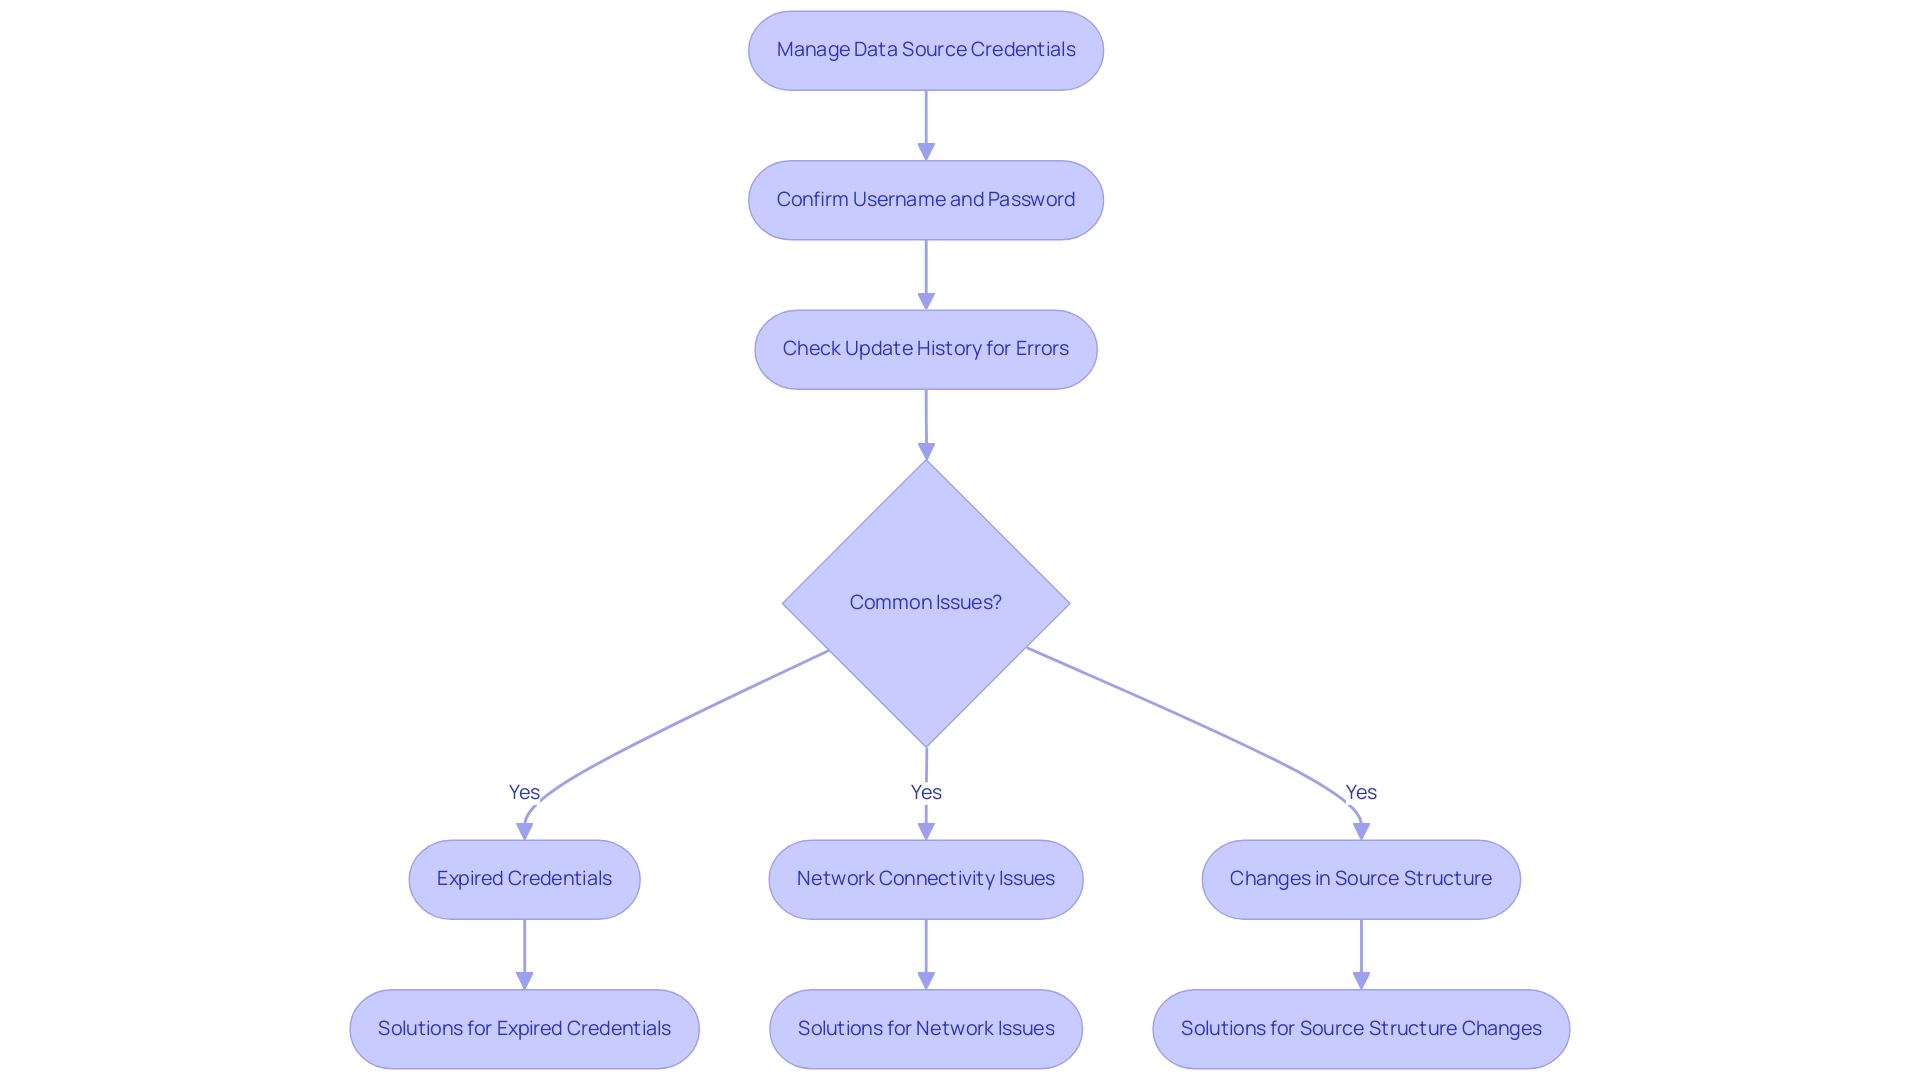
To effectively manage credential information in Power BI, navigate to the dataset settings within the Power BI Service. It’s essential to confirm you possess the correct username and password for each information repository. If you experience update issues, examine the update history for error messages that may offer insight into the problem.
Common pitfalls include:
- Expired credentials
- Network connectivity challenges
- Changes in the source structure
Moreover, as highlighted in our discussions on the importance of Business Intelligence, these issues can hinder your ability to leverage insights effectively. Keep in mind that it can take up to 24 hours for new usage information to be imported, which may also contribute to perceived refresh issues.
For instance, as PowerBINoob24 noted,
'Figured it out. There was an issue with the path to the files in BI Desktop. Once that was corrected and published, I had to delete the old files from the workspace because republishing did not overwrite the file path with the correct path.'
To further enhance your reporting and operational efficiency, consider utilizing RPA solutions like EMMA RPA and Power Automate.
These tools can automate repetitive tasks associated with management and reporting, significantly reducing the time spent on manual processes and minimizing errors. Regularly review and utilize version history to track changes made to reports and dashboards. Addressing these issues promptly is essential for learning how to update Power BI dashboard with new data.
By proactively managing your credentials and staying attuned to these common challenges, you can significantly minimize disruptions and ensure a seamless refresh process, which is essential for understanding how to update Power BI dashboard with new data to enhance the effectiveness of your reporting. Understanding compliance and security standards, as demonstrated in our case studies on usage metrics in national/regional clouds, can also inform your data management strategies, positioning your organization for growth and innovation.
Automating Dashboard Updates with Power Automate
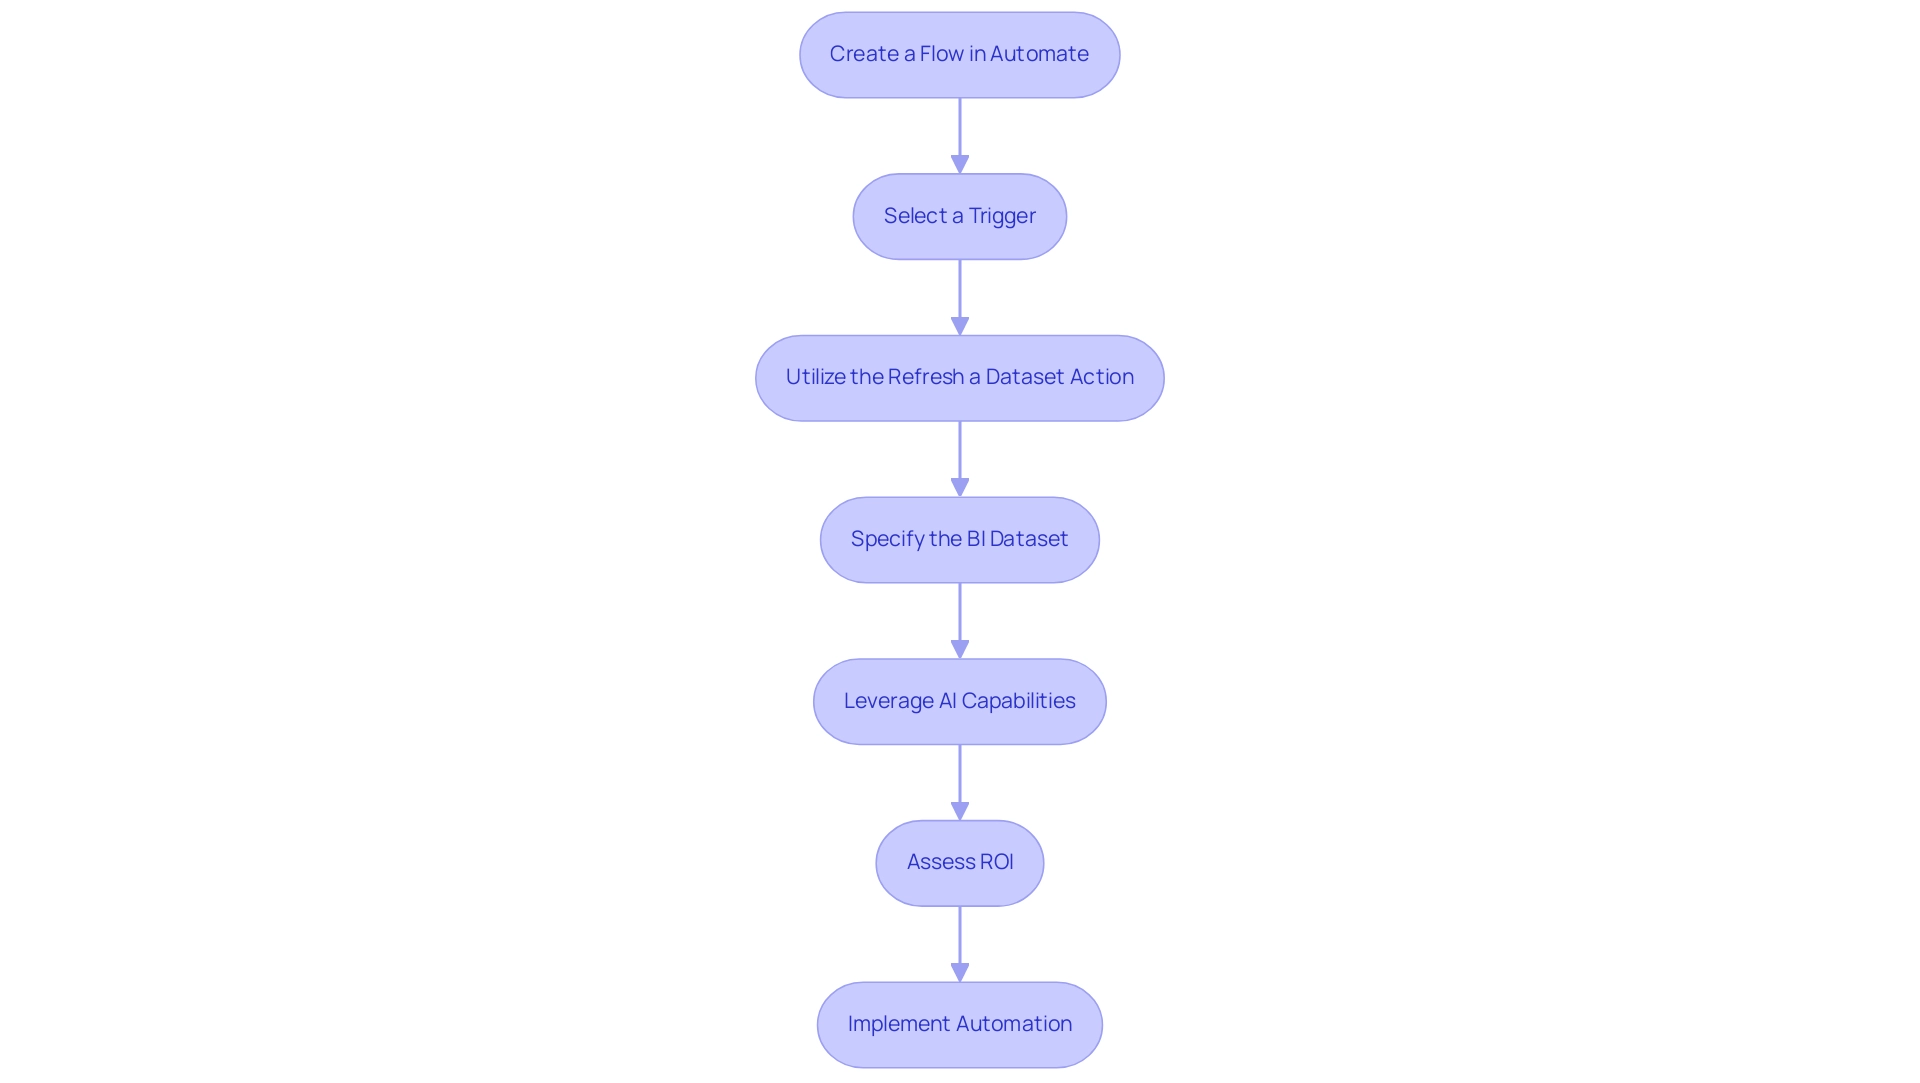
To effectively automate your BI dashboard updates, the first step is to create a flow in Automate. Begin by selecting a trigger that aligns with your operational needs, such as a scheduled time or an event from another application. Next, utilize the ‘Refresh a dataset’ action to specify the exact BI dataset you wish to refresh.
This automation not only saves valuable time but also illustrates how to update Power BI dashboard with new data whenever it becomes available, significantly enhancing operational efficiency. By leveraging Automate’s AI-driven capabilities, you can streamline workflows and execute automation risk-free, as our approach involves a thorough ROI assessment before implementation. Grasping Automate is essential for creating seamless workflows and maximizing the benefits of your BI tools.
For example, in a case study on Automate integration with BI, managers were able to receive customized reports by establishing flows that filter information based on their department, demonstrating the practical use of this automation. As Taymour Ahmed, a Business Intelligence Professional, highlights, ‘The capability to automate processes in BI is not merely a convenience; it’s a strategic edge that allows organizations to react promptly to evolving information requirements.’
Furthermore, comprehending the three types of flows in automation—Automated Flows, Instant Flows, and Scheduled Flows—can further optimize your approach to how to update Power BI dashboard with new data, making your reporting more responsive and tailored to your needs.
Additionally, we offer a free consultation to help you assess your automation needs and demonstrate how accessible automation can benefit your organization.
Best Practices for Maintaining and Optimizing Power BI Dashboards
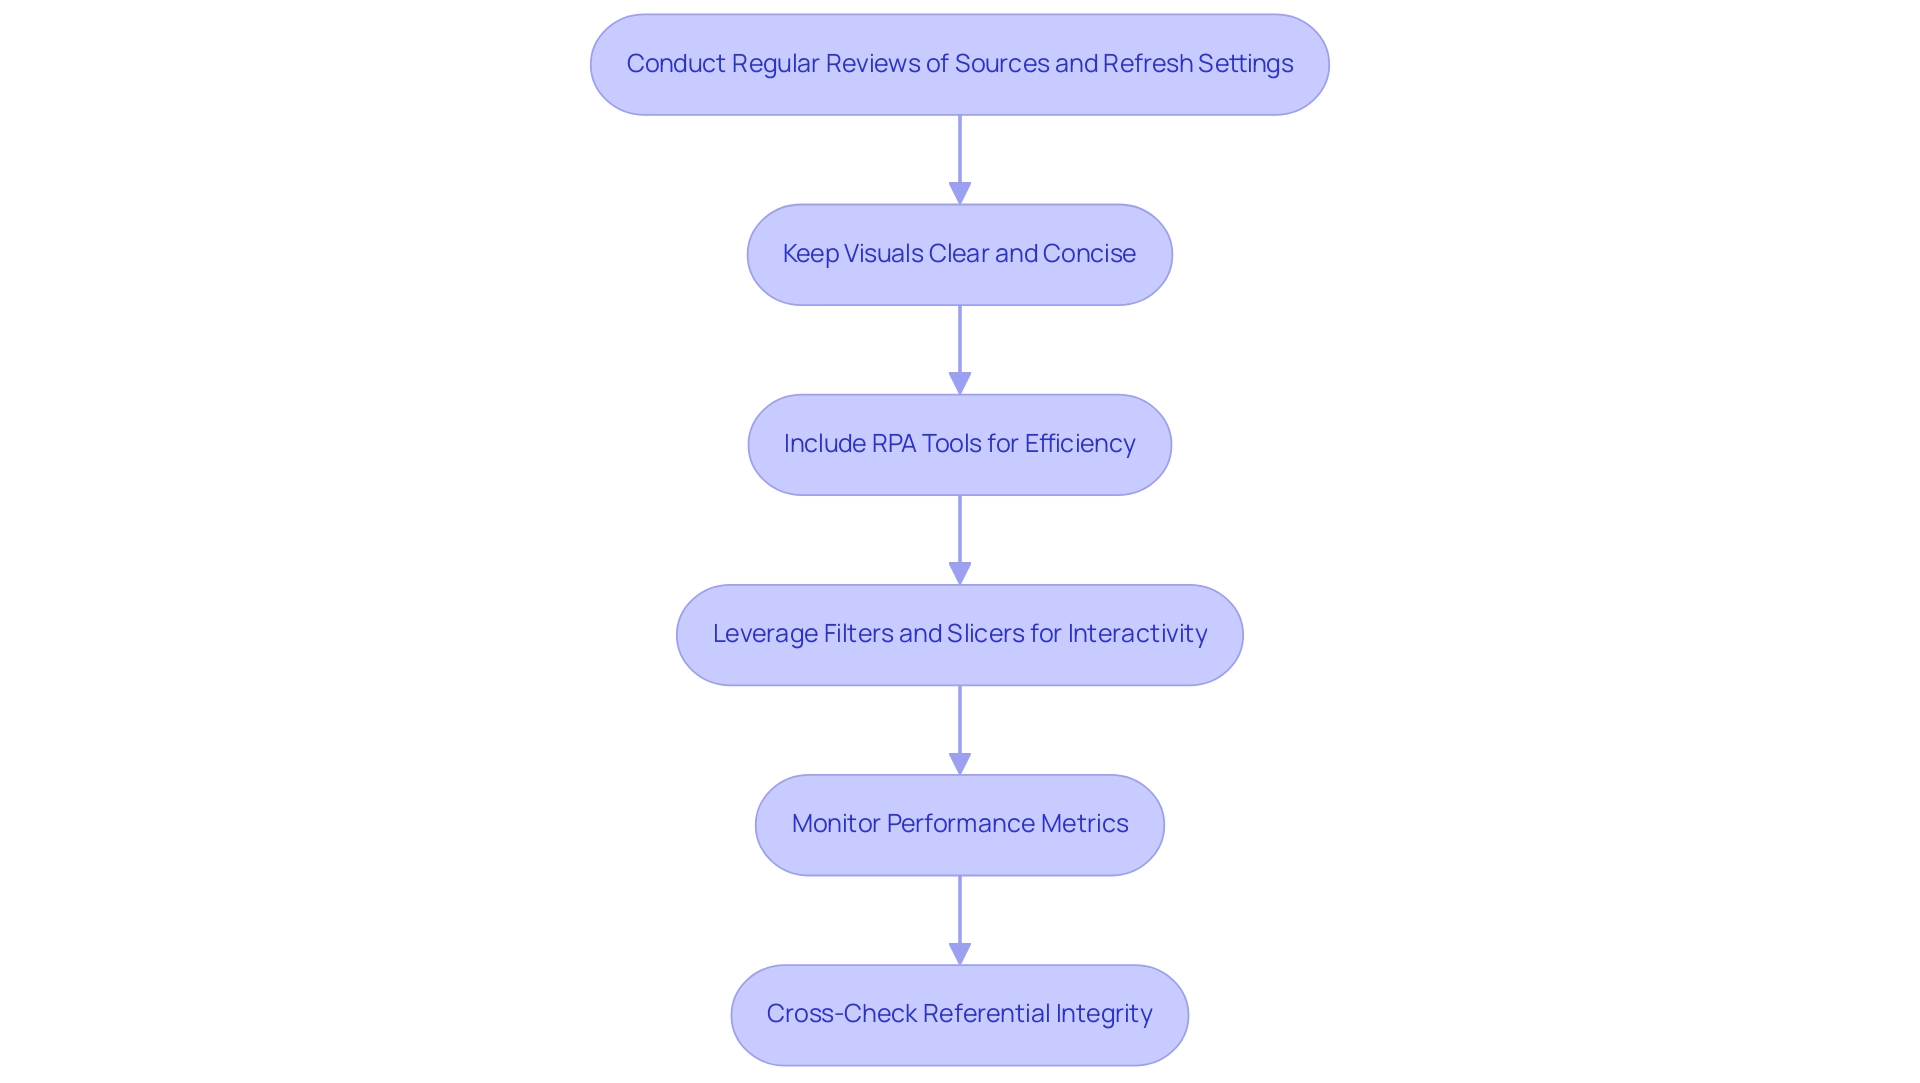
To effectively maintain and optimize your BI dashboards, it is essential to understand how to update Power BI dashboard with new data by conducting regular reviews of your sources and refresh settings, ensuring they are aligned with your business objectives. In today’s dynamic environment, leveraging Business Intelligence is crucial for transforming raw information into actionable insights that drive growth and innovation. A key trend is to keep visuals clear and concise, as clutter can lead to user confusion and diminish engagement; reducing the number of visuals in BI reports can significantly decrease query load and enhance performance.
Furthermore, think about including Robotic Process Automation (RPA) tools such as EMMA RPA and Automate to simplify repetitive tasks associated with report creation, tackling issues of time consumption and information inconsistencies. For instance, EMMA RPA can automate the extraction and transformation of information, while Automate can facilitate seamless integration between various applications, enhancing efficiency. Leverage filters and slicers to boost interactivity, enhancing the overall user experience.
Monitoring performance metrics is essential; identify any slowdowns and modify your model accordingly to maintain responsiveness. Significantly, minimizing network latency can greatly affect performance; strategically placing your data repositories, gateways, and BI capacity in the same region can result in enhanced service responsiveness, as demonstrated by case studies that have effectively reduced latency problems through strategic location. For example, a recent case study demonstrated that a company reduced report generation time by 50% after implementing RPA solutions, showcasing the tangible benefits of these technologies.
Furthermore, it is important to cross-check referential integrity for relationships in DirectQuery sources to optimize query performance. As Idrissshatila wisely suggests,
Learn with me on YouTube @DAXJutsu or follow my page on Facebook @DAXJutsuPBI
— a reminder that continuous learning and adaptation are key to mastering how to update Power BI dashboard with new data effectively.
Conclusion
Optimizing Power BI dashboards is a strategic imperative for organizations aiming to leverage their data for operational excellence. By understanding data sources and refresh capabilities, businesses can ensure that their reports are both accurate and timely. Scheduled refreshes automate the data update process, reducing manual intervention and enhancing reliability, while effective management of data source credentials minimizes disruptions and maintains the integrity of reporting.
Incorporating tools like Power Automate and RPA solutions can significantly streamline workflows and automate repetitive tasks, providing a competitive advantage in today’s data-driven landscape. Best practices, such as:
- Regular reviews of data sources
- Maintaining clear visuals
- Monitoring performance metrics
are essential for ensuring dashboards remain relevant and user-friendly.
Ultimately, embracing these strategies not only empowers organizations to make informed decisions but also fosters a culture of innovation and agility. By navigating the complexities of data management with confidence, businesses can transform their reporting capabilities into a powerful tool for driving growth and operational efficiency. Now is the time to harness the full potential of Power BI and unlock actionable insights that propel your organization forward.
Overview
To refresh Power BI effectively, users can utilize three main methods: manual updates, scheduled updates, and automatic refreshes, each tailored to specific operational needs. The article illustrates that understanding these methods, along with best practices and the integration of Robotic Process Automation (RPA), is crucial for maintaining data accuracy and operational efficiency, thereby empowering users to make informed decisions based on timely insights.
Introduction
In the realm of data-driven decision-making, the ability to refresh and manage data effectively is paramount for any organization aiming to enhance operational efficiency. Power BI stands out as a powerful tool that not only simplifies the complexities of data reporting but also ensures that insights are timely and actionable.
As businesses increasingly rely on accurate data to inform their strategies, understanding the nuances of data refresh methods becomes essential. This article delves into the various techniques available in Power BI for refreshing data—manual, scheduled, and automatic—while highlighting best practices and troubleshooting tips that empower users to maintain seamless operations.
By mastering these processes, organizations can unlock the full potential of their data, driving growth and innovation in an ever-evolving landscape.
Understanding Data Refresh in Power BI
Data refresh in this tool is a crucial process that demonstrates how to refresh Power BI by updating your dashboards with the latest information from your sources, ensuring that the insights derived are both current and precise. In the context of enhancing operational efficiency, our BI services provide a streamlined approach to reporting, featuring a 3-Day BI Sprint designed to quickly create professionally crafted reports that address common challenges. Given that analyzing datasets on Microsoft Excel can become complex and slow with over a million rows, Power BI offers robust solutions to simplify this task.
The platform enables users to select from various methods for refreshing information, including learning how to refresh Power BI, empowering them to choose the approach that aligns best with their workflow and operational needs. Comprehending how information update processes operate is crucial for handling documents efficiently and making knowledgeable choices based on the most current available information. Furthermore, the regularity of information updates plays a vital role in preserving the precision of reports, as timely revisions are directly associated with the dependability of insights produced.
The history display in BI presents information for the latest 60 records for each scheduled update, while the schedule view divides scheduling details into 30-minute intervals, assisting in managing resource contention efficiently. As organizations increasingly adopt Power BI—evidenced by a staggering 97% of Fortune 500 companies utilizing it—understanding how to refresh Power BI techniques becomes crucial for sustaining competitive advantage. Furthermore, in scenarios where access to an enterprise information gateway is unavailable, users can deploy a personal information gateway for managing their semantic models.
Although personal gateways have limitations, they enable users to manage source configurations without needing to share with others. This emphasizes the significance of information quality and the utilization of tools such as Automate for efficient management, ultimately fostering insight-driven decision-making and operational effectiveness for business growth. Additionally, explore our Actions portfolio to discover tailored solutions that can further enhance your BI experience, and don’t hesitate to book a free consultation to discuss how we can support your business needs.
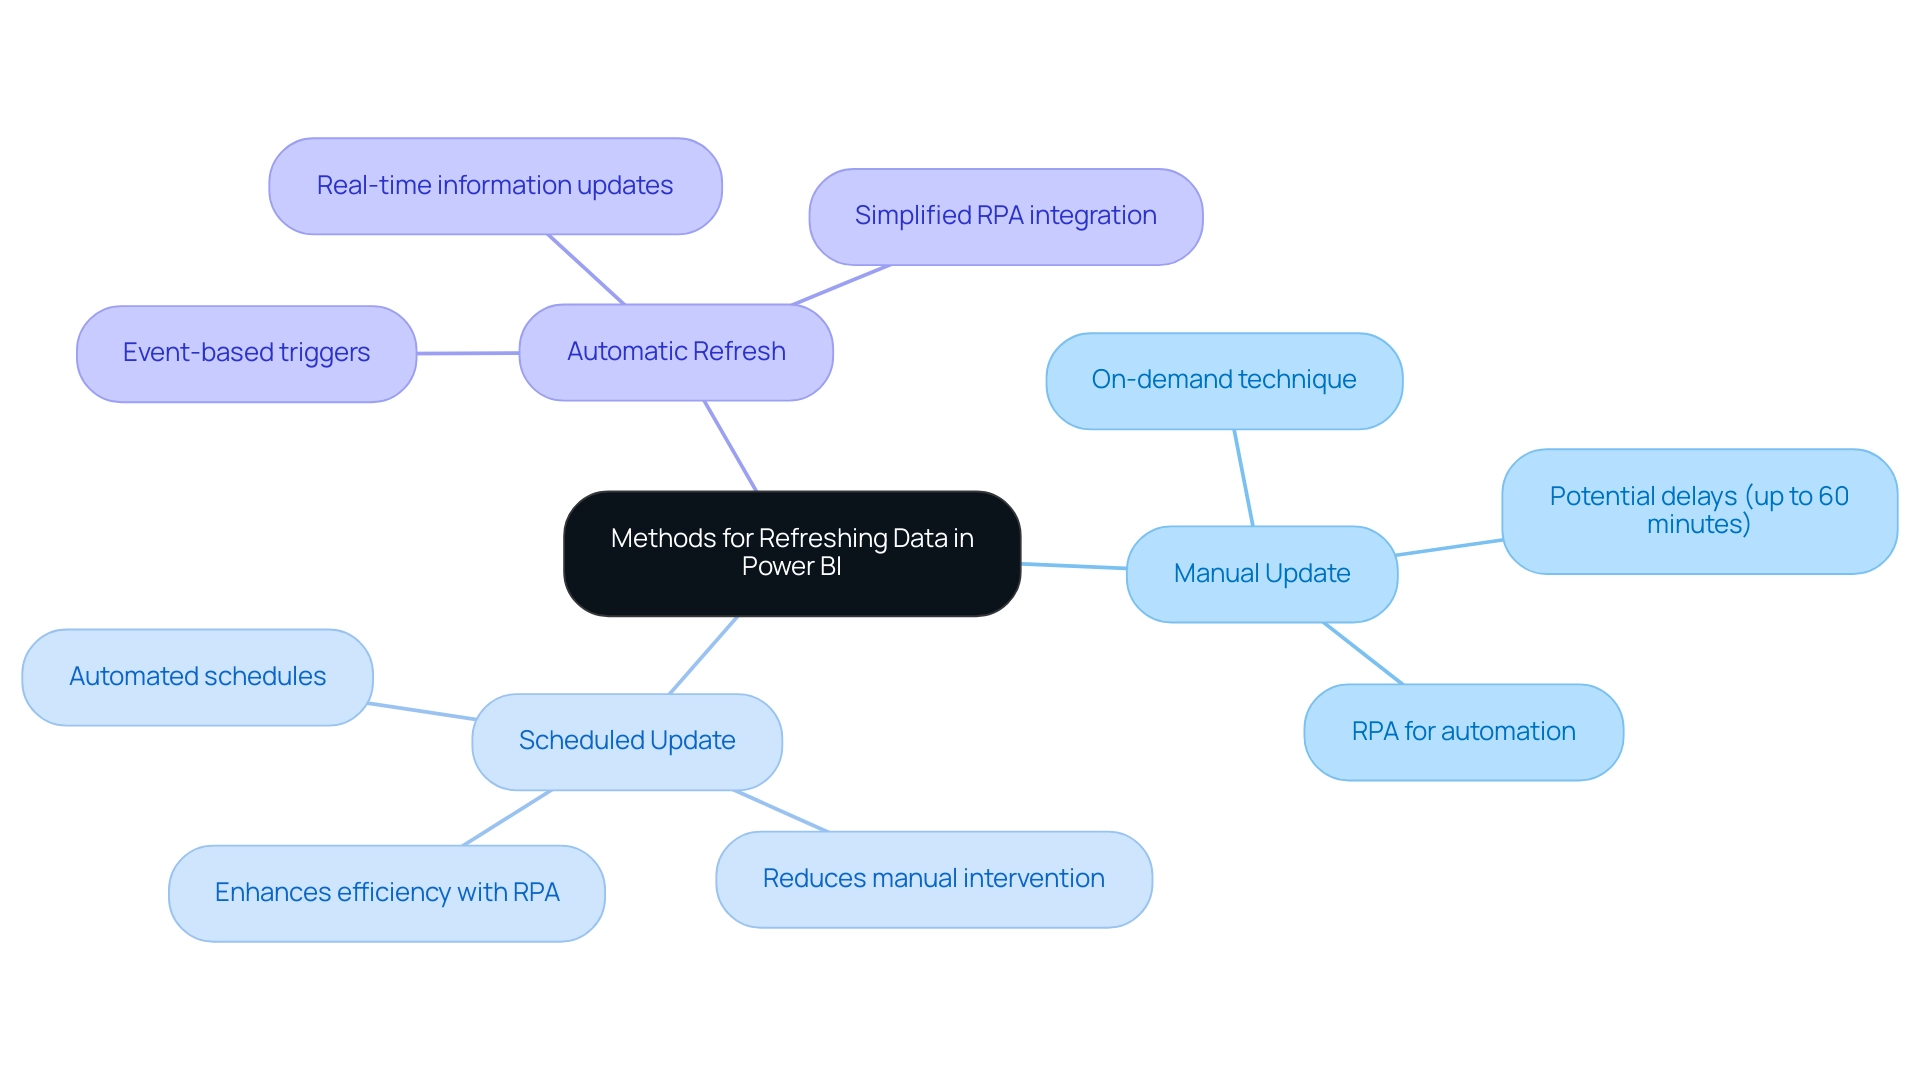
Methods for Refreshing Data in Power BI: Manual, Scheduled, and Automatic
The BI tool offers three crucial approaches for updating information, each customized to particular operational requirements, and can be greatly improved through the incorporation of Robotic Process Automation (RPA):
-
Manual Update: This on-demand technique enables users to update information whenever required. By simply clicking the ‘Refresh’ button in Power BI Desktop, users can learn how to refresh Power BI to retrieve the latest information from their sources. While this method provides immediate updates, it can lead to delays; for instance, refreshing a semantic model can take up to 60 minutes using the ‘Refresh now’ option. Understanding this potential delay is crucial for operational planning, especially in an environment where RPA can automate repetitive tasks surrounding manual refreshes, which relates to how to refresh Power BI, thus saving time and reducing the likelihood of human error.
-
Scheduled Update: This feature enables users to set automated update schedules at designated times. Employing scheduled updates alongside RPA is an effective method to understand how to refresh Power BI, ensuring that reports are regularly updated and reducing the necessity for manual intervention while preserving data accuracy. Implementing such refresh schedules can significantly enhance efficiency, particularly when RPA is employed to manage tasks related to how to refresh Power BI seamlessly, allowing team members to focus on more strategic initiatives.
-
Automatic Refresh: For datasets housed in the Power BI service, it is possible to learn how to refresh Power BI automatically based on specific triggers or events. This method is particularly advantageous for real-time information scenarios, demonstrating how to refresh Power BI to allow for instantaneous updates that keep your reports relevant and actionable. Furthermore, utilizing RPA here can simplify the process of establishing these triggers, ensuring that your information management is optimized for efficiency without manual oversight.
To illustrate practical applications, consider the case study on deploying a personal information gateway. In situations where an enterprise information gateway is unavailable, users can deploy a personal information gateway for managing their semantic models without sharing sources. While personal gateways have limitations, they allow users to manage source configurations directly without needing to add definitions.
Incorporating RPA into this process could further simplify configurations, improve information management, and reduce mistakes.
By comprehending and effectively utilizing these updating techniques alongside RPA, you can uphold precise and prompt reports, thereby boosting operational efficiency. As Dhyanendra Singh Rathore aptly puts it, > If everything looks as expected, then we will update the production dataset. < Consequently, choosing the appropriate update strategy not only simplifies operations but also guarantees your information stays usable and dependable, fostering business expansion through informed decision-making and enabling teams to assign resources to more strategic tasks.
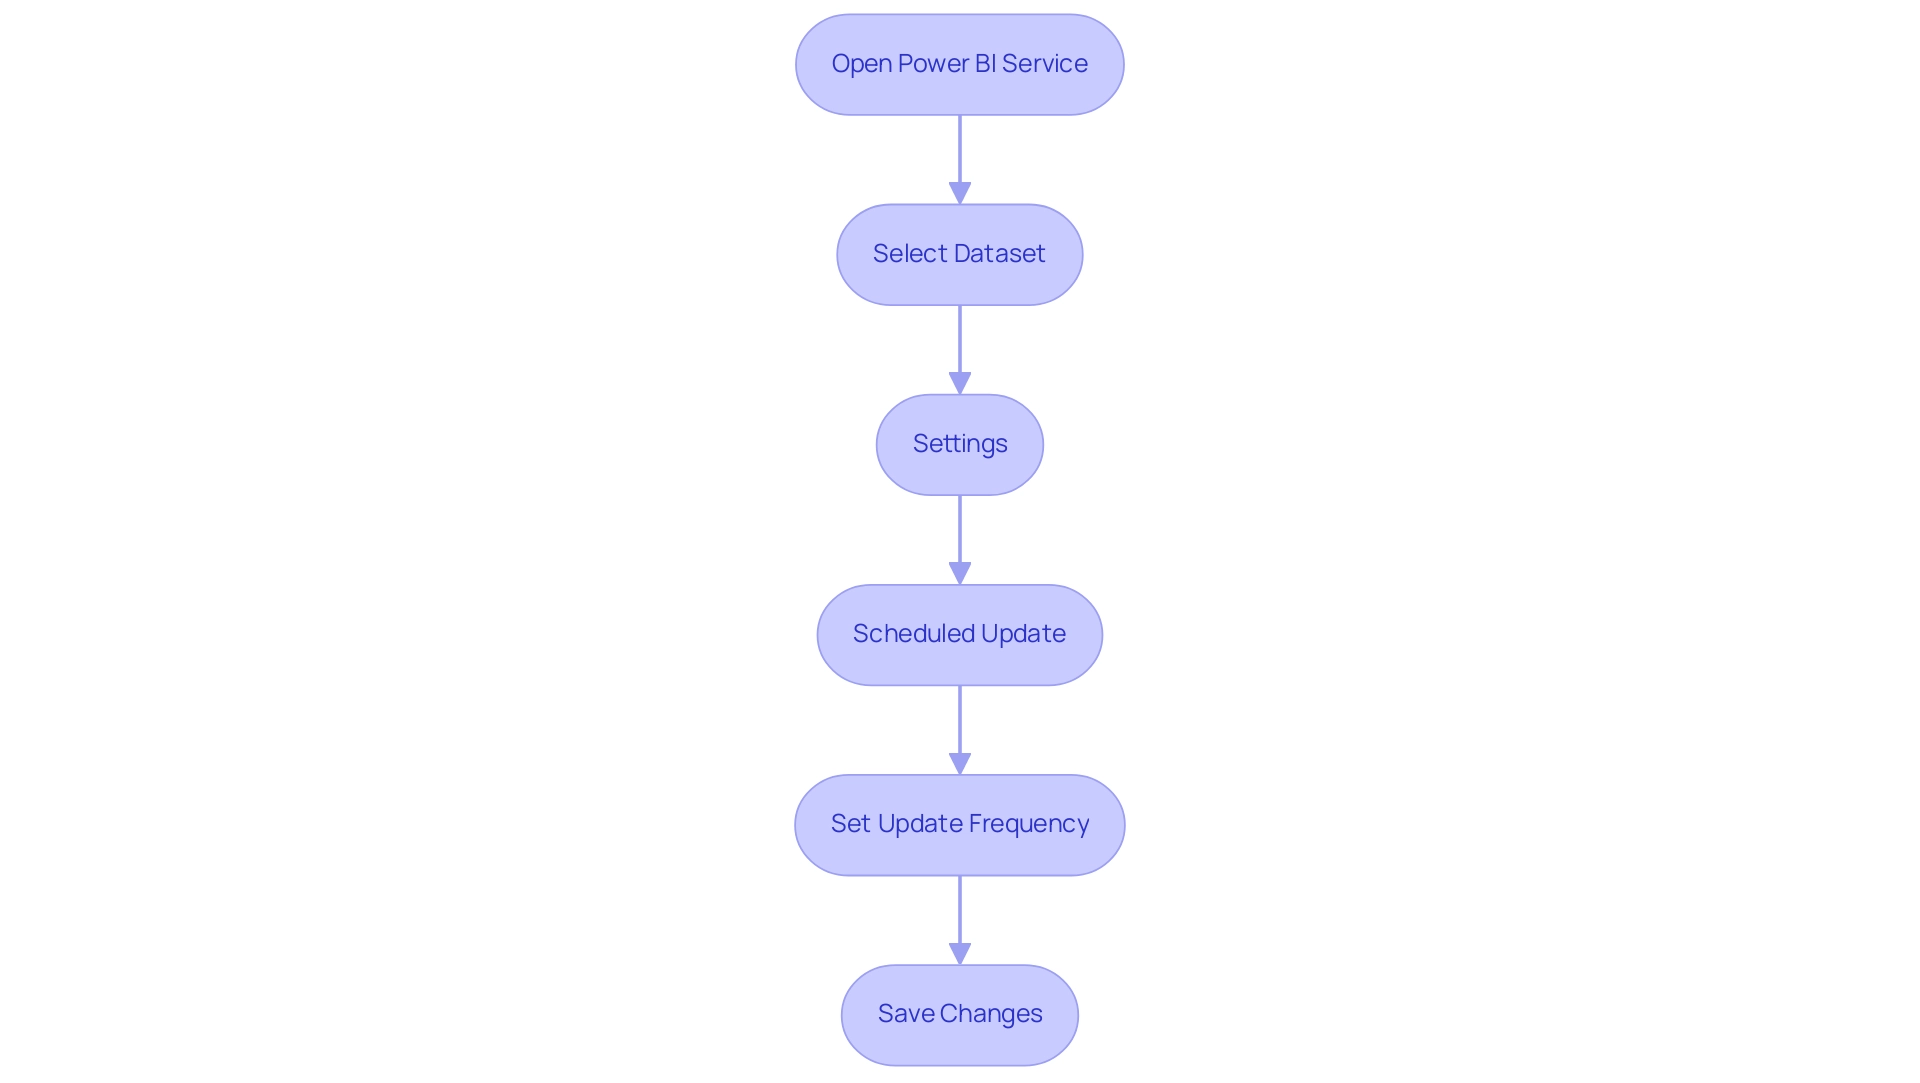
Step-by-Step Guide to Setting Up Scheduled Refresh in Power BI
Understanding how to refresh Power BI through a scheduled refresh is a simple yet essential procedure that greatly improves your information management efficiency. In today’s data-driven landscape, maintaining engagement with your documents is vital, particularly as Power BI deems a semantic model inactive after two months of inactivity. Frequent updates are crucial to address the typical difficulties of time-consuming documentation creation, information inconsistencies, and the absence of actionable insights from your dashboards.
To automate your data update effectively and ensure your reports are always current, follow these steps:
- Open Power BI Service: Begin by logging into your Power BI account and navigating to the workspace containing your desired dataset.
- Select Dataset: Locate the dataset for which you want to arrange an update. Click on the ‘More options’ (represented by three dots) adjacent to it.
- Settings: Select ‘Settings’ to access the dataset settings page.
- Scheduled Update: In the ‘Scheduled update’ section, toggle the switch to ‘On’ to activate this feature.
- Set Update Frequency: Determine how often you wish the update to occur—options include daily or weekly—and specify the appropriate time zone.
- Save Changes: Finally, click ‘Apply’ to save your configurations.
By following these steps, you can effectively learn how to refresh Power BI to automate your information update processes, ensuring the relevance and precision of your reports. Mussarat Nosheen emphasizes the necessity of setting up a data gateway for on-premises data sources, stating, ‘For on-premises data sources, setting up a data gateway is crucial.’ This demonstrates the significance of sustaining a continuous connection during the update process.
Furthermore, following optimal procedures, as emphasized in the case study ‘Best Practices for Scheduled Update in BI,’ can result in quicker update times and enhanced performance. Simplifying information models and implementing incremental refresh are proactive strategies that not only mitigate common issues, such as source connection errors and refresh timeouts but also align with broader efforts to enhance operational efficiency through Business Intelligence and RPA.
Moreover, utilizing our ‘3-Day BI Sprint’ can accelerate the development of professionally crafted documents, while the ‘General Management App’ offers extensive oversight and intelligent evaluations, further improving your reporting abilities. By addressing these challenges, you can unlock the full potential of your information and drive informed decision-making.
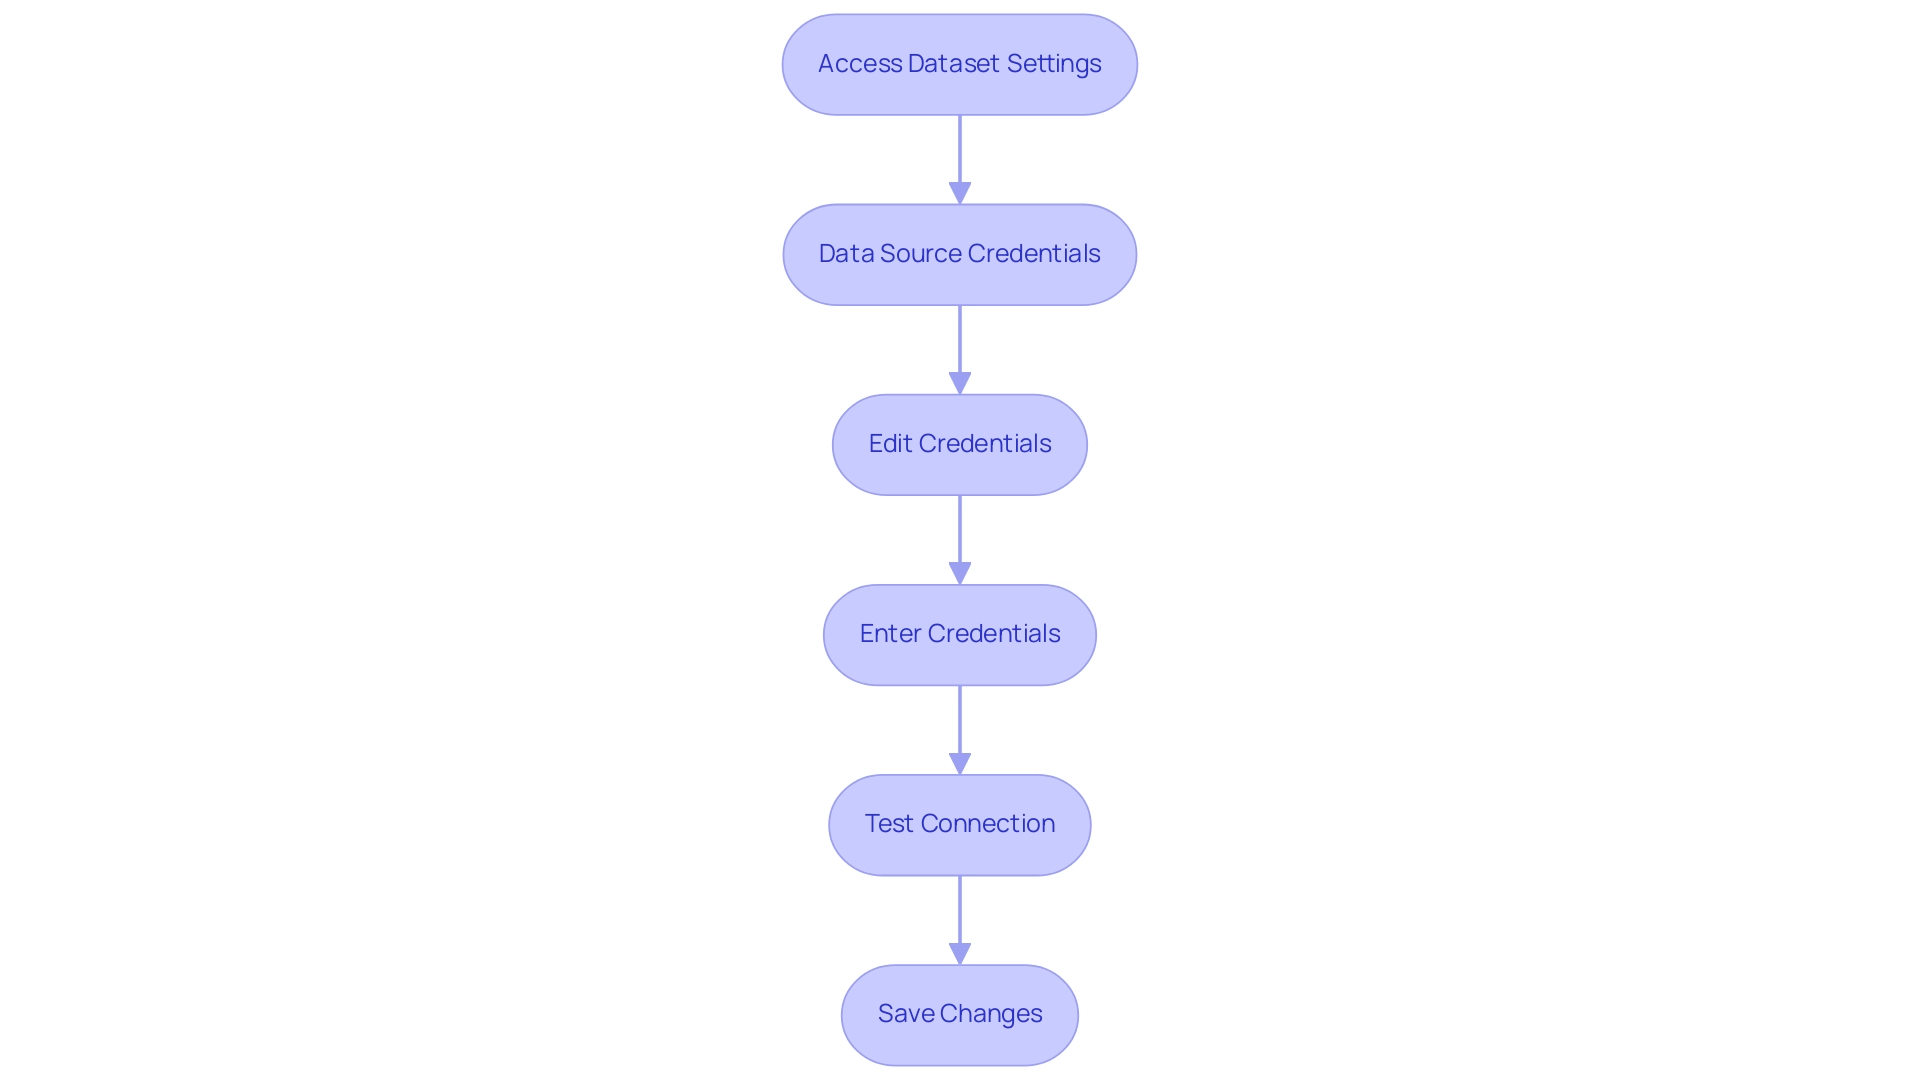
Configuring Data Source Credentials for Successful Refresh
Setting up source credentials in Power BI is crucial for understanding how to refresh Power BI effectively and maintaining accuracy, which are vital for extracting actionable insights and driving business growth. In today’s information-rich environment, companies that struggle with time-consuming document creation and information inconsistencies face a competitive disadvantage. Precise reporting is essential, as demonstrated by the mean profit of 8,833 units and a median profit of 7,000 units, highlighting the necessity for trustworthy information management.
Moreover, integrating Robotic Process Automation (RPA) solutions can streamline the process of information handling, significantly reducing the time spent on report generation and minimizing inconsistencies. Follow these steps to establish a secure connection:
- Access Dataset Settings: In the BI Service, locate your dataset and select ‘Settings’.
- Data Source Credentials: Scroll to the ‘Data source credentials’ section to view your current settings.
- Edit Credentials: Click on ‘Edit credentials’ and select the appropriate authentication method, such as Basic or OAuth.
- Enter Credentials: Input your username and password, or any other required information, then click ‘Sign In’.
- Test Connection: After entering your credentials, select ‘Test connection’ to confirm that BI can successfully access your source.
- Save Changes: Once the connection is validated, make sure to save your changes.
Implementing Azure Active Directory (AAD) for authentication not only simplifies credential management but also enhances security through features like Single Sign-On and conditional access policies. For instance, the case study titled ‘Using Azure Active Directory (AAD) for Authentication’ illustrates how organizations leveraging AAD have benefited from improved security and streamlined credential processes.
As noted by Harris Amjad, > Descriptive statistics also help us understand the world around us; this is particularly relevant here as effective credential management directly contributes to operational efficiency and accurate reporting. Addressing these challenges and following these steps on how to refresh Power BI ensures your scheduled refreshes operate smoothly, enabling you to deliver accurate and timely reports that drive informed decision-making and innovation.
Best Practices and Troubleshooting for Power BI Data Refresh
To enhance the efficiency of your Power BI data refresh process and leverage the full power of Business Intelligence, implementing the following best practices is essential:
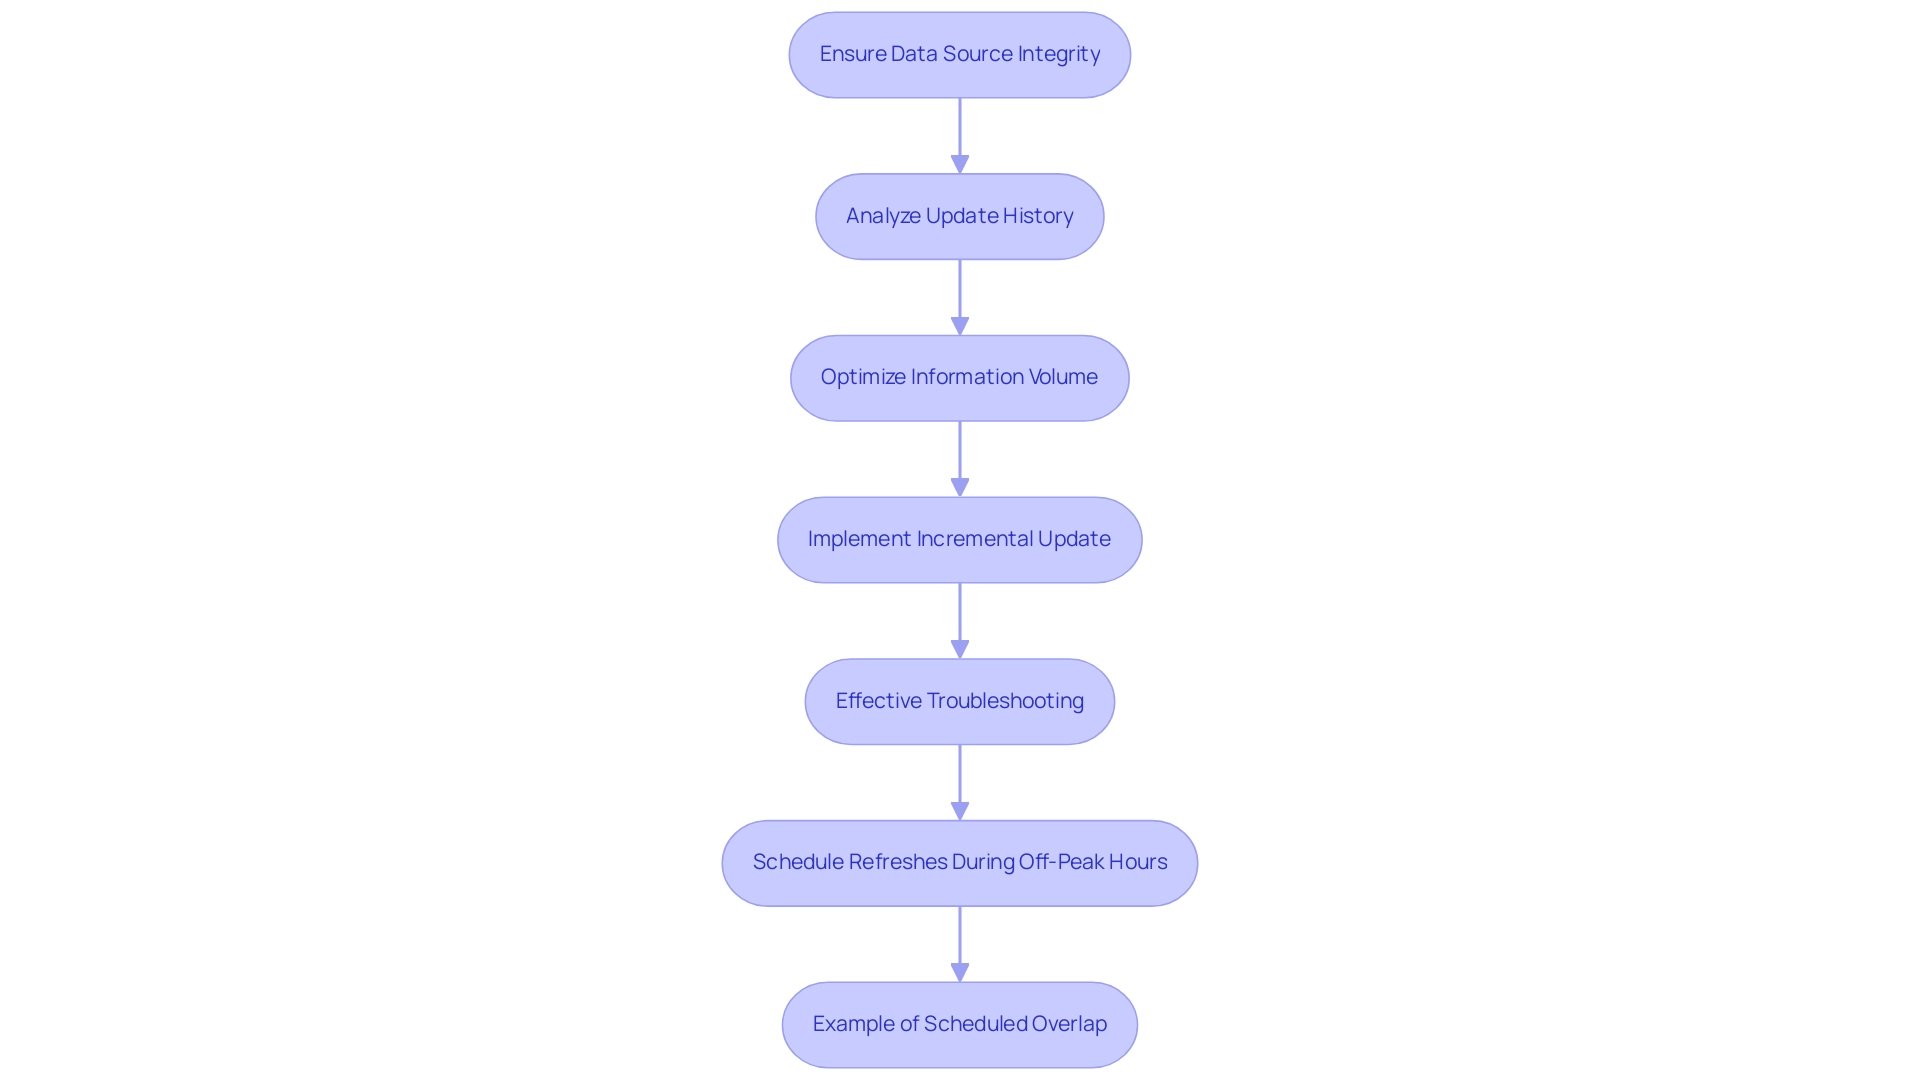
- Ensure Data Source Integrity: Regularly verify that your data sources are reliable and current. This reduces the risk of update errors and ensures a seamless upgrade, fostering data-driven decision-making that is crucial for maintaining a competitive edge in today’s market.
- Analyze Update History: Conduct a routine review of the update history to identify any failures or recurring issues that may hinder performance, ensuring that your team can tackle inefficiencies promptly.
- Optimize Information Volume: Limit the information volume being retrieved during update operations. This approach not only enhances performance but also decreases the chances of overlaps, which can result in inefficiencies in scheduled operations, a common challenge for many organizations.
- Implement Incremental Update: For extensive datasets, leveraging incremental update techniques allows you to modify only the information that has changed, significantly improving update times and reducing resource consumption—an essential strategy for operational efficiency.
- Effective Troubleshooting: In the event of update failures, verify data source credentials, ensure accessibility of data sources, and thoroughly review error messages from the update history for insight on how to resolve issues.
Additionally, it is crucial to schedule refreshes during off-peak hours to enhance performance. For instance, scheduled update #2 takes an average of over 48 minutes to complete, often causing it to overflow into the next time slot. isUzu 2019, a BI Super User, emphasizes, “If you make any changes in your BI desktop file (add a new chart, new column to your table, any DAX), you have to publish every time to BI service.”
This emphasizes the challenges encountered during the update process. Additionally, the case study titled “Example of Scheduled Overlap” illustrates the real-world implications of overlapping updates, where an administrator is prompted to contact the owners of the scheduled update to reschedule, thereby improving the efficiency of update operations. By adopting these best practices, including the integration of RPA tools such as EMMA RPA or Microsoft Power Automate, and remaining vigilant about common troubleshooting strategies, you can discover how to refresh Power BI more efficiently and effectively, ultimately driving growth and innovation in your organization.
Conclusion
Mastering data refresh techniques in Power BI is crucial for organizations striving to enhance operational efficiency and drive informed decision-making. The article has explored the importance of timely and accurate data refresh processes, highlighting three primary methods:
- Manual refresh
- Scheduled refresh
- Automatic refresh
Each method has its unique advantages, allowing users to select the most suitable approach based on their specific needs and workflow.
Setting up scheduled refreshes not only automates the update process but also ensures reports remain relevant and actionable. By following the outlined steps and best practices, such as configuring data source credentials and implementing incremental refresh, organizations can significantly improve their reporting capabilities. Additionally, integrating Robotic Process Automation can streamline these processes further, reducing the burden of manual tasks and enhancing data quality.
Ultimately, effective data management through Power BI empowers organizations to unlock the full potential of their data, leading to better insights, strategic growth, and a competitive edge in the market. Embracing these techniques and best practices will pave the way for a more efficient, data-driven future, where insights are readily available to support operational excellence and innovation.
Overview
The article titled “How to Create Heat Maps in Power BI: A Step-by-Step Guide” focuses on providing a comprehensive methodology for generating heat maps within Power BI, emphasizing both the technical steps and the significance of visual data representation. It outlines essential techniques such as conditional formatting, utilizing matrix visuals, and integrating R or Python scripts, while also addressing common challenges and best practices to enhance clarity and effectiveness in data visualization, thus ensuring users can derive actionable insights from their data.
Introduction
In a world increasingly driven by data, the ability to visualize complex information effectively has become paramount for organizations striving for operational excellence. Heatmaps emerge as a transformative tool, offering a vibrant, intuitive way to uncover trends, patterns, and anomalies within vast datasets. As businesses navigate the rapid advancements in technology and the challenges of data overload, leveraging heatmaps in Power BI can significantly enhance decision-making processes and streamline workflows.
This article delves into the definition and importance of heatmaps, explores practical methods for creating them, and provides a step-by-step guide to optimizing data for impactful visualizations. By embracing these techniques, organizations can not only improve clarity in their reporting but also foster a culture of data-driven insights that propel growth and innovation.
Understanding Heatmaps: Definition and Importance
Heatmaps function as impactful graphical representations of information, where individual values are illustrated through a spectrum of colors. This visualization technique proves particularly advantageous for uncovering trends, patterns, and anomalies within extensive datasets. In the context of Power BI, heat maps in Power BI provide graphical representations that enable users to swiftly interpret complex information, offering a visual summary of data density and distribution.
By utilizing visual data representations alongside Robotic Process Automation (RPA), organizations can automate manual workflows, significantly reducing time and errors, thereby enhancing operational efficiency—crucial in today’s rapidly evolving AI landscape. For instance, production bays 3, 4, and 7 are performing within their expected thresholds, demonstrating how visual data representations can be utilized in monitoring operational performance. However, challenges such as time-consuming report creation, inconsistencies, and a lack of actionable guidance can hinder the effective use of Power BI dashboards.
As we enter 2024, the use of visual patterns in organizations is anticipated to increase, propelled by their capacity to enable swift analysis and enhance the understanding of information—essential elements in the pursuit of operational excellence. Paul Tulloch aptly notes, ‘Heatmaps are advantageous over scatterplots when there are too many data points to view on a scatterplot,’ highlighting their crucial role in effective data visualization. Furthermore, the integration of heat maps in Power BI into decision-making processes, along with Power BI’s 3-Day Sprint for report creation and the General Management App, has shown to significantly enhance organizational effectiveness, as evidenced by real-world applications where they have led to improved outcomes.
Additionally, correlograms serve as heatmap variants that replace the axes of a heatmap with lists of numeric variables, depicting the relationships between intersecting variables. These visualizations assist analysts in exploring relationships between variables, thereby supporting the narrative on decision-making and driving data-driven insights for business growth.
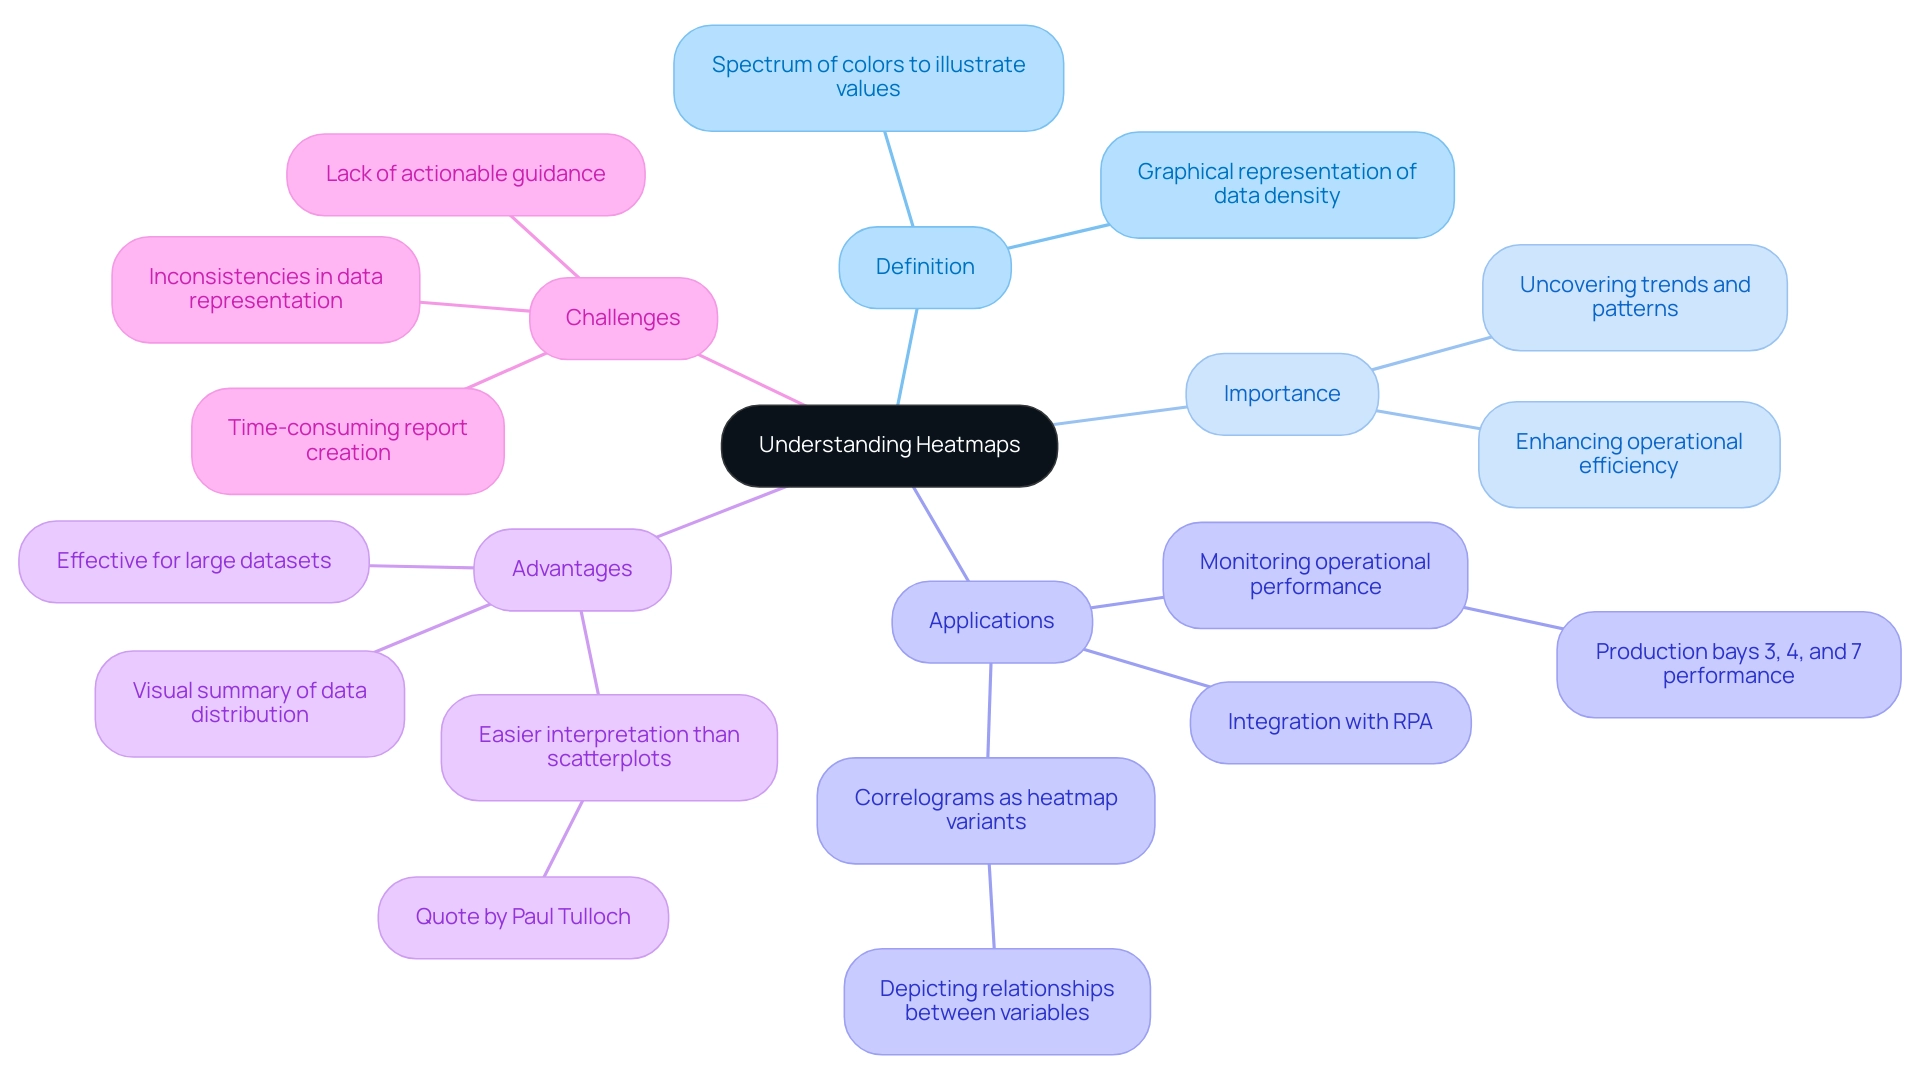
Methods to Create Heatmaps in Power BI: A Comprehensive Overview
Generating visualizations in Power BI not only provides a dynamic method to illustrate data trends but also tackles common issues encountered by organizations, such as time-consuming report creation and data inconsistencies. The rapidly evolving AI landscape can make it challenging to identify the right solutions, but visual representations can help in navigating these complexities. Here are several effective methods for crafting compelling heatmaps that drive actionable insights:
-
Conditional Formatting: This technique enables users to apply color scales directly to cells according to their values, effectively highlighting trends and variations. It serves as a straightforward yet powerful way to interpret complex information sets, ensuring stakeholders have clear, actionable guidance.
-
The Power BI marketplace offers a range of custom visuals, including specialized heat maps in Power BI that can be imported for advanced visualizations. Utilizing these visuals can enhance the depth of insights gained from the information, aligning with the need for comprehensive management solutions.
-
By leveraging matrix visuals, users can create heat maps in Power BI within a grid layout. This method streamlines the distribution representation of information, making it easier to identify patterns and anomalies, thereby improving operational efficiency.
-
R or Python Integration: For individuals seeking to explore further into analysis, incorporating R or Python scripts into Power BI enables the development of advanced graphical representations customized to particular analytical requirements. This method is especially beneficial for advanced users aiming to improve their storytelling and strategic decision-making.
Additionally, Coupler.io facilitates the integration of various data sources, including Google Sheets and Excel, into Power BI, significantly enhancing the data utilized for creating heat maps in Power BI visualizations.
A practical example of creating visual representations can be seen in the case study titled ‘Getting Started with Data Visualization in Power BI,’ where participants learned to design and customize various plots, including graphical representations of data, during a training webinar. This real-world application underscores the importance of mastering these techniques in navigating the overwhelming AI landscape and utilizing business intelligence for growth.
Moreover, graphical representations have found applications in the Sports Industry, where they are used to illustrate favorite zones of players and areas where bowlers achieve maximum wickets. This specific use case highlights the versatility and impact of graphical data representations across various fields.
As noted by Tarun Chaturvedi, a Data Science intern with Pickl.ai, > I am exploring the enormous potential of machine learning and artificial intelligence to provide solutions for businesses & learning <. This sentiment reflects the transformative impact of visualization techniques like heat maps in Power BI on driving operational efficiencies. Moreover, with usage rates of tailored visuals expected to rise in 2024, mastering these visualization creation techniques not only enhances your analytical abilities but also places you at the forefront of evidence-based decision-making.
To effectively manage inconsistencies and foster trust, implementing a governance strategy is essential.
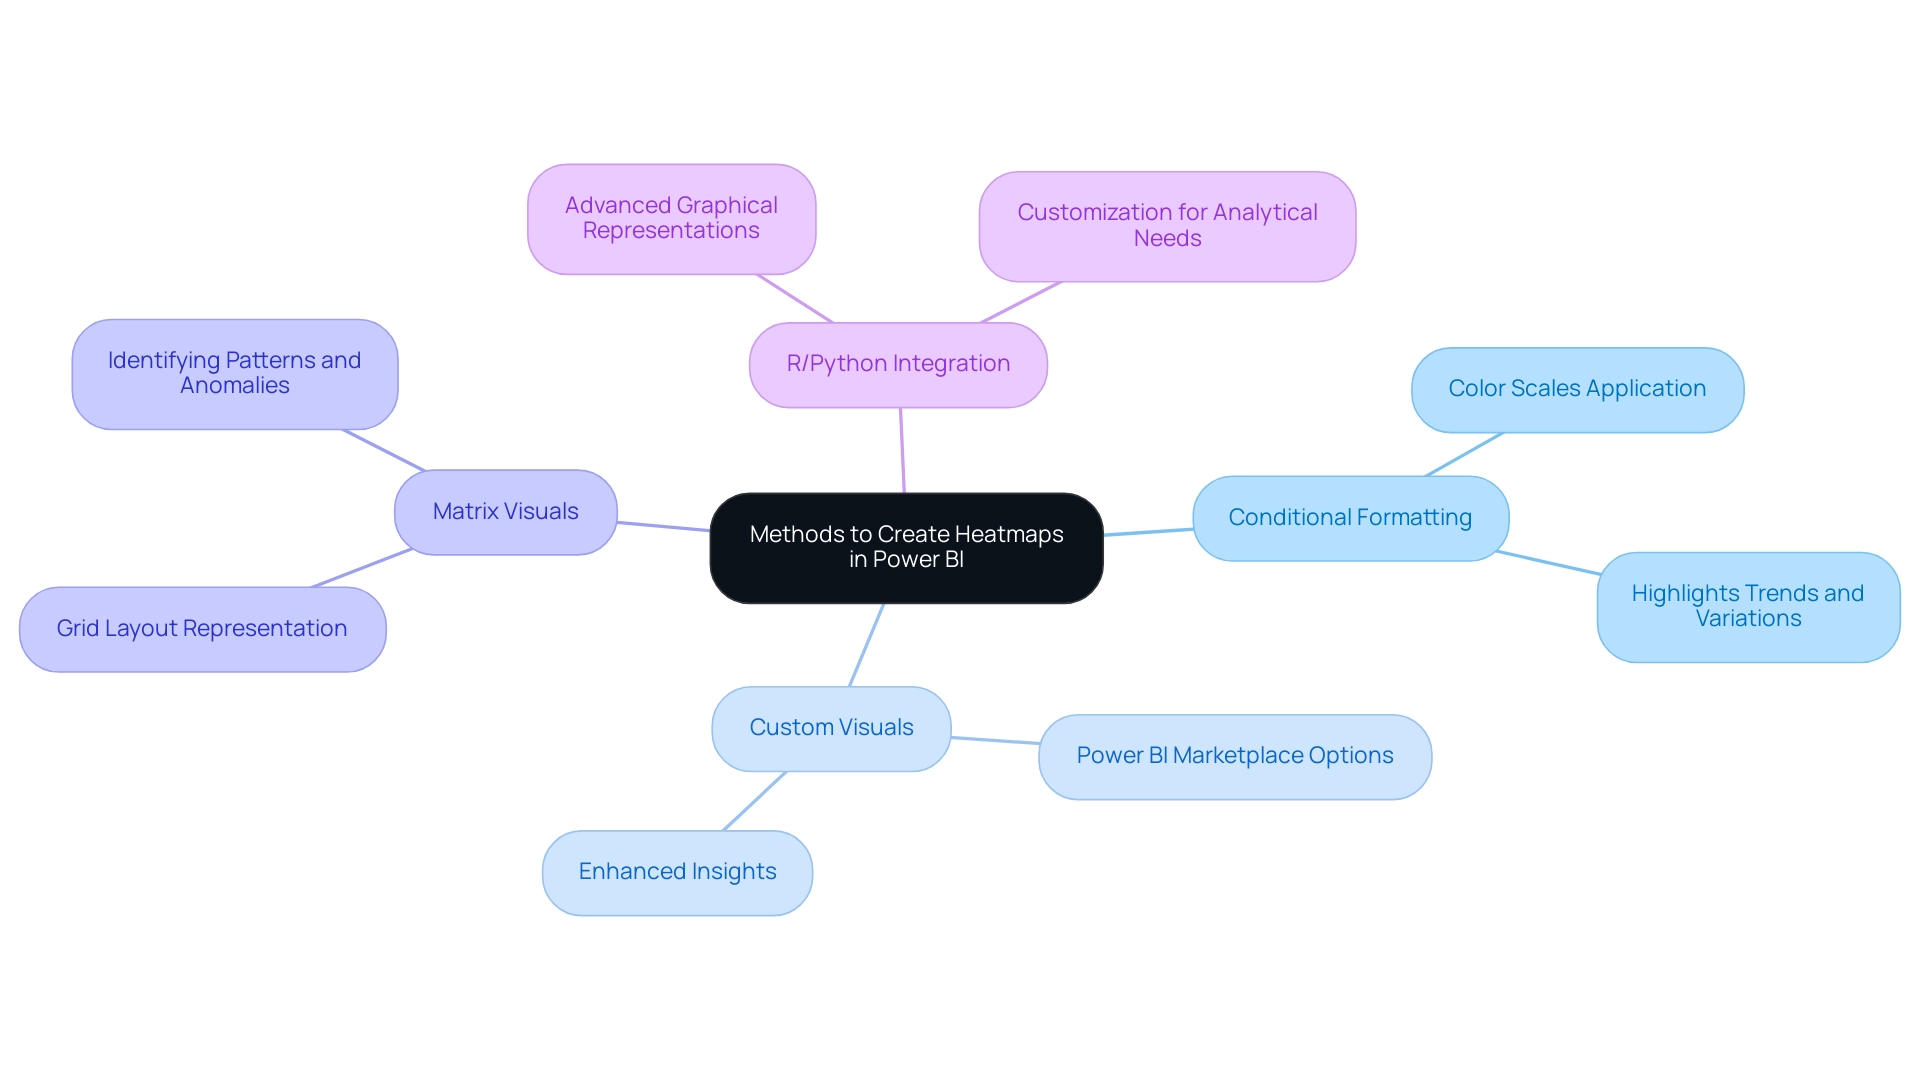
Step-by-Step Guide to Creating Heatmaps in Power BI
Producing a visual representation in Power BI is a simple task that can significantly improve your visualization abilities, particularly when addressing typical obstacles. Follow these empowering steps to create an effective heatmap while utilizing insights from your information:
- Open Power BI Desktop and load your dataset to get started. This initial step ensures you are working with the most relevant data.
- Select the Matrix Visual from the Visualizations pane, which will serve as the foundation for your heatmap.
- Drag and Drop Fields: Organize your information by placing categorical entries in the Rows and Columns fields, while numerical figures go in the Values field. This structure is essential for effective visualization and helps to mitigate inconsistencies.
- Apply Conditional Formatting: Click the dropdown arrow in the Values field, select ‘Conditional formatting’, and then choose ‘Background color’ to add a dynamic visual element. This aids in establishing clarity in your reports, tackling the common problem of unclear information presentations.
- Set Color Rules: Define your color scale to represent value ranges effectively. For example, a gradient from red (indicating low values) to green (indicating high values) can provide immediate visual cues to users, guiding them towards actionable insights.
- Utilize Binning: To enhance readability, particularly when measure values differ significantly, consider applying binning. This technique groups data points into defined ranges, enhancing clarity and assisting in delivering clear guidance from your reports.
- Adjust Formatting: Tailor your visual representation’s appearance by modifying font sizes, gridlines, and overall layout. Customization is essential for enhancing readability and ensuring user engagement metrics are met.
- Refer to Best Practices: As highlighted in the case study titled ‘Key Points for Using heat maps in Power BI’, it is important to pay attention to color choices and handling empty values in your dataset. These considerations are vital for creating effective visualizations that stakeholders can trust.
- Save and Publish: After finalizing your visualization, save your Power BI report and publish it to the Power BI service for enhanced sharing and collaboration. This enables broader access to the insights obtained from your information, promoting a knowledge-driven culture within your organization.
By following these steps, you not only create impactful heat maps in Power BI but also provide clear, actionable guidance that addresses the common challenge of report clarity. As Iason Prassides emphasizes,
Learn principles of dashboard design to apply to your own dashboards.
Additionally, understanding user engagement metrics, such as tracking requests during browsing sessions (with cookies expiring after 6 months), can provide valuable insights for future analysis.
This approach ensures that your heat maps in Power BI function as a powerful tool for driving operational efficiency and informed decision-making.
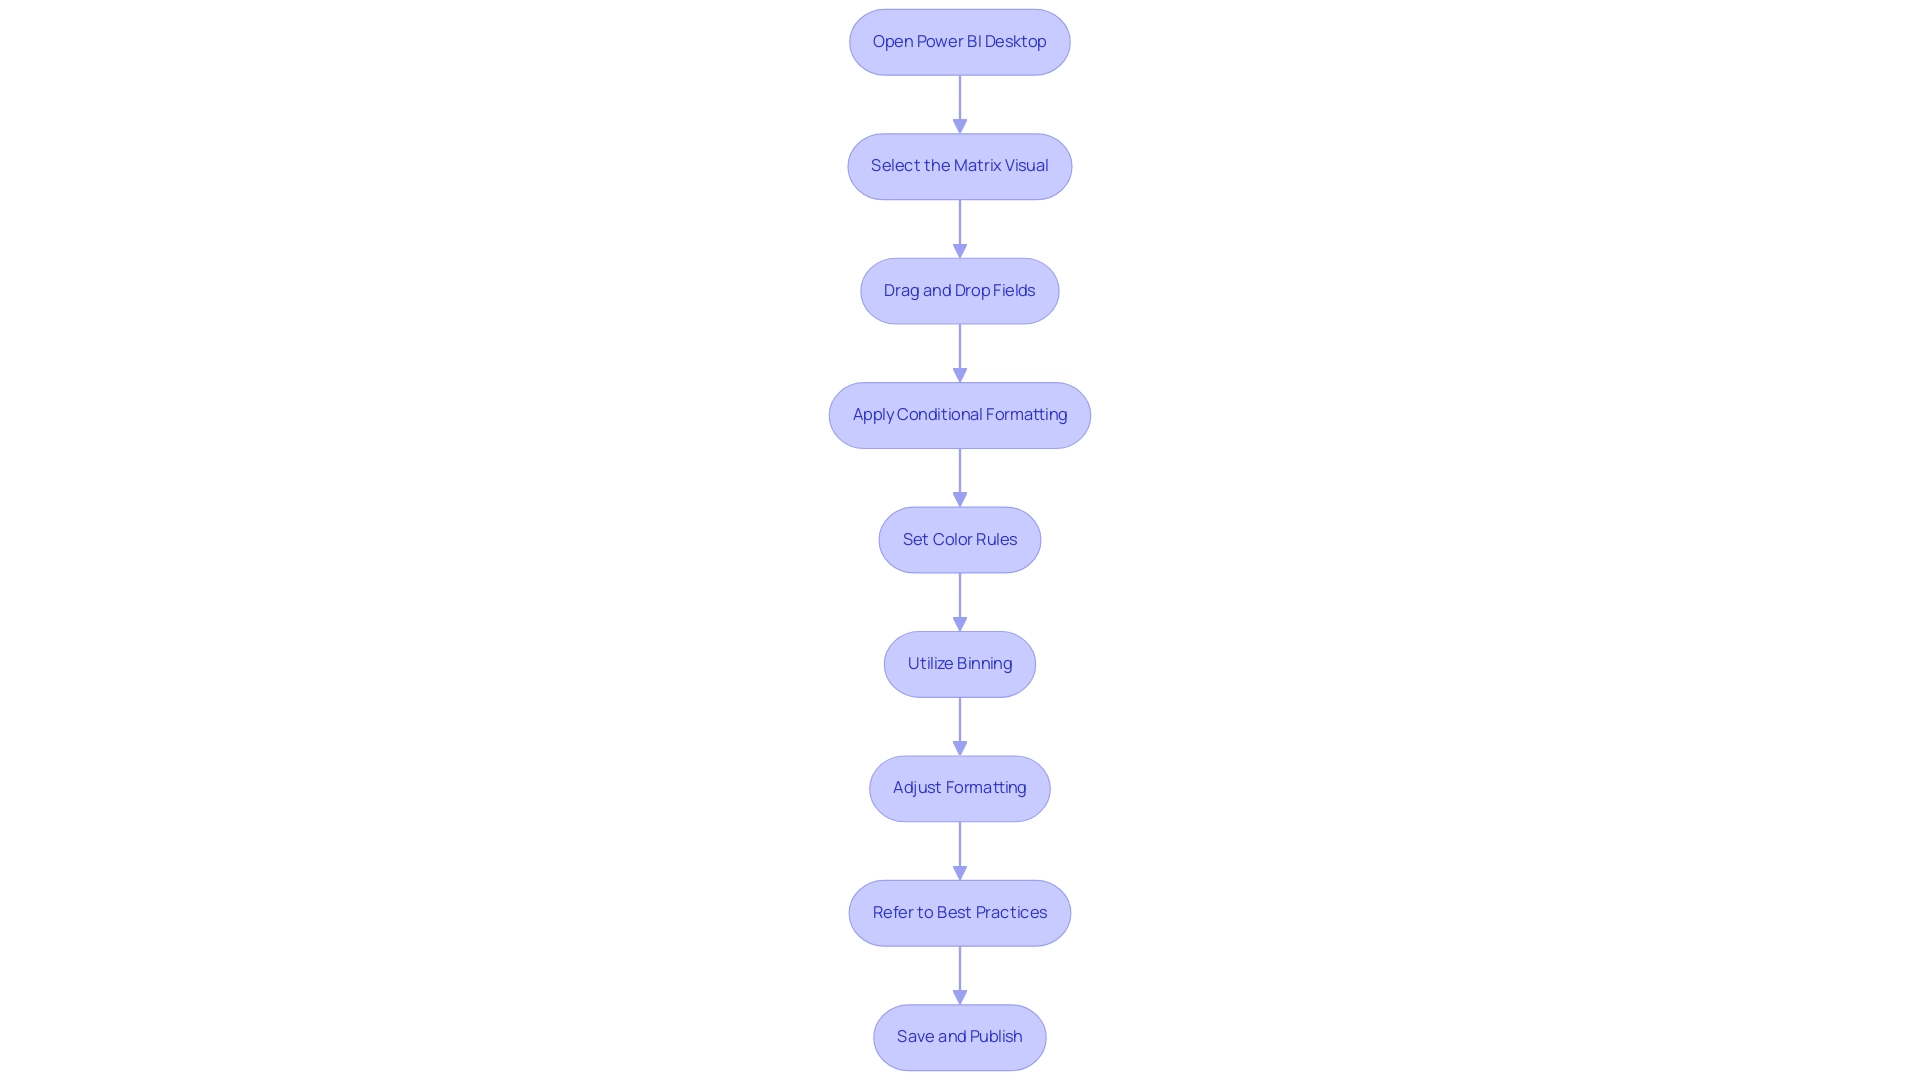
Optimizing Your Data for Effective Heat Mapping
To enhance your information for effective heat mapping and drive operational efficiency, follow these essential steps:
-
Clean Your Data: Start by removing duplicates, filling in missing values, and correcting inconsistencies. Managing absent information appropriately is crucial for creating an accurate and meaningful visual representation, as emphasized by Adrian Wallace, a Solution Architect and Machine Learning Engineer. In Python, the Pandas library provides functions like
isnull()andisna()to assist in identifying and managing missing information effectively. Implementing RPA can streamline this process, reducing the manual effort needed for cleansing, while tailored AI solutions can further enhance quality by ensuring consistency and accuracy throughout the cleaning phase. -
Aggregate Information: Summarize your information at the appropriate level—whether daily, weekly, or monthly—to reduce clutter and enhance clarity in your heatmap. This practice not only simplifies the visualization but also highlights key trends through the use of heat maps in Power BI. Recent developments, such as JMP’s addition of heatmaps for pairwise correlations in scatter plot matrices, demonstrate the growing importance of effective information aggregation in visual analytics. Utilizing Business Intelligence tools can aid in automating and optimizing this aggregation process, ensuring that the information is both relevant and actionable.
-
Standardize Formats: Ensure all entries maintain a consistent format, such as uniform date formats and currency notations. This standardization is vital for facilitating precise comparisons across different sets, which can be enhanced through tailored AI solutions that ensure quality and consistency during the standardization process.
-
Use Appropriate Measures: Select metrics that will yield meaningful insights when visualized. Utilize averages, sums, or counts to provide clarity and relevance in your heat maps in Power BI. A well-structured Business Intelligence framework can help in identifying the right metrics that align with your business goals, while tailored AI solutions can assist in determining which measures provide the most significant insights.
-
Test Different Scales: Experiment with various scales and aggregations to identify the best representation for your specific dataset. This iterative method enables the identification of the most effective visual storytelling techniques, improving the decision-making process based on precise analysis. Heat maps in Power BI are especially potent because they can demonstrate relationships between multiple variables. As shown in the case study on generating a heat map based on a correlation matrix using Covid information, effectively visualizing relationships can reveal significant correlations, such as the strong link between total cases and total deaths (0.93). By optimizing your information preparation processes with RPA and Business Intelligence, and leveraging tailored AI solutions, you can create insightful heat maps in Power BI that enhance informed decision-making and operational efficiency.
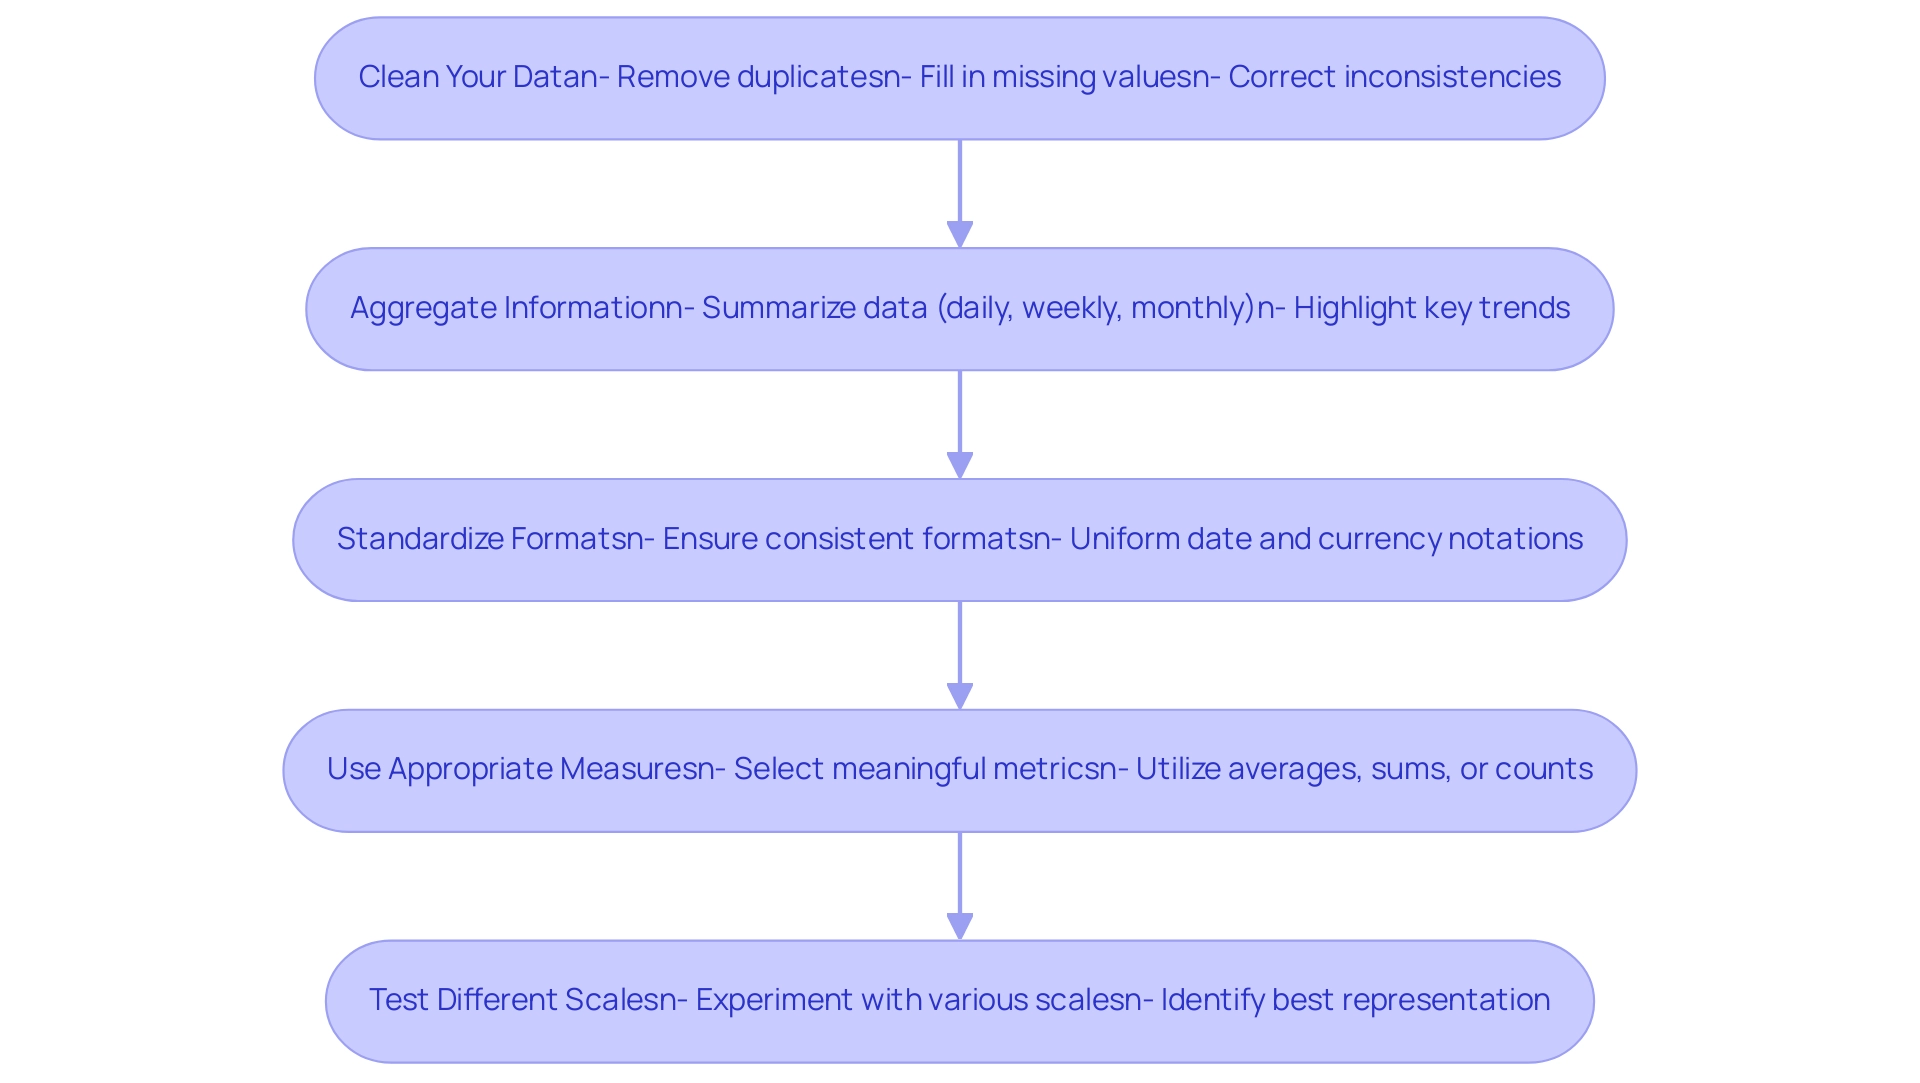
Common Challenges in Creating Heatmaps and How to Overcome Them
Creating effective heat maps in Power BI can present several challenges, but with the right strategies and tools like RPA, tailored AI solutions, and Business Intelligence, these obstacles can be overcome.
-
Information Overload: An abundance of information can clutter your heatmap, making it difficult for viewers to discern key insights. To combat this, prioritize essential metrics and consolidate your information thoughtfully, ensuring clarity and focus.
-
Robotic Process Automation (RPA) can assist in streamlining information collection, enabling the prioritization of relevant details, while customized AI solutions can analyze trends to guide your selection of content for your heatmap.
-
Color Perception Issues: Not all viewers perceive colors the same way. Opt for color-blind friendly palettes and ensure your choices provide adequate contrast. This method improves accessibility and guarantees that your visual representation is comprehensible to a broader audience, fostering inclusivity in information interpretation.
-
Incorrect Information Representation: Misleading visualizations often stem from inaccurate aggregation or formatting. It’s essential to double-check your calculations and information sources before finalizing your heatmap to maintain accuracy and reliability. Utilizing Business Intelligence tools, such as heat maps in Power BI, can assist in ensuring that the information is accurately represented, avoiding potential pitfalls in interpretation. Without these insights, your organization risks falling behind competitors who utilize precise information for decision-making.
-
Performance Issues: Large datasets can hinder the performance of heat maps in Power BI. Streamline your information model by minimizing unnecessary columns and rows, which can significantly enhance loading times and responsiveness. Automating the visualization process with tools like Power Automate ensures accuracy and timely updates, further enhancing performance. RPA can also aid in optimizing processing, allowing for quicker turnaround times on reports.
-
User Confusion: To facilitate easy interpretation of your heatmap, incorporate clear legends and labels. This clarity helps viewers understand the context and significance of the data presented, reducing confusion and enhancing user experience. As Micah Bowers, a verified expert in design, notes,
Crafting meaningful connections through design is essential in all forms of visualization.
By ensuring that your heatmaps are not only visually appealing but also clear and informative, you can empower your audience to make data-driven decisions effectively, driving growth and innovation for your organization.
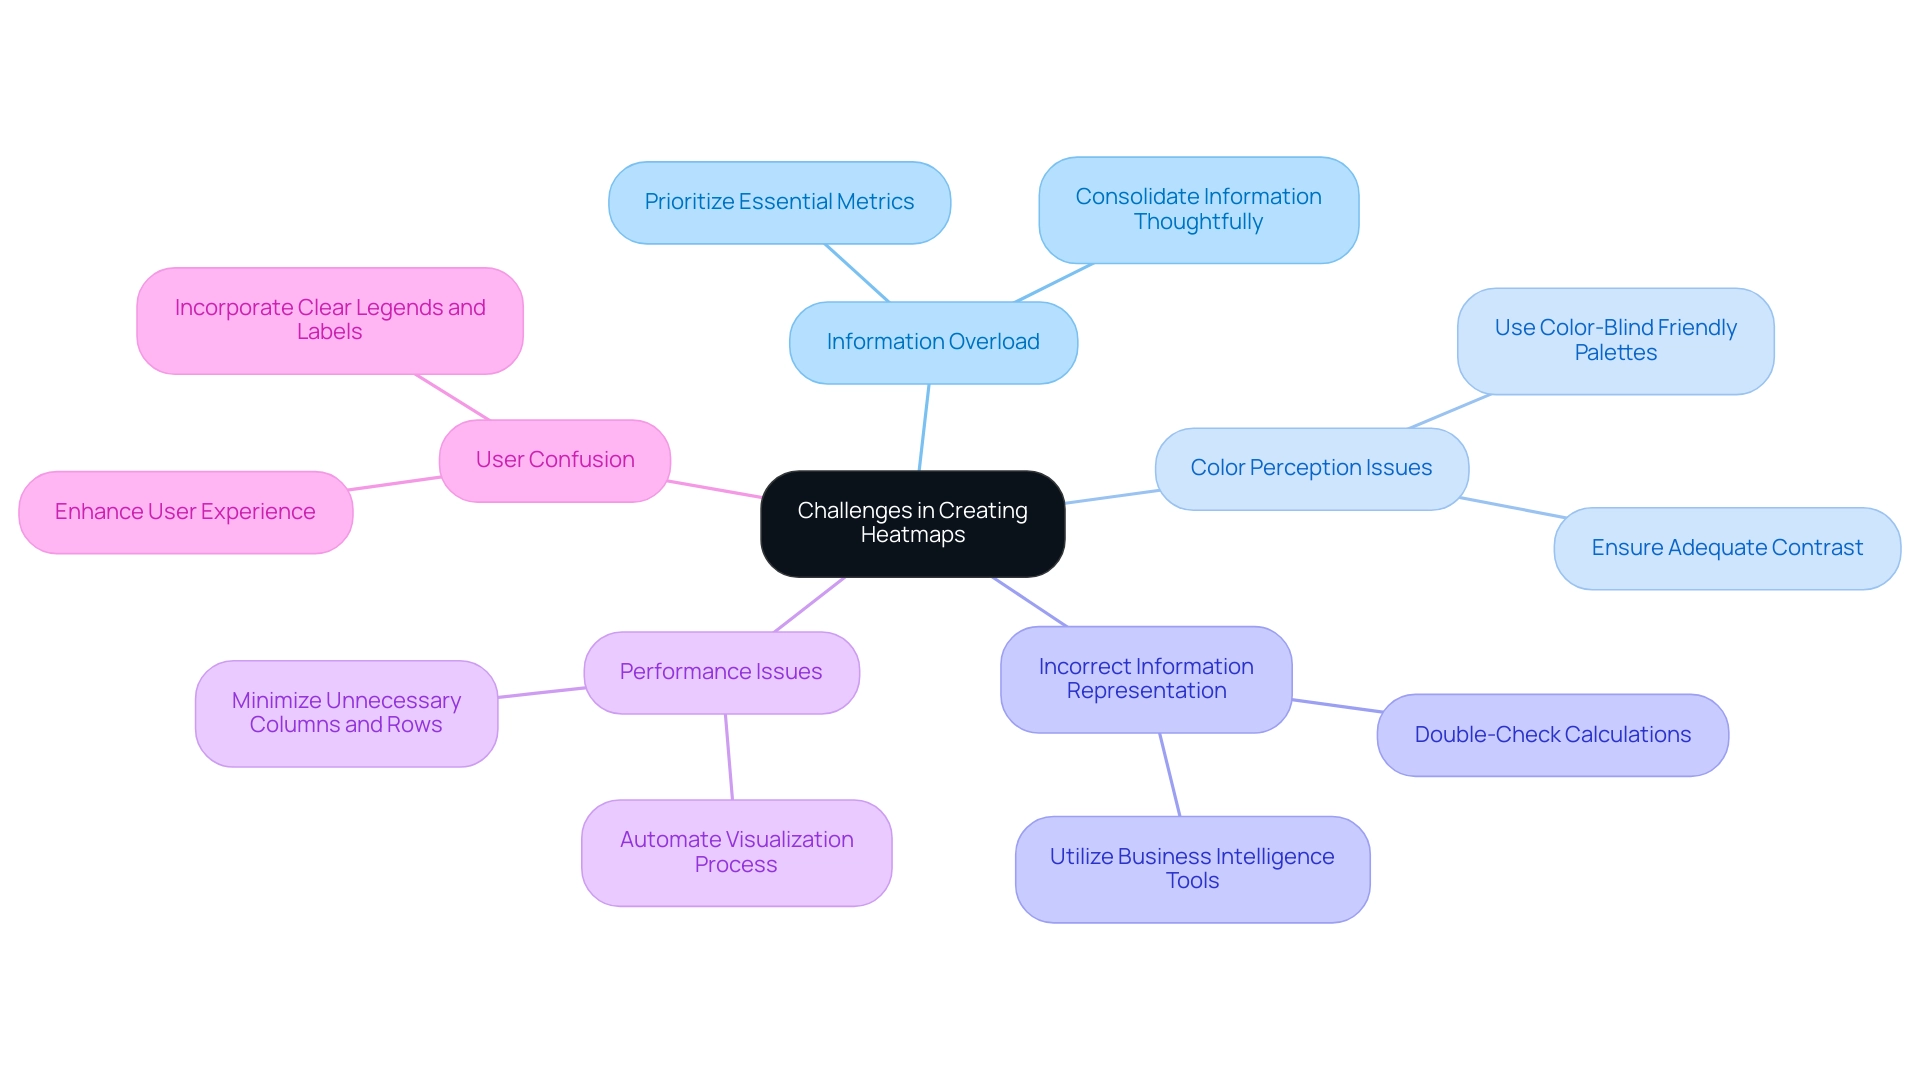
Conclusion
Harnessing the power of heatmaps in Power BI is an essential strategy for organizations striving for operational excellence in today’s data-driven landscape. By effectively visualizing complex datasets, heatmaps not only reveal trends and patterns but also enhance decision-making processes across the board. The article has outlined the definition and significance of heatmaps, the various methods to create them, and the steps required to optimize data for impactful visualizations.
As businesses face challenges such as data overload and inconsistencies, implementing heatmaps offers a solution that streamlines reporting and fosters a culture of data-driven insights. Techniques such as:
- Conditional formatting
- Custom visuals
- Integration with programming languages like R and Python
provide robust avenues for creating compelling heatmaps that drive actionable insights. Furthermore, optimizing data preparation through cleaning, aggregation, and standardization ensures that heatmaps convey clear and reliable narratives.
In conclusion, the adoption of heatmaps represents a transformative step towards enhancing operational efficiency and informed decision-making. By embracing these visual tools, organizations can navigate the complexities of their data landscape, ultimately positioning themselves for growth and innovation. The time to act is now; leveraging heatmaps can propel organizations forward, making data not just a resource but a strategic asset in achieving excellence.
Overview
The article focuses on how to effectively forecast in Power BI using DAX, providing a comprehensive step-by-step guide for users to create accurate predictive models. It emphasizes the importance of clean data, the utilization of specific DAX functions like FORECAST.ETS, and best practices such as regular updates and cross-departmental collaboration to enhance forecasting accuracy and operational efficiency.
Introduction
In the dynamic landscape of business intelligence, forecasting has emerged as a pivotal tool for organizations striving to maintain a competitive edge. Power BI, with its robust capabilities, empowers users to transform historical data into actionable insights, facilitating informed decision-making that drives operational efficiency.
By harnessing advanced DAX functions and integrating innovative solutions like Robotic Process Automation, businesses can refine their forecasting models, address common challenges, and unlock the true potential of their data.
As organizations navigate the complexities of predictive analytics, understanding the nuances of forecasting in Power BI becomes essential for enhancing responsiveness to market changes and optimizing strategic planning.
This article delves into the intricacies of forecasting within Power BI, offering practical guidance and best practices to elevate forecasting accuracy and operational effectiveness.
Introduction to Forecasting in Power BI
The process of forecasting in Power BI using DAX is crucial for Business Intelligence, as it allows companies to anticipate future values based on historical trends, thus promoting informed decision-making essential for operational efficiency. By utilizing DAX (Data Analysis Expressions), users can improve forecasting in Power BI using DAX, enhancing the accuracy of these predictions and building sophisticated models that visualize potential future outcomes. However, it is important to note that BI may be less effective for erratic data or data lacking a time component, which could necessitate the use of custom models or external tools.
As the Power BI Team aptly states,
Hindcasting shows how the forecast would’ve predicted the recent past, from the vantage point of the past.
This highlights the significance of historical context in predicting. The validation set utilized for these forecasts includes information from 1997 to 2014, covering 17 years and representing approximately 30% of the dataset, providing a robust foundation for analysis.
With the newest enhancements in BI for 2024, users can utilize advanced DAX functions for forecasting in Power BI using DAX to enhance their prediction methods and improve strategic planning, tackling frequent issues such as time-consuming report generation and inconsistencies in information. Furthermore, incorporating Robotic Process Automation (RPA) tools such as EMMA RPA and Automate can simplify data processes, automate report generation, and improve operational efficiency. The integration of custom forecasting models using R and Python allows for complex analysis and machine learning techniques, resulting in more accurate and comprehensive forecasts, as demonstrated in the case study on Custom Forecasting Models with R and Python.
By understanding and implementing these tools, businesses can significantly enhance their operational efficiency and responsiveness to market changes, unlocking the true power of Business Intelligence.
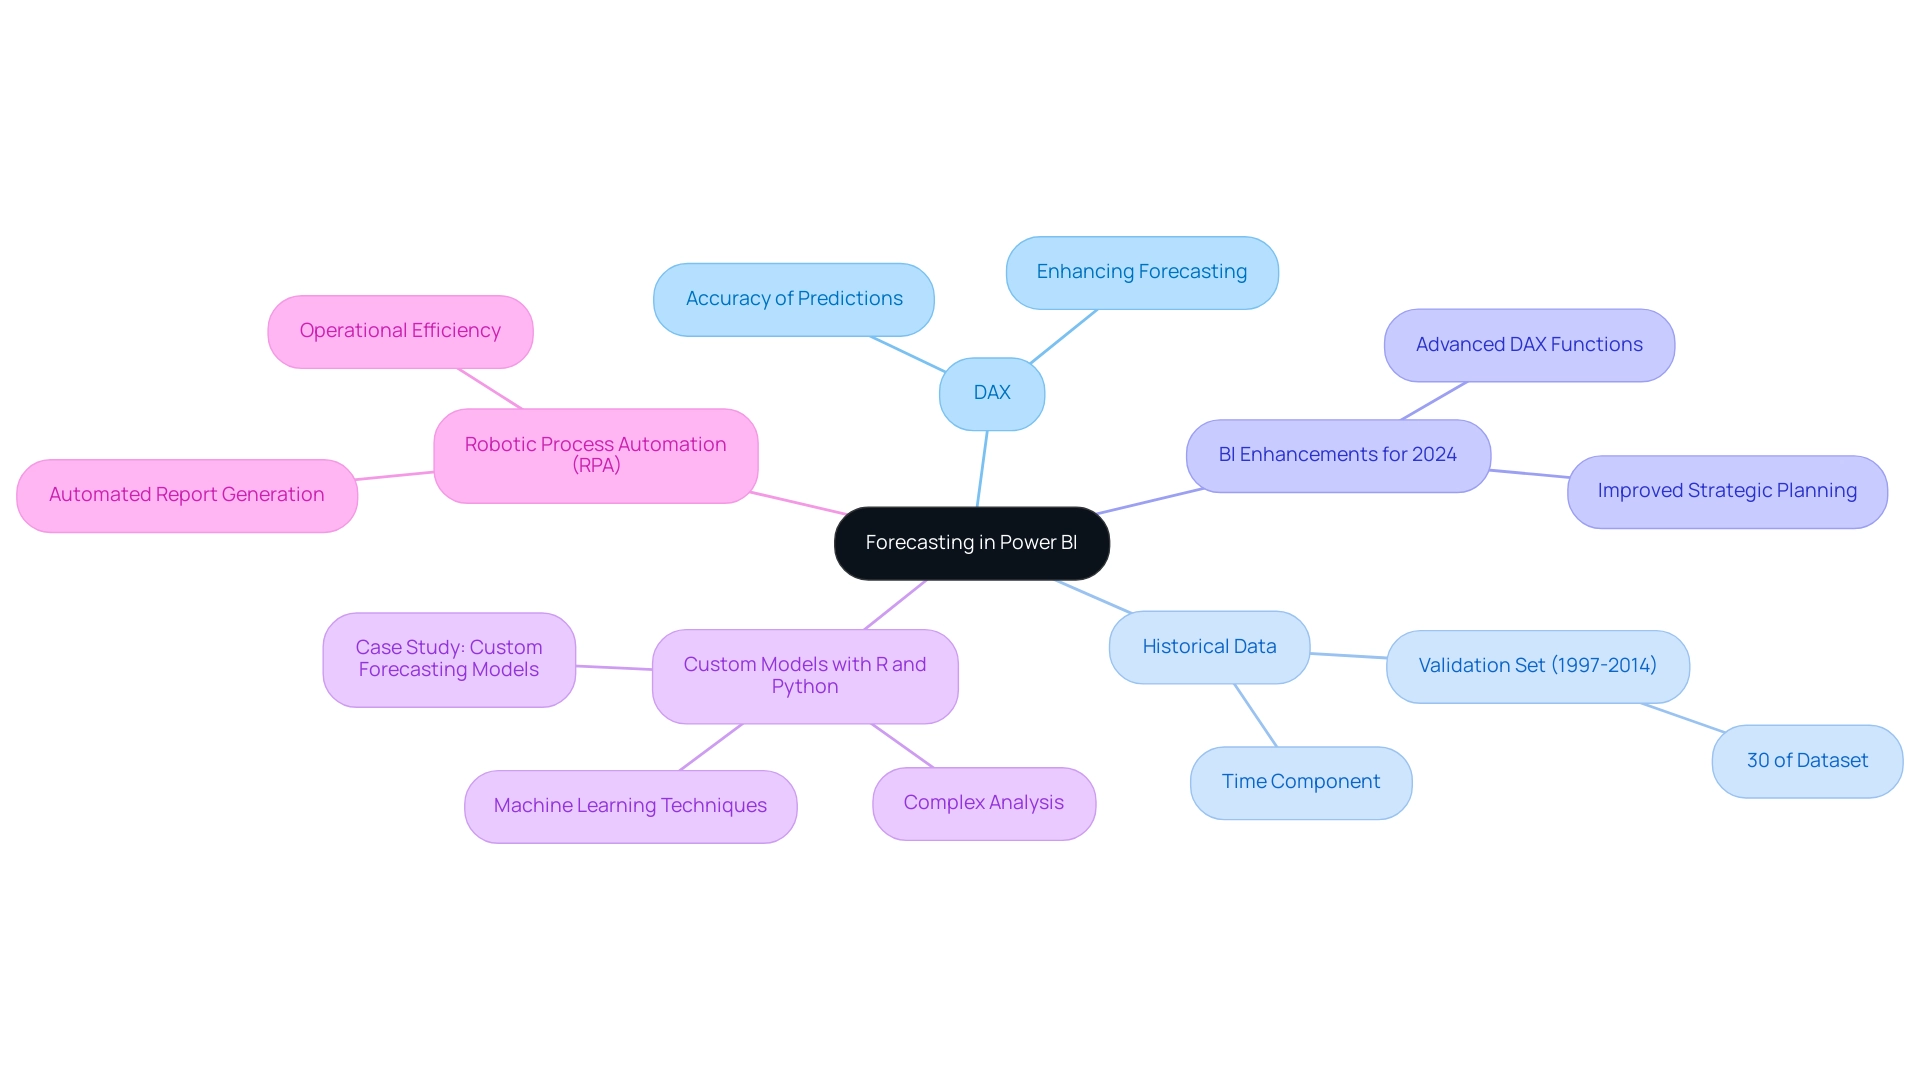
Step-by-Step Guide to Using DAX for Forecasting
-
Open Power BI Desktop: Begin by launching Power BI Desktop and importing your dataset. It is crucial that your information is clean and well-structured to facilitate effective analysis, as challenges in predictive analytics often stem from poor master information quality and inconsistent details, leading to inefficient operations and flawed decision-making.
-
Create a New Measure: In the Fields pane, right-click on your table and select ‘New Measure’. This is the space where you will craft your DAX formula for forecasting in Power BI using DAX.
-
Write Your DAX Formula: Utilize the following DAX formula to create a straightforward forecast:
Forecast = FORECAST.ETS(<target_value>, <timeline>, <seasonality>, <data>)Substitute
<target_value>,<timeline>,<seasonality>, and<data>with your specific parameters, ensuring that you align these inputs with your dataset for accurate predictions. -
Visualize Your Forecast: After establishing the measure, enhance your report by adding a line chart. Drag your timeline field to the axis and the forecast measure to the values. This visualization will effectively represent your forecasted information, helping to bridge the gap between insights and actionable guidance.
-
Adjust Forecast Parameters: Experiment with various seasonality settings to observe how they influence your forecast. This iterative process is vital for honing your predictions and understanding the dynamics of your data. As highlighted in a case study on predictive analytics challenges, implementing best practices for model validation can significantly enhance prediction accuracy, thereby addressing barriers to effective AI integration.
-
Review and Analyze: Once your forecast is configured, conduct a thorough analysis of the results. Compare the predicted values against actual outcomes to assess accuracy and improve your prediction method as needed. For further learning, Joleen Bothma provides an 11-minute tutorial on advanced analytical features in BI, which can deepen your understanding of these techniques and foster confidence in leveraging AI technologies.
By following these steps, you harness the capabilities of DAX for forecasting in Power BI using DAX, which enables your organization to make informed, data-driven decisions that enhance operational efficiency. As Joleen Bothma, a Data Science Consultant, states, “BI makes it easy to build predictive models that can help you make informed decisions and stay ahead of the competition.” Embracing these tools effectively can transform the way you tackle quality challenges and unlock the full potential of AI in your organization.
Moreover, by utilizing the user-friendly features of BI, you can mitigate the common perception of AI projects being time-intensive and costly, allowing for a more accessible integration of AI technologies into your operations.
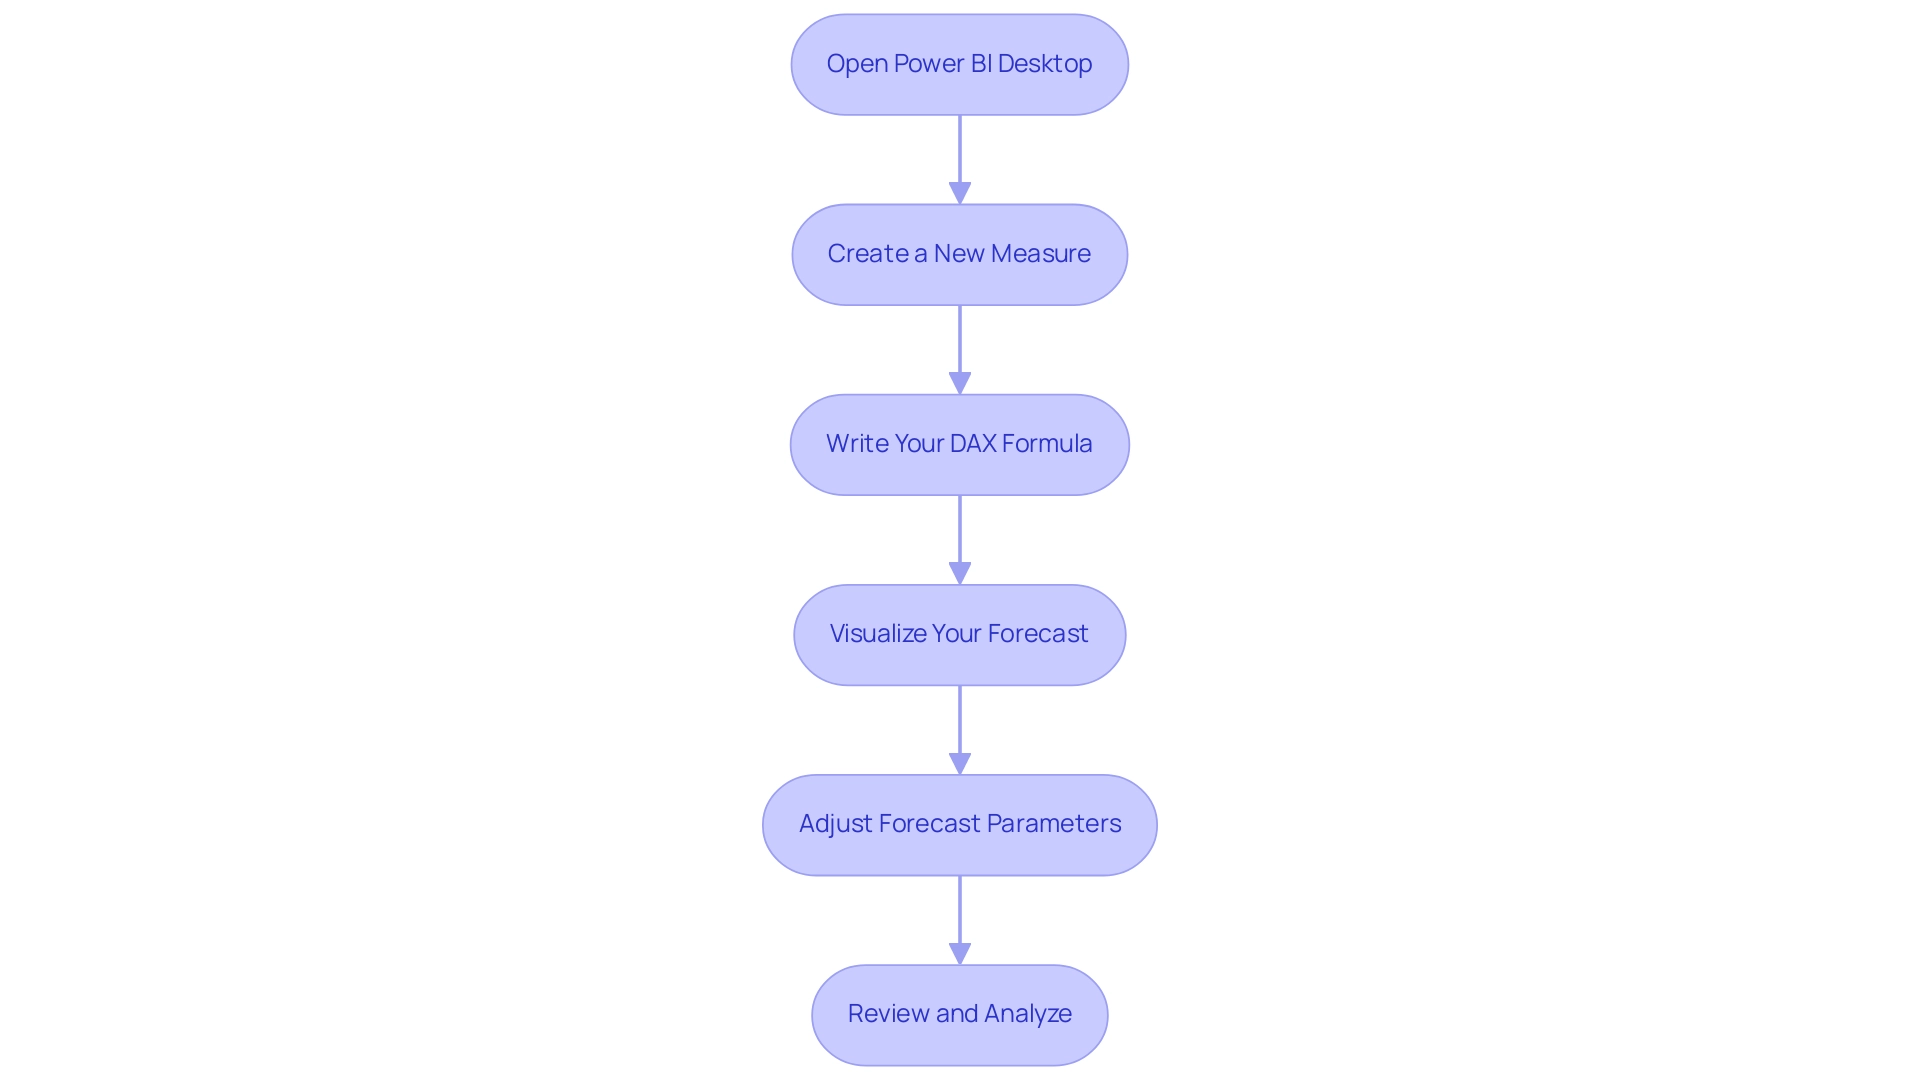
Understanding DAX Functions for Forecasting
Power BI provides a variety of DAX functions that are essential for efficient forecasting, especially in tackling frequent issues such as time-consuming report creation and inconsistencies. Among these, FORECAST.ETS stands out as a powerful tool, enabling users to predict future values by leveraging historical information while accounting for seasonality and trends. This function is essential for enhancing predictive accuracy in analytics, especially when report clarity is often compromised by overwhelming numbers and graphs.
According to analyst Zohaib Khan, ‘Using DAX functions like FORECAST.ETS can dramatically enhance the reliability of your forecasts, making information-driven decisions more effective.’ Another key function is DATESINPERIOD, which allows you to define a specific date range for your information, ensuring forecasts are based on relevant periods—this helps mitigate inconsistencies across reports.
Furthermore, establishing a robust governance strategy is vital to ensure information integrity and consistency across all reports, which can enhance trust in the insights generated. The CALCULATE function is essential; it enables users to alter the context in which information is assessed, paving the way for more advanced and customized prediction models. A practical example is the LOOKUPVALUE function, which can return values based on specific criteria, enhancing the ability to filter information for precise predictions, thus providing actionable insights for stakeholders.
Lastly, SUMX is essential as it iterates over each row in a specified table, summing the results to provide valuable insights into aggregated information, which is vital for thorough analysis in prediction scenarios. Statistics demonstrate that organizations employing DAX functions for predictions have experienced a significant rise in accuracy, with reports indicating a 20% enhancement in predictive capabilities. By mastering these DAX functions and implementing a robust governance strategy, you can create intricate and precise models for forecasting in Power BI using DAX, significantly improving your analysis capabilities in BI and transforming report creation into a streamlined process that emphasizes actionable insights.
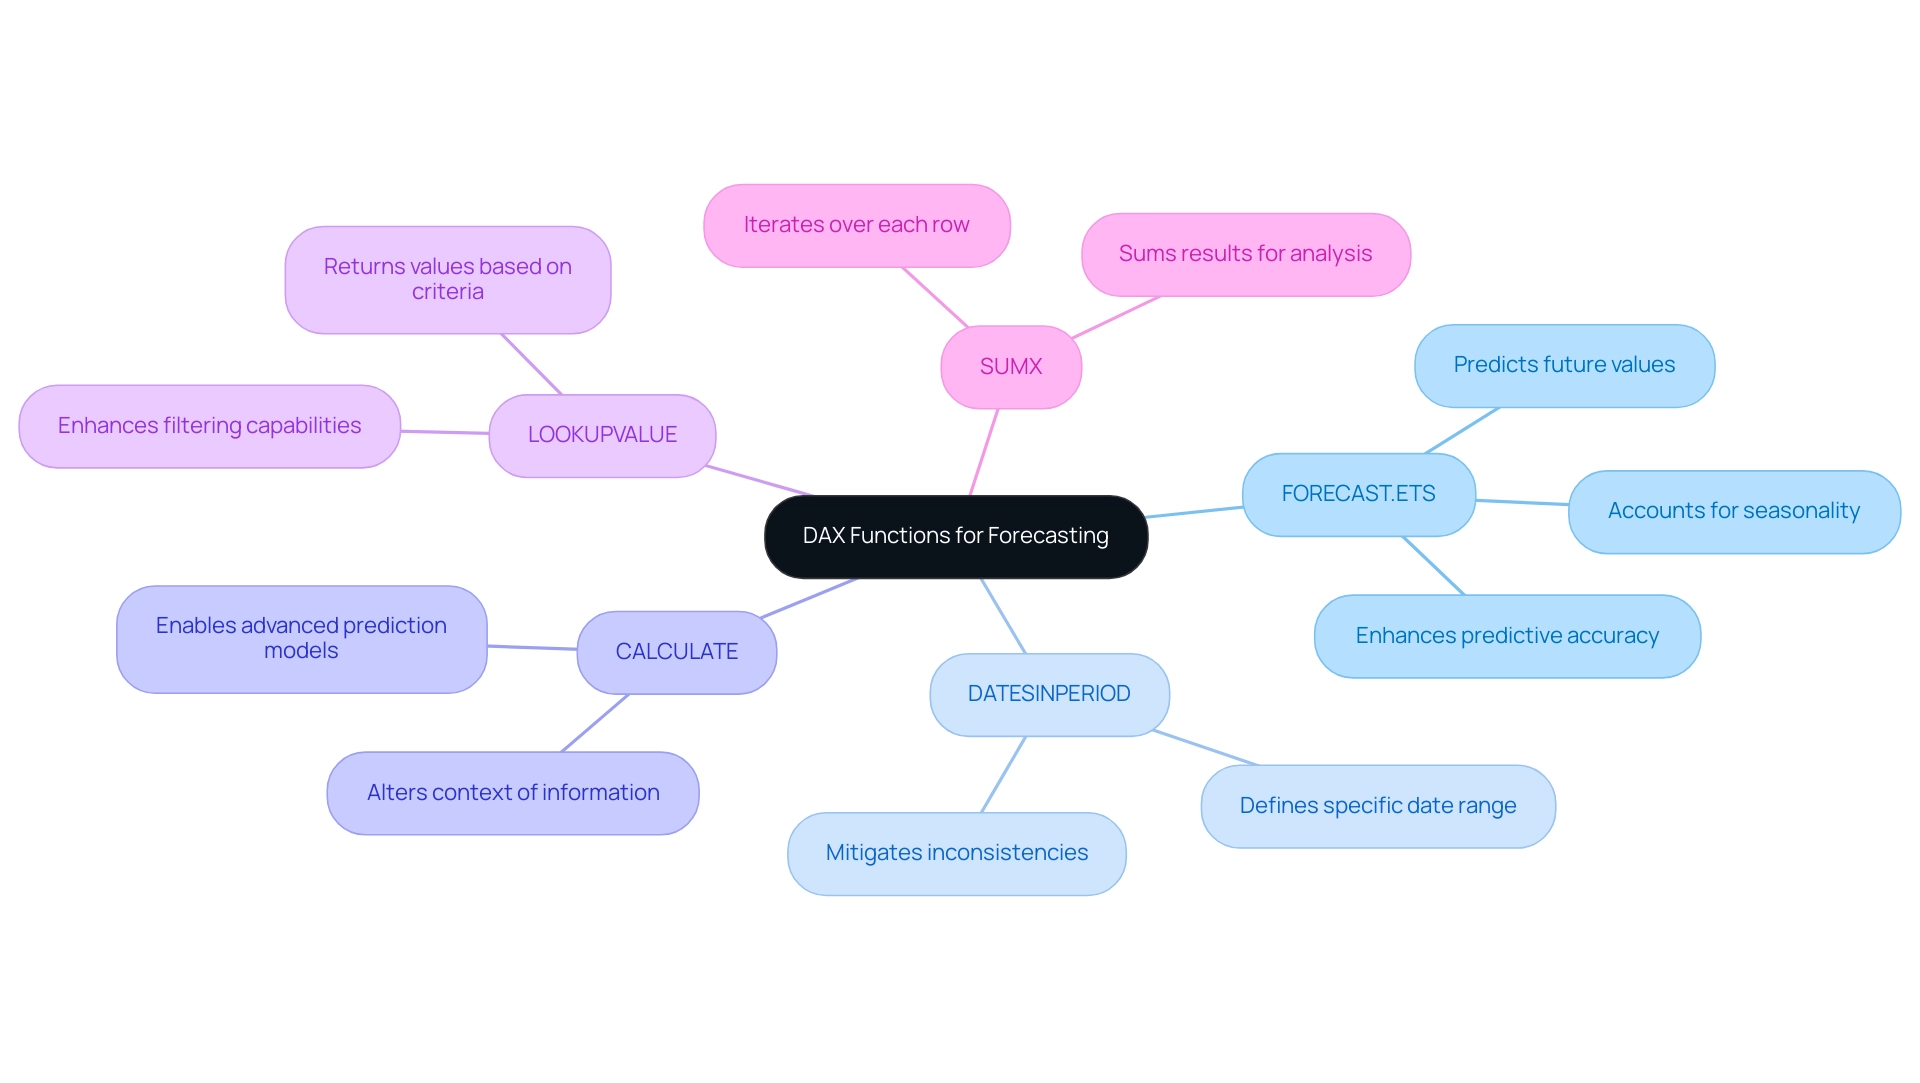
Common Challenges in Forecasting and How to Overcome Them
The challenges of forecasting in Power BI using DAX can significantly impact accuracy and effectiveness. Here are some important issues to consider:
-
Information Quality Issues: Accurate, complete, and current information is fundamental for dependable predictions. In today’s data-rich environment, struggling to extract meaningful insights can leave your business at a competitive disadvantage. Regular audits of your information sources can help bridge gaps in quality, as emphasized by Barr Moses, CEO of Monte Carlo, who states,
As an industry, we need to prioritize trust to optimize the potential of our investments.
Maintaining information accuracy reduces the risks linked to prediction errors. Furthermore, employing statistical methods for data harmonization is essential to address discrepancies that can arise across different data sources, enhancing overall data quality. -
Seasonality Misinterpretation: It is crucial to recognize and understand seasonal patterns within your data. Utilizing the correct DAX functions for forecasting in Power BI using DAX to accurately capture these trends can significantly enhance your prediction capabilities. The case study titled ‘Using Bayesian Belief Network and Time-Series Model to Conduct Prescriptive and Predictive Analytics for Computer Industries’ demonstrates how understanding seasonality can enhance prediction outcomes. The framework introduced in this study attained an impressive r value of 0.935, confirming the effectiveness of its methods in improving prediction accuracy.
-
Overfitting Models: Strive to avoid overly complex models that may fail to generalize effectively to new data. Concentrate on simplicity and clarity in your DAX formulas, which can enhance forecasting in Power BI using DAX and lead to more robust and dependable projection outcomes.
-
Resistance to Change: The implementation of new prediction methods may encounter employee resistance. Cultivating a culture of data-driven decision-making through comprehensive training and engagement initiatives can facilitate smoother transitions and greater acceptance of innovative practices.
By proactively addressing these challenges with targeted strategies, including the integration of RPA solutions such as EMMA RPA and Power Automate to automate repetitive tasks and improve efficiency, you can significantly enhance your forecasting in Power BI using DAX. Ultimately, this results in better business outcomes, as demonstrated by the previously mentioned case study that shows how tackling quality issues and understanding seasonality can enhance accuracy and strategic planning in projections. Highlighting the significance of Business Intelligence in discovering actionable insights can further reduce the competitive drawbacks linked to inadequate planning practices.
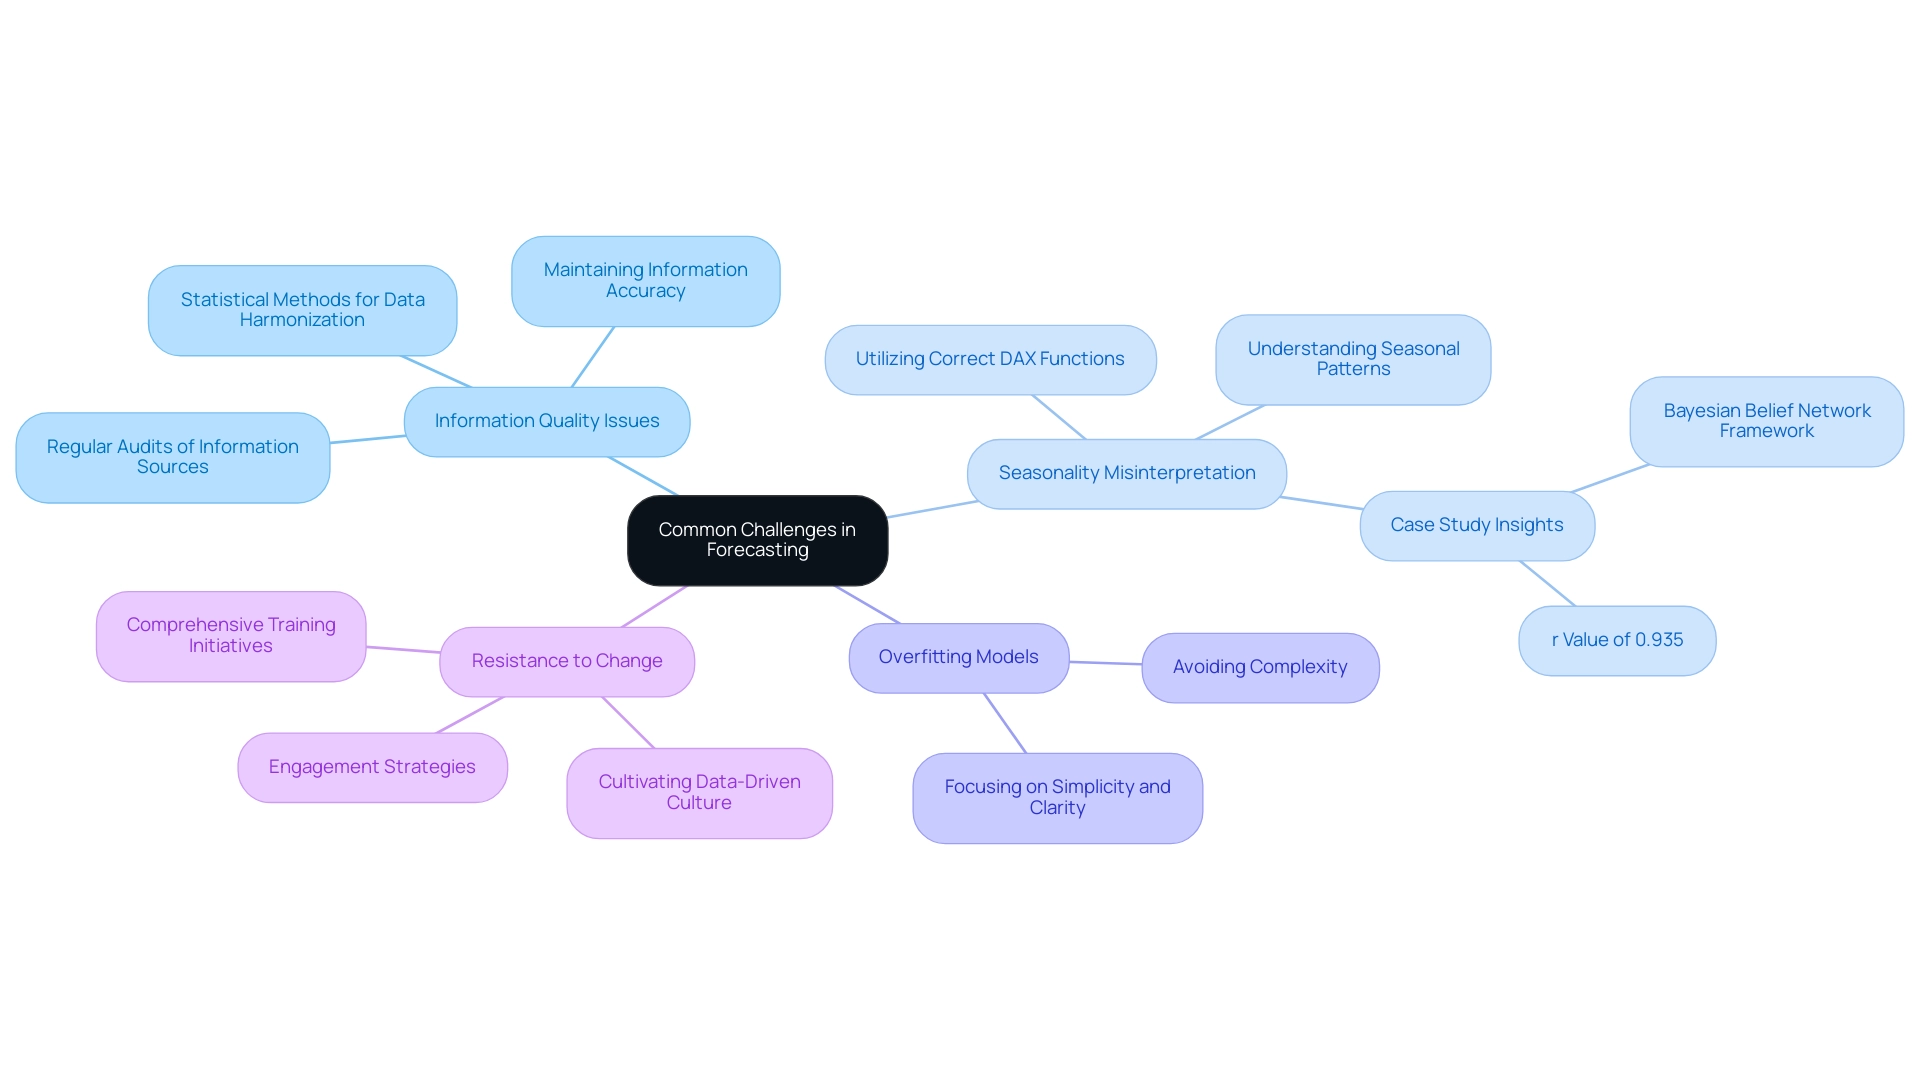
Best Practices for Effective Forecasting in Power BI
To enhance the effectiveness of your predictions in Business Intelligence, consider implementing the following best practices:
-
Prioritize Regular Information Updates: Frequent refreshes are critical to ensuring your collections reflect the most current information available. This commitment to timely updates enhances prediction accuracy and reliability, particularly in an environment where forecasting in Power BI using DAX, along with automated deduplication and AI-driven validation, has become essential in data management.
-
Leverage Visualizations Effectively: Business Intelligence tools offer a range of visualization resources that can transform complex data into clear, actionable insights. By using these tools wisely, you can enhance understanding and aid decision-making through forecasting in Power BI using DAX. The insights gleaned from your reports can significantly impact operational efficiency, highlighting the importance of a well-structured reporting process such as our 3-Day Power BI Sprint, which promises to create a fully functional, professionally designed report on a topic of your choice in just three days. This report can also serve as a template for future projects, ensuring a professional design from the start.
-
Foster Cross-Departmental Collaboration: Encouraging collaboration among various departments can lead to richer insights and a more comprehensive approach to planning. Open-source collaboration fosters an inclusive analytics science culture and leads to creative solutions for analytical challenges, significantly enhancing the accuracy of your predictions, particularly through forecasting in Power BI using DAX.
-
Continuously Monitor and Adjust: Regularly assess the performance of your forecasts against actual outcomes. This ongoing evaluation allows you to identify discrepancies and adjust your models and assumptions as needed for effective forecasting in Power BI using DAX. In the words of industry specialists,
Continuous adaptation and utilizing unified information sources are vital for making informed choices in today’s information-rich environment.
Incorporating these best practices into your forecasting in Power BI using DAX not only supports strategic decision-making but also enhances operational efficiency. For instance, organizations utilizing unified information platforms like Databricks Lakehouse and Snowflake have seen remarkable improvements in their management strategies, treating their platforms as products for long-term scalability. As you embrace these practices, remember that the implementation of AI-powered governance tools can automatically enforce policies and ensure compliance across distributed data environments, which can further enhance your forecasting in Power BI using DAX.
Additionally, consider utilizing Robotic Process Automation (RPA) to automate manual workflows, freeing your team to focus on strategic, high-value tasks.
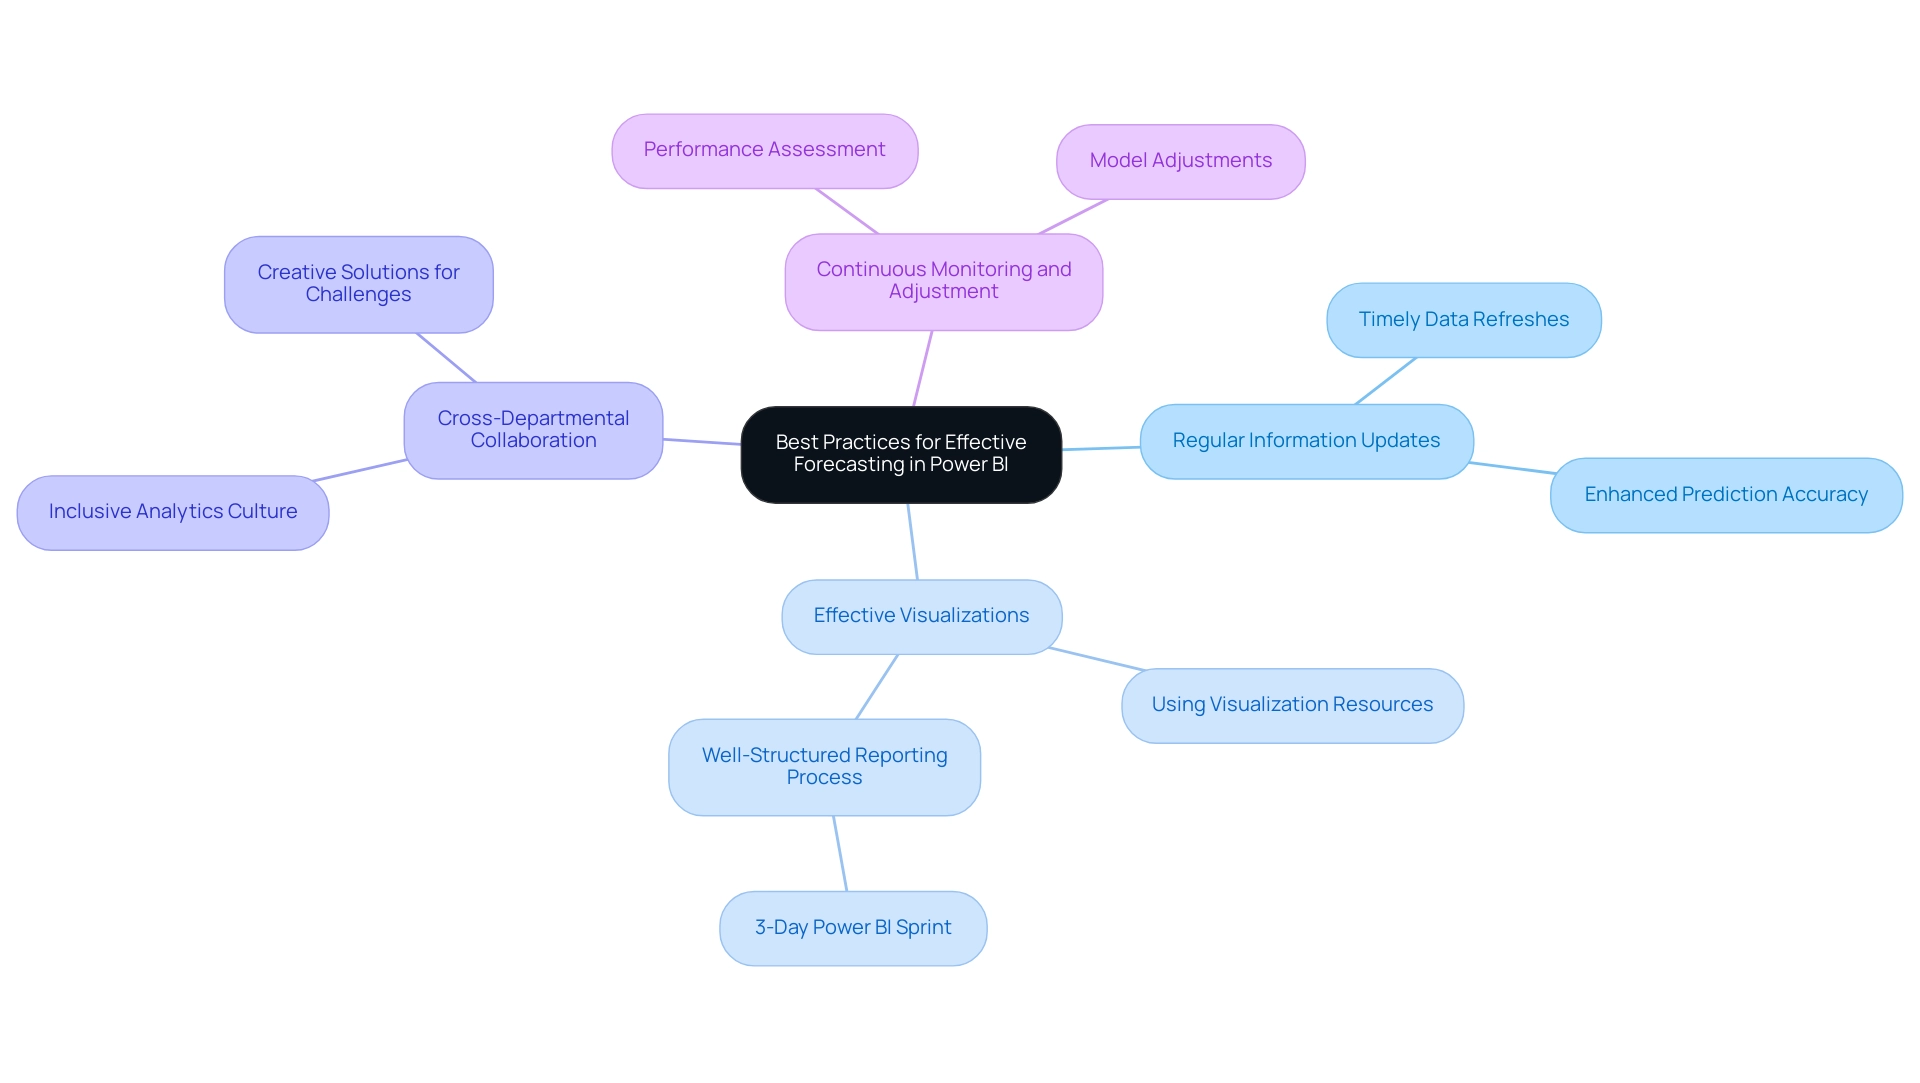
Conclusion
Harnessing the power of forecasting in Power BI is an essential strategy for organizations aiming to enhance their operational efficiency and responsiveness to market dynamics. By effectively utilizing DAX functions like FORECAST.ETS and embracing advanced analytical techniques, businesses can turn vast amounts of historical data into reliable predictions that inform strategic decision-making.
Addressing common challenges such as data quality and seasonal misinterpretation is crucial for improving forecasting accuracy. Implementing best practices like:
- Regular data updates
- Effective visualizations
- Fostering collaboration across departments
can significantly elevate the quality of forecasts. Moreover, integrating Robotic Process Automation tools streamlines processes, allowing teams to focus on high-value tasks while ensuring consistency and accuracy in reporting.
Ultimately, mastering forecasting within Power BI equips organizations with the insights needed to navigate complexities in predictive analytics. By prioritizing data integrity and leveraging the latest technological advancements, businesses can unlock the full potential of their data, driving informed decisions that lead to sustainable growth and competitive advantage. Embracing these methodologies not only transforms forecasting capabilities but also positions organizations for long-term success in an ever-evolving business landscape.
Overview
To successfully embed a Power BI report in a web application, one must establish prerequisites such as a Power BI account, a published report, proper access permissions, and familiarity with web development technologies. The article outlines a step-by-step process, including creating an embed URL and using an <iframe> tag for integration, emphasizing that following these steps enhances data accessibility and operational efficiency while addressing common challenges in utilizing insights effectively.
Introduction
In a landscape where data-driven decision-making is paramount, embedding Power BI reports into web applications emerges as a powerful strategy to enhance operational efficiency and insight accessibility. As organizations grapple with the challenges of extracting meaningful insights from their data, the ability to seamlessly integrate advanced reporting tools can transform how teams engage with information.
This article delves into the essential prerequisites, step-by-step processes, and best practices for embedding Power BI reports, ensuring that users not only access critical data but also harness it to drive informed decisions. By addressing common hurdles and implementing effective solutions, organizations can unlock the full potential of their data, fostering a culture of innovation and strategic growth.
Prerequisites for Embedding Power BI Reports
To successfully embed Power BI reports, it’s crucial to have the following prerequisites established:
-
BI Account: A BI Pro or Premium account is essential for creating and sharing documents effectively. BI Pro enables impressive data streaming capabilities of up to 1 million rows per hour, enhancing reporting efficiency. However, many users find themselves investing more time in creating documents than in leveraging insights, which can lead to frustration. As Sophia Ellis observes, ‘BI Premium is an advanced service that provides improved performance, scalability, and flexibility for your Business Intelligence requirements.’
-
Power BI Document: Begin by creating and publishing the document you intend to embed within the Power BI service, ensuring its readiness for your audience. It’s essential to ensure that the document provides clear, actionable guidance, as many submissions often contain numbers and graphs but lack direction.
-
Web Application: Identify the web application where you plan to learn how to embed Power BI report in web application, ensuring a seamless experience for individuals. This integration should be straightforward to avoid adding complexity to the experience journey.
-
Access Permissions: Verify that individuals who will view the document have the required permissions. About 70% of BI participants indicate having adequate access rights, which is essential for collaboration and information sharing. Inconsistencies in data access can lead to confusion and mistrust, often exacerbated by a lack of governance strategy.
-
Development Environment: Familiarity with web development technologies such as HTML and JavaScript is crucial, alongside access to an appropriate Integrated Development Environment (IDE) for coding tasks.
By ensuring these prerequisites are in place, you lay a robust foundation for a seamless and effective embedding experience. Furthermore, organizations should take into account the recent insights on selecting between BI Pro and Premium based on user scale and performance demands. RPA solutions can enhance BI by automating repetitive tasks, thus addressing operational efficiency challenges.
The case study on BI Free, Pro, and Premium highlights the main differentiators in performance, assisting IT professionals in optimizing their infrastructure and dataset requirements. This comprehensive approach enables your organization to utilize BI to its fullest potential, transforming information into actionable insights and enhancing operational efficiency.
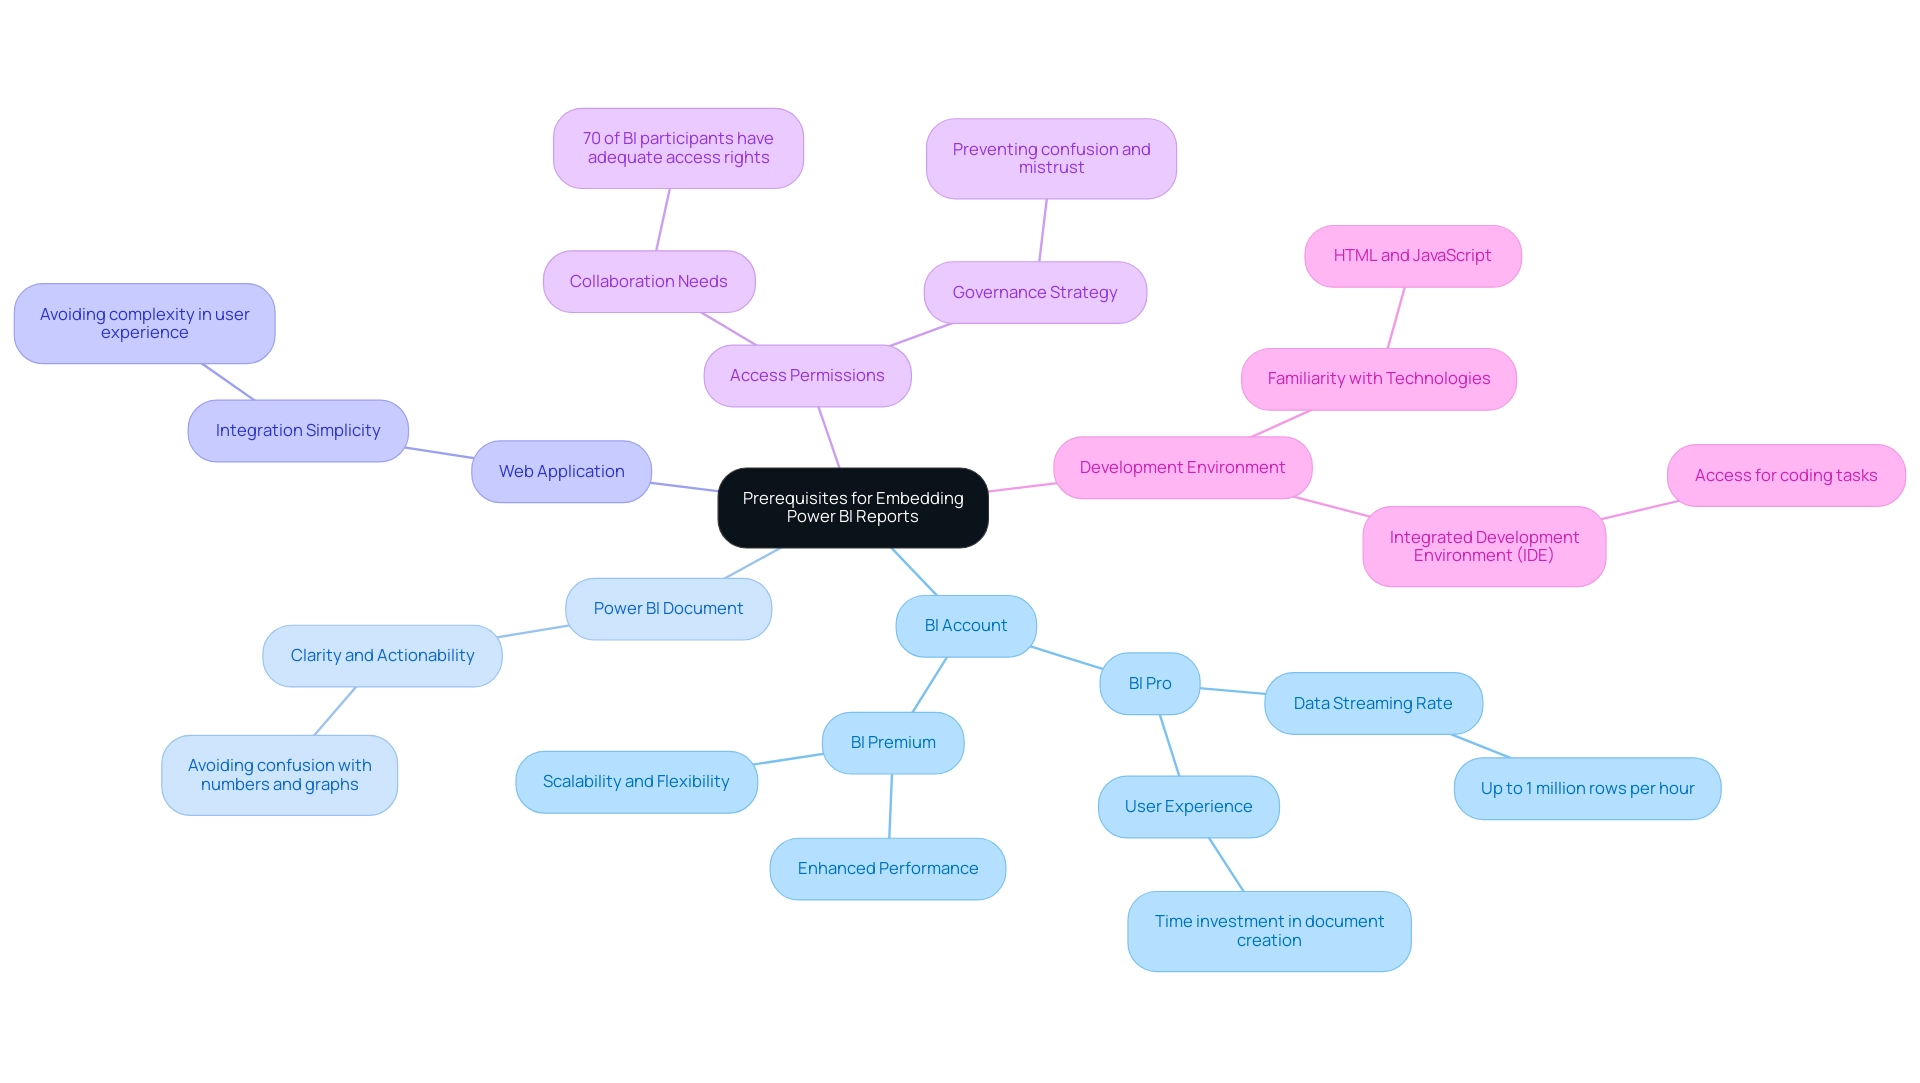
Step-by-Step Process to Embed Power BI Reports
Learning how to embed Power BI report in web application can significantly improve your visualization abilities and tackle the challenges of utilizing insights effectively. In an era where 40% of executives indicate their organizations’ information strategies have not produced success, struggling to derive meaningful insights can leave your business at a competitive disadvantage. It is critical to adopt effective data strategies alongside automation solutions.
Follow these straightforward steps to achieve seamless integration:
-
Create and Publish Your Document: Start by crafting your document in BI Desktop. Once satisfied with your design, publish it to the BI service to make it accessible for embedding.
-
Get the Embed URL: In the Power BI service, navigate to your published document. Click on the ‘File’ menu, select ‘Embed document’, then choose ‘Website or portal’. This action will generate an embed URL that you can copy.
-
Insert the Embed Code: In your web application, utilize an
<iframe>tag to insert the document. For example:<iframe width="800" height="600" src="YOUR_EMBED_URL" frameborder="0" allowFullScreen="true"></iframe> -
Test the Embedded Document: After inserting the code, open your web application in a browser to ensure the document displays correctly and interacts as expected.
-
Adjust Dimensions: Modify the width and height attributes in the
<iframe>tag to align with your application’s layout requirements, ensuring a user-friendly experience.
By following these steps, you will understand how to embed Power BI report in web application, which enhances data accessibility and visualization. This integration not only improves operational efficiency but also helps mitigate the data-related challenges that lead to productivity losses—averaging over five working days per employee annually. Additionally, RPA solutions can further streamline processes by automating repetitive tasks, complementing the insights gained from BI.
A worked example of view and viewer metrics illustrates how usage metrics are calculated based on user interactions with multiple reports, clarifying how report views and page views are counted. This understanding is vital for making informed, data-driven decisions. As Douglas Rocha, a data science enthusiast, states, ‘Can you do statistics in BI without DAX?’
Yes, you can, you can do it without measures as well and I will teach you how at the end of this tutorial. This flexibility in utilizing BI is essential for empowering directors of operations to drive growth and innovation.
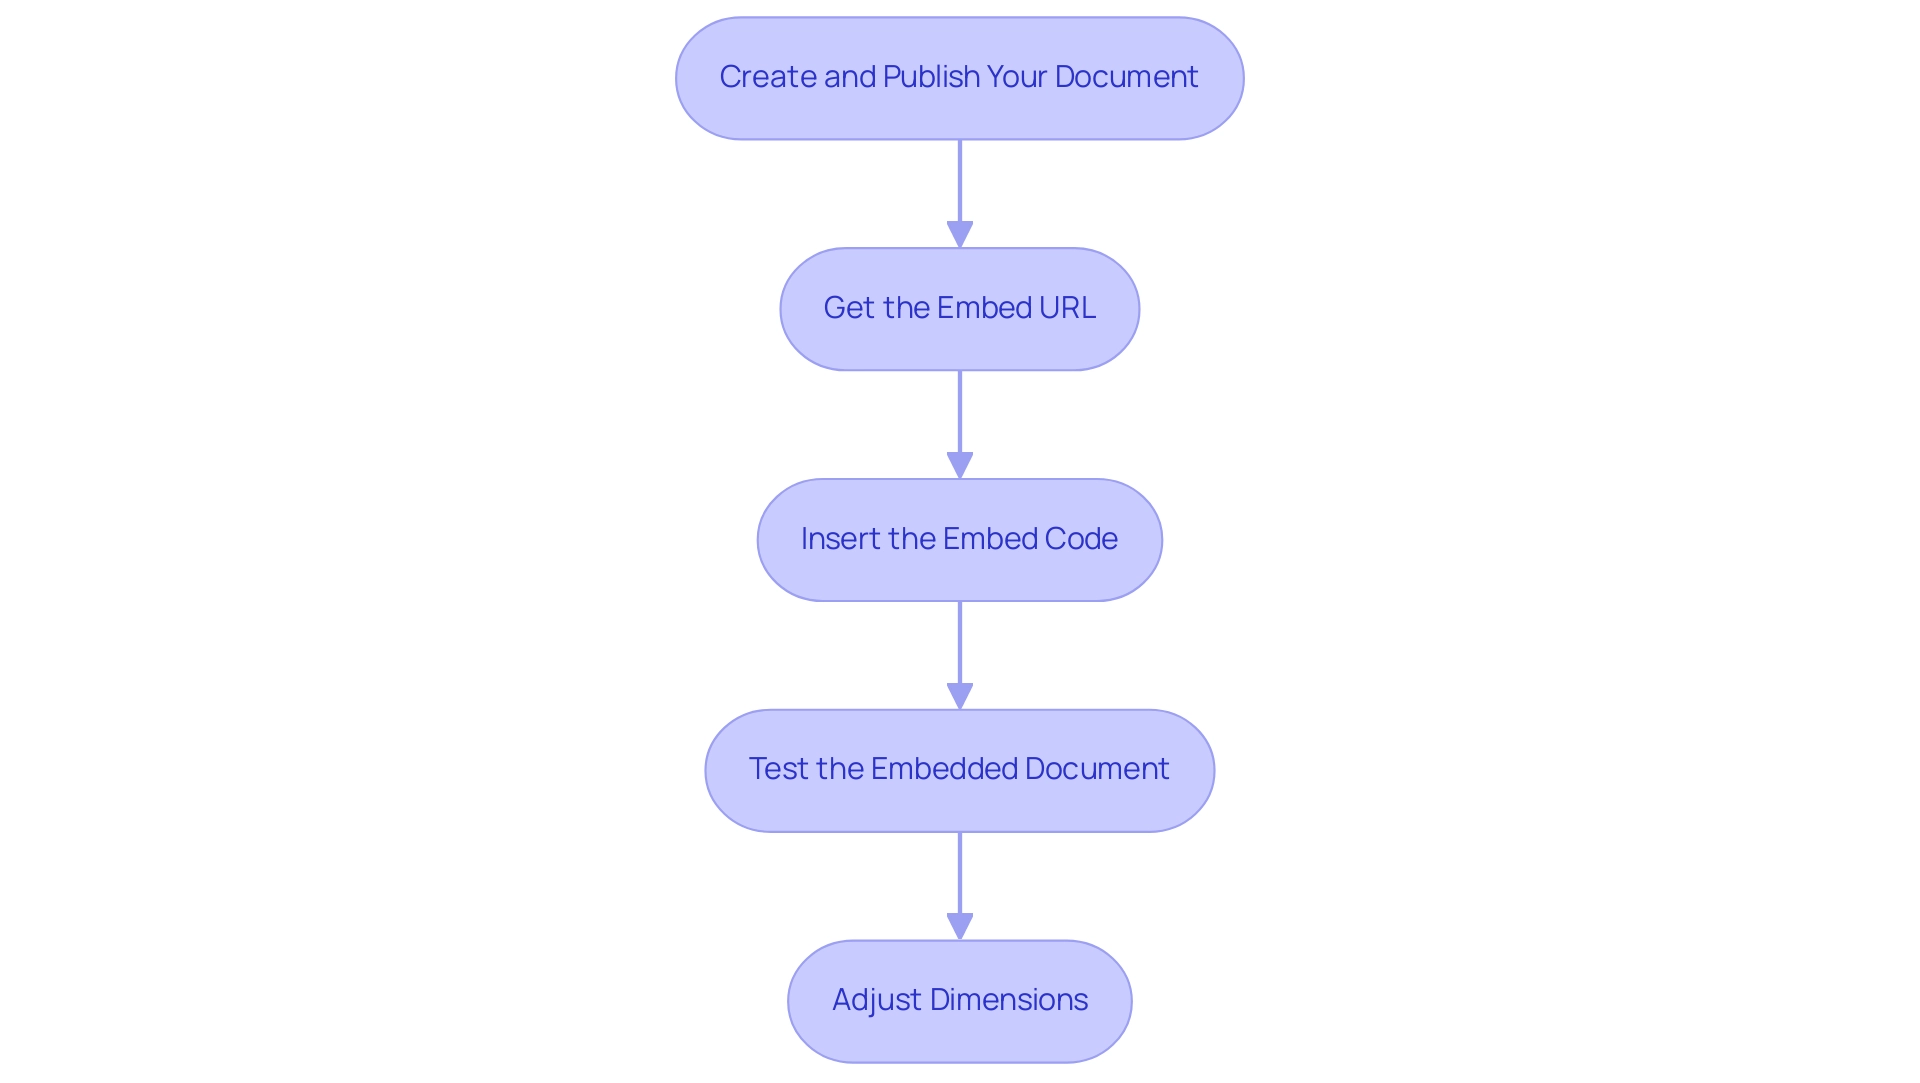
Generating Embed Codes and Configuring Settings
To effectively create embed codes and configure settings for your BI analysis, adhere to the following structured steps:
- Access the BI Service: Start by signing into your BI account and going to the specific document you wish to embed. With 3,518 users online, BI’s popularity underscores the importance of these capabilities in driving data-driven insights for operational efficiency and business growth.
2. Get the Embed Code: Click on ‘File’, select ‘Embed document’, and then opt for ‘Website or portal’. Here, you’ll find the embed code, which contains the URL and necessary parameters—copy this code for your use.
3. Configure Document Settings: Within the BI service, it’s crucial to verify that your settings permit embedding. Ensure the ‘Embed settings’ option ‘Allow individuals to share this document’ is enabled to facilitate sharing functionality and enhance collaboration.
4. Modify Embed Code for Security: Tailor the embed code according to your security requirements. As lbendlin advises, consult with your Tenant admin to review audit logs, which can provide insight into security measures. For improved security, consider using the BI Embedded service, which provides greater control over user access and ensures compliance with local residency regulations.
5. Implement in Your Application: Finally, paste the embed code into your web application at the desired location to show how to embed Power BI report in web application for the display of the analysis.
By diligently following these steps and considering the compliance illustrated in the case study on ‘Usage Metrics in National/Regional Clouds’, you will ensure that your BI analysis is not only correctly configured for embedding but also aligns with necessary security protocols and compliance considerations. Furthermore, Creatum provides extensive BI services, including tailored dashboards, information integration, and professional training, to assist businesses in overcoming the difficulties of document creation and insights extraction. This holistic approach empowers your organization to leverage insights for impactful decisions, addressing the common hurdles faced in information management.
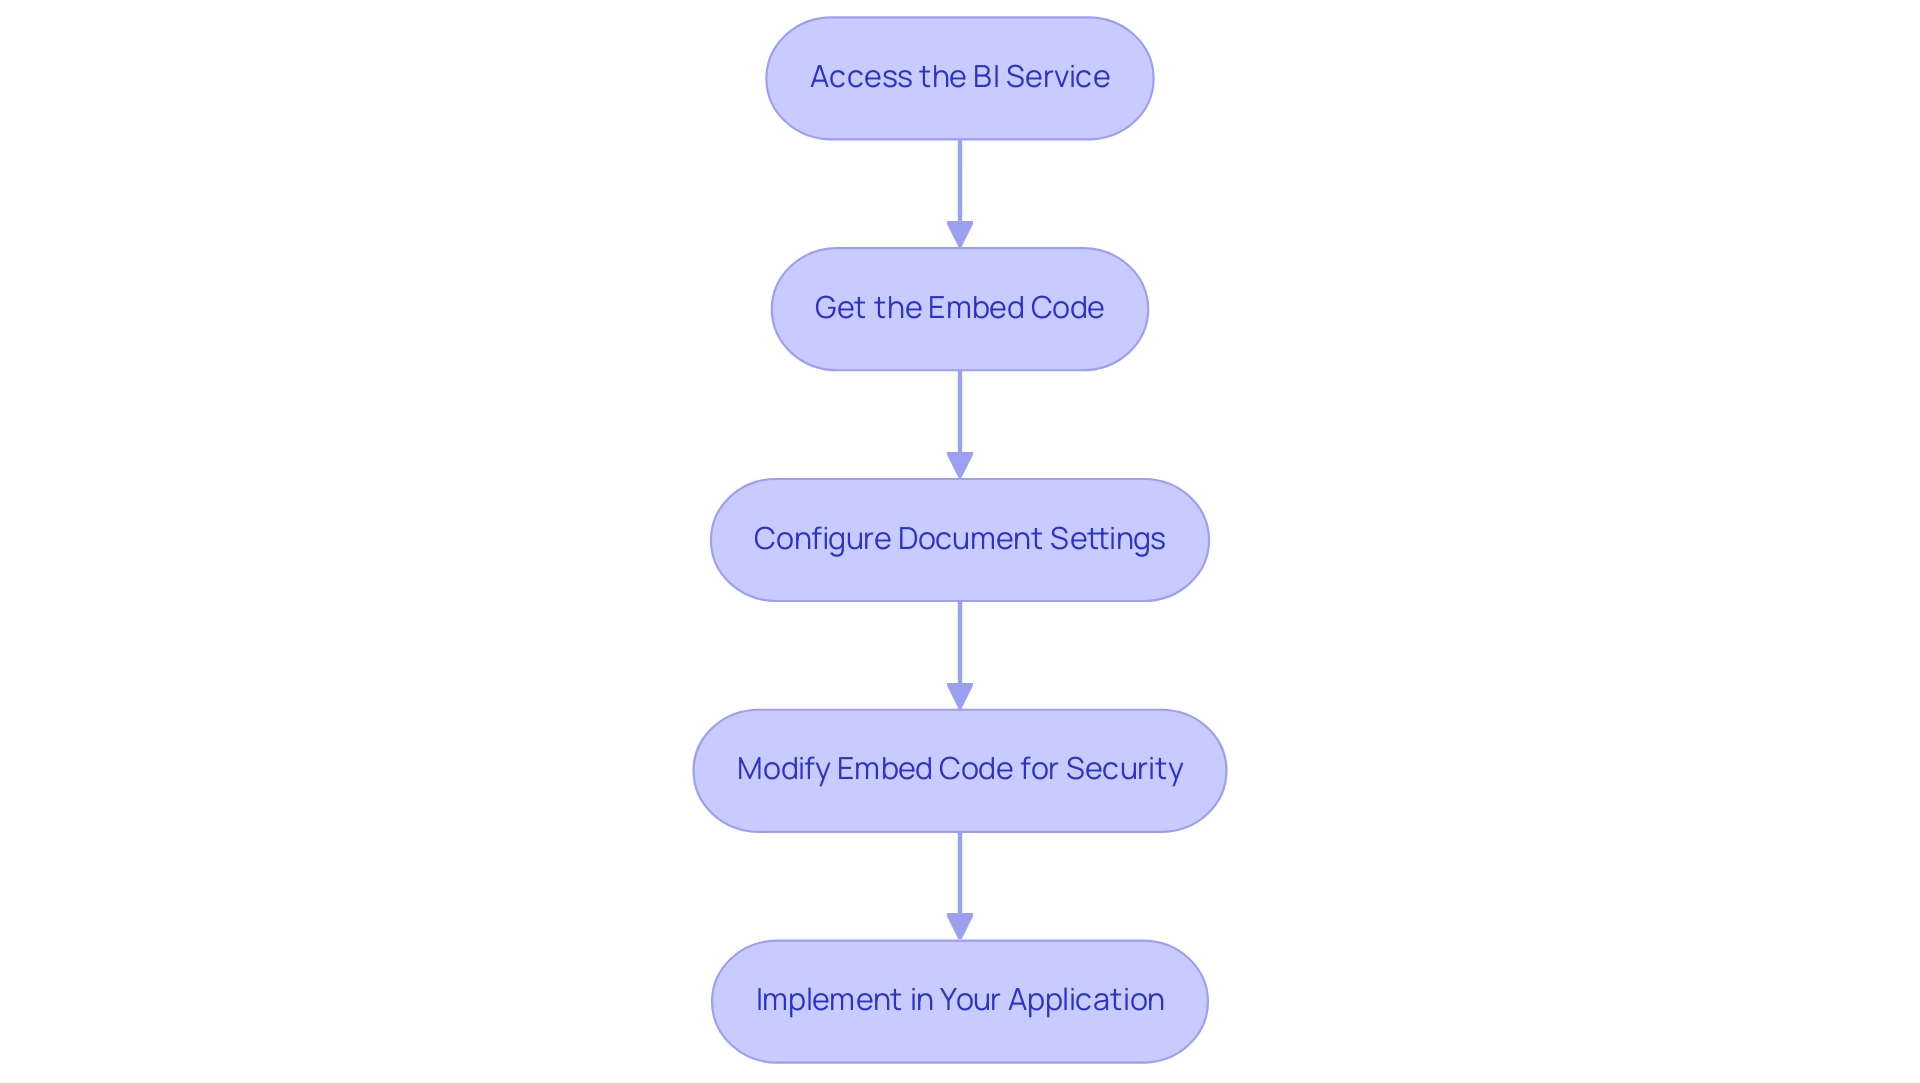
Managing Authentication and Security for Embedded Reports
To effectively manage authentication and security for your embedded Power BI reports, consider implementing the following strategies:
- Leverage BI Embedded: Utilize BI Embedded for applications requiring secure access, as it provides enhanced control over authentication and permissions, ensuring that only authorized individuals can access sensitive information.
- Implement Row-Level Security: Establish row-level security within Power BI to customize information visibility based on roles. This not only protects confidential information but also guarantees that individuals view only the information relevant to their duties.
- Utilize Azure Active Directory for Access Authentication: Employ Azure Active Directory (AAD) for verifying individuals accessing your embedded documents. This method is crucial for verifying user identities and maintaining information integrity, making it significantly harder for cybercriminals to breach access.
- Regularly Monitor Access Logs: Consistently review access logs to track report access. This practice not only aids in recognizing unauthorized access attempts but also guarantees adherence to your organization’s security protocols, tackling the challenges of inconsistencies.
- Educate Users on Information Security Best Practices: Conduct training sessions focused on information security best practices, emphasizing the significance of safeguarding sensitive information. Recent statistics reveal that ransomware attacks on healthcare organizations have escalated in cost from an average of $10,000 in 2017 to $100,000 in 2019, underscoring the urgent need for improved security measures. Additionally, as highlighted by Security.org, a staggering 76% of Millennials tend to use weak passwords, often relying on memory rather than utilizing password managers. By educating users, you can cultivate a culture of security awareness within your organization, thereby enhancing operational efficiency.
- Implement Multi-Factor Authentication (MFA): As shown in the case study titled “Enhanced Protection with MFA,” enabling MFA offers a double or triple layer of security, making it more difficult for hackers to obtain access. The suggestion is to use MFA wherever applicable to reduce the risks of breaches.
By adopting these strategies, you can significantly enhance the security of your embedded business intelligence visuals while learning how to embed Power BI report in web application, addressing the critical need for data-driven insights and operational efficiency in today’s competitive landscape. Furthermore, utilizing RPA can assist in optimizing the document creation process, reducing the time spent on repetitive tasks and minimizing data inconsistencies, ultimately enhancing decision-making and business growth.
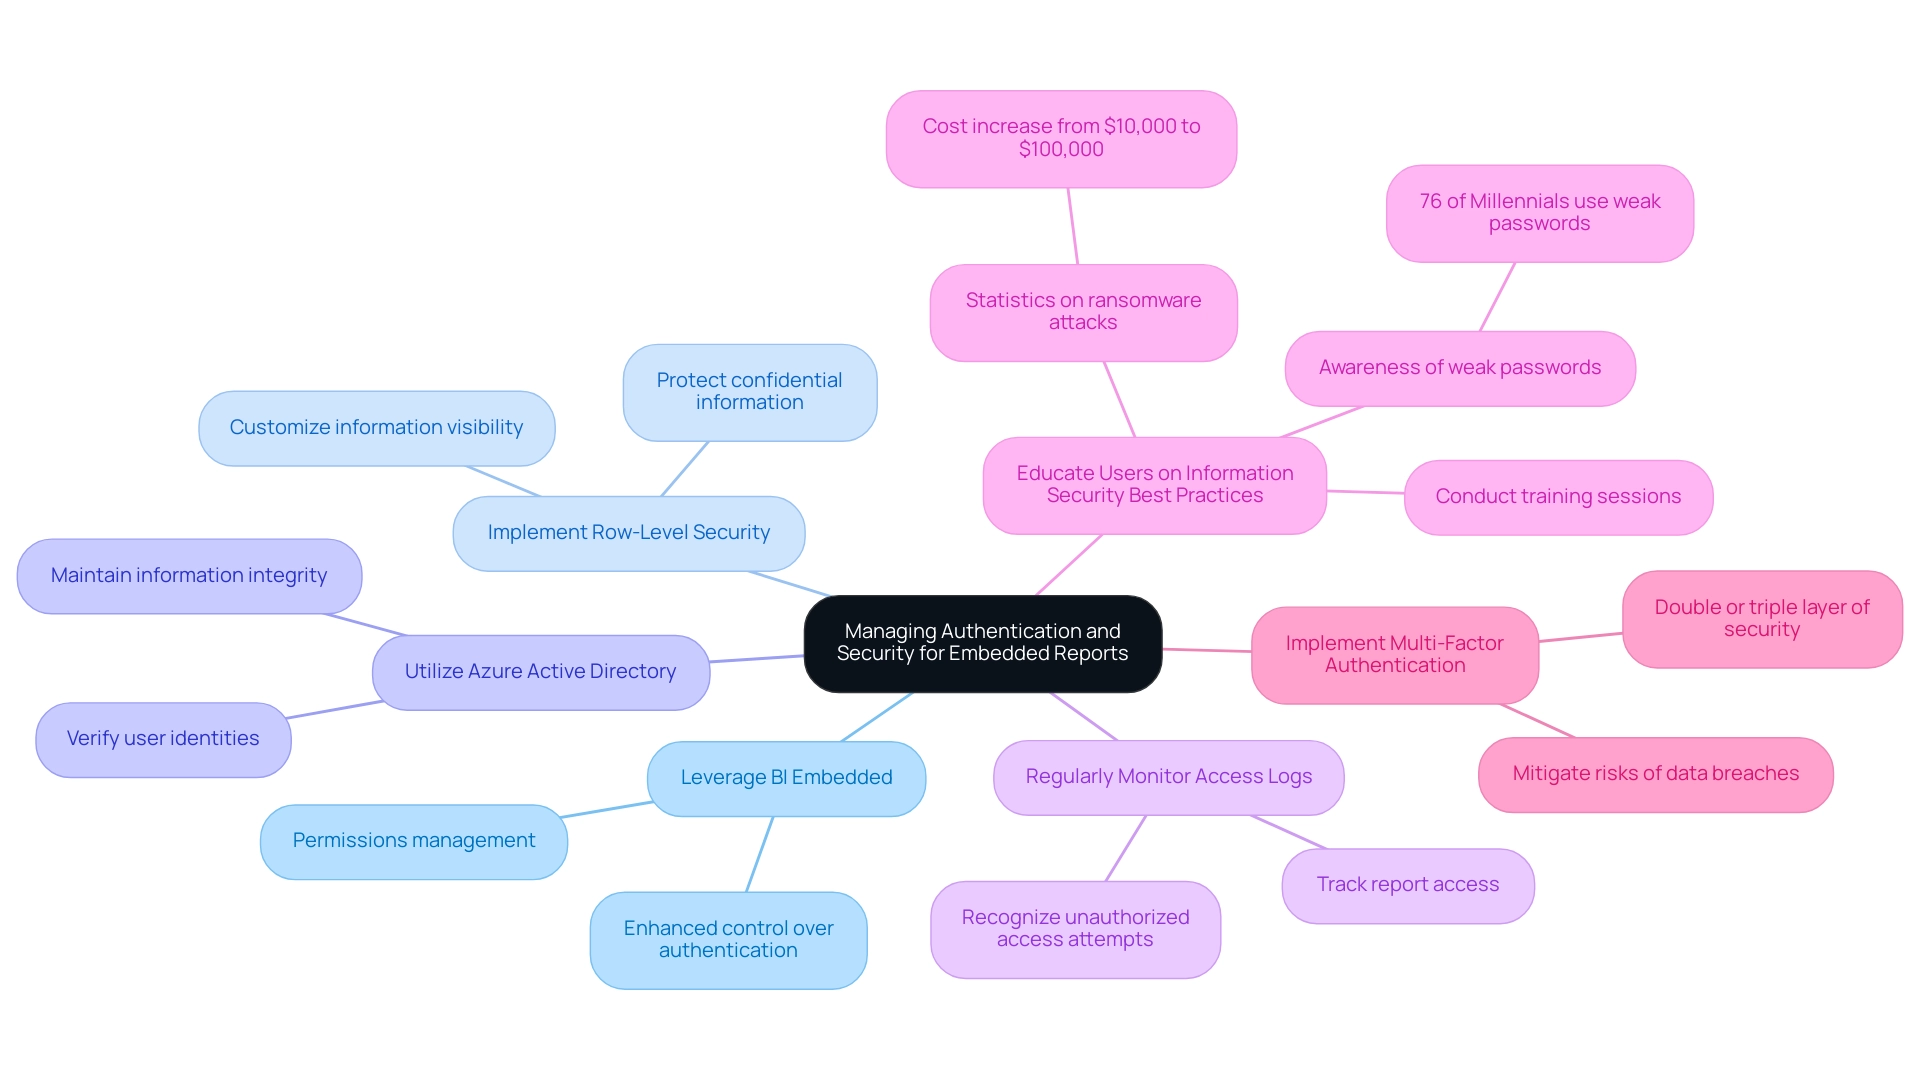
Best Practices and Troubleshooting for Embedded Power BI Reports
To ensure the seamless operation of embedded Power BI displays and effectively address potential issues, consider the following best practices and troubleshooting tips:
-
Enhance Document Efficiency: Simplify documents by limiting the number of visuals to improve loading times. Employing the VACUUM command can also assist in clearing out old files, minimizing storage clutter and improving overall performance—particularly advantageous for a large group of over 100 developers who need to handle extensive information efficiently. This aligns with the efficiency gains anticipated from implementing Robotic Process Automation (RPA).
-
Regularly Update Documents: Keep your documents current by implementing a routine update schedule. This ensures that users access the latest data and insights, which is critical for informed decision-making—a principle reinforced by leveraging Business Intelligence. Our 3-Day Power BI Sprint can assist in rapidly creating professionally designed documents to maintain this relevance.
-
Test Across Browsers: Conduct thorough testing of your embedded reports on various web browsers. This will help ensure a consistent experience, as discrepancies can arise between different platforms, directly addressing the challenge of data inconsistencies.
-
Handle Errors Gracefully: Implement robust error handling in your web application. Providing individuals with clear and informative messages in the event of an error not only improves experience but also allows for quicker resolutions—streamlining operations and enhancing overall efficiency.
-
Feedback System: Set up a feedback system to gather insights from individuals concerning the integrated data. This ongoing conversation enables constant enhancement, ensuring the documents develop alongside consumer requirements. By integrating these insights, you can inform the development of tailored AI solutions that align with your business goals.
Incorporating these best practices and troubleshooting strategies can significantly enhance user experience and ensure the effectiveness of how to embed Power BI report in web application. As observed by Tarsem Singh, utilizing techniques such as the Star Schema modeling can enhance performance by organizing information effectively into fact and dimension tables. Moreover, community insights from Manoj Prabhakar highlight practical strategies such as using dedicated Dates tables, splitting DateTime columns, filtering unnecessary data, and utilizing performance optimization tools like Tabular Editor and DAX Studio. Ultimately, these strategies will not only streamline operations but also drive improved performance metrics across your organization, reinforcing the role of Business Intelligence in achieving data-driven insights.
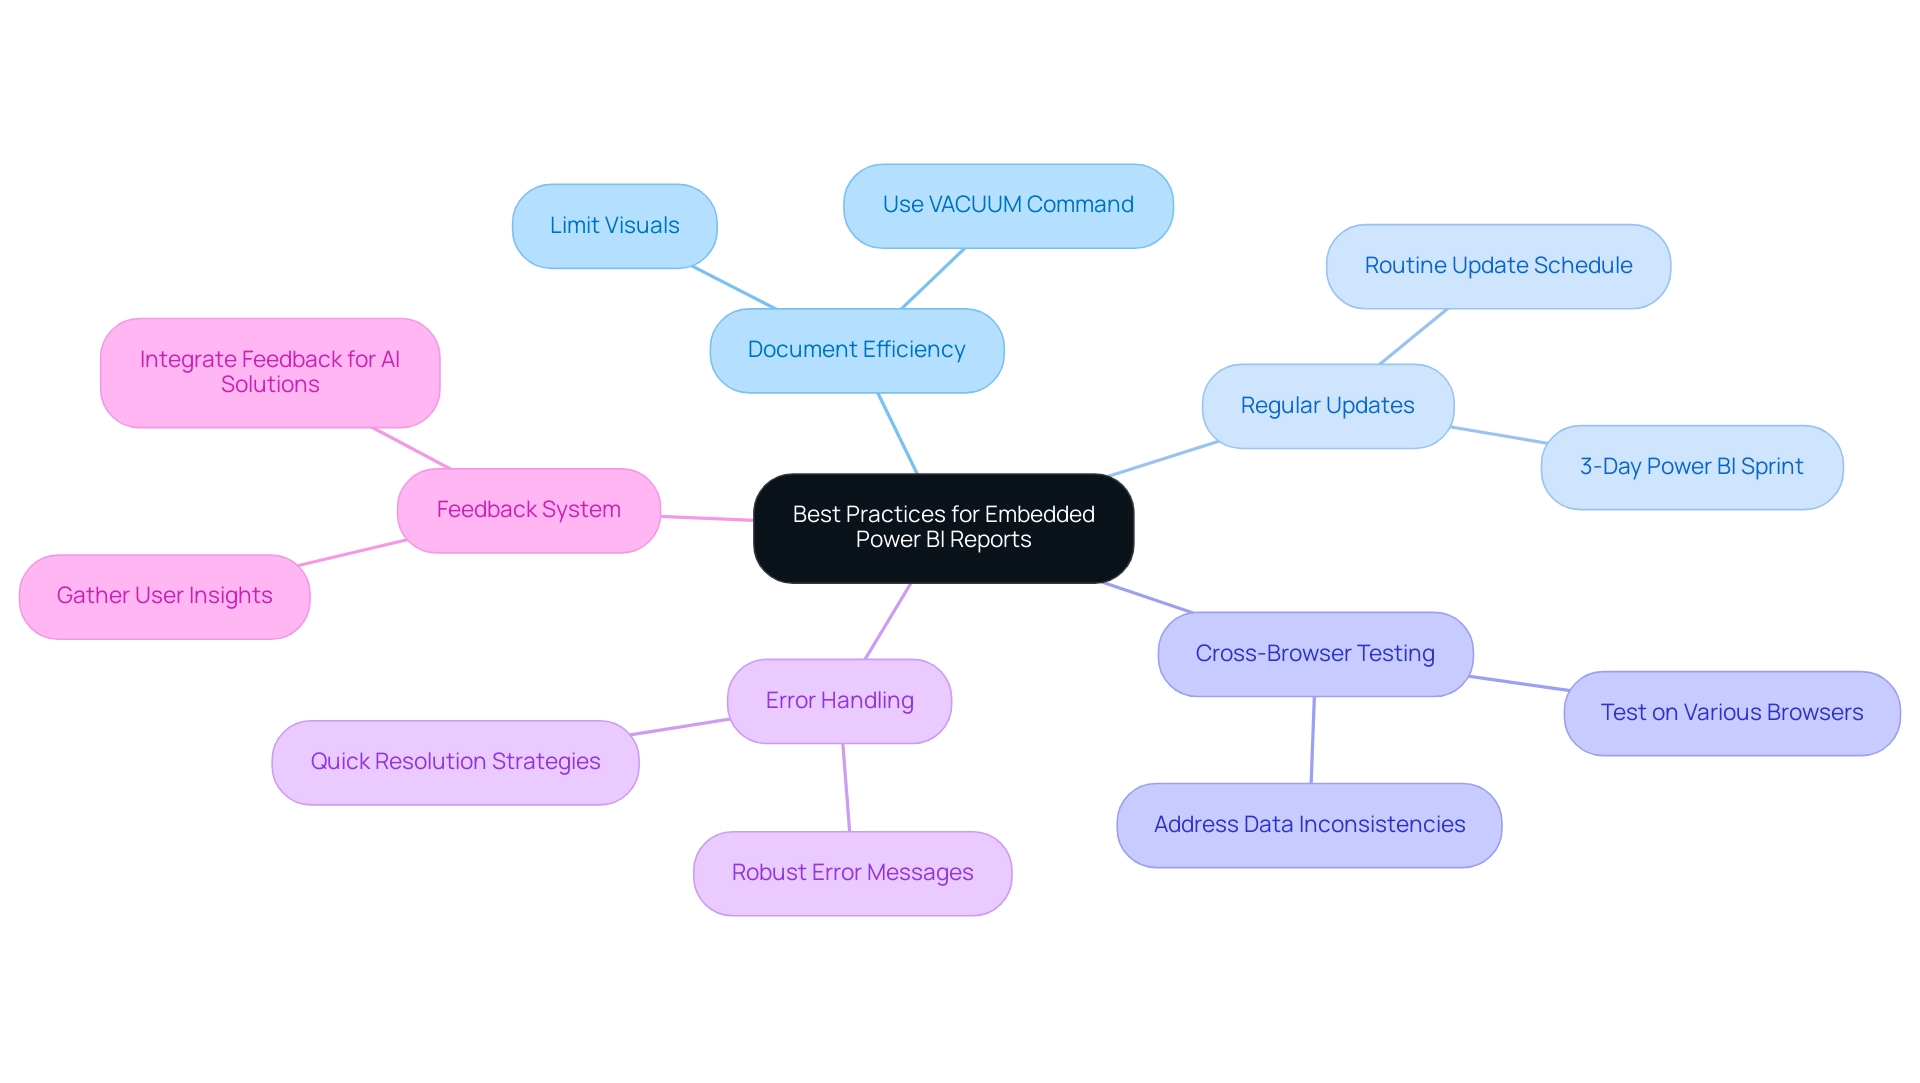
Conclusion
Embedding Power BI reports into web applications is a transformative strategy that empowers organizations to unlock the full potential of their data. The foundational prerequisites, such as having a Power BI account, creating actionable reports, and ensuring proper access permissions, set the stage for successful implementation. By following a structured step-by-step process to embed reports, organizations can significantly enhance their data visualization capabilities and improve access to critical insights.
Security and authentication are paramount when it comes to managing embedded reports. Implementing robust strategies such as row-level security and utilizing Azure Active Directory ensures that sensitive data remains protected while still being accessible to authorized users. Regular monitoring of access logs and educating users on data security best practices further strengthens the defense against potential breaches.
Adopting best practices, including optimizing report performance and establishing a feedback mechanism, ensures that embedded reports not only function seamlessly but also evolve according to user needs. By addressing common hurdles and leveraging automation, organizations can streamline their operations, reduce time spent on repetitive tasks, and ultimately drive informed, data-driven decisions.
In conclusion, embedding Power BI reports is not just about enhancing data accessibility; it is a strategic move towards fostering a culture of innovation and operational efficiency. As organizations embrace these practices, they position themselves to thrive in a data-driven landscape, transforming insights into actionable strategies for growth and success.
Overview
Exporting underlying data from Power BI is essential for organizations to enhance their analytical capabilities and share insights effectively across teams. The article outlines various methods for exporting data, such as using the ‘Export data’ option in reports and dashboards, leveraging the ‘Analyze in Excel’ feature, and employing the Power BI REST API, while also addressing potential challenges like size restrictions and formatting losses that users may encounter during the process.
Introduction
In a data-driven world, the ability to extract and analyze information effectively can be the key to unlocking business success. As organizations increasingly rely on Power BI to visualize their data, understanding the nuances of exporting this information becomes paramount.
From enhancing analytical capabilities to integrating with advanced tools, exporting data not only facilitates deeper insights but also empowers teams to make informed decisions swiftly. However, navigating the complexities of data export can present challenges, from size limitations to formatting issues.
This article provides a comprehensive guide on best practices for exporting data from Power BI, ensuring that organizations can leverage their data assets efficiently while maintaining integrity and security throughout the process.
The Importance of Exporting Data from Power BI for Enhanced Analysis
Exporting underlying data Power BI is a crucial practice for organizations aiming to enhance their analysis capabilities and overcome implementation challenges. The capability to export underlying data Power BI not only allows users to conduct thorough analyses and merge details with other applications but also facilitates efficient sharing of insights across teams. This process enables stakeholders to handle and illustrate information in ways that may not be feasible solely within Power BI’s interface, allowing them to export underlying data Power BI.
Additionally, it enables the application of advanced analytical tools, such as Excel and statistical software, yielding deeper insights into business performance and emerging trends. Significantly, when utilizing DirectQuery, BI can export a maximum of 16-MB uncompressed information. With 97% of Fortune 500 companies utilizing Power BI, effective information management is vital for informed decision-making in 2024.
However, users should be aware that when they export underlying data Power BI, dynamic formatting and visual-specific formatting may not be preserved, as highlighted in the case study on dynamic formatting limitations. Embracing these capabilities will improve analysis and drive better business outcomes. Furthermore, organizations can benefit from the expertise of Microsoft Gold Partners, who provide services to modernize information and applications, create visualizations, and enhance overall business value, ensuring a streamlined workflow and risk-free ROI assessment.
In particular, the 3-Day Business Intelligence Sprint enables teams to swiftly produce professionally crafted reports, while the General Management App facilitates thorough management and intelligent evaluations, simplifying the process for organizations to navigate their information landscape efficiently. Furthermore, incorporating Robotic Process Automation (RPA) can further optimize workflows, and customized AI solutions can assist organizations in navigating the complexities of technology implementation, ensuring that they utilize BI to its maximum potential.
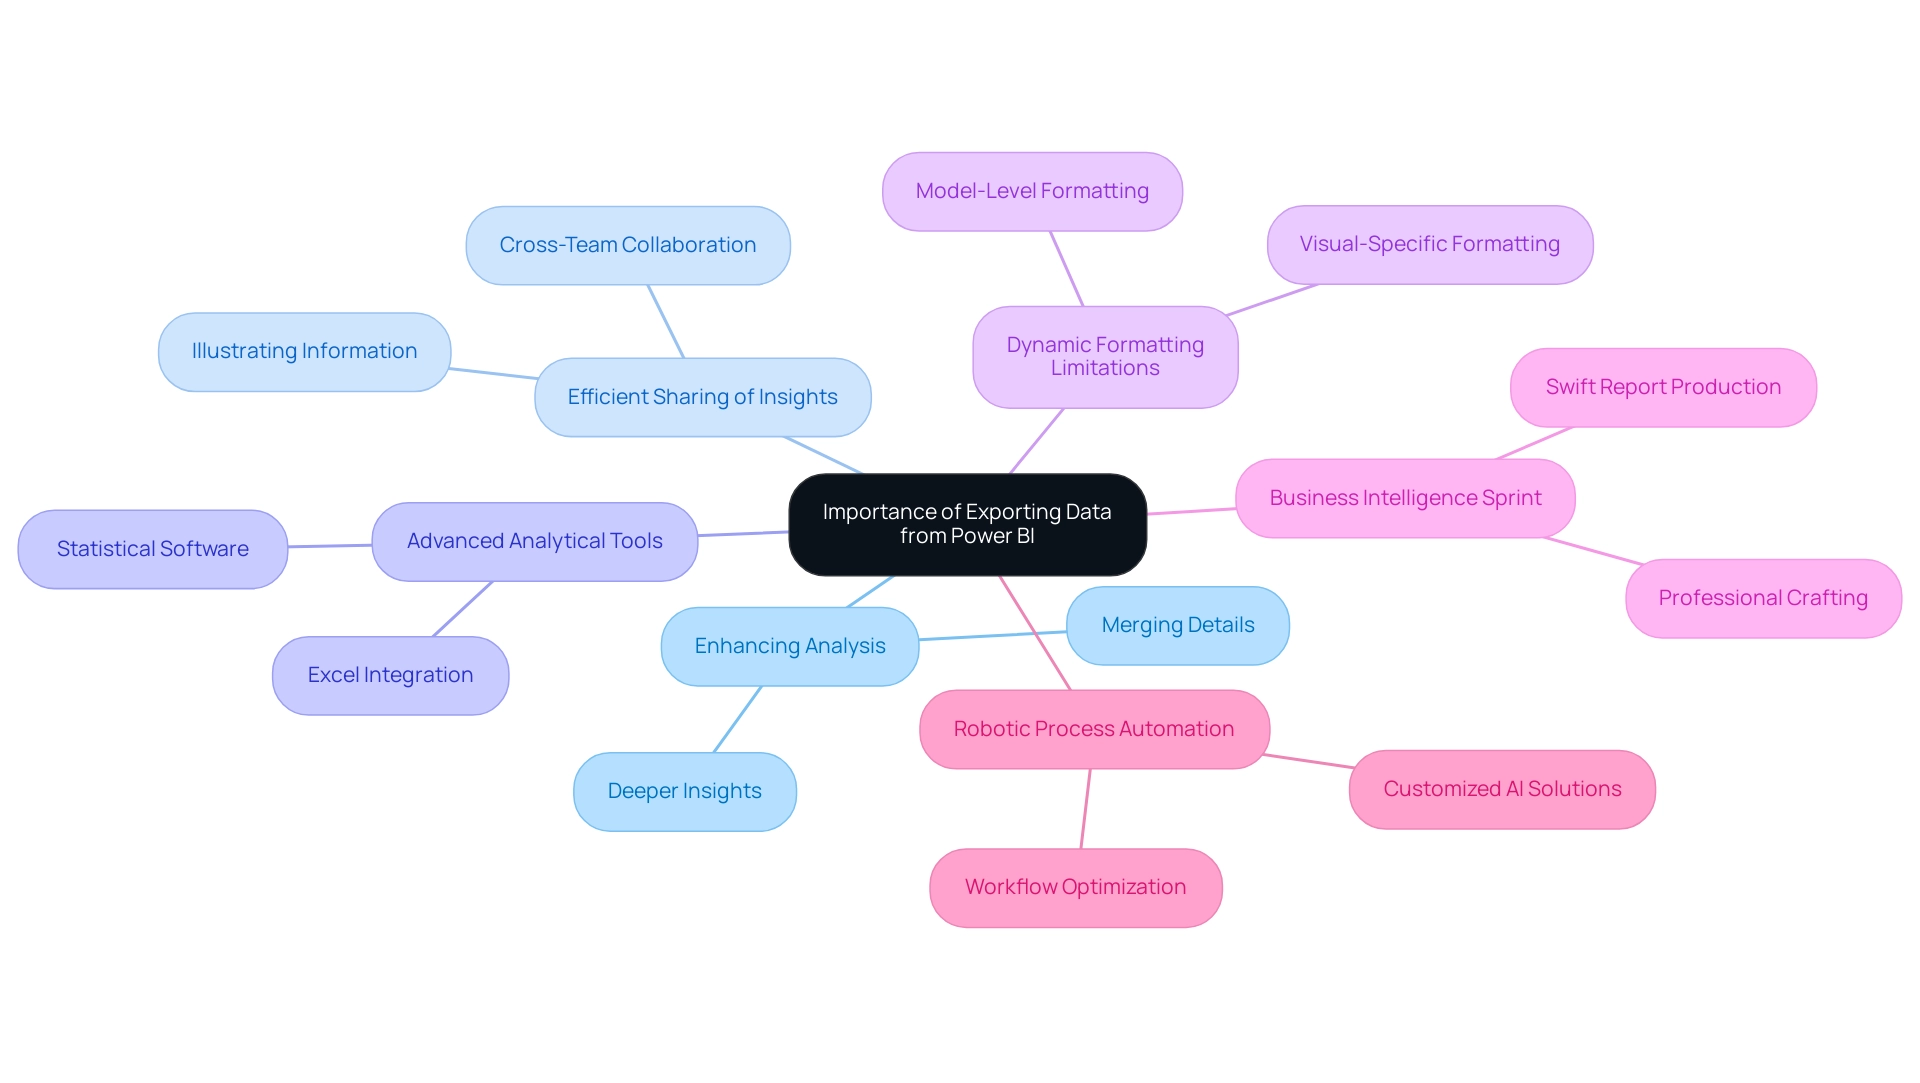
Methods for Exporting Data from Power BI: A Comprehensive Overview
Exporting data from Power BI can be accomplished through several effective methods, each designed to enhance your data management capabilities and support operational efficiency:
-
Exporting Information from Reports: Users can easily export underlying data Power BI from visualizations within reports by clicking on the ‘More Options’ (represented by three dots) on the desired visualization and selecting ‘Export information’. This straightforward method facilitates immediate information access for further analysis, empowering you to export underlying data power bi and leverage insights quickly.
-
Utilizing the ‘Analyze in Excel’ Feature: This powerful feature enables users to connect their Power BI datasets directly to Excel. By leveraging Excel’s advanced analytical tools, users can conduct in-depth analyses and create complex models, enhancing reporting capabilities and driving data-driven decision-making.
-
Exporting from Dashboards: Similar to reports, information from dashboard tiles can be exported. Users simply select the relevant tile and use the export option, ensuring that they can harness insights from their most critical visuals without hassle, thus reducing the time spent on report creation.
-
Power BI Service API: For those seeking a more advanced solution, the Power BI REST API provides the capability to programmatically export underlying data Power BI from datasets. This method is particularly beneficial for automation and integration with other applications, allowing for greater flexibility in handling information and enabling users to export underlying data power bi while aligning with RPA initiatives.
-
DAX Studio Workaround: For users needing to export large datasets, utilizing DAX Studio is an effective workaround. This tool enables the export of an unlimited number of rows to Excel, significantly improving management capabilities when handling extensive sets and addressing potential inconsistencies.
To further enhance operational efficiency, consider integrating RPA solutions like EMMA RPA and Automate. These tools can automate repetitive tasks related to extraction and reporting, significantly reducing the time and effort needed for manual processes. By implementing these RPA solutions, businesses can streamline workflows, minimize errors, and allow teams to focus on more strategic initiatives.
It’s important to note that reports accessed through the Admin Portal are in read-only mode, which restricts the ability to export underlying data power bi directly. However, exploring these alternative methods can significantly enhance your information management strategies.
Furthermore, consider the insights from the case study titled ‘Practical Application of Statistical Measures in BI’, which demonstrates using SQL Server to create a dataset of a hypothetical firm’s monthly profit and revenue, followed by analysis in BI using statistical measures such as sum, mean, median, and standard deviation. This practical example illustrates how statistical evaluations can provide valuable insights into financial performance, further demonstrating the importance of BI.
As you evaluate the reliability of your information, consider the insights from statistical assessments: “By examining the source of statistical information, you can evaluate the trustworthiness of your exported information by asking critical questions about the author, currency, and cross-checking capabilities.” Moreover, examining extra statistical measures in the Query Editor, such as skewness and kurtosis, can enhance your comprehension of the distribution and variability. This approach will not only empower your decision-making but also optimize your operational efficiency through effective utilization of BI and RPA technologies.
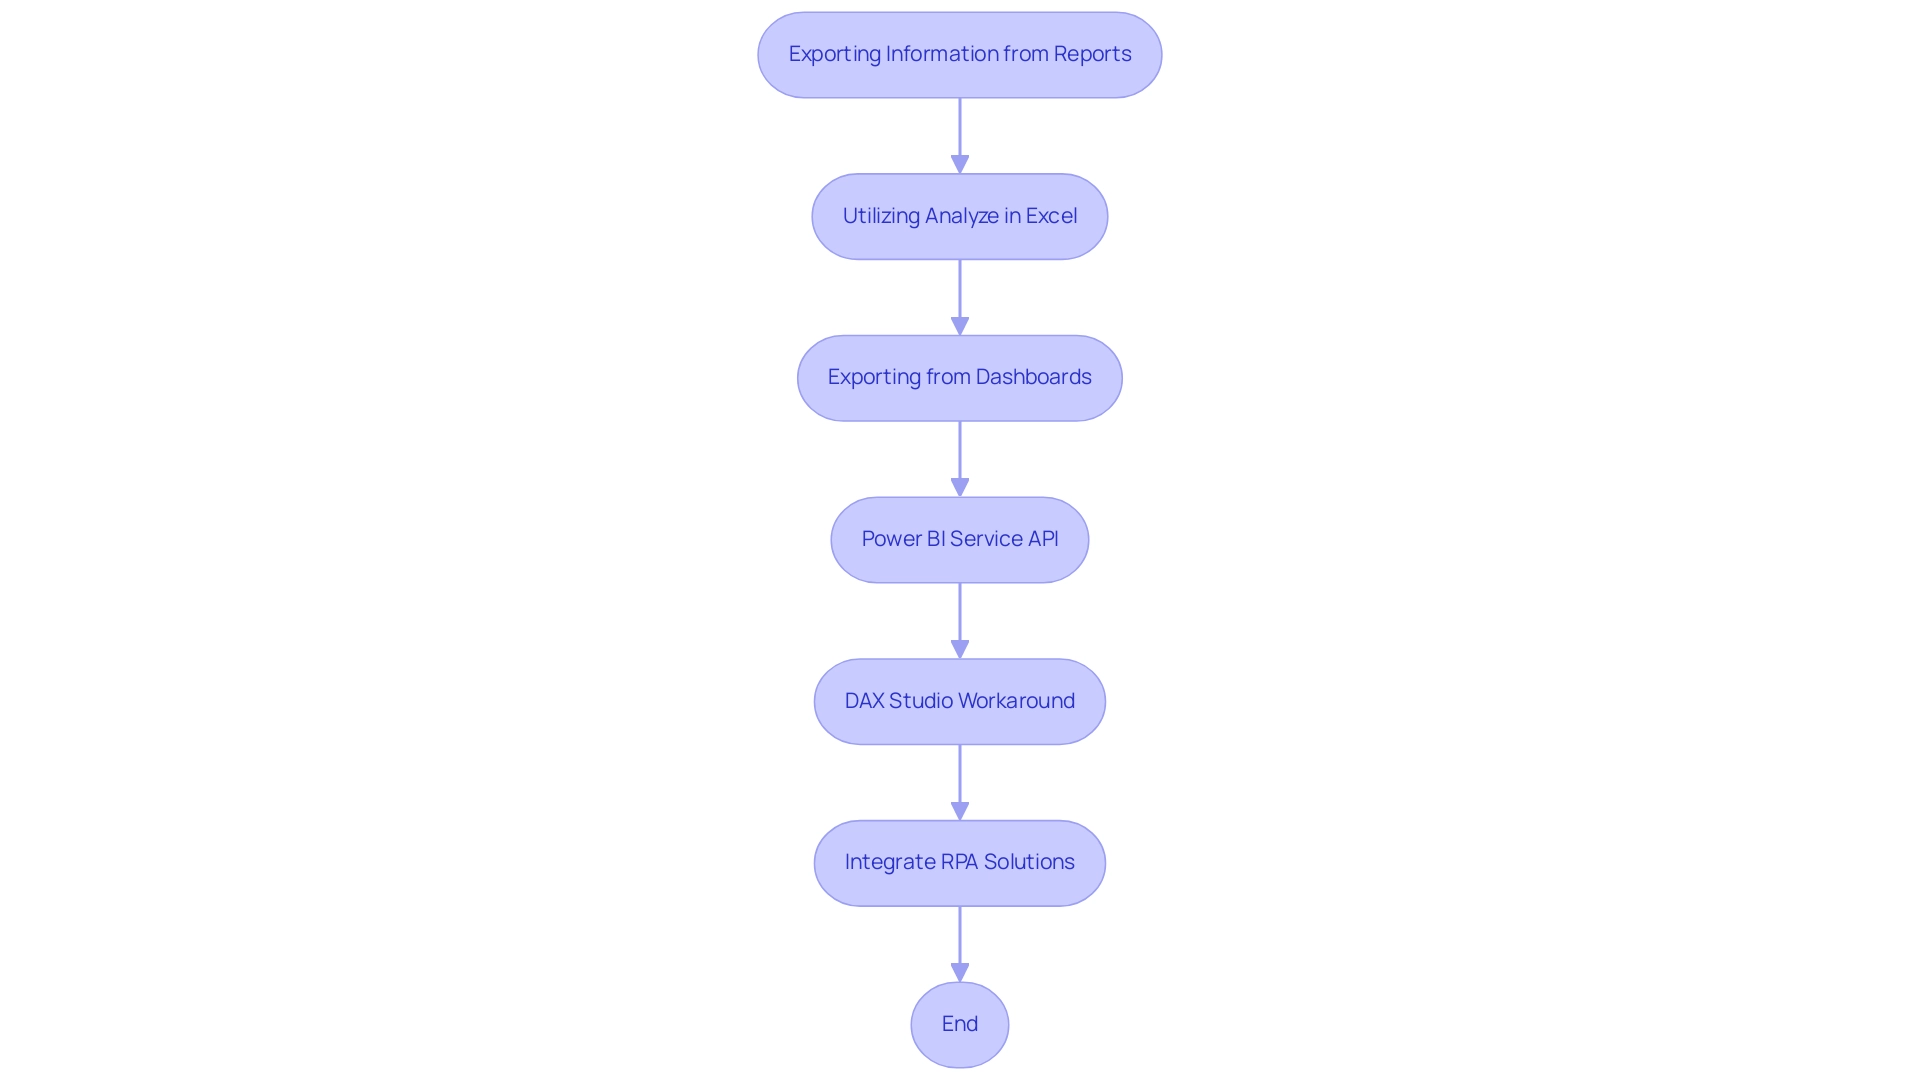
Step-by-Step Guide to Exporting Underlying Data from Power BI
The process to export underlying data Power BI is straightforward and can significantly enhance your analysis capabilities, especially when combined with Robotic Process Automation (RPA) and tailored AI solutions. RPA facilitates the creation of automated workflows for timely access to current information, enhancing export efficiency and minimizing mistakes. Here’s a step-by-step guide to help you efficiently extract the data you need:
- Open Power BI: Begin by logging into your Power BI account. Navigate to the specific report or dashboard that contains the information you wish to export.
- Select the Visualization: Identify and click on the visualization from which you want to extract information. This could be a chart, graph, or table.
- Access More Options: Locate the ‘More Options’ icon, represented by three dots in the top-right corner of the visualization, and click on it.
- Choose Export Data: In the dropdown menu that appears, select the ‘Export data’ option, which will direct you to the next steps.
- Select File Format: You will be prompted to choose your desired file format for the transfer. Options typically include CSV or Excel, depending on your needs.
- Download the File: After selecting the format, click ‘Export.’ Wait for the download to complete; the file will be saved directly to your local device, ready for further analysis.
As noted by Roxanne Vals, a Senior Financial Modeling Consultant, to effectively utilize this feature, it’s essential to engage with the report directly:
Go to Power BI. Open the report that includes the set of information you wish to export. Click ‘Export’ within the top ribbon.
Within the dropdown, select ‘Analyze in Excel’.
Additionally, it is important to evaluate the reliability of the exported information. As highlighted in the case study titled “Evaluating Statistical Information,” asking critical questions about the information’s author, currency, and cross-checking capabilities is crucial to ensure integrity. By leveraging Business Intelligence alongside tailored AI solutions and RPA, you can transform raw information into actionable insights that drive growth and innovation.
Furthermore, utilizing the Zuar Portal can provide secure access to analytics, further enhancing your information management and integration capabilities. By following this process and considering these insights, you can ensure that you extract the necessary information efficiently and effectively, overcoming common challenges such as time-consuming report creation and inconsistencies.
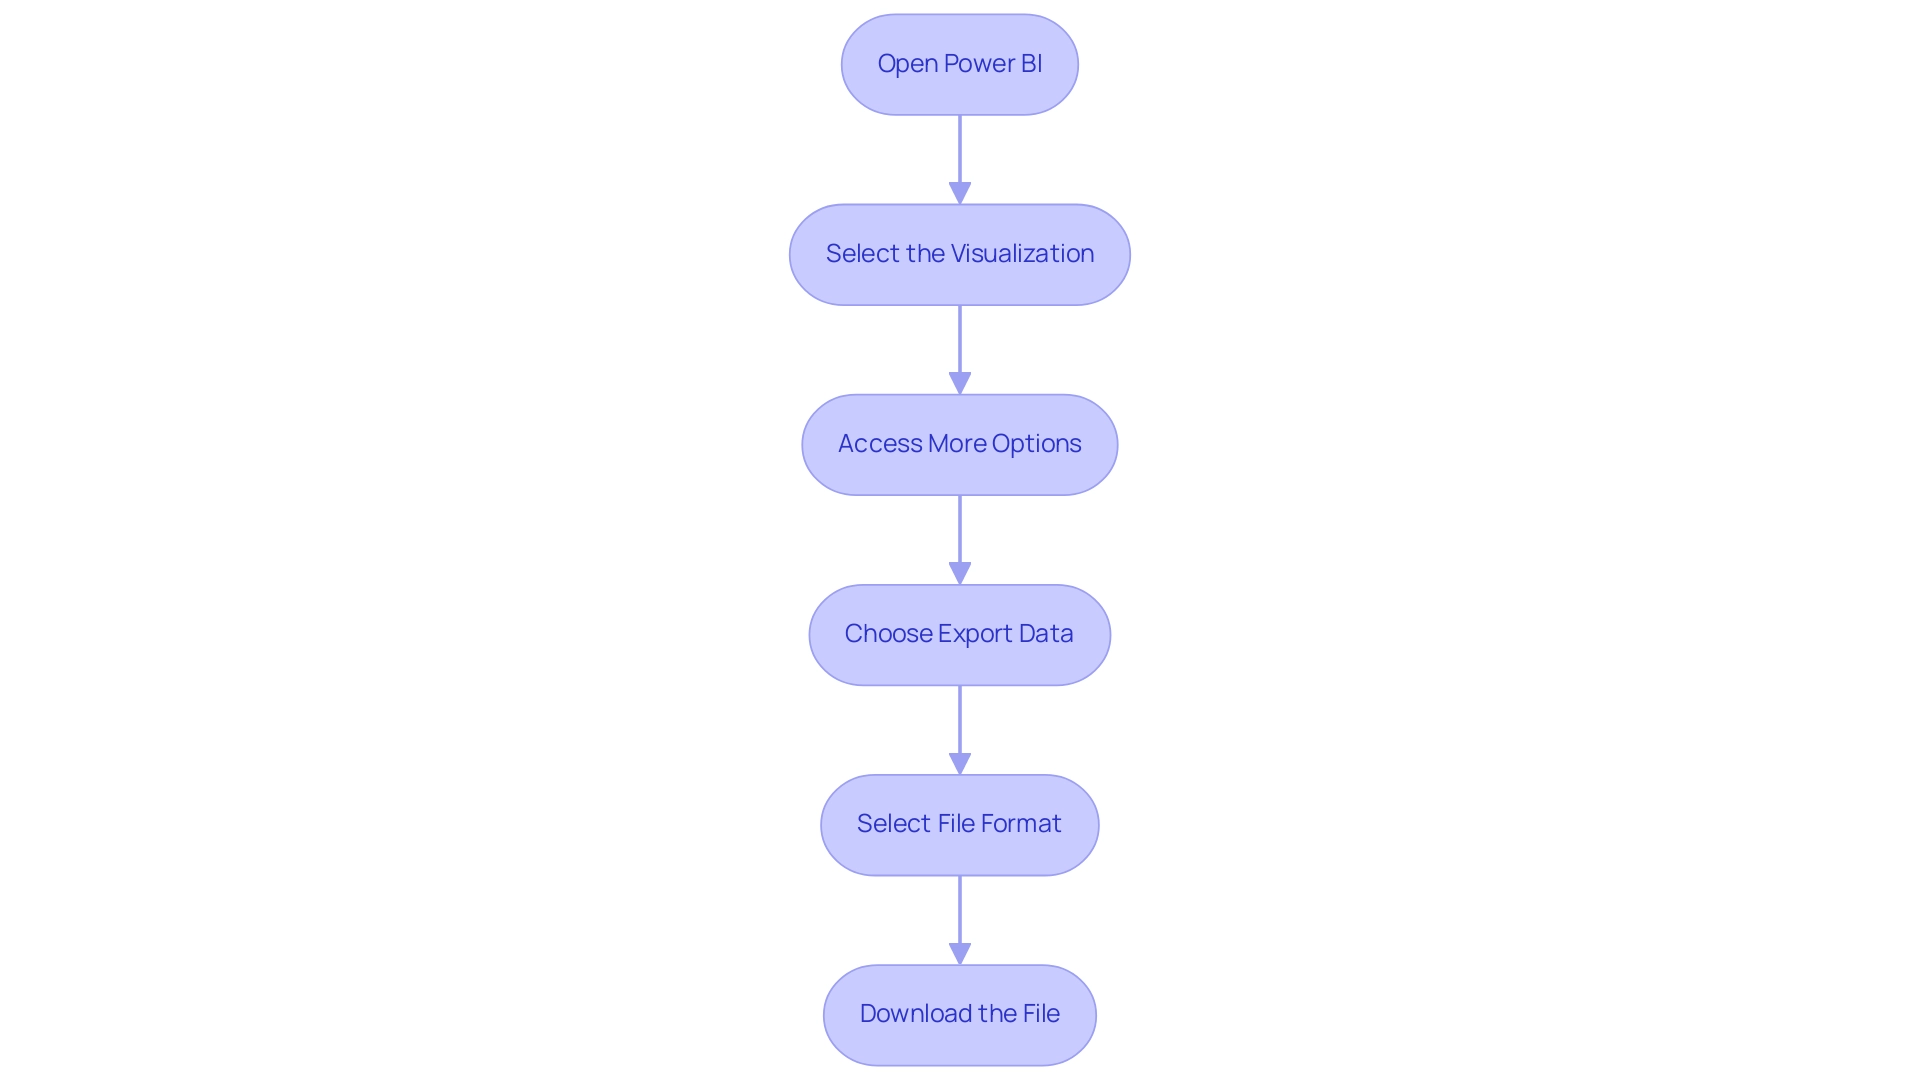
Navigating Challenges: Common Limitations in Exporting Power BI Data
Transferring information from BI, while usually a simple process, poses several notable difficulties that users ought to recognize:
- Size Restrictions: Power BI enforces strict limits on the amount of information that can be used to export underlying data Power BI, which can be particularly problematic for users handling large datasets. For instance, one user encountered the need to copy and paste information in 500,000-row chunks, requiring seven separate batches to complete the task. This limitation can result in inefficiencies in operations that RPA could assist in alleviating by automating processes to export underlying data power bi.
- Export Format Limitations: The kind of visualization used in Power BI can limit the ability to export underlying data. Not all formats are compatible with the desired output options, potentially complicating the analysis process and reducing the effectiveness of BI tools, particularly when attempting to export underlying data power bi.
- Permissions Issues: To export underlying data power bi, appropriate permissions are required. Users lacking these permissions may find themselves unable to access vital features needed to export underlying data power bi, stifling their ability to obtain necessary information and insights that drive informed decision-making. To address this, organizations should implement a clear permissions framework and training for users to ensure they understand the access requirements to export underlying data in Power BI.
- Information Transformation Loss: A common frustration arises when attempting to export underlying data from Power BI, as certain visual formatting and calculated fields may not be retained in the exported files. This loss can result in incomplete analyses, undermining the integrity of the information and hindering growth and innovation. Individuals can alleviate this by recording their information transformation procedures and considering alternative methods of sharing that allow them to export underlying data power bi while maintaining these elements.
Utpal Kar aptly notes, > This is one of the major BI drawbacks as Microsoft has designed BI in a very complex manner, underscoring the need for users to navigate these limitations thoughtfully.
To address these challenges, users may consider workarounds such as exporting underlying data Power BI or intercepting and reinterpreting information; however, these methods require high technical expertise and do not allow for inferring totals. Case studies, such as those outlining the limitations of BI Desktop, reveal that utilizing tools like DAX Studio can assist users in circumventing these internal restrictions to export underlying data power bi. For instance, DAX Studio provides the ability to export underlying data power bi by enabling the transfer of larger datasets, accommodating .xlsx files containing up to 1 million rows and .csv files with around 15 million rows, thus offering practical solutions to tackle the inherent challenges of BI information transfers.
Additionally, users can discover what’s new and trending in the Fabric community, which can provide valuable insights and resources to remain informed on BI developments. Customized AI solutions can further improve this process by automating information preparation and ensuring uniformity across outputs. Leveraging RPA and BI together can significantly enhance operational efficiency and drive data-driven insights crucial for business growth.
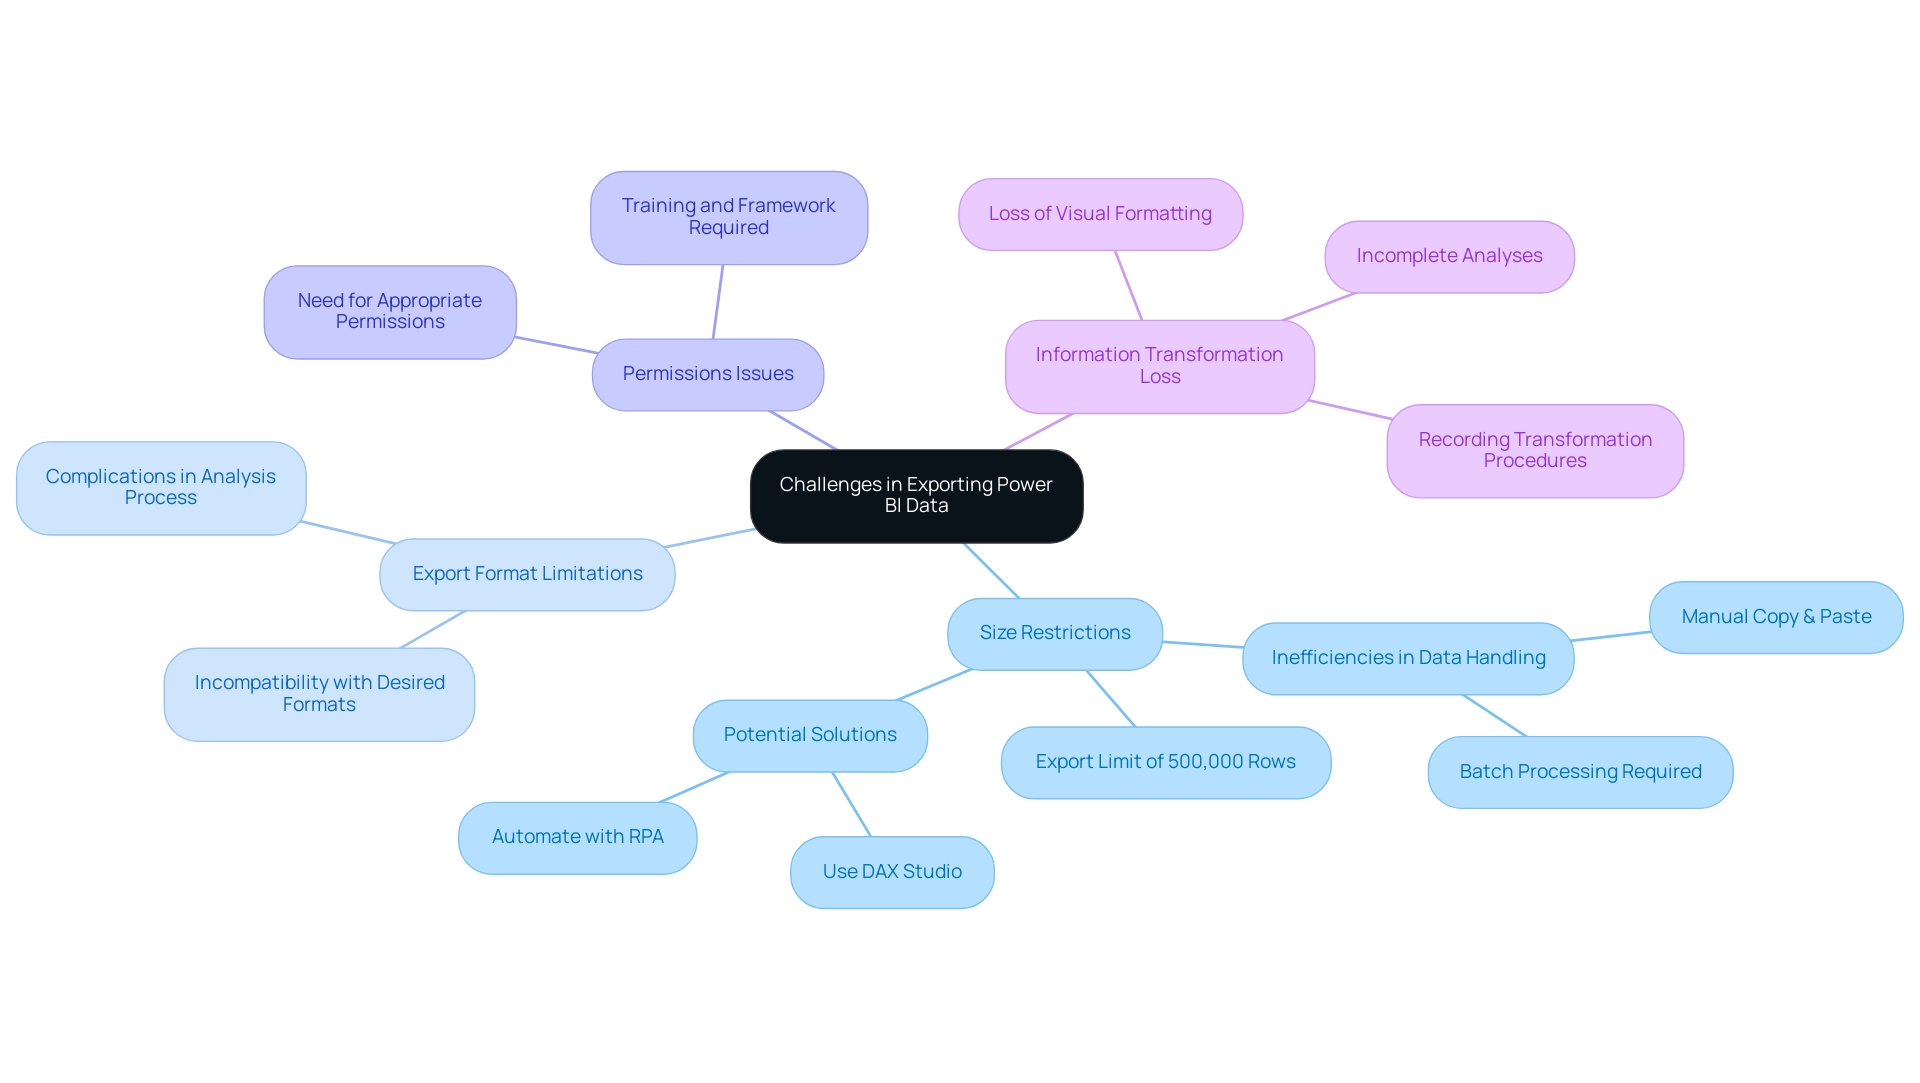
Best Practices for Ensuring Data Integrity and Security During Export
To uphold information integrity and security during the transfer process in Power BI, while utilizing the advantages of Business Intelligence and RPA, adhere to these crucial best practices:
- Verify Permissions: Always confirm that you have the necessary permissions for export, ensuring that files are shared exclusively with authorized personnel to prevent unauthorized access. This step is crucial for maintaining information security and integrity.
- Use Secure Connections: Export information using secure connections, such as HTTPS. This action is vital in safeguarding information from potential interception during transmission, ensuring that your insights remain reliable and actionable.
- Validate Information After Transfer: After finishing the transfer, prioritize verifying the information. This validation process ensures that the information is accurately captured, free from errors, and ready for subsequent analysis, which is essential for effective decision-making.
- Implement Governance Policies: Establish robust governance policies that outline clear guidelines for access, export, and sharing. These policies help maintain information integrity and enhance overall security within your organization, fostering a culture of accountability.
- Employ Error Detection & Correction Methods: Utilize techniques such as checksums, duplication checks, and anomaly detection. These methods are essential for verifying integrity during transfers or storage, as highlighted in the case study on Error Detection & Correction Methods. This study demonstrates that these techniques can effectively identify potential corruption or tampering, ensuring precise analysis.
- Leverage RPA for Efficiency: Implement Robotic Process Automation (RPA) to streamline the process to export underlying data from Power BI. RPA can automate repetitive tasks, reducing the likelihood of human error and enhancing operational efficiency, ultimately allowing teams to focus on strategic analysis rather than manual information handling.
As Michael Buckbee emphasizes,
Information integrity is not to be confused with information security.
Understanding this distinction is crucial as you implement these practices, ensuring both aspects are prioritized in your operations. Additionally, it’s important to note that if confidence is to remain at 98%, reliability drops from 99% to 98.549%.
This statistic emphasizes the necessity of maintaining high reliability in integrity practices. Moreover, utilizing tools that provide a sanity check for information integrity before proceeding with further analysis can significantly enhance the effectiveness of these best practices, ultimately driving growth and innovation through informed decision-making. Addressing challenges such as time-consuming report creation and data inconsistencies through these practices can further empower your organization to export underlying data from Power BI effectively, allowing for better insights from dashboards.
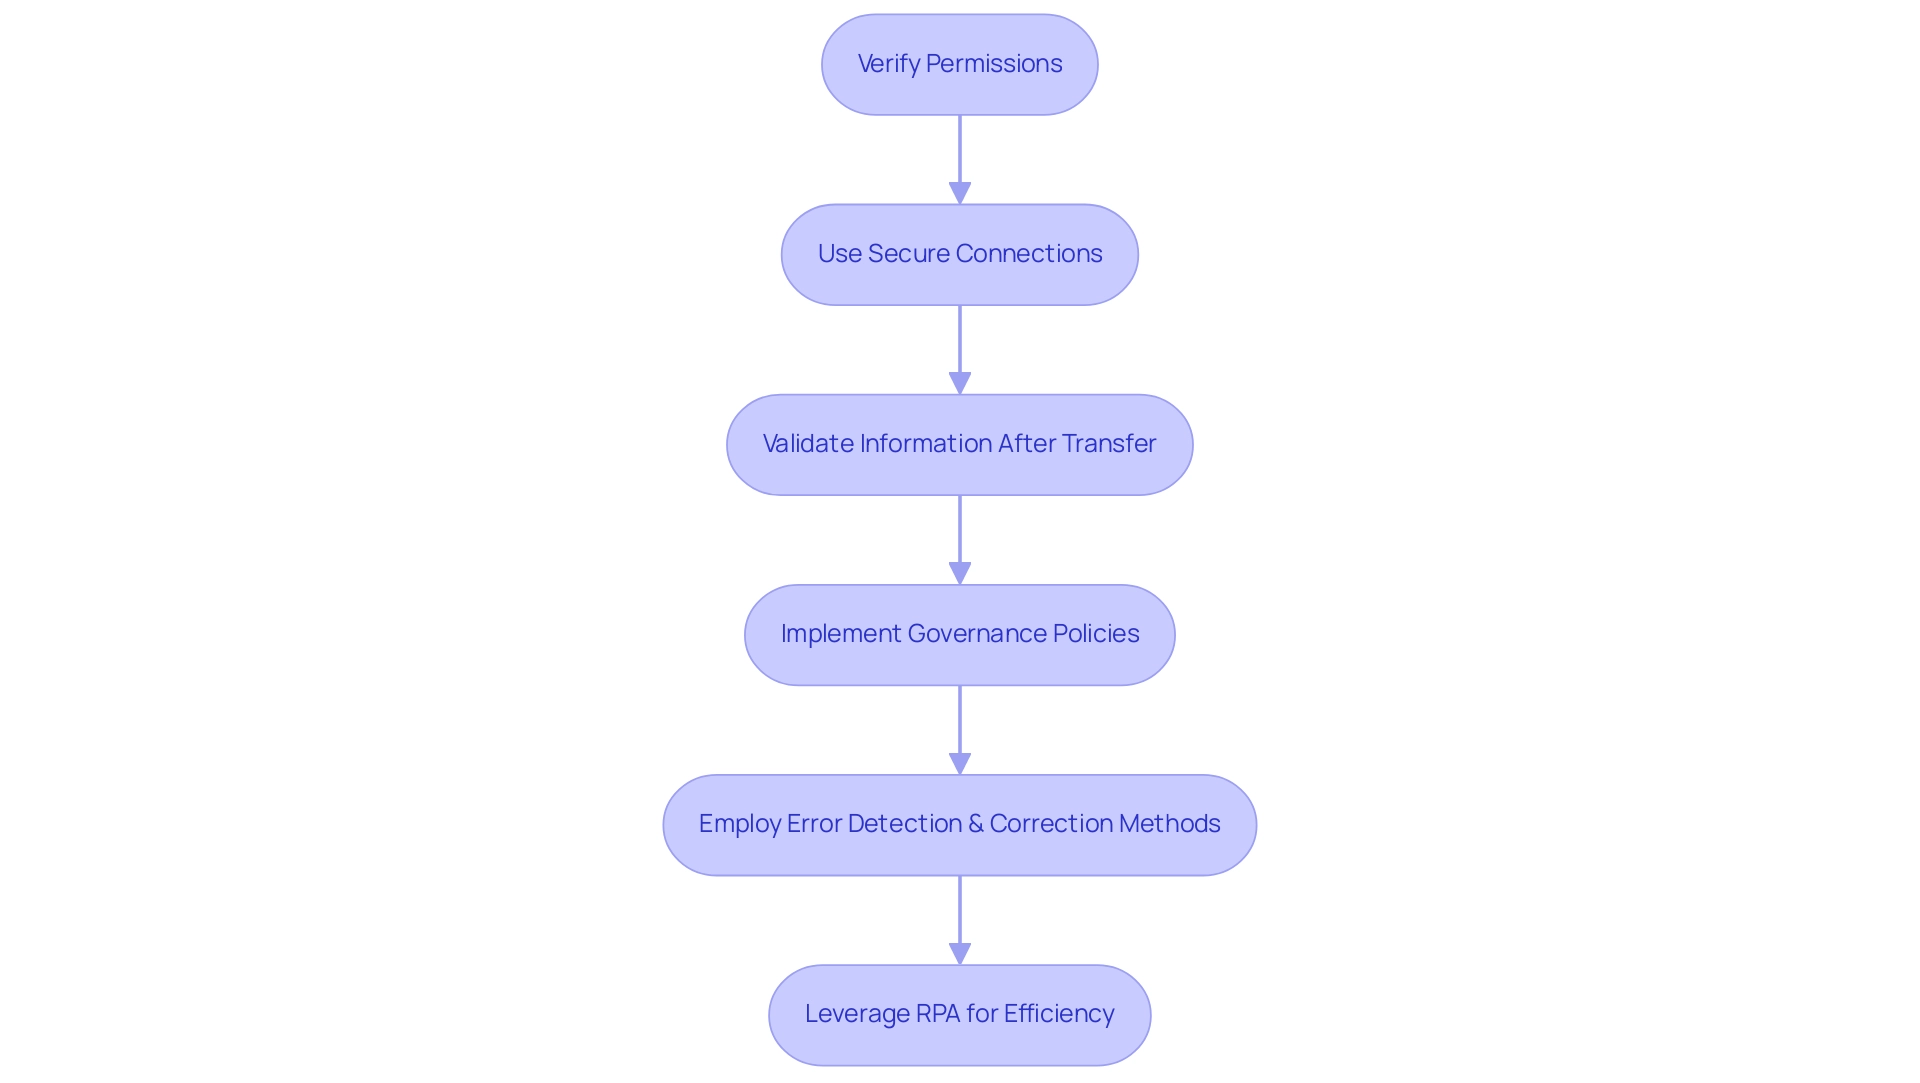
Conclusion
Exporting data from Power BI is not just a technical necessity; it is a strategic enabler that enhances analytical proficiency and fosters informed decision-making. By leveraging various methods such as:
- Exporting from reports
- Utilizing the ‘Analyze in Excel’ feature
- Employing DAX Studio
organizations can significantly streamline their data management processes. These practices empower teams to extract, analyze, and visualize data effectively, thus maximizing the value derived from their data assets.
However, it is essential to navigate the inherent challenges associated with data export, including:
- Size limitations
- Formatting issues
- Permissions constraints
By implementing best practices such as:
- Verifying permissions
- Using secure connections
- Employing Robotic Process Automation (RPA)
organizations can maintain data integrity and security throughout the export process. This proactive approach not only mitigates risks but also enhances operational efficiency, allowing teams to focus on strategic initiatives rather than manual data handling.
In a rapidly evolving data landscape, the effective export of data from Power BI is crucial for unlocking deeper insights and driving business success. By embracing these methodologies and best practices, organizations can transform their data into actionable intelligence, ensuring they remain competitive and responsive in today’s dynamic market. Taking these steps will not only elevate analytical capabilities but will also pave the way for sustainable growth and innovation.
Overview
The article provides a comprehensive guide on how to automate the export of Power BI reports to PDF, detailing a step-by-step process that enhances operational efficiency. It emphasizes the importance of understanding key concepts, utilizing automation tools like Power Automate, and adhering to best practices to mitigate challenges such as formatting issues and user permissions, ultimately streamlining the reporting process for improved data sharing.
Introduction
In the dynamic landscape of data management, the ability to efficiently export Power BI reports is more than just a technical necessity; it is a strategic advantage that can empower organizations to communicate insights effectively. As businesses grapple with the complexities of report creation and data governance, understanding the nuances of exporting reports to formats like PDF becomes crucial.
This article delves into the intricacies of Power BI report exporting, offering practical methods to automate the process, tools to enhance efficiency, and best practices to ensure successful outcomes. By addressing common challenges and limitations, organizations can transform their reporting strategies into streamlined workflows, ultimately fostering clearer communication and informed decision-making among stakeholders.
Understanding Power BI Report Exporting
An effective method to share insights and visualizations with stakeholders who may not have direct access to the Power BI service is to export Power BI report to PDF automatically. However, many organizations face challenges such as:
- Spending excessive time on document creation
- Encountering data inconsistencies due to a lack of governance strategy
- Lacking actionable guidance
The procedure mainly entails transforming documents into widely recognized formats, such as PDF, ensuring a broad reach across diverse audiences.
To effectively export Power BI report to PDF automatically, it’s essential to grasp a few key concepts:
- Selecting the appropriate format is crucial
- Confirming that all visuals are preserved during the transfer
- Being mindful of the limitations inherent in the transfer function, such as potential formatting discrepancies that can arise during conversion
For instance, an Excel .xlsx file can export up to 150,000 rows, underscoring the importance of understanding your data’s limitations. Additionally, comprehending how view and viewer metrics are calculated based on user interactions can provide deeper insights into engagement.
Recent news highlights that distribution indicates how viewers accessed a document, while the platform shows the technology used to open it, adding context to document accessibility. A case study on usage metrics in national/regional clouds illustrates how BI ensures compliance with local regulations while providing valuable usage insights. As Amitchanka mentioned, Microsoft indicates that documents in the BI admin portal are in read-only mode, which highlights the significance of comprehending the constraints of accessibility.
By becoming acquainted with these aspects, including the necessity for a governance strategy to uphold data integrity, you create a strong basis for automating your document transfers and can easily export Power BI reports to PDF automatically, improving not only accessibility but also the overall efficiency of data sharing within your organization. This approach ultimately transforms your reporting process into a more strategic and insightful endeavor, addressing the challenges posed by the overwhelming AI landscape and ensuring stakeholders receive clear, actionable guidance.
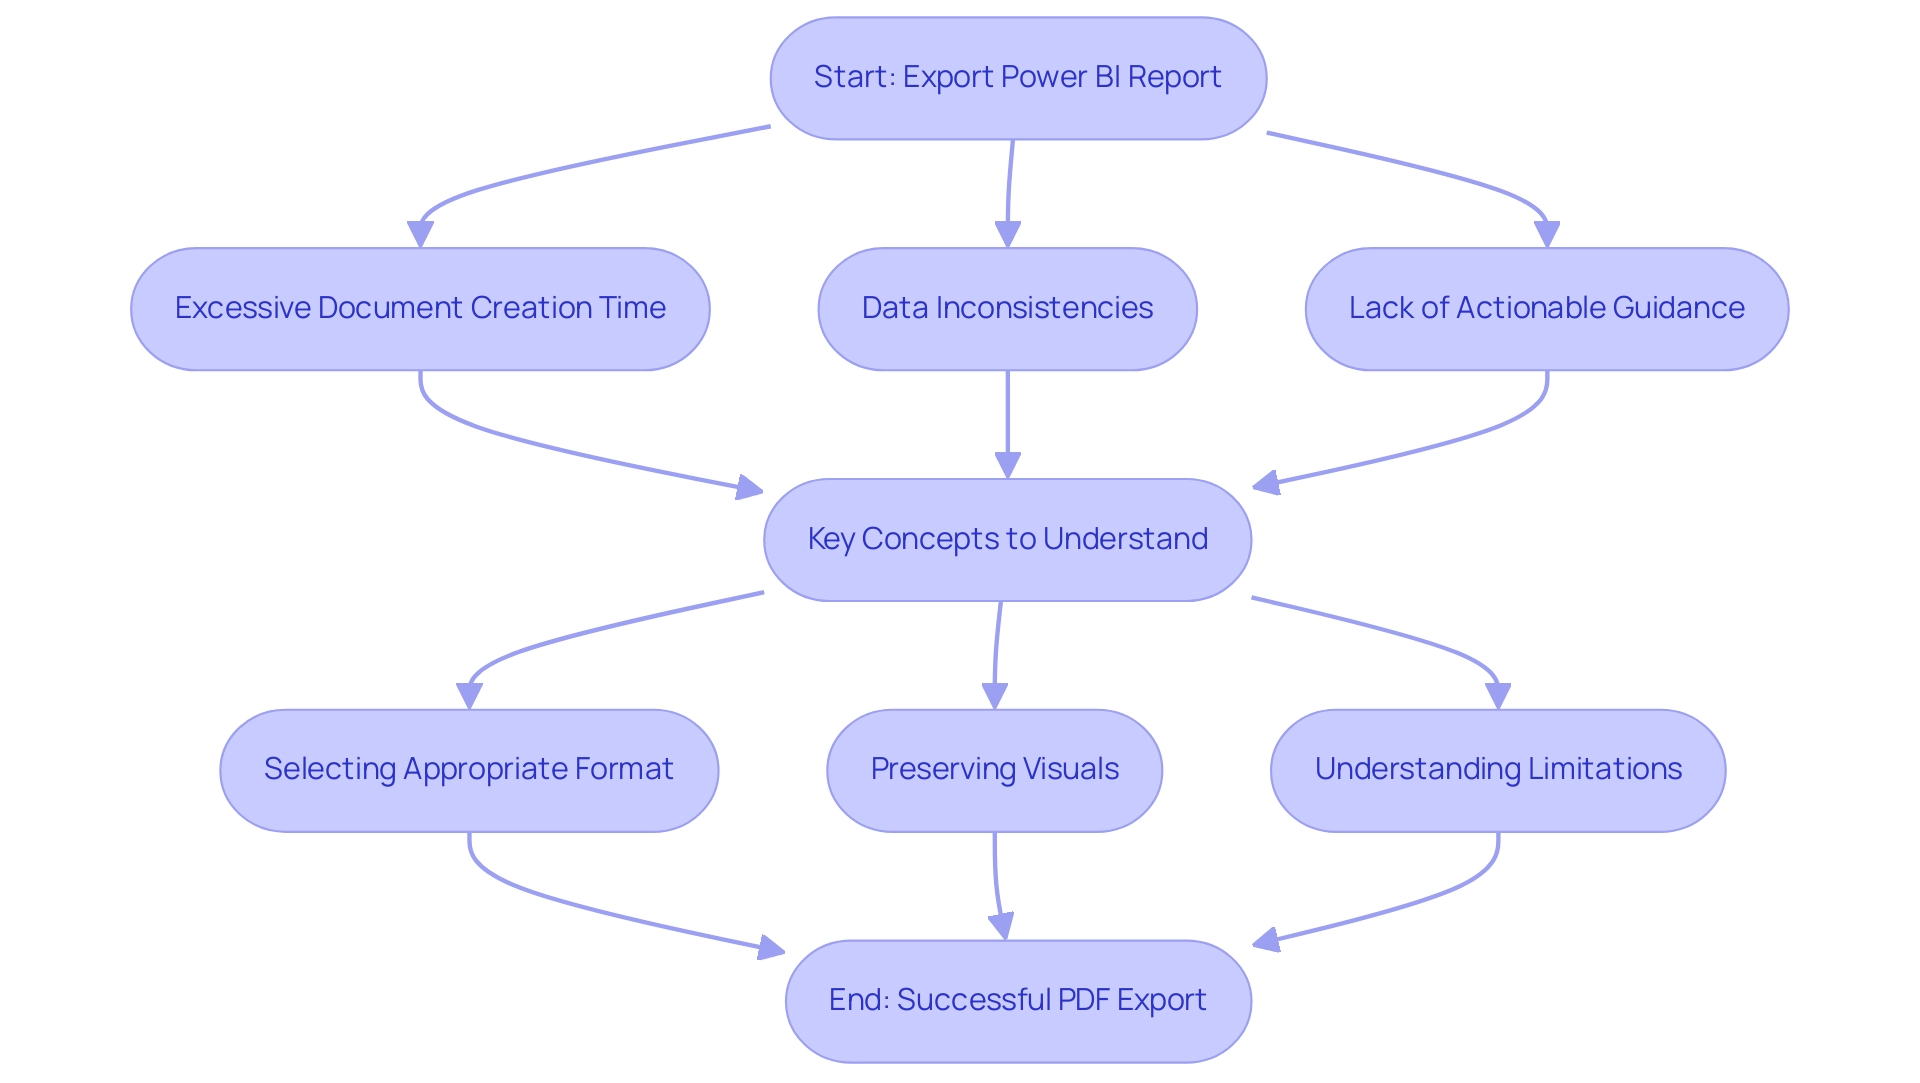
Automating PDF Exports: Step-by-Step Methods
To effectively automate PDF exports of your Power BI reports and enhance operational efficiency, follow this streamlined process while considering the challenges posed by manual workflows:
- Launch BI Desktop and access the document you intend to export.
- Submit the report to the BI Service, confirming its availability online for seamless access.
- Utilize Automate: Navigate to Automate and initiate a new flow that leverages Robotic Process Automation to automate your manual workflows, addressing the inefficiencies of repetitive tasks.
- Select an appropriate trigger: Opt for a trigger that aligns with your needs, such as ‘Recurrence’ for scheduled transfers, significantly boosting your operational efficiency.
- Add an action: Locate and select the ‘Save to File for Power BI Reports’ action to enable the functionality.
- Configure the action: Designate the workspace and document, set the output format to PDF, and identify the destination for the saved files.
- Save and test: Conclude by saving your flow and conducting a test run to ensure that the automation operates as intended.
This method not only permits you to arrange transfers but also facilitates automatic delivery to designated email recipients or storage in SharePoint or OneDrive, ensuring easy access for your team. By automating this process, organizations can significantly enhance their success rates, especially when they export Power BI reports to PDF automatically, reflecting the growing trend toward efficiency in information management. In fact, the usage metrics report updates daily with new data, underscoring the importance of timely and accurate reporting.
Additionally, consider the polling mechanism described in the case study on the BI Export API, which operates asynchronously. This feature enables users to track the progress of their jobs until completion, offering feedback on the amount of work accomplished during the process. Integrating tailored AI solutions can further enhance this automation by providing targeted technologies that align with your specific business goals.
As noted by a community expert, “Did I answer your question? Mark my post as a solution! Proud to be a Datanaut!”
This community engagement highlights the value of leveraging automation in BI for enhanced operational efficiency and informed decision-making.
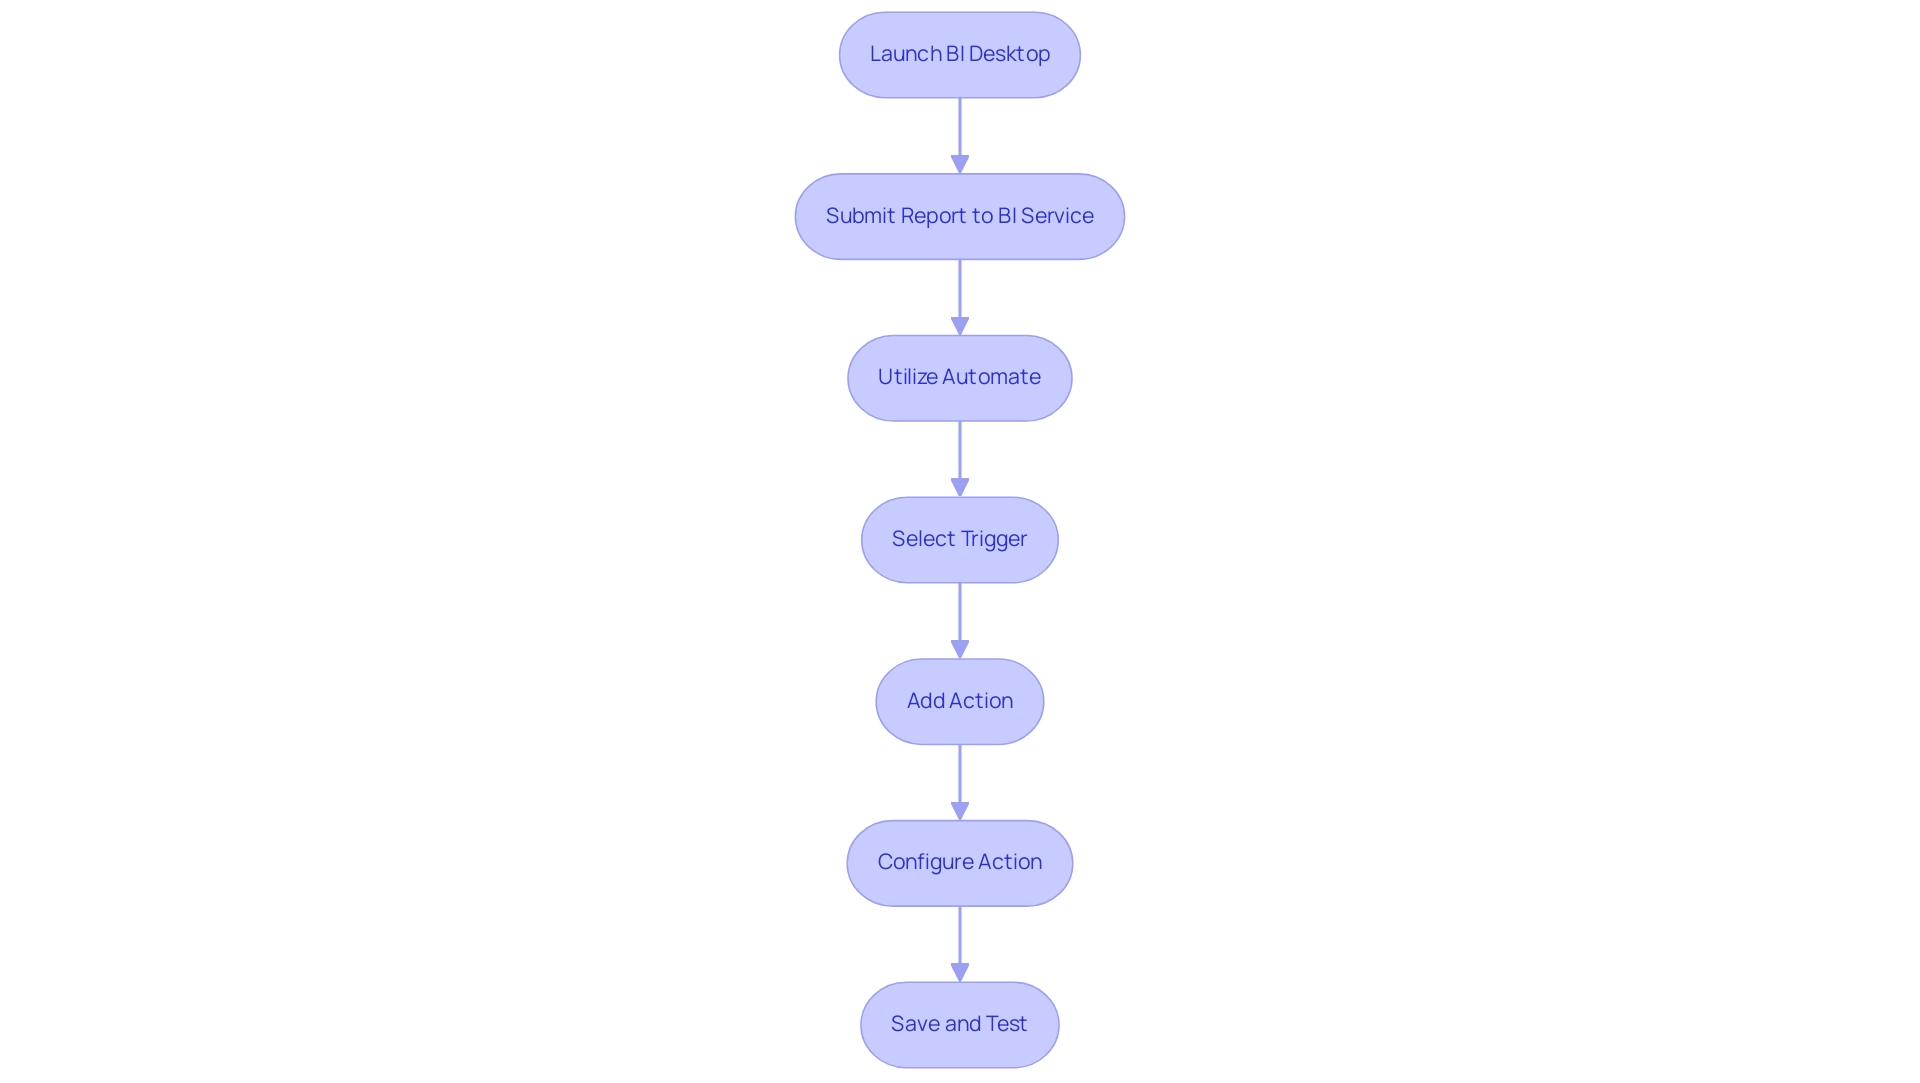
Tools for Automating Power BI Report Exports
To simplify the transfer of BI documents to PDF, several robust tools are accessible that can greatly improve your operational efficiency, particularly when used alongside our 3-Day BI Sprint:
-
Automate: This cloud-based service enables you to create automated workflows between different applications. Its smooth integration with BI makes it a preferred option for efficiently exporting documents, including the ability to export Power BI report to PDF automatically, enabling users to establish triggers and automate processes effortlessly. When merged with the insights obtained from your expertly crafted analysis created in the 3-Day Business Intelligence Sprint, Power Automate can further improve your operational efficiency and reduce costs over time.
-
PBRS (Business Intelligence Reports Scheduler): Specifically designed for the task, PBRS offers advanced scheduling options and the capability to export Power BI report to PDF automatically, as well as in various other formats. This third-party tool is invaluable for organizations seeking to automate their documentation processes thoroughly and effectively, particularly in helping to export Power BI report to PDF automatically, while complementing the professional summaries generated during the 3-Day Business Intelligence Sprint. Furthermore, tools such as Datylon streamline the creation of standard charts and documents through templates, ensuring consistency and clarity in documentation, thereby improving business intelligence.
-
Business Intelligence REST API: For those desiring a more personalized approach, the REST API offers advanced users the ability to develop customized automation solutions. This option enables greater flexibility in exporting documents programmatically, catering to specific organizational needs. A notable case study on Datylon Template Utilization illustrates how users can build a personalized chart library for reuse, significantly enhancing efficiency in creating visualizations.
By familiarizing yourself with these tools and how they complement the 3-Day Business Intelligence Sprint, you can streamline processes to export Power BI report to PDF automatically, enabling informed decisions that align with your organization’s automation requirements. This ultimately results in improved productivity and efficiency in your strategy while utilizing the insights gained from your BI analysis.
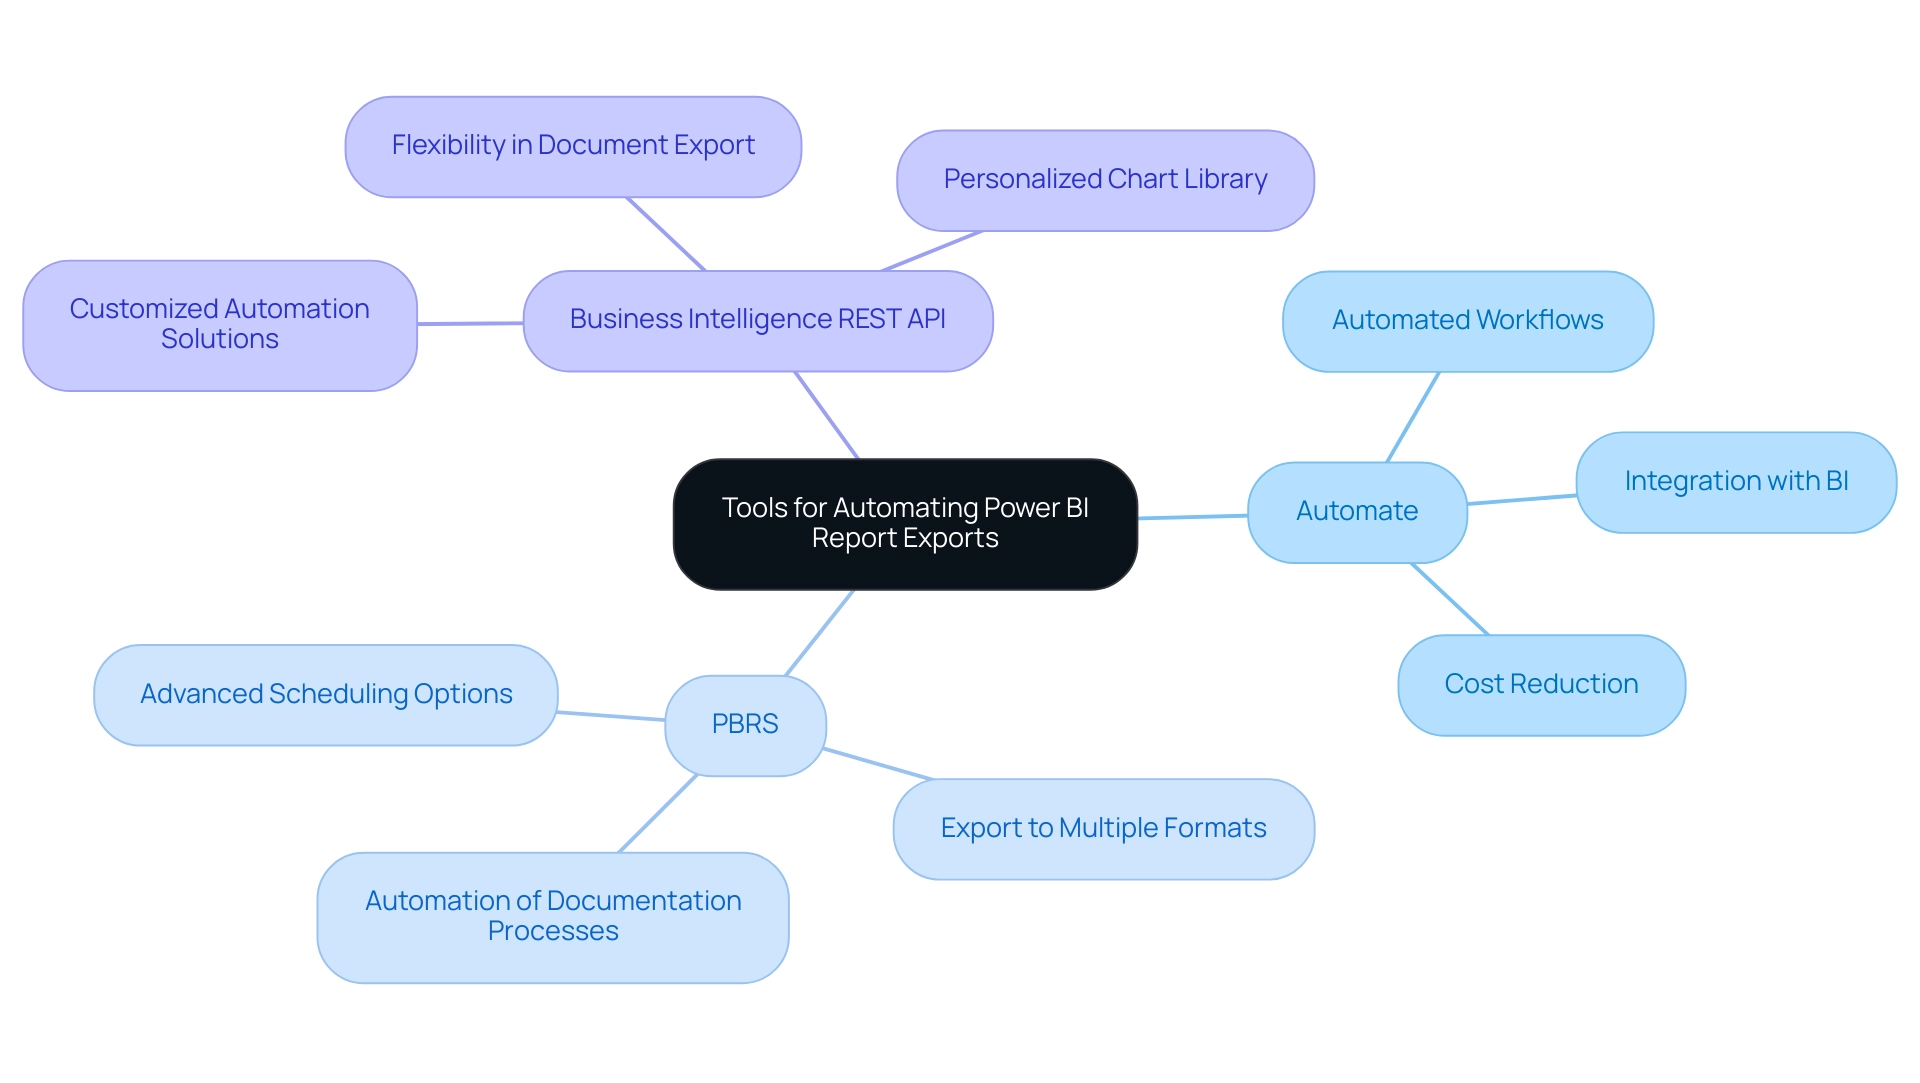
Considerations and Limitations in PDF Exports
When exporting Power BI documents to PDF, it is crucial to consider several limitations that may impact the process:
- Formatting Issues: The exported PDF may not accurately reflect the visual elements of the original Power BI document. Discrepancies can arise, leading to a loss of critical visual information. Significantly, dynamic formatting and visual-specific formatting are not retained when transferring information to Excel, complicating information representation.
- Information Size Limitations: Large datasets can complicate the transfer process, potentially causing timeouts or resulting in incomplete transfers. It’s crucial to maintain the size of information manageable to ensure successful transfers, thus easing the frequent issue of time-consuming document creation.
- Underlying Information Transfer: When transferring underlying information, remember that datetime variations and numeric columns with aggregation are not included. This limitation can significantly influence the insights obtained from the exported information, underscoring the importance of actionable guidance in your documents.
- Export Frequency: Depending on your licensing agreement with BI, there may be restrictions on how often documents can be exported. Comprehending these boundaries can assist you in organizing your schedule for submissions efficiently, boosting operational effectiveness.
- User Permissions: Verify that users have the required authorizations to transfer documents. Without proper access, they may encounter frustrating obstacles during the export process, contributing to the inconsistencies in data presentation.
To mitigate risks associated with exporting BI documents, it is essential to implement a governance strategy that ensures data consistency when you export Power BI reports to PDF automatically. By acknowledging these considerations, you can ensure a smoother process to export Power BI reports to PDF automatically. Furthermore, as suggested by super user Idrissshatila, connecting Excel directly to the BI dataset can provide an alternative visualization method that may circumvent some of these limitations, enhancing your reporting capabilities.
Additionally, leveraging tools like Robotic Process Automation (RPA) can streamline these processes, allowing your team to focus on strategic insights rather than manual report generation. The case study titled ‘Modeling Limitations in BI’ highlights user satisfaction concerns and emphasizes the need for ongoing enhancements in the BI experience, particularly regarding exporting functionalities. By concentrating on actionable insights obtained from BI dashboards, you can guide stakeholders effectively and enhance decision-making.
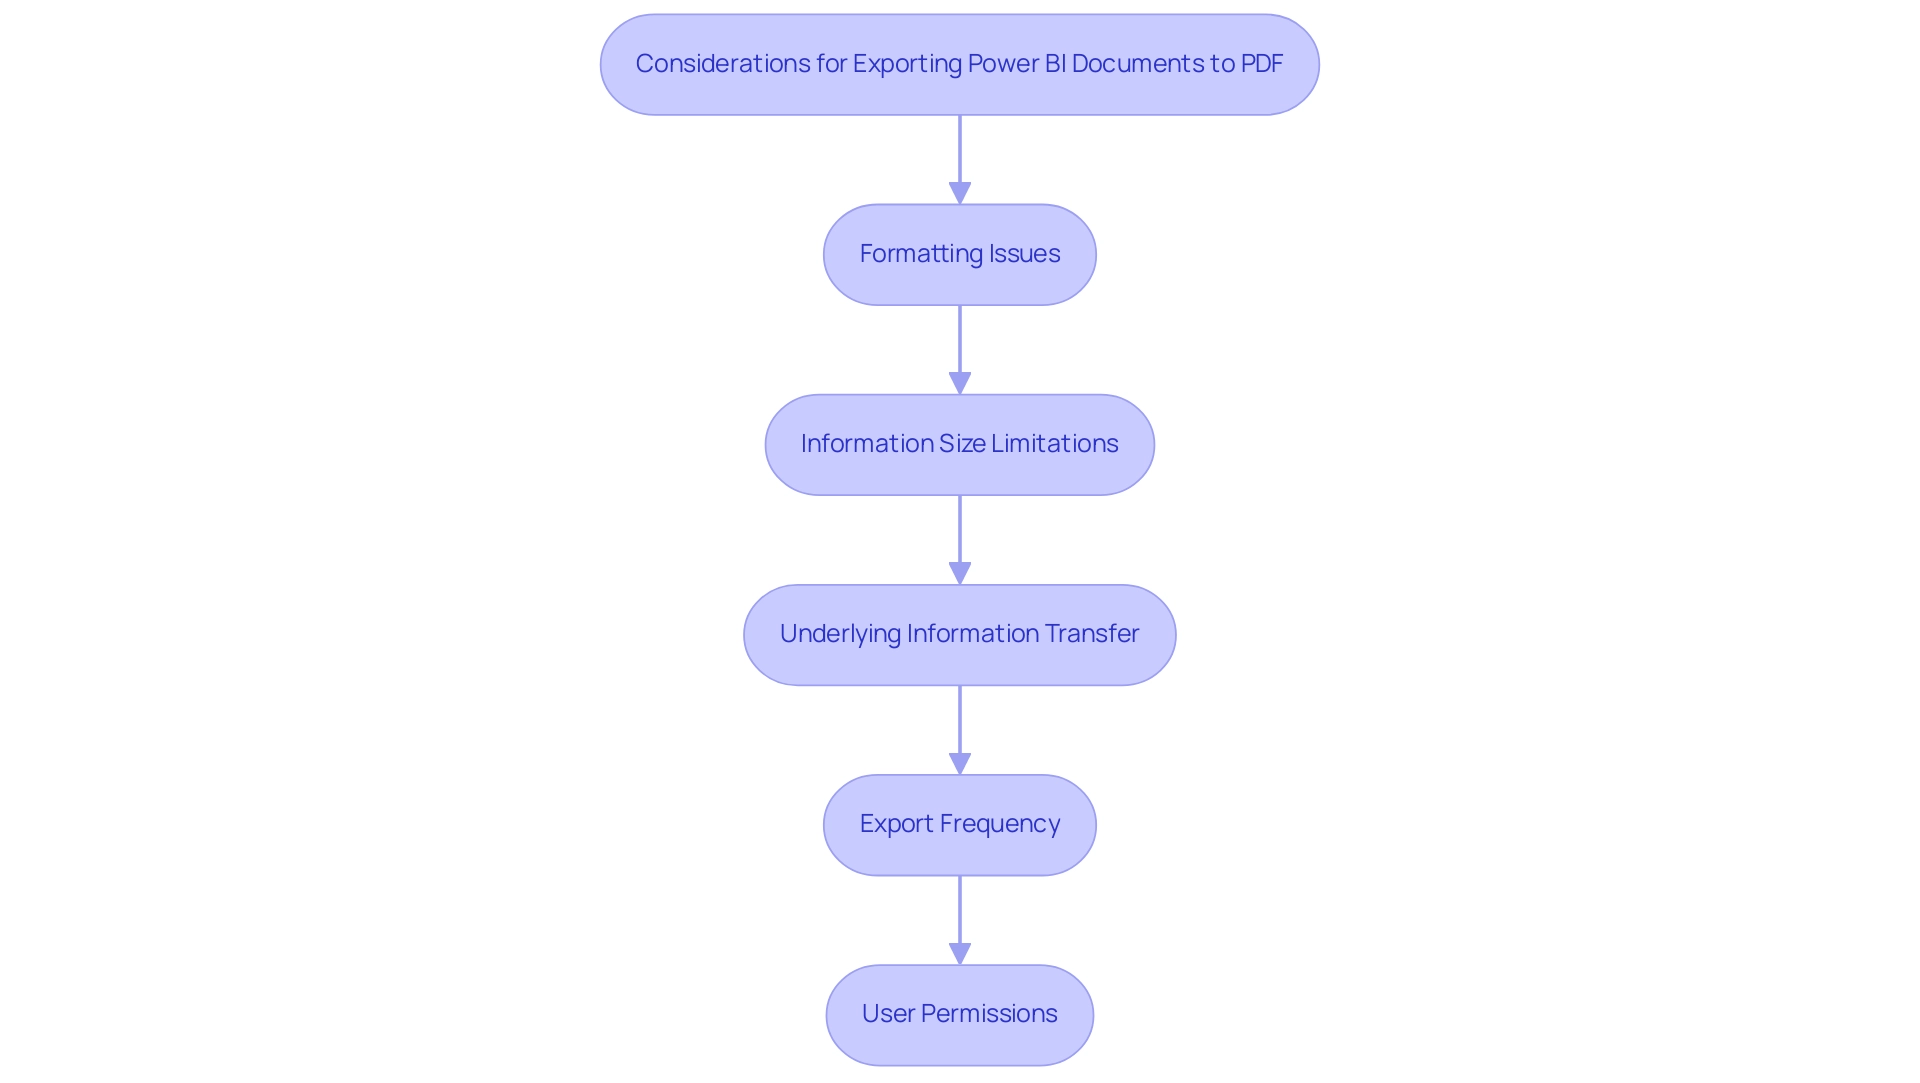
Best Practices for Successful Power BI PDF Exports
To achieve reliable and effective Power BI PDF exports while enhancing operational efficiency through automation, adopting the following best practices is essential:
- Regularly Update Power BI: Ensure that both your Power BI Desktop and Service versions are consistently updated. This practice enables you to utilize the latest features and enhancements, improving the overall functionality of your reports.
- Test Transfers Thoroughly: Prior to automating any transfer processes, conduct manual tests to uncover potential formatting or data issues. This proactive approach will help you address problems before they impact your automated workflows.
- Leverage Robotic Process Automation (RPA): Incorporating RPA can significantly streamline the transfer process, reducing the time spent on manual, repetitive tasks. By automating these workflows, your team can focus on more strategic, value-adding activities that drive business growth.
- Document Your Transfer Processes: Create comprehensive documentation detailing your transfer workflows and settings. This resource will serve as a valuable reference for troubleshooting and making necessary adjustments in the future.
- Monitor Automated Performance Regularly: Keep a close eye on the performance of your automated processes. Regular reviews will help ensure that the shipments are functioning as intended, allowing you to make timely adjustments as needed. As Szymon Dybczak noted, “By simplifying these measures and doing more of the heavy lifting in Databricks, I was able to accelerate my documentation,” which underscores the importance of optimizing your processes.
- Utilize the VACUUM Command: Implementing the VACUUM command can clean up old files, reducing storage clutter and improving performance, which is crucial for efficient data transfers.
By implementing these best practices, which have been shown to lead to faster loading times and a smoother user experience, you can significantly improve the reliability and effectiveness of your process to export Power BI report to PDF automatically, ultimately enhancing user experiences and operational efficiency. Additionally, leveraging tailored AI solutions alongside Business Intelligence tools can transform data into actionable insights, enabling informed decision-making that drives growth.
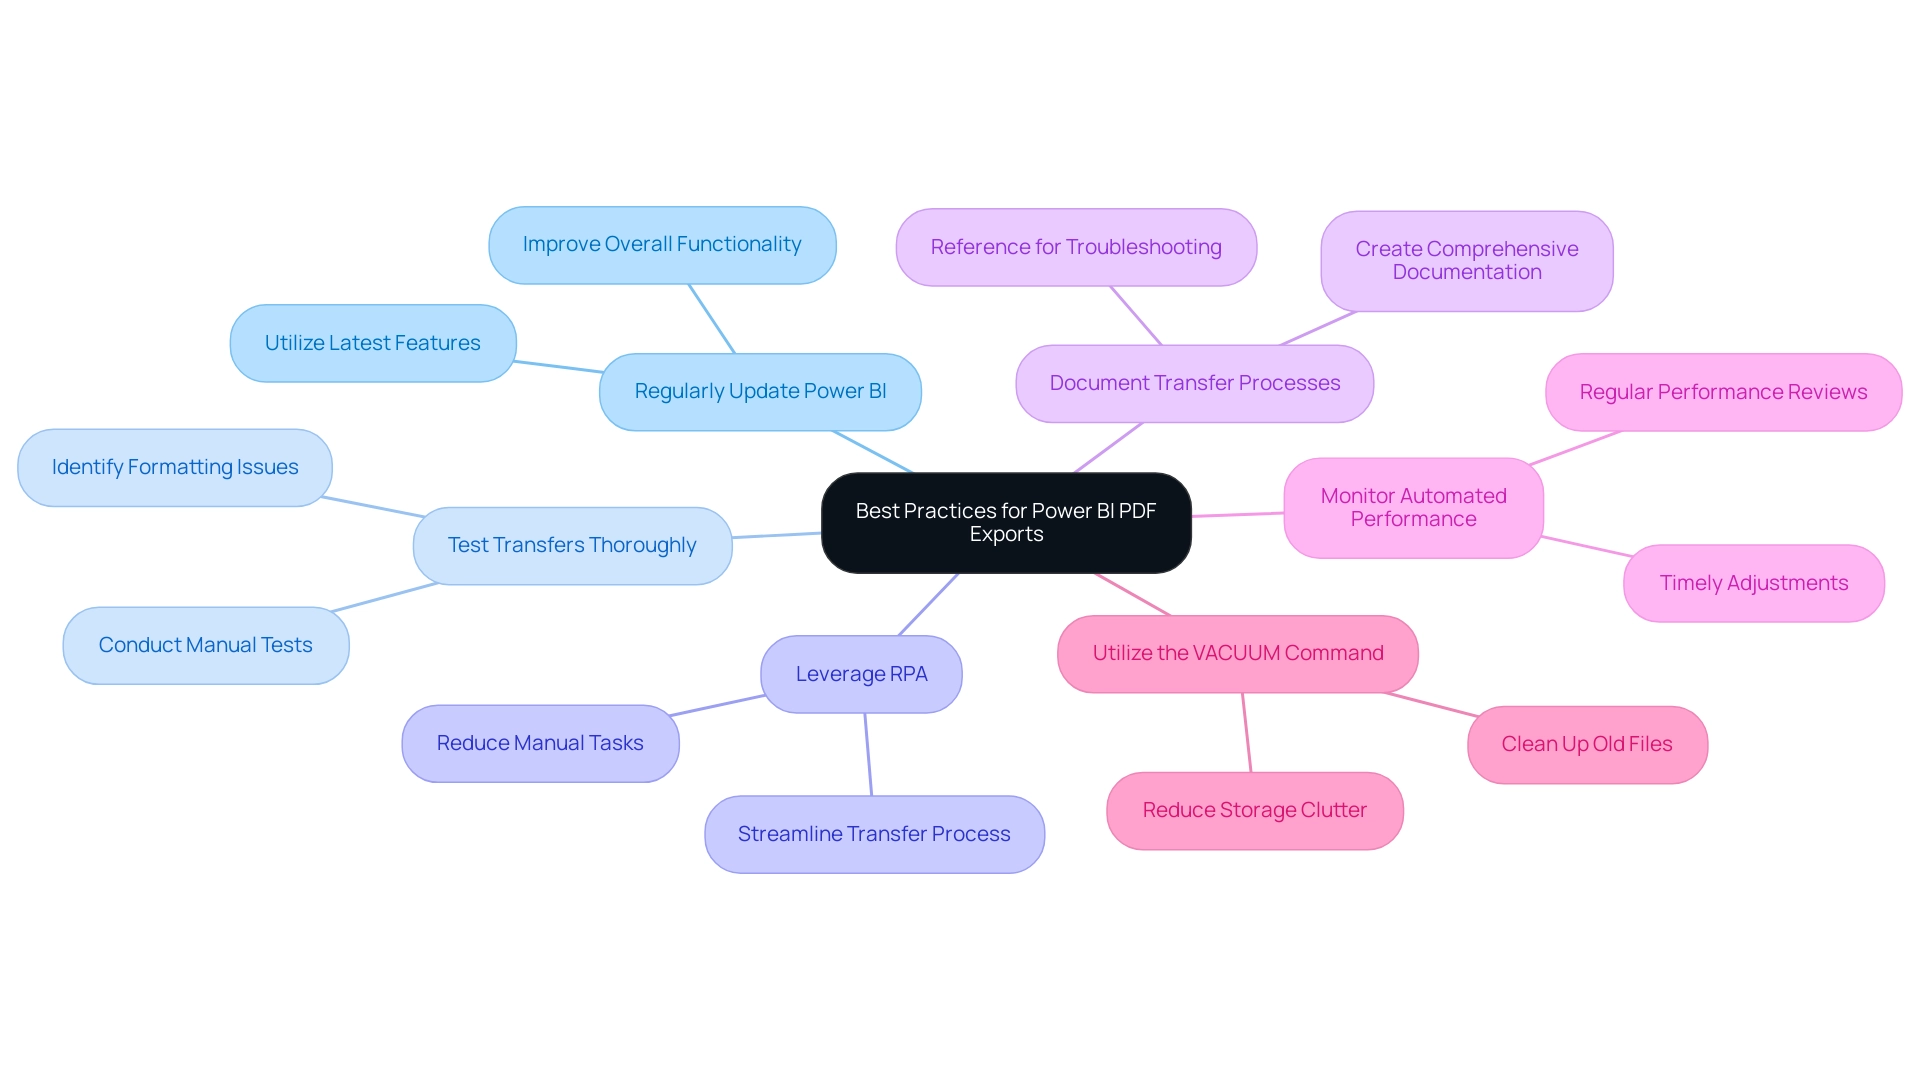
Conclusion
Efficiently exporting Power BI reports is a pivotal strategy that organizations must embrace to enhance data management and communication. By understanding the complexities involved in the export process, such as formatting issues and data limitations, teams can better navigate potential challenges and implement effective solutions. Utilizing tools like Power Automate and PBRS allows for seamless automation, reducing the manual workload and ensuring timely delivery of insights to stakeholders.
Furthermore, adopting best practices, including:
– Regular updates
– Thorough testing
– Robust documentation
ensures that the export process remains reliable and effective. These practices not only improve operational efficiency but also enhance the overall quality of reports, fostering a culture of informed decision-making within organizations.
Ultimately, by transforming the reporting process into a streamlined and strategic endeavor, businesses can leverage Power BI to its fullest potential. This proactive approach empowers organizations to communicate insights more clearly and effectively, paving the way for enhanced collaboration and informed choices that drive success in today’s data-driven landscape.
