Overview
Replacing null values with blank entries in Power Query is essential for improving data quality and ensuring accurate analysis and reporting. The article outlines a step-by-step guide for this process, emphasizing the importance of understanding the differences between null and blank values, and provides troubleshooting tips and best practices to maintain data integrity and operational efficiency.
Introduction
In the realm of data analysis, the distinction between null and blank values in Power Query can be the linchpin for achieving accurate and reliable results. While null values indicate a complete absence of data, blank values represent empty strings that can often be more manageable in reporting contexts.
However, the challenges posed by poor master data quality can complicate the handling of these values, leading to inconsistencies that undermine decision-making processes. Organizations that grasp these nuances are better equipped to enhance their data integrity and operational efficiency.
This article delves into practical strategies for addressing null and blank values, offering step-by-step guides and troubleshooting tips that empower users to optimize their data workflows. By embracing these insights, businesses can not only improve their data quality but also foster a culture of informed decision-making that drives growth in today’s competitive landscape.
Understanding Null vs. Blank Values in Power Query
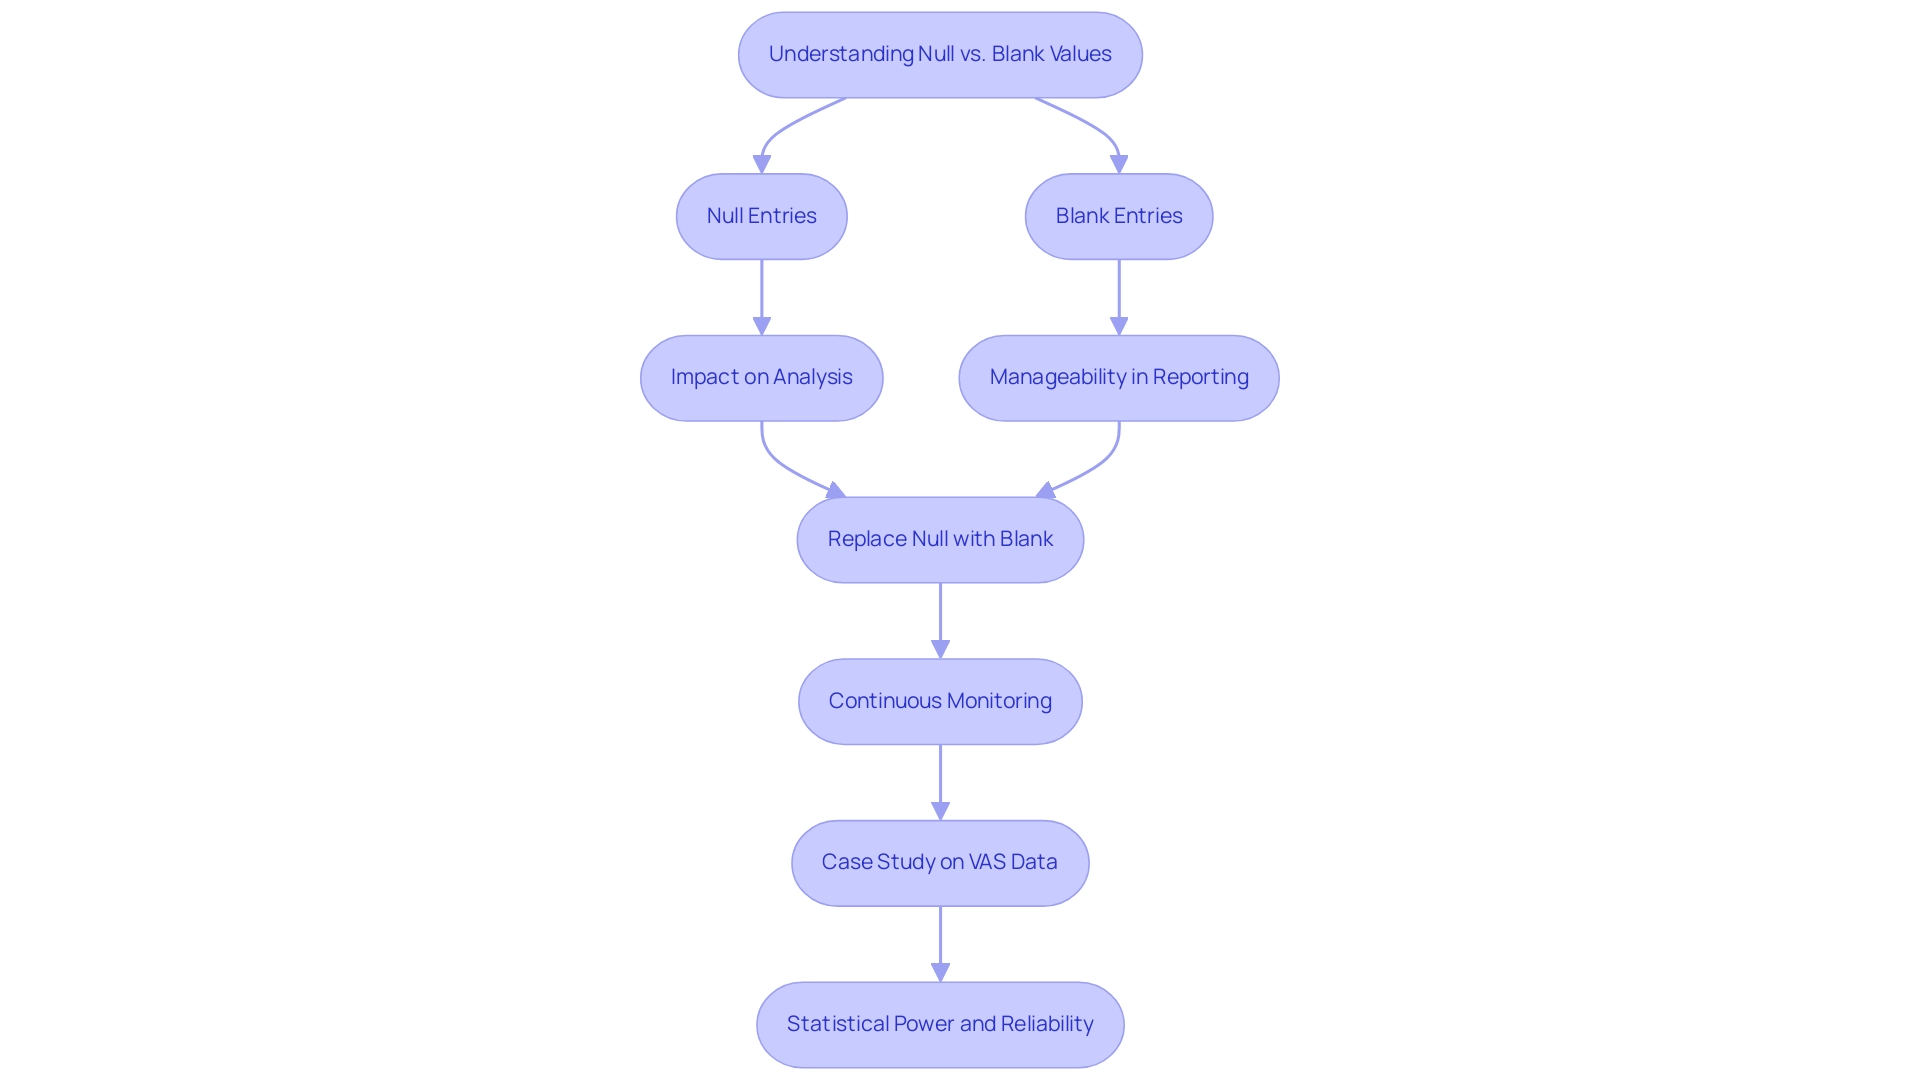
In Power Query, null entries signify the complete absence of information, while blank entries refer to strings that contain no characters. Grasping this difference is crucial, as null entries can result in unforeseen consequences in your analysis, possibly jeopardizing the dependability of your findings. This challenge is exacerbated by poor master information quality, which can hinder effective Business Intelligence and RPA adoption.
Poor master information quality can significantly complicate the handling of null and empty entries, as inconsistent entries may lead to increased null occurrences, further affecting analysis and decision-making processes. For instance, if winsorization is applied, the mean (SD) would be 3.2 (0.84), highlighting the quantitative impact of quality issues on statistical outcomes. Conversely, blank values are processed as empty strings, which can sometimes be more manageable in reporting contexts.
By replacing null with blank in Power Query for datasets where clarity is paramount, you can enhance consistency and ensure your reports accurately convey the absence of information. Continuous monitoring and predictive information quality are crucial for detecting and resolving these issues early, thereby maintaining the integrity of your analysis and fostering operational efficiency. Recognizing these differences equips you to navigate your information transformation processes effectively.
Jong Hae Kim aptly notes,
The presence of missing data reduces the information available to be analyzed, compromising the statistical power of the study, and eventually the reliability of its results.
This highlights the necessity of addressing null entries proactively to maintain the robustness of your findings and drive growth through informed decision-making. Furthermore, a case study on Visual Analogue Scale (VAS) Data demonstrates the real-world implications of managing missing entries and outliers.
In this study, proper handling of absent data prevented bias in statistical estimates, thus enhancing the reliability of the findings. This further promotes AI adoption in your organization, demonstrating that addressing data quality issues is not only essential for accurate analysis but also critical for maintaining a competitive edge in today’s data-driven environment.
Step-by-Step Guide to Replacing Null with Blank in Power Query
To effectively replace null values with blank values in Power Query, follow this straightforward guide:
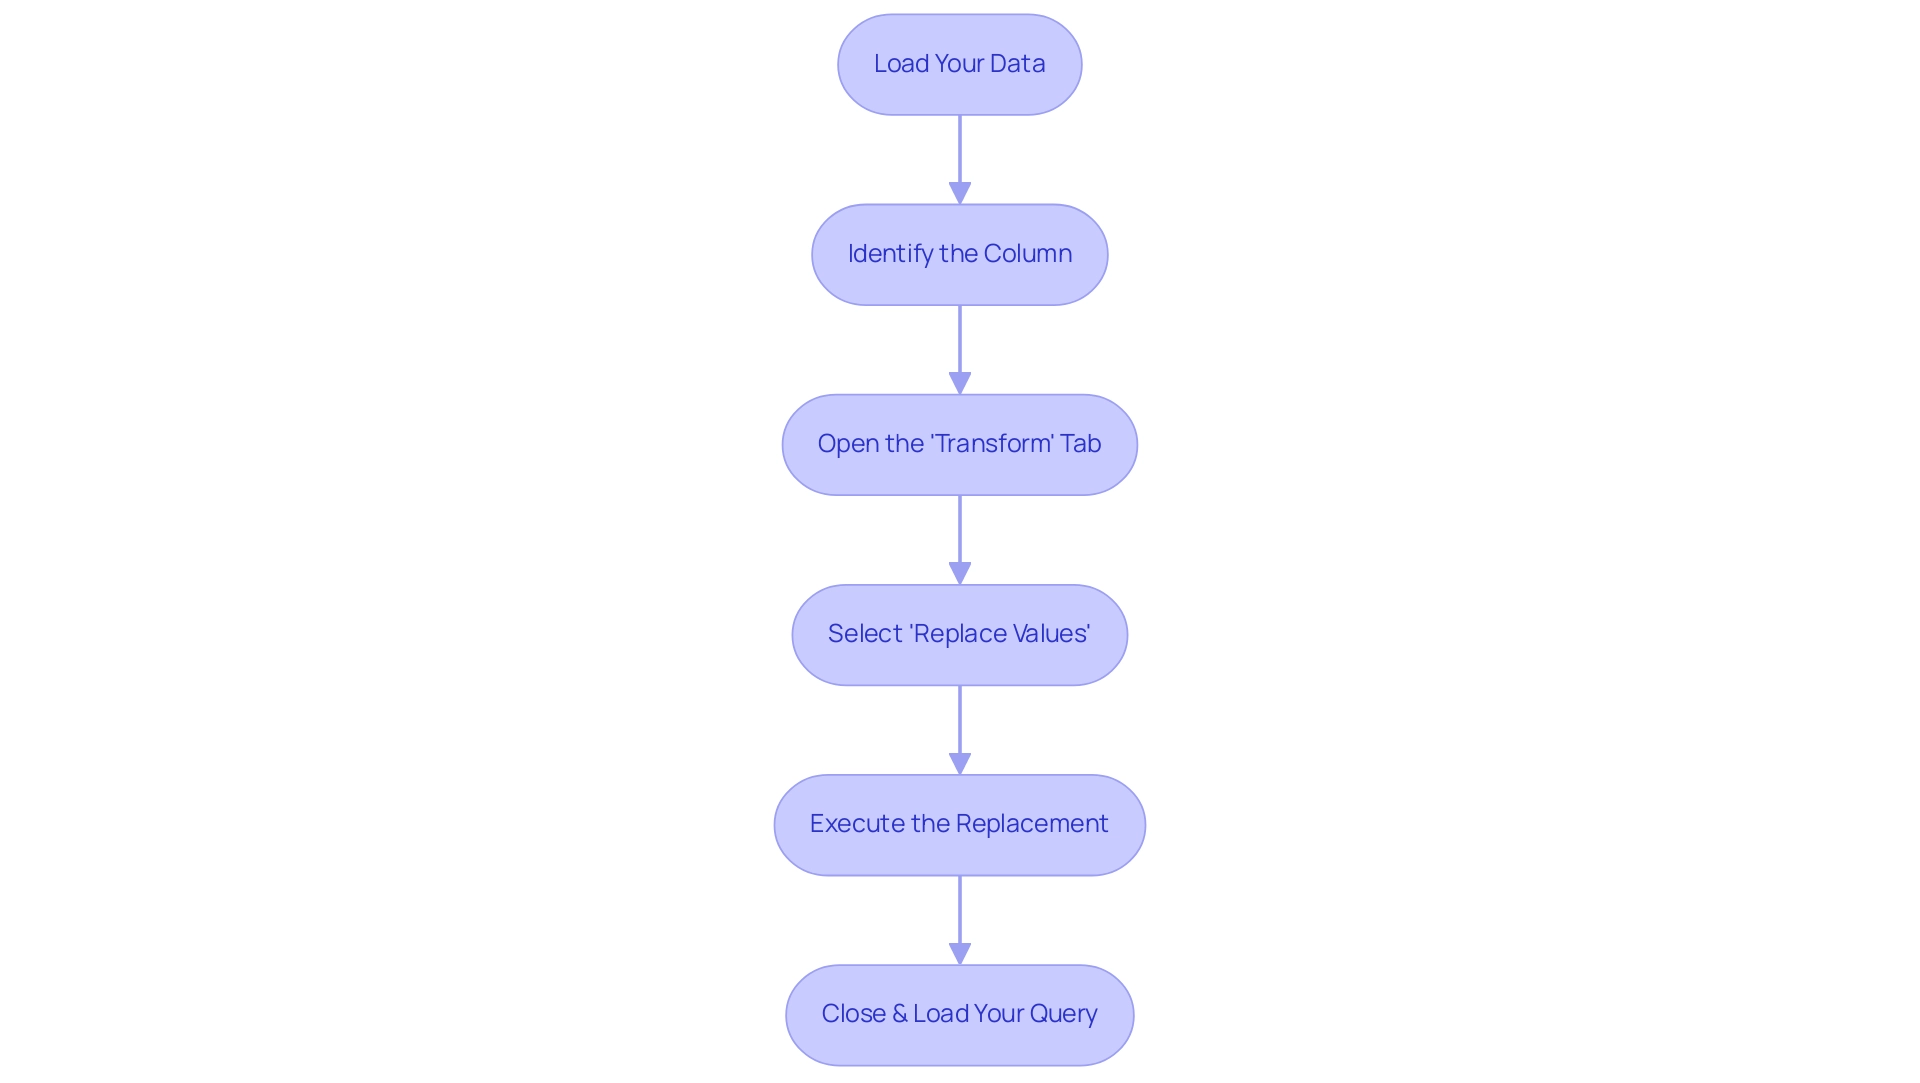
- Load Your Data: Begin by launching Excel and navigating to the Data tab. Choose ‘Get Data’ to import your dataset into the data transformation tool.
- Identify the Column: Pinpoint the specific column that contains the null entries you wish to address by clicking on its header.
- Open the ‘Transform’ Tab: Within the data editing tool, locate and click on the ‘Transform’ tab to access various data manipulation options.
- Select ‘Replace Values’: Click on ‘Replace Values.’ A dialog box will appear where you can input ‘null’ (without quotes) in the ‘Field to Find’ section, allowing you to replace null with blank in power query by leaving the ‘Replace With’ section empty to denote a blank entry.
- Execute the Replacement: Confirm the action by clicking ‘OK.’ Power tools will automatically substitute all null entries in your chosen column with empty entries, enhancing the overall quality of your dataset.
- Close & Load Your Query: To finalize your modifications, return to Excel by clicking ‘Close & Load’ in the Home tab.
By adhering to these steps, you can effectively replace null with blank in power query, which will significantly improve your dataset’s usability for analysis and reporting. As noted by the professional gdecome, “I figured out my problem when trying to enter a function with more than one parameter… Make sure to structure your function calls correctly for optimal results.” This insight emphasizes a common challenge encountered during transformation that can influence the effectiveness of your cleaning process.
Furthermore, a case study on improving Table.Profile functionality demonstrates how a user overcame challenges in profiling, ultimately enhancing their analysis capabilities. This approach not only streamlines your information cleaning process but also enhances the reliability of your analysis results.
Considering that this subject has attracted 2,429 views, it highlights the significance and necessity of efficiently handling null entries in the tool for numerous users.
Troubleshooting Common Issues in Value Replacement
While it may seem straightforward to replace null with blank in Power Query during BI and data manipulation, users often encounter challenges that impede their data transformation processes. By leveraging Robotic Process Automation (RPA), organizations can automate these manual workflows, enhancing operational efficiency in the face of a rapidly evolving AI landscape. Here are common issues and solutions:
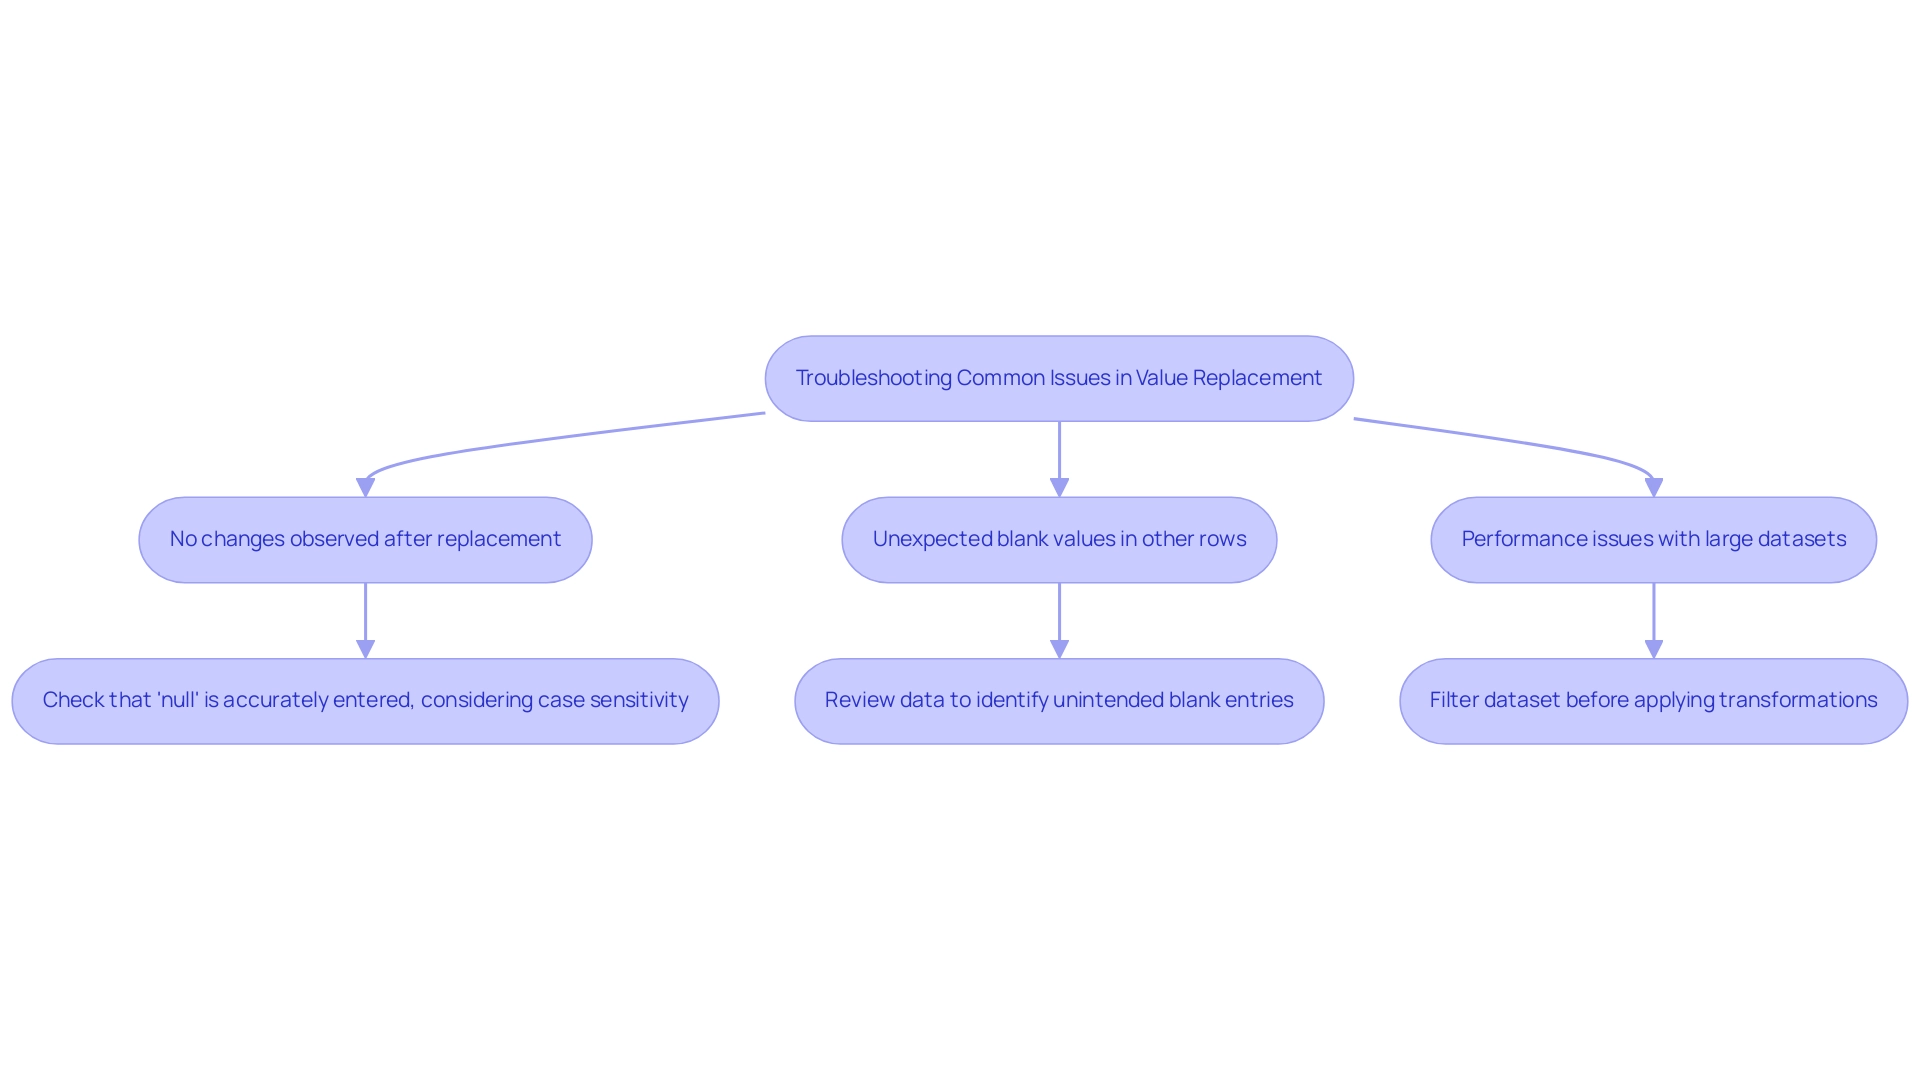
- Issue: No changes observed after replacement.
-
Solution: Check that ‘null’ is accurately entered in the ‘Value to Find’ field, as Power Query is case-sensitive. Any discrepancies in casing could prevent replacements from occurring.
-
Issue: Unexpected blank values in other rows.
-
Solution: Review your data to identify unintended blank entries. Filtering the column can assist you in visually examining the information more effectively.
-
Issue: Performance issues with large datasets.
- Solution: If sluggish performance arises, consider filtering your dataset before applying transformations. This approach can significantly reduce the volume of information Power Query processes at a time, thereby enhancing overall efficiency.
To further streamline these processes, consider utilizing RPA tools such as UiPath or Automation Anywhere, which can automate the repetitive tasks associated with information cleansing and transformation. By proactively addressing these potential issues and implementing the suggested solutions, you can troubleshoot effectively, ensuring a seamless workflow and maintaining high information quality. This is essential, particularly considering the challenges of inadequate master information emphasized in industry studies.
As Tracy Rock noted in 2022, 26% of small businesses that encountered cyberattacks lost between $250,000 and $500,000, emphasizing the financial consequences of inadequate information management. Furthermore, 20% of respondents either had not tested their disaster recovery plans or lacked them completely, highlighting the necessity of proactive information management strategies. Remember, overlooking issues in information processing can lead to significant setbacks, as evidenced by NASA’s loss of a $125 million Mars Climate Orbiter due to format inconsistencies.
By leveraging RPA and BI to drive data-driven insights, you can not only enhance operational efficiency but also reduce errors and free up your team for more strategic, value-adding work that fosters business growth.
Best Practices for Handling Null and Blank Values in Power Query
To ensure data integrity and streamline your workflows in Power Query, consider the following best practices, all of which can be further enhanced by leveraging our 3-Day Power BI Sprint service:
-
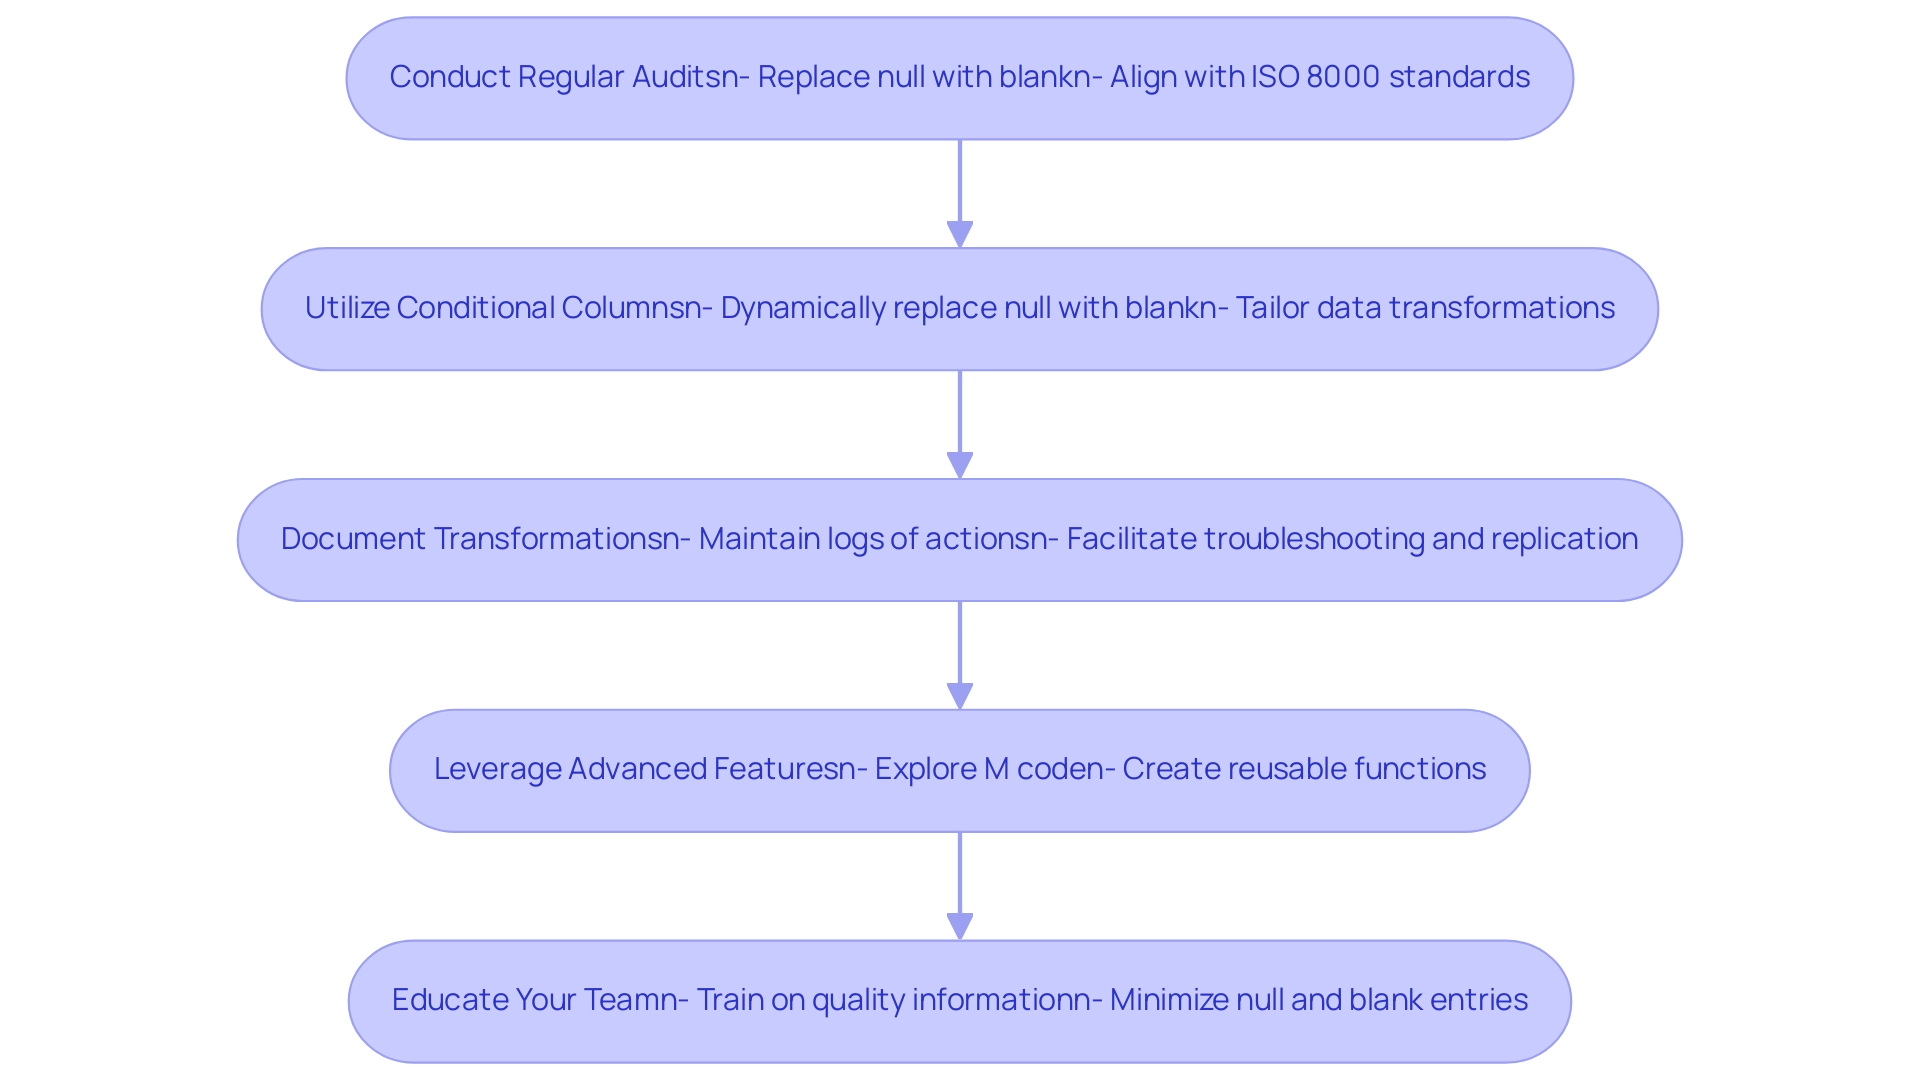
Conduct Regular Audits: Establish a routine to replace null with blank in Power Query while checking for null and blank values, aligning with standards such as ISO 8000 for quality management. This proactive approach will assist in preserving the overall quality of your information. As emphasized by Anja Whiteacre, Senior Consultant at RevGen, “If your organization is struggling to make the most of your BI tools, contact us to schedule a quick chat with one of our experts or visit our Technology Services site to learn more.”
-
Utilize Conditional Columns: Implement conditional columns to dynamically replace null with blank in Power Query, enabling more adaptive data transformations tailored to your needs. This method can be further refined during the 3-Day BI Sprint, ensuring a professional finish on your reports.
-
Document Transformations: Maintain thorough logs of the actions performed within Data Transformation. This documentation not only aids in troubleshooting but also facilitates the replication of successful processes in future projects, contributing to a streamlined workflow.
-
Leverage Advanced Features: Explore Power Query’s advanced functionalities, including M code, to tackle complex scenarios that necessitate the ability to replace null with blank in Power Query. By integrating these advanced features, you enhance your analytical capabilities, creating reusable functions that apply the same transformations across different queries, thereby saving time and centralizing transformation logic.
-
Educate Your Team: Foster a culture of integrity by training your team on the significance of quality information. By minimizing the occurrence of null and blank entries, you can improve your process to replace null with blank in Power Query, creating a more dependable information environment. This training can be part of our comprehensive BI services, which also include custom dashboards and advanced analytics, ensuring your team is well-equipped to uphold information integrity.
By implementing these best practices and utilizing our services, you will significantly enhance your data management strategies, drive operational efficiency through Robotic Process Automation, and achieve more dependable analyses, all while adhering to the guidelines set forth by ISO 8000. Our 3-Day BI Sprint not only promises a fully functional report tailored to your needs but also provides a template for future projects, enhancing your reporting capabilities.
Additional Resources for Power Query Users
To enhance your expertise in Power Query, a variety of valuable resources are available that cater to different learning styles and preferences:
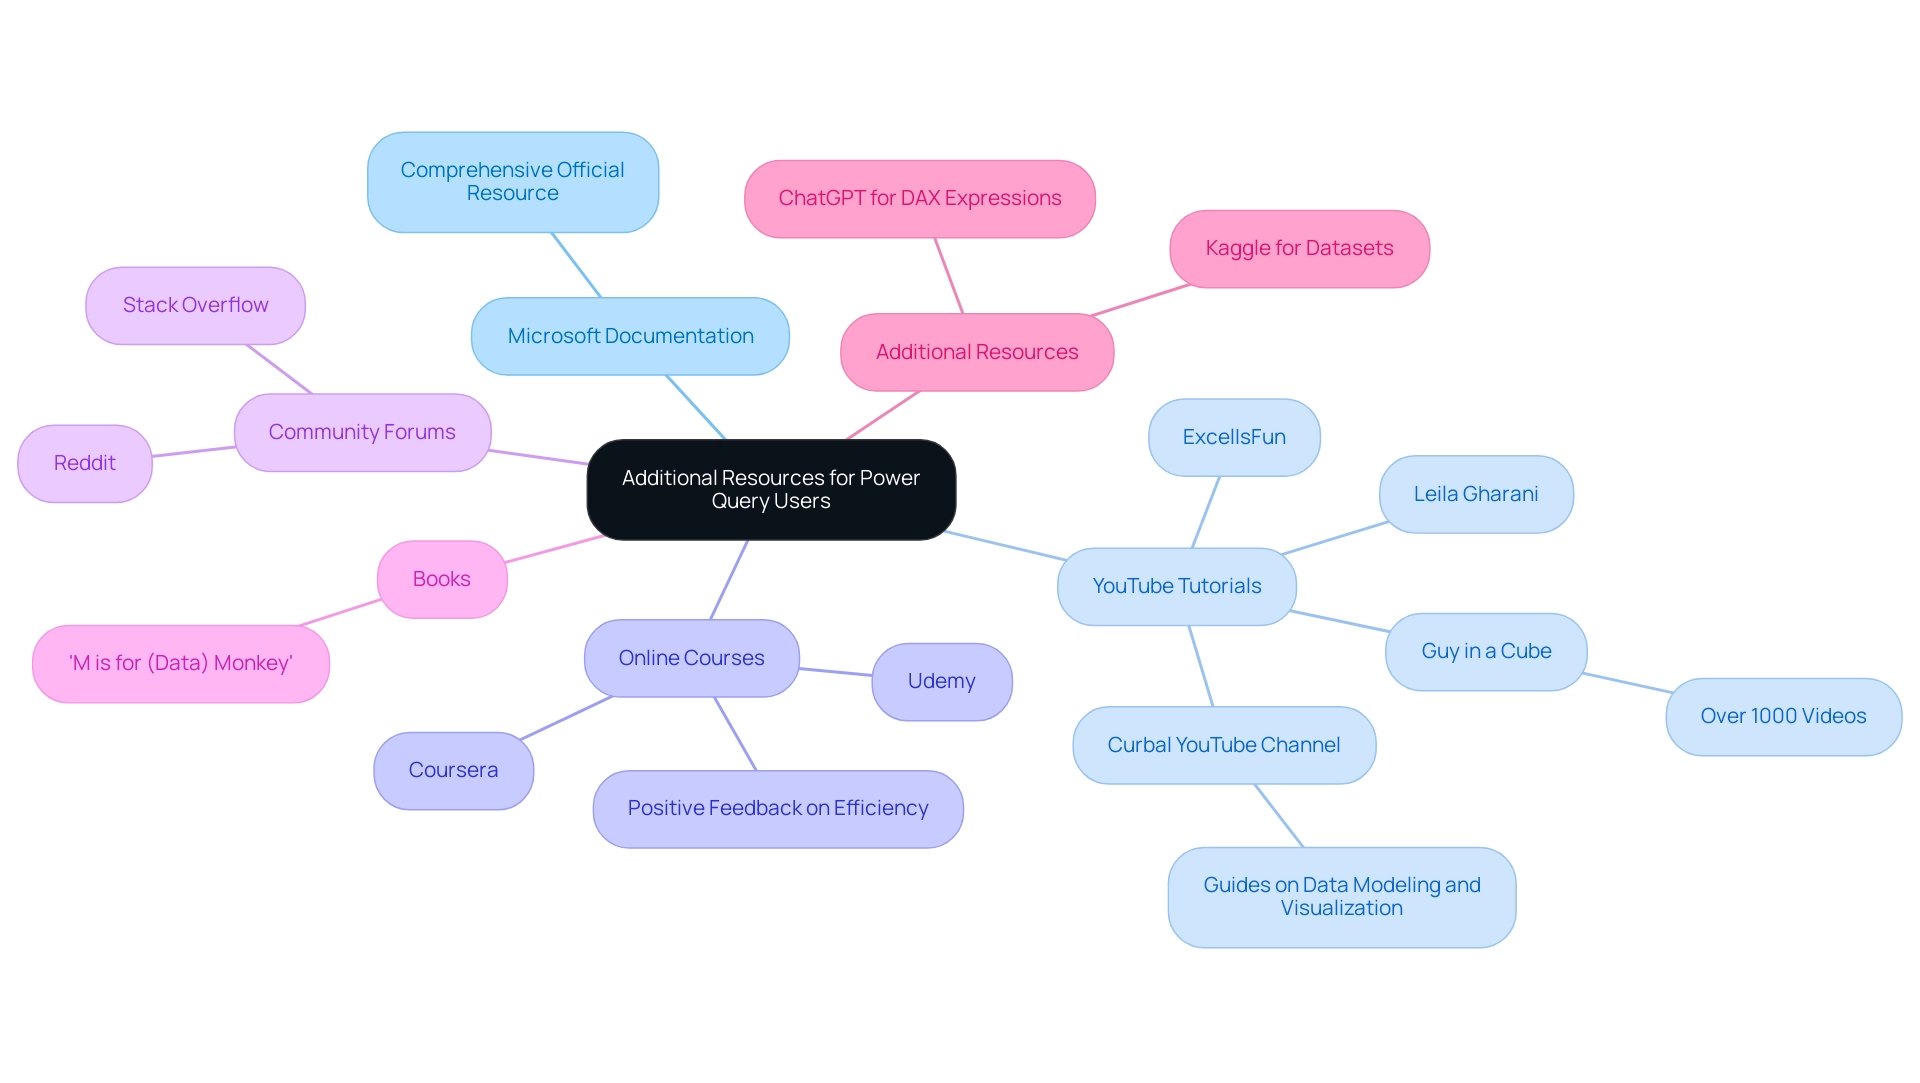
- Microsoft Power Query Documentation: This comprehensive official resource covers all features of Power Query, making it a foundational tool for both beginners and advanced users.
- YouTube Tutorials: Channels like the ‘Curbal YouTube Channel,’ owned by Ruth Pozuelo Martinez, offer valuable guides on modeling and visualization, assisting subscribers in staying updated on the newest BI features and improving their skills through brief, practical tutorials. Notably, ‘Guy in a Cube’ has uploaded more than a thousand videos, offering a vast array of content for learners. Furthermore, ‘ExcelIsFun’ and ‘Leila Gharani’ provide captivating video demonstrations that explain data transformation techniques.
- Online Courses: Platforms such as Coursera and Udemy offer organized courses that promote a deeper comprehension of data processing and manipulation, with numerous courses earning favorable feedback for their efficiency. Studies show that online courses significantly boost retention and comprehension in technical subjects.
- Community Forums: Engaging with the data transformation community on platforms like Stack Overflow and Reddit allows for interactive learning; you can ask questions, share experiences, and gain insights from fellow users who face similar challenges.
- Books: Titles such as ‘M is for (Data) Monkey’ offer comprehensive insights into data processing applications, making them an excellent complement to hands-on learning.
- Additional Resources: For further enhancement of your skills, consider utilizing ChatGPT for DAX expressions and Kaggle for datasets, which are valuable tools for practical application.
As Reid Havens, a Microsoft Data Platform MVP, highlights, ‘Investing in quality resources is vital for mastering information manipulation tools such as Data Transformation.’ By exploring these resources, you can empower yourself to deepen your understanding of Power Query and enhance your data manipulation skills effectively.
Conclusion
Understanding and effectively managing null and blank values in Power Query is crucial for ensuring data integrity and driving informed decision-making. The distinction between these two types of values can significantly impact data analysis outcomes, making it essential to address them proactively. By implementing practical strategies such as:
- Regular audits
- Conditional columns
- Detailed documentation of transformations
organizations can streamline their data workflows and enhance the reliability of their analyses.
Moreover, troubleshooting common issues and leveraging advanced features of Power Query can further bolster efforts to maintain high data quality. The integration of Robotic Process Automation (RPA) into these processes not only automates repetitive tasks but also frees up valuable resources for more strategic initiatives. This holistic approach to data management not only mitigates risks associated with poor data quality but also positions organizations to thrive in a competitive landscape.
Investing in continuous learning through various resources, including:
- Online courses
- Community forums
- Official documentation
empowers teams to stay ahead of the curve. By fostering a culture of data integrity and equipping staff with the necessary skills, organizations can ensure that they are not only maintaining data quality but also leveraging it to drive growth and operational efficiency. Ultimately, addressing null and blank values with diligence and strategy lays the groundwork for a data-driven future, enabling more effective and insightful business decisions.
Overview
Related tables in Power BI are essential for creating complex data models that facilitate insightful analysis and reporting by establishing connections between different datasets. The article emphasizes that these relationships enhance data integration and performance, enabling users to derive actionable insights and streamline report creation through functions like RELATED and LOOKUP, while also addressing operational challenges with automation tools like Robotic Process Automation (RPA).
Introduction
In the realm of data analytics, Power BI stands out as a powerful tool that transforms raw data into actionable insights. At the heart of this transformation lies the concept of related tables, which facilitate intricate data relationships and enable organizations to create comprehensive data models. As businesses grapple with the complexities of data integration and reporting, understanding how to effectively utilize these relationships becomes paramount.
By mastering key functions like LOOKUP and RELATED, and embracing best practices for data management, teams can streamline their reporting processes, enhance operational efficiency, and drive strategic decision-making.
This article delves into the essential aspects of related tables in Power BI, exploring their applications, the importance of establishing robust relationships, and the strategies that can optimize performance, ultimately empowering organizations to harness the full potential of their data.
Understanding Related Tables in Power BI: An Overview
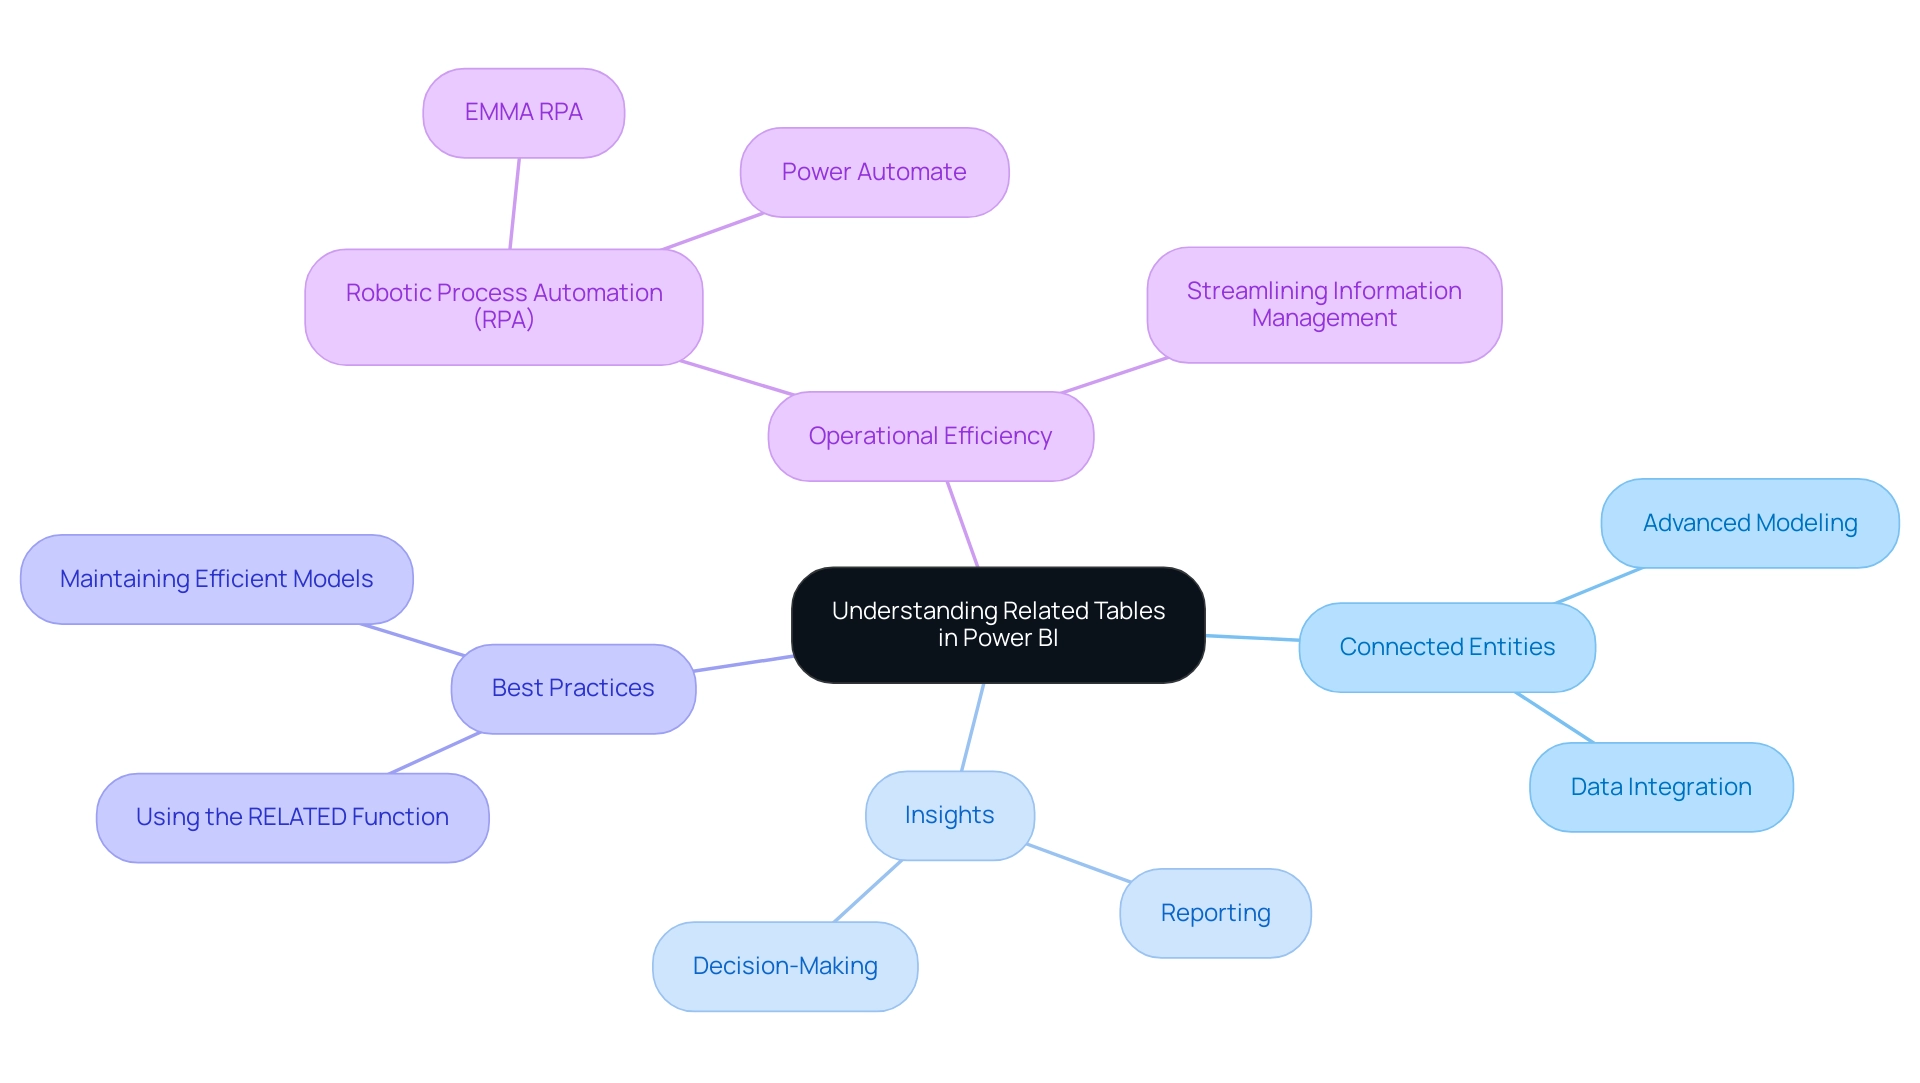
In this tool, connected entities act as the foundation of advanced modeling, establishing clear connections that enable users to create complex structures. With a course duration of just 3 hours and 63.7K views, Power BI is acknowledged for its powerful capabilities in visualization. These connections are essential for smooth information integration, allowing users to derive insights from various sources and form a comprehensive view of their datasets.
This unified approach not only enhances the depth of analysis but also facilitates more insightful reporting and strategic decision-making, addressing the challenges of time-consuming report creation and inconsistencies in information. The significance of associated datasets is further highlighted by the insights of Iason Prassides, who stresses,
Learn to use DAX in BI to customize and optimize your KPIs.
By strategically applying theRELATEDfunction, users can traverse complex relationships across multiple tables, ensuring that only the most pertinent information is incorporated, which ultimately improves report performance.
Adhering to best practices, as detailed in the case study titled ‘Best Practices for Using the RELATED Function’, assists in maintaining efficient models and improves report performance in BI. Additionally, integrating Robotic Process Automation (RPA) tools like EMMA RPA and Power Automate can significantly streamline information management processes. These tools automate repetitive tasks, reduce errors, and enhance operational efficiency, thereby allowing teams to concentrate on deriving actionable insights from the information.
This strategic application of related datasets, combined with RPA solutions, not only drives operational efficiency but also paves the way for actionable insights that propel business intelligence forward.
Key Functions for Managing Related Tables: LOOKUP and RELATED
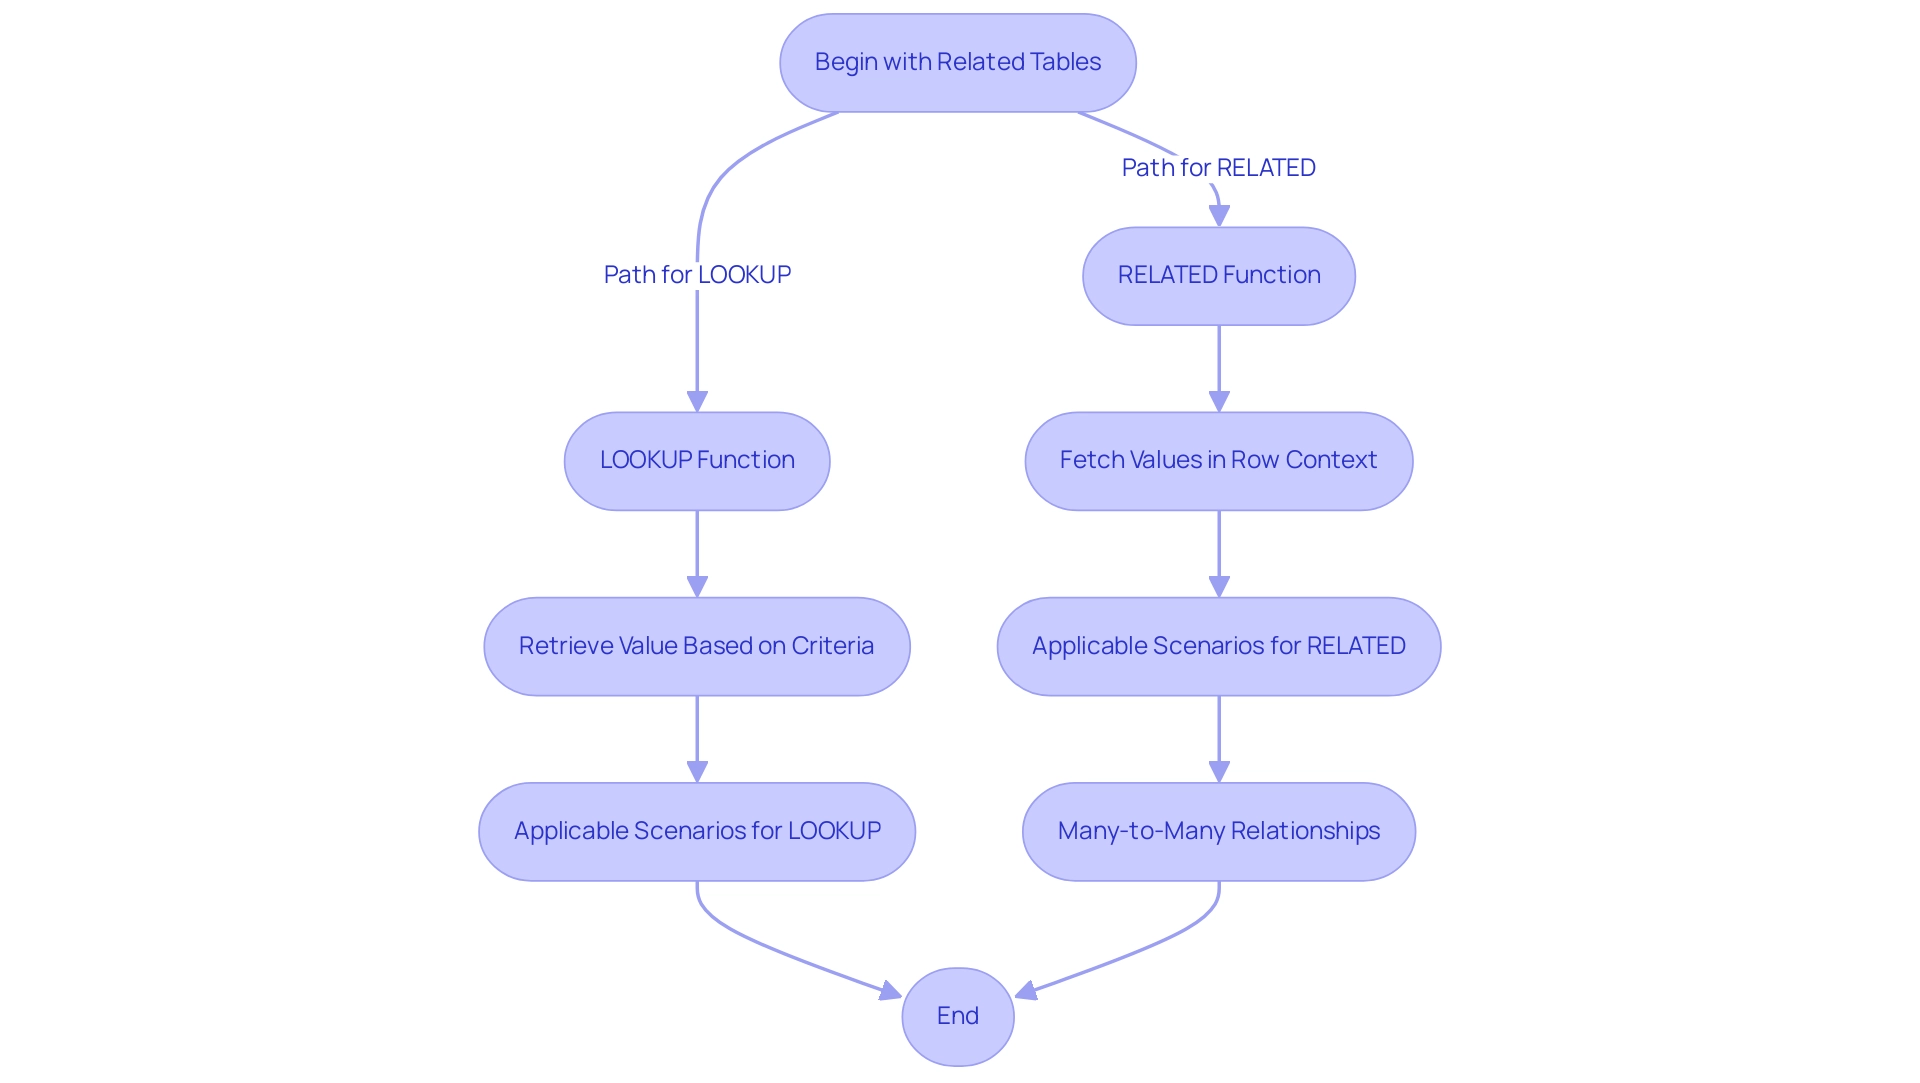
The LOOKUP and RELATED functions are crucial in managing related table Power BI datasets, which enables users to unlock the full potential of their data relationships. The LOOKUP function retrieves a value from a related table in Power BI based on specified criteria, while the RELATED function fetches values from the related table in Power BI within a row context. For instance, consider a sales table linked to a products table; by leveraging related table Power BI functions, users can seamlessly integrate product details into their sales reports, enriching their analysis and driving informed decision-making.
Furthermore, the significance of Business Intelligence and RPA, including tools like EMMA RPA and Automate, cannot be exaggerated in this context, as they tackle challenges such as:
- Time-consuming report generation
- Information inconsistencies
- Task repetition fatigue
- Staffing shortages
Ultimately enhancing operational efficiency. Various techniques in BI can obtain outcomes akin to the VLOOKUP formula in Excel, depending on specific scenarios, which is crucial for users to understand. Mastering these functions not only improves the ability to create dynamic reports but also enables users to visualize intricate connections in their related table Power BI data.
A practical example is illustrated in the case study titled ‘Using DAX LOOKUPVALUE Function in Power BI,’ demonstrating how the DAX LOOKUPVALUE function can successfully perform lookups across datasets, especially in scenarios involving a related table Power BI where RELATED cannot be used, such as Many-to-Many relationships. This flexibility is crucial for effective information management. As Olga Cheban, a Technical Content Writer at Coupler.io, aptly states,
I’ve been writing about information, tech solutions, and business for years, and this passion never fades.
This sentiment emphasizes the significance of engaging thoroughly with BI’s functionalities and utilizing RPA solutions to cultivate a strong understanding of management. Readers can expect to spend approximately 17 minutes on this article, which provides a comprehensive exploration of these critical functions.
Practical Applications of Related Tables in Data Analysis
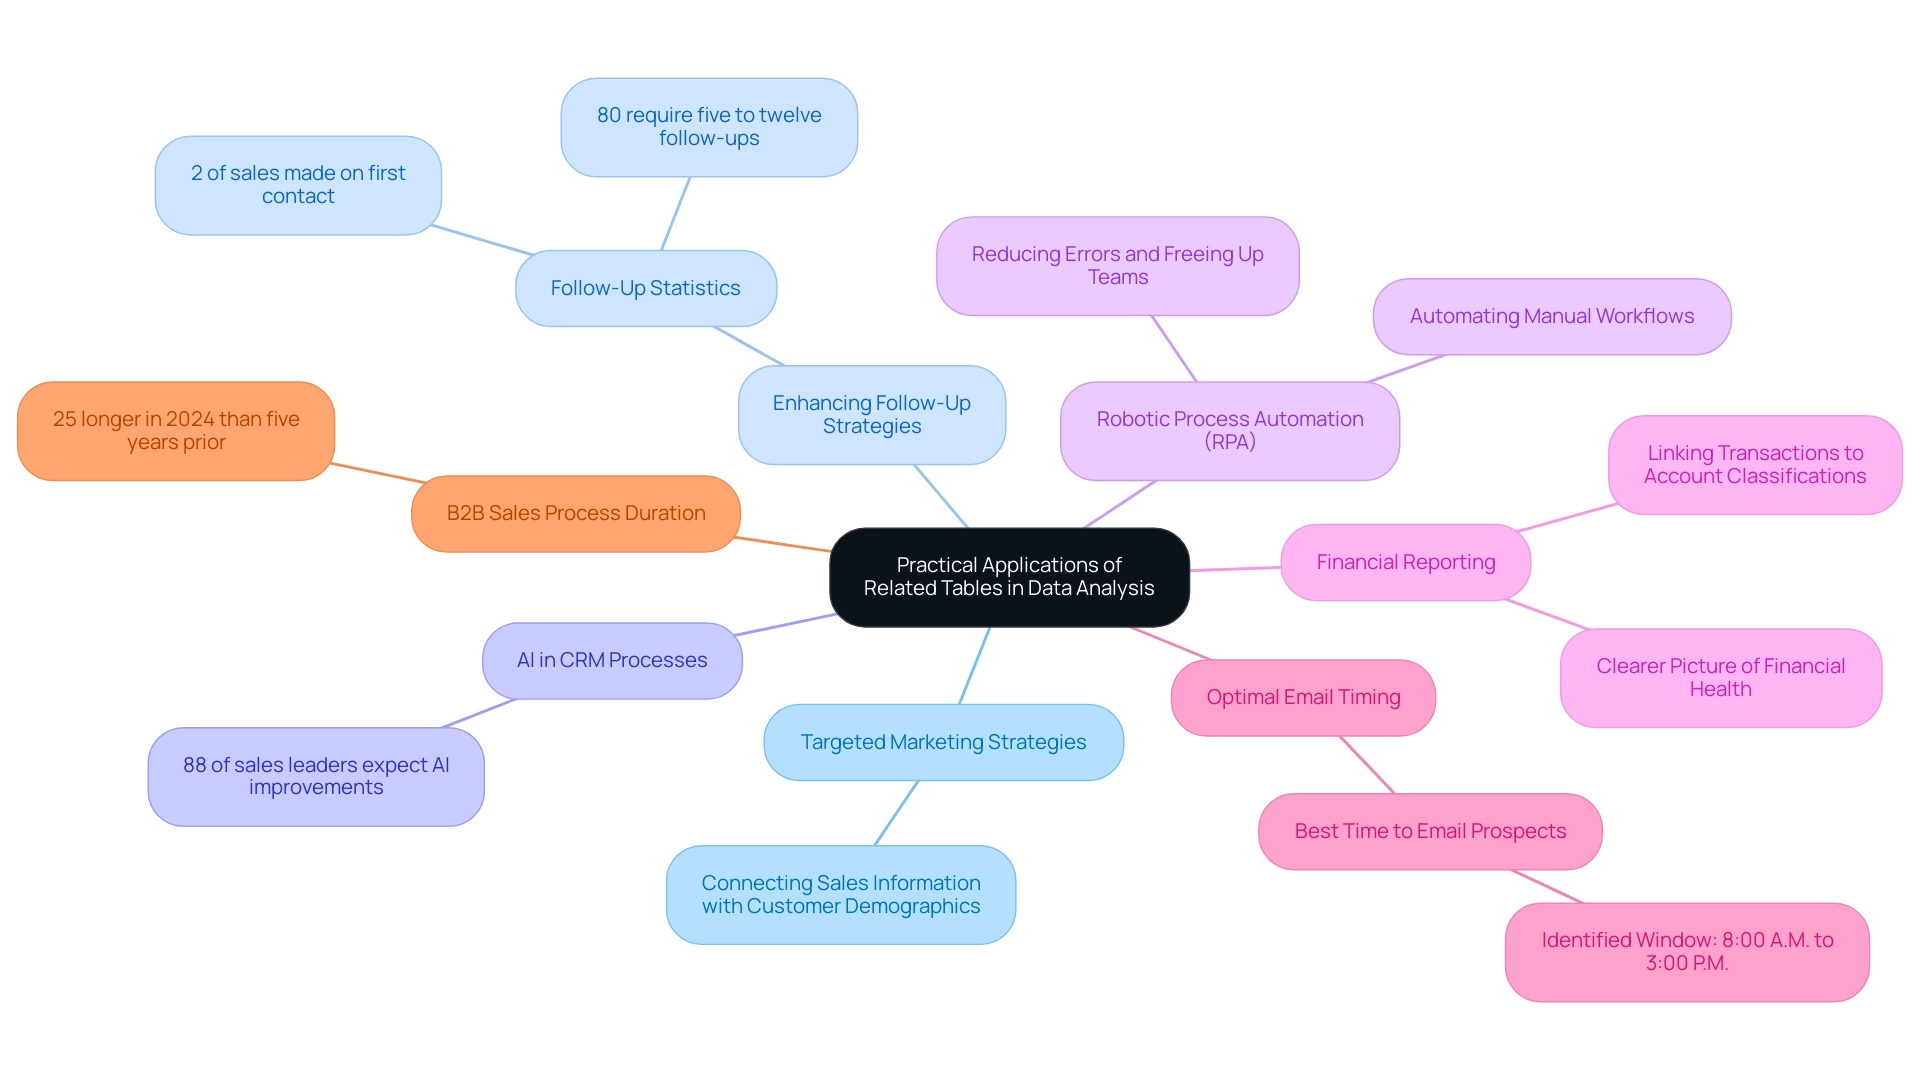
Related table power bi plays a crucial role in analysis within Power BI, offering a multitude of applications that can drive business success. By connecting sales information with customer demographics, businesses can develop targeted marketing strategies that significantly enhance engagement and conversion rates. As noted by sales executive Michael Brown, ‘Only 2% of sales are made on the first contact, while 80% require five to twelve follow-ups.’
This highlights the significance of employing information to enhance follow-up strategies effectively. Moreover, with 88% of sales leaders anticipating AI to improve their CRM processes in the coming two years, incorporating AI into information management practices becomes increasingly essential for operational efficiency. The challenges in leveraging insights from Power BI dashboards—such as time-consuming report creation and inconsistencies—can be addressed through Robotic Process Automation (RPA).
By automating manual workflows, RPA not only reduces errors but also frees up teams to focus on strategic, value-adding tasks rather than repetitive ones. In another application, a related table power bi can enhance financial reporting by linking transactions to specific account classifications. This integration provides organizations with a clearer picture of their financial health, allowing for more informed decision-making.
Additionally, understanding optimal email timing—identified as between 8:00 A.M. and 3:00 P.M.—can significantly enhance engagement rates with prospects, further illustrating the importance of timing in marketing strategies. Recent findings suggest that the typical B2B sales process required 25% more time in 2024 compared to five years prior, highlighting the necessity for effective information management in handling these complexities. By leveraging associated datasets effectively and incorporating RPA, organizations can significantly enhance their reporting capabilities, making data-driven decisions that align with their strategic goals and ultimately improve overall sales performance.
Moreover, tailored AI solutions can assist in navigating the overwhelming AI landscape, ensuring that businesses adopt the right technologies that align with their specific goals.
Establishing Relationships: The Backbone of Data Modeling
Creating connections among structures is a fundamental aspect of efficient information modeling in Power BI, particularly regarding the related table Power BI, which is emphasized in our 3-Day Power BI Sprint. These connections determine how information in one chart interacts with information in another, facilitating the creation of insightful and meaningful reports. For instance, implementing a one-to-many connection between a customer table and an orders table in Power BI enables comprehensive analysis of all orders linked to a specific customer using related table power bi.
This capability is essential for deriving actionable insights from interconnected datasets, ultimately streamlining report creation and utilization for impactful decision-making. In just three days, we promise to create a fully functional, professionally designed report on a topic of your choice, allowing you to focus on utilizing the insights. Furthermore, you can use this report as a template for future projects, ensuring a professional design from the start.
Frequent model evaluations are essential for guaranteeing that these connections stay refined to achieve user objectives. As noted by modeling experts, ‘In many cases, issues and errors are not discovered until the process is running,’ which underscores the importance of proactive management of relationships. By understanding how to establish and maintain these connections with the related table power bi, users can significantly enhance information integrity and reliability in their analyses, leading to better decision-making and strategic outcomes.
Additionally, with a strong foundation in statistics, professionals can expect to enhance their job prospects; those skilled in machine learning, for instance, can earn an average salary of close to $113,000 per year. This emphasizes the practical advantages of mastering modeling techniques, as shown in the case study on expanding job opportunities in science roles, where statistical analysis skills are increasingly sought after.
Optimizing Performance with Related Tables: Best Practices
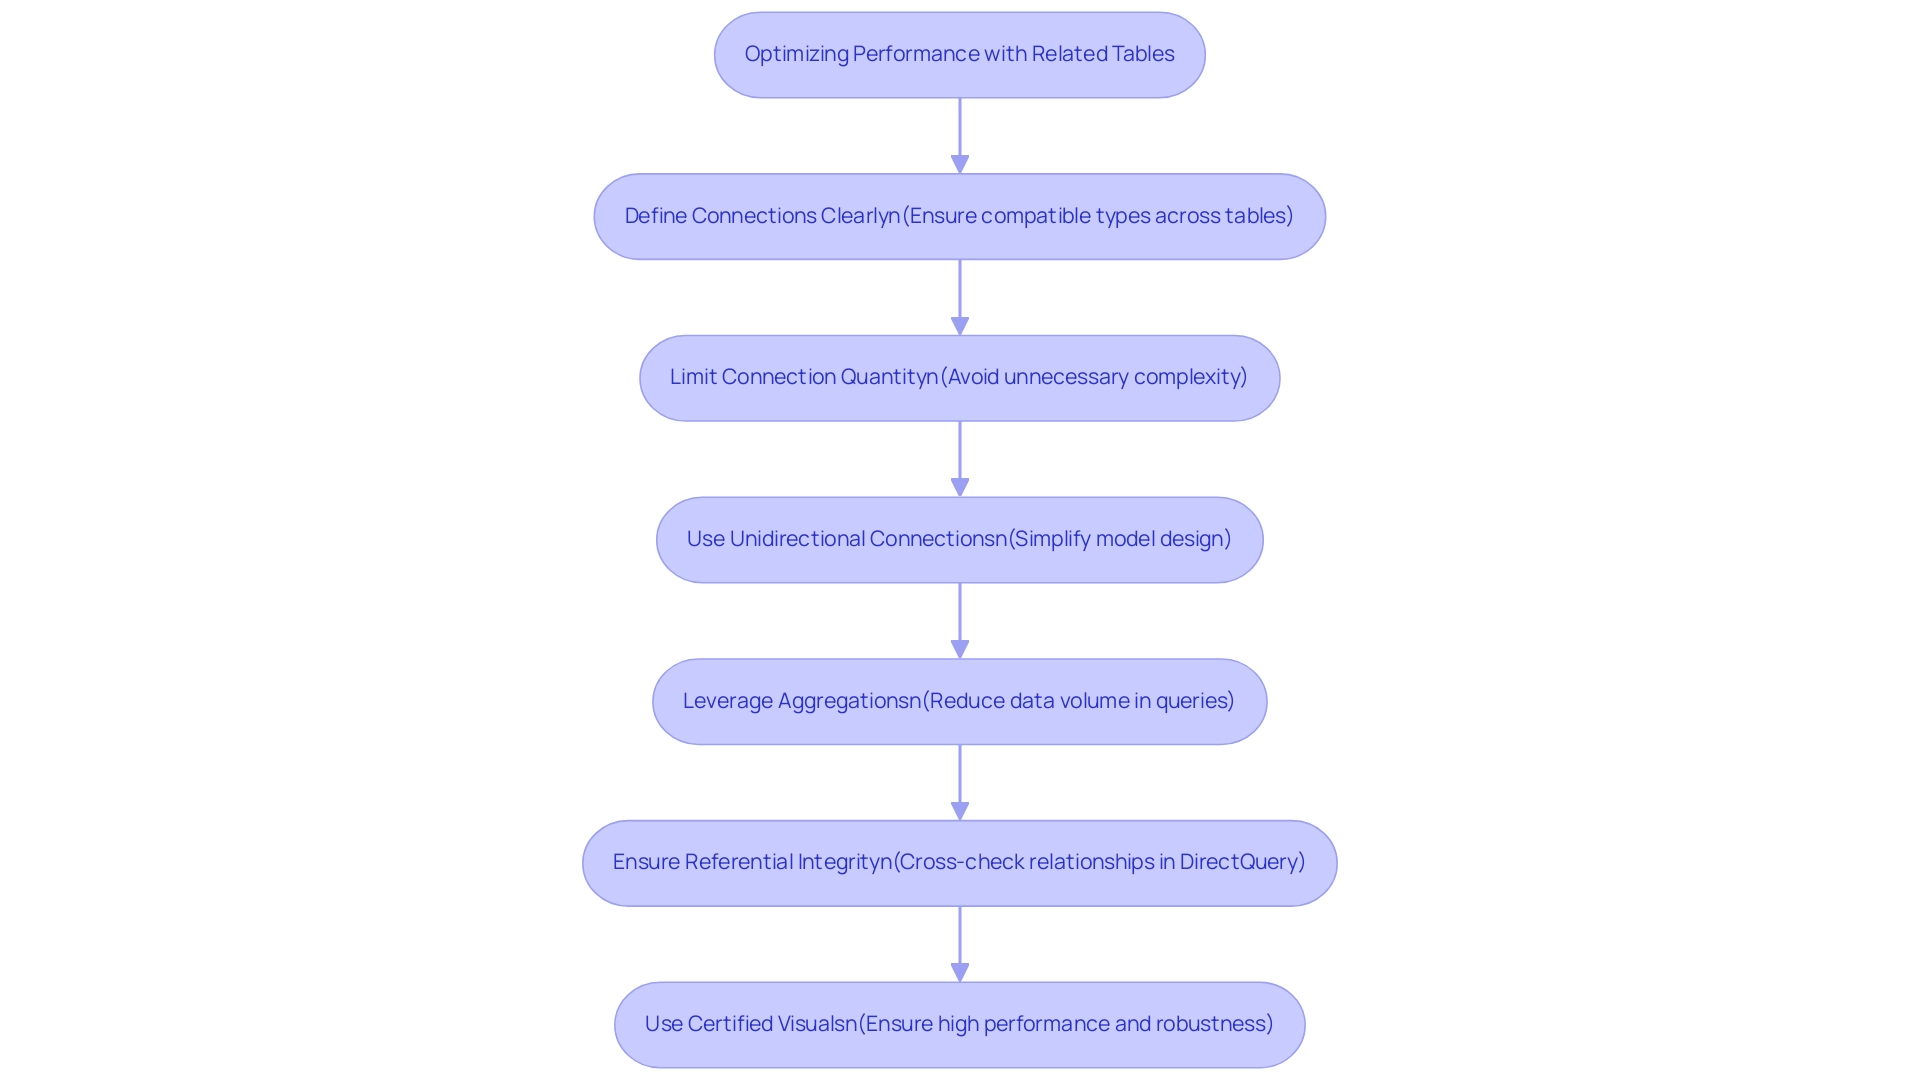
To achieve optimal performance with related table Power BI datasets, it is essential for users to adopt several strategic best practices while being aware of common challenges. One significant issue is the time-consuming nature of report creation, which can detract from leveraging insights effectively. A lack of a governance strategy can exacerbate inconsistencies, leading to confusion and mistrust in the information presented.
Ensuring that connections are precisely defined, with compatible types across associated tables, helps to reduce mistakes and improve query performance. Moreover, it is recommended to restrict the quantity of connections to avoid unnecessary complexity in models, as excessively intricate designs can result in performance decline—a warning backed by understandings of the dangers of bi-directional connections. Instead, concentrating on unidirectional connections can simplify the model and enhance operational efficiency.
Additionally, leveraging aggregations can dramatically enhance performance by reducing the volume of data processed in queries. It is also crucial to cross-check referential integrity for relationships in DirectQuery sources to optimize query performance. The use of Power BI-certified visuals ensures high performance and robustness, further supporting the effectiveness of these practices.
A practical case study demonstrating the successful categorization of report information using sensitivity labels illustrates how effectively managing information not only aids in security but also optimizes performance. For instance, implementing a clear governance framework can guide users in establishing data accuracy and consistency across reports. As Markus, a frequent visitor, noted, ‘Thank you for all your suggestions everyone, I will look into it further, but this answer confirms my thoughts and gives me some new ideas.’
By implementing these best practices and establishing a governance strategy, users can overcome the challenges faced in report creation and significantly enhance the efficiency and robustness of their Power BI reports, particularly those involving related table Power BI, ultimately driving data-driven insights for better decision-making.
Conclusion
Harnessing the power of related tables in Power BI is essential for organizations aiming to transform their data into valuable insights. By establishing defined relationships, users can create sophisticated data models that enhance reporting accuracy and decision-making. Key functions like LOOKUP and RELATED play a crucial role in managing these relationships, allowing for seamless integration of data across multiple tables. This capability not only enriches data analysis but also streamlines the reporting process, making it easier for teams to derive actionable insights.
The practical applications of related tables extend beyond mere data management. By linking diverse datasets, businesses can refine their marketing strategies, improve customer engagement, and enhance financial reporting. Moreover, the integration of Robotic Process Automation (RPA) tools can automate repetitive tasks, reducing errors and freeing up valuable time for strategic initiatives. As organizations navigate the complexities of data integration, embracing these technologies and practices will be instrumental in achieving operational efficiency and driving business success.
Establishing and maintaining strong relationships within data models is foundational for effective analysis. Regular audits, adherence to best practices, and a focus on optimizing performance can significantly improve data integrity and reliability. As organizations continue to leverage the capabilities of Power BI and related tables, they position themselves to make informed, data-driven decisions that align with their strategic goals. Now is the time to embrace these practices and unlock the full potential of data analytics for enhanced operational excellence.
Overview
Setting up data refresh in Power BI involves a systematic approach that includes choosing the right refresh method, configuring settings, and monitoring updates to ensure accurate reporting. The article outlines a step-by-step guide detailing the process of initiating manual, scheduled, or automatic updates, emphasizing the importance of maintaining data integrity for informed decision-making and highlighting best practices to optimize refresh efficiency.
Introduction
In the dynamic landscape of data analytics, ensuring that reports and dashboards reflect the latest insights is essential for informed decision-making. Power BI stands out as a powerful tool in this realm, offering a variety of data refresh options designed to meet diverse organizational needs. From manual to automatic refreshes, each method plays a critical role in maintaining data integrity and operational efficiency.
However, many organizations struggle with effectively implementing these strategies, resulting in missed opportunities for actionable insights. By exploring best practices, troubleshooting techniques, and innovative automation solutions, organizations can enhance their data refresh processes, ensuring that they not only keep pace with the rapid flow of information but also leverage it to drive strategic growth.
Understanding Data Refresh in Power BI
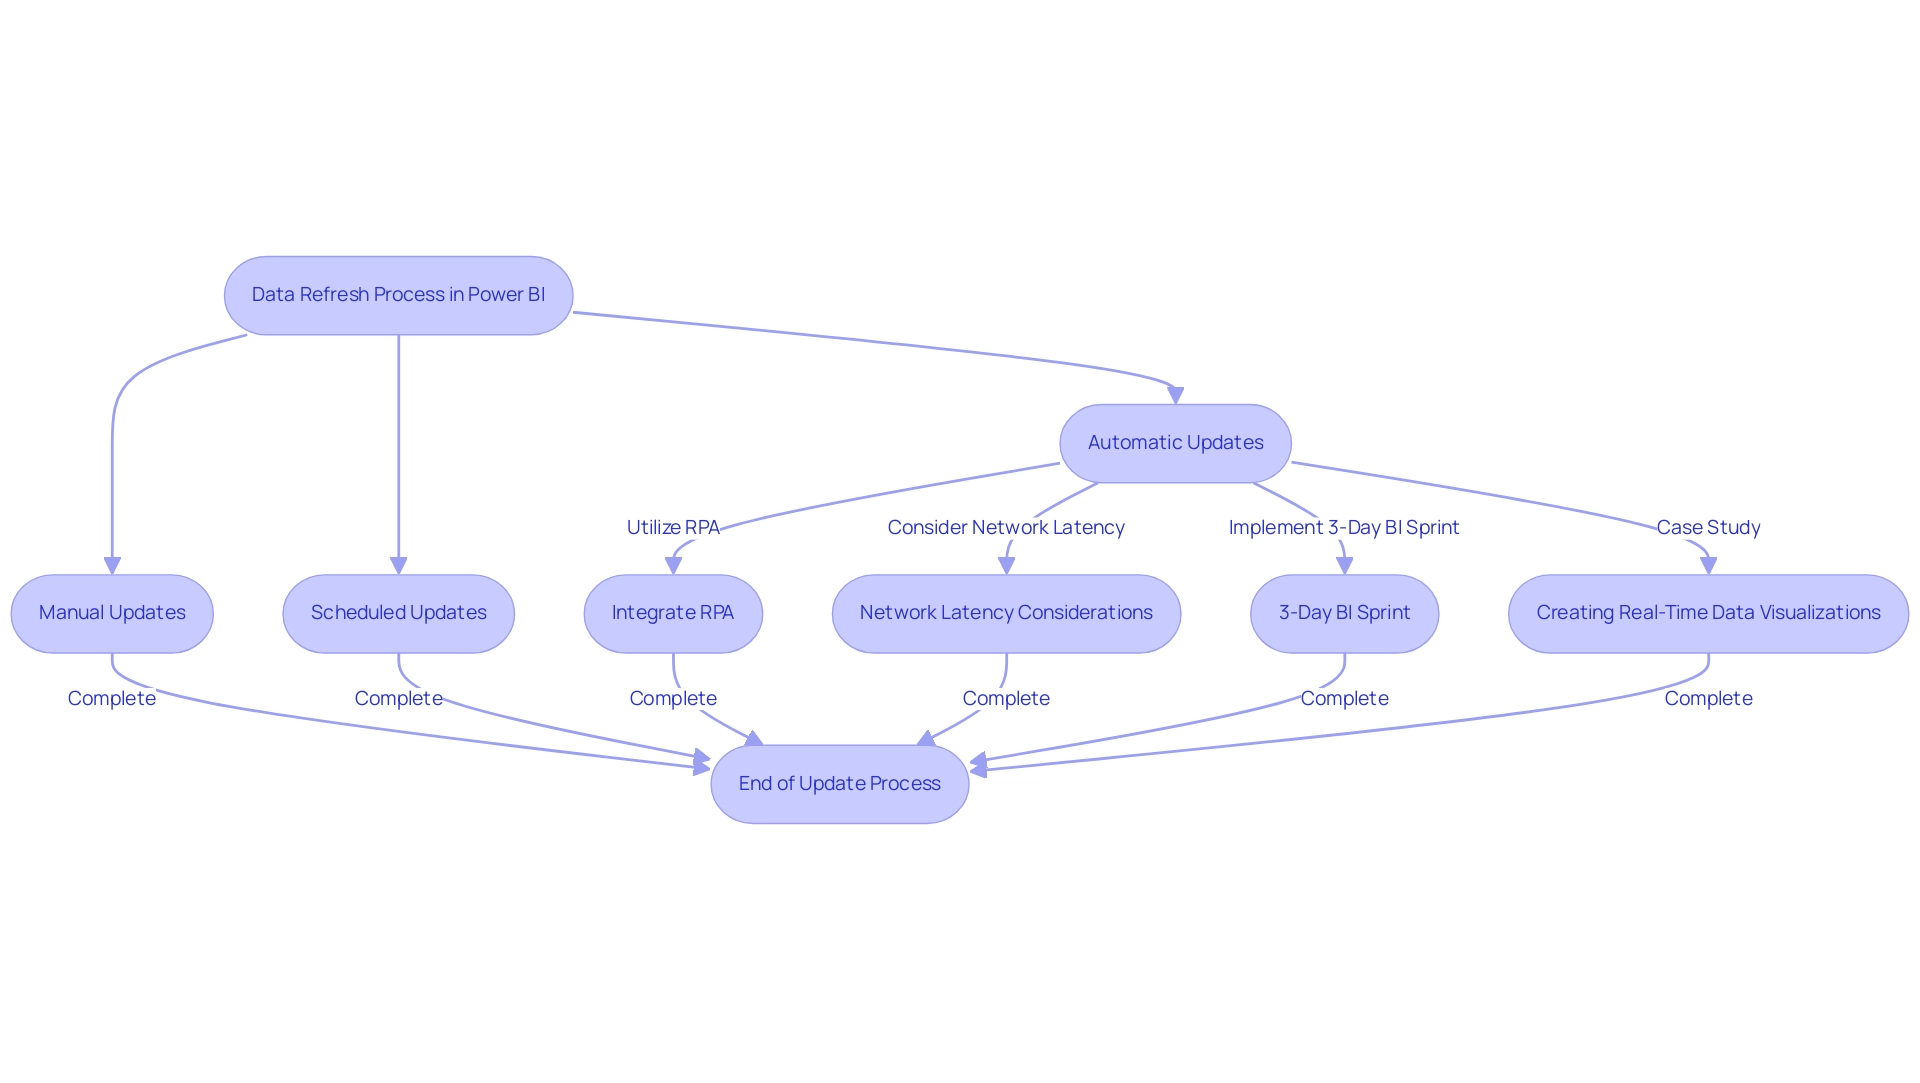
The update process in the BI tool is an essential activity to refresh data Power BI reports and dashboards with the most recent information from your sources, ensuring that your visualizations are aligned with current insights. This is not just a technical requirement; it’s essential for accurate reporting and strategic decision-making. By preserving the integrity of your insights, you enable your organization to make informed choices based on the most recent available information.
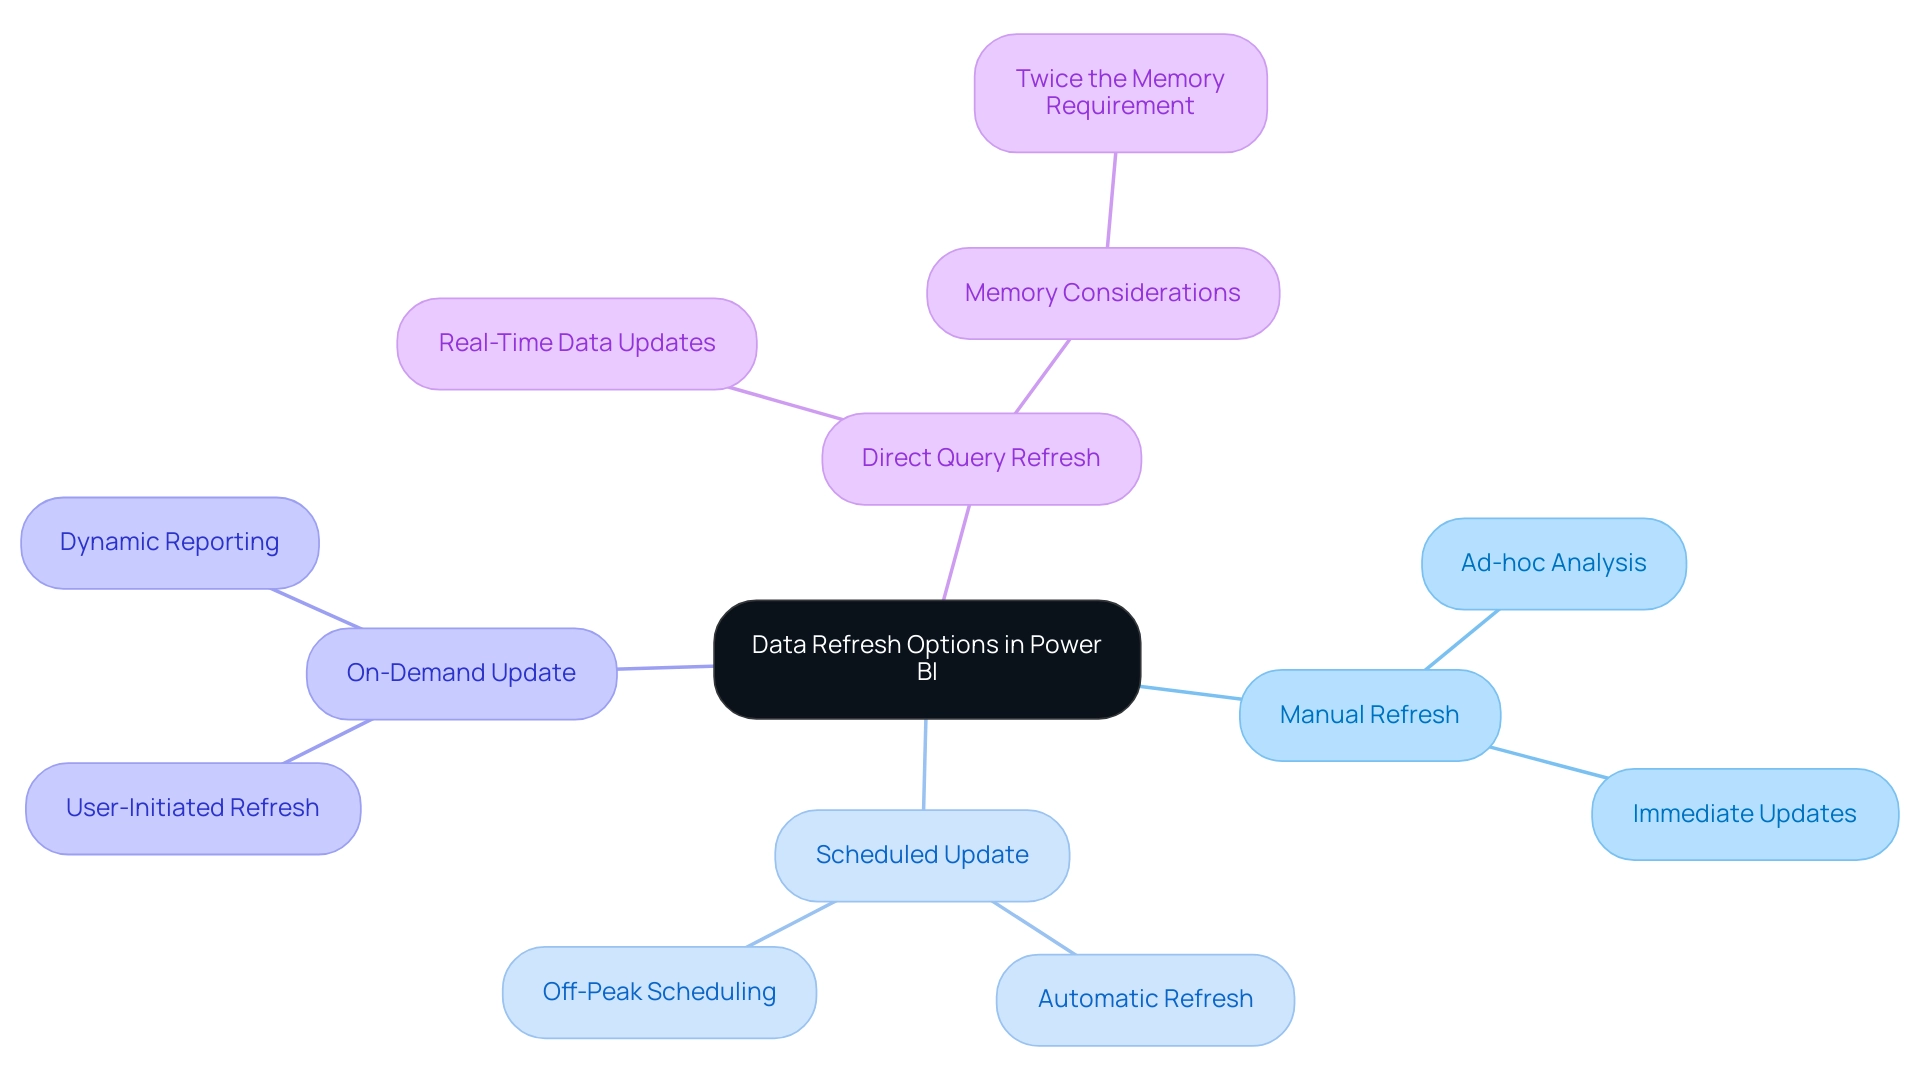
Power BI provides various update options designed for different situations, including:
- Manual updates
- Scheduled updates
- Ways to refresh data Power BI automatically
Each method addresses specific operational needs, allowing you to optimize your reporting practices effectively.
Moreover, the integration of Robotic Process Automation (RPA) can significantly enhance the efficiency of your reporting processes, reducing the time spent on manual tasks and minimizing errors. As you traverse the intricate environment of information management, utilizing customized AI solutions can enhance your operations, ensuring that the technologies you adopt correspond with your business objectives.
Information integrity is crucial; as shown by recent findings, 26% of organizations attain only a 50% update rate, while 58% fall below 25%. This highlights the need for a strong update strategy that not only improves the reliability of your insights but also allows you to refresh data Power BI, promoting a data-driven culture within your organization. Moreover, BI can send update failure alerts to your email, ensuring that you are quickly informed of any issues that may affect your information integrity.
Additionally, it is important to consider network latency, as it can impact update performance; therefore, it is advised to keep sources, gateways, and BI clusters in the same region to minimize delays. To demonstrate efficient information update methods, consider the 3-Day BI Sprint, which enables the swift production of expertly crafted reports, and the General Management App that offers extensive oversight and intelligent evaluations. A practical example of successful implementation can be seen in the case study titled ‘Creating Real-Time Visualizations,’ where organizations successfully utilized Power BI to refresh data and enhance agility and responsiveness in decision-making.
Step-by-Step Guide to Setting Up Data Refresh in Power BI
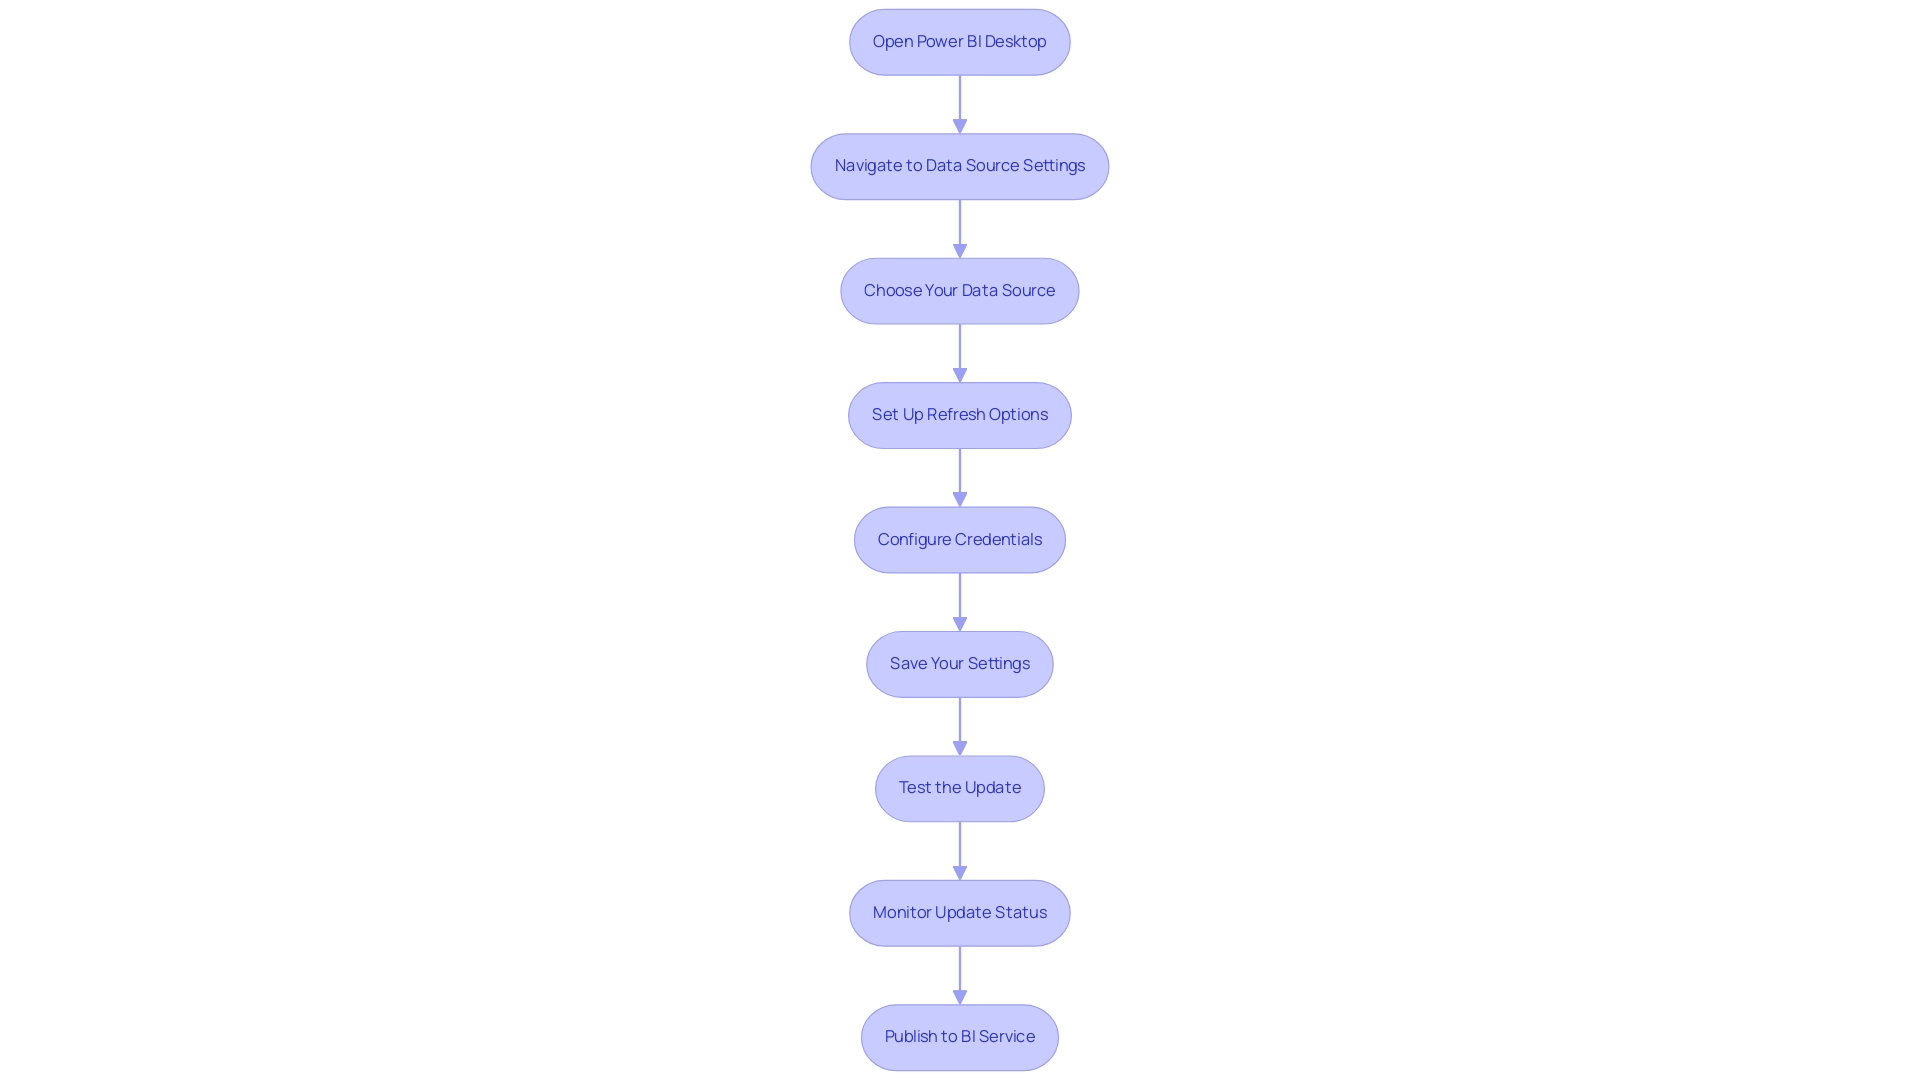
- Open Power BI Desktop: Launch the application and load the report you wish to work with.
- Navigate to Data Source Settings: Access the ‘File’ menu, then select ‘Options and settings,’ followed by ‘Data source settings.’
- Choose Your Data Source: Identify and select the specific data source that requires refreshing.
- Set Up Refresh Options: Click on ‘Schedule Refresh’ to define your preferred refresh frequency to refresh data Power BI. Power BI Premium allows you to refresh data Power BI as frequently as every 30 minutes, with a total of up to 48 refreshes available per day, enabling you to select daily, weekly, or custom intervals. However, as noted by mjmowle, while up to 48 times you can refresh data Power BI in a 24-hour period, they may be limited to 30-minute intervals depending on your license type.
- Configure Credentials: Make sure to enter the correct authentication details for your data source to avoid connectivity issues during refreshes.
- Save Your Settings: Click ‘Apply’ to ensure your configurations are saved.
- Test the Update: Manually initiate a test by clicking ‘Update’ to confirm that your settings are functioning correctly.
- Monitor Update Status: After configuring your update, regularly check the update status and history of your semantic models to refresh data Power BI, monitor for errors, and ensure successful synchronization cycles. This step is essential for overcoming challenges associated with time-consuming report creation and inconsistencies, as it ensures your information remains precise and current.
- Publish to BI Service: Once you’re assured in the update configuration, upload your report to the BI Service, allowing others to access the most recent information.
By following these steps, you can ensure that your BI reports are set up to refresh data Power BI consistently, providing accurate insights to support decision-making and drive business growth. Moreover, think about utilizing RPA solutions such as EMMA RPA or Automate to streamline the information update process, improving efficiency and minimizing manual involvement. Be aware of possible challenges with BI tools, such as a steep learning curve and integration issues; consider structured training and ongoing education programs designed for BI to enhance your proficiency with its update capabilities.
Exploring Different Types of Data Refresh Options
Power BI provides a range of data refresh options, each tailored to meet different reporting needs:
- Manual Refresh: This user-initiated option is ideal for ad-hoc analysis, allowing for immediate updates when specific insights are required.
- Scheduled Update: Automatically refreshing data Power BI at specified intervals, this approach is crucial for frequently updated reports, ensuring stakeholders have access to the most recent details without manual intervention. It is recommended to schedule these refreshes during off-peak times to optimize performance.
- On-Demand Update: This adaptable method allows users to refresh data Power BI at their discretion, making it especially beneficial for dynamic reporting situations where timing is crucial.
- Direct Query Refresh: This method allows users to refresh data Power BI for compatible data sources, providing real-time data updates and ensuring that they always interact with the most current information available. Significantly, during a complete update, you need twice the amount of memory the semantic model requires, which is a critical technical consideration.
Comprehending these varied options enables organizations to choose the most appropriate update method to refresh data in Power BI based on their reporting needs. However, many organizations struggle with a lack of data-driven insights, which can leave them at a competitive disadvantage. By applying these improvement strategies, organizations can enhance their reporting capabilities and drive informed decision-making.
Alongside these strategies, our 3-Day BI Sprint can expedite the report creation process, while the General Management App supports comprehensive management and smart reviews. As Sayantoni Das notes,
Query is a commonly utilized ETL (Extract, Transform, Load) tool, underscoring its essential role in the analytics landscape.
Additionally, adopting best practices for data transformation in BI, such as maintaining clear documentation, prioritizing information quality, and optimizing models, can further enhance these refresh strategies.
The case study titled “Best Practices for Transforming Data in Business Intelligence” illustrates that organizations can achieve improved business outcomes by adhering to these practices. By implementing these approaches, organizations can maximize the value of their advanced analytics investments and leverage Power Automate for streamlined workflow automation, ensuring a risk-free ROI assessment and professional execution.
Best Practices for Effective Data Refresh in Power BI
-
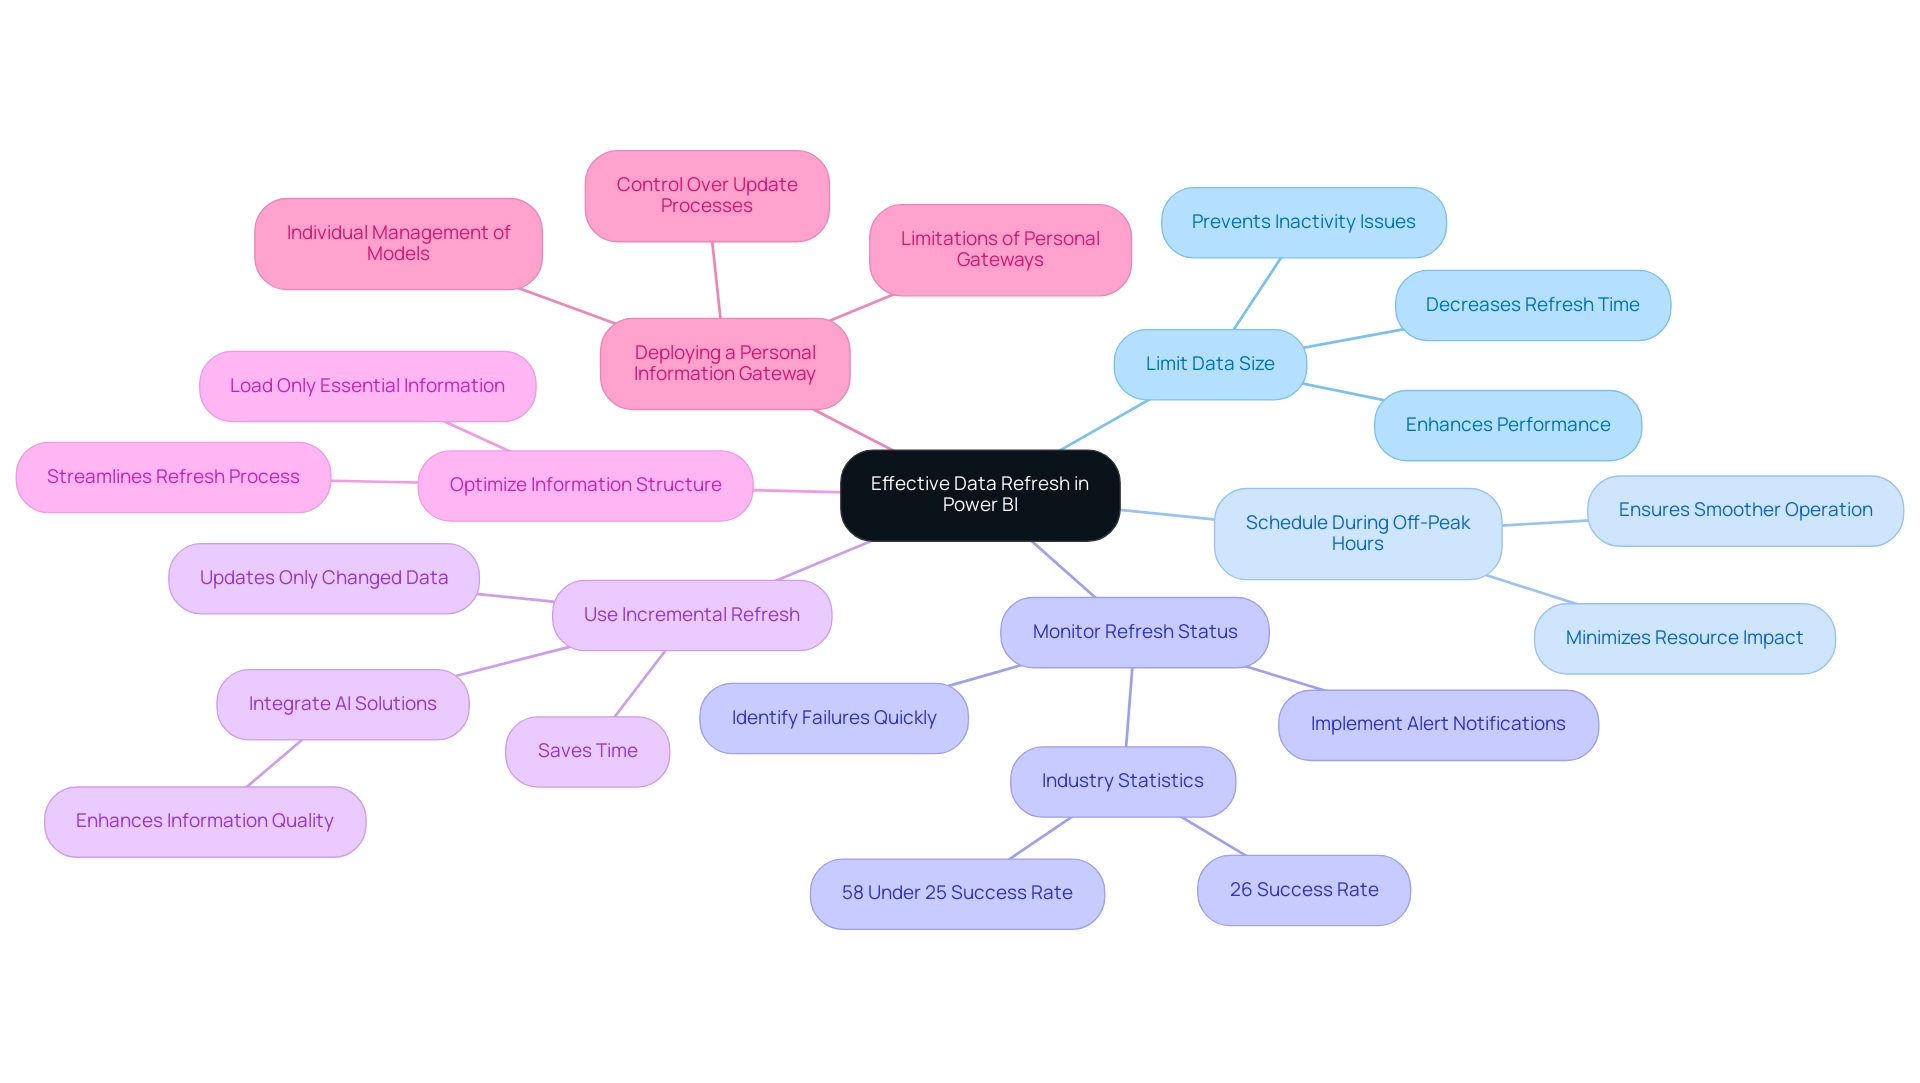
Limit Data Size: Start by reducing the amount of data to refresh data Power BI effectively. A smaller dataset not only enhances performance but also decreases the time required for each refresh cycle. This is crucial, especially considering that it is important to refresh data Power BI deems a semantic model inactive after two months of inactivity, emphasizing the necessity of regular engagement.
-
Schedule During Off-Peak Hours: To further optimize performance, schedule data refreshes during off-peak hours. By doing so, you minimize the impact on system resources and ensure a smoother operation.
-
Monitor Refresh Status: Regular observation of update history is essential. This practice enables you to quickly identify any failures or delays, allowing for timely responses. According to industry statistics, ‘26% of organizations encounter update issues at a 50% success rate, while 58% report problems occurring under 25%.’ Implementing alert notifications for update failures can significantly enhance responsiveness to these challenges, especially when leveraging Robotic Process Automation (RPA) to automate manual workflows and improve operational efficiency.
-
Use Incremental Refresh: For those managing large datasets, incremental refresh is a game changer. This technique updates only the information that has changed, rather than refreshing the entire dataset, leading to substantial time savings and improved performance. Additionally, consider integrating AI solutions, such as Small Language Models, which can enhance information quality by providing tailored analyses that address inconsistencies in master information.
-
Optimize Information Structure: An effective information model is essential for improving update durations. Ensure that only essential information is loaded into your model. This not only streamlines the refresh process but also improves overall performance.
-
Case Study – Deploying a Personal Information Gateway: For users without access to an enterprise gateway, deploying a personal information gateway can be a practical solution. This permits individual management of semantic models, enabling users to handle source configurations independently. While personal gateways have limitations, they enable users to maintain control over their information update processes, aligning with the best practices discussed.
By adhering to these best practices and considering automation strategies, you can significantly enhance the reliability and efficiency of the refresh data Power BI processes, ultimately driving better decision-making and operational effectiveness. To discover more about how our AI solutions can specifically tackle your quality challenges, schedule a free consultation today.
Troubleshooting Data Refresh Issues in Power BI
-
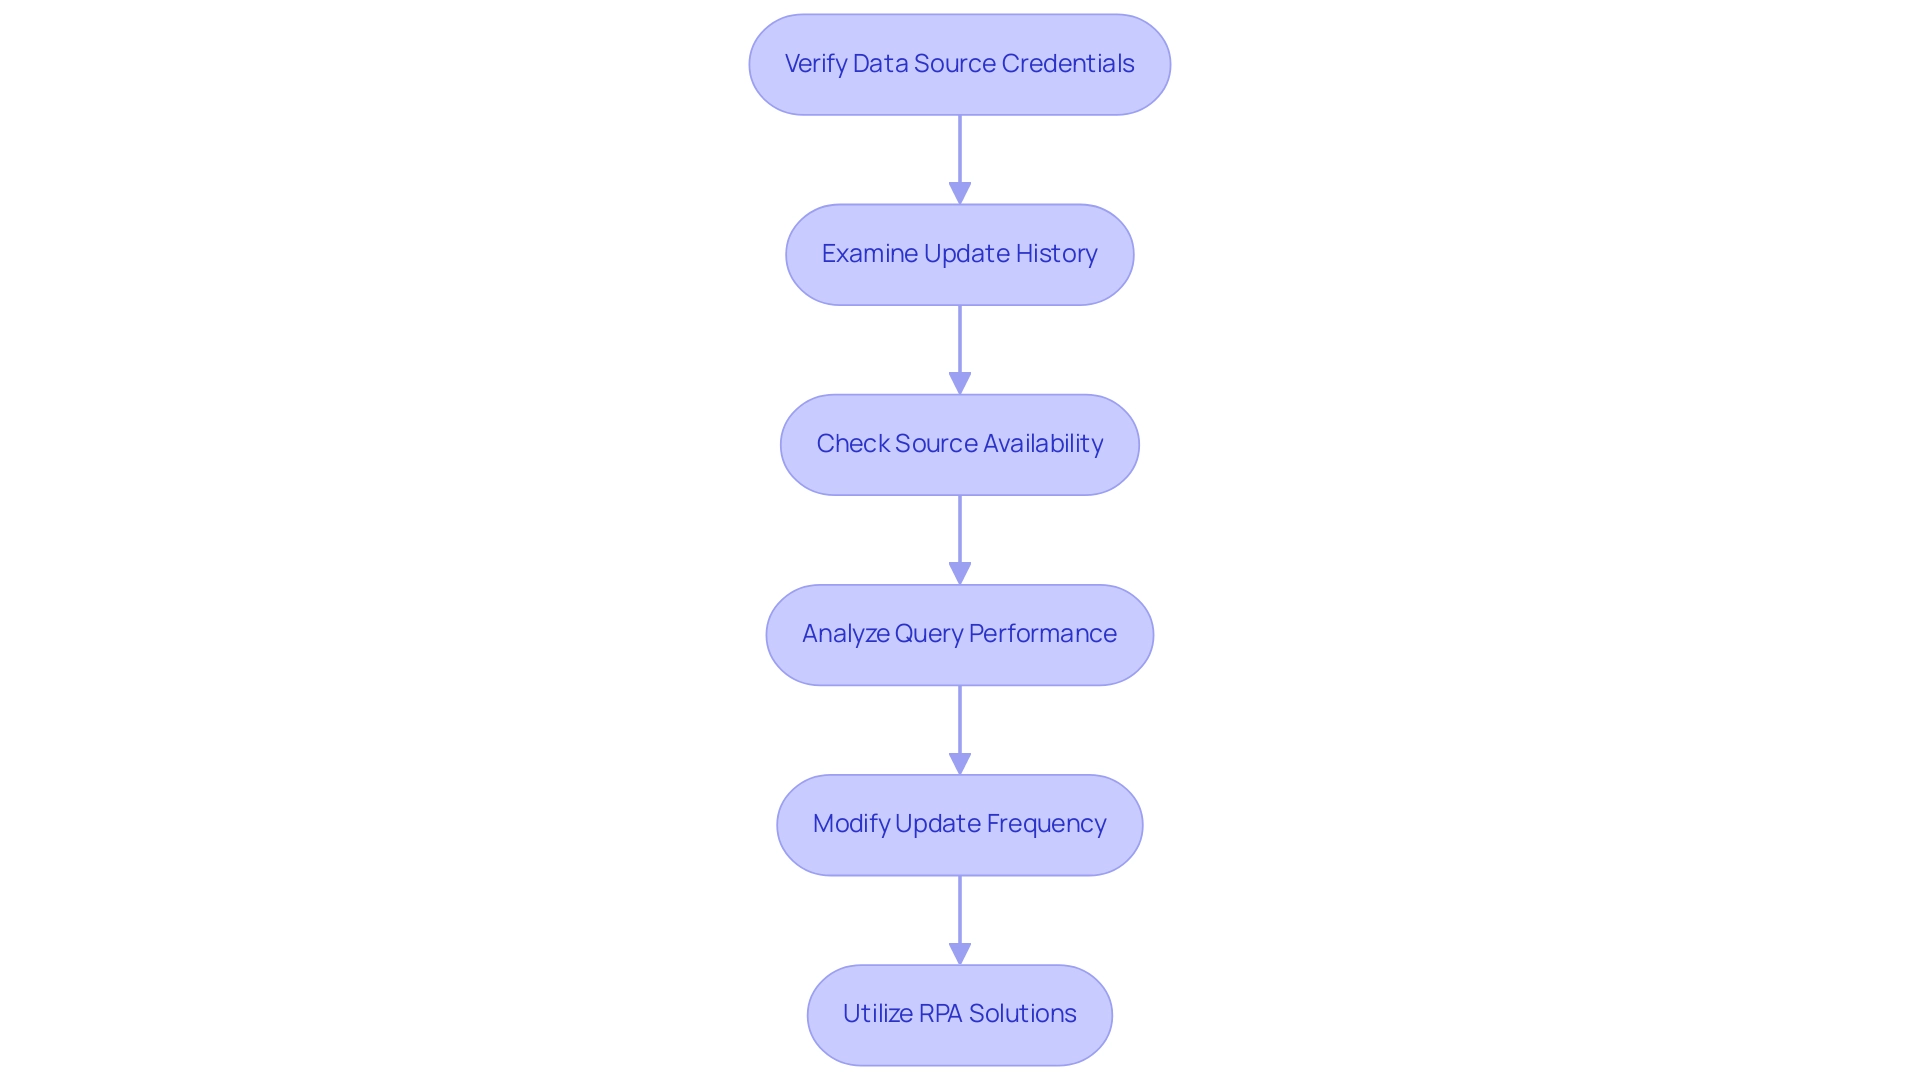
Verify Data Source Credentials: Start by confirming that the credentials for your data source are accurate and have not expired. This foundational step is vital, as incorrect credentials can lead to failed update attempts, ultimately affecting your ability to extract meaningful insights essential for informed decision-making.
-
Examine Update History: Utilize the update history feature in BI Service to pinpoint any error messages or recurring patterns. This insight can help identify specific issues that need addressing, allowing you to improve operational efficiency in report generation.
-
Check Source Availability: Ensure that your information source is online and reachable during scheduled update periods. Downtime or network issues can significantly impact update success rates, posing challenges in leveraging your Power BI dashboards effectively.
-
Analyze Query Performance: If you encounter sluggish update times, it’s essential to review the performance of the queries within your data model. Optimizing queries can lead to more efficient update operations, reducing timeouts and enhancing the overall user experience with your business intelligence tools.
-
Modify Update Frequency: For those experiencing frequent update failures, consider adjusting the update frequency. Allocating more time for processing can alleviate pressure on your models, particularly during high-demand periods. For instance, you might retain two years of information and configure the incremental update to modify only the last three months.
-
Utilize RPA Solutions: Think about incorporating RPA solutions such as EMMA RPA and Automate to streamline routine information management tasks. This can streamline the updating process, reduce human error, and enhance overall operational efficiency.
By implementing these key troubleshooting strategies, you can effectively manage and resolve common data updating issues in Power BI. As v-angzheng-MSFT notes, ‘The table will update if changes to the APPLIED STEPS pane are detected.’ There is no way to prevent an update from occurring if you modify a step. This emphasizes the significance of comprehending how changes affect update processes.
Additionally, consider the case study regarding scheduled refresh time-outs, which indicates that reducing the size or complexity of semantic models can help avoid time-outs. By integrating RPA solutions alongside these practices, the success rate of your troubleshooting efforts will improve, facilitating smoother operations and enhanced data insights, ultimately driving growth and innovation within your organization.
Conclusion
Ensuring that data refresh processes in Power BI are robust and efficient is critical for organizations striving to harness the full potential of their analytics. By understanding the various data refresh options—manual, scheduled, on-demand, and direct query—organizations can tailor their strategies to meet specific reporting needs. Each method serves a distinct purpose, facilitating timely access to the most current insights, which is essential for informed decision-making.
Implementing best practices, such as:
- Limiting data size
- Scheduling refreshes during off-peak hours
- Monitoring refresh statuses
can significantly enhance the reliability of data updates. Utilizing techniques like incremental refresh allows for more efficient data management, while integrating automation solutions such as Robotic Process Automation can streamline workflows and minimize human error.
Moreover, troubleshooting common refresh issues, from verifying data source credentials to optimizing query performance, empowers teams to maintain seamless operations. As organizations embrace these strategies, they position themselves to not only improve data integrity but also foster a culture of data-driven decision-making that drives strategic growth.
In today’s fast-paced business environment, the ability to leverage up-to-date data effectively can set organizations apart from the competition. By prioritizing these data refresh strategies, organizations can ensure they are equipped to respond swiftly to changing insights and market dynamics, ultimately paving the way for sustained success.
Overview
The article focuses on the differences between reference and duplicate queries in Power Query, highlighting their implications for data management and reporting efficiency. It explains that reference queries maintain a dynamic connection to the original data, allowing for real-time updates, while duplicate queries create static copies, which can hinder efficiency and increase resource consumption; thus, understanding these distinctions is crucial for optimizing workflows and ensuring accurate reporting in business intelligence contexts.
Introduction
In the evolving landscape of data management, understanding the nuances between reference and duplicate queries in Power Query is pivotal for optimizing operational efficiency. As organizations strive to harness the full potential of their data, these query types emerge as essential tools in the arsenal of Business Intelligence.
- Reference queries provide a dynamic connection to original datasets, ensuring that reports reflect the most current information.
- Duplicate queries allow for safe experimentation without altering the source data.
By mastering these concepts, organizations can streamline workflows, enhance reporting capabilities, and ultimately drive informed decision-making. This article delves into the practical applications, performance considerations, and best practices that empower users to leverage these queries effectively, transforming data challenges into opportunities for growth and innovation.
Understanding Reference and Duplicate Queries in Power Query
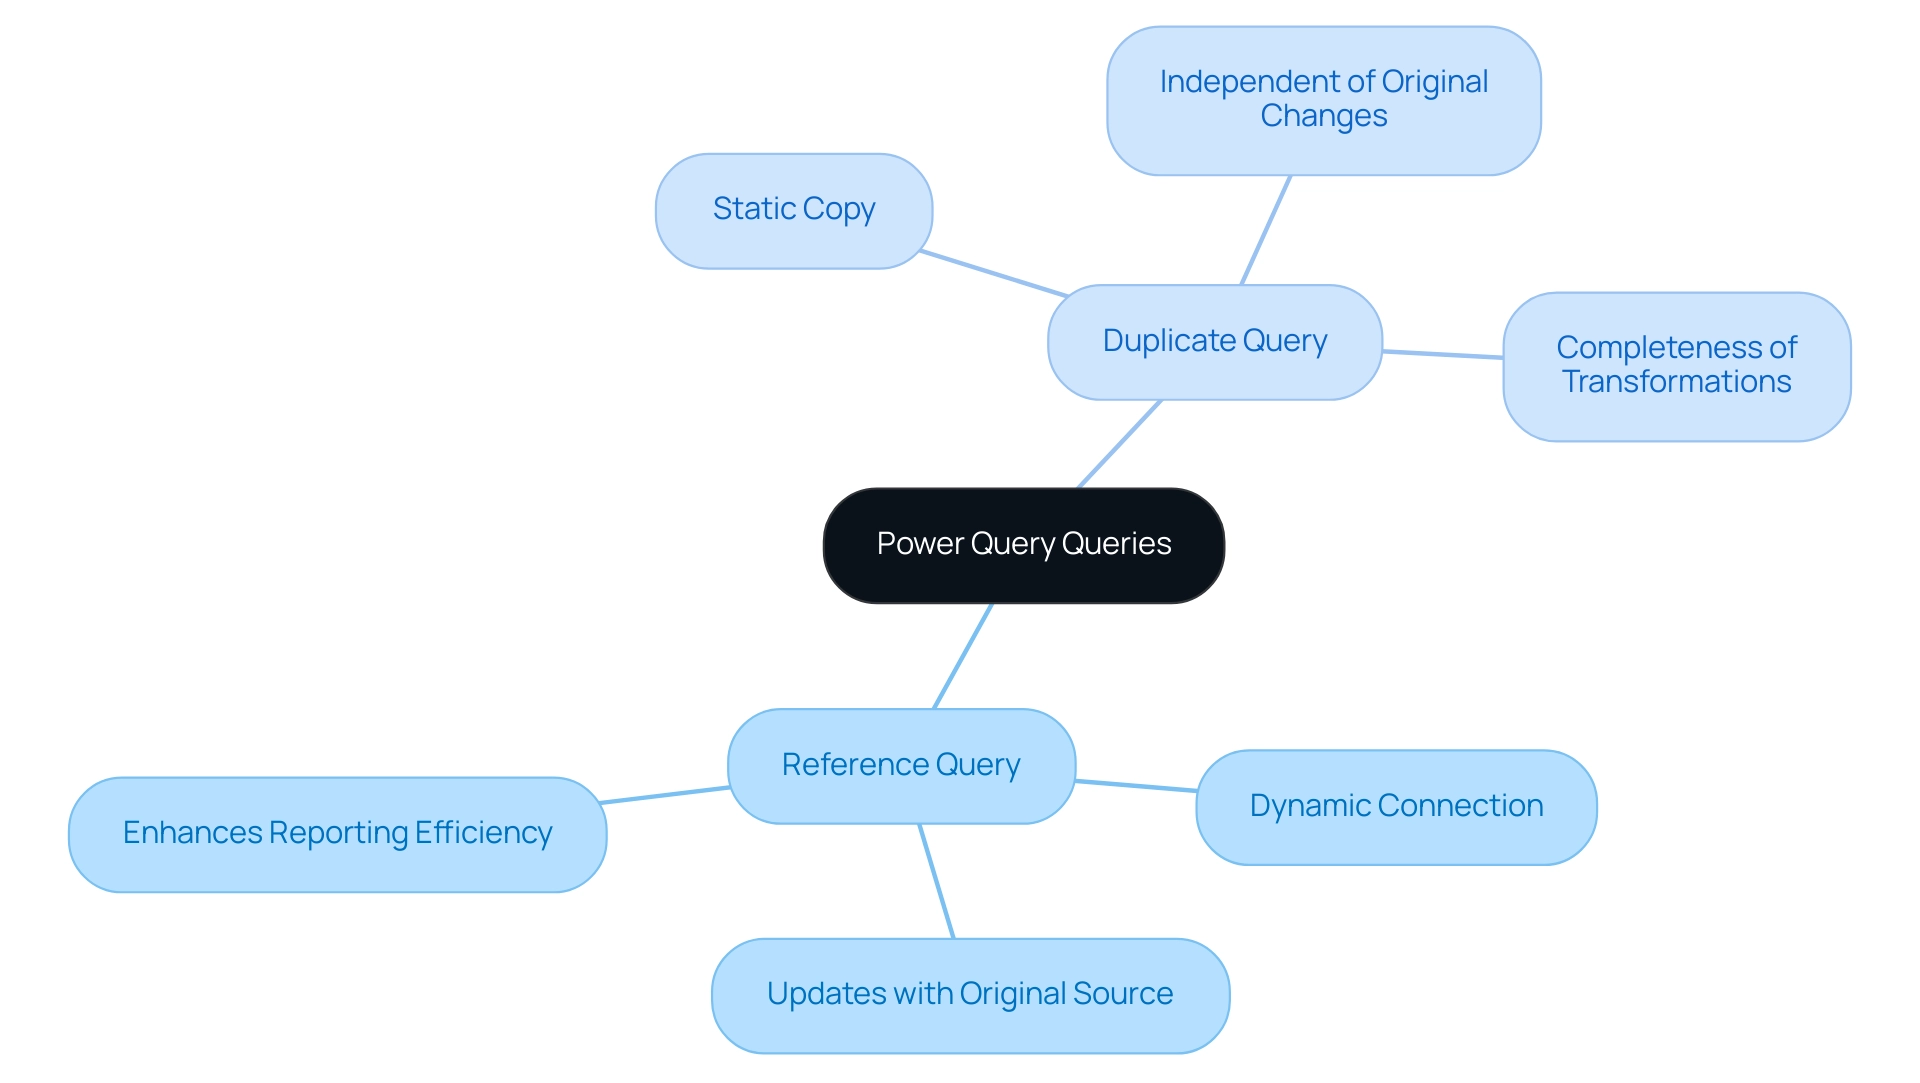
In Power Query, a linked component acts as a dynamic connection to the original information source, enabling users to generate a new element that mirrors any changes made to the source information. This indicates that as the original dataset evolves, the reference search seamlessly updates, enhancing efficiency and accuracy in the reporting process—key components in leveraging Business Intelligence for operational growth. Unlocking the power of Business Intelligence is essential for transforming raw information into actionable insights that drive informed decision-making.
Conversely, a duplicate query generates a complete copy of the original, encompassing all transformations applied. This leads to a static dataset that stays the same, regardless of updates made to the original information. Understanding the distinctions of reference vs duplicate power query is vital for optimizing workflows and ensuring information integrity, particularly considering the challenges many encounter, such as time-consuming report creation, inconsistencies, and lack of actionable guidance.
With 1,957 users online in the Fabric community, you are not alone in navigating these complexities. As Johnny Winter wisely noted,
It makes sense in this scenario to generate a request that brings in the complete table, and then compose a series of reference requests to transform the information into a better format for reporting.
For example, a junior analyst employed both reference vs duplicate power query searches to improve information management abilities, demonstrating the practical advantages of comprehending these search types.
Furthermore, understanding dependency can significantly enhance the management of multiple machine learning models in Power BI, streamlining data management and empowering users to leverage the full potential of Power Query. Additionally, our RPA solutions can further enhance operational efficiency by automating repetitive tasks, allowing you to focus on strategic decision-making. Book a free consultation to learn more about how RPA can transform your operations.
Practical Differences: When to Use Reference vs Duplicate Queries
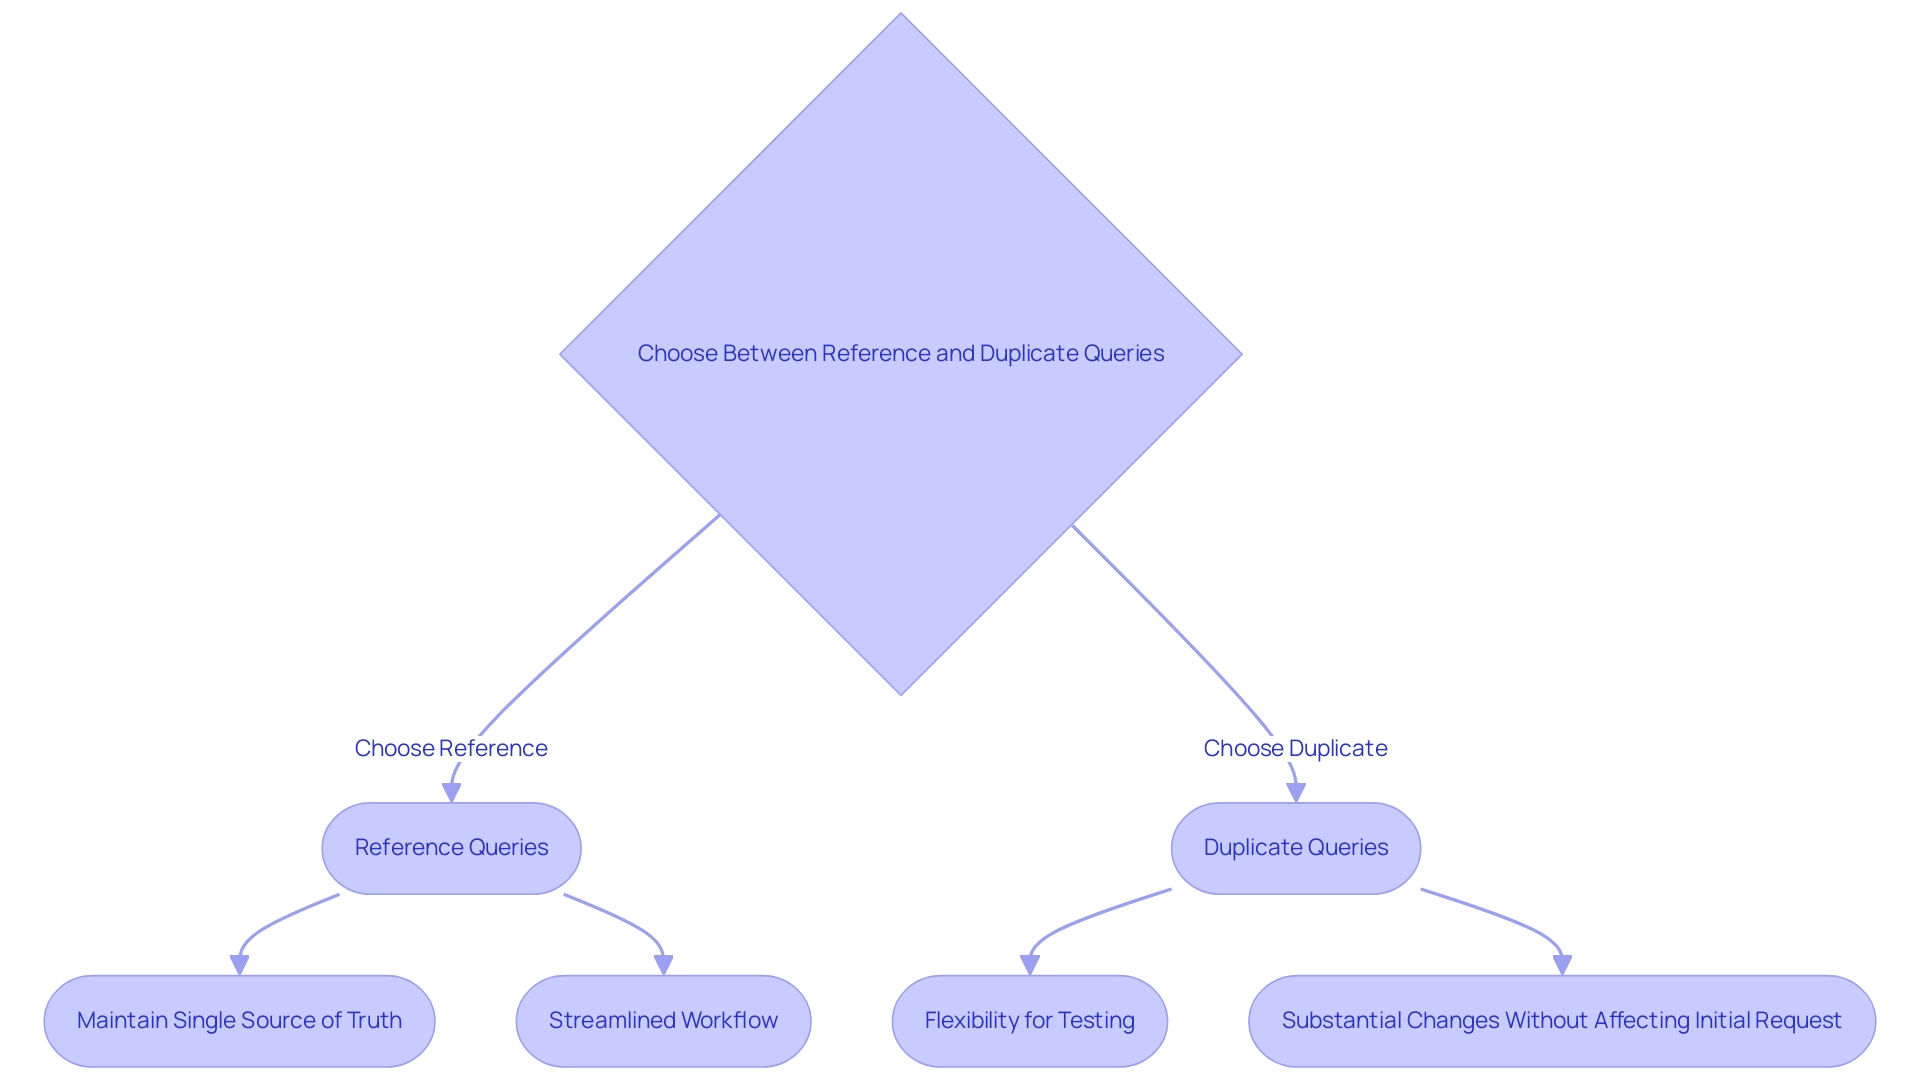
When confronted with the choice between reference vs duplicate power query searches, it’s essential to carefully evaluate your objectives. When aiming to maintain a single source of truth, you should consider the difference between reference vs duplicate power query as your go-to option. This method ensures that any updates to the original information are automatically reflected in your reports, which is crucial for scenarios where freshness is paramount.
As emphasized by Pete, a Super User,
If you can develop a core request that includes all generic transformations, then use this for each subset of unique transformations, you will reduce the number of areas that require adjustments.
This approach not only streamlines your workflow but also enhances efficiency in ongoing reporting processes, crucially supporting your Business Intelligence efforts. Additionally, figures from Ovid and Covidence indicate a specificity of 100%, highlighting the significance of precise information management in your requests.
On the other hand, using reference vs duplicate power query is advantageous when substantial changes to the information structure or transformations are necessary without affecting the initial request. This flexibility is particularly valuable for testing new transformations or creating variations of a report based on the same dataset. The difference in the context of reference vs duplicate power query is how each technique employs processing power and memory; duplicating a request creates a separate object in memory, while pointing to a request functions like a pointer, thereby saving resources and avoiding circular references.
Furthermore, incorporating Robotic Process Automation (RPA) can notably improve the efficiency of these processes by automating repetitive tasks related to inquiries, enabling your team to concentrate on more strategic decision-making. It’s also important to acknowledge the limitations concerning the emphasis on sources from the Ovid platform and the incapacity to assess certain software due to file size constraints, which can create obstacles in analysis. Tackling these challenges, such as time-consuming report creation and inconsistencies, will enable you to make informed decisions that enhance your analysis strategies in Power Query and Power BI, ultimately driving growth and innovation in your operations.
Use Cases: Real-World Applications of Reference and Duplicate Queries
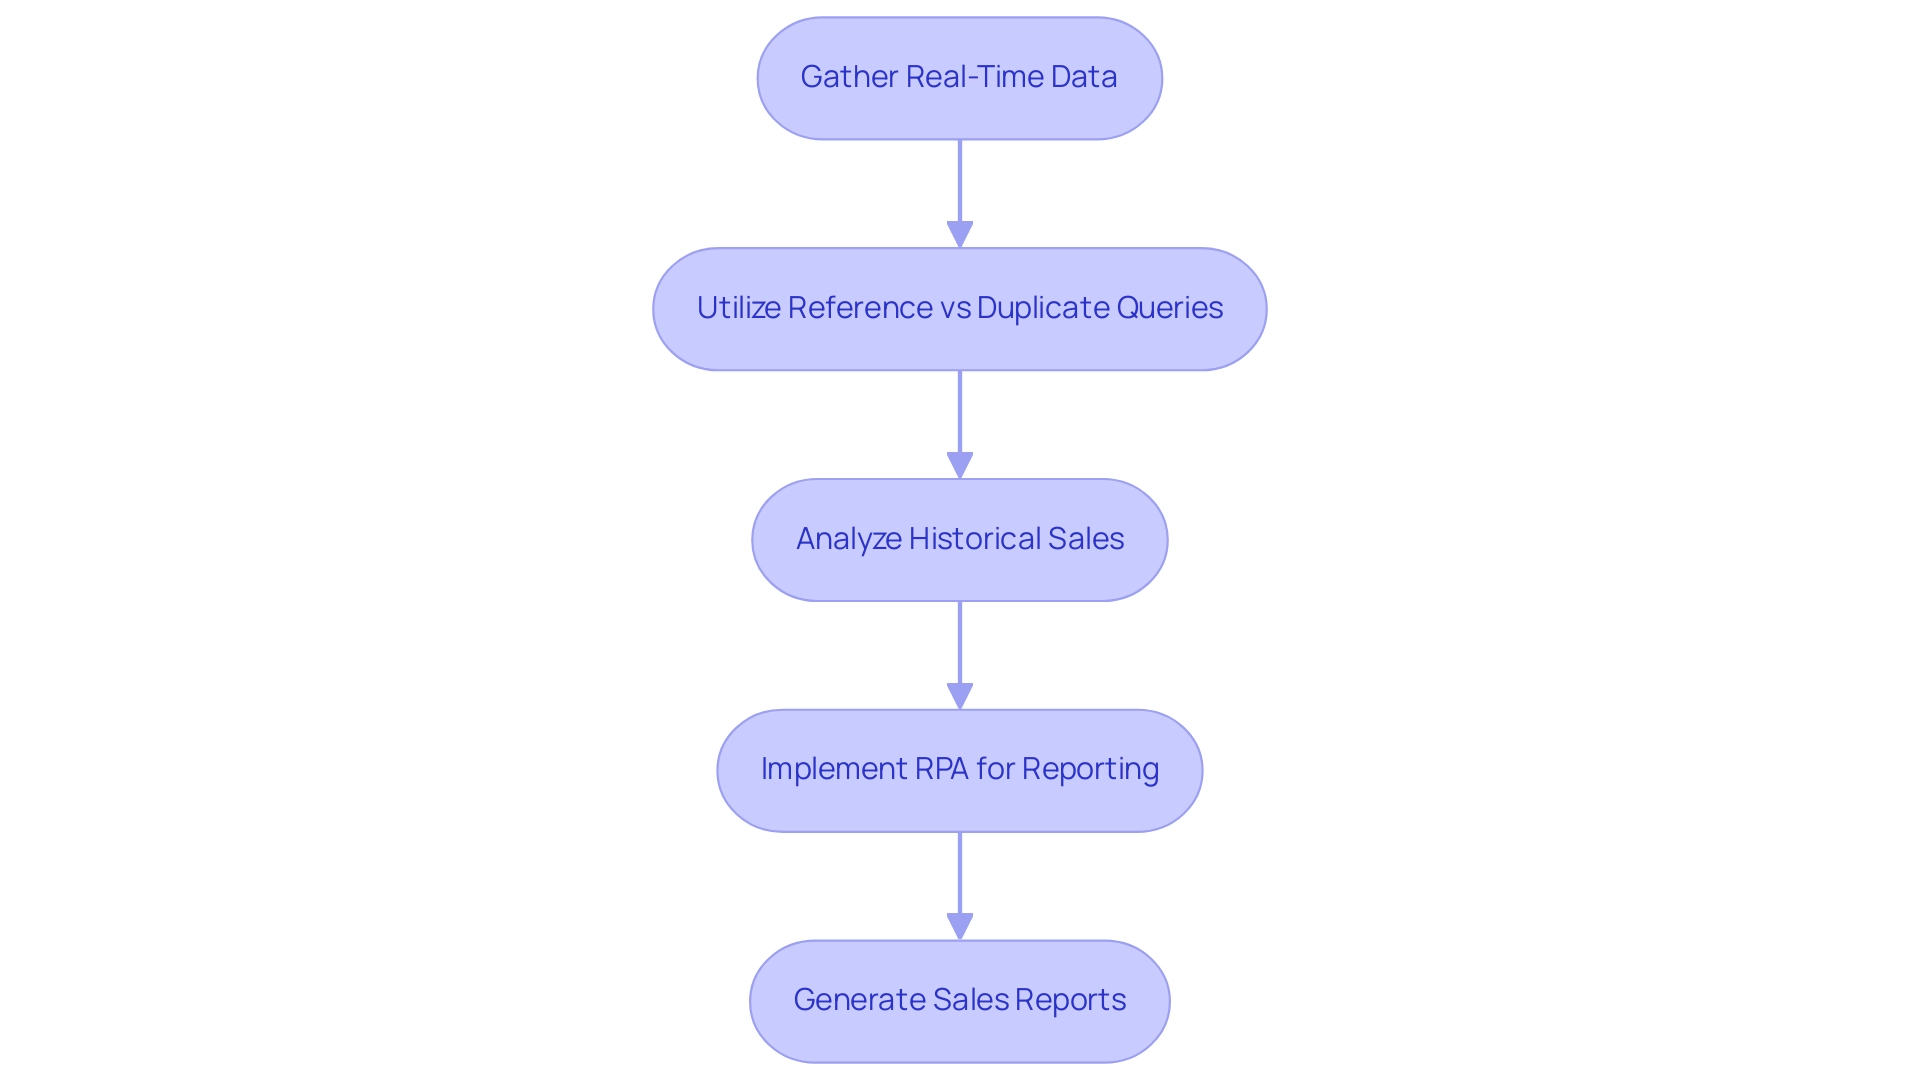
An information request acts as a strong instrument in business reporting, especially when handling sales reports that need real-time information from regularly updated sources, like a database monitoring customer orders. For instance, with SKF having 17,000 distributor locations worldwide, the ability to utilize the reference vs duplicate power query ensures that reports consistently reflect the most current sales figures across a vast network, empowering decision-makers with timely insights. As Andy Morris, Principal Product Marketing Specialist, notes, “The online experience should mirror a good trip experience, but the company had no visibility into the voice of the customer.”
This highlights the necessity for real-time information in sales reporting to enhance customer experience and drive operational efficiency. To support this, Robotic Process Automation (RPA) can be implemented to simplify information gathering and reporting processes, reducing errors and freeing up resources for more strategic tasks. On the other hand, when analyzing historical sales information, such as figures from the previous quarter, the distinction of reference vs duplicate power query provides a strategic benefit without altering the original dataset.
This method enables focused analysis while preserving the integrity of ongoing sales information. However, organizations frequently face challenges with inadequate master information quality, which can obstruct efficient utilization of both varieties of inquiries. The transition in large information utilization from 17% in 2015 to 53% in 2017, along with 97.2% of firms investing in big information and AI by 2018, indicates a significant movement towards advanced analytics.
By utilizing both citations and the reference vs duplicate power query in contemporary reporting methods, along with strong Business Intelligence solutions, organizations can enhance their reporting capabilities, tackle issues of inadequate master information quality, and ultimately achieve superior business results through informed decision-making.
Performance Considerations: Efficiency of Reference vs Duplicate Queries
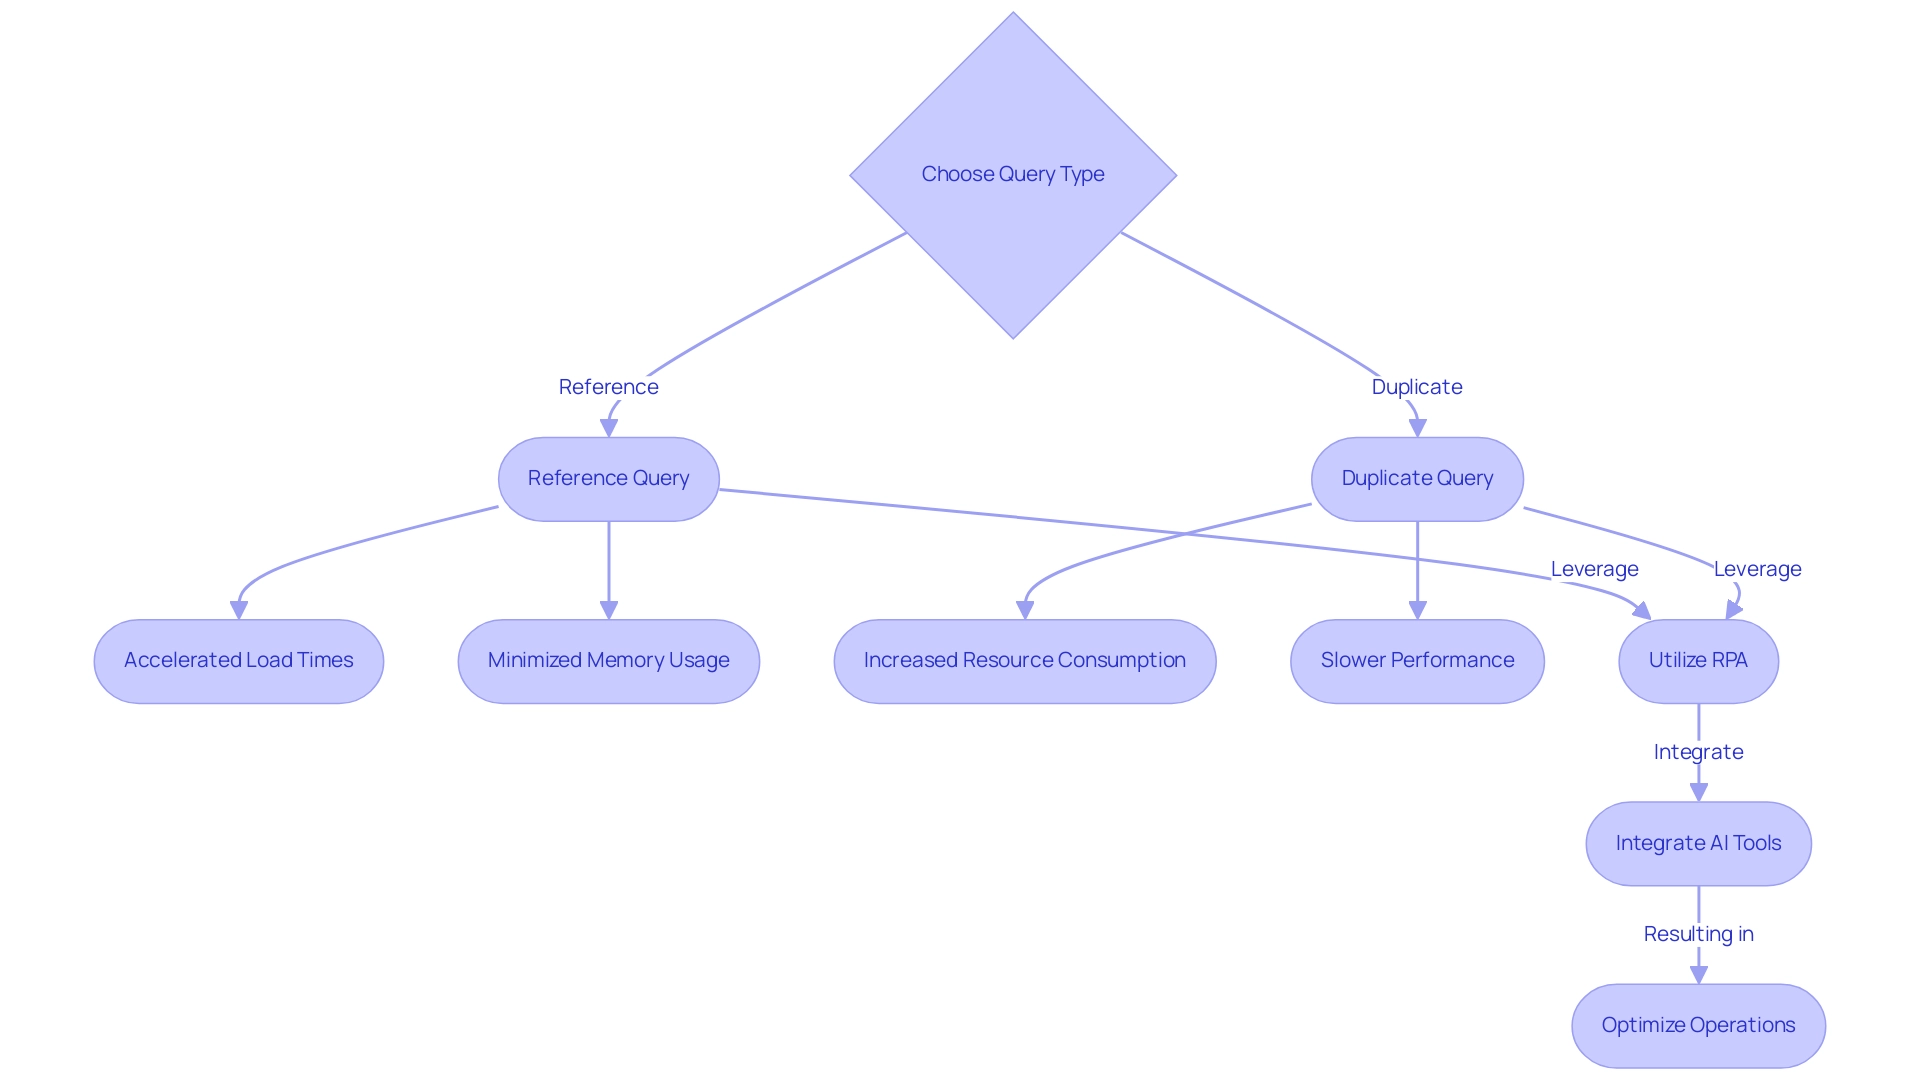
When assessing performance, the distinction between reference vs duplicate power query arises as the more efficient choice, mainly because reference queries do not replicate information; rather, they merely refer to the original source. This method can significantly accelerate load times and minimize memory usage, particularly when dealing with larger datasets. By utilizing Robotic Process Automation (RPA) alongside these requests, organizations can automate manual workflows, resulting in significant cost savings and enabling teams to concentrate on strategic tasks.
For example, automating information entry and report generation can decrease labor expenses and mistakes. Conversely, in the discussion of reference vs duplicate power query, duplicate queries tend to consume more resources since they generate a complete copy of the information, which can result in slower performance, especially if multiple duplicates are initiated. Recent findings suggest that organizations can enhance their information handling capabilities by integrating tailored AI solutions, which address challenges in a rapidly evolving technological landscape.
As emphasized in the case study ‘Common Challenges and Solutions When Working with Queries,’ implementing strategies like RPA can effectively address issues such as mismatches and performance bottlenecks. By prioritizing data requests for large datasets or intricate transformations, organizations can optimize operations, decrease resource usage, and ultimately improve overall efficiency. Furthermore, utilizing Business Intelligence tools in conjunction with RPA and AI can assist organizations in deriving actionable insights from their information, fostering informed decision-making.
As BI Analyst Pablo Genero notes,
While these small tips have little or no impact on performance, they can be beneficial in optimizing the workflow.
Organizations interested in furthering their understanding of these concepts can use code MSCUST for a $150 discount on registration for relevant workshops.
Best Practices for Using Reference and Duplicate Queries in Power Query
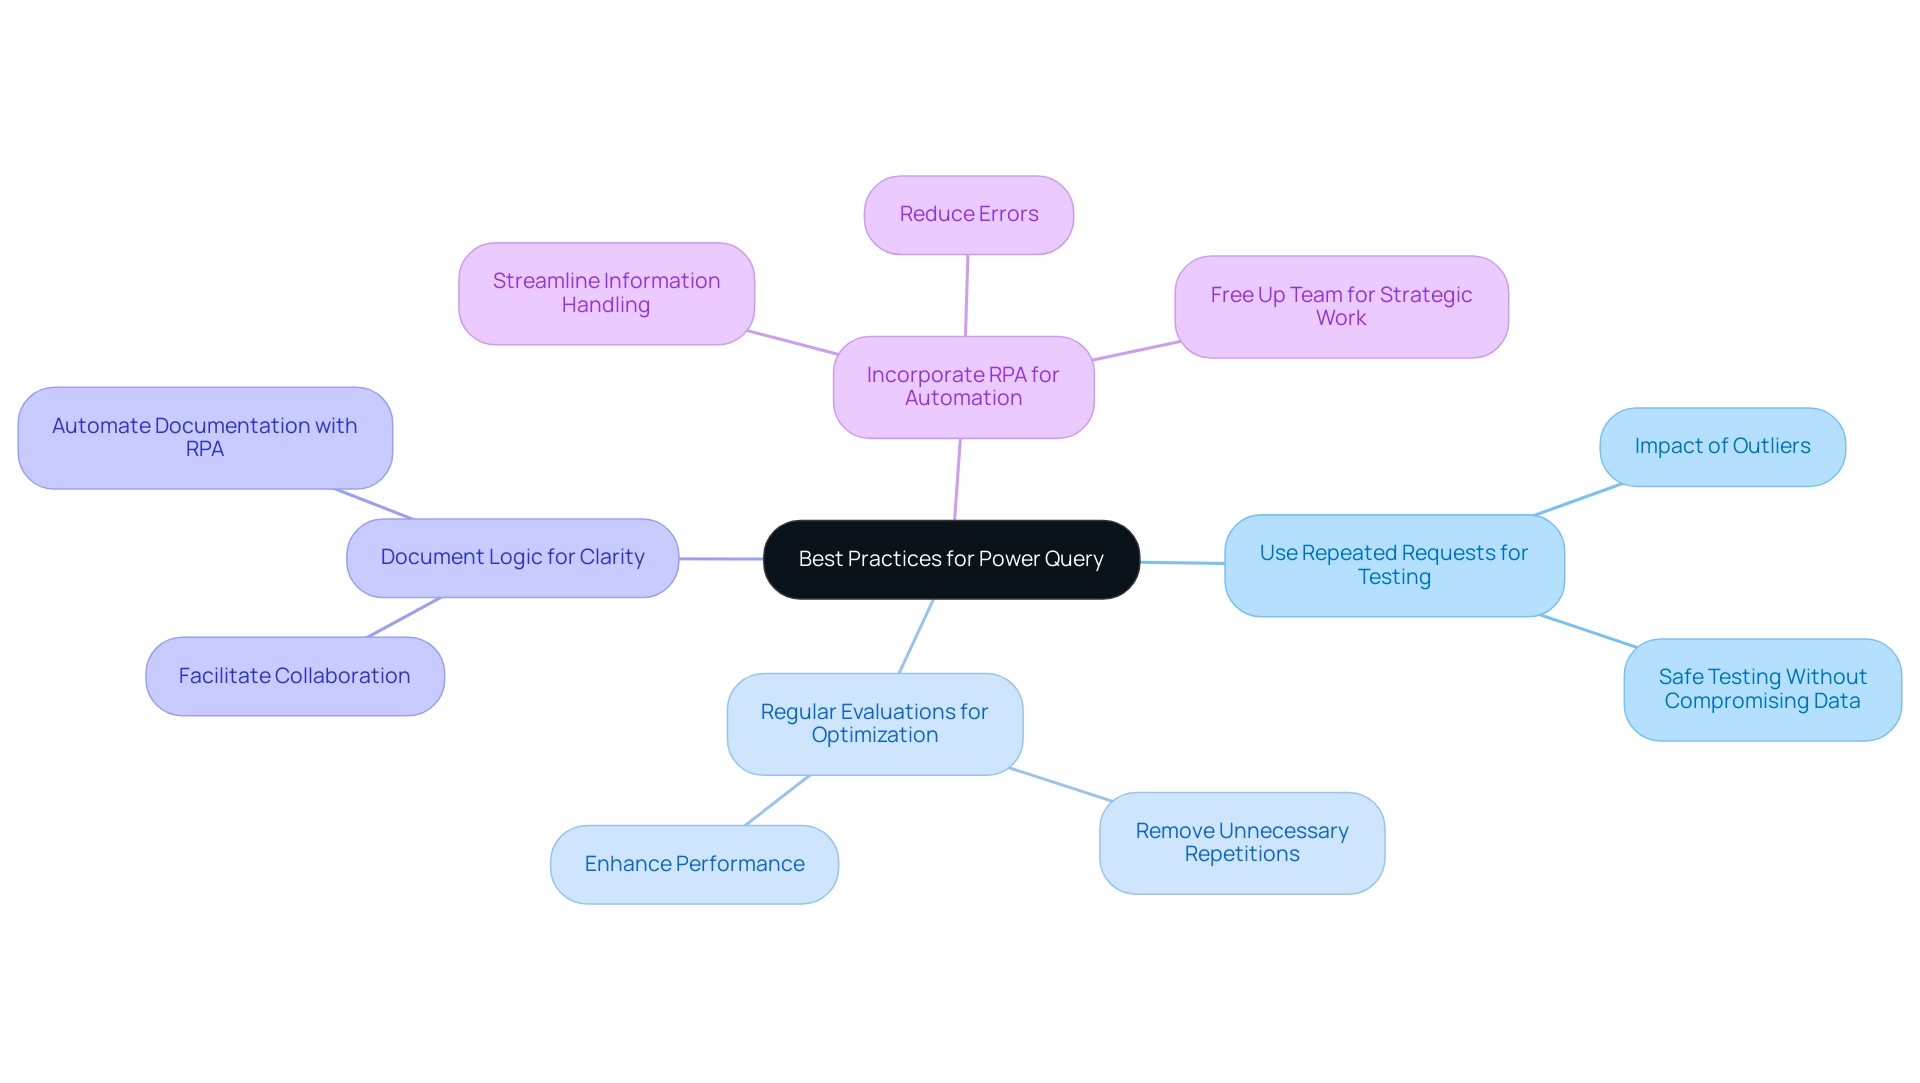
To enhance the efficiency of requests in Power Query, understanding the differences in reference vs duplicate power query is essential, particularly when utilizing reference requests for dynamic reports that necessitate real-time updates, ensuring your information remains current and pertinent. For instance, in analyzing vehicles sold for over 180 thousand Reais, identifying outliers can significantly influence decision-making and information transformation processes:
- Utilize repeated requests when experimenting with new transformations, allowing for safe testing without compromising the integrity of your original dataset.
- Conduct regular evaluations of your requests to optimize performance, actively removing unnecessary repetitions that may hinder efficiency.
By incorporating Robotic Process Automation (RPA) into this process, you can automate these reviews and streamline information handling, ultimately enhancing operational efficiency while reducing errors and freeing up your team for more strategic, value-adding work.
As Paul Turley, Microsoft Data Platform MVP, observes, “Comparing semantic model performance in Fabric and Power BI: Report & semantic model performance comparing the same information in Import mode, DirectQuery and Direct Lake” can provide insights into optimizing your processes:
- Thoroughly document your logic to enhance clarity and facilitate seamless collaboration with team members. RPA can also play a vital role in automating the documentation processes, ensuring that your team has easy access to updated query logic.
By adhering to these best practices, you can significantly enhance your data transformation processes, leading to improved operational efficiency and more informed decision-making.
Additionally, referencing the case study on Semantic Model Performance in Fabric and Power BI illustrates how performance variances can inform future BI architecture decisions and guide effective RPA implementation, especially when considering reference vs duplicate power query.
Conclusion
Understanding the distinctions between reference and duplicate queries in Power Query is essential for effective data management. Reference queries provide a dynamic link to original datasets, ensuring that reports reflect the most current information. This capability is vital for maintaining a single source of truth and facilitating informed decision-making. Conversely, duplicate queries allow for experimentation with data transformations without affecting the original dataset, making them ideal for safe testing and focused analysis.
The practical applications of these queries are significant:
- Reference queries empower organizations to generate real-time reports.
- Duplicate queries enable in-depth analysis of historical data.
By effectively leveraging both types, organizations can navigate data complexities and enhance their reporting capabilities.
Performance-wise, reference queries are generally more efficient, conserving resources and minimizing load times. Prioritizing these queries can streamline operations and boost productivity. Additionally, the integration of Robotic Process Automation (RPA) can further optimize data handling by automating routine tasks, allowing teams to focus on strategic initiatives.
In conclusion, mastering reference and duplicate queries is a strategic advantage that organizations should embrace. By utilizing the strengths of each query type and implementing best practices, organizations can improve data integrity, drive informed decision-making, and transform challenges into opportunities for growth and innovation.
Overview
Power BI Dataflows and Datasets serve distinct but complementary roles in business intelligence, with Dataflows focusing on data preparation and transformation, while Datasets emphasize data consumption and visualization. The article highlights that Dataflows enable centralized data management and reusability, making them ideal for complex data transformations and collaborative environments, whereas Datasets facilitate ease of use and rapid analysis, essential for effective reporting and decision-making.
Introduction
In the ever-evolving landscape of data management and analytics, organizations are increasingly turning to Power BI as a robust solution for harnessing the power of their data. At the heart of this platform lie Dataflows and Datasets, two essential components that facilitate seamless data preparation, transformation, and analysis. Understanding the distinct roles and benefits of these tools is crucial for any organization aiming to enhance operational efficiency and drive informed decision-making.
As the demand for data-driven insights continues to rise, particularly in a world where self-service analytics is becoming the norm, leveraging Power BI effectively can unlock significant competitive advantages. This article delves into the intricacies of Dataflows and Datasets, exploring their features, best practices, and the strategic scenarios in which they can be most beneficial, all while highlighting the importance of integrating innovative solutions like Robotic Process Automation (RPA) to streamline workflows and optimize performance.
Understanding Power BI Dataflows and Datasets
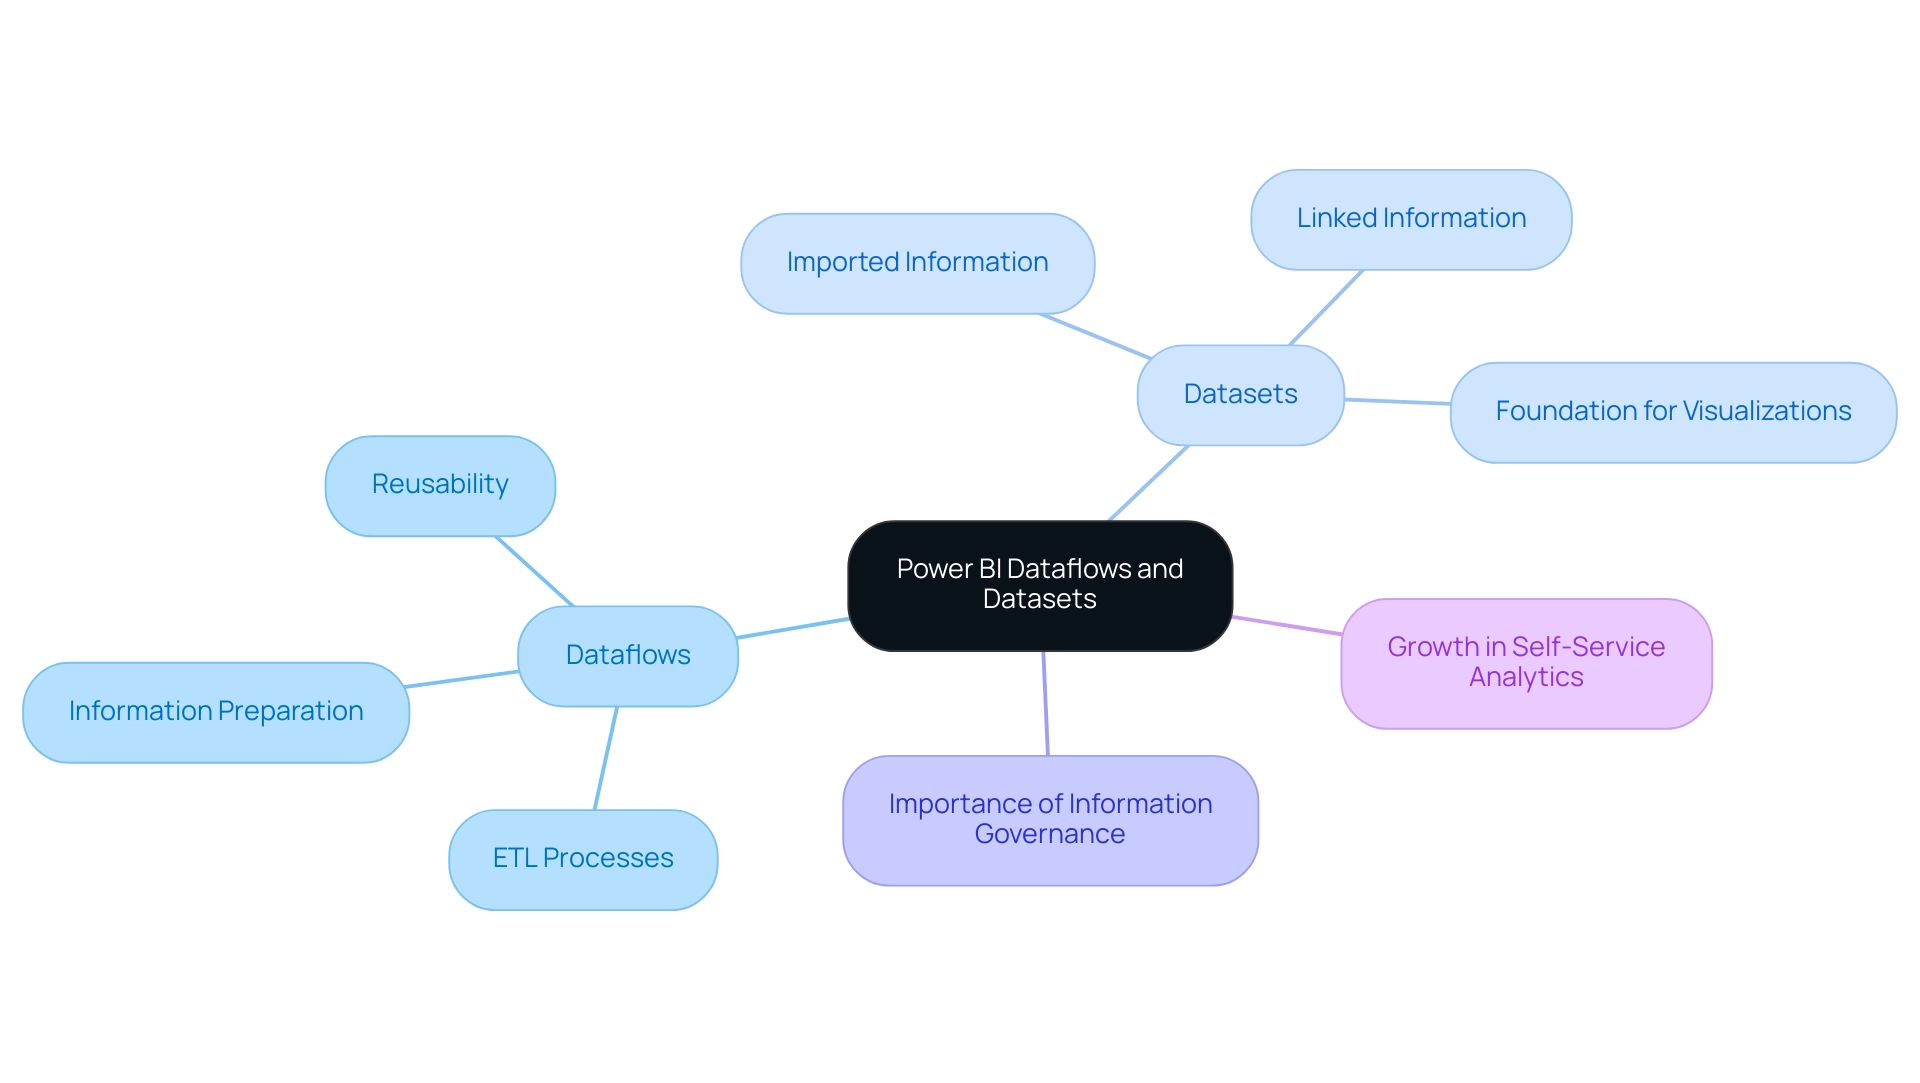
These workflows and datasets are crucial components that improve information management and analytics within the BI environment. Data processes are specifically designed for information preparation and transformation, enabling users to connect to a variety of sources, cleanse, and shape the information prior to its entry into Power BI. This centralized method of managing ETL (Extract, Transform, Load) processes not only streamlines workflows but also encourages reusability across various reports and dashboards, ultimately enhancing efficiency in management.
As the need for information engineers is projected to grow at a rate of 50% annually, effective tools like Dataflows become increasingly crucial for organizations aiming to meet this requirement.
In contrast, collections consist of groups of information that have either been imported or linked to within Power BI. These datasets serve as the foundation for developing visualizations and reports, organizing the information in a way that is easily analyzable by users. While the discussion of Power BI dataflow vs dataset emphasizes the essential preparatory work needed for effective data management, Datasets focus on the consumption and analysis of that data.
Together, they create a powerful synergy within the BI framework, enhancing the overall effectiveness of data-driven decision-making. As Saumya Dubey noted, “Choosing between Power BI and Tableau depends on your organisation’s specific needs and budget,” highlighting the importance of understanding these tools within broader BI strategies.
Moreover, as we navigate the challenges of today’s information-rich environment, organizations can unlock the power of Business Intelligence to transform raw information into actionable insights, enabling informed decision-making that drives growth and innovation. Investing in solutions like RPA can further enhance operational efficiency by streamlining manual processes and freeing up teams for more strategic work. Additionally, with the anticipated growth in self-service analytics—whereby 50% of analytics queries will be generated using search or natural language processing by 2023—understanding the differences between Power BI Dataflow vs Dataset has never been more critical.
Organizations that prioritize information governance and real-time analytics are poised to outperform their peers financially, underscoring the relevance of these tools in modern BI practices. To back these initiatives, our services encompass the 3-Day BI Sprint for quick report generation and the General Management App for extensive management solutions, ensuring that businesses can effectively utilize the full capabilities of their information.
Key Features and Benefits of Power BI Dataflows vs. Datasets
When evaluating Power BI Dataflows and Datasets, several crucial features and benefits stand out:
- Dataflows:
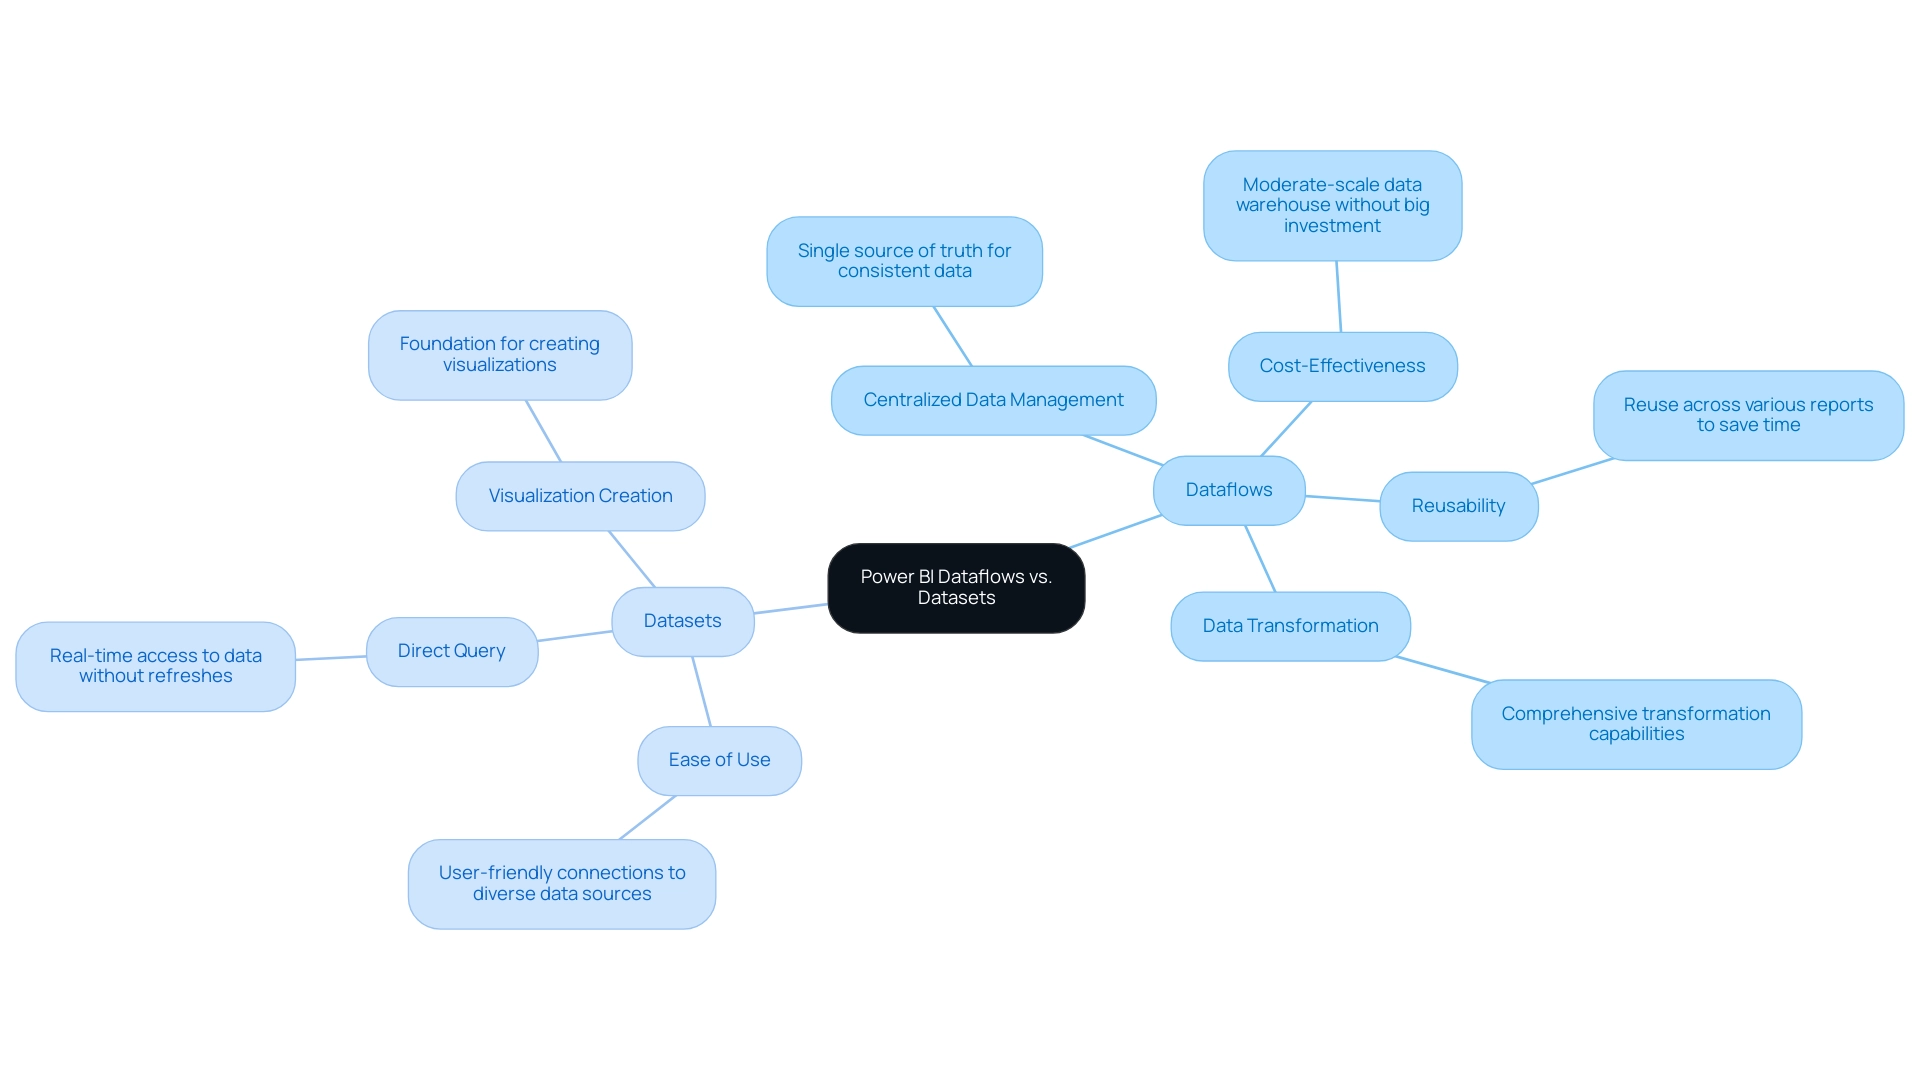
- Centralized Data Management: Dataflows establish a single source of truth, ensuring consistent data across multiple reports. This centralized approach enhances data governance and quality, vital for fostering a robust data culture, which is essential for overcoming challenges in leveraging insights from Power BI dashboards as highlighted in Matthew Roche’s blog series on building a data culture.
- Cost-Effectiveness: Dataflows can create a moderate-scale data warehouse without a substantial investment, making them a financially viable option for organizations looking to optimize their data management and improve operational efficiency through Business Intelligence.
- Reusability: Once a Dataflow is established, it can be reused across various reports, significantly reducing redundancy and saving valuable time for teams. This capability is particularly beneficial in multi-developer environments where collaboration is key, addressing the challenge of time-consuming report creation.
-
Data Transformation: Dataflows provide comprehensive transformation capabilities that efficiently handle complex data preparation tasks before integration with Power BI. This functionality is crucial for organizations aiming to streamline their data management processes without substantial investment, thus facilitating informed decision-making.
-
Datasets:
- Ease of Use: Datasets are designed for user-friendliness, allowing for straightforward connections to diverse data sources. This accessibility promotes quick analyses, making it easier for stakeholders to derive insights rapidly, addressing the lack of actionable guidance.
- Direct Query: Utilizing Direct Query mode, Datasets enable real-time access to data without necessitating data refreshes. This feature is crucial for organizations requiring up-to-the-minute information to inform their decisions, thereby enhancing operational efficiency.
- Visualization Creation: Serving as the foundation for creating visualizations, Datasets are essential for report building. They enable users to showcase information insights efficiently, converting unprocessed information into practical intelligence that fosters growth and innovation.
Integrating RPA solutions with BI tools and collections can further improve operational efficiency by automating information gathering and reporting procedures. This synergy not only addresses staffing shortages but also mitigates the impact of outdated systems, allowing organizations to focus on strategic initiatives. In essence, while data pipelines excel in data preparation and reusability, enabling organizations to manage their data landscape efficiently, the discussion of Power BI Dataflow vs Dataset emphasizes that Datasets focus on ease of use and visualization capabilities, making them indispensable for effective reporting and analytics.
As Paul Turley, a Microsoft Data Platform MVP, notes, comparing the performance of semantic models in both Fabric and Business Intelligence—specifically in Import mode, direct query, and Direct Lake—illustrates the nuanced advantages each approach brings to business intelligence.
When to Use Power BI Dataflows Over Datasets
Power BI Dataflows present unique advantages in several critical scenarios that align with the pressing need for operational efficiency and actionable insights, particularly when integrated with Robotic Process Automation (RPA):
-
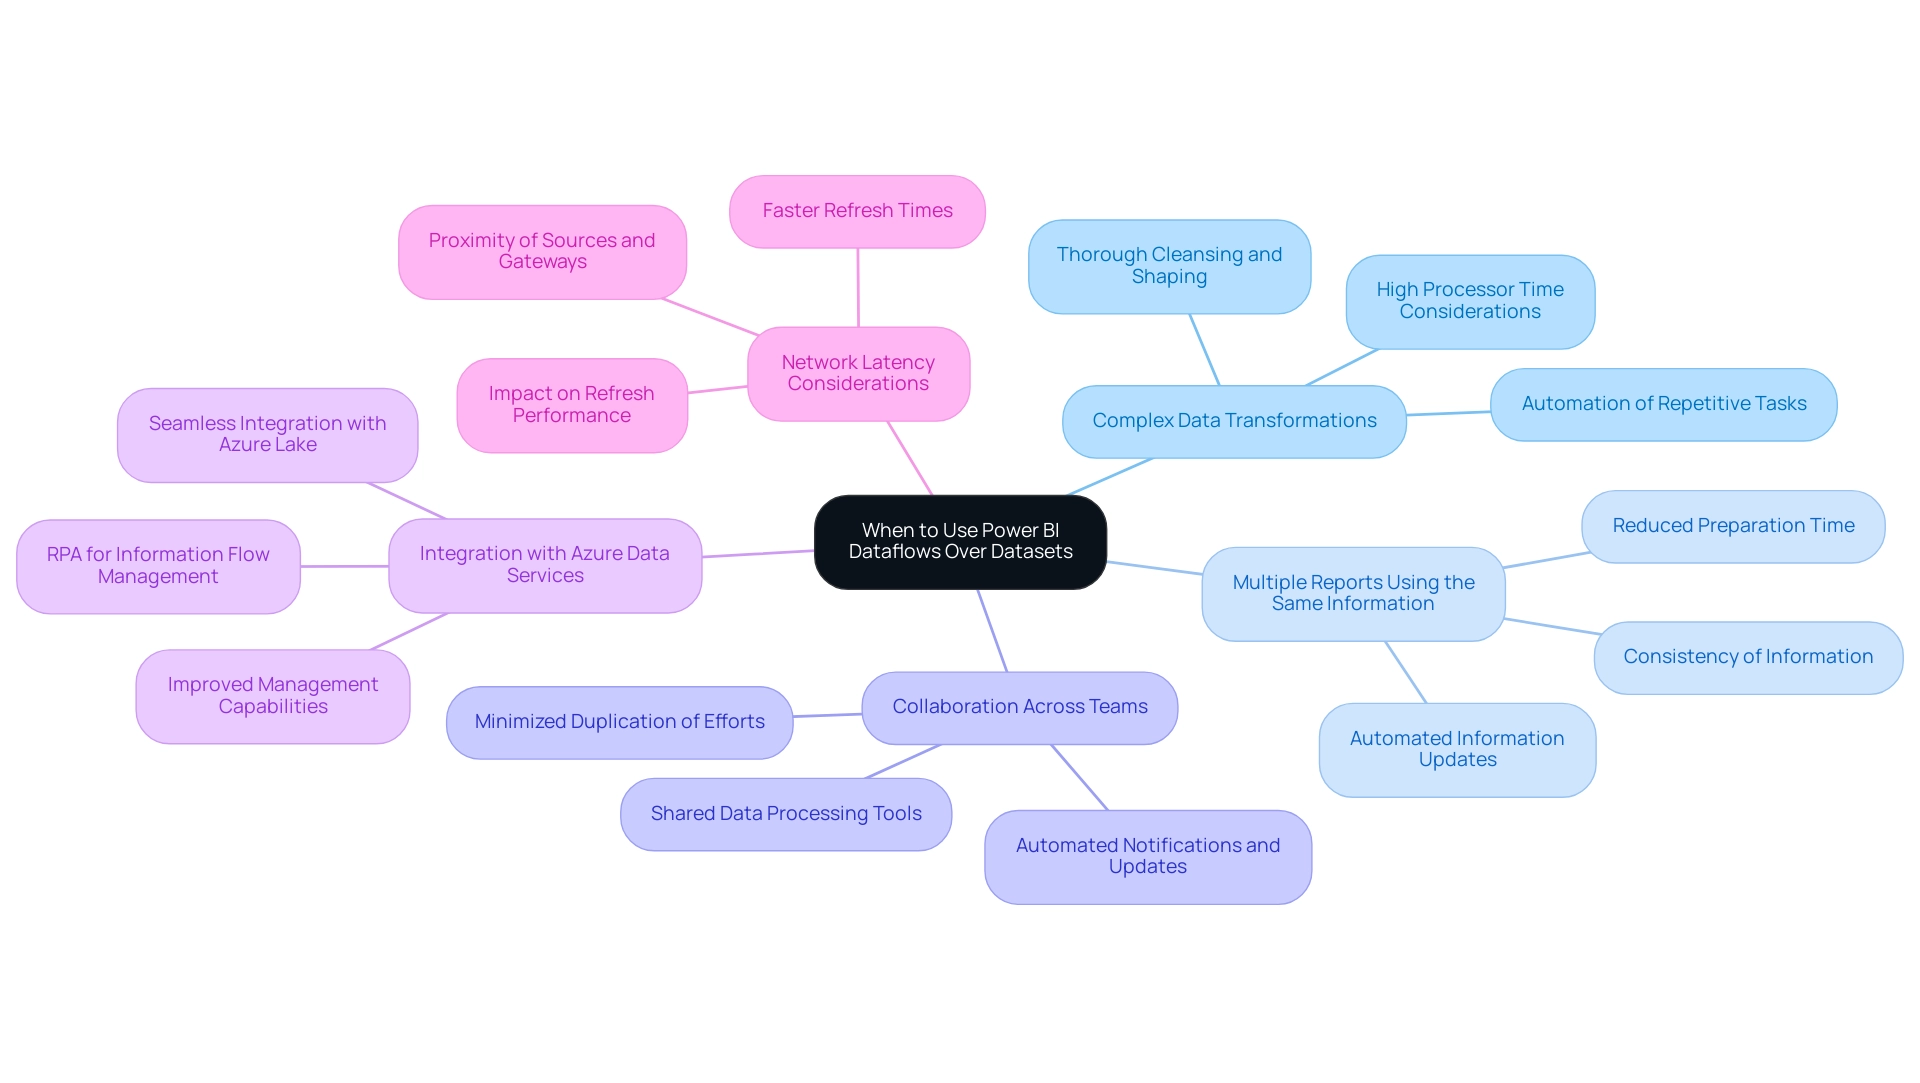
Complex Data Transformations: For organizations grappling with intricate data transformation requirements, such systems provide a powerful framework that allows for thorough cleansing and shaping of data prior to reporting. This capability is pivotal, especially when considering the powerbi dataflow vs dataset, as high processor time can result from the number of applied steps or the type of transformations being made. As Nikola aptly states, “You create a dataflow in the Power BI Service!” emphasizing the practicality and efficiency of utilizing data streams in overcoming challenges associated with time-consuming report creation. Furthermore, RPA can automate repetitive information preparation tasks, enhancing overall efficiency.
-
Multiple Reports Using the Same Information: When various reports rely on the same foundational information, understanding the powerbi dataflow vs dataset allows for the creation of a single entity that can be leveraged across multiple reports. This not only ensures consistency of information but also significantly reduces the time spent preparing information for reporting, addressing issues of inconsistencies that can hamper decision-making. The integration of RPA can further streamline this process by automating information updates and report generation, which can be compared to the concepts of Power BI dataflow vs dataset.
-
Collaboration Across Teams: In collaborative environments where different teams manage various reports, shared data processing tools enhance teamwork by providing access to a shared and prepped dataset, especially when considering powerbi dataflow vs dataset. This approach minimizes duplication of efforts and fosters synergy among departments, facilitating smoother operational processes. RPA can also support collaboration by automating notifications and updates across teams, which can be compared to the differences in powerbi dataflow vs dataset.
-
Integration with Azure Data Services: Organizations that utilize Azure services for storage can take full advantage of Dataflows, particularly when comparing powerbi dataflow vs dataset, as they seamlessly integrate with Azure Lake and other cloud platforms, thereby improving management capabilities and driving growth through better insights. RPA can assist in managing information flows between different services, ensuring seamless operations.
-
Network Latency Considerations: Additionally, it is important to recognize that network latency can impact refresh performance, as illustrated in the case study titled “Network Latency and Dataflow Performance.” Reducing latency by placing sources and gateways near the Power BI cluster can lead to quicker refresh times and an enhanced user experience, which is crucial for prompt decision-making in the context of powerbi dataflow vs dataset.
In contrast, when evaluating powerbi dataflow vs dataset, data collections are ideal for rapid analyses and straightforward reporting tasks, particularly when the information does not necessitate extensive preparation. This distinction is crucial for optimizing operational efficiency and ensuring that resources are allocated effectively in your reporting processes, ultimately empowering your organization to harness the full potential of Business Intelligence. Companies that find it difficult to derive valuable insights risk lagging behind their rivals, making the integration of RPA and data processes not only advantageous but crucial for ongoing growth and innovation.
Limitations and Challenges of Power BI Dataflows and Datasets
While Power BI Dataflows and Datasets provide substantial advantages for business intelligence processes, they are not without their limitations that can impact operational efficiency:
- Data flows:
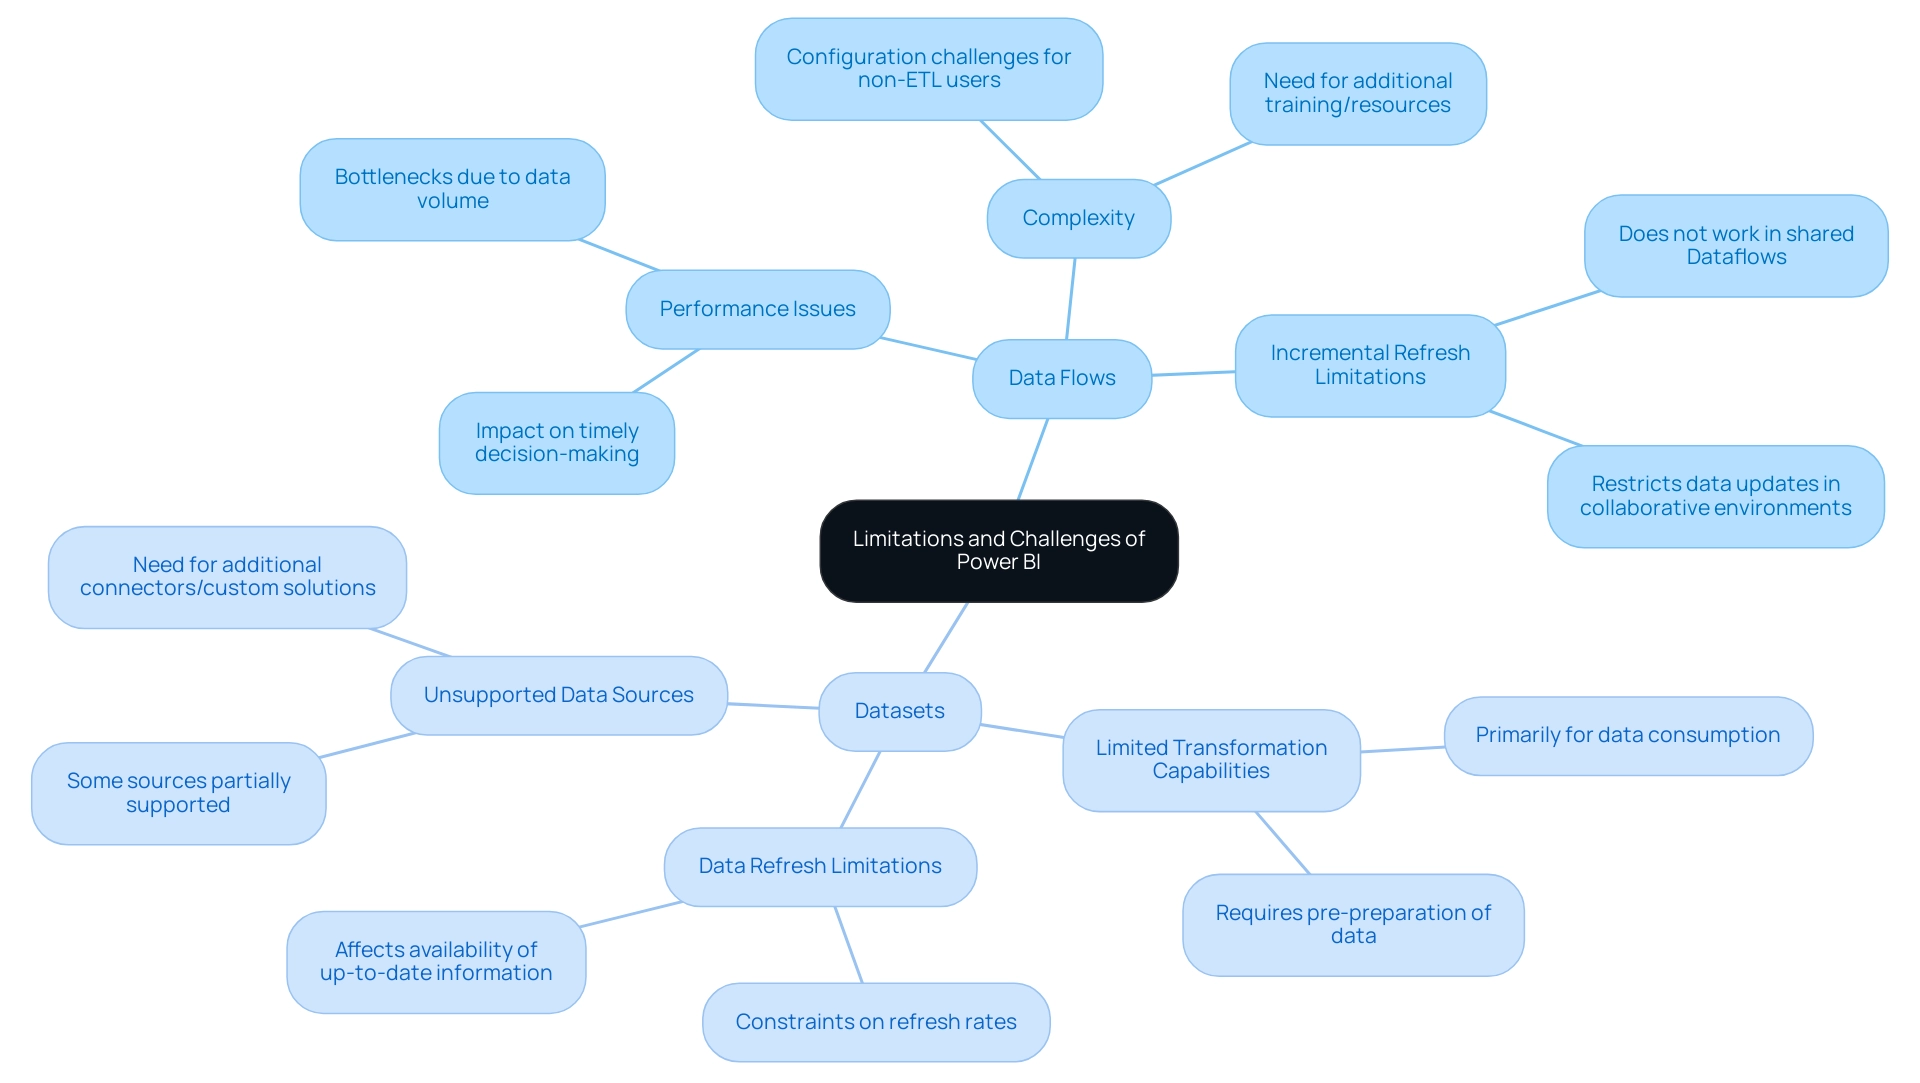
- Complexity: The configuration of Data flows can pose challenges, especially for users who are not well-versed in ETL (Extract, Transform, Load) processes. This complexity often necessitates additional training or resources, straining operational efficiency, especially in environments overwhelmed by AI options. Tailored AI solutions can simplify these processes, offering user-friendly interfaces and guided setups that reduce the learning curve.
- Performance Issues: Performance bottlenecks may arise due to data volume and transformation intricacies, hindering the speed of data processing and impacting timely decision-making.
-
Incremental Refresh Limitations: Incremental refresh does not work in shared Dataflows, significantly restricting data updates and management efficiency in collaborative environments.
-
Datasets:
- Limited Transformation Capabilities: Datasets are primarily for data consumption, lacking the robust transformation capabilities of Dataflows. This limitation may require organizations to prepare their information in advance, complicating workflows and making it harder to harness actionable insights. Tailored AI solutions can enhance transformation capabilities, allowing for more flexible data preparation.
- Data Refresh Limitations: Datasets often face constraints on refresh rates, particularly with large data volumes, affecting the availability of up-to-date information for analysis and decision-making. Custom solutions can help mitigate these limitations by optimizing refresh strategies.
- Unsupported Data Sources: Some data sources may be unsupported or only partially supported by Power Query, necessitating additional connectors or custom solutions, complicating the data integration process further.
Recognizing these limitations is vital for organizations aiming to effectively strategize their data management efforts and mitigate risks associated with these challenges. Mark Smallcombe’s insights emphasize the necessity of leveraging strengths while navigating the complexities inherent in BI:
In my extensive work with Query, I’ve encountered various limitations and challenges, but also numerous ways to leverage its strengths effectively.
Furthermore, comparing BI to Tableau reveals that while BI is generally more affordable and user-friendly for non-technical users, Tableau offers superior performance with large datasets and broader compatibility. Understanding these dynamics will empower organizations to navigate the overwhelming AI landscape and optimize their use of Business Intelligence tools for informed decision-making and operational efficiency. Additionally, integrating Robotic Process Automation (RPA) can further streamline workflows, reduce manual tasks, and enhance overall operational efficiency, allowing teams to focus on strategic initiatives.
Best Practices for Utilizing Power BI Dataflows and Datasets
To fully harness the potential of Power BI data connections and Datasets, implementing the following best practices is essential:
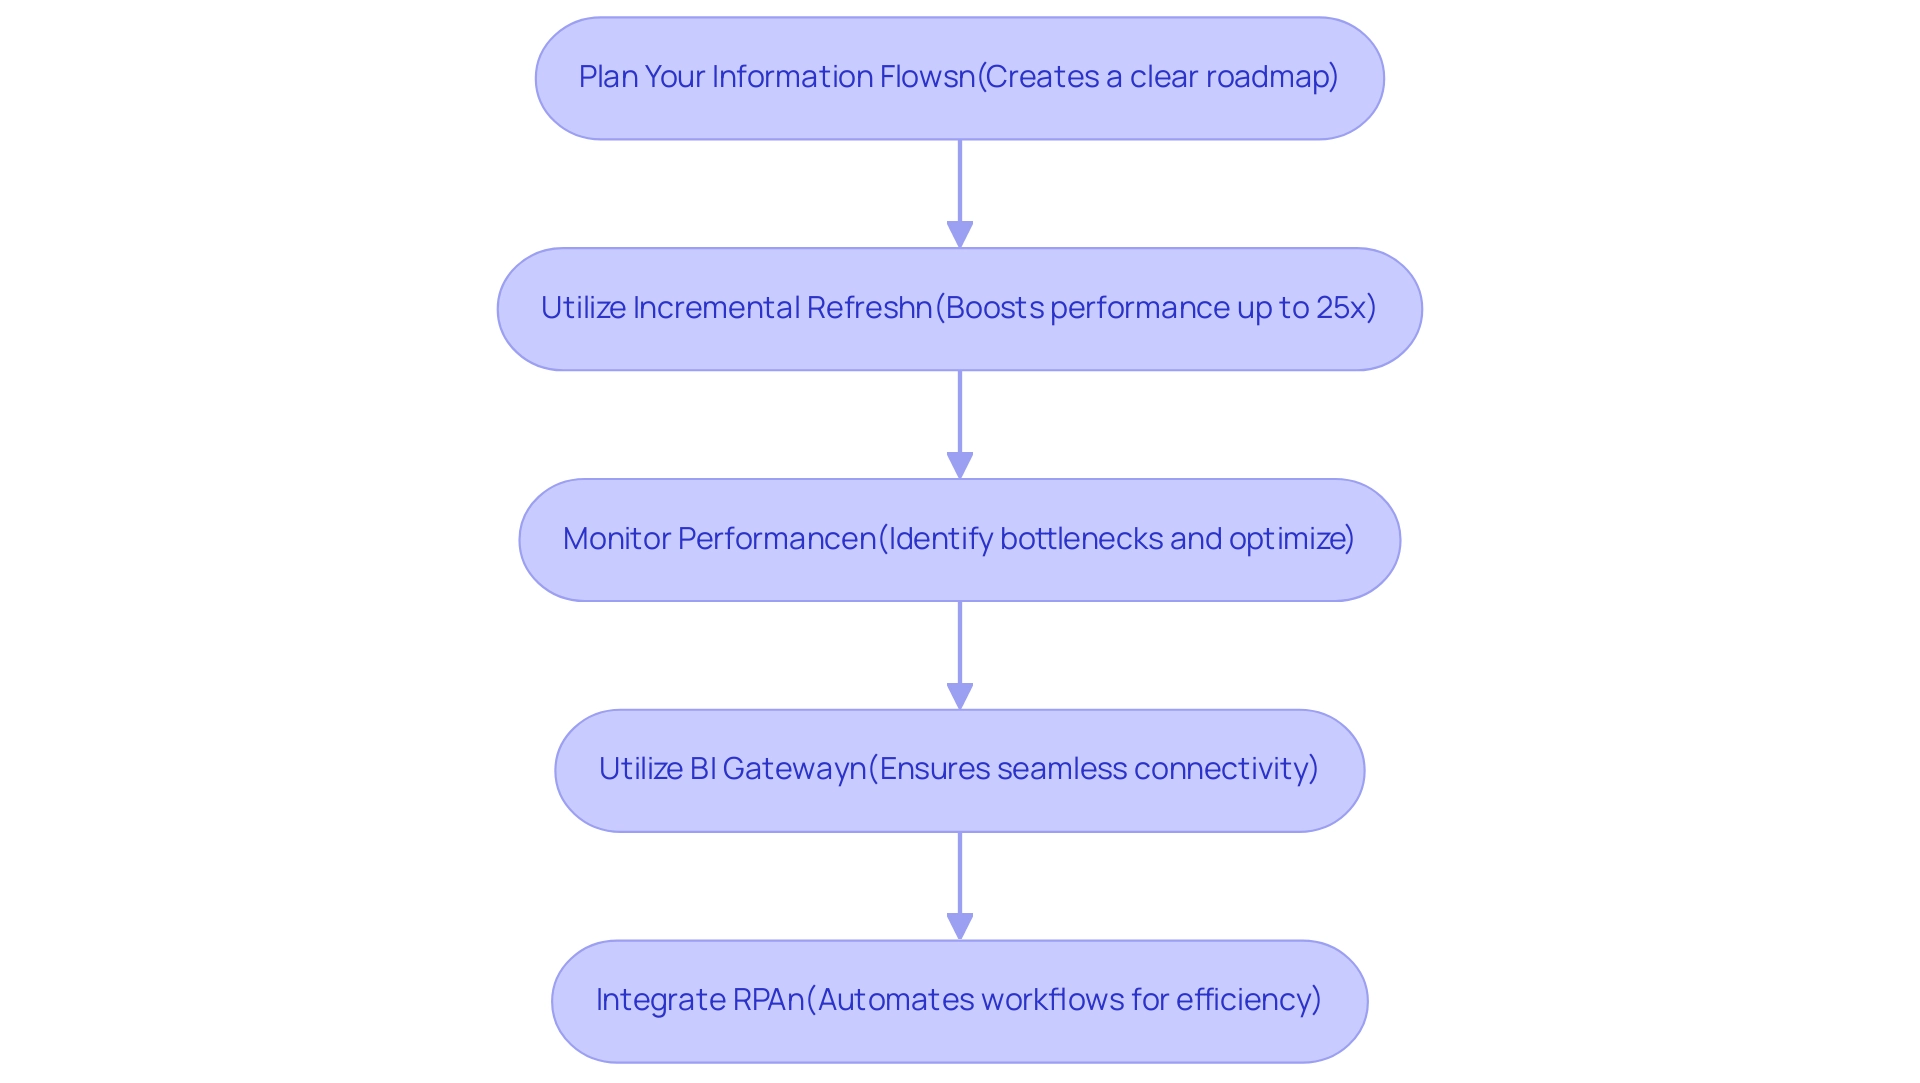
- Plan Your Information Flows: A strategic approach begins with outlining your sources and necessary transformations. This preparatory phase is crucial as it creates a clear roadmap that streamlines the creation process and enhances overall efficiency in governance.
- Utilize Incremental Refresh: For extensive datasets, the implementation of incremental refresh can significantly boost performance. This method reduces load times during information updates, allowing for smoother operations and quicker access to fresh insights. In fact, utilizing enhanced compute can potentially improve dataflow performance up to 25x, making this practice even more beneficial.
- Monitor Performance: Consistent performance tracking of both processes and collections is vital. By regularly evaluating these elements, organizations can swiftly identify bottlenecks and optimize configurations, ensuring that information management remains agile and effective. Maintaining comprehensive documentation of your Power BI dataflow vs dataset is critical. Clear annotations regarding their purposes and transformation processes facilitate collaboration among team members and streamline future updates, which is a key aspect of effective information governance when evaluating Power BI dataflow vs dataset.
- Utilize BI Gateway: To ensure uninterrupted refreshes and seamless connectivity between on-premises sources and BI services, utilizing the BI Gateway is highly recommended. This tool enhances the integration of diverse information streams, promoting a more cohesive environment.
By adhering to these best practices, organizations can significantly improve their management capabilities, resulting in enhanced reporting and more informed decision-making processes. Furthermore, the 3-Day Business Intelligence Sprint allows teams to create fully functional, professionally designed reports quickly, enabling a focus on actionable insights rather than the intricacies of report creation. For example, a production firm successfully optimized its procedures by centralizing its components list through Dataflows, decreasing information retrieval time by 30%—a testament to the transformative effect of effective planning and execution in BI environments. Additionally, by integrating RPA into these practices, organizations can automate manual workflows, further enhancing operational efficiency. RPA can specifically streamline data entry and reporting processes in Power BI, allowing teams to focus on strategic initiatives that drive business growth.
Conclusion
Power BI Dataflows and Datasets are pivotal in optimizing data management and analytics, enabling organizations to transform raw data into actionable insights. Dataflows serve as a powerful tool for data preparation and transformation, streamlining ETL processes and ensuring a centralized source of truth. This capability not only enhances data governance but also promotes reusability across various reports, significantly improving efficiency. On the other hand, Datasets facilitate easy access and analysis of data, serving as the foundation for insightful visualizations and reports. Together, these components create a synergistic effect that empowers organizations to make informed decisions and drive growth.
While both Dataflows and Datasets offer distinct advantages, their effective integration with Robotic Process Automation (RPA) can further enhance operational efficiency. By automating repetitive tasks and ensuring timely data updates, RPA complements the functionalities of Power BI, allowing teams to focus on strategic initiatives that foster innovation. Organizations that prioritize best practices—such as:
- Planning dataflows
- Utilizing incremental refresh
- Monitoring performance
can maximize the benefits of these tools, thereby positioning themselves for success in a data-driven landscape.
In conclusion, embracing Power BI Dataflows and Datasets, coupled with innovative solutions like RPA, equips organizations with the capabilities needed to thrive in an increasingly competitive environment. By harnessing the full potential of their data, businesses can not only enhance operational efficiency but also unlock significant competitive advantages that drive sustained growth and informed decision-making. As the demand for data-driven insights continues to rise, the strategic application of these tools is essential for organizations aspiring to lead in their respective industries.
Overview
Merging columns in Power BI involves a systematic approach that enhances data analysis and reporting efficiency by creating cohesive representations of related data points. The article outlines a step-by-step guide for merging columns, emphasizing the importance of planning, maintaining data quality, and utilizing either DAX or Power Query methods to address common challenges, ultimately leading to improved decision-making and operational efficiency.
Introduction
In the realm of data analysis, the ability to effectively merge columns in Power BI stands as a transformative skill that can significantly enhance operational efficiency and reporting accuracy. This technique not only streamlines the process of data management but also addresses common hurdles such as time-consuming report generation and data inconsistencies that often plague organizations.
By mastering column merging, users can create a more cohesive view of their datasets, empowering them to derive actionable insights that drive informed decision-making.
With a step-by-step guide, practical troubleshooting tips, and best practices at hand, this article delves into the nuances of column merging, equipping professionals with the tools they need to optimize their data analysis workflows and elevate their strategic initiatives.
Understanding Column Merging in Power BI
The technique of powerbi merge columns in Power BI is powerful as it significantly improves analysis and streamlines reporting processes. This approach tackles typical difficulties encountered by operations directors, such as:
- Time-consuming report generation
- Inconsistencies in information
- The absence of actionable guidance
By using Power BI to merge columns, you can create a cohesive representation of related data points, which not only improves clarity but also facilitates quicker insights and informed decision-making.
For example, merging first and last names or consolidating street address components can simplify your datasets, allowing for a more intuitive view. As Douglas Rocha, a seasoned software engineer, aptly puts it, Hope I’ve helped you in some way and see you next time! This reflects the collaborative spirit of learning that comes with mastering tools like BI.
Furthermore, the clustering capability in BI assists in pattern identification, improving your analysis techniques even more. With recent updates enabling integration with external statistical tools like R or Python, users can leverage advanced analysis techniques for richer insights. A significant example of BI’s capabilities is illustrated in the case study titled ‘Automated Insights with BI,’ where the Analyze feature provides automated insights for selected points, allowing users to quickly understand reasons behind changes and compare distributions across categories.
This connection illustrates how BI tackles the challenges of report creation and information inconsistencies while offering actionable insights. This not only enhances the overall analysis procedure but also enables you to refine your models through powerbi merge columns, positioning yourself for greater operational efficiency and strategic advantage. Embrace these BI services to transform your reporting and gain actionable insights that drive success.
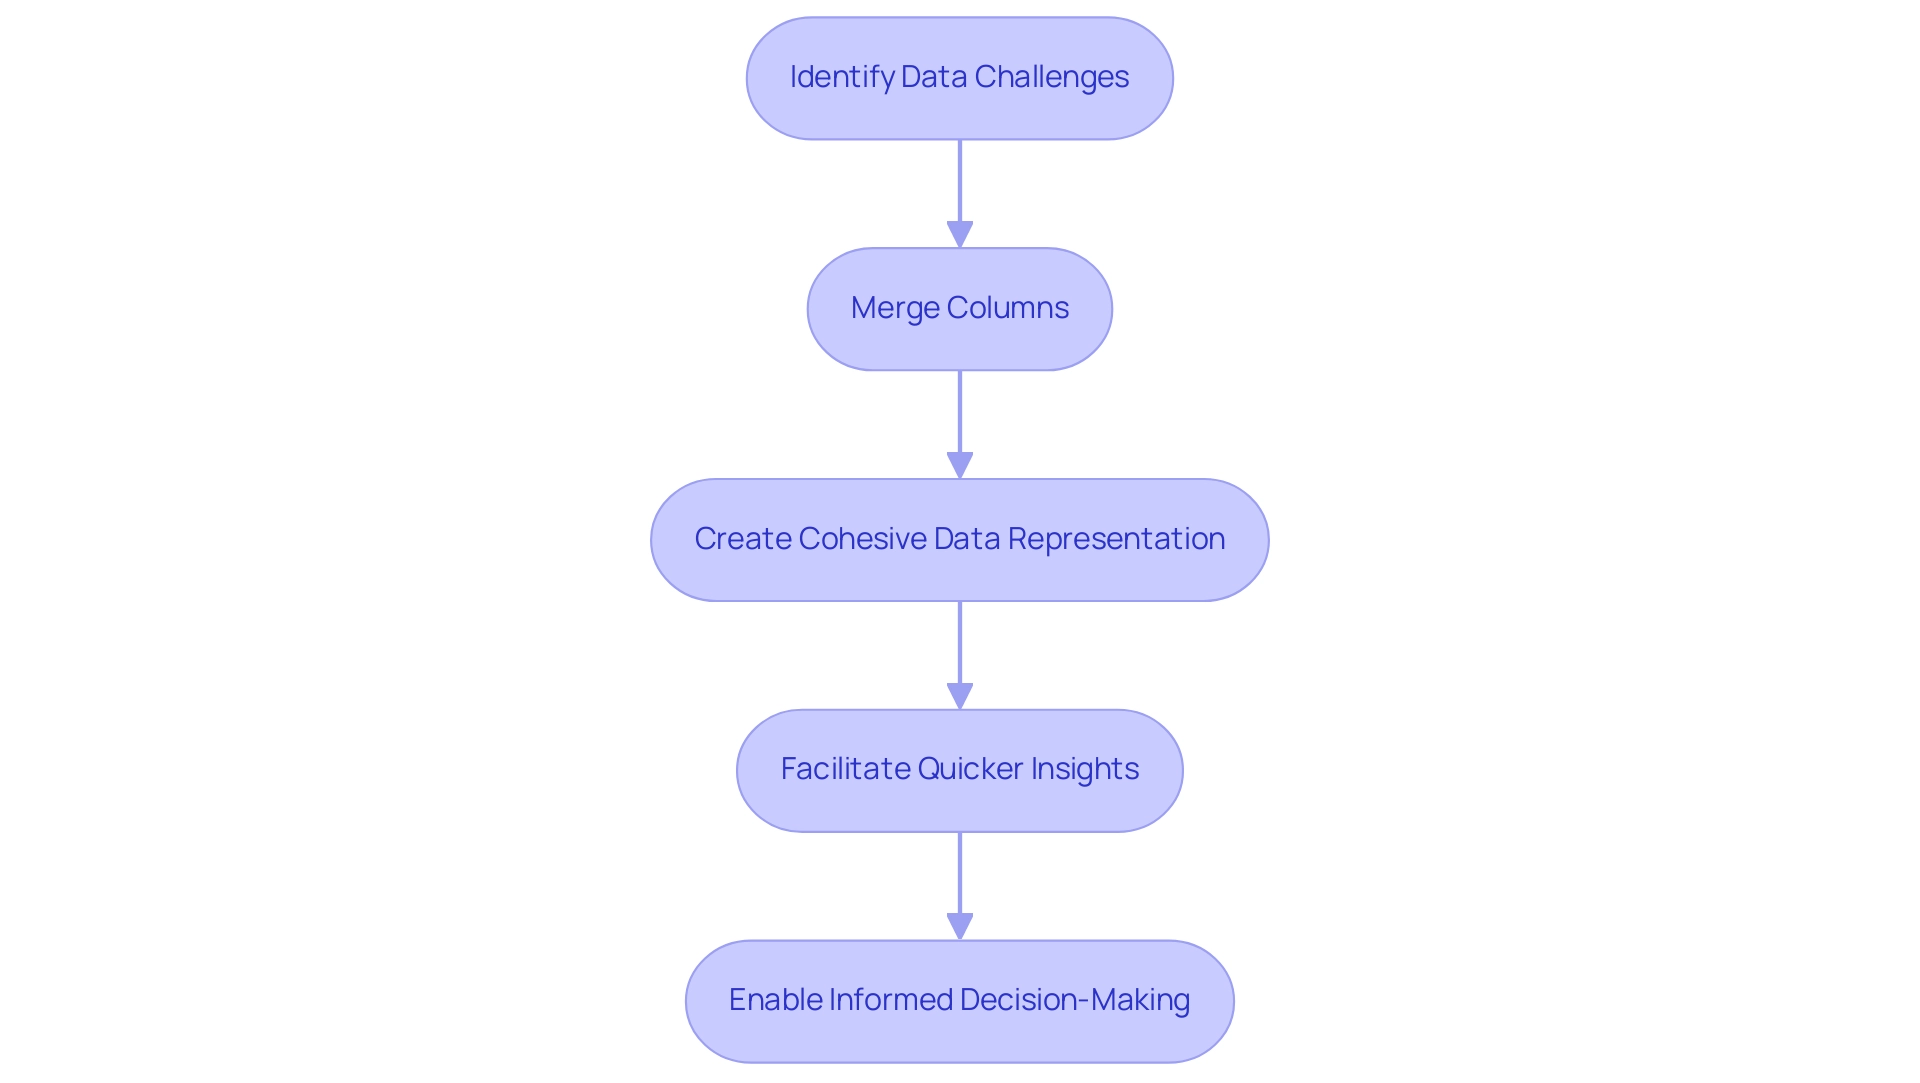
Step-by-Step Guide to Merging Columns in Power BI
Using Power BI merge columns to combine fields in BI is a strong method that can greatly improve your analysis process and promote operational efficiency. To effectively execute this, follow these steps:
- Open Power BI Desktop: Begin by launching the application and loading your desired data model.
- Navigate to the Data View: Click on the ‘Data’ icon located on the left sidebar to access your tables.
- Select the Sections: While holding down the Ctrl key, click on each section you wish to merge. This enables you to select several fields efficiently.
- Merge Sections: Right-click on one of the selected sections and choose ‘Merge Sections’ from the context menu.
- Choose a Separator: In the dialog box that appears, select an appropriate separator (such as space, comma, or another character) that will be inserted between the merged values.
- Name the New Field: Designate a name for your recently merged field and click ‘OK’ to finalize the process.
- Review Your Data: It’s crucial to check the newly created section to verify that it meets your expectations and accurately reflects the desired results.
- Apply Changes and Close Power Query Editor: After combining your fields, ensure to apply any adjustments and close the Power Query Editor to utilize the modified information in Power BI Desktop.
Utilizing the powerbi merge columns feature not only simplifies your information but also enhances the efficiency of your analysis, helping you overcome challenges such as time-consuming report creation and inconsistencies. By leveraging tailored AI solutions alongside this technique, businesses can further enhance their analysis capabilities, ensuring that the insights derived are both actionable and aligned with strategic goals. Individuals such as Sarah have saved considerable time through this method, showcasing the practical advantages of combining sections.
As Joleen Bothma emphasizes,
Learn to create, customize, and optimize slicers for better reports.
Furthermore, the right outer join case study demonstrates how combining fields can be advantageous for verifying or cross-referencing information, ensuring that all pertinent details from the secondary table are included. By implementing these steps, you pave the way for better decision-making and data-driven strategies, which are essential in navigating the rapidly evolving landscape of business intelligence.
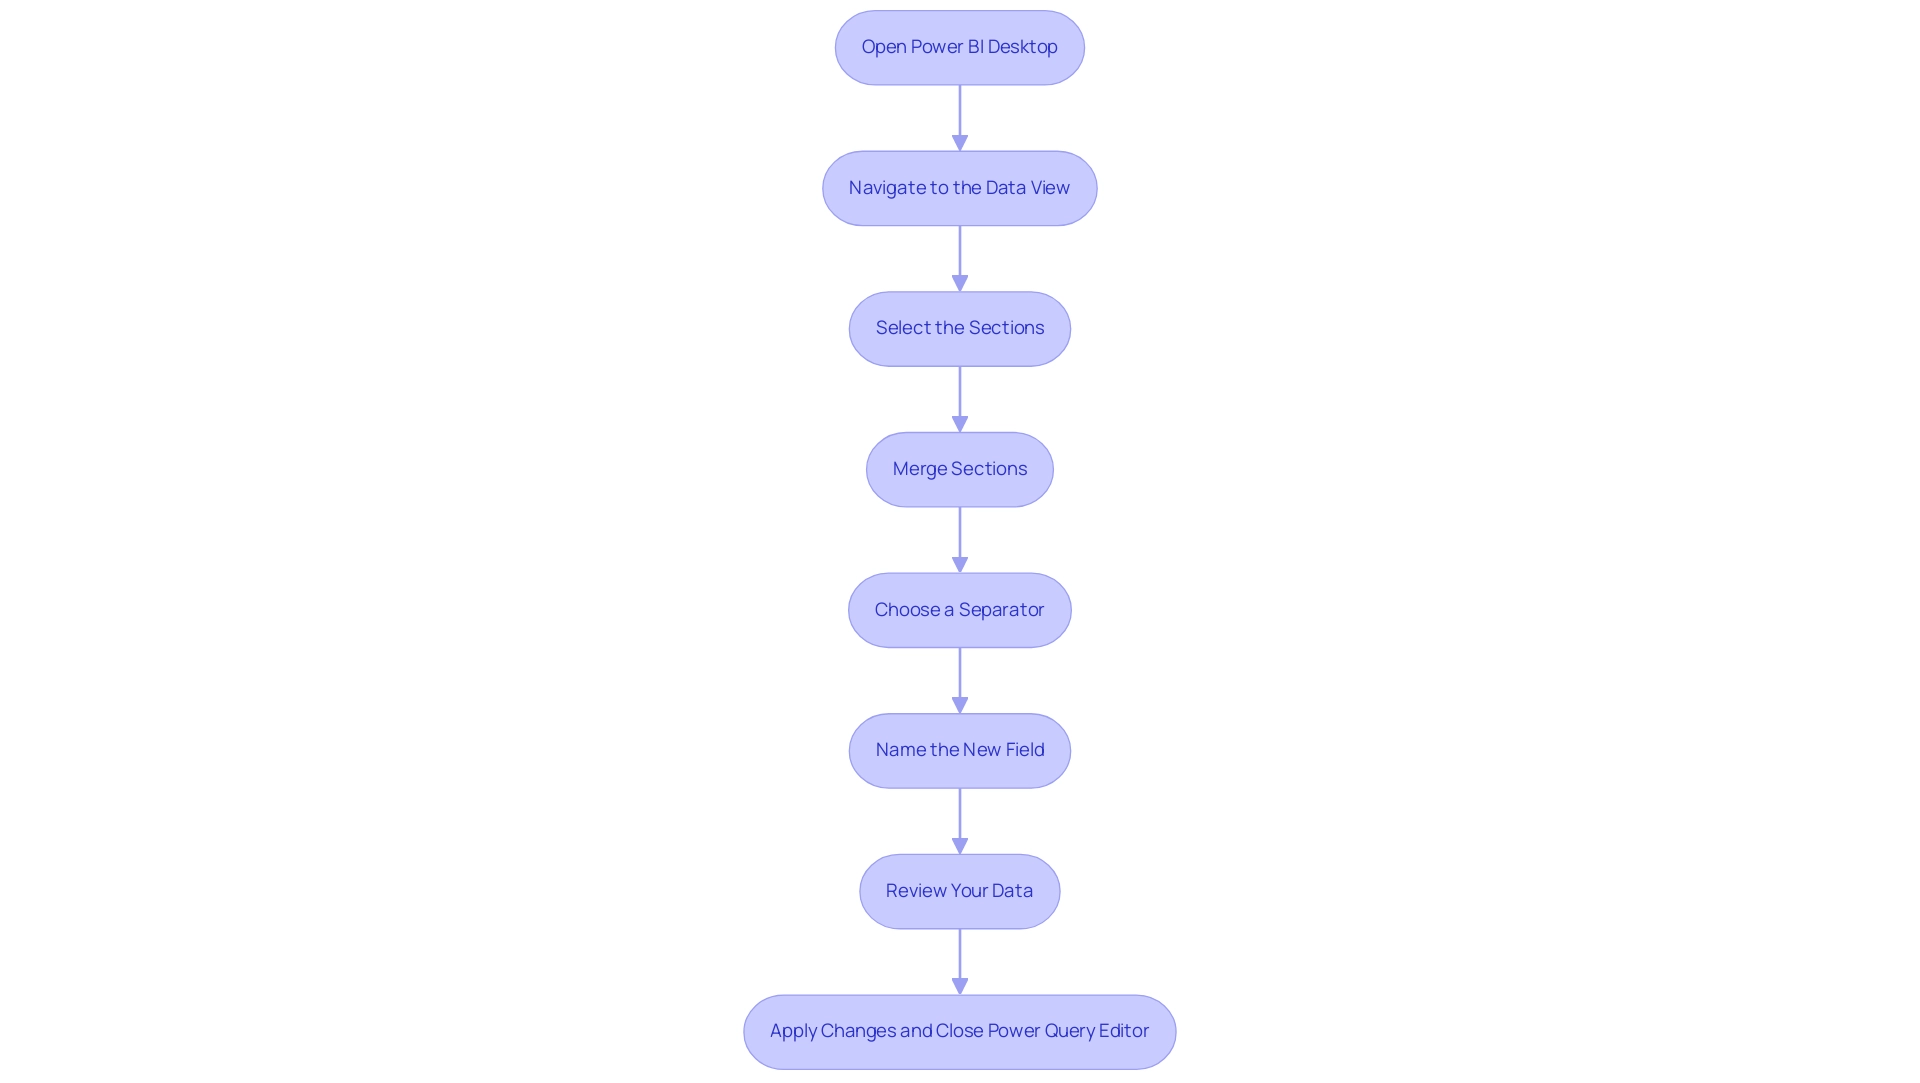
Techniques for Merging Columns: DAX vs. Power Query
When it involves combining fields in Power BI, users can utilize the powerbi merge columns feature, along with two strong options: DAX (Data Analysis Expressions) and Power Query, each providing distinct benefits that can tackle frequent issues in analysis.
- DAX Method: Leveraging DAX allows for the creation of calculated columns where dynamic merging can occur based on specific conditions. For instance, the DAX formula for calculating total sales for the ‘South’ region is
TotalSalesSouthRegion = CALCULATE(SUM(SalesTable[Sales]), SalesTable[CountryRegion] = 'South').
Using functions like CONCATENATE or the & operator, users can effectively merge information right within the model. This method is particularly advantageous for resolving inconsistencies across various reports, as it enables precise calculations tailored to specific conditions, thereby reducing confusion and mistrust in the information presented.
- Power Query Method: In contrast, Power Query offers a more intuitive and visual interface. Users can powerbi merge columns seamlessly within the Query Editor, choosing from various separators and instantly previewing the results. This method excels in batch processing, allowing for manipulation before it enters the model, thus streamlining the overall preparation phase and reducing the time spent on report creation. By ensuring information consistency at this stage, users can foster greater trust in the insights derived from their reports.
The choice between DAX and Query often hinges on the specific use case and individual user preferences. As Ahmed Alsaket aptly puts it, > Clean your information in Query, and analyze it in DAX. Recent insights from the Fabric community, including a review of popular content in 2024, further underscore the importance of selecting the right tool for the task at hand.
For straightforward row-based calculations, Query is usually recommended to simplify the process, while DAX shines in scenarios requiring aggregation across multiple tables. By grasping the advantages of each method and understanding how powerbi merge columns can lead to clearer, actionable insights, users can enhance their analysis workflows, alleviate the challenges of report generation, and improve their reporting abilities with clear guidance on the subsequent steps.
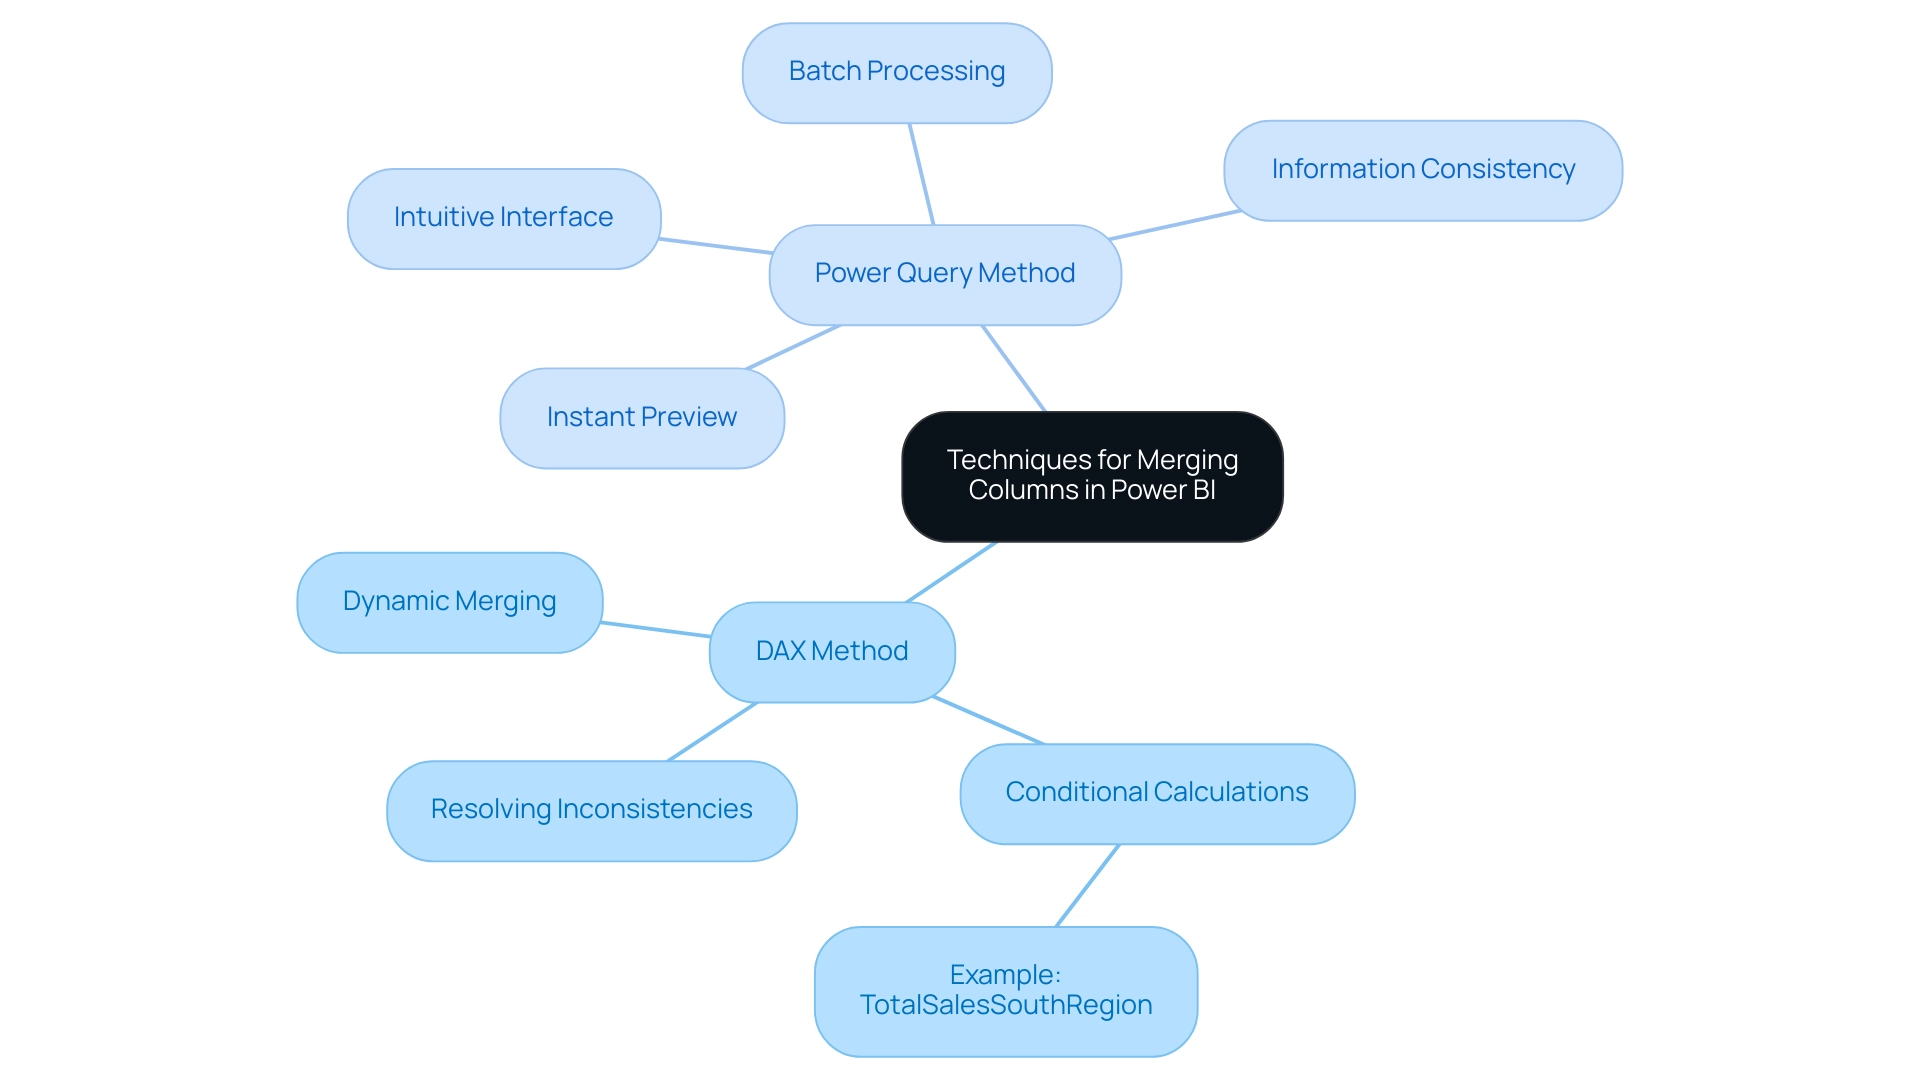
Troubleshooting Common Issues in Column Merging
When users attempt to use Power BI merge columns to combine fields, they may encounter various issues that can obstruct their data analysis efforts. Manual, repetitive tasks can significantly slow down operations, leading to wasted time and resources. Here are some common challenges and practical solutions:
- Unexpected Results: If the merged field does not meet your expectations, first check the selected fields and the chosen separator. It is crucial to ensure there are no blank values in the source columns, as these can significantly impact the output. Given that the ACS provides estimates based on the past 5 years of information collection for areas with populations of at least 7,000, accurate merging is essential for maintaining integrity.
To streamline this process and enhance efficiency, consider implementing Robotic Process Automation (RPA) to automate repetitive tasks related to information cleaning and preparation.
- Information Type Conflicts: Merging columns with incompatible types can lead to errors. For instance, attempting to merge text with numerical values will cause issues.
To prevent this, ensure to convert types appropriately before starting the merge. Imputation can play a vital role here by providing complete datasets and leveraging relationships among variables for better inference. Customizing AI solutions can also assist in recognizing potential type conflicts before they occur, ensuring a smoother integration process.
- Performance Issues: Merging extensive datasets can result in performance slowdowns. To improve efficiency, consider filtering or summarizing your information before combining. This step can drastically enhance the combination process, especially with large datasets.
Furthermore, automated information integration tools, such as Data Ladder’s DataMatch Enterprise, can streamline the merging process by supporting various types and formats, enabling your team to focus on strategic analysis rather than labor-intensive tasks.
- Undoing Merges: If the result of a merge does not align with your objectives, you always have the option to revert changes. In Power Query, you can easily click ‘Undo’ or remove the Power BI merge columns from your model.
This flexibility is crucial in preserving control over your information integration processes. Prof. Dr. Asyraf Afthanorhan, > Documentar o processo de mescla dos dados é essencial para manter o padrao e revisitar sua análise no futuro <. This emphasizes the importance of documenting the integration process for future reference and consistency, which is vital in an era where data-driven decision-making is crucial for competitive advantage.
Additionally, struggling to extract meaningful insights can leave your business at a competitive disadvantage. The case study titled ‘Small Area Estimation for Poverty and Health‘ illustrates the effectiveness of combining survey information with administrative records to enhance estimates of poverty and health outcomes. Such techniques highlight the importance of resolving type conflicts and integration challenges to enhance the accuracy of your analyses, ultimately utilizing Business Intelligence for informed decision-making.
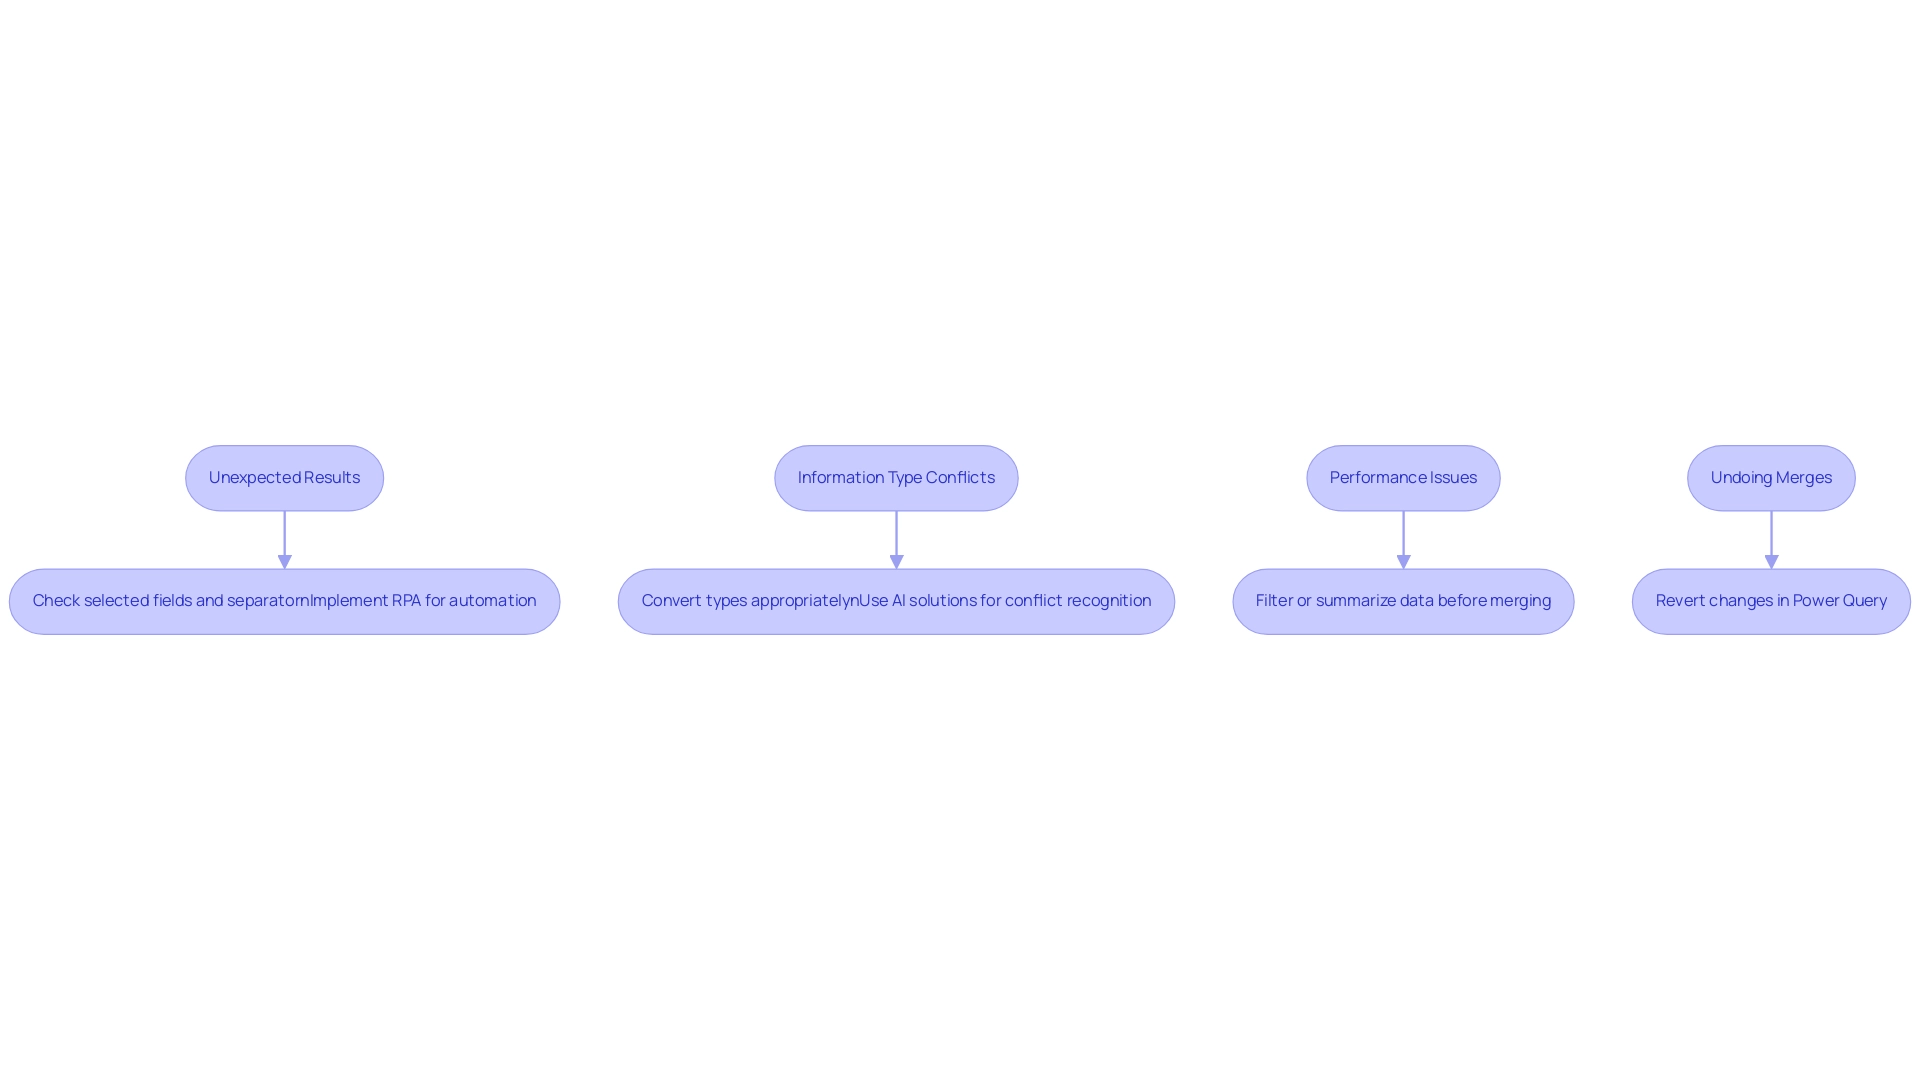
Best Practices for Effective Column Merging in Power BI
To achieve effective combination of segments in Power BI, adhere to the following best practices:
-
Plan Your Information Structure: Before combining, assess how the new feature fits into your current information framework. Ensure that this action aligns with your analytical objectives. This foresight is crucial, as improper planning can complicate your structure and lead to issues down the line. Notably, many-to-many relationships should be avoided, as they can multiply the value of measures and create confusion for end users. This planning phase is vital to prevent the competitive disadvantage that arises from struggling to extract meaningful insights from your data.
-
Use Descriptive Names: Clearly name the merged column to accurately represent its contents. This practice not only enhances clarity within your model but also aids end users in navigating the information more efficiently, preventing confusion that can arise from ambiguous naming conventions.
-
Maintain Data Quality: Prior to merging, it’s essential to check for null or blank values. Addressing these issues beforehand safeguards the integrity of your merged information, ensuring that your analysis is built on a solid foundation. Furthermore, having too many calculated columns can prevent incremental refresh of fact tables, which is a critical aspect of maintaining quality. As emphasized in conversations regarding Business Intelligence, poor information quality can result in misleading insights and diminished confidence in decision-making.
-
Document Changes: Maintain comprehensive documentation of any alterations made during the integration process. This record is invaluable for troubleshooting and streamlining future information management tasks, facilitating easier updates and modifications down the line.
-
Test Merges: Once the integration process is complete, rigorously test the new column within your reports and visualizations. Confirm that it behaves as expected and provides the intended insights. Should any discrepancies arise, be prepared to make necessary adjustments. This iterative approach not only enhances the accuracy of your presentations but also reinforces a culture of continuous improvement in practices.
Additionally, utilizing RPA solutions can help automate repetitive tasks, including aspects of the merging process, allowing your team to focus on analysis rather than manual report creation. RPA can streamline information preparation, ensuring that your reports are generated more efficiently and reducing the time spent on repetitive tasks. As Karel Moijson pointed out during the recent ‘Best of Microsoft Fabric & FabCon’ event, grasping the latest advancements in BI is crucial for effective management of information.
By following these guidelines and leveraging the power of BI and RPA, you can enhance the effectiveness of your data models in Power BI by utilizing powerbi merge columns to ensure they meet the specific analytical needs of your organization.
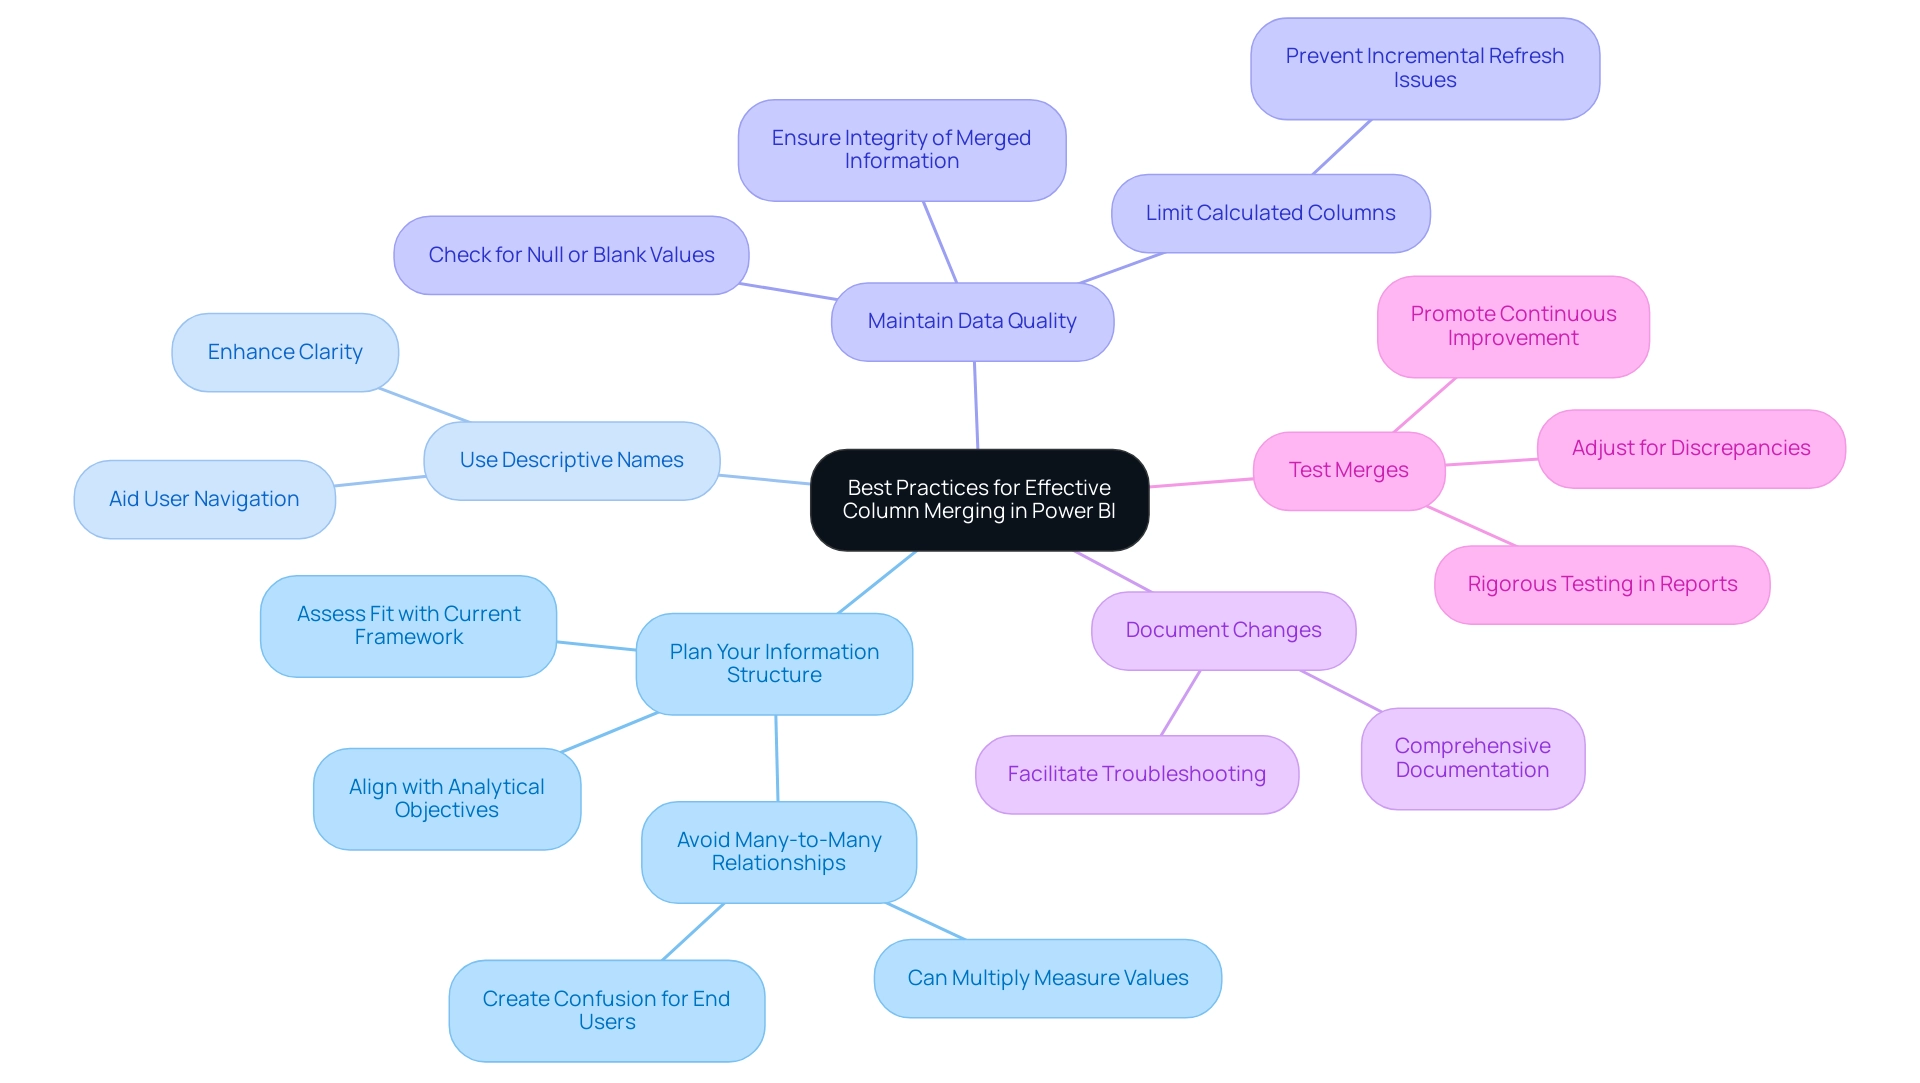
Conclusion
Mastering the art of column merging in Power BI is essential for enhancing data analysis and operational efficiency. By effectively merging columns, users can tackle common challenges such as data inconsistencies and time-intensive report generation. The step-by-step guidance provided not only simplifies the merging process but also empowers professionals to create a unified view of their datasets, leading to clearer insights and more informed decision-making.
Understanding the different methods for merging—whether through DAX or Power Query—enables users to choose the approach that best fits their specific needs. Each method has its unique advantages, allowing for flexibility in handling data and ensuring that reports are both accurate and actionable. Furthermore, troubleshooting common issues and adhering to best practices can significantly streamline the merging process, preventing potential pitfalls that may arise during data integration.
Ultimately, the ability to merge columns effectively transforms how organizations manage and analyze their data. By implementing the techniques and strategies outlined in this article, professionals can not only enhance their reporting capabilities but also drive greater operational efficiency. Embracing these practices positions businesses for success in an increasingly data-driven landscape, where every insight gained can translate into a competitive advantage.
Overview
Power BI datamarts are self-service data warehouses designed to simplify data management and analysis for business users, enabling them to prepare and analyze data from various sources without extensive technical skills. The article supports this by highlighting key benefits such as improved information accessibility, enhanced collaboration, and robust analytics capabilities, which collectively empower organizations to make informed decisions and optimize operational efficiency.
Introduction
In the fast-paced landscape of modern business, organizations are increasingly recognizing the need for robust data management solutions that empower users to make informed decisions. Power BI Datamarts emerge as a pivotal tool in this transformation, offering a self-service data warehouse that simplifies the complexities of data preparation and analysis. By integrating seamlessly with existing data sources and leveraging advanced automation tools like Robotic Process Automation (RPA), businesses can enhance operational efficiency and drive strategic growth.
As industries transition towards data-driven models, understanding how to effectively implement and maximize the benefits of Power BI Datamarts becomes essential for maintaining a competitive edge. This article delves into the definition, benefits, integration capabilities, best practices, and real-world applications of Power BI Datamarts, providing valuable insights for organizations eager to harness the power of their data.
Understanding Power BI Datamarts: Definition and Purpose
Power BI datamarts represent a revolutionary aspect aimed at simplifying information management and analysis for business users. Acting as a self-service data warehouse, Power BI datamarts empower users to efficiently prepare, manage, and analyze data from diverse sources, all without the need for extensive technical skills. This integration allows users to craft insightful reports and dashboards based on a centralized and curated dataset, significantly enhancing operational efficiency through Power BI datamarts.
In a rapidly evolving AI landscape, leveraging Robotic Process Automation (RPA) tools like EMMA RPA and Microsoft Power Automate can further automate manual workflows, reducing the time spent on repetitive tasks and enabling teams to focus on strategic initiatives. These RPA solutions tackle significant challenges like task repetition fatigue and staffing shortages, making them vital for entities aiming to optimize their operations. As industries transition towards digital-first business models, the ability to harness such tools is crucial.
The World Economic Forum forecasts that by 2025, 50% of employees will need substantial reskilling, emphasizing the importance for companies to invest in user-friendly data solutions. Kira Belova notes that ‘the BI landscape is set for rapid evolution and expansion, which offers immense potential for organizations to harness data-driven insights for strategic decision-making.’ By merging BI data hubs with RPA solutions, companies can manage this transition more efficiently, enabling informed decision-making and strategic planning, ultimately fostering growth and innovation in an increasingly data-driven landscape.
Moreover, the manufacturing sector’s digital transformation, valued at $263 billion in 2020 and expected to reach $767 billion by 2026, highlights the financial consequences of adopting advanced information management tools. This case study demonstrates that 86% of manufacturing companies indicate that one hour of system downtime can result in a loss of at least $300,000, emphasizing the importance of tools such as BI analytics and RPA. As the adoption of these technologies continues to increase, entities are better positioned to utilize information for competitive advantage, ensuring they remain resilient and proactive in response to changing market demands.
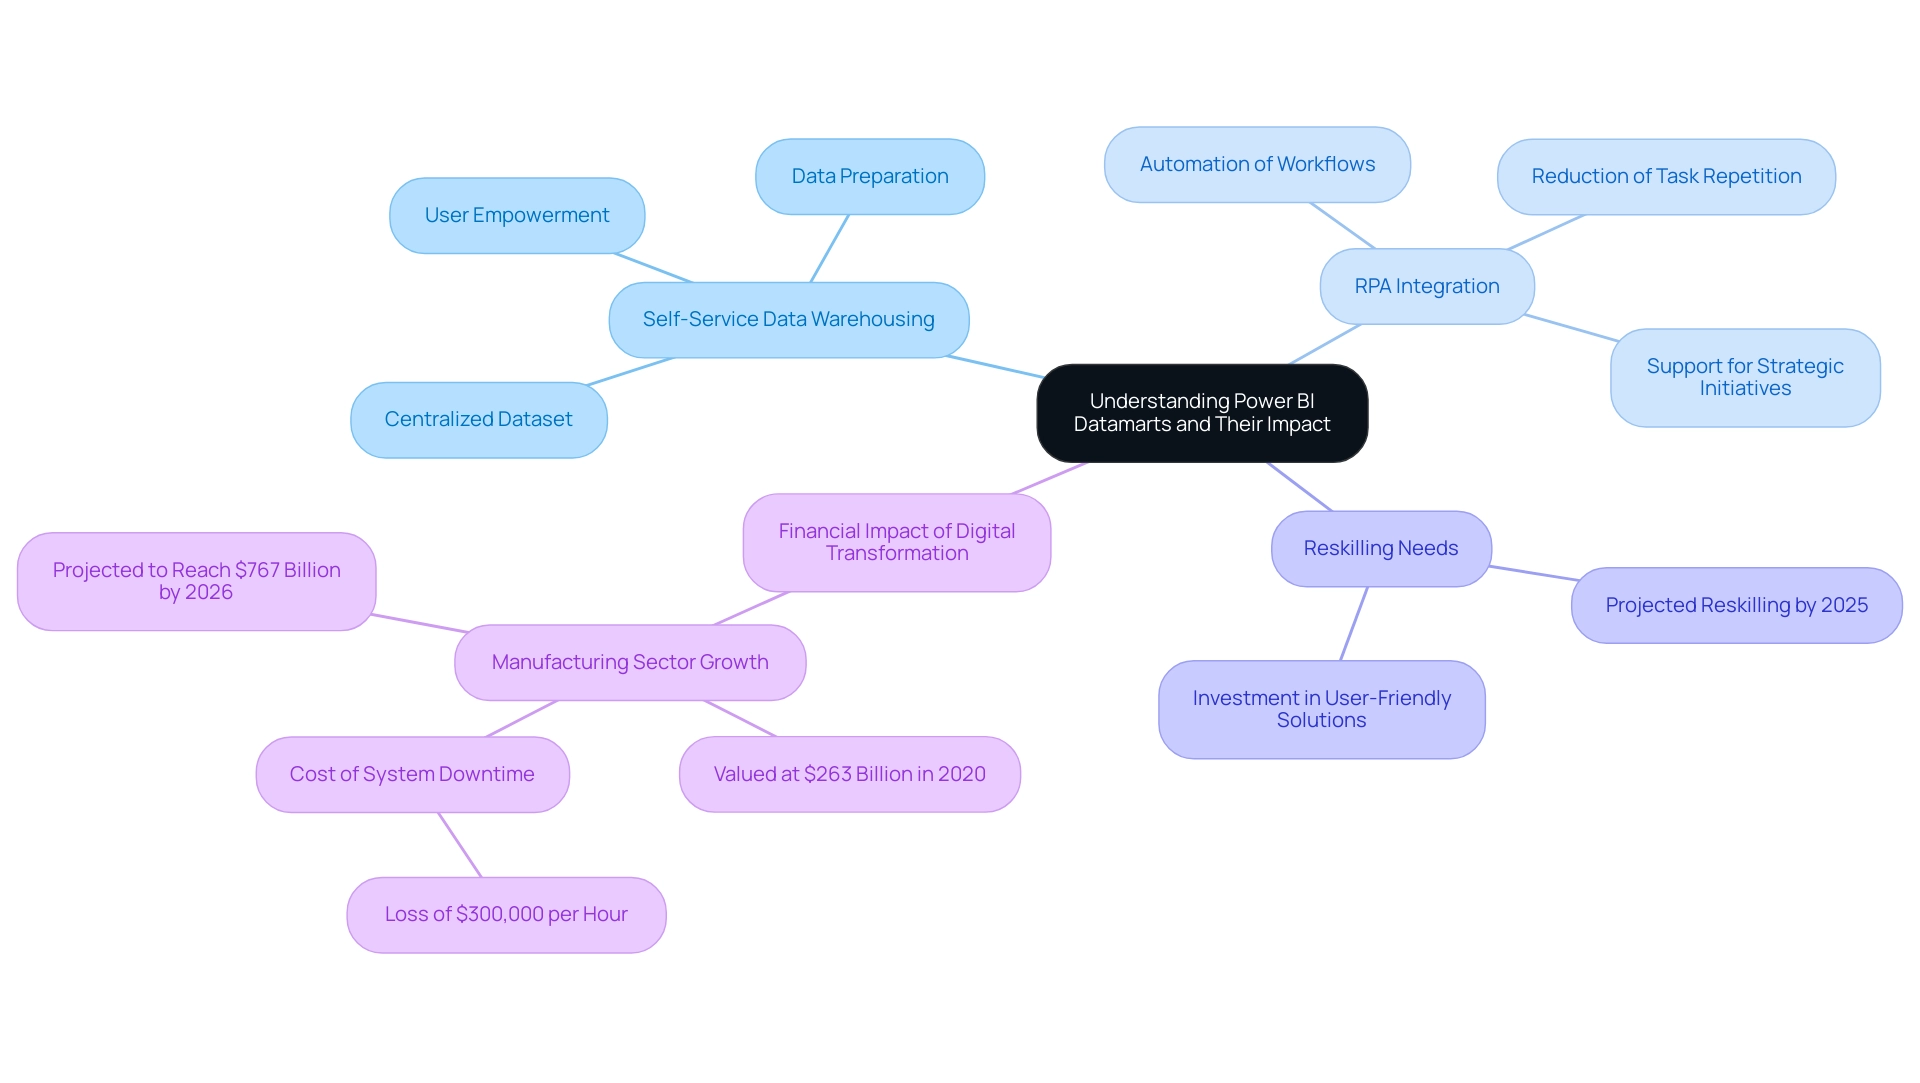
Key Benefits of Power BI Datamarts for Data Management
These analytical tools provide numerous advantages, rendering them an attractive option for organizations keen on enhancing their information management strategies, particularly regarding operational efficiency. Notable advantages include:
-
Simplified Data Preparation: Power BI data hubs enable users to seamlessly connect to various sources of information, transform content, and create a cohesive analytical view without requiring intricate coding or extensive IT assistance.
-
Improved Information Accessibility: By centralizing information in an intuitive platform, business users gain the ability to independently access and analyze details, thereby reducing reliance on IT departments and expediting decision-making processes.
-
Enhanced Cooperation: These information repositories promote teamwork by providing a common source available to various users, ensuring that all individuals function from the same collection of knowledge. Encouraging open communication and empathy can further enhance collaboration and cohesion within teams.
-
Robust Analytics Capabilities: Featuring building information modeling and reporting tools, Power BI Datamarts enable users to swiftly generate insights, allowing organizations to adapt effectively to evolving business conditions. This is especially pertinent considering that a recent case study showed a mid-sized healthcare company encountered considerable challenges, including manual information entry errors and slow testing processes, which resulted in the implementation of GUI automation. Through this automation, the company reduced entry errors by 70% and improved workflow efficiency by 80%.
-
Cost-Effectiveness: By optimizing information management workflows and reducing the necessity for extensive IT participation, BI solutions can lead to significant cost reductions for entities, enabling more efficient resource distribution.
Furthermore, to address resistance to novel concepts, entities should actively listen and foster alliances among stakeholders. This method can greatly improve the acceptance of BI Databases, ensuring that all team members are aligned with the transition.
In summary, Power BI Datamarts not only streamline information management but also enable enterprises to utilize their information’s full potential for strategic benefit. As companies navigate the challenges of 2024, investing in such innovative solutions aligns with the growing preference for self-service forums, where 67% of customers seek peer-driven insights to enhance their operational efficiency. Moreover, combining Robotic Process Automation (RPA) with Business Intelligence data stores can further simplify manual workflows, improving overall productivity and operational effectiveness.
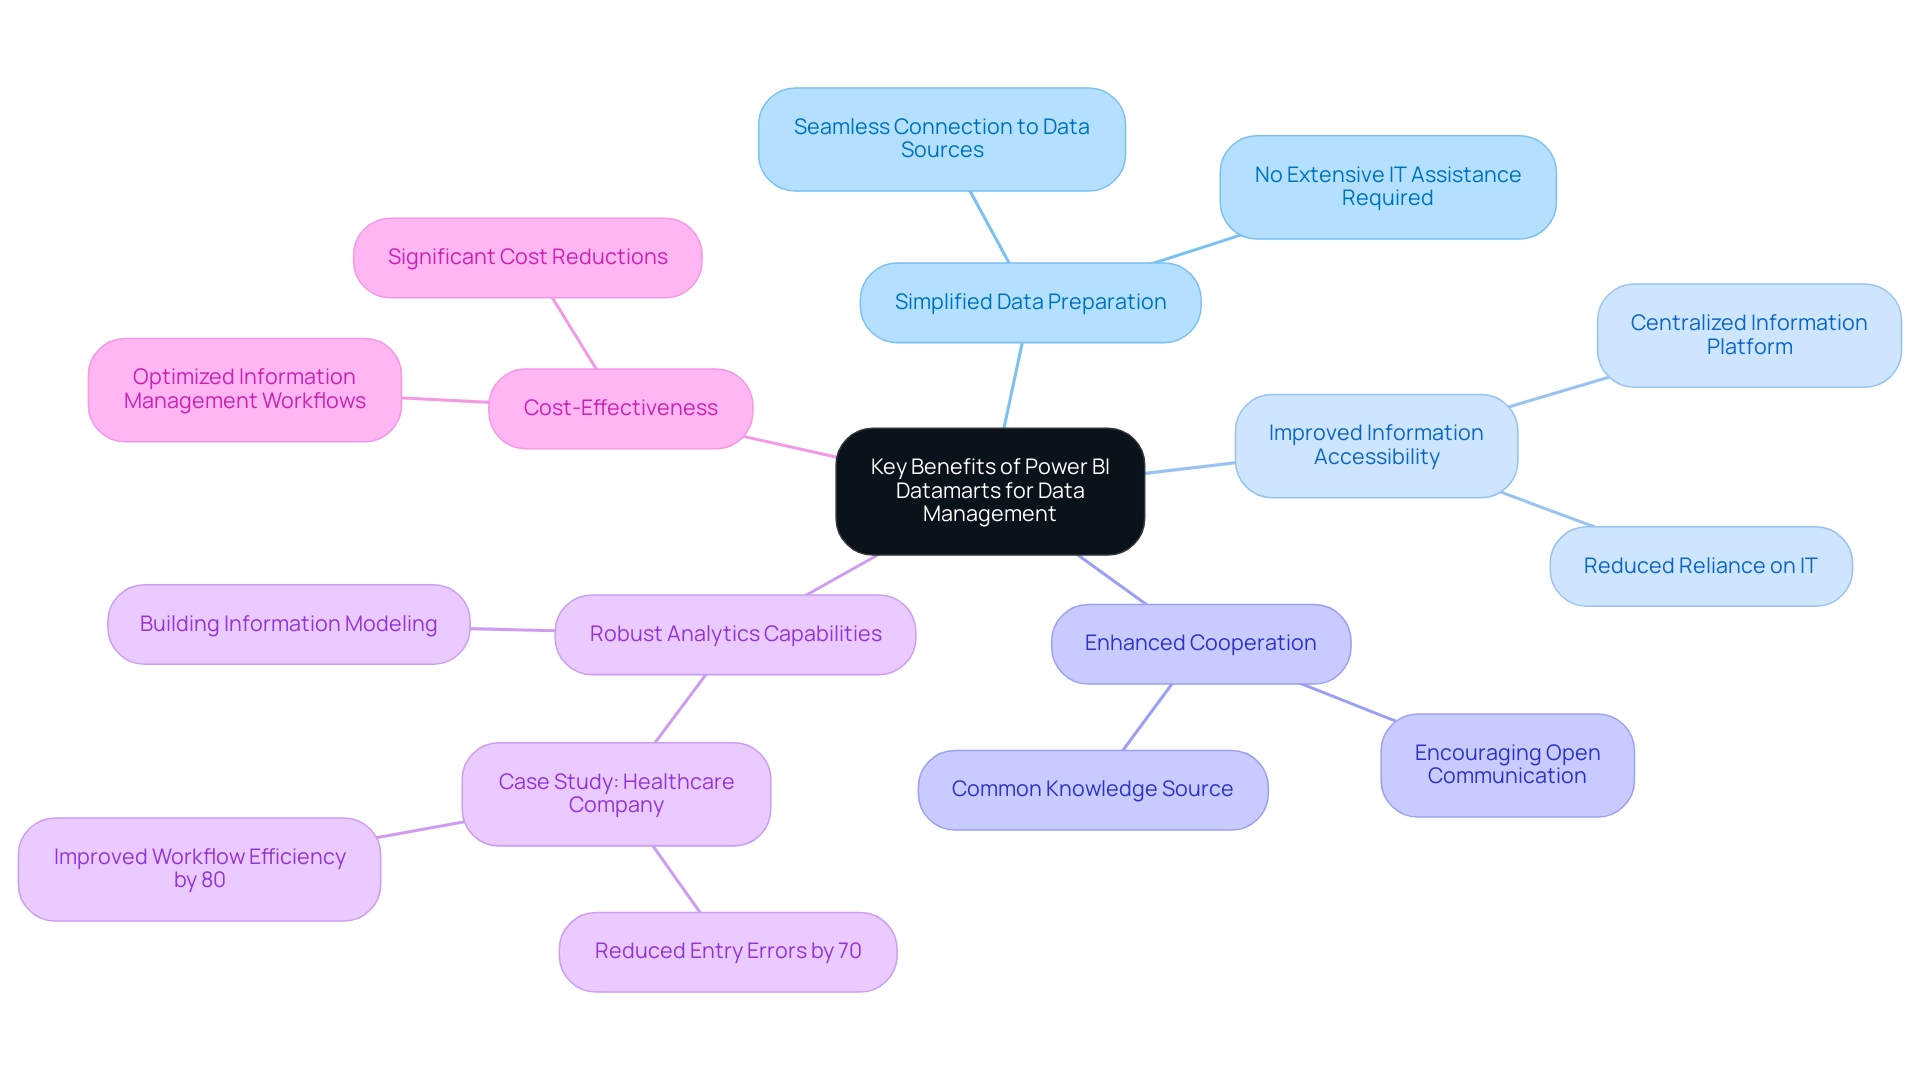
How Power BI Datamarts Integrate with Existing Data Sources
Power BI data warehouses provide exceptional flexibility by effortlessly linking to a broad range of information sources, improving functionality and allowing entities to optimize their current resources. This capability is crucial in today’s environment where leveraging Robotic Process Automation (RPA) to automate manual workflows is essential for boosting operational efficiency. However, manual workflows often lead to inefficiencies, errors, and wasted resources, underscoring the need for automation.
The following integration points highlight this capability:
-
Cloud Services: Data repositories can effortlessly link to cloud-based databases such as Azure SQL Database, Amazon Redshift, and Google BigQuery. This connectivity enables entities to harness the full potential of their cloud information investments, facilitating scalability and accessibility.
-
On-Premises Databases: Organizations have the option to connect data repositories to on-premises sources, including SQL Server, Oracle, and other relational databases. This hybrid approach empowers organizations to blend traditional and contemporary strategies effectively.
-
Power BI Datamarts can access information through APIs and web services, which enables real-time integration from various applications. This feature guarantees that decision-makers have access to the most current information for informed decision-making.
-
Excel and CSV Files: Users can import information directly from Excel spreadsheets and CSV files, offering flexibility in input and streamlining workflows.
By enabling these vital links, Power BI solutions empower entities to create a comprehensive information ecosystem that supports effective analysis and reporting. In a rapidly evolving AI landscape, the demand for efficient information management solutions like Power BI Datamarts is evident, especially as the social business intelligence market is projected to be worth $25,886.8 million in 2024. As Kira Belova emphasizes, “The BI landscape is set for rapid evolution and expansion, offering immense potential for organizations to harness data-driven insights for strategic decision-making.”
This evolution highlights the significance of integrating strong information sources and utilizing RPA to enhance operational efficiency. For instance, a case study by Inkwood Research demonstrated how a leading retail company optimized its business intelligence systems through effective data integration and RPA, resulting in a 30% reduction in manual data entry errors and significant time savings. Furthermore, tailored AI solutions can further streamline these processes, ensuring that entities navigate the complexities of the AI landscape effectively.
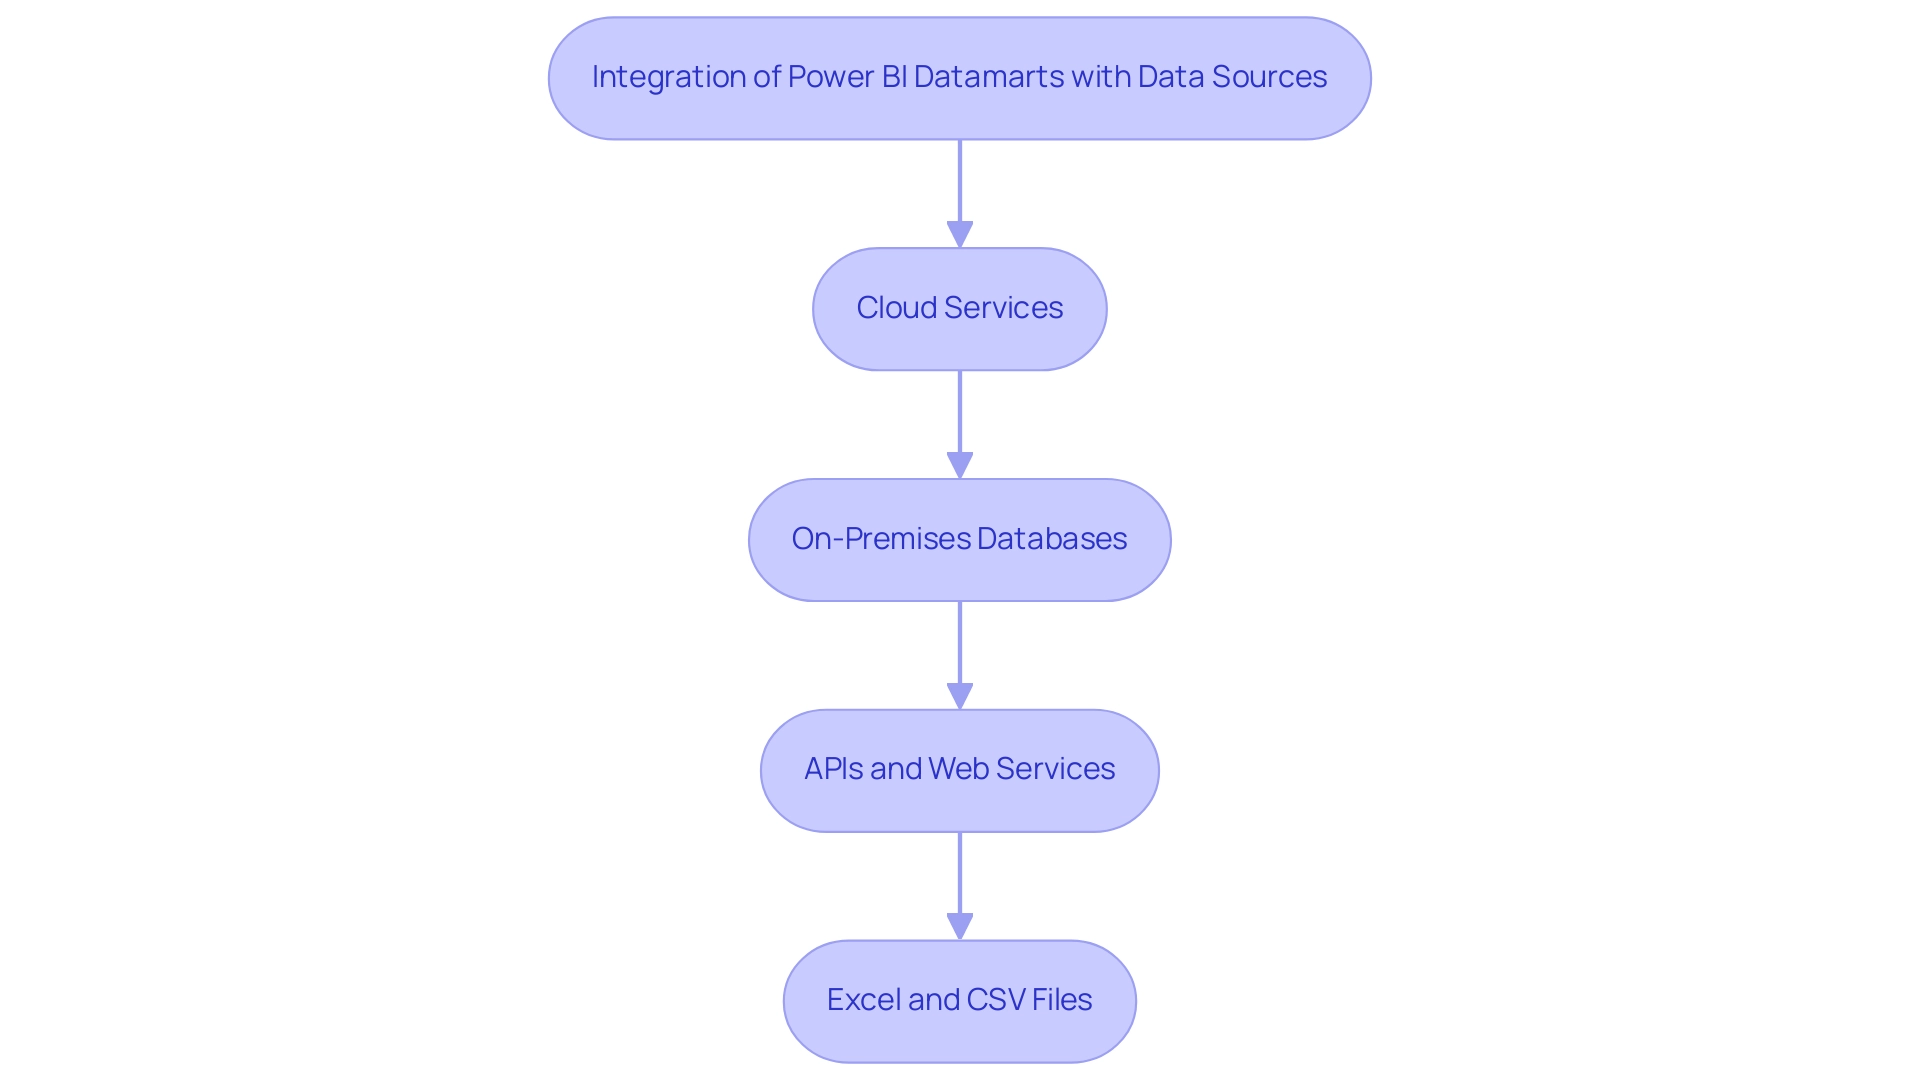
Best Practices for Implementing Power BI Datamarts
To effectively implement BI Datamarts, organizations should adhere to the following best practices:
-
Define Clear Objectives: Establishing precise goals is essential before implementation. Organizations must ensure that the setup of powerbi datamarts aligns with their strategic business objectives, enhancing clarity and direction. Leveraging insights from our 3-Day Business Intelligence Sprint can help in refining these objectives, allowing teams to focus on actionable outcomes that drive efficiency. This Sprint not only promises a fully functional report on a chosen topic but also provides a template for future projects, ensuring consistency in design and functionality.
-
Involve Stakeholders Early: Engaging key stakeholders from various departments at the onset can significantly enhance the identification of information requirements. This collaborative approach guarantees that the powerbi datamarts will cater to the needs of all users, fostering a sense of ownership and accountability, much like the tailored solutions provided by Creatum’s comprehensive services.
-
Maintain Quality: Implementing rigorous cleansing and validation processes is paramount to ensuring the accuracy and reliability of the information in the Database. High information quality is crucial for effective decision-making. Continuous improvement in this area is essential, as emphasized by the importance of data quality in analytics journeys discovered through our training workshops.
-
Regularly Monitor and Update: Organizations should develop robust monitoring systems to assess the performance and usage of their data repositories. By making timely adjustments based on these insights, they can enhance efficiency and user satisfaction. The integration of Robotic Process Automation (RPA) can streamline these processes, significantly improving operational efficiency and enabling teams to focus on strategic tasks.
-
Provide Training and Support: Offering comprehensive training sessions and continuous support for users is vital to boost adoption rates. Equipping teams with the necessary skills ensures they can utilize the data repositories effectively. The user-friendly design of our BI tools, supported by tailored training solutions, enhances operational efficiency and empowers teams to make informed decisions. Our training workshops are particularly crafted to support this learning journey, guaranteeing that users are well-equipped to use the tools available to them.
By adopting these optimal practices and leveraging the resources from our 3-Day BI Sprint, organizations can establish a robust framework that enhances the application of powerbi datamarts, ultimately improving their information management skills and promoting informed decision-making.
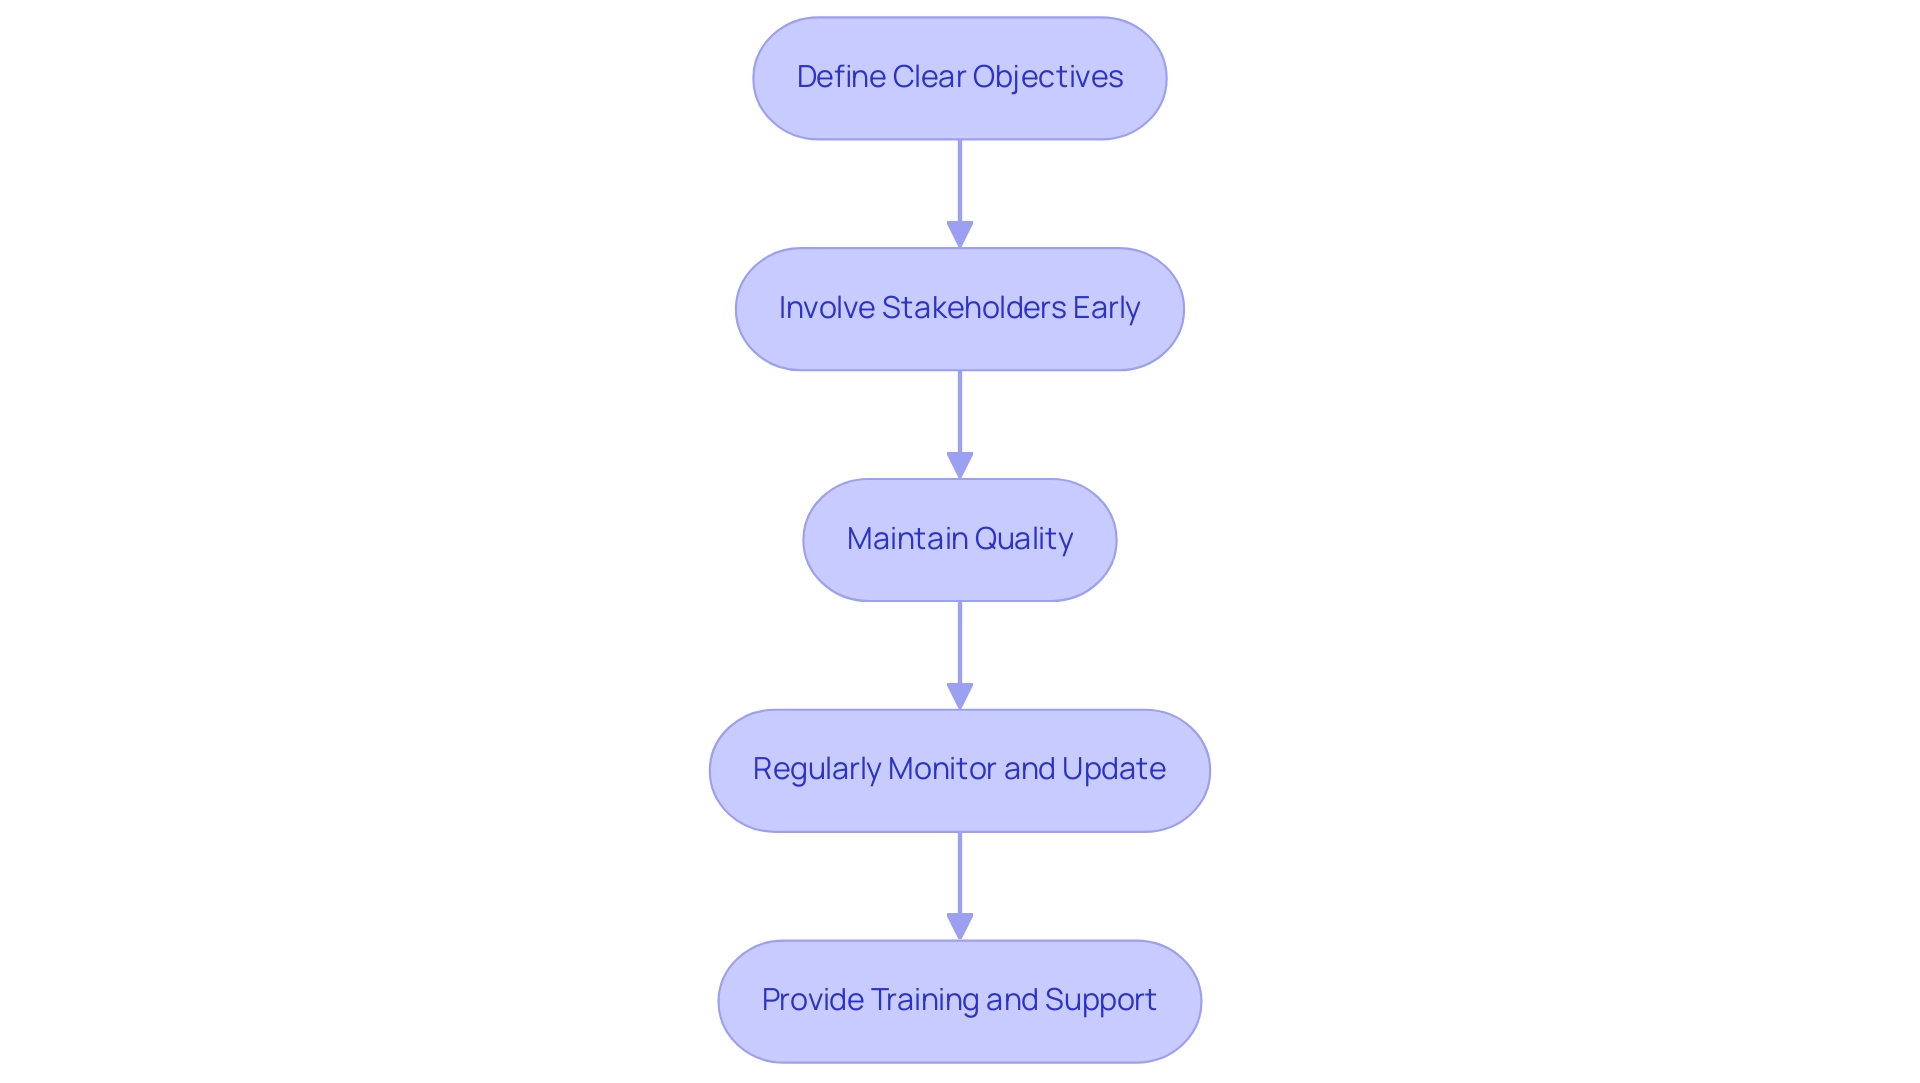
Real-World Use Cases of Power BI Datamarts
Powerbi datamarts have demonstrated to be invaluable resources across various sectors within Business Intelligence, showcasing their flexibility and efficiency in improving operational results. This project aims to optimize the visualization and analysis of information related to exporting and importing agricultural products in Mexico, which is critical for informed decision-making.
-
Retail Analytics: A leading retail firm utilized the capabilities of Power BI to consolidate sales information from multiple sources.
This integration allowed them to delve into customer behavior patterns and refine inventory management strategies. Consequently, they accomplished an impressive 15% rise in sales, mainly due to focused marketing efforts guided by insights. -
Healthcare Reporting: In the healthcare sector, a leading provider adopted data warehouses to amalgamate patient information from multiple departments.
This initiative not only improved reporting accuracy but also ensured compliance with regulatory standards. The improved accessibility of information resulted in better patient care and increased operational efficiency.
A financial institution effectively utilized powerbi datamarts to create a centralized repository for transaction information.
This setup facilitated real-time fraud detection and comprehensive risk assessments. By proactively managing information, the institution significantly mitigated financial losses, demonstrating the critical role of analytics in safeguarding assets.
Policymakers can also leverage the dashboard to visualize and compare export trends across states, allowing for more informed decisions regarding trade policies, subsidies, and specific agricultural development sectors. However, it is important to note that the current dashboard has limitations in granularity and lacks predictive analytics capabilities. The challenges of time-consuming report creation and inconsistencies can hinder effective decision-making.
To truly harness the power of Business Intelligence and RPA for operational excellence, future developments should focus on enhancing information granularity, integrating predictive capabilities, and expanding metrics beyond currency values. Additionally, tailored AI solutions can help businesses navigate the overwhelming AI landscape, ensuring they leverage the full potential of their data.
These illustrative examples underscore the transformative potential of powerbi datamarts, which empower organizations to leverage data-driven insights for informed decision-making and operational efficiency amidst the complexities of modern business environments.
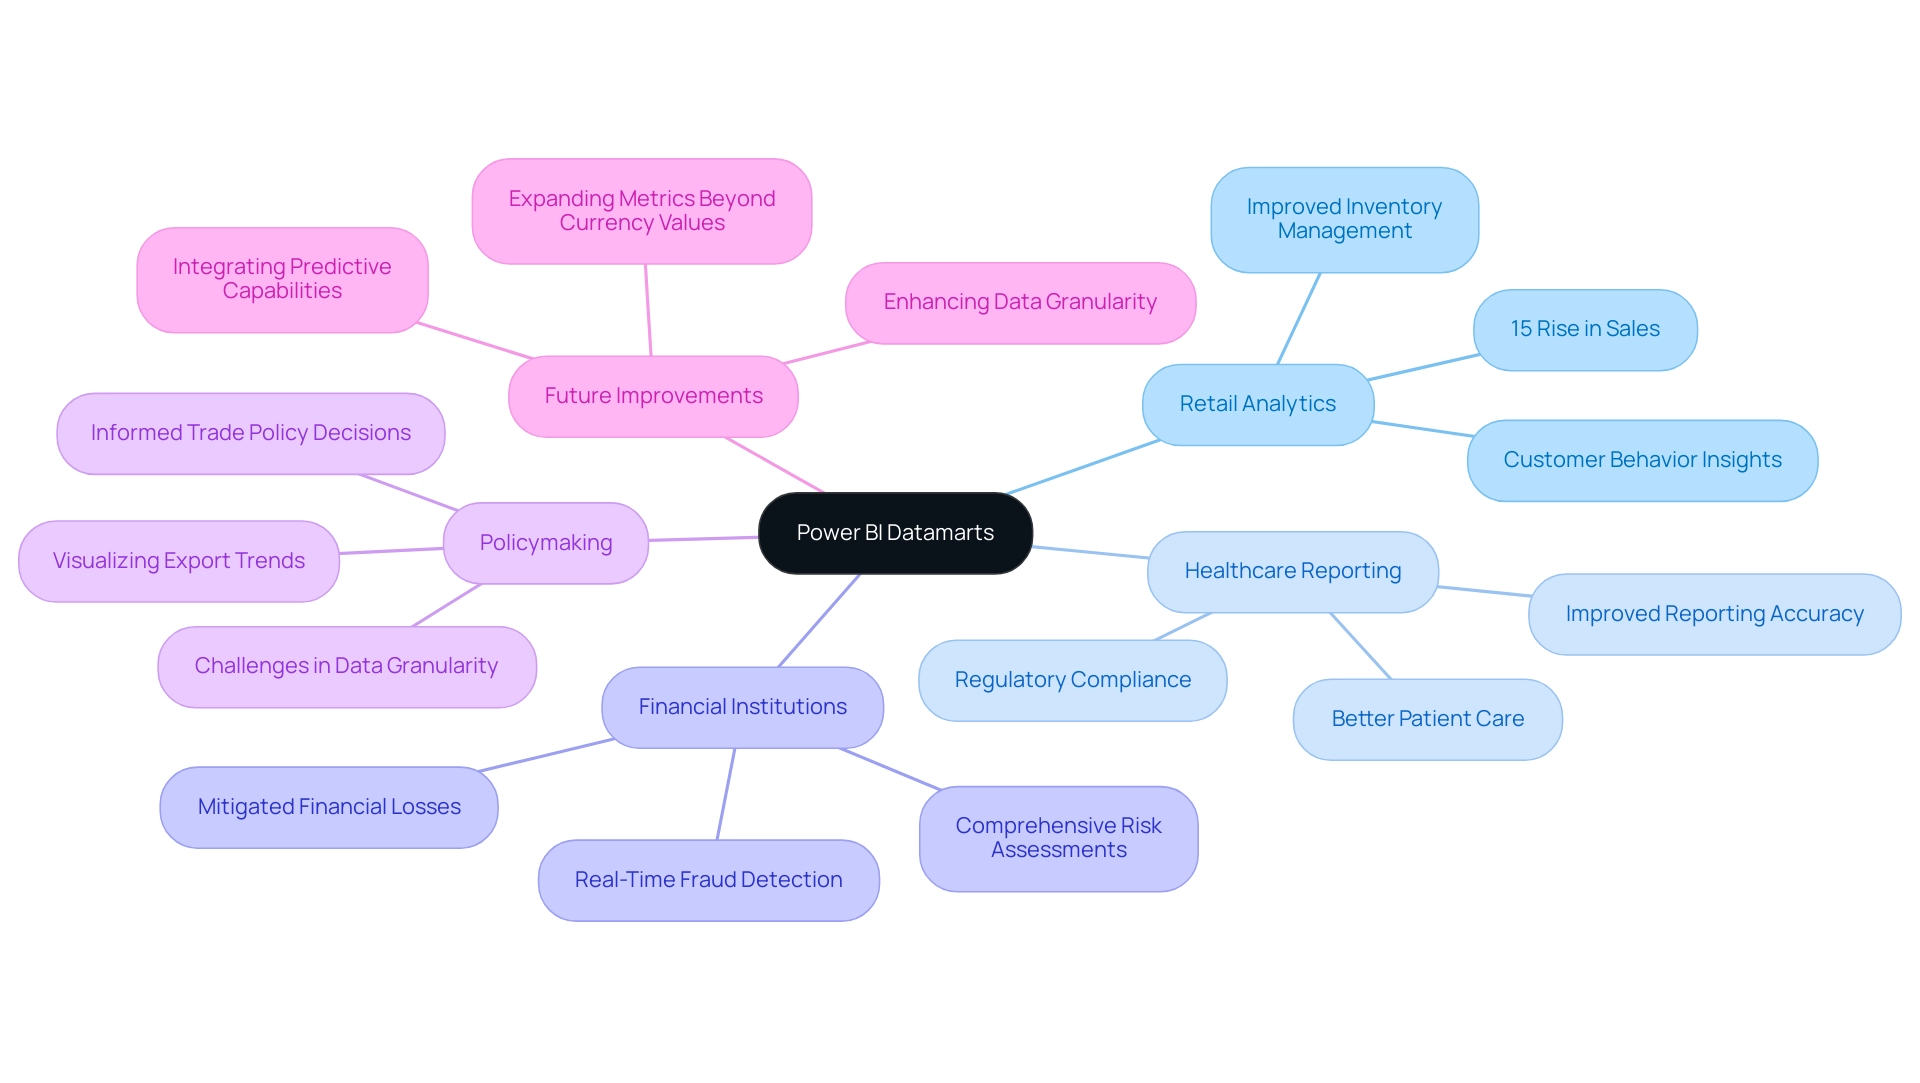
Conclusion
Power BI Datamarts represent a groundbreaking advancement in data management, empowering organizations to harness their data’s full potential. By simplifying data preparation, enhancing accessibility, and promoting collaboration, these tools allow business users to create insightful reports and dashboards without the need for extensive technical expertise. The integration of Robotic Process Automation (RPA) further amplifies these benefits, automating repetitive tasks and freeing up valuable resources for strategic initiatives.
Implementing Power BI Datamarts not only streamlines data management but also supports organizations in navigating the complexities of a data-driven landscape. By adhering to best practices such as:
– Defining clear objectives
– Involving stakeholders
– Maintaining data quality
Businesses can maximize the effectiveness of their Datamarts. Real-world applications across various industries—from retail to healthcare—illustrate how these tools drive operational efficiency, improve decision-making, and ultimately contribute to strategic growth.
As industries continue to evolve, the necessity for robust data management solutions becomes increasingly clear. The adoption of Power BI Datamarts, coupled with RPA, positions organizations to thrive in an ever-changing environment. By embracing these innovative solutions, businesses can not only enhance their operational efficiency but also secure a competitive edge in a data-centric world. Investing in Power BI Datamarts is not just a step towards improved analytics; it is a strategic move towards future-proofing operations and fostering a culture of data-driven decision-making.
Overview
Mastering Power BI automatic refresh is crucial for ensuring that datasets in reports reflect the most current information, thus facilitating informed decision-making. The article outlines various methods for setting up automatic refresh, such as scheduled updates, on-demand refreshes, and integrating Power Automate, while emphasizing best practices and troubleshooting techniques to optimize performance and reliability in data management.
Introduction
In the dynamic landscape of data analytics, ensuring that insights are timely and relevant is paramount for organizational success. Power BI stands out as a powerful tool, but harnessing its full potential requires a deep understanding of data refresh processes.
This article delves into the intricacies of automatic refresh in Power BI, providing a roadmap to optimize data management strategies. From setting up scheduled refreshes to troubleshooting common issues, each section equips professionals with practical techniques to enhance operational efficiency.
By embracing these best practices and advanced methodologies, organizations can transform their data workflows, ensuring that decision-makers are always armed with the latest insights to drive growth and innovation.
Understanding Data Refresh in Power BI
The update process in Business Intelligence is an essential procedure that modifies your datasets within reports to showcase the most recent alterations from the source information. Mastering this process is vital, as it ensures that your analyses and visualizations are grounded in the most current information. Power BI provides two main types of updates:
- Manual update, which users must initiate themselves.
- Power BI automatic refresh, which occurs based on a set schedule.
The Power BI automatic refresh feature is especially important for organizations that rely on real-time information for decision-making, greatly decreasing the risk of working with obsolete details. Recent updates permit updates to be scheduled as frequently as every 15 minutes, enhancing responsiveness to business needs. However, to enhance performance and lessen the effect of update processes, it is advisable to use separate gateways for Import and DirectQuery models.
Additionally, if access to an enterprise data gateway is unavailable, users can deploy a personal data gateway to manage their semantic models, although this comes with limitations compared to enterprise gateways, such as reduced functionality and scalability. As highlighted by mjmowle, an Advocate I, understanding the nuances in scheduling is essential:
With BI Premium, you can set up refresh schedules as frequent as every 15 minutes…
While BI Premium per-user licenses allow for a maximum of 48 refreshes in a 24-hour period, they may still be limited to 30-minute intervals, which differs from Premium Capacity licenses.
These strategies not only enable teams to utilize the latest insights but also emphasize the essential role of Business Intelligence and RPA tools such as EMMA RPA and Automate in addressing challenges like lengthy report creation and inconsistencies, ultimately enhancing operational efficiency and business growth.
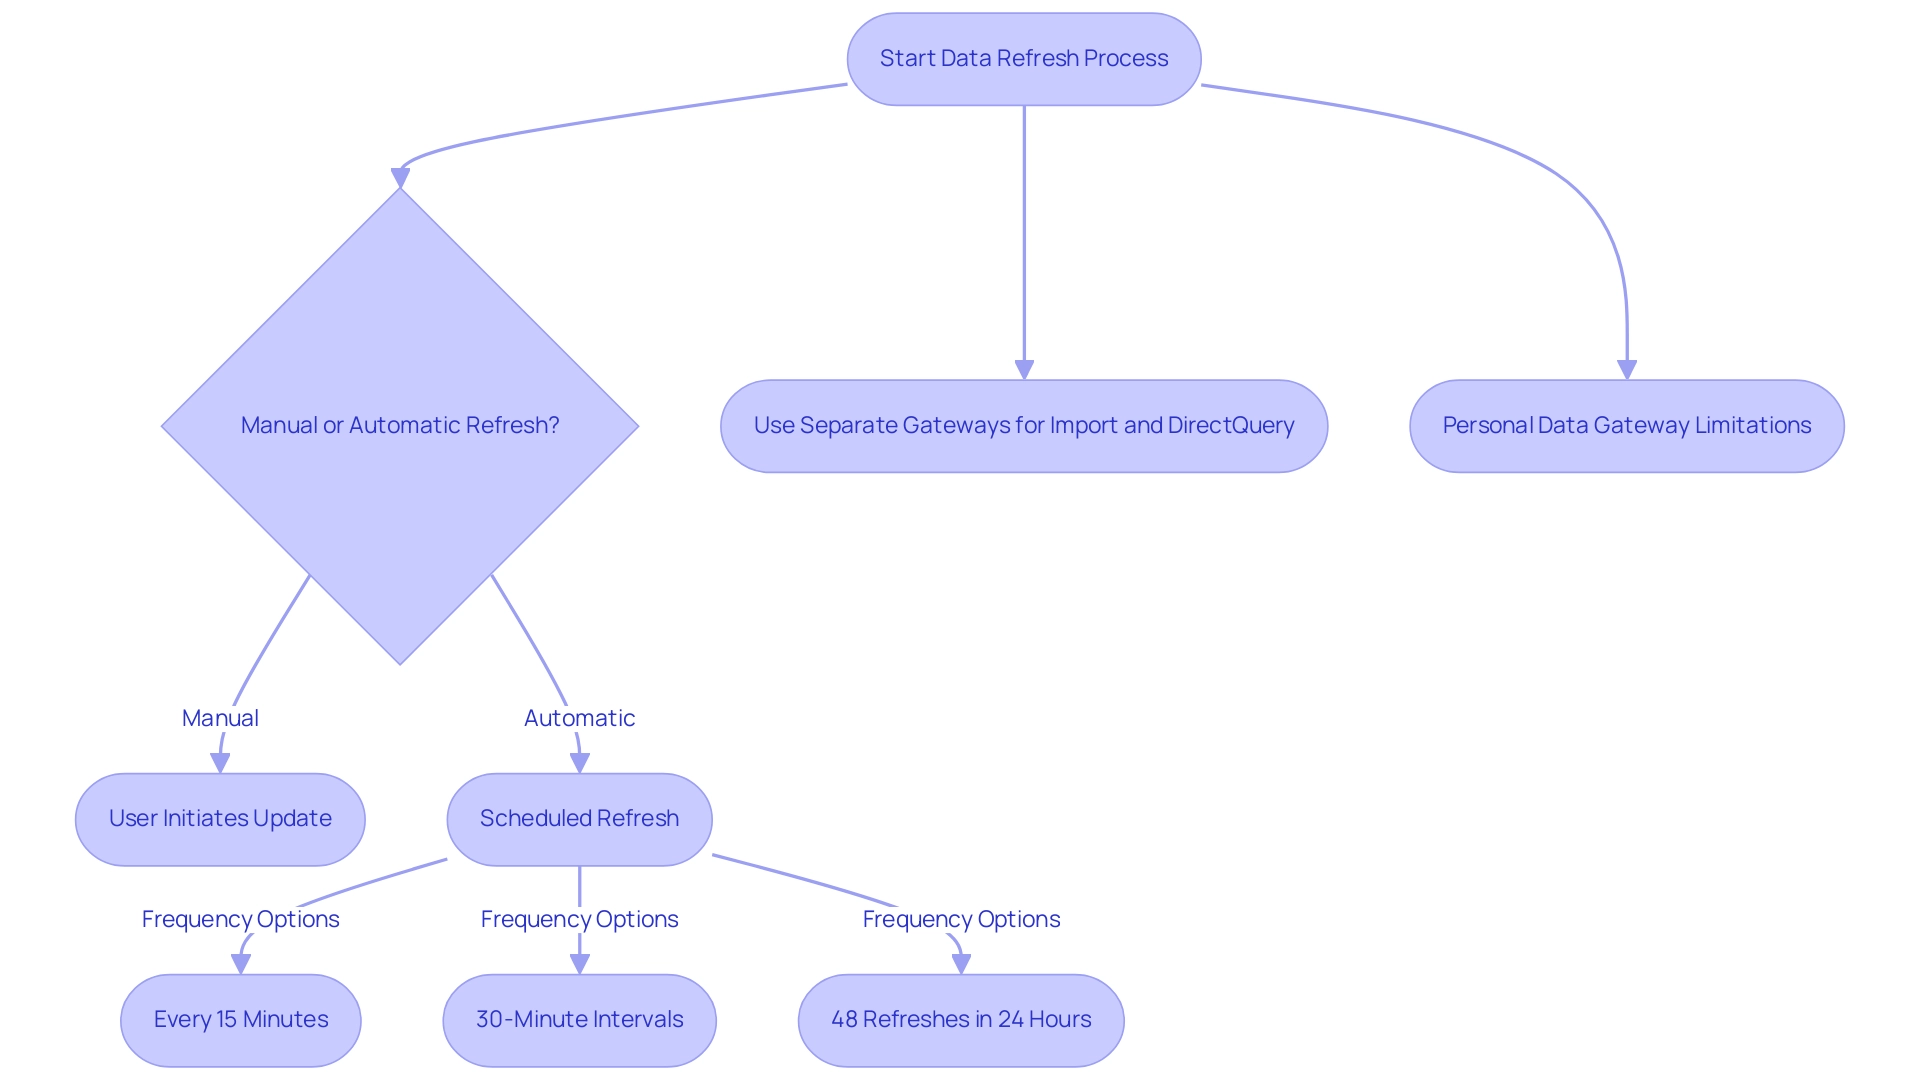
Methods for Setting Up Automatic Refresh in Power BI
Configuring Power BI automatic refresh provides various techniques to ensure your information remains up-to-date and useful, which is essential in today’s competitive environment. Failing to extract meaningful insights can leave your business at a competitive disadvantage. Here are the primary techniques you can employ:
-
Planned Update: This approach enables users to create a customized update timetable, essential for preserving information integrity and uniformity. Within Power BI Service, navigate to your dataset settings to configure the update frequency—be it daily, weekly, or another interval. Ensure your dataset is linked to a gateway, especially for on-premises data sources. Using distinct gateways for Import and DirectQuery models can improve performance and reduce update conflicts. Note, however, that it can take BI up to 60 minutes to update a semantic model after utilizing the ‘Refresh Now’ option, so plan your update schedule accordingly to maximize efficiency.
-
On-Demand Refresh: For urgent information needs, the on-demand refresh option enables users to manually initiate a refresh. While this method lacks the automation that scheduled refreshes provide, it is ideal for immediate updates. Simply access the dataset settings page and click on ‘Refresh Now’ to initiate the process whenever needed.
-
Power Automate Integration: Advanced users may find great value in integrating Power Automate for enhanced flexibility. This option automates refreshes based on specific triggers from various applications or information events. By establishing a flow, you can guarantee that the refresh happens automatically when predefined criteria are met, streamlining the management process and enabling your team to concentrate on strategic initiatives. Furthermore, utilizing RPA tools such as EMMA RPA can further improve operational efficiency by automating repetitive tasks linked to management.
Comprehending these techniques is essential for enhancing your BI experience and ensuring that your information reflects the most up-to-date details available. Keep in mind, while scheduled refreshes are crucial for automated updates, the Power BI automatic refresh and on-demand options, along with integrations with tools such as Automate, enhance your control over information management. As Seth Bauer wisely states, “I hope you found this summary useful; stay tuned for more articles that guide you through specific source connections and updates that will assist in simplifying the process of connecting to, and updating all your various information sources in BI.”
Additionally, it’s crucial to clarify that scheduled refreshes on the web do not automatically update the desktop version; users must manually download the updated PBIX file from the online service to reflect changes, as highlighted in the case study titled ‘Understanding Scheduled Refresh and Desktop Updates.
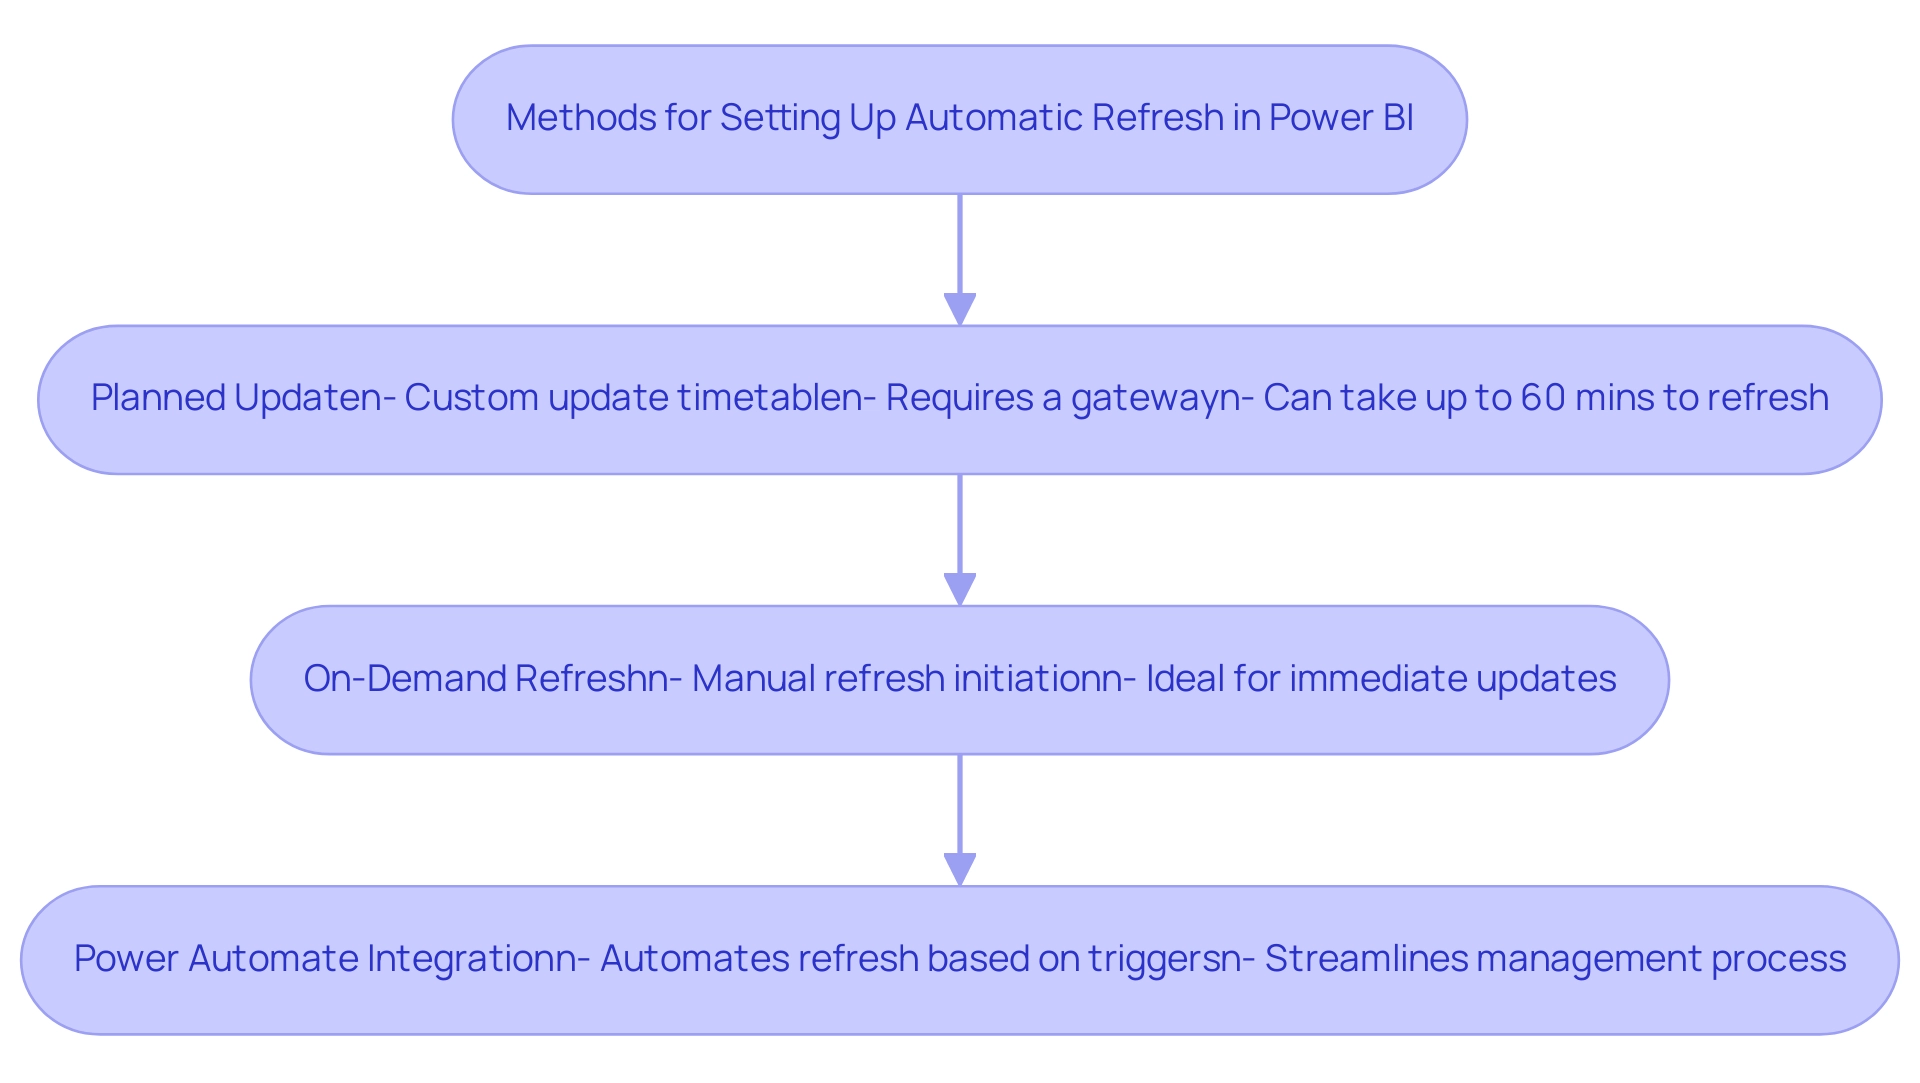
Best Practices for Power BI Automatic Refresh
To effectively optimize automatic updating in Power BI, it’s essential to adopt the following best practices that not only enhance operational efficiency but also leverage Robotic Process Automation (RPA) to streamline manual workflows:
- Restrict the Volume of Information: Import solely the essential information into your documents to reduce refresh durations. Utilize filters strategically to exclude irrelevant information, significantly enhancing performance and reducing the time invested in report creation.
- Optimize the Data Model: Ensure your data model is as efficient as possible. Eliminate unnecessary columns and tables that can obstruct update rates. A streamlined model not only accelerates update times but also enhances overall document performance, enabling your team to concentrate on analysis rather than creation.
- Set Appropriate Refresh Frequency: Choose a refresh frequency that strikes a balance between timely updates and the performance capabilities of your sources. This approach ensures your reports remain current without overloading the system, overcoming the common challenge of time-consuming report generation.
- Schedule Refreshes During Off-Peak Times: To further enhance performance, schedule your refreshes during off-peak hours when system usage is lower, reducing the load on your sources and allowing for smoother operations.
- Ensure Reliable Gateway Connections: A dependable gateway connection is crucial for successful information refreshes. Consistently inspect and upkeep your gateway to prevent interruptions in the update process, thus reducing data inconsistencies that may occur from inadequate connections.
- Monitor Update Performance: Regularly review the update history to identify any failures or delays. The BI tool disables your update schedule after four successive failures, making it essential to oversee performance actively. BI offers tools to check the status of your refreshes, with errors indicated by a warning icon, allowing for swift troubleshooting and adjustments.
- Test Update After Changes: Following any adjustments to your model or sources, always test the update functionality. This step is essential to ensure everything functions as anticipated, avoiding potential pitfalls that could interrupt your reporting processes.
By adopting these practices, organizations can significantly improve their Power BI automatic refresh performance and utilize RPA to free up valuable resources. RPA can automate repetitive tasks such as information extraction and document generation, directly tackling the challenges of time-consuming creation and ensuring consistency. As Szymon Dybczak aptly puts it,
By simplifying these measures and doing more of the heavy lifting in Databricks, I was able to accelerate my submissions.
Furthermore, real-world applications of these strategies, such as categorizing report information by business impact with sensitivity labels, highlight how thoughtful information management can raise awareness about security and sharing policies.
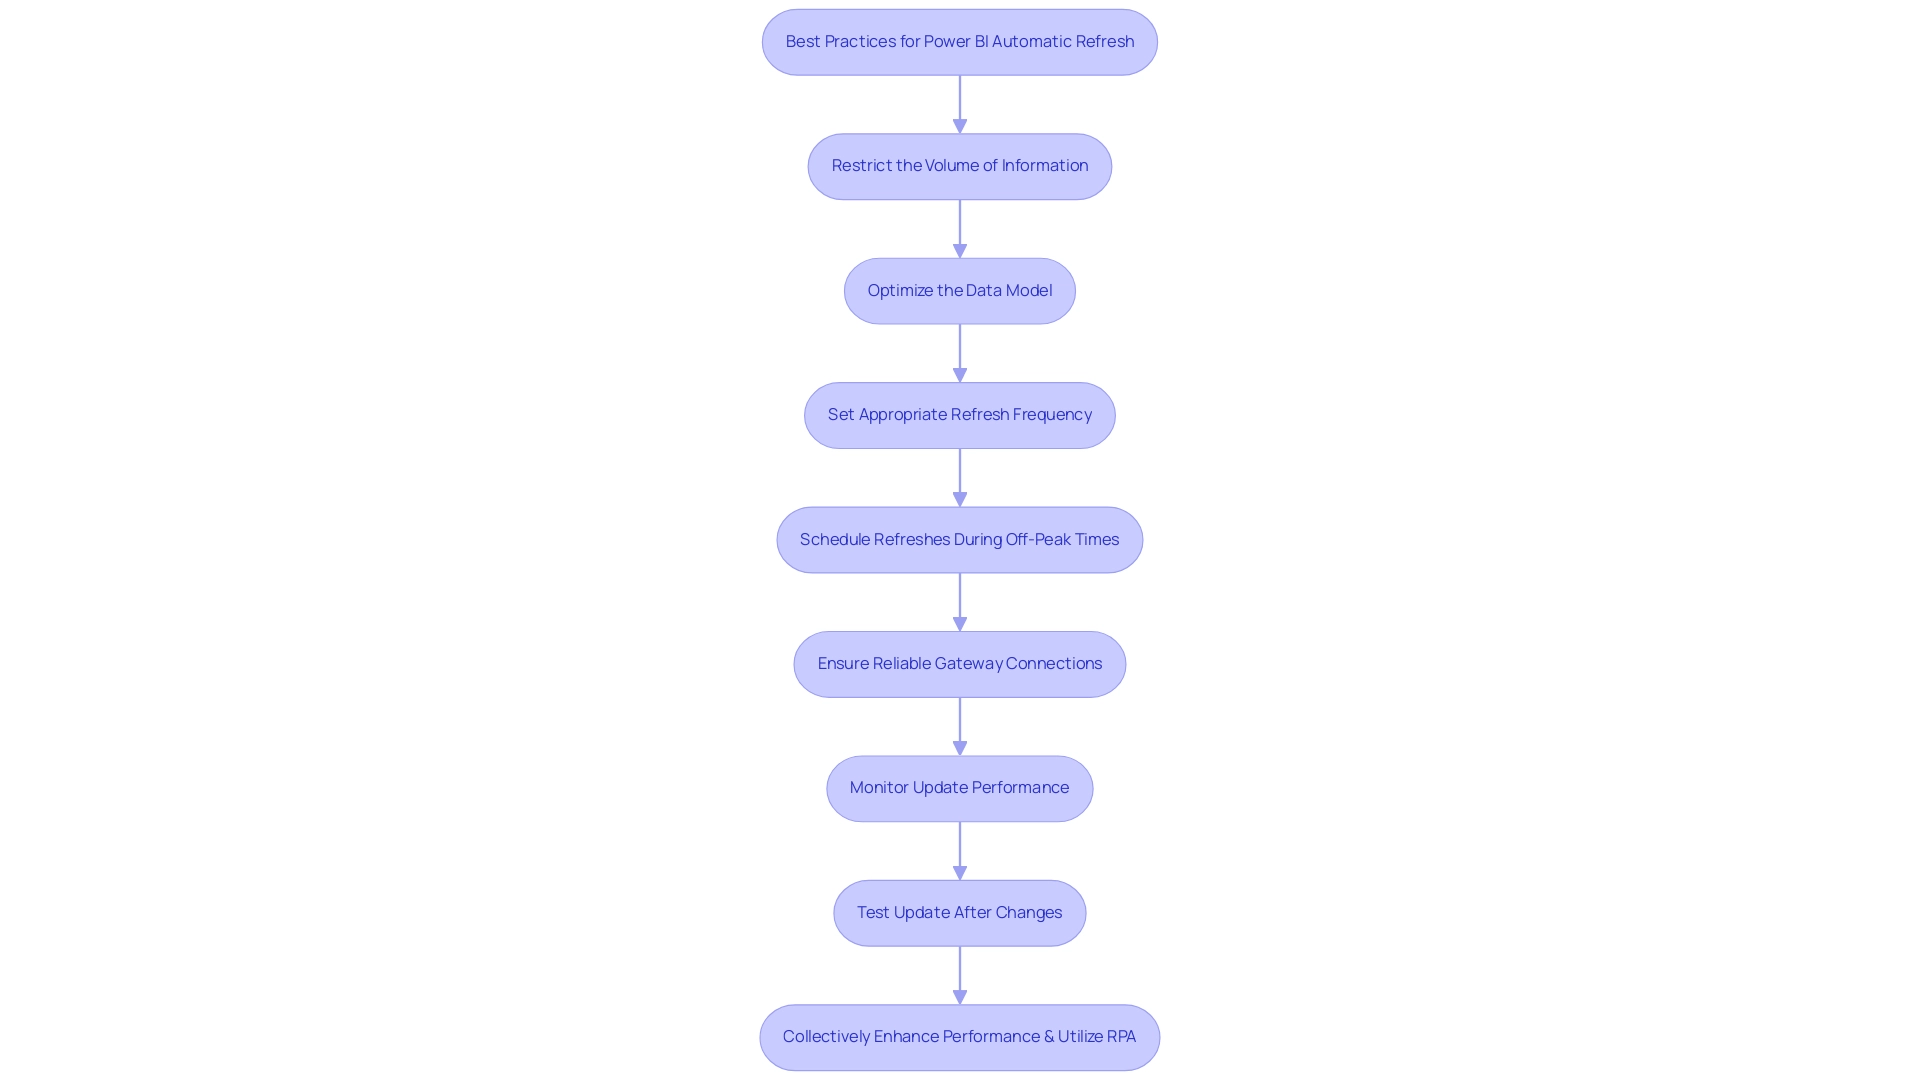
Troubleshooting Automatic Refresh Issues in Power BI
When encountering difficulties with automatic update in Power BI, especially regarding inadequate master information quality and the obstacles to AI adoption, adhering to these crucial troubleshooting steps can assist in pinpointing and addressing the problems efficiently:
- Check Source Credentials: Start by confirming that the credentials for your sources are current and possess the required permissions. Without precise credentials, update attempts will fail, worsening problems related to inconsistent quality.
- Review Update History: Dive into the update history to identify any failed attempts. Analyzing error messages can provide critical insights into the underlying issues, which may stem from data inaccuracies that hinder effective decision-making.
- Gateway Status: If your setup includes a gateway, ensure that it is online and correctly configured. An inactive or misconfigured gateway can halt refresh processes. Remember that if you make any changes in your Power BI Desktop file, such as adding a new chart or column, you have to republish to the Power BI service for those changes to be reflected, as noted by Uzi2019, a Super User.
- Information Source Availability: Ensure that your information source is operational and accessible. Network disruptions or outages can hinder the update and lead to failures, complicating your efforts to leverage insights effectively.
- Adjust Timeout Settings: For refreshes that timeout, consider optimizing your queries for efficiency or increasing the timeout settings within the data source configuration. Additionally, it’s important to note that while a Premium license permits up to 48 updates a day, some users have reported limitations to 30-minute intervals, necessitating careful management of update schedules. To prevent scheduled update time-outs, users should think about streamlining their semantic models or dividing them into smaller models, as emphasized in a pertinent case study.
By taking these actions, you can greatly enhance the dependability of Power BI automatic refresh in your BI environment. This not only helps in overcoming barriers to AI adoption but also enhances operational efficiency, allowing your organization to confidently embrace AI technologies and drive better decision-making.
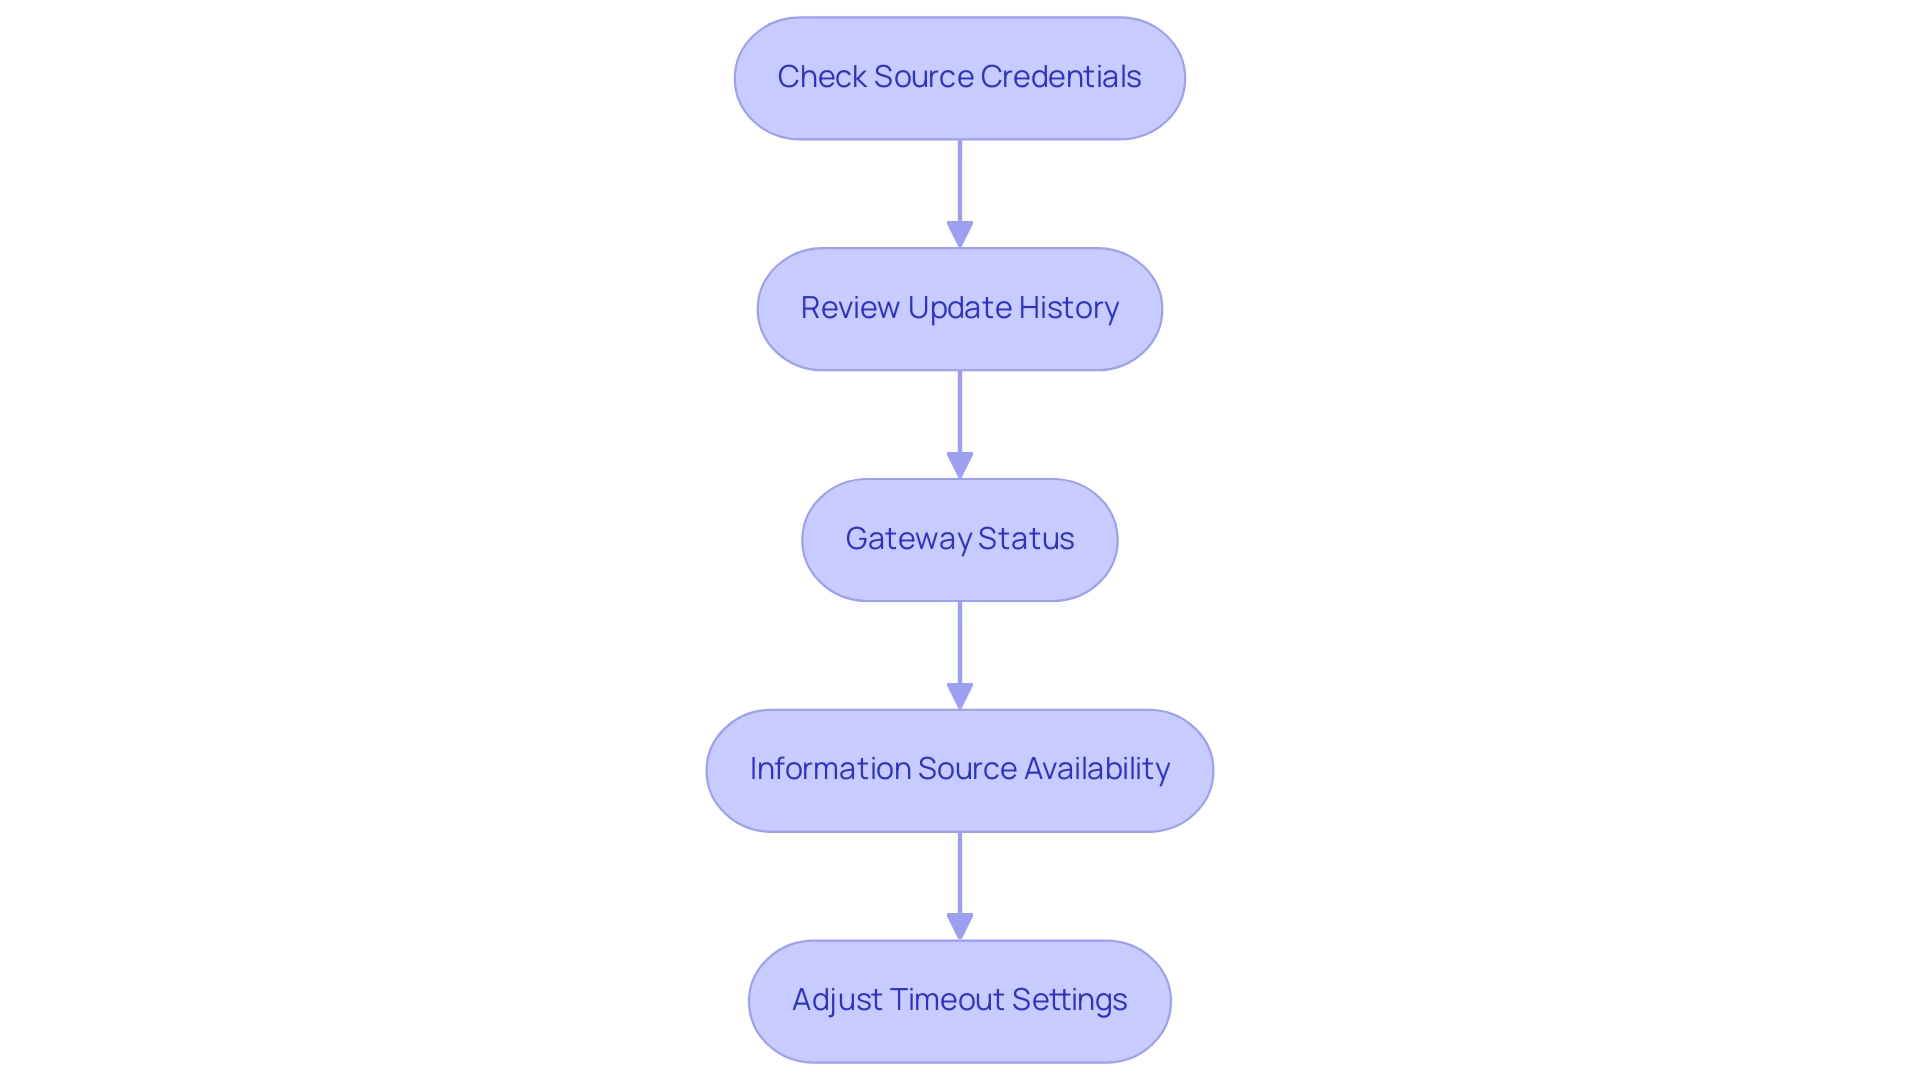
Advanced Techniques for Enhancing Power BI Automatic Refresh
To significantly improve your Business Intelligence automatic update capabilities, consider implementing the following advanced techniques:
-
Utilizing Automation: Harness the capabilities of automated workflows that can initiate a refresh based on specific events, such as the arrival of new data. This not only saves time but ensures that your reports are always up-to-date with Power BI automatic refresh, allowing for efficient task automation with a risk-free ROI assessment, as our certified professionals help you streamline the process. Accessible automation through Automate makes it easier for teams to manage workflows without extensive technical knowledge.
-
Integrate with Azure Functions: For more complex scenarios, leverage Azure Functions to handle processing prior to refreshing your Power BI datasets. This approach can streamline operations and improve the Power BI automatic refresh efficiency, enhancing overall productivity.
-
Dynamic Information Sources: Implement parameters to create dynamic information sources that adapt based on user input or other variables. This flexibility enables more customized and agile reporting, addressing the challenges of inconsistencies.
-
Implement Incremental Update: For extensive datasets, setting up incremental update can be a game-changer. This technique updates only new or modified information, drastically reducing the time spent refreshing entire datasets and enhancing performance.
-
Monitoring Tools: Utilize monitoring tools to closely observe the performance of your Power BI analysis and update schedules. Regular tracking can help you identify areas for improvement and ensure optimal functionality, driving informed decision-making through Power BI automatic refresh.
-
SQL Filtering: As Janey Guo suggests, consider using SQL statements to filter part of the data from the beginning of connecting to the data source. This could potentially streamline your update process further, mitigating the challenges faced in report creation.
-
Case Study Reference: Addressing complex or poorly optimized data flow is essential, as highlighted in the case study titled ‘Mitigating Long Refresh Durations.’ Implementing the discussed techniques can aid in decreasing update times through Power BI automatic refresh, optimizing your dataflows and enhancing operational efficiency in a rapidly evolving AI landscape.
-
Cost Monitoring: Keep in mind the importance of monitoring licensing costs for budget management. This consideration is crucial when deciding between Pro licenses, Premium Per User, or Premium capacity based on your usage patterns. Engaging in a consultation process can also help you evaluate the best licensing options for your needs.
By adopting these advanced techniques, you can not only reduce refresh durations—addressing the statistic that shows the top 1000 from view currently takes about 30 minutes—but also enhance overall reporting efficiency, ultimately leading to better data-driven decisions.
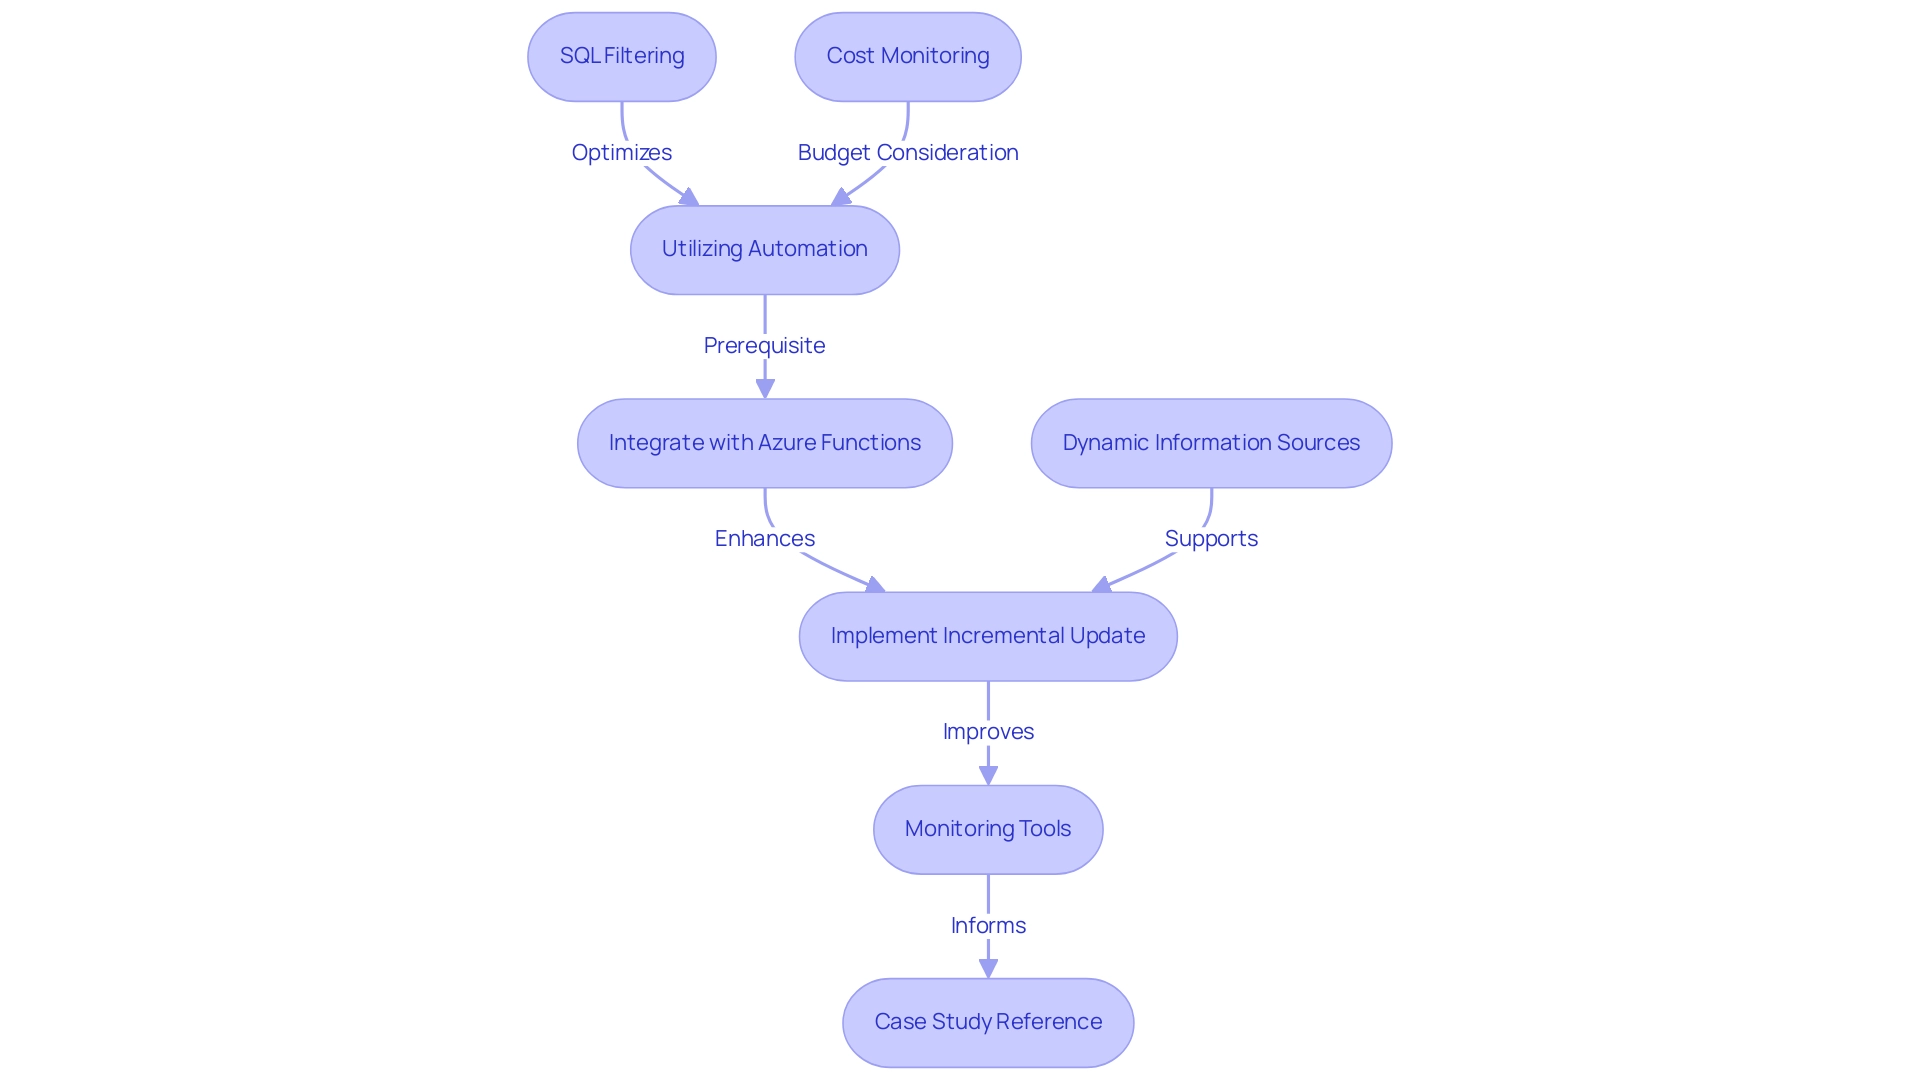
Conclusion
Embracing the intricacies of automatic refresh in Power BI is essential for any organization aiming to leverage data effectively in today’s fast-paced environment. Understanding the different types of refresh—scheduled, on-demand, and automated through tools like Power Automate—equips teams with the ability to access up-to-date insights, essential for strategic decision-making.
Implementing best practices such as:
- Limiting data imports
- Optimizing data models
- Scheduling refreshes during off-peak hours
can significantly enhance operational efficiency. Monitoring refresh performance and troubleshooting potential issues ensures that disruptions are minimized, allowing organizations to maintain consistent access to reliable data.
Furthermore, adopting advanced techniques like:
- Incremental refresh
- Dynamic data sources
can revolutionize how businesses manage their data workflows. These strategies not only streamline refresh processes but also empower teams to focus on analyzing insights rather than grappling with data management challenges.
Ultimately, by harnessing the full potential of automatic refresh in Power BI, organizations can transform their data capabilities, driving growth and innovation. The ability to deliver timely insights is not just a competitive advantage; it is a cornerstone for informed decision-making that propels businesses forward in an increasingly data-driven world.
Overview
The article provides a comprehensive guide on how to change data types in Power BI, emphasizing the importance of correctly categorizing information for effective data management and analysis. It outlines various methods, including using the Query Editor, DAX functions, and the Ribbon’s ‘Data Type’ option, while also addressing common challenges and best practices to enhance reporting accuracy and operational efficiency.
Introduction
In the dynamic realm of Business Intelligence, mastering data types in Power BI is not just a technical necessity; it is a strategic advantage that can propel organizations toward operational excellence. Understanding the nuances of data types—whether Text, Number, Date, or Boolean—plays a critical role in ensuring accurate data interpretation and effective reporting.
As organizations increasingly rely on data-driven insights for decision-making, the ability to manage these types effectively becomes paramount. This article delves into the essential methods for changing data types, highlights common challenges faced during this process, and outlines the myriad benefits of proper data type management.
By embracing best practices and leveraging advanced tools, users can transform their data management processes, enhancing both the quality of insights and the overall efficiency of their Power BI solutions.
Understanding Data Types in Power BI
In a business intelligence tool, specifying information types is essential to efficient information management, particularly in a setting increasingly dependent on Business Intelligence (BI) for informed decision-making. The primary information types—Text, Number, Date, and Boolean—have distinct characteristics that significantly influence how Power BI changes data type and interprets and processes information. For instance, a column designated as Text restricts mathematical operations, while a Number column is designed for aggregation and statistical analysis.
This distinction is essential not only for crafting precise reports and impactful visualizations but also for overcoming common challenges such as time-consuming report creation and inconsistencies. As Harris Amjad accurately notes,
Descriptive statistics also aid us in comprehending the environment surrounding us,
highlighting that the appropriate categories enhance better insights. Incorrectly assigning classifications can result in mistakes in computations and misrepresentations in visual displays, highlighting the significance of precise categorization when you need to use Power BI to change data type.
The real-world consequences of mismanagement of information classifications are illustrated in a worked example of view and viewer metrics, showcasing how metrics derived from user interactions with reports clarify the essential nature of information categories in evaluating report performance. Moreover, utilizing RPA tools such as EMMA RPA and Automate can simplify workflows and improve efficiency, making it even more essential to handle information categories effectively. For example, the standard deviation for profit and revenue columns can be calculated by creating separate measures and selecting ‘Standard Deviation’ from the ‘Statistics’ options, providing further context on the importance of precise information.
By mastering information categories and utilizing RPA solutions, users can significantly enhance report precision and the overall effectiveness of their BI solutions, transforming information into a powerful asset for growth and innovation.
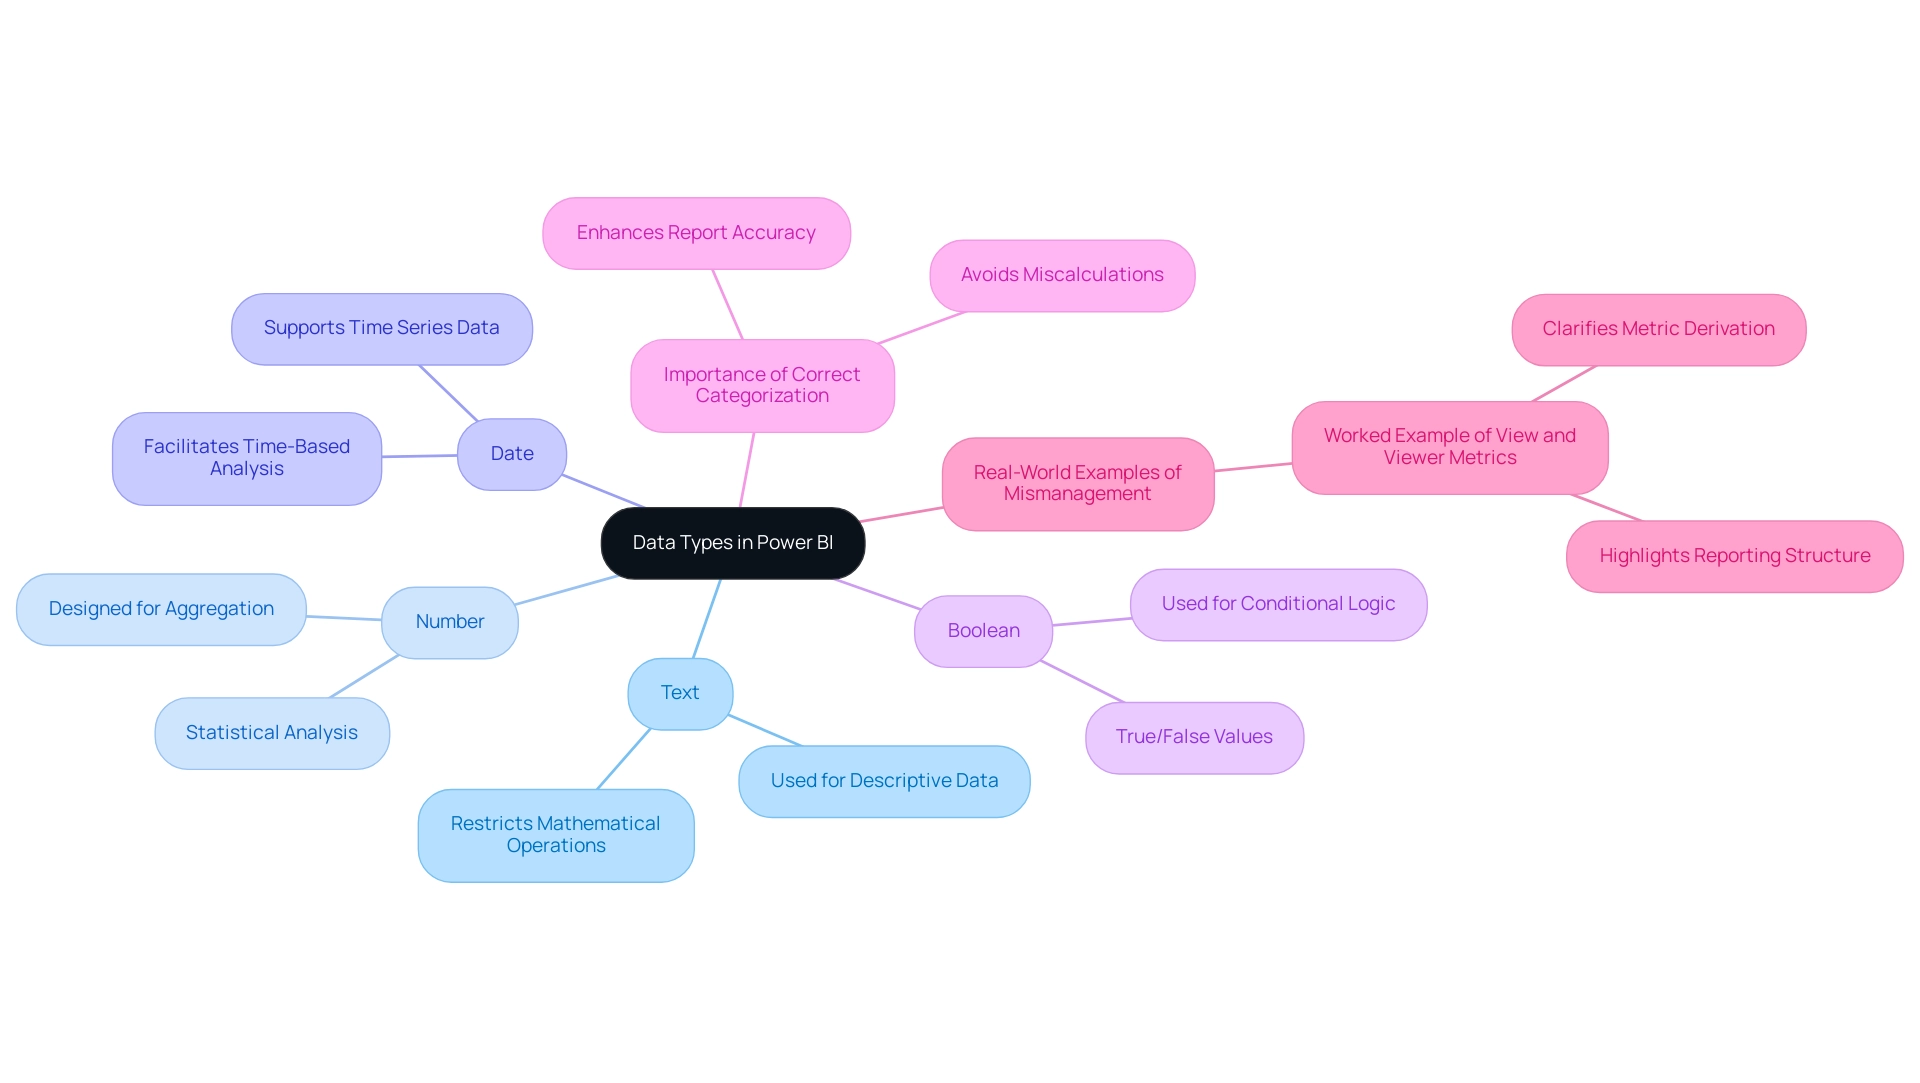
Methods for Changing Data Types in Power BI
-
Using the Query Editor: Access the Query Editor by clicking on ‘Transform Data’. Select the column you wish to modify, right-click on it, and choose the ‘powerbi change data type’ option from the context menu. This intuitive approach enables you to effortlessly choose your preferred information category, ensuring your information aligns with your analytical requirements. Power BI supports various information forms, including text, numbers, dates, and geographical information, making it versatile for different analytical scenarios and essential for generating actionable insights that drive growth.
-
Utilizing the Information Model: Navigate to the Model view and select the column in question. In the Properties pane, you can easily modify the information category from a dropdown menu. This approach is especially advantageous for users who favor handling information categories at the model level for uniformity across reports. Establishing uniform information management practices can assist in alleviating typical issues like inconsistencies in reporting.
-
Utilizing DAX Functions: For individuals working with calculated columns, applying DAX functions such as
FORMAToffers a strong method to clearly specify the information category when creating new columns. This method is particularly beneficial when you need to create new categories based on current information, allowing for greater versatility in your information management. Such adaptability is crucial in a data-rich environment where timely insights are key to operational efficiency. -
Navigating the Ribbon’s ‘Data Type’ Option: In the Data view, select your target column and head to the ‘Column tools’ tab on the ribbon. Here, you can choose the suitable type from the ‘Type’ dropdown. This option simplifies the process for individuals who favor a visual method for information management in Power BI, particularly when they need to change data types, thereby improving engagement and the overall effectiveness of BI.
-
Integrating RPA Solutions: To further improve information management processes, consider implementing Robotic Process Automation (RPA) solutions. RPA can automate repetitive tasks involved in preparation and reporting, significantly reducing the time spent on manual entry and allowing teams to focus on analysis and insight generation. This integration is essential for addressing challenges like time-consuming report creation and ensuring consistency across your BI dashboards.
Each of these methods provides unique benefits suited to various user preferences and contexts. As you explore these options, consider the latest updates in Power BI for 2024, which enhance the Power Query Editor’s functionality, making the process even more efficient. Furthermore, utilizing unique formats, such as Image URL and Web URL, can enhance the interactivity and visual attractiveness of your reports, offering instant access to external resources.
For example, utilizing these unique formats enables individuals to showcase images and generate clickable hyperlinks in reports, improving engagement. A recent user, Nikola, noted,
And, the entire model size is now ca. 220 MB instead of 635 MB,
emphasizing the significance of effective information management in enhancing performance.
Furthermore, it’s important to mention that Fixed Decimal Number formats permit four digits to the right of the decimal separator, accommodating up to 19 significant figures, which is essential for accurate information management.
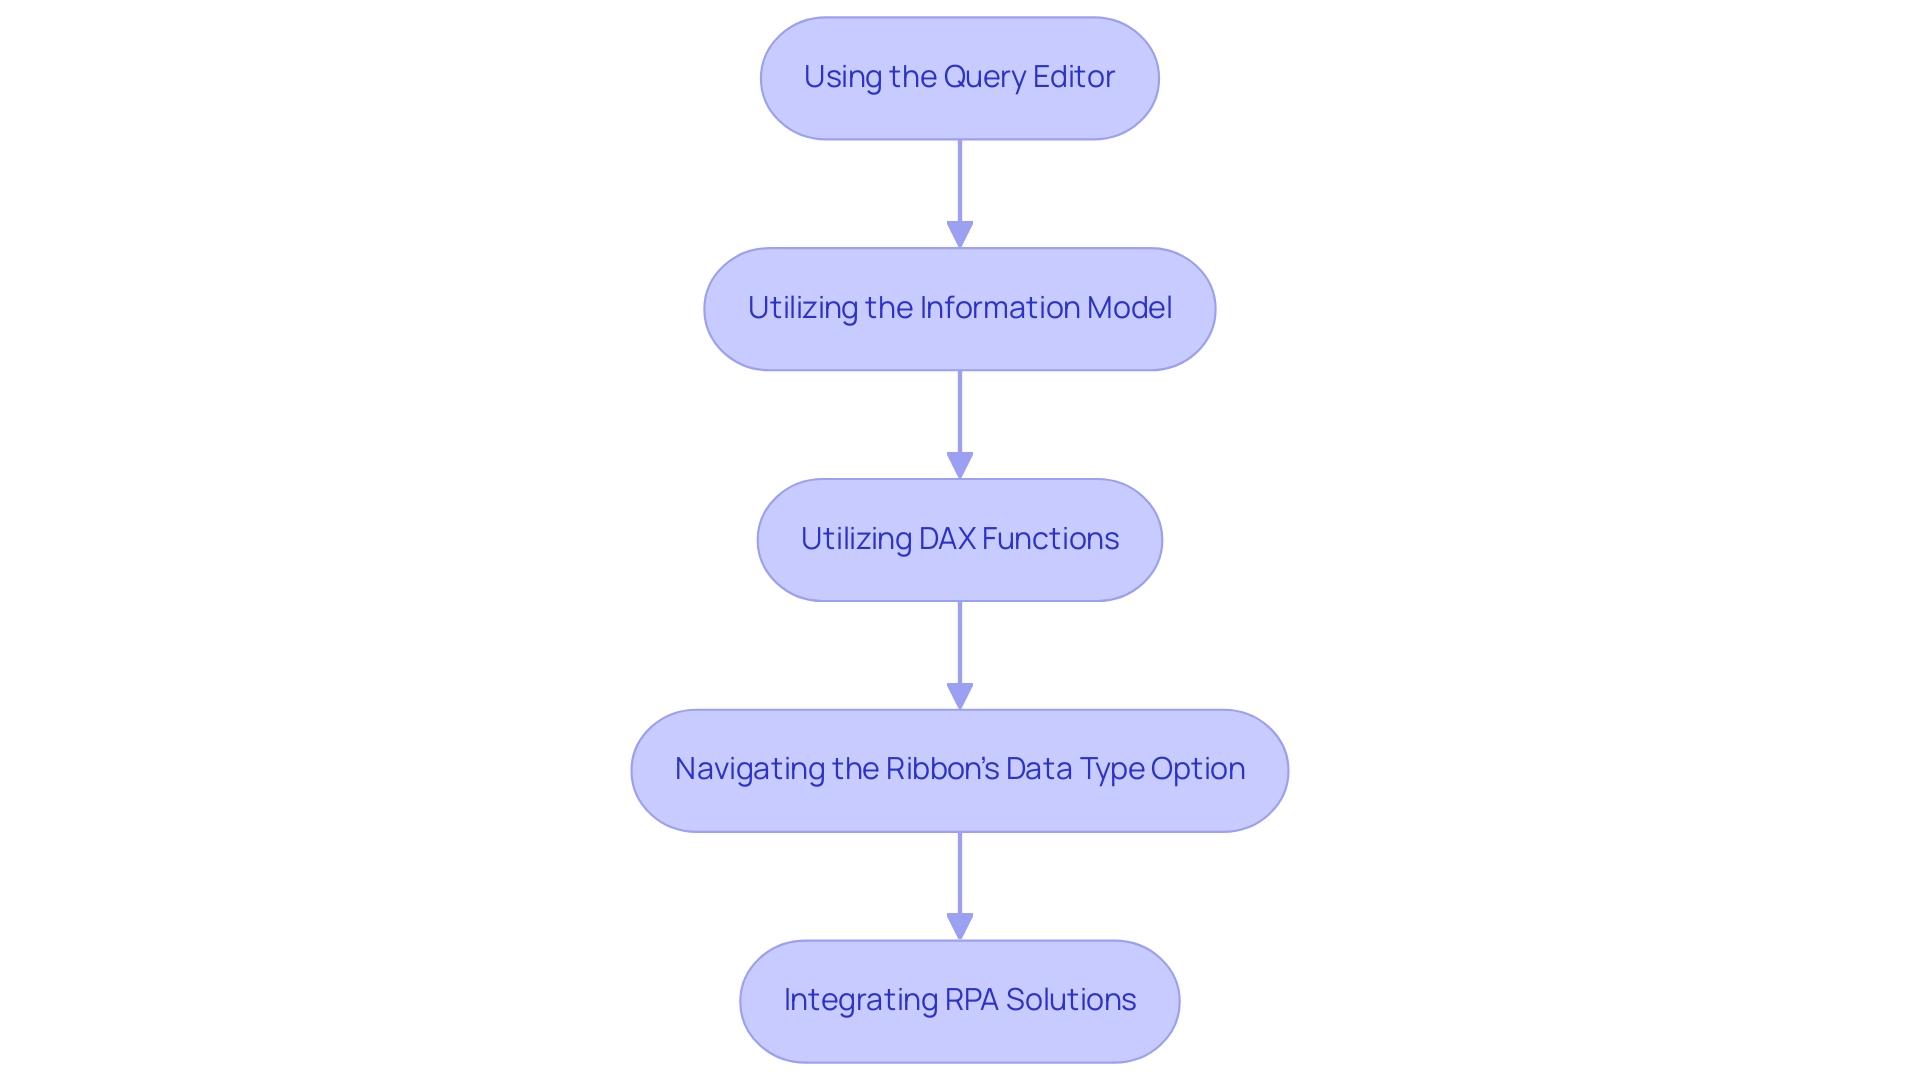
Common Challenges When Changing Data Types
Changing data types in Power BI can present several notable challenges that users should be aware of, especially in the context of leveraging Business Intelligence and RPA for operational efficiency:
-
Information Loss: Changing a column from a more specific format, such as Date, to a broader format like Text can lead to considerable information loss or misinterpretation of values. This misstep can lead to inaccurate reporting and analysis, hindering your ability to draw meaningful insights that drive business growth and may place your organization at a competitive disadvantage.
-
Incompatibility Issues: Actions conducted on incompatible formats frequently result in mistakes. For instance, attempting to sum a column formatted as Text will result in a failure, disrupting workflow, productivity, and the overall decision-making process. Tools like EMMA RPA can assist in automating validation processes, decreasing the chances of such errors.
-
Performance Impact: Frequent alterations to formats can negatively influence report performance, especially in large collections. It is recommended to finalize information categories early in the preparation process to maintain optimal performance and ensure that your dashboards provide timely insights. Automate can assist in streamlining these processes, enhancing operational efficiency.
-
Information Format Conflicts: In instances where an information source contains varied formats within a single column, BI may default to a format that does not align with expectations, leading to confusion and potential errors that could hinder effective information utilization.
To effectively mitigate these challenges, it is crucial for users to thoroughly review their information both before and after executing a powerbi change data type, ensuring consistency throughout their datasets. This vigilance can significantly reduce the risk of encountering these common issues, allowing for a smoother information management experience in BI. As Stephanie William aptly inquired, “I would like to know if it’s possible to convert profile information into the Power BI dash?”
Numerous individuals are seeking to utilize information effectively, and grasping these challenges is an essential step toward accomplishing that objective. Notably, with 7,019 users currently online, this topic resonates with a broad audience. Furthermore, the case study on the Blank Format in DAX demonstrates how the Blank format signifies SQL nulls and can be generated using the BLANK function, emphasizing effective management of null values within BI models and showcasing practical solutions to the format challenges discussed.
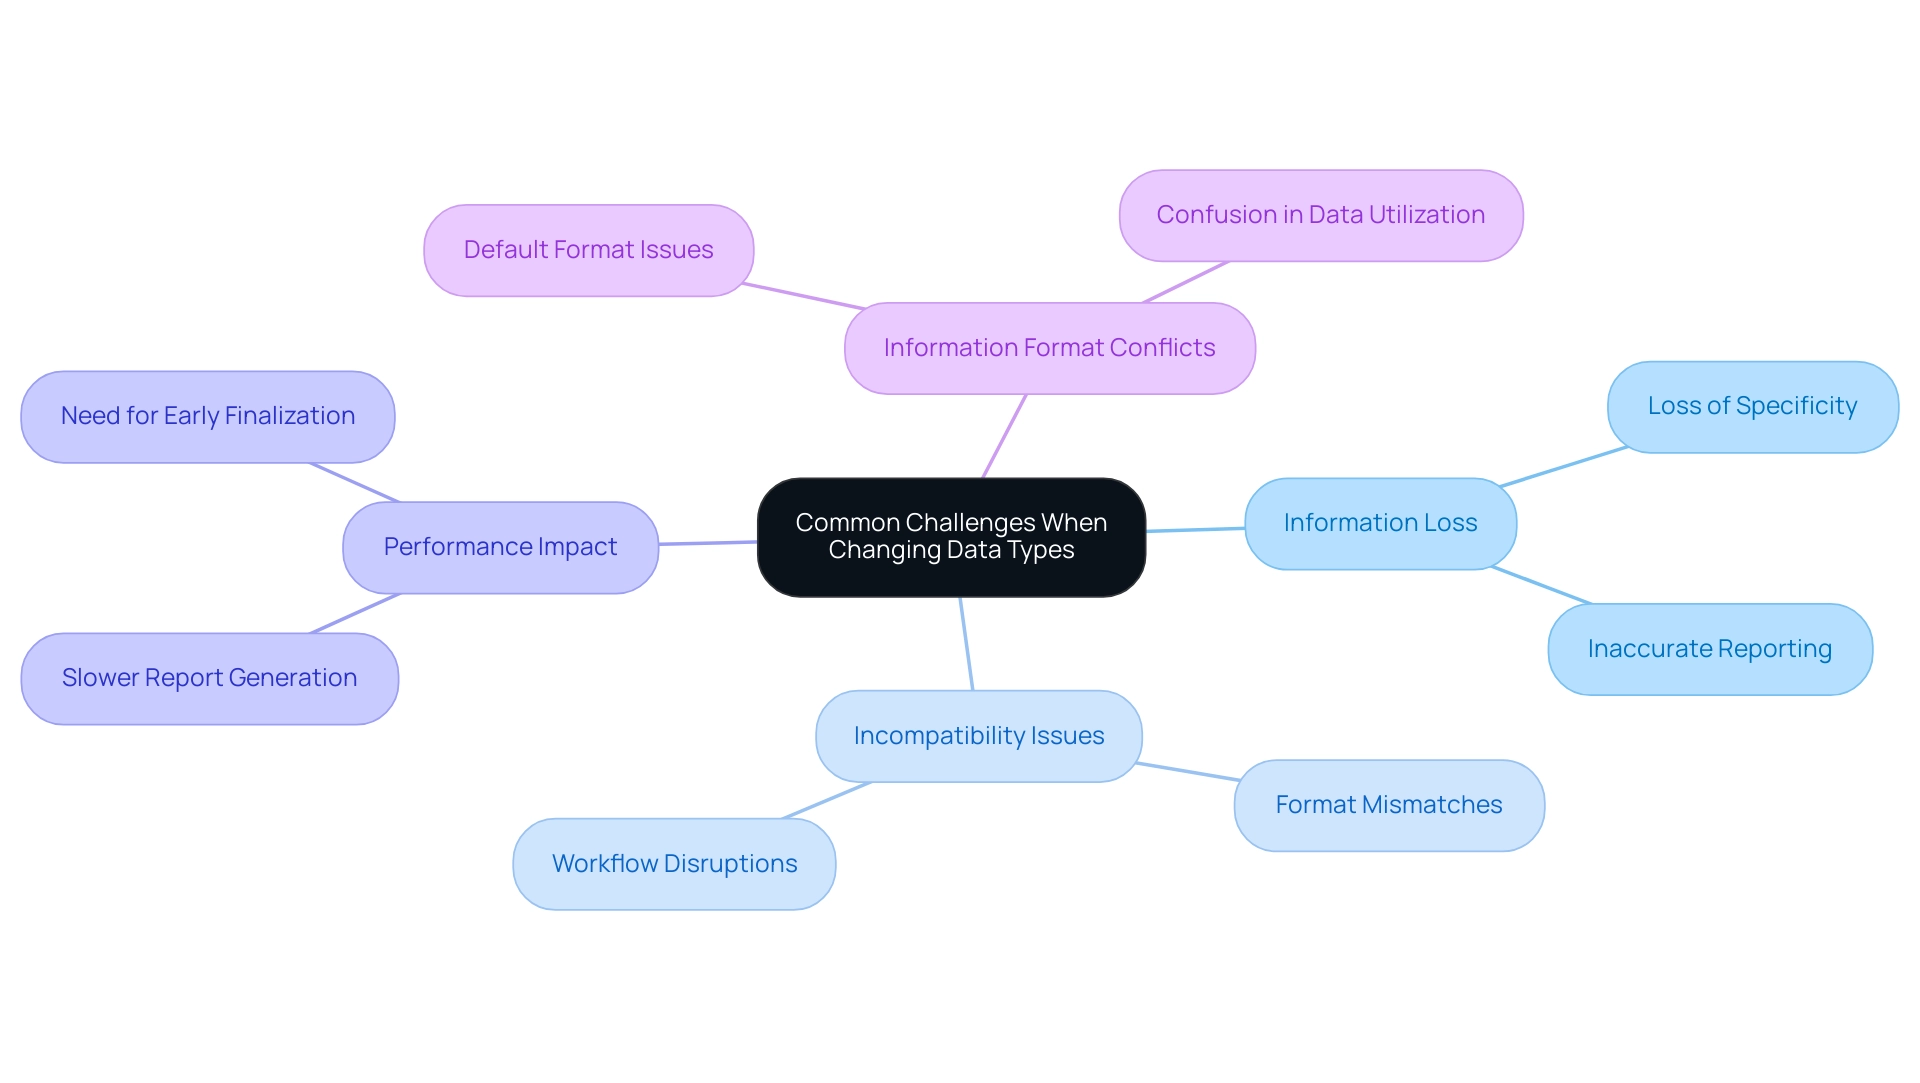
Benefits of Proper Data Type Management
Efficient handling of information categories in BI provides numerous benefits that can greatly improve operational productivity, particularly when integrated with Robotic Process Automation (RPA):
- Enhanced Information Precision: By ensuring that each unit of information is assigned the correct category, calculations and analyses are based on accurate details. This minimizes errors and discrepancies, ultimately leading to more reliable insights. Significantly, the Power BI model accommodates dates ranging from 1900 to 9999, which highlights the necessity of precise classification for temporal information.
- Improved Efficiency: Refining information categories directly contributes to better report performance. Users can anticipate faster load times and more responsive interactions, which are crucial for timely decision-making. When RPA is utilized to automate information input and processing, such as entry from forms and report generation, the efficiency gains are compounded, allowing teams to focus on strategic tasks.
- Improved Information Representation: Precise categories enable visualizations to genuinely reflect the foundational information, promoting deeper analysis and more knowledgeable business choices. With the appropriate information categories, the insights obtained from reports become more actionable, further improved by RPA’s capability to optimize information flows and refresh visual representations automatically.
- Streamlined Information Processing: Properly managed formats simplify the processes of information transformation and maintenance. This not only facilitates easier updates to datasets but also ensures that information remains relevant and usable over time. In the Modeling section, individuals can clearly use PowerBI to change the data type of a chosen column for improved analysis, which is a useful measure that enhances overall information management.
An engaging example of efficient information format management is demonstrated in the case study on Automatic Information Refreshes. The software offers automatic refresh tools for datasets, enabling individuals to view updated insights without manual intervention. This feature, accessible for BI Pro and Premium members, improves information management efficiency and demonstrates the advantages of appropriate information categorization, especially when combined with RPA processes.
As emphasized by analytics enthusiast Douglas Rocha,
Yes, you can, you can do it without measures as well and I will teach you how at the end of this tutorial.
By prioritizing information category management and integrating RPA, users can dramatically enhance their BI experience, driving better business outcomes and maximizing the potential of their information. To learn more about how RPA can transform your information management processes and save time and resources, explore our additional resources.
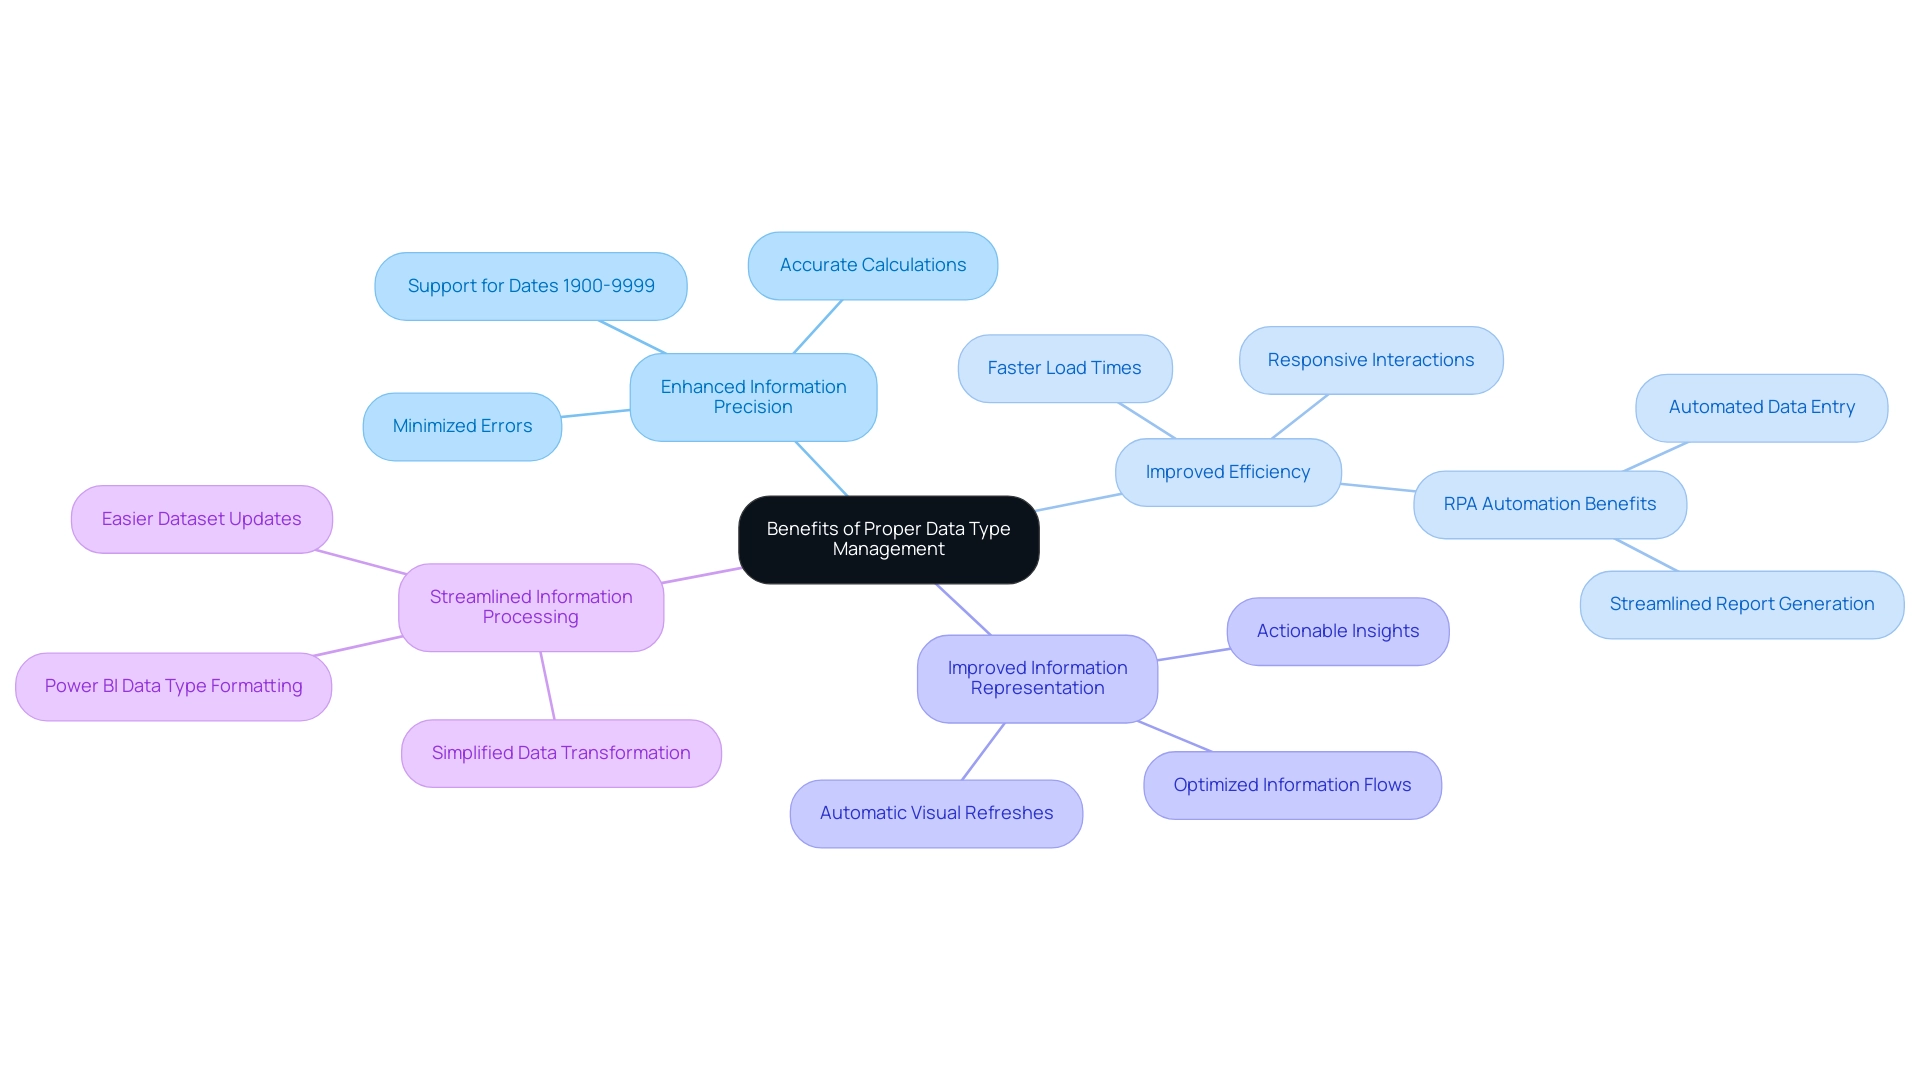
Best Practices for Managing Data Types in Power BI
Effectively handling information categories in BI is essential for improving quality and ensuring precise reporting, directly influencing your operational efficiency and decision-making abilities. Here are essential best practices to consider:
-
Review Information Sources: Regularly evaluate the information categories present in your source files.
This proactive step ensures they align with your analysis requirements before bringing them into BI. With Power BI accommodating dates from 1900 to 9999, comprehending your categories becomes even more essential for effective reporting. -
Establish Consistency: Consistently apply similar information categories across various datasets.
This practice not only mitigates confusion but also decreases the risk of mistakes during analysis, ensuring that your insights are reliable. -
Document Changes: Maintain a comprehensive record of any modifications made to information types, along with the rationale behind these changes.
Such documentation proves invaluable for troubleshooting and maintaining clarity in your information management processes. -
Utilize Information Profiling: Take advantage of Power BI’s information profiling features to gain insights into the distribution and nature of your columns.
This understanding empowers you to make informed decisions and enhances the overall quality of your datasets. -
Train Team Members: Foster a culture of information quality by educating your team on the importance of categories and effective management strategies.
A knowledgeable team can significantly enhance the integrity of your information processes, ultimately resulting in more actionable insights.
By applying these best practices, including the PowerBI change data type feature, you can ensure that your types are meticulously managed, leading to improved analysis and more dependable reporting outcomes. For instance, a global company with over 400,000 employees successfully automated reporting from Salesforce, Webeo, and LinkedIn Ads, reducing manual work from 6 hours per report refresh to daily updates. Additionally, our 3-Day BI Sprint can help streamline this process by creating a fully functional, professionally designed report on a topic of your choice, allowing you to focus on utilizing insights rather than getting bogged down in report creation.
Bill Schmarzo aptly states,
By adopting these best practices for Power BI modeling, you’re not just improving your reports—you’re transforming how your organization makes informed decisions.
Furthermore, consider leveraging custom connectors from companies like Vidi Corp, which specialize in integrating various data sources, further enhancing your data management capabilities and driving efficiency in your business operations. Such transformations are pivotal in today’s data-centric environment.
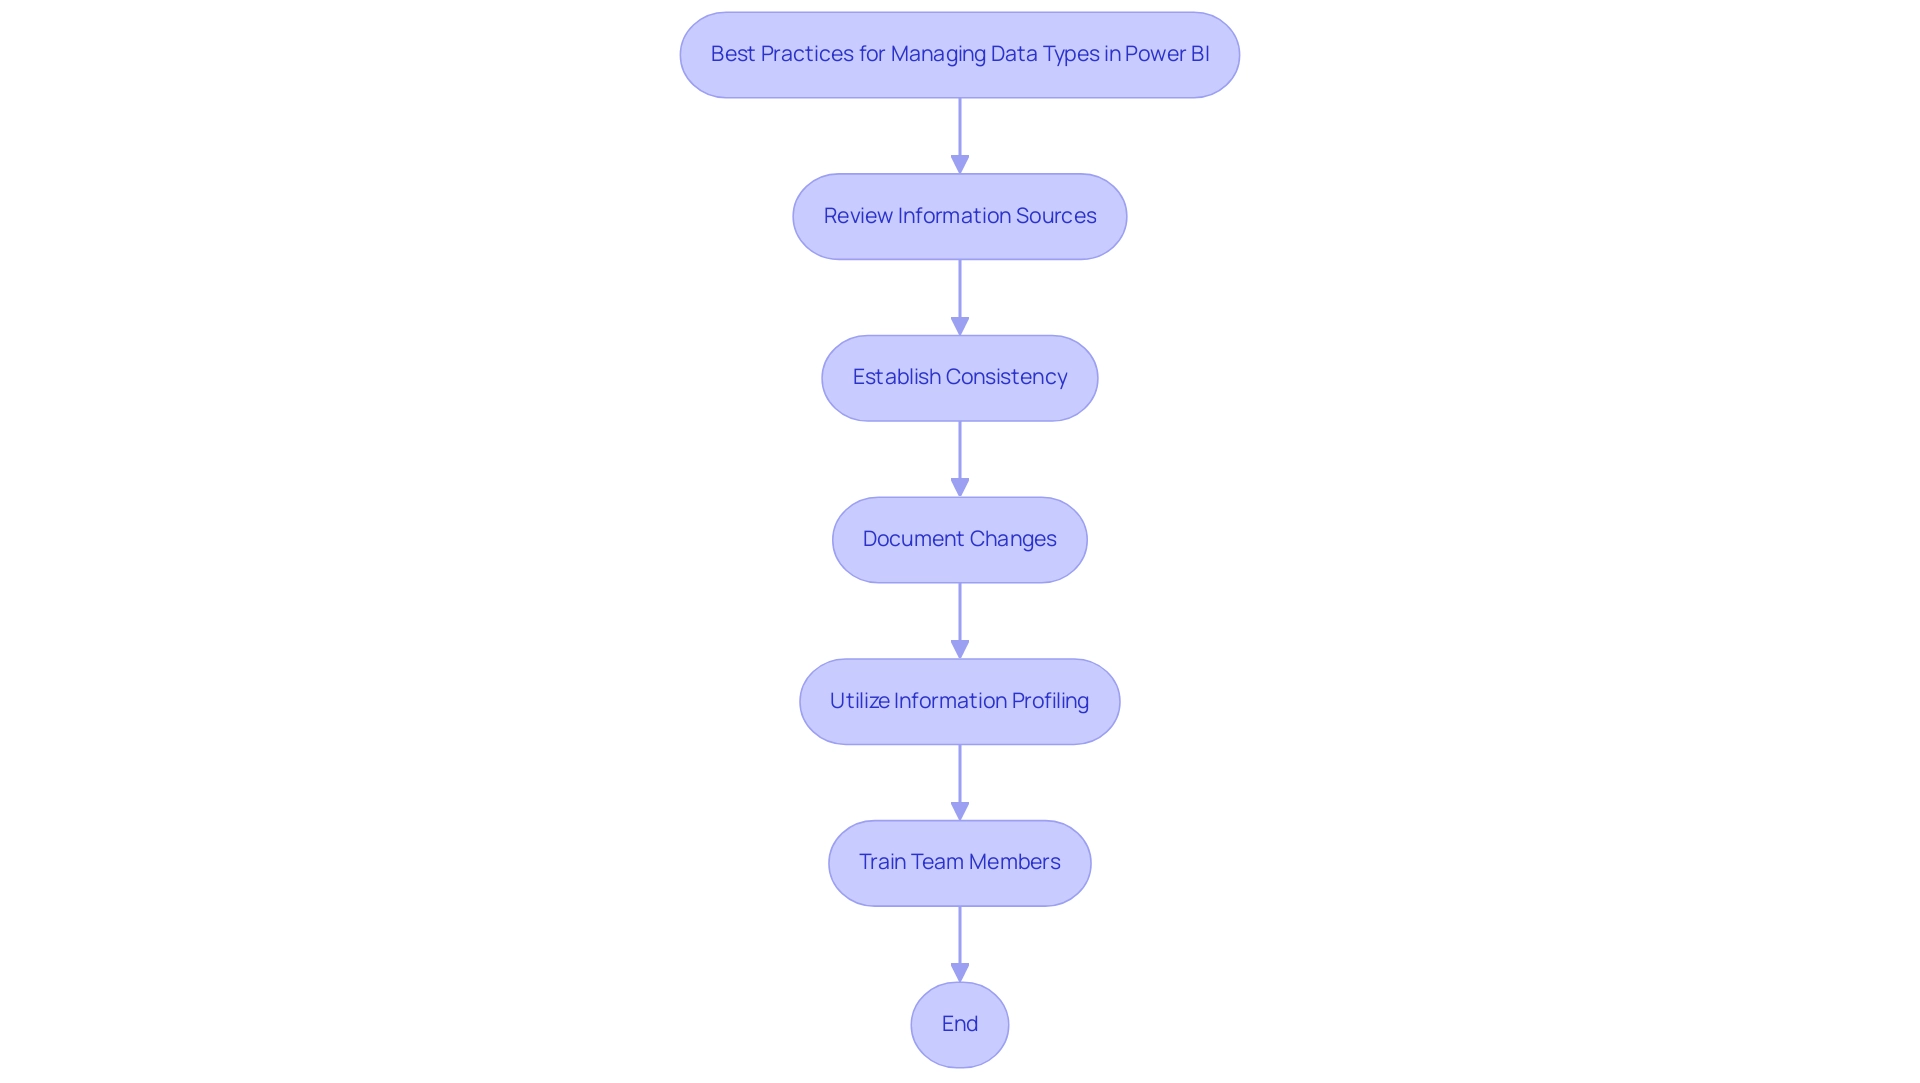
Conclusion
Mastering data types in Power BI is a critical component of effective data management that can significantly enhance organizational performance. By understanding and accurately defining the primary data types—Text, Number, Date, and Boolean—users can ensure precise data interpretation and reporting. The methods for changing data types, whether through the Power Query Editor, Data Model, DAX functions, or RPA solutions, empower users to tailor their data management processes to meet specific analytical needs.
Challenges such as data loss, incompatibility issues, and performance impacts can hinder effective decision-making if not addressed properly. Awareness of these challenges allows users to implement best practices that promote data consistency and accuracy. The benefits of proper data type management are manifold, including improved data accuracy, enhanced performance, and better visualization, all of which contribute to more informed business decisions.
By embracing these strategies and integrating advanced tools like RPA, organizations can transform their data management practices, leading to operational excellence. The proactive approach to data type management not only streamlines processes but also maximizes the potential of data as a powerful asset for growth and innovation. Prioritizing these best practices will pave the way for achieving significant improvements in reporting accuracy and efficiency, ultimately driving better business outcomes.
Overview
The article provides a comprehensive step-by-step guide on how to use the ReplaceValue function in Power Query, emphasizing its role in data cleaning and transformation processes. It outlines the function’s syntax, practical applications, troubleshooting tips, advanced techniques, and best practices, demonstrating how effective use of ReplaceValue can enhance data reliability and operational efficiency in business intelligence contexts.
Introduction
In the realm of data management, efficiency and accuracy are paramount, especially when it comes to transforming datasets for analysis. The ReplaceValue function in Power Query emerges as a powerful ally for users striving to enhance their data cleaning processes. By enabling seamless value replacements, this function not only corrects inaccuracies but also standardizes entries, paving the way for reliable insights.
As organizations increasingly adopt Robotic Process Automation (RPA) tools like EMMA RPA and Power Automate, the integration of such capabilities becomes essential for streamlining workflows and minimizing manual intervention.
This article delves into the intricacies of the ReplaceValue function, offering:
- Practical applications
- Troubleshooting tips
- Advanced techniques
to empower users in their data transformation journey. By mastering these tools, businesses can unlock the full potential of their data, driving informed decision-making and fostering growth in an ever-evolving digital landscape.
Understanding the ReplaceValue Function in Power Query
The Power Query ReplaceValue function is an invaluable tool for users aiming to streamline their cleaning processes by substituting specific values within a column. This capability is especially advantageous for correcting errors and standardizing entries, ensuring that your information is both accurate and reliable. By incorporating Robotic Process Automation (RPA) into your workflows, such as utilizing EMMA RPA or Automate, you can improve efficiency and lessen the manual effort involved in preparation tasks.
Notably, Power Query performs data profiling over the first 1,000 rows of your data by default, allowing users to assess the quality and distribution of their datasets effectively. The syntax for the power query replacevalue method is structured as follows: Table.ReplaceValue(table as table, oldValue as any, newValue as any, replacer as function). Here’s a detailed breakdown of the parameters involved:
- table: This represents the input table you wish to modify.
- oldValue: This is the value that you aim to replace.
- newValue: This is the value that will take the place of the old value.
- replacer: This parameter specifies the method that determines how the replacement will take place, with
Replacer.ReplaceValuebeing the common choice for straightforward value substitutions.
Understanding the nuances of this function is crucial, as it establishes the foundational capability for transforming information with power query replacevalue. By mastering power query replacevalue, users position themselves to efficiently clean and prepare their datasets for analysis, aligning with the increasing emphasis on effective transformation techniques in analytics throughout 2024.
A recent case study on information profiling illustrates that understanding the quality and distribution of information is essential for effective cleaning, especially in light of challenges like poor master information quality and barriers to AI adoption. Recent updates to Query have further refined these functionalities, enhancing users’ ability to manage and manipulate their information with greater precision. Unlocking the power of Business Intelligence through these transformation techniques can drive informed decision-making, ultimately supporting your organization’s growth and strategic objectives.
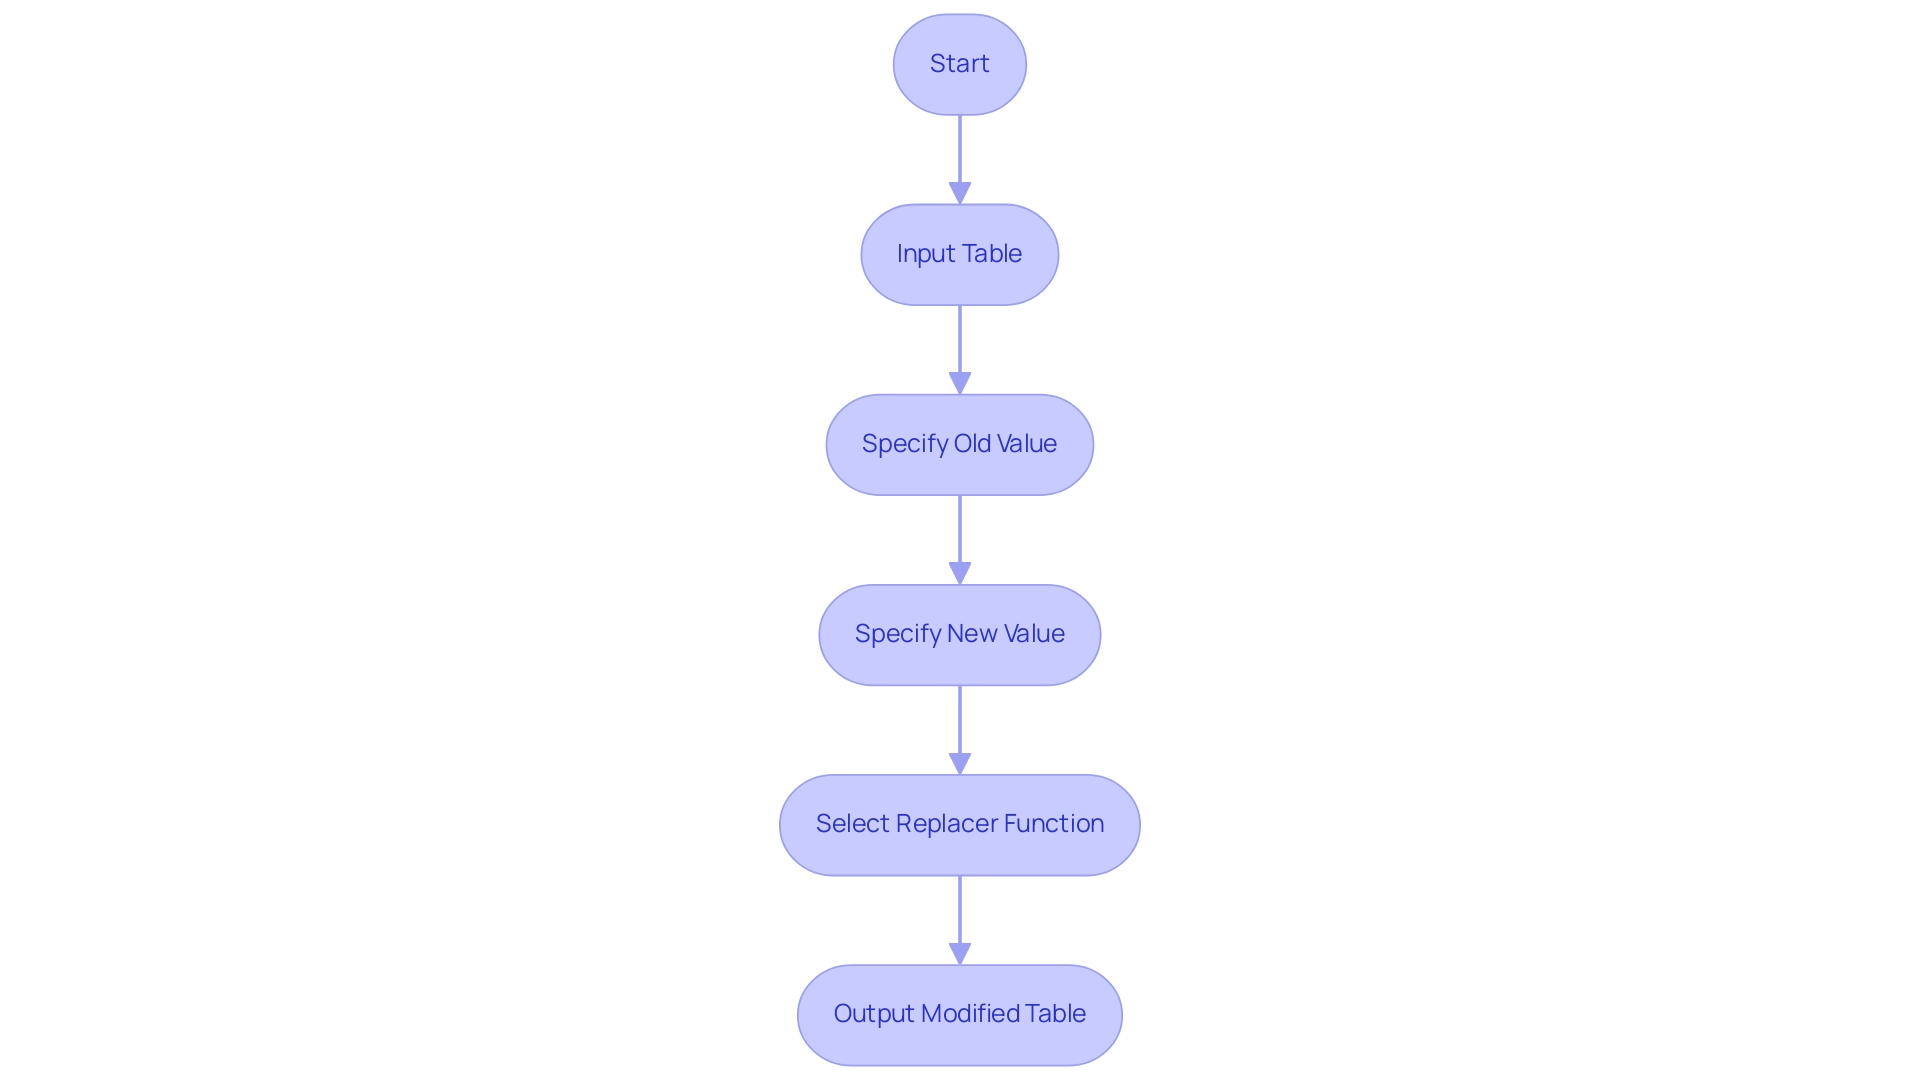
Practical Applications of ReplaceValue: Step-by-Step Examples
Let’s delve into practical applications of the Replace Value function in Power Query, which can significantly enhance your data cleaning processes and support your business intelligence initiatives, particularly when paired with RPA solutions like EMMA RPA and Power Automate for improved operational efficiency:
- Correcting Typos: Imagine a scenario where your product database contains misspellings. For instance, if ‘Appl’ is incorrectly listed instead of ‘Apple’, you can rectify this easily with the following command:
Table.ReplaceValue(yourTable, 'Appl', 'Apple', Replacer.ReplaceValue, {'ProductName'})
This simple replacement ensures your product names are accurate, improving overall data reliability and empowering your decision-making processes.
- Standardizing Values: Information inconsistency can hinder analysis, particularly when poor master quality is an issue. If your dataset shows varying formats for ‘Yes’ and ‘No’ responses, such as ‘Y’ and ‘N’, standardizing these can streamline your processing.
Use:
Table.ReplaceValue(yourTable, 'Y', 'Yes', Replacer.ReplaceValue, {'Response'})

   Table.ReplaceValue(yourTable, 'N', 'No', Replacer.ReplaceValue, {'Response'})
This method ensures uniformity across your responses, enhancing clarity and operational efficiency. Additionally, as highlighted by the PROPER formula in Excel, proper formatting is crucial for maintaining information quality, ensuring consistency in textual content.
- Updating Status Codes: When replacing status codes, like translating ‘1’ to ‘Active’ and ‘0’ to ‘Inactive’, you can utilize:
Table.ReplaceValue(yourTable, 1, 'Active', Replacer.ReplaceValue, {'Status'})

   Table.ReplaceValue(yourTable, 0, 'Inactive', Replacer.ReplaceValue, {'Status'})
This step not only clarifies status indicators but also aids in data interpretation, facilitating better decision-making in your operations.
These examples demonstrate the effectiveness of the power query replacevalue function for cleaning and transformation activities in Query. By automating these menial tasks, the power query replacevalue feature enables users, even those without coding expertise, to maintain quality and prepare sets efficiently for further analysis. As Harry Fry once stated, “If you can’t explain something to a five-year-old, you don’t really understand it yourself,” highlighting the significance of clarity in information processes.
Moreover, understanding the quality and distribution of information is essential for effective cleaning, especially as organizations face barriers to AI adoption due to information quality issues. The case study on information profiling demonstrates how users can gain insights into the structure and characteristics of their dataset, helping to identify potential issues and anomalies. Such insights improve the efficiency of the value substitution process and contribute to your business’s growth and innovation.
Remember, failing to extract meaningful insights from your information can leave your business at a competitive disadvantage, underscoring the urgency of adopting effective management practices.
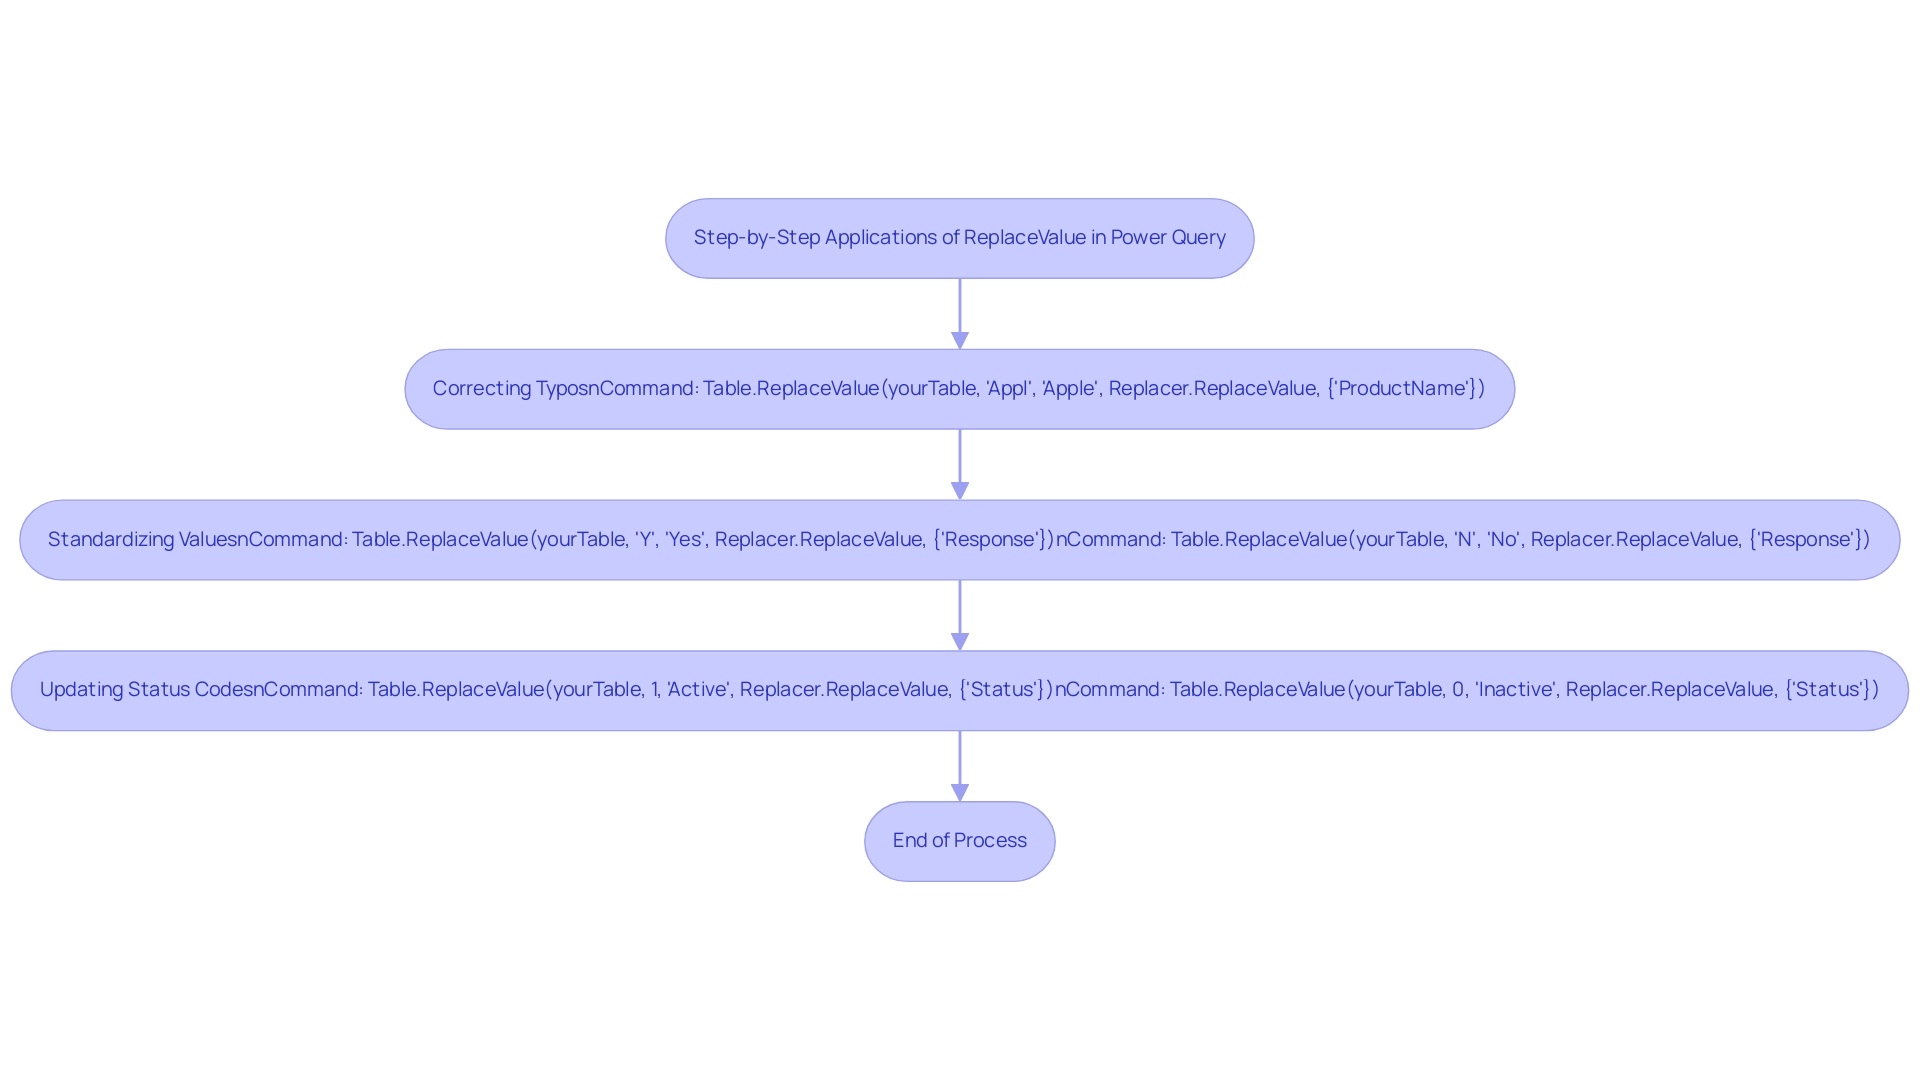
Troubleshooting Common Issues with ReplaceValue
When employing the substitution method in Power Query, users may face several typical problems that can obstruct their transformation efforts, particularly in the context of addressing technology implementation challenges. Considering that 44% of organizations are worried about needing to form a team to lead their transformation, tackling these challenges is essential for effective information handling. Here are key challenges and their corresponding solutions:
-
No Changes Made: If the power query replacevalue function seems ineffective, first verify that the
old Valuespecified is present in the dataset. It’s essential to check for any leading or trailing spaces that might prevent a match. -
Information Type Mismatch: A common problem occurs from type mismatches. Ensure that both the old and new values share the same data type; for instance, if replacing a text value, the new value must also be of text type.
-
In situations needing the substitution of several values, it is essential to call the value replacement method multiple times or use a list for efficient bulk substitutions.
-
Case Sensitivity: The value replacement operation is case-sensitive, meaning that substituting ‘apple’ will not impact ‘Apple’. To address this, handle each case specifically or consider employing a case-insensitive approach with power query replacevalue.
By recognizing these common pitfalls and applying the provided solutions, users can troubleshoot effectively, enhancing their use of the ReplaceValue function. This not only assists in smoother information manipulation but also aligns with the broader organizational goals of optimizing resources and driving transformation effectively. RPA can streamline the process by automating repetitive tasks associated with data manipulation, thus improving operational efficiency and reducing errors.
As organizations increasingly focus on selecting the right technology solutions for their digital transformation, effective troubleshooting of tools like Query is essential for achieving these objectives, ultimately leveraging RPA and tailored AI solutions to drive data-driven insights and operational efficiency.
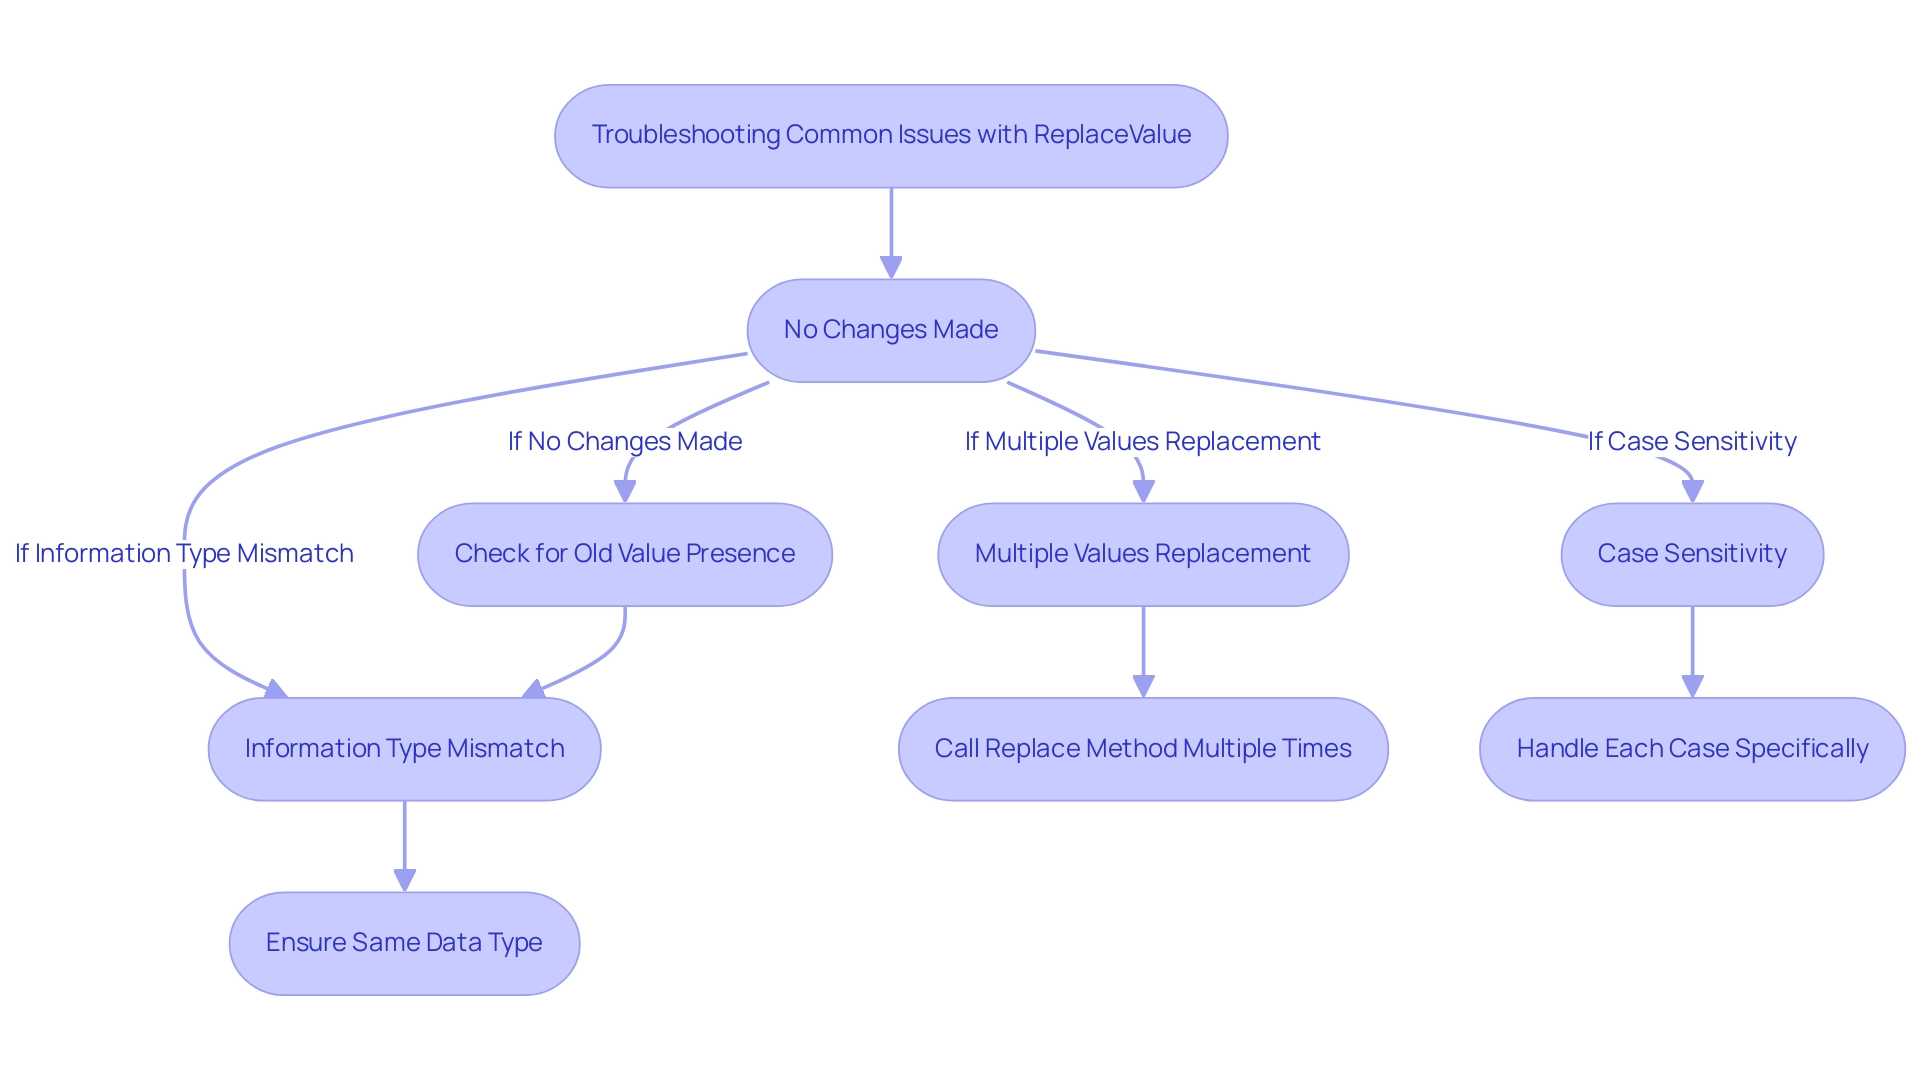
Advanced Techniques: Conditional and Bulk Replacements
To effectively execute conditional replacements with the power query replacevalue method, utilize the if... then statement within a custom column. For instance:
= if [Status] = 'Pending' then 'In Progress' else [Status]
This simple yet powerful technique allows you to customize value replacements based on specific conditions, enhancing the accuracy of your information, reducing errors, and supporting your operational goals in a rapidly evolving AI landscape.
In transformation processes, it is essential to ensure that the independent variables do not correlate highly with each other. Jeff Sauro emphasizes: ‘You also don’t want the independent variables to correlate highly with each other (usually r > .8)—a condition called multicollinearity, which renders the regression equation unreliable.’ This principle emphasizes the importance of effective information processing techniques in fostering insight-driven understanding and operational efficiency for business growth.
For more extensive changes, utilizing the List.Accumulate method can simplify the process of executing multiple replacements at once, a practice aligned with the efficiency objectives of RPA. Here’s how it works:
let

    replacements = { { 'Y', 'Yes' }, { 'N', 'No' } },

    result = List.Accumulate(replacements, yourTable, (state, current) => Table.ReplaceValue(state, current{0}, current{1}, Replacer.ReplaceValue, {'Response'}))

in

    result
This approach not only simplifies bulk replacements but also optimizes your workflow, enabling you to transform data more efficiently, ultimately reducing errors and freeing up your team for more strategic, value-adding work.
By enhancing your data transformation capabilities in Power Query, you will ultimately lead to more insightful and actionable results, aligning your operations with the principles of RPA and business intelligence.
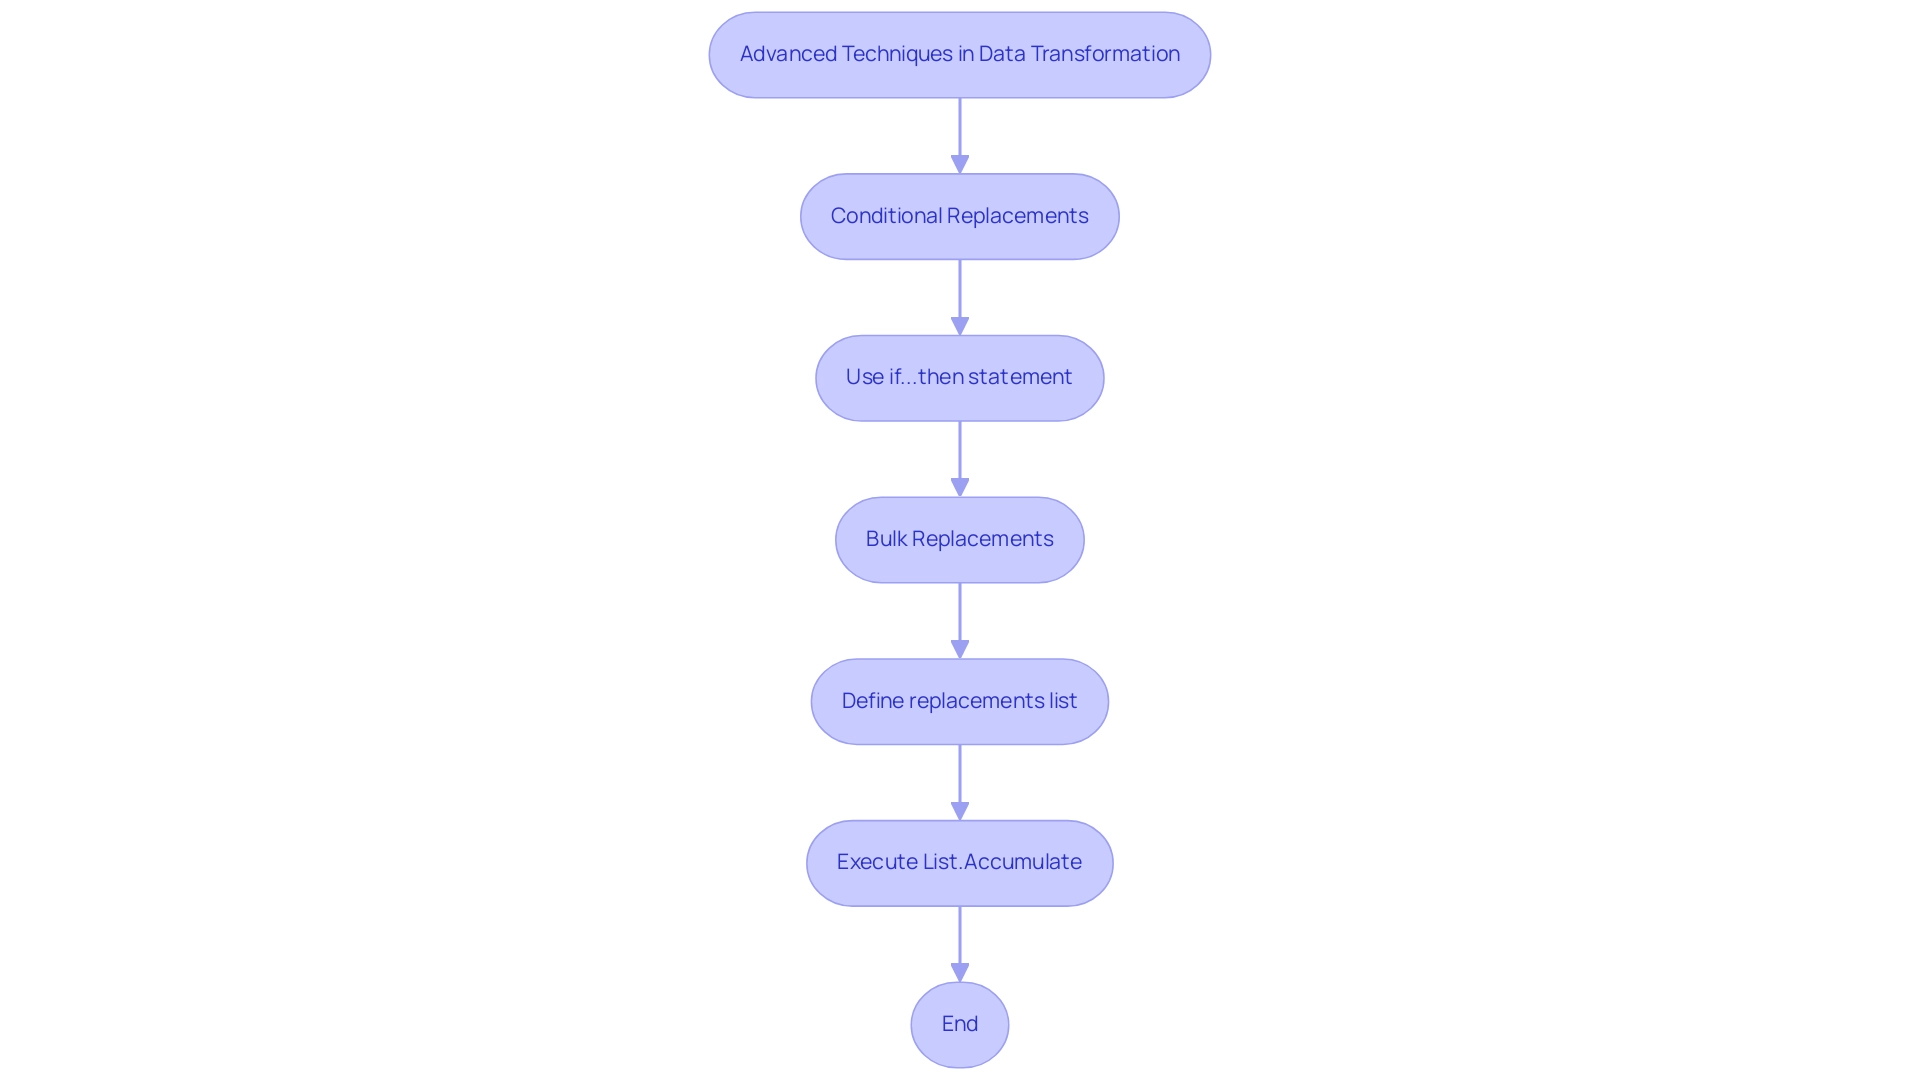
Best Practices for Effective Use of ReplaceValue in Power Query
To effectively utilize the substitution feature in Power Query while tackling common challenges in Power BI, such as time-consuming report generation and inconsistencies, it’s essential to adopt several best practices that enhance both safety and efficiency:
-
Always Backup Data: Before executing any replacements, ensure you create a backup of your original dataset. This precaution safeguards against accidental information loss and permits recovery if necessary, particularly significant when encountering the pressures of tight reporting timelines.
-
Test Replacements: Begin with a smaller dataset to test your substitution function. This approach helps you identify potential issues early, preventing complications when you scale up to larger datasets. For instance, one task involved replacing hundreds of incorrect URLs across 63 blog posts—testing on a smaller scale could have streamlined this process and reduced the overall reporting time.
-
Use Descriptive Names: When crafting custom columns or transformations, opt for descriptive names. This practice clarifies the purpose of each step, making future reference easier and aiding collaboration within your team. Clear naming conventions can also help reduce confusion that arises from inconsistencies.
-
Document Changes: Maintaining a record of modifications made using ReplaceValue is crucial. Documenting original and new values ensures traceability and transparency in your information processes. The case study titled ‘Documenting Cleaning Steps’ illustrates this well; by creating a documentation sheet that describes each step, specifies sources, details transformations, and records filters, teams can track and replicate processes, ensuring integrity and providing actionable guidance for stakeholders. As Neeraj Sharma aptly states,
Remember to regularly update and review the documentation for accuracy and relevance.
This practice is essential for preserving information integrity and trust in your reports. -
Review Value Types: Always verify that the types of the values you are replacing correspond accurately. Mismatched value types can result in errors, complicating your management efforts and the clarity of insights derived from your reports.
By adhering to these best practices, users can harness the full potential of the ReplaceValue function while safeguarding their information and enhancing their overall management strategy in Query. This approach not only prepares and manages information effectively for Power BI reports but also ensures that the insights derived are clear and actionable for stakeholders. Additionally, implementing governance strategies, such as regular audits of data processes and establishing clear guidelines for data usage, can help maintain consistency and trust in the data presented.
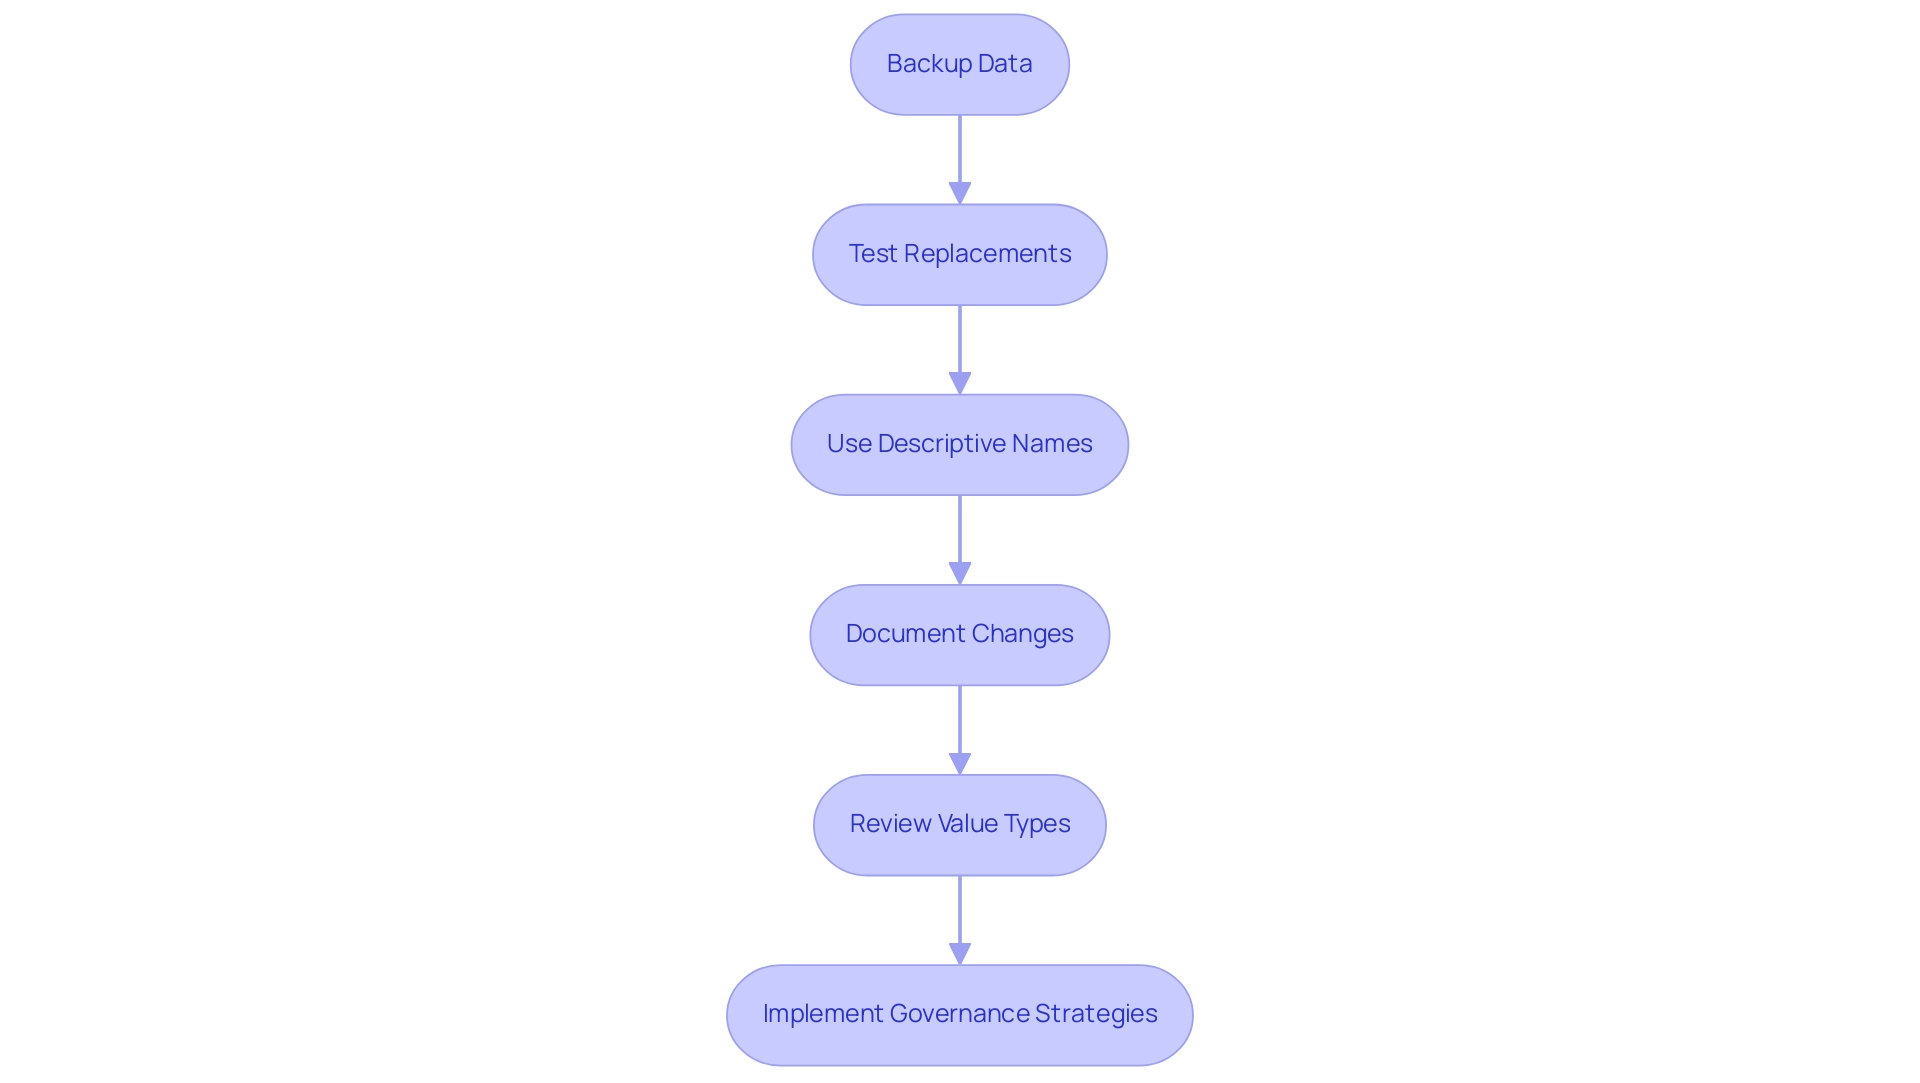
Conclusion
Mastering the ReplaceValue function in Power Query is an essential step towards achieving efficient and accurate data management. By understanding its practical applications, users can easily correct errors, standardize values, and enhance the overall quality of their datasets. The function not only simplifies the data cleaning process but also integrates seamlessly with Robotic Process Automation tools, paving the way for streamlined workflows and reduced manual effort.
Addressing common troubleshooting issues ensures that users can effectively utilize the ReplaceValue function without unnecessary complications. By implementing best practices such as:
– Backing up data
– Testing replacements
– Documenting changes
organizations can safeguard their data integrity while fostering a culture of transparency and collaboration.
Ultimately, the ability to transform data accurately and efficiently is crucial in today’s data-driven landscape. By leveraging the capabilities of Power Query and the ReplaceValue function, businesses can unlock valuable insights that drive informed decision-making and support strategic growth. Embracing these tools and techniques not only enhances operational efficiency but also positions organizations to thrive in an increasingly competitive environment. Now is the time to harness the power of effective data management to propel your organization forward.
