Overview:
Power BI matrix visualizations are crucial for organizing and analyzing complex datasets, allowing users to make meaningful comparisons and derive actionable insights. The article highlights their effectiveness in enhancing clarity through features like expand/collapse functionality and advanced techniques such as conditional formatting and dynamic titles, which collectively improve user engagement and facilitate informed decision-making.
Introduction
In the realm of data visualization, Power BI matrix visualizations stand out as a critical tool for Directors of Operations Efficiency seeking to transform complex datasets into clear, actionable insights. By structuring data into an easily navigable grid format, these visuals empower users to uncover trends and make comparisons that might otherwise remain hidden.
As organizations grapple with the challenges of report creation and data consistency, harnessing the full potential of matrix visuals becomes essential. This article delves into the intricacies of Power BI matrix visualizations, offering a comprehensive guide on their creation, advanced techniques for optimization, and best practices to avoid common pitfalls.
With a focus on integrating innovative features, this exploration aims to equip professionals with the knowledge needed to elevate their data storytelling and drive informed decision-making in a fast-paced, data-driven environment.
Understanding Power BI Matrix Visualizations
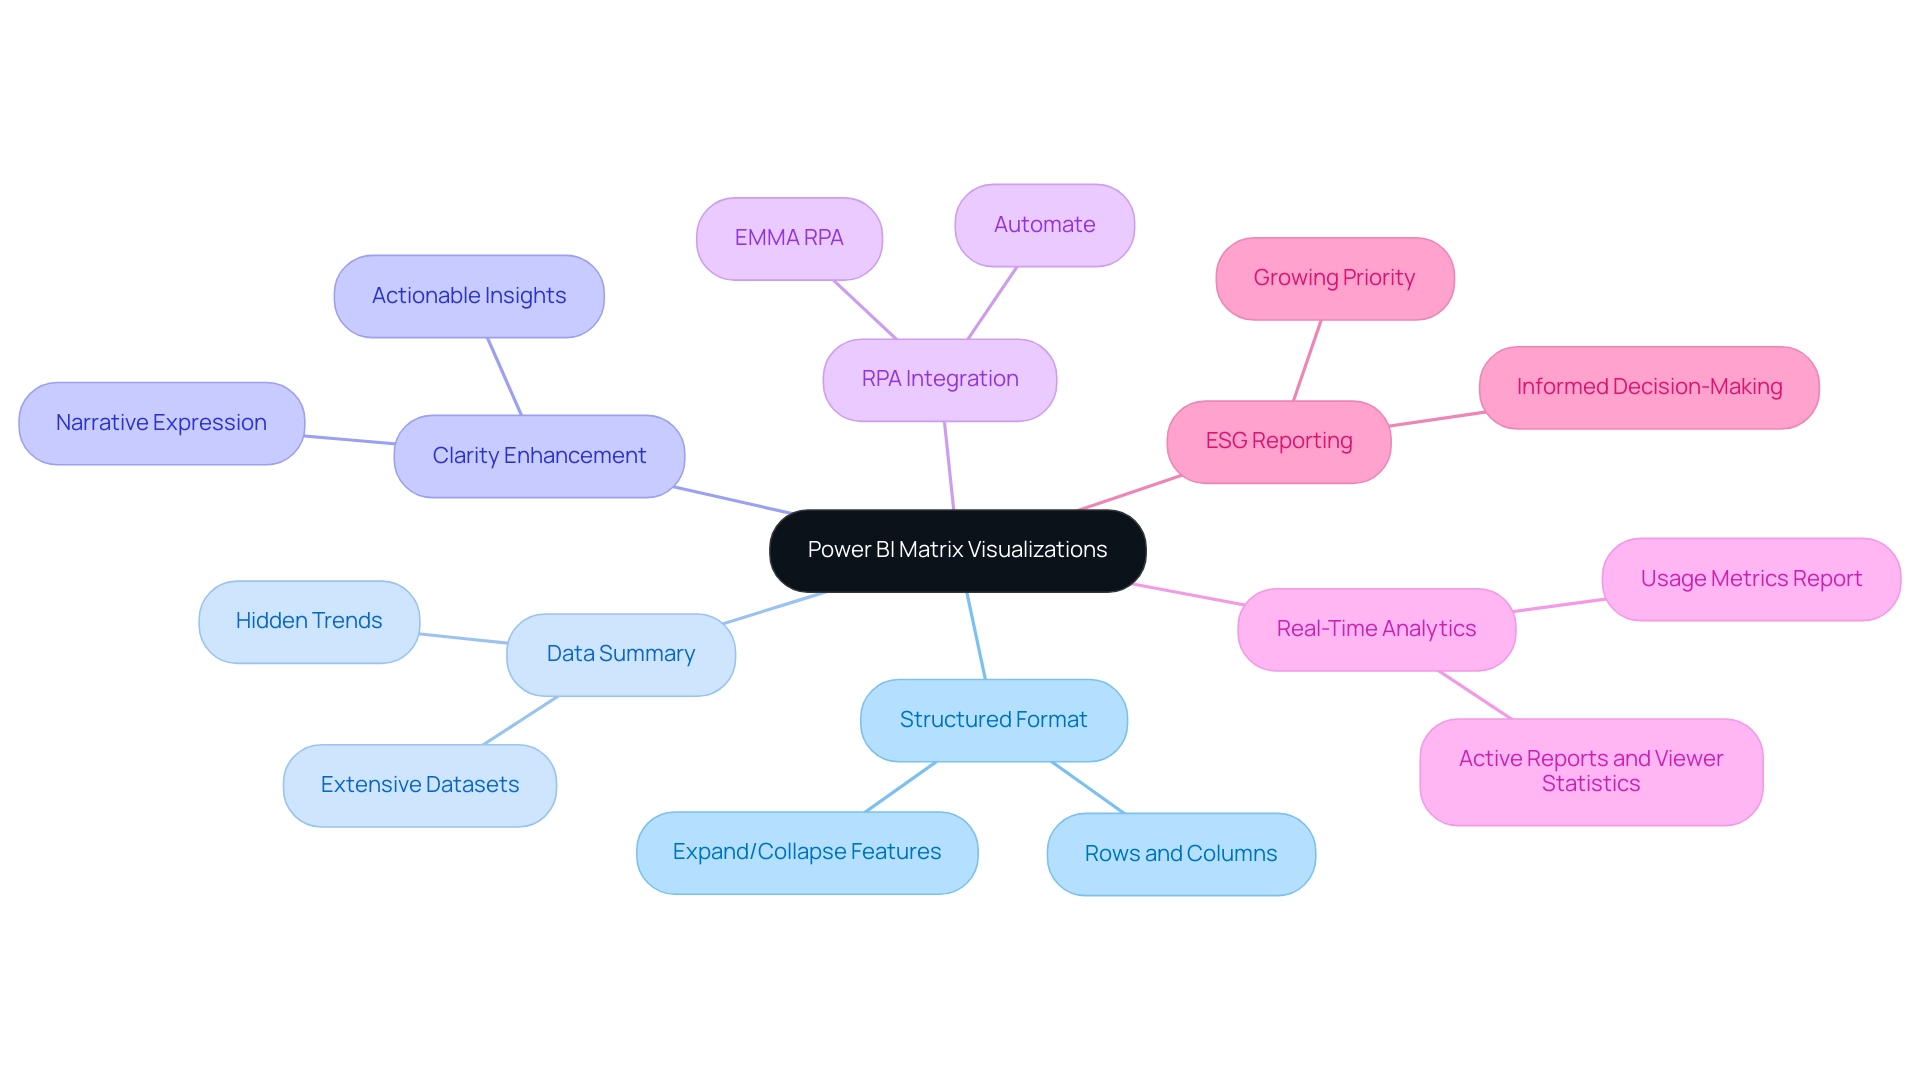
Power BI matrix visualization is essential for showcasing information in a structured format, enabling Directors of Operations Efficiency to make significant comparisons across different dimensions effortlessly. Their design excels in summarizing extensive datasets and uncovering hidden trends that traditional visualizations may overlook. By organizing information into rows and columns, the Power BI matrix visualization enhances clarity through the ability to expand and collapse details, significantly bolstering narrative expression.
This capability not only assists in deriving actionable insights from complex datasets but also addresses common challenges such as time-consuming report creation and inconsistencies. Furthermore, integrating RPA solutions like EMMA RPA and Automate can streamline these processes, helping to mitigate staffing shortages and outdated systems that often hinder operational efficiency. As Douglas Rocha aptly states,
Last but definitely not least is the Mode,
emphasizing the pivotal role that Power BI matrix visualization plays in effective information analysis.
Moreover, the new usage report in Power BI provides detailed, user-specific metrics that offer deeper insights into the performance of these visualizations in real-world applications. Each report automatically creates a Usage Metrics Report semantic model that refreshes daily, ensuring real-time analysis capabilities are at users’ fingertips. A practical illustration of this can be found in the ‘Active Reports and Viewer Statistics’ case study, which tracks active reports across the workspace, revealing total views and identifying underutilized reports.
As companies place greater emphasis on Environmental, Social, and Governance (ESG) reporting, mastering storytelling through matrix visuals, alongside RPA tools, becomes essential for driving informed decision-making in today’s analytics-driven landscape.
Step-by-Step Guide to Creating a Matrix Visual in Power BI
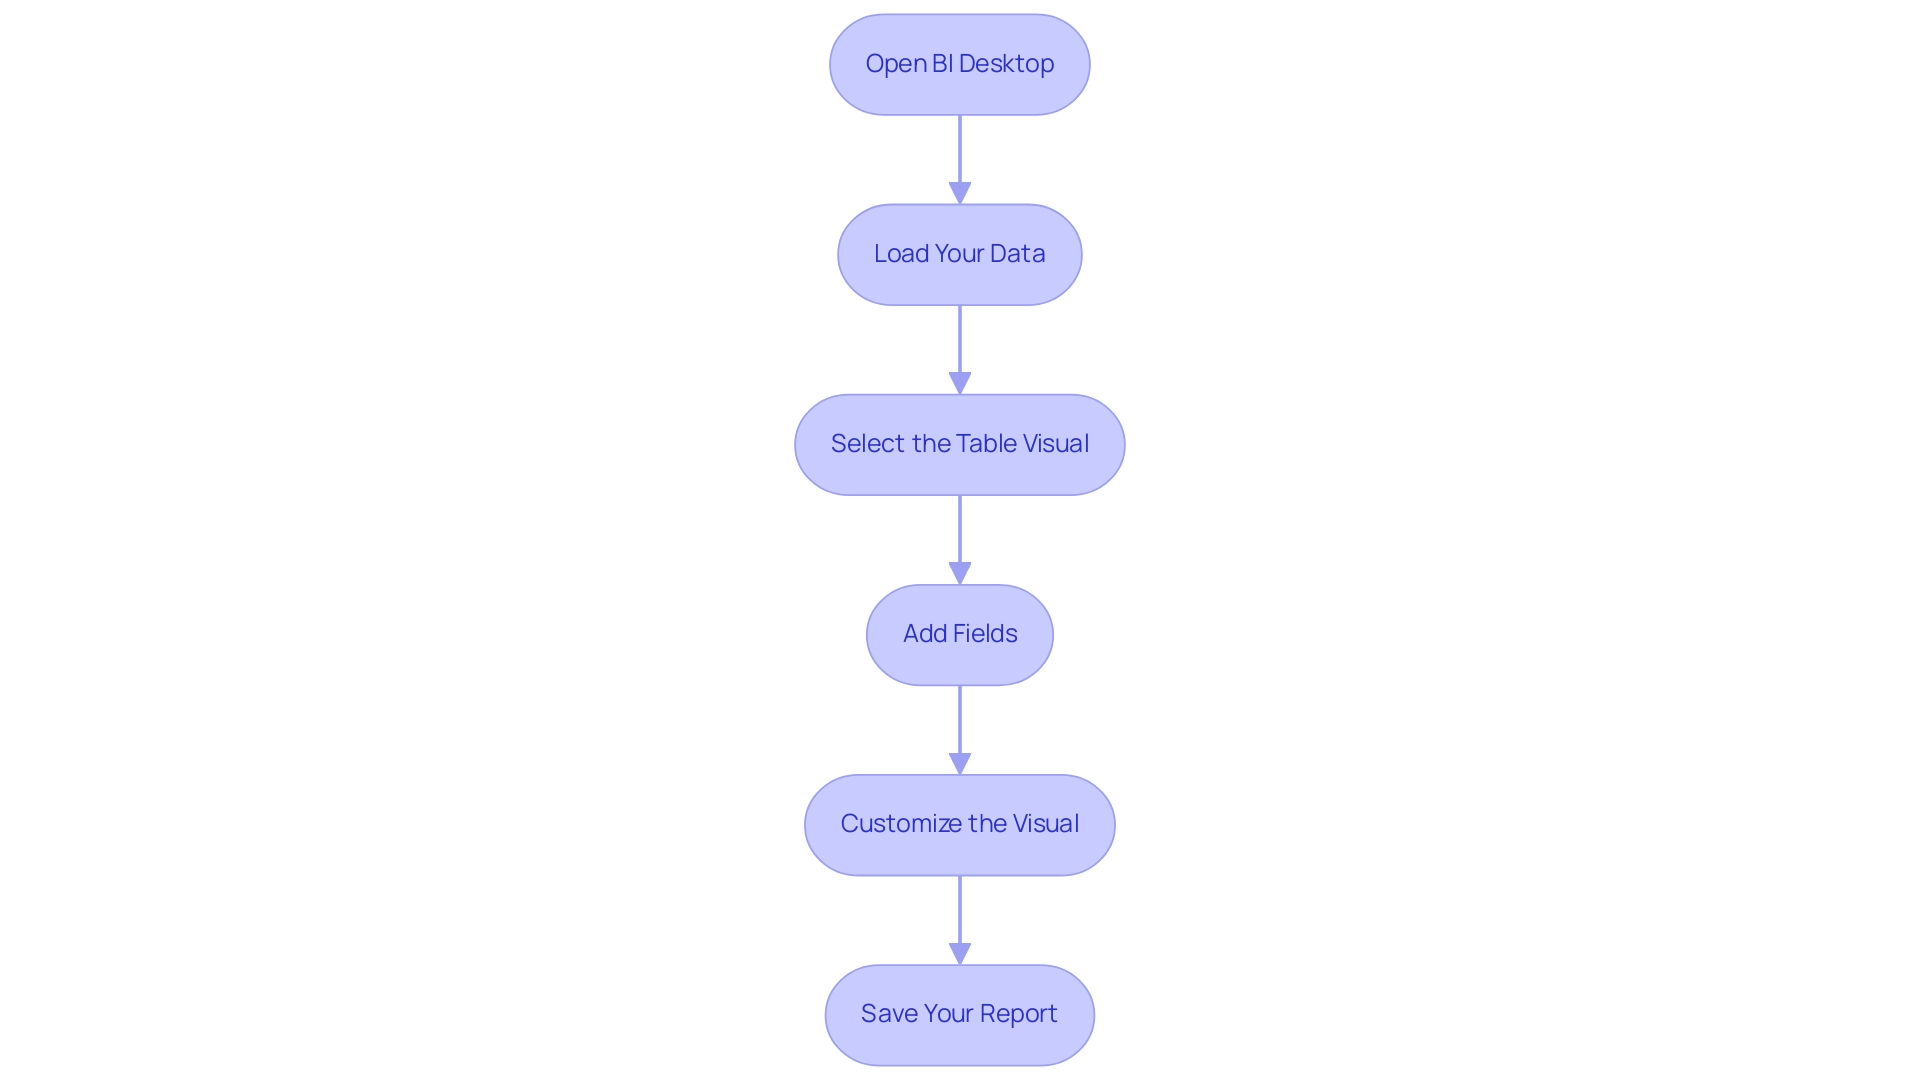
- Open BI Desktop: Start by launching the BI Desktop application, your canvas for information transformation.
- Load Your Data: Import the dataset you wish to analyze. Click on ‘Get Data’ and choose your information source to import your details into the Power BI environment.
- Select the Table Visual: Within the ‘Visualizations’ pane, click on the ‘Table’ icon to initiate the creation of your table visual, a powerful tool for addressing common reporting challenges.
- Add Fields: Drag and drop the relevant fields from the ‘Fields’ pane into the Rows, Columns, and Values areas of the visual representation, organizing your information for insightful analysis. This step helps mitigate inconsistencies, which can often stem from a lack of governance strategy, by ensuring that all relevant information is cohesively presented in the power bi matrix visualization.
- Customize the Visual: Utilize the ‘Format’ pane to refine your table. Adjust settings such as font size, grid lines, and colors to enhance readability and make your information visually appealing. For instance, as emphasized in a recent case study, users can modify font sizes, colors, and header styles to personalize their visuals, significantly enhancing clarity and presentation. This customization of the power bi matrix visualization not only enhances visual appeal but also supports actionable insights, enabling stakeholders to easily interpret the information and make informed decisions.
- Save Your Report: After fine-tuning your data to your satisfaction, save your report by clicking on ‘File’ and then ‘Save’. By diligently following these steps, you will create a visual representation that not only presents your information effectively but also captivates your audience with its clarity and design. Remember, before you go, sign up for my free BI course, which has over 100,000 students, to further enhance your skills and tackle the challenges of report creation with confidence and a strategic approach!
Advanced Techniques for Power BI Matrix Visuals
To genuinely enhance your Power BI table visual and address frequent challenges such as time-consuming report creation, inconsistencies, and a lack of governance strategy, consider implementing these advanced techniques:
-
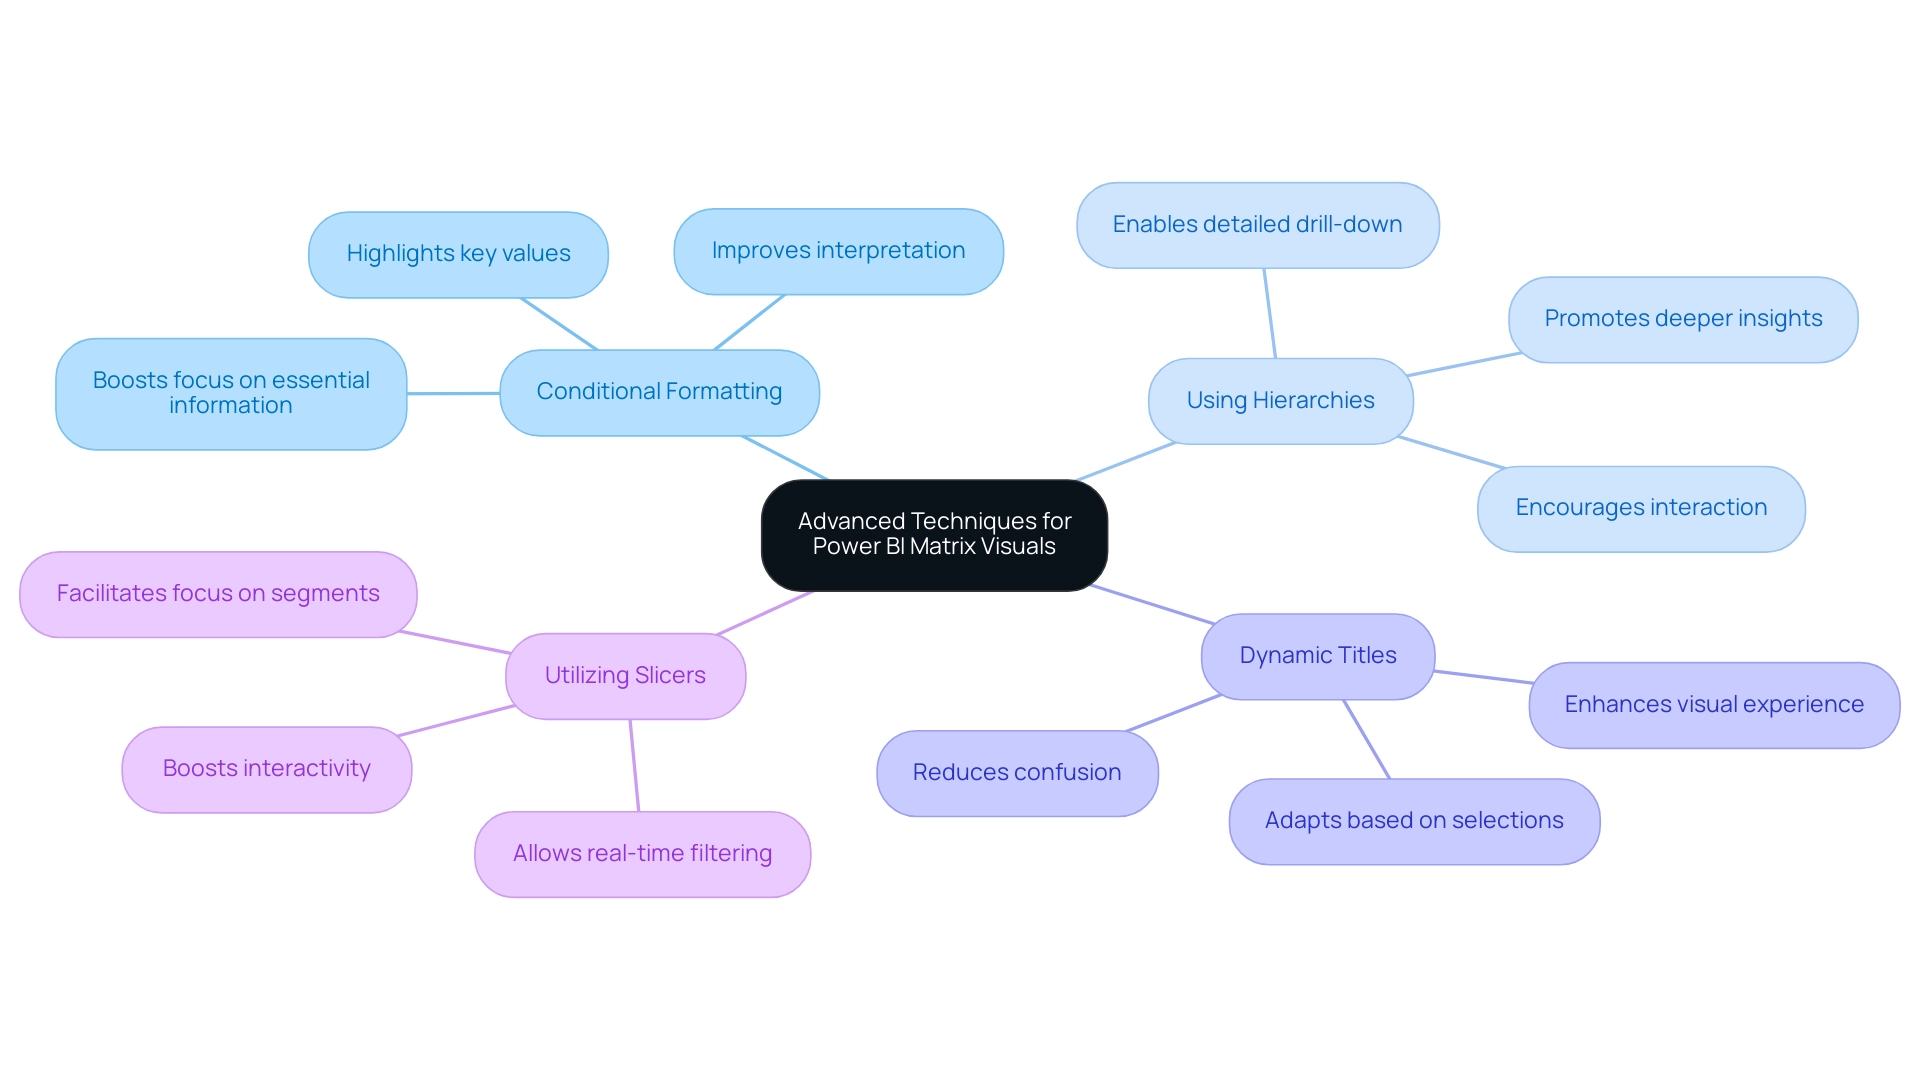
Conditional Formatting: This powerful feature allows you to highlight key values or trends directly within your table. By selecting your matrix and navigating to the ‘Format’ pane, you can easily configure the ‘Conditional Formatting’ options. Employing this strategy not only attracts focus to essential information points but also boosts overall interpretation, making trends more apparent and actionable, which is vital for rebuilding confidence in your information.
-
Using Hierarchies: Introducing information hierarchies can significantly enhance experience by enabling detailed drill-down capabilities. Simply drag a relevant field into the Rows or Columns section to establish a hierarchy. This method encourages individuals to investigate information at different levels, promoting deeper insights and interaction, thus fulfilling the requirement for clearer guidance.
-
Dynamic Titles: Enhance engagement further by employing DAX functions to create dynamic titles that adapt based on selections within the report. This personalization not only enhances the visual experience but also communicates relevant context, assisting individuals in comprehending the current emphasis of their analysis, which can reduce confusion arising from prior reports.
-
Utilizing Slicers: Incorporating slicers into your visual representations allows individuals to filter information in real-time, boosting interactivity. By incorporating slicers for key fields, individuals can adjust the information shown in the table, facilitating a focus on particular segments of interest, thereby enhancing the guidance offered by your reports.
In accordance with best practices, Xiaoxin Sheng suggests,
Perhaps you can consider relocating the currency fields to row fields instead of column fields. Then, the power bi matrix visualization will group your records based on company and currency fields. This strategic adjustment not only arranges your information more effectively but also facilitates users in deriving insights.
Additionally, Jain’s recent observations highlight the significance of improving visual representations to impress clients and reveal actionable insights. By implementing these techniques, you will not only enhance the functionality of your visuals but also create a more engaging and informative experience for your audience. Furthermore, these strategies can help mitigate the confusion and mistrust that often arise from inconsistent data and lack of governance, ultimately addressing the prevalent challenges in leveraging insights from BI dashboards.
Common Pitfalls and Best Practices in Matrix Visualization
Creating impactful Power BI matrix visualizations requires a thoughtful approach to avoid common pitfalls. Here are some essential best practices to enhance clarity and effectiveness:
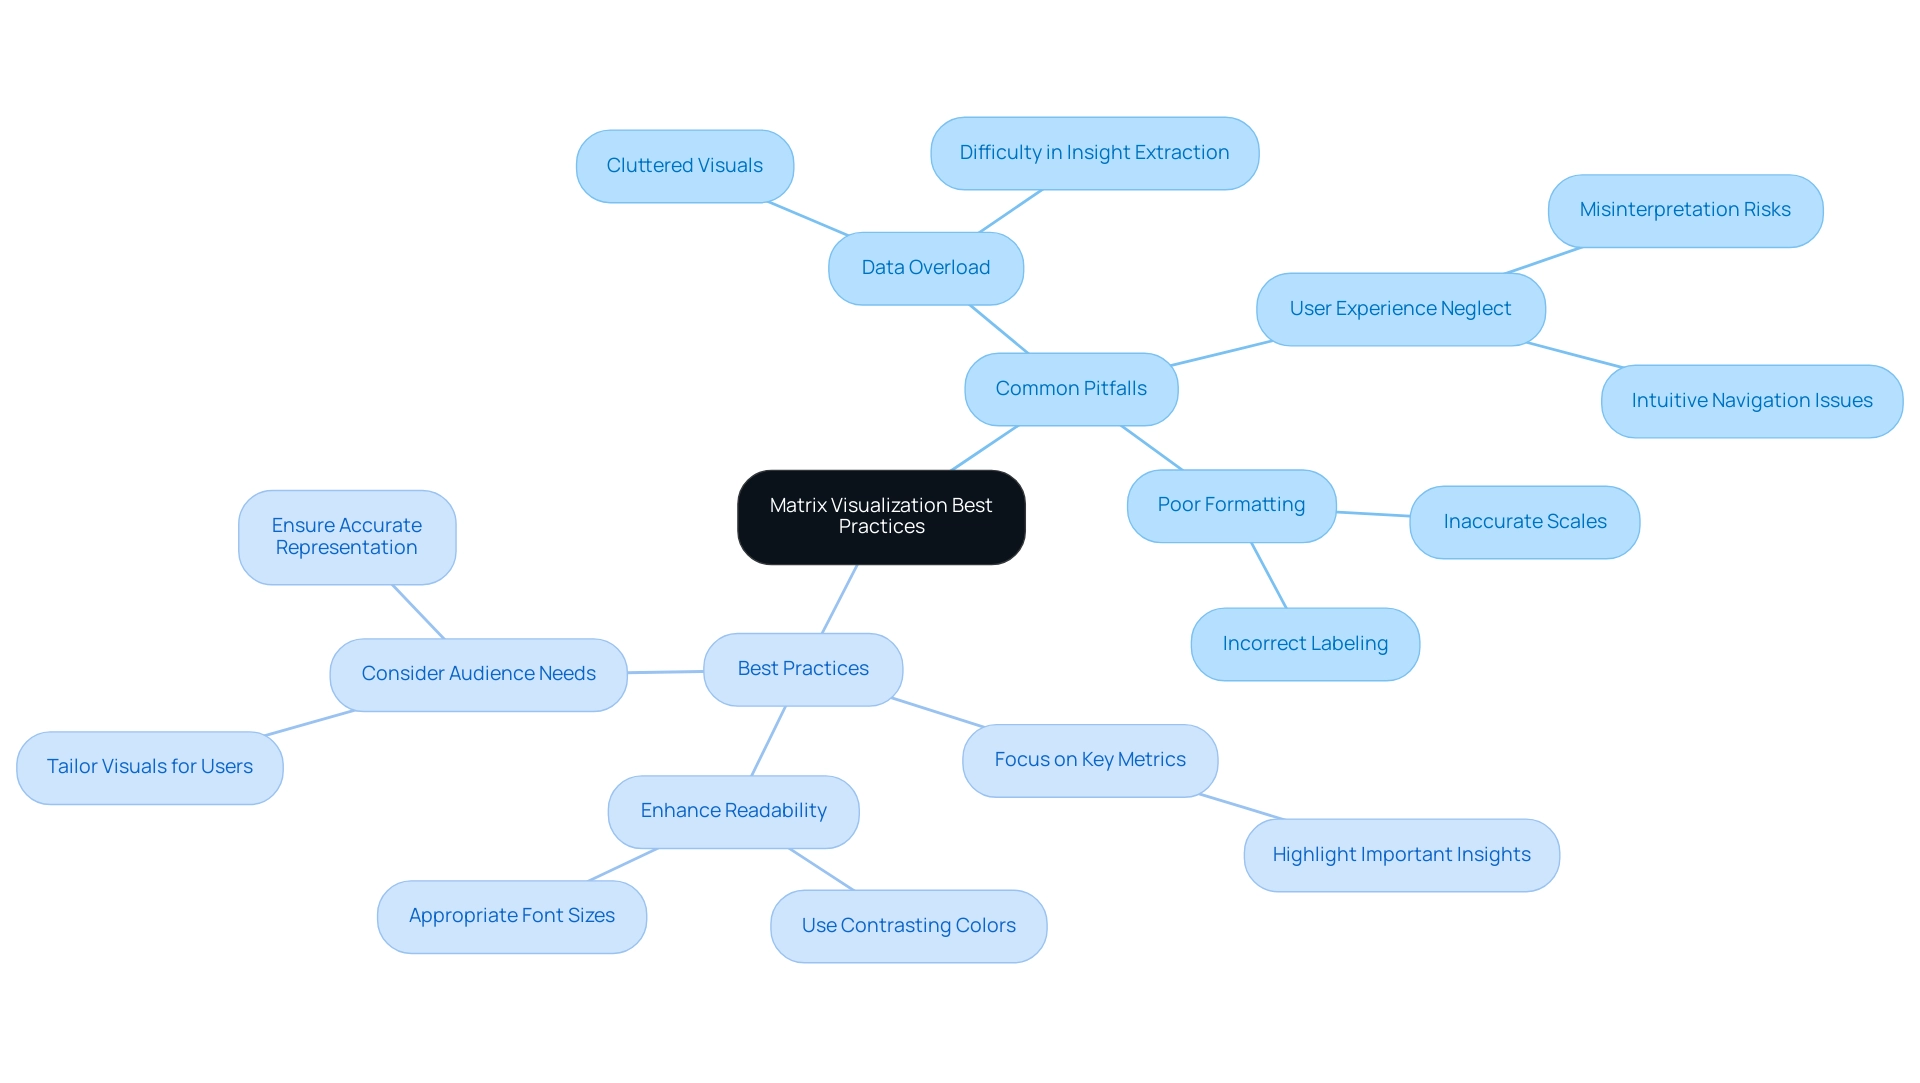
- Avoid Overloading with Data: It’s crucial to avoid cluttering the matrix with excessive information. Focus on key metrics that convey the most important insights.
Overwhelming charts with excessive information can hinder understanding, making it difficult for users to discern the most relevant details, especially in an information-rich environment where extracting meaningful insights is vital for maintaining a competitive edge.
-
Prioritize Formatting: Proper formatting is key to enhancing readability. Utilize appropriate font sizes and contrasting colors to distinguish between points. As Edward Tufte, known as the ‘Galileo of graphics,’ aptly stated,
Graphical excellence is that which gives to the viewer the greatest number of ideas in the shortest time with the least ink in the smallest space.
This principle underscores the need for clarity in your visual representations. Additionally, incorrect labeling and using scales that do not accurately reflect information can lead to confusion, further emphasizing the importance of careful formatting. Implementing RPA solutions like EMMA RPA can streamline the report generation process, reducing errors and freeing up time for more strategic analysis. Power Automate can also facilitate efficient information integration and automation, enhancing overall operational efficiency. -
Enhance User Experience: Always consider your audience when designing visuals. An intuitive and easily navigable framework can greatly enhance the user experience. Pay attention to labeling and ensure that scales accurately represent the information, as neglecting these aspects can lead to misinterpretation. Utilizing customized AI solutions together with BI can assist in overcoming frequent challenges like inconsistencies and absence of actionable guidance, ultimately promoting informed decision-making.
By following these best practices, you can create Power BI matrix visualizations that effectively convey insights and significantly engage your audience. It is essential to remain vigilant against the manipulation of information through misleading visualizations, as illustrated in Becca Cudmore’s work, Five Ways to Lie with Charts. This case study serves as a cautionary reminder of how information can be misrepresented, urging professionals to critically evaluate their visualizations to uphold ethical representation and facilitate accurate understanding.
With a following of 2.6K on this platform, it is crucial to maintain integrity in information presentation. To learn more about how EMMA RPA and Automate can enhance your reporting processes, book a free consultation today.
Integrating Matrix Visuals with Other Power BI Features
To enhance your visual representation in Power BI and fully utilize the insights from your information, combining it with complementary features is crucial for a more interactive and engaging experience. Here are essential strategies to consider:
-
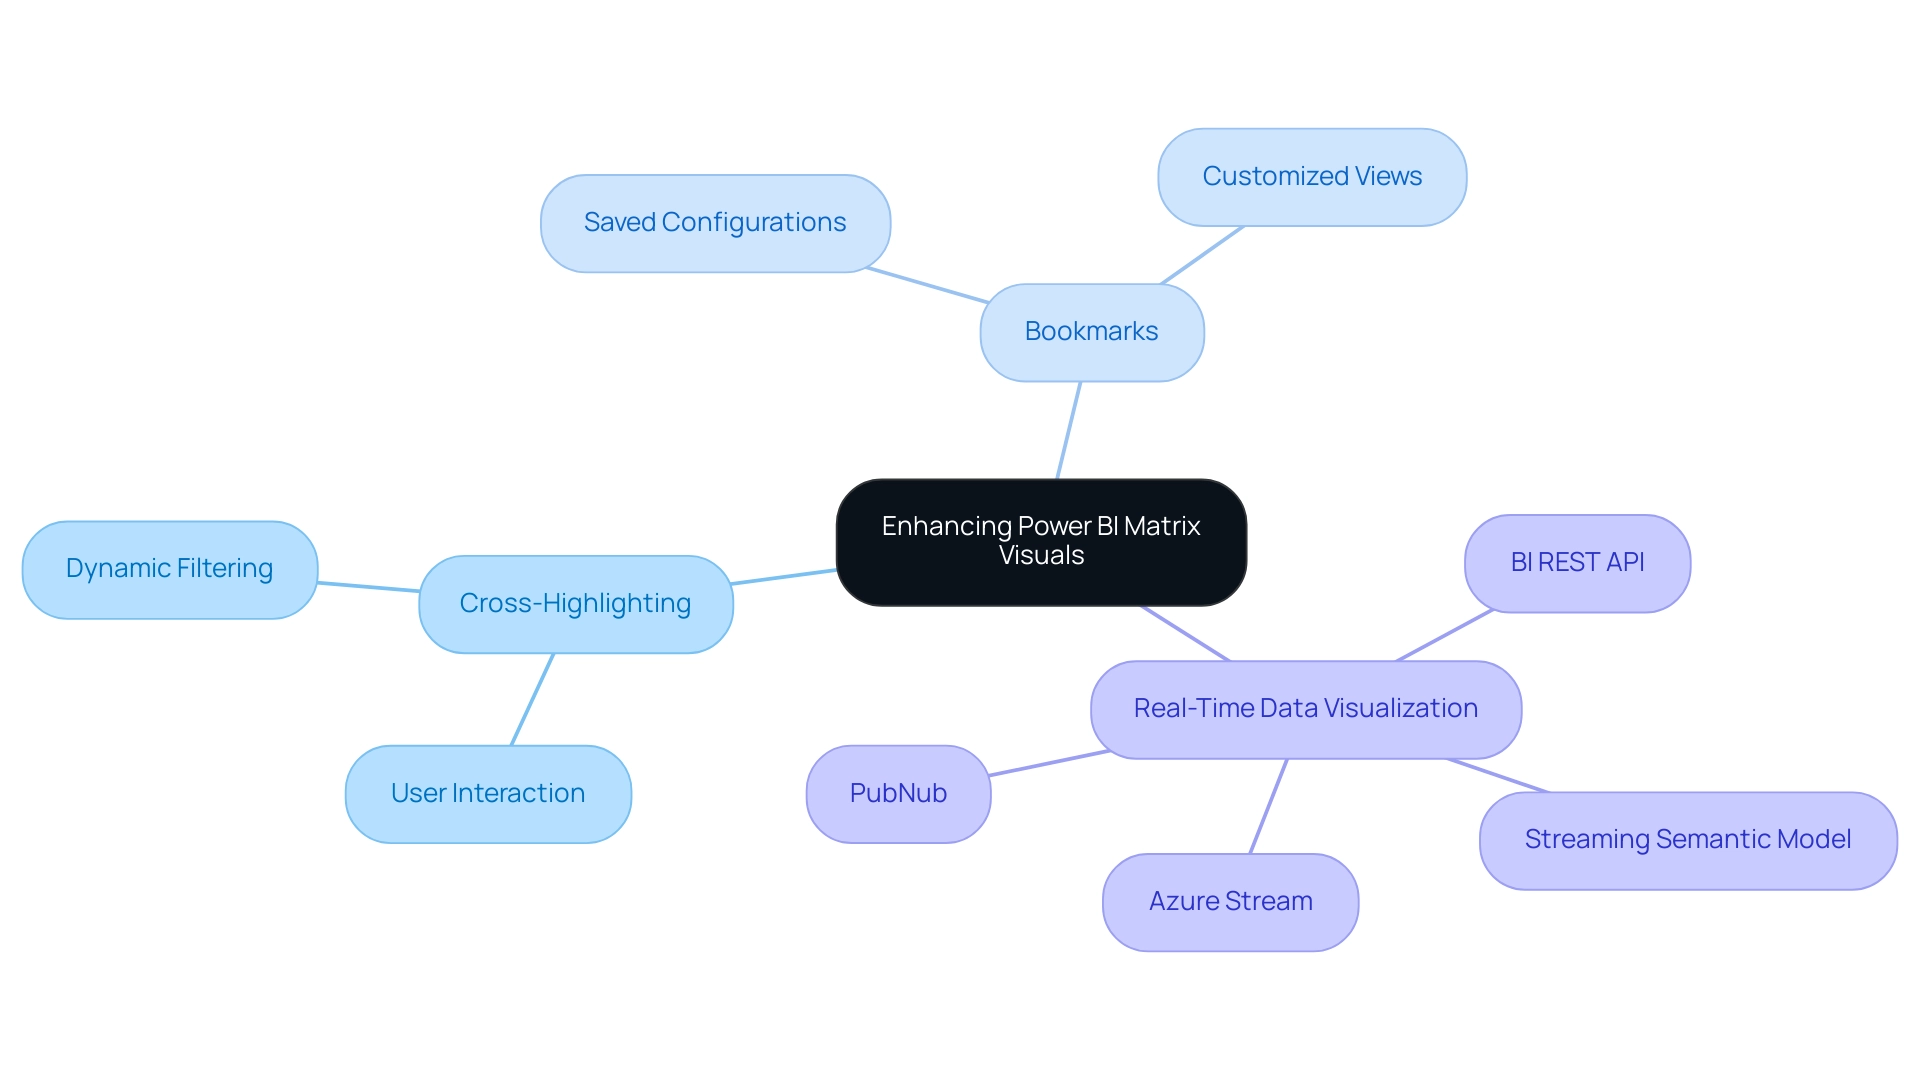
Cross-Highlighting: Activating cross-highlighting allows individuals to filter information interactively across various visuals by simply selecting points within the grid. This dynamic interaction not only boosts participant engagement but also enables deeper understanding of the information. Recent statistics show that interaction rates with cross-highlighting greatly enhance information interpretation, making it an essential feature for effective analysis. Incorporating value bars within your visual representation provides an immediate visual depiction of values, offering quick insights at a glance. This feature can be activated through the ‘Conditional Formatting’ options, making it a straightforward enhancement that adds depth to your information representation.
-
Bookmarks: Utilize bookmarks to save specific configurations of your matrix visual, allowing individuals to toggle between various perspectives effortlessly. This feature simplifies the experience by offering customized views that address particular analytical requirements.
Furthermore, it’s essential to guarantee the promptness of your information. For instance, information in a streaming semantic model will clear itself after 1 hour, emphasizing the need for real-time information visualization. Developing a streaming semantic model can be achieved through the BI REST API, Azure Stream, or PubNub, facilitating the visualization of real-time data.
Furthermore, the effectiveness of the Power BI matrix visualization significantly relies on the individual’s familiarity with its features, including adding multiple columns and applying various formatting options. As highlighted in the case study titled ‘Effective Use of Power BI Matrix Visualization in Business Intelligence,’ users are encouraged to explore the capabilities of Power BI matrix visualization to enhance data visualization and improve audience interpretation of findings.
By leveraging these integrations, you can transform your Power BI matrix visualization into a compelling storytelling tool that not only conveys information effectively but also invites user interaction and exploration. As you embark on this journey, consider our 3-Day BI Sprint, where we promise to create a fully functional, professionally designed report tailored to your needs. This experience not only enhances your understanding of Power BI features but also equips you with the skills to utilize insights effectively.
As BI Engineer Denys Arkharov aptly noted, effective data visualization is pivotal in interpreting findings and decision-making processes. Therefore, mastering these features will significantly enhance your matrix’s impact and utility, thus driving operational efficiency and supporting informed decision-making.
Conclusion
Harnessing the power of Power BI matrix visualizations is key to transforming complex datasets into clear, actionable insights. By utilizing these structured grid formats, Directors of Operations Efficiency can effortlessly summarize data, uncover hidden trends, and enhance their data storytelling capabilities. The step-by-step guide provided serves as an essential roadmap for creating effective matrix visuals, ensuring clarity and engagement from the outset.
Advanced techniques such as:
- Conditional formatting
- Data hierarchies
- Dynamic titles
further elevate the functionality of matrix visuals, allowing users to interact with and explore their data in meaningful ways. By avoiding common pitfalls and adhering to best practices, organizations can enhance the clarity and effectiveness of their visualizations, ultimately driving better decision-making processes.
Integrating matrix visuals with other Power BI features, such as:
- Cross-highlighting
- Data bars
transforms data representation into a dynamic storytelling tool. This approach not only improves user engagement but also fosters a deeper understanding of complex data sets. As organizations continue to navigate the challenges of data consistency and reporting efficiency, mastering Power BI matrix visualizations will be crucial for informed decision-making and operational success. Embracing these strategies equips professionals to lead in a data-driven landscape, turning insights into impactful actions that propel their organizations forward.
Overview:
The article focuses on how to effectively use the Power BI LOOKUPVALUE function with multiple criteria to enhance data analysis and reporting. It provides a step-by-step guide on implementing the function, highlights best practices for optimizing performance, and discusses common pitfalls to avoid, thereby equipping users with the necessary skills to streamline their data retrieval processes and improve operational efficiency.
Introduction
In the world of data analytics, the ability to extract precise insights from vast datasets is paramount. Power BI’s LOOKUPVALUE function serves as a powerful ally in this endeavor, enabling users to retrieve specific values based on defined criteria, thereby streamlining data analysis and enhancing reporting efficiency.
As organizations increasingly adopt data-driven decision-making practices, mastering this function becomes essential for overcoming challenges such as data inconsistencies and time-consuming report creation.
With a focus on practical applications and best practices, this article delves into the intricacies of LOOKUPVALUE, offering:
- Step-by-step guidance
- Comparisons with other functions
- Strategies to optimize performance
By harnessing the full potential of LOOKUPVALUE, users can transform their data modeling capabilities, paving the way for more informed decisions and operational excellence.
Understanding the LOOKUPVALUE Function in Power BI
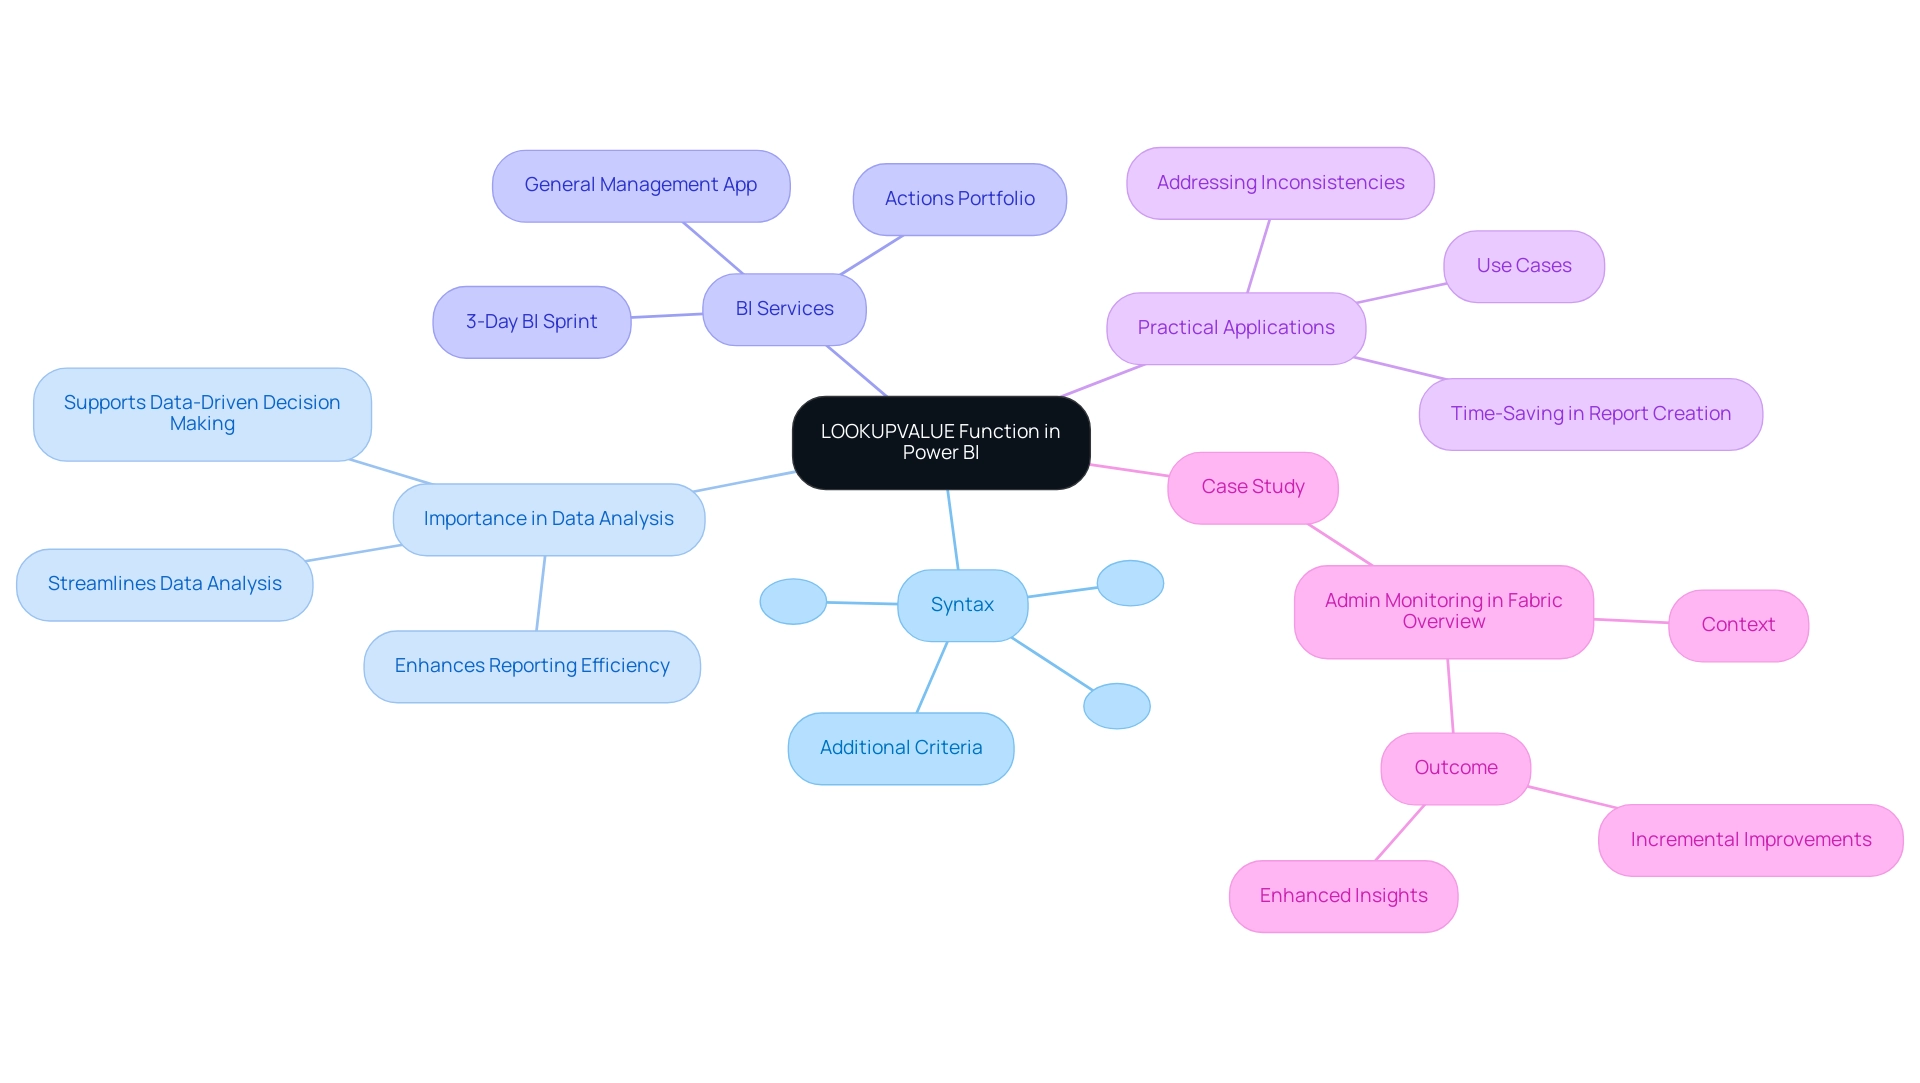
The retrieval tool in Power BI lookupvalue multiple criteria is an essential resource for obtaining specific values from a table based on defined criteria, which streamlines data analysis. Its syntax is structured as follows:
lookup value(<result_column name>, <search_column name>, <search_value>[, <search_column name>, <search_value>]…). This method becomes invaluable when you need to extract a single value from a related table, particularly in scenarios involving power bi lookupvalue multiple criteria.
Recent statistics indicate that as of 2024, organizations are increasingly adopting BI, reflecting a growing reliance on data-driven decision-making. Mastering the Power BI LOOKUPVALUE function with multiple criteria can significantly enhance your modeling and reporting efficiency, allowing for more accurate and insightful analyses. As Bogdan Blaga noted, effective July 2024, the BI Admin portal Usage metrics dashboard will be removed, emphasizing the need for users to adapt their data modeling strategies.
This aligns with our BI services, including:
- The 3-Day BI Sprint, which ensures efficient report creation
- The General Management App that supports comprehensive management and smart reviews
Additionally, our Actions portfolio offers a range of solutions tailored to maximize your Power BI experience, and we invite you to book a free consultation to explore how we can assist you further. Additionally, the case study on Admin Monitoring in Fabric Overview illustrates how organizations are utilizing the power bi lookupvalue multiple criteria method to enhance reporting and insights, showcasing its practical applications.
By understanding its structure and applications, you’ll be better equipped to utilize it across various use cases, ultimately driving greater operational excellence and effectively addressing the challenges of inconsistencies and time-consuming report creation.
Implementing LOOKUPVALUE with Multiple Criteria: Step-by-Step Examples
To effectively use the lookup tool with multiple criteria in BI while addressing challenges such as time-consuming report creation, inconsistencies, and the absence of a governance strategy, follow these structured steps:
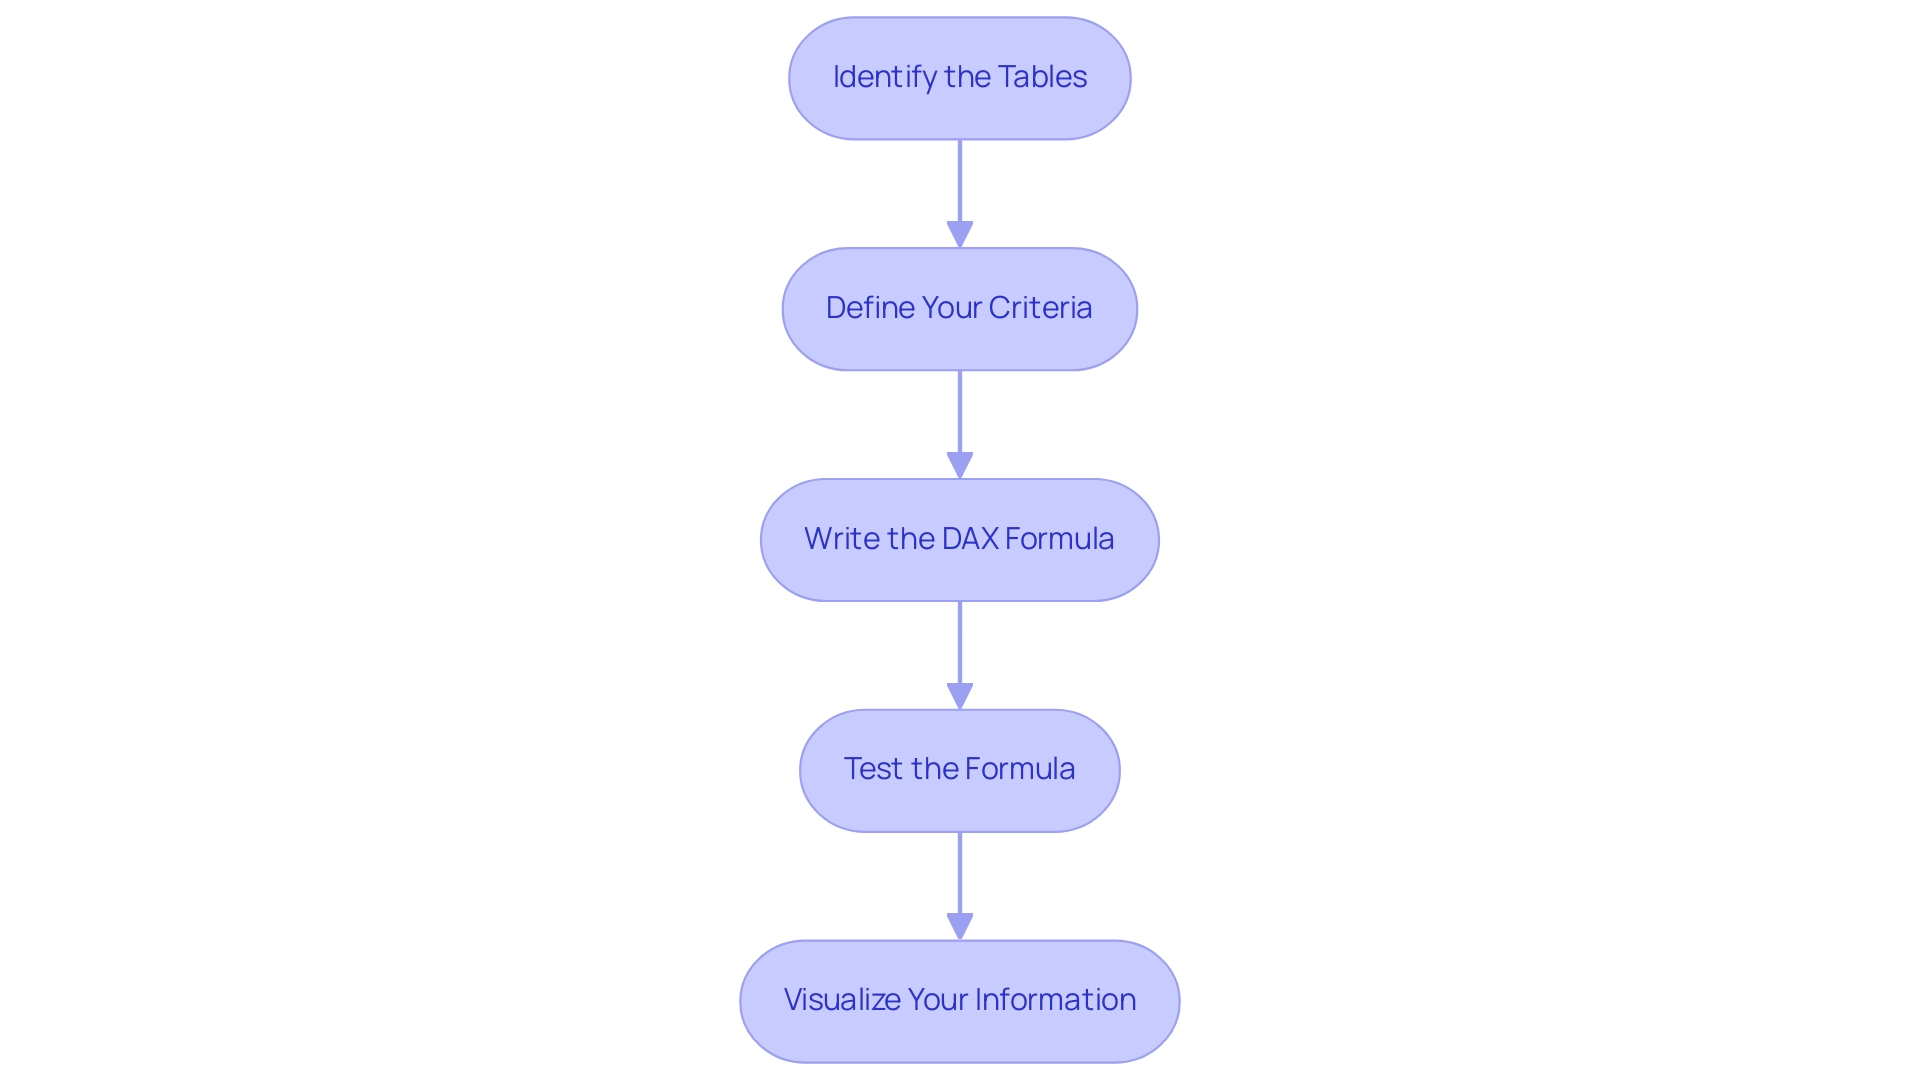
- Identify the Tables: Start by clarifying the tables involved in your analysis. For example, consider a ‘Sales’ table and a ‘Products’ table.
- Define Your Criteria: Outline the specific criteria for your lookup. You may want to retrieve the price of a product based on its unique ID and category.
- Write the DAX Formula: Implement the LOOKUPVALUE function using the following DAX syntax:
DAX

product price = LOOKUPVALUE(Products[Price], Products[ProductID], Sales[ProductID], Products[Category], Sales[Category]) - Test the Formula: Validate the formula to ensure it produces the expected outcomes. Conduct a manual check on a few records to confirm accuracy.
- Visualize Your Information: Utilize the results in your BI reports to enhance insights and decision-making.
By following these steps, you can skillfully utilize Power BI LOOKUPVALUE multiple criteria to retrieve information, thereby improving your reporting efficiency in addressing the common challenges of unclear governance and absence of actionable guidance. This method not only streamlines your analysis process but also aligns with best practices in utilizing DAX formulas, as emphasized by experts in the field. Moreover, with a community of 453,487 members, assistance and resources are readily accessible for BI users, which can aid in tackling challenges such as inconsistencies and report generation.
Furthermore, consider the case study titled ‘Case 3: No Record Found,’ which illustrates the importance of defining output for scenarios where no records exist in the data table, ensuring effective handling of such cases. Success stories shared by users, such as Saxon 10, demonstrate the effectiveness of these techniques in real-world applications, empowering your decision-making with actionable insights.
Comparing LOOKUPVALUE and RELATED: When to Use Each Function
When selecting between the function for searching values and RELATED functions in Power BI, several key considerations can guide your decision, especially in the context of overcoming common reporting challenges.
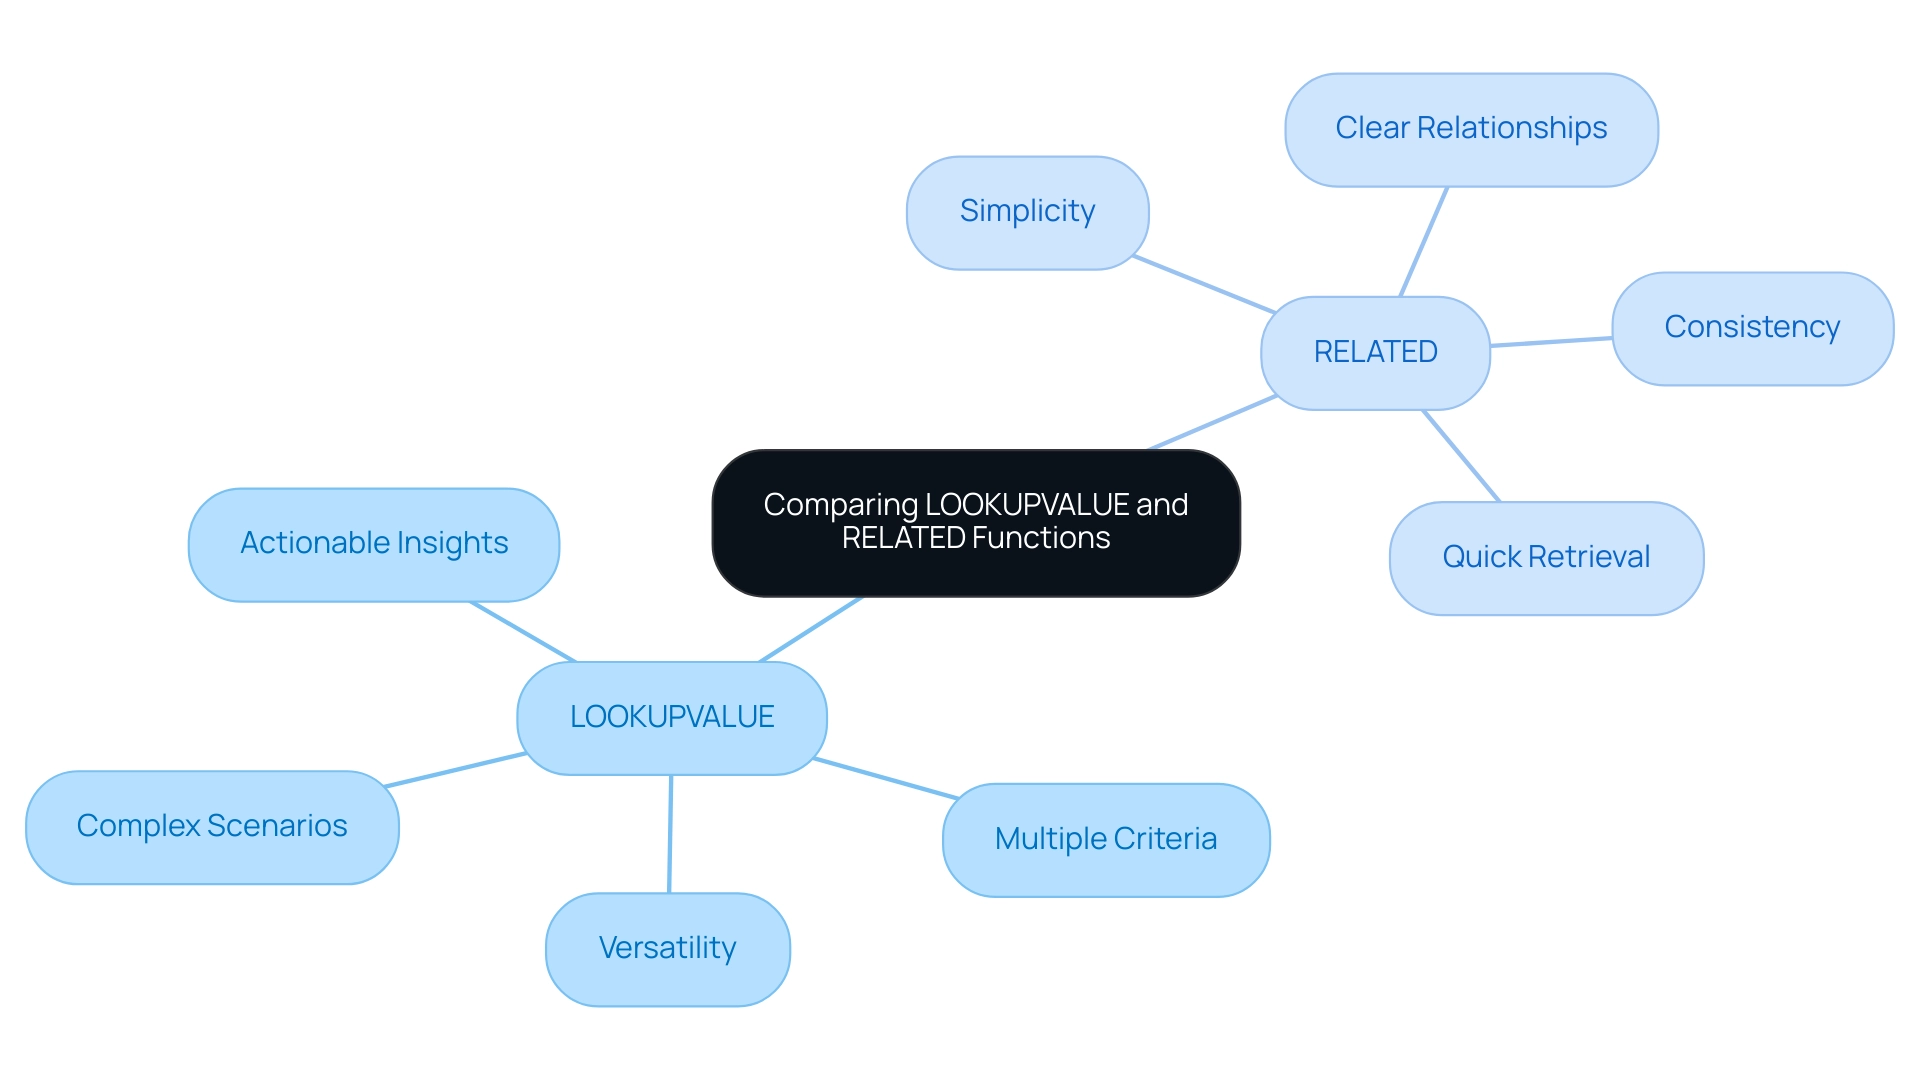
The function stands out for its versatility, allowing for power bi lookupvalue multiple criteria in lookups without requiring a direct relationship between tables. This makes it particularly useful for complex scenarios where you need to extract information based on various conditions, helping to reduce the time spent on report creation and enhancing the reliability of the insights derived. For instance, by employing a lookup function, you can generate insights that directly inform stakeholders on actionable steps, thereby addressing the common issue of reports lacking clear guidance.
RELATED, in contrast, offers a simpler and faster solution for retrieving values from a related table, specifically in cases of well-defined one-to-one or many-to-one relationships. It is optimal when the relationship between tables is clear-cut and straightforward, aiding in the creation of consistent and trustworthy reports. This function can also contribute to actionable insights by ensuring that stakeholders can easily understand the relationships between data points.
A case study titled “Performance Considerations for Calculated Columns” highlights that while calculated columns can enhance performance due to their pre-calculated nature when the model is loaded, they also increase the model size. Thus, the choice between utilizing the function and RELATED should consider the trade-off between performance and model size based on user priorities. The results from this case analysis emphasize the significance of choosing the suitable role to guarantee that your information stays actionable and manageable.
Furthermore, the January 2025 BI update brought new features that may affect how you use VALUE and RELATED functions, so remaining updated about these changes is essential for effective modeling.
To summarize, utilize the function for its flexibility in handling power bi lookupvalue multiple criteria lookups and generating actionable insights, while opting for RELATED when working with uncomplicated relationships. By mastering these differences and understanding their implications for actionable guidance, you can significantly enhance your data modeling capabilities within BI, enabling more efficient and effective data analysis that addresses the prevalent issues of report creation and data inconsistencies.
Optimizing Performance: Best Practices for Using LOOKUPVALUE
To enhance the performance of the value retrieval function in Power BI while leveraging insights from Business Intelligence and the capabilities of Robotic Process Automation (RPA), consider implementing the following best practices:
-
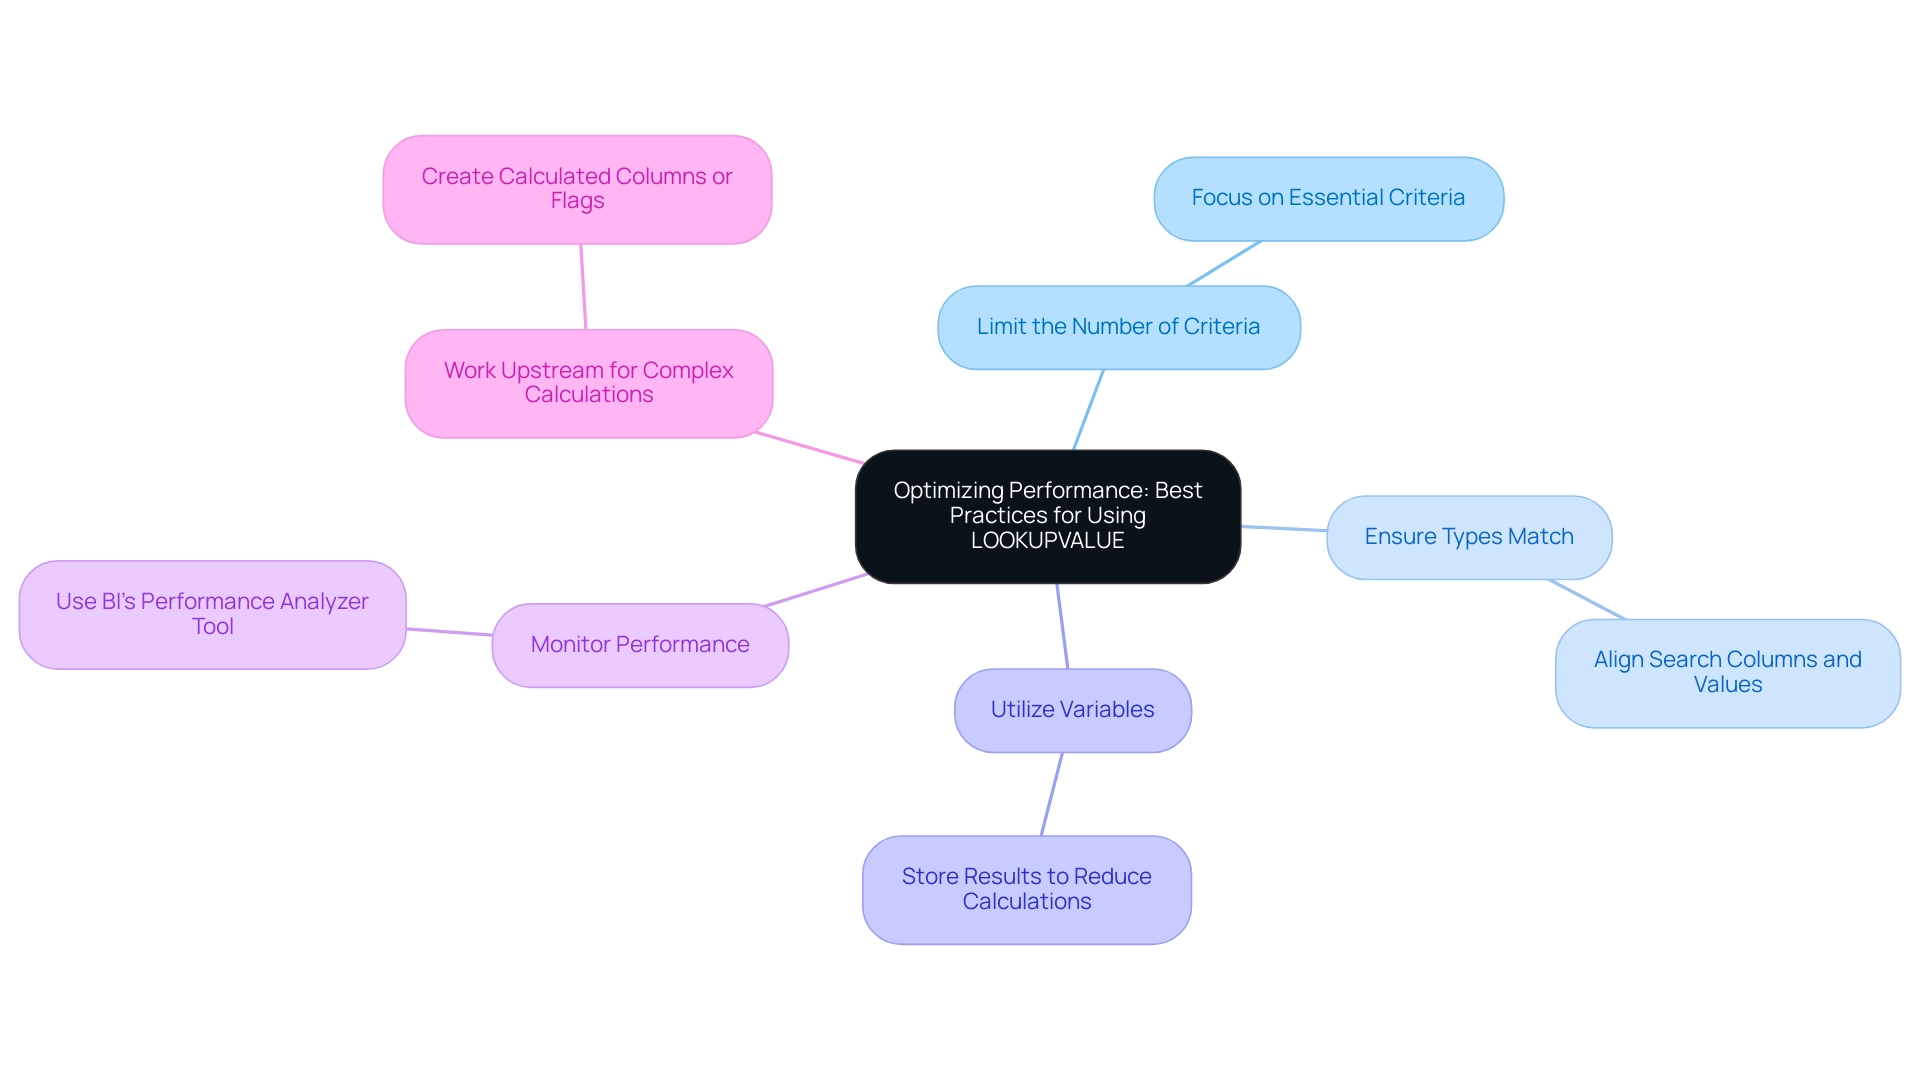
Limit the Number of Criteria: Although the Power BI
LOOKUPVALUEmultiple criteria function accommodates various inputs, reducing the number of criteria can significantly boost performance. Focus only on the essential criteria to streamline your calculations, which is vital in a data-rich environment where clarity is key. -
Ensure Types Match: Consistency in types is crucial; mismatched types can impede performance. To enhance the reliability of your insights and avoid unnecessary slowdowns, confirm that the types of your search columns and values are aligned, especially when implementing Power BI
LOOKUPVALUEmultiple criteria. -
Utilize Variables: When you find yourself using
LOOKUPVALUEmultiple times within a single calculation, consider storing the result in a variable. This method reduces unnecessary calculations and improves overall efficiency, which is crucial when managing the intricacies of information. -
Monitor Performance: Utilize BI’s performance analyzer tool to identify bottlenecks in your reports. Consistently tracking performance enables prompt optimizations, ensuring your reports remain responsive even as information volume rises—an essential element of sustaining operational efficiency.
-
Work Upstream for Complex Calculations: In scenarios involving complex DAX formulas or repeated filters, creating calculated columns or flags in the backend can simplify your calculations. This strategy not only clarifies your code but also improves performance, making it easier to identify further optimizations. For example, implementing calculated columns can reduce the complexity of your DAX formulas, allowing for more efficient information processing, which is crucial in driving informed decision-making.
Additionally, it is worth noting that while COUNTROWS is often more efficient than LOOKUPVALUE due to its clearer formula intention and disregard for Blanks, understanding when to use each function, such as Power BI LOOKUPVALUE multiple criteria, is vital for optimizing overall performance in Power BI.
By integrating RPA into your workflow, you can automate repetitive tasks associated with extraction and reporting, thereby enhancing the efficiency of your Power BI processes. This method not only eases the load of manual tasks but also enables your team to concentrate on more strategic initiatives.
By adhering to these practices, you can sustain efficient and responsive reports, adapting seamlessly as your informational landscape evolves. As one expert advises,
Clean up your code; it may not improve performance directly but will help you better understand what you are doing and more easily find optimizations.
Furthermore, mastering dynamic stock management with cumulative totals can greatly enhance your operational insights, making these best practices even more critical as you navigate the complexities of data management.
Common Pitfalls and Troubleshooting LOOKUPVALUE in Power BI
When utilizing the LOOKUPVALUE function in Power BI, it’s essential to be vigilant about the following common pitfalls, as addressing these can greatly enhance operational efficiency and data-driven insights:
-
Incorrect Syntax: Adhering to proper syntax is crucial; even minor errors can lead to unexpected outcomes. For instance, a user named Gugge reported an error stating, “A table of multiple values was supplied where a single value was expected,” when attempting to create a table with specific formulas. This highlights the importance of double-checking your formula to ensure it aligns with the required structure, thereby streamlining report creation.
-
Missing Relationships: A frequent issue arises when tables are not appropriately related. This can result in blank values being returned when using Power BI lookupvalue multiple criteria. Always verify that your model accurately represents the necessary relationships, as suggested by other users who recommend using relationships to join tables instead. Establishing these connections not only mitigates errors but also enhances the overall effectiveness of your Business Intelligence efforts.
-
Overlooking Data Types: Data type mismatches can cause significant lookup errors. Ensure that the types across related tables are compatible to avoid disruptions in your analyses. A clear understanding of these details can empower your team to extract actionable insights more effectively.
-
Performance Issues: If you encounter sluggish performance, reassess your criteria’s complexity and the volume of information being processed. Streamlining your queries can enhance efficiency, especially given that there are currently 2,953 users online, all potentially facing similar challenges.
To further enhance operational efficiency, consider integrating Robotic Process Automation (RPA) to automate repetitive tasks related to information preparation for Power BI. This can significantly reduce the time spent on manual information handling and allow your team to focus on more strategic activities. Additionally, tailored AI solutions can assist in identifying and resolving data inconsistencies, ensuring that your analyses are based on accurate and reliable data.
By staying mindful of these pitfalls and applying effective troubleshooting strategies, you can harness the full potential of the function. For example, in the case study titled “LOOKUPVALUE Error Resolution,” a user discovered that the issue related to power bi lookupvalue multiple criteria stemmed from the SF_Account[Name] having multiple values for each unique SF_Account[ERP_ID__c]. This experience underscores the necessity of understanding your data structure to enhance your Power BI analyses, ultimately driving operational efficiency and informed decision-making.

Conclusion
Mastering the LOOKUPVALUE function in Power BI is crucial for organizations striving to harness the power of data-driven decision-making. This article has laid out the foundational aspects of LOOKUPVALUE, including its syntax, practical applications, and comparisons with the RELATED function, highlighting the unique advantages it offers for complex data retrieval scenarios. By effectively utilizing this function, users can significantly improve their data modeling capabilities and streamline reporting processes, ultimately leading to more informed decision-making.
Implementing best practices for LOOKUPVALUE, such as:
- Limiting criteria
- Ensuring data type consistency
- Utilizing performance monitoring tools
can greatly enhance operational efficiency. Furthermore, being aware of common pitfalls—like incorrect syntax and missing relationships—empowers users to troubleshoot effectively, ensuring that data analyses remain accurate and actionable.
As organizations continue to navigate the complexities of data management, leveraging LOOKUPVALUE not only addresses prevalent challenges but also positions teams for operational excellence. The insights gained from mastering this function will pave the way for more reliable reporting and enhanced decision-making processes, driving overall business success. Embrace these strategies to transform data into a powerful asset for your organization.
Overview:
The article focuses on best practices for implementing multiple apps within a single Power BI workspace to enhance efficiency and collaboration. It emphasizes the importance of a structured approach to app creation and management, highlighting steps such as understanding audience needs, configuring permissions, regularly updating content, and leveraging automation tools, which collectively drive better data-driven decision-making and operational effectiveness.
Introduction
In the ever-evolving landscape of business intelligence, Power BI apps stand as a cornerstone for organizations aiming to harness the power of data. Understanding the lifecycle of these apps, from their inception to their eventual retirement, is crucial for maximizing their impact on decision-making and operational efficiency.
As organizations strive to create insightful reports and dashboards, the ability to effectively manage and configure these applications becomes paramount. This article delves into practical strategies for navigating the complexities of Power BI, offering actionable insights on:
- Creating multiple apps
- Targeting specific audiences
- Maintaining relevance
- Anticipating future trends
By embracing these best practices, organizations can unlock the full potential of their Power BI investments, driving innovation and informed decision-making across their operations.
Understanding Power BI Apps and Their Lifecycle
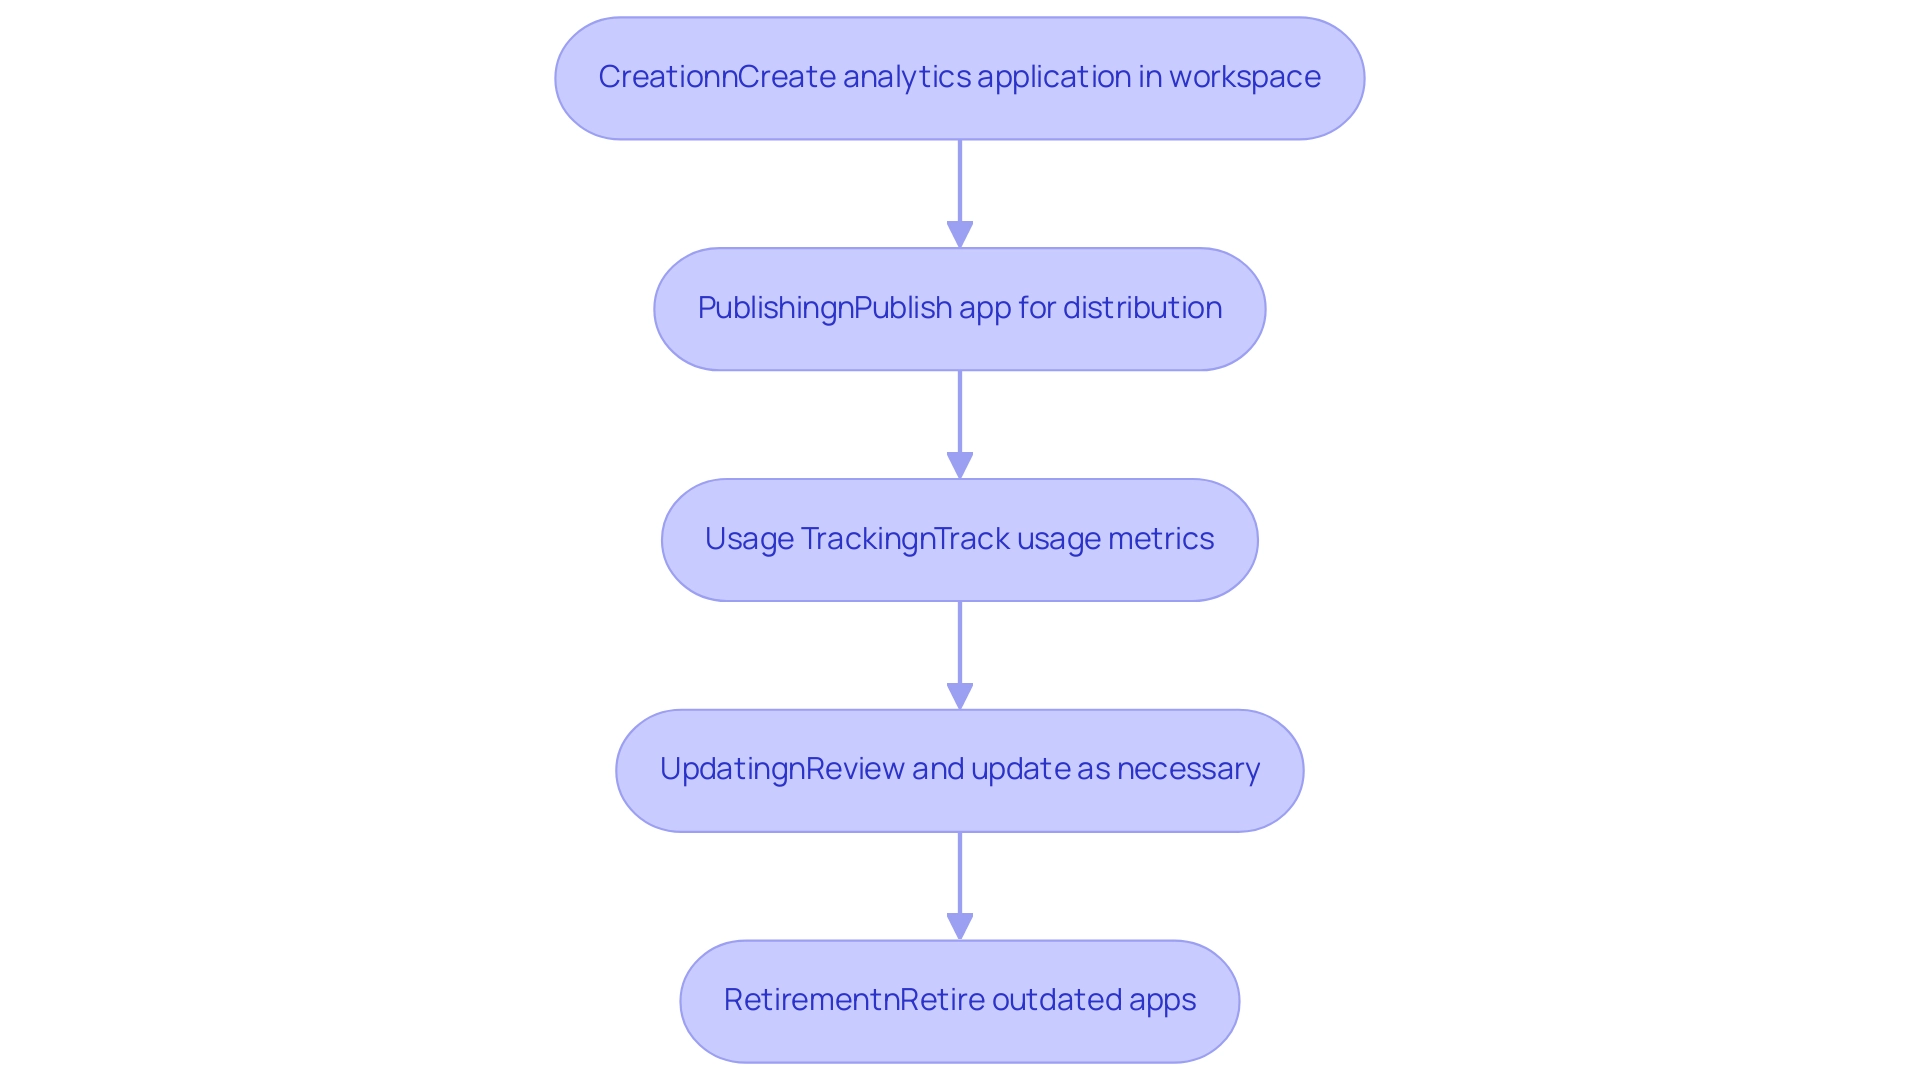
BI applications play an essential role in effectively packaging and sharing dashboards and documents within an organization. A comprehensive understanding of their lifecycle—from creation to sharing and eventual retirement—is vital for effective management. At first, an analytics application is created within a workspace that supports Power BI multiple apps per workspace, where information models and documents are designed to satisfy particular organizational requirements.
With our specialized services, including a 3-Day Power BI Sprint, you can swiftly create professionally designed documents that enhance your informational capabilities and provide actionable insights. Once the app is published, it can be distributed to individuals, granting them access to critical insights that inform decision-making processes. However, it is important to note that usage metrics may sometimes undercount activities due to inconsistent network connections, ad blockers, or other issues, which can obscure the true effectiveness of the app.
Additionally, usage metrics are not supported when utilizing Private Links, resulting in no data being available for analysis. To overcome these challenges and ensure your BI solutions remain effective, it becomes imperative to regularly review and update Power BI multiple apps per workspace as organizational requirements evolve. For example, to see metrics for all dashboards or documents in a workspace, individuals must eliminate the default filter that restricts the document to a single dashboard or document.
By editing the report and removing the filter, users can gain insights into the overall usage metrics for the entire workspace. This lifecycle approach, complemented by tools like Automation and our EMMA RPA solution, not only streamlines app management but also significantly boosts organizational productivity and enhances data-driven decision-making. Implementing a structured Application Lifecycle Management (ALM) process in Business Intelligence can dramatically enhance how analytics resources are managed within your organization, ensuring that all stakeholders derive maximum benefit from the tools available.
Additionally, we encourage you to explore our Actions portfolio and book a free consultation to discover how our solutions can drive growth and innovation through enhanced Business Intelligence and RPA, addressing the critical challenges of extracting meaningful insights from information.
Step-by-Step Guide to Creating Multiple Apps in a Workspace
Implementing Power BI multiple apps per workspace can significantly enhance your team’s efficiency and collaboration, driving productivity through better data management and insights. To view metrics for all dashboards or analyses in the workspace, remember to remove the default filter. Follow this structured approach to ensure a smooth process:
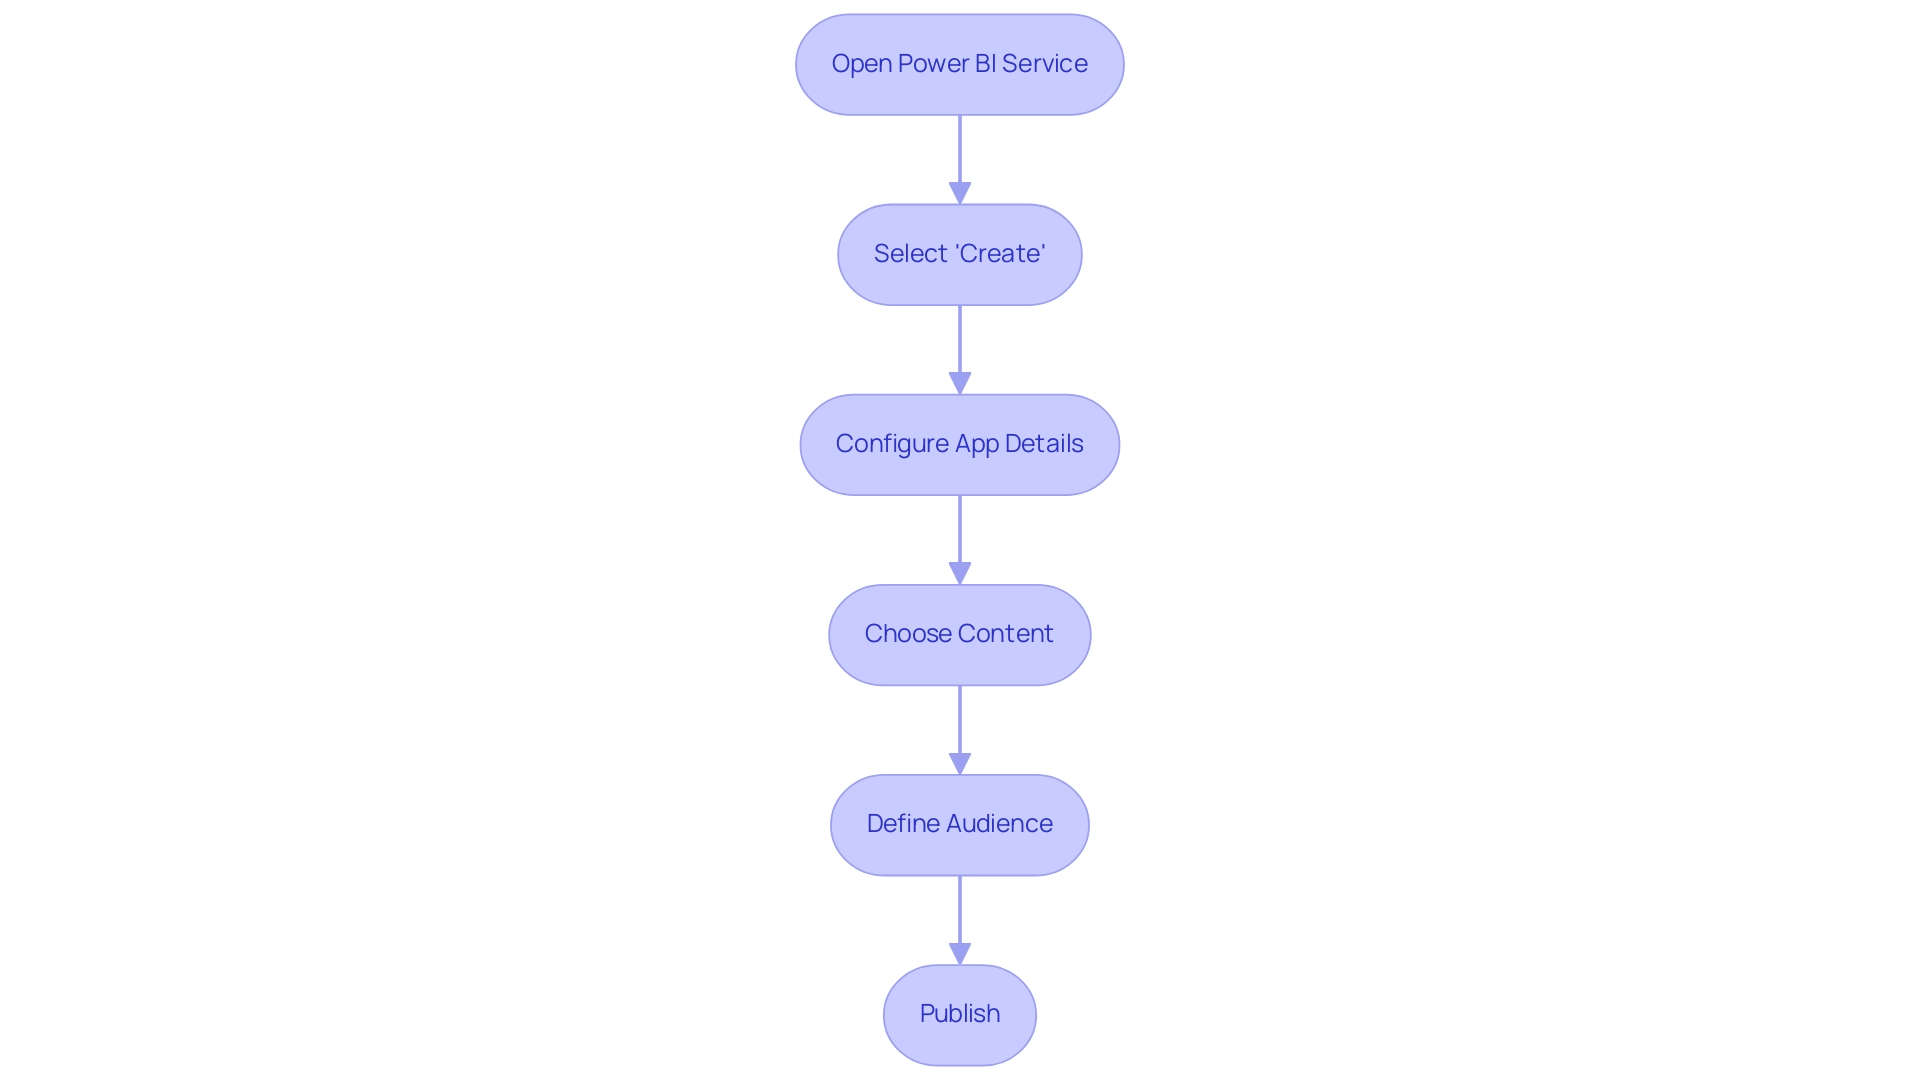
- Open Power BI Service: Begin by logging into your account and navigating to the desired workspace where you intend to create your apps.
- Select ‘Create’: Click on the ‘Create’ button, and then choose ‘App’ from the dropdown menu.
- Configure App Details: Provide essential information such as the app name, description, and logo to establish a clear identity for the app.
- Choose Content: Select the dashboards, documents, and datasets that align with the needs of individuals, ensuring they facilitate informed decision-making.
- Define Audience: Customize visibility settings to determine who will have access to the app, tailoring the experience to specific groups.
- Publish: After configuring all necessary settings, click ‘Publish’ to make the app accessible to your intended audience.
With 2,285 users currently online, the scale of BI usage emphasizes its importance in your operations, especially as you address challenges such as time-consuming report creation and inconsistencies.
This systematic approach not only streamlines the creation of Power BI multiple apps per workspace but also facilitates effective management and collaboration within your organization. Moreover, incorporating Robotic Process Automation (RPA) can further improve your BI experience by automating repetitive tasks associated with preparation and reporting, enabling your team to concentrate on strategic analysis. Furthermore, adopting tailored AI solutions can provide deeper insights from your data, enabling quicker and more informed decision-making.
As pointed out by individual Rusty_Brookes, addressing flaws in BI, such as the concatenation of names and permissions without delimiters, is crucial for effective app management. Furthermore, best practices, like frequently refreshing content and employing the newest features in Power BI, can improve the functionality and experience of your applications. For instance, after removing the semantic model, individuals can generate a new usage metrics document.
If the report still appears after deletion, refreshing the browser is recommended to ensure the latest state is displayed.
Configuring Power BI Apps for Targeted Audiences
Configuring Power BI apps for specific audiences requires a strategic approach that enhances engagement and drives meaningful insights. Here are several key steps to consider:
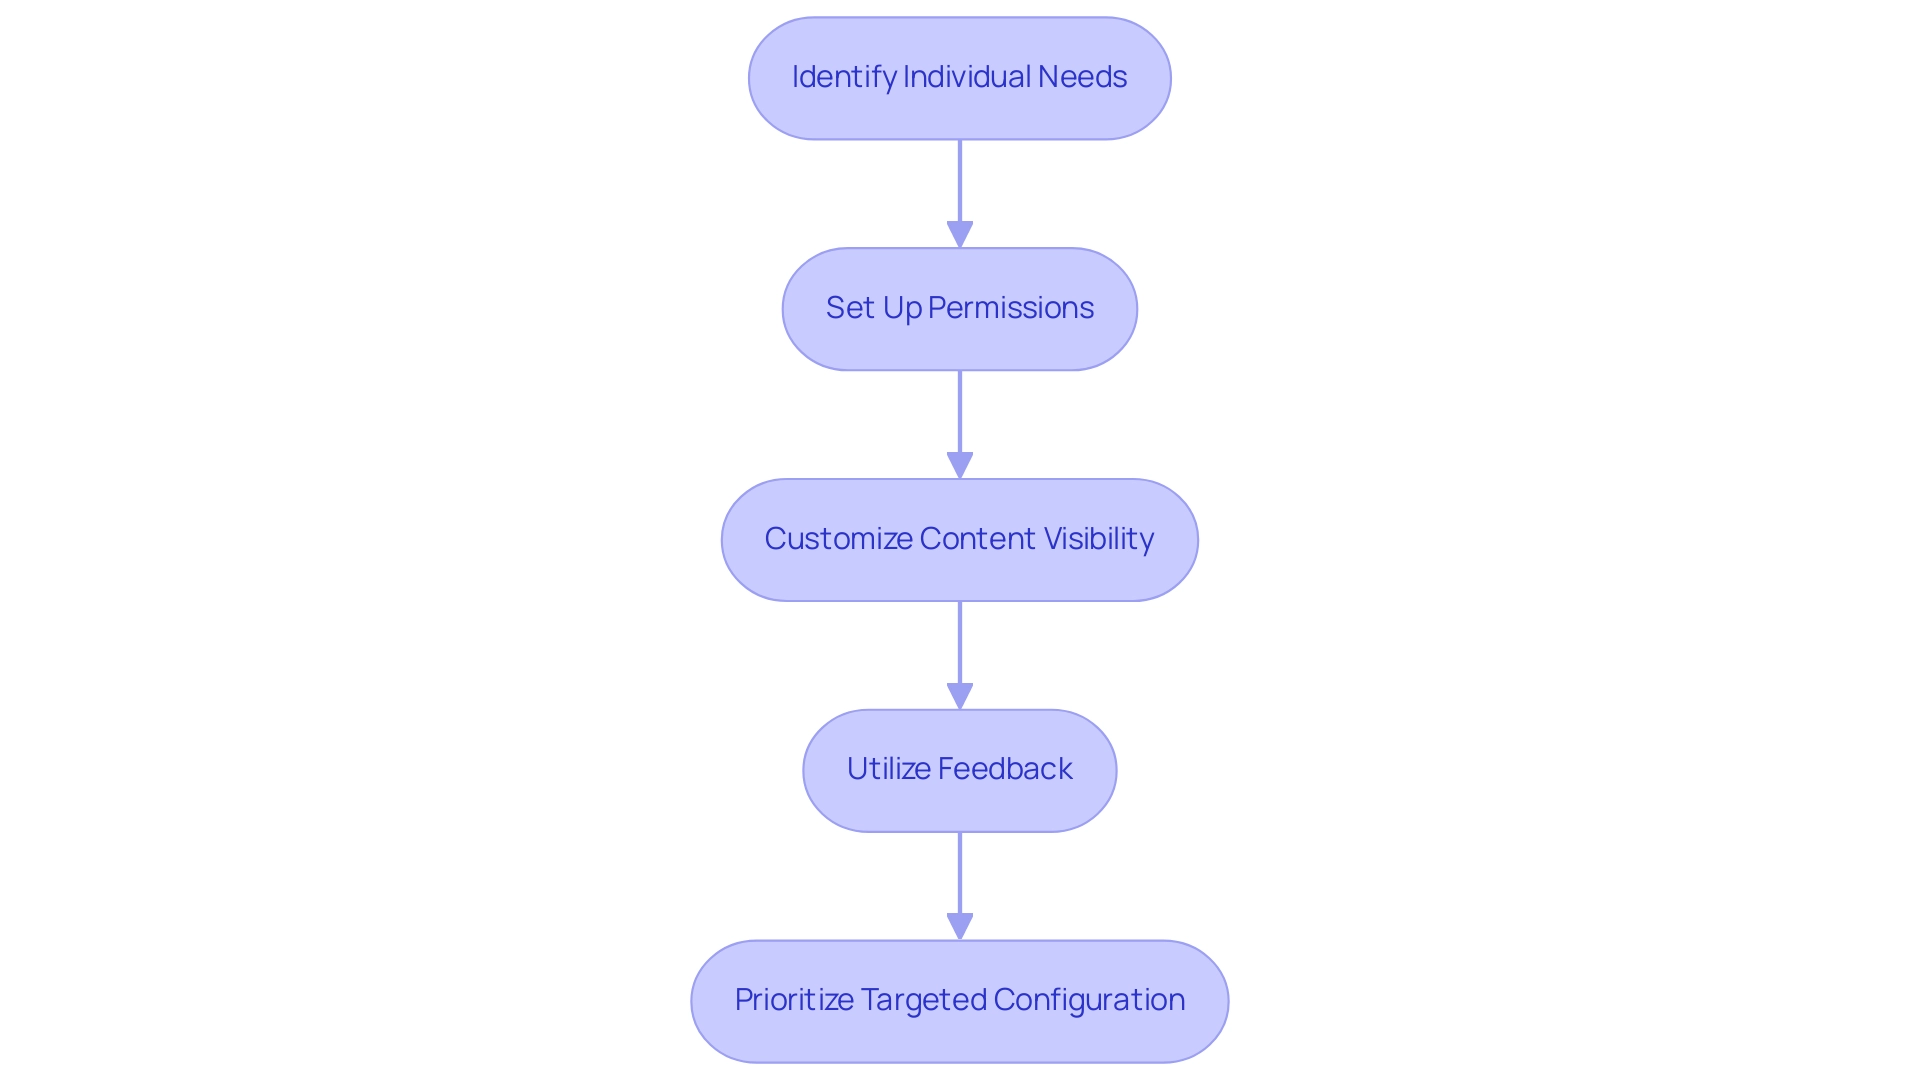
- Identify Individual Needs:
Conduct a thorough analysis of the different groups within your organization to ascertain their specific insights and reporting requirements.
Comprehending these needs is essential for providing pertinent content, particularly given that reports not accessed over time are logged as Unused reports, suggesting a possible misalignment with audience expectations.
- Set Up Permissions:
Leverage the app’s settings to establish permissions tailored to each role, ensuring that individuals only access the content pertinent to their responsibilities.
This not only protects sensitive information but also enhances the experience for individuals. As mentioned by KarlinOz, “to utilize that I need to create a distinct document for each and every workspace we have in the organization,” which emphasizes the difficulties individuals encounter in overseeing Power BI multiple apps per workspace.
-
Customize Content Visibility:
Adjust the visibility of reports and dashboards based on their relevance to the audience. This targeted method assists individuals in concentrating on the most essential information, enhancing their capacity to make data-driven decisions. -
Utilize Feedback:
Regularly solicit input from individuals to refine app content and enhance usability. Incorporating input from individuals is essential for developing the app in accordance with real experiences and expectations.
By unlocking the potential of Business Intelligence and utilizing RPA solutions like EMMA RPA and Automate, organizations can tackle challenges such as time-consuming report creation and data inconsistencies while automating repetitive tasks.
The case study on the ‘Improved Usage Metrics Report‘ showcases how detailed insights into user engagement and performance metrics can enhance the effectiveness of BI applications. By prioritizing targeted audience configuration, organizations can significantly enhance the value and relevance of their BI apps, ultimately driving better operational outcomes.
Best Practices for Maintaining and Updating Power BI Apps
To effectively maintain and update Power BI apps, organizations should adopt the following best practices:
-
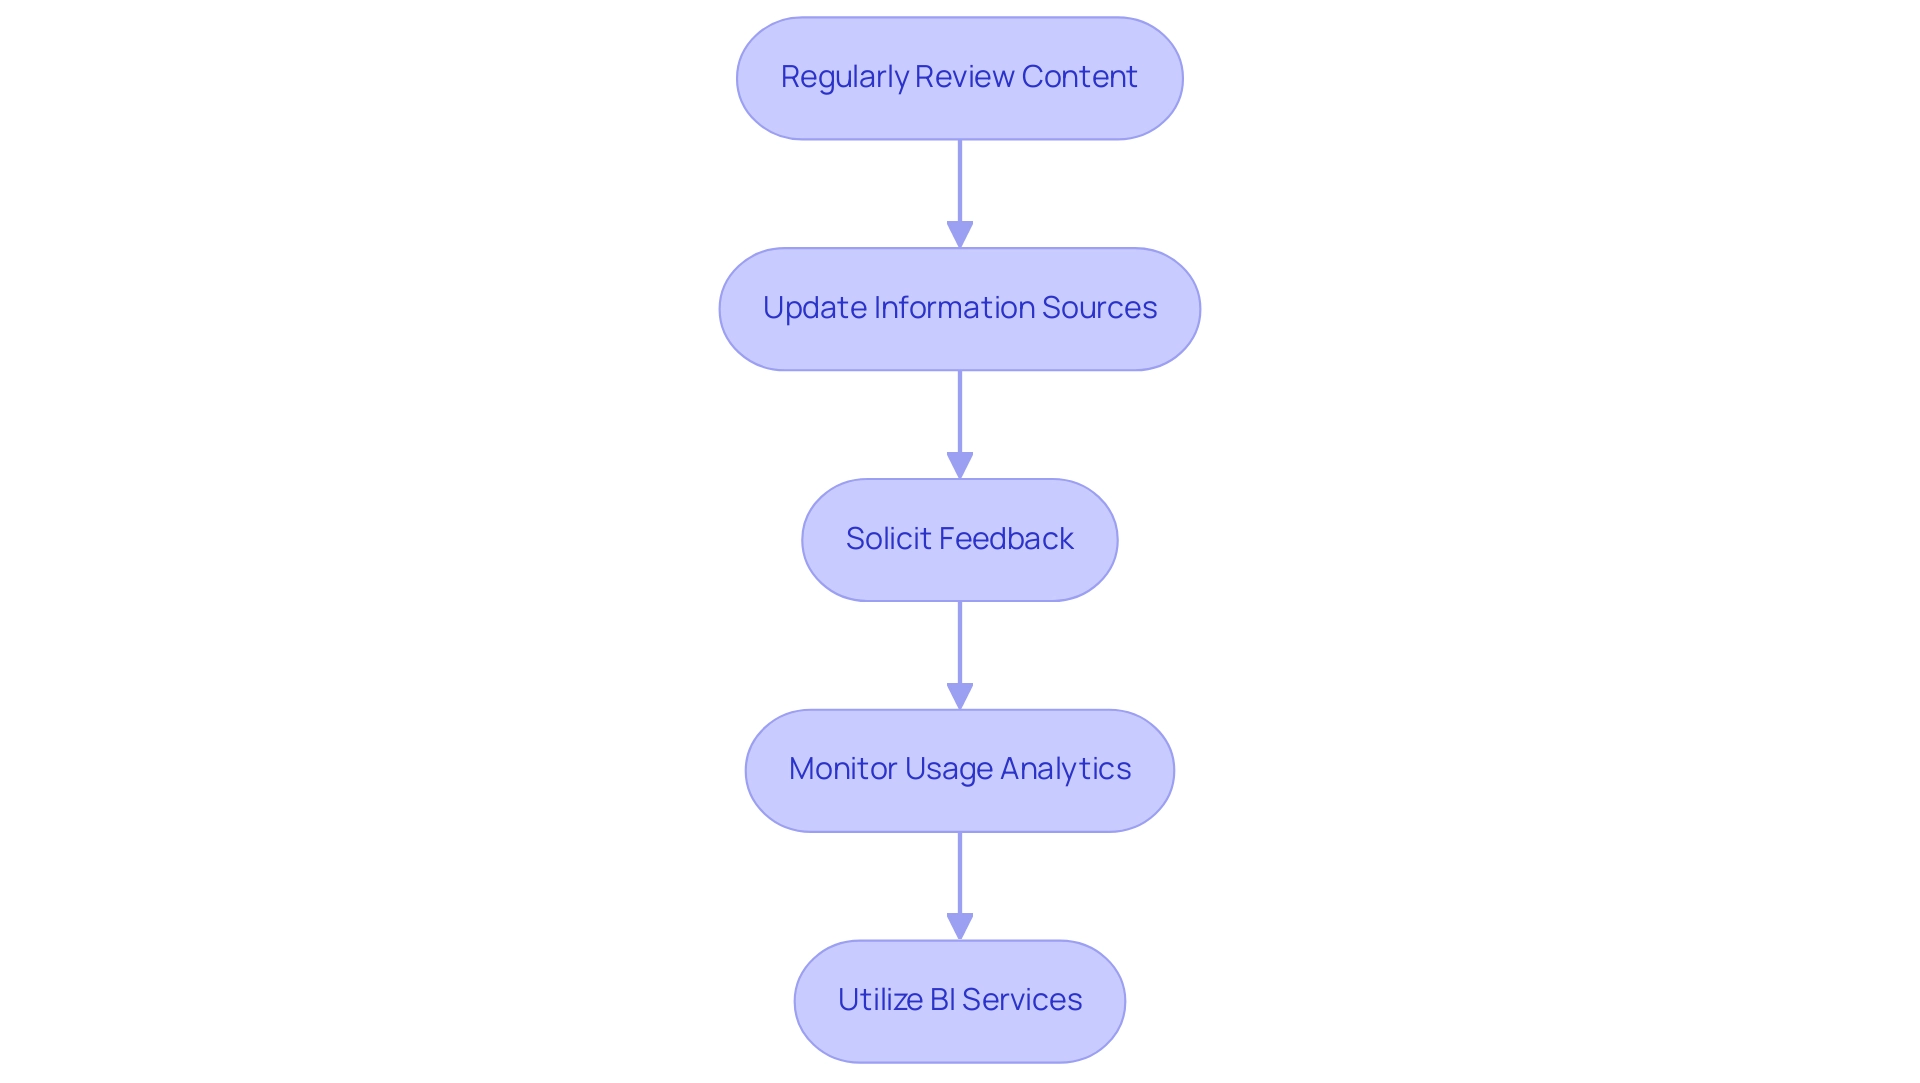
Regularly Review Content: Establish a schedule for periodic assessments of reports and dashboards within your apps. This ensures alignment with evolving business needs and strategic goals.
-
Update Information Sources: Regularly refresh all information sources to ensure that individuals have access to the most precise and timely details. Utilizing dataflows allows for centralized data sourcing, minimizing discrepancies and enhancing data reliability—an essential aspect of leveraging Business Intelligence effectively.
-
Solicit Feedback: Proactively seek input from individuals to identify enhancement opportunities. As noted by Kwixand Solutions, “Get in touch with one of our implementation experts by scheduling a free consultation to see how Kwixand can help support your business’s unique needs and goals.”
Incorporating insights from individuals is crucial for informed updates that resonate with preferences.
- Monitor Usage Analytics: Utilize BI’s analytics capabilities to track app usage and engagement metrics.
By analyzing this data, organizations can adjust content and features to better serve users. Additionally, the case study titled “Cross-Checking Referential Integrity” demonstrates that in DirectQuery sources with enforced primary keys, verifying the Assume Referential Integrity setting can optimize query performance, speeding up processing through efficient joins.
- Utilize BI Services: Consider leveraging our specialized services like the 3-Day BI Sprint for rapid report creation and the General Management App for comprehensive management and smart reviews. By committing to these ongoing maintenance efforts, organizations ensure that their Power BI apps, especially in the context of power bi multiple apps per workspace, remain relevant and valuable. Such practices not only enhance operational efficiency but also foster a culture of continuous improvement, crucial for staying competitive in today’s fast-paced business environment.
Embracing the power of Business Intelligence and RPA can transform your information into actionable insights that drive growth and innovation. Addressing challenges like time-consuming report creation and data inconsistencies will further empower your organization to make informed decisions.
The Future of Power BI Apps: Trends and Innovations
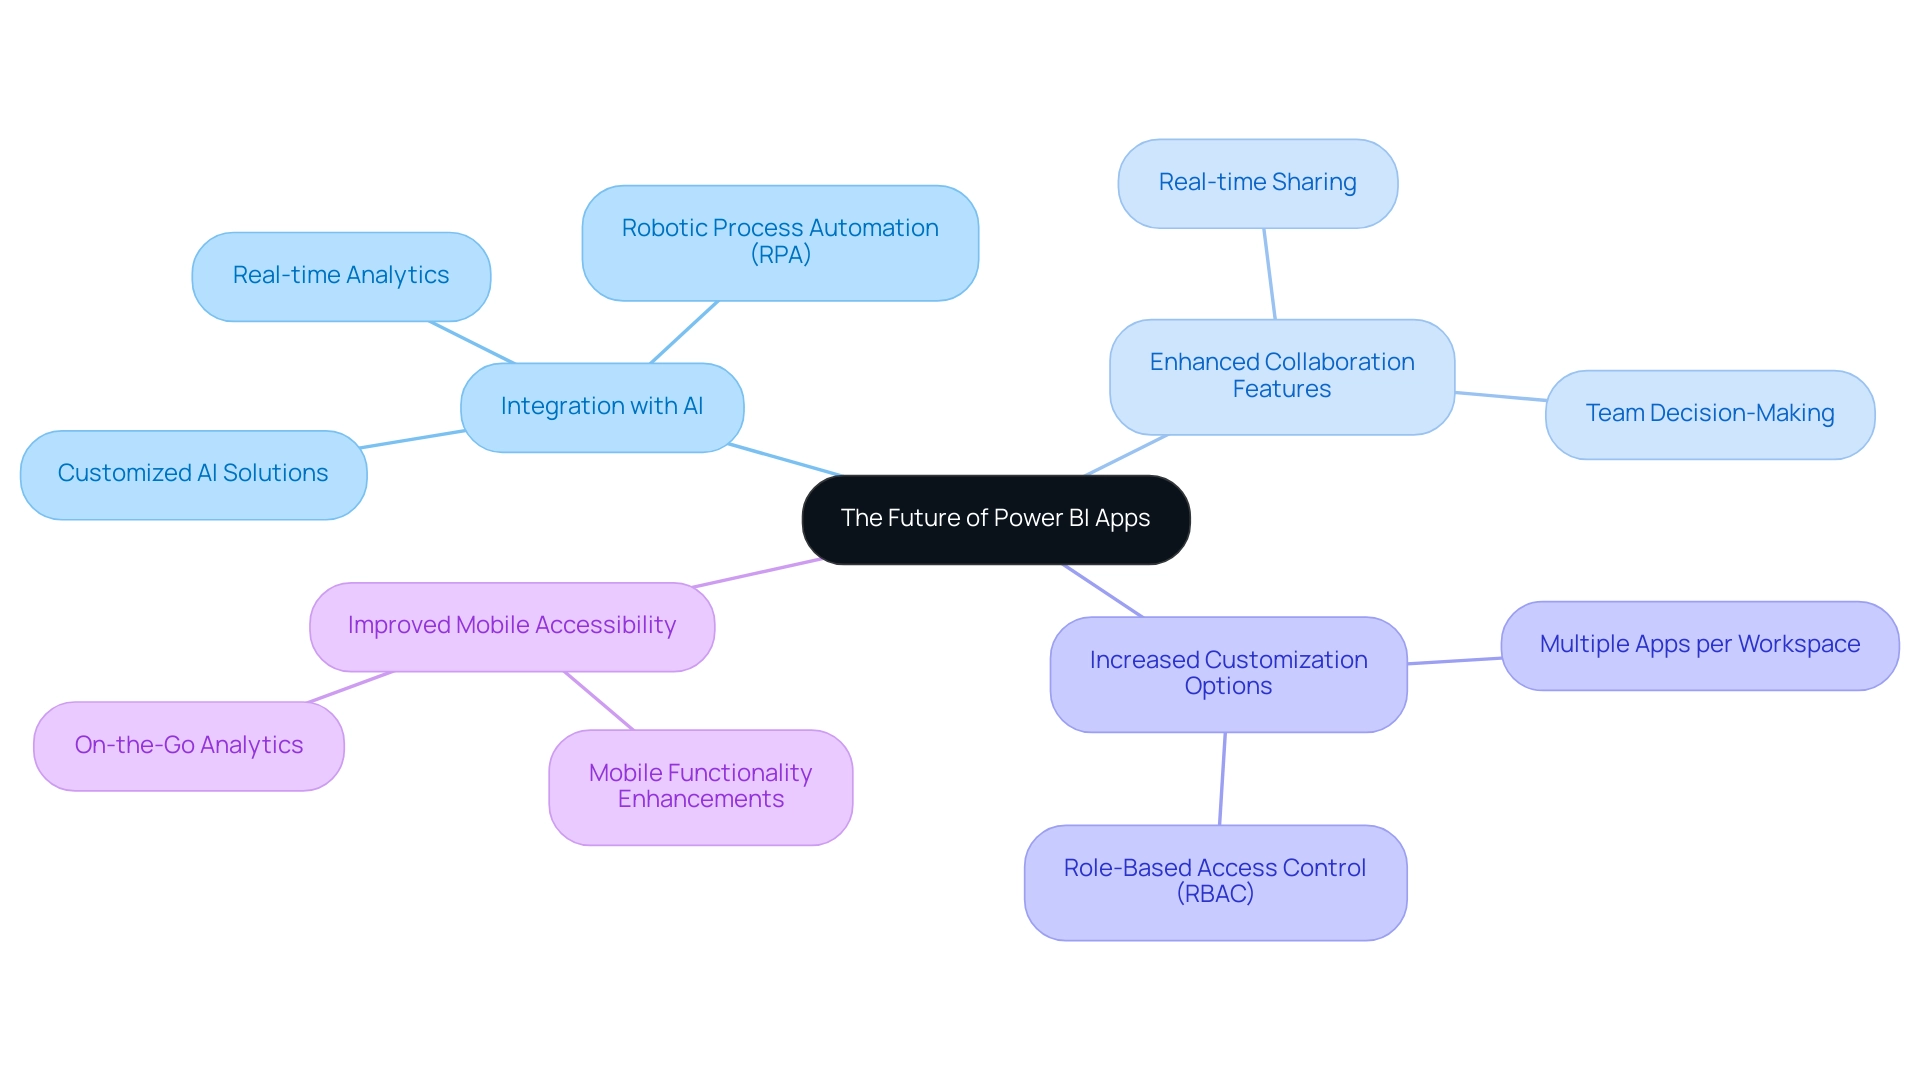
The future landscape of BI applications is set to be defined by several dynamic trends and innovations:
- Integration with AI:
As artificial intelligence technologies advance, BI is poised to embed more sophisticated analytical capabilities, simplifying the process for users to extract actionable insights from vast datasets. This evolution is essential, especially as over 80% of professionals express a need for real-time analytics, positioning Power BI as a key player in this demand.
Moreover, leveraging Robotic Process Automation (RPA) can enhance operational workflows by automating manual processes, thus reducing errors and freeing teams to focus on strategic analysis. Customized AI solutions can further support organizations in navigating the complexities of AI adoption by providing targeted technologies that align with specific business objectives, thereby addressing challenges such as poor master information quality.
-
Enhanced Collaboration Features:
Upcoming updates are anticipated to foster seamless collaboration across teams, incorporating features that enable real-time sharing and editing of insights. Such advancements are essential for enhancing teamwork and decision-making processes. -
Increased Customization Options:
With the introduction of Power BI multiple apps per workspace, users will likely see an increase in app customization options, allowing experiences to be tailored to individual preferences. This level of personalization can significantly enhance engagement and satisfaction, particularly with the upgraded role-based access control (RBAC) mechanisms ensuring sensitive data is accessible only to authorized individuals. -
Improved Mobile Accessibility:
With the rise of remote work, innovations focused on mobile functionality will be crucial. Power BI’s enhancements in mobile app capabilities allow individuals to access insights on the go, meeting the demands of a mobile workforce. Notably, the case study on Mobile BI and On-the-Go Analytics illustrates how these enhancements cater to the needs of users working remotely.
Furthermore, as organizations navigate the overwhelming AI landscape, they can overcome adoption hesitations by understanding the benefits of integrating AI and RPA into their information strategies. This proactive approach addresses challenges such as poor master data quality and the perceived complexity of AI projects. By keeping abreast of these trends, organizations can refine their Power BI strategies to utilize Power BI multiple apps per workspace, ensuring they remain competitive in an increasingly data-driven marketplace.
Conclusion
Harnessing the full potential of Power BI apps is essential for organizations seeking to optimize their data-driven decision-making processes. By understanding the lifecycle of these applications, from creation to retirement, businesses can effectively manage their reporting tools and ensure they remain relevant and impactful.
Creating multiple apps tailored to specific audiences not only enhances collaboration but also improves data management. Organizations should prioritize:
– Identifying user needs
– Setting appropriate permissions
– Customizing content visibility
These steps drive engagement and streamline decision-making. Regular updates and maintenance of Power BI apps are crucial for aligning with evolving business requirements and ensuring data accuracy, while leveraging user feedback can lead to continuous improvements that resonate with stakeholders.
Looking ahead, staying informed about emerging trends and innovations in Power BI will empower organizations to adapt and thrive in a rapidly changing landscape. Embracing AI integration, enhancing collaboration features, and improving mobile accessibility are just a few of the ways businesses can elevate their Power BI strategies. By proactively addressing challenges and implementing best practices, organizations can unlock new opportunities for growth and innovation, positioning themselves as leaders in the data-driven economy.
Overview:
To effectively group data by month and year in Power BI, users should create a dedicated calendar table and establish relationships between this table and their primary datasets, followed by utilizing the calendar fields in visualizations. The article emphasizes that this structured approach enhances the accuracy and efficiency of time-based analyses, as it allows for seamless filtering and the application of DAX functions to derive actionable insights from the data.
Introduction
In the realm of data analysis, the significance of a well-structured calendar table in Power BI cannot be overstated. As organizations strive to harness the full potential of their data, the ability to effectively manage and analyze time-based information becomes a crucial differentiator. A dedicated calendar table not only streamlines reporting processes but also enhances data consistency and accuracy, empowering users to uncover actionable insights.
This article delves into the multifaceted benefits of calendar tables, exploring practical methods for their creation using DAX and Power Query, as well as best practices for grouping data by month and year. By integrating these strategies with advanced date intelligence features, organizations can elevate their data analysis capabilities, ensuring they remain competitive in an increasingly data-driven landscape.
Understanding the Power BI Calendar Table
In this tool, a calendar reference is essential for managing time, allowing users to categorize and examine data with accuracy. This chart generally includes essential columns such as year, month, day, and other date-related attributes, which facilitate comprehensive filtering and segmentation using Power BI group by month and year. An optimal approach is to utilize a Date List, which prevents the software from generating underlying date lists for each time field, aiding in avoiding model bloat and enhancing performance.
The effectiveness of a calendar schedule extends beyond basic date tracking; as Joanna Korbecka notes, ‘Moreover, it improves the efficiency and consistency of the information.’ Thus, implementing Power BI group by month and year becomes a critical component for any time-based analysis, especially in a data-rich environment where failing to extract meaningful insights can lead to a competitive disadvantage. To illustrate this, consider the case study titled ‘Importance of a Separate Calendar Resource in BI,’ which highlights how a dedicated calendar resource simplifies time-based calculations and enhances reporting capabilities.
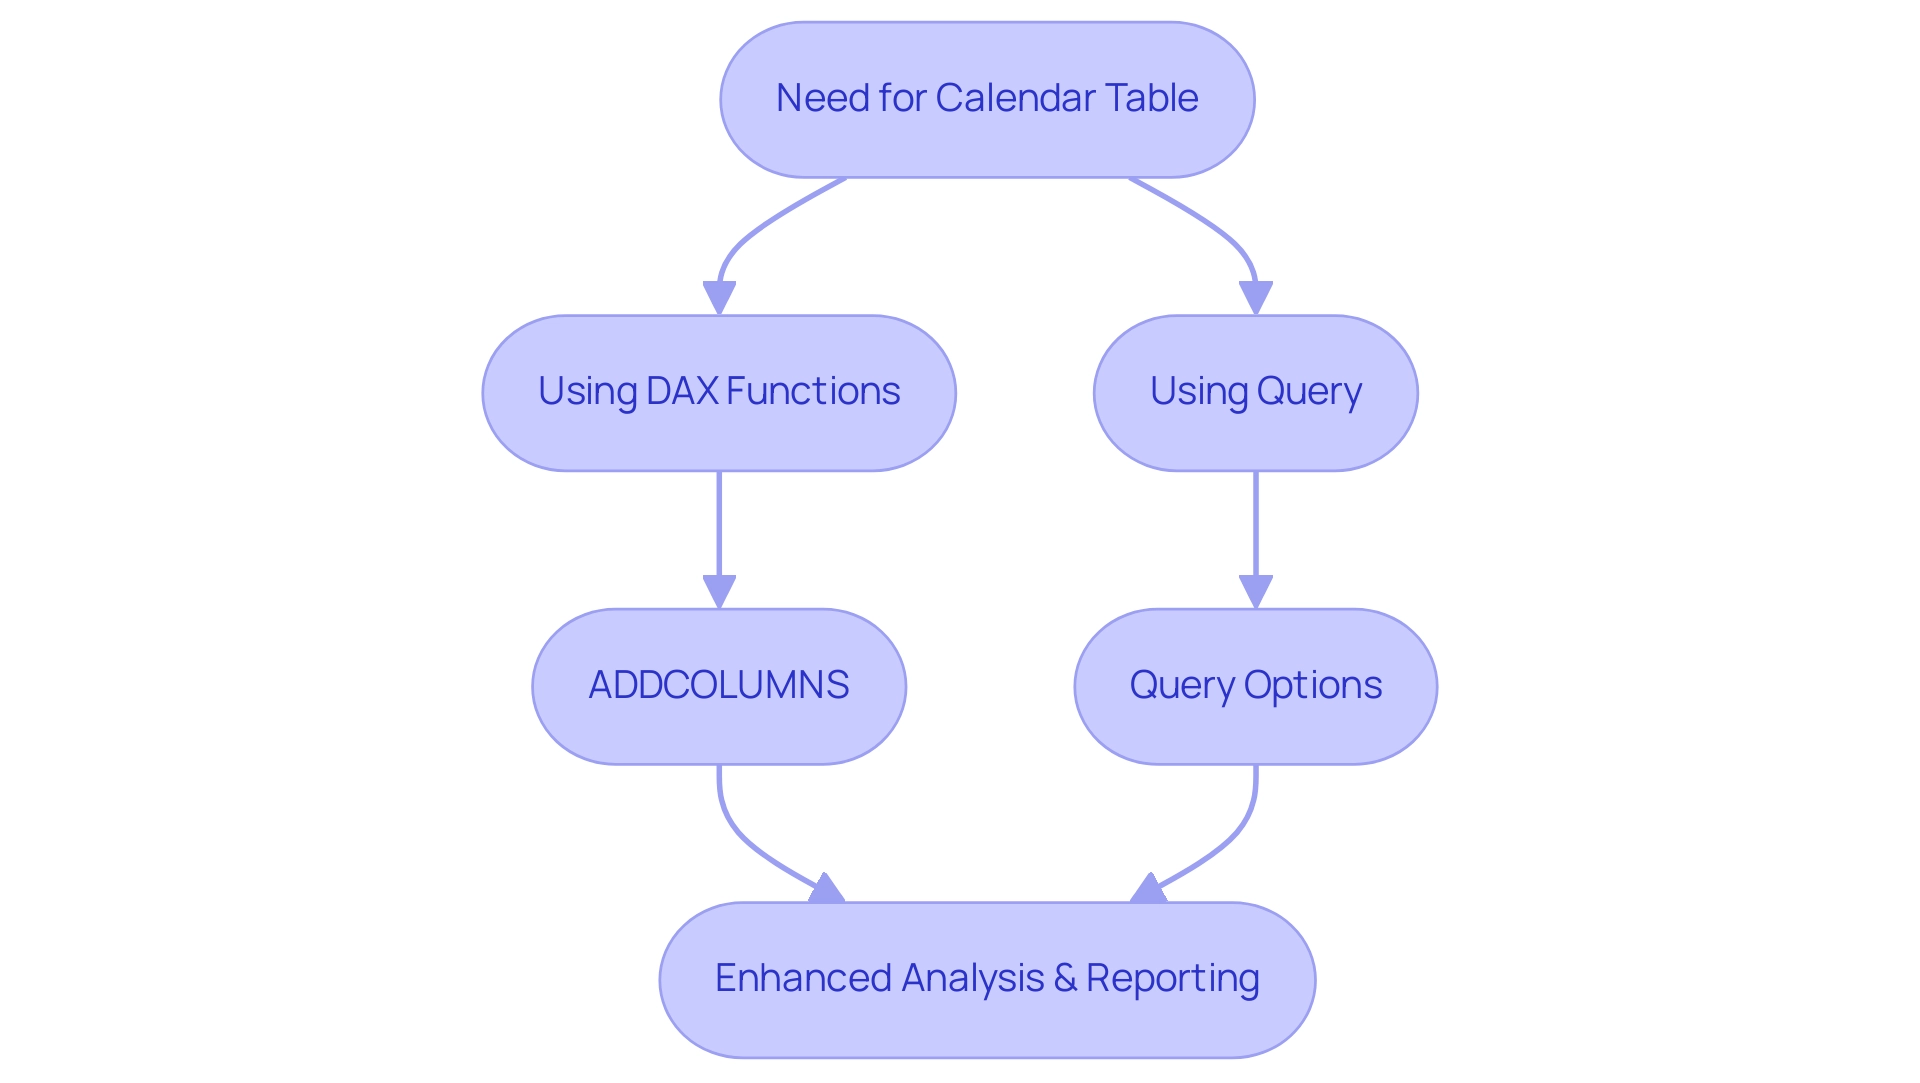
Moreover, incorporating RPA solutions can enhance the use of BI by automating repetitive tasks, thus streamlining the analysis process and boosting operational efficiency. To create a calendar table, you can utilize DAX functions, such as ADDCOLUMNS, to enhance your table with custom columns, or leverage Query for a more visual setup. Both techniques will be examined thoroughly in the upcoming sections, providing you with the resources needed to enhance your analysis in BI.
Additionally, don’t forget that our early bird discount ends on December 31, providing an excellent opportunity to access training and resources related to BI.
Methods for Creating Calendar Tables in Power BI
Establishing calendar tables in BI can significantly enhance your analytics capabilities and address common operational challenges, particularly in improving report creation efficiency and ensuring consistency. There are two main approaches: utilizing DAX (Data Analysis Expressions) or leveraging Query. It’s worth noting that disabling usage metrics for the organization removes access to existing reports and is irreversible, highlighting the necessity of effective data management in BI to prevent confusion and mistrust in your data.
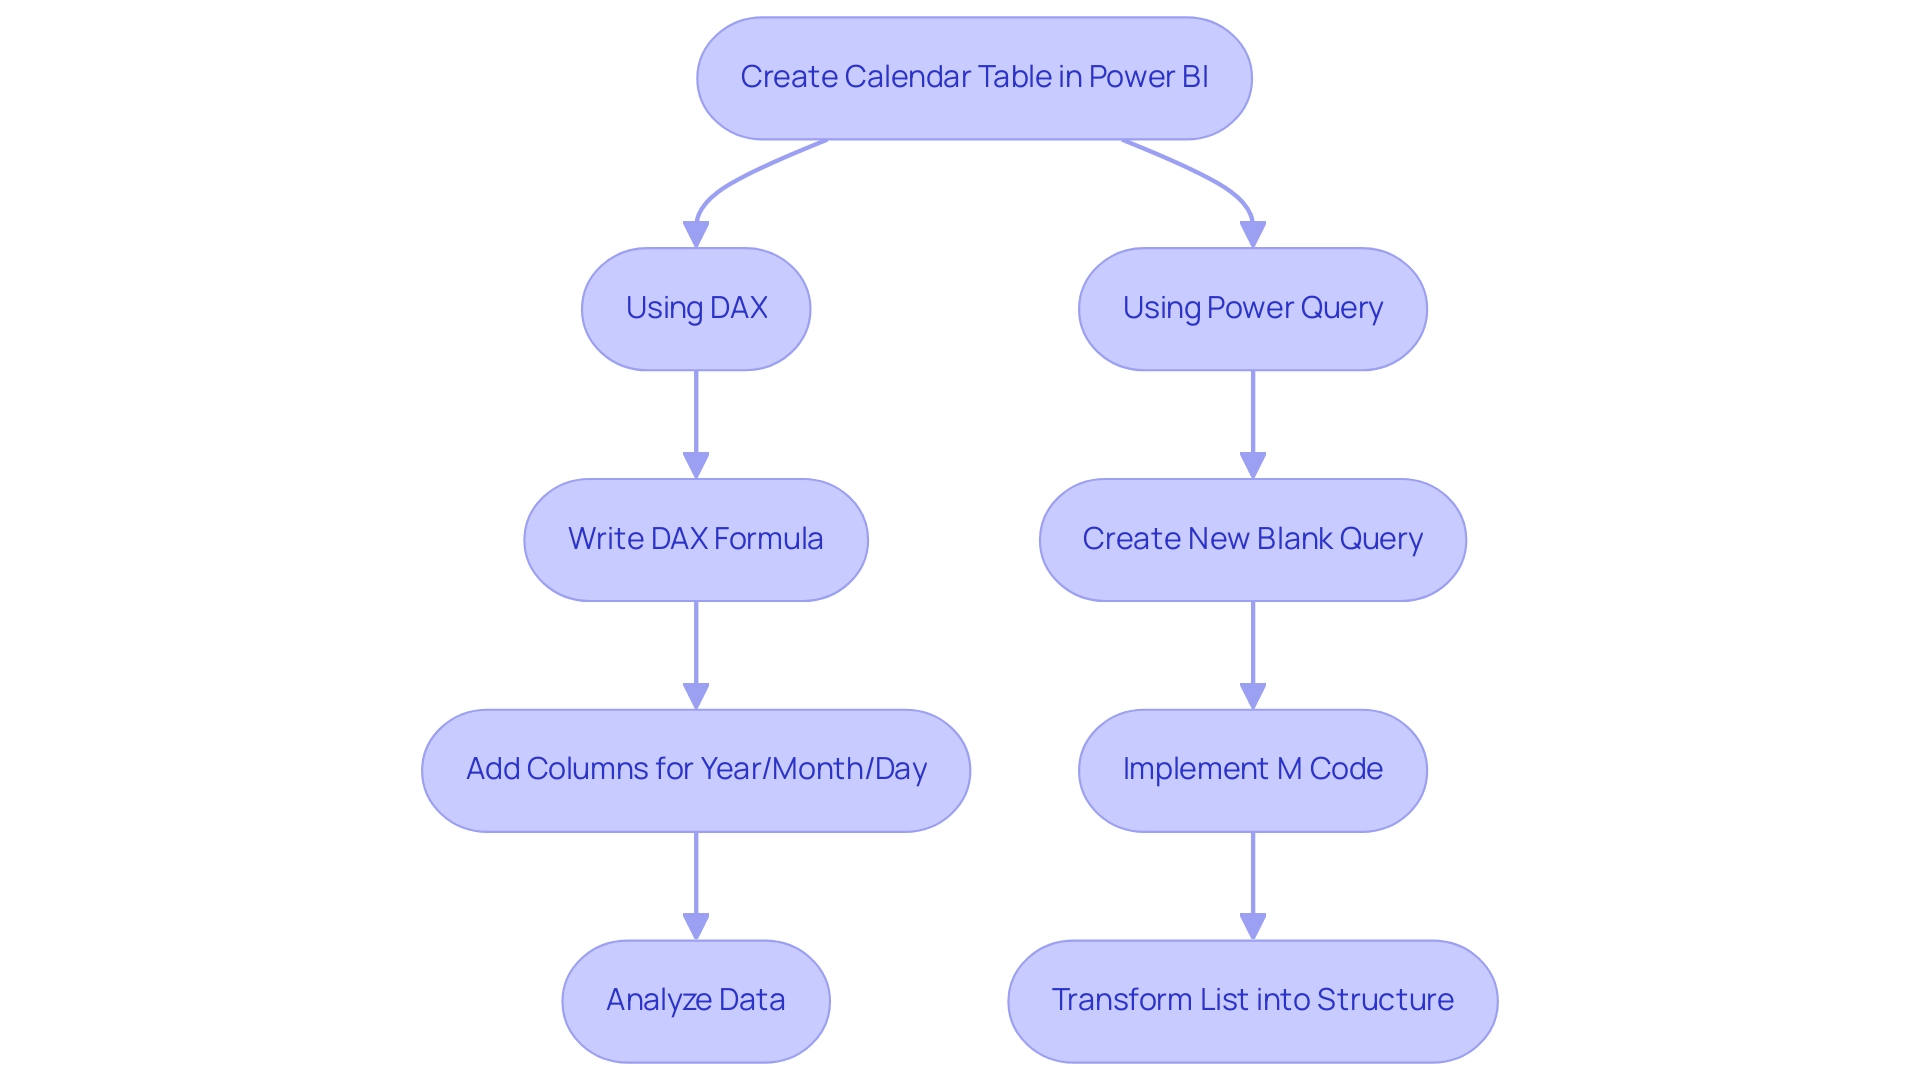
Creating a Calendar Table with DAX: A straightforward way to generate a calendar table directly within Power BI is by using the following DAX formula:
DAX

Calendar = CALENDAR(MIN('YourData'[Date]), MAX('YourData'[Date]))
This formula effectively constructs a table of dates that spans from the earliest to the latest date in your dataset. Once this chart is created, you can enhance it by adding extra columns for year, month, and day, offering clear, actionable guidance for analysis. By having a well-organized calendar layout that utilizes Power BI group by month and year, you can streamline your reporting processes, reduce the time spent on report creation, and minimize inconsistencies in your data.
In 2024, statistics indicate that DAX is increasingly being utilized for calendar structure creation, solidifying its role in addressing the inefficiencies of report generation. Creating a Calendar Schedule with Power Query: Alternatively, Power Query offers a robust method for generating a calendar schedule through its ‘Date’ functions. To start, create a new blank query and implement the following M code:
M

let

    StartDate = #date(2020, 1, 1),

    EndDate = #date(2030, 12, 31),

    Dates = List.Dates(StartDate, Duration.Days(EndDate - StartDate) + 1, #duration(1, 0, 0, 0))

in

    Dates
This code snippet generates a comprehensive list of dates between the defined start and end dates.
You can then transform this list into a structured format and add any necessary columns for subsequent analysis. Furthermore, for time-series information, DAX provides functions like TOTALYTD and SAMEPERIODLASTYEAR, which can be utilized in Power BI group by month and year to analyze trends over time, identify patterns, seasonality, and anomalies. Integrating a governance strategy along with calendar creation can further improve the reliability of your reports by ensuring consistent information usage and clarity in reporting practices.
As Jason Himmelstein aptly states,
There is much more to explore, please continue to read on!
This sentiment truly embodies the wealth of possibilities that both DAX and Query provide for calendar creation in BI, ultimately reducing the time spent on report generation and enhancing the clarity and trustworthiness of your insights.
Step-by-Step Guide to Grouping Data by Month and Year
To effectively group your data by month and year in Power BI, follow this structured approach:
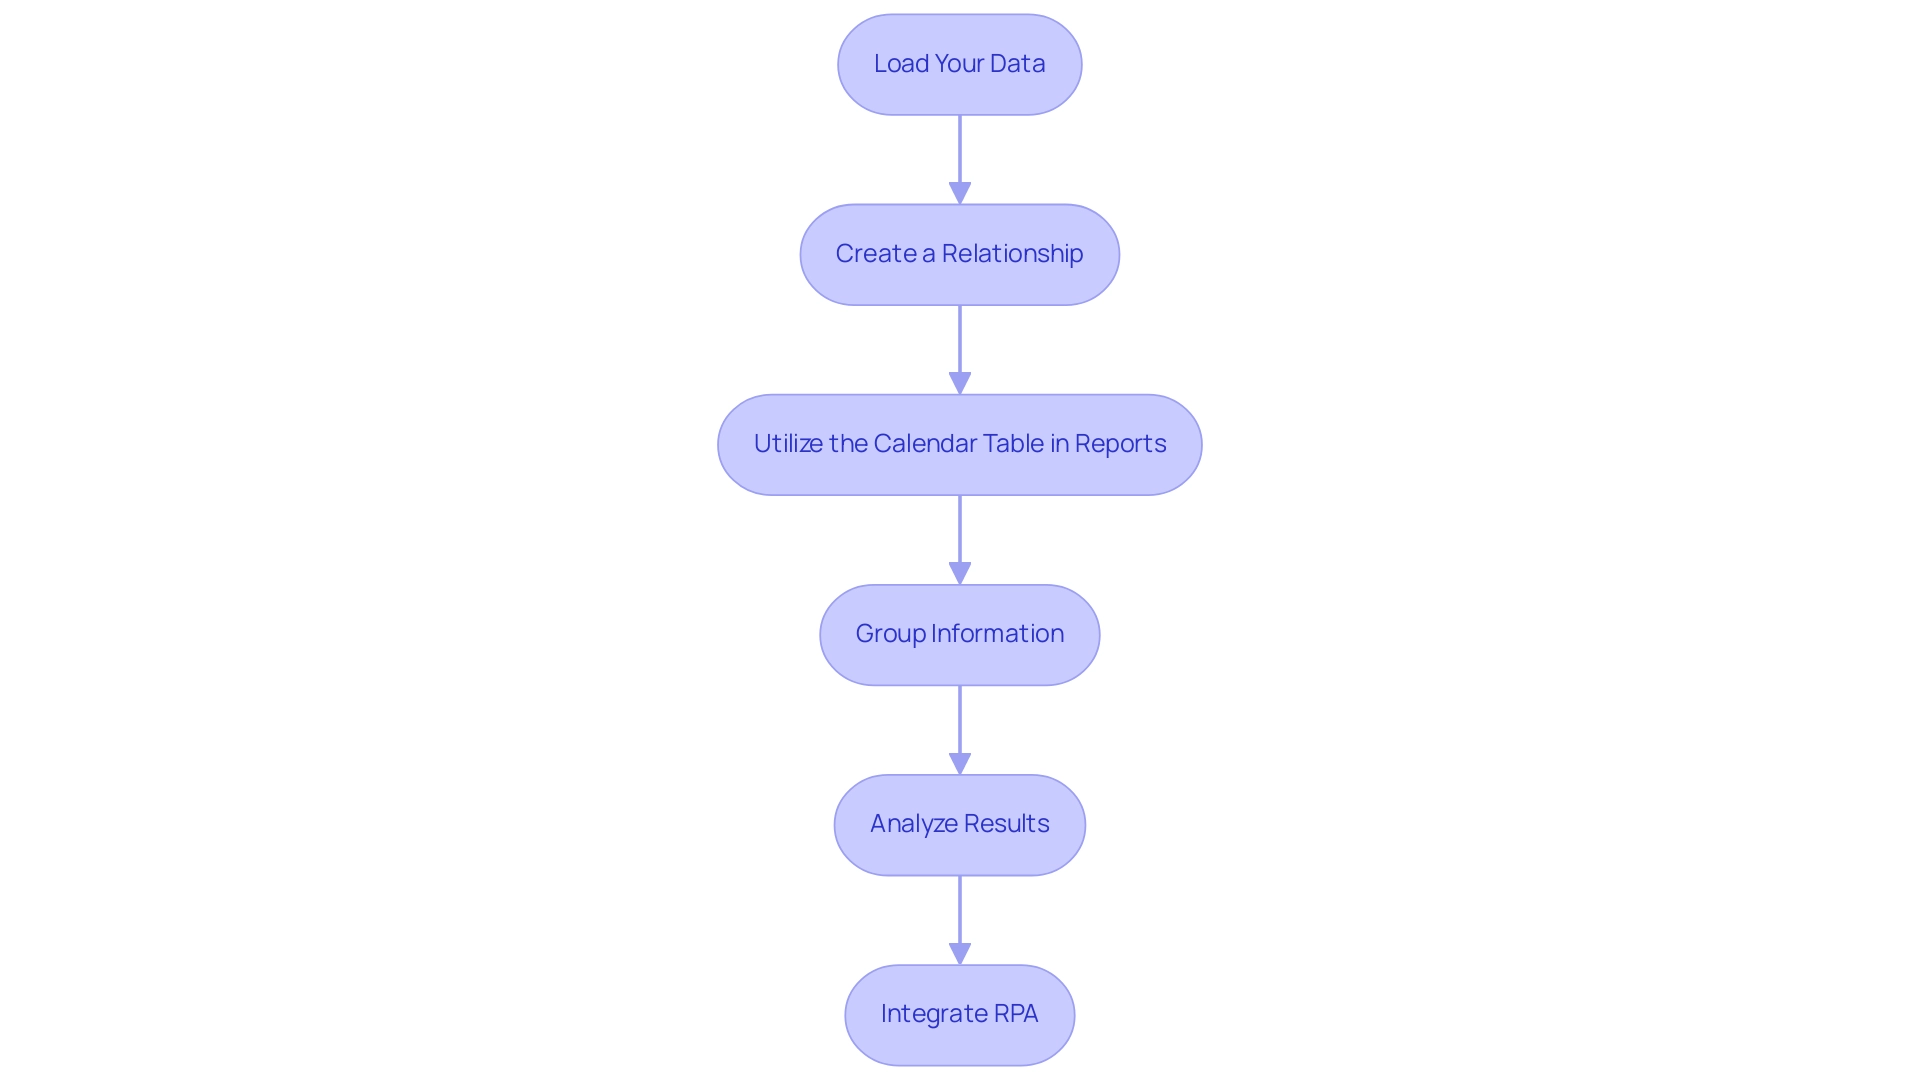
- Load Your Data: Start by confirming that your dataset is imported into BI and that a calendar structure is created, as outlined in earlier sections. Note that Power Query conducts profiling over the first 1,000 rows of your information by default, which assists in comprehending your dataset better.
- Create a Relationship: Navigate to the ‘Model’ view and establish a connection between your calendar entity and the primary information set. This is typically accomplished by connecting the date columns of both datasets.
- Utilize the Calendar Table in Reports: In the report view, you can now drag the month and year fields from your calendar table into your visualizations, enhancing the context of your information.
- Group Information: Within the visualization pane, you can group your information by month and year. For instance, when using a bar chart, configure the axis to display the month while setting the values to represent the sum or average of another field, such as sales.
- Analyze Results: After grouping, you can delve into trend analysis over time, compare month-over-month performance, and extract valuable insights from your information. As Boniface Muchendu, a BI specialist, states, “I’m a BI expert passionate about transforming unrefined information into actionable insights.”
Integrating Robotic Process Automation (RPA) into this procedure can simplify repetitive tasks associated with information gathering and reporting, such as automating the extraction of information from various sources and filling your BI reports. Tools like Power Automate can facilitate these automations, allowing your team to focus on strategic analysis rather than manual information input. Furthermore, consider the insights from the Usage Metrics Report, which illustrates how content has been accessed over the last 90 days.
By effectively grouping information, you can adapt your dashboards based on real user engagement insights, ensuring that your reports are not only accurate but also actionable.
Implementing these techniques not only streamlines your analysis but also empowers you to make informed, evidence-based decisions. By effectively using Power BI group by month and year to group data in Business Intelligence, you can alleviate the challenges of extracting meaningful insights while harnessing the full potential of Business Intelligence and RPA for operational excellence.
Leveraging Date Intelligence for Enhanced Data Analysis
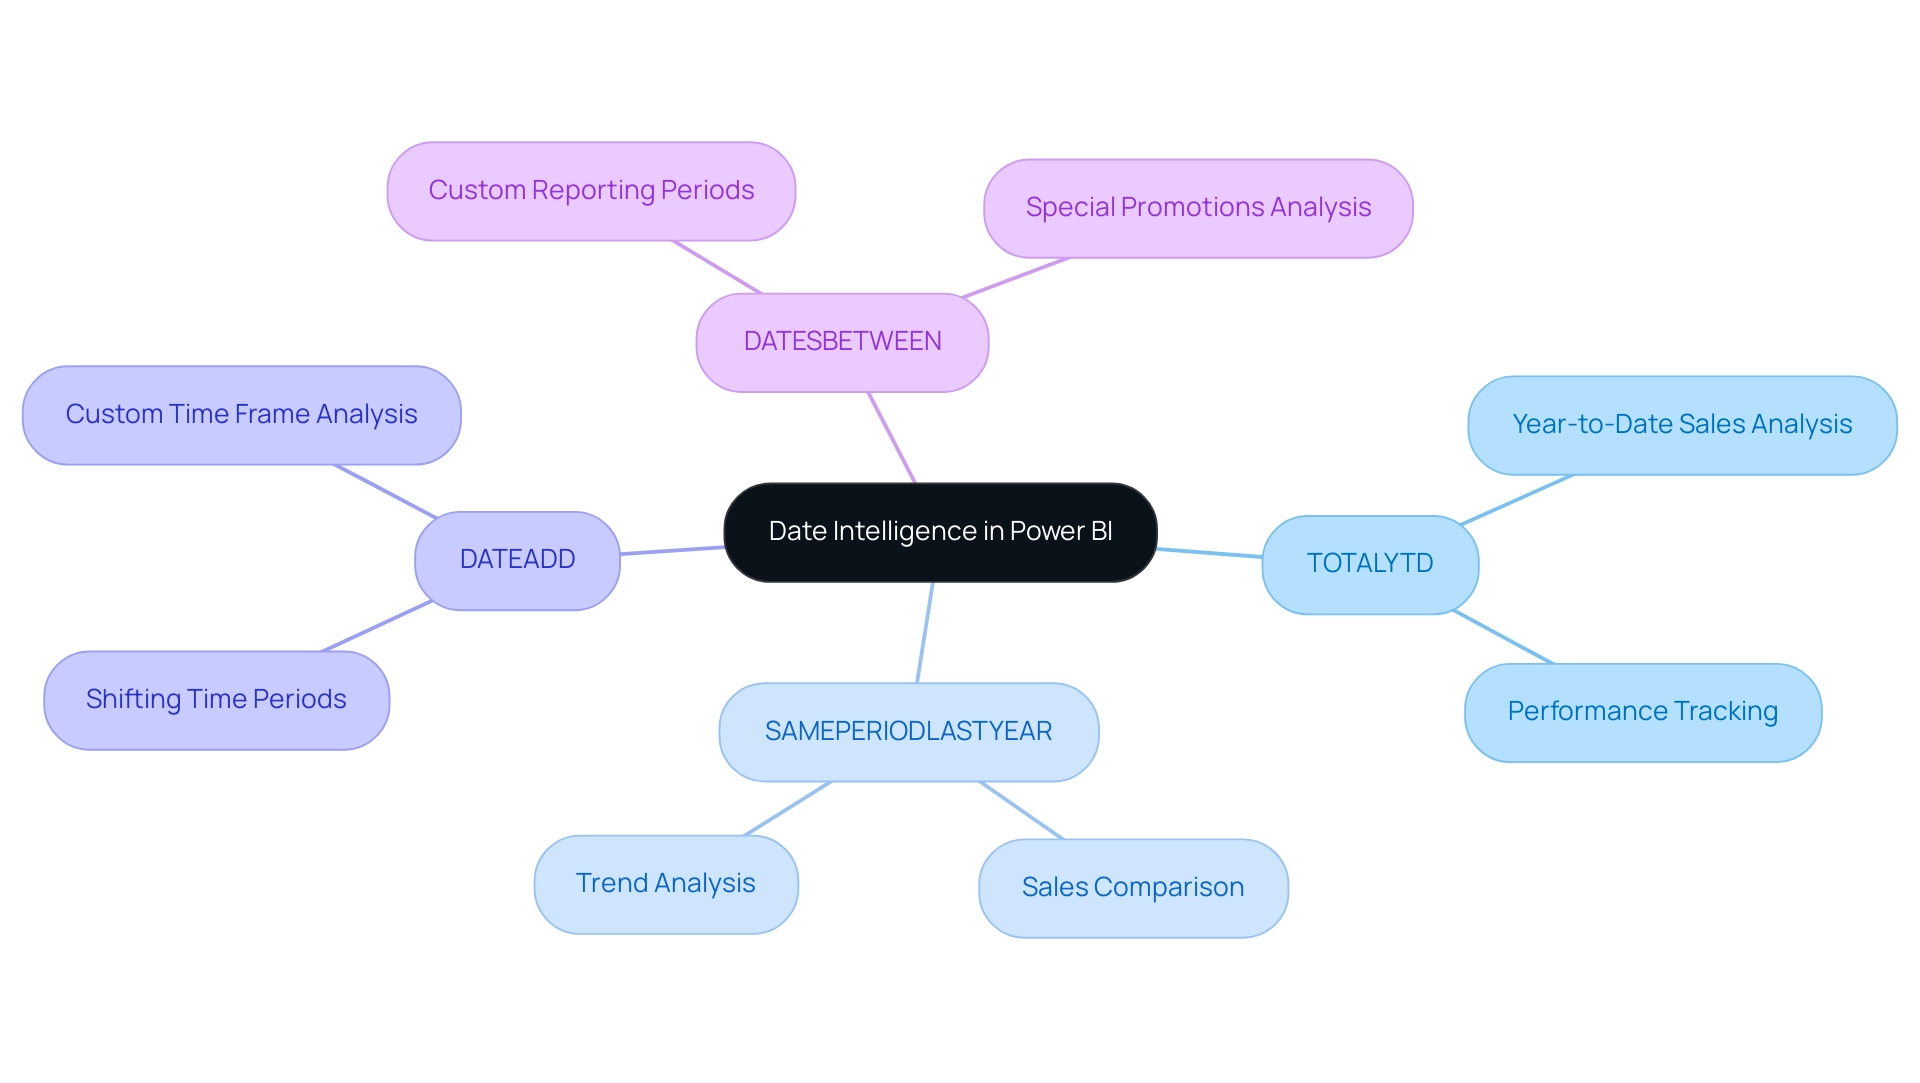
Date intelligence in Power BI, particularly the ability to group by month and year, is a powerful feature that enables users to conduct time-based calculations and analyses effectively, which is crucial for driving data-driven insights. Utilizing DAX functions such as TOTALYTD, SAMEPERIODLASTYEAR, and DATEADD can significantly enhance your analytical capabilities. For instance, if you’re aiming to compare this year’s sales against those of the previous year, employing the SAMEPERIODLASTYEAR function allows for a dynamic calculation of last year’s sales based on the current context.
This functionality not only empowers users to derive actionable insights but also aids in identifying trends over time, thereby improving the overall effectiveness of reports. As emphasized by industry expert amitchandak, “For time intelligence, prefer a date calendar table marked as the date,” highlighting the crucial role of a well-structured date calendar for accurate analysis. Furthermore, combining Business Intelligence with Robotic Process Automation (RPA) can automate repetitive reporting tasks, easing the burden of time-consuming report creation and addressing inconsistencies.
EMMA RPA, for instance, simplifies information entry processes and improves accuracy, while Automate enables smooth workflows between applications, ensuring that information is consistently refreshed and accessible for analysis. Additionally, the ability to customize time frames, as demonstrated by the DATESBETWEEN function, allows for tailored insights that address specific business questions; for example, using Power BI group by month and year can help define reporting periods for special promotions or fiscal quarters. Moreover, the introduction of the new text slicer feature in BI enhances user interaction with date filters, making it easier to visualize and analyze time-related information.
By mastering these DAX functions and features, alongside leveraging the power of BI and RPA, you can unlock the full potential of your analysis outcomes and drive informed decision-making. To explore how EMMA RPA and Automation can specifically benefit your operations, consider booking a free consultation.
Best Practices and Common Challenges in Date Grouping
When navigating the complexities of schedule charts and using Power BI group by month and year to group information, it’s essential to address common challenges such as time-consuming report creation, inconsistencies, and the lack of actionable guidance. Implementing the following best practices can significantly enhance your analytical capabilities and provide clearer next steps for stakeholders:
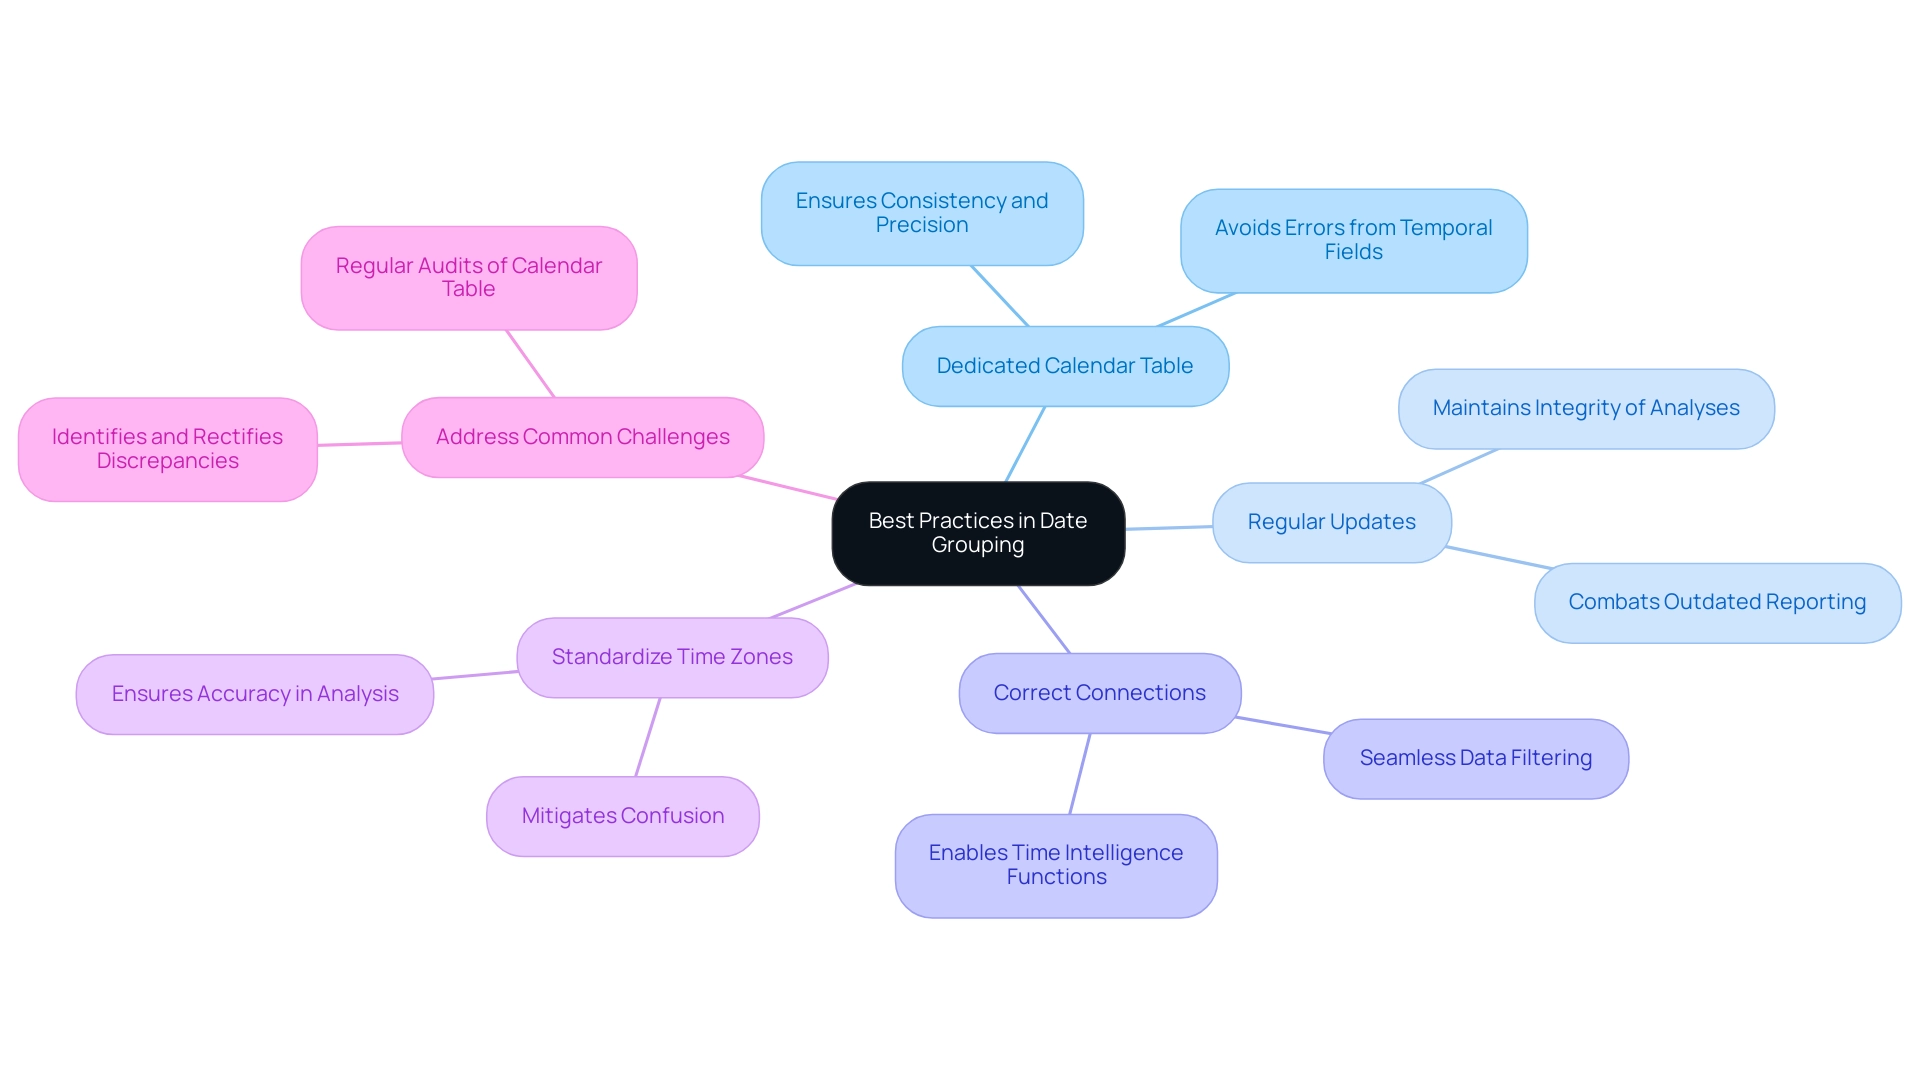
- Utilize a Dedicated Calendar Table: This foundational step guarantees consistency and precision in your time calculations.
Depending on temporal fields from your main records can result in errors; therefore, a specific calendar structure is crucial. With a confidence interval of .05, ensuring accuracy in these calculations is paramount to trustworthy analysis.
- Ensure Regular Updates to Your Calendar: Keep your calendar updated to encompass new dates, especially in dynamic business environments where information frequently evolves.
This practice helps maintain the integrity of your time-based analyses and combats the issue of outdated reporting, especially when using Power BI group by month and year.
- Establish Correct Connections: It’s essential that your calendar structure is suitably connected to other information sets.
Establishing these relationships allows for seamless data filtering and avoids discrepancies during analysis, enabling users to effectively use time intelligence functions in Power BI group by month and year, thus providing actionable insights.
- Standardize Time Zones and Formats: For datasets that span multiple time zones, adopting a consistent time zone for your calendar is vital.
This practice not only mitigates confusion but also ensures accuracy in your time-based analysis, addressing the inconsistencies that often arise in reporting.
- Address Common Challenges: Users often encounter issues with incorrect date formats or missing dates within their analyses.
Regular audits of your calendar table against your information are necessary to identify and rectify any discrepancies promptly, especially when performing a Power BI group by month and year.
This proactive approach fortifies the reliability of your Power BI reports and provides clearer, more actionable insights for stakeholders.
By adhering to these best practices, you not only maximize the effectiveness of your Power BI reporting but also foster accurate data representation, enabling more insightful decision-making and clearer guidance for future actions.
Conclusion
Creating and utilizing a well-structured calendar table in Power BI is a transformative step toward optimizing data analysis and reporting. By understanding its significance, organizations can enhance their ability to manage and interpret time-based data, ensuring consistency and accuracy across reporting processes. The use of DAX and Power Query to create these tables opens up a world of possibilities, enabling streamlined operations and more informed decision-making.
Implementing best practices such as:
- Establishing dedicated calendar tables
- Maintaining regular updates
- Ensuring correct relationships between data tables
will further bolster the effectiveness of time-based analysis. These strategies not only mitigate common challenges but also empower teams to derive actionable insights that drive operational efficiency.
As organizations navigate the complexities of data analysis in a rapidly evolving data landscape, leveraging date intelligence features will be essential. The combination of robust calendar tables and advanced DAX functions allows for deeper insights and trend analysis, ultimately positioning companies to stay ahead of the competition. Embracing these practices ensures that data remains a powerful asset, enabling informed decisions that contribute to long-term success.
Overview:
To get today’s date in Power BI, users can utilize DAX by creating a measure with the formula Today Date = TODAY() or use Power Query to add a custom column with DateTime.LocalNow(). The article provides a detailed step-by-step guide for both methods, emphasizing their importance in enhancing data analysis and ensuring reports reflect real-time information for informed decision-making.
Introduction
In the realm of data analysis, the ability to effectively utilize today’s date within Power BI is not just a convenience; it is a strategic necessity. As organizations strive to enhance operational efficiency and make informed decisions, understanding how to dynamically incorporate the current date into reports and analyses becomes paramount.
From automating report generation to filtering datasets and generating real-time insights, Power BI offers powerful tools that can transform how data is interpreted and presented. By mastering both DAX and Power Query functionalities, users can streamline their reporting processes, mitigate common challenges associated with date management, and ultimately drive business growth through actionable insights.
This article delves into the essential techniques and best practices for harnessing today’s date in Power BI, empowering users to unlock the full potential of their data.
Understanding Today’s Date Functionality in Power BI
In this tool, the power bi get today’s date feature is a fundamental aspect of effective data analysis and reporting, essential for leveraging Business Intelligence to drive operational efficiency. This capability is crucial for tasks such as filtering datasets, crafting dynamic visuals, and generating time-sensitive reports that can inform strategic decisions. Power BI offers strong alternatives for obtaining the current time, with a focus on how to power bi get today’s date, primarily utilizing DAX (Data Analysis Expressions) and Power Query.
As Max pointed out, under the ‘Home’ tab and ‘Calculations’ ribbon, there is a button to create measures. By pasting the text NowDatetime = NOW() into this measure, users can create a measure named ‘NowDatetime’ that shows the current time and moment. Users can also right-click a table in the fields pane and choose ‘new measure’ to create a measure efficiently.
By mastering these functionalities, users can harness date-related insights to their benefit in documents. For example, utilizing Power BI to get today’s date not only automates reporting processes but also ensures that visual representations consistently reflect the most current information—an essential factor for informed decision-making. Moreover, automating the retrieval of today’s information can greatly lessen the time invested in creating documents, tackling one of the primary obstacles in information analysis.
As Tom Martens expressed, grasping the difference between measures and calculated columns in this software is essential; measures, which can be generated on the Desktop version, improve the functionality of analyses by permitting real-time calculations that use Power BI get today’s date. This understanding is vital for leveraging BI effectively, ensuring precise data analysis, and overcoming the challenges of time-consuming document creation and data inconsistencies. Furthermore, incorporating RPA tools such as EMMA RPA and Automate can enhance these processes further, automating repetitive tasks and ensuring that your documents are not only timely but also precise, thus offering actionable insights that propel business growth.
Step-by-Step Guide to Using DAX and Power Query for Today’s Date
Using DAX to Get Today’s Date
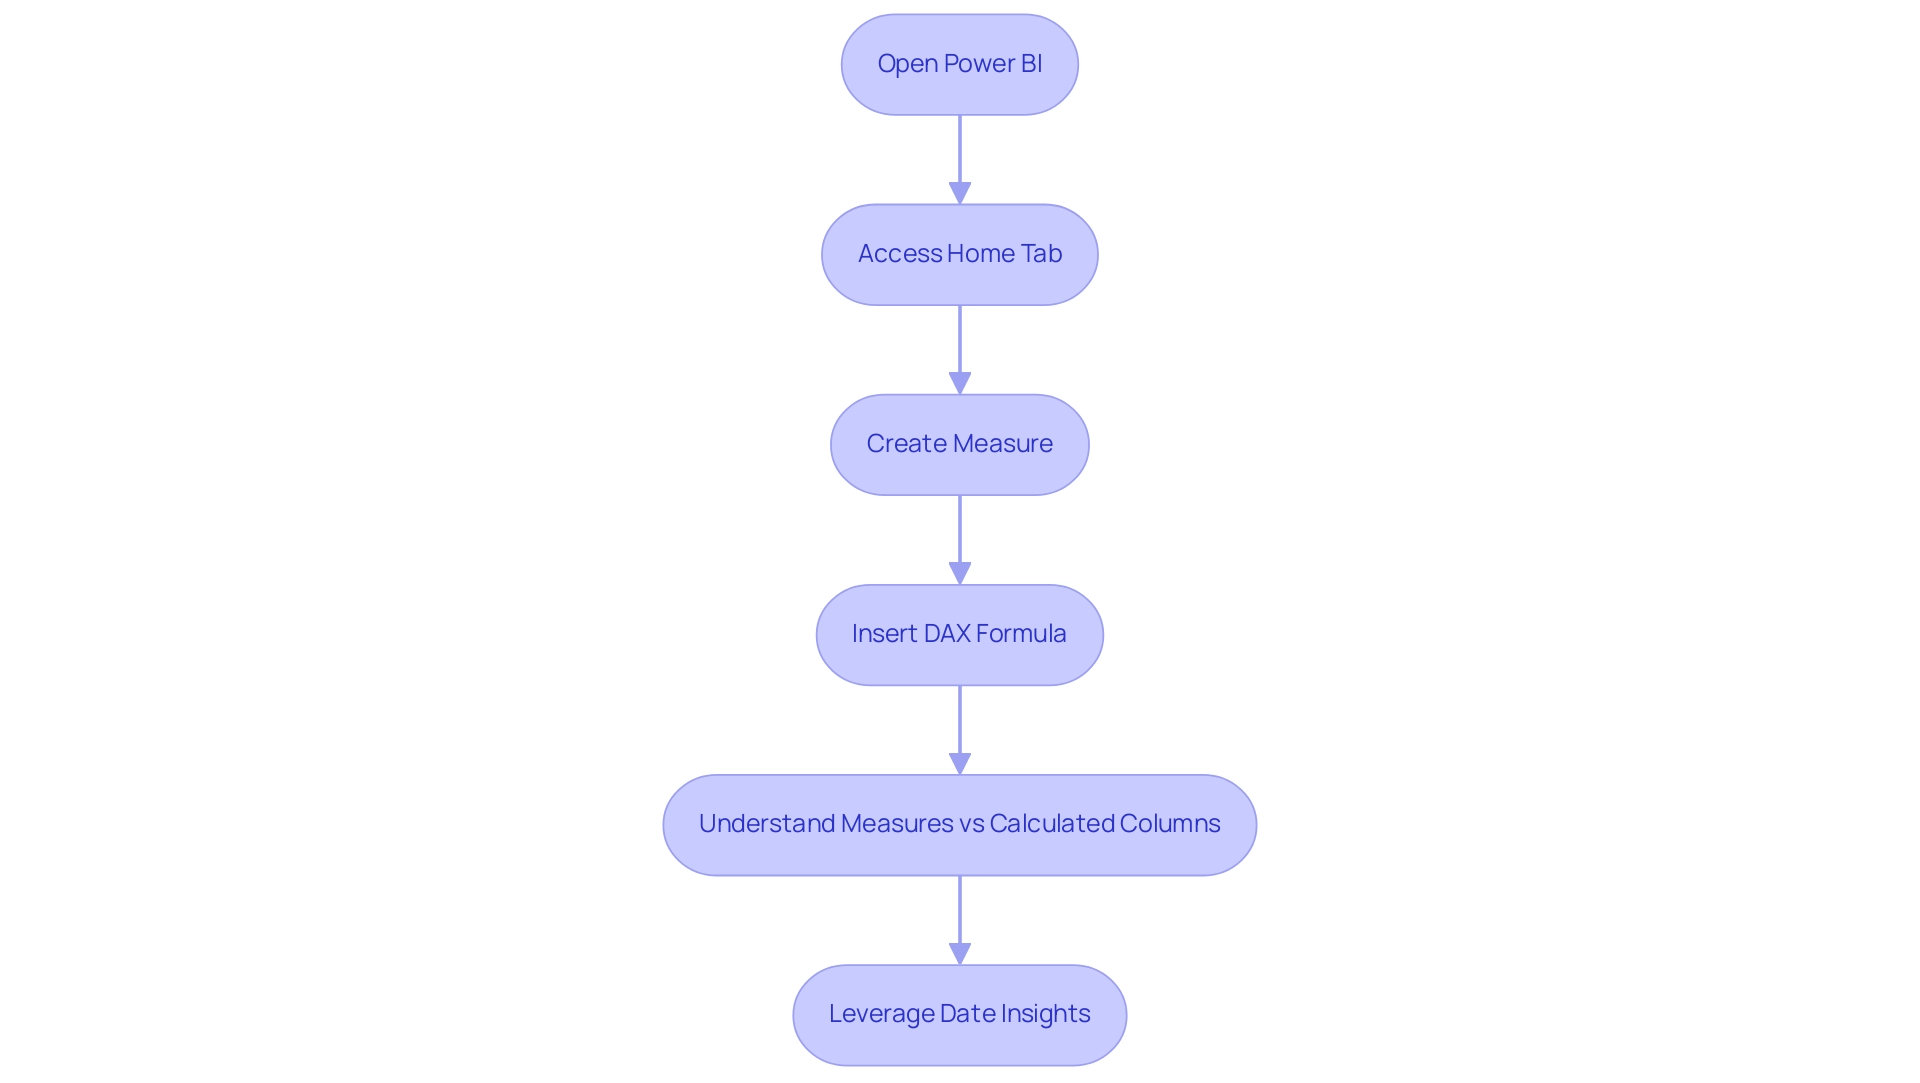
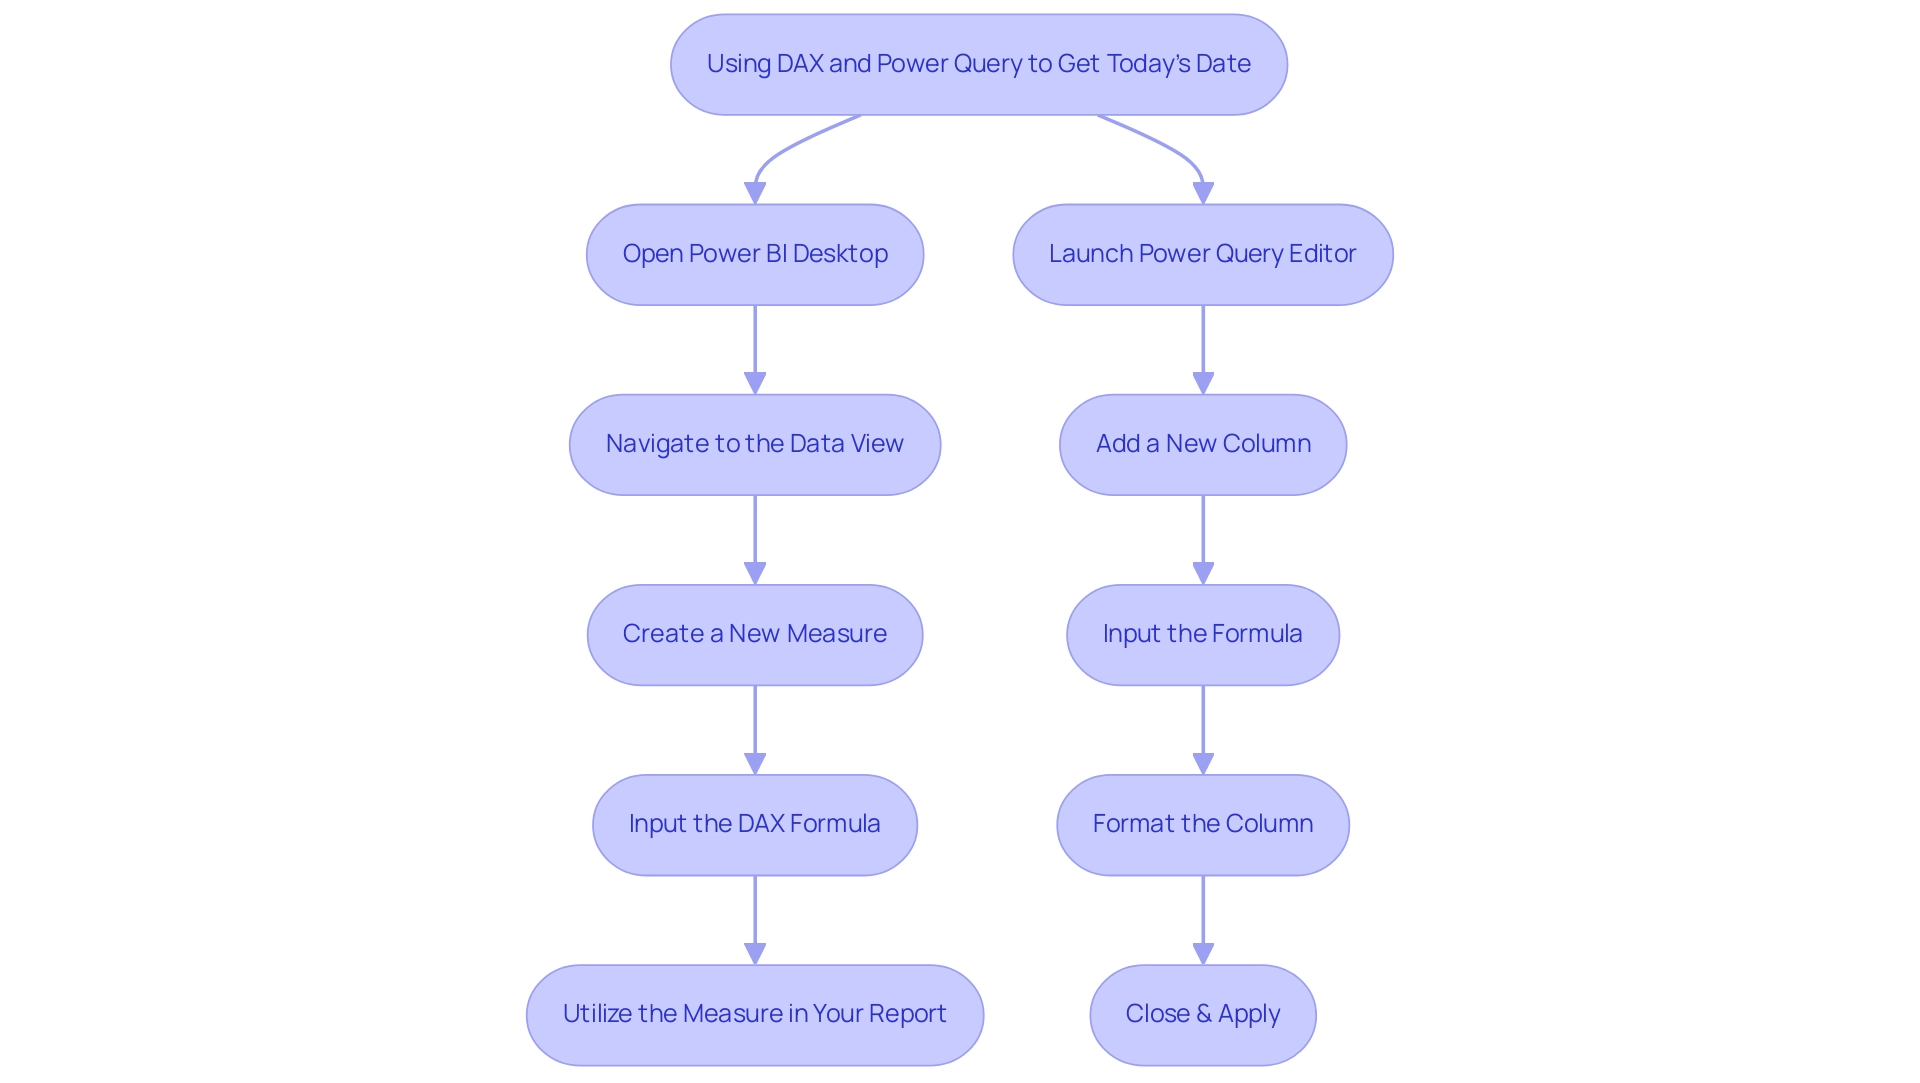
- Open Power BI Desktop: Begin by launching Power BI Desktop and opening the report you wish to work on.
- Navigate to the Data View: Click on the ‘Data’ icon located on the left sidebar to enter the data view.
- Create a New Measure: In the ribbon at the top, click on ‘Modeling’ and select ‘New Measure’.
- Input the DAX Formula: In the formula bar, enter the following DAX formula to create a measure that captures today’s date:
DAX

Today Date = TODAY() - Utilize the Measure in Your Report: This newly created
Today Datemeasure can now be integrated into your visuals or any calculations within your report.
Using Query to Get Today’s Date
- Launch Power Query Editor: In Power BI Desktop, click on ‘Transform Data’ to open the Power Query Editor.
- Add a New Column: In the Home tab, select ‘Add Column’ and then choose ‘Custom Column’.
- Input the Formula: In the formula input box, type:
PowerQuery

   DateTime.LocalNow()
This action will generate a new column containing the current date and time. - Format the Column: To show only the day, right-click on the column header, choose ‘Change Type’, and select ‘Date’.
- Close & Apply: After making your changes, remember to click ‘Close & Apply’ to save your modifications and return to the main BI interface.
By following these detailed steps, users can effectively harness the capabilities of both DAX and Query to get today’s date into their BI visuals, thus enhancing their data analysis and presentation effectiveness.
It’s important to note that the count of dashboards or reports in your organization that have had at least one view in the past 90 days underscores the significance of user engagement with the reports you create. Ongoing advancements in BI and DAX language present opportunities for data-driven innovation, making it essential to utilize these functions effectively.
Additionally, ensure that you are using an updated browser version, as using an outdated version may prevent you from accessing features in BI.
Common Use Cases for Today’s Date in Power BI
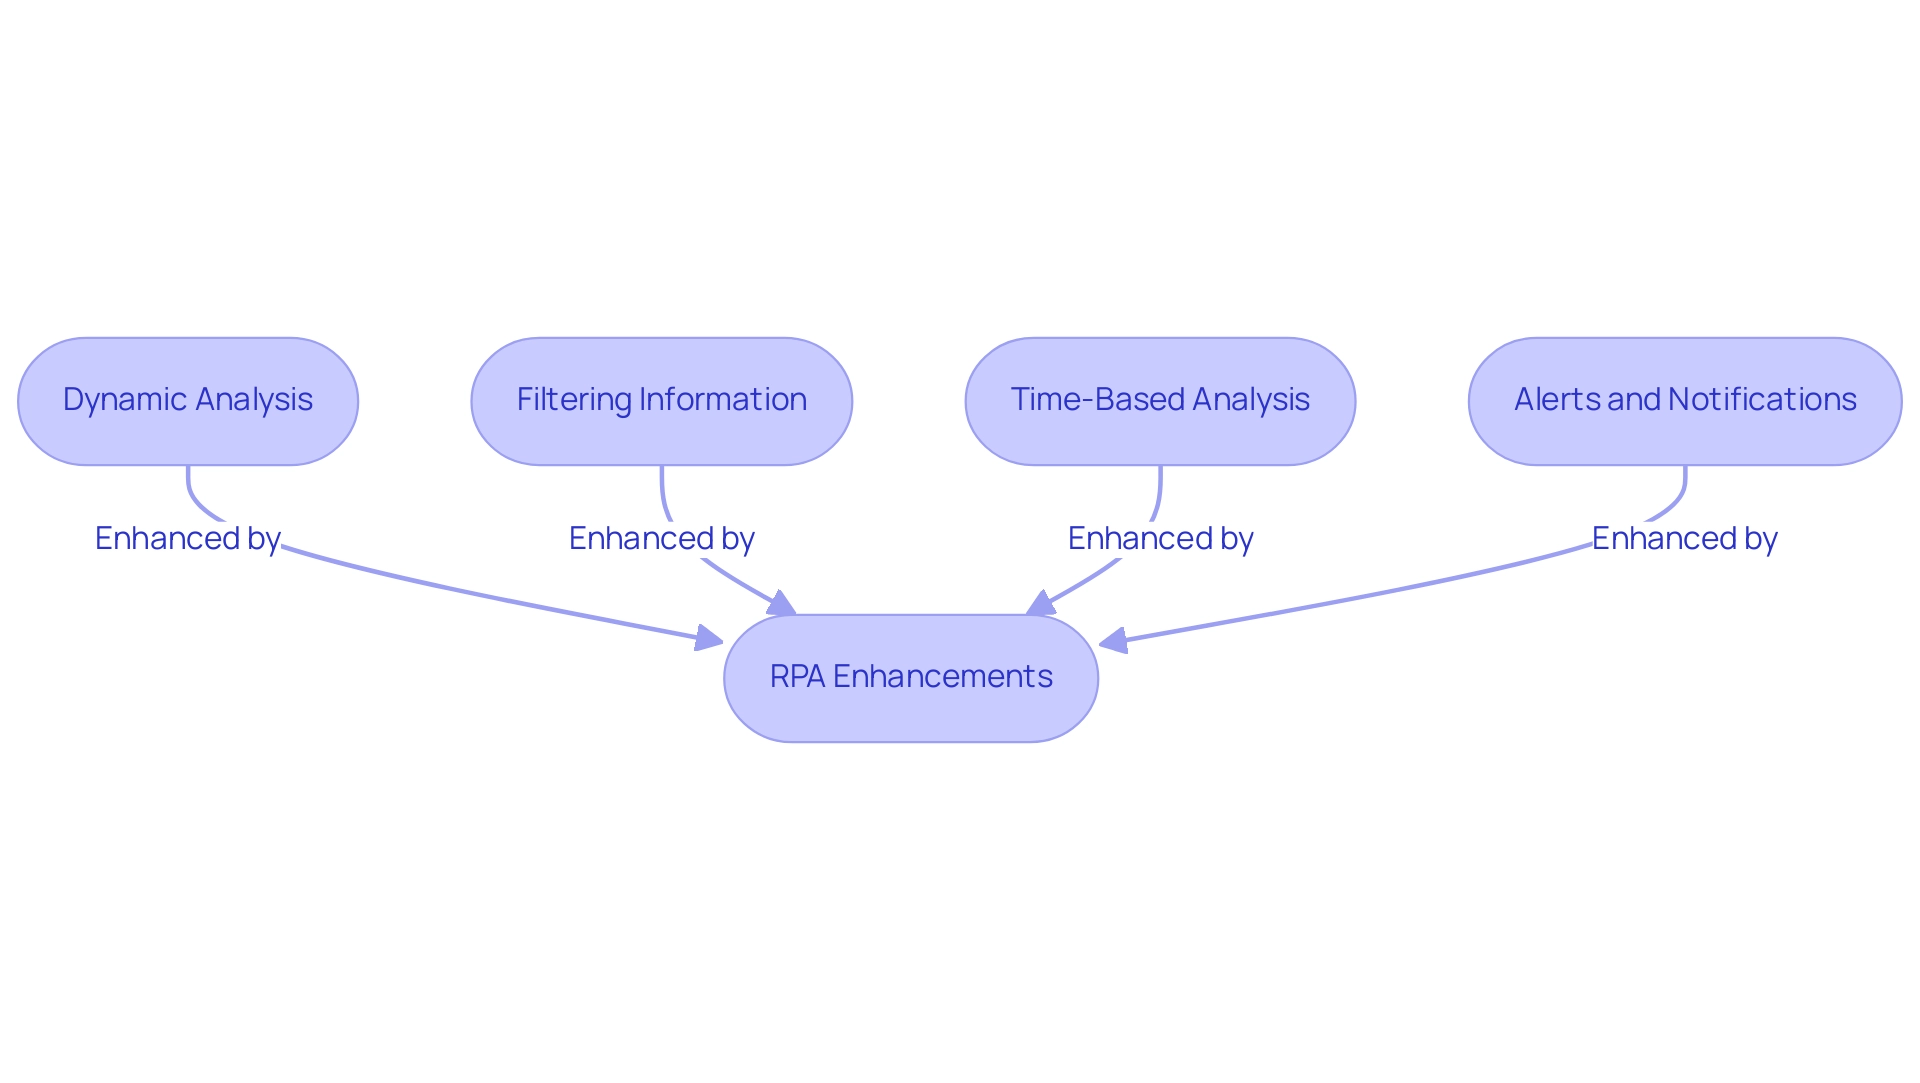
In Power BI, the incorporation of the current day can greatly improve your analytical capabilities through various practical applications:
-
Dynamic Analysis: Utilize the present day to create summaries that automatically update, displaying real-time information such as daily sales performance. This ensures that decision-makers in the BFSI sector, projected to experience the fastest growth in the market according to Inkwood Research, always have access to the most current insights, driving operational efficiency. Furthermore, Robotic Process Automation (RPA) can automate the information gathering process, ensuring that the reports are produced without manual intervention, thereby reducing errors and saving time.
-
Filtering Information: Implement date filters in Power BI to get today’s date, isolating records from today and concentrating on the most pertinent details for immediate analysis. This targeted approach allows teams to make quicker, data-driven decisions, which is crucial in a rapidly evolving market where RPA can streamline these processes, reducing manual effort and errors. By automating information filtering, RPA ensures that analysts can focus on interpreting results rather than collecting information.
-
Time-Based Analysis: Develop visuals in Power BI to get today’s date and juxtapose it with historical records. This comparative analysis facilitates a deeper understanding of trends and performance shifts, empowering users to identify patterns and anomalies efficiently. Incorporating RPA into this analysis can further automate the collection and reporting processes, enhancing the overall effectiveness. For example, RPA can be utilized to arrange routine information updates, making certain that the visuals consistently reflect the most current details.
-
Alerts and Notifications: Set up notifications in Power BI to get today’s date to keep users aware of important deadlines or notable events. This proactive approach enhances operational awareness and fosters timely responses to emerging situations, ensuring that insights derived from Business Intelligence are actionable. RPA can automate the sending of these alerts, ensuring that stakeholders are promptly notified without manual effort.
By adopting these strategies, BI users can transform their reporting processes, fostering a more responsive and informed operational environment. Moreover, the case study on edge computing shows how immediate information access can be advantageous in sectors such as construction, paralleling the application of the current day in BI for operational effectiveness, while also highlighting the crucial role of RPA in enhancing workflows. In the context of the overwhelming AI landscape, leveraging tailored AI solutions alongside RPA can help organizations navigate their options effectively, ensuring that they adopt the most suitable technologies for their specific business needs.
Troubleshooting Common Issues with Today’s Date in Power BI
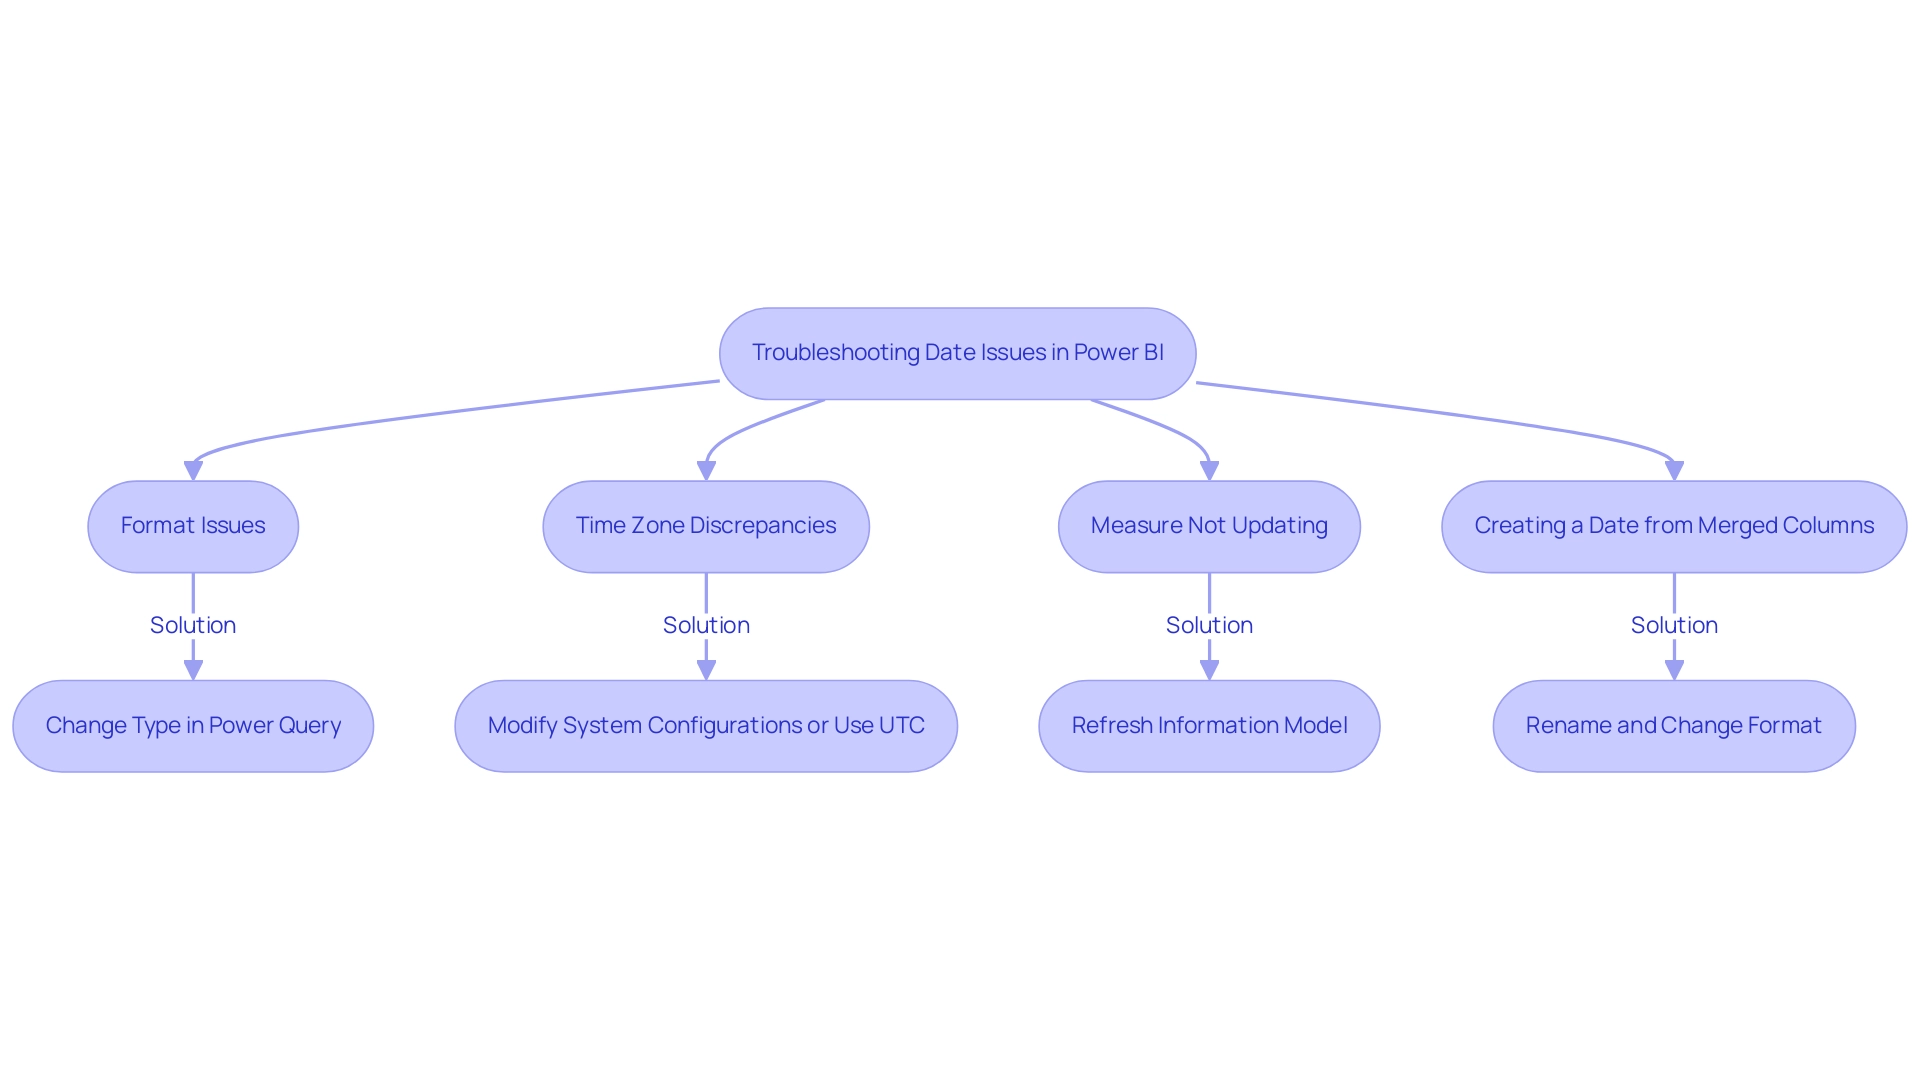
When dealing with the current day in Business Intelligence, users frequently face various common problems that can obstruct their analysis, affecting operational efficiency and the retrieval of actionable insights:
-
Format Issues: If dates do not appear correctly, it’s essential to check that the column is set with the correct type. Utilize the ‘Change Type’ function in Power Query to resolve this. As highlighted by Wecks, a frequent visitor, > I managed to resolve this issue… The data set was a SharePoint list that contained a time field. When I pulled the field into a report, I observed the timestamps were incorrect. I checked the dataset under the model tab, and the format for the column was selected. However, when released, the format either altered to non-UK time or displayed months for which information was not available, which was perplexing. By changing the type to a temporal format for the specific column in the Query Editor, everything operates as it should, and my documents function as planned. This highlights the significance of ensuring accurate information types in your documents to drive valuable insights and informed decision-making.
-
Time Zone Discrepancies: It’s crucial to note that
DateTime.LocalNow()retrieves the current timestamp based on the system’s time zone, and you can use power bi get today’s date for accurate date retrieval. If inconsistencies emerge, think about modifying your system configurations or using UTC functions to guarantee uniformity throughout your reports, thus improving the dependability of your information-driven choices. -
Measure Not Updating: In situations where measures do not appear to represent the present time, it is essential to refresh your information model in Power BI to get today’s date. Use the ‘Refresh’ option in BI to update visuals and measures, maintaining the accuracy of your reporting and facilitating timely, informed decision-making.
-
Creating a Date from Merged Columns: Finally, create a date using the merged columns, rename it as Date, and change its format from text to date to ensure proper functionality in your reports.
By proactively troubleshooting these common date-related issues, users can uphold the integrity of their analyses, ensuring precise reporting in BI. Additionally, utilizing automation solutions such as EMMA RPA and Automate can simplify these processes, ultimately resulting in enhanced operational efficiency and the extraction of actionable insights. Insights from the case study titled ‘Power BI DAX Tutorial for Beginners’ demonstrate that comprehending basic DAX syntax and functions improves users’ BI skills, enabling better analysis and reporting, which is essential for utilizing BI and RPA effectively.
Best Practices for Working with Dates in Power BI
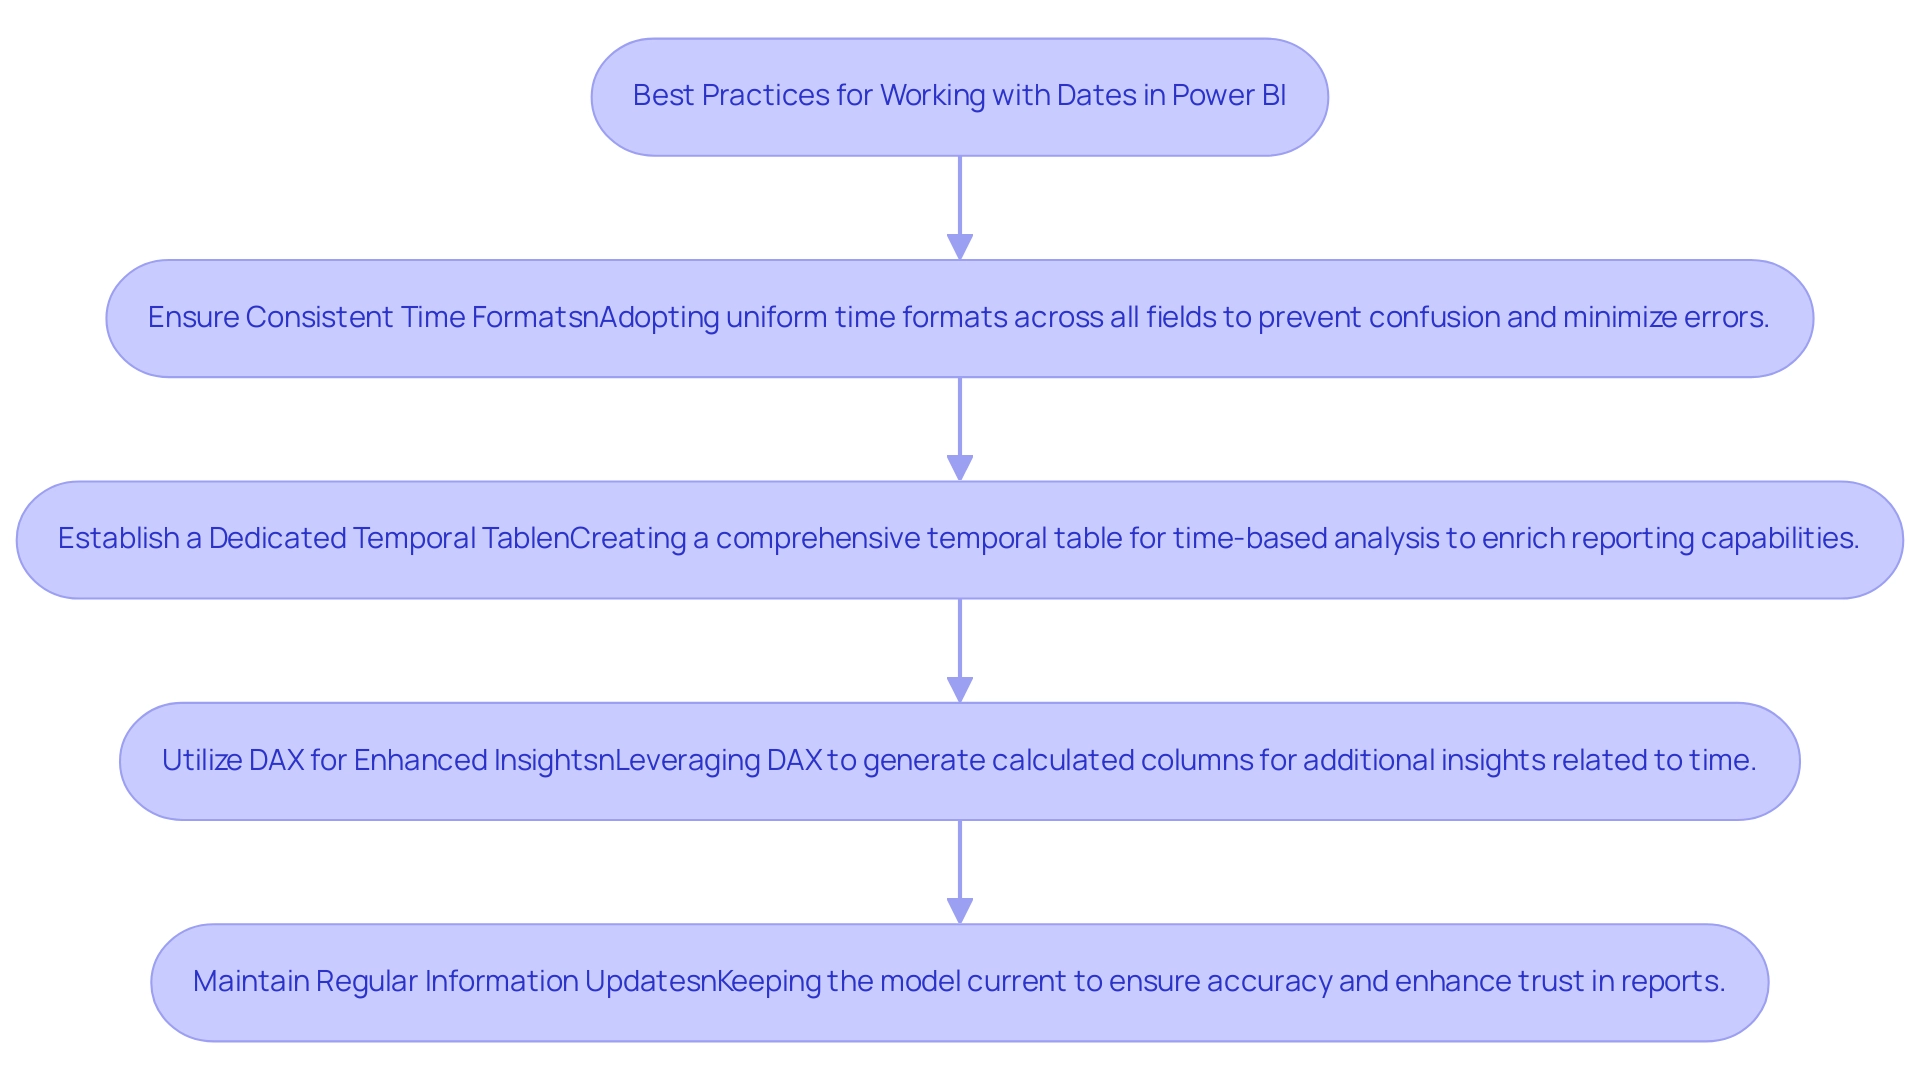
To enhance your effectiveness in managing timelines within Power BI, implement the following best practices while addressing common challenges:
- Ensure Consistent Time Formats: Adopting uniform time formats across all fields in your model is crucial for preventing confusion and minimizing errors. Consistency enhances clarity and improves overall data integrity, which is essential to combat the inconsistencies that often undermine trust in your reports. Establishing a governance strategy can further support this consistency, ensuring that all users adhere to the same standards.
- Establish a Dedicated Temporal Table: Creating a comprehensive temporal table is essential for facilitating time-based analysis. This table should encompass various temporal attributes—such as year, month, day, and fiscal periods—to enrich your reporting capabilities and streamline your analytical processes. Users often encounter visibility challenges when a dedicated calendar table is not employed, resulting in inaccuracies in reporting.
- Utilize DAX for Enhanced Insights: Leverage DAX functionality to generate calculated columns that provide additional insights related to time. For instance, you can derive fiscal quarters or week numbers, enabling more nuanced reporting and analysis. Frequent updates in DAX calculations are essential to ensuring precision, tackling common issues where documents are filled with figures yet lack practical direction.
- Maintain Regular Information Updates: Keeping your model current is vital. Regular updates ensure that all date functionalities, such as power bi get today’s date, reflect the latest information, enhancing the accuracy of your documents. This is particularly important to overcome trust issues caused by data inconsistencies; anomalies, such as having only one entry for June 2009, can lead to misleading insights if not properly managed.
By adhering to these best practices, you can significantly improve your analytical capabilities, ensuring that your reports are not only accurate but also insightful, ultimately driving better decision-making and operational efficiency.
Conclusion
Incorporating today’s date into Power BI is a game-changer for data analysis and reporting. By leveraging both DAX and Power Query, users can create dynamic measures and columns that automatically reflect the current date, streamlining the reporting process and enhancing operational efficiency. This capability not only facilitates real-time insights but also significantly reduces the time spent on report generation, allowing teams to focus on strategic decision-making.
The practical applications of today’s date in Power BI are vast. From dynamic reporting and filtering data to conducting time-based analyses and setting up alerts, these strategies empower organizations to respond swiftly to changing business conditions. By integrating automation tools like RPA, users can further optimize these processes, minimizing manual intervention and ensuring that insights are both timely and accurate.
To navigate common challenges effectively, adopting best practices such as:
- Maintaining consistent date formats
- Creating dedicated date tables
- Utilizing DAX for enhanced insights
is essential. These measures not only improve the integrity of data analysis but also foster trust in the reports generated. As organizations continue to embrace advanced data analytics, mastering the use of today’s date in Power BI will undoubtedly drive growth and informed decision-making, positioning businesses for success in an increasingly competitive landscape.
Overview:
Power BI hybrid tables are a feature that combines the advantages of DirectQuery and Import modes, allowing users to access real-time data while utilizing cached information for improved performance. The article highlights that this dual capability enhances data modeling, enabling organizations to efficiently manage resources and generate timely insights, particularly in scenarios like financial reporting and operational decision-making.
Introduction
In the evolving landscape of data management, hybrid tables in Power BI are emerging as a game-changer, seamlessly integrating the strengths of both DirectQuery and Import modes. This innovative approach not only enhances performance but also provides organizations with the agility to access real-time insights while efficiently utilizing historical data. As businesses grapple with the complexities of data analytics, the adoption of hybrid tables is set to rise, offering a strategic advantage in navigating the challenges of modern data environments. By harnessing this powerful tool, organizations can streamline their reporting processes, improve decision-making, and ultimately drive growth in an increasingly data-driven world.
Introduction to Hybrid Tables in Power BI
The introduction of power bi hybrid tables signifies a major progression, combining the advantages of both DirectQuery and Import modes. This innovative feature empowers users to create a cohesive modeling experience, enabling real-time retrieval while simultaneously utilizing cached information for enhanced performance. Organizations can leverage this dual capacity to obtain timely insights without sacrificing efficiency.
In 2024, the use of mixed formats is anticipated to increase, highlighting their essential function in information management strategies. As RKM, a noted expert in the field, emphasizes,
Yes SQL Server. The calculated column in SQL View highlights the technical capabilities of power bi hybrid tables, especially in terms of calculated columns that enhance information modeling.
A key aspect of managing information effectively involves implementing a partitioning strategy for ‘hot’ and ‘cold’ segments, as illustrated in the case study titled “Scenario #2: Hot and Cold Segmentation.” This scenario illustrates the necessity of maintaining ‘hot’ information in Import mode while utilizing DirectQuery for older records, streamlining processing and optimizing performance. However, careful setup is required, often involving external tools like Tabular Editor, to ensure smooth operation.
Moreover, defining ‘hot’ information to include records from the last three months aids organizations in managing their resources efficiently. By incorporating power bi hybrid tables into their information modeling practices, organizations can efficiently navigate the vast AI environment, leveraging Business Intelligence to enhance operational effectiveness and expansion.
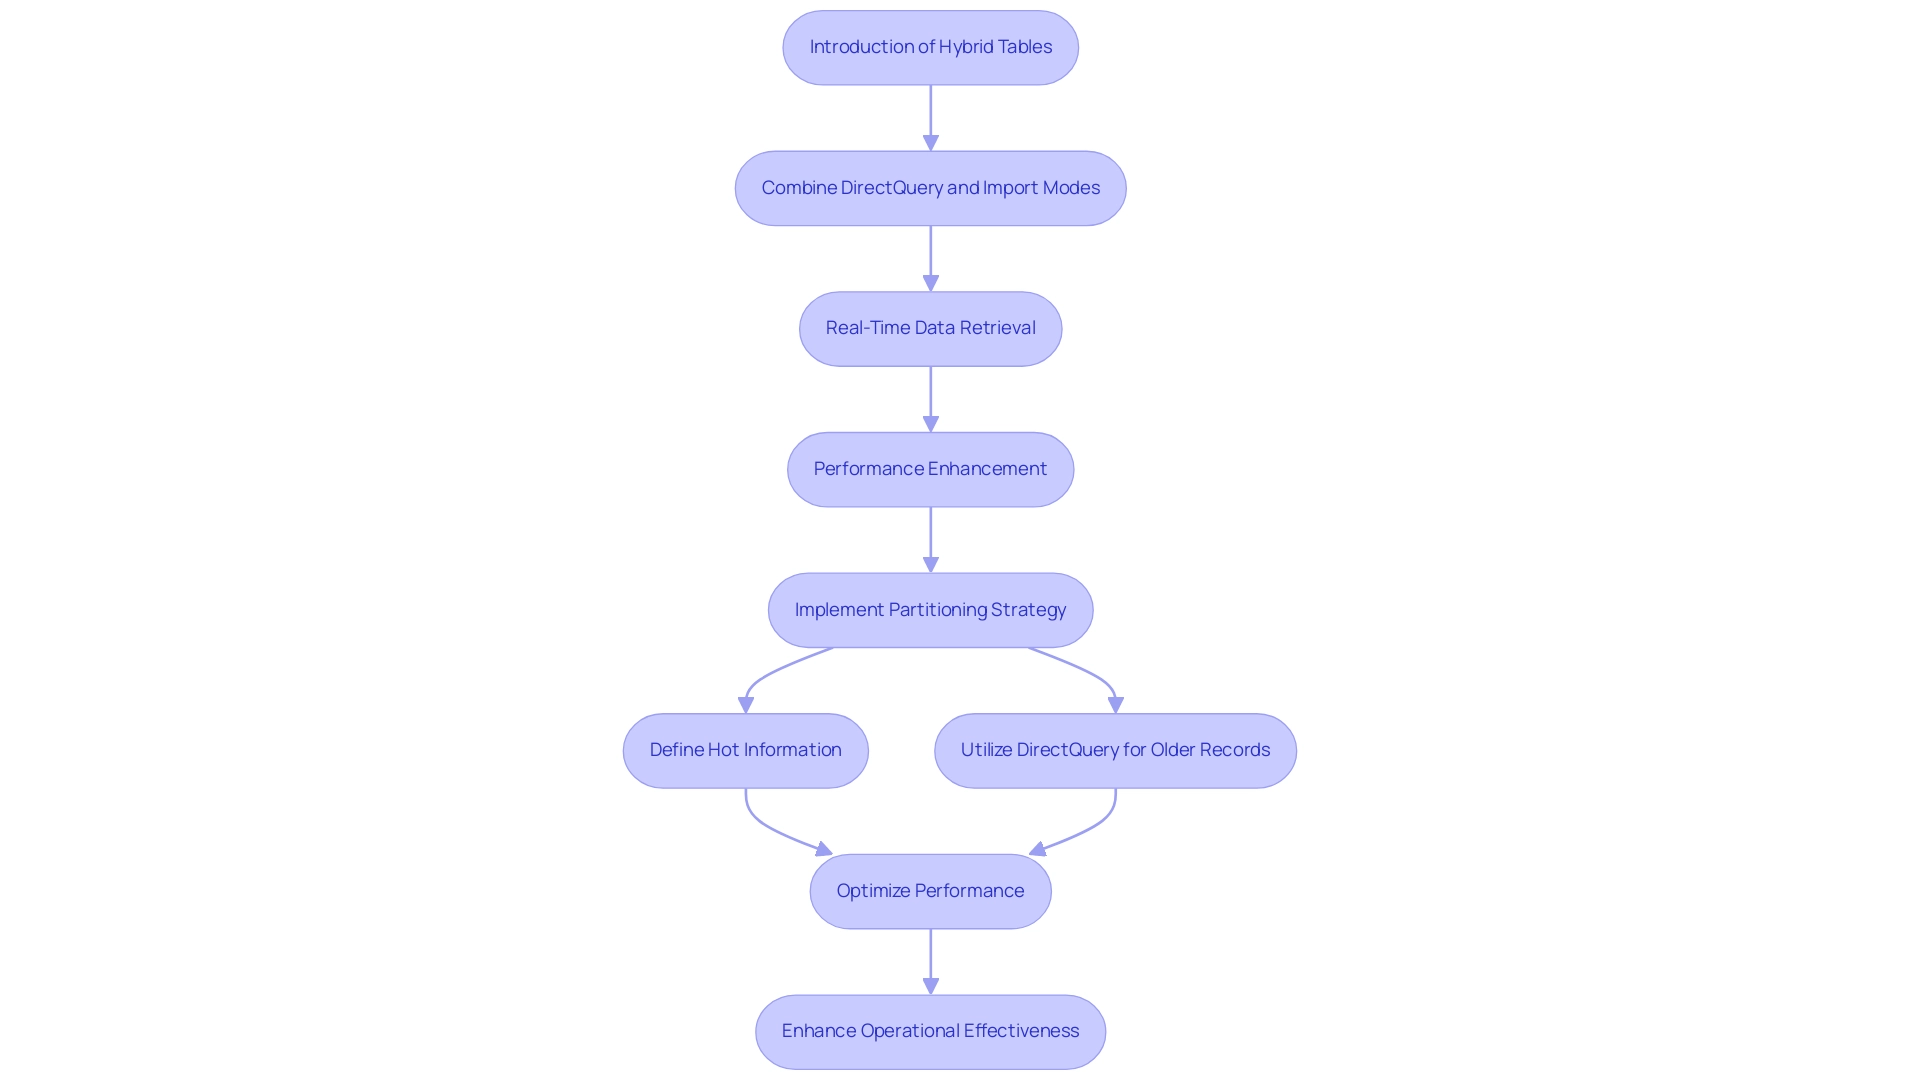
Benefits and Use Cases of Hybrid Tables
The use of power bi hybrid tables in Power BI provides a plethora of benefits, including enhanced performance, unparalleled flexibility, and efficient handling of substantial datasets. By enabling organizations to utilize Import mode for historical analysis while concurrently accessing real-time insights through DirectQuery, power bi hybrid tables create a powerful dynamic for information management. This adaptability is crucial in the context of Robotic Process Automation (RPA), which aims to automate manual workflows—often burdened by time-consuming report creation and data inconsistencies—thereby increasing efficiency and reducing errors.
For instance, in the realm of financial reporting—where timely information is paramount—hybrid formats enable businesses to craft reports that reflect both current conditions and historical trends. As organizations work to address challenges in utilizing insights from BI dashboards, power bi hybrid tables emerge as an essential solution. They not only streamline report generation but also guarantee information accuracy, allowing teams to focus on strategic decision-making.
As Paul Turley, a Microsoft Data Platform MVP, states, ‘Comparing semantic model performance in Fabric and Power BI: Report & semantic model performance comparing the same information in Import mode, DirectQuery, and Direct Lake’ emphasizes the substantial benefits of utilizing power bi hybrid tables in enhancing information workflows. Moreover, the case study on Programmatic Partitioning through XMLA Endpoints demonstrates how power bi hybrid tables can be programmatically divided, enabling tailored partitioning schemes that incorporate DirectQuery segments for historical information. This flexibility supports big information solutions by enabling users to manage large volumes of historic information while utilizing power bi hybrid tables to benefit from the performance of newly imported information.
Utilizing power bi hybrid tables as mixed structures not only promotes improved decision-making but also enables companies to react efficiently to changing information environments, ultimately fostering growth and innovation. Moreover, incorporating customized AI solutions can improve the efficiency of mixed platforms, ensuring that organizations can maneuver through the swiftly evolving information environment with assurance.
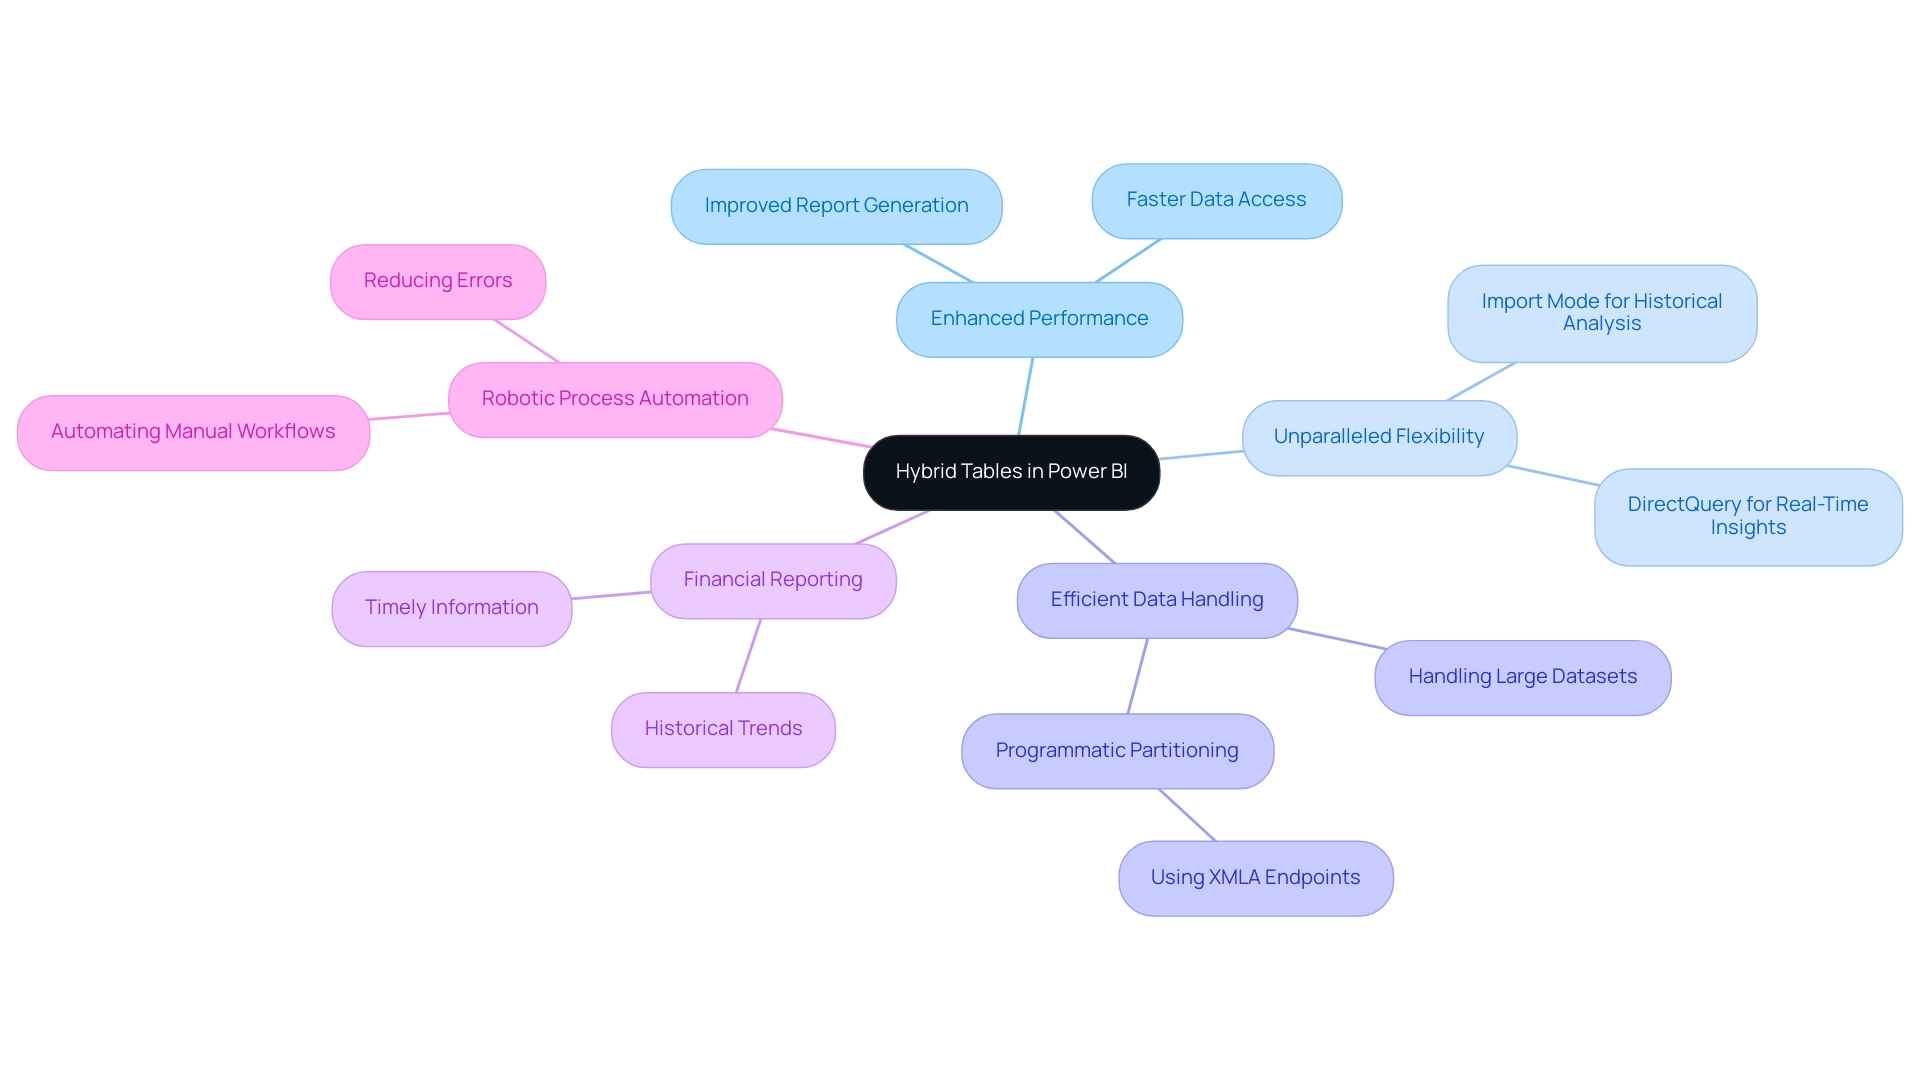
Setting Up and Configuring Hybrid Tables
Configuring combined structures in BI 2024 is a tactical process that not only improves your reporting abilities but also tackles key challenges in utilizing insights from BI dashboards. Start by ensuring the compatibility of your information sources with both DirectQuery and Import modes, which is essential to avoid time-consuming report creation. Connect to your selected information sources through Power BI Desktop, then create power bi hybrid tables by choosing the relevant settings in the view.
Accurate definition of connections between records allows seamless integration from both modes, mitigating issues of inconsistency. It is essential to establish governance strategies to ensure that information remains consistent and trustworthy across reports. Remember, the presence of a DirectQuery partition on a table may limit certain features, so compatibility must be ensured before configuration.
To further enhance operational efficiency and drive growth, consider employing optimization techniques such as information aggregation. These techniques can directly tackle the challenges of inconsistencies by ensuring that information is accurately represented and easily interpretable. This is especially crucial since combined structures can accommodate distinct partitioning methods without needing an incremental refresh policy for historical information.
As emphasized in the case analysis on the programmatic setup of mixed structures, power bi hybrid tables can be configured programmatically using XMLA endpoints, facilitating custom partitioning schemes and supporting large-scale solutions. Furthermore, it’s important to note that loading 20 million fact rows from CSV files is often less efficient compared to utilizing a Fabric lakehouse with Query. Chris Webb from the Fabric CAT group at Microsoft stresses that effectively utilizing combined structures can result in significant performance improvements, enabling you to address the challenges of information management and transform raw information into actionable insights that promote informed decision-making.
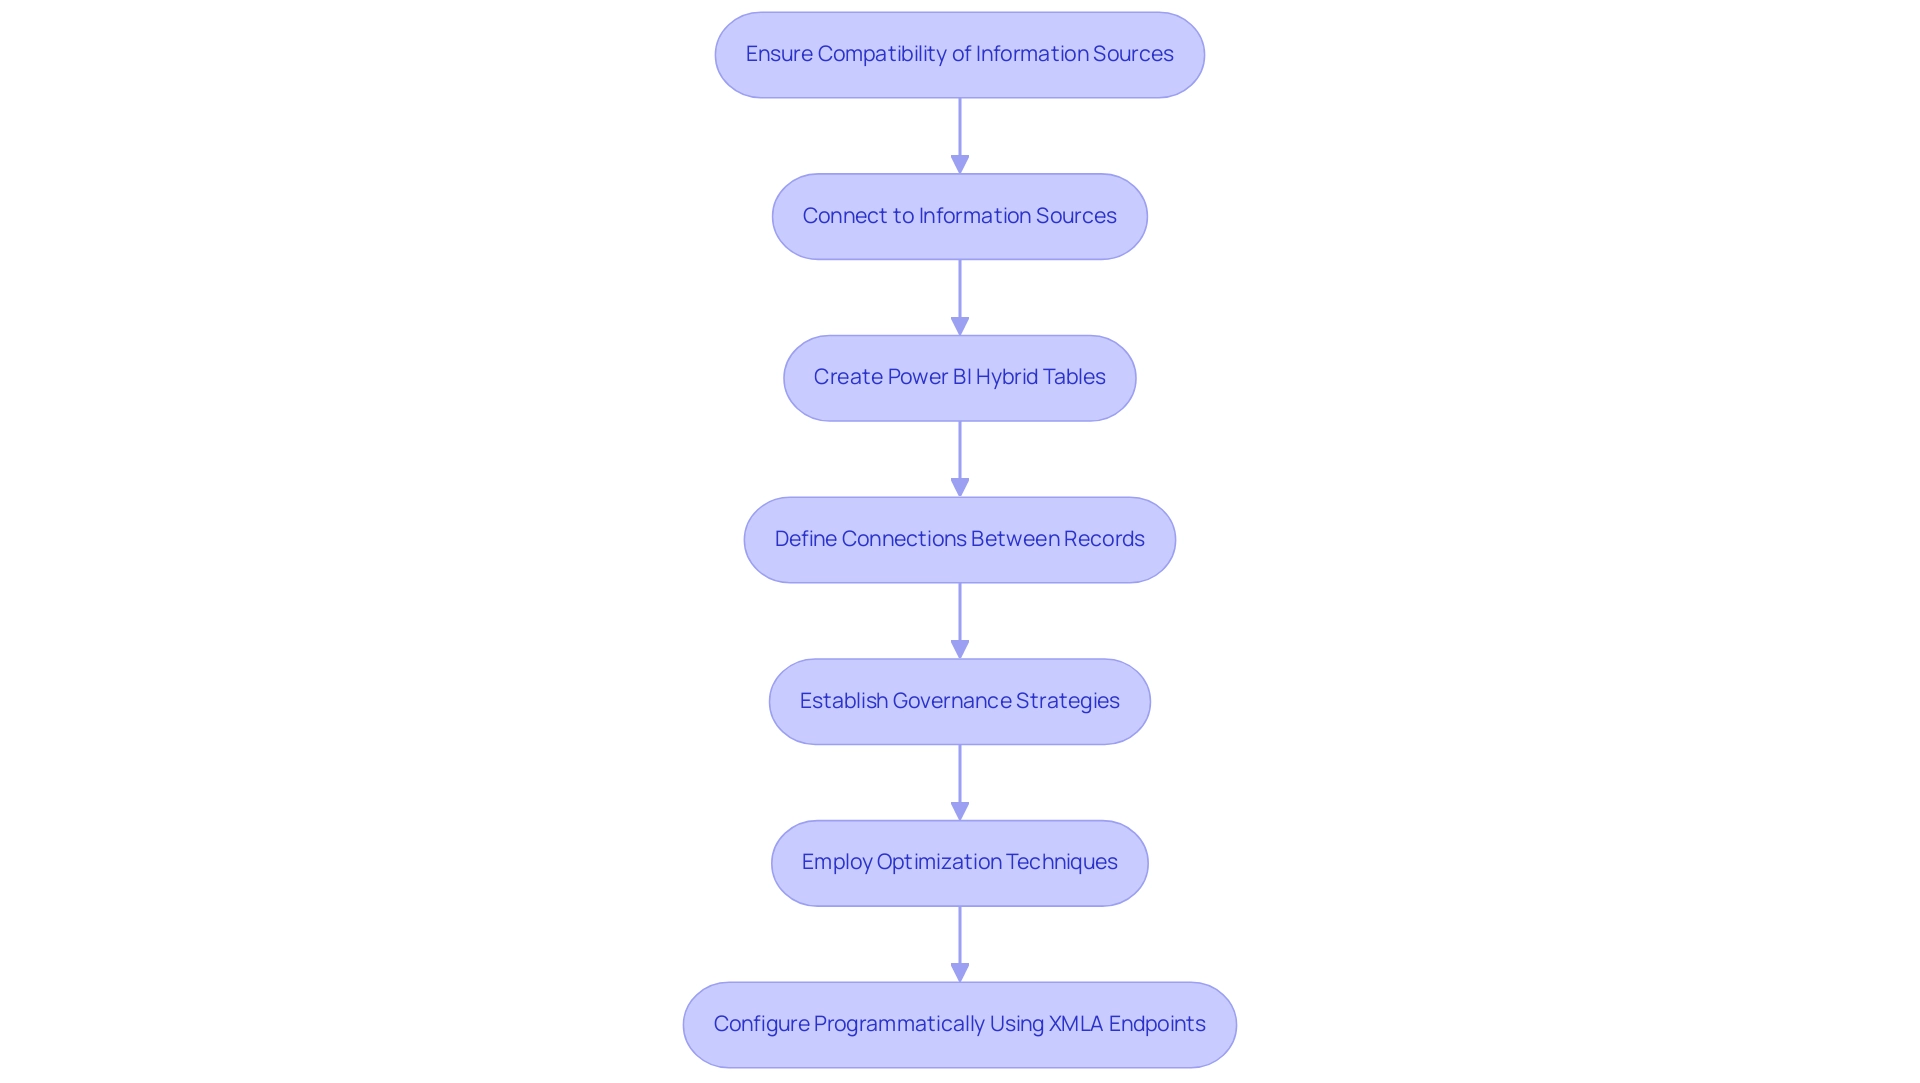
Hybrid Tables vs. Composite Models: A Comparative Analysis
In the realm of Power BI, hybrid structures and composite models stand out as formidable tools, each tailored for distinct functionalities. Power BI hybrid tables are designed to enhance performance by combining real-time access with cached information, making them particularly effective for scenarios that require immediate insights and responsiveness. Conversely, composite models provide the flexibility of integrating multiple sources, including both DirectQuery and Import connections, into a unified framework.
As Clara Gong aptly puts it,
Composite model means that reports can seamlessly include connections from multiple DirectQuery connections or import connections in any combination you choose.
This feature allows organizations to customize their environments to better fit their reporting and analytical needs, addressing common challenges such as time-consuming report creation, inconsistencies, staffing shortages, and outdated systems. With a Google Reviews rating of 4.8 from 276 reviews, Power BI’s tools have garnered significant trust among users, further validating their effectiveness in driving data-driven insights.
Moreover, the recent analysis suggests that while Power BI hybrid tables prioritize performance, composite models excel in versatility, accommodating the various information landscapes many organizations face today. This is particularly relevant in the context of mixed work environments, where leaders must adapt their styles to manage remote teams effectively and enhance employee morale. The case study titled ‘Redesigning Office Spaces for Hybrid Work’ emphasizes that fewer than half of employers and employees believe their office environments are adequately prepared for hybrid work, highlighting the significance of utilizing analytics to guide such choices.
By grasping these critical differences, leaders can strategically select the most suitable approach, whether aiming to enhance real-time analytics or to harness the power of comprehensive data integration, ultimately driving operational efficiency and business growth. Moreover, utilizing RPA solutions such as EMMA RPA and Automate can further streamline these processes, addressing staffing shortages and outdated systems while enhancing overall productivity.
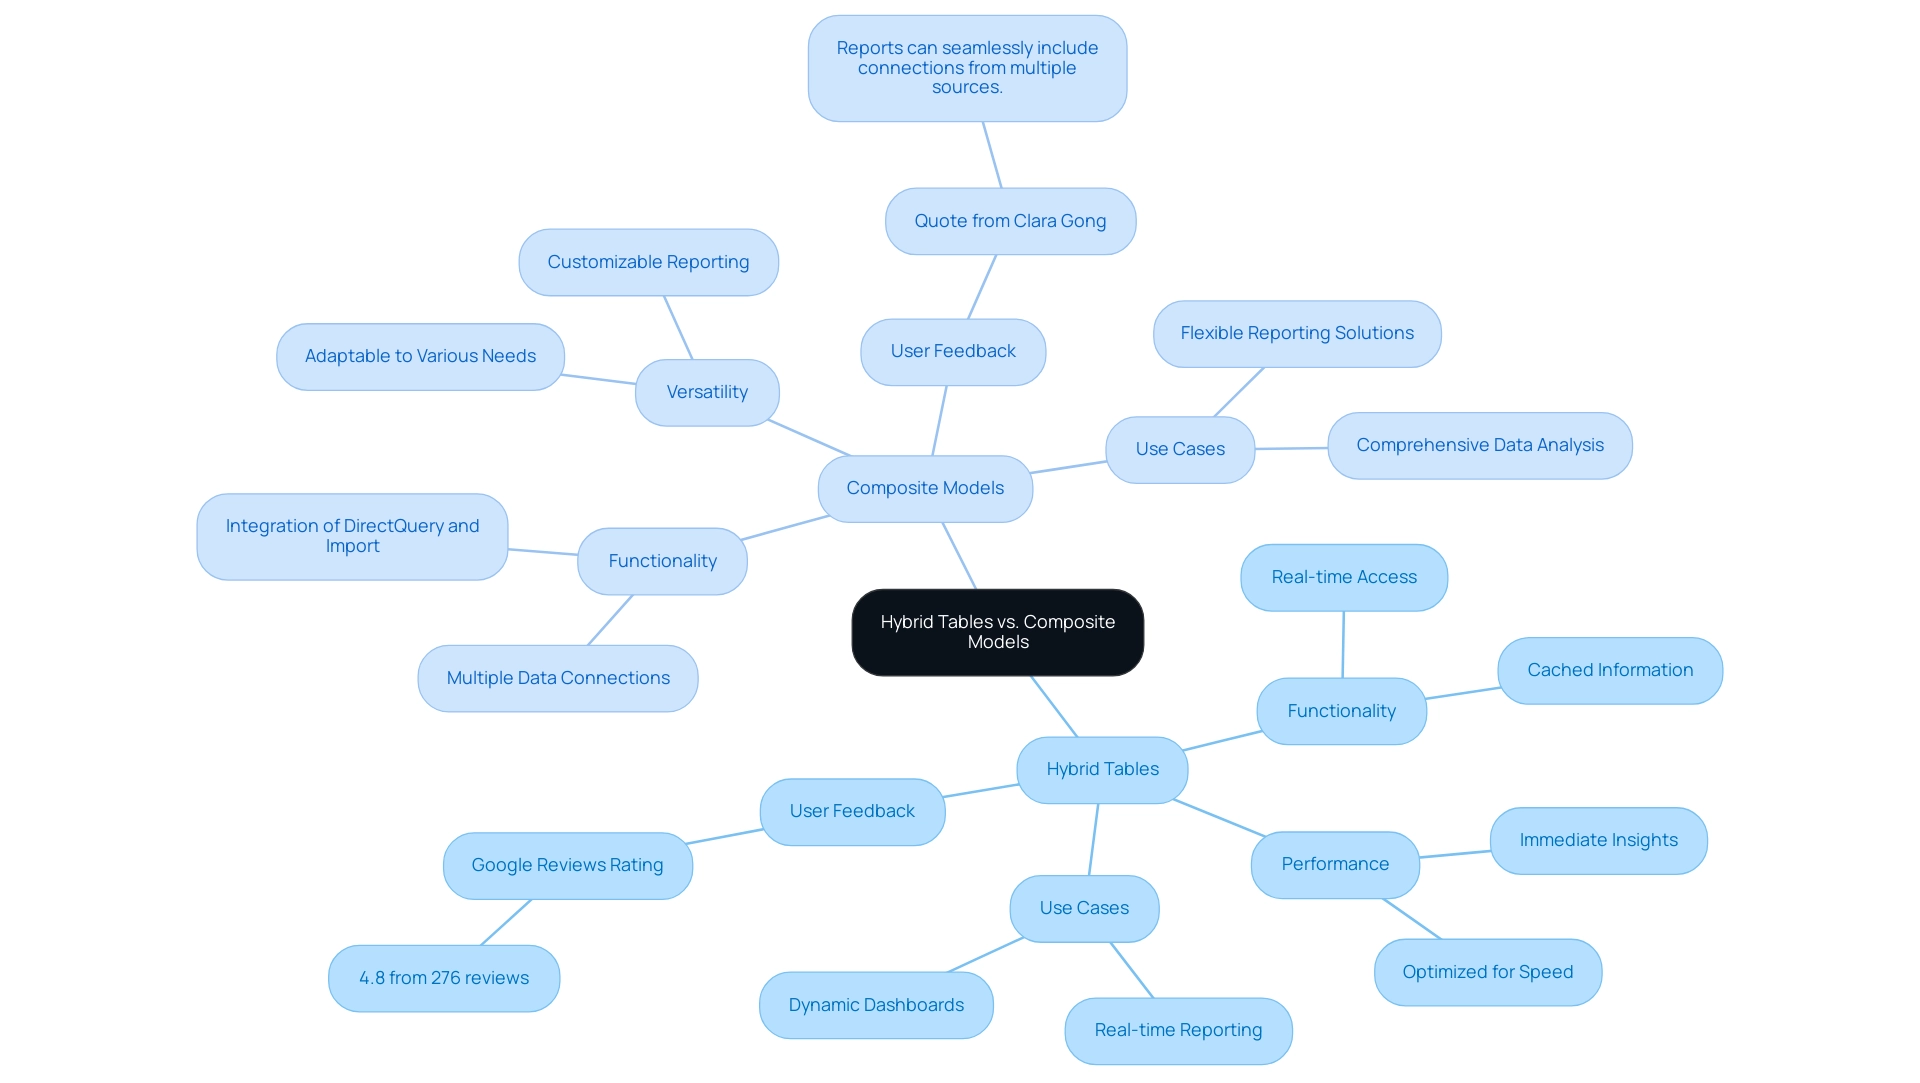
Best Practices for Utilizing Hybrid Tables in Power BI
To fully harness the potential of Power BI hybrid tables in Business Intelligence, several key best practices should be followed. First and foremost, optimizing information sources is crucial; ensuring that they are fine-tuned for performance can lead to significant improvements in report efficiency. Our 3-Day Power BI Sprint is designed to help you overcome common challenges such as time-consuming report creation and inconsistencies, allowing you to focus on utilizing insights rather than just building reports.
With a team of over 60 coders and developers at Imenso, their expertise reinforces the importance of these recommendations. Implementing a robust data refresh strategy, particularly through incremental refresh, is another effective approach, especially for managing large datasets where performance can be a concern. For instance, confirming reports can display sales transactions for dates before and after January 1, 2020, illustrates how combined structures can be employed effectively in real-world situations.
Moreover, keeping comprehensive records of connections and setups within mixed structures is crucial for aiding problem-solving and upcoming modifications. Insights from the case study titled “SQL Database in Fabric – What, Why, and How?” show practical uses of combined structures within the Microsoft Fabric environment, clarifying their advantages and methods.
Regularly reviewing and optimizing queries is also vital, as it can enhance report generation speed and improve user satisfaction. As Nikola aptly states,
It’s not just about maintaining ‘hot’ and ‘cold’ data separately within the same structure – mixed formats essentially provide you with endless opportunities to separate more significant data from the less significant one.
This perspective highlights the flexibility and Power BI hybrid tables offer when managed correctly, ultimately driving business intelligence and operational efficiency.
To experience these benefits firsthand, book your 3-Day Power BI Sprint today and transform your reporting capabilities.
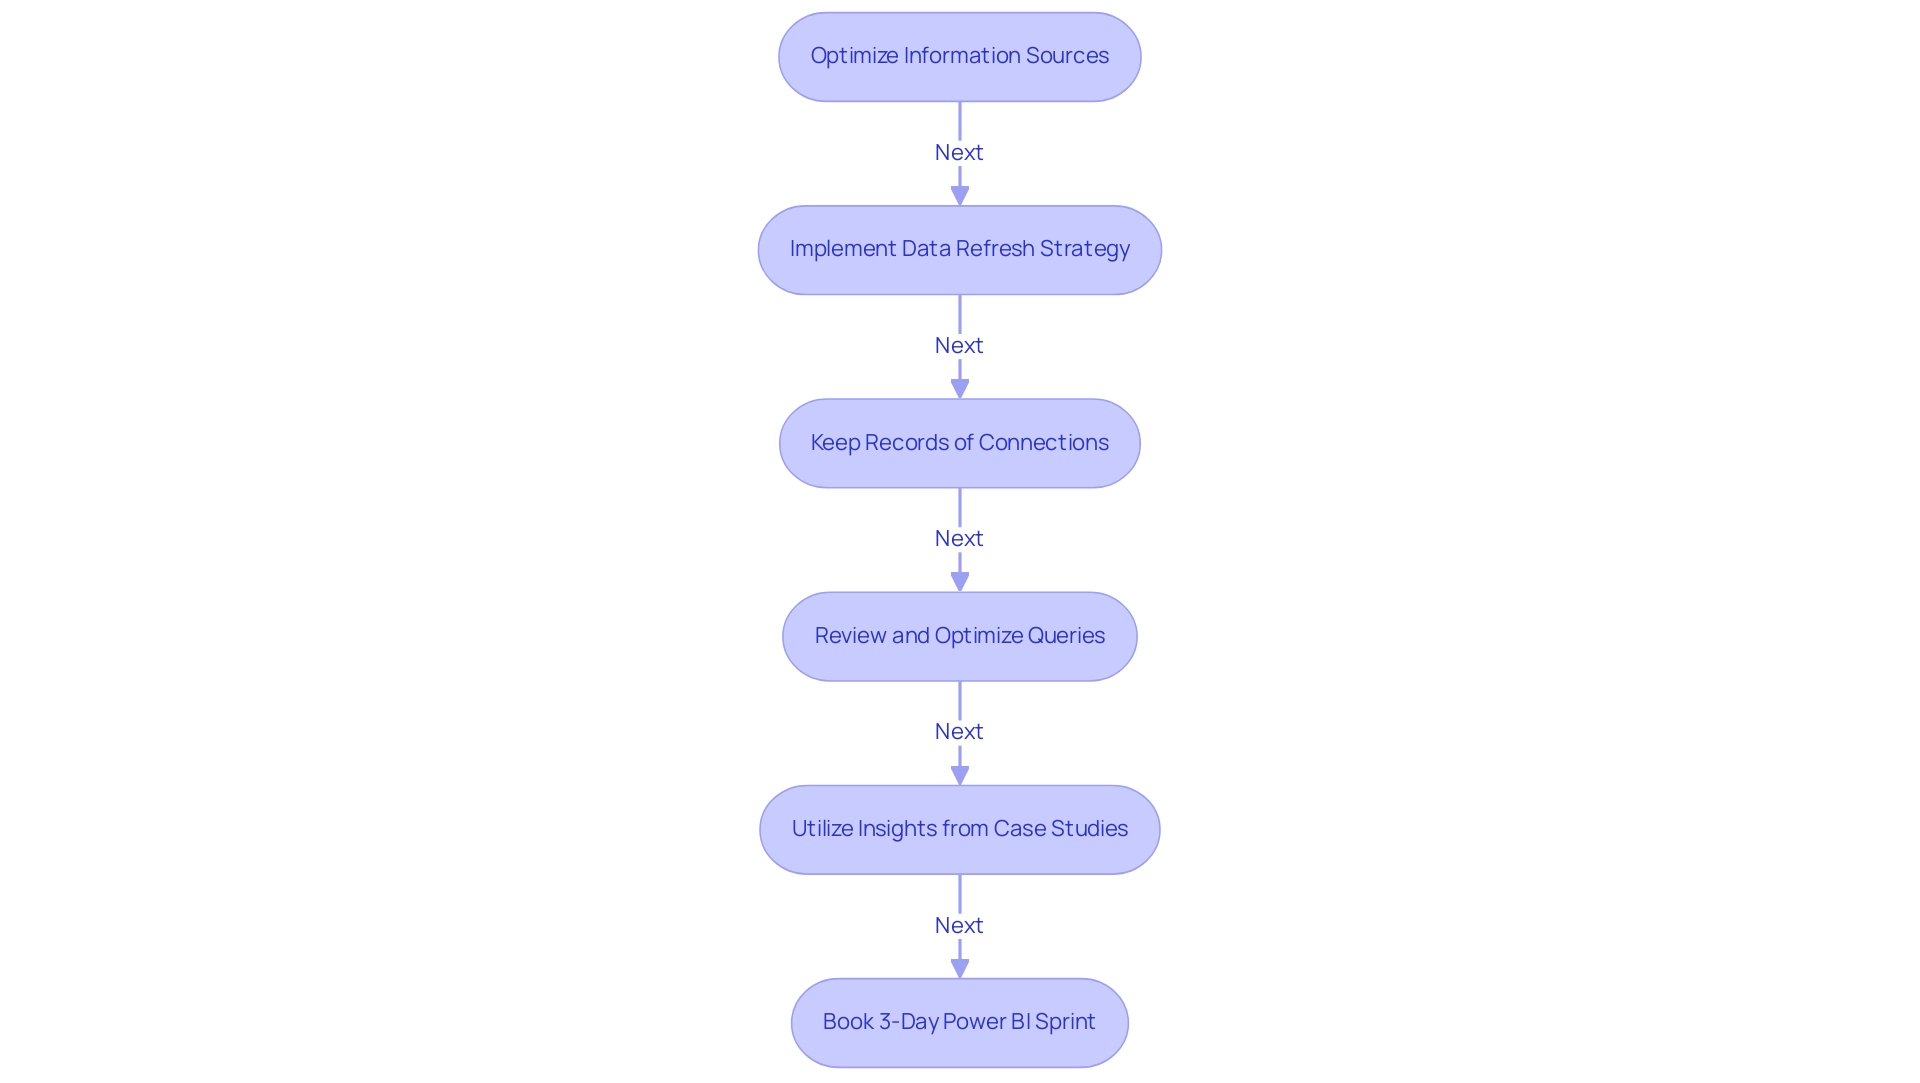
Conclusion
Hybrid tables in Power BI represent a transformative shift in data management, offering organizations a powerful combination of real-time insights and historical data analysis. By leveraging the strengths of both DirectQuery and Import modes, businesses can enhance their reporting capabilities, streamline processes, and make informed decisions with speed and accuracy. The strategic implementation of hybrid tables not only addresses common challenges such as data inconsistencies and lengthy report creation but also fosters operational efficiency that is crucial in today’s fast-paced environment.
As organizations continue to navigate the complexities of data analytics, the adoption of hybrid tables is expected to grow. This innovative feature provides the flexibility needed to manage substantial datasets effectively while ensuring that timely insights are always at hand. By following best practices and employing robust data governance strategies, businesses can maximize the potential of hybrid tables, driving growth and innovation in their operations.
In conclusion, embracing hybrid tables in Power BI is not just a technical upgrade; it is a strategic move towards enhanced data management and decision-making. Organizations that invest in this capability will find themselves better equipped to respond to the evolving data landscape, ultimately gaining a competitive edge in their respective industries. The future of data-driven insights is here, and hybrid tables are leading the charge towards greater efficiency and effectiveness in business operations.
Overview:
The article “Mastering Power BI Date Time Format: An In-Depth Tutorial” focuses on how to effectively utilize date and time formats in Power BI to enhance data clarity and reporting efficiency. It emphasizes the importance of adhering to standards like ISO 8601 and provides practical techniques, such as using DAX and M code for formatting, to address common challenges and ensure consistent representation across reports, ultimately driving better data-driven insights.
Introduction
In the dynamic landscape of data analytics, mastering date and time formats in Power BI is not just a technical necessity; it’s a strategic advantage. As organizations strive for operational efficiency and data-driven decision-making, understanding how to navigate the complexities of date representation becomes paramount.
From utilizing the ISO 8601 standard to implementing effective date slicers, the ability to present data clearly and accurately can significantly influence the insights drawn from reports. This article delves into practical techniques and troubleshooting strategies that empower users to streamline their data processes, enhance report clarity, and foster trust in their analytics.
By equipping teams with the knowledge to tackle common challenges and leverage advanced functionalities, organizations can unlock the full potential of their data and drive impactful results.
Understanding Date and Time Formats in Power BI
Power BI accommodates a range of date and time styles, prominently showcasing the power bi date time format of the ISO 8601 standard, which plays a crucial role in how dates are represented in analytics. In a setting where lengthy report preparation and discrepancies can obstruct operational efficiency, comprehending these structures is crucial for precise information interpretation. The lack of data-driven insights can further exacerbate these challenges, leaving stakeholders without clear guidance.
For instance, the year 2020 corresponds to Q2, illustrating how temporal context can influence analysis. Commonly used styles in the power bi date time format include:
- ‘MM/DD/YYYY’
- ‘DD-MM-YYYY’
- ‘YYYY-MM-DD’
By familiarizing yourself with these conventions, you can significantly enhance the configuration of your reports and dashboards, ensuring that stakeholders receive clear, actionable guidance.
Moreover, mastering time representations can enhance governance strategies, promoting confidence in the information presented. Power BI empowers users to establish the power bi date time format as a default within the settings, which fosters consistency across visualizations. This consistency is vital as it streamlines information processing and mitigates confusion caused by inconsistent representations.
For instance, organizations utilizing Private Links encounter restrictions with report usage metrics, as client information cannot be transmitted over these links, resulting in reports that may have no content. As Eduardo Nickel aptly inquired,
Hey there, in case of having my months in columns, how can I get them read as axis for the chart?
This emphasizes the practical implications of mastering time formats in your Power BI projects.
Additionally, experts emphasize that adhering to ISO 8601 is crucial for information interpretation, as it reduces ambiguity and enhances clarity across various datasets, enabling the use of the power bi date time format to transform raw information into actionable insights.
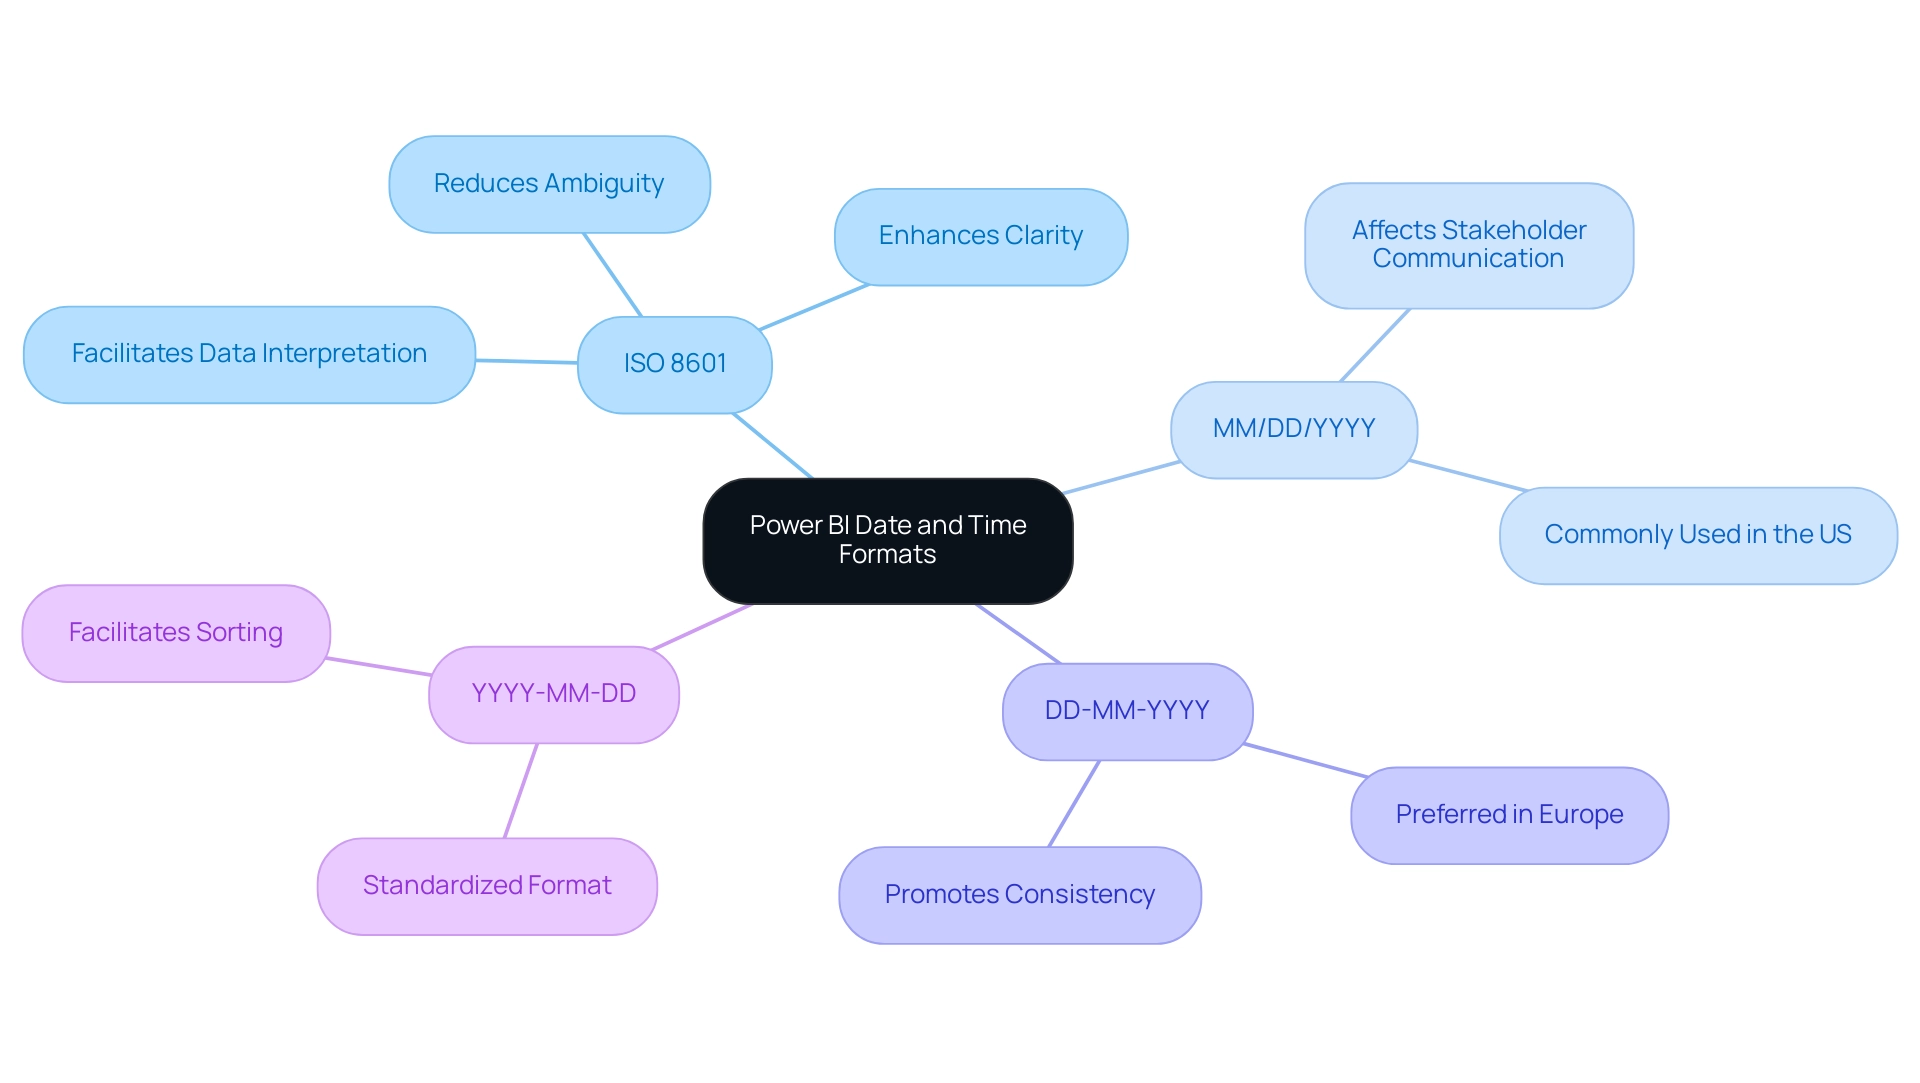
Creating and Using Date Slicers for Effective Data Filtering
Creating a time slicer in Power BI, especially with the correct Power BI date time format, is a straightforward yet powerful way to enhance your data analysis capabilities, particularly for smaller teams like ours, which consists of less than 50 people. Start by choosing the ‘Slicer’ visual from the visualizations pane and dragging your preferred time field into the slicer to commence the setup using the Power BI date time format. Personalization is essential—enable individuals to choose particular time frames, specific days, or set intervals to customize their analysis.
Activating the ‘Between’ option in the Power BI date time format is especially advantageous, as it permits individuals to refine information between two dates, focusing on pertinent insights. As RodyHarper, a regular visitor in our community, observed, having the option to switch between various date-selectors in the slicer significantly enhances engagement. Testing the slicer thoroughly is essential to ensure it interacts seamlessly with other visuals on your report page.
This functionality not only enriches user engagement but also enhances overall analysis effectiveness, addressing common challenges such as time-consuming report creation and inconsistencies. For instance, in our Customer Analysis Dashboard case study, using date slicers helped us analyze the relationship between customer sales and marketing engagement effectively, providing actionable insights that guided our strategy. By implementing governance strategies alongside these practices, we can enhance trust in the information presented, ensuring stakeholders have clear, actionable guidance.
By adopting these practices, you position your reports to deliver impactful results tailored to client needs, ultimately driving data-driven insights and operational efficiency for sustained business growth.
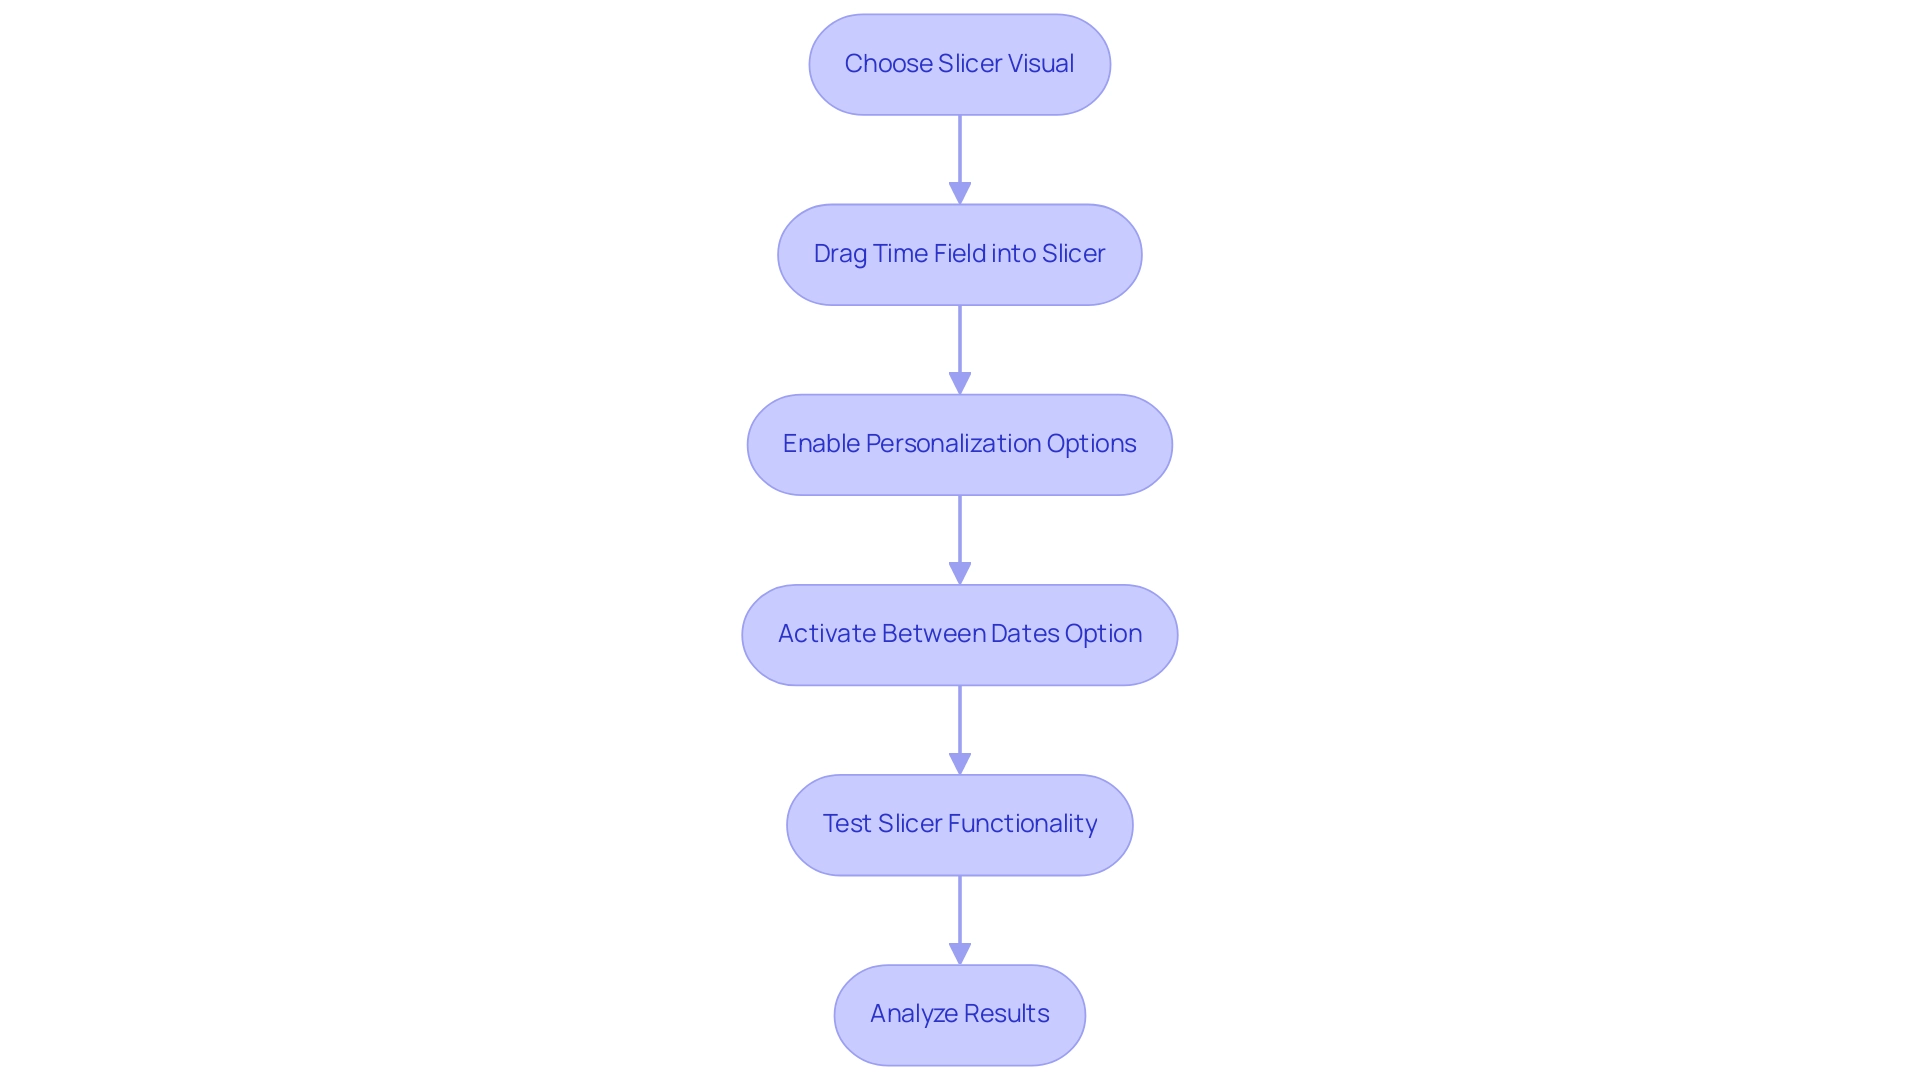
Formatting Dates in Power BI: DAX and M Code Techniques
In Power BI, utilizing Data Analysis Expressions (DAX) for the power bi date time format is essential for enhancing data clarity and presentation, especially since many individuals spend excessive time on report creation rather than deriving actionable insights. The FORMAT function illustrates this ability in the Power BI date time format, enabling users to present times in a more understandable manner. For instance, using FORMAT(Today(), 'MMMM DD, YYYY') transforms the information into a user-friendly representation.
Meanwhile, M code in Power Query offers another layer of formatting flexibility. An example of the power bi date time format would be DateTime.ToText(DateTime.LocalNow(), 'yyyy-MM-dd'), which formats the current time in a standard ISO format. Users like Josh have pointed out challenges with formatting, mentioning,
We are experiencing similar problems.
There is no option for formatting English entries (dd/mm/yyyy) in the modeling section of the ribbon. All our slicers are displaying information in US style while the tables show information in UK style. Any help would be appreciated.
Such inconsistencies can lead to confusion and mistrust in the information presented, particularly when there is a lack of a governance strategy to ensure consistent representation. This makes it essential to address these issues for creating tailored reports that meet organizational needs. Users can choose the preferred time representation using the power bi date time format from the Modeling option in the Desktop ribbon, which offers essential functionality for handling time displays efficiently.
Moreover, daily updates to usage metrics emphasize the significance of precise formatting as data evolves. The case study concerning the request for a genuine custom time format in the context of Power BI date time format highlights real-world challenges that individuals encounter, emphasizing the need for improved choices to personalize time displays. Recent developments in M code further improve these capabilities, providing individuals with more options to tailor their time displays in the power bi date time format.
As users navigate the complexities of formatting, mastering both DAX and M code techniques becomes increasingly essential in generating clear and effective reports that drive informed decision-making, ultimately providing the actionable guidance needed to overcome the challenges faced.
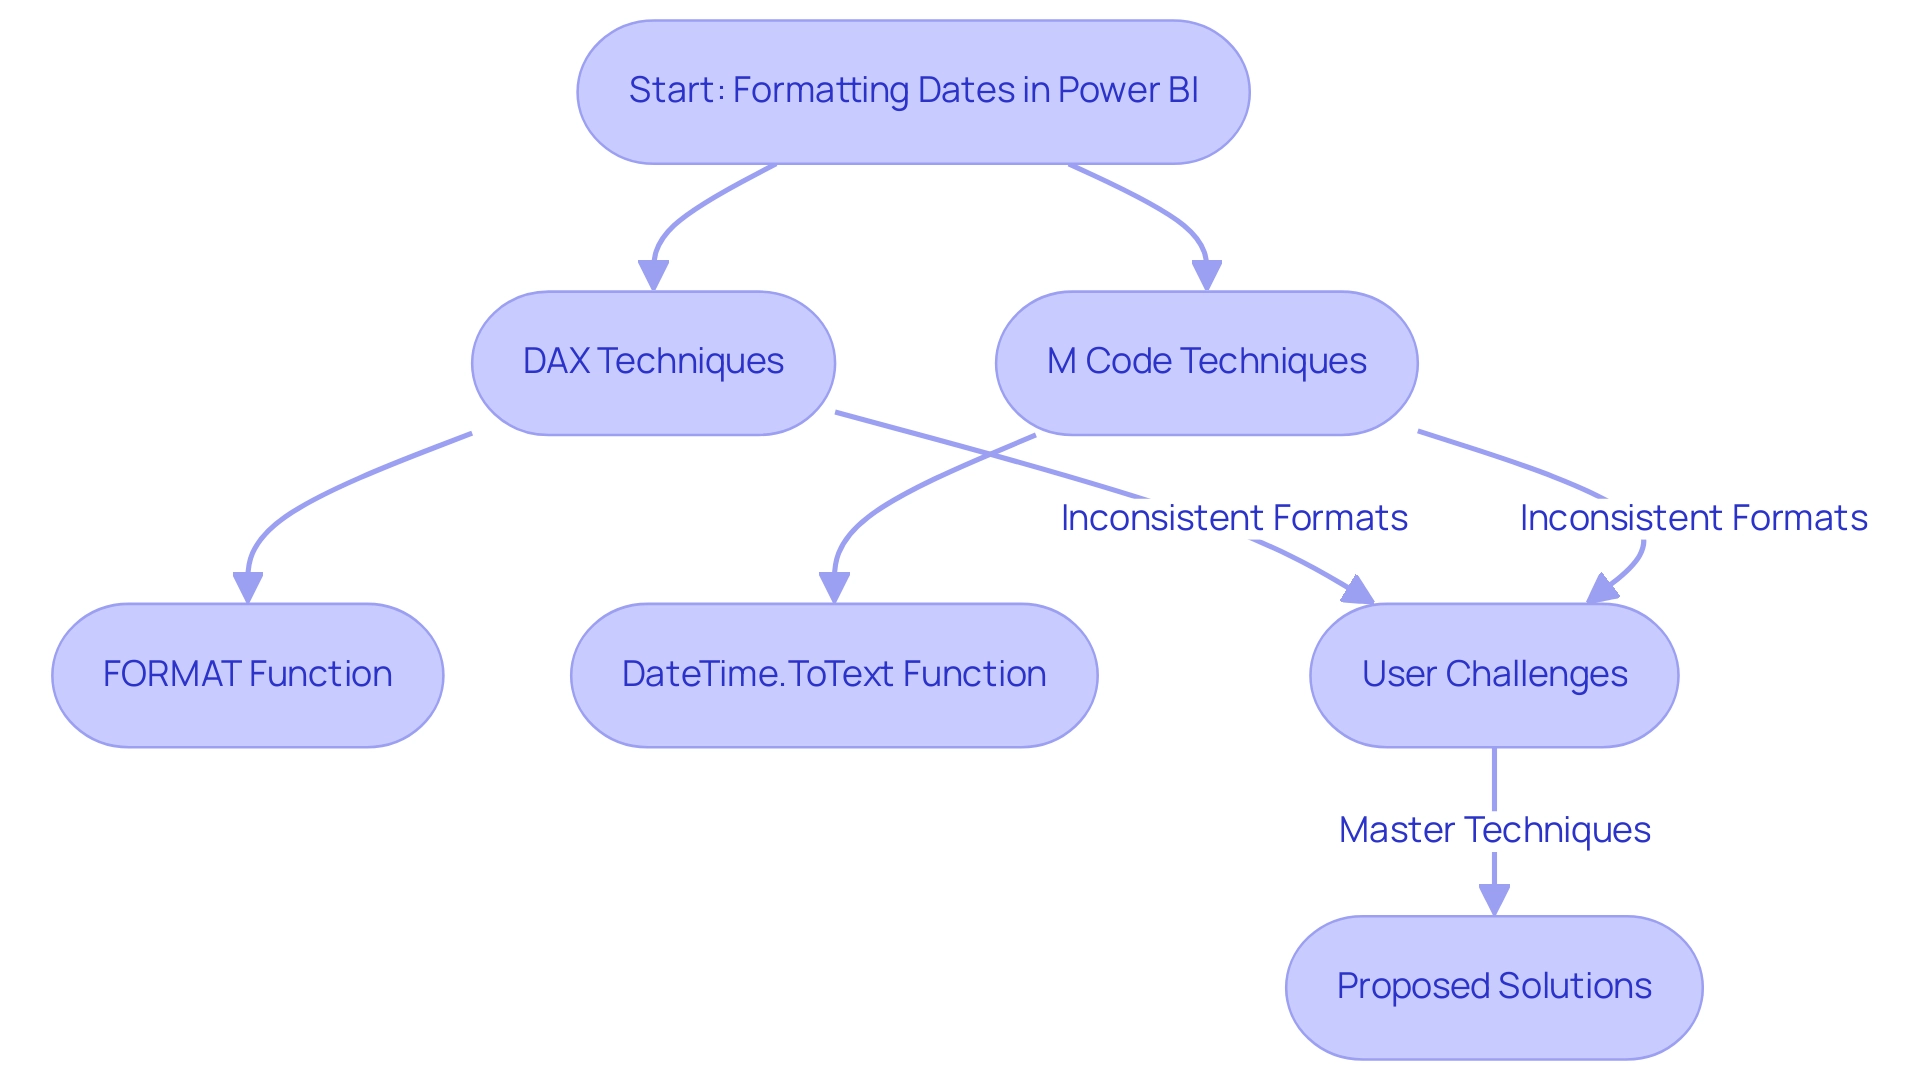
Troubleshooting Common Date Format Issues in Power BI
Frequent obstacles with the Power BI date time format often arise from inconsistencies across various sources and issues related to the conversion of text to time formats. Significantly, string representations such as ‘2017-01-01’ are examined as text sequences, which can lead to considerable complications in analysis. To effectively troubleshoot these problems, begin by examining your data types within the Power Query Editor.
It’s crucial to ensure that they are appropriately classified in the Power BI date time format as either ‘Date’ or ‘Date/Time’. Should you find entries represented as text, utilize the ‘Change Type’ feature to convert them seamlessly into the Power BI date time format. Furthermore, the ‘Style’ option found in the modeling tab is essential for normalizing time representations in the Power BI date time format across your dataset.
As Sudip Narayan Choudhury observed, ‘Order Date 7/27/2012 9/14/2013…’ demonstrates the diversity of temporal representations that can occur within your information. By addressing these inconsistencies, you can streamline your workflow, enhancing efficiency and reducing errors in your reporting processes. Implementing Robotic Process Automation (RPA) can further automate these tasks, ensuring that time formats are consistently handled without manual intervention.
After applying these changes, always take a moment to confirm the integrity of your information. This step is essential to ensure that your analysis is based on accurate and consistent information, ultimately enhancing the reliability of your insights. Additionally, using tailored AI solutions can assist in identifying and correcting quality issues, providing a more robust framework for your management.
Furthermore, using Power Query to generate time tables can provide a dynamic solution for maintaining your records without the need for manual recreation, further supporting informed decision-making in your operations.
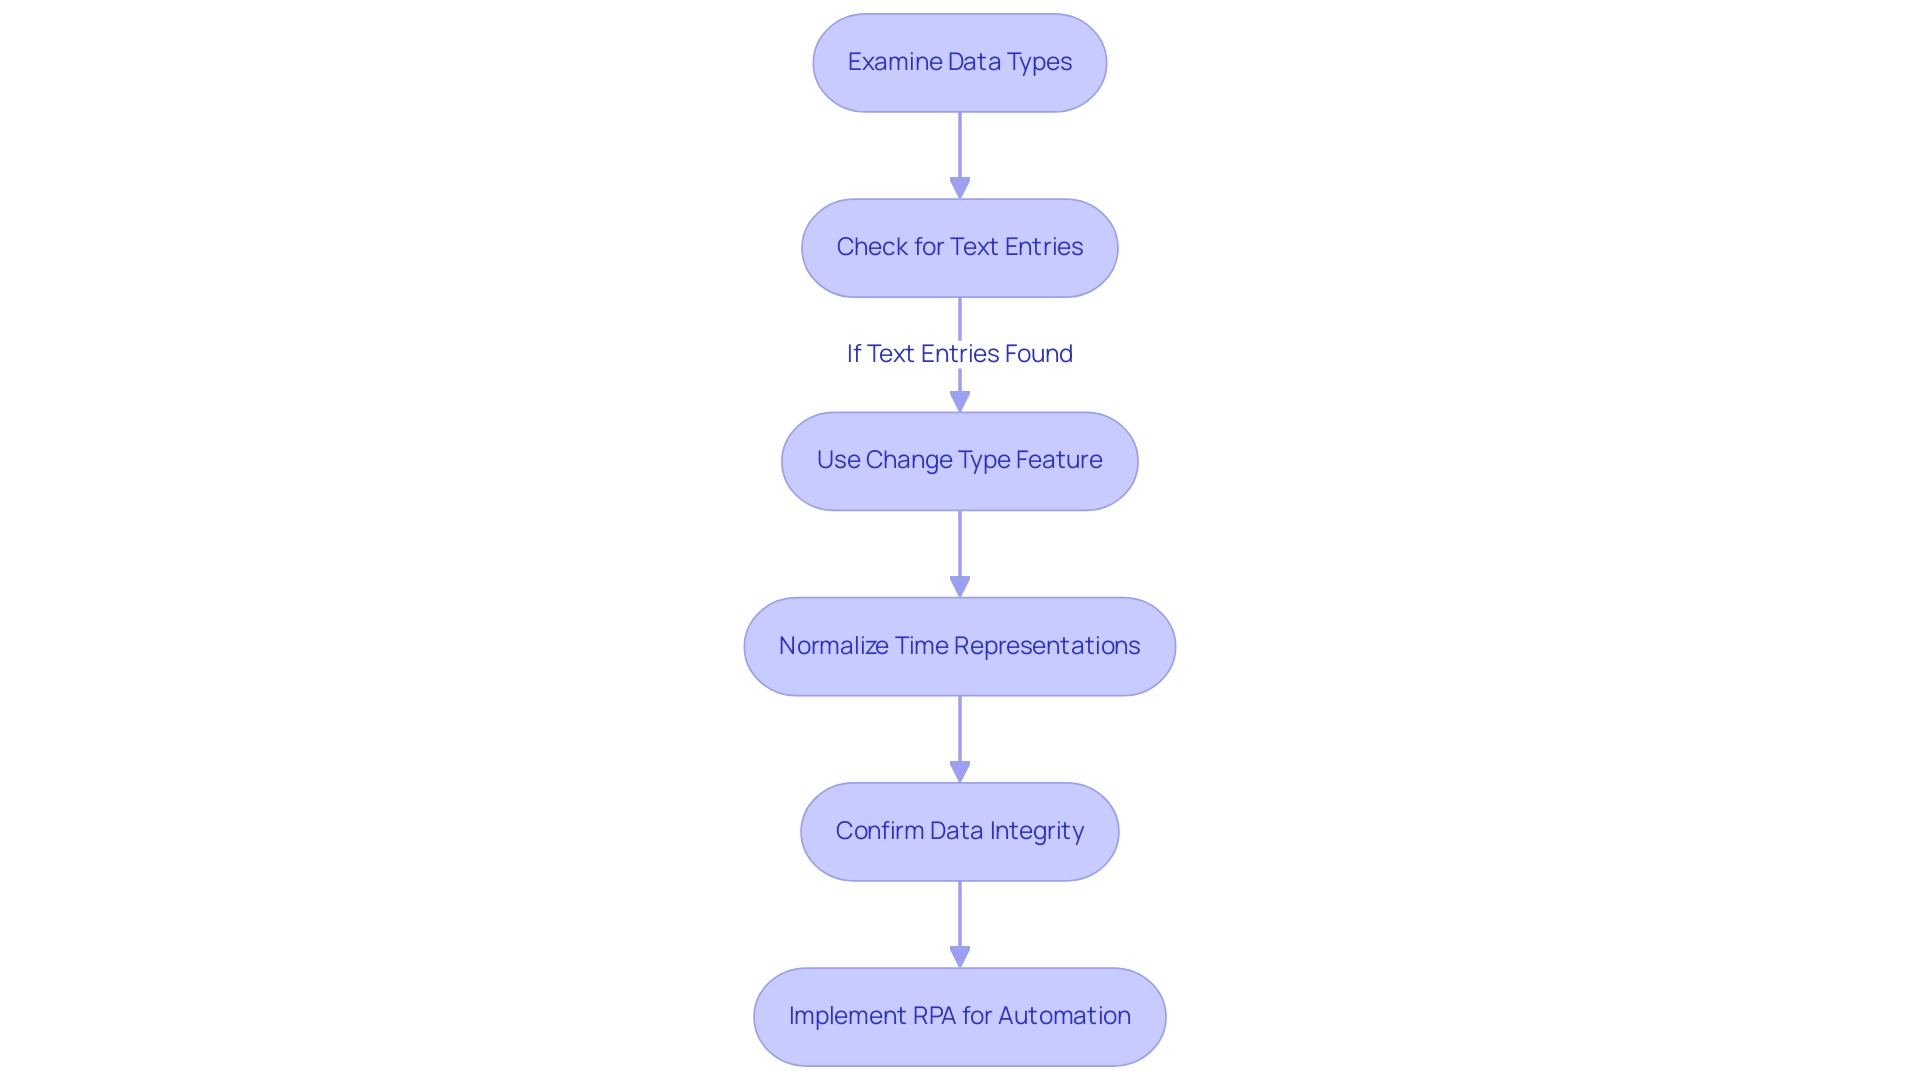
Advanced Techniques for Managing Date and Time Data in Power BI
To enhance the management of time information in Power BI, utilizing the ‘Timezone’ feature is essential for modifying dates to the correct Power BI date time format based on the individual’s geographical position. This capability ensures that your reports reflect accurate local times, enhancing user experience and data relevance. In the realm of Business Intelligence, effective time management plays a pivotal role in deriving actionable insights that drive operational efficiency.
For over 20 years, Anexas has been transforming individuals and organizations, reinforcing this significance. Additionally, you can generate personalized time representations effortlessly using the FORMAT function in DAX or via Power Query transformations to achieve the desired Power BI date time format. For instance, to present the date in a ‘Day-Month-Year’ format according to the Power BI date time format, you can implement the following expression: FORMAT(YourDateColumn, 'DD-MM-YYYY').
A practical illustration of this can be observed in the case study titled ‘Statistical Functions in Power BI,’ where measures such as Average Quantity and Price Standard Deviation were created to analyze sales information effectively. However, challenges such as time-consuming report creation and inconsistencies often hinder the full potential of Power BI dashboards. By addressing these challenges with advanced techniques, you not only bolster the precision of your reports but also significantly improve user engagement with the data, ultimately leading to more informed decision-making.
As Amitabh Saxena aptly states, ‘Enroll Now‘ to start mastering these essential skills and drive growth through enhanced data-driven insights, ensuring that your organization remains competitive in today’s data-rich environment.
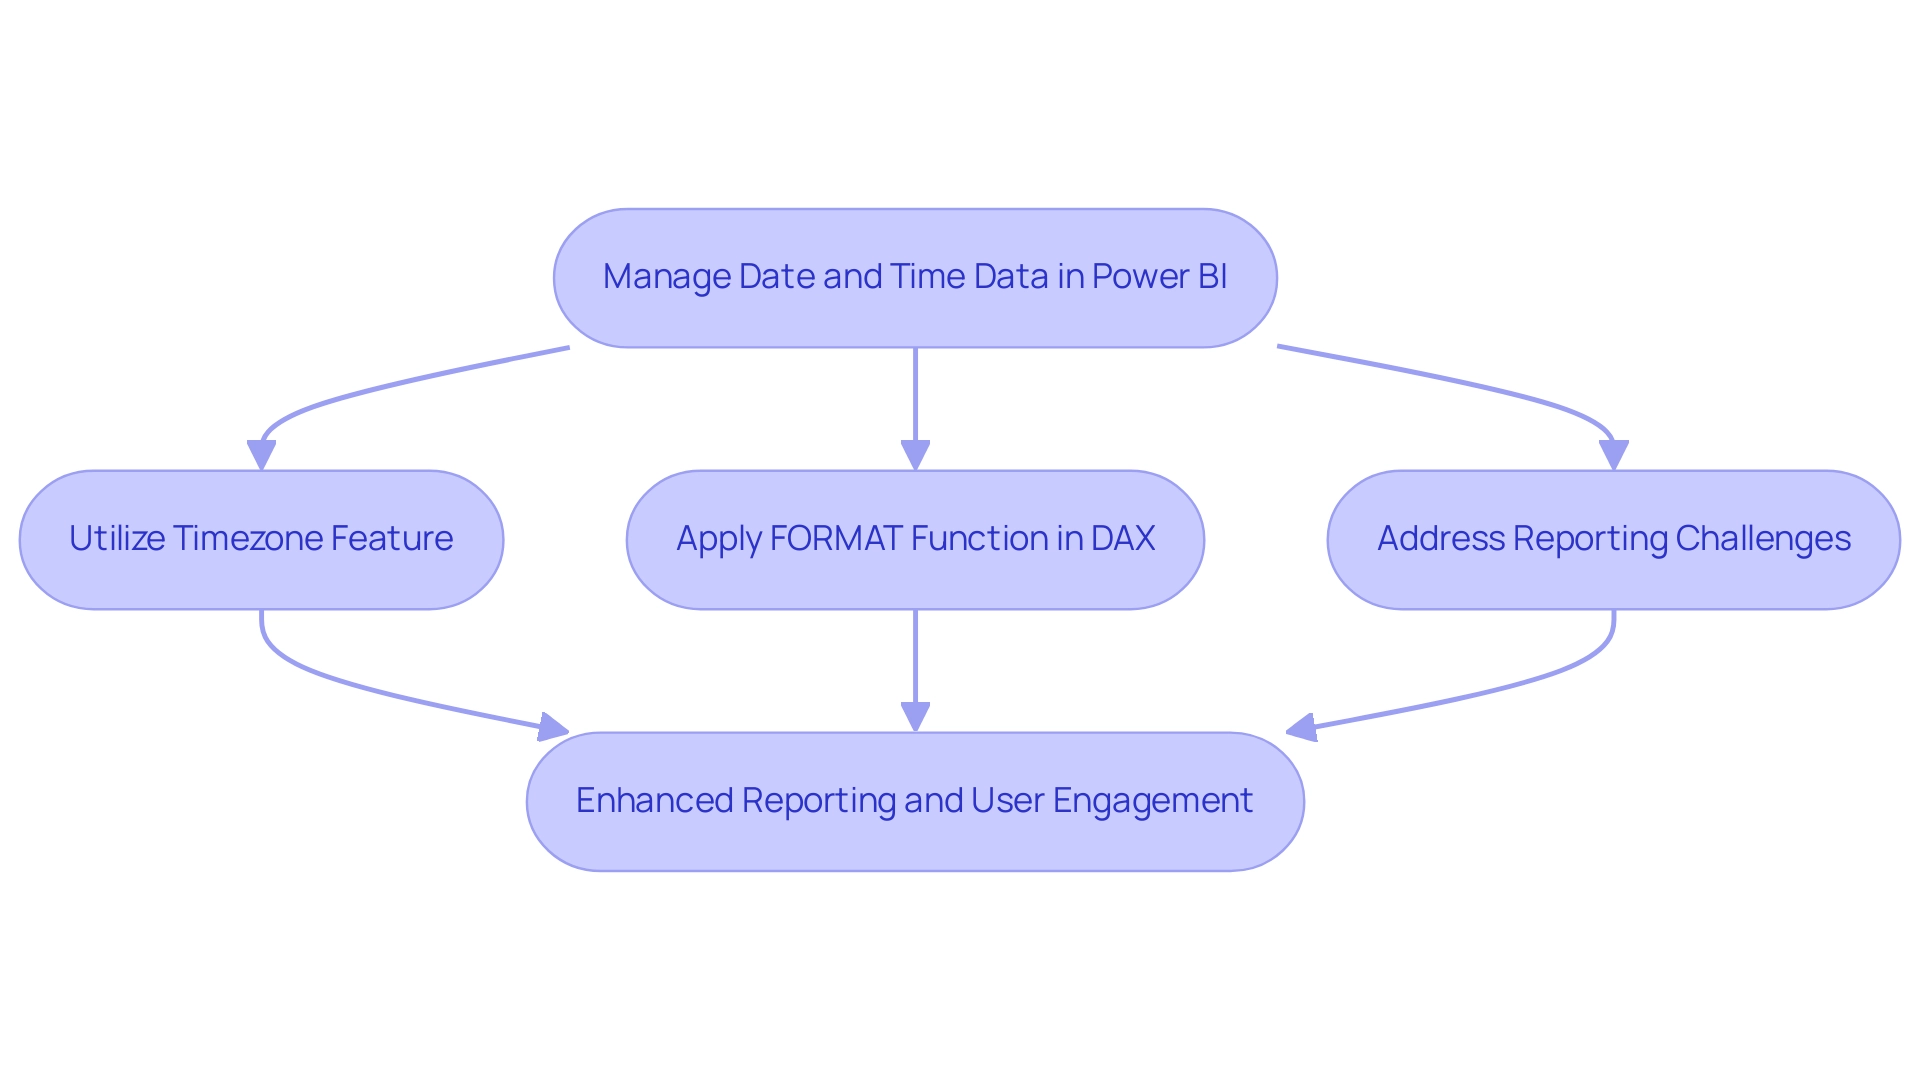
Conclusion
Mastering date and time formats in Power BI is essential for driving operational efficiency and enhancing data-driven decision-making. By understanding the various date formats, particularly the ISO 8601 standard, organizations can significantly improve report clarity and accuracy. Utilizing date slicers allows for tailored data filtering, enabling teams to extract meaningful insights while fostering user engagement. Furthermore, leveraging DAX and M code techniques enhances date formatting capabilities, ensuring that reports are not only visually appealing but also reliable.
Addressing common challenges, such as inconsistencies across data sources and text-to-date conversions, is crucial for maintaining data integrity. Implementing automation and AI solutions can streamline these processes, reducing errors and enhancing the overall reporting experience. Advanced techniques, including timezone adjustments and custom date formats, further empower users to present data that is relevant and actionable.
In conclusion, equipping teams with the knowledge and tools to effectively manage date formats in Power BI unlocks the full potential of data analytics. By prioritizing these practices, organizations can drive impactful results, foster trust in their analytics, and ultimately achieve sustained business growth. Now is the time to embrace these strategies and transform data into a powerful asset for informed decision-making.
Overview:
The article addresses common issues related to timezone discrepancies when using the datetime.localnow() function in Power BI and proposes effective solutions to mitigate these challenges. It emphasizes the importance of standardizing on UTC, aligning timezone settings, and employing DAX functions for adjustments, thereby ensuring accurate reporting and informed decision-making across organizations with distributed teams.
Introduction
In the complex landscape of data reporting, timezone discrepancies can pose significant challenges, particularly for organizations with teams spread across various regions. As businesses increasingly rely on tools like Power BI for critical insights, understanding the implications of timezone management becomes paramount. The datetime.localnow() function, while useful, can lead to inconsistencies that hinder accurate decision-making.
By exploring effective strategies to address these discrepancies—ranging from standardizing on Coordinated Universal Time (UTC) to leveraging advanced DAX functions—organizations can enhance their data integrity and reporting accuracy.
This article delves into practical solutions that empower businesses to navigate timezone challenges, ensuring reliable insights that drive informed decisions and foster growth.
Understanding Timezone Discrepancies with datetime.localnow() in Power BI
The application of the datetime.localnow() function in Power BI can frequently result in significant discrepancies, especially because of timezone management. While this function captures the current local date and time based on the system’s timezone settings, challenges arise when the datetime.localnow() timezone operates in a different time zone from the user’s local environment. Such inconsistencies are particularly problematic for organizations with distributed teams across various timezones, where accurate information reporting is crucial for informed decision-making.
For instance, Google Ads functions on a 30-day attribution window, emphasizing how timing can significantly affect reporting accuracy. Furthermore, recent statistics show that mobile fraud, including SDK spoofing, worsens discrepancies, complicating the accuracy of reports. As Maya, a Square Community Moderator, noted, ‘For this inquiry, you will need to reach out to Customer Support so our team can look further into this and file the ticket,’ underscoring the importance of seeking assistance to address discrepancies.
Without addressing these time differences, organizations risk facing a lack of data-driven insights, which can lead to a competitive disadvantage in the market. To mitigate these issues, the implementation of timezone-specific tables is proposed as a solution. This method, examined in a case study, indicates that organizing information population into distinct tables for each time region can efficiently control computation expenses and improve precision.
However, the design has faced scrutiny regarding its efficiency, indicating that while retrieving information directly from timezone-specific tables could be a viable solution, it may not be without its drawbacks. By comprehending these time differences and utilizing tools such as EMMA RPA and Automate, organizations can take proactive measures towards more dependable reporting, ultimately empowering improved decision-making and promoting business growth through effective use of Business Intelligence and RPA.
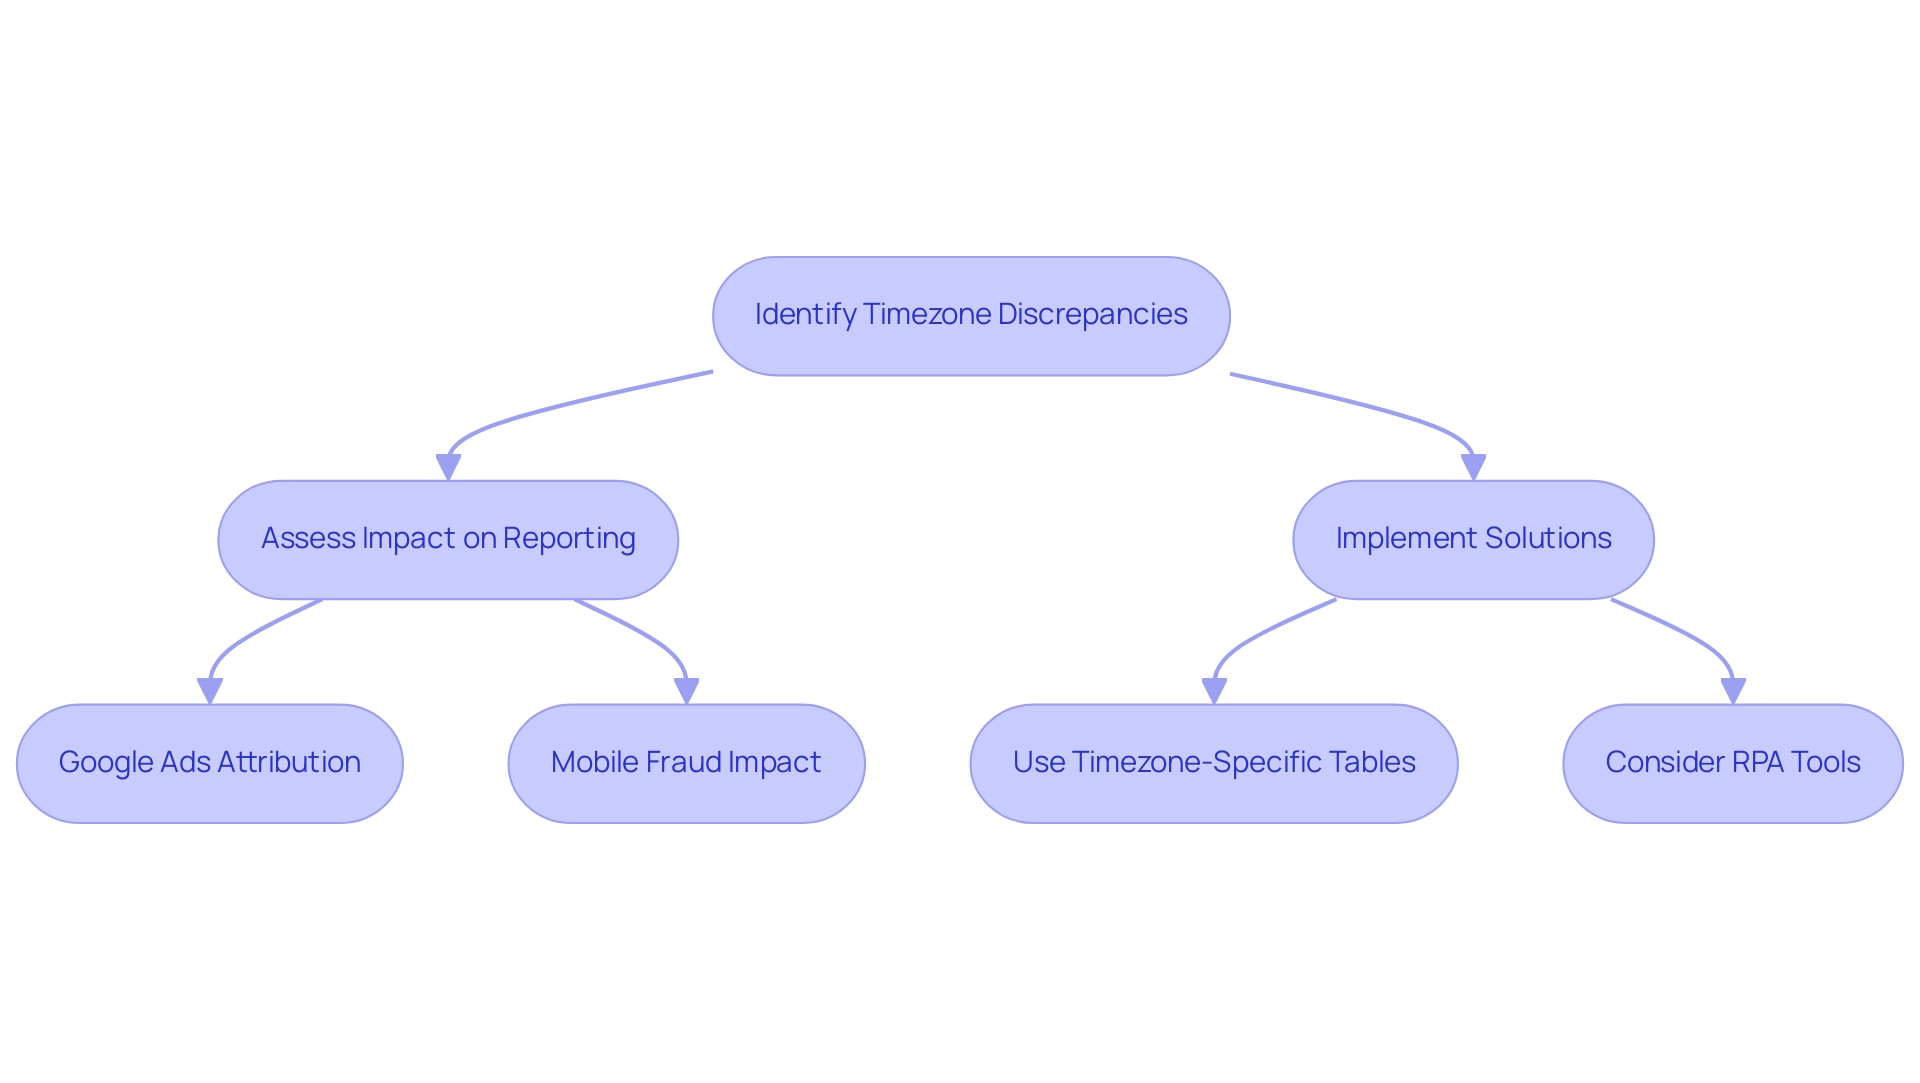
Effective Solutions for Fixing Timezone Issues in Power BI
To effectively tackle time zone challenges in BI and mitigate the common issues of time-consuming report creation, data inconsistencies, and lack of actionable guidance, consider these strategic solutions:
-
Leverage UTC Time: Transitioning your datetime values to Coordinated Universal Time (UTC) before importing them into Power BI is crucial. This standardization minimizes discrepancies across various regions, ensuring consistency in reporting. For instance, the timestamp
2014-09-01T14:44:13+0100always signifies the same moment, highlighting the reliability of UTC. As observed in modern applications, particularly with cloud computing, storing values in UTC has become increasingly prevalent, allowing for better handling of zone logic at the application level. -
Align Timezone Settings: Ensure that your BI service settings are synchronized with your organization’s designated timezone. This adjustment can be made directly within the Power BI Admin portal, facilitating a smoother reporting process that reflects precise local hours and minimizes the duration spent on correcting discrepancies.
-
Develop Calculated Columns: For situations where local display is necessary, consider creating calculated columns. Employing DAX functions like
DATEADD()facilitates smooth modifications of UTC to the suitable local region, improving clarity and usability for end-users while delivering actionable insights. -
Utilize Power Query: Harness the power of Power Query to transform datetime values during the import phase. Applying timezone adjustments at this stage can streamline processes and reduce errors in reporting, freeing up valuable time for analysis instead of report creation.
-
Establish a Governance Strategy: Implementing a governance strategy is essential to address inconsistencies effectively. This strategy should include clear guidelines on information handling, ensuring that all stakeholders are aligned and that the information remains trustworthy.
-
Empower Through Education: Educating team members about the implications of time differences on reporting is vital. Offering training on best practices in handling information not only fosters awareness but also cultivates a culture of accuracy and reliability in processing, addressing the root of inconsistencies.
By implementing these strategies, organizations can significantly mitigate the effects of time zone discrepancies, which is essential for more precise and trustworthy reporting in Power BI using the datetime.localnow() timezone. As Zoid aptly stated,
Timezone makes no sense to me
— a sentiment that emphasizes the necessity for clear and consistent scheduling management in information reporting. Moreover, the case study on transparency and normalization in information processing emphasizes the importance of including time zone details to enhance clarity in production deliveries, demonstrating how such practices can address questions during review and ensure reliable outcomes.
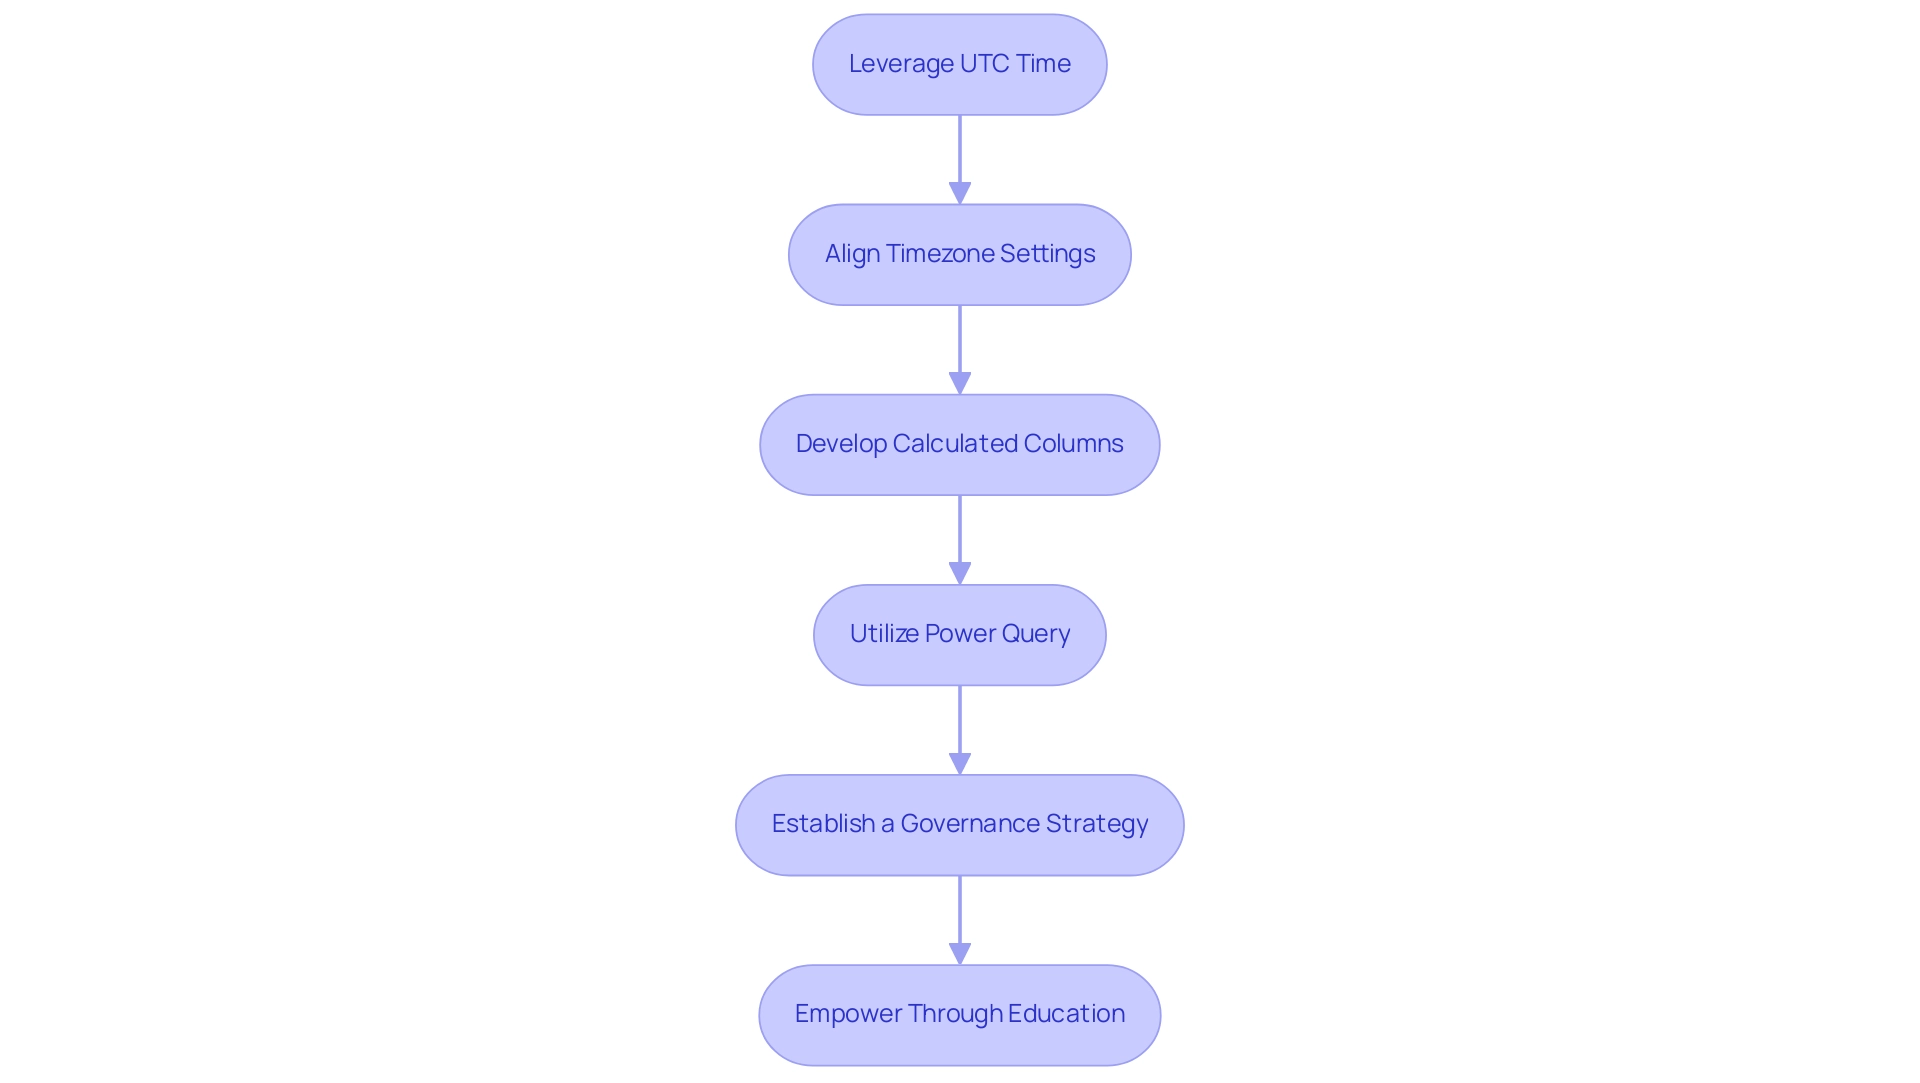
Common Misconfigurations Leading to Timezone Issues
Timezone discrepancies in BI, especially concerning the power bi datetime.localnow() timezone, can significantly hinder data analysis and reporting, but they can often be traced back to a few common misconfigurations. Here are four key areas to focus on:
- Incorrect System Time Settings: First, ensure that the system clock on the machine running BI is set to the correct timezone.
A mismatch in system time can lead to erroneous datetime values, distorting your analysis. As noted by Sahir Maharaj, Should you require further assistance, please do not hesitate to reach out. This underscores the importance of addressing these foundational issues, especially considering that there are currently 3,635 users online who may be facing similar challenges.
-
Energy BI Service vs. Desktop Settings: Many users overlook that time zone configurations can differ between Power BI Desktop and the Power BI Service. Confirming that both environments are aligned is crucial to prevent inconsistencies in your reporting, especially when considering the
power bi datetime.localnow()timezone. -
Information Source Time Settings: When retrieving datetime values from different information sources, it’s crucial to ensure that their time settings align with your reporting requirements, particularly concerning the
power bi datetime.localnow()timezone. Disparities here can lead to significant inaccuracies in the information presented. A pertinent case study titled ‘Error in Direct Query Mode‘ emphasizes this issue, where a user reported mistakes when applying time zone updates within a Direct Query table in BI, noting that switching to Import mode removed the real-time view, making it impossible to switch without losing functionality. -
Regional Settings: The regional settings within Power BI also affect how datetime values are interpreted and displayed. Double-checking these settings ensures that your information aligns with the correct formats and standards.
By proactively addressing these common misconfigurations, you can mitigate many issues related to the power bi datetime.localnow() timezone that typically arise during information analysis and reporting. Furthermore, applying these solutions strengthens a more robust governance strategy, improving the reliability of your insights and empowering your decision-making processes, thereby reducing confusion and mistrust in the information presented.

Utilizing DAX for Timezone Adjustments
DAX serves as a formidable ally in navigating time differences within Power BI, particularly by utilizing the datetime.localnow() timezone, empowering users to maintain accurate datetime representations while overcoming common challenges such as time-consuming report creation and data inconsistencies. To effectively address these inconsistencies, a robust governance strategy is essential. Here are several essential DAX functions to harness for this purpose:
-
UTCNOW()Function: This function retrieves the current date and time in UTC, providing a reliable starting point. To convert this to a specific time region, utilize theDATEADD()function, adjusting the hours according to your target location, thus streamlining the report creation process. -
Creating a Timezone Offset Table: Establish a dedicated table containing timezone offsets for various regions. This dynamic table allows for real-time adjustments of your datetime values, ensuring they reflect the correct local time based on user location, utilizing the
datetime.localnow()timezone. Such customization not only enhances user experience and data accuracy but also mitigates the inconsistencies often seen in reports, providing stakeholders with clear, actionable guidance. -
SWITCH()Function for Conditional Adjustments: Implement theSWITCH()function to facilitate conditional timezone adjustments. This allows you to apply different offsets depending on the user’s location or specific reporting needs, making your reports more relevant and precise, and providing stakeholders with actionable guidance.
Additionally, for those with access to a SQL Server instance, utilizing DirectQuery can be beneficial. By executing the T-SQL command SELECT CONVERT(Time, GETDATE()), you can leverage the database’s time zone, which enhances the accuracy of your datetime values and reduces the time spent on report construction. However, it’s essential to integrate this approach within a governance framework to ensure information integrity.
Furthermore, it’s essential to consider the implications of limited relationships in Power BI, as highlighted in the case study. Limited relationships often arise from many-to-many cardinality or cross-source group relationships, affecting structures and referential integrity. By being aware of these issues, users can better manage their time adjustments in relation to information relationships.
By integrating these DAX techniques along with a strong governance strategy, users can adeptly manage and present datetime values that authentically represent their desired time zone using datetime.localnow() timezone. Such enhancements significantly boost the reliability of reports, empowering decision-makers with accurate data insights and alleviating the challenges of inefficient reporting.
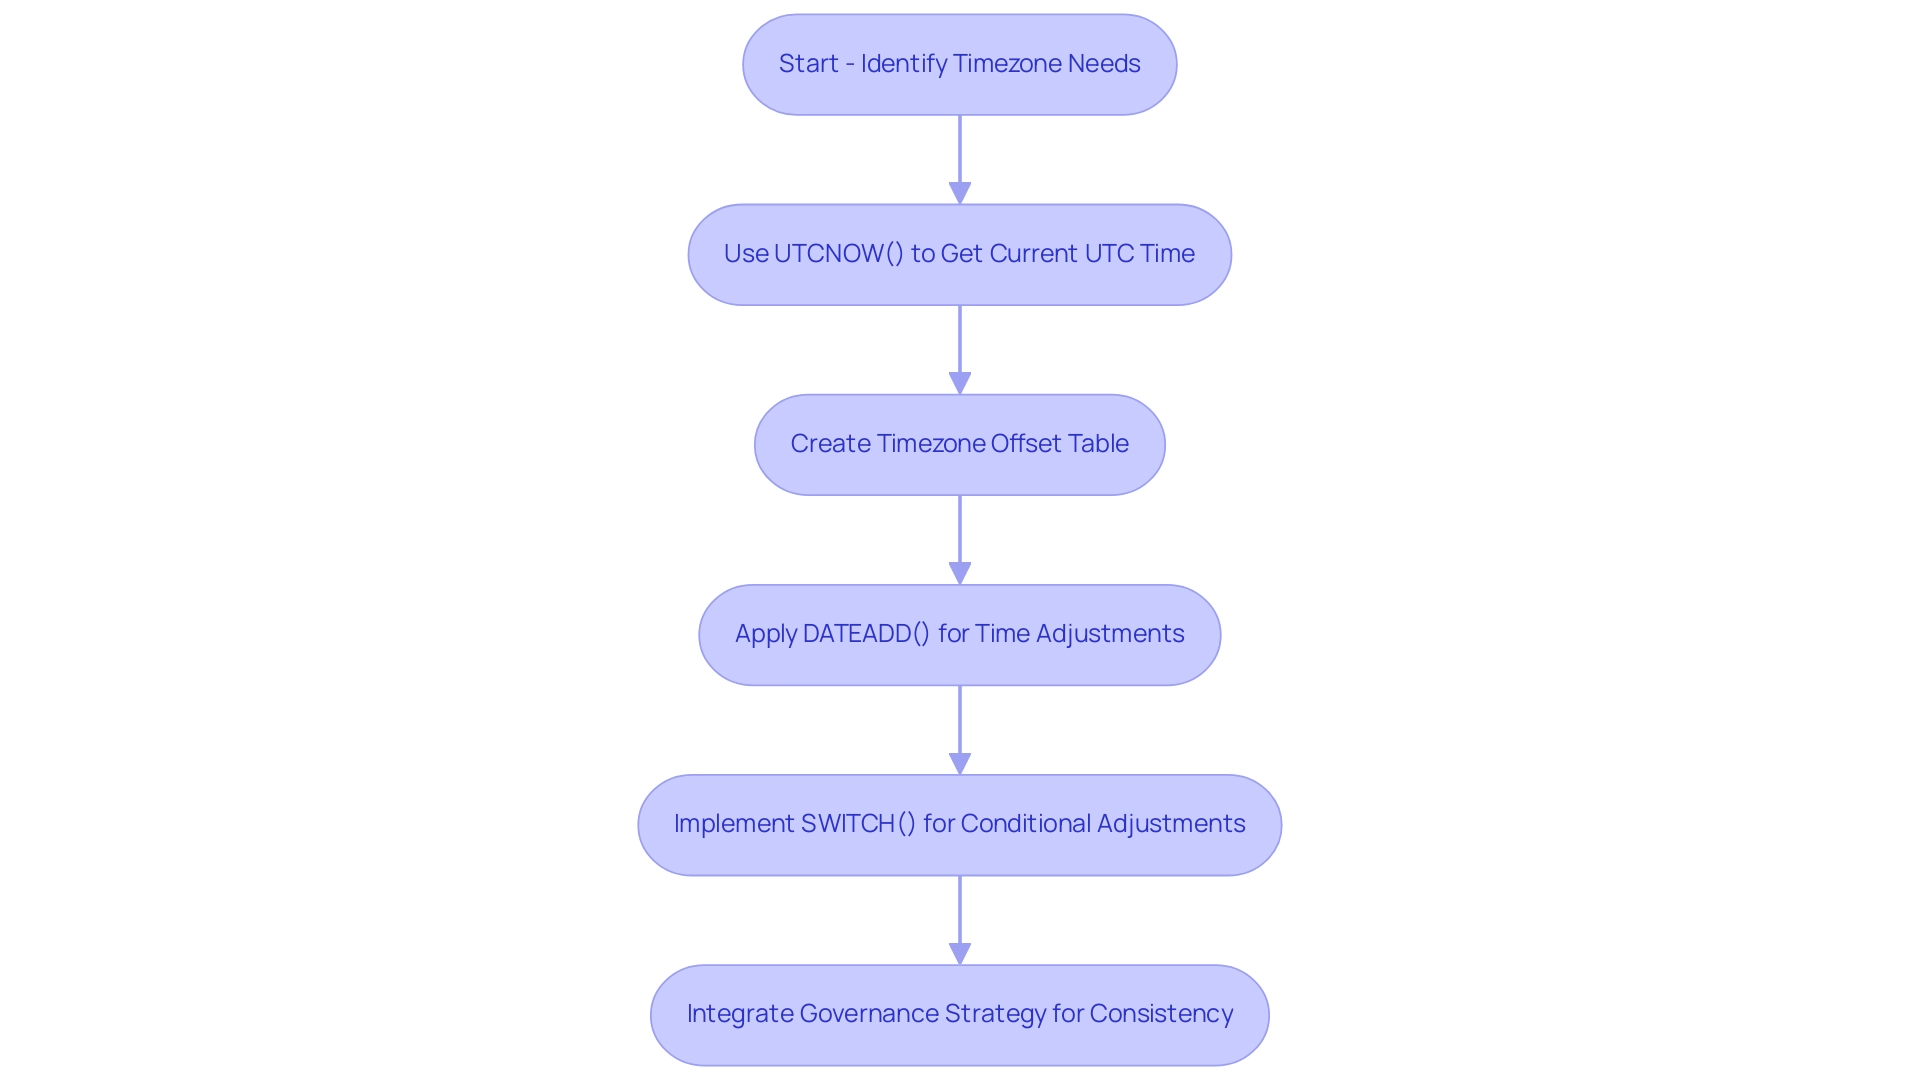
Best Practices for Handling Timezones in Power BI
To effectively manage timezone challenges in Power BI and enhance overall operational efficiency, consider implementing the following best practices:
-
Standardize on UTC: Convert all datetime values to Coordinated Universal Time (UTC) before importing them into Power BI. This practice simplifies the handling of multiple timezones, enhances consistency, and addresses the common challenge of time-consuming report creation. Additional enhancements can be realized by utilizing machine learning models trained on past conversion information for increased precision.
-
Document Timezone Conventions: Maintain detailed documentation of the time zone conventions used across reports and datasets. This ensures all stakeholders are aligned, fostering trust in the information presented and mitigating confusion stemming from inconsistencies.
-
Regularly Review Settings: Conduct periodic reviews of your Power BI service and desktop settings, ensuring they align with the
power bi datetime.localnow()timezone for consistency and accuracy. This step is crucial for preventing discrepancies in information reporting, especially concerning Daylight Saving Time changes, which should be consistently managed. -
Train Staff: Invest in comprehensive training sessions for team members focused on managing timezone discrepancies. Emphasizing the significance of precise information reporting not only boosts morale but is vital for operational efficiency.
-
Leverage RPA Solutions: Implement Robotic Process Automation (RPA) solutions to automate repetitive tasks related to report creation. This can significantly reduce the time spent on manual processes, allowing your team to focus on transforming raw information into actionable insights that drive informed decision-making.
-
Stay Updated: Keep informed about updates to Power BI that may influence the
power bi datetime.localnow()timezone functions and datetime management. Regularly revising your practices in light of new features ensures your organization remains at the forefront of effective information handling.
Implementing these strategies not only boosts reporting accuracy but also enhances overall operational efficiency. Furthermore, addressing Daylight Saving Time adjustments is essential in your information management approach. Significantly, case studies such as “Identifying and Converting Time Zones” show that employing natural language processing to recognize time zones in text significantly enhances the precision and usability of time-related information, resulting in more dependable analysis and visualization.
By focusing on these best practices, you can ensure that your organization effectively leverages its data for strategic growth.
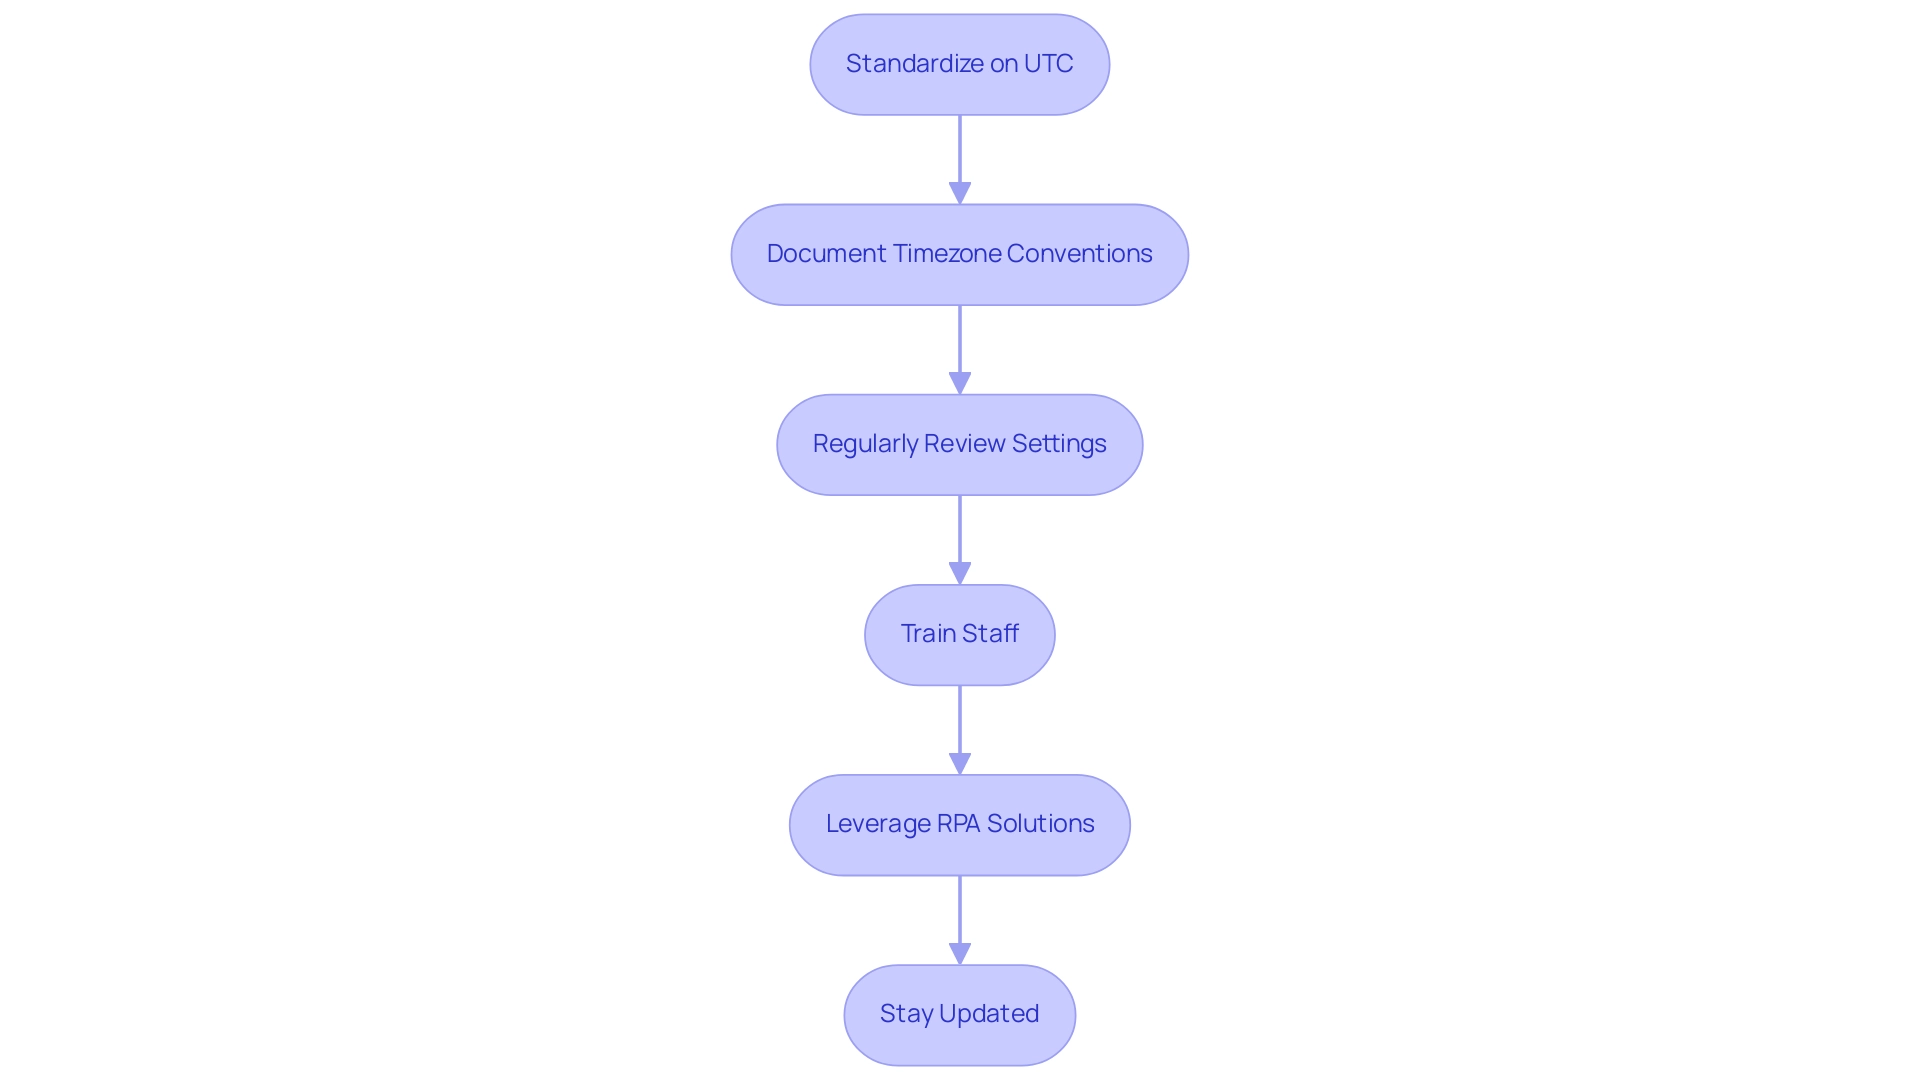
Conclusion
Timezone discrepancies are a significant hurdle in achieving accurate data reporting, particularly for organizations that operate across multiple regions. The challenges posed by the datetime.localnow() function in Power BI highlight the necessity for a strategic approach to timezone management. Key solutions include:
- Standardizing on Coordinated Universal Time (UTC)
- Aligning timezone settings across platforms
- Leveraging advanced DAX functions for precise adjustments
These strategies not only enhance data integrity but also empower teams to make informed decisions based on reliable insights.
By addressing common misconfigurations and implementing best practices, organizations can mitigate the risks associated with inconsistent data reporting. Essential steps in fostering a culture of accuracy include:
- Training staff
- Documenting timezone conventions
- Regularly reviewing settings
Furthermore, embracing technology solutions such as Robotic Process Automation (RPA) can streamline reporting processes, allowing teams to focus on deriving actionable insights from their data.
Ultimately, overcoming timezone challenges is an achievable goal that requires a proactive and informed approach. By prioritizing effective timezone management, businesses can enhance their operational efficiency, ensure reliable reporting, and maintain a competitive edge in today’s data-driven landscape. The commitment to these practices paves the way for growth, informed decision-making, and a robust governance strategy that instills trust in organizational data.
Overview:
Power BI Direct Query and Live Connection each offer distinct advantages and challenges for data management, with Direct Query being ideal for large datasets that require real-time access, while Live Connection enhances performance through server-side processing. The article emphasizes that the choice between these methods should be guided by specific use cases, infrastructure capabilities, and performance needs, as illustrated by various examples and expert insights throughout the analysis.
Introduction
In the dynamic landscape of data analytics, choosing the right connection type in Power BI is a critical decision that can significantly impact an organization’s reporting capabilities and operational efficiency. With options like Direct Query and Live Connection, each offering unique advantages and challenges, understanding their nuances is essential for harnessing the full potential of business intelligence.
As data continues to evolve at an unprecedented pace, the ability to access real-time insights while managing large datasets becomes paramount. This article delves into the intricacies of these connection types, providing a comprehensive overview of their performance, use cases, and best practices.
By equipping decision-makers with the knowledge to navigate these choices, organizations can enhance their data strategies, streamline operations, and ultimately drive growth and innovation.
Understanding Direct Query and Live Connection in Power BI
In BI, Live Query provides users the ability to link straight to a source, executing inquiries instantly. This approach enables data to stay within its original source system, with BI retrieving it on-demand, making it especially beneficial when handling large datasets that necessitate frequent updates. Statistics suggest that the utilization of BI Query is anticipated to rise by 30% in 2024, highlighting its growing significance in data-driven decision-making.
However, a user reported that while a view in SQL Server utilizes four tables and runs quickly, Power BI’s efficiency is hindered as it executes the query multiple times for each visual. This emphasizes a common challenge when utilizing Power BI Direct Query vs Live Connection for near real-time visibility, illustrating the significance of optimizing models for performance. On the other hand, a Live Connection, in the context of Power BI Direct Query vs Live Connection, operates similarly but is designed for linking to models hosted in services like SQL Server Analysis Services (SSAS).
In this context, Power BI serves as a front-end interface, with all queries processed on the server, facilitating real-time analysis without requiring imports. This distinction between Power BI Direct Query vs Live Connection is crucial for users striving to enhance their reporting and analytics capabilities. Furthermore, applying row-level security can result in a high number of queries during refresh, affecting overall efficiency.
As industry expert Amit Chandak wisely advises:
Do you have bi-directional joins? If yes, try to avoid that. Second, ensure you have an index in the join columns.
Such insights highlight the significance of utilizing Business Intelligence and RPA solutions, along with customized AI solutions, to tackle operational challenges and improve information extraction capabilities. By addressing these challenges, businesses can avoid the competitive disadvantage of struggling to extract meaningful insights, enabling informed decision-making that drives growth and innovation.
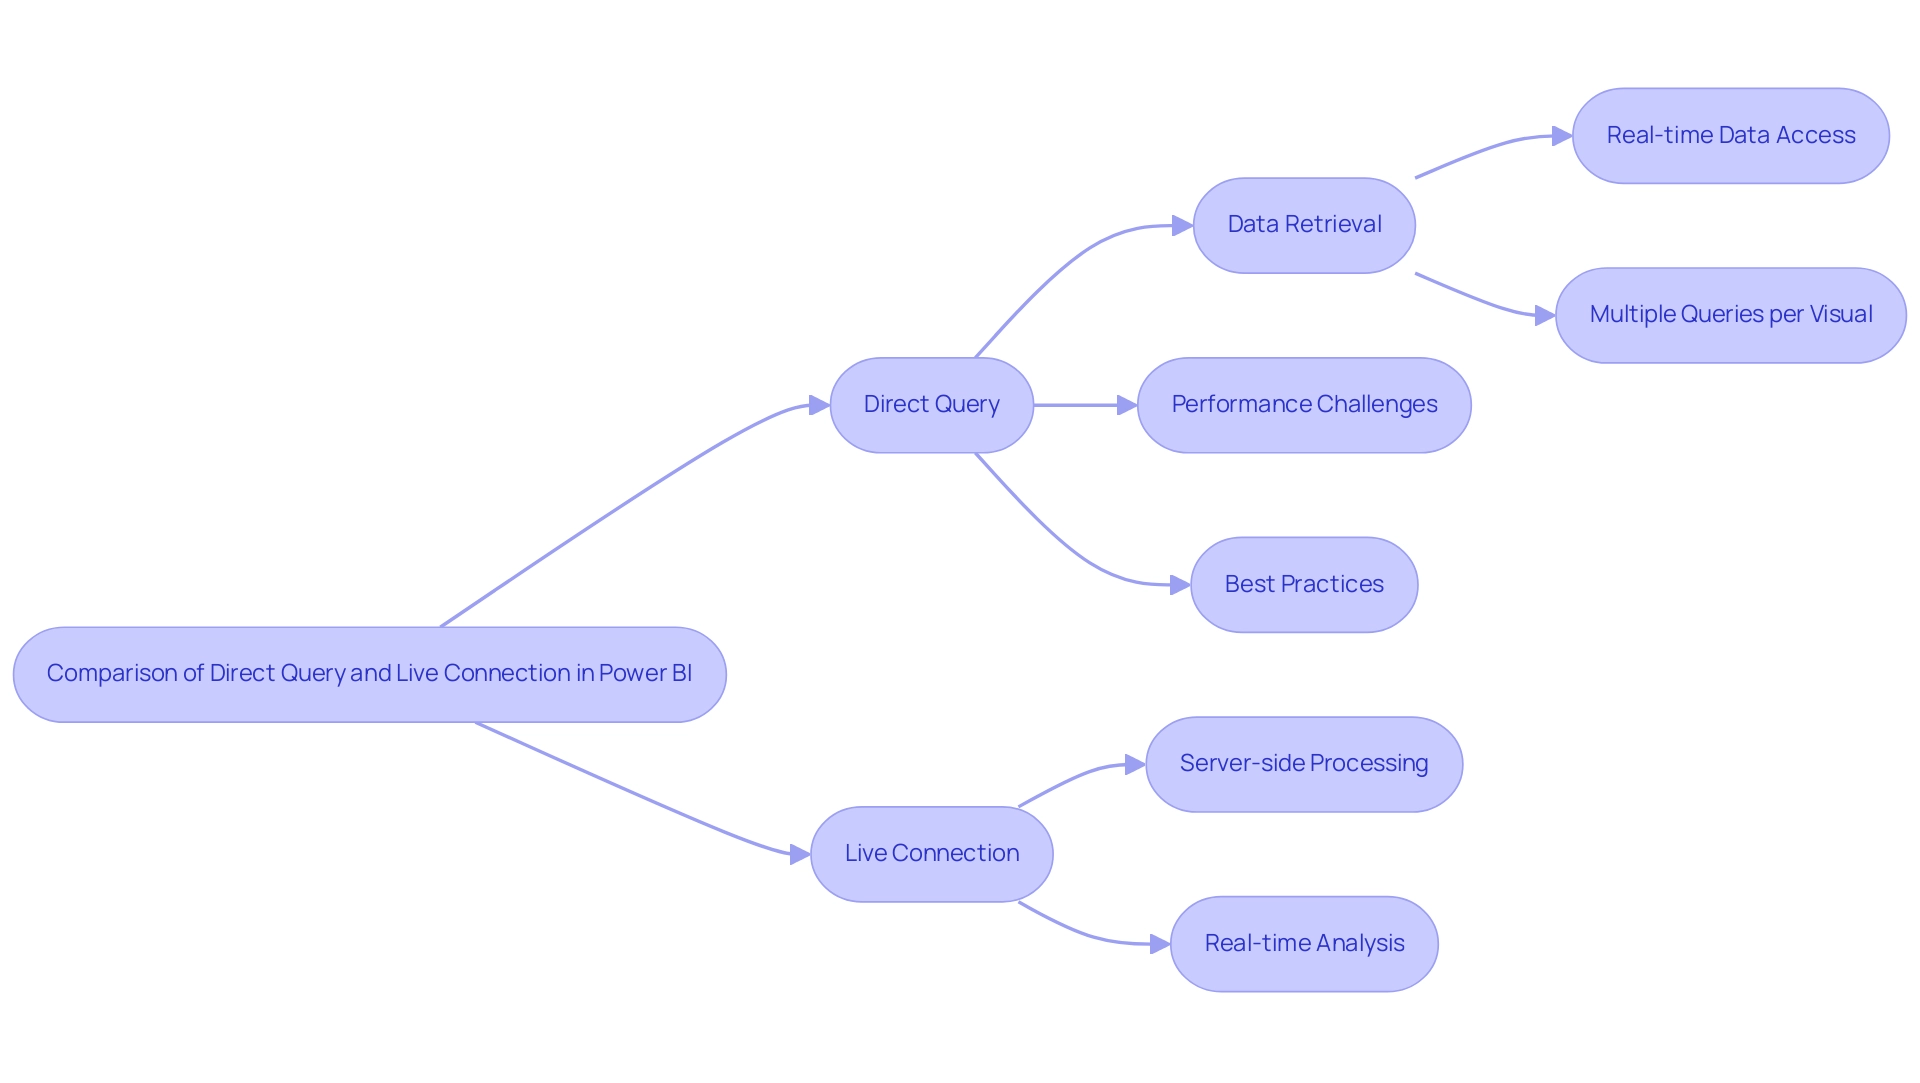
Performance Comparison: Direct Query vs. Live Connection
When assessing efficiency in Power BI, it’s vital to comprehend the inherent latency linked to various connection types, especially in the context of Power BI Direct Query vs Live Connection, particularly regarding typical challenges such as time-consuming report creation and information inconsistencies. Direct Query can introduce latency because each query requires a round trip to the source, which can lead to slower report efficiency if the underlying database is not properly optimized. However, it is ideal for large datasets that exceed the 1 GB in-memory limit, making it suitable for organizations dealing with extensive data.
For instance, a recent case study highlighted a user who initially experienced slow response with an SSAS cube, taking 15 seconds to load. After transitioning to Power BI Premium, efficiency stayed the same until the user changed to Query mode, significantly decreasing the load time to only 5 seconds. This demonstrates that while there are potential latency issues with Power BI Direct Query vs Live Connection, effective use of Direct Query can offer significant performance enhancements, ultimately providing actionable insights rather than just numbers and graphs.
Additionally, the Composite Model allows e-commerce companies to respond quickly to inventory needs while analyzing long-term trends, addressing the lack of clear guidance that often plagues report users. Conversely, when considering Power BI Direct Query vs Live Connection, the latter generally provides quicker response times by utilizing the processing power of the server hosting the model. However, response times can still fluctuate based on the complexity of the data model and the server’s efficiency.
As the landscape of Power BI continues to evolve, with the quote ‘Countries are coming online tomorrow, whole countries,’ it becomes essential to tie these findings to actionable guidance for stakeholders. Organizations must not only stay informed about the latest findings on report optimization but also ensure that their governance strategies are aligned with the connection type chosen. Thus, organizations must carefully assess their specific environments and performance metrics to determine how Power BI Direct Query vs Live Connection will deliver optimal reporting capabilities, addressing the overarching challenges of report creation, governance, and the need for clear, actionable insights.
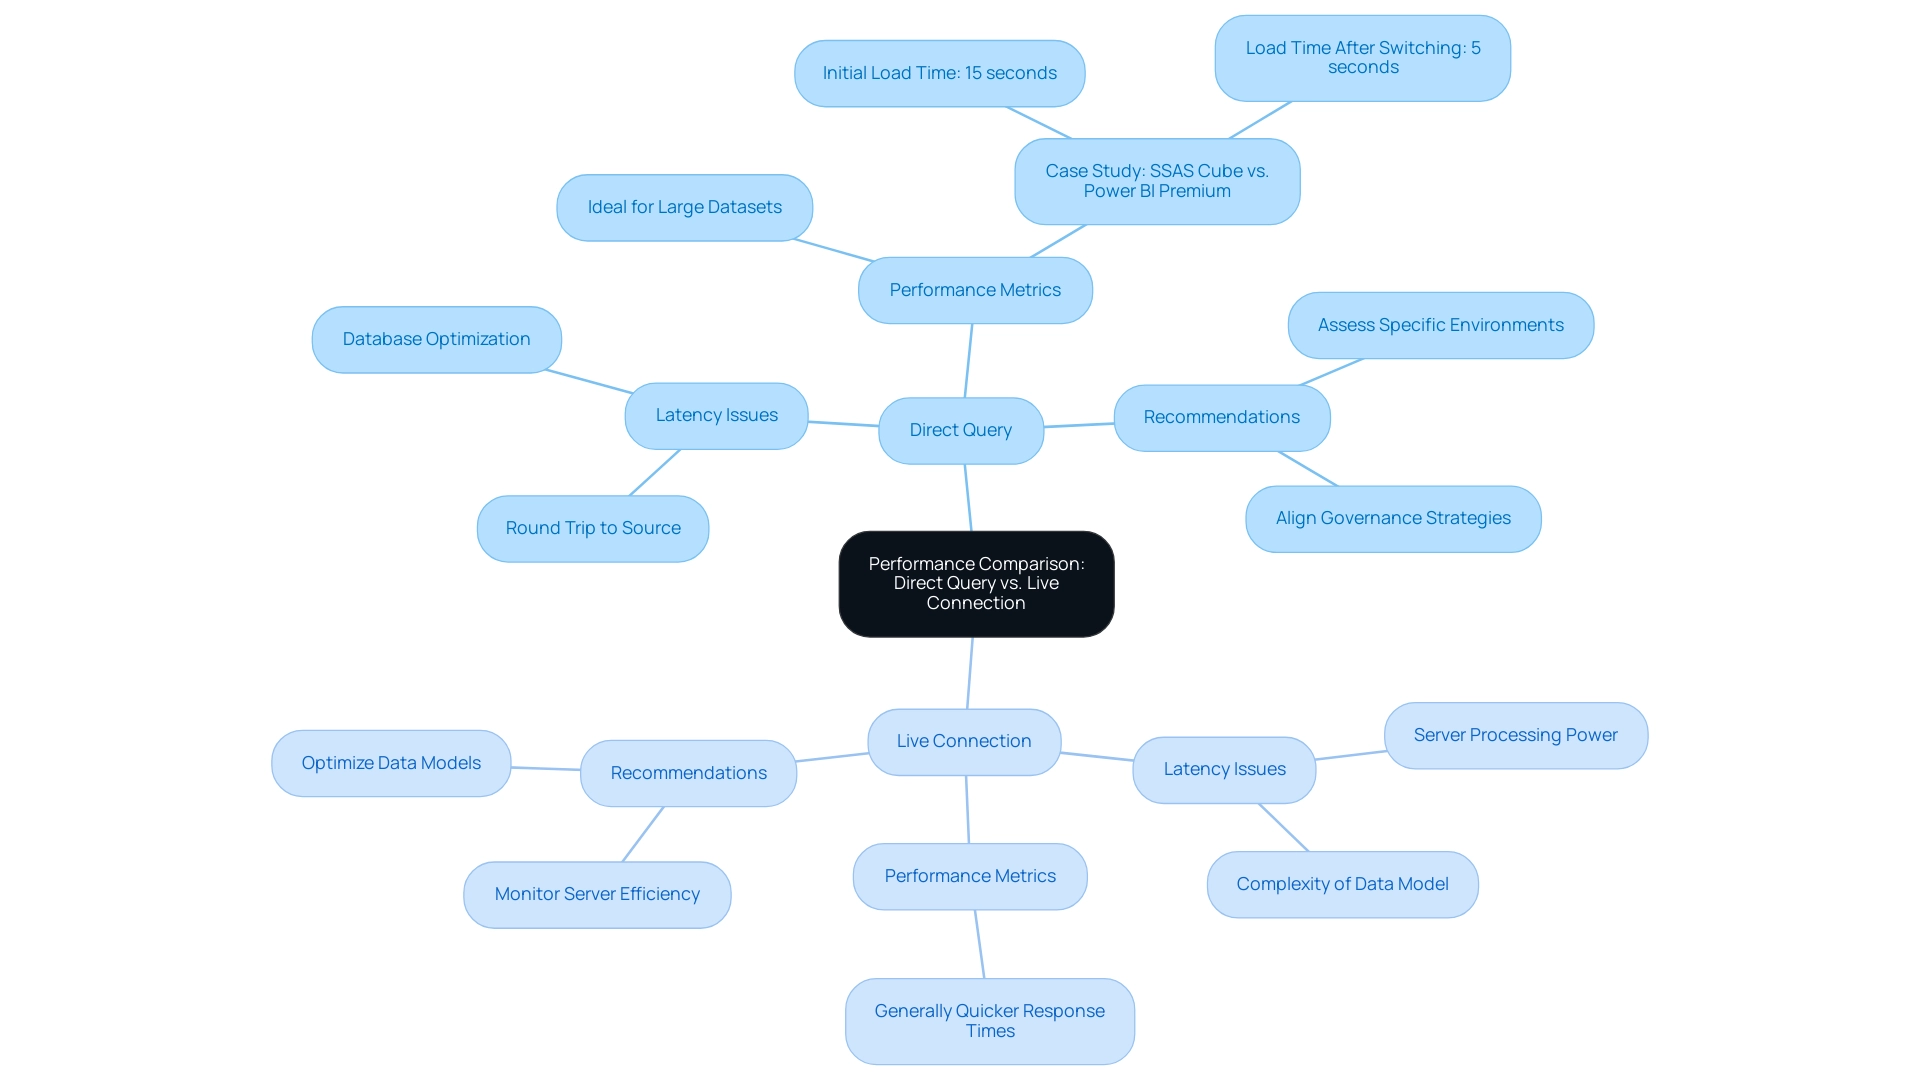
Use Cases for Direct Query and Live Connection
Immediate Query is especially appropriate for settings where information is continuously changing and demands prompt access, particularly when considering Power BI Direct Query vs Live Connection, as illustrated by operational dashboards that display real-time business metrics. This mode excels with large datasets that would be cumbersome to import into Power BI, allowing for near real-time querying without the limitations often associated with row counts or dataset sizes. By integrating Robotic Process Automation (RPA) into your workflows, you can significantly reduce manual tasks and errors, streamlining processes and enhancing overall operational efficiency.
RPA automates repetitive tasks, freeing your team to focus on strategic initiatives that drive growth. However, the choice between SPICE and Direct Query mode in QuickSight should be made based on scenario-specific requirements and latency needs, similar to the considerations in Power BI Direct Query vs Live Connection. If individual visuals take longer than tens of seconds to refresh, the experience can become unreasonably poor, emphasizing the need for optimal efficiency in real-time querying.
On the other hand, in the context of Power BI Direct Query vs Live Connection, the latter proves invaluable when handling intricate models that demand significant processing power. This is especially true in enterprise scenarios utilizing SQL Server Analysis Services (SSAS). In such instances, organizations can prioritize analytical reports where performance and information integrity are crucial.
By leveraging Live Connection and RPA, users can tap into the comprehensive capabilities of their models while ensuring swift access to insights without sacrificing the robustness needed for complex analyses. Business Intelligence plays a critical role in this process by transforming raw information into actionable insights, which enhances decision-making and operational efficiency. A practical example of enhancing performance can be seen in the case study titled ‘Visual Totals and Performance,’ where disabling unnecessary totals improved efficiency, particularly in complex aggregate scenarios.
As mentioned by Johannes R., CEO of a creative agency, ‘We are pleased with our results and with DATAFOREST’s professional services; they have assisted us in generating additional revenue through optimized information strategies and RPA implementation.’ This highlights the tangible benefits that effective information strategies and RPA can provide in optimizing operational efficiencies and driving business growth.

Pros and Cons of Direct Query and Live Connection
When assessing connection types in Power BI, understanding the benefits and drawbacks of Power BI Direct Query vs Live Connection is essential for operational success and data-driven insights. When comparing Power BI Direct Query vs Live Connection, Direct Query stands out for its ability to provide real-time information access, making it ideal for managing large datasets that require immediate updates. However, organizations must be aware of its limitations, including potential efficiency issues that can arise from high query loads and the reliance on the source’s uptime.
In contrast, the comparison of Power BI Direct Query vs Live Connection enhances performance through efficient information handling and offers robust modeling capabilities, significantly streamlining the analytics process. Nonetheless, it comes with limitations regarding information transformations and necessitates a dedicated SQL Server Analysis Services (SSAS) server to function optimally. To tackle common challenges such as time-consuming report creation and inconsistencies, users should consider best practices.
For instance, leveraging Excel files through OneDrive can mitigate risks by allowing for better information management and reducing the likelihood of incorrect information propagation. As mentioned by Applicable, training users to manage these files effectively and ensuring backups are created before changes can help preserve information integrity. Furthermore, the case study titled ‘Using Excel Files with Power BI‘ highlights the benefits of linking Power BI datasets with Excel files stored on OneDrive, demonstrating how this method improves information management and decreases the risk of erroneous information dissemination.
It is crucial to recognize that a lack of information-driven insights can severely hinder operational efficiency, making it essential for organizations to adopt effective management practices. With 3,447 users currently engaging in discussions within the community, it is evident that these topics are of significant relevance. Therefore, organizations can benefit from carefully considering these factors to choose the connection type that aligns with their operational goals while maximizing performance and minimizing risks.
To implement these practices effectively, directors should prioritize training for their teams and explore the specific features of Business Intelligence tools and RPA solutions that can further enhance their data-driven decision-making capabilities.
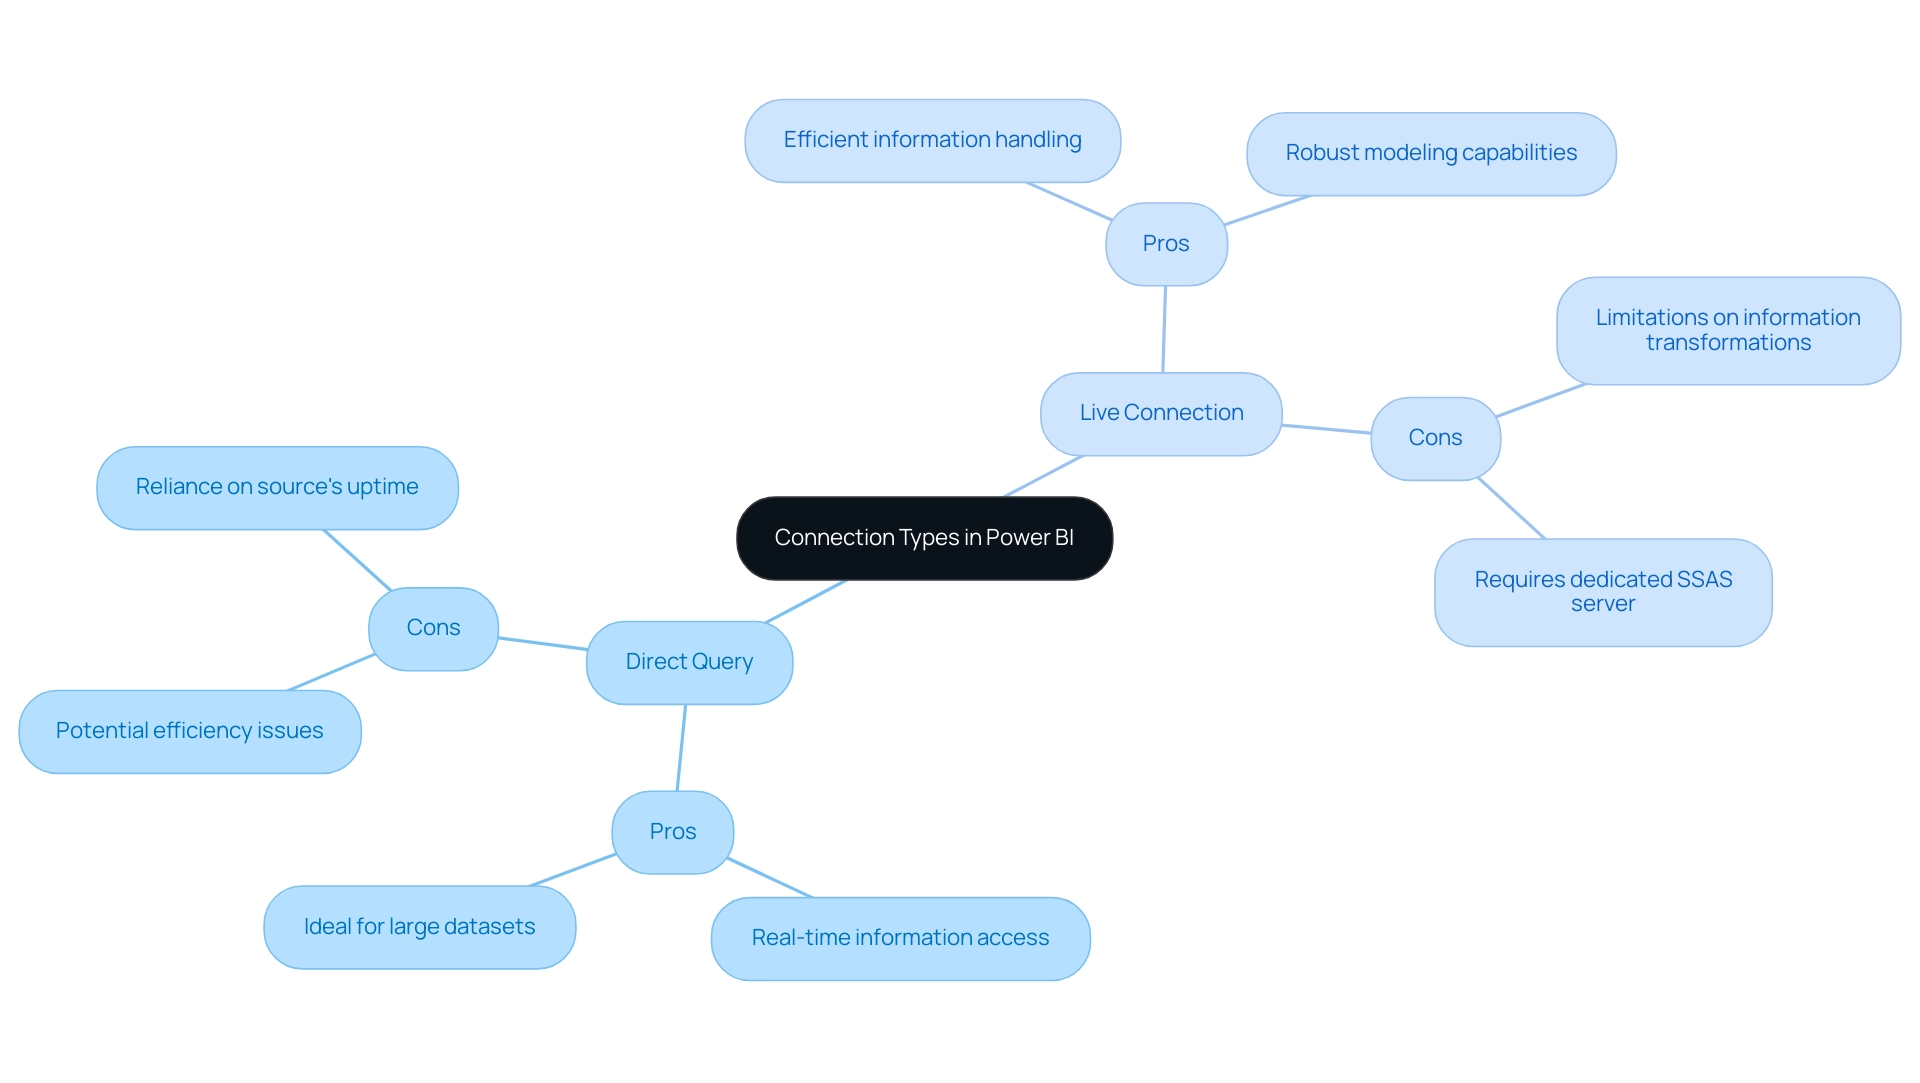
Best Practices for Selecting the Right Connection Type
Choosing the suitable connection type in BI requires a thorough assessment of data requirements, including the frequency of updates and the size of datasets involved. Organizations must evaluate their existing infrastructure, specifically whether they have access to SQL Server Analysis Services (SSAS), Azure Analysis Services, or Power BI Service Datasets, as Live Connection is primarily utilized for these sources. The choice of connection type can significantly influence efficiency and the overall effectiveness of business intelligence initiatives.
For example, a case study titled ‘Performance Issue with OPTIMIZE Command for Historical Data Migration Using Liquid Clustering’ highlights challenges that can arise, underscoring the importance of careful selection. Our 3-Day Power BI Sprint can help streamline this process, allowing you to create professional, functional reports quickly, ultimately enabling better decision-making. Additionally, you can use the report created during the Sprint as a template for future projects, ensuring a professional design from the start.
Implementing a pilot environment allows organizations to test both Power BI Direct Query vs Live Connection, offering critical insights into performance and usability tailored to unique operational needs. Moreover, scalability is a crucial consideration; as data demands evolve, the selected connection type should accommodate growth without necessitating major rework. By adhering to these best practices, organizations can refine their BI implementations, enhancing operational efficiency and empowering teams to leverage insights effectively.
As we collaborate in this field, it’s vital to share suggestions and experiences. Together, we can refine these do’s and don’ts for Power BI, ensuring that as a community, we all continue learning and improving our reporting practices!
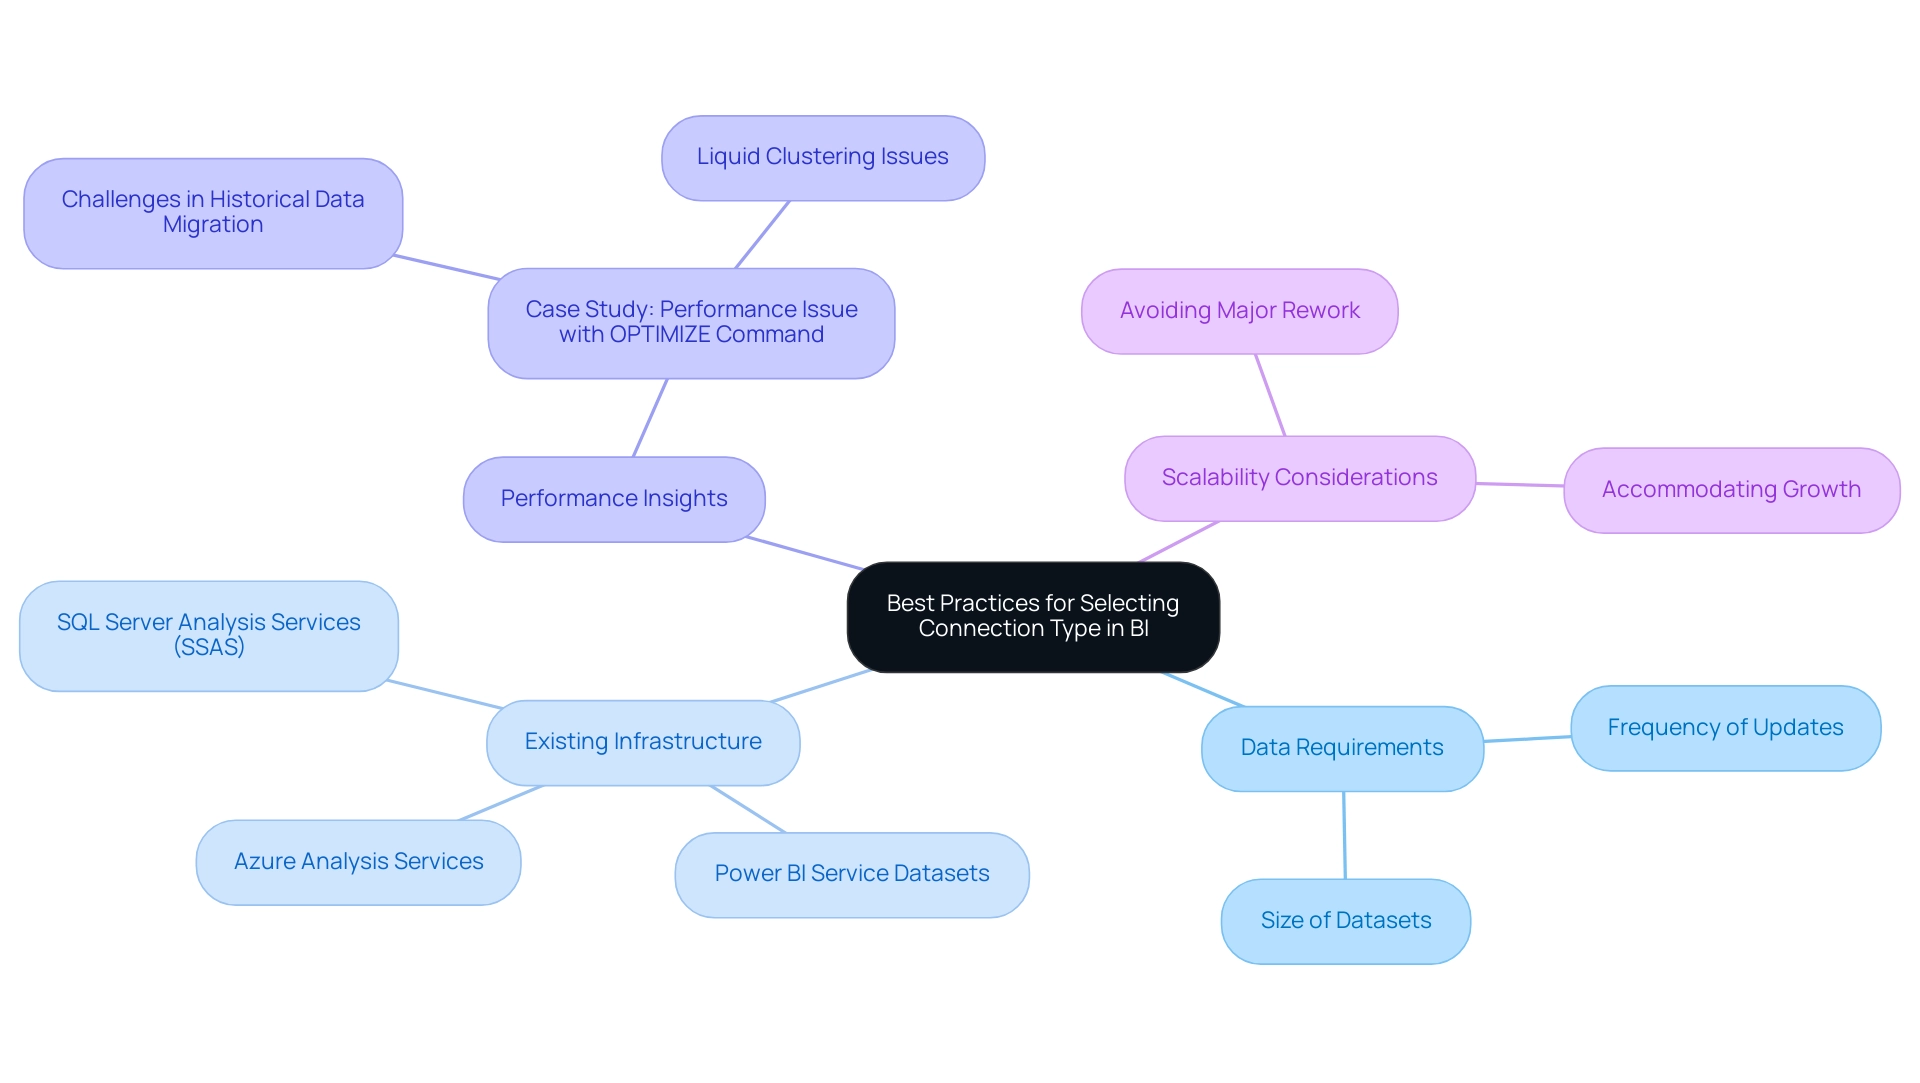
Conclusion
Power BI’s connection types, Direct Query and Live Connection, each offer unique advantages that can significantly influence an organization’s data analytics capabilities.
-
Direct Query provides real-time access to data while allowing organizations to manage large datasets efficiently, making it particularly valuable for dynamic environments. However, it also presents challenges such as potential performance issues and query load management.
-
Live Connection excels in processing power and speed, especially for complex data models, but comes with limitations regarding data transformations and infrastructure requirements.
Understanding the nuances of these connection types is crucial for organizations aiming to optimize their reporting capabilities. By evaluating specific needs, such as data update frequency and size, companies can make informed decisions that enhance operational efficiency and decision-making.
Implementing best practices—like optimizing data models, leveraging RPA, and training teams on effective data management—can further mitigate risks and improve performance.
In a rapidly evolving data landscape, the ability to harness the right connection type in Power BI not only empowers organizations to extract actionable insights but also positions them for sustained growth and innovation. By focusing on strategic implementation and continuous improvement, businesses can navigate the complexities of data analytics with confidence, ultimately driving better outcomes and maintaining a competitive edge.
Overview:
The article addresses the common issue of the Power BI data view not showing, identifying several key reasons such as source connection issues, modeling errors, software bugs, permissions restrictions, and the need for regular updates. It supports this by providing a systematic troubleshooting approach and best practices to maintain data view functionality, emphasizing that understanding and addressing these challenges can significantly enhance the user experience and the reliability of insights derived from Power BI.
Introduction
In the dynamic landscape of data analytics, Power BI stands out as a powerful tool, yet many users encounter obstacles that hinder their ability to fully leverage its capabilities. Missing data views can lead to frustration and inefficiencies, detracting from the very insights organizations seek to drive decision-making.
From connection issues and modeling errors to software bugs and permission restrictions, understanding the root causes of these challenges is essential for enhancing operational efficiency. By exploring practical troubleshooting steps and best practices, users can not only resolve existing visibility issues but also cultivate a data environment that promotes clarity and actionable insights.
This article delves into common pitfalls and effective strategies to empower users in navigating Power BI’s complexities and maximizing its potential for informed decision-making.
Common Reasons for Missing Data View in Power BI
The View in Power BI may sometimes be elusive due to issues like ‘power bi data view not showing’, which disrupt its visibility, lead to time-consuming report creation, and ultimately detract from actionable insights. With over 4,531 users online, it’s clear that many face similar challenges. Here are the main culprits:
- Source Connection Issues: A broken or misconfigured connection can result in the power bi data view not showing, which severely impacts your analytics capabilities.
- Modeling Errors: Incorrect relationships, missing columns, or improperly configured tables can result in the power bi data view not showing complete information presentation, which complicates the reporting process.
- Software Bugs: Occasionally, glitches or bugs may surface in BI, resulting in the power bi data view not showing and causing discrepancies in reports.
- Permissions Issues: User permissions may restrict access to specific views, which could result in the power bi data view not showing and further complicating your analysis.
- Updates and Compatibility: Keeping BI updated is crucial, as updates often address known issues and enhance performance.
A practical example of addressing absent information issues can be seen in the case study titled ‘Visualizing Missing Values’, where a user visualized the number of missing values across all features in a dataset by unpivoting the table in Query Editor and creating measures to calculate blank and total values, which were then displayed in a Stacked Column Chart. Additionally, software tools like R and Python have built-in functions to manage missing information effectively, offering further solutions to enhance your handling of it. As Alexis Olson, a seasoned Super User, suggests,
I’d recommend checking the View tab to see if the statistics you can show with those options are sufficient.
By recognizing and addressing these challenges, especially the need for clear, actionable guidance in your reports, you can significantly enhance your experience and utilize BI’s strong features to drive clarity and actionable insights. Moreover, implementing a robust governance strategy is essential to ensure consistency and trustworthiness, enabling stakeholders to make informed decisions based on reliable information.
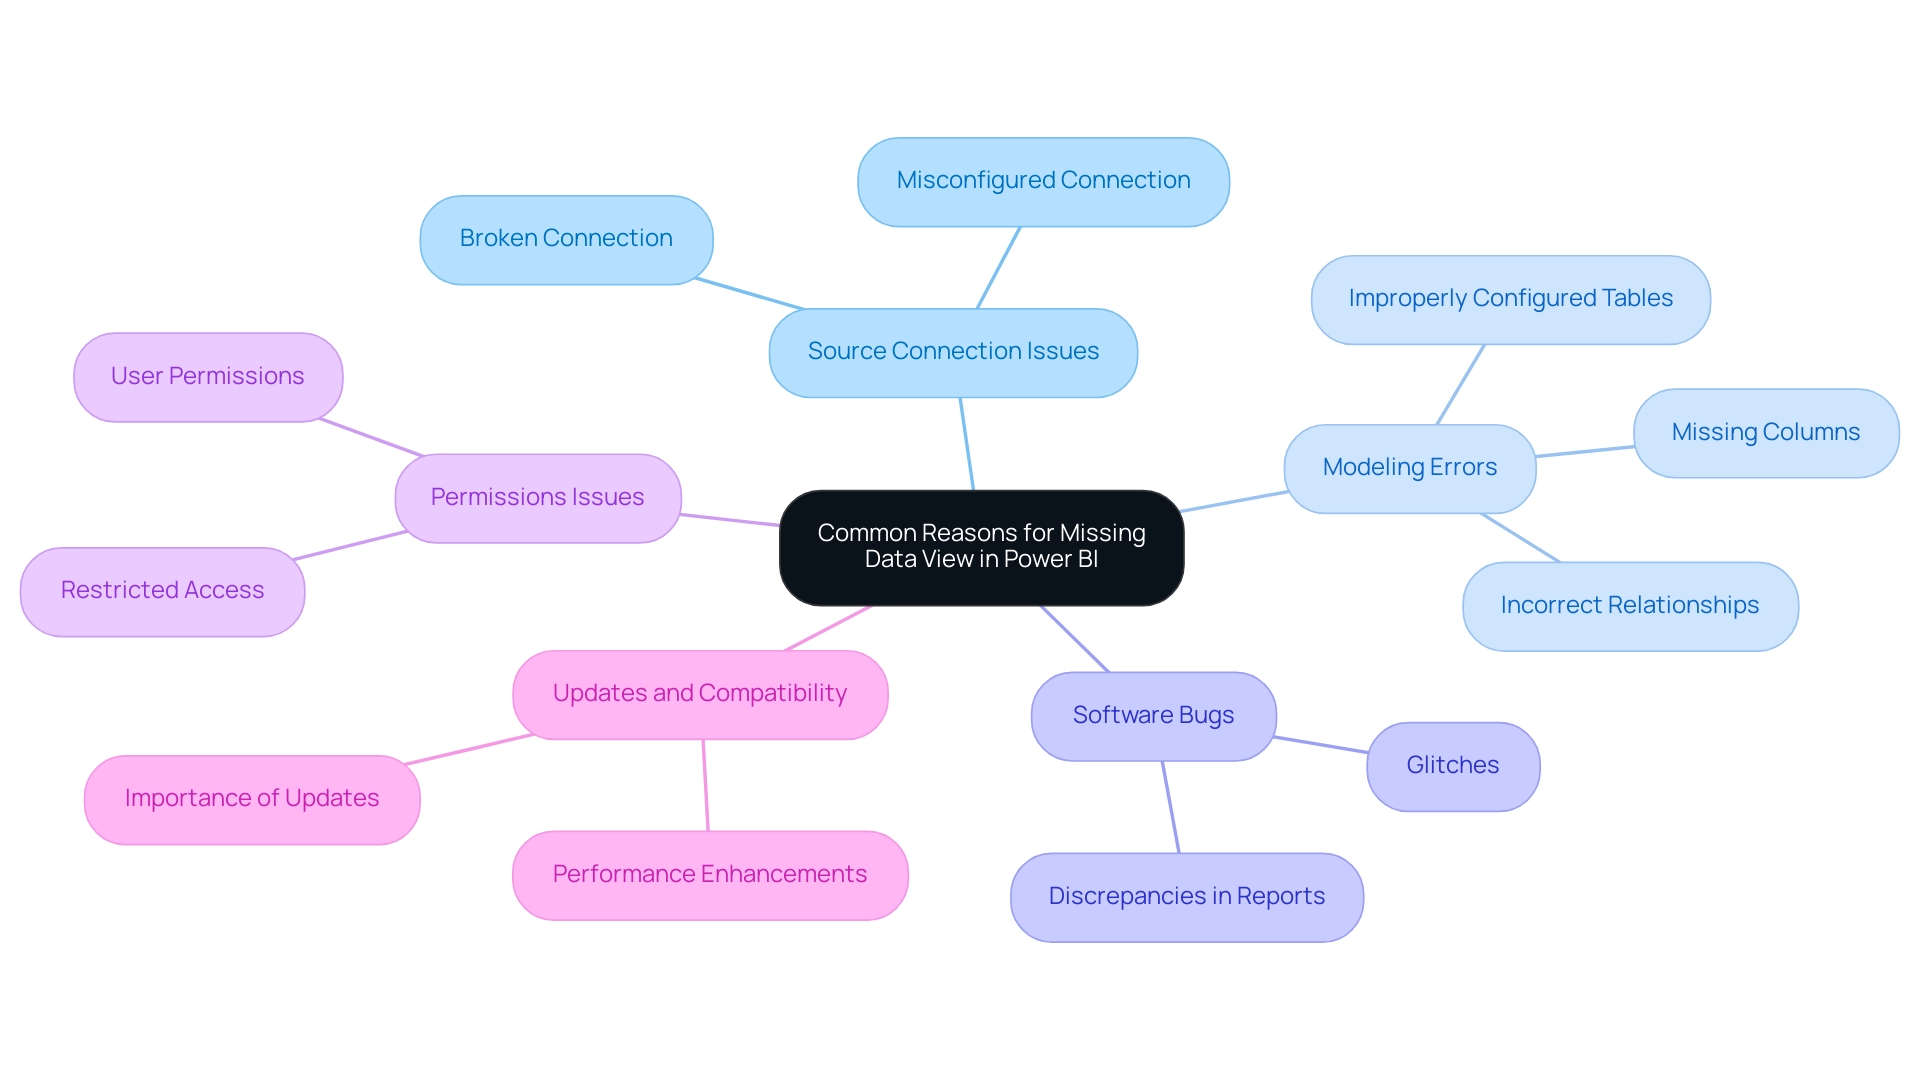
Step-by-Step Troubleshooting for Data View Issues
To effectively troubleshoot View issues in Power BI and enhance your operational efficiency, adhere to the following systematic approach:
- Check Information Source Connection: Begin by navigating to the ‘Home’ tab and selecting ‘Transform Information’ to verify your connection to the information source. This initial step is crucial for ensuring information visibility and overcoming common report creation challenges.
- Examine Your Data Model: Switch to the ‘Model’ view to inspect for any errors in table relationships. Recognizing inconsistencies at this stage can prevent further complications and assist in resolving governance issues, which are essential for maintaining integrity across reports.
- Verify Permissions: Confirm that you have the necessary permissions to access and view the information. The Power BI data view not showing is often a result of a lack of appropriate permissions, which can cause visibility issues and lead to confusion and mistrust in your reports.
- Update BI: Regular updates can significantly enhance functionality. Go to the ‘File’ menu and check for updates to ensure you are utilizing the latest features and fixes, which can support your data-driven insights.
- Restart BI: A simple restart can often resolve rendering issues, especially when Power BI data view is not showing, and refresh your session, providing a quick fix for minor glitches that might hinder your analysis. Check for software bugs by engaging with the BI support forums to find out if others are encountering the Power BI data view not showing issue. This community resource can provide insights into known bugs and available fixes, reinforcing the value of collaborative problem-solving.
Additionally, recent collaborations, such as Tikkurila’s project with Multishoring’s consultants for an Integration Platform Migration, emphasize the critical role of expert assistance in addressing complex visibility issues. As Grant Gamble, Owner of G Com Solutions, aptly states, ‘I run a company called G Com Solutions, specializing in BI training and consultancy, helping businesses master data analytics.’ This highlights the importance of professional support, particularly when internal resources may be limited.
Lastly, if specific devices or browsers are flagged for slow performance, consider submitting a support ticket through the BI support page to resolve these issues promptly and enhance your operational capabilities. Incorporating a governance strategy can further enhance your reporting accuracy and trustworthiness, ensuring that insights drawn from BI dashboards are actionable and dependable.
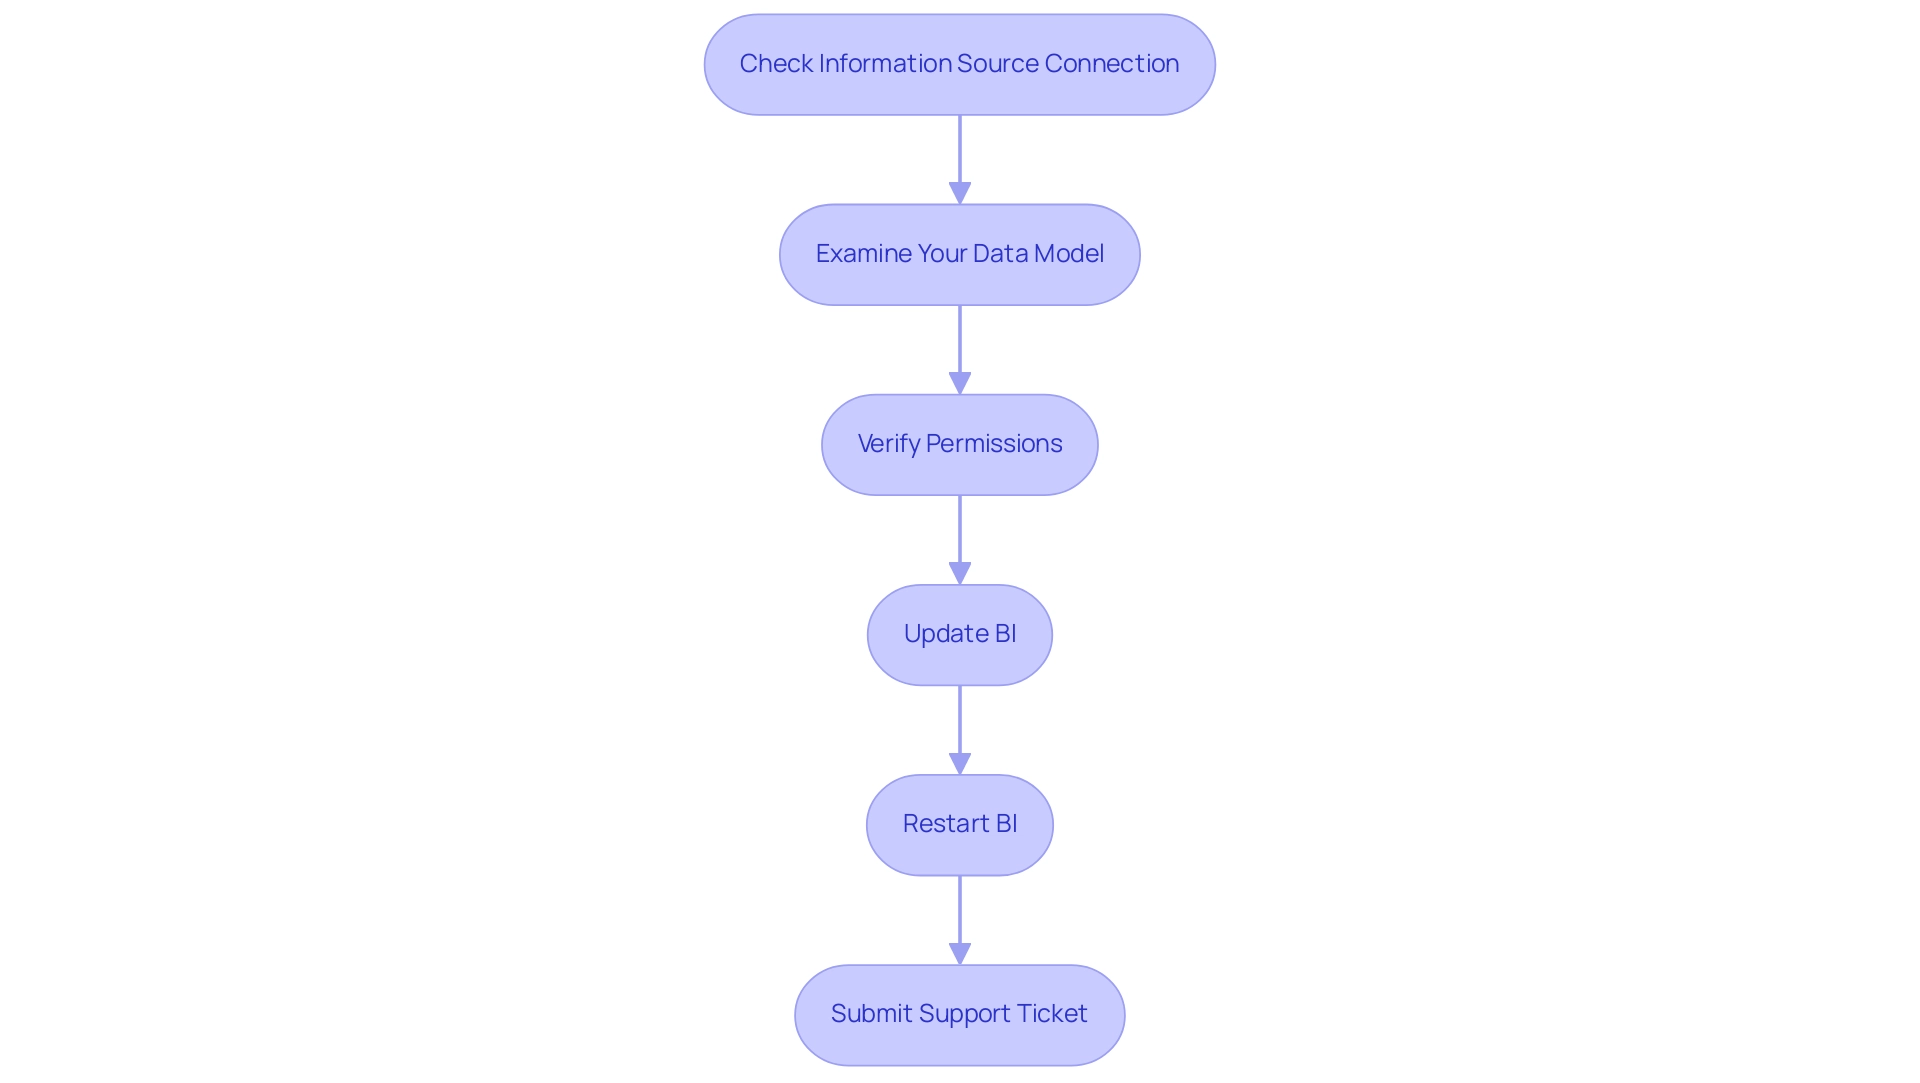
Identifying Specific Scenarios Leading to Data View Problems
In Power BI, several specific scenarios can result in a power bi data view not showing correctly, which impacts overall efficiency and decision-making. Understanding these challenges is crucial for optimization. Here are the key issues to consider:
-
Import Errors: Incomplete or failed imports can lead to unexpected results in the View. Such errors are not unusual; recent reports suggest that import errors impact a significant number of users, highlighting the importance of thorough validation during the import process.
-
Misconfigured Relationships: Incorrectly set relationships between tables can drastically affect information visibility. As highlighted by community champion themistoklis, ‘for the field heading the type of the field is text (‘ABC’).’ To convert it to numeric, please do the following steps:
- Right-click on the column –> Replace Values
- Leave ‘Value to find’ box empty and in ‘Replace With’ box add a numeric value that you want (zero for example)
- Click OK then
- Right-click on column again
- Change Type –> Whole number
-
Done.
Ensuring the information types align correctly is vital; misconfigurations can lead to isolation, making it impossible to derive insights from related datasets. -
Filters Applied: Filters implemented at the report level can inadvertently limit visibility of information. If the filters are not appropriately configured, it may result in the power bi data view not showing the complete range of information, leading to confusion and inefficiency.
-
Single Table Selection: Single Table Selection may lead to misunderstanding of the overall information model if the power bi data view is not showing while only a single table is selected. It is essential to ensure that the entire model is being viewed to accurately assess relationships and visibility.
-
Using Unsupported Information Types: Compatibility of types is crucial for display integrity in BI. For instance, converting a text field to a numeric type involves specific steps:
- Right-click the column
- Select ‘Replace Values’ (leaving the ‘Value to find’ box empty)
- Input the desired numeric value in ‘Replace With’
-
Finally, change the type to ‘Whole number’ to complete the conversion.
This process helps avoid potential issues, such as the power bi data view not showing. -
Challenges in Utilizing Information: Many users invest more time in constructing reports than in utilizing data from Power BI dashboards. This time-consuming report creation process often results in inconsistencies across reports due to a lack of governance strategy. Stakeholders may receive reports filled with numbers and graphs yet lack clear, actionable guidance, leaving them with data but without direction. Overcoming these challenges is crucial; implementing Robotic Process Automation (RPA) can streamline workflows, allowing teams to focus on analysis rather than report creation. Additionally, tailored AI solutions can help identify and present relevant insights, enhancing decision-making.
-
Real-World Example: A new user sought guidance on how to use Query within BI, expressing a need for tutorials to better understand the tool. They received suggestions for resources to learn Query and enhance their skills in BI, illustrating how targeted learning can address visibility challenges.
By tackling these situations and obstacles in utilizing information, you can improve data visibility in BI, ensuring that your reports display precise and thorough information. Leveraging solutions such as Robotic Process Automation (RPA) can further streamline workflows, while tailored AI solutions can help cut through the noise to provide targeted insights that align with your specific business goals. Additionally, utilizing free resources, such as the Ultimate Beginners Guide to BI and the 60-page DAX reference guide, can provide further assistance in troubleshooting and optimizing your BI experience.
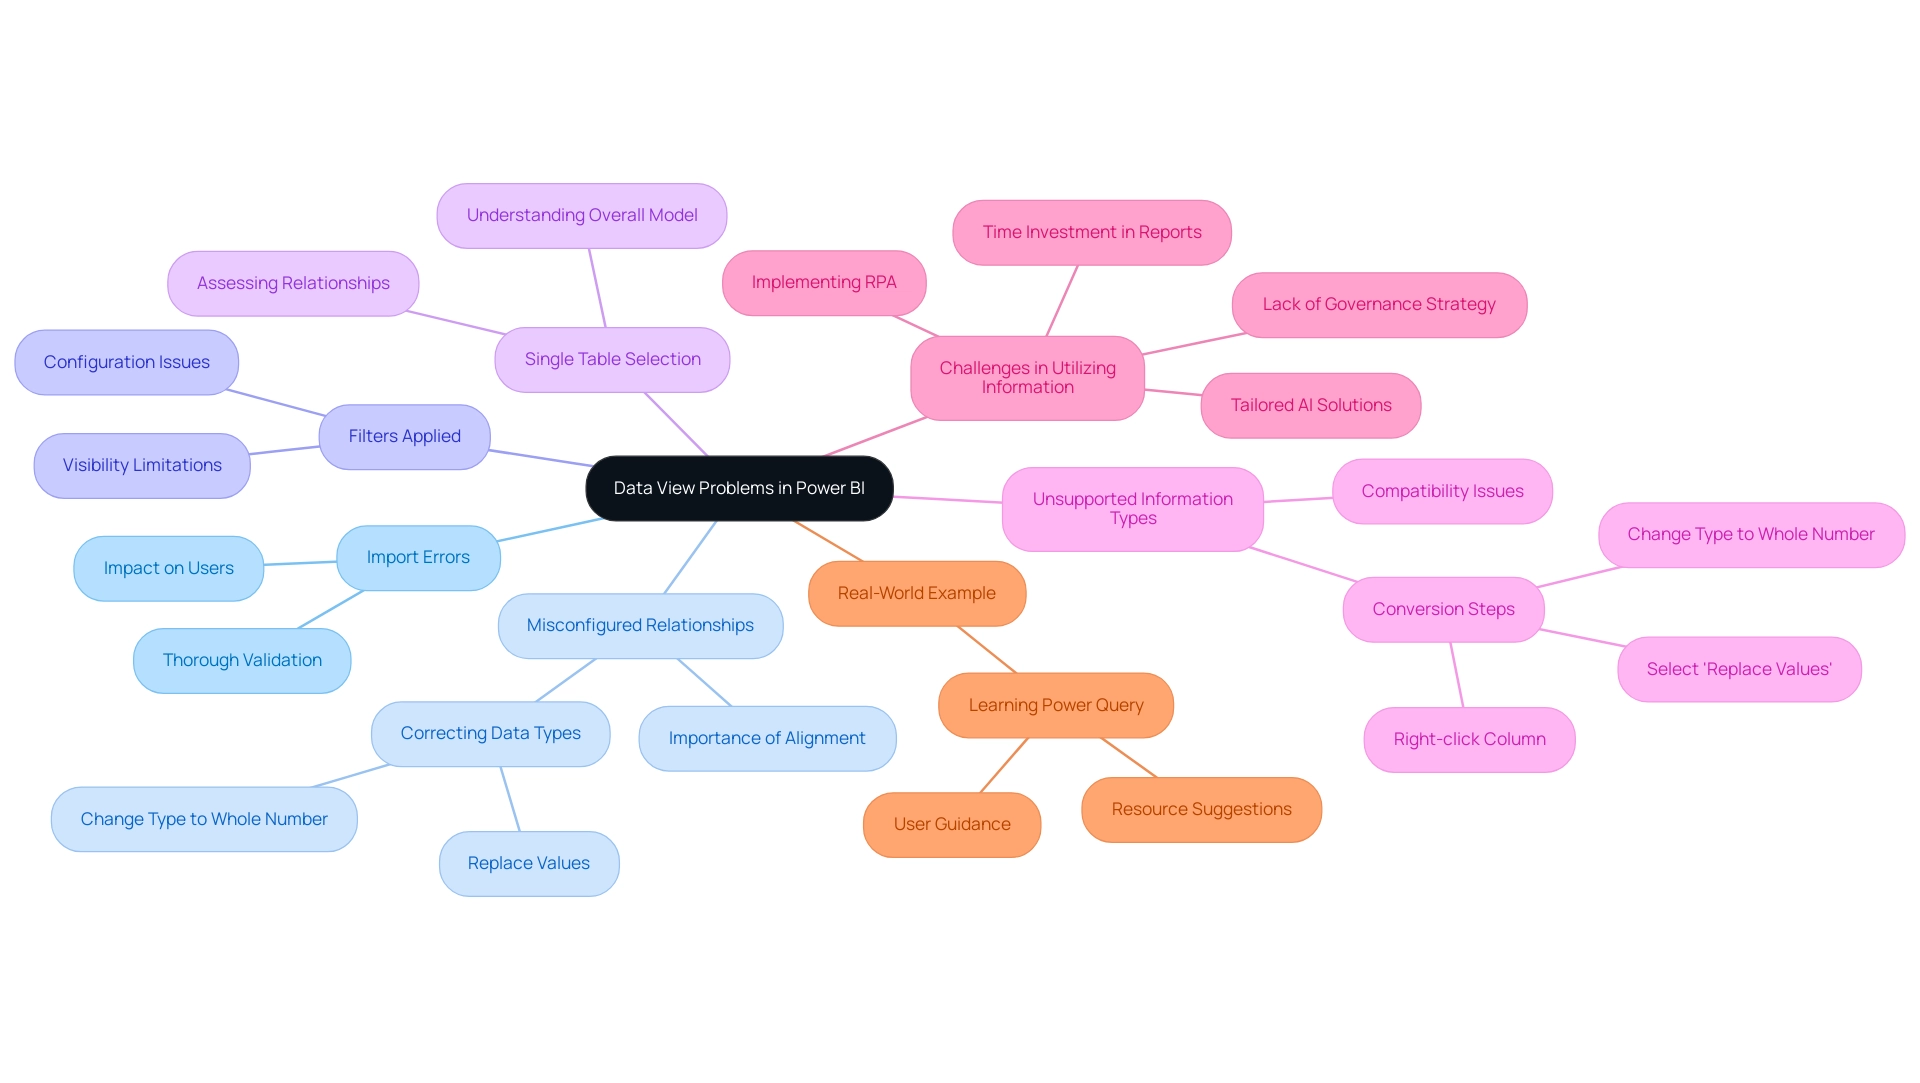
Best Practices for Maintaining Data View Functionality
To effectively maintain the functionality of your Data View in Power BI and leverage the full potential of Business Intelligence, consider implementing the following best practices:
-
Regular Updates: Keeping Power BI updated is essential in preventing bugs and compatibility issues, which can hinder performance. Regular updates not only enhance functionality but also introduce vital bug fixes that improve user experience and ensure that your observations remain relevant and actionable.
-
Information Validation: Make it a priority to regularly verify your information sources. Ensuring that your information is accurate and complete is crucial for reliable insights. This process can significantly reduce discrepancies that arise during analysis, thereby addressing one of the common challenges in Power BI when the data view is not showing due to data inconsistencies.
-
Document Your Model: Maintain comprehensive documentation of your information model and its relationships. This practice simplifies troubleshooting and helps new team members understand the existing setup, which is vital for operational efficiency and effective use of Business Intelligence tools.
-
Limit Filters: Exercise caution with filters; using them sparingly helps to avoid unnecessarily restricting visibility. Thoughtful application of filters ensures that all relevant information is accessible for analysis, which is essential for creating meaningful reports without the time-consuming process of re-creating them due to restricted views.
-
Training and Resources: Engage regularly with community forums and utilize training resources to stay up to date on best practices and the latest updates in BI. Empowering your team with knowledge can significantly enhance operational efficiency and help overcome challenges related to time-consuming report creation and lack of actionable guidance.
-
Backup and Restore Procedures: Implement robust backup and restore protocols for essential BI assets to protect against loss. This practice is essential for ensuring continuity during unexpected issues, reinforcing the importance of operational preparedness in your business intelligence strategy.
-
Leverage RPA Tools: Integrating RPA solutions like EMMA RPA and Power Automate can streamline information management processes, reducing manual effort and minimizing errors. These tools can automate routine tasks related to validation and report generation, allowing your team to concentrate on more strategic initiatives.
Brahmareddy emphasizes the impact of these strategies, stating,
This not only reduced the information size but also made the subsequent analysis much quicker.
Additionally, the case study titled “Regular Maintenance for Long-Term Performance” highlights the importance of maintaining a data environment through the routine use of the OPTIMIZE command on Delta Tables and the VACUUM command to clean up old files. These strategies resulted in considerably quicker loading times for BI reports and a smoother overall experience, demonstrating how effective operational practices can lead to enhanced business growth through actionable insights.
Moreover, with 53,443 views on the subject, it is clear that preserving BI View functionality is of significant interest and importance.
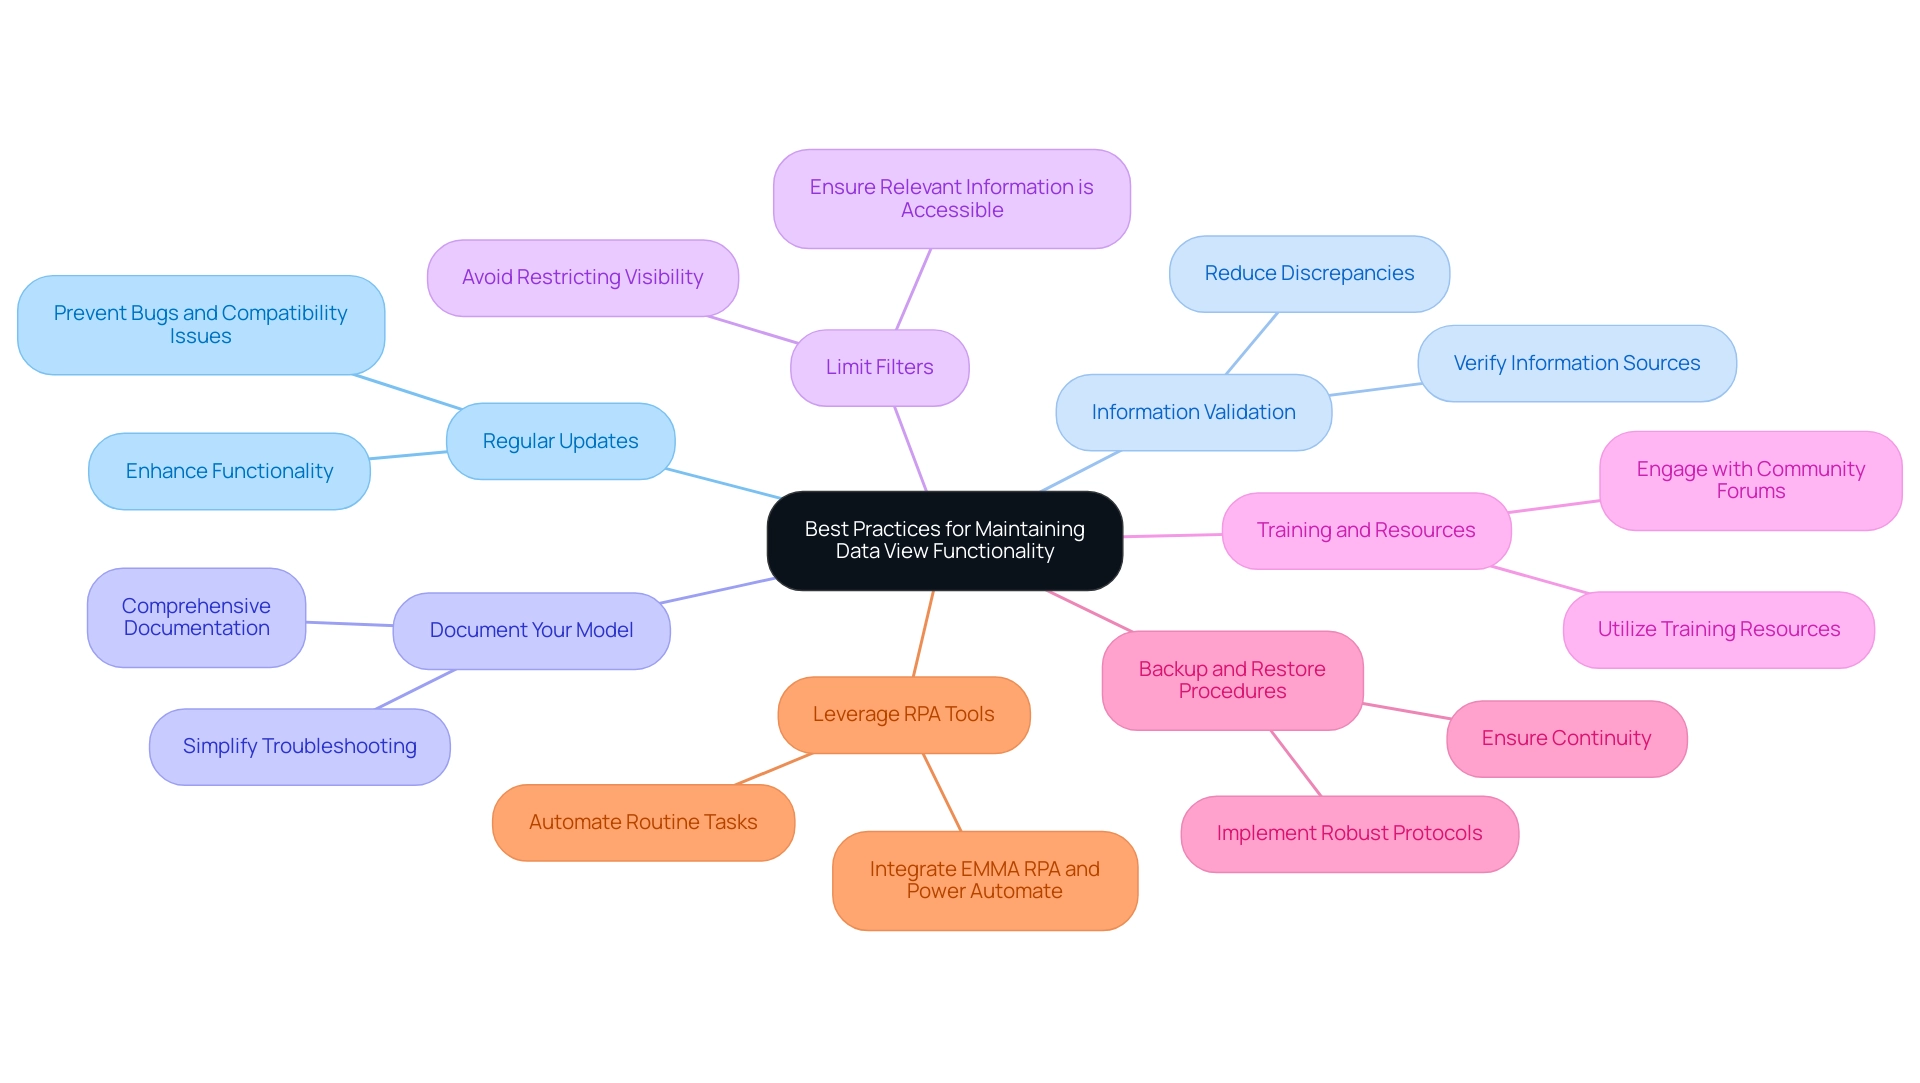
Understanding Data Relationships and Their Impact on Data View
Information relationships are essential to how insights are represented in BI tools, directly affecting visibility and accessibility. However, many organizations encounter difficulties in utilizing information from Power BI dashboards, such as the power bi data view not showing, time-consuming report creation, inconsistencies in information, and a lack of actionable guidance. Here are some crucial perspectives to enhance your understanding and management of these relationships, empowering you to navigate these challenges effectively:
-
Types of Relationships: Comprehending the various types of relationships—one-to-one, one-to-many, and many-to-many—is essential, as they greatly influence how information can be accessed and analyzed. In non-star schema models, for example, Purchases often have a Many-to-1 relationship with Product, while Product maintains a 1-to-Many relationship with Sales. This hierarchy can shape the narrative you aim to convey, ensuring that you focus on insights rather than merely report construction.
-
Relationship Directionality: Monitoring the direction in which relationships flow is essential; incorrect settings can lead to power bi data view not showing the correct information. Properly configured relationships will facilitate clearer and more effective analysis, enabling stakeholders to gain valuable insights.
-
Managing Relationships: Regularly reviewing and refining your relationships is vital for maintaining an efficient information model. A streamlined information structure ensures that insights can be drawn promptly and accurately, mitigating confusion and mistrust in the information presented. Implementing a governance strategy can further enhance this process by establishing clear protocols for information management. However, be cautious with the ‘Update or delete relationships when refreshing information’ option, as it can pose risks if row-level security relies on those relationships.
-
Impact of Relationship Changes: Adjustments made to relationships may immediately alter information visibility. It’s essential to thoroughly test your model after any changes to ensure that the desired information remains accessible and accurately represented. For instance, the limitations of the Excel Information Model, such as the inability to create relationships with composite keys, highlight the challenges users face and the necessity for creative solutions like utilizing DAX functions for many-to-many relationships.
-
Use of Active Relationships: During analysis, confirm that you are utilizing the appropriate active relationships. Inactive relationships do not contribute to the power bi data view not showing, potentially leading to incomplete analyses and skewed insights.
By mastering these aspects of data relationships, you can enhance data visibility in Power BI, ultimately leading to more informed decision-making and operational efficiency. In an era where data-driven analysis is paramount for growth, leveraging Business Intelligence and RPA solutions can further transform how you approach operational challenges. This approach not only addresses the immediate issues but also provides a clear path forward for stakeholders to take actionable steps based on the insights gained.
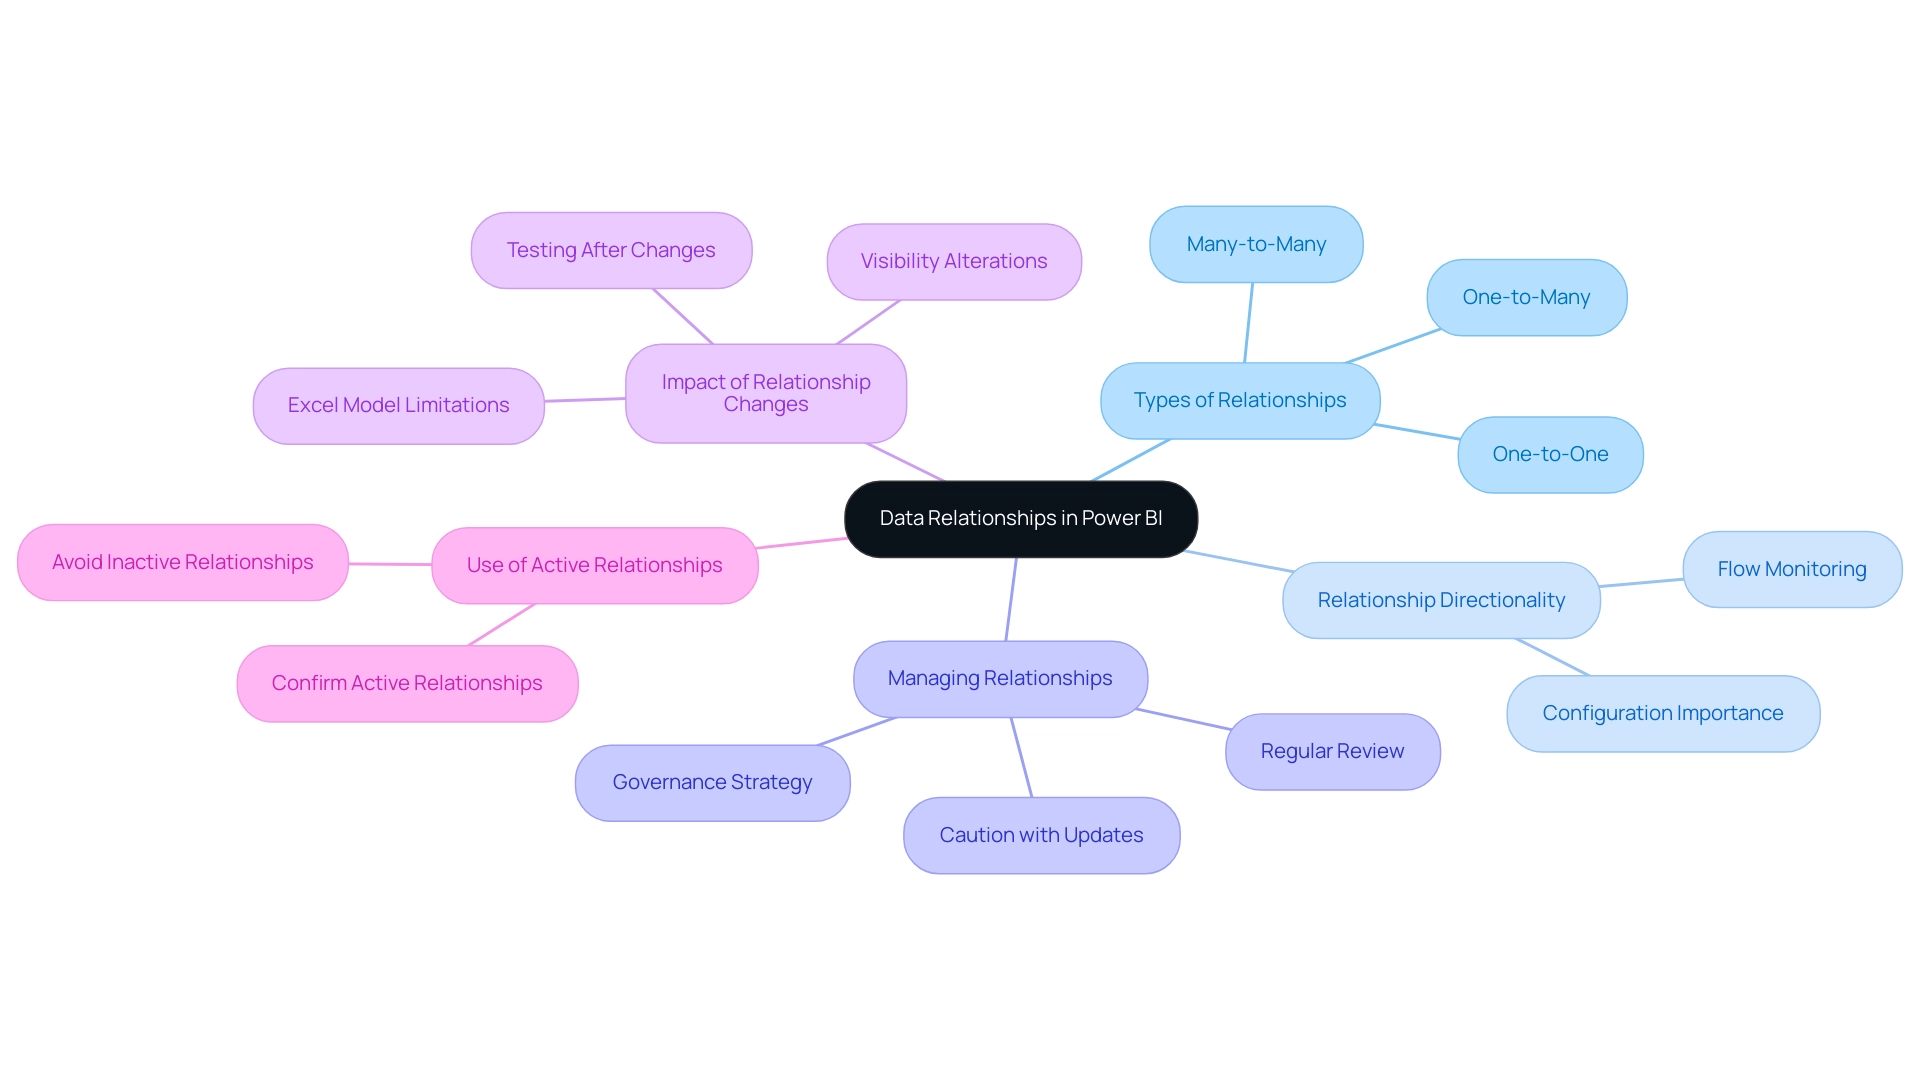
Conclusion
Missing data views in Power BI can significantly hinder an organization’s ability to derive insights and make informed decisions. By understanding the common reasons behind these visibility issues—such as connection errors, modeling mistakes, and permission restrictions—users can take proactive steps to address them. The systematic troubleshooting steps outlined provide a clear pathway for users to resolve issues effectively, ensuring that their data remains accessible and actionable.
Implementing best practices, such as regular updates, thorough data validation, and maintaining comprehensive documentation, can further enhance the functionality of Power BI’s Data View. By fostering a culture of continuous learning and leveraging community resources, teams can navigate the complexities of data management more efficiently. Additionally, recognizing the importance of data relationships and their configurations is essential for maximizing the potential of Power BI.
Ultimately, the journey towards a fully functional Data View in Power BI is one of empowerment and strategic enhancement. By addressing the obstacles and employing effective strategies, organizations can cultivate a data-rich environment that not only improves operational efficiency but also drives meaningful insights to inform their decision-making processes. Embracing these practices transforms challenges into opportunities, paving the way for a data-driven future.
