Introduction
In the realm of data analysis, Power BI stands out as a powerful tool that empowers organizations to transform raw data into actionable insights. At the heart of this transformation lies the effective use of sample data, which not only accelerates the learning curve for new users but also enhances the quality of reports and dashboards.
By leveraging pre-defined datasets, businesses can bypass the hurdles of data collection and inconsistencies, allowing them to focus on what truly matters—extracting meaningful trends and insights that drive strategic decisions.
As organizations increasingly recognize the value of data-driven approaches, understanding the best practices for utilizing sample data becomes essential. This article delves into the myriad benefits of sample data in Power BI, offering practical strategies to optimize its use and ultimately elevate decision-making processes across various sectors.
Understanding Sample Data in Power BI: A Key Component for Effective Analysis
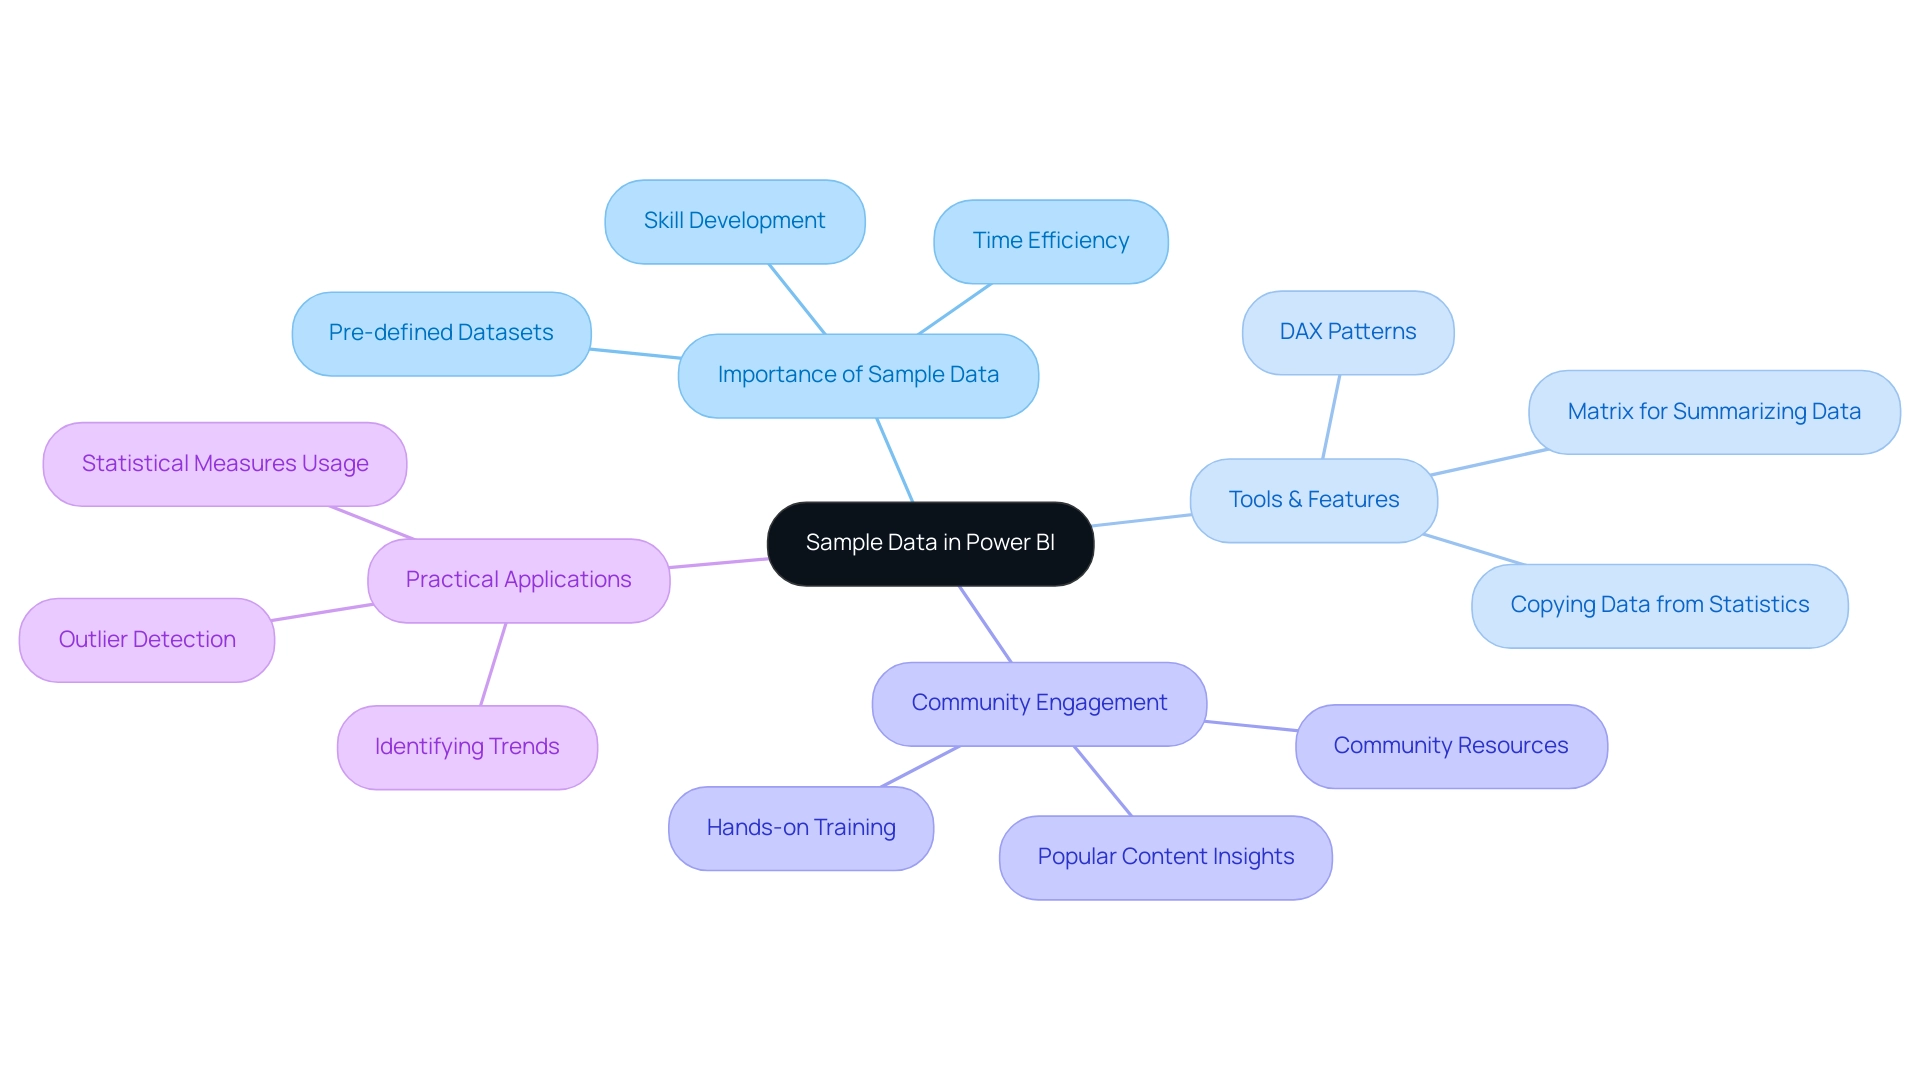
In Power BI, sample information serves as a vital resource for users, especially as they navigate the complexities of information management and insights generation. By utilizing pre-defined datasets, newcomers can engage with the software’s features without the delay of collecting their own information. This prompt access not only promotes skillfulness in information manipulation and visualization but also tackles the prevalent issues of time-consuming document creation and information inconsistencies, often worsened by an absence of governance strategy.
As individuals learn to create insightful reports using example information, they are better prepared to extract clear, actionable guidance from their analyses, addressing the common problem of reports filled with figures yet lacking clarity.
Recent improvements to BI tools, such as the capability to copy information from column statistics and the DAX Patterns repository for calculating statistical measures, further empower users. These tools streamline interactions with datasets and enhance analytical capabilities, crucial for directors focused on operational efficiency. As Greg Deckler emphasizes, community engagement is key to effective learning, and the Power BI community’s resources, including hands-on training sessions, exemplify this approach.
Notably, a case study demonstrating the use of basic statistical measures illustrates how users can summarize information without extensive technical knowledge, enabling them to identify trends, such as outliers among car sales over 180 thousand Reais. This practical usefulness of example information not only clarifies intricate ideas but also proves vital for making informed choices in real-world situations.
Use Cases of Sample Data: Enhancing Power BI Dashboards and Reports
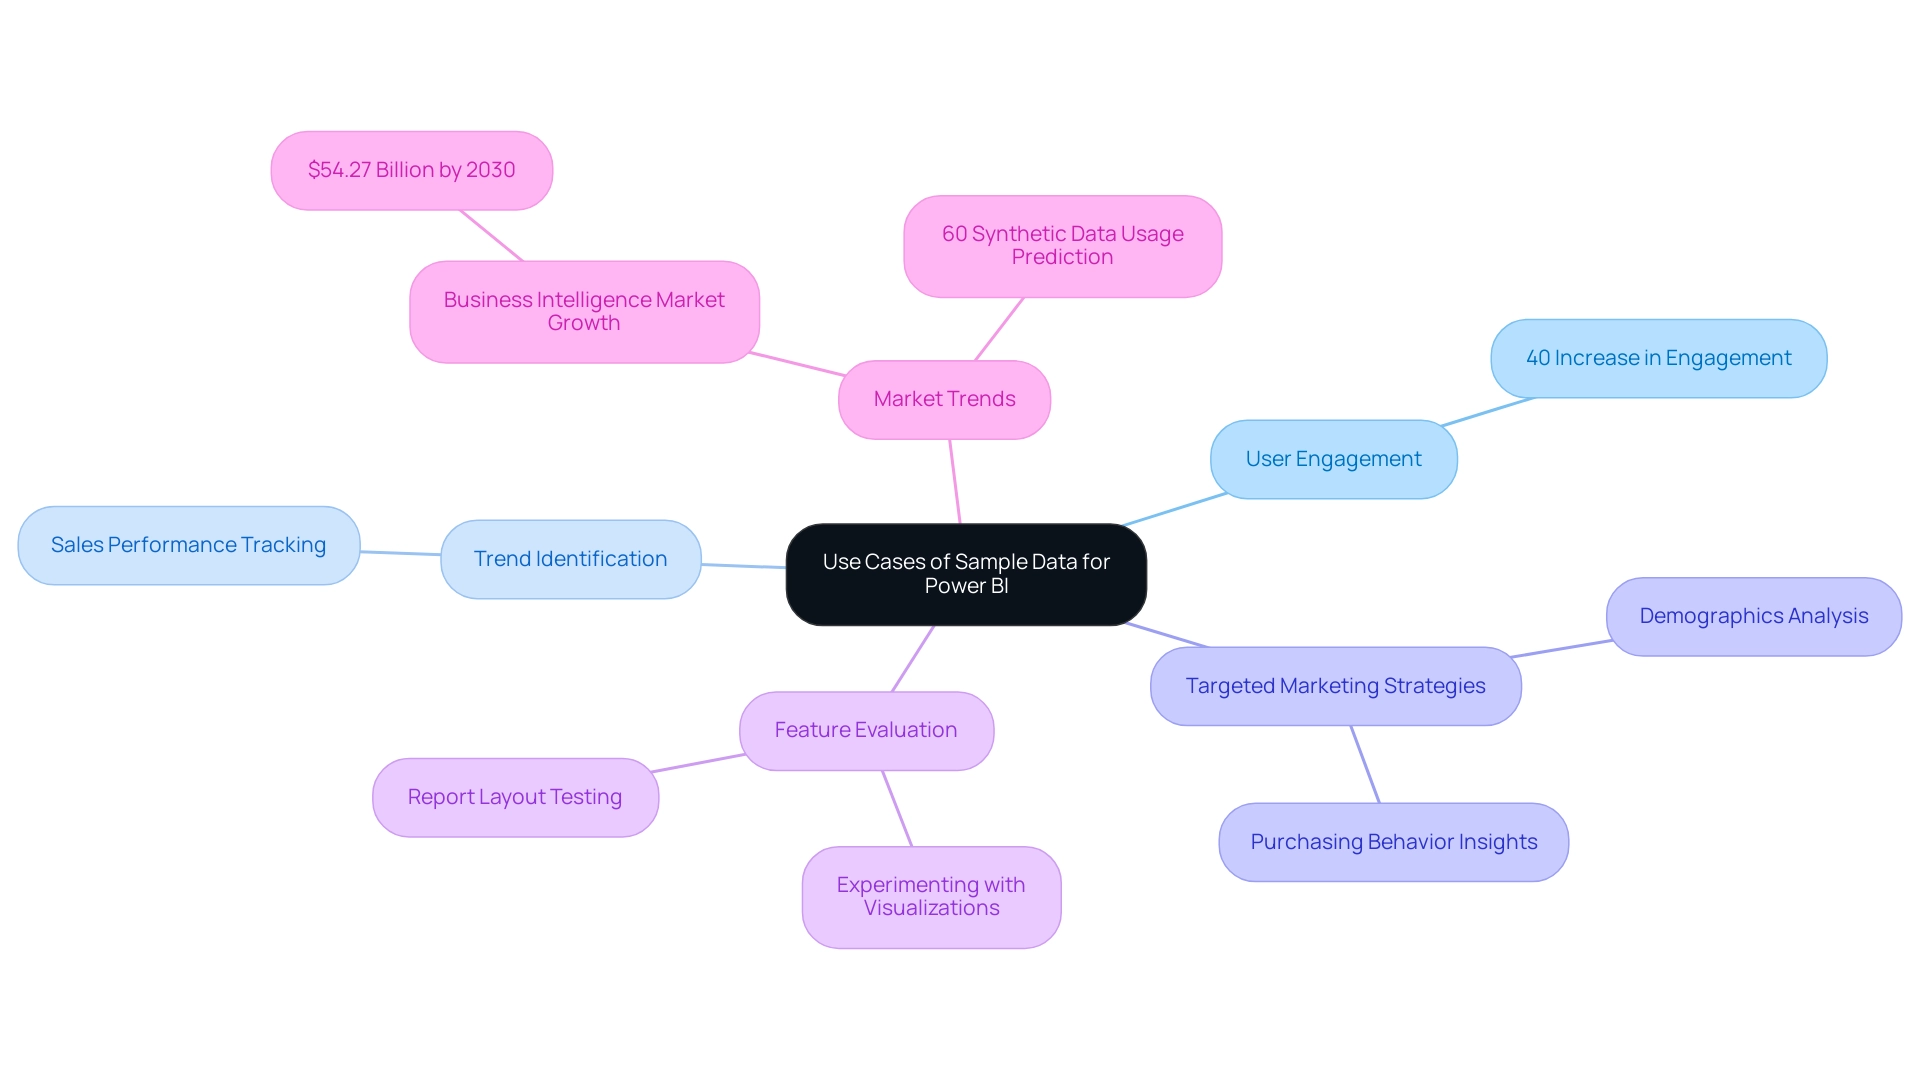
Utilizing sample data for Power BI provides numerous opportunities to enhance dashboards and reports, significantly boosting analytical capabilities. For example, statistics indicate that dashboards employing sample data for Power BI can enhance user engagement by as much as 40%, enabling organizations to generate dynamic visualizations that track sales performance over time using test sales figures. This approach enables stakeholders to identify trends and make informed, strategic decisions.
Furthermore, utilizing customer information enables companies to examine demographics and purchasing behaviors, aiding the creation of targeted marketing strategies. Another valuable use of sample data for Power BI is in evaluating new features, where users can experiment with various visualizations and report layouts without jeopardizing live information integrity. This capability not only fosters innovation but also accelerates the development of business intelligence solutions.
The recent case study of Databricks, which filed for its initial public offering (IPO), highlights the significance of innovative information management and analytics in a competitive landscape. With the business intelligence market expected to rise to $54.27 billion by 2030, utilizing sample data for Power BI becomes increasingly essential for organizations striving to stay competitive. As highlighted by industry experts, ‘The business intelligence market is evolving rapidly, and organizations must adapt to stay ahead.’
Furthermore, Gartner predicts that by the end of the year, 60% of the information utilized by AI and analytics solutions will be synthetic, making effective information management more critical than ever. By harnessing the strength of sample data for Power BI, organizations can effectively streamline their BI processes, ensuring they deliver insights that truly drive strategic initiatives and optimize performance. Additionally, our 3-Day BI Sprint can help you quickly create professionally designed reports, while the General Management App provides comprehensive management and smart reviews.
To explore how these features can benefit your organization, book a free consultation today.
Best Practices for Utilizing Sample Data in Power BI
To maximize the utility of sample information in Power BI and leverage the power of Business Intelligence, the following best practices are essential:
-
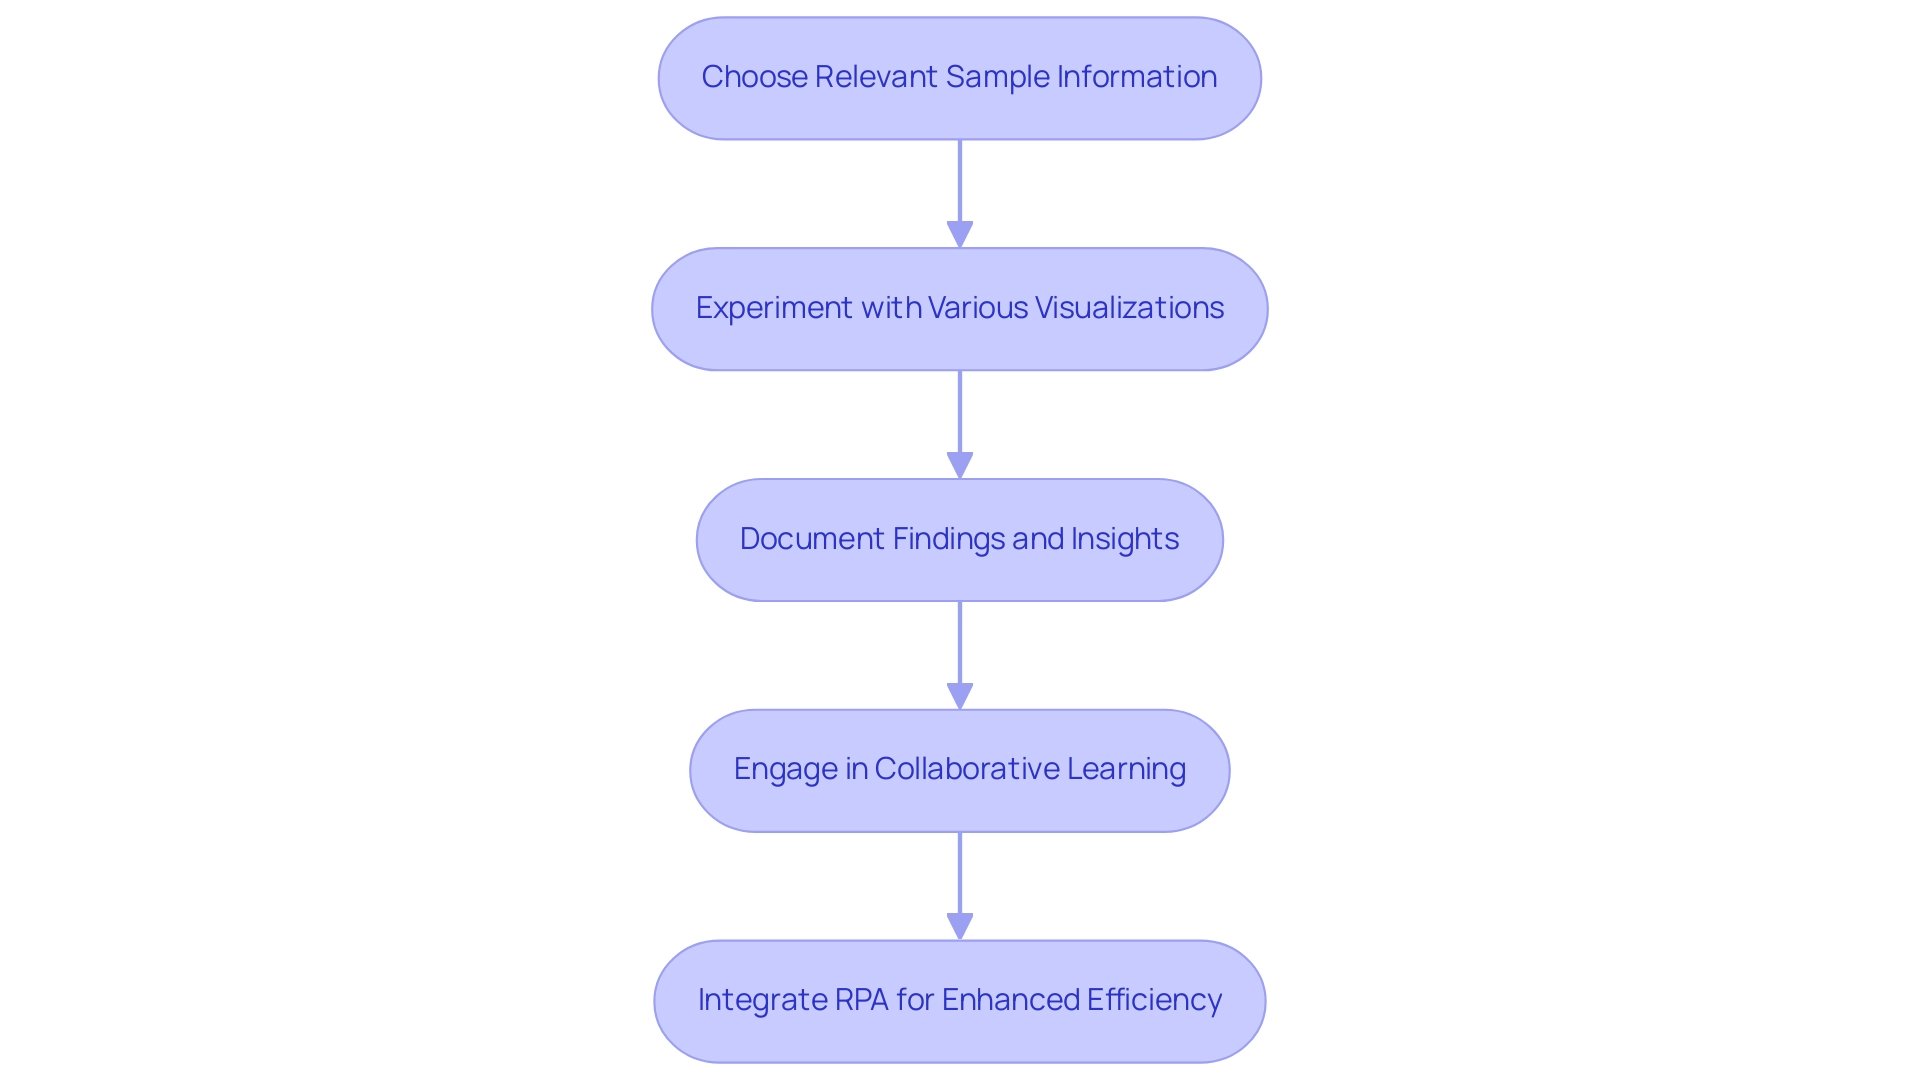
Choose Relevant Sample Information: Opt for datasets that closely mirror upcoming production information. This alignment facilitates a clearer understanding of final document functionality and aesthetics, paving the way for more effective operational insights.
-
Experiment with Various Visualizations: Utilize example information to test a range of visualization methods. This experimentation can unveil the most impactful methods for presenting insights effectively, addressing the common challenge of report creation that can be time-consuming.
-
Document Findings and Insights: As you explore representative information, meticulously record observations regarding successful strategies and pitfalls. Such records will serve as invaluable references during the analysis of actual information and can help mitigate inconsistencies.
-
Engage in Collaborative Learning: Foster a collaborative environment by sharing insights and findings with colleagues. This exchange fosters a culture of learning and ongoing enhancement in utilizing sample information and promotes growth through informed decision-making.
-
Integrate RPA for Enhanced Efficiency: Consider how Robotic Process Automation (RPA) can complement these best practices by automating repetitive tasks, thus improving overall efficiency in information management and report generation.
By adhering to these practices, users can significantly enhance their proficiency in Power BI, leading to the creation of dashboards that not only present insights effectively but also drive informed decision-making. A case study titled ‘Building the Dashboard’ underscores this approach, showing that visualizing calculated measures—such as mean, median, mode, and standard deviation—using a column chart can illuminate information distribution and outliers, thereby improving analytical clarity. For instance, cars sold for over 180 thousand Reais indicate the existence of outliers, showcasing the importance of identifying these values in analysis. As Brahmareddy aptly states,
This not only reduced the information size but also made the subsequent analysis much quicker.
Additionally, to upload Excel files to the BI service, users must sign in, navigate to their workspace, and select the upload option. Applying these strategies will not only enhance the utilization of examples in BI tools but also boost user involvement and efficiency within BI projects. Remember, failing to leverage Business Intelligence effectively can leave your business at a competitive disadvantage, making these practices all the more crucial.
Measuring the Impact of Sample Data on Decision-Making
The impact of example information in Power BI on decision-making quality is significant and quantifiable. By utilizing representative information effectively, organizations can produce thorough reports that reveal essential insights into business performance, emerging trends, and strategic opportunities. This approach empowers decision-makers to formulate strategies grounded in strong analysis rather than relying on intuition alone.
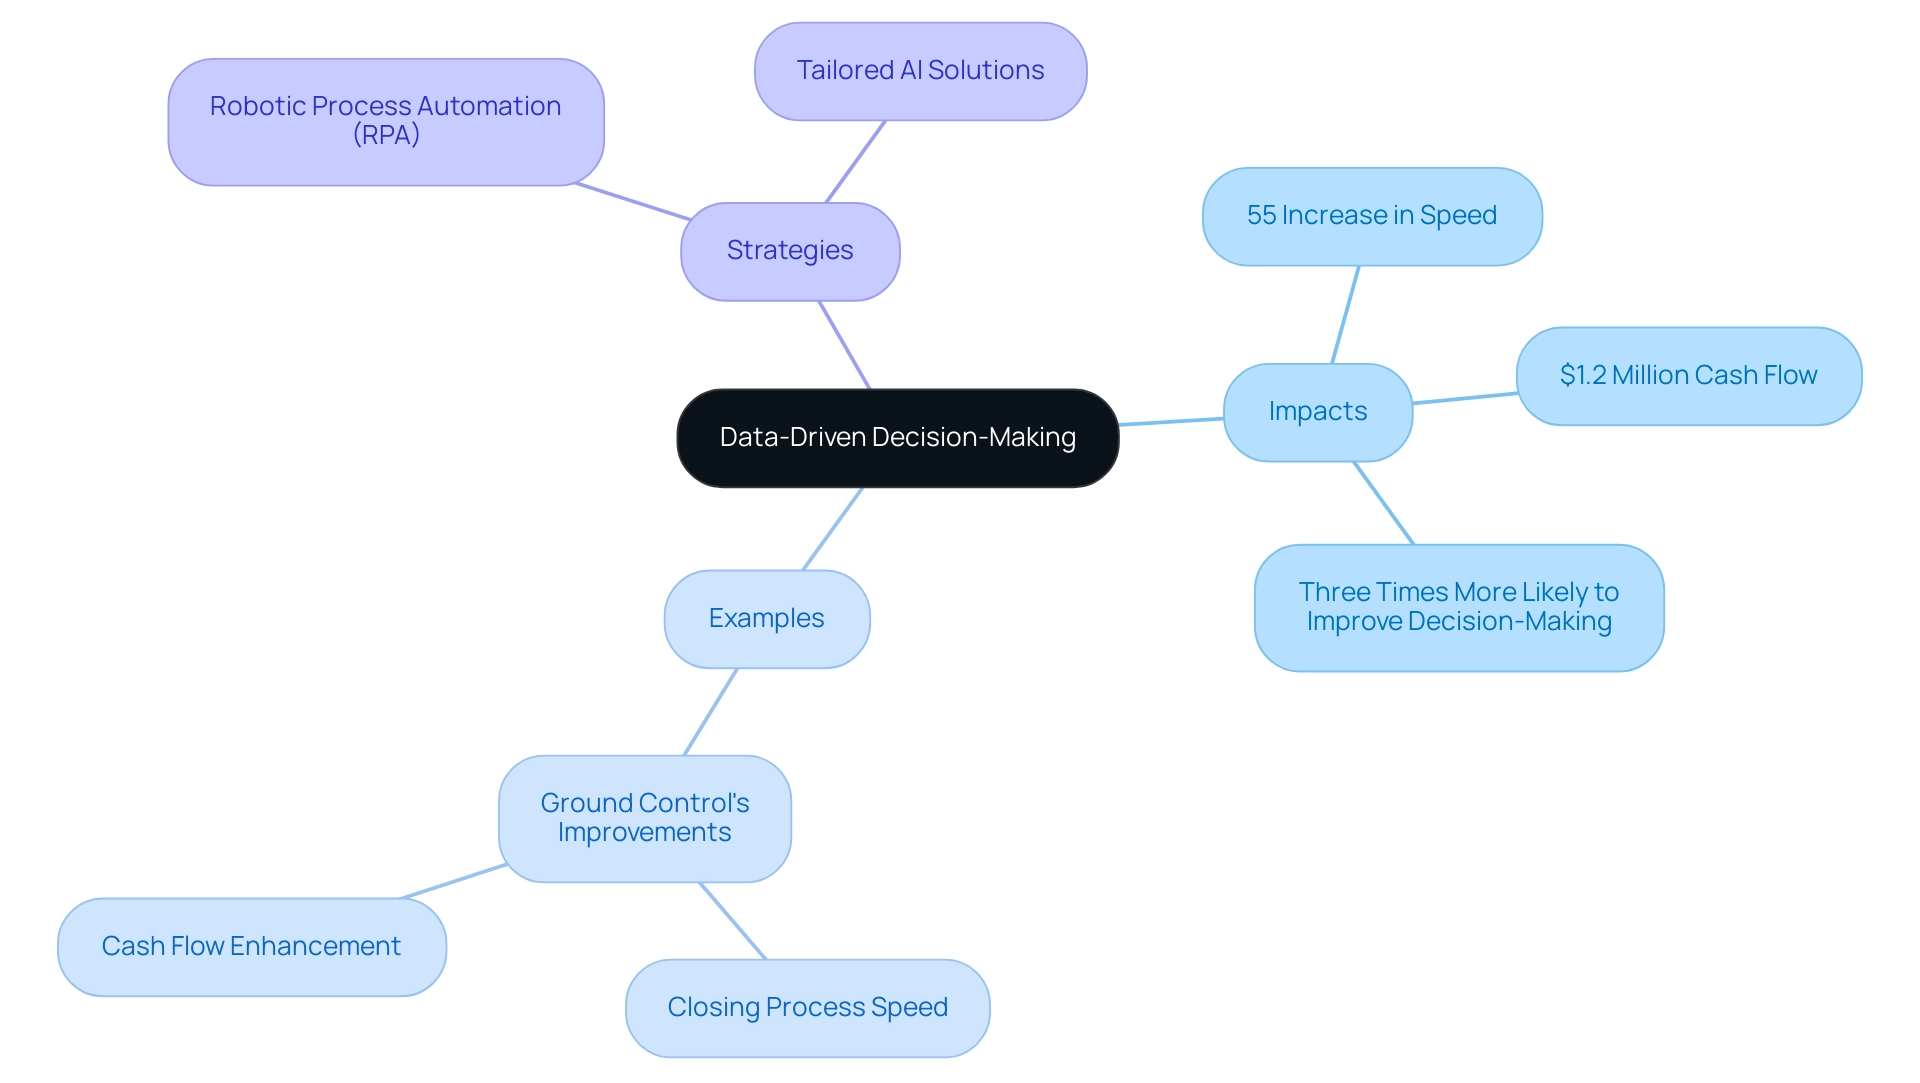
For instance, Ground Control implemented strategies that significantly improved their closing process, achieving a 55% increase in speed and freeing up $1.2 million in cash flow, illustrating the tangible benefits of data-driven decision-making. Furthermore, organizations that diligently integrate sample data for Power BI into their BI processes cultivate a culture of informed decision-making, ultimately enhancing operational efficiency and overall effectiveness. As highlighted by marketing specialist Tim Stobierski, ‘Data-driven strategies not only streamline processes but also empower organizations to make informed decisions that drive success.’
Additionally, a recent survey by PwC shows that organizations prioritizing data-driven strategies are three times more likely to experience notable improvements in decision-making compared to their counterparts. This shift towards data-centric operations is further underscored by the timely release of the infographic titled ‘Data Mesh and Data Fabric – From Theory to Application,’ which illustrates modern approaches to data management and their implications for business success. To further enhance productivity and efficiency, integrating Robotic Process Automation (RPA) can streamline repetitive tasks, addressing the challenges of manual processes that often hinder operational flow.
Tailored AI solutions can also help identify the right technologies to address specific business challenges, ultimately driving operational excellence. We encourage you to explore how these solutions can transform your operations and lead to significant improvements in performance.
Conclusion
Harnessing the power of sample data in Power BI is a game-changer for organizations striving to enhance their data analysis capabilities. By utilizing pre-defined datasets, users can streamline their learning process, overcome common challenges, and create meaningful insights that drive strategic decisions. The practical applications of sample data—from improving user engagement in dashboards to facilitating innovative testing—underscore its value in a competitive business landscape.
Implementing best practices, such as selecting relevant datasets and engaging in collaborative learning, can significantly elevate the effectiveness of Power BI projects. By documenting findings and experimenting with different visualizations, organizations can create reports that not only reflect accurate data but also tell a compelling story. The impact of this approach is evident in the measurable improvements in decision-making quality, as evidenced by case studies highlighting substantial gains in operational efficiency and financial performance.
As the business intelligence market continues to evolve, the integration of sample data into analytical processes will be essential for organizations seeking to maintain a competitive edge. Embracing these strategies not only fosters a culture of data-driven decision-making but also empowers teams to navigate complexities with confidence. Prioritizing the use of sample data in Power BI is not just a technical enhancement; it is a strategic imperative that positions organizations for success in an increasingly data-centric world.
Introduction
In the realm of data analytics, understanding cardinality is not just a technical necessity; it is a cornerstone for achieving operational excellence in Power BI. As organizations grapple with the complexities of data relationships, mastering the nuances of cardinality becomes crucial for transforming raw data into actionable insights. With the potential for misconfigured relationships leading to inefficiencies and confusion, it is essential to navigate these challenges with a strategic approach.
By delving into the various types of cardinality—
1. one-to-one
2. one-to-many
3. many-to-many
users can enhance their data modeling capabilities, ensuring that their reports not only convey accurate information but also empower informed decision-making. As the landscape of data continues to evolve, implementing robust governance strategies and leveraging best practices will unlock the true potential of Power BI, enabling organizations to harness their data more effectively and drive meaningful results.
Understanding Cardinality in Power BI
In BI, understanding what is cardinality in Power BI is crucial for determining the uniqueness of values within a relationship, shaping how tables interact with one another. This understanding is essential for building effective models, as it directly impacts the precision of aggregation and the presentation of insights in reports. However, many users find themselves investing excessive time in report creation rather than leveraging insights from their Power BI dashboards.
This common challenge arises from issues such as inconsistencies across reports and a lack of actionable guidance, which can lead to confusion and impede decision-making. It is essential to implement a governance strategy to address these inconsistencies and ensure dependable information management. What is cardinality in Power BI? It is classified into three primary types:
- One-to-one
- One-to-many
- Many-to-many
Each type distinctly influences information behavior and outcomes. By mastering these fundamental concepts and highlighting actionable insights, users can significantly improve their modeling capabilities, resulting in more accurate and influential analysis. As noted by Joleen Bothma, a Data Science Consultant,
By following these guidelines, you can significantly improve the efficiency and scalability of your BI reports, making them more effective tools for business analysis.
This insight highlights the significance of grasping numerical relationships not only as a theoretical idea but as a practical basis for analytical success in BI. Furthermore, it is essential to mention that BI lacks a native Boxplot function, which restricts specific visualization capabilities associated with quantity. Following optimal methods in BI data structuring, grasping connections, data count, and directionality is essential for enhancing report efficiency and addressing the difficulties of report generation.
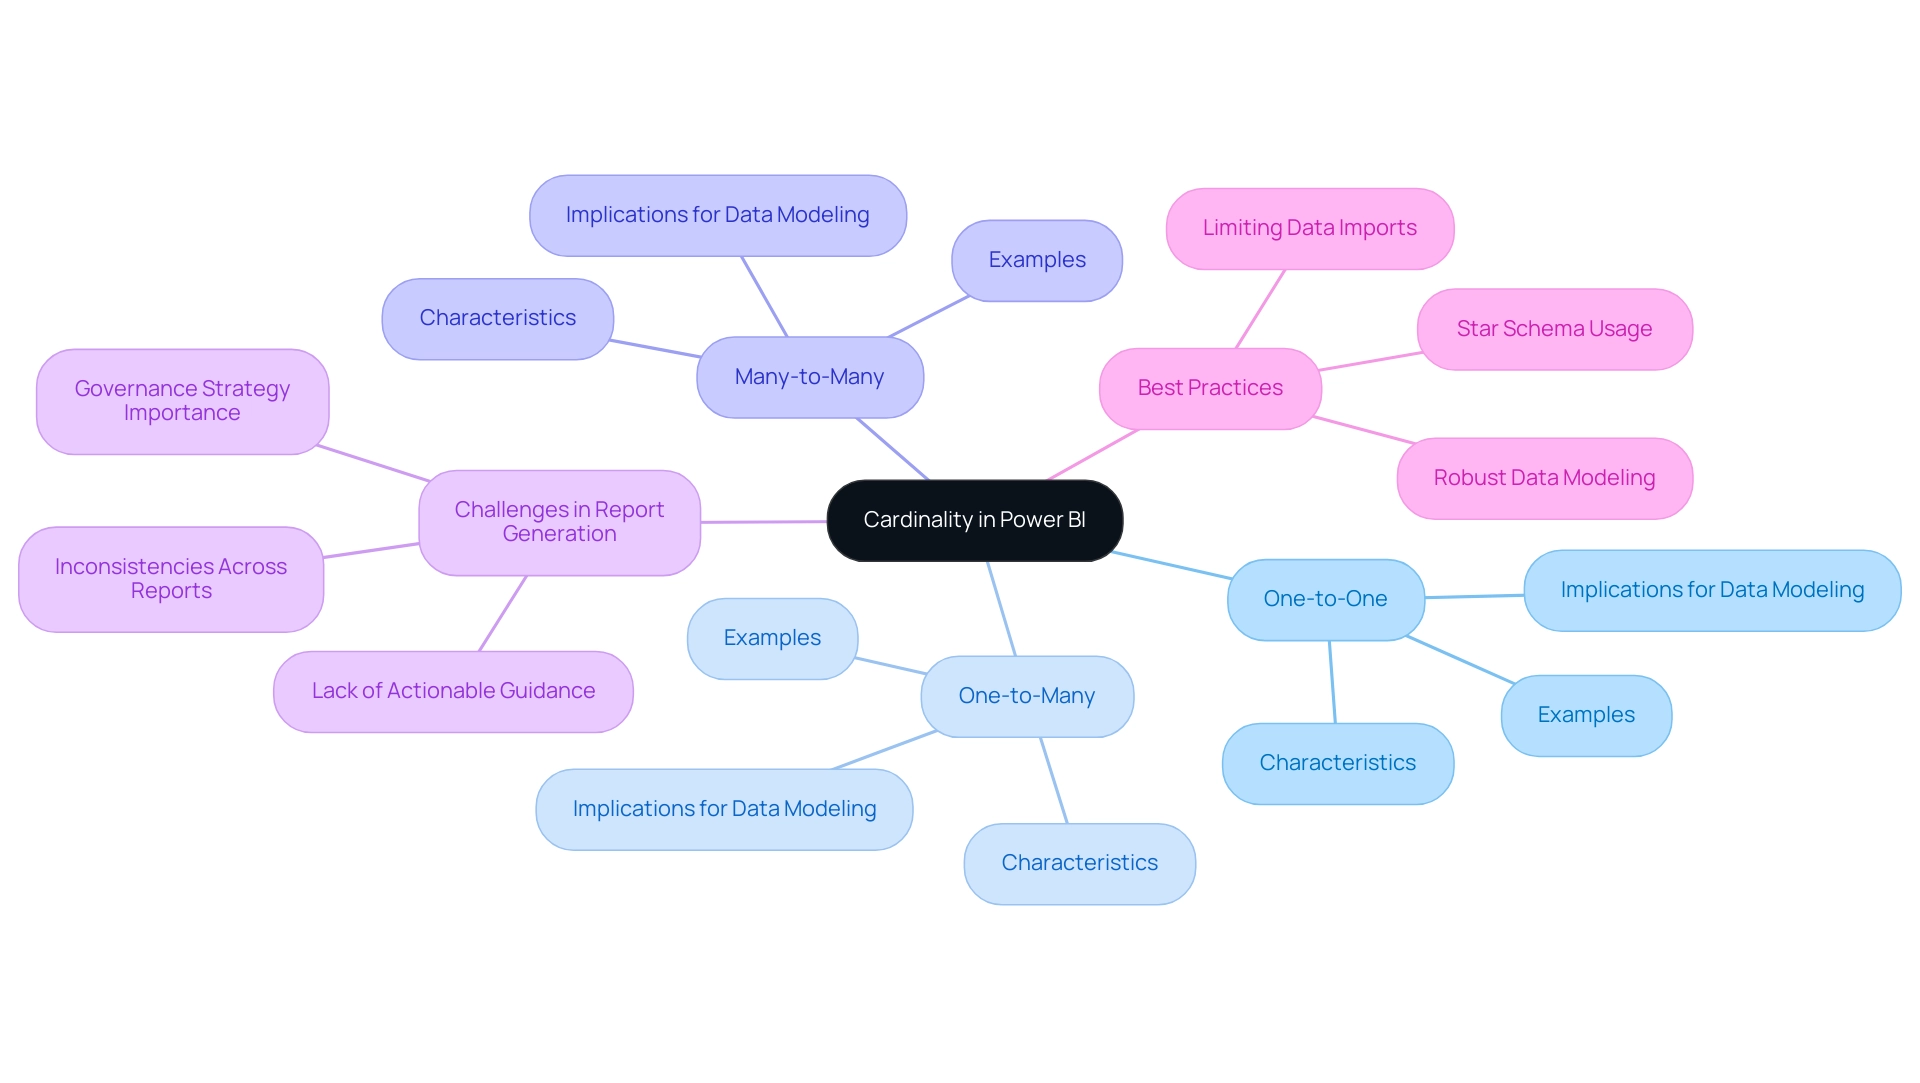
Types of Cardinality in Power BI Relationships
Power BI helps in understanding what is cardinality in Power BI by managing three primary types of connections: one-to-one (1:1), one-to-many (1:), and many-to-many (:*). In a one-to-one connection, each record in one table corresponds directly to a single record in another, which is relatively rare in practice. The one-to-many connection, however, is significantly more prevalent, allowing one record in a table to be associated with multiple records in another table.
This arrangement is particularly useful for aggregating information and drawing insights, addressing the common challenge of time-consuming report creation. Conversely, many-to-many relationships allow multiple records in one table to connect with multiple records in another, adding complexity to modeling but enabling richer analyses. Understanding what is cardinality in Power BI is essential for accurately building and examining models, particularly since organizations often encounter inconsistencies that can lead to confusion.
This confusion can be worsened by a lack of governance strategy, which is essential for maintaining integrity and trust. As Kta aptly points out,
In relational databases, we have relations among the tables. These relations can be one-to-one, one-to-many or many-to-many.
These relations illustrate what is cardinality in Power BI. A concrete example of distinctiveness in practice is the PERSON_ID column, which is likely to be a very high distinctiveness column where every row has a different value. Understanding what is cardinality in Power BI is crucial for accurately defining these relationships, which guarantees alignment with business requirements and facilitates the extraction of actionable insights, essential for effective analytics and operational efficiency.
Furthermore, as demonstrated in the case study titled ‘Defining Measurements Based on Business Rules,’ the concept is defined based on business rules and the nature of the objects involved, which plays a critical role in ensuring that the database structure aligns with business needs. In today’s information-abundant setting, failing to extract significant insights can put your business at a competitive disadvantage, highlighting the necessity of grasping the concept in optimizing information use.
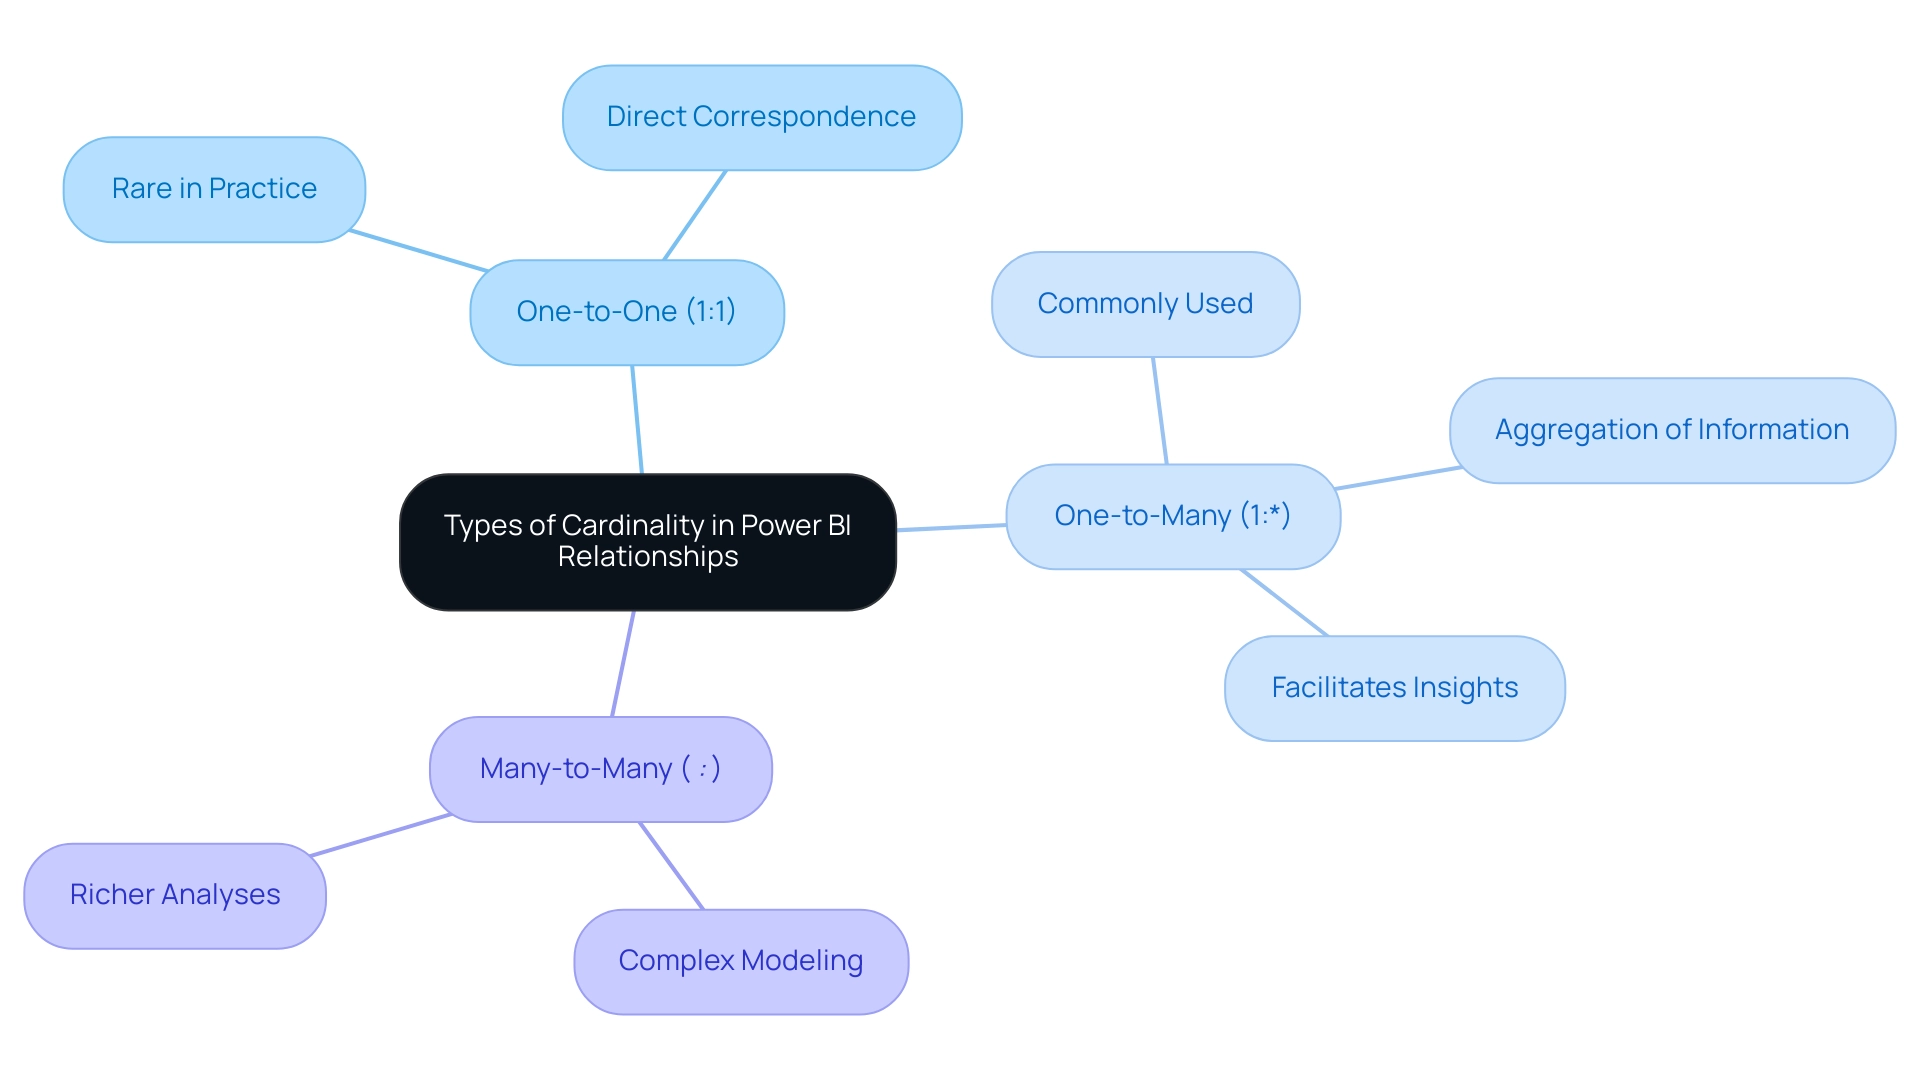
The Impact of Cardinality on Data Modeling and Performance
Understanding what is cardinality in Power BI is crucial as it plays a pivotal role in shaping information modeling efficiency and overall performance, especially when organizations encounter challenges like poor master information quality and inefficient reporting processes. When settings related to what is cardinality in Power BI are improperly configured, they can lead to significant inefficiencies in retrieval, prolonging processing times and affecting report performance. This is particularly vital for directors concentrated on operational efficiency, as emphasized in the context of time-consuming report creation and inconsistencies that can arise from a lack of governance strategy.
Moreover, organizations often encounter barriers to AI adoption, such as uncertainty about how to integrate AI into existing processes and fears of high costs and complexity. These barriers can further exacerbate issues related to information quality and reporting efficiency. As indicated in industry insights, a model connection is restricted when there’s no assured ‘one’ side, often leading to many-to-many associations or cross-source group connections.
This limitation complicates information management and necessitates INNER JOIN semantics for table joins, which can restrict the use of certain DAX functions. Thus, defining clear quantities is crucial to enhance information connections, allowing quicker queries and more responsive dashboards. Furthermore, a thorough understanding of what is cardinality in Power BI is essential in preventing duplication and integrity issues that often stem from mismanaged relationships.
By addressing these challenges, including those related to AI integration, BI users can enhance their reporting capabilities. The recent inclusion of the ‘read/write XMLA endpoint’ to Business Intelligence signifies a notable milestone, bridging the gap between IT-managed workloads and self-service BI, further emphasizing the importance of effective modeling practices. By mastering the concept of quantity and overcoming AI adoption obstacles, BI users not only improve their operational efficiency but also enhance their decision-making abilities, thus leveraging insights more effectively.
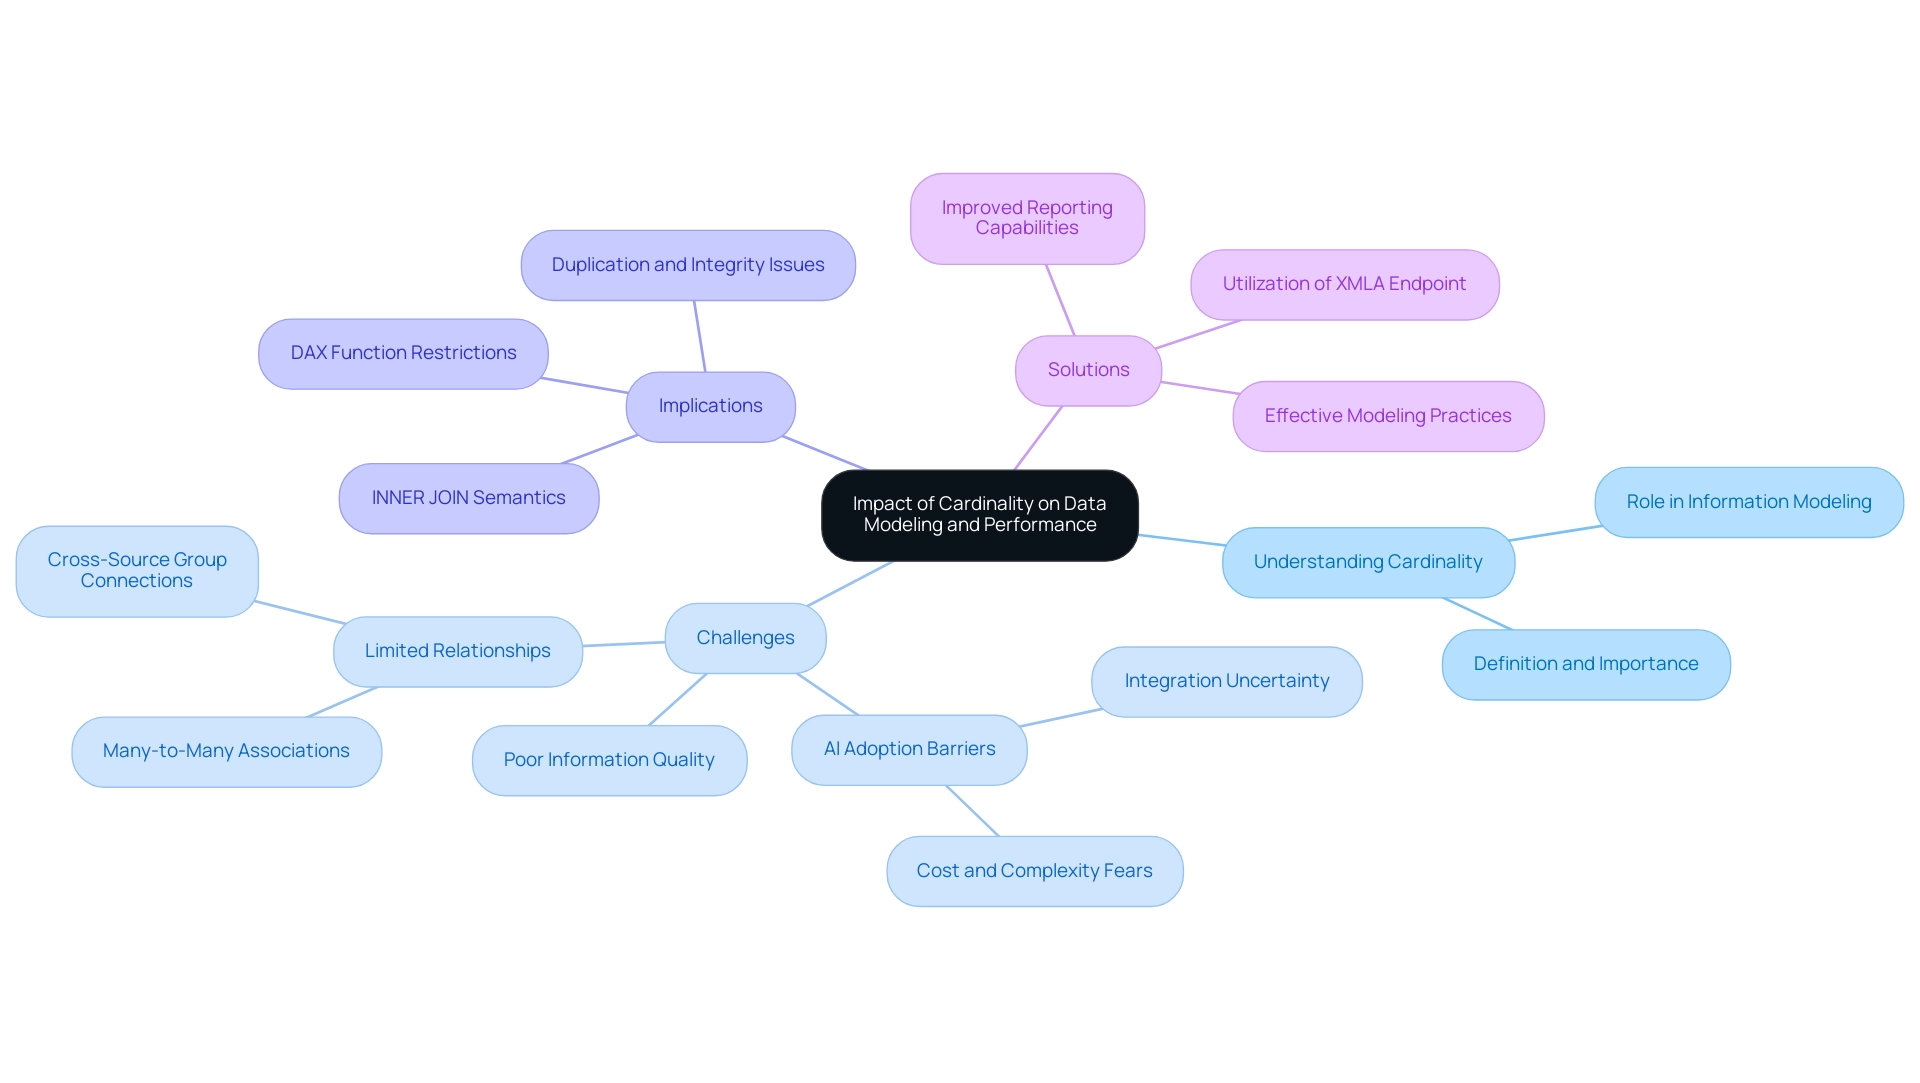
Common Cardinality Issues in Power BI
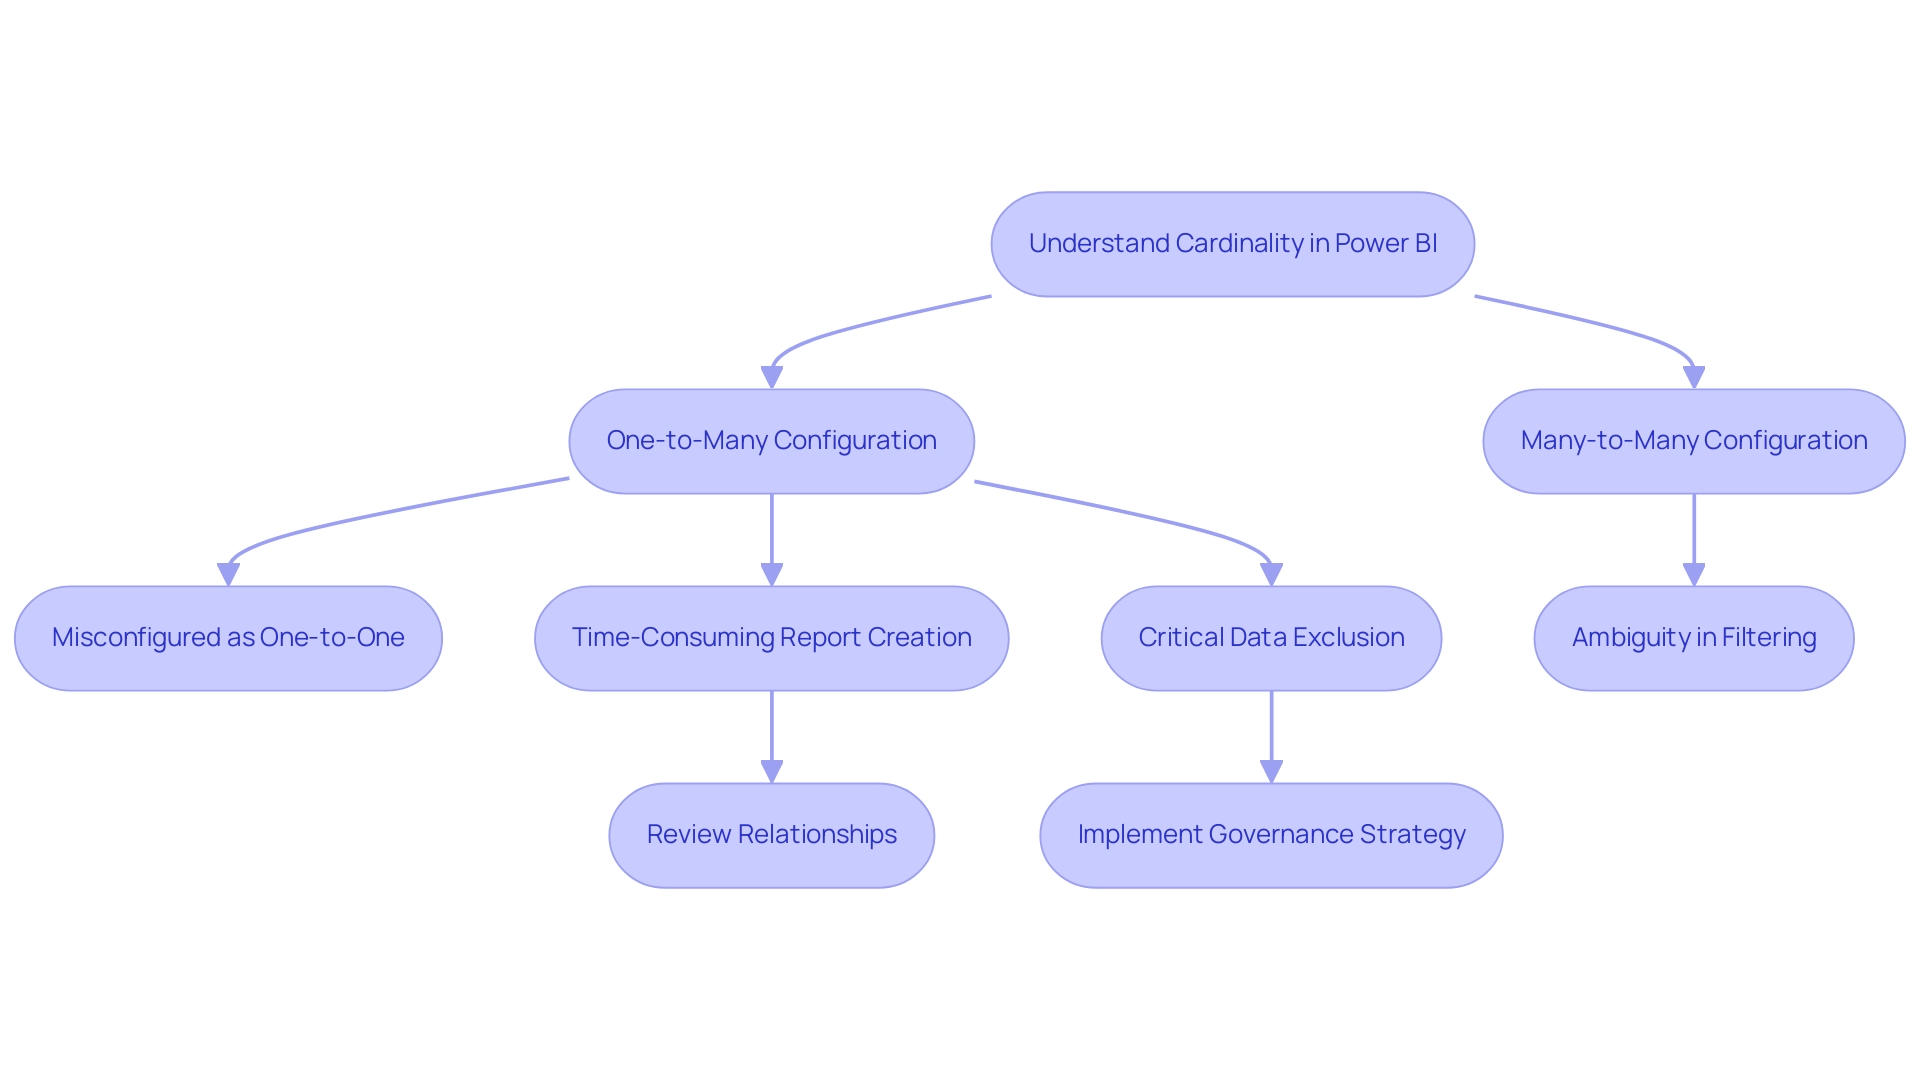
Understanding what is cardinality in Power BI is essential to address common problems, such as misconfigured one-to-many and many-to-many connections, which pose significant challenges for analysis. These misconfigurations can lead to time-consuming report creation, where users may spend more time building reports than extracting valuable insights. For instance, when a connection is mistakenly configured as one-to-one instead of one-to-many, critical data points may be excluded from reports, distorting the analysis.
Furthermore, many-to-many relationships introduce ambiguity and complicate filtering processes, hindering the ability to derive actionable insights. A recent user expressed concerns regarding Power BI automatically deciding on an n-to-n relationship, raising questions about the impact of empty cells in other rows on the analysis. This situation highlights the significance of understanding what is cardinality in Power BI configurations to prevent misinterpretations and inconsistencies in information.
It’s crucial for users to meticulously review their relationships to ensure precise definitions; failure to do so can severely compromise information integrity and impede effective decision-making. Additionally, the lack of a robust governance strategy can exacerbate these issues, leading to further inconsistencies across reports and diminishing trust in the data presented. As pointed out by Farhan Ahmed, a Community Champion, ‘Can’t filter the NULL value in Query Edit in Table 1?’
I don’t think this value will be used in your fact table. Did I answer your question? Mark my post as a solution!
Appreciate your Kudos!! Proud to be a Super User! This insight highlights the significance of proactively tackling common pitfalls in BI.
Moreover, reports that are filled with numbers and graphs yet lack clear, actionable guidance can leave stakeholders without a clear direction on the next steps. The case study titled ‘Creating Connections in BI’ illustrates that connections can be established automatically or manually, with autodetected connections being convenient but sometimes flawed. By maintaining robust information models and being aware of these issues, users can enhance their analytical capabilities and foster improved operational efficiency, ultimately shifting focus from report creation to leveraging insights.
Strategies for Managing Cardinality in Power BI
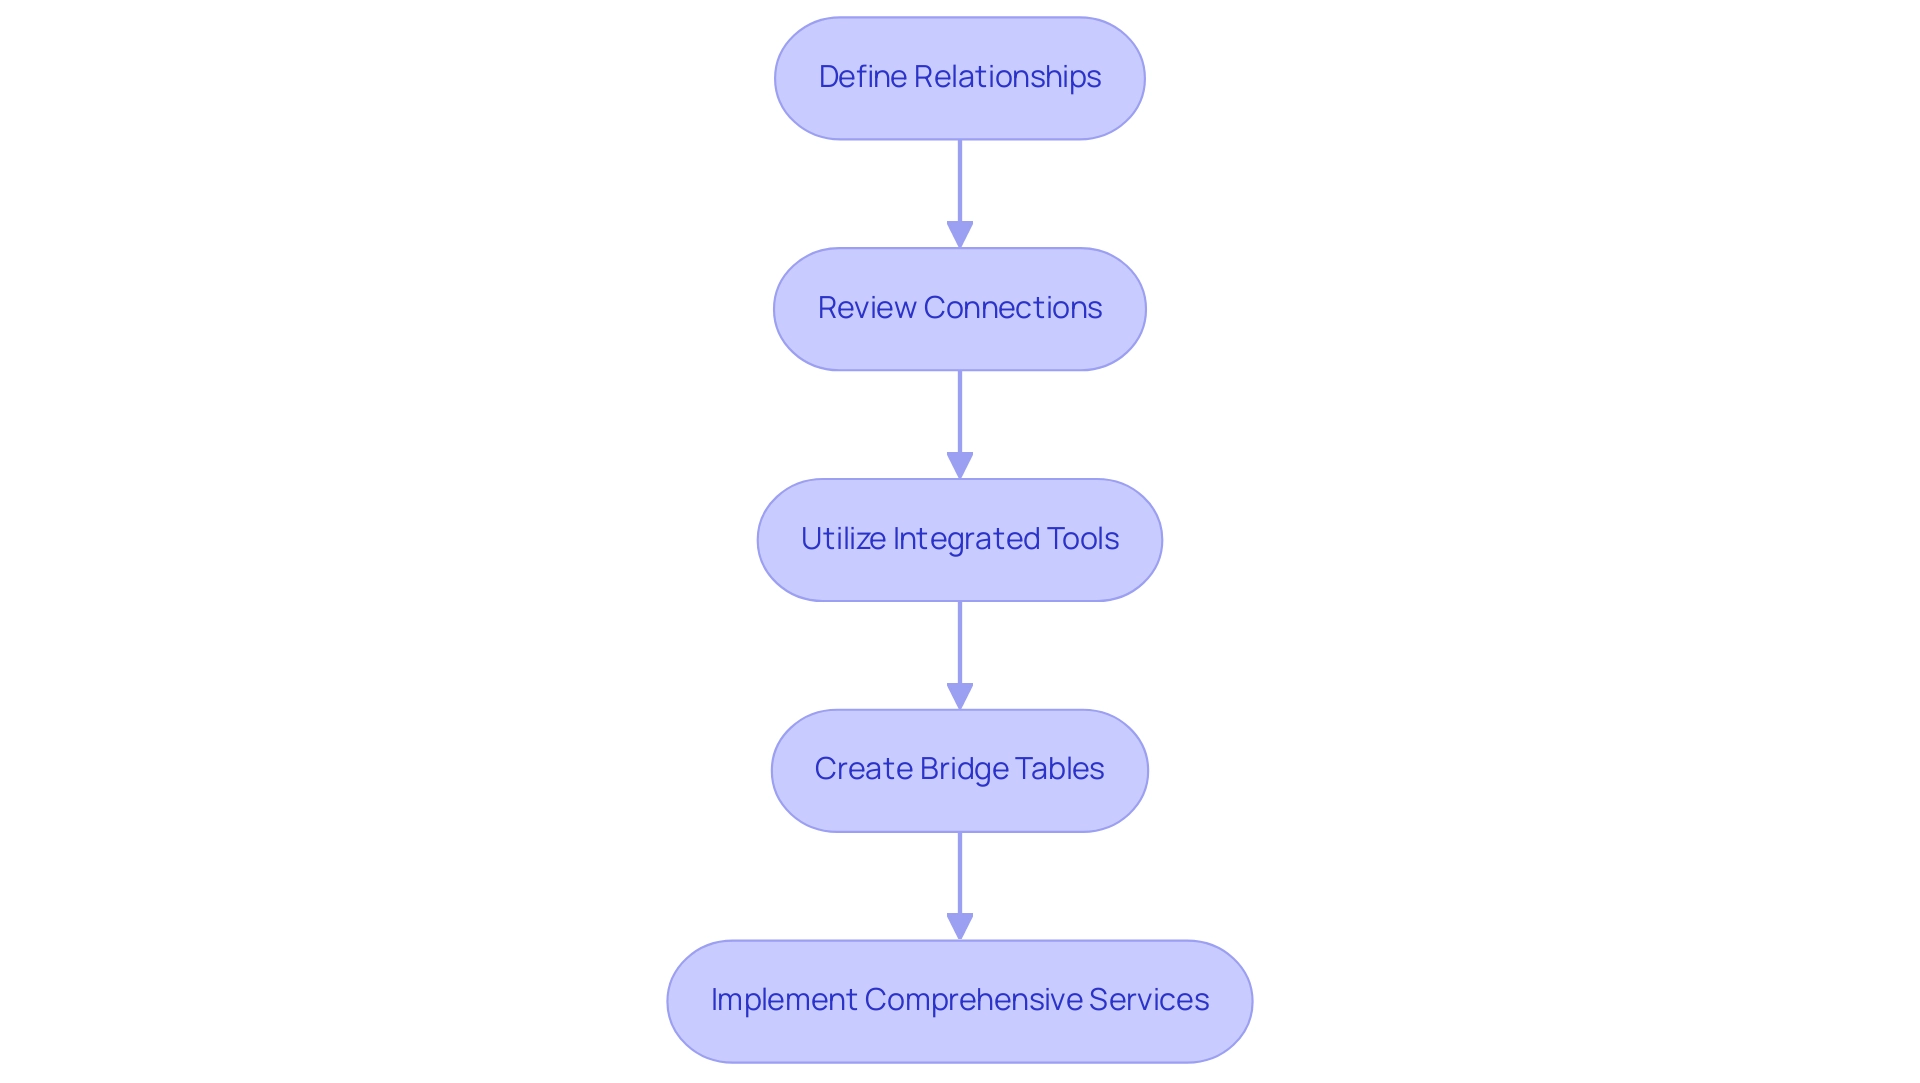
Effectively managing the number of unique values in Power BI starts with a precise definition of relationships, ensuring they align seamlessly with the intended analytical outcomes. As Nikola Ilic aptly states, “The biggest opponent is referred to as the number of elements!” This emphasizes the difficulties encountered when handling quantity in information management.
It is essential to periodically review and update these connections, especially as data evolves, to maintain accuracy and relevance. With 5,917 views on discussions surrounding what is cardinality in Power BI, it is clear that managing this aspect is of significant interest to many. Utilizing Power BI’s integrated tools for visualizing and managing these connections can assist in recognizing potential issues before they can negatively impact performance.
One highly effective strategy involves creating bridge tables to address many-to-many relationships, which simplifies complex models and significantly enhances performance. Furthermore, as emphasized in our 3-Day BI Sprint, we enable you to tackle these challenges by producing professional reports that concentrate on actionable insights, ensuring your team can utilize information effectively. Furthermore, our Comprehensive Power BI Services include custom dashboards, integration, expert training, and the unique bonus of using your report as a template for future projects, which can significantly streamline your reporting processes.
By implementing these strategies and utilizing our services, users can foster efficient and effective data models that not only support their analytical goals but also drive insightful outcomes.
Conclusion
Understanding cardinality in Power BI is crucial for building effective data models and enhancing operational efficiency. By grasping the nuances of:
- one-to-one
- one-to-many
- many-to-many relationships
users can create more accurate and insightful reports. Misconfigured cardinality can lead to inefficiencies, confusion, and wasted time, highlighting the necessity of a robust governance strategy to maintain data integrity.
Addressing common cardinality issues is essential for preventing data misinterpretations and ensuring that reports deliver actionable insights. By meticulously reviewing relationships and leveraging Power BI’s tools, organizations can overcome these challenges and enhance their analytical capabilities. Implementing strategies such as utilizing bridge tables can simplify complex data models, leading to improved performance and faster decision-making.
Ultimately, mastering cardinality not only optimizes data relationships but also empowers organizations to leverage their data more effectively. This foundational knowledge equips users to transform raw data into meaningful insights, driving operational excellence and fostering informed decision-making in an increasingly data-driven landscape. Embracing these principles will enable organizations to unlock the full potential of Power BI and achieve significant business results.
Introduction
In a world where data is the new currency, the ability to transform raw information into actionable insights is paramount for organizations striving for operational excellence. Semantic models in Power BI emerge as a transformative solution, bridging the gap between complex data structures and user-friendly analytics. By defining clear relationships among data entities, these models not only streamline reporting processes but also empower users to harness the full potential of their data.
As organizations grapple with challenges such as time-consuming report creation and data inconsistencies, understanding and implementing semantic models becomes essential for driving informed decision-making and enhancing efficiency. This article delves into the myriad benefits of semantic models, practical strategies for building and managing them, and best practices for integration, ultimately equipping organizations with the tools necessary to thrive in today’s data-driven landscape.
Understanding Semantic Models in Power BI
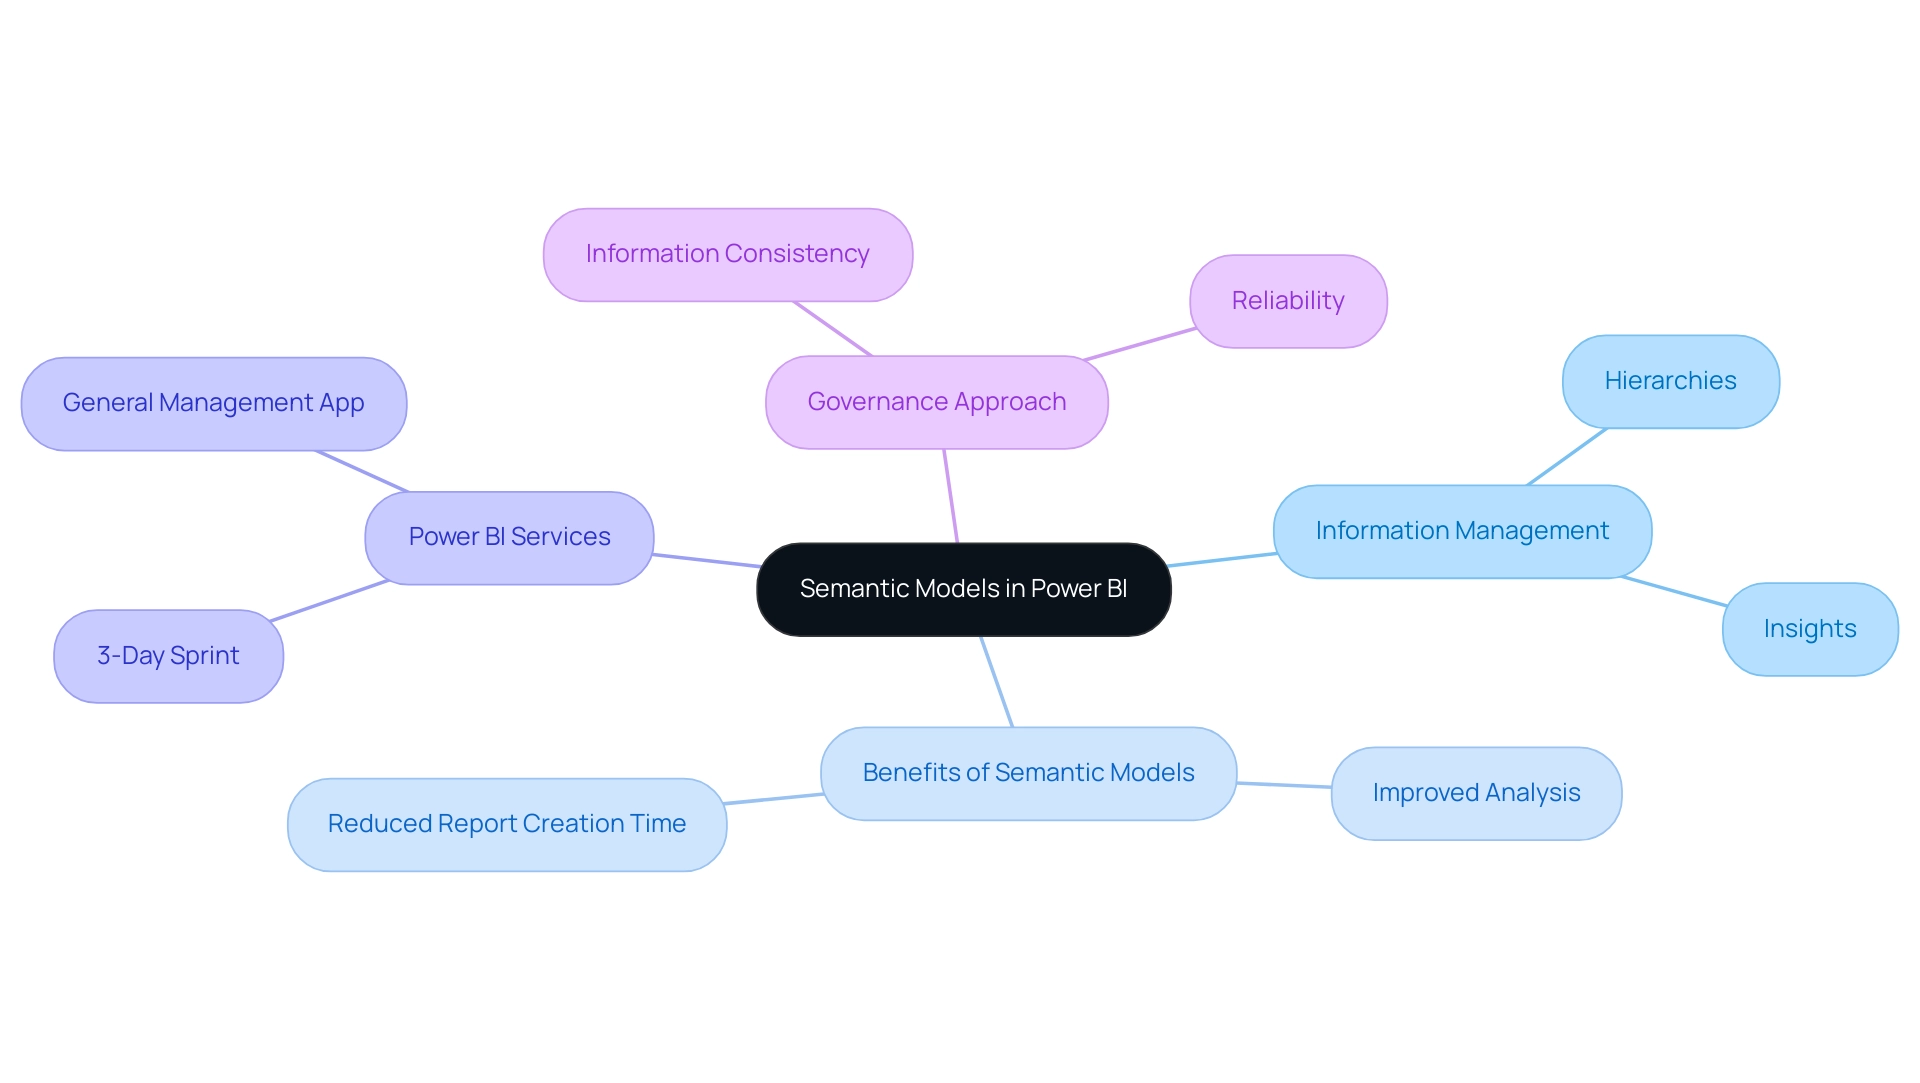
Semantic models in Power BI serve as a crucial element in information management, acting as organized structures that outline relationships between various information entities. They operate as a mediator layer, simplifying complex structures and enabling users to interact with their information more intuitively. By arranging information into clear hierarchies and significant connections, conceptual frameworks greatly improve the effectiveness of analysis and reporting processes, thus tackling prevalent issues encountered by operations directors, including the absence of actionable guidance.
This leads to extracting valuable insights with greater ease, ultimately reducing the time spent on report creation. As Ibarrau, an informed Super User, observes, ‘You might be able to obtain that information but with the BI Rest API only… in that manner, you could gain insights into the usage for creating new reports.’ This viewpoint emphasizes the essential significance of semantic models in Power BI for revealing the complete capabilities of BI, as they convert unprocessed data into practical insights that promote informed decision-making.
Furthermore, our Power BI services include a 3-Day Sprint designed to quickly create professionally designed reports, alongside the General Management App that facilitates comprehensive management and smart reviews. Furthermore, generating structured representations from Excel workbooks and CSV files automatically produces a framework with imported tables, simplifying the framework creation process. Case studies investigating usage metrics in national/regional clouds demonstrate how conceptual frameworks function within compliance structures while improving analytical capabilities.
Additionally, establishing a strong governance approach guarantees information consistency and reliability, further enhancing the efficiency of conceptual frameworks. Comprehending and applying semantic models in Power BI efficiently is crucial for any organization aiming to enhance its analytical capabilities and surpass obsolete systems through intelligent automation.
Benefits of Implementing Semantic Models in Power BI
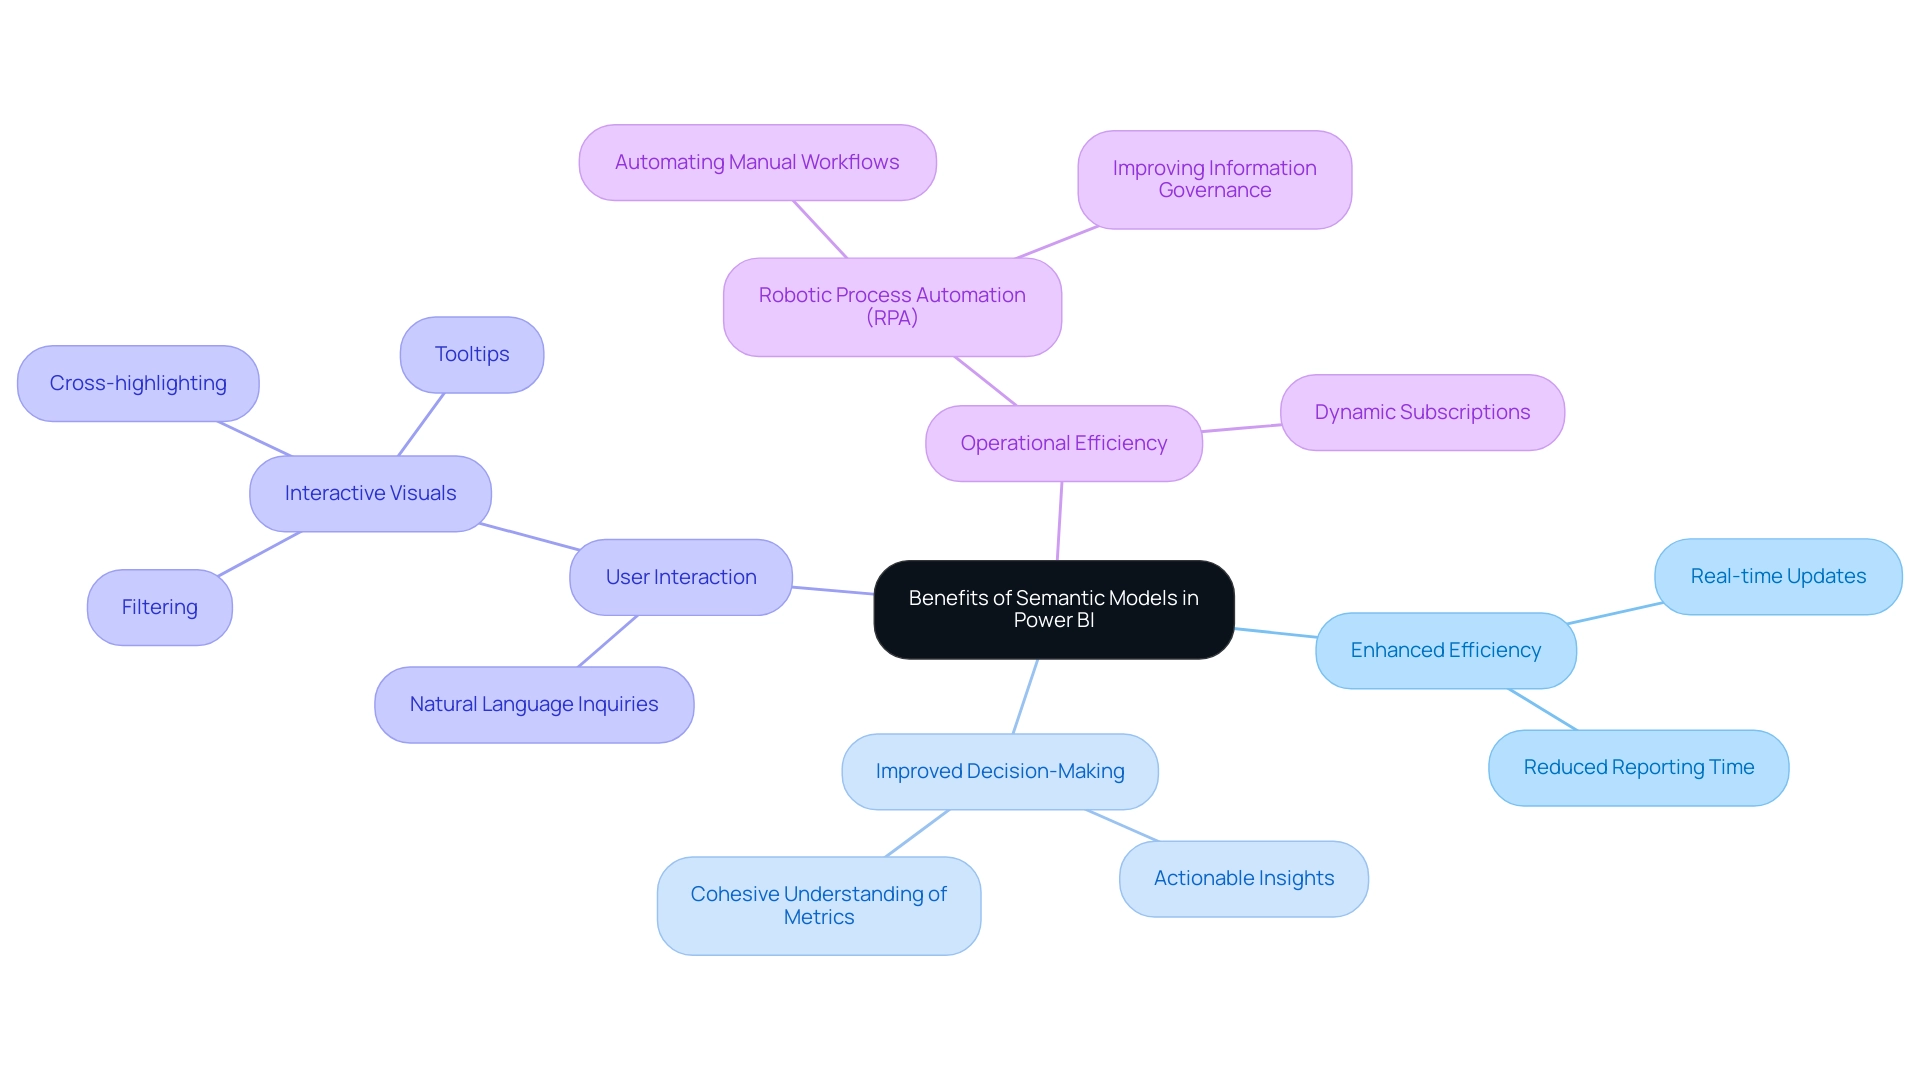
Implementing semantic models in Power BI unlocks a plethora of advantages that significantly enhance organizational efficiency and decision-making processes. By tackling challenges such as time-consuming report creation, inconsistencies in information, and the absence of actionable guidance, these frameworks establish a clear structure and define relationships among information. This ensures that users across various departments have access to uniform information interpretations, minimizing discrepancies and fostering a cohesive understanding of business metrics.
Furthermore, conceptual frameworks enable users with sophisticated analytical functions, allowing features such as natural language inquiries. As Jason Himmelstein aptly notes,
Users can now update their visuals in real time, interact with their information through BI’s standard features such as filtering, cross-highlighting, and tooltips.
This interactivity not only streamlines the reporting process but also accelerates insight generation, allowing for more informed decision-making.
To effectively set up their environment for monitoring and enhancing the quality of semantic models in Power BI, organizations can follow the deployment steps outlined in the BPA case study, which includes:
- Creating a new Lakehouse
- Establishing a Data Engineering Environment
- Integrating the semantic-link-labs library
Moreover, incorporating Robotic Process Automation (RPA) can greatly improve operational efficiency by automating manual workflows, tackling the challenges of report creation and information governance, and enabling teams to concentrate on strategic, value-adding tasks. With over 200 hours of learning available, users can deepen their understanding of these frameworks and their implementation.
The inclusion of dynamic subscriptions in BI also improves the efficiency of these frameworks, enabling prompt updates and enhanced information management. As organizations adopt these frameworks alongside RPA, they position themselves to drive business success through enhanced accessibility and deeper analytical capabilities.
Building and Managing Power BI Semantic Models
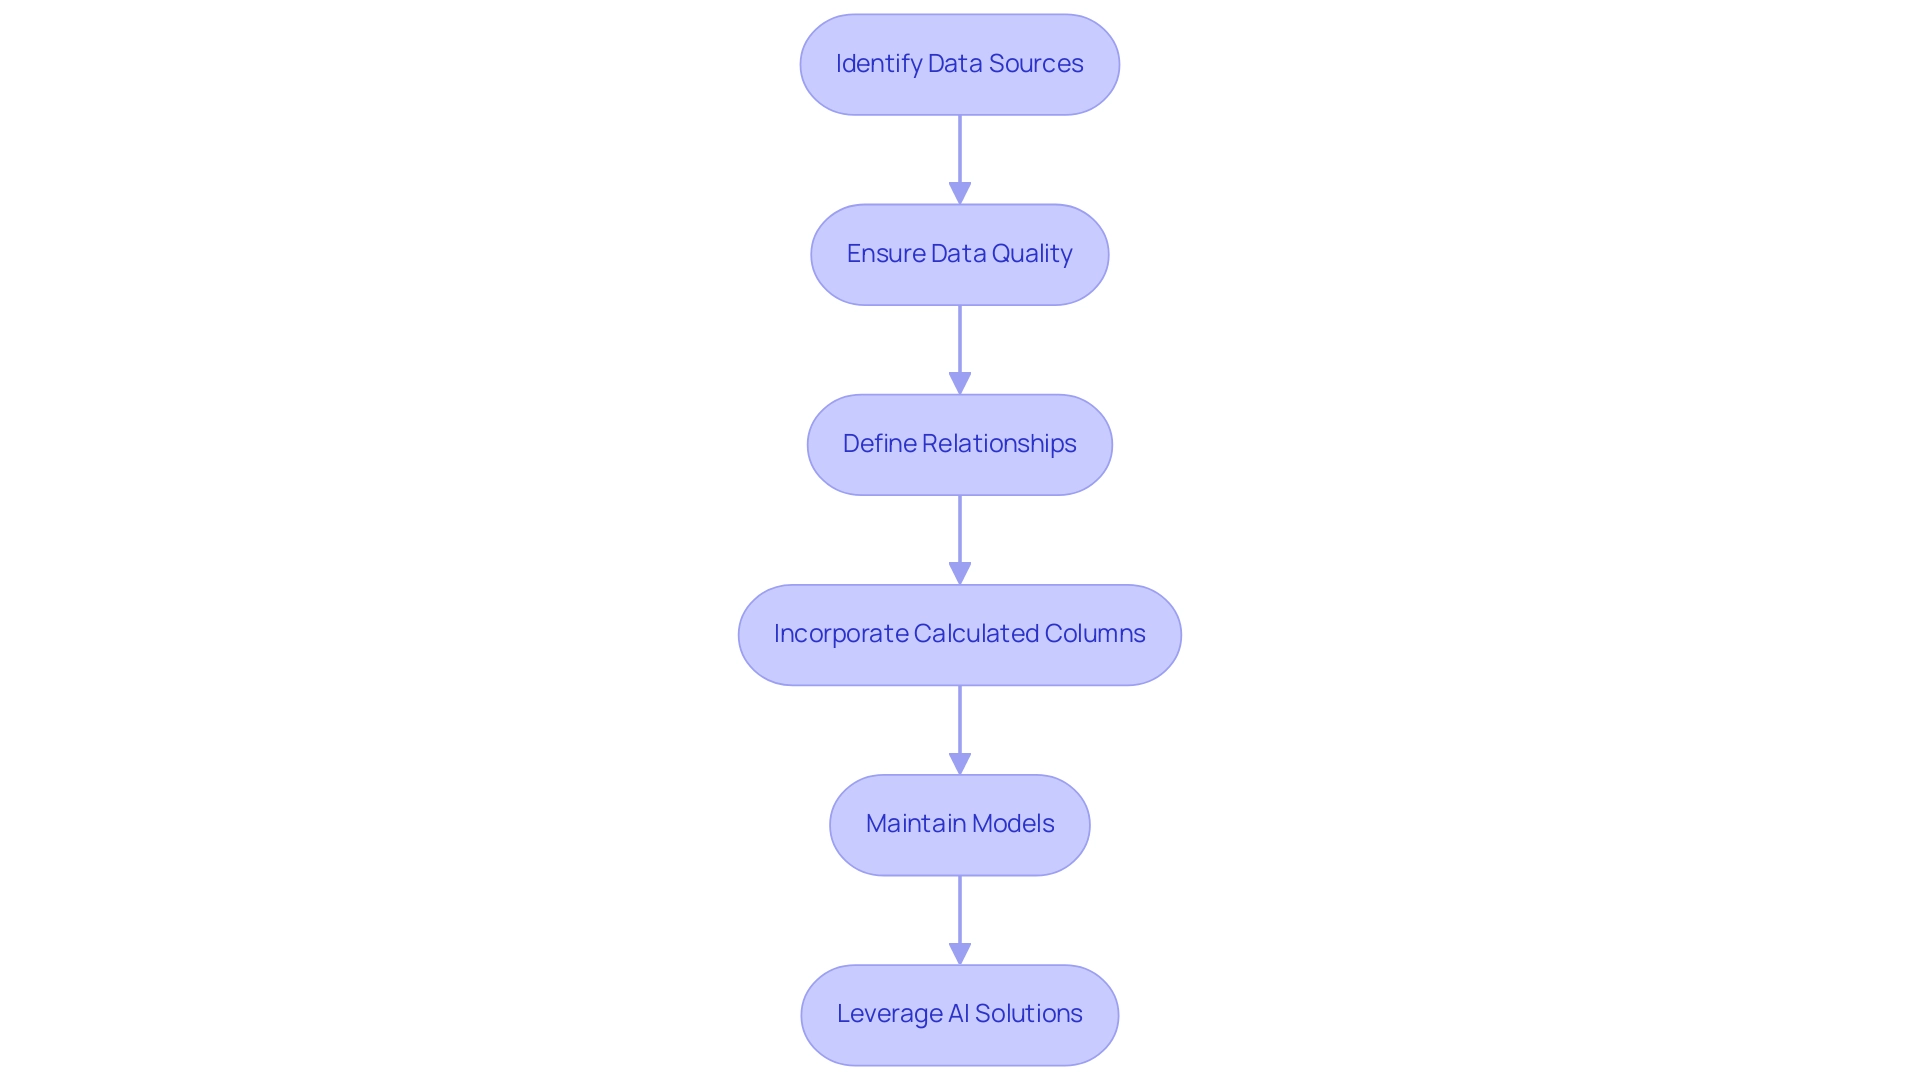
Constructing and overseeing semantic models in Power BI is a strategic process that enables organizations to utilize their information effectively. In today’s data-rich environment, the importance of Business Intelligence and RPA in driving data-driven insights cannot be overstated, particularly as many businesses struggle with a lack of actionable insights. A practical example of this can be seen in the tutorial on building a machine learning model in Power BI, where the first crucial step involves identifying and connecting to the suitable information sources.
This step is essential for ensuring that the information is both clean and well-structured, addressing challenges like inconsistencies that can arise in report creation. Following this, defining the relationships between various entities creates a logical framework that accurately reflects how the information interacts. In the case study titled ‘Tracking Training Status,’ the training procedure for the machine learning system involves monitoring the training status through the BI interface, indicating whether the system is queued, under training, or has been successfully trained.
Incorporating calculated columns and measures is vital, as these elements provide valuable insights that drive decision-making. Furthermore, consistent upkeep of the semantic models in Power BI must not be neglected; regularly examining and refreshing the models guarantees that they adjust to any alterations in information sources or changing business requirements. Our Power BI services, including the 3-Day Power BI Sprint, offer organizations rapid pathways to create professionally designed reports while the General Management App ensures comprehensive management and smart reviews.
By leveraging AI solutions like Small Language Models, which enhance information quality through efficient analysis, and GenAI Workshops that provide hands-on training, organizations can address the challenges of poor master information quality. As Ayushi Trivedi, Technical Content Editor at Analytics Vidhya, states, ‘I love building the bridge between the technology and the learner,’ emphasizing the importance of connecting technology with practical applications. By following these steps and utilizing these AI solutions, organizations can build strong conceptual frameworks that greatly improve their analytical capabilities, paving the way for informed strategic decisions.
Integrating Semantic Models with Data Sources and BI Tools
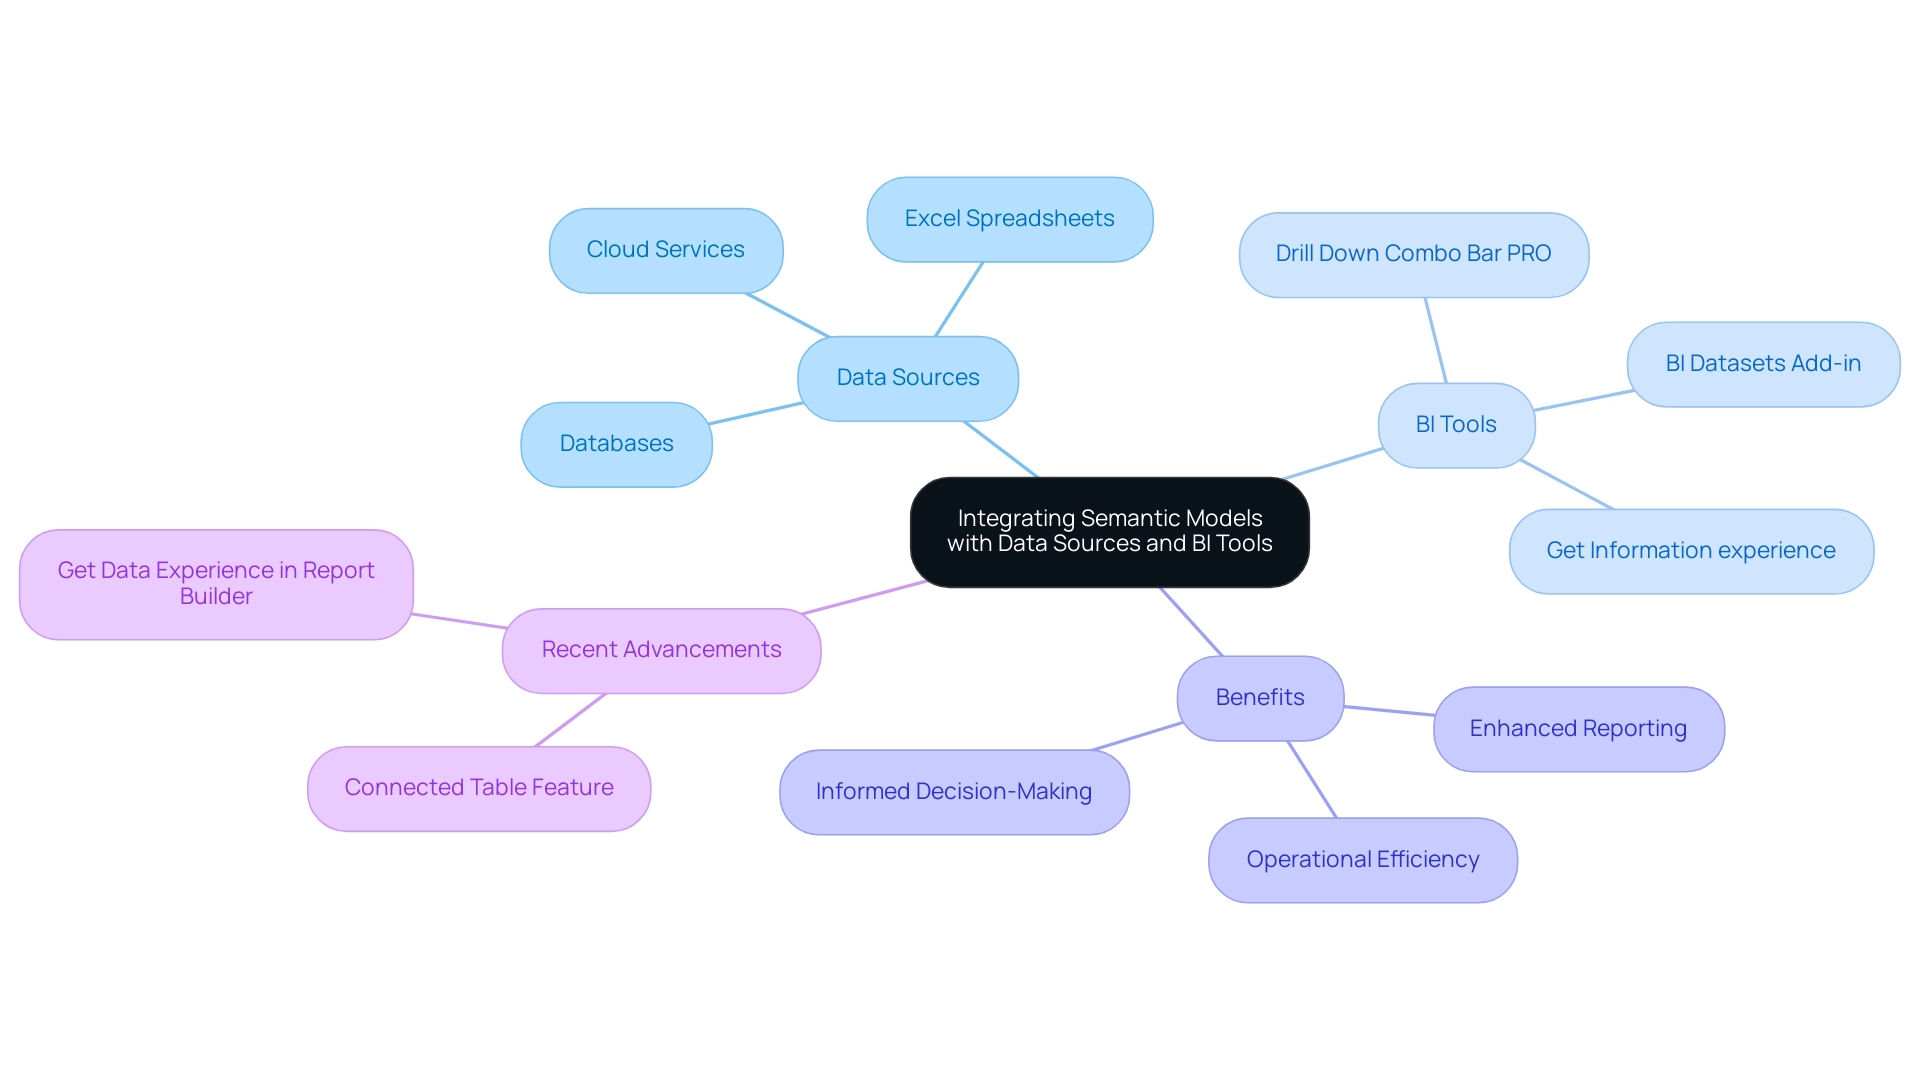
Combining meaningful frameworks with a varied array of information sources and business intelligence tools is essential for enhancing the capabilities of BI. In today’s data-rich environment, the ability to unlock actionable insights through Business Intelligence is essential for maintaining a competitive edge. Users can connect the BI tool to numerous information sources, including databases, Excel spreadsheets, and various cloud services, ensuring that semantic models are consistently updated with the most current information available.
Notably, the Drill Down Combo Bar PRO can visualize up to 25 series, showcasing BI’s robust analytical capabilities. The combination of BI tools with other business intelligence solutions greatly improves reporting abilities and user experience, tackling issues like time-consuming report generation and inconsistencies in information. This seamless connection facilitates comprehensive analysis and visualization, empowering organizations to make informed decisions grounded in a holistic view of their information landscape.
Recent advancements, such as the connected table feature in the BI Datasets Add-in for Excel, streamline the incorporation of BI information into Excel workbooks, enhancing this integration journey. Moreover, the Get Information experience in Report Builder enables users to efficiently create reports from over 100 sources, enhancing performance and usability. As a result, users can monitor their business and receive quick answers through rich dashboards accessible on any device.
Furthermore, utilizing RPA solutions such as EMMA RPA and Automate can automate repetitive tasks, further enhancing operational efficiency and allowing teams to concentrate on strategic initiatives. As Arun Ulag noted concerning the upcoming Microsoft Fabric Conference 2025 in Las Vegas, the advancements in BI tool integration are poised to transform how businesses manage and analyze their information, further promoting growth and operational efficiency. To learn more about how these solutions can benefit your operations, book a free consultation today.
Challenges and Best Practices for Power BI Semantic Models
Navigating the complexities of semantic models in Power BI can present significant challenges, such as information quality issues, user resistance to change, and intricate model designs. To effectively tackle these hurdles, organizations must prioritize robust data governance, ensuring that all data remains accurate and current. Our 3-Day Power BI Sprint is designed to help you create professional reports quickly while addressing these challenges, allowing you to leverage insights effectively for impactful decisions.
A key feature of this service is the template bonus, providing you with a professionally designed report that can be reused for future projects. As Amine Jerbi aptly noted, as semantic frameworks grow in size after refreshes, if the capacity of the workspace is not increased, performance slowdowns can occur. In such cases, organizations can utilize incremental refresh as a viable solution.
Thus, it’s crucial to simplify models by removing unnecessary columns, tables, or complex calculations to enhance refresh times. The focus on cleaning datasets is further highlighted by the recent BI Dev Dash case study, where contestants demonstrated the impact of this practice. Furthermore, fostering a culture of teamwork and providing extensive training can greatly reduce resistance to new tools and processes, aligning with our commitment to expert education in our BI services.
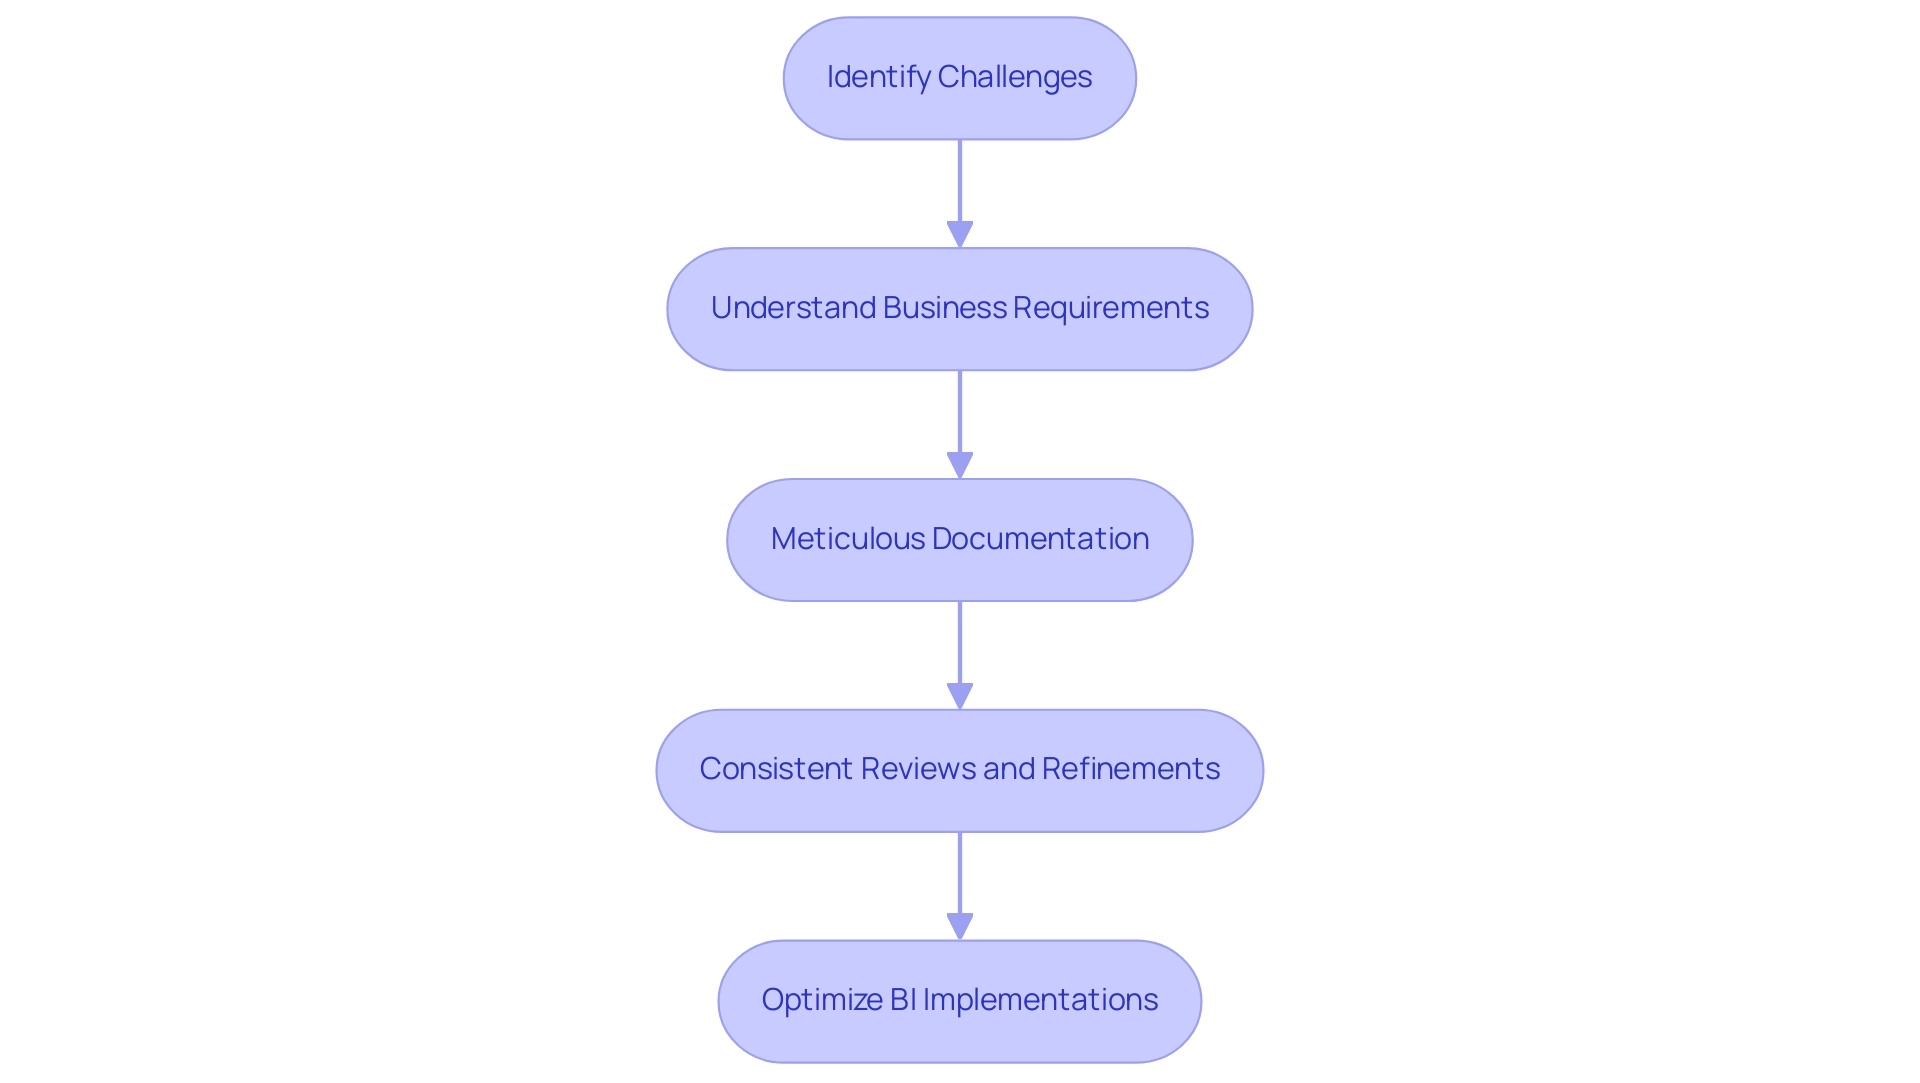
Best practices for developing effective semantic models in Power BI begin with:
- A thorough understanding of business requirements
- Meticulous documentation
- Consistent reviews and refinements of the model
These proactive measures not only address existing challenges but also empower organizations to optimize their BI implementations, ultimately driving greater efficiency and productivity. The Power BI Dev Dash case study exemplifies this approach, highlighting how Angelica’s strong technical skills contrasted with Allison’s focus on polished presentation, showcasing the importance of both technical proficiency and design in achieving success.
Conclusion
Implementing semantic models in Power BI is not just a strategic initiative; it is a crucial step toward operational excellence in a data-driven world. By establishing clear relationships among data entities, these models streamline the reporting process and minimize inconsistencies, enabling users across all departments to make informed decisions with confidence. The insights gleaned from semantic models empower organizations to enhance their analytics capabilities, ultimately transforming raw data into actionable information that drives business success.
Moreover, the integration of semantic models with various data sources and BI tools amplifies their effectiveness, allowing organizations to leverage real-time data and advanced analytics features. This seamless connectivity not only enhances the user experience but also fosters a culture of collaboration and innovation within the organization. By adopting best practices in building and managing these models, companies can navigate challenges such as data quality issues and user resistance, positioning themselves for sustained growth and competitive advantage.
In conclusion, embracing semantic models in Power BI is essential for organizations aiming to thrive in today’s complex data landscape. By investing in these structured frameworks and prioritizing data governance, organizations can unlock the full potential of their data, driving efficiency, enhancing decision-making, and ultimately achieving operational excellence. The journey toward effective data management starts now—equip your organization with the tools and strategies to harness the power of semantic models and pave the way for future success.
Introduction
In the dynamic landscape of data-driven decision-making, the installation and effective use of Power BI can significantly transform how organizations analyze and visualize their data. With the right prerequisites in place, users can unlock the full potential of this powerful tool, streamlining report creation and enhancing data consistency.
This article serves as a comprehensive guide, detailing everything from:
- The essential system requirements
- Installation steps
- Troubleshooting common issues
- Understanding the different versions of Power BI
By following these practical insights, organizations can not only overcome initial hurdles but also harness actionable insights that drive operational efficiency and informed decision-making. Whether for individual users or large enterprises, the journey to mastering Power BI begins with a solid foundation and a strategic approach to setup and configuration.
Essential Prerequisites for Installing Power BI
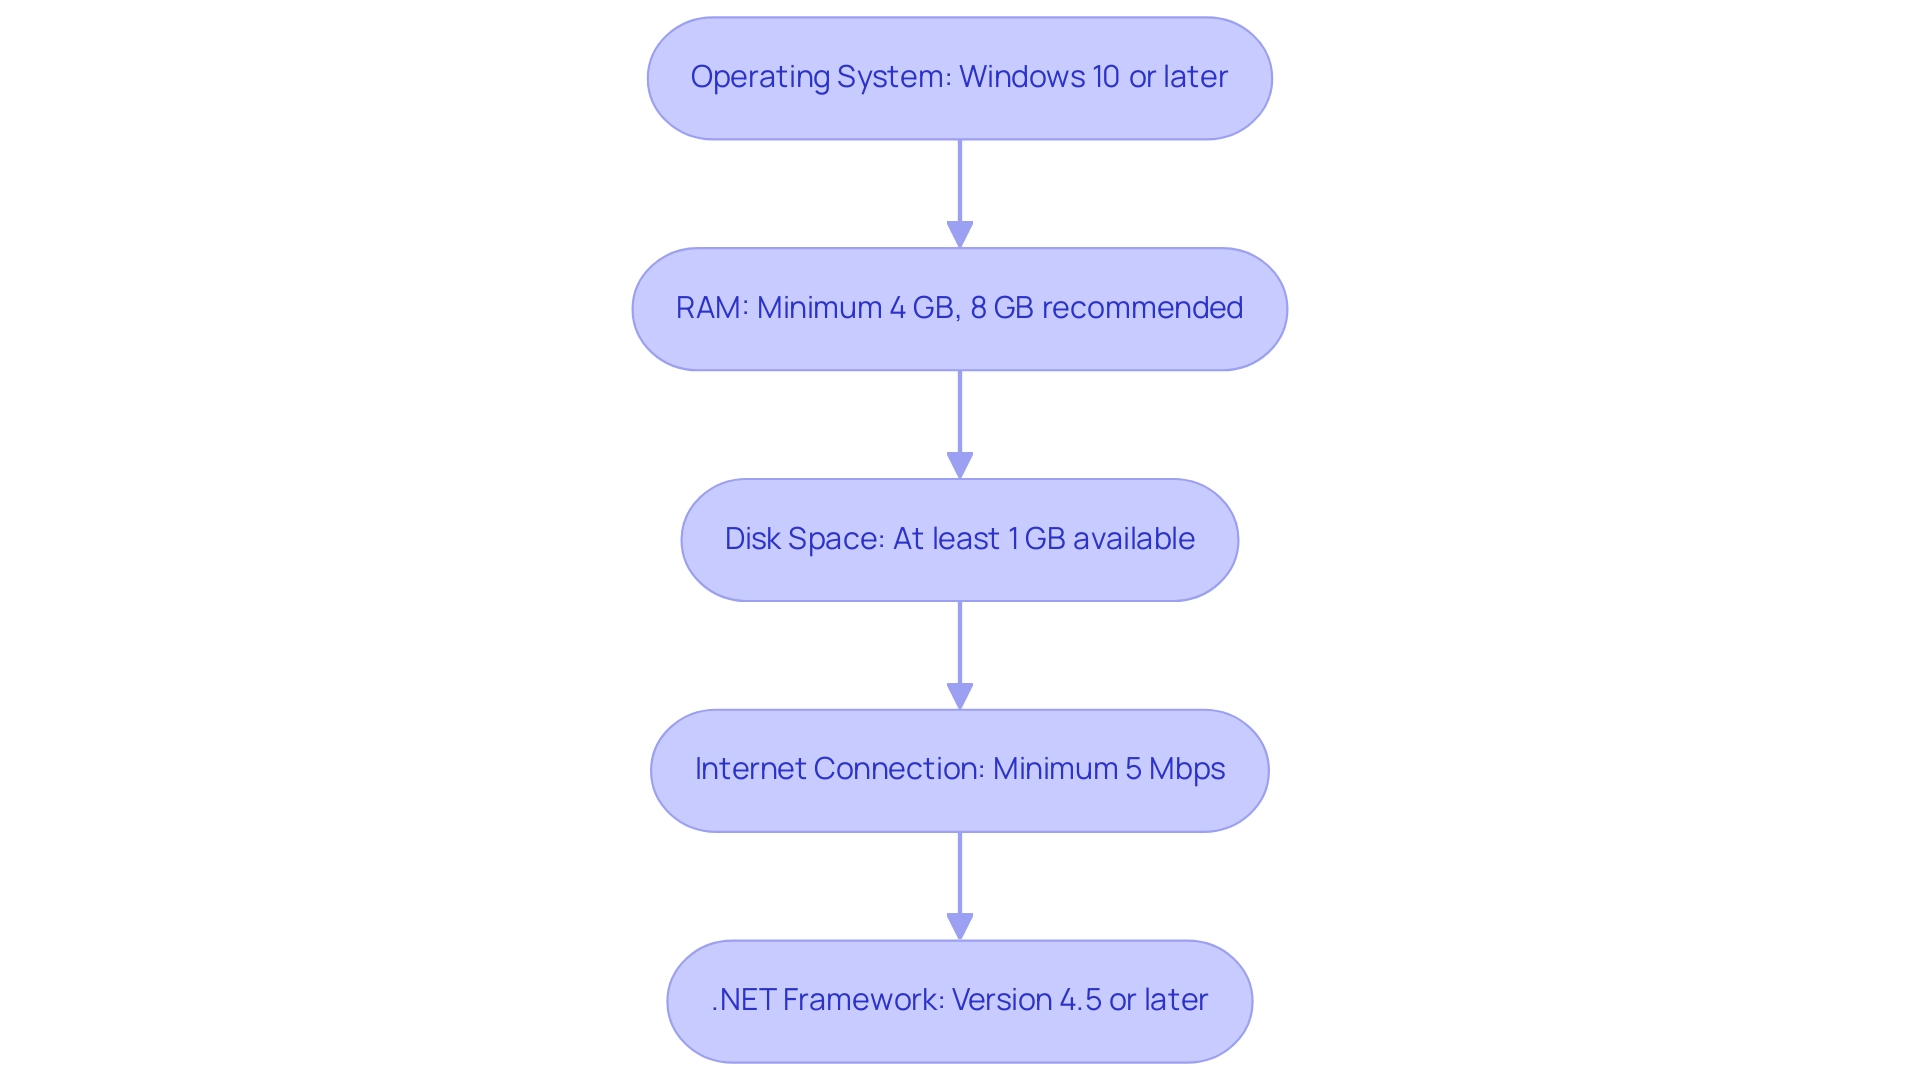
Before diving into the PowerBI installation, it’s essential to confirm that your system meets the following prerequisites for a seamless experience. Addressing common challenges such as time-consuming document creation, ensuring data consistency, and providing actionable insights begins with the right foundation:
- Operating System: Windows 10 or later, or Windows Server 2016 or later are necessary to run Power BI effectively.
- RAM: While a minimum of 4 GB of RAM will suffice, opting for 8 GB or more is advisable to significantly enhance performance, especially when working with larger datasets and avoiding delays in report generation.
- Disk Space: Ensure that you have at least 1 GB of available disk space for the PowerBI installation process. For optimal performance, a solid-state disk (SSD) is recommended, particularly for larger models, to facilitate swift data access and processing.
- Internet Connection: A reliable internet connection with a minimum speed of 5 Mbps is necessary for downloading BI and accessing its online features efficiently, which assists in reducing interruptions during document creation.
- .NET Framework: Confirm that the .NET Framework version 4.5 or later is installed, as this is crucial for BI’s functionality and to ensure that all features are available without inconsistencies.
By ensuring these prerequisites are met, you can avoid potential issues during the Power BI installation and enhance your ability to leverage BI’s insights. Meeting these requirements not only streamlines the PowerBI installation but also supports clearer, actionable guidance in your documents, leading to better decision-making. According to industry expert Andre, for content creators, opting for an i7 CPU, 16 GB of RAM, an SSD, and a 64-bit operating system will provide a notable boost in performance, especially when handling complex models with over 100 million rows.
For users considering compatibility, it is important to note that a MacBook can run BI, but only if Windows is installed on it. Additionally, while the Surface Pro 3 is suitable for smaller models, users should be aware that performance significantly improves with a desktop CPU when handling larger datasets. This preparation will set the stage for a successful experience with BI, reducing report creation time and improving the clarity of your insights, ultimately addressing the lack of actionable guidance in your reports.
Step-by-Step Guide to Installing Power BI
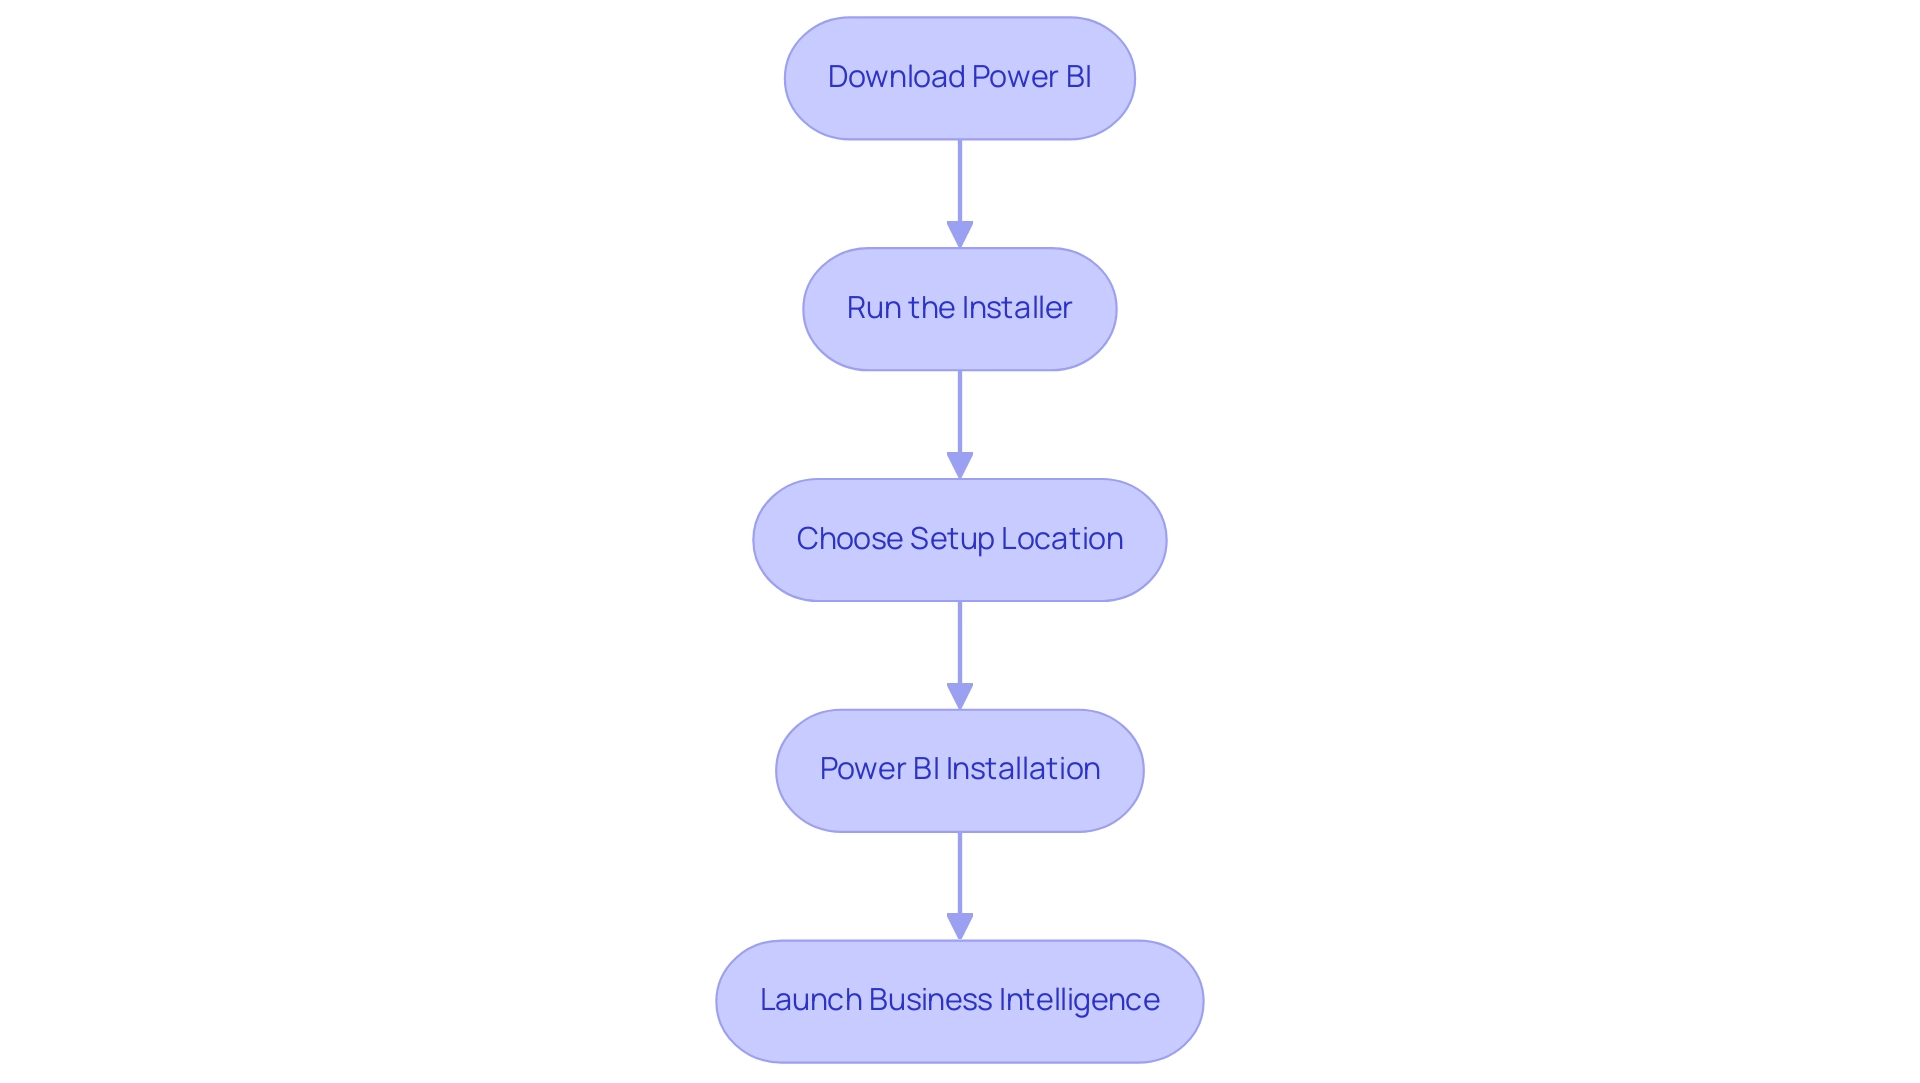
To successfully install BI and unlock its data visualization capabilities, follow these straightforward steps:
- Download Power BI: Navigate to the official Microsoft Power BI website and click on the ‘Download’ button for Power BI Desktop. This step is critical as it ensures you have the most recent version, which is vital for optimal performance.
- Run the Installer: Once the download completes, locate the installer file in your Downloads folder and double-click it to start the setup process.
- Accept the License Agreement: Carefully read through the Microsoft Software License Terms. Check the box to indicate your acceptance and click ‘Install’ to proceed.
- Choose Setup Location: If prompted, select your preferred setup location or leave it as the default setting, which is often the best choice for most users.
- PowerBI installation: Wait while the installation process completes. You will see a confirmation message indicating that BI has been successfully installed.
- Launch Business Intelligence: Click ‘Finish’ to exit the installer. Then, locate BI in your Start Menu and launch the application.
Congratulations on successfully completing the Power BI installation! With a growing demand for business intelligence solutions—evidenced by the Netherlands investing $1.2 billion in such technologies—effective use of BI can significantly enhance your operational efficiency. Moreover, as you leverage Robotic Process Automation (RPA) alongside Business Intelligence, you can accelerate the automation of manual workflows, thereby reducing errors and freeing up your team for more strategic tasks.
For example, automating information extraction processes with RPA can streamline the preparation phase, making it easier to visualize insights in Business Intelligence. The revised Snowflake connector, which enhances performance by decreasing unnecessary metadata queries, can further optimize your handling capabilities. Furthermore, the capability to link Dynamics 365 information to BI enables the integration of AI-driven analyses, demonstrating the tool’s adaptability in meeting diverse business requirements.
However, users may face challenges such as time-consuming report creation, data inconsistencies, and a lack of actionable guidance when leveraging insights from BI dashboards. As Jurriaan Amesz, Lead Product Owner at ABN AMRO Bank, states,
Business Intelligence and Azure … provided us with the performance for hundreds of concurrent users handling tens of billions of records.
This powerful tool is now at your fingertips!
Troubleshooting Common Installation Issues
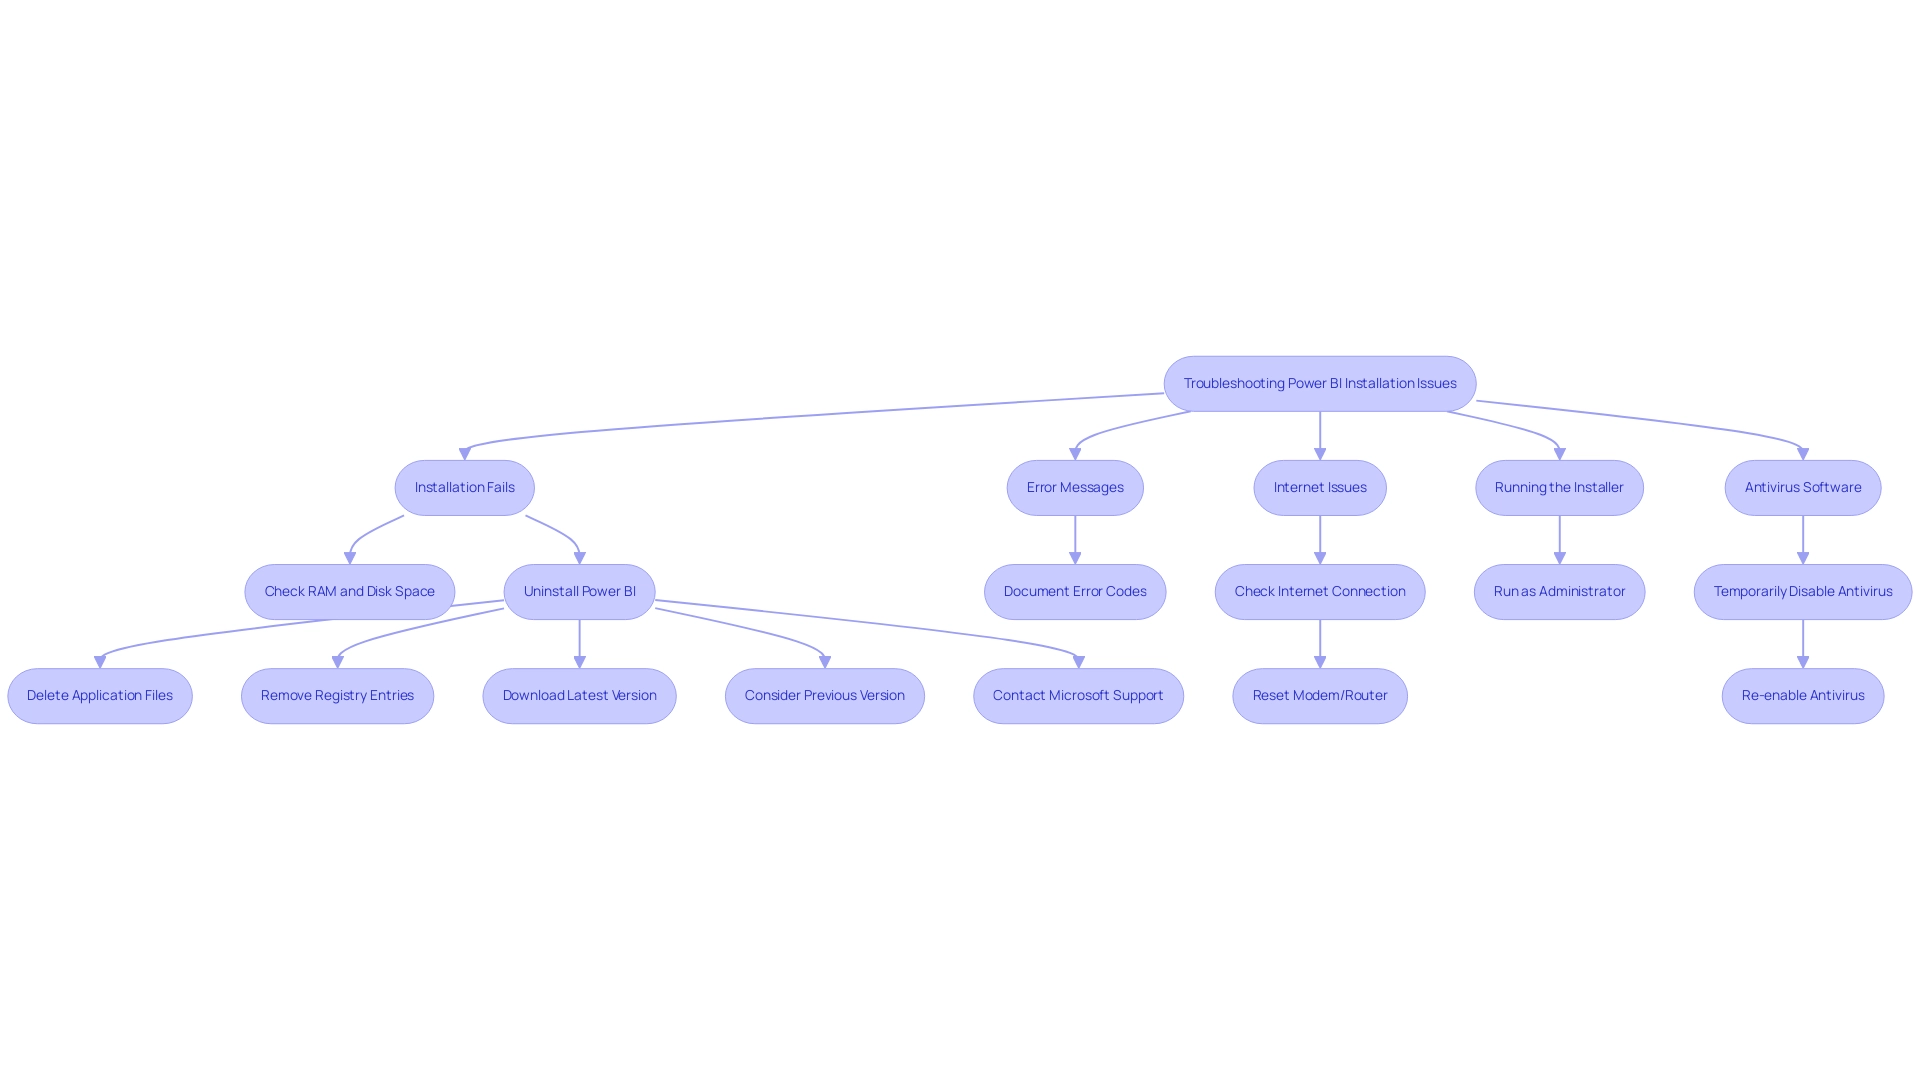
Facing problems during the PowerBI installation can be annoying, but with the correct troubleshooting measures, you can fix them effectively. Acknowledging that many users face similar challenges—with over 2,044 views on related discussions—here are some actionable solutions to ensure a smooth setup:
- Installation Fails: Verify that your system meets all prerequisites for Power BI.
-
Insufficient disk space or RAM can lead to setup failures. Ensure that you have at least 2 GB of RAM and sufficient disk space available for the PowerBI installation.
-
Error Messages: Pay close attention to any error messages that appear during the setup process.
-
Document these specific error codes, as they often lead to effective solutions tailored to your situation when searched online.
-
Internet Issues: If your download fails, check your internet connection.
- A stable connection is crucial for downloading large applications like Power BI.
-
If problems persist, consider resetting your modem or router.
-
Running the Installer: Running the installer with elevated privileges is essential for the PowerBI installation.
-
Right-click the installer and choose ‘Run as administrator’ to ensure the setup has the necessary permissions to modify system files.
-
Antivirus Software: Occasionally, antivirus programs can prevent setups.
- Temporarily disabling your antivirus software during the PowerBI installation process can assist, but remember to re-enable it afterward for your security.
In addition, organizations seeking to enhance operational efficiency should consider how deploying BI Pixie in Azure can improve information security and scalability. Furthermore, leveraging Robotic Process Automation (RPA) can streamline the report generation process, reducing the time spent on report creation and minimizing data inconsistencies. If these steps do not resolve your issues, consider reaching out to Microsoft support for further assistance with your Power BI installation.
As mentioned by Eason from the Community Support Team, it’s important to completely uninstall the PowerBI installation if you encounter persistent problems.
– You can locate the application directory in C:\Program Files\Microsoft BI Desktop\bin and delete all files within it.
– Additionally, navigate to the registry editor and remove any related folders under HKEY_LOCAL_MACHINE\SOFTWARE, HKEY_CURRENT_USER\SOFTWARE, and HKEY_USERS\.DEFAULT\Software.
After that, download the latest version of BI Desktop as part of the PowerBI installation from the Download Center or the Microsoft Store, especially if you’re using Windows 10. If your computer is not suitable for the latest version, consider reverting to an earlier version, such as the November 2021 update.
Referencing the case study on BI Admin Controls for Usage Metrics illustrates how administrators can effectively manage setup issues and user information, ensuring sensitive details are protected while enabling the analysis of usage metrics. These thorough troubleshooting suggestions not only enable you to handle typical installation problems but also guarantee a smoother setup experience with BI, while also tackling the challenges of creation and governance.
Understanding Different Versions of Power BI
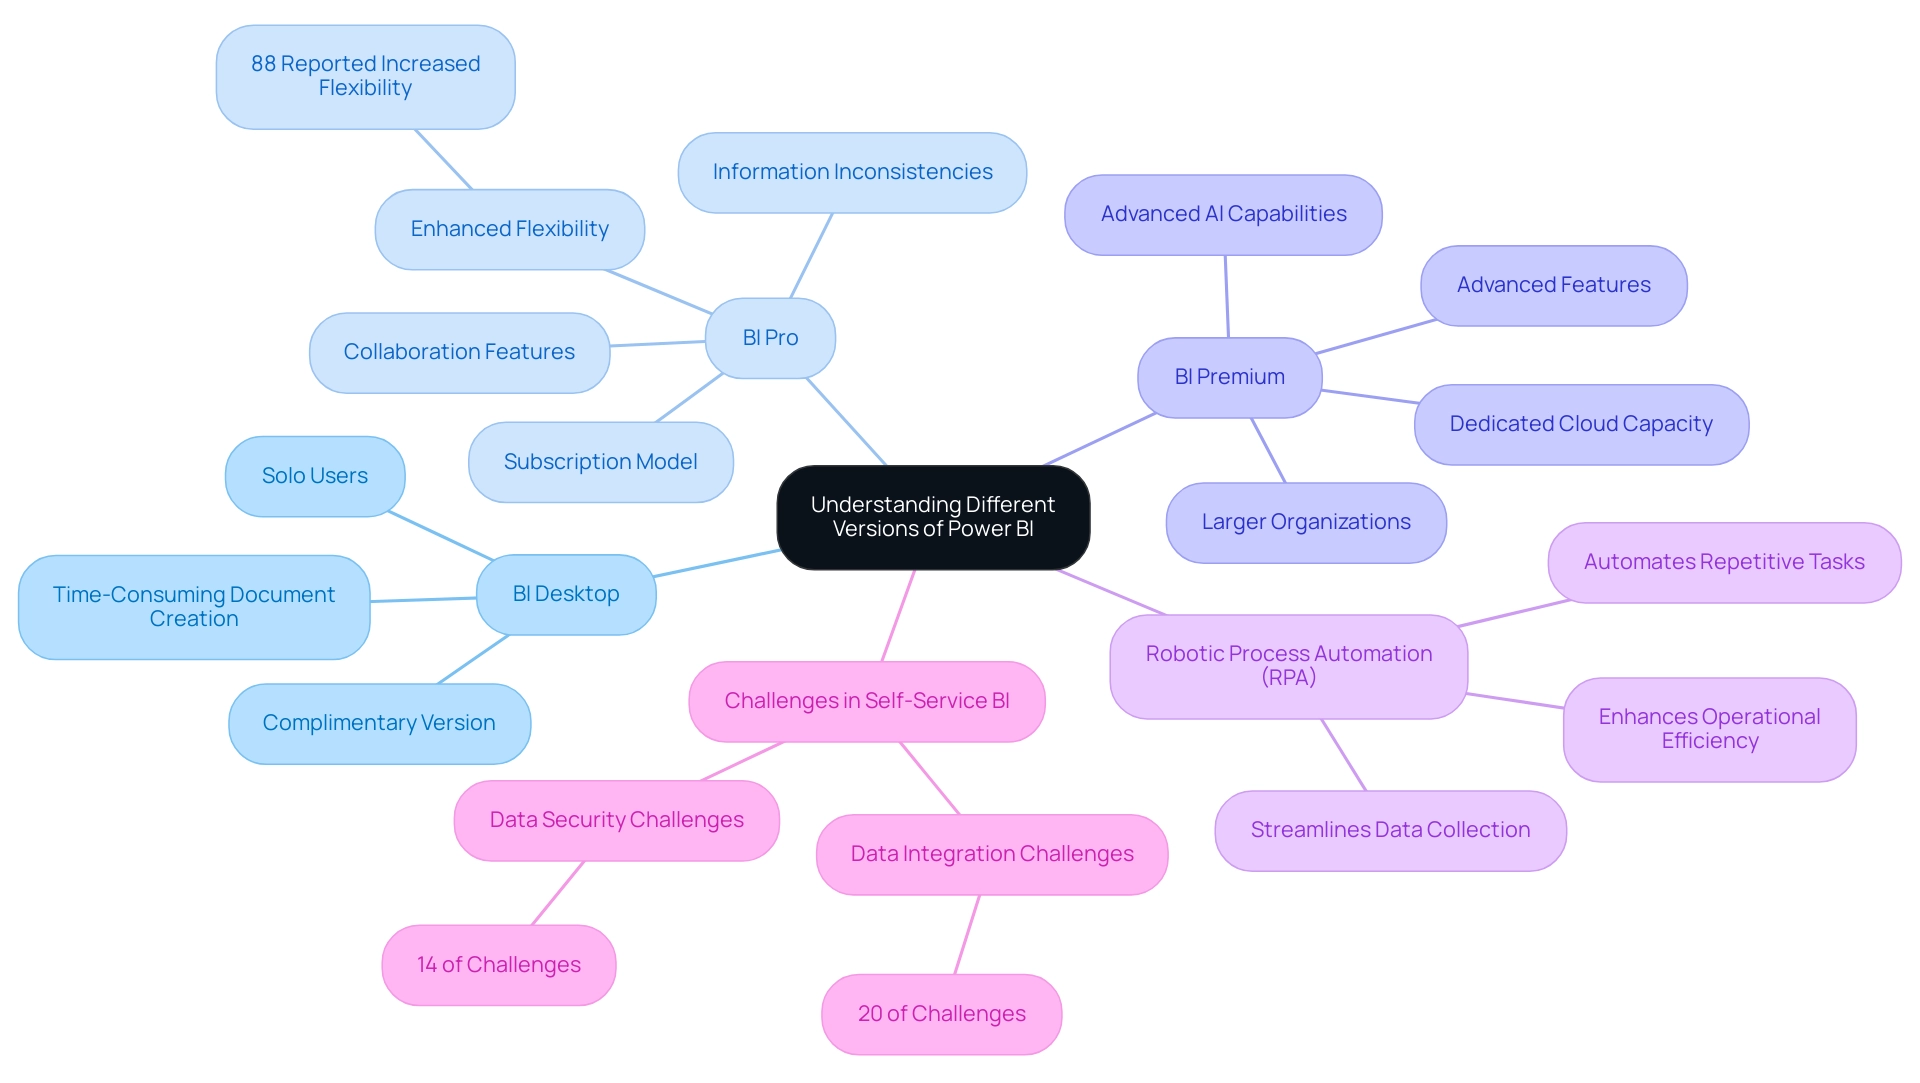
BI provides a range of versions tailored to meet various user requirements, enabling organizations to harness data effectively and overcome challenges in deriving actionable insights.
-
BI Desktop: This complimentary version is perfect for solo users who want to generate visuals and dashboards on their own.
It serves as an excellent starting point for those new to business intelligence, though users may encounter time-consuming document creation processes that hinder efficiency. -
BI Pro: A subscription-based model that facilitates collaboration and sharing of reports across teams and organizations.
BI Pro boosts team efficiency by enabling refreshes and supporting larger collections, which is vital for dynamic business environments.
Based on a survey, 88% of organizations utilizing cloud-based BI reported enhanced flexibility in accessing and analyzing information from any location, at any time, emphasizing the benefits of using BI Pro.
However, issues like information inconsistencies may still arise without proper management strategies. -
BI Premium: Tailored for larger organizations, this version provides advanced features such as dedicated cloud capacity and superior performance for extensive datasets.
BI Premium also supports greater data storage and advanced AI capabilities, making it a robust choice for enterprises looking to derive deeper insights from their data.
Microsoft’s recent acquisition of C3.ai for $6.9 billion underscores the growing importance of advanced analytics and AI in the business intelligence landscape.
In conjunction with Business Intelligence, implementing Robotic Process Automation (RPA) can significantly enhance operational efficiency.
RPA tools, such as EMMA RPA and Microsoft Automation, can automate repetitive tasks, reducing task repetition fatigue and addressing staffing shortages.
By streamlining data collection and report generation processes, RPA allows teams to focus on analyzing insights rather than getting bogged down by manual tasks.
Choosing the suitable version of BI is essential to maximizing its potential.
By aligning the chosen version with organizational operational needs and budget constraints, users can fully utilize BI’s robust capabilities.
Addressing challenges in self-service business intelligence, such as data integration and security, is essential for successful adoption, especially in light of the BFSI sector’s projected growth in the business intelligence market from 2023 to 2032.
Post-Installation Setup and Configuration for Power BI
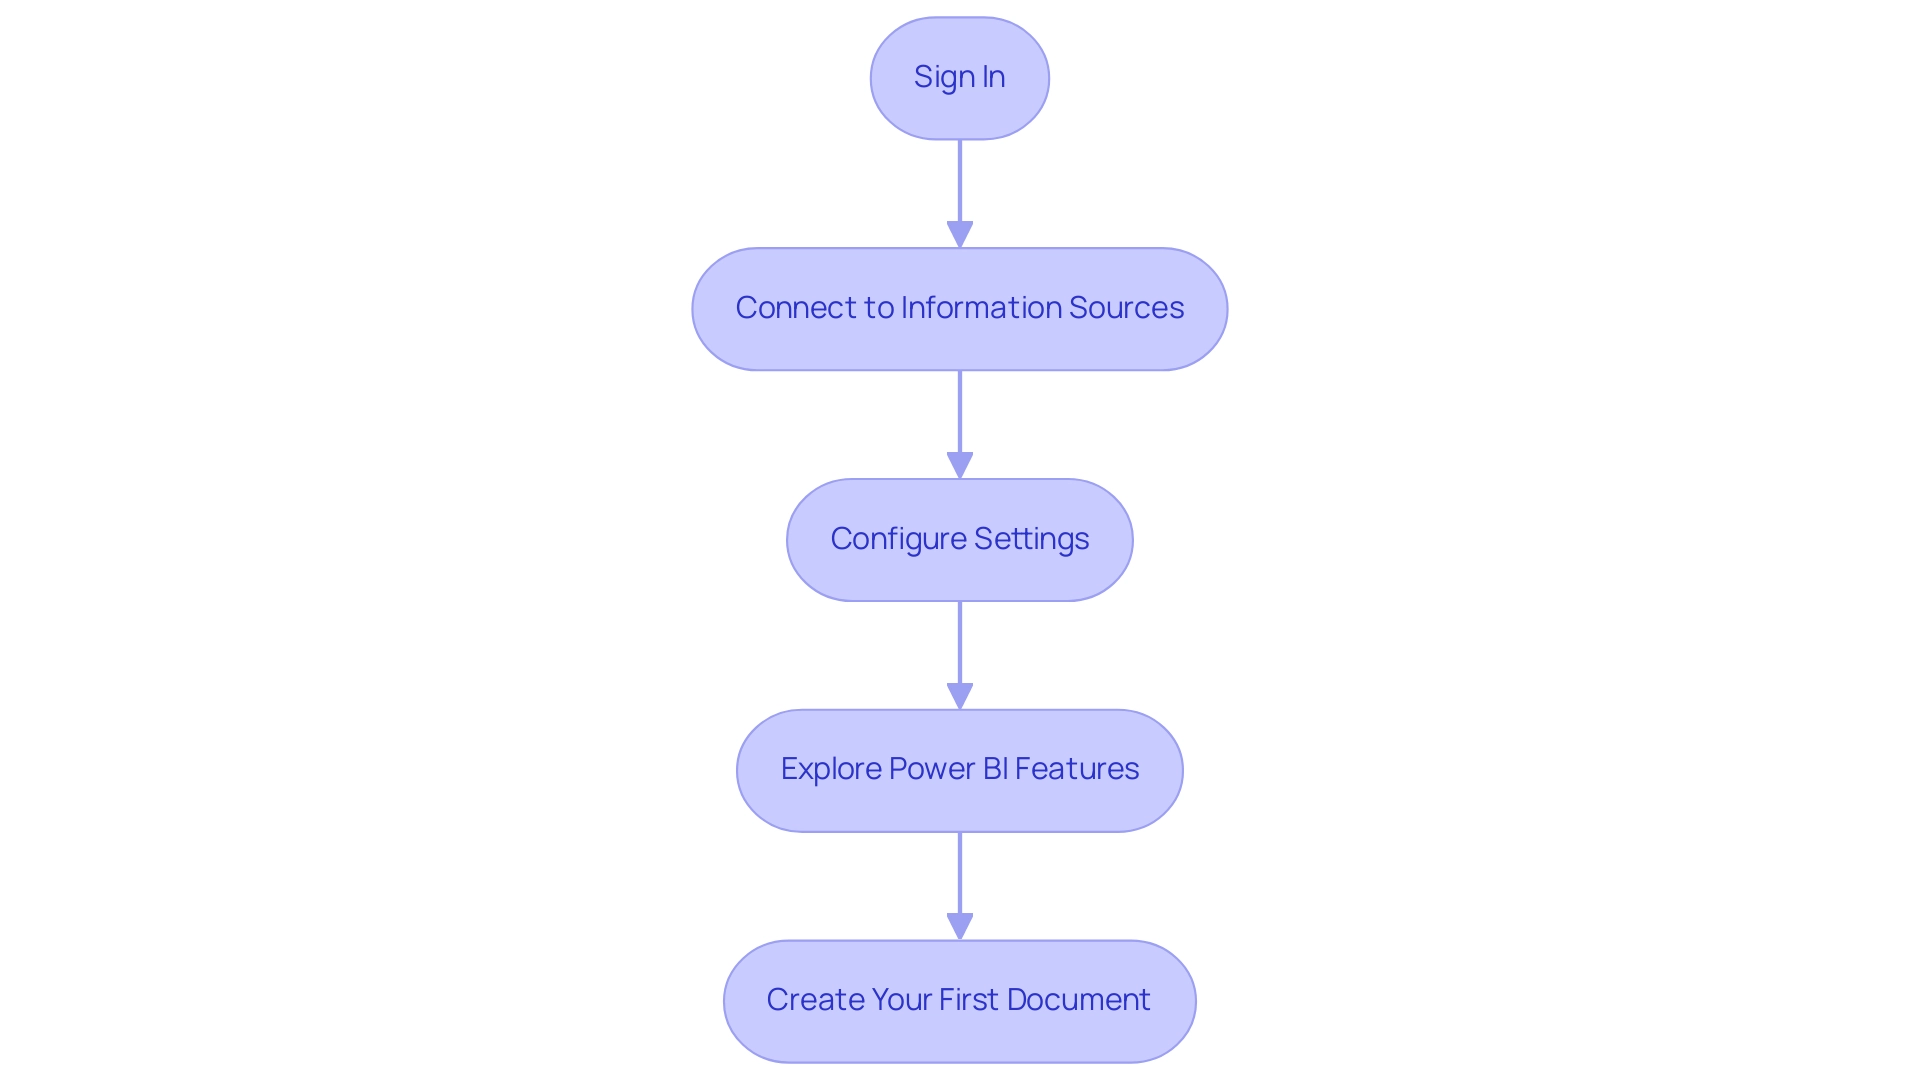
Once you have successfully installed BI, follow these strategic steps to set it up effectively:
- Sign In: After completing the Power BI installation, launch the application and sign in with your Microsoft account. If you don’t already have one, you can create an account during this process.
- Connect to Information Sources: Utilize the ‘Get Information’ feature to establish connections with various information sources, including Excel, SQL Server, and online services tailored to your needs.
- Configure Settings: Navigate to the ‘File’ menu and select ‘Options and settings’. Here, you can fine-tune preferences such as information load options and regional settings to optimize performance.
- Explore Power BI Features: Spend some time familiarizing yourself with the interface. Explore features such as dashboards, summaries, and datasets to understand how they can be utilized for your analysis.
- Create Your First Document: Begin by designing a simple document. This practical experience will enable you to understand the features of BI and the importance of Power BI installation for meeting your specific information requirements.
By completing the Power BI installation and finishing these steps, you will be well-equipped to leverage BI’s capabilities for comprehensive analysis and visualization. In an information-rich environment, the role of Business Intelligence in enhancing operational efficiency is crucial; organizations must overcome challenges like time-consuming report creation and inconsistencies to leverage insights effectively. As the market for social business intelligence is projected to reach $25,886.8 million by 2024, ensuring your team is adept at using tools like Power BI and RPA solutions such as EMMA RPA and Power Automate is crucial.
With the BFSI sector predicted to experience the fastest growth in business intelligence from 2023 to 2032, the relevance of effective tools cannot be overstated. Notably, user adoption rates can vary significantly; 26% of users achieve full utilization at 50% capacity, while 58% remain below 25%. This underscores the importance of a thorough setup process and adequate user training to ensure effective data-driven decision-making.
Additionally, a recent case study showcased how the narrative visual with Copilot can be embedded in applications, streamlining workflows by allowing organizations to refresh data with user-specific information, further enhancing operational efficiency and data usability.
Conclusion
Ensuring a successful installation and effective use of Power BI is pivotal for organizations aiming to harness the power of data-driven decision-making. By first confirming that system prerequisites are met, users can streamline the installation process and enhance overall performance. The step-by-step guide provided offers a clear pathway to successfully installing Power BI, empowering users to unlock its robust capabilities and drive operational efficiency.
Addressing common installation issues through proactive troubleshooting can prevent disruptions and facilitate a smoother setup experience. Understanding the distinctions between Power BI versions allows organizations to choose the right fit for their specific needs, ensuring they maximize the tool’s potential. Moreover, post-installation setup steps, such as connecting to data sources and configuring settings, are crucial for leveraging Power BI’s full range of features.
Ultimately, by following these guidelines, organizations can overcome initial hurdles and fully embrace the transformative capabilities of Power BI. This not only leads to improved report creation and data consistency but also fosters a culture of informed decision-making that is essential for thriving in today’s competitive landscape. Embracing Power BI as part of the organizational strategy will pave the way for deeper insights and enhanced operational efficiency, making it a valuable asset in the journey towards data excellence.
Introduction
In an age where data drives decision-making and operational efficiency, the ability to maintain up-to-date insights is crucial for organizations striving to stay competitive. Scheduled refresh in Power BI emerges as a powerful solution, allowing teams to automate data updates and ensure reports reflect the latest information. This functionality not only minimizes the risk of human error but also enhances consistency across reports—two significant challenges that often hinder effective data management.
By delving into the intricacies of scheduled refresh, from prerequisites to troubleshooting common issues, organizations can unlock the full potential of their data analytics efforts. Embracing best practices and leveraging innovative tools such as Robotic Process Automation (RPA) can further streamline these processes, empowering teams to focus on strategic initiatives rather than time-consuming manual tasks.
As businesses prepare for the evolving landscape of business intelligence, understanding and optimizing scheduled refresh capabilities in Power BI is essential for informed decision-making and sustained growth.
Understanding Scheduled Refresh in Power BI
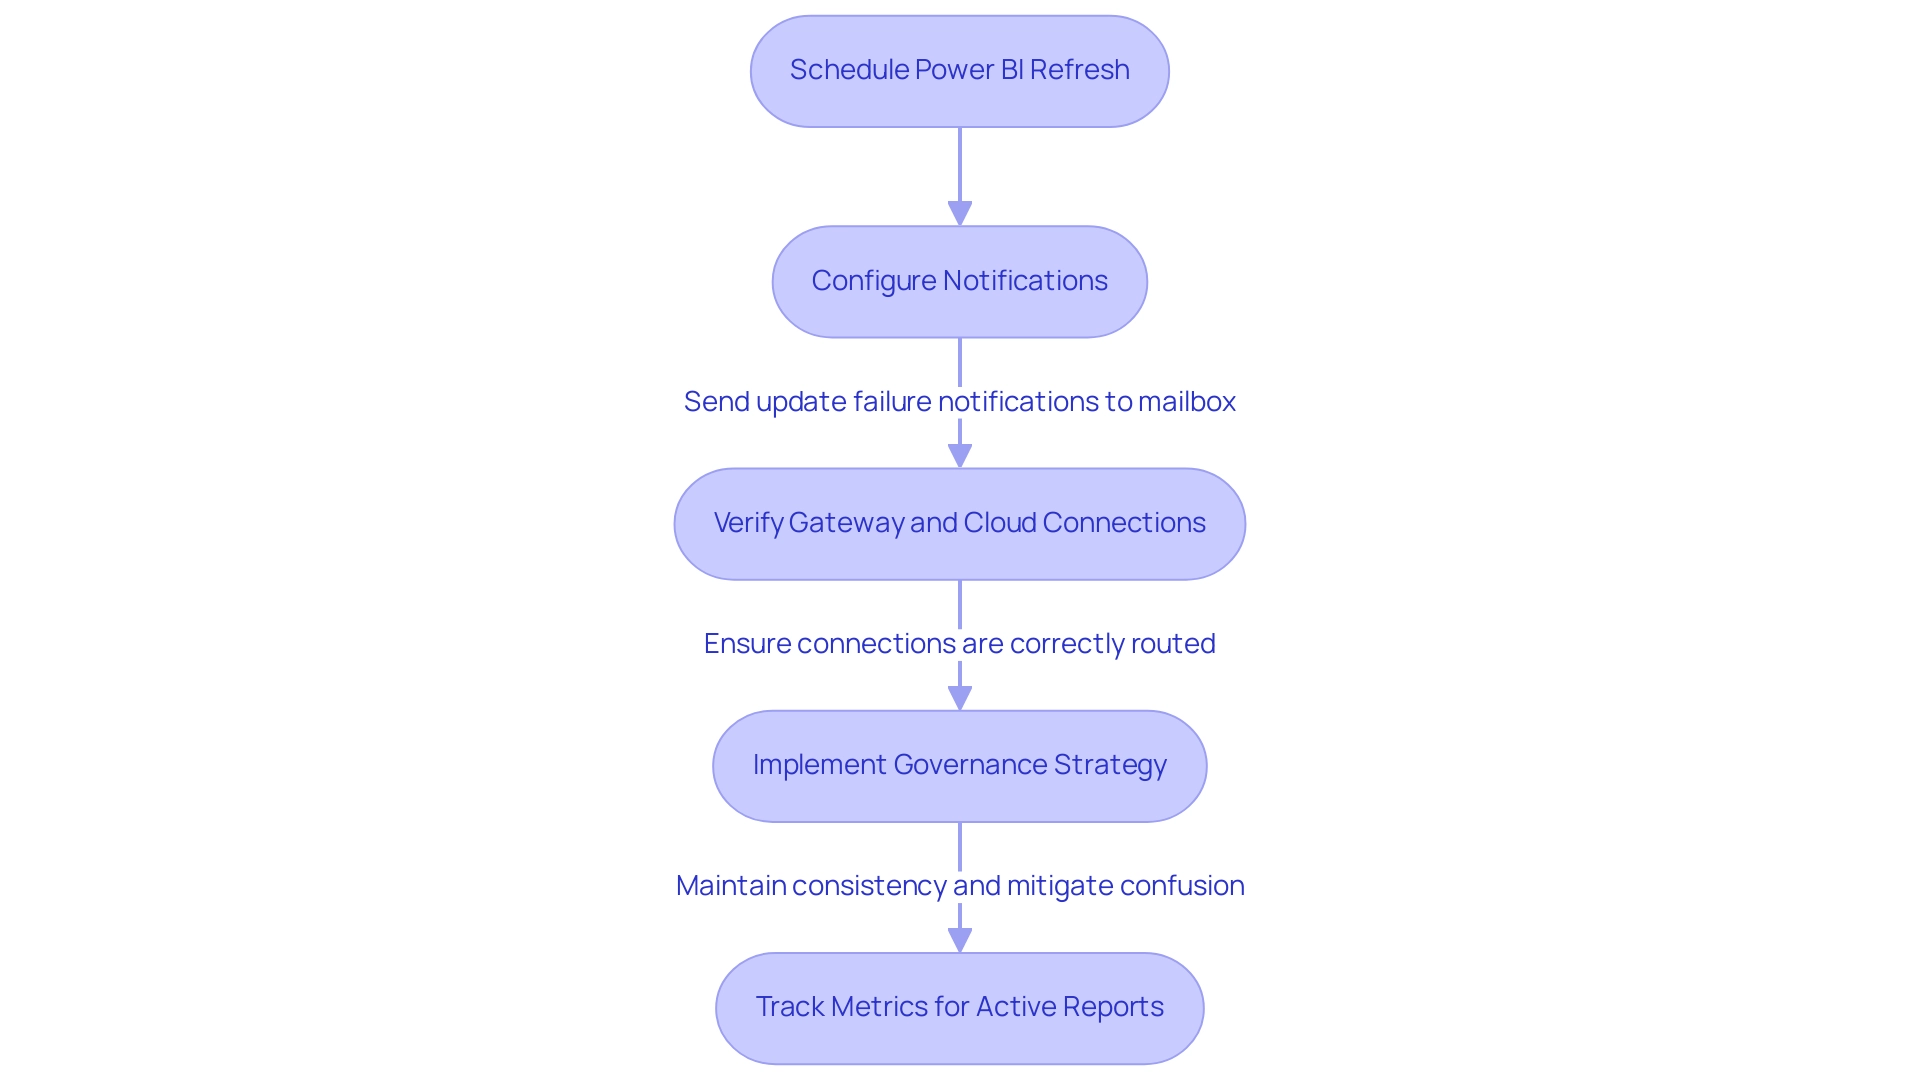
The feature that allows organizations to schedule Power BI refresh is vital, as it enables automatic updates of datasets at defined intervals, ensuring that reports reflect the most current information. This capability is especially advantageous for businesses that rely on real-time information analysis for informed decision-making. By implementing a schedule power bi refresh, teams can eliminate the need for manual updates, significantly reducing the risk of errors and enhancing consistency across reports—key challenges often faced due to time-consuming report creation and data inconsistencies.
Significantly, it can take Power BI up to 60 minutes to update a semantic model when using the ‘Refresh now’ option, emphasizing the time efficiency gained through scheduling.
Furthermore, ensuring that Power BI is configured to send update failure notifications directly to your mailbox can help address any issues promptly. It’s also crucial to verify that ‘Gateway and cloud connections‘ are routed and applied correctly, as this can affect the overall effectiveness of the update strategy. A strong governance strategy is essential to maintain consistency and mitigate confusion, addressing prevalent issues in report accuracy.
As highlighted by industry expert Sal Alcaraz, organizations utilizing a Premium license can perform up to 48 refreshes per day, with the potential to increase this limit by enabling an XMLA Endpoint. Grasping the complexities of planned updates is essential for optimizing Power BI’s functionalities, particularly as companies aim to schedule Power BI refresh to utilize the newest enhancements and features in 2024. Furthermore, the General Management App improves your reporting strategy by offering comprehensive management, custom dashboards, and smooth information integration, tackling the frequent problem of reports lacking actionable guidance.
A case study titled ‘Active Reports and Viewer Counts’ demonstrates the effectiveness of regular updates, where metrics such as total views and total viewers were tracked, leading to improved report management and enhanced user engagement. This emphasizes the significant effect that a well-executed update strategy can have on data accuracy and operational efficiency within your organization, reinforcing the importance of real-time data analysis in business intelligence.
Prerequisites for Setting Up Scheduled Refresh
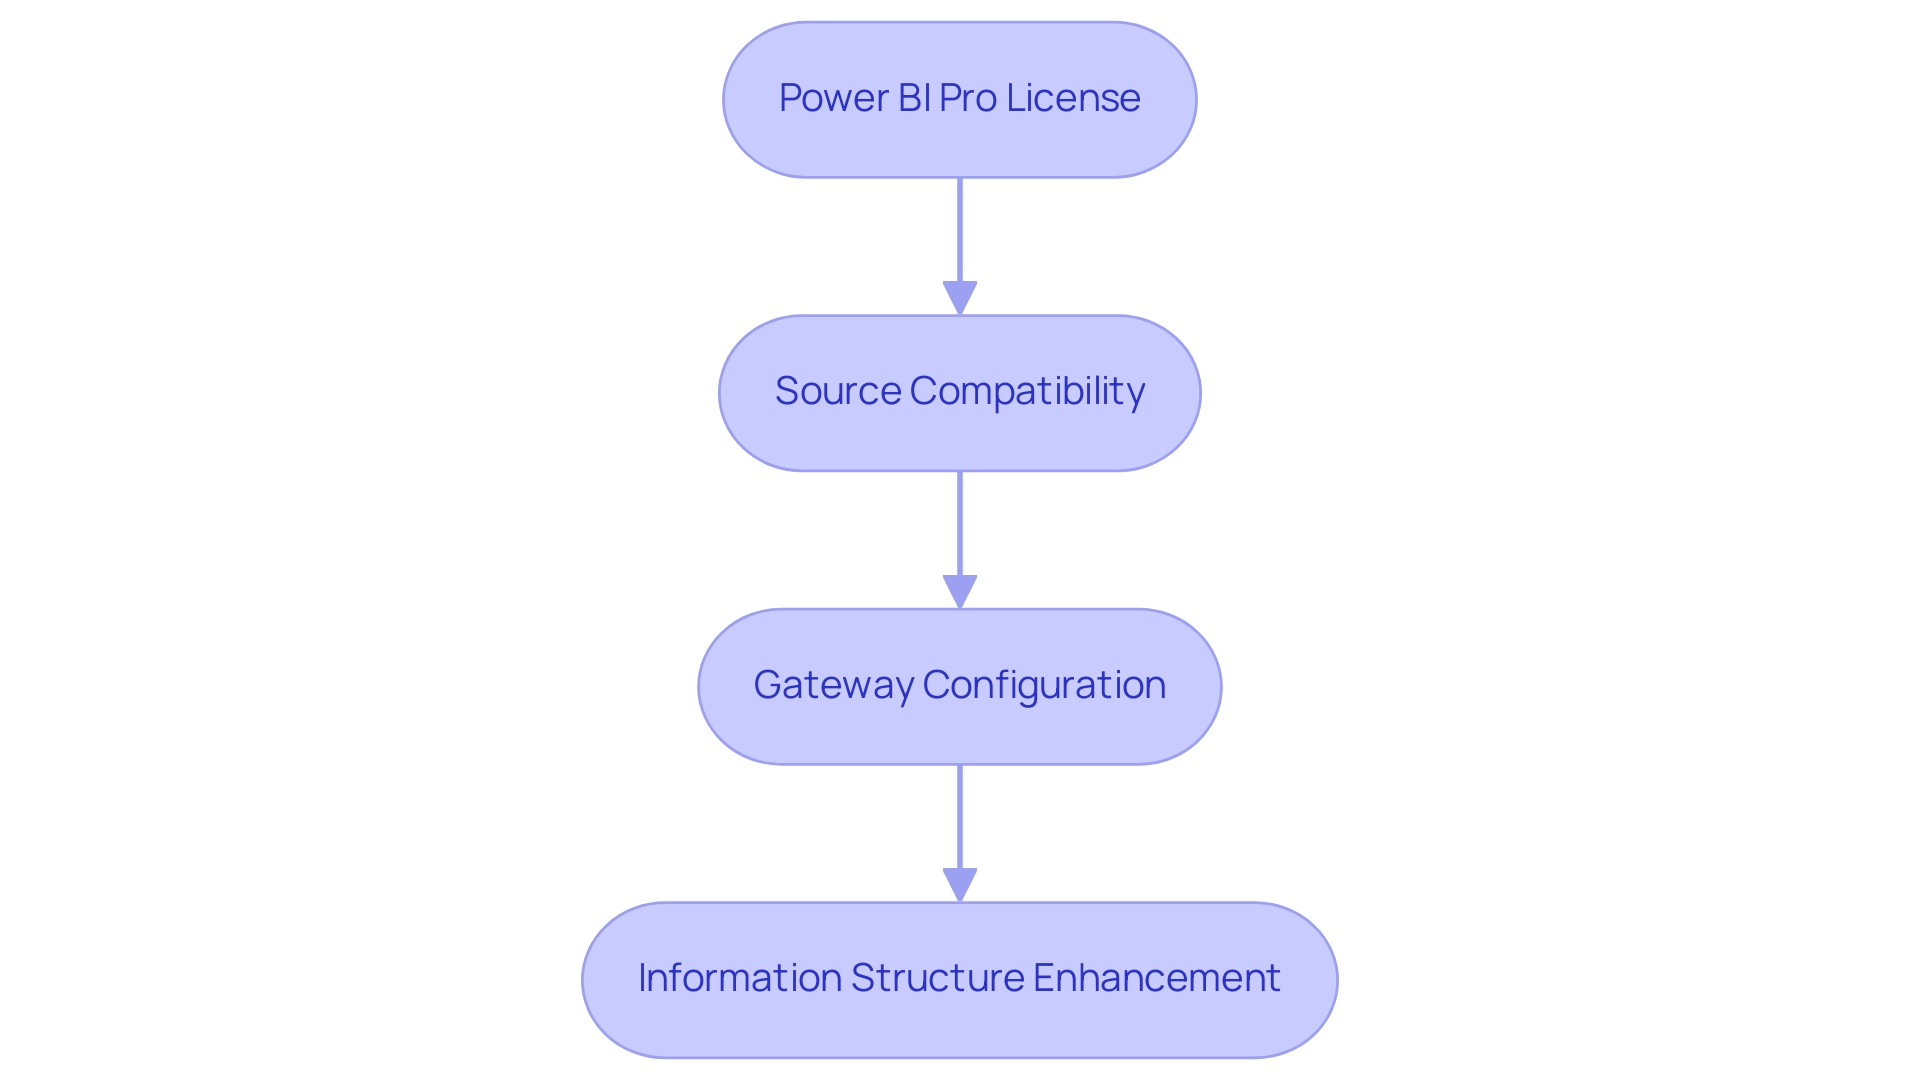
To successfully establish a timed refresh in BI, it’s crucial to meet the following prerequisites:
- A Power BI Pro license is essential to schedule Power BI refreshes in the Power BI Service. Be mindful that if the license remains inactive for an extended period, such as six months, it may not be utilized effectively.
- Source Compatibility: Verify that your sources are suitable for scheduled refreshes. Commonly supported sources include Azure SQL Database, SharePoint Online, and SQL Server.
- Gateway Configuration: For on-premises information sources, ensure that an On-premises Gateway is configured. This gateway is essential for facilitating seamless information transfer between your sources and Power BI.
- Information Structure Enhancement: Enhance your information structure for performance. Larger datasets can result in extended update times, so efficient modeling is key.
By meeting these prerequisites, you will be well-equipped to schedule Power BI refresh, which will enhance the efficiency of your operations and address the prevalent challenges of time-consuming report creation and inconsistencies that can undermine trust in your insights. To further enhance actionable guidance, consider utilizing Power BI features such as alerts and dashboards that provide real-time insights and direction. Additionally, integrating RPA tools can automate repetitive information handling tasks, streamlining your processes and allowing your team to focus on analysis rather than report creation. As noted by experts, many of the capabilities discussed here are not available to Fabric administrators, underscoring the need for the right licensing and setup. Organizations that have effectively met these requirements have reported significant improvements in their information management processes, facilitating information-driven decision-making that can drive growth and innovation.
Step-by-Step Guide to Configuring Scheduled Refresh in Power BI Service
Configuring a schedule power bi refresh in the BI Service is essential for maintaining up-to-date reports, thereby enhancing your ability to leverage data-driven insights for operational efficiency. RPA solutions can play a pivotal role in automating the scheduling and management of these data refreshes, further streamlining the process. Follow these detailed steps to ensure a seamless setup:
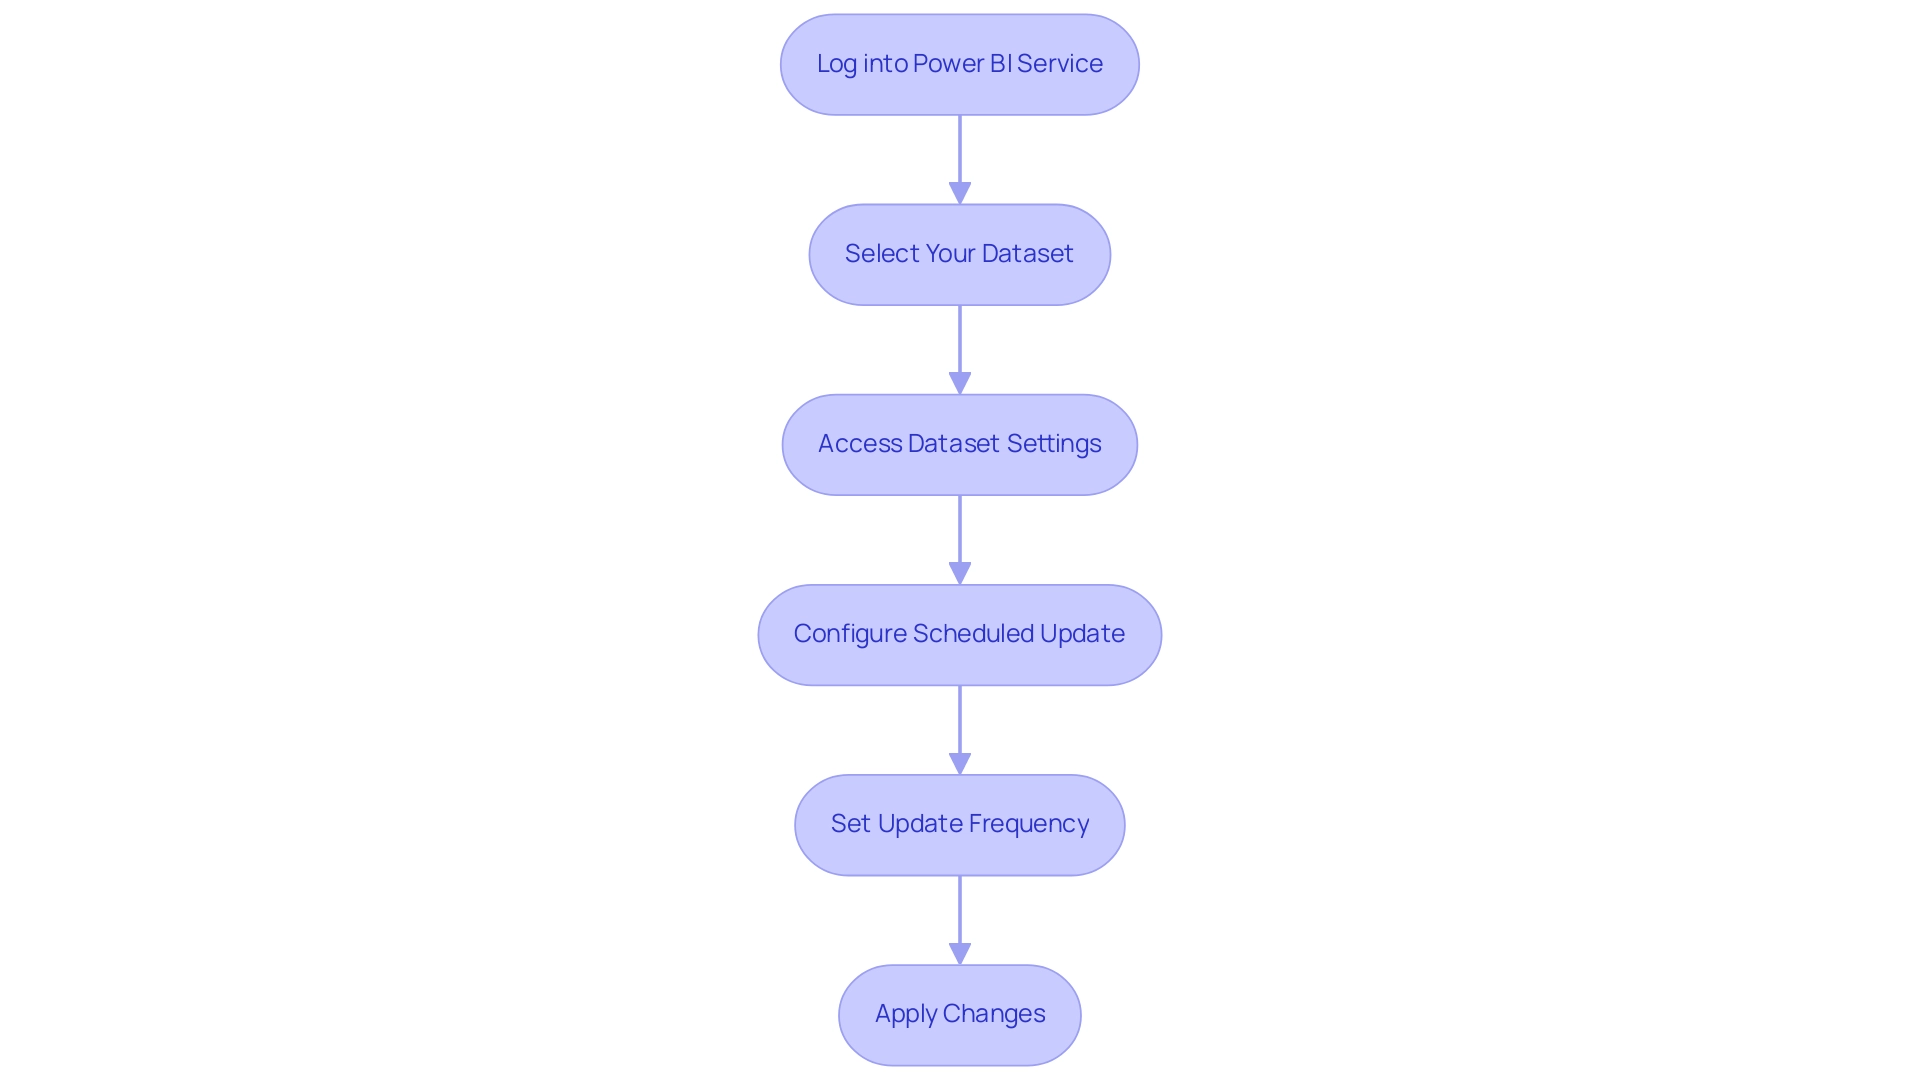
- Log into Power BI Service: Begin by navigating to the Power BI Service at https://app.powerbi.com and logging in with your credentials.
- Select Your Dataset: In the left navigation pane, click on ‘Datasets’ to locate the specific dataset you plan to update.
- Access Dataset Settings: Click on the ellipsis (…) next to your selected dataset, then choose ‘Settings’ to access the configuration options.
- Configure Scheduled Update: Scroll down to the ‘Scheduled update’ section. Here, toggle the ‘Keep information updated’ switch to ‘On’ to enable automatic update.
- Set Update Frequency: Choose your desired update frequency, either daily or weekly, and select the appropriate time zone. Indicate the moments when you wish the update to take place for optimal information retrieval.
- Apply Changes: Click ‘Apply’ to save your settings. In this section, you can also choose to set up email notifications for any update failures, providing you with timely updates.
By following these steps, you will successfully schedule power bi refresh for your dataset, which will ensure that your reports reflect the most recent information available. This proactive approach not only streamlines report creation but also minimizes inconsistencies—common challenges faced by operations directors. Remember, a semantic model can utilize only a single gateway connection, so ensure that all necessary data source definitions are included in that same gateway.
For new updates, it is advisable to utilize the certified Supermetrics connector, as this helps streamline the update process. Keep in mind that the business intelligence tool will deactivate your update schedule after four consecutive failures, making it essential to monitor your update settings for consistent performance.
As Denys Arkharov, a BI Engineer at Coupler.io, states, “A notable achievement in my career was my involvement in creating Risk Indicators for Ukraine’s ProZorro platform, a project that led to my work being incorporated into the Ukrainian Law on Public Procurement.” This emphasizes the importance of efficient information management in BI. Moreover, the case study on utilizing BI Gateway for On-Premises Information Sources illustrates how mapping the gateway’s information source to the report’s semantic model facilitates the ability to schedule power bi refresh for reports using on-premises information sources.
Businesses that struggle to leverage these data-driven insights often find themselves at a competitive disadvantage, making the integration of RPA solutions crucial for optimizing data management and operational efficiency.
Troubleshooting Common Issues with Scheduled Refresh
When handling planned refreshes in Power BI, several common issues may arise, but with the right strategies, you can troubleshoot effectively:
-
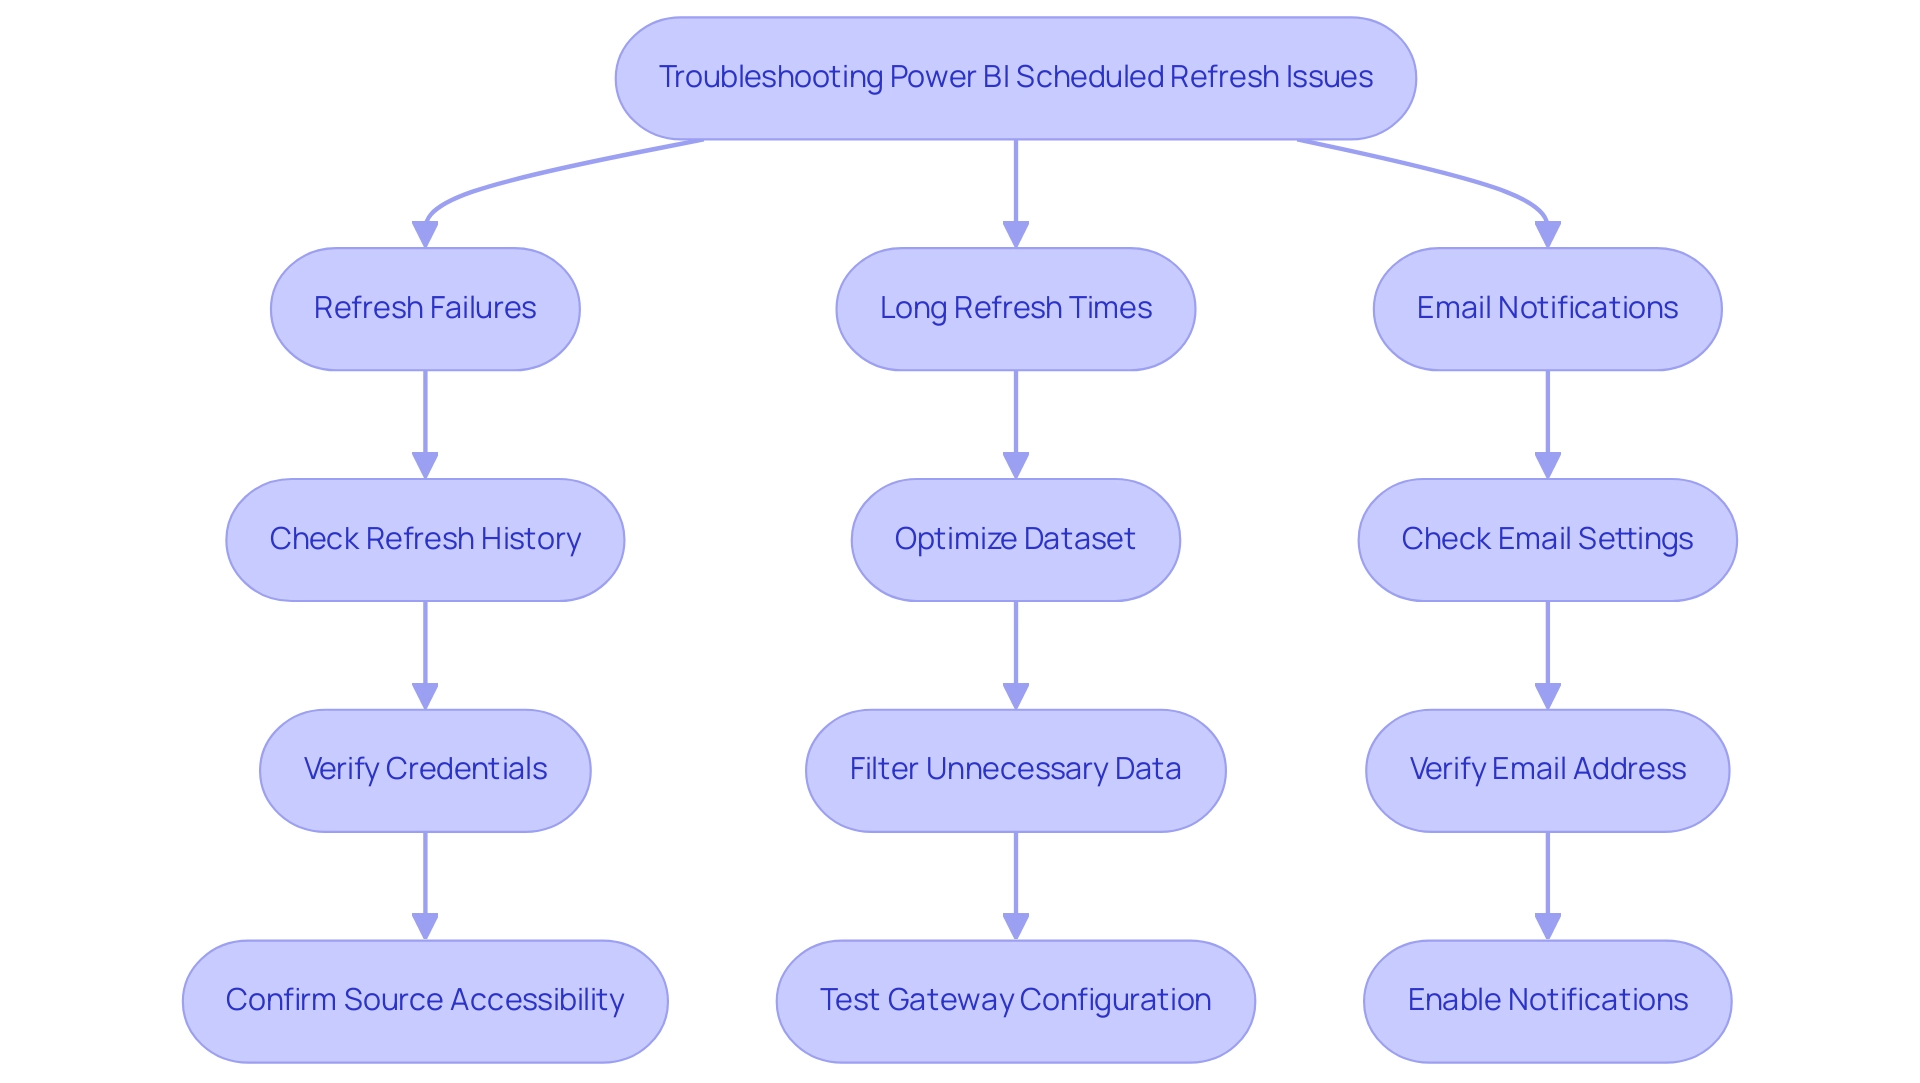
Refresh Failures: If a scheduled refresh fails, the first step is to examine the error message in the refresh history. Often, such failures arise from invalid credentials or source connectivity issues. Confirm that your credentials are accurate and that the information source is accessible. Rena, from Community Support, emphasizes a crucial concern:
When did the last planned update and manual update occur independently? When SQL Server (the count: 4,232,405) is updated? Is it possible that the planned refresh operation has concluded, but the information in SQL Server has not been updated yet? Being aware of these nuances can help clarify the situation and emphasizes the importance of monitoring SQL Server updates in relation to the scheduled Power BI refresh, particularly in a landscape where a lack of governance strategy can lead to inconsistencies, confusion, and mistrust.
-
Long Refresh Times: If your refreshes are taking longer than anticipated, optimizing your model is essential. This can be achieved by reducing dataset size or filtering out unnecessary data. Additionally, ensure that your On-premises Data Gateway is properly configured and up to date. Regular testing of update scenarios is a best practice that helps prevent last-minute issues. The case study on Best Practices for Power BI Update Operations emphasizes that to schedule Power BI refresh, proactive management and regular testing can significantly enhance the reliability and efficiency of update processes. Remember, in today’s data-rich environment, efficiency in managing these processes is vital to avoid the pitfalls of time-consuming report creation and to leverage the full potential of Business Intelligence for informed decision-making.
-
Email Notifications: Not receiving notifications for update failures can hinder your ability to respond promptly. Verify that your email settings in the dataset configuration are accurate. Ensure that the email address is valid and that notifications are enabled. By taking these steps, you can maintain an agile decision-making process and ensure precise information reporting, transforming raw information into actionable insights that drive growth and innovation. The possible misunderstanding and distrust that can emerge from inconsistencies in information emphasize the importance of tackling these problems proactively.
Comprehending these frequent issues and their resolutions will enable you to efficiently schedule Power BI refresh for your planned updates, thus improving information accuracy and operational effectiveness.
Best Practices for Optimizing Scheduled Refresh in Power BI
To enhance the efficiency of your scheduled refreshes in Power BI while addressing the challenges of manual, repetitive tasks, consider implementing the following best practices while leveraging Robotic Process Automation (RPA) to automate workflows:
-
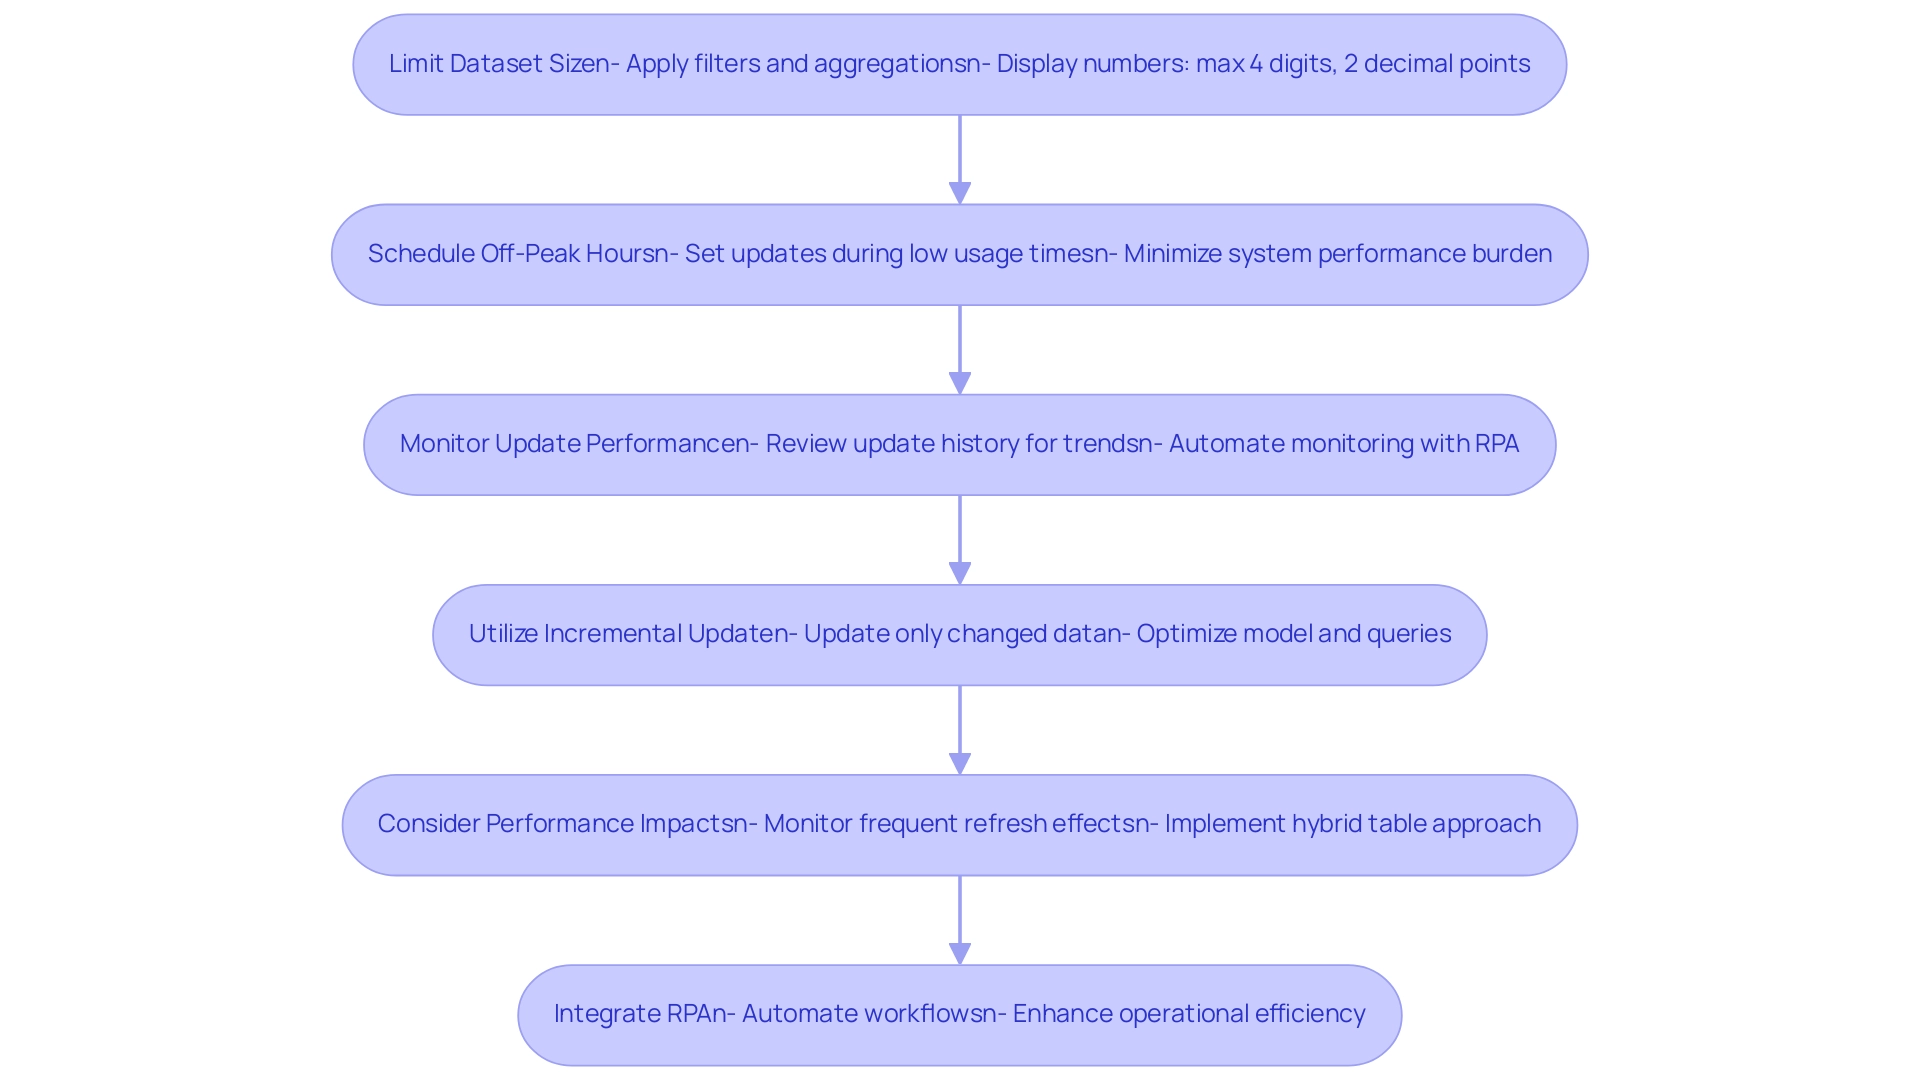
Limit Dataset Size: Streamline your update processes by decreasing the amount of information updated at each interval. This can be achieved by applying filters or aggregating data whenever possible.
Smaller datasets not only update more rapidly but also enhance overall performance. Additionally, limiting displayed numbers to four numerals and decimal points to two decimal points improves readability and consistency across reports. -
Schedule Off-Peak Hours: Strategically set your update schedules for off-peak hours.
This timing minimizes the burden on system performance and ensures that sufficient resources are available for other critical tasks, leading to smoother operations. -
Monitor Update Performance: Consistently review the update history to identify trends in update durations and any failures.
Examining this information enables you to make informed choices regarding management and update strategies, ultimately enhancing performance.
By integrating RPA, this monitoring can be automated, freeing your team to focus on strategic initiatives and reducing the errors associated with manual oversight. -
Utilize Incremental Update: For larger datasets, explore the option of incremental update.
This technique allows you to update only the information that has changed since the last refresh, rather than reloading the entire dataset, thus improving efficiency.
As highlighted by community expert Dino Tao, it is essential to monitor and optimize your model and queries to mitigate potential performance issues that can arise from frequent intraday refreshes. -
Consider Performance Impacts: Be mindful of the performance ramifications of frequent intraday refreshes, especially with larger datasets.
Dino Tao emphasizes the importance of ensuring consistency between historical and real-time information segments, suggesting that implementing a hybrid table approach can help maintain this consistency without significant performance penalties.
Real-World Example: Consider the case study of using an Enterprise Data Gateway, which connects a semantic model to on-premises information sources.
Proper configuration and permissions allow gateway administrators to manage source definitions effectively, ensuring that the semantic model can access the necessary sources, thus optimizing refresh performance.
By adopting these best practices and leveraging RPA, you can significantly improve the performance and reliability of your scheduled Power BI refreshes.
This integration leads to more effective data management and informed decision-making, empowering your operations with timely and accurate insights.
Additionally, as the AI landscape evolves, RPA can adapt to these changes, further enhancing operational efficiency and reducing the burden of manual workflows.
Conclusion
Implementing scheduled refresh in Power BI is a vital step towards ensuring that organizations remain agile and data-driven in decision-making. By automating data updates, teams can eliminate the potential for human error and enhance the consistency of reports, addressing common challenges in data management. The prerequisites for setting up a scheduled refresh include:
- Having a Power BI Pro license
- Compatible data sources
These prerequisites provide a solid foundation for optimizing data operations.
Following a structured approach to configuring scheduled refresh not only streamlines the reporting process but also enables teams to focus on strategic initiatives rather than repetitive tasks. Troubleshooting common issues, such as:
- Refresh failures
- Long refresh times
is essential for maintaining a reliable data environment. By adopting best practices, including:
- Limiting dataset size
- Scheduling refreshes during off-peak hours
organizations can significantly enhance the efficiency of their data operations.
Incorporating innovative tools like Robotic Process Automation (RPA) further empowers teams to optimize their workflows, ensuring that data-driven insights are readily available for informed decision-making. Embracing these strategies will not only improve operational efficiency but also foster a culture of accurate data reporting, ultimately driving growth and innovation within the organization. As the landscape of business intelligence continues to evolve, mastering scheduled refresh capabilities in Power BI will be crucial for sustaining a competitive edge.
Introduction
In the rapidly evolving landscape of data management, Power BI Dataflows emerge as a transformative solution for organizations seeking to harness their data effectively. As businesses grapple with the complexities of data preparation and analysis, these cloud-based tools offer a streamlined approach to ingesting, transforming, and integrating data, paving the way for insightful reporting.
However, the journey to optimizing Power BI Dataflows is not without its challenges. From establishing clear roles to implementing best practices, organizations must navigate a series of strategic steps to unlock the full potential of their data initiatives.
This article delves into the essentials of Power BI Dataflows, providing a comprehensive guide to creating, managing, and maximizing their benefits, ultimately empowering teams to make informed decisions and drive operational efficiency.
Introduction to Power BI Dataflows: What You Need to Know
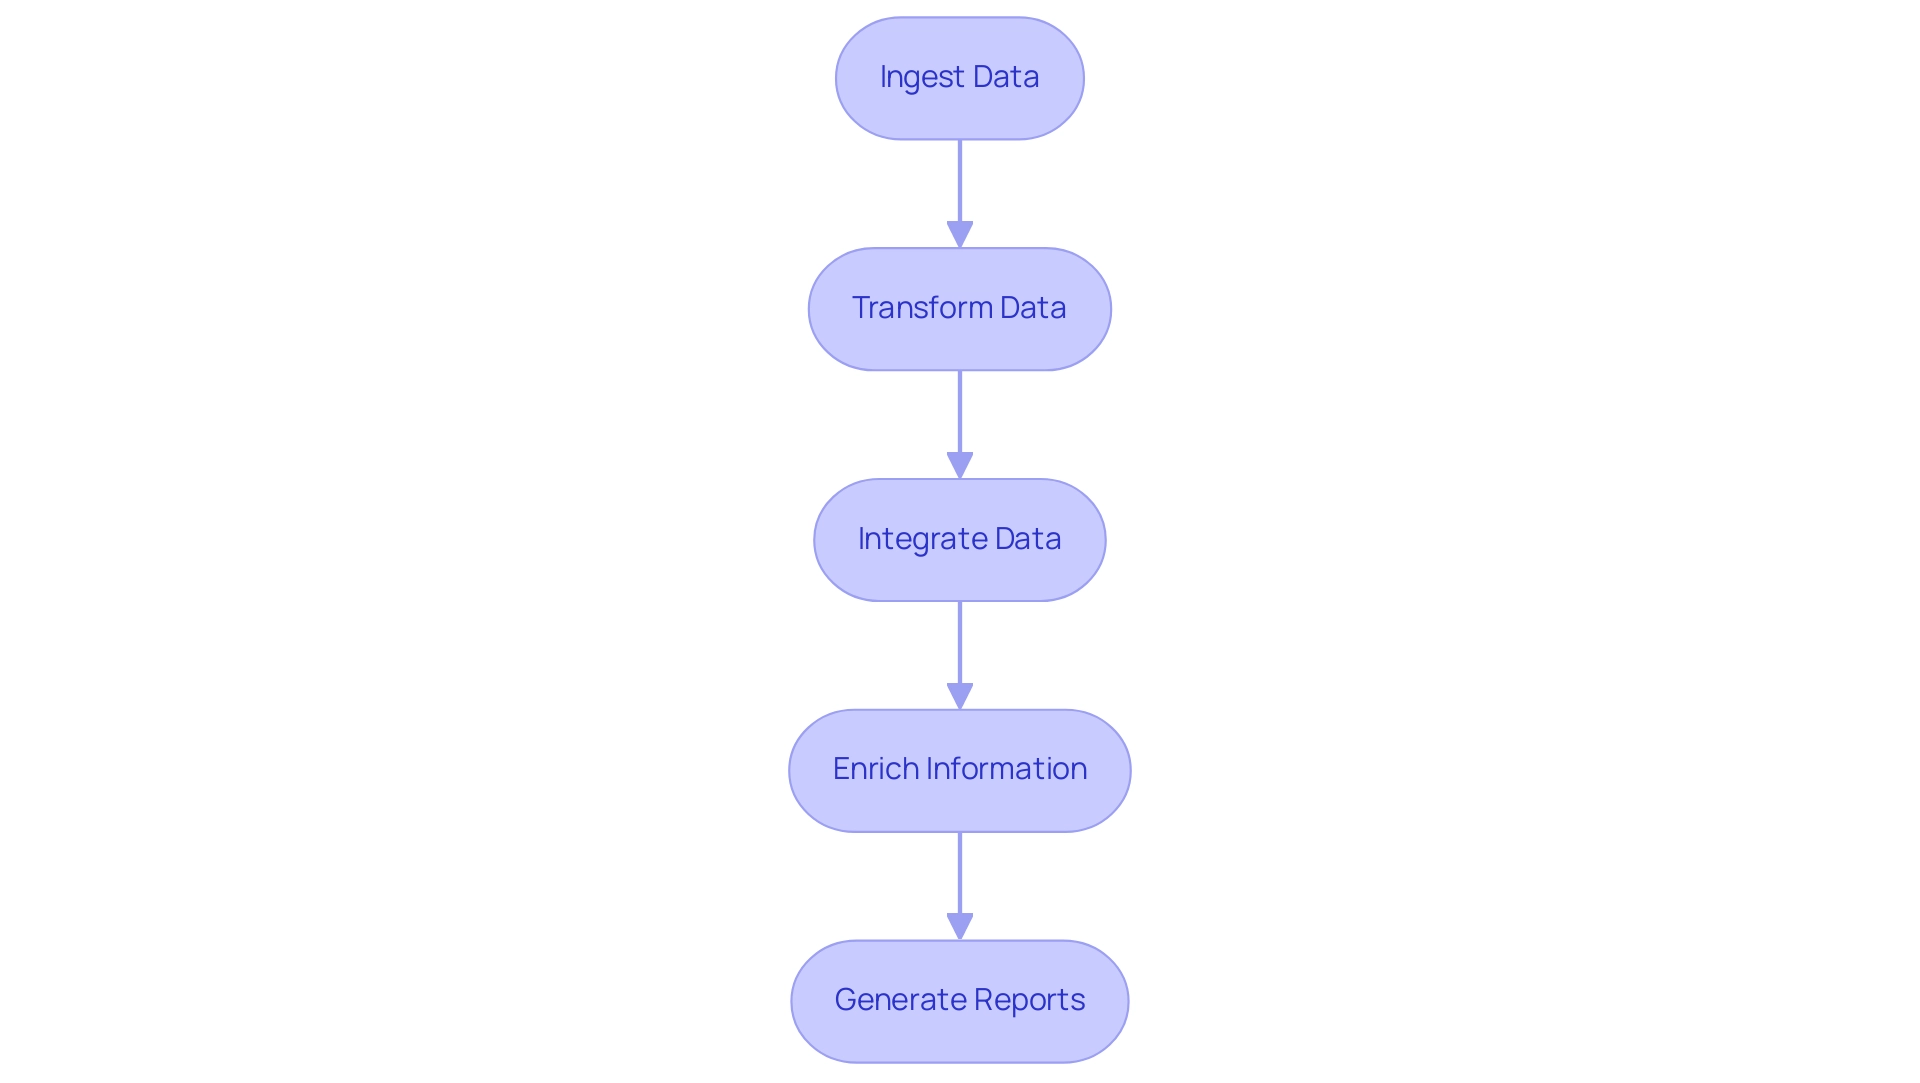
Powerful BI workflows act as an effective cloud-based information preparation tool, allowing users to efficiently ingest, transform, integrate, and enrich information for insightful reporting and analysis. In today’s data-rich environment, failing to extract meaningful insights can leave your business at a competitive disadvantage. Establishing roles and responsibilities is essential for a successful BI initiative, as it guarantees stakeholder involvement and clarity throughout the information handling process.
By focusing on information management tasks, these workflows enable the development of reusable transformations, ensuring consistency across various reports. The integration of dataflow Power BI within the BI ecosystem is essential; they automate preparation processes, significantly lowering manual efforts and improving collaboration among teams. Moreover, the challenges associated with leveraging insights from BI dashboards—such as time-consuming report creation and data inconsistencies—can be addressed through our tailored BI services.
Notably, our 3-Day Business Intelligence Sprint allows for rapid development of professionally designed reports, while the General Management App enhances overall management and review processes. As Tajammul Pangarkar, CMO at Prudour Pvt Ltd, aptly notes, ‘Understanding tech trends is essential for organizations to utilize tools like BI effectively.’ Utilizing Query, dataflow Power BI enables users to apply familiar transformation techniques without needing extensive technical knowledge, which empowers organizations to leverage their information more effectively.
This process of transforming raw data into actionable insights is central to driving informed decision-making. Furthermore, with Automate, businesses can streamline workflow automation, ensuring a risk-free ROI assessment and professional execution. Significantly, 80% of organizations utilizing cloud-based BI have witnessed enhanced scalability, highlighting the influence of dataflow Power BI on operational efficiency and informed decision-making.
Step-by-Step Guide to Creating and Managing Power BI Dataflows
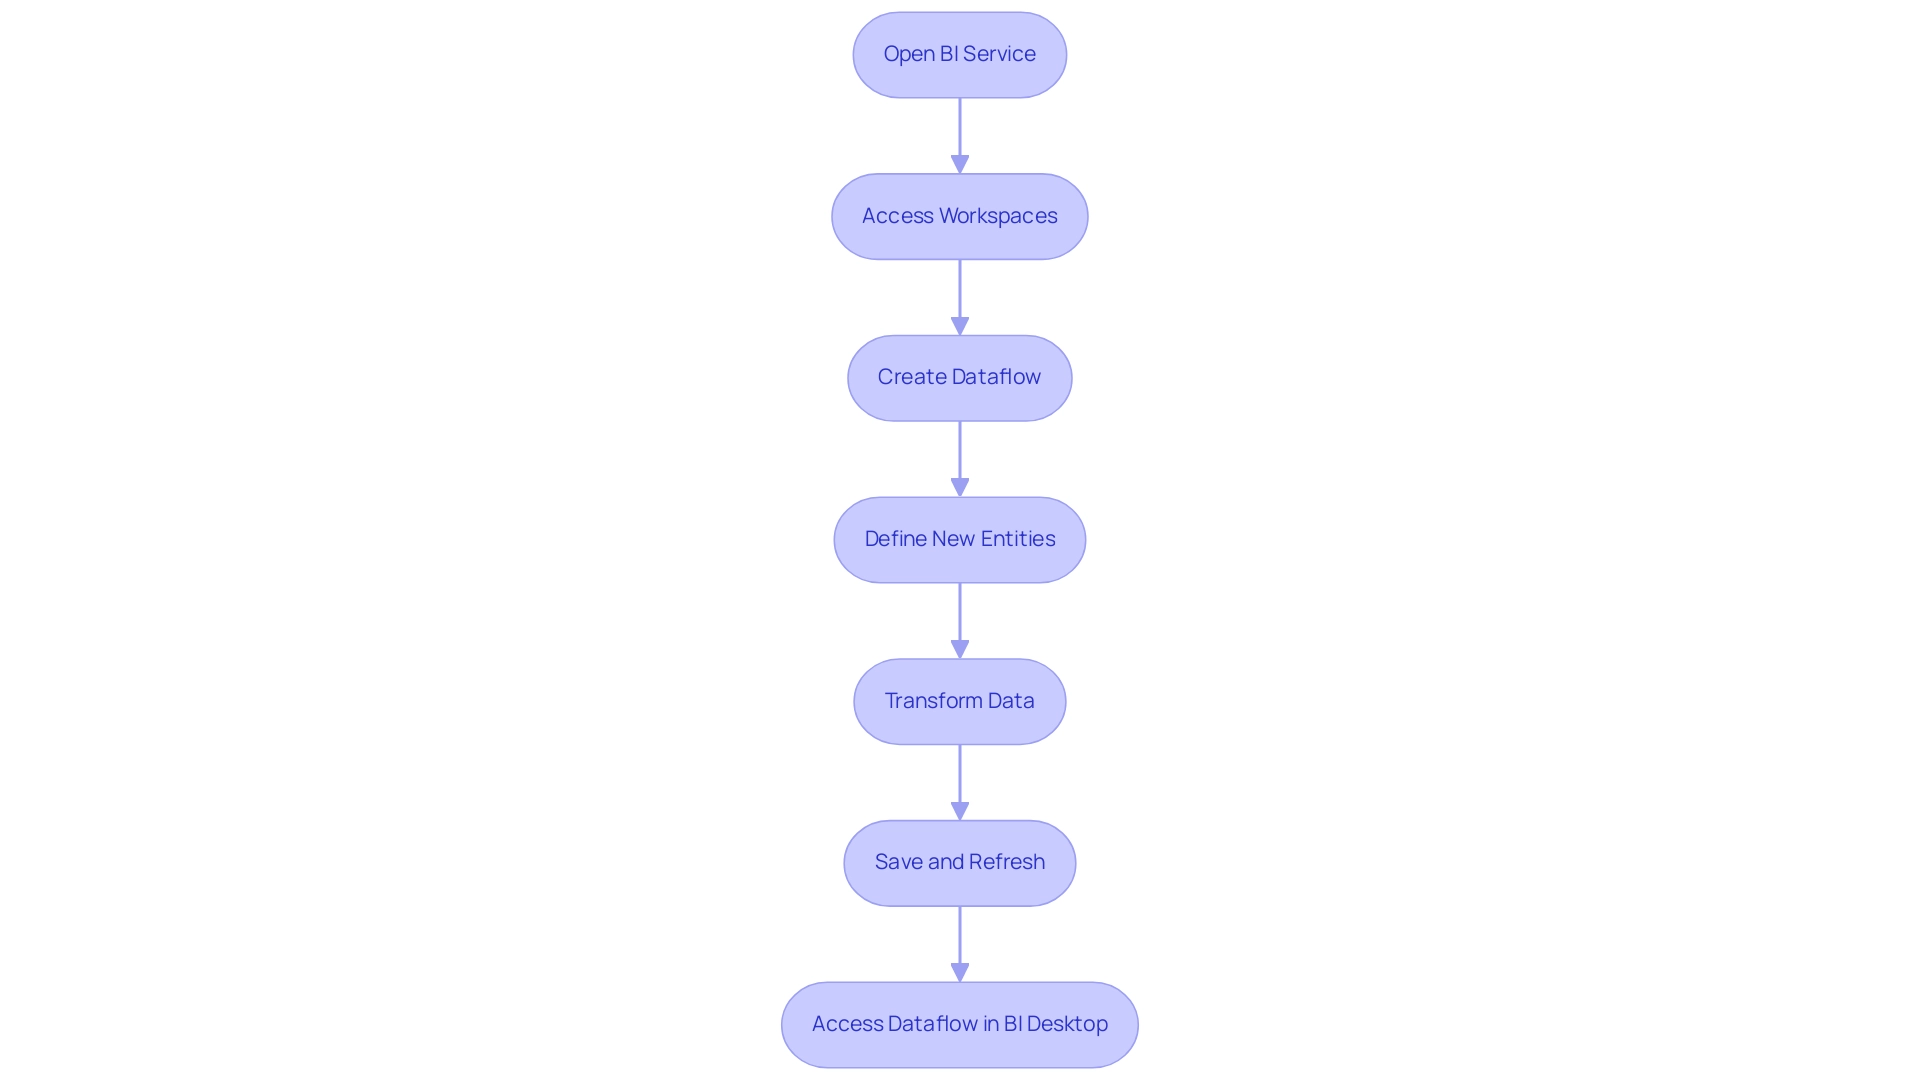
Establishing a dataflow Power BI in Business Intelligence is a simple procedure that enables organizations to efficiently handle their information while utilizing Robotic Process Automation (RPA) to streamline manual workflows. This integration not only boosts operational efficiency but also enhances data-driven insights crucial for business growth by reducing errors and freeing up team resources for more strategic tasks. Follow these steps to set up your Dataflow:
- Open BI Service: Begin by navigating to
https://app.bi.comand log in with your credentials. - Access Workspaces: On the left pane, click on ‘Workspaces’ and select the workspace you wish to use.
- Create Dataflow: Click the ‘Create’ button, then choose ‘Dataflow’ from the options.
- Define New Entities: Select ‘Add new entities’ and choose your information source, whether it be SQL Server, Excel, or another option.
- Transform Data: Utilize the Power Query Editor to apply transformations. This might involve filtering rows, renaming columns, or merging tables to customize the information to your needs.
- Save and Refresh: Save your Dataflow and establish a refresh schedule to keep your information current.
- Access Dataflow in BI Desktop: You can now reach this Dataflow in BI Desktop to create insightful reports.
By following these steps, users can create dataflow Power BI that not only improve information oversight but also align with RPA strategies for greater operational efficiency. The BFSI sector is expected to witness the quickest expansion in the business intelligence market from 2023 to 2032, according to Inkwood Research, making efficient information handling in tools such as BI crucial for operational success. With more than 10,000 firms utilizing BI within the 1,000 to 4,999 staff range, its scalability and adaptability are clear, offering a strong solution for mid-sized organizations seeking to enhance their processes.
Additionally, as organizations navigate the challenges posed by the rapidly evolving AI landscape, the significance of data management tools becomes increasingly apparent. Microsoft’s recent acquisition of C3.ai for $6.9 billion underscores the growing importance of utilizing BI for maximizing operational efficiency.
Best Practices for Optimizing Your Power BI Dataflows
To enhance the performance of your dataflow Power BI and leverage the capabilities of Robotic Process Automation (RPA), implementing the following best practices is crucial:
-
Minimize Information:
Focus on extracting only the essential information required for your reports. This approach not only improves performance but also reduces load times, ultimately leading to more efficient operations.
RPA can automate the extraction process, ensuring that only the necessary information is pulled, which is especially important as spending on non-cloud infrastructure is projected to grow at a CAGR of 2.3% over the 2021-2026 period. -
Use dataflow Power BI with incremental refresh:
By employing dataflow Power BI’s incremental refresh, you can manage large datasets more effectively, ensuring that only the information that has changed is reloaded. RPA can automate the incremental refresh process, significantly cutting down on processing times and system resource usage, making it a vital strategy for organizations handling vast amounts of data. -
Organize Entities:
Structuring your dataflow Power BI with clear naming conventions and logical groupings can greatly facilitate easier management and collaboration among team members. RPA can assist in maintaining this organization by automating updates and adjustments, reducing the likelihood of errors. Leading marketers are 1.6 times more likely to believe that open access to information results in higher performance, highlighting the benefits of organized structures. -
Leverage Parameters:
Utilize parameters for dynamic filtering of information sources in dataflow Power BI. RPA can enhance this adaptability by automating parameter adjustments based on real-time information analysis, allowing for more tailored dataflow configurations that can adjust to varying project requirements without significant rework. -
Monitor Performance:
Regularly reviewing dataflow Power BI performance metrics is essential to identify and troubleshoot bottlenecks or inefficiencies. RPA can play a crucial role in continuous monitoring and alerting of performance issues, ensuring proactive oversight. As 85% of Singaporean business leaders recognize, effective information handling can significantly enhance decision-making and decrease risks linked to operational delays. Monitoring performance can help avoid the high costs associated with prolonged breaches of information, which average $1.02 million higher for incidents lasting beyond 200 days.
Implementing these best practices not only optimizes your BI workflows but also positions your organization to better handle unforeseen challenges posed by the rapidly evolving AI landscape, supported by the strategic use of RPA.
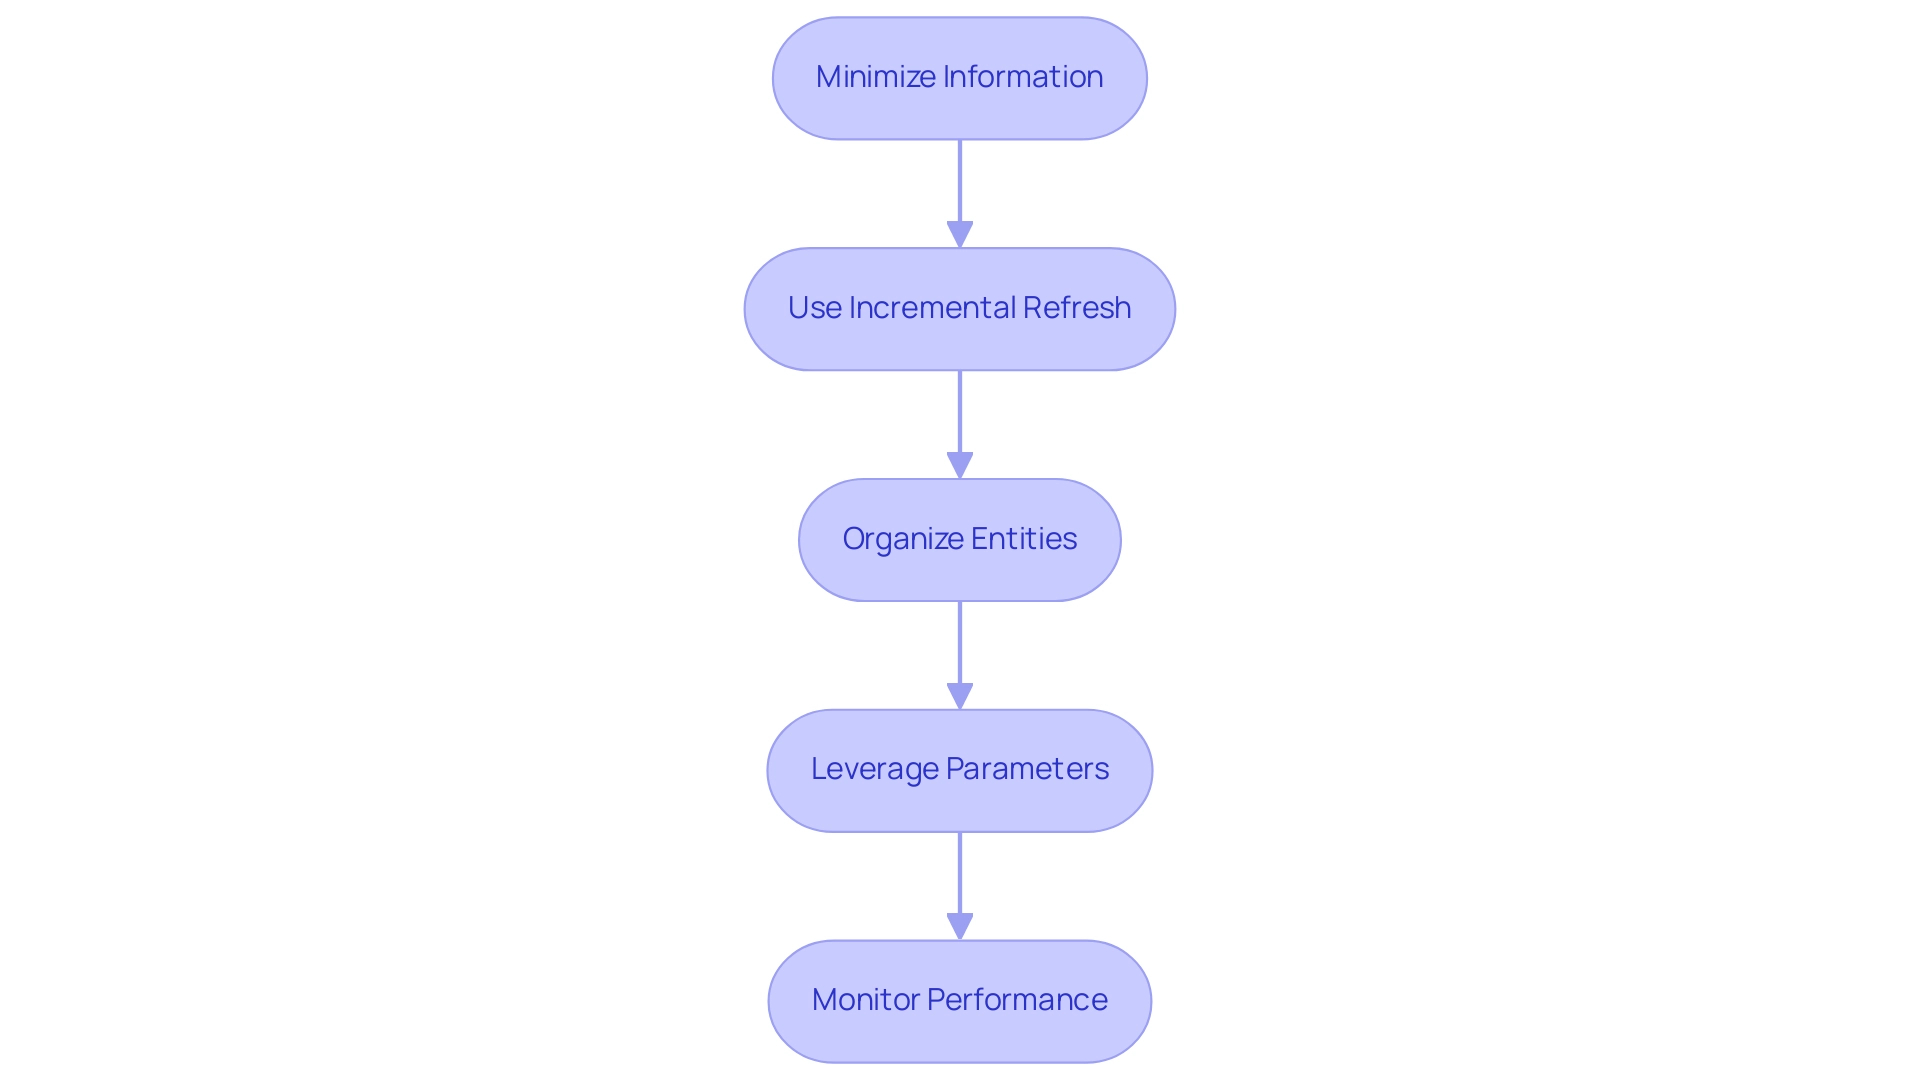
Benefits of Using Power BI Dataflows for Data Management
Utilizing BI processes offers numerous benefits for organizations seeking to improve their information handling strategies, particularly alongside Robotic Process Automation (RPA):
-
Centralized Information Oversight: The use of dataflow Power BI in BI Data streams enables a unified method for information oversight, guaranteeing uniformity across multiple datasets while reducing redundant efforts. This centralization is crucial for maintaining information integrity and reliability, particularly as RPA can automate the entry and management processes, significantly reducing errors and enhancing operational efficiency.
-
Enhanced Cooperation: With Power BI workflows, multiple users can effortlessly contribute to processes, boosting teamwork and facilitating the sharing of insights across various departments. As organizations increasingly utilize RPA, the collaborative environment becomes crucial, particularly with statistics showing that 85% of organizations are likely to incorporate customer analytics using AI/ML and predictive capabilities into their strategies in the next 12 months.
-
Automated Information Refresh: Dataflow Power BI enables the establishment of automated refresh schedules, ensuring that reports are consistently based on the most recent information without necessitating manual intervention. This feature not only saves time but also reduces the risk of errors associated with outdated information, further supported by RPA’s ability to efficiently handle routine tasks, thereby freeing up teams for more strategic initiatives.
-
Reusable Transformations: Users can create transformations once and apply them across various reports. This capability streamlines the preparation process and significantly reduces workload, allowing teams to focus on analysis rather than repetitive tasks. RPA can enhance this process by automating the execution of these transformations, thus enabling faster insights and reducing the manual effort involved.
-
Enhanced Information Quality: Through the application of consistent transformations, the dataflow Power BI workflows promote a standardized approach to information quality across the organization. This is especially vital as organizations acknowledge the financial consequences of breaches; IBM indicates that breaches with a lifecycle shorter than 200 days incur costs that are, on average, $1.02 million lower than those extending beyond that timeframe. Ensuring information integrity through analytical processes, aided by RPA, can help reduce these risks and enhance overall information quality.
In the context of the EDM market, where large enterprises hold 69.50% of the market share, the advantages of such analytical processes for centralized information oversight and improved collaboration are paramount. These advantages are particularly pertinent for organizations of all sizes aiming to optimize their information strategies in 2024, as they can significantly enhance operational efficiency and decision-making across various scales of business operations.
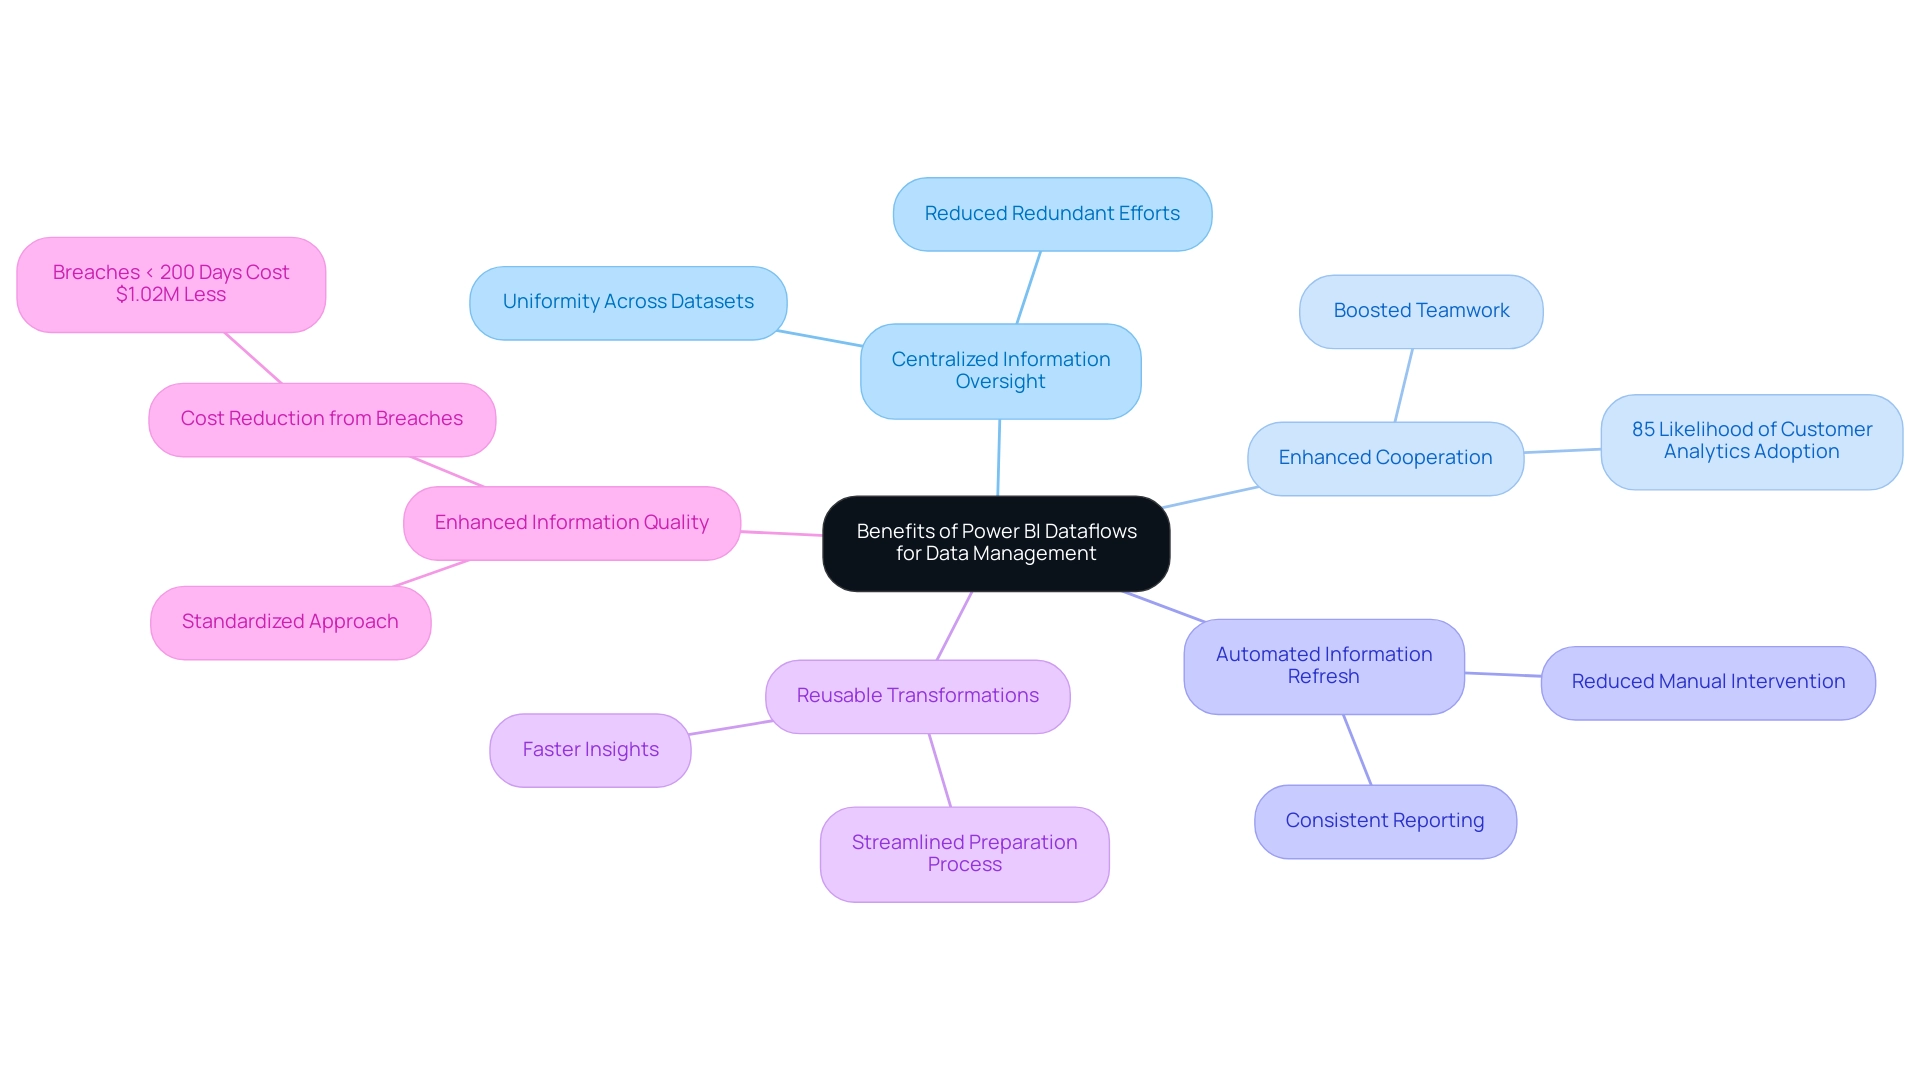
Challenges and Limitations of Power BI Dataflows
While Power BI Dataflows present numerous benefits for data management, it is crucial to recognize the challenges that may arise, particularly in the context of poor master data quality and the barriers to effective AI adoption:
-
Complexity in Setup: The initial configuration of data streams can be daunting for newcomers, often requiring a significant investment of time to familiarize oneself with the interface and diverse functionalities. This complexity can deter organizations from fully utilizing AI capabilities, leading to missed opportunities. However, understanding the accessibility of AI technology and its application in dataflow powerbi can help alleviate these concerns, making integration more manageable.
-
Performance Issues: Handling large datasets or poorly optimized Dataflows can lead to noticeable slowdowns. Users must engage in proactive oversight to ensure optimal performance and responsiveness. For example, the BI Premium license restricts file uploads to 10 GB, which can complicate management for larger datasets, further worsening issues related to inconsistent quality.
-
Limited Transformations: Advanced information transformations may not be feasible directly within Dataflows. This limitation necessitates additional processing in Power BI Desktop, especially regarding dataflow Power BI, potentially complicating workflows and making it harder to extract actionable insights for informed decision-making. Customized AI solutions can aid in streamlining these processes, enhancing the overall efficiency of information management.
-
Reliance on Information Sources: The functionality of these workflows is closely linked to the availability and performance of the originating information. Any disruptions or inefficiencies at the source can directly affect Dataflow operations, complicating the process of generating reliable business intelligence. Organizations should consider strategies to ensure dataflow powerbi source reliability as part of their AI integration efforts.
-
Licensing Considerations: Certain advanced features within BI Dataflows may require specific licensing arrangements. This can pose a barrier for organizations with budget constraints, limiting their ability to fully leverage the tool and hindering their overall efficiency. Grasping the licensing landscape is essential for maximizing the potential of dataflow powerbi, BI, and AI technologies.
As Liu Yang notes, “If this post helps, then please consider Accept it as the solution to help the other members find it more quickly,” emphasizing the importance of community support in navigating these challenges.
Furthermore, the case study titled ‘Modeling Limitations in Power BI‘ illustrates user dissatisfaction with the modeling experience. By examining the implications of these challenges, organizations can better appreciate the necessity for enhancements and the potential of tailored solutions in overcoming quality issues.
Overall, while these challenges are significant, understanding them equips users to develop strategies that can mitigate their impact, ultimately enhancing their data management capabilities and enabling more effective AI integration.
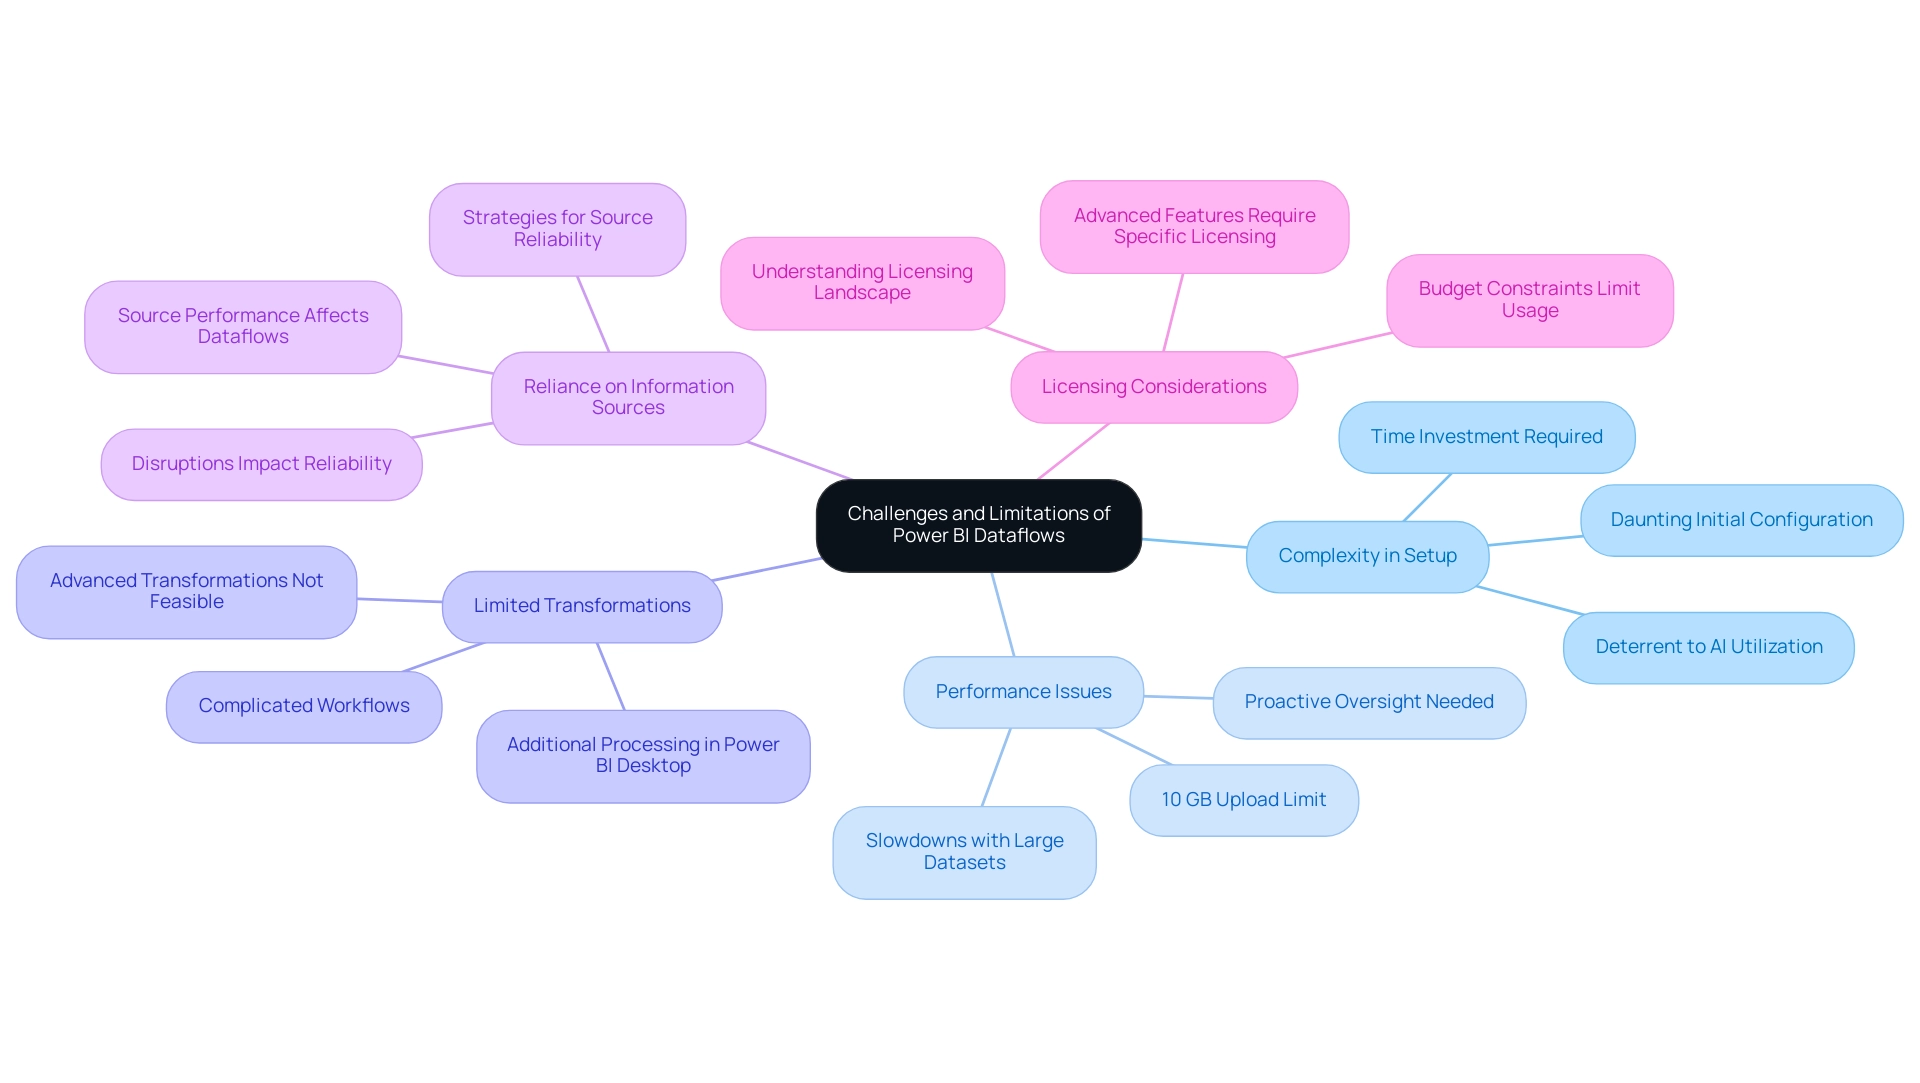
Conclusion
Power BI Dataflows represent a pivotal advancement in data management, offering organizations a powerful tool to streamline their data preparation and analysis processes. By enabling efficient ingestion, transformation, and integration of data, these cloud-based solutions empower teams to derive actionable insights that drive informed decision-making and enhance operational efficiency. The article outlines essential steps for creating and managing Dataflows, emphasizing the importance of establishing clear roles and responsibilities to foster stakeholder engagement and effective collaboration.
Implementing best practices, such as:
- Minimizing data loads
- Leveraging incremental refresh
- Organizing entities
further optimizes the performance of Power BI Dataflows. These strategies, complemented by Robotic Process Automation (RPA), not only enhance data quality but also reduce manual efforts, allowing teams to focus on strategic initiatives rather than repetitive tasks. The benefits of centralized data management and improved collaboration are crucial for organizations aiming to stay competitive in today’s data-driven landscape.
However, it is essential to acknowledge the challenges that accompany the use of Power BI Dataflows, including:
- Complexities in setup
- Performance issues with large datasets
By understanding these limitations and employing tailored solutions, organizations can navigate potential obstacles and unlock the full potential of their data management initiatives. As businesses continue to evolve in the face of technological advancements, embracing tools like Power BI Dataflows will be vital for cultivating a culture of data-driven decision-making and operational excellence.
Introduction
In the world of data analytics, understanding cardinality in Power BI is not just a technical necessity; it is a critical factor that can elevate the effectiveness of data modeling and reporting. Cardinality defines the relationships between data entities, shaping how information is structured and interpreted.
By mastering the nuances of:
- one-to-one
- one-to-many
- many-to-many relationships
data professionals can create models that accurately reflect complex real-world scenarios, leading to more insightful analyses and informed decision-making.
This article delves into the intricacies of cardinality in Power BI, providing actionable strategies to tackle common challenges such as data inconsistencies and inefficiencies in report generation. With the right knowledge and tools, organizations can harness the full potential of their data, driving operational excellence and fostering a culture of data-driven insights.
Understanding Cardinality in Power BI: The Basics
The concept of power bi cardinality explained is fundamental in Business Intelligence, referring to the uniqueness of values within a relationship in a model. This document provides a detailed overview of power bi cardinality explained, which describes how many occurrences of one entity connect to occurrences of another, essential for precise information analysis and efficient information modeling. The concept of power bi cardinality explained includes three primary types in Power BI: one-to-one, one-to-many, and many-to-many.
Each type serves a distinct purpose in reflecting real-world scenarios and influences how data analysts design robust models. For example, a one-to-one (1:1) connection guarantees that one row in a dataset corresponds exactly to one row in another, illustrated by links such as student to student contact details. This connection is represented in ER diagrams by a single line linking the two entities, with perpendicular lines indicating mandatory associations, while optionality is denoted by an empty circle.
In contrast, many-to-many (M:N) relationships require an additional junction or link table to establish connections effectively, highlighting the complexity and necessity of understanding these relationships in information modeling. Understanding the power bi cardinality explained metrics is essential, particularly in cloud-native environments, as managing these metrics can significantly impact system efficiency and monitoring capabilities. Tackling common issues such as time-consuming report creation, inconsistencies, and the absence of actionable guidance can be accomplished by utilizing the capabilities of Business Intelligence tools like BI.
For instance, applying a governance strategy can help ensure consistency across reports, thereby reducing confusion and mistrust in the information presented. As emphasized by Stephen Watts from Splunk, high cardinality provides the flexibility to tailor monitoring and observability to specific needs, ultimately driving operational efficiency and empowering your organization to make informed decisions.
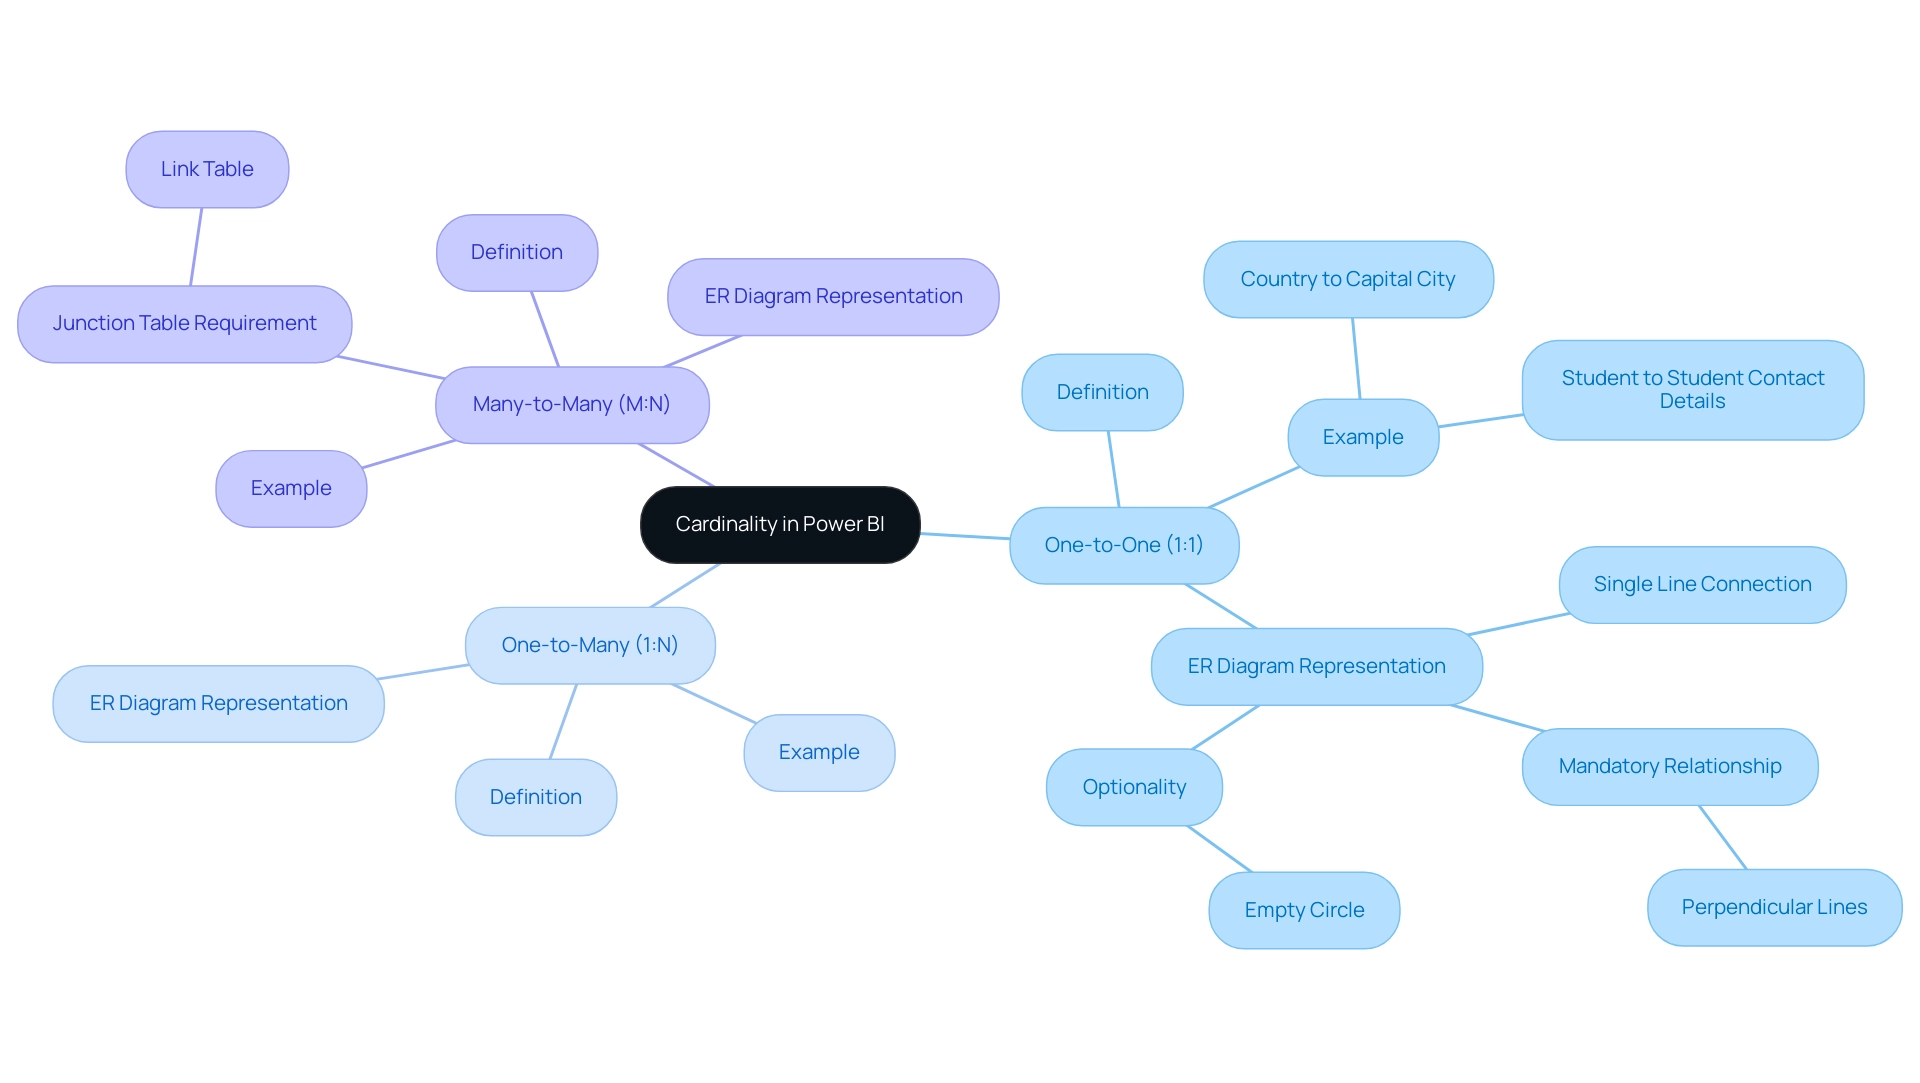
Exploring Types of Cardinality Relationships in Power BI
In Power BI, the concept of power bi cardinality explained is crucial for effective modeling, particularly when addressing frequent issues such as time-consuming report creation, inconsistencies, and the absence of actionable guidance. The main types include:
- One-to-One (1:1): Each record in one dataset corresponds to a single record in another dataset.
This relationship is often utilized to divide information into more manageable sections, particularly when one field is preferred over another. Gordon Linoff observes, > One instance where it is better to place such similar fields together is when one is clearly preferred and the other is the alternate.
A pertinent case study, titled ‘Feasible 1:1 Scenario: Optional Parts of Table,’ illustrates this concept through user information, where most users do not have specific settings, leading to many empty entries in the user record.
The suggested approach was to divide the user structure into two distinct entities: user and user_settings, enabling a more efficient arrangement while recognizing the complexity of retrieving information across both entities.
- One-to-Many (1:N): A single entry in one table can connect to numerous entries in another table, making this the most common association type in modeling.
Understanding the one-to-many cardinality is essential, as it ensures that analysts can construct precise models that represent the intricacies of their information, which is effectively power bi cardinality explained. Furthermore, understanding this connection can assist in simplifying report creation by minimizing errors and inconsistencies in data presentation. However, after forming a connection, it is important to remember that Excel must recalculate any formulas that reference columns from the associated datasets, which can be time-consuming.
Significantly, the limit on 2 will never change, but it should be possible to add or remove a person, which is pertinent to managing connections effectively.
- Many-to-Many (N:N): In this more intricate connection type, entries in both datasets can relate to multiple entries in one another.
Diligent oversight is essential to avoid ambiguity and maintain information integrity. A current trend in Business Intelligence suggests the creation of separate mapping tables to manage connections, allowing for greater flexibility in accommodating varying numbers of associated persons. By identifying and accurately applying these fundamental connections, analysts can enhance their models by understanding power bi cardinality explained, making them not only more precise but also more adaptable to the changing information landscape.
This understanding ultimately alleviates common reporting challenges, providing clearer, actionable guidance for stakeholders.
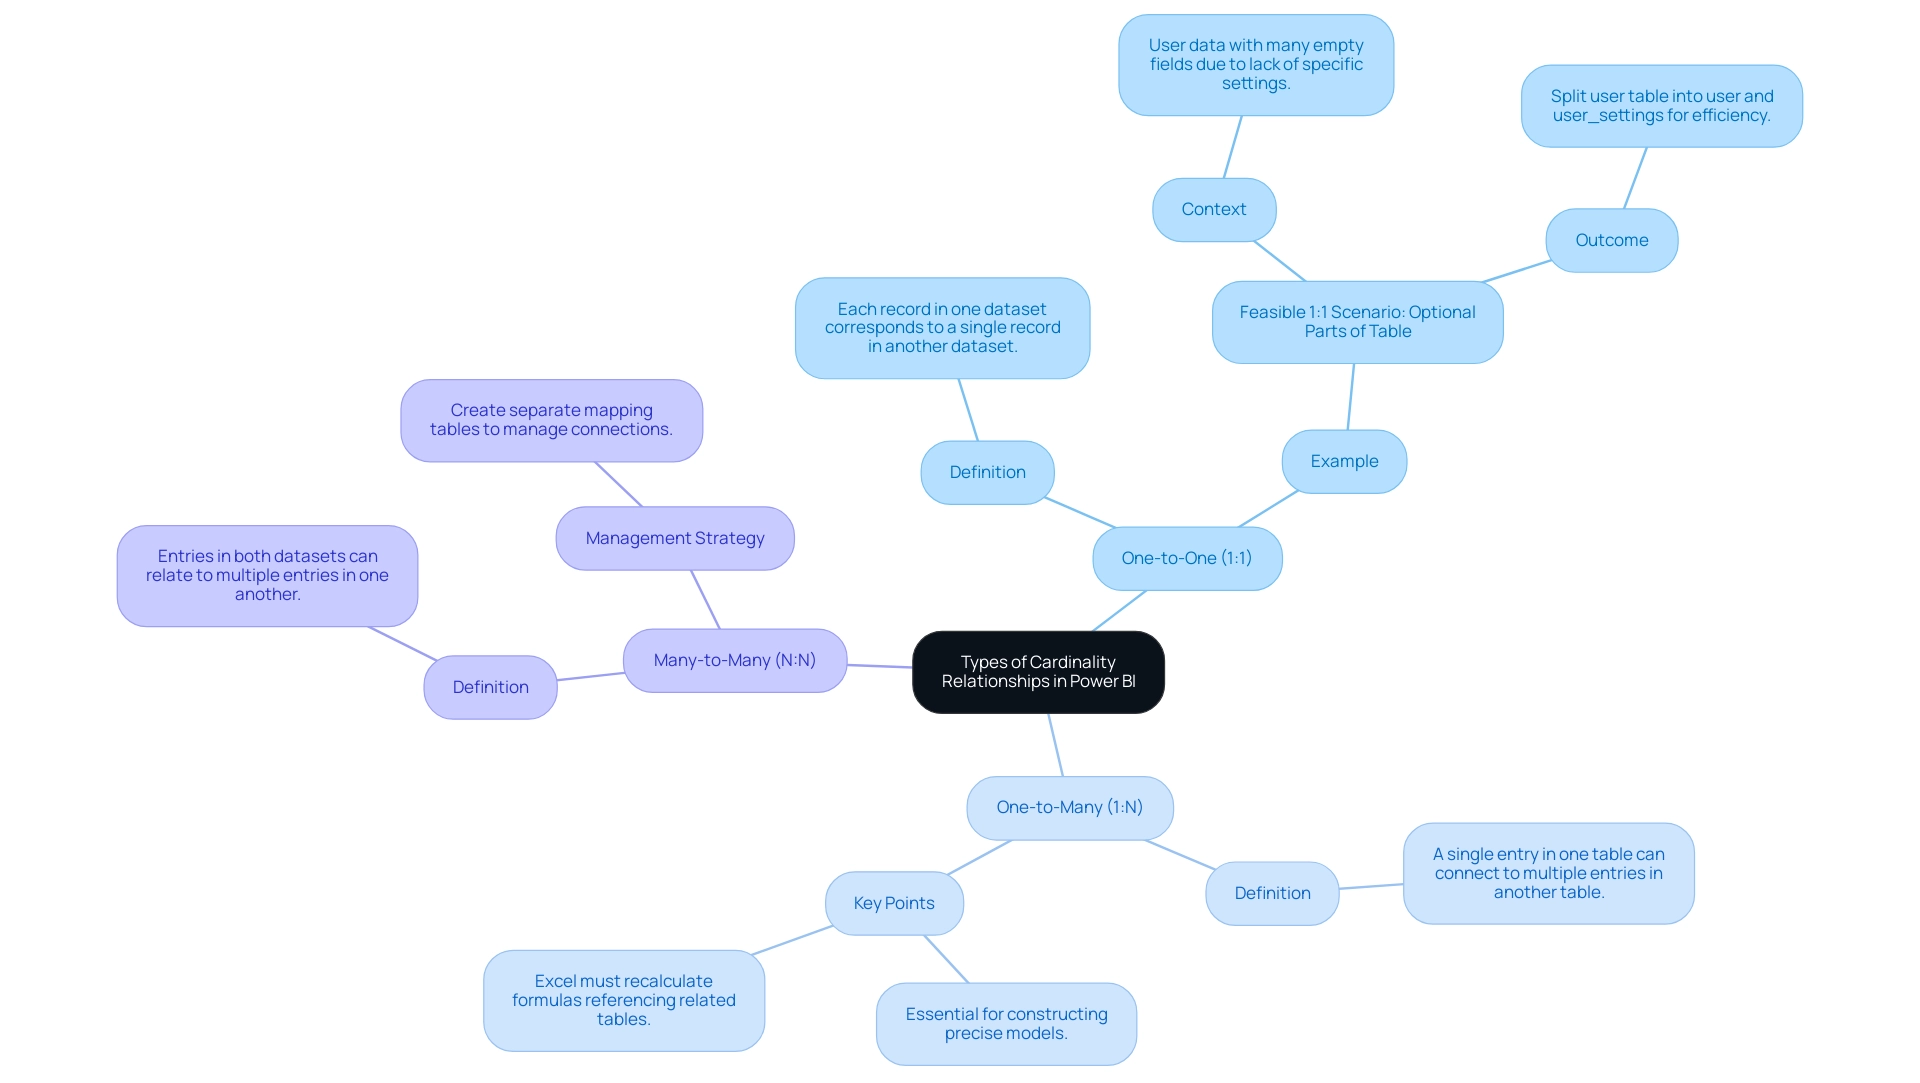
Creating and Managing Relationships in Power BI
Establishing effective relationships in BI is essential for constructing strong models that improve reporting abilities and tackle common challenges. Many professionals find themselves spending excessive time on report creation rather than leveraging insights from BI dashboards, leading to inconsistencies and confusion among stakeholders. A lack of a governance strategy can exacerbate these issues, making it essential to establish clear guidelines for data management.
To combat these challenges, it is essential to understand the four types of cardinality in Power BI, as power bi cardinality explained includes:
- One-to-many (1:*)
- Many-to-one (*:1)
- One-to-one (1:1)
- Many-to-many (:)
Here are the steps to establish a relationship:
- Open the ‘Model’ view and select the entities you wish to relate.
- Drag the field from one table to the corresponding field in another table.
- In the ‘Edit Relationship’ dialog, confirm that the cardinality type—such as one-to-one or one-to-many—is accurately set.
- Click ‘OK’ to finalize the connection.
For managing existing connections, access the ‘Manage Connections’ option, where you can edit, delete, or view connection details. Recent updates emphasize the importance of matching types for both columns in a relationship, particularly with DateTime columns, to prevent errors in your models. This adjustment can be made in the Query Editor.
A crucial understanding comes from Sam, who states,
Once you’ve fully grasped how to set up information models, you can easily create intuitive and significant BI reports.
Understanding these dynamics allows data analysts to optimize their models effectively and reduce the time spent on report generation. Significantly, the performance of filter propagation in BI varies by type of connection; one-to-many intra-source group connections are ranked the fastest, while many-to-many connections tend to hinder performance.
This performance ranking reflects the inefficiencies that can arise from poorly managed connections, leading to confusion among stakeholders. According to the case study on BI Model Connections: Performance Preference, many-to-many connections and cross-source group connections are slower, affecting overall model performance. By mastering these best practices and implementing a robust governance strategy, you can leverage the unique characteristics of your information to enhance overall efficiency and provide clear, actionable insights to stakeholders.
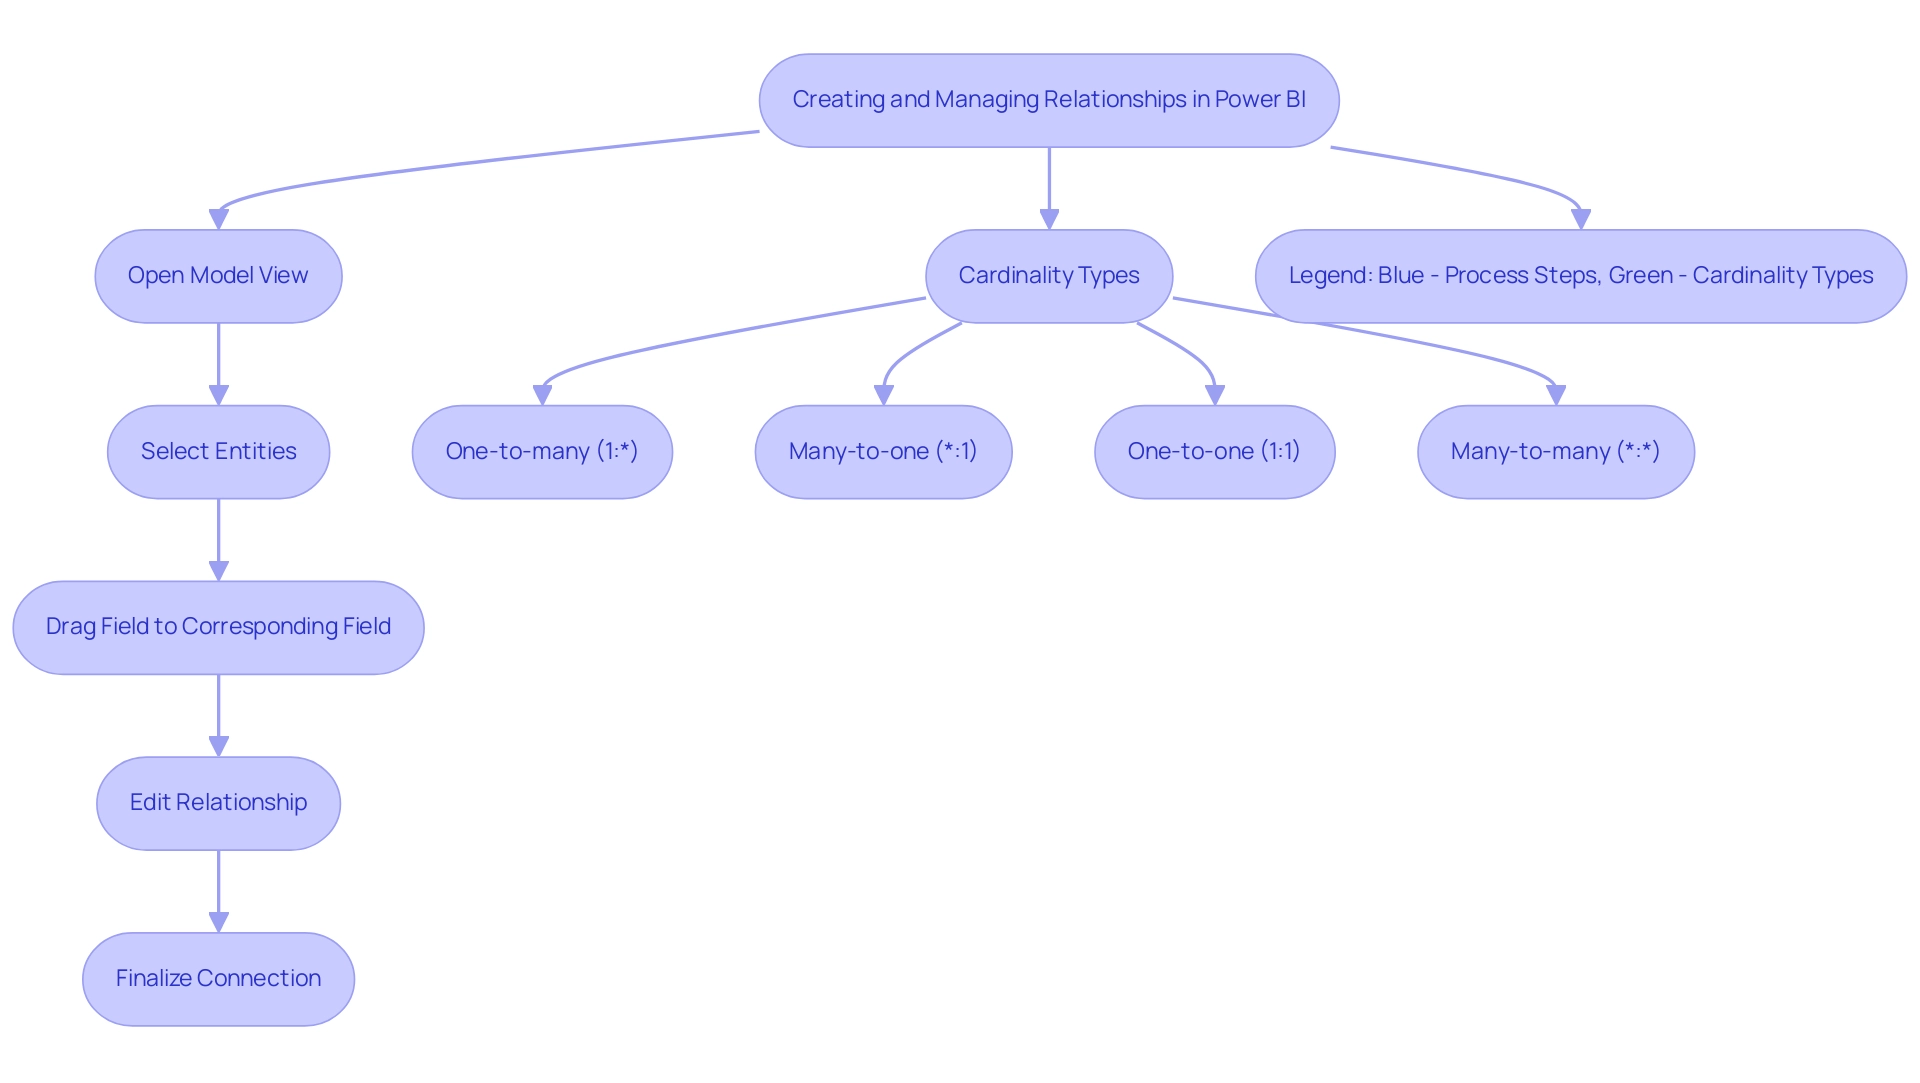
Troubleshooting Cardinality Issues in Power BI
Understanding power bi cardinality explained is crucial, as cardinality issues in Power BI, especially unclear connections, can significantly undermine the quality of your summaries and reporting, further exacerbating challenges related to poor master information quality, including inconsistent, incomplete, or flawed content. To tackle these challenges effectively, consider the following steps:
- Inspect your primary key fields for duplicate values, as these can lead to confusion in relationships and hinder your ability to leverage AI insights.
- Verify that the cardinality type—whether one-to-one, one-to-many, or many-to-many—is appropriately defined based on the characteristics of your information, as understanding the power bi cardinality explained is essential for accurate modeling.
- Utilize the ‘Manage Relationships’ tool to identify and resolve any conflicts that may occur in your model.
Addressing these concerns about power bi cardinality explained is crucial for enhancing the accuracy of your models, ultimately ensuring they reflect real-world business scenarios. Engaging with the community can provide valuable insights, as noted by Farhan Ahmed, a Community Champion, who emphasizes the importance of collaboration in problem-solving.
Additionally, don’t miss the early bird discount for the upcoming conference ending December 31, which offers a chance to learn from experts about Microsoft Fabric, Copilot, and Purview. Significantly, a recent conversation about confidentiality issues related to dataset uploads emphasizes the importance of grasping compliance requirements in BI. Case studies, like ‘Creating Connections in BI’, demonstrate that connections can be established automatically or manually, emphasizing the necessity to confirm their precision during the Query loading process.
By implementing these strategies, analysts can significantly enhance the reliability of their models and facilitate a smoother AI adoption process, addressing the common perception that AI projects are time-intensive and costly.
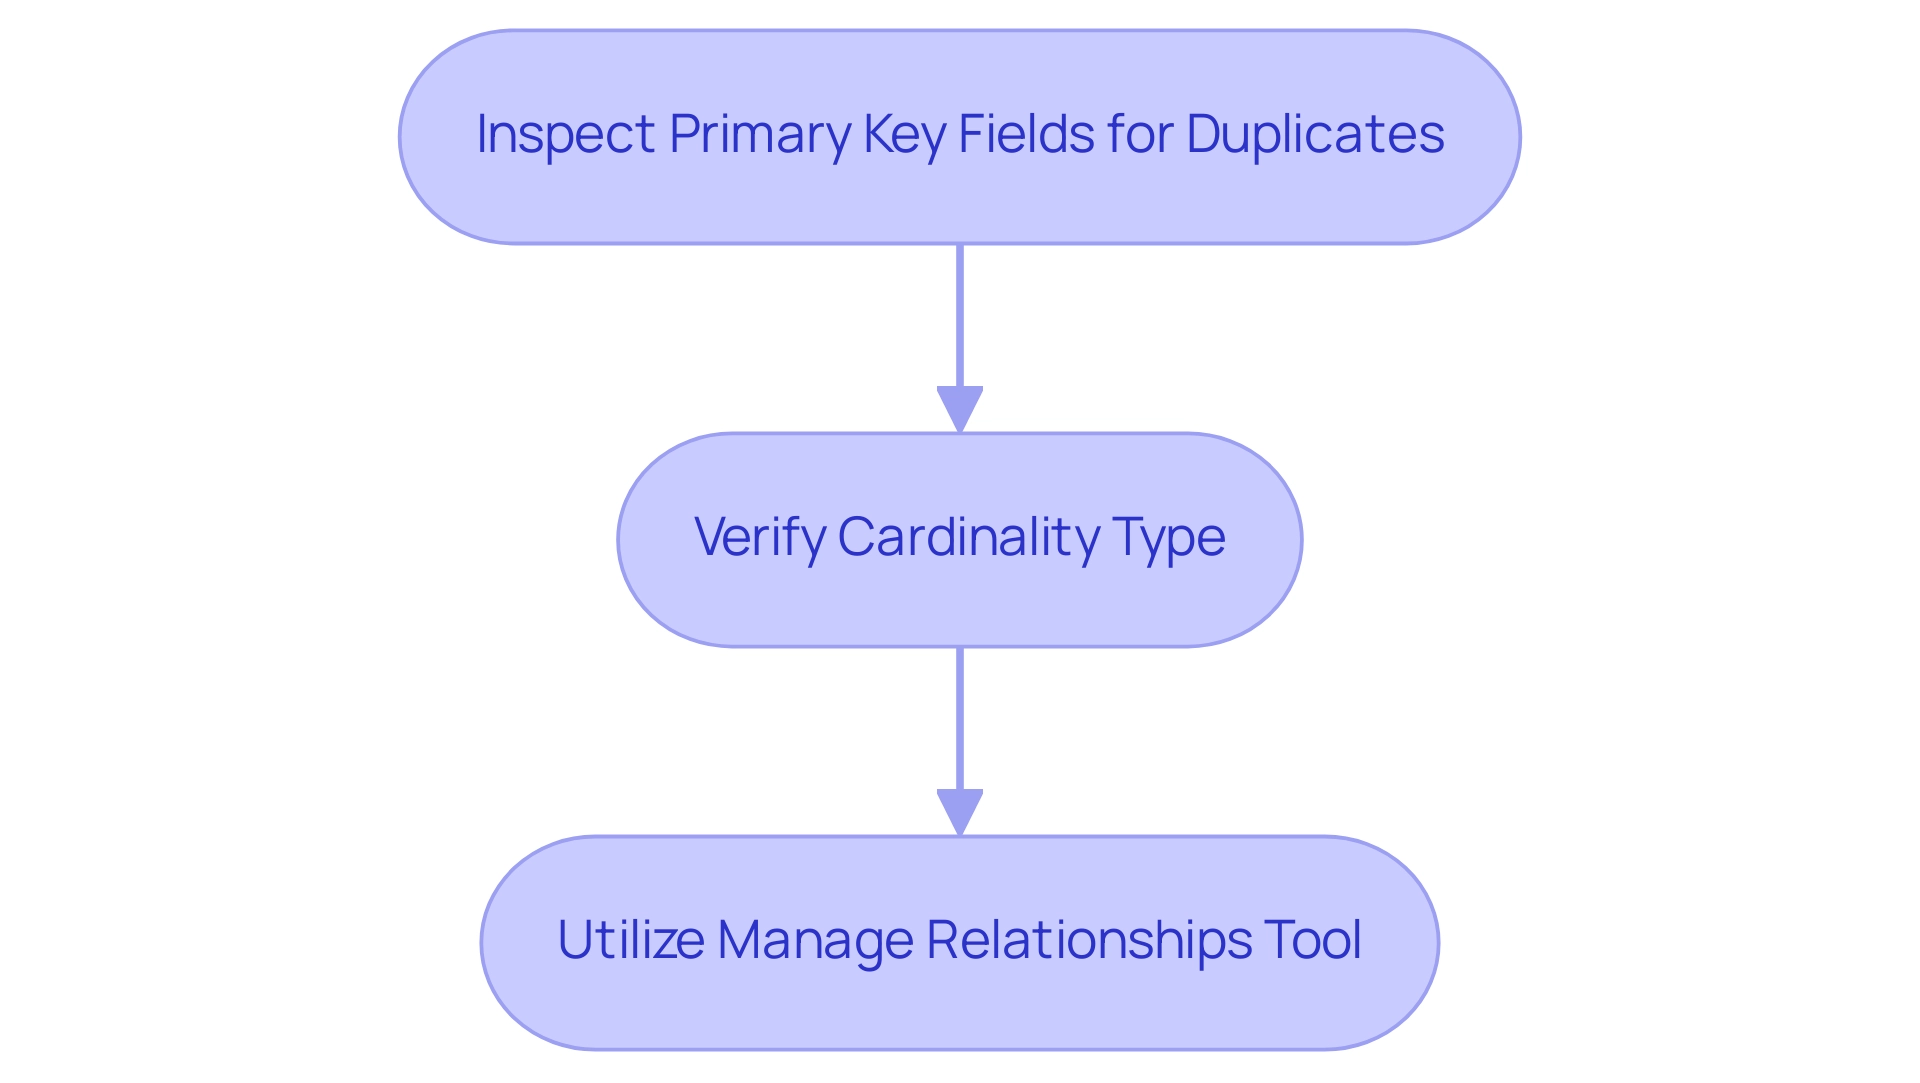
Advanced Relationship Management Techniques in Power BI
Advanced relationship management within BI is a strong approach that enables users to harness DAX (Data Analysis Expressions) for creating calculated columns and measures, thereby unlocking deeper insights from their data. With 2,724 users online, the relevance and popularity of BI among analysts is evident. By leveraging these capabilities, analysts can significantly enhance their reporting and analytical frameworks, especially with our 3-Day Power BI Sprint, which allows for the rapid creation of professionally designed reports.
Additionally, our General Management App ensures comprehensive management and smart reviews, further streamlining operations. An exciting advancement in this area is the use of virtual connections, which allows the creation of associations on-the-fly, providing flexibility without the need to alter the underlying information model. As one user noted, ‘I did just switch the relationships around which seems to have worked,’ highlighting the practical application of these concepts.
To effectively implement DAX, users can simply access the formula bar and compose expressions that define new calculations grounded in their existing datasets. This strategic application of DAX not only empowers analysts to develop dynamic reports and dashboards but also fosters improved decision-making. Moreover, as emphasized in the case study on optimizing performance with aggregations, these techniques are essential for efficiently managing large datasets, enabling organizations to analyze vast quantities of information without compromising speed or accuracy.
Such advancements in information modeling, alongside our EMMA RPA solutions aimed at overcoming outdated systems, significantly enhance operational efficiency. EMMA RPA not only automates repetitive tasks but also tackles staffing shortages and outdated processes, driving innovation and emphasizing the significance of investing in Power BI skills and RPA capabilities to gain competitive advantages in the continuously changing information landscape. Furthermore, by unlocking the power of Business Intelligence, organizations can transform raw data into actionable insights, enabling informed decision-making that drives growth and innovation.
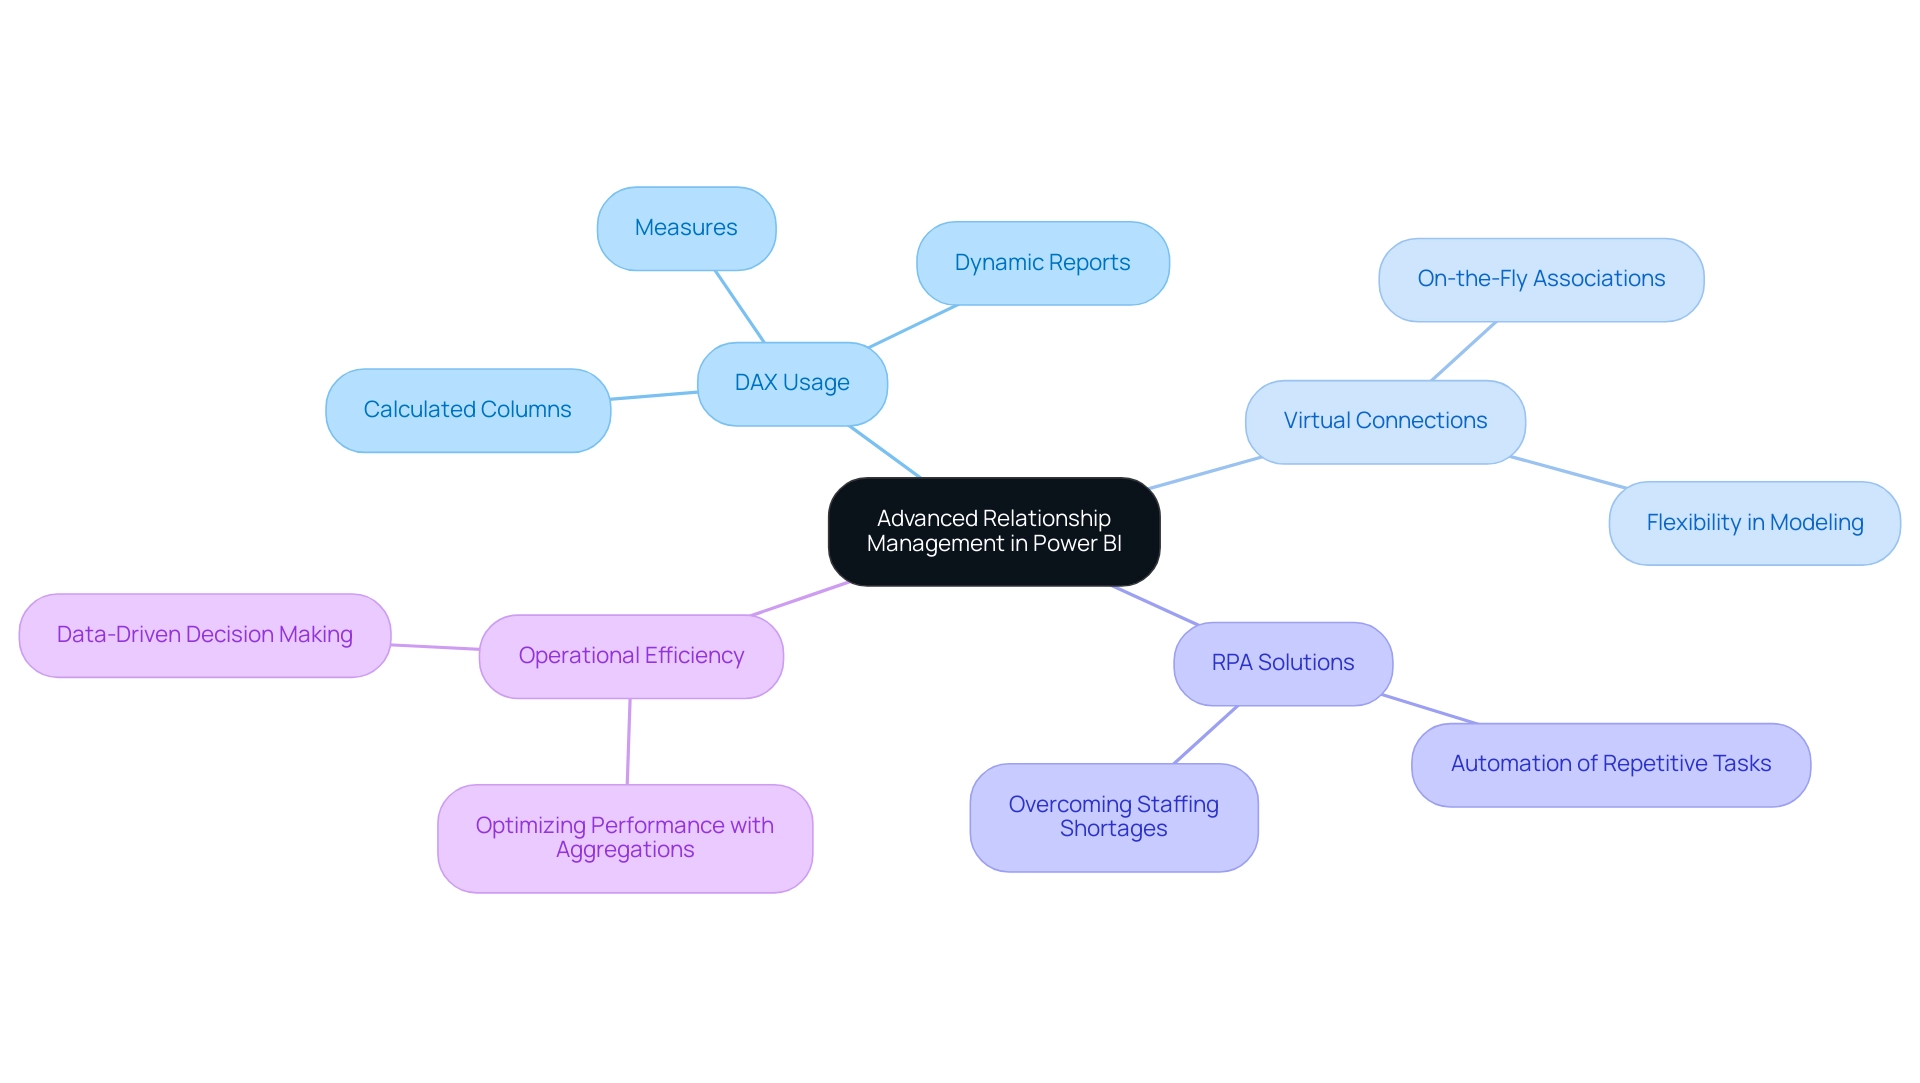
Conclusion
Mastering cardinality in Power BI is indispensable for data professionals aiming to enhance their data modeling and reporting capabilities. By understanding the different types of relationships—one-to-one, one-to-many, and many-to-many—analysts can create robust models that accurately reflect real-world scenarios. This knowledge not only streamlines report creation but also resolves common challenges such as data inconsistencies and inefficiencies.
Implementing effective relationship management strategies and leveraging advanced techniques like DAX can significantly optimize reporting processes. Establishing clear governance strategies is crucial to ensuring data integrity and fostering trust among stakeholders. Additionally, addressing cardinality issues proactively enhances the reliability of data models, providing a solid foundation for insightful decision-making.
Ultimately, the ability to navigate and manage cardinality in Power BI equips organizations to unlock the full potential of their data. By transforming complex datasets into clear, actionable insights, businesses can drive operational excellence and cultivate a culture of data-driven decision-making. Embracing these practices is not just beneficial; it is essential for thriving in today’s data-centric landscape.
Introduction
In the modern landscape of data-driven decision-making, the integration of Excel with Power BI emerges as a game-changer for organizations striving for operational excellence. This powerful combination not only enhances data analysis capabilities but also fosters a collaborative environment where insights can be shared seamlessly across teams.
By leveraging the strengths of both tools, users can transform static data into dynamic visualizations, enabling real-time insights that drive informed actions. As organizations navigate the complexities of data management, understanding the best practices for connecting these two platforms becomes essential.
This article delves into the practical steps for integration, explores effective data sharing methods, and addresses common challenges, all while highlighting the myriad benefits that this synergy can bring to enhance operational efficiency and strategic decision-making.
Understanding the Connection Between Excel and Power BI
Combining spreadsheets with Business Intelligence reveals a strong synergy that improves analysis capabilities, crucial for Directors of Operations Efficiency. BI connects to hundreds of information sources, including SQL databases and cloud platforms, making it a versatile tool for integration. Excel to Power BI is well-known for its strong information manipulation and initial analysis functions, while BI excels in visualizing information and facilitating insight sharing across teams.
This integration enables users to create dynamic summaries and dashboards that include real-time information, significantly enhancing decision-making processes. Key features consist of:
1. The 3-Day BI Sprint, enabling swift creation of documents
2. The General Management App, which provides extensive management and intelligent reviews
3. Dynamic Data Exchange (DDE), which allows automatic updates of spreadsheet reports with the latest information from Business Intelligence, ensuring that teams are always working with the most up-to-date details
To establish this connection efficiently, make sure you are utilizing the most recent versions of both spreadsheets and Business Intelligence software, and that your information is well-organized in the spreadsheet. This essential step is vital for a smooth import into BI, laying the groundwork for meaningful collaboration. For instance, the process to excel to Power BI allows visuals to be embedded in Excel spreadsheets using Power BI and Excel for Office 365, enabling interactive visualizations within Excel.
As Manahil Ahmad observes,
By combining the strengths of both tools, users can leverage advanced analytics features, seamless information transfer, and enhanced collaboration for more informed decision-making.
Furthermore, ensuring consistency and clear guidance is essential to maximize the advantages of these tools, as failure to do so may result in a competitive disadvantage in today’s information-driven landscape. To explore how our services can further enhance your operations, consider our Actions portfolio and book a free consultation.
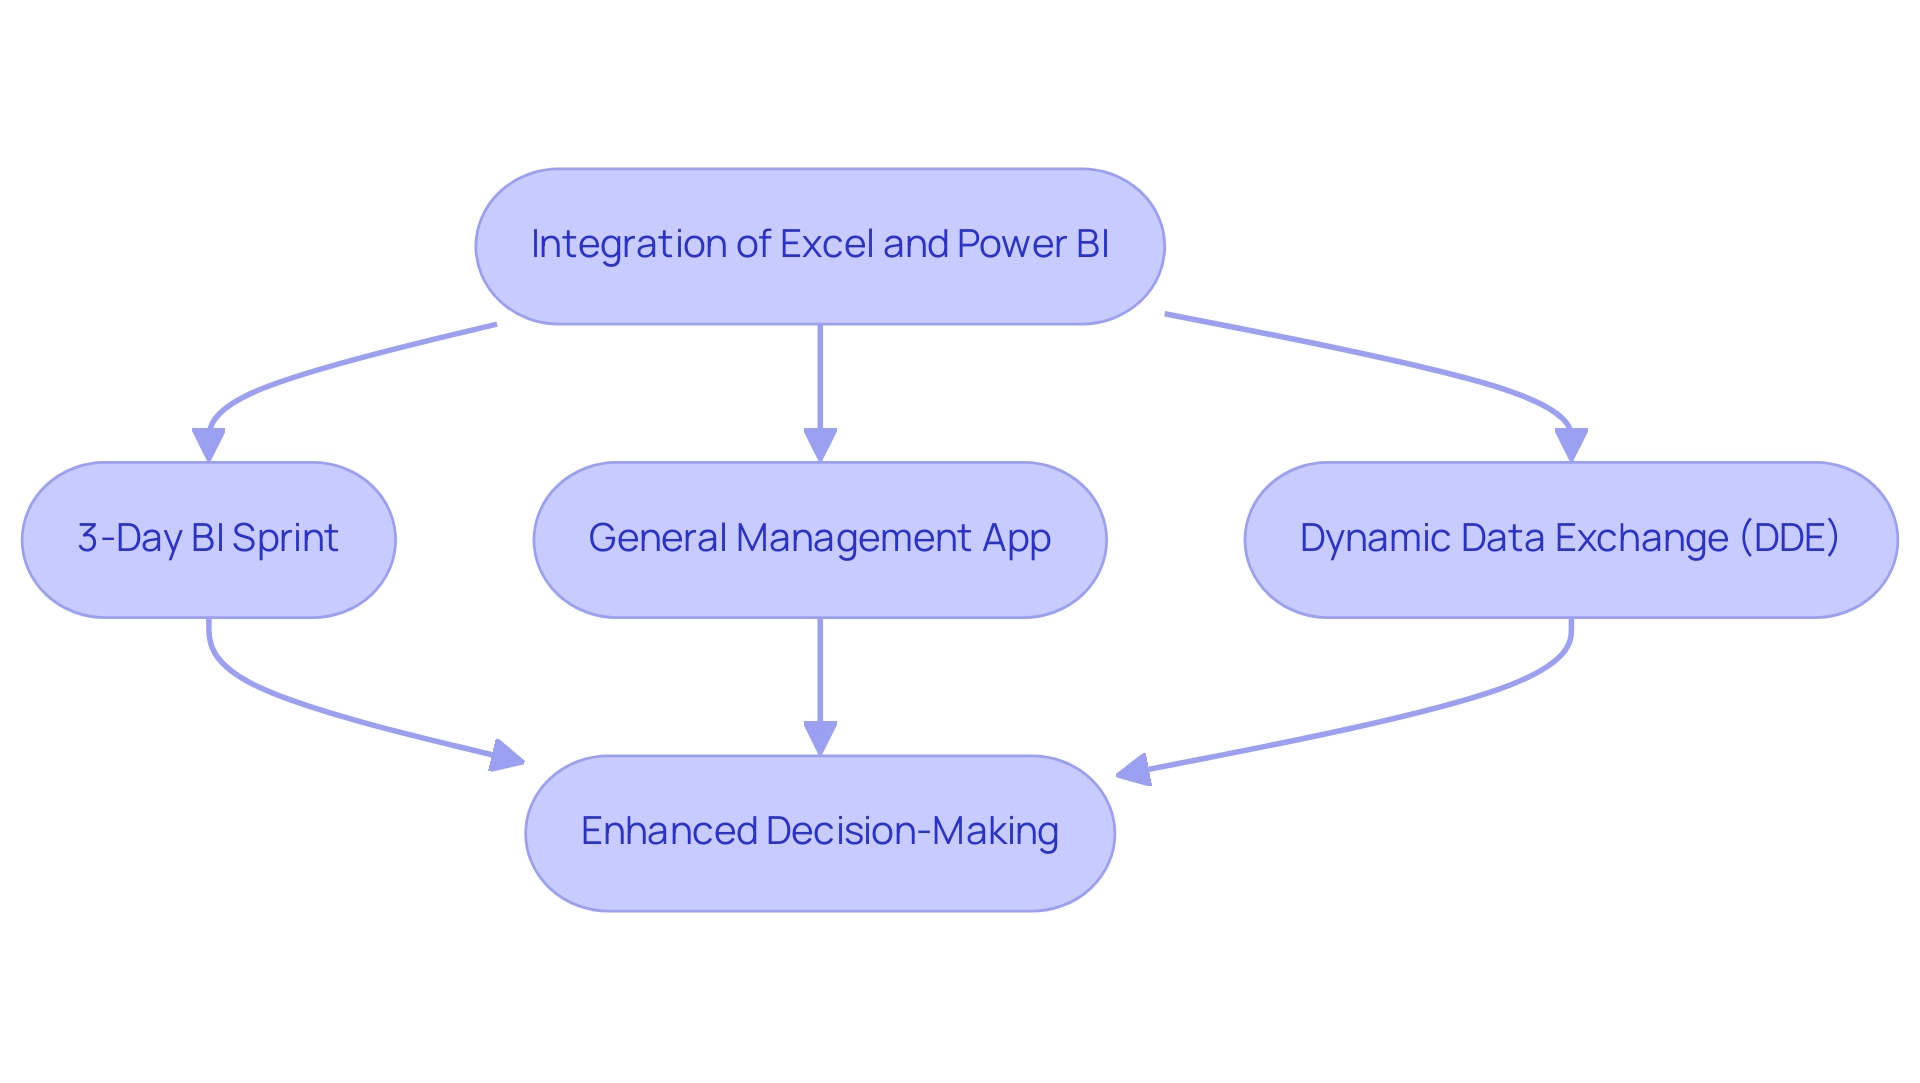
Step-by-Step Guide to Connecting Excel to Power BI
-
Prepare Your Excel File to Power BI: To ensure seamless integration with Business Intelligence, arrange your information in a structured table format. Highlight the relevant information range and navigate to ‘Insert’ > ‘Table’ to create a table. This step is crucial as the BI tool will recognize and import the information more effectively when it is formatted correctly, reducing manual errors and enhancing operational efficiency through automation.
-
Open BI Desktop: Launch BI Desktop, a robust tool intended for visualization and reporting. From the Home ribbon, select ‘Get Data’ to initiate the import process, ensuring a streamlined workflow.
-
Select Excel to Power BI: In the list of available sources, choose ‘spreadsheet’. This selection signals to Power BI that you intend to excel to Power BI by importing data from a spreadsheet file, setting the stage for efficient data handling.
-
Locate Your File: A file browser will open, allowing you to navigate to your prepared spreadsheet file. Once found, click ‘Open’ to proceed with the import.
-
Select Data to Import: The Navigator window will appear, displaying the table(s) available in your Excel file when you choose to excel to Power BI. Select the specific table(s) you wish to import and click ‘Load’. This action transfers the information directly into Business Intelligence, allowing us to excel to Power BI for further analysis and assisting in addressing challenges such as inconsistencies and time-consuming documentation creation by ensuring precise information flows.
-
Create Visualizations: After your information is successfully loaded into BI, leverage its robust visualization tools to create insightful reports and dashboards. For instance, by visualizing sales information divided by product and market segment, as shown in the case study ‘Visualizing Sales Segments’, you can create a clustered column chart that can be transformed into a stacked column chart for improved clarity. This case study exemplifies how to effectively visualize information by selecting relevant fields from the Data pane, leading to more informed business decisions and actionable insights.
Keep in mind that while Power BI does not natively connect to OneDrive, you can automate refreshes by using Coupler.io to link your Excel files from OneDrive. This integration enables you to set an update frequency, varying from monthly to daily and even every 15 minutes, ensuring your summaries reflect the most recent information. As Denys Arkharov, a BI Engineer at Coupler.io, notes, ‘A notable achievement in my career was my involvement in creating Risk Indicators for Ukraine’s ProZorro platform, a project that led to my work being incorporated into the Ukrainian Law on Public Procurement.’
This emphasizes the significance of efficient information integration in producing impactful results and demonstrates how RPA can enhance your management processes, especially in tackling the challenges of report creation and accuracy.
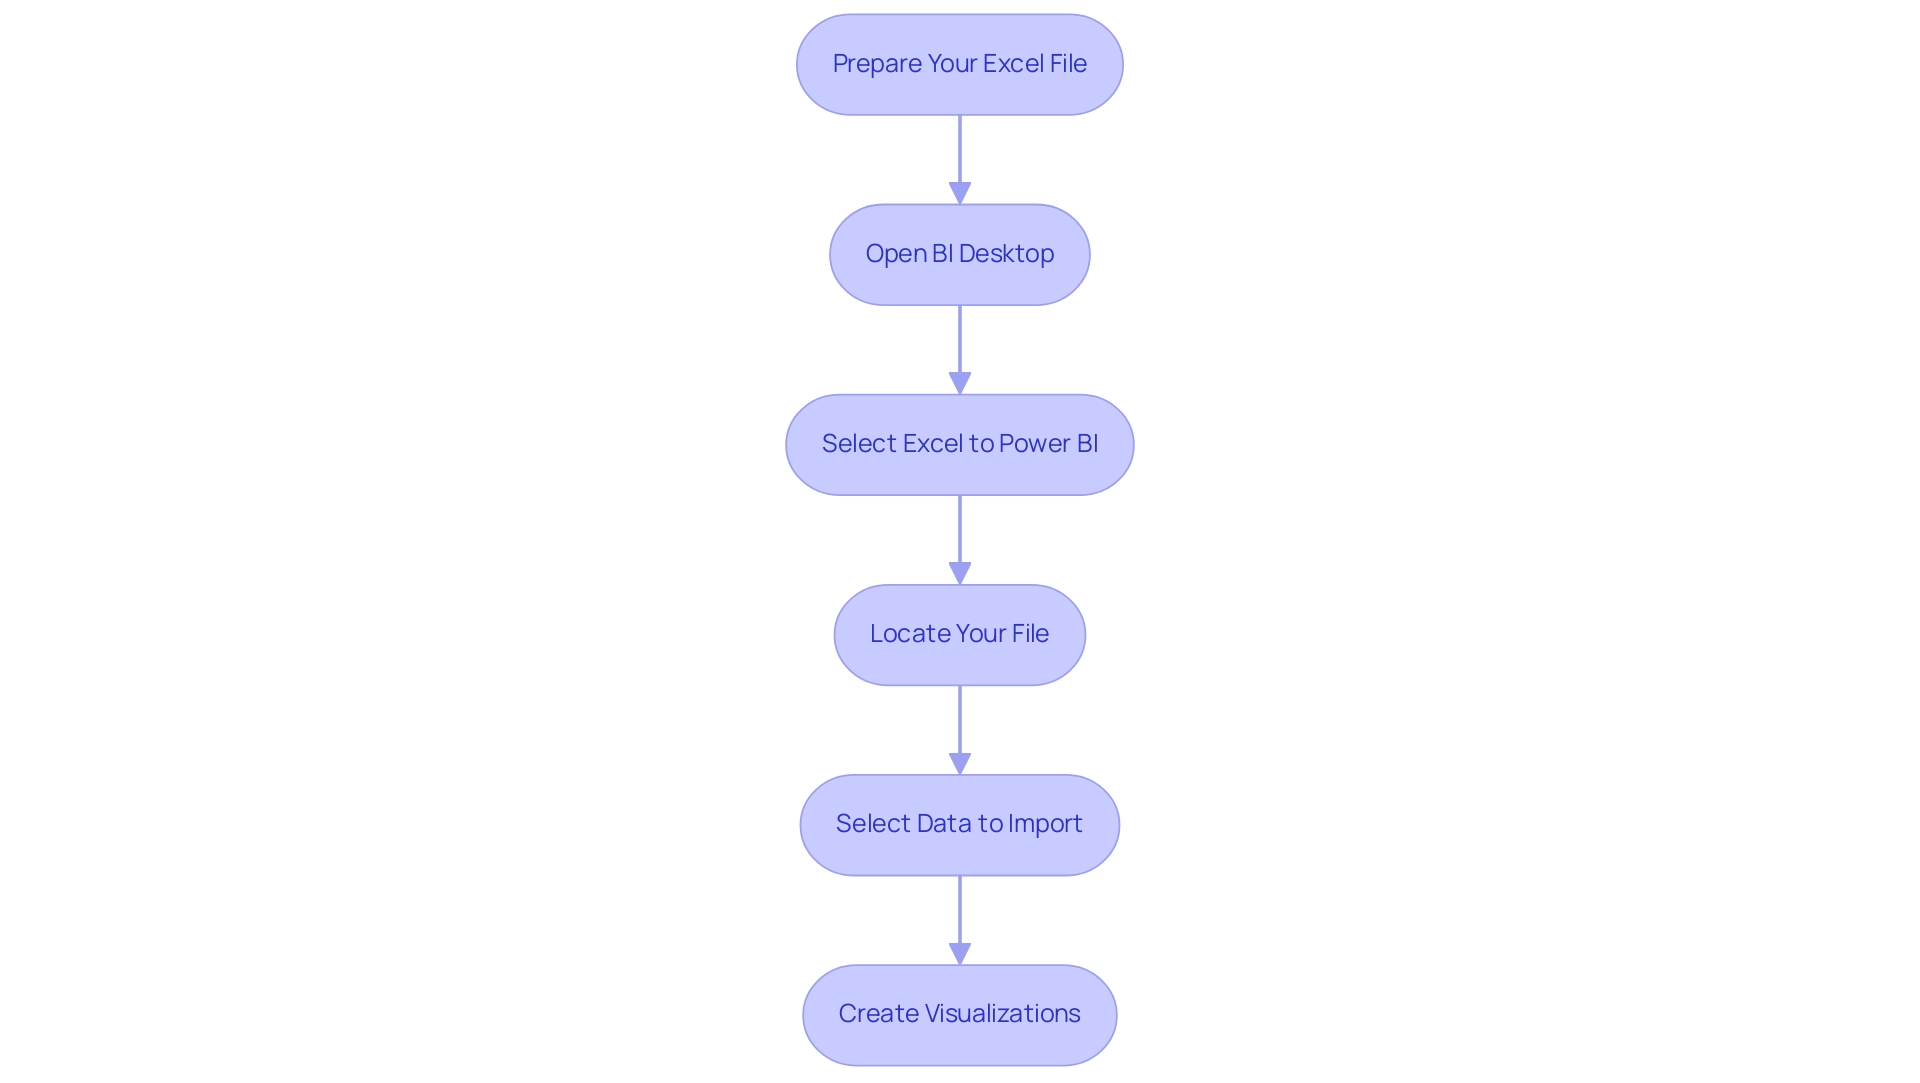
Exploring Data Sharing Methods Between Excel and Power BI
Sharing data between Excel and Power BI can be streamlined through several effective methods tailored to enhance operational efficiency:
- Direct Import: Users can seamlessly import data from Excel into Power BI using the ‘Get data’ option, ensuring that vital information is readily available for analysis and reporting.
- BI Publisher for Spreadsheet: This robust add-in enables users to pin specific spreadsheet ranges directly to their BI dashboards, facilitating real-time updates and insights. This feature not only simplifies the integration process but also keeps stakeholders informed with the most recent information.
- Query: By leveraging Query in Excel, users can connect to existing BI datasets. This capability enables advanced information transformations and analysis, allowing for deeper insights and improved decision-making.
- Dataflows: For organizations employing Premium BI, Dataflows act as a strong solution for centralizing information preparation. This method promotes efficient sharing across multiple reports and dashboards, enhancing collaboration and consistency in data management.
- Case Study: For example, files can be uploaded to the BI service using the Upload button. Users can connect to files stored in OneDrive or SharePoint, or upload files from their computer. BI syncs changes made to files in OneDrive or SharePoint automatically, enhancing collaboration.
In the words of Núria E., “In short, Excel is for individual statistical analysis. Business Intelligence is for information visualization and enterprise-level intelligence generation. These techniques together enable organizations to utilize the complete capabilities of their information, aiding the objectives of the 3-Day Power BI Sprint by producing a fully operational, professionally crafted document in only three days. This allows users to focus on utilizing insights rather than getting bogged down in report building.
Additionally, leveraging Robotic Process Automation (RPA) within this context can further enhance operational efficiency by automating repetitive tasks related to information management, ensuring that teams can concentrate on strategic initiatives. By implementing these practices, organizations can achieve greater operational excellence and informed decision-making, as exemplified in our actions portfolio.
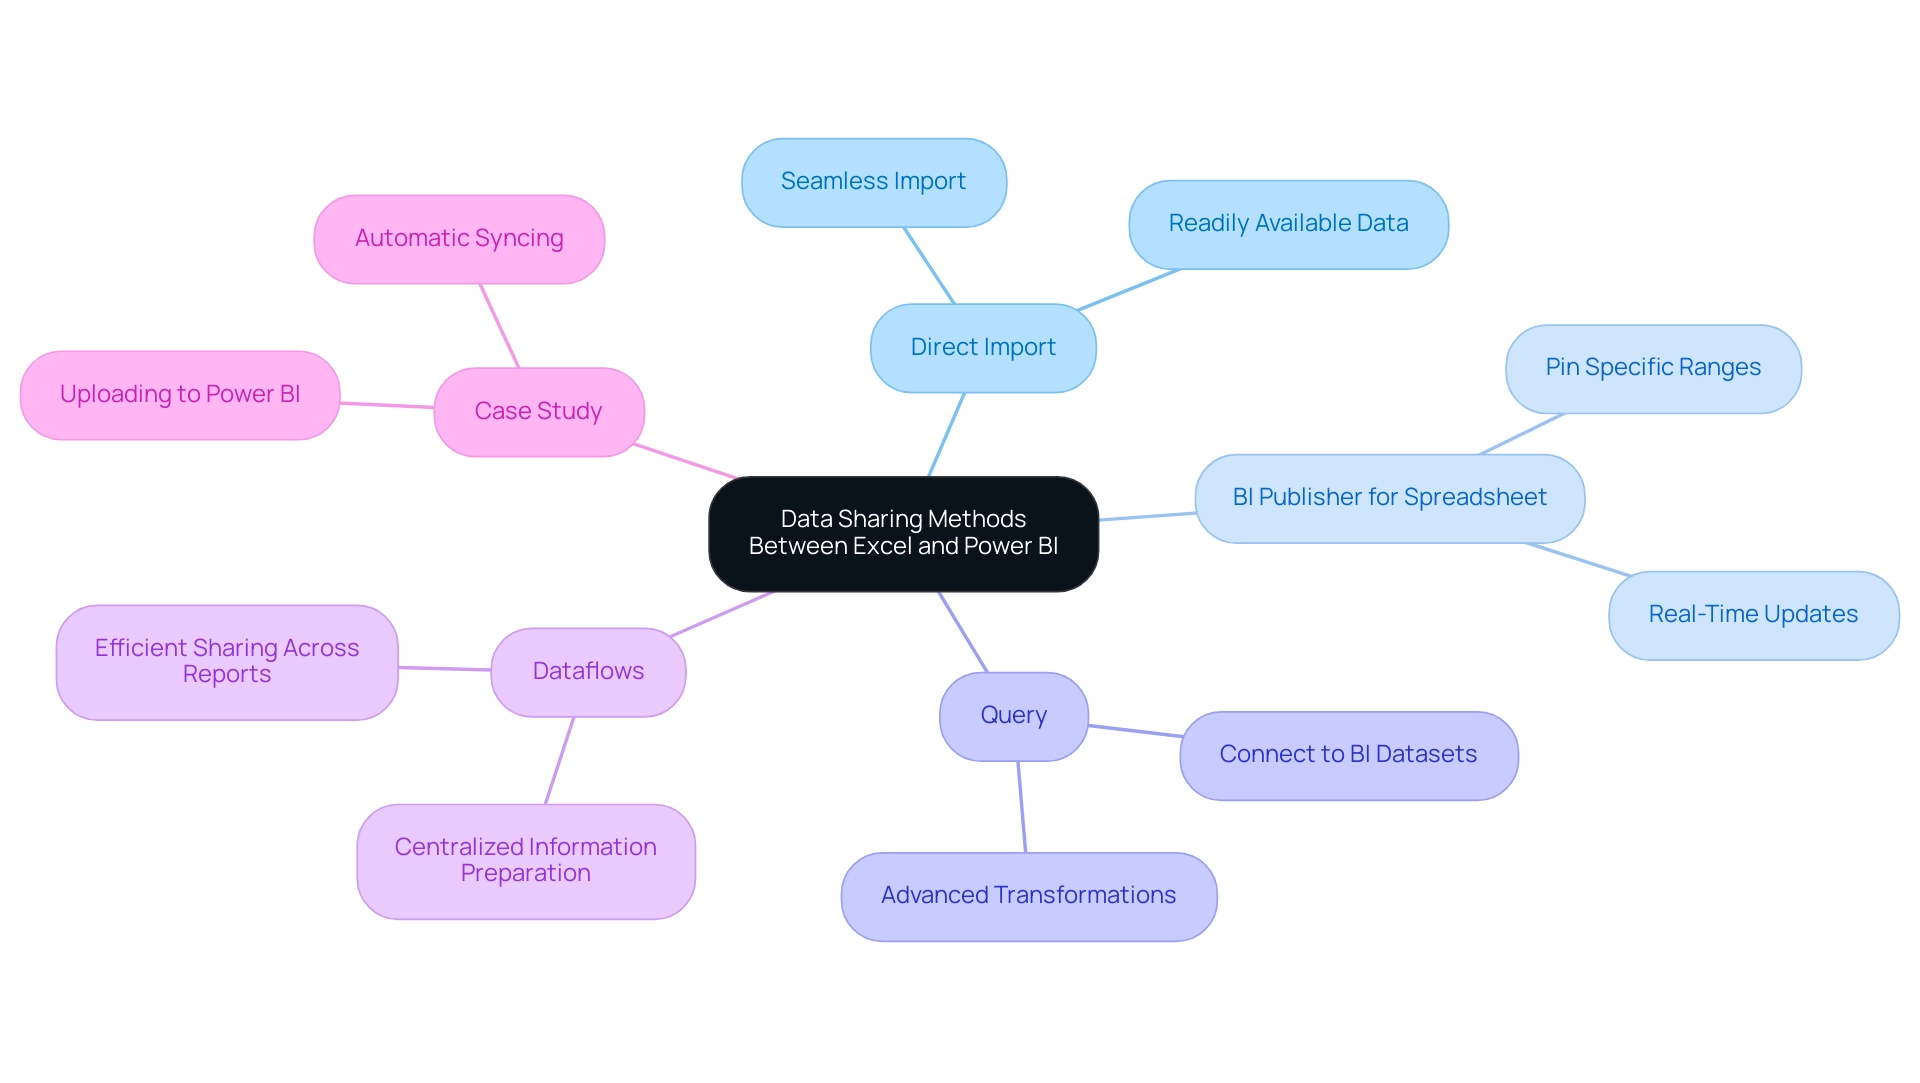
Troubleshooting Common Issues in Excel and Power BI Integration
When linking a spreadsheet program to Power BI, users frequently face various typical challenges that can obstruct their ability to excel to Power BI and achieve operational effectiveness. Addressing these challenges effectively is crucial for seamless operations:
-
Information Formatting Errors: Inconsistent information types can lead to integration issues. It is essential to ensure that all information in the spreadsheet is correctly formatted—particularly for numerical and date fields—to avoid discrepancies during the transfer. Implementing Robotic Process Automation (RPA) can automate these formatting tasks, boosting efficiency and reducing manual errors.
-
Connection Issues: If the data visualization tool fails to connect to your spreadsheet, confirm that the file is closed and not being accessed by another application. Additionally, ensure that the file path is accurate, as changes in file location can disrupt connections. Customized AI solutions can assist in optimizing connection procedures, cutting through the noise of technology integration difficulties by offering intelligent suggestions for addressing connectivity problems.
-
Missing Information: If certain information does not appear in BI, verify that your information is formatted as a table in Excel. This tool necessitates information to be clearly defined as a table to excel to Power BI and import it accurately. This step is vital for leveraging Business Intelligence effectively, turning raw information into actionable insights that drive informed decision-making.
-
Refresh Errors: Encountering refresh errors can be frustrating. To resolve this, check that your information source settings in BI are correctly configured and that the underlying information has not changed in a way that would cause synchronization issues. Utilizing Business Intelligence tools can provide the guidance needed to navigate these refresh challenges, ensuring that information remains up-to-date and reliable.
For a real-world perspective, Tikkurila engaged Multishoring’s consultants for an integration platform migration project aimed at enhancing their capabilities in managing integration processes. By tackling these frequent challenges effectively, organizations can optimize their integration efforts and enhance overall operational efficiency using Excel to Power BI.
Users are encouraged to seek assistance through the BI community forums or submit a support ticket for unresolved issues. As Anna, a PMO Specialist, highlights, > We offer extensive BI troubleshooting and optimization services, from addressing refresh failures to enhancing performance. Furthermore, utilizing third-party support tools, such as Microsoft Azure and other integrated platforms, can offer additional help in troubleshooting and optimizing your connections.
Community resources often lead to effective solutions and insights from experienced users, reinforcing the value of collaboration in overcoming technology challenges.
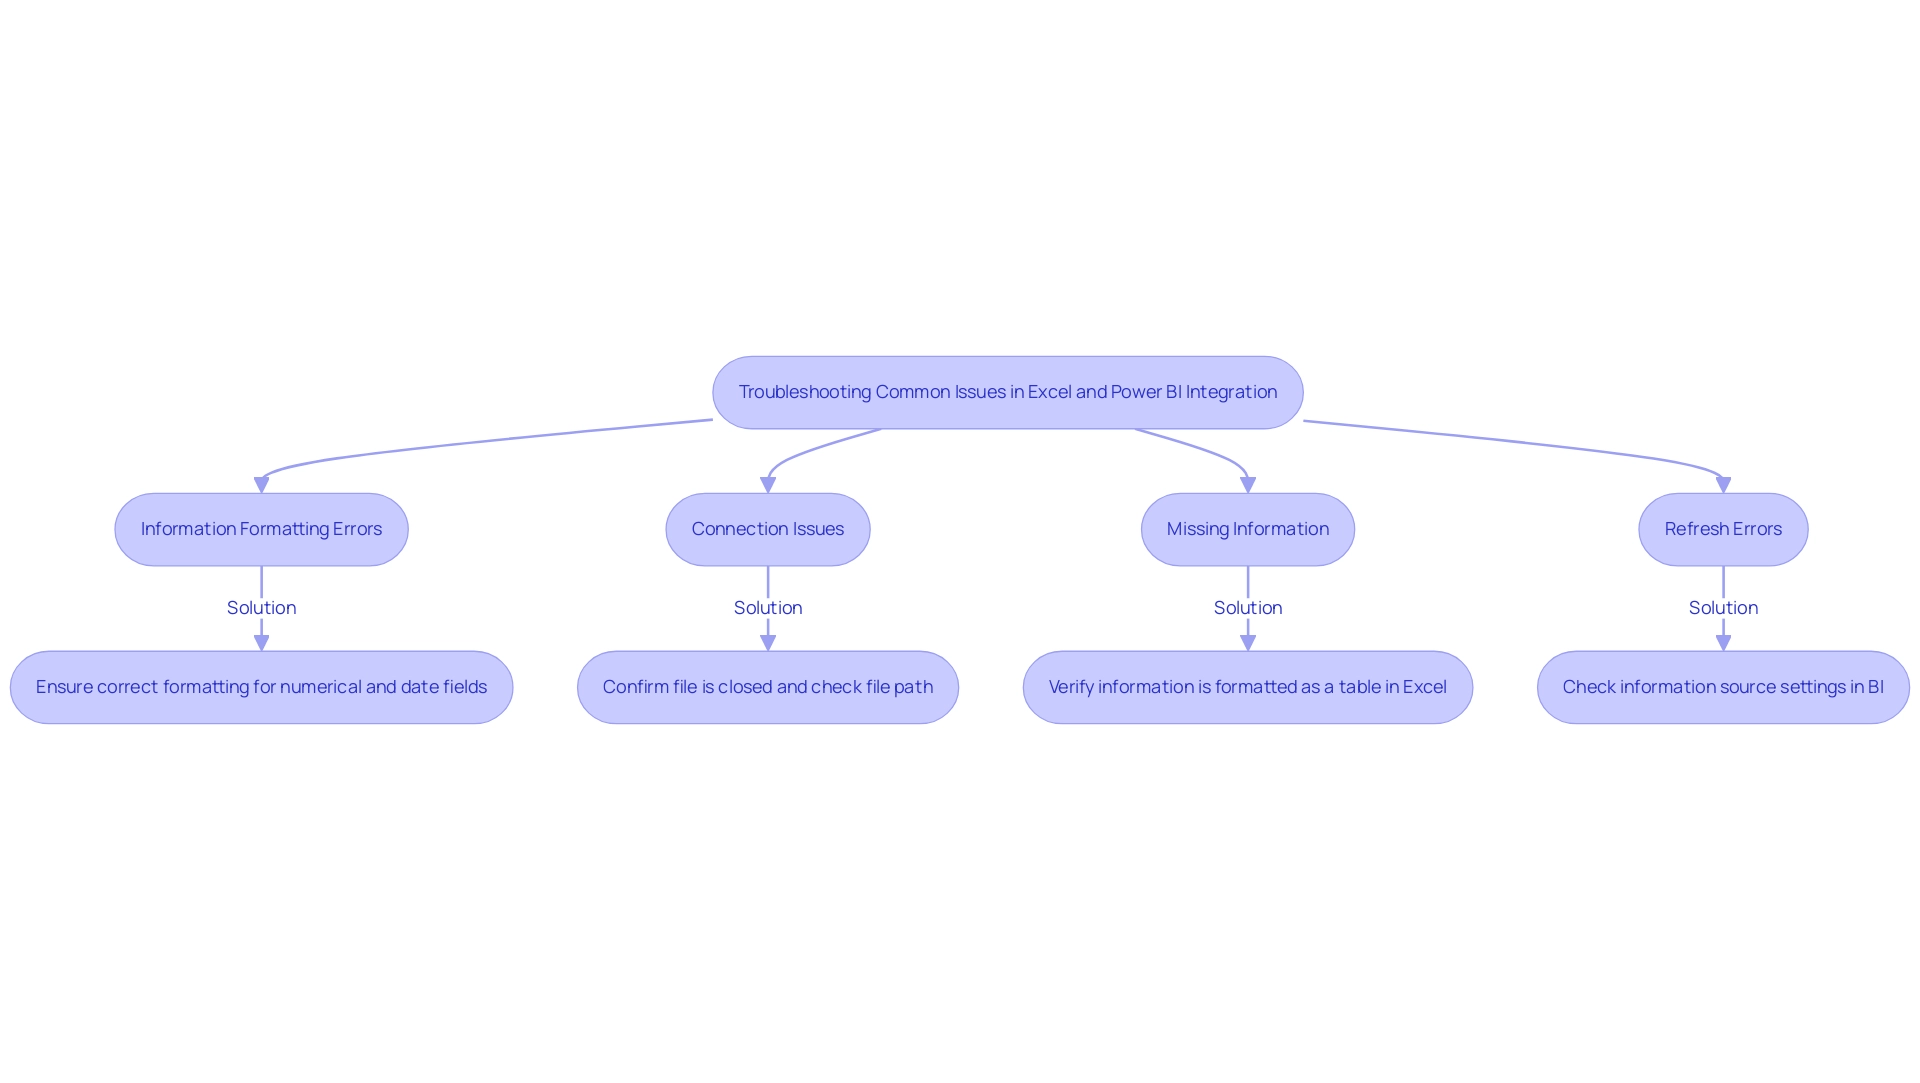
Benefits of Integrating Excel with Power BI for Enhanced Data Analysis
Integrating Excel with Power BI unlocks a multitude of advantages that can significantly enhance operational efficiency and data-driven decision-making:
-
Enhanced Data Visualization: Power BI offers sophisticated visualization options, transforming static Excel data into dynamic, interactive reports that provide deeper insights. This capability allows organizations to present complex datasets in a more comprehensible and impactful manner.
-
Real-Time Insights: Using BI, users can create dashboards that show real-time information, enabling quick and informed decision-making. This immediacy is crucial in today’s fast-paced business environment, where timely actions can greatly influence outcomes.
-
Collaboration and Sharing: BI simplifies the sharing of reports with various stakeholders, fostering improved collaboration across teams. This interconnectedness ensures that all team members are aligned and can contribute to decisions based on a shared comprehension of the information.
-
Data Transformation Capabilities: The robust information modeling and transformation features of this tool enable users to clean and prepare information more effectively than relying solely on Excel to Power BI. This efficiency saves time and ensures that analysis is based on accurate, high-quality inputs.
-
Scalability: As organizations accumulate larger datasets, BI excels in managing this growth. Its capability to manage large volumes of information ensures that analytics efforts can scale seamlessly, allowing businesses to continue leveraging insights as their operations expand.
In the context of leveraging Robotic Process Automation (RPA) to automate these manual workflows, organizations can experience a transformative boost in efficiency, reducing errors while freeing up teams for more strategic, value-adding tasks. RPA can automate the repetitive information entry and report generation processes associated with Power BI, ensuring that details are consistently updated and accurate. According to recent statistics, three out of five organizations are utilizing analytics to drive business innovation, underscoring the critical role of information-driven decision-making in today’s competitive landscape.
As mentioned by Manahil Ahmad, “By merging the strengths of both tools, users can utilize advanced analytics capabilities, smooth information transfer, and improved collaboration for more informed decision-making.” Furthermore, Ipsos Jarmany’s case study, entitled “Making Power BI Work for You,” demonstrates how businesses can maximize the value of Power BI, ensuring effective information utilization and achieving better ROI. This integration not only enhances individual capabilities but also drives organizational success through improved data strategies, particularly as many companies have yet to scale their data strategies across their operations.
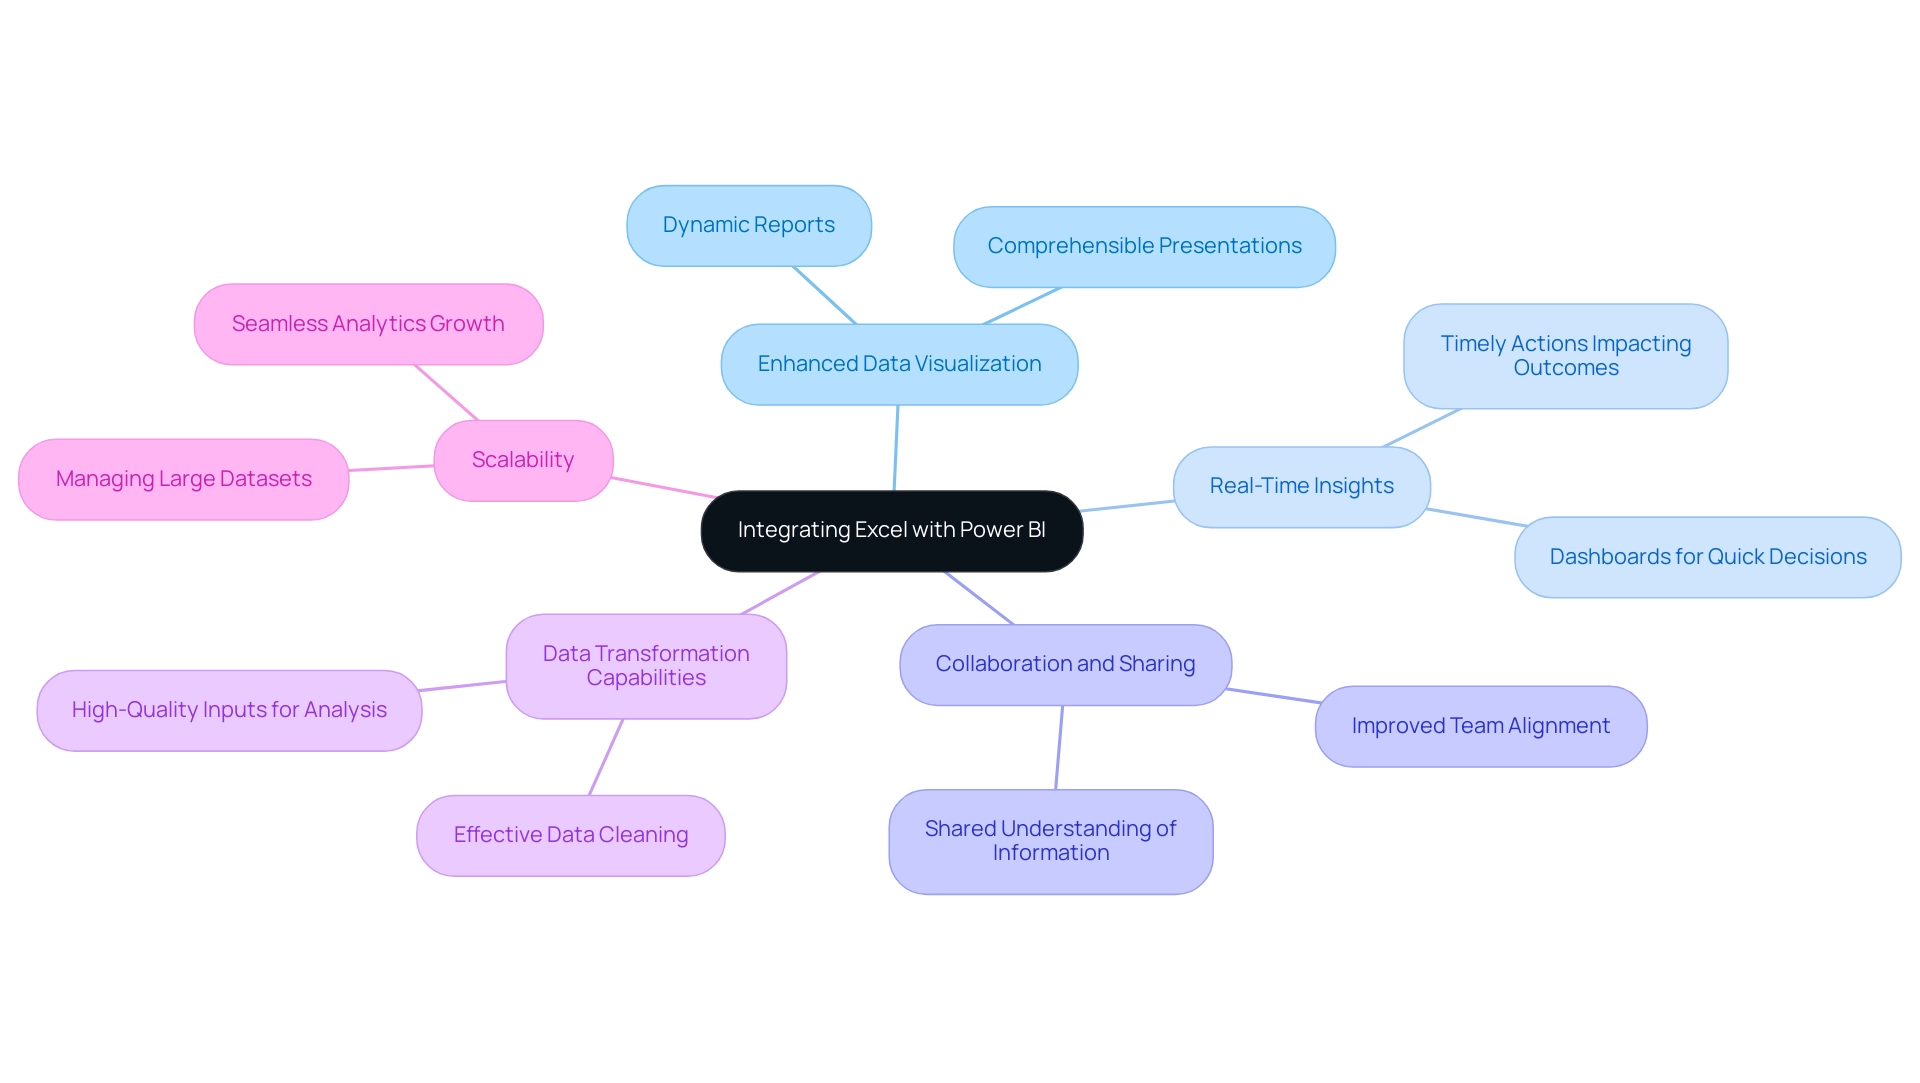
Conclusion
Integrating Excel with Power BI is a transformative approach that empowers organizations to enhance their data analysis capabilities and operational efficiency. By understanding the connection between these two powerful tools, users can leverage their strengths to:
- Create dynamic reports
- Visualize data in real-time
- Facilitate seamless collaboration across teams
The step-by-step guide provided outlines the essential process for connecting Excel to Power BI, ensuring that data is well-structured and easily imported, which is crucial for effective data management.
Effective data sharing methods, such as:
- Direct imports
- The Power BI Publisher for Excel
further streamline the integration process, ensuring that stakeholders have access to the most current insights. Organizations can also overcome common challenges related to:
- Data formatting
- Connectivity
- Refresh issues
by implementing best practices and utilizing available resources. Addressing these obstacles not only simplifies the integration but also enhances overall operational efficiency.
The benefits of this integration are profound, offering enhanced data visualization, real-time insights, and improved collaboration. As organizations embrace these capabilities, they position themselves to make informed decisions that drive success in a competitive landscape. By harnessing the combined power of Excel and Power BI, businesses can transform their data strategies, ensuring they remain agile and responsive to evolving market conditions. Now is the time to take action and unlock the full potential of your data through this powerful integration.
Introduction
In the dynamic world of data visualization, Power BI dashboard themes emerge as a powerful tool for organizations striving to enhance their reporting capabilities. These themes not only provide a framework for consistent visual aesthetics but also address critical challenges such as time-consuming report generation and data inconsistency.
By carefully selecting colors, styles, and visuals, businesses can create an engaging user experience that fosters better data interpretation and decision-making. As organizations seek to optimize their dashboards, understanding the importance of these themes becomes essential for driving operational efficiency and elevating brand identity.
This article delves into the intricacies of Power BI dashboard themes, offering actionable insights and best practices to empower users in their quest for impactful data visualizations.
Defining Power BI Dashboard Themes: An Overview
The power bi dashboard theme visual styles act as essential groups of formatting configurations that influence the overall appearance of reports and displays within the Power BI ecosystem. These concepts include components such as color palettes, typefaces, and visual styles, which allow organizations to create a unified and professional look throughout their power bi dashboard theme and other visual representations. By utilizing these themes, companies not only improve brand awareness but also develop interfaces that are more engaging and intuitive for individuals, addressing common challenges like time-consuming report generation and information inconsistencies arising from a lack of governance strategy.
In a landscape where participant engagement, as indicated by total report viewers across the workspace, can significantly impact data interpretation and decision-making, the importance of actionable guidance cannot be overstated. The General Management App offers comprehensive management solutions, Microsoft Copilot integration, and predictive analytics, which can seamlessly integrate with Power BI to enhance the functionality of logistics dashboards. Specifically, it offers actionable insights that assist individuals in their decision-making processes, thereby enhancing report efficiency.
As noted by Adeline, a Helper III, “Here is a good resource for Power BI marketing templates, containing analysis for Google Ads, Facebook, LinkedIn, Amazon, HubSpot, and many others.” Combining these resources can assist organizations in applying efficient concepts, enhancing information display, and elevating the overall experience for individuals. This engaging and accessible method highlights the practical use of concepts in crafting displays that enhance participant involvement, making it crucial for organizations aiming to improve their data-driven strategies.
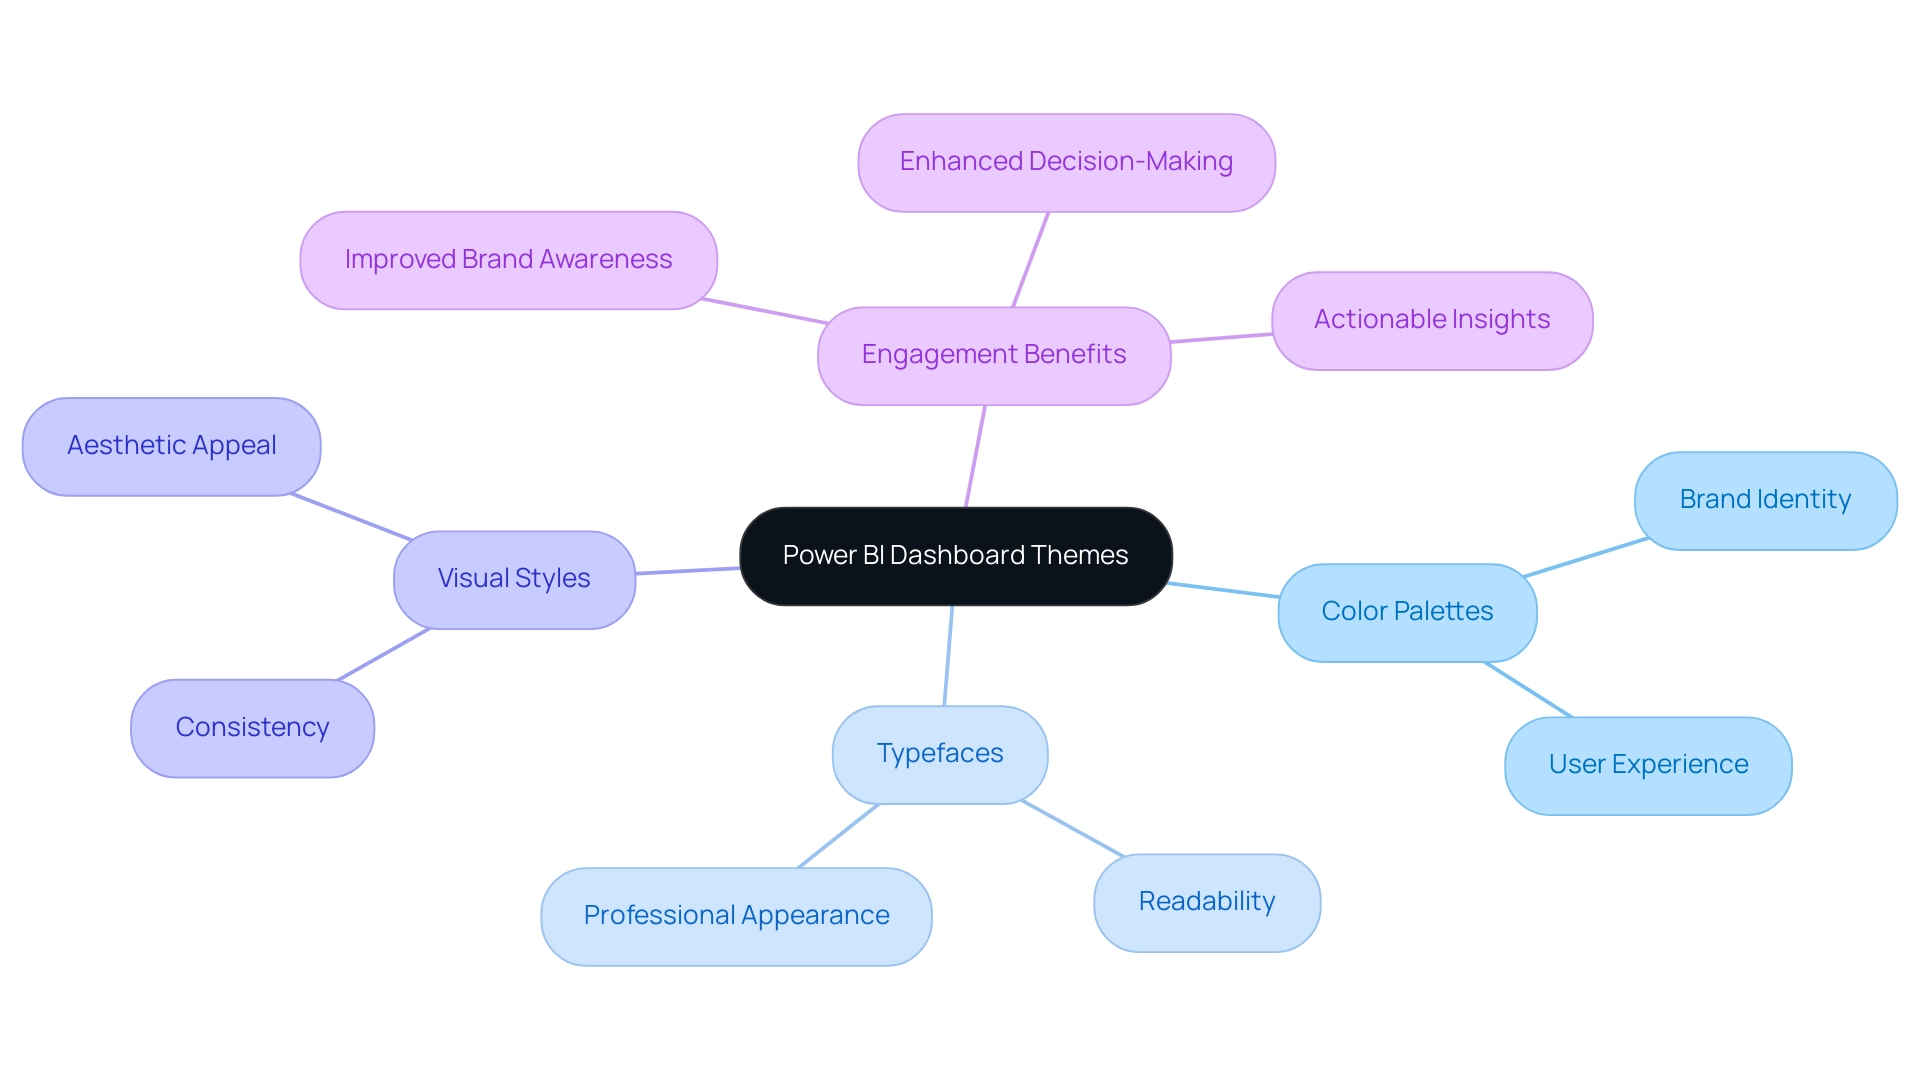
Key Components of Power BI Dashboard Themes: Colors, Styles, and Visuals
The foundational elements of the Power BI dashboard theme encompass colors, styles, and visuals, each serving a distinct purpose in effective information communication. Color selections are crucial, as they not only improve readability but also elicit specific emotions and responses from individuals. A well-organized palette can greatly enhance engagement by directing focus to essential information, tackling the frequent issues of time-consuming report creation and inconsistencies.
As Carlos Nisbet aptly notes,
We need to apply some logical rules that give us scope; so we opted for tints and shades of our primary and accent colors therefore giving us flexibility whilst containing the five palette colors.
Styles are equally essential, involving the formatting of text and other elements to ensure clarity and consistency throughout the interface. Meanwhile, visuals denote the collection of charts and graphs employed to showcase information, simplifying the interpretation of intricate details.
Various kinds of metrics, such as performance, health, and operational metrics, play a vital role in shaping the design of these displays, ensuring that key information is highlighted effectively. The case study titled ‘Better Interface Design with Audience Research’ emphasizes the significance of audience feedback in crafting interfaces that connect with individuals by presenting pertinent, clear, and succinct information. Furthermore, the BBC’s accessibility interface serves as a real-world example of effective design, featuring high-contrast mode and keyboard navigation, enhancing engagement and accessibility.
By carefully choosing and coordinating these elements, individuals can create a Power BI dashboard theme that not only engages visually but also promotes informed decision-making and efficient information analysis. Moreover, integrating RPA solutions like EMMA RPA and Power Automate can significantly boost operational efficiency by automating repetitive tasks and enhancing information accuracy. To explore how these tools can transform your business, book a free consultation today.
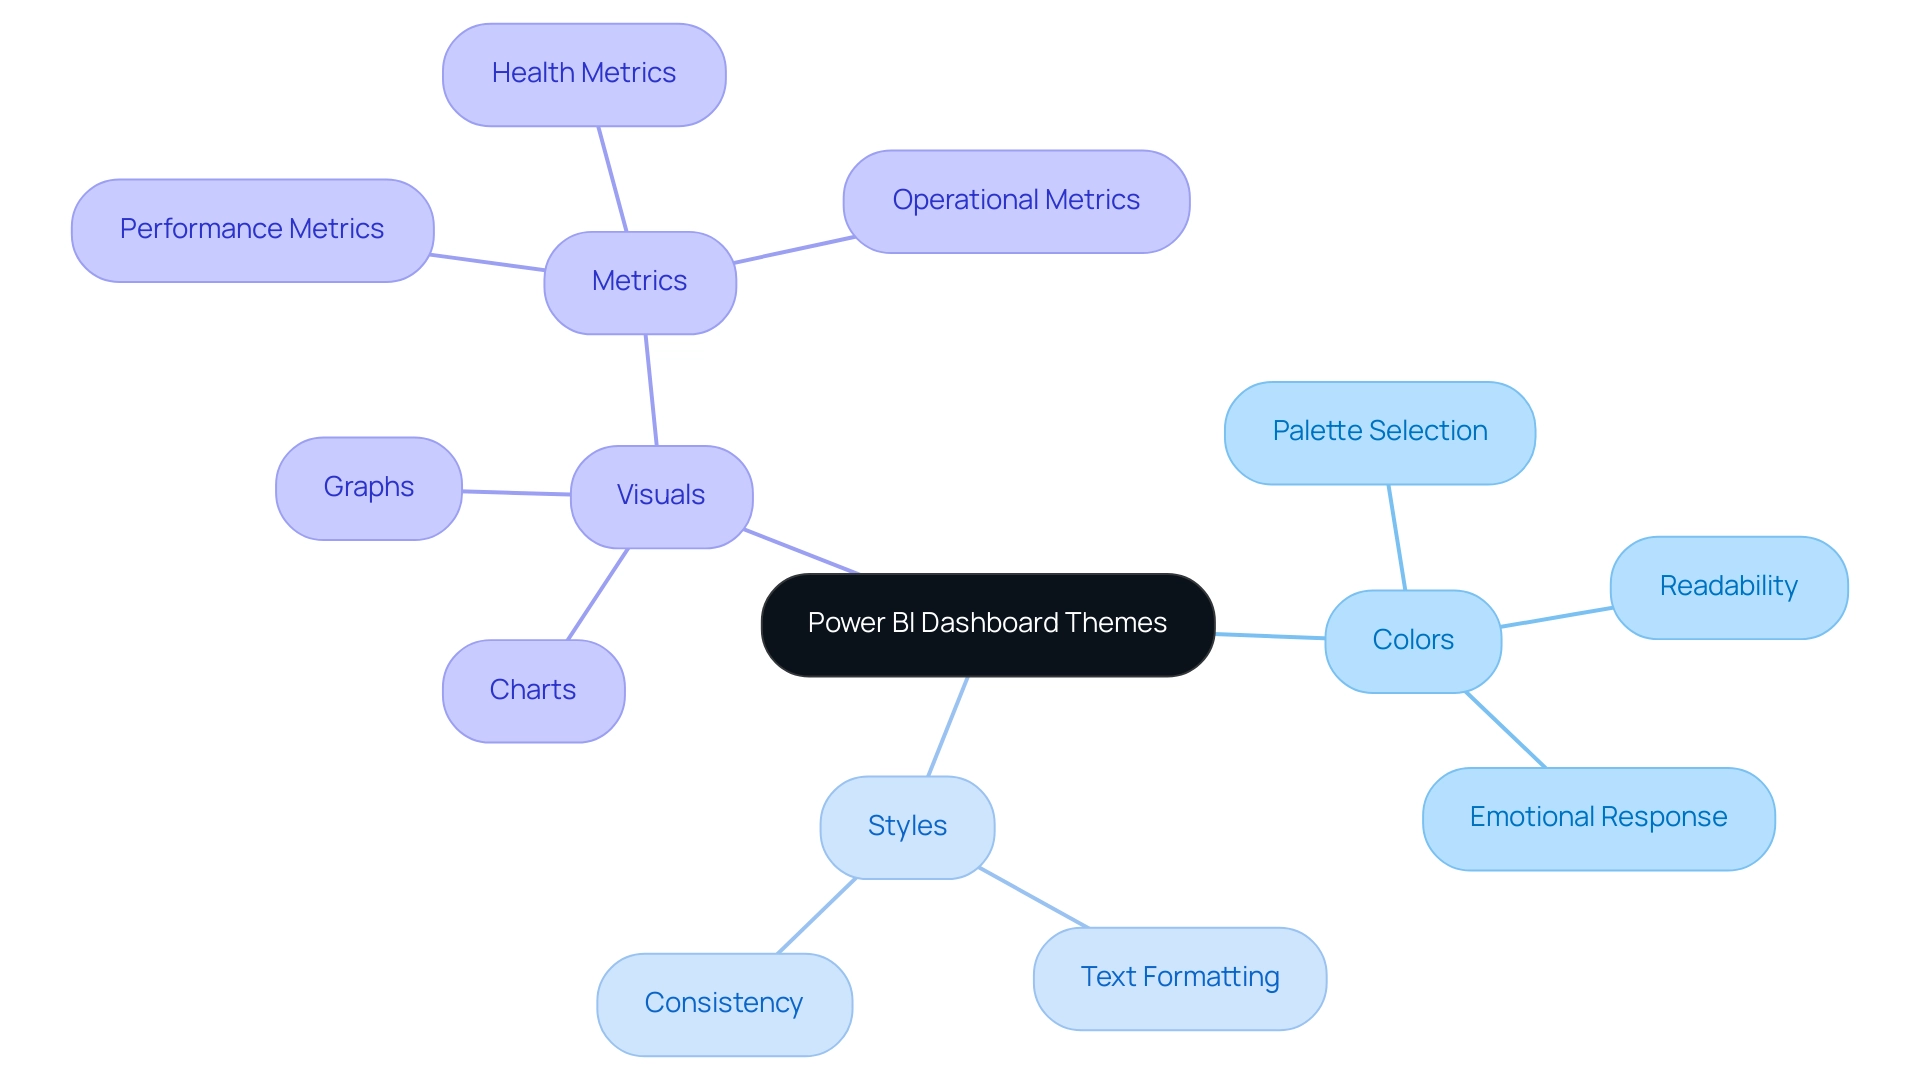
The Importance of Themes in Enhancing User Experience and Data Interpretation
Themes in Power BI dashboard themes are essential for improving experience and information interpretation. They design a visually unified setting, allowing individuals to explore intricate information sets effortlessly. By addressing common challenges such as time-consuming report creation and inconsistencies, thoughtfully designed themes significantly reduce cognitive load.
This enables individuals to concentrate on extracting actionable insights instead of sorting through a mishmash of styles. Implementing features from the General Management App—like Microsoft Copilot integration and custom dashboards—can streamline seamless data integration and provide expert training. These enhancements not only lead to improved adoption rates but also render dashboards more engaging and accessible.
For instance, utilizing contrasting colors for key performance indicators helps individuals in swiftly identifying trends and anomalies, thereby accelerating the decision-making process. Moreover, effective concepts can direct users on the subsequent actions to undertake based on the information provided, addressing the significant absence of practical advice frequently encountered. With the organization currently achieving a maturity level of 200 in executive sponsorship and aiming for 500, the effective use of the Power BI dashboard theme is crucial in reaching these goals.
As Kenneth Leung states, ‘Discover how Power BI can be leveraged to generate high-impact visualizations and narratives to drive scalable, evidence-based decision making in your organization.’ Additionally, addressing governance strategy issues, such as ensuring consistent data presentation across reports, is essential for building trust in the data. Case studies such as ‘Utilizing Additional Data for Adoption Tracking‘ demonstrate how organizations can enhance their adoption tracking efforts through effective implementation, ultimately improving clarity and driving scalable, data-driven decision-making throughout their operations.
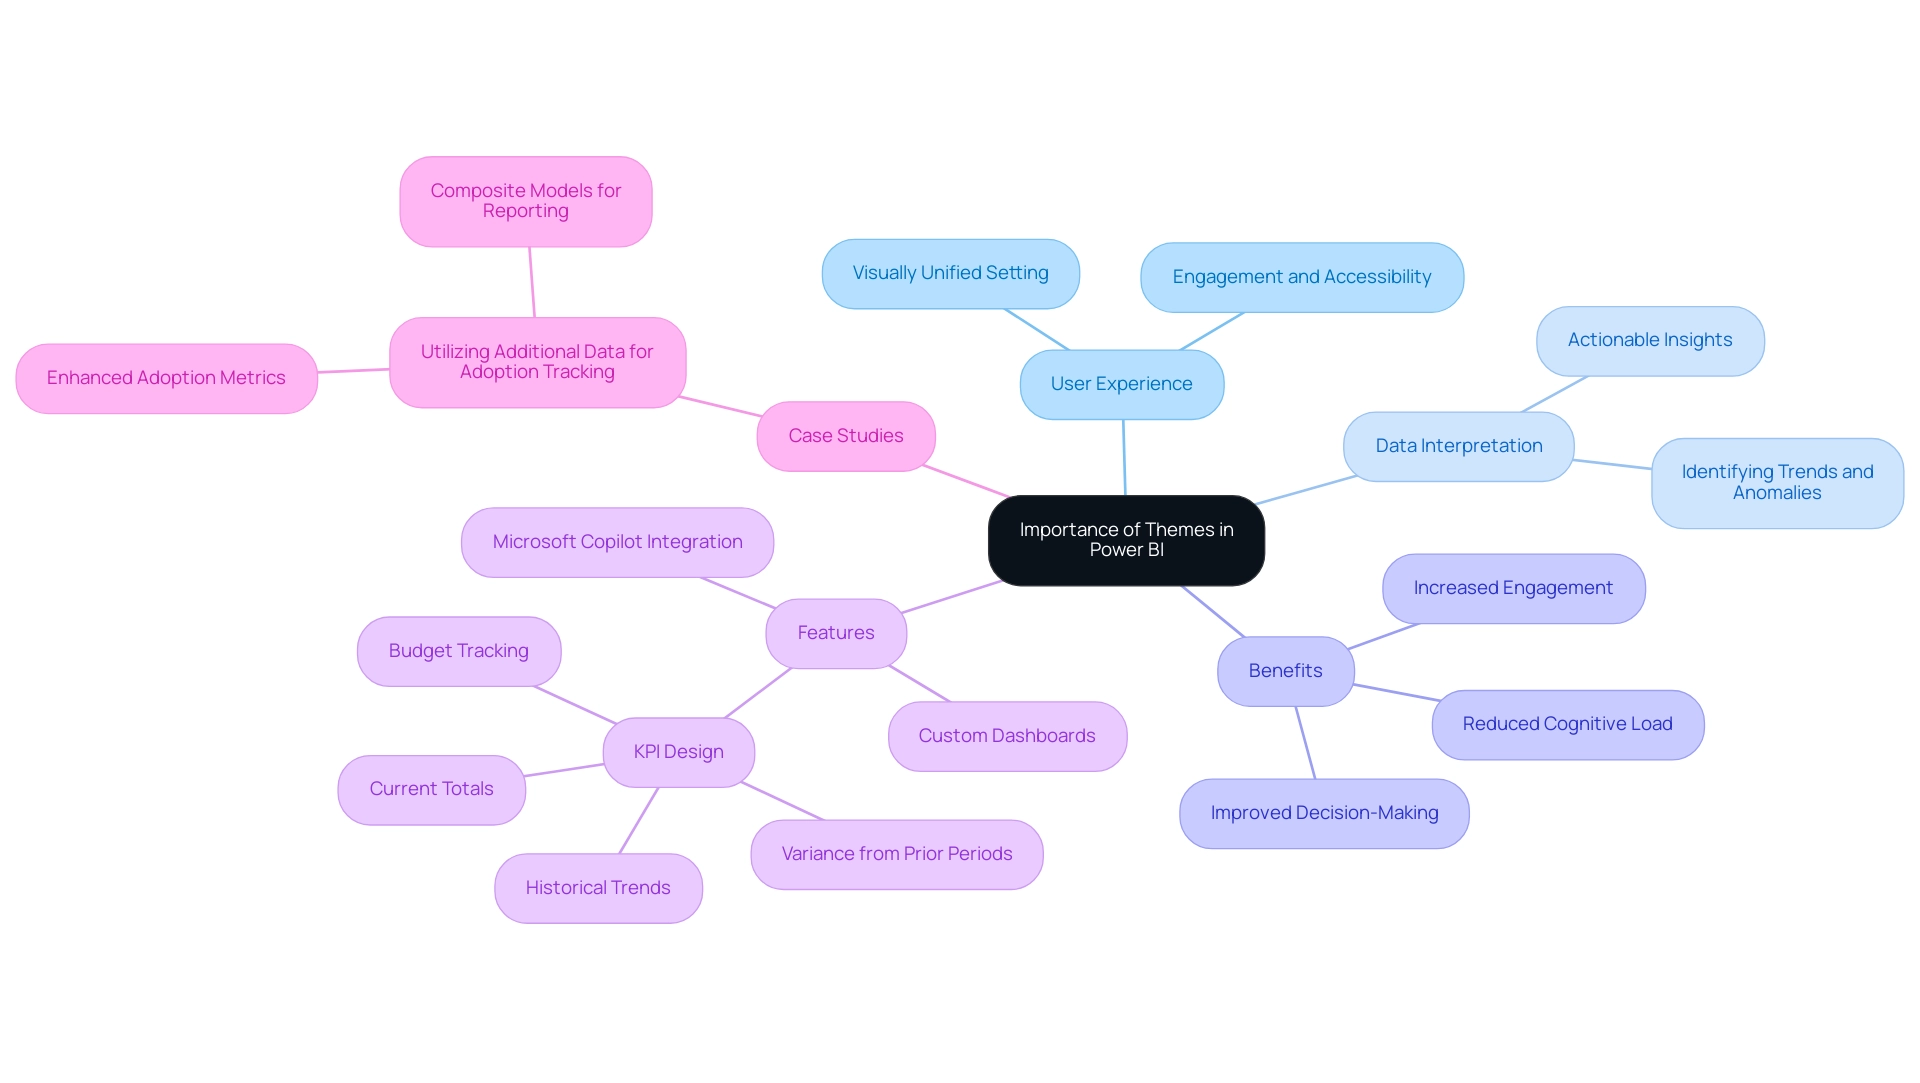
Creating and Implementing Custom Themes in Power BI
The process of creating and implementing a Power BI dashboard theme significantly enhances your reports, ensuring they not only reflect your organization’s brand identity but also drive operational efficiency. To begin, individuals should define a color palette that resonates with their branding standards, as emphasized by designer Paul Waller, who highlights the importance of accessibility in data visualization. By developing an accessible color palette, particularly for individuals with color vision deficiencies, organizations can promote inclusivity in their reporting.
Utilizing JSON files, Power BI users can effectively customize various visual elements, such as colors and fonts, to create a Power BI dashboard theme that meets the needs of diverse audiences. This customization not only enhances visual appeal but also strengthens brand identity across all reports and dashboards. For those encountering challenges in report creation, such as time-consuming processes, inconsistencies, and the competitive disadvantage of not utilizing meaningful insights, Creatum offers the 3-Day Power BI Sprint.
In just three days, we will create a fully functional, professionally designed report on a topic of your choice, allowing you to focus on utilizing actionable insights for impactful decision-making. Additionally, Power BI provides a variety of ready-made custom report theme JSON files, including the Waveform theme and Color-blind friendly theme, which enhance the Power BI dashboard theme by improving accessibility and personalization. Embracing these resources empowers users to create impactful, inclusive visualizations while driving business growth and innovation.
Furthermore, integrating tools like EMMA RPA and Power Automate can streamline processes, reduce task fatigue, and enhance operational efficiency, addressing the challenges of data extraction and report generation. For assistance, a tutorial series named ‘Mastering Design in Power BI’ is scheduled to debut on March 24, 2024, offering step-by-step directions for applying these concepts and customization methods.
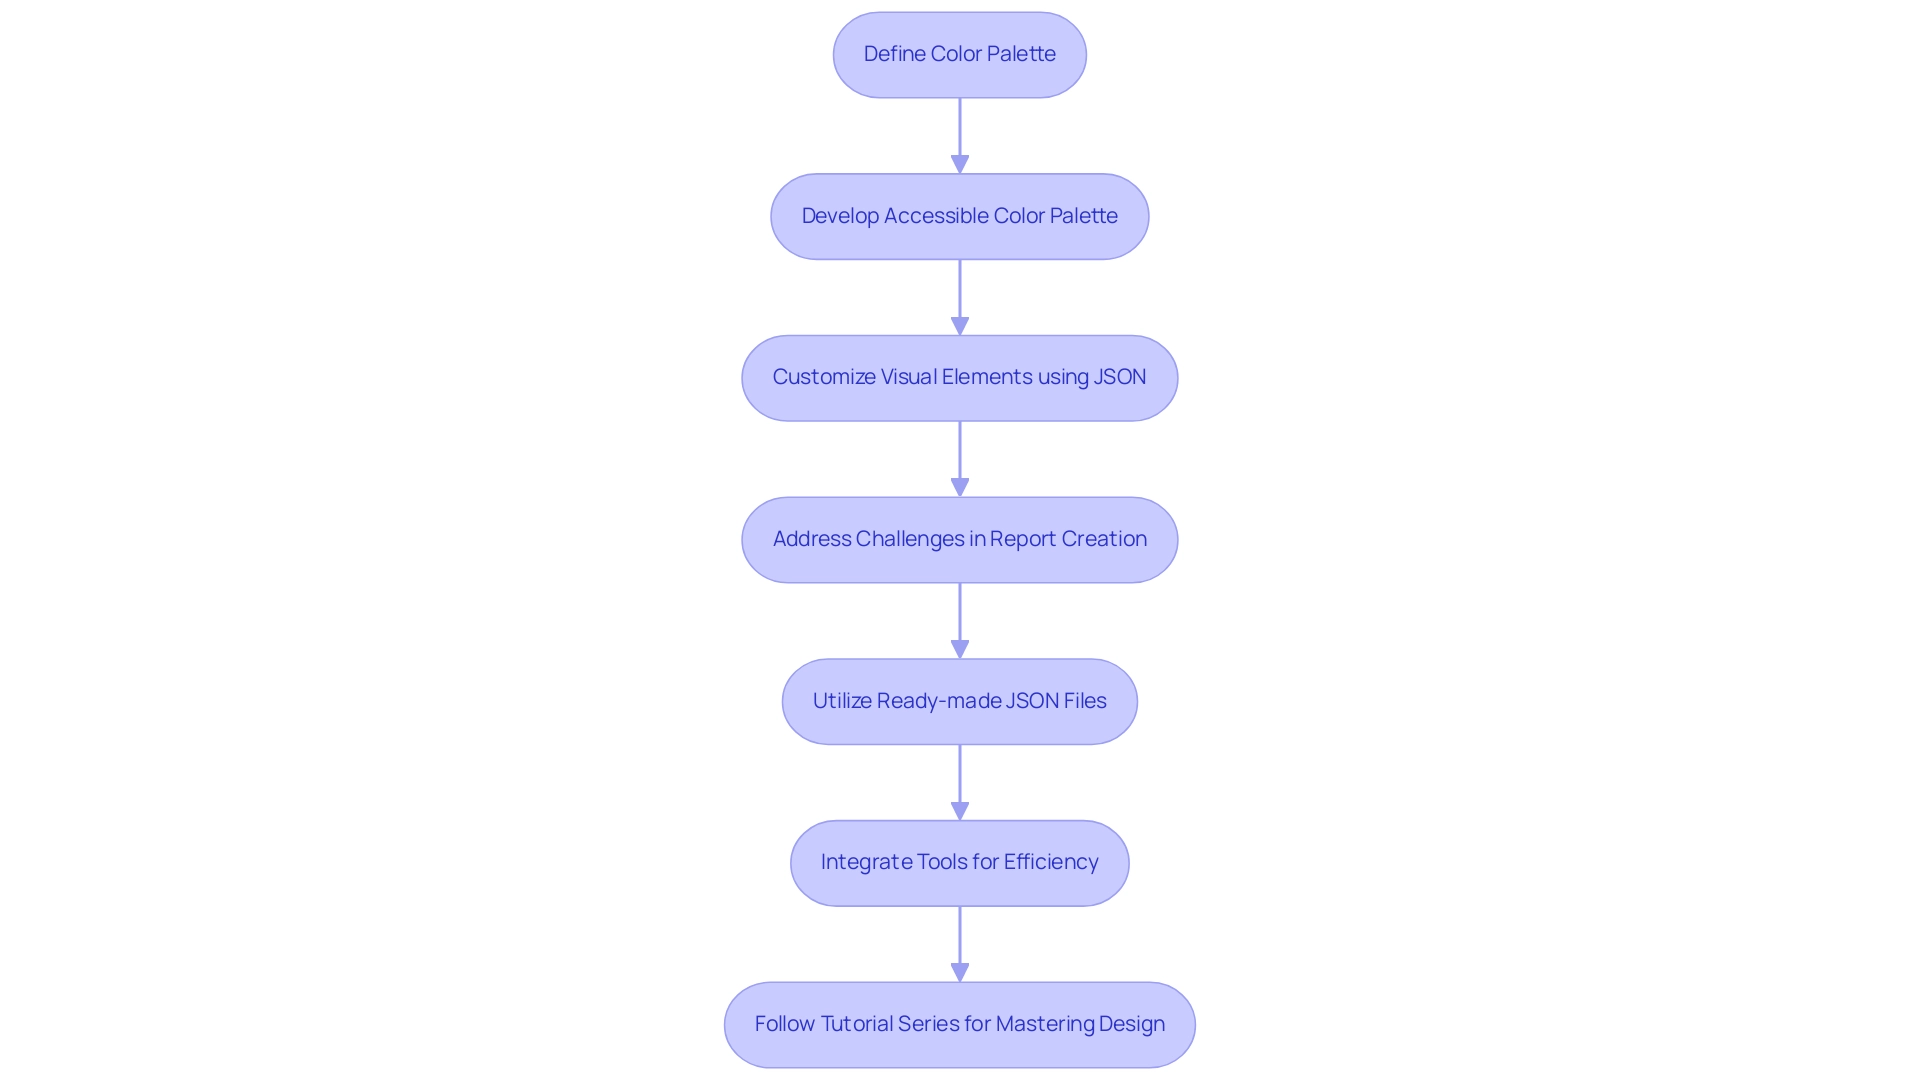
Best Practices for Designing Effective Power BI Dashboard Themes
Creating effective Power BI dashboard themes requires adherence to several best practices that enhance both visual appeal and usability, ultimately contributing to improved operational efficiency. Consistency is essential; employing a cohesive color palette and uniform typography fosters a polished and professional appearance that assists in interpretation. It is crucial to choose colors that promote readability, particularly for users with color blindness, ensuring that the information is accessible to all.
Understanding the cultural implications of color is vital; as highlighted in the case study titled ‘Cultural Considerations in Color Usage,’ colors can have different meanings across cultures—red, for instance, can signify danger in Western cultures but prosperity in Eastern contexts. This awareness can help in designing visualizations that resonate universally and drive actionable insights. Furthermore, before creating a visualization, it is essential to consider the information being presented and the tools or platforms used for building the visualization.
Utilizing sequential color palettes improves interpretation; lighter colors usually represent lower values while darker shades signify higher ones, aligning with the need for clarity in reporting. To illustrate, Amy Bower, a Senior Scientist at Woods Hole Oceanographic Institute, states,
frequency mapping, when low tones match with low numbers and high tones represent high numbers, is an effective way to depict information without a graph.
Involving end-users for feedback on themes encourages ongoing enhancement based on their preferences, resulting in more functional and impactful displays.
Additionally, integrating RPA solutions can further enhance operational efficiency by automating repetitive tasks, thereby reducing task fatigue and streamlining processes. For instance, tools like EMMA RPA and Microsoft Power Automate can assist organizations in automating information collection and reporting processes, significantly decreasing the time devoted to manual tasks. By implementing these best practices and utilizing RPA tools, organizations can craft visually striking and efficient dashboards with a Power BI dashboard theme that effectively convey critical insights, overcoming the challenges of time-consuming report creation and data inconsistencies, ultimately driving business growth.
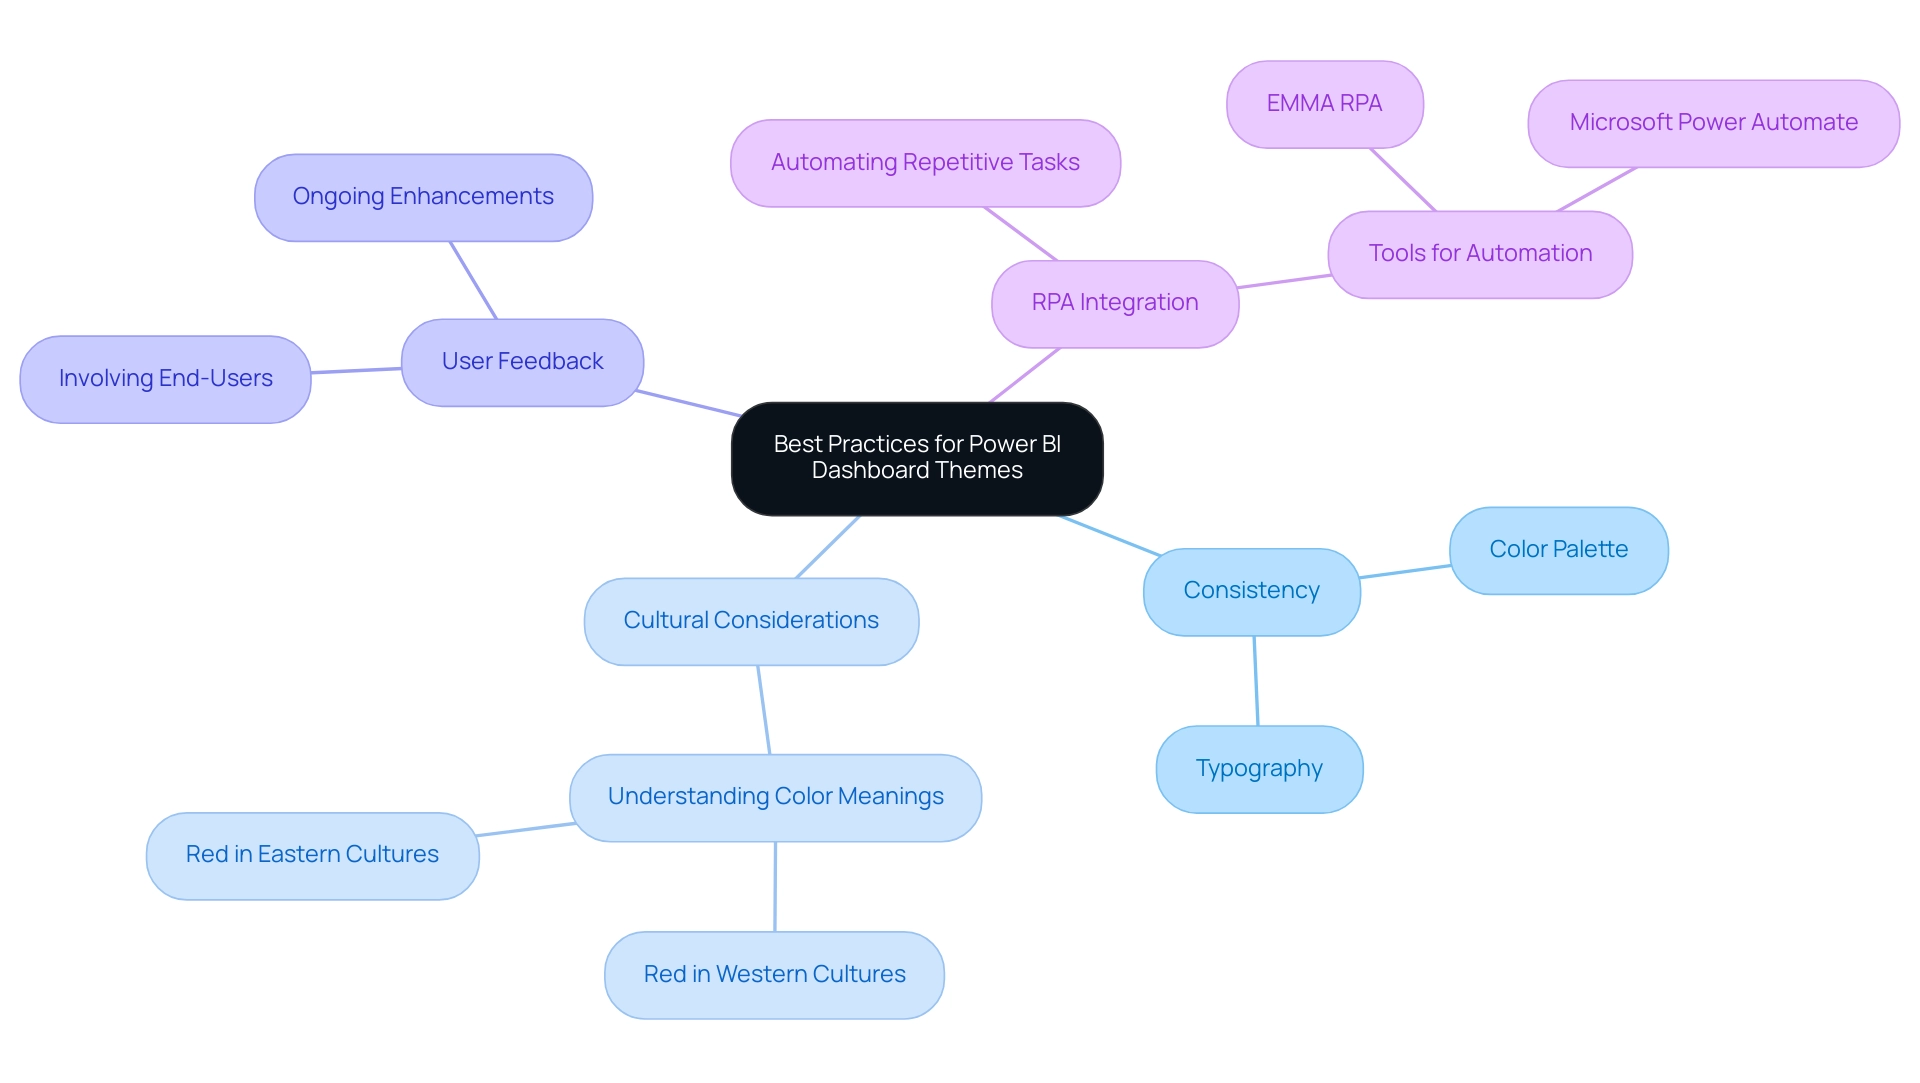
Conclusion
The effective utilization of Power BI dashboard themes is a game changer for organizations aiming to enhance their data visualization and reporting capabilities. By defining a cohesive aesthetic through careful selection of colors, styles, and visuals, businesses can not only improve brand recognition but also create engaging and intuitive dashboards that facilitate better decision-making. The implementation of these themes addresses common challenges such as time-consuming report generation and data inconsistencies, ultimately streamlining the reporting process and boosting operational efficiency.
Moreover, the importance of user feedback and accessibility cannot be overstated. Themes that are designed with inclusivity in mind ensure that all users can interpret data effectively, regardless of their visual abilities. This commitment to accessibility, combined with best practices in design, empowers organizations to create dashboards that resonate with their audience and drive actionable insights. As organizations continue to refine their data-driven strategies, leveraging custom themes becomes essential for fostering user engagement and enhancing the overall user experience.
In conclusion, embracing Power BI dashboard themes is not just about aesthetics; it’s about operational excellence and informed decision-making. By following best practices and utilizing available resources, organizations can craft impactful, visually appealing dashboards that not only capture attention but also enhance clarity and understanding of complex data sets. The journey toward effective data visualization begins with the right themes, setting the stage for a future of data-driven success.
Introduction
In the dynamic landscape of data management, the ability to share insights effectively can set organizations apart from their competitors. Power BI’s “Publish to Web” feature opens the door to a broader audience, enabling companies to distribute interactive reports with ease. However, this opportunity comes with significant responsibilities, particularly regarding data privacy and security.
As organizations navigate the complexities of sharing information publicly, understanding the nuances of this feature becomes imperative. From ensuring compliance with regulations to customizing reports for maximum impact, this article delves into practical strategies and best practices that empower organizations to harness the full potential of Power BI while safeguarding their sensitive data.
By addressing these critical aspects, businesses can enhance transparency and engagement, ultimately driving informed decision-making and fostering growth.
Understanding Power BI Publish to Web
By choosing to publish Power BI report to web, organizations can distribute a BI publication that offers a significant chance to share interactive visualizations with a broader audience, thus improving access to essential data insights. This capability is particularly advantageous for disseminating information to stakeholders or the public without the need for them to possess Power BI licenses. However, it is essential to recognize that when you publish Power BI report to web, the reports become accessible to anyone with the link.
This openness can significantly enhance transparency, fostering trust and engagement with the audience, yet it simultaneously raises critical privacy concerns that must be addressed, especially regarding the uploading of images with embedded location information (EXIF GPS). As the landscape of information sharing continues to evolve, particularly in 2024, organizations must tread carefully, balancing the benefits of wider access against the imperative of protecting sensitive information. Significantly, the dataset utilized in BI analyses frequently includes merely four count measures, which can restrict the breadth of understanding offered.
Additionally, as emphasized by a confidential source, the enhanced usage statistics document only encompasses instances that have been accessed in the past 30 days, raising concerns for users seeking more comprehensive usage information. Understanding these complexities is vital before embarking on the publication process. Utilizing our BI services, including the 3-Day BI Sprint for rapid document creation—which enables organizations to generate professional documents in just three days—and the General Management App for thorough management, can assist in streamlining your reporting processes and improving actionable understanding.
The integrated usage metrics summary accessible in the BI Service enables organizations to obtain usage information without requiring administrative privileges, demonstrating a practical approach to address these challenges. Furthermore, it is crucial to tackle the difficulties in utilizing insights from BI dashboards, such as time-consuming document creation and possible information inconsistencies. By exploring the implications of how to publish Power BI report to web, organizations can develop strategic approaches to maximize its benefits while safeguarding their information integrity.
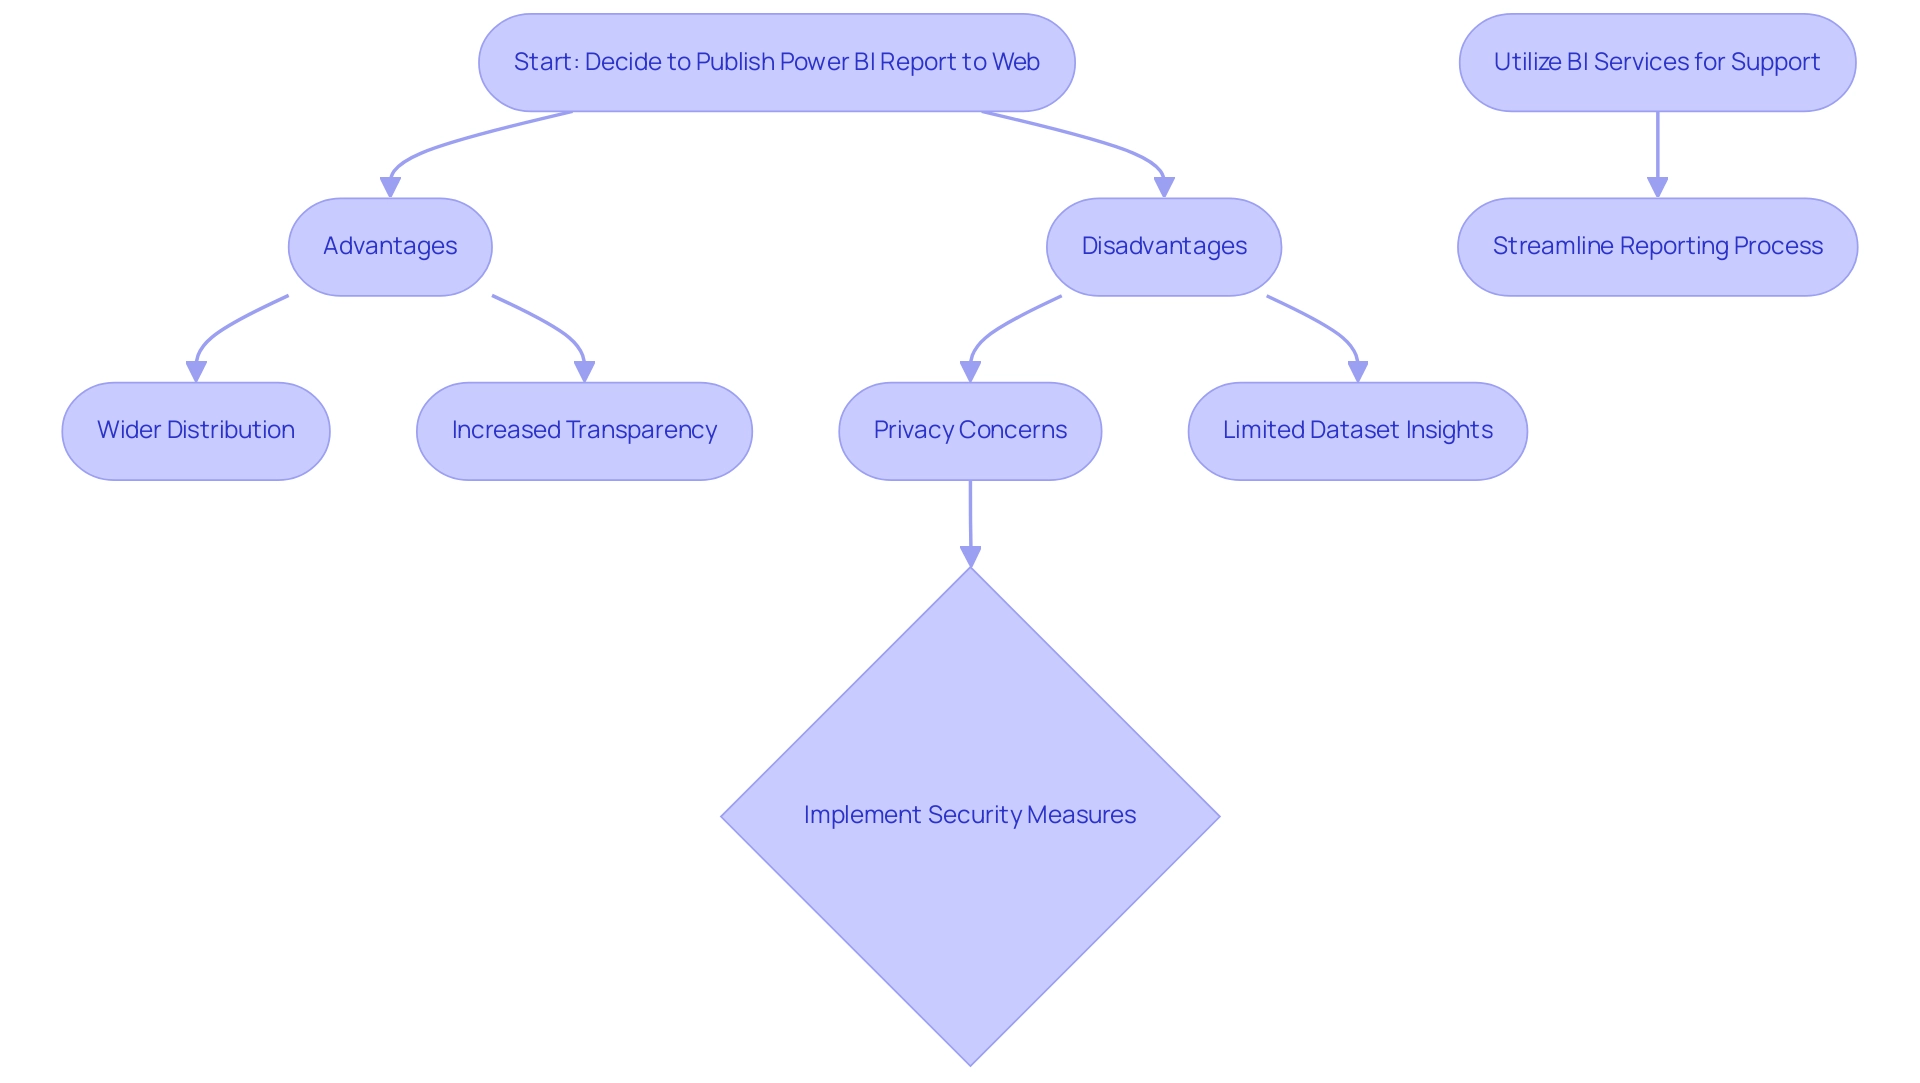
Step-by-Step Guide to Publishing Your Power BI Report
-
Open Your Report: Begin by accessing the BI report that you intend to publish. Confirm that it is polished and prepared for audience engagement, ensuring that it addresses any inconsistencies in information and provides actionable insights.
-
Select ‘File’: Click on the ‘File’ menu located in the upper left corner of the Power BI interface.
-
Choose ‘Publish to Web’: From the drop down menu, select the ‘Publish to Web’ option. A dialog box will appear, outlining the public nature of the document and its implications, which is crucial for maintaining data governance and trust.
-
Create Embed Code: Click on the ‘Create embed code’ button. Ensure you acknowledge the implications of making your document publicly accessible before proceeding, as this can enhance your insights’ reach and impact.
-
Copy the Link: After the embed code is generated, copy the provided link. This link will serve as the gateway for others to access your document, facilitating informed decision-making.
-
Share Your Report: You can disseminate the link through email, social media platforms, or by embedding it on a website. Be sure to inform your audience that the document is publicly accessible, as Christian Ofori-Boateng aptly notes,
Knowing how to publish Power BI report to web will enable you to provide readers, customers, and relevant parties access to responsive visualized information that automatically updates when you change the information within the Microsoft software.
Additionally, it’s worth noting that in January 2017, a statistic recorded indicated that 5% of organizations were effectively sharing BI reports online. Moreover, the case study titled ‘How to Create Interactive Dashboards‘ offers significant perspectives on developing and labeling dashboards, which can improve your information presentation and operational efficiency. Lastly, while percentiles and quartiles can be visualized using Boxplots, Power BI does not provide a native method to create them, which is an important consideration for users aiming for comprehensive analysis.
In today’s data-rich environment, failing to utilize information effectively can place your organization at a competitive disadvantage. Embracing Business Intelligence can transform raw data into actionable insights, driving growth and innovation.
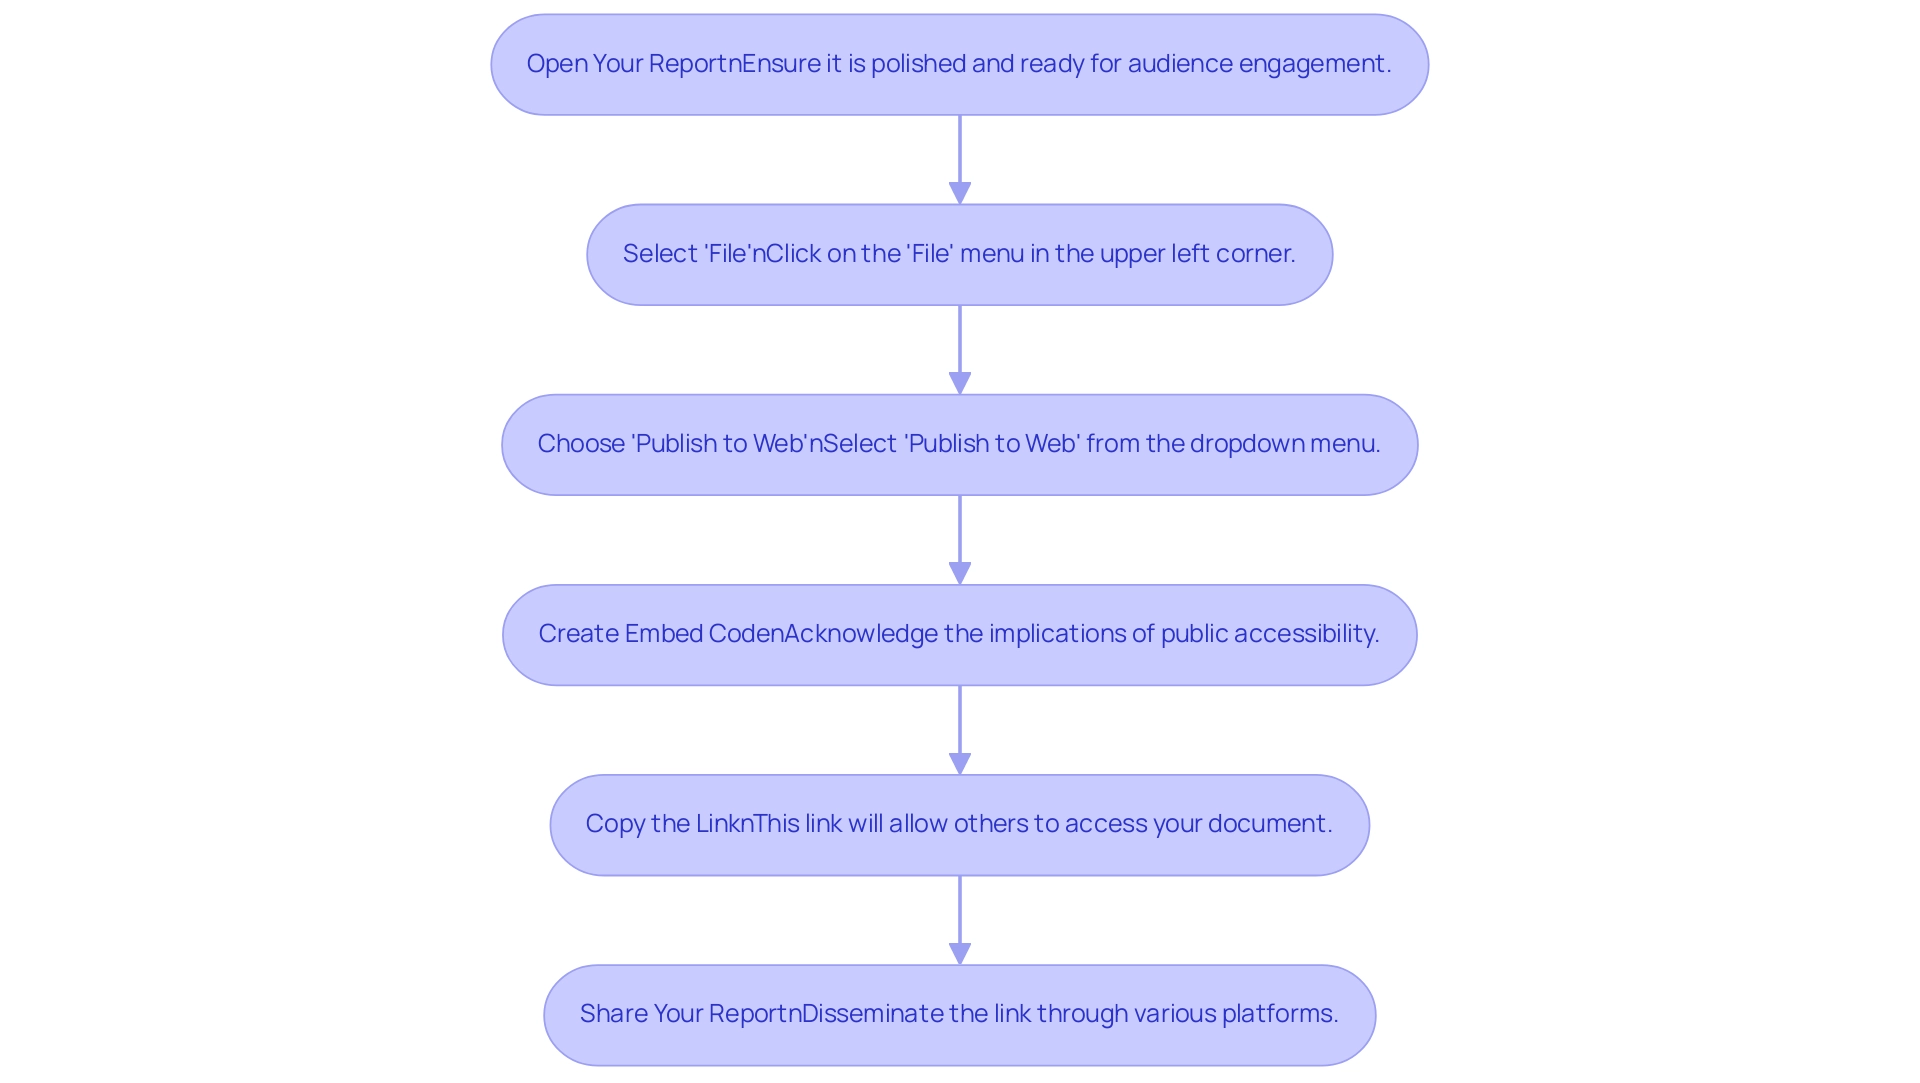
Security and Privacy Considerations for Published Reports
Before publishing your Power BI document, it is essential to address several key security and privacy considerations:
-
Data Sensitivity: Assess the document for any sensitive or confidential information. Remember, anyone with access to the link can view the document, potentially exposing your organization to risks. Statistics have indicated that sensitivity breaches in published documents can result in significant consequences, highlighting the necessity for vigilance. Historical events, such as the 1984 TRW hack that led to the theft of 90 million records, highlight the significance of strong information protection measures.
-
Compliance: Confirm that sharing your document aligns with your organization’s governance policies and complies with relevant regulations such as GDPR. Non-compliance can lead to substantial fines and legal consequences, as demonstrated in previous settlements involving breaches, such as the $750,000 agreement by Raleigh Orthopedic Clinic in 2016. Additionally, staying informed about current data privacy regulations is crucial to guarantee continuous compliance and reduce risks.
-
Monitoring Access: Regularly review who has access to your document. Be proactive in managing permissions and be ready to withdraw the document from public access if any concerns arise. A study indicated that remote employees have been associated with security breaches in 20% of organizations during the pandemic, emphasizing the significance of access control.
-
Updating Documents: Keep in mind that once your document is published, it remains static. Any updates or changes made after you publish Power BI report to web will not be reflected until you republish the document. This limitation necessitates careful planning and regular updates to ensure that the published content remains accurate and relevant. The case of Providence Health & Services, which settled a case in 2008 for $100,000 due to insufficient information governance, serves as a reminder of the potential financial repercussions of neglecting these responsibilities.
-
Visitor Comments and Privacy Practices: When receiving comments on your reports, be aware that details such as the visitor’s IP address and browser user agent string are collected to assist in spam detection. Additionally, an anonymized string created from the email address may be shared with services like Gravatar, which allows users to display their profile pictures publicly once comments are approved. Comprehending these practices is vital for preserving transparency and trust with your audience.
-
Image Upload Privacy: Be cautious when uploading images that may contain embedded location information (EXIF GPS). This information can inadvertently expose sensitive details about locations, which could compromise privacy. It is recommended to remove such metadata prior to uploading images to guarantee that no unintentional location information is disclosed publicly.
-
Challenges in Utilizing Information: While BI dashboards can offer valuable information, obstacles such as time-consuming document creation, inconsistencies in information, and the absence of actionable guidance can impede effective decision-making. Tackling these challenges is essential to completely utilize the features of BI tools and enhance data governance.
By considering these factors, you can greatly improve the security and compliance of your BI analyses, reducing risks and guaranteeing that you maintain the highest standards of data governance.
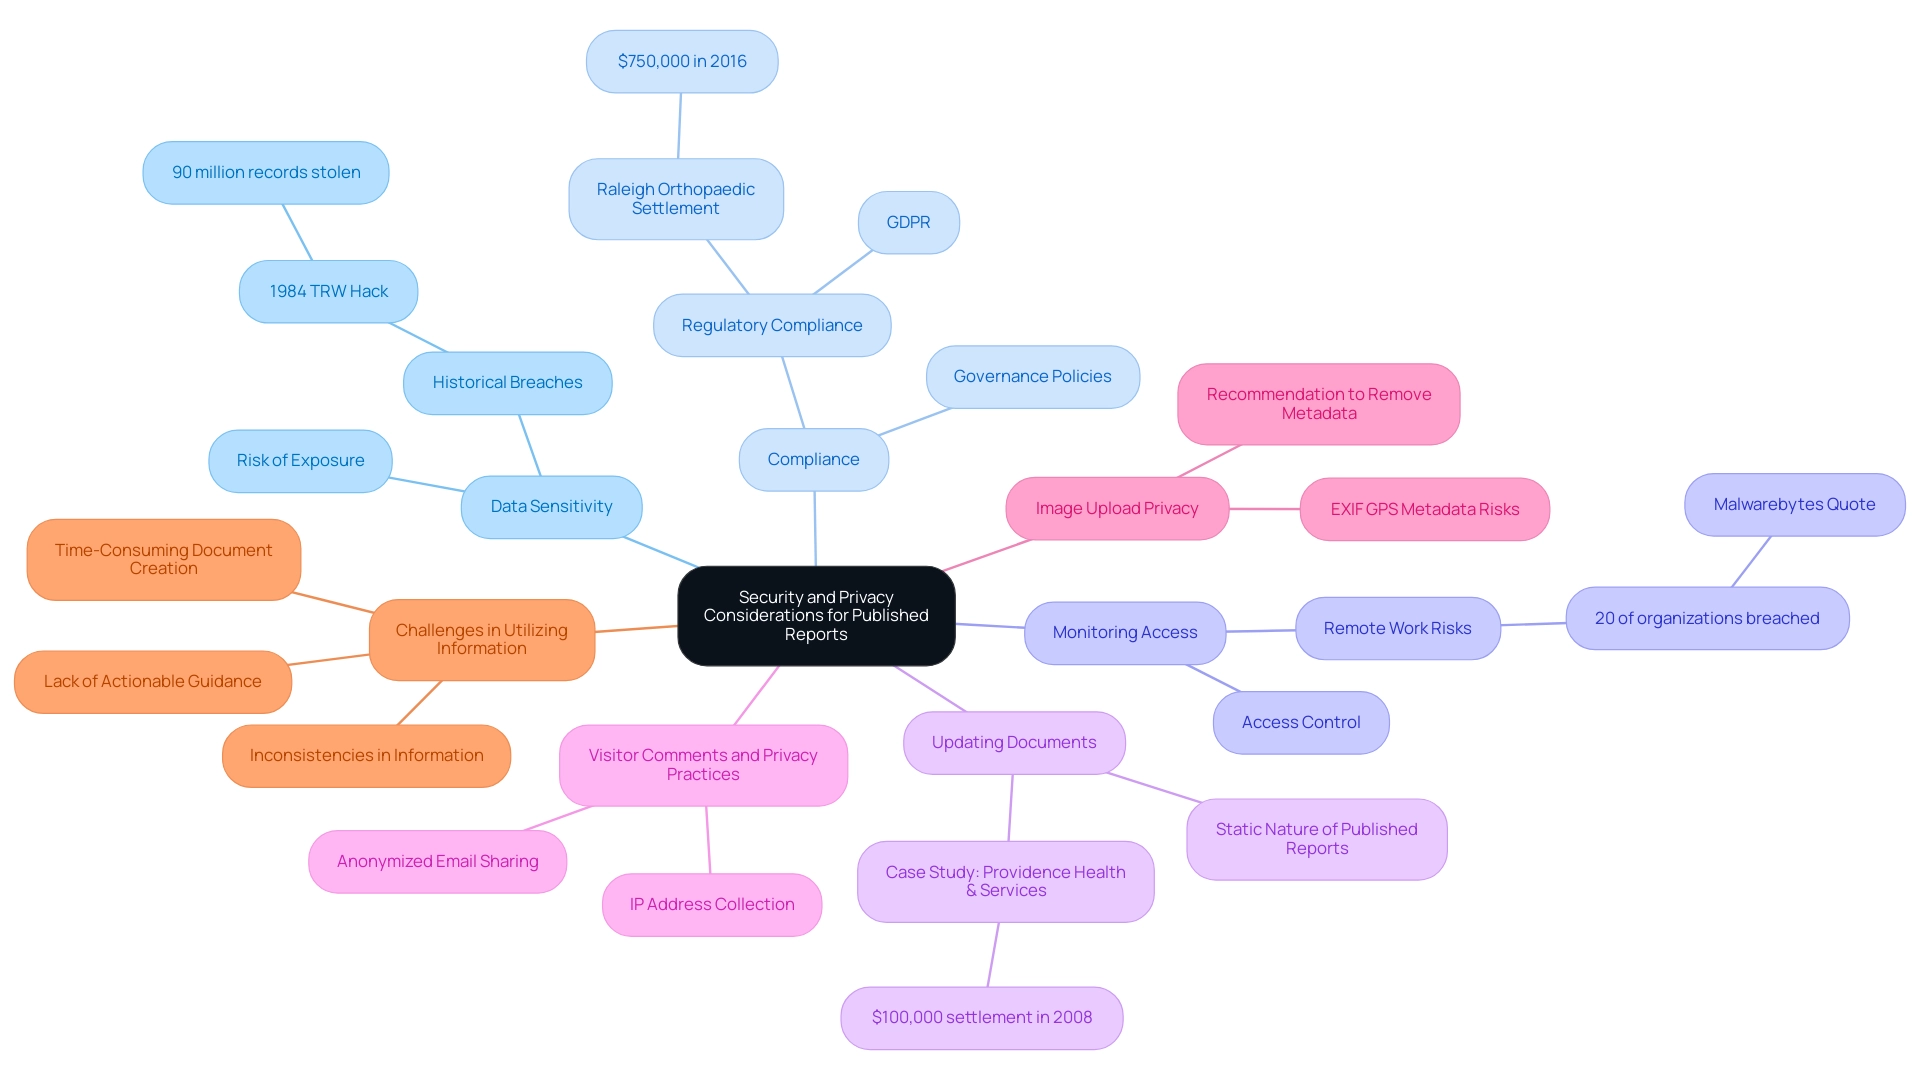
Customizing Your Published Power BI Report
Modifying your published BI visualization is crucial for maximizing its effect and ensuring that your audience gains valuable knowledge. With 1,882 users online, the relevance and demand for efficient BI customization are clear. Here are key steps to enhance your reports:
-
Adjust Visualizations: Tailor your charts, graphs, and tables to clearly convey the insights you wish to communicate. Effective visualizations should not only represent information accurately but also engage viewers by highlighting key trends and metrics, a capability bolstered by our Power BI services.
-
Add Filters: Implement filters that empower viewers to interact with the data, allowing them to focus on specific areas of interest. This interactivity is crucial for enhancing user engagement and ensuring that the document meets diverse viewer needs. As mentioned by Pat, a Microsoft Employee, “For your daily tasks transferring files, I’m guessing Automate could assist you there, but I don’t know the specifics of what you are doing,” highlighting the significance of customized solutions in document personalization. Leveraging tools like Power Automate can streamline workflow automation, providing a risk-free ROI assessment for your operations.
-
Branding: Infuse your organization’s branding elements—such as logos and color schemes—into the document. Consistent branding not only maintains a professional appearance but also strengthens brand recognition and viewer trust.
-
Set Up Navigation: Develop a clear navigation structure within your document to improve user experience. A well-organized layout helps viewers seamlessly transition between different sections, enabling them to find information quickly and efficiently. Furthermore, to view metrics for all dashboards or documents in a workspace, users must remove default filters that restrict the document to a single dashboard or item. This adjustment, as outlined in the case study on viewing all workspace usage metrics, can lead to better resource allocation and content strategy.
By implementing these personalization techniques, combined with knowledge acquired from our 3-Day Power BI Sprint and General Management App, you can enhance the impact of your Power BI analyses and dashboards, especially when you publish Power BI report to web. Moreover, utilizing Business Intelligence converts raw information into practical knowledge, promoting informed decision-making that encourages growth and innovation. Incorporating RPA solutions can enhance productivity by automating repetitive tasks, allowing your team to focus on strategic initiatives.
By tackling obstacles in information extraction and document creation, these improvements guarantee your summaries connect effectively with your audience.
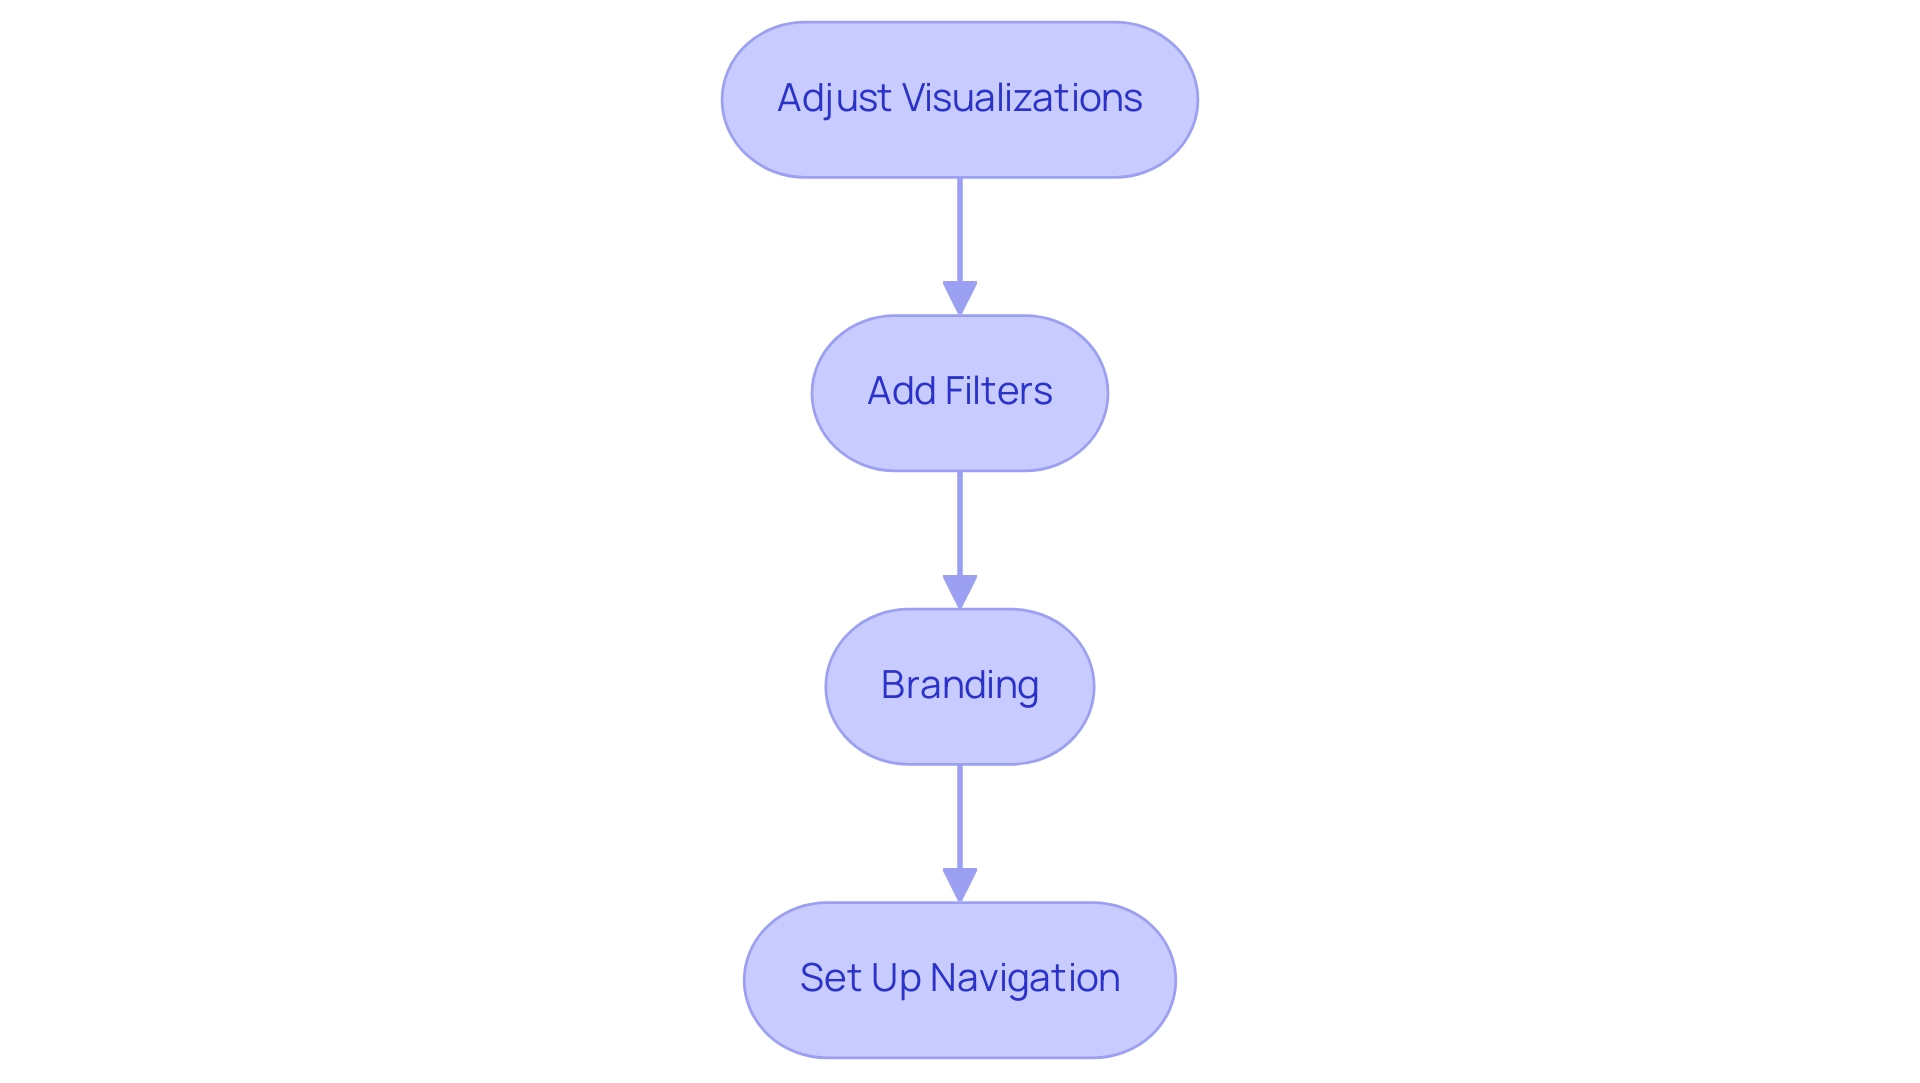
Best Practices for Managing Published Power BI Reports
To effectively manage your published Power BI reports and overcome common implementation challenges, consider implementing the following best practices:
-
Regular Updates: Establish a consistent schedule for reviewing and updating your reports, ensuring they reflect the latest data and insights. This practice not only enhances the accuracy of your documents but also aligns with best practices for managing Power BI files in 2024, ultimately improving operational efficiency.
-
Feedback Loop: Foster a robust feedback mechanism by encouraging viewers to share their thoughts on the documents. This input is invaluable for pinpointing areas needing improvement and allows for adjustments that enhance user experience, ensuring you can tailor your insights to meet business needs effectively.
-
Access Management: Conduct periodic reviews of access to ensure that only essential personnel can view or share the documents. This step is vital in maintaining security and operational efficiency within your organization, mitigating risks associated with data access.
-
Documentation: Keep detailed records of changes made to documents, including the rationale behind these updates. This practice ensures transparency and accountability, fostering trust among stakeholders who depend on these documents and aligning them with your strategic goals.
-
Readability and Consistency: Limit displayed numbers to four numerals and decimal points to two decimal points. This approach significantly enhances readability and consistency across your documents, making them easier to interpret at a glance and improving decision-making capabilities.
-
Leverage RPA: Integrate Robotic Process Automation (RPA) to automate repetitive tasks related to management. By utilizing RPA, you can streamline the data collection and documentation generation processes, significantly reducing the time spent on these tasks and minimizing errors, thus enhancing overall efficiency.
Implementing these strategies will not only enhance the effectiveness of your Power BI outputs but also support your overall business intelligence transformation efforts to publish Power BI report to web. As Kwixand Solutions, a Microsoft Certified Partner, advises, “Get in touch with one of our implementation experts by scheduling a free consultation to see how Kwixand can help support your business’s unique needs and goals.”
Additionally, monitoring performance through key events, such as the Loaded and Rendered events, can provide critical metrics for evaluating the performance of embedded reports, allowing for optimization based on loading and rendering times. This real-world application emphasizes the importance of continuous improvement in your reporting processes, driving data-driven insights essential for business growth.
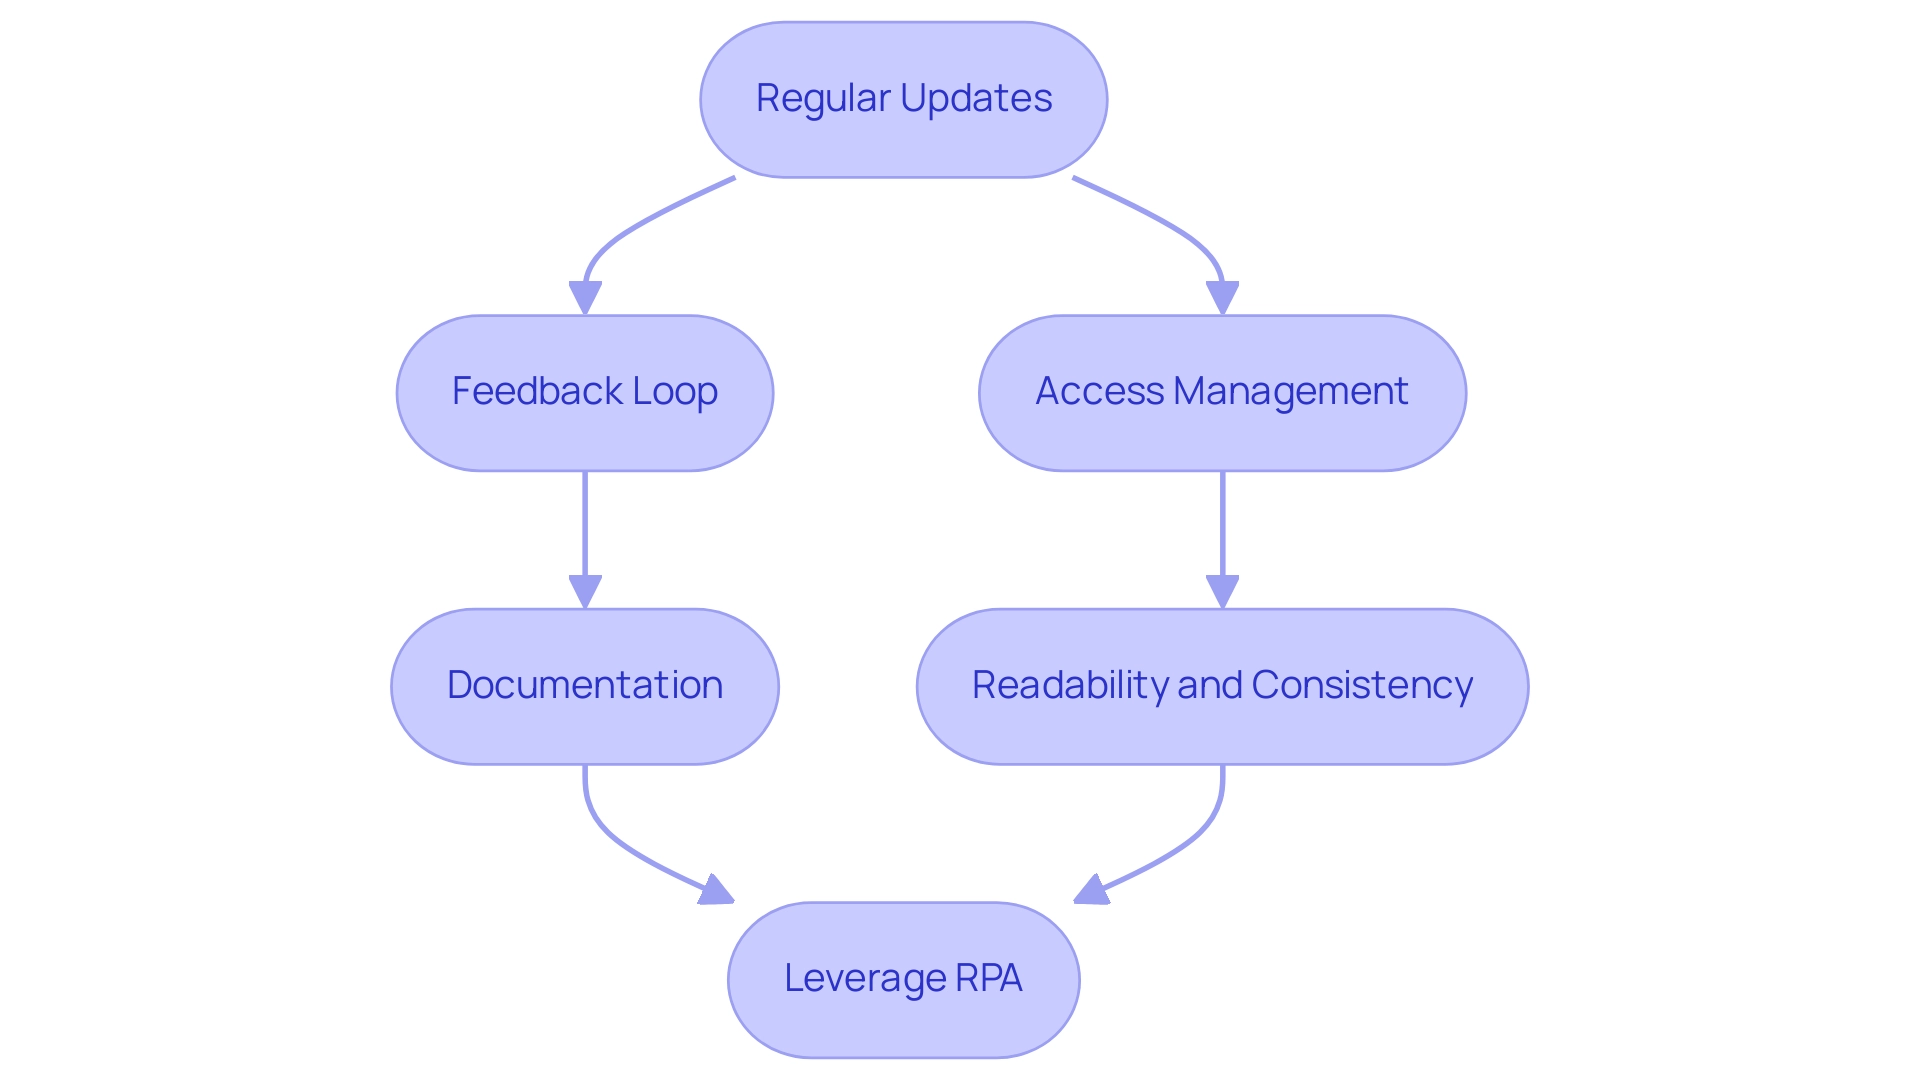
Conclusion
Publishing reports through Power BI’s “Publish to Web” feature can significantly enhance an organization’s ability to share valuable data insights with a wider audience. However, this opportunity comes with the necessity of a thorough understanding of security, privacy, and compliance issues. By recognizing the implications of public access, organizations can make informed decisions that balance transparency with the protection of sensitive information.
Effective customization of reports is crucial for maximizing engagement and ensuring that the data presented resonates with the audience. Utilizing visual enhancements, interactive filters, and branding elements can transform static reports into dynamic tools that drive informed decision-making. Furthermore, incorporating regular updates and establishing a feedback loop will not only keep the reports relevant but also foster a culture of continuous improvement.
In conclusion, navigating the complexities of data sharing with Power BI requires a strategic approach that prioritizes both accessibility and data integrity. By implementing best practices for report management, organizations can leverage the full potential of Power BI while mitigating risks associated with public data sharing. This proactive stance not only enhances operational efficiency but also strengthens stakeholder trust, ultimately leading to more informed decision-making and sustainable growth.
