Introduction
In the realm of data analysis, the ability to adeptly manipulate date and time data can be a game-changer for organizations striving for operational excellence. Power BI’s date functions serve as essential tools that empower users to unlock deeper insights and streamline reporting processes. From calculating the duration of sales conversions to generating real-time performance metrics, these functions facilitate a more nuanced understanding of temporal trends that drive business decisions.
As companies grapple with the complexities of data management, mastering these functions becomes crucial in overcoming challenges such as time-consuming report creation and data inconsistencies. This article delves into the practical applications, advanced features, and best practices associated with date functions in Power BI, providing a roadmap for professionals looking to enhance their analytical capabilities and foster a data-driven culture within their organizations.
Introduction to Date Functions in Power BI
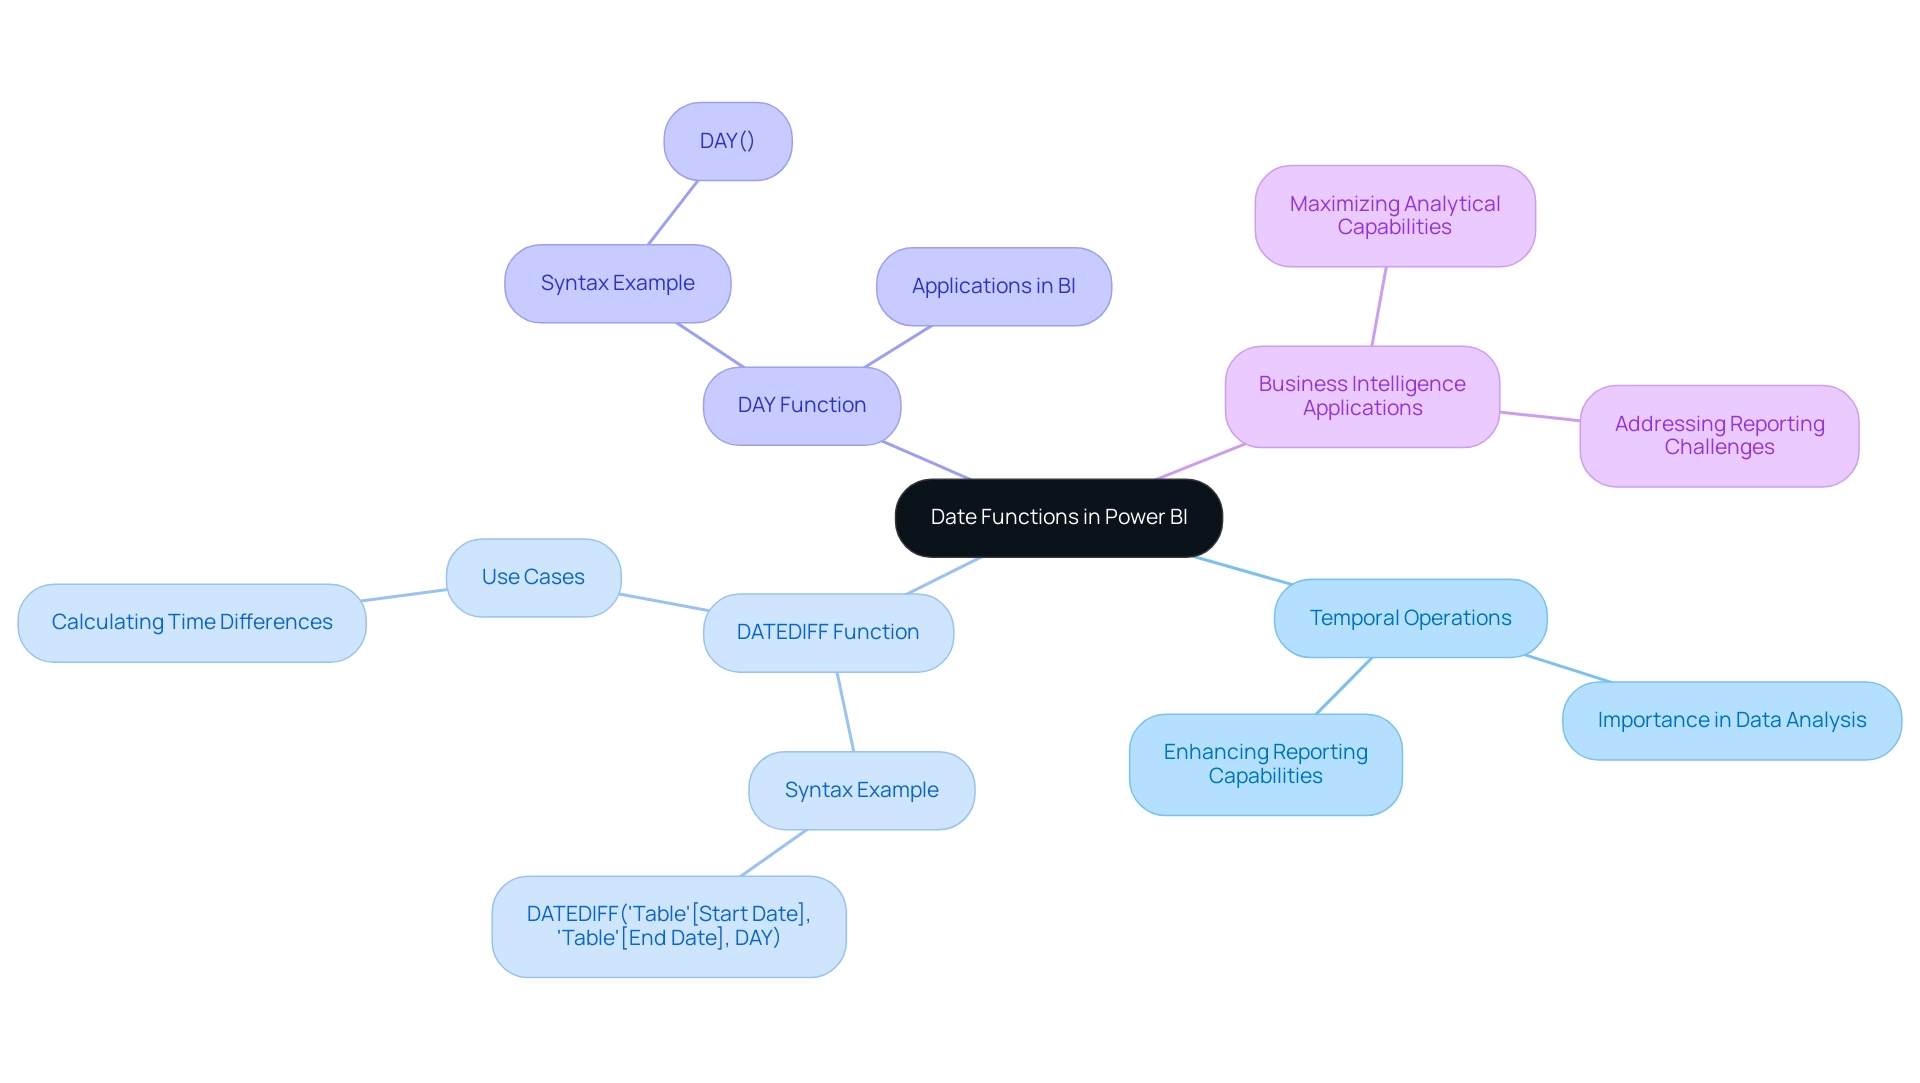
The power bi date function is essential for efficiently handling and examining time-related data through temporal operations, serving a vital purpose in generating data-driven insights that improve operational effectiveness. These operations enable analysts to carry out a variety of calculations, filter datasets, and create insightful visualizations based on temporal elements. For example, the DATEDIFF operation can determine the difference between two timestamps, like in the formula DATEDIFF('Table'[Start Date], 'Table'[End Date], DAY), which measures the number of days dividing the two points.
Moreover, the syntax for the DAX Day operation is DAY(<value>), which further assists in date handling with the power bi date function. By utilizing the power bi date function within the framework of Business Intelligence, users can significantly enhance their reporting capabilities, ensuring that insights are not only timely but also relevant to the business context. This is especially crucial in addressing typical obstacles like time-intensive report generation and information discrepancies, where the use of temporal operations can enhance workflows and boost precision.
A pertinent case study emphasizes how DAX enables the creation of formulas and expressions in Excel models, maximizing analytical capabilities in Business Intelligence. As one user noted,
I already done it this way. Time and Date are linked to the main table, and I use Hour or Date/Weekday/Month from dimension tables.
This feedback highlights the flexibility of temporal operations, which can assist multiple analytical methods beyond basic counts. Grasping these processes is essential for anyone looking to enhance their utilization of BI tools, as they constitute the foundation of efficient analysis and reporting, ultimately propelling business expansion and innovation through the capabilities of RPA and Business Intelligence.
Key Date Functions in Power BI: An Overview
Power BI provides various crucial temporal operations that can change how you assess time-related information, tackling frequent obstacles encountered by operations efficiency leaders. Each function serves a unique purpose, and understanding them is vital for effective data management and to mitigate issues like time-consuming report creation, data inconsistencies, and the lack of actionable guidance in reports:
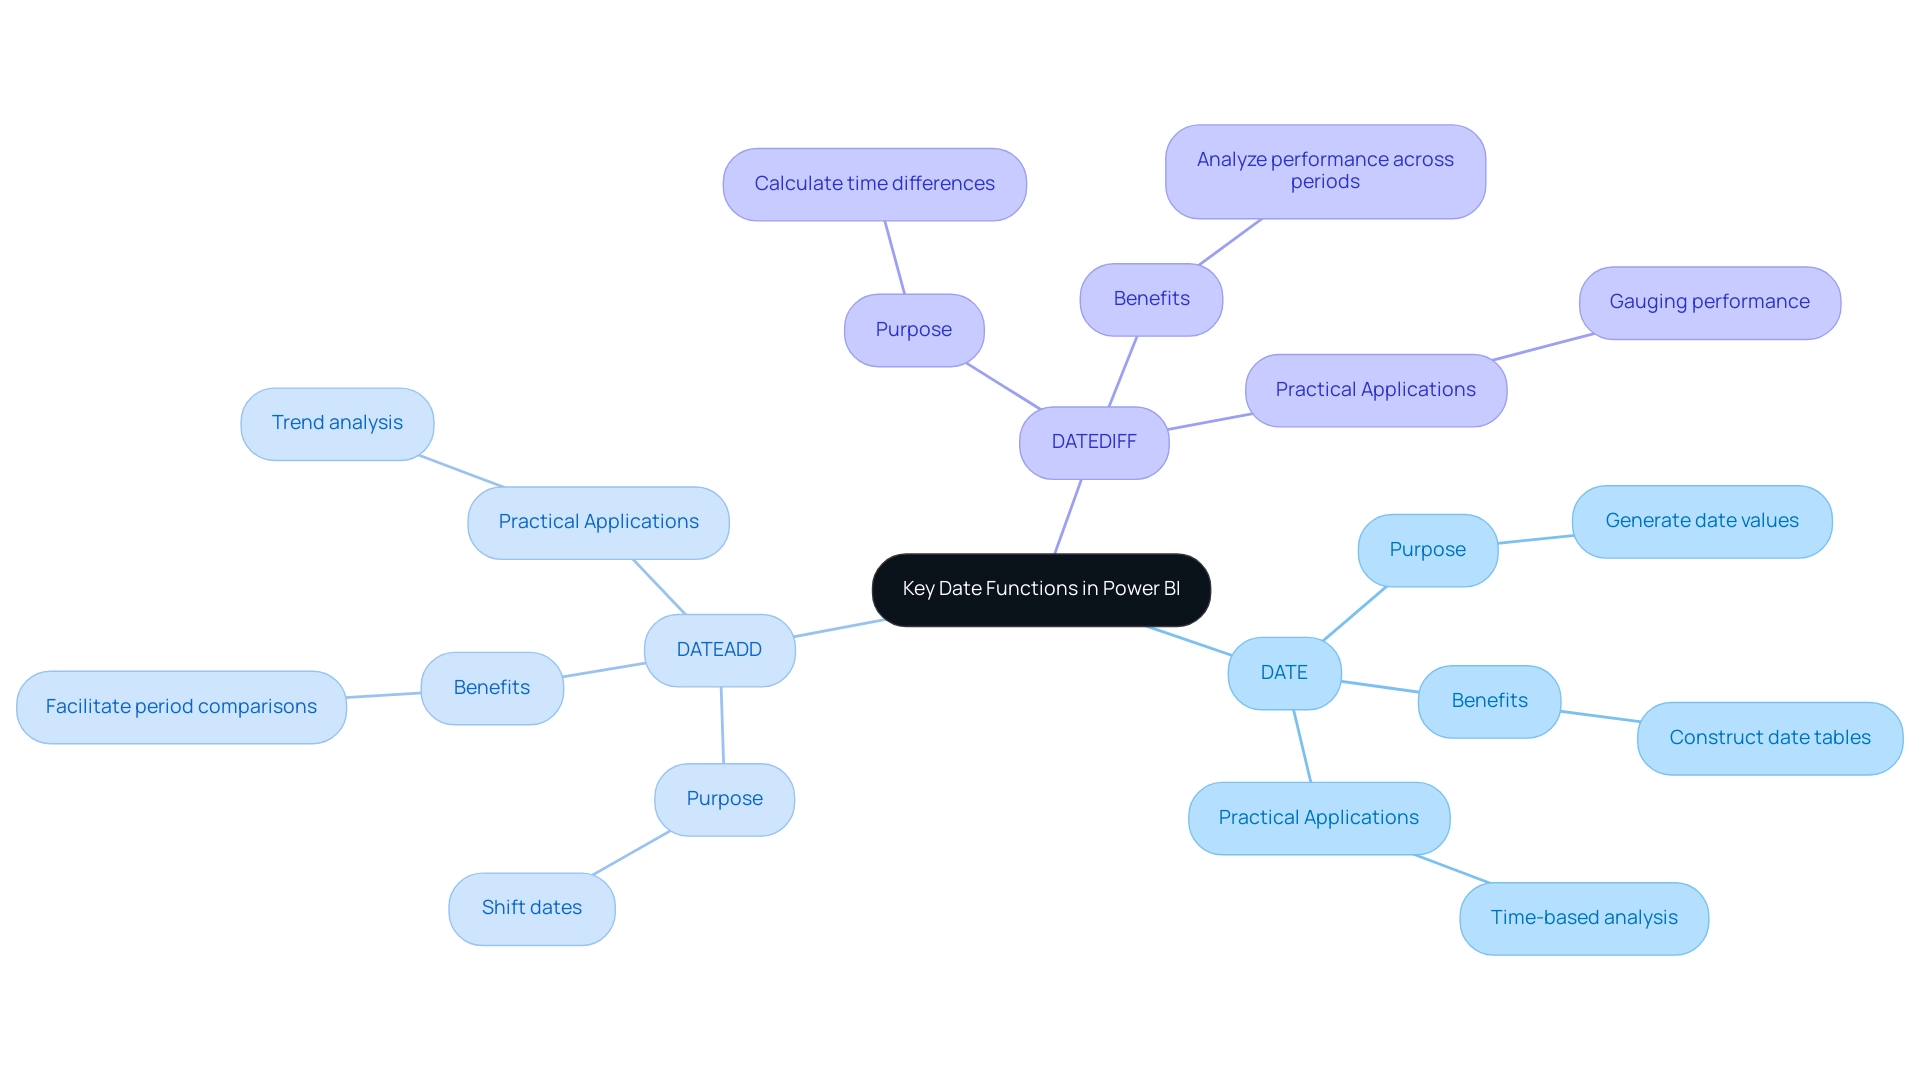
- DATE: This foundational function allows you to generate a date value from year, month, and day inputs, instrumental in constructing date tables crucial for time-based analysis.
- DATEADD: This operation enables you to shift a date by a defined number of intervals—be it days, months, or years—facilitating period comparisons and trend analysis. As emphasized by HamidBee, a Power Participant, “Thank you, it worked like a charm… Correct me if I’m mistaken but it appears the Filter operation must come before the DATESBETWEEN operation in the formula otherwise DAX gives an error.” This highlights the necessity of understanding sequences in DAX for effective analysis.
- DATEDIFF: This robust tool calculates the difference between two points in time, offering results in your selected units (such as days, months, or years). Mastering the Power BI date function, specifically DATEDIFF, is essential for analyzing time intervals and gauging performance across different periods.
In practical applications, the Usage Metrics Report case study demonstrates how these date operations can offer insights into user engagement over the past 90 days, allowing users to modify their dashboards based on real trends. By harnessing these key capabilities, you’ll not only enhance your ability to analyze time-based data with the Power BI date function but also drive informed decision-making and improve operational efficiency, ensuring your reports offer clear, actionable guidance rather than just numbers and graphs. Failing to master these capabilities may place your organization at a competitive disadvantage, making it crucial for professionals in operations efficiency to develop these skills.
With 1,865 users currently online, mastering these date operations is increasingly important for BI users, making it a valuable skill for professionals in operations efficiency.
Practical Applications of Date Functions in Data Analysis
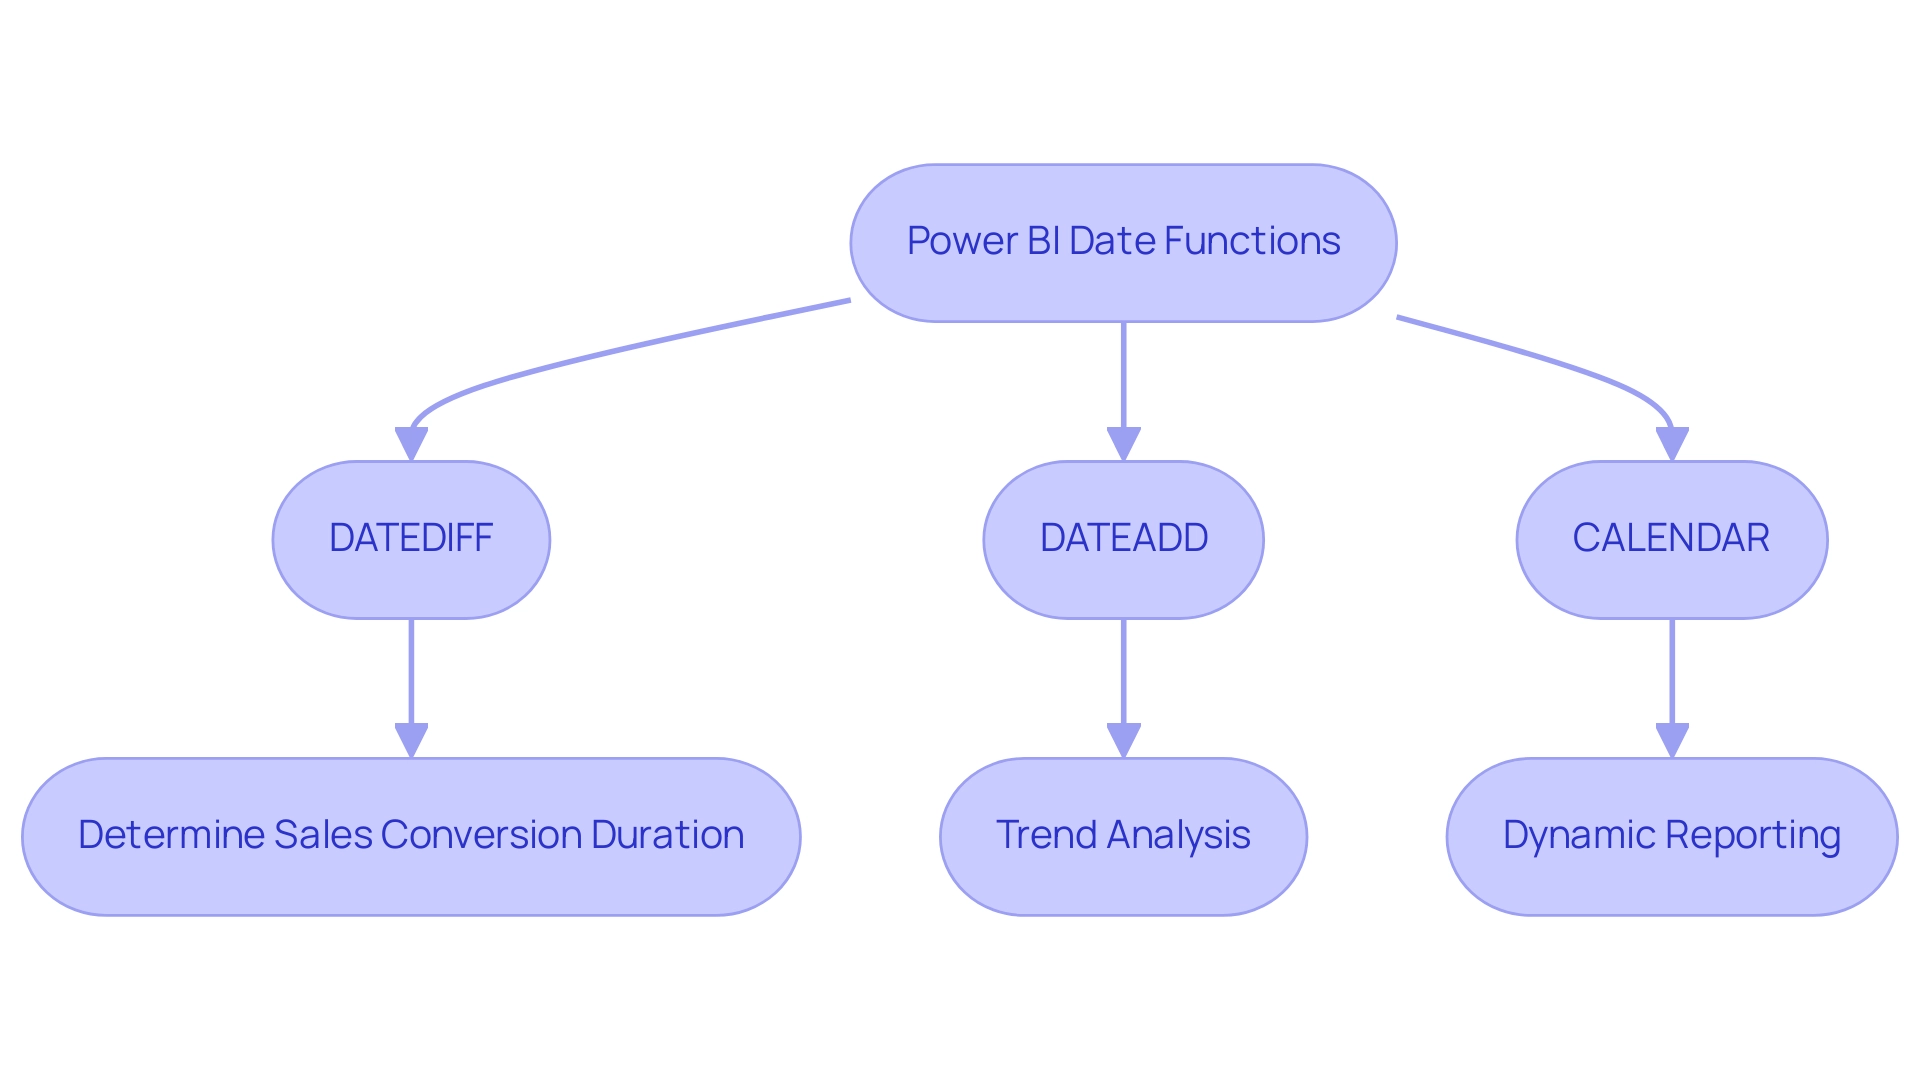
The power bi date function provides practical applications that significantly enhance sales analysis and decision-making processes, particularly in today’s overwhelming AI landscape. For instance, utilizing the DATEDIFF method enables teams to determine the duration of sales conversions, which is critical for pinpointing bottlenecks in the sales pipeline. Given that customers are 57% of the way through the purchase process before engaging with sales reps, analyzing these timeframes becomes essential for organizations to streamline their processes and boost efficiency through actionable insights.
However, many businesses struggle to extract meaningful insights from their data, which can leave them at a competitive disadvantage.
Tailored AI solutions can help address these challenges by providing advanced analytics capabilities that enhance the effectiveness of the power bi date function.
In terms of trend analysis, the DATEADD operation serves a pivotal role in comparing sales figures across various time periods, thereby revealing valuable seasonal trends. This capability not only assists in forecasting but also enables businesses to adapt their strategies in response to observed patterns. As noted by Gong, sales leaders who teach their reps to open cold calls with the question, ‘How’ve you been?’ can see rep success rates jump by 6.6%. This highlights the essential significance of timing and method in sales, which can be enhanced through the use of calendar capabilities to promote operational efficiency.
Moreover, employing the CALENDAR capability of the power bi date function enables companies to create dynamic reports that illustrate performance metrics over time. This real-time tracking of performance information facilitates informed strategic decision-making, aligning with the goal of optimizing operations and addressing challenges in report creation and inconsistencies. A relevant case study titled ‘Optimal Email Timing‘ suggests that the best time to email prospects is between 8:00 A.M. and 3:00 P.M., providing a significant window for engagement.
Thus, the incorporation of these temporal capabilities in Business Intelligence, backed by customized AI solutions, is vital for boosting sales efficiency and improving overall business performance, utilizing the full potential of Business Intelligence and RPA solutions.
Exploring Advanced Date Functions and Time Intelligence
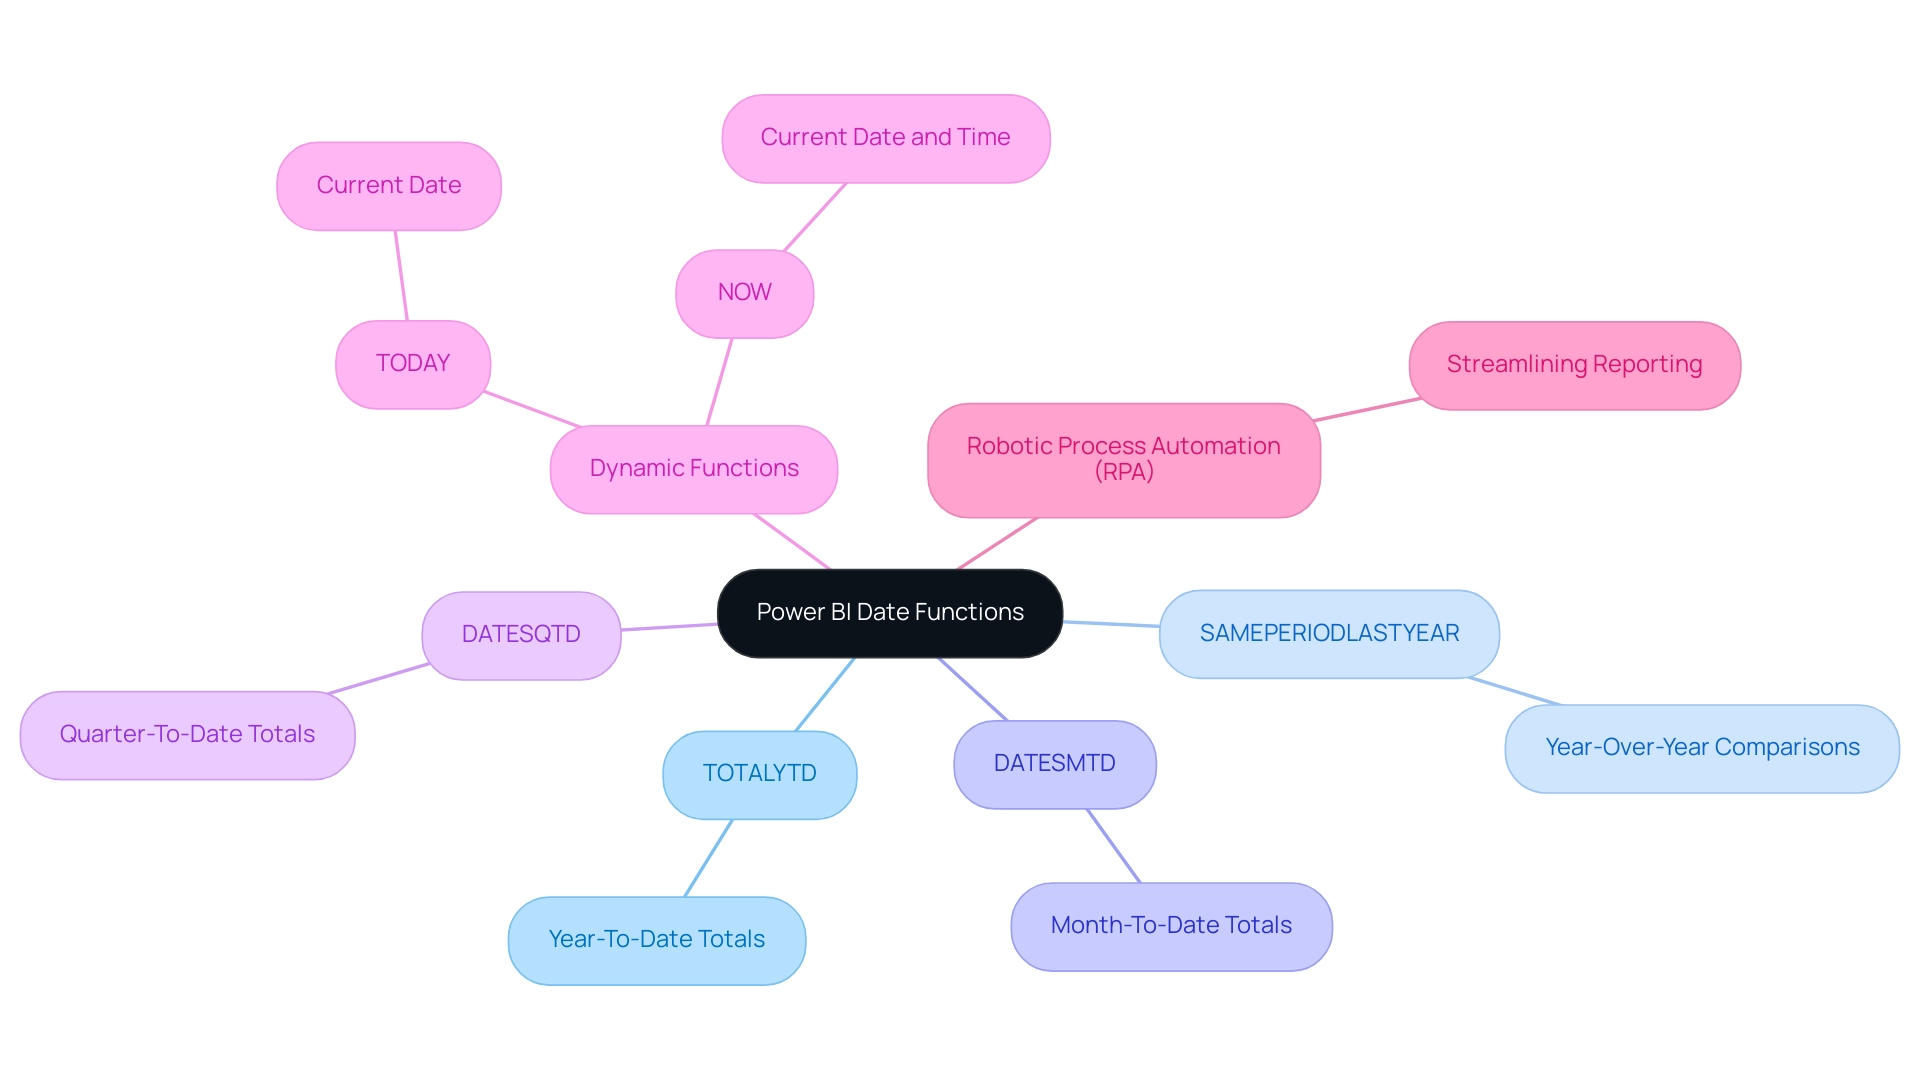
Advanced data capabilities in Power BI, which include the power bi date function such as TOTALYTD, SAMEPERIODLASTYEAR, and PARALLELPERIOD, empower users to conduct sophisticated time-based calculations essential for comprehensive analysis. In the context of today’s data-rich environment, utilizing these capabilities is essential not only for precise financial reporting but also for addressing the common issues of time-consuming report creation and data inconsistencies. For instance, the power bi date function includes TOTALYTD, which is crucial in calculating year-to-date totals, while Month to Date (MTD) and Quarter to Date (QTD) calculations, utilizing the DATESMTD and DATESQTD tools respectively, allow users to evaluate totals from the beginning of the month or quarter.
This granularity enhances analytical capabilities, enabling users to derive nuanced insights into temporal trends and overall business performance. Furthermore, the ability to utilize the Power BI date function SAMEPERIODLASTYEAR facilitates year-over-year comparisons, providing a clearer picture of growth trajectories. As noted by Community Champion littlemojopuppy, clarity in analytical approaches is vital to avoid confusion among users navigating multiple solutions.
Additionally, integrating Robotic Process Automation (RPA) can streamline the reporting process by automating repetitive tasks, thereby allowing analysts to focus on deriving insights rather than spending time on report construction. By leveraging these advanced features, including the dynamic TODAY and NOW tools that refresh automatically, users can enhance their reporting processes using the power bi date function to ensure that their analyses remain aligned with evolving financial reporting trends. This method converts raw information into actionable insights, driving informed decision-making that fosters operational efficiency and business growth.
Best Practices and Common Challenges with Date Functions
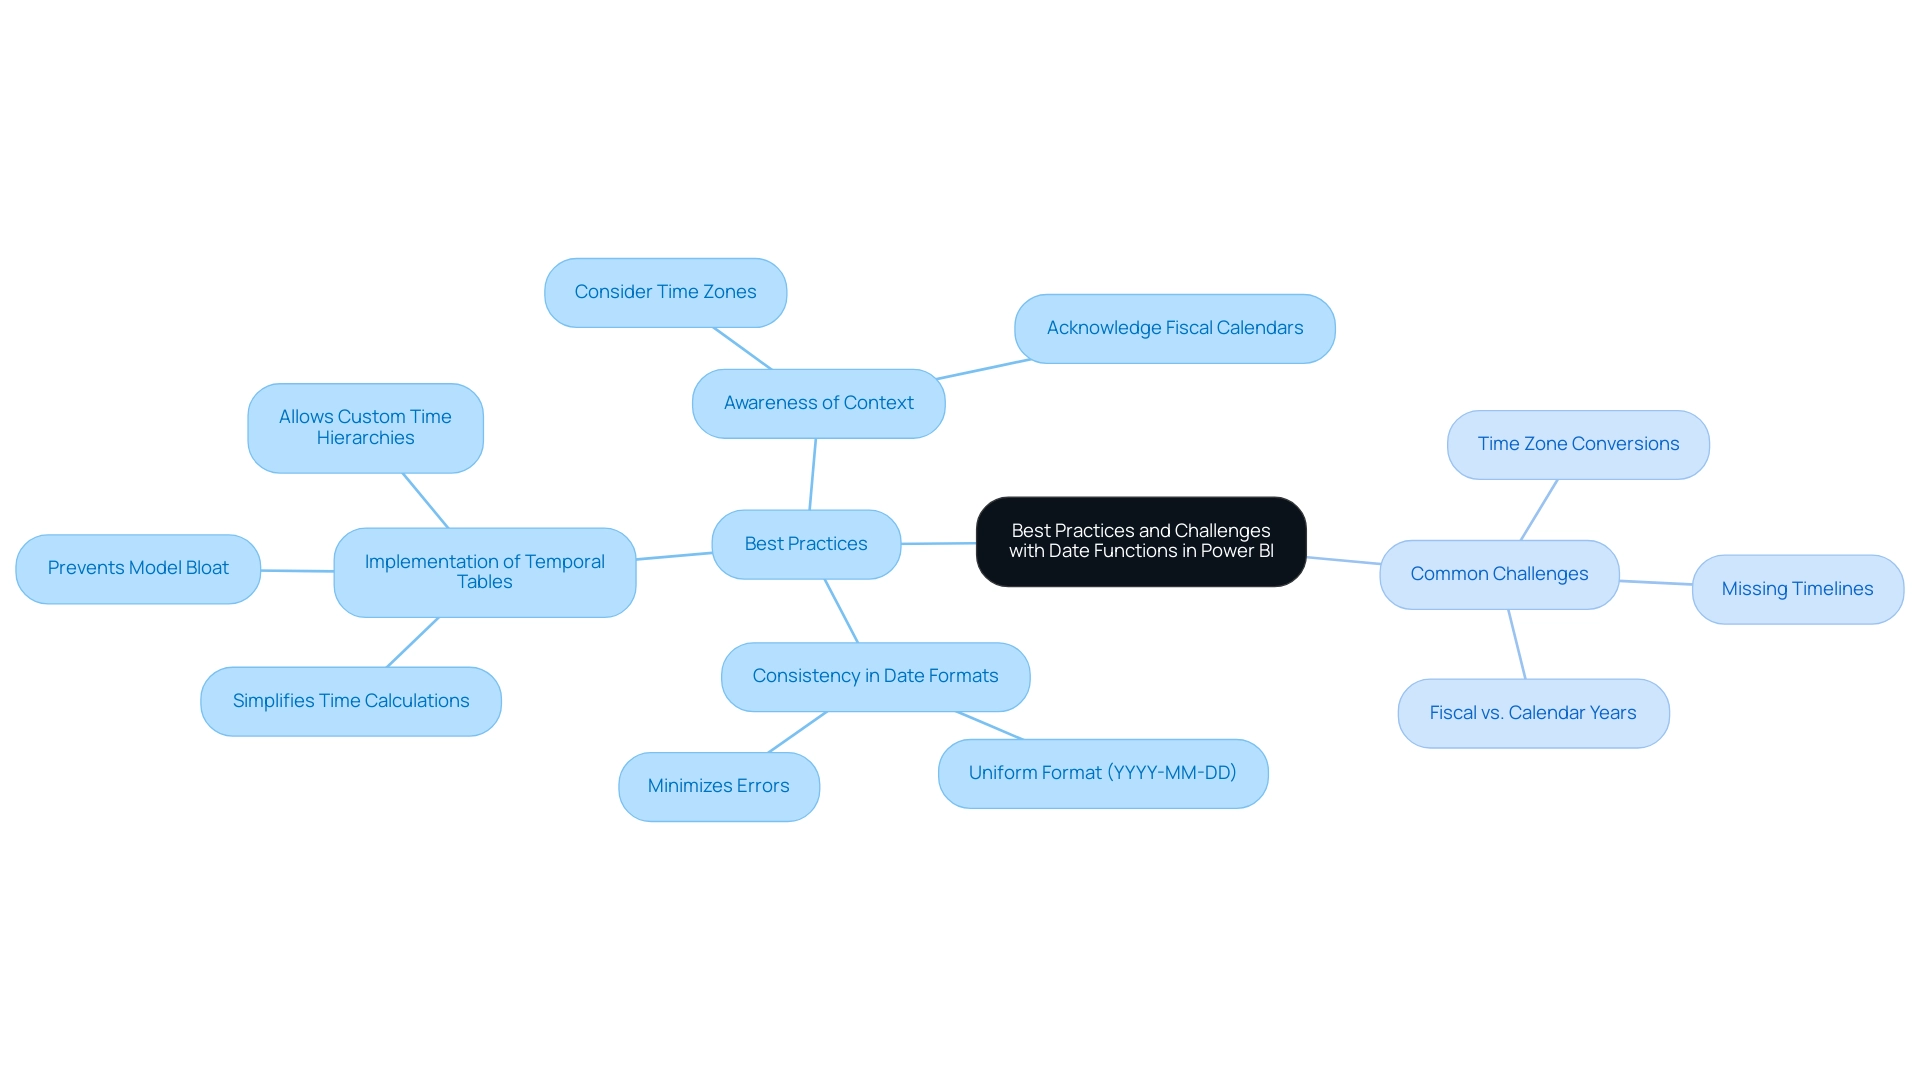
When navigating date functions in Power BI, adopting best practices can significantly enhance your analytical capabilities and address common challenges such as time-consuming report creation and data inconsistencies, which often lead to confusion and mistrust among stakeholders:
-
Consistency in Date Formats: Ensure that all date fields maintain a uniform format to minimize errors during calculations. Consistent formatting is crucial for precise information interpretation and reporting, helping you shift focus from report creation to leveraging actionable insights from your dashboards. For instance, using a standard format like YYYY-MM-DD across all reports can help prevent discrepancies that may lead to mistrust in the data.
-
Implementation of Temporal Tables: Utilizing temporal tables is crucial for simplifying intricate time calculations and enhancing performance. As pointed out by Super User amitchandak, > The best practice for time intelligence is to have a table that has been designated as a temporal table <. By marking a calendar table, you remove the requirement for Power BI to generate underlying calendar tables for each time field, thereby preventing unnecessary model bloat and ensuring a more efficient analysis. Additionally, as emphasized in the case study named “Benefits of Marking a Temporal Table,” marking a temporal table enables users to establish their own time hierarchy, conserving space and avoiding erroneous values when utilizing time intelligence tasks.
-
Awareness of Context: Understanding the context in which date functions are applied is vital, as it can substantially affect calculation results. This includes acknowledging how time zones and fiscal calendars may change your interpretation of information. For instance, neglecting to consider time zone differences can lead to misleading reports that confuse stakeholders and weaken their trust in the information.
Common challenges that arise include managing missing timelines, navigating the complexities of time zone conversions, and differentiating between fiscal and calendar years. By recognizing these challenges and applying best practices, you can significantly enhance your effectiveness in utilizing the Power BI date function, ultimately resulting in more precise and insightful analysis. This approach not only enhances your reporting capabilities but also fosters trust and clarity in the data presented to stakeholders.
Conclusion
Mastering date functions in Power BI is essential for organizations aiming to enhance their operational efficiency and derive actionable insights from their data. By leveraging key functions such as:
- DATEDIFF
- DATEADD
- Advanced time intelligence features like TOTALYTD and SAMEPERIODLASTYEAR
professionals can streamline their reporting processes and improve accuracy in data analysis. These tools are not just technical necessities; they are vital for addressing common challenges such as time-consuming report creation and data inconsistencies, which can hinder effective decision-making.
Implementing best practices, such as:
- Maintaining consistency in date formats
- Utilizing date tables
further empowers users to navigate the complexities of date functions with confidence. By doing so, organizations can transform raw data into clear, insightful reports that drive informed decisions and foster a data-driven culture. The integration of tailored AI solutions can also enhance these processes, ensuring that insights are not only timely but also relevant to the business context.
Ultimately, the ability to manipulate date and time data effectively is a game-changer for any organization looking to thrive in today’s competitive landscape. By embracing these date functions and best practices, businesses can unlock deeper insights, streamline operations, and position themselves for sustained growth and innovation. The journey towards data mastery begins with the commitment to understand and implement these powerful tools in Power BI.
Introduction
In the digital age, where data reigns supreme, the ability to effectively harness and analyze information is paramount for organizations striving for operational excellence. Power BI stands out as a powerful tool that transforms raw data into actionable insights, but the journey begins with mastering the intricacies of data importation, transformation, visualization, and sharing.
This article delves into practical strategies and techniques that empower users to navigate Power BI with confidence, enhancing their reporting capabilities and driving informed decision-making. From understanding the nuances of data sources to optimizing report performance, each section is designed to equip professionals with the essential skills needed to thrive in an increasingly data-driven landscape.
By embracing these methodologies, organizations can unlock the full potential of their data, fostering a culture of continuous improvement and strategic insight.
Exploring Data Sources: How to Import Data into Power BI
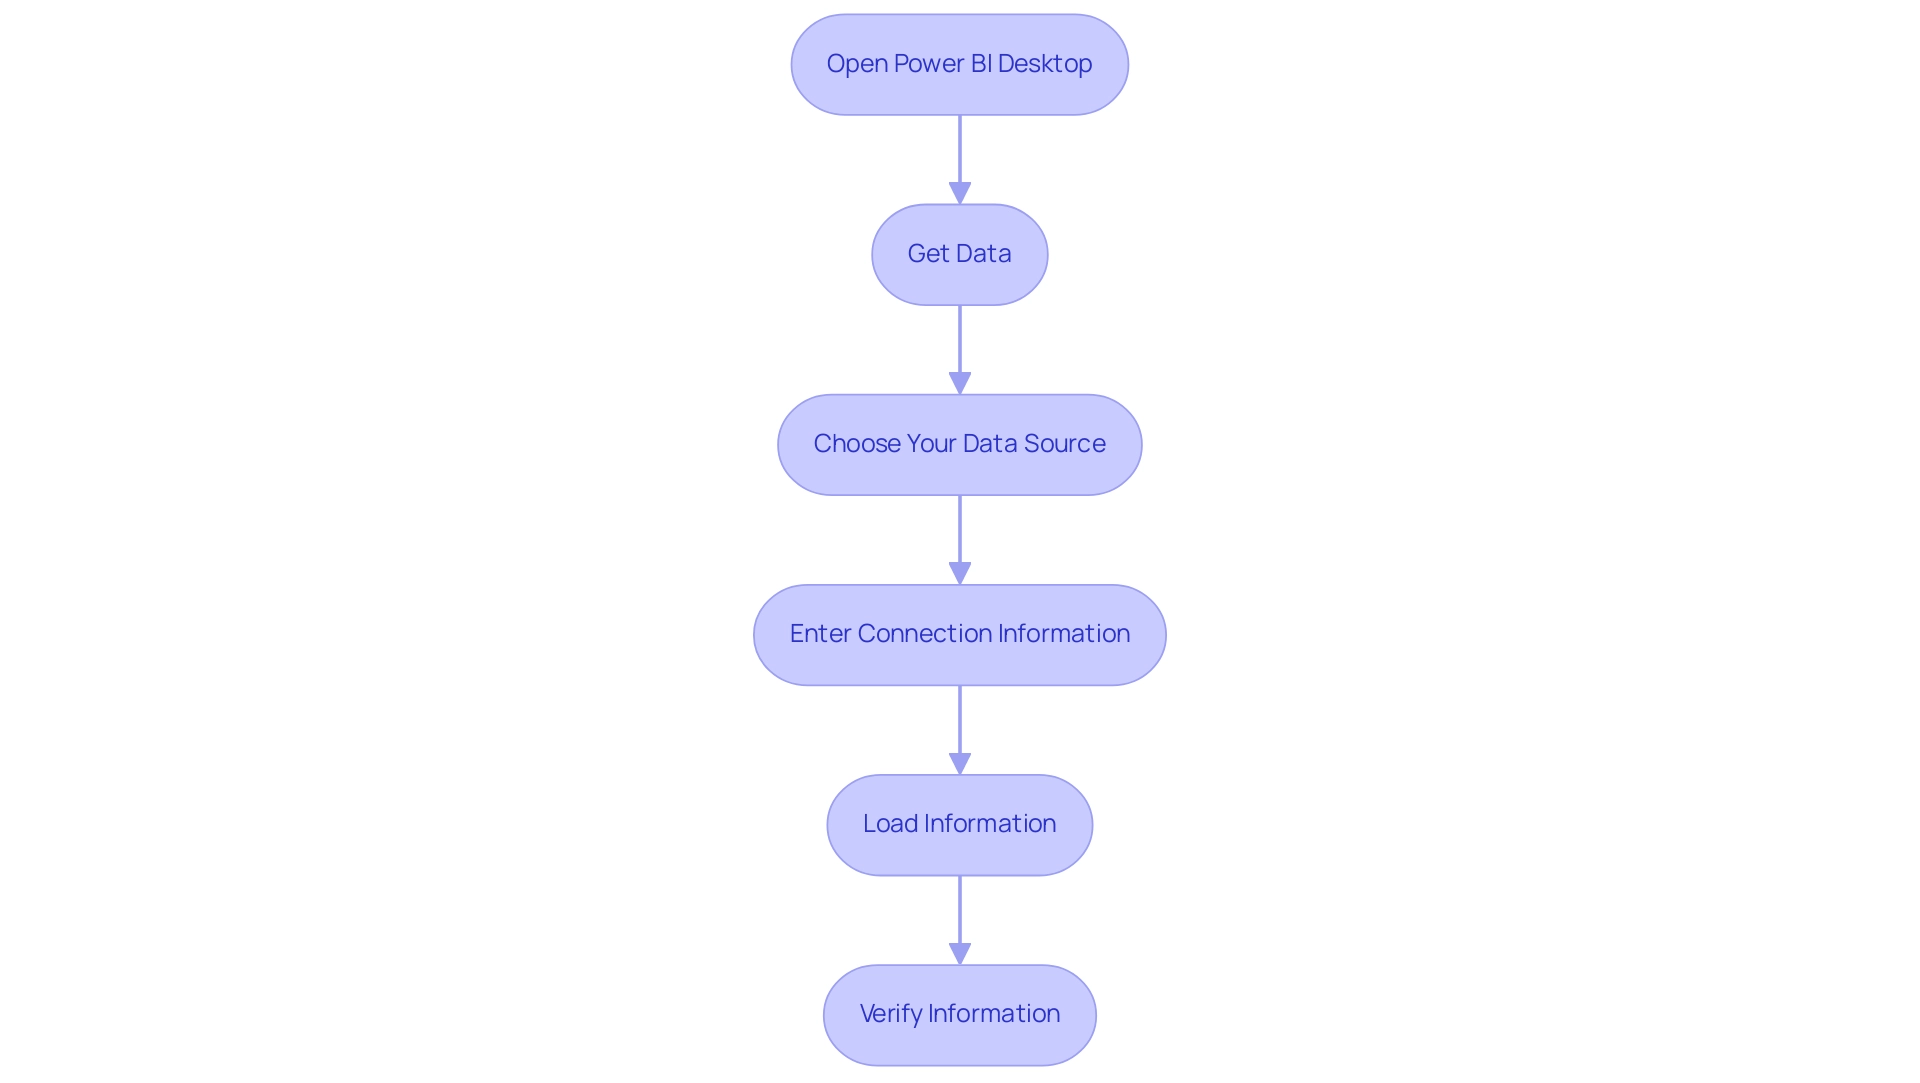
Understanding how to get data into Power BI is a vital initial step in utilizing its features for effective analysis and enhancing operational efficiency. The platform supports a variety of information sources, including Excel spreadsheets, SQL databases, cloud services like Azure, and web APIs. Here’s a streamlined process to get you started:
- Open Power BI Desktop: Launch the application on your computer.
- Get Data: Navigate to the ‘Home’ tab and select ‘Get Data.’ This action will open a window showcasing various source options.
- Choose Your Data Source: Identify and select the relevant source from the list (e.g., Excel, SQL Server, etc.), then click ‘Connect.’
- Enter Connection Information: Depending on the chosen source, you may need to input specific details such as the file path or server name.
- Load Information: After establishing the connection, a preview of the information will appear. Choose the tables or queries you wish to import, then click ‘Load.’
- Verify Information: Once imported, review the information model to confirm that all details have been accurately integrated.
Implementing these steps will facilitate seamless integration of diverse sources into BI, effectively demonstrating how to get data into Power BI and laying a strong foundation for insightful analysis. In a setting where lengthy document generation and information discrepancies can impede advancement, utilizing RPA tools like EMMA RPA and Automate can streamline these manual processes, greatly improving operational efficiency and allowing your team to concentrate on strategic perspectives. Tackling the ‘Lack of Evidence-Based Insights’ is vital; efficient information integration through BI not only streamlines operations but also enables organizations to extract actionable insights from their information.
Recent reports indicate that the BFSI sector is poised for rapid growth in information management from 2023 to 2032, making effective integration more crucial than ever. Additionally, as noted by Joaquin, a Microsoft Employee, prioritizing usage statistics on Power BI Report Server can significantly enhance reporting capabilities. Furthermore, as emphasized in the case study titled ‘Prioritization of Information Governance and Location Intelligence,’ organizations that implement effective information governance and location intelligence strategies benefit from enhanced operational efficiency.
By adopting these practices, you position your organization at the forefront of the evolving information landscape.
Transforming Data in Power BI: Essential Techniques and Tools
Once you learn how to get data into Power BI, effective transformation becomes essential for providing insightful analysis. Notably, Coupler.io permits refresh schedules as frequently as every 15 minutes, underscoring the significance of timely management.
Here are key techniques and tools to empower you in this process:
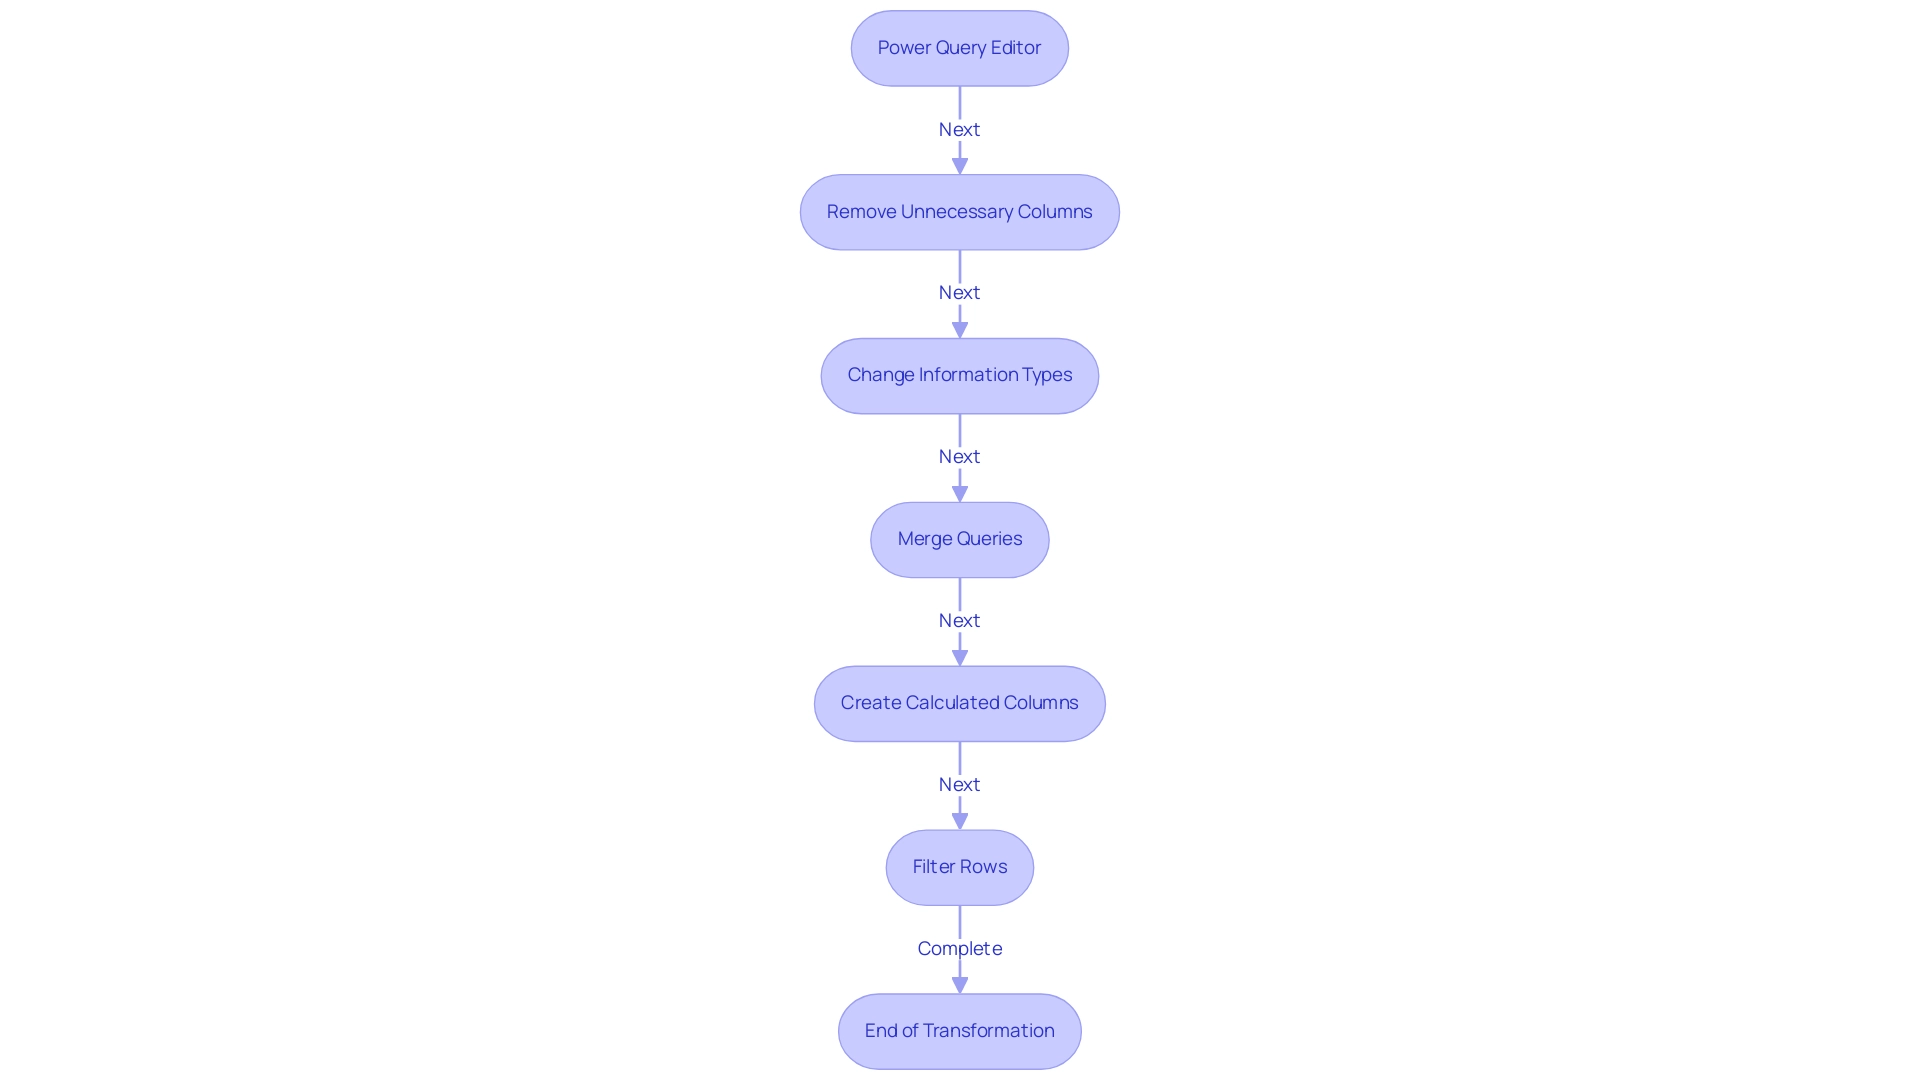
- Power Query Editor: Begin by utilizing the Power Query Editor to clean and transform your information. You can access this tool by clicking ‘Transform Data’ after loading your dataset. This feature is fundamental for optimizing information before analysis.
- Remove Unnecessary Columns: Streamline your dataset by identifying and removing any columns that do not contribute to your analysis. This aids in concentrating on pertinent information and improves performance.
- Change Information Types: Ensure that each column reflects the correct type—be it text, number, or date. Choose the column and modify the type in the ribbon to ensure integrity.
- Merge Queries: To combine information from various sources effectively, employ the ‘Merge Queries’ function. This capability allows for vertical and horizontal dataset expansion, creating a unified dataset for comprehensive analysis through append and join operations.
- Create Calculated Columns: Utilize DAX (Data Analysis Expressions) to formulate new columns derived from existing information, enabling more complex calculations and deeper insights.
- Filter Rows: Apply filters to exclude any irrelevant or duplicate entries, ensuring that your analyses are grounded in accurate information.
Integrating BI services like the 3-Day BI Sprint, which enables quick creation of visuals, and the General Management App can greatly enhance your workflow. These services directly tackle challenges such as time-consuming report creation and inconsistencies by providing structured frameworks for efficient management. Furthermore, integrating Automation can enhance operational efficiency, ensuring risk-free ROI assessments and professional execution of your automation needs.
Mastering these transformation techniques will not only enhance your preparation process but also align with the broader goal of learning how to get data into Power BI to harness Business Intelligence and RPA solutions for driving insights and operational efficiency for business growth. The case study titled ‘Using Statistical Measures in Power BI‘ illustrates the significance of statistical measures in analysis, particularly using a Car Sales dataset as an example. As noted by Denys Arkharov, a BI Engineer at Coupler.io, effective information management is crucial for impactful reporting, reflecting the growing trend of utilizing statistical measures to drive analysis.
By embracing these practices, you position yourself to extract the maximum value from your information. Additionally, explore our Actions portfolio for tailored solutions and consider booking a free consultation to discuss how we can support your information management needs.
Creating Visualizations in Power BI: Best Practices
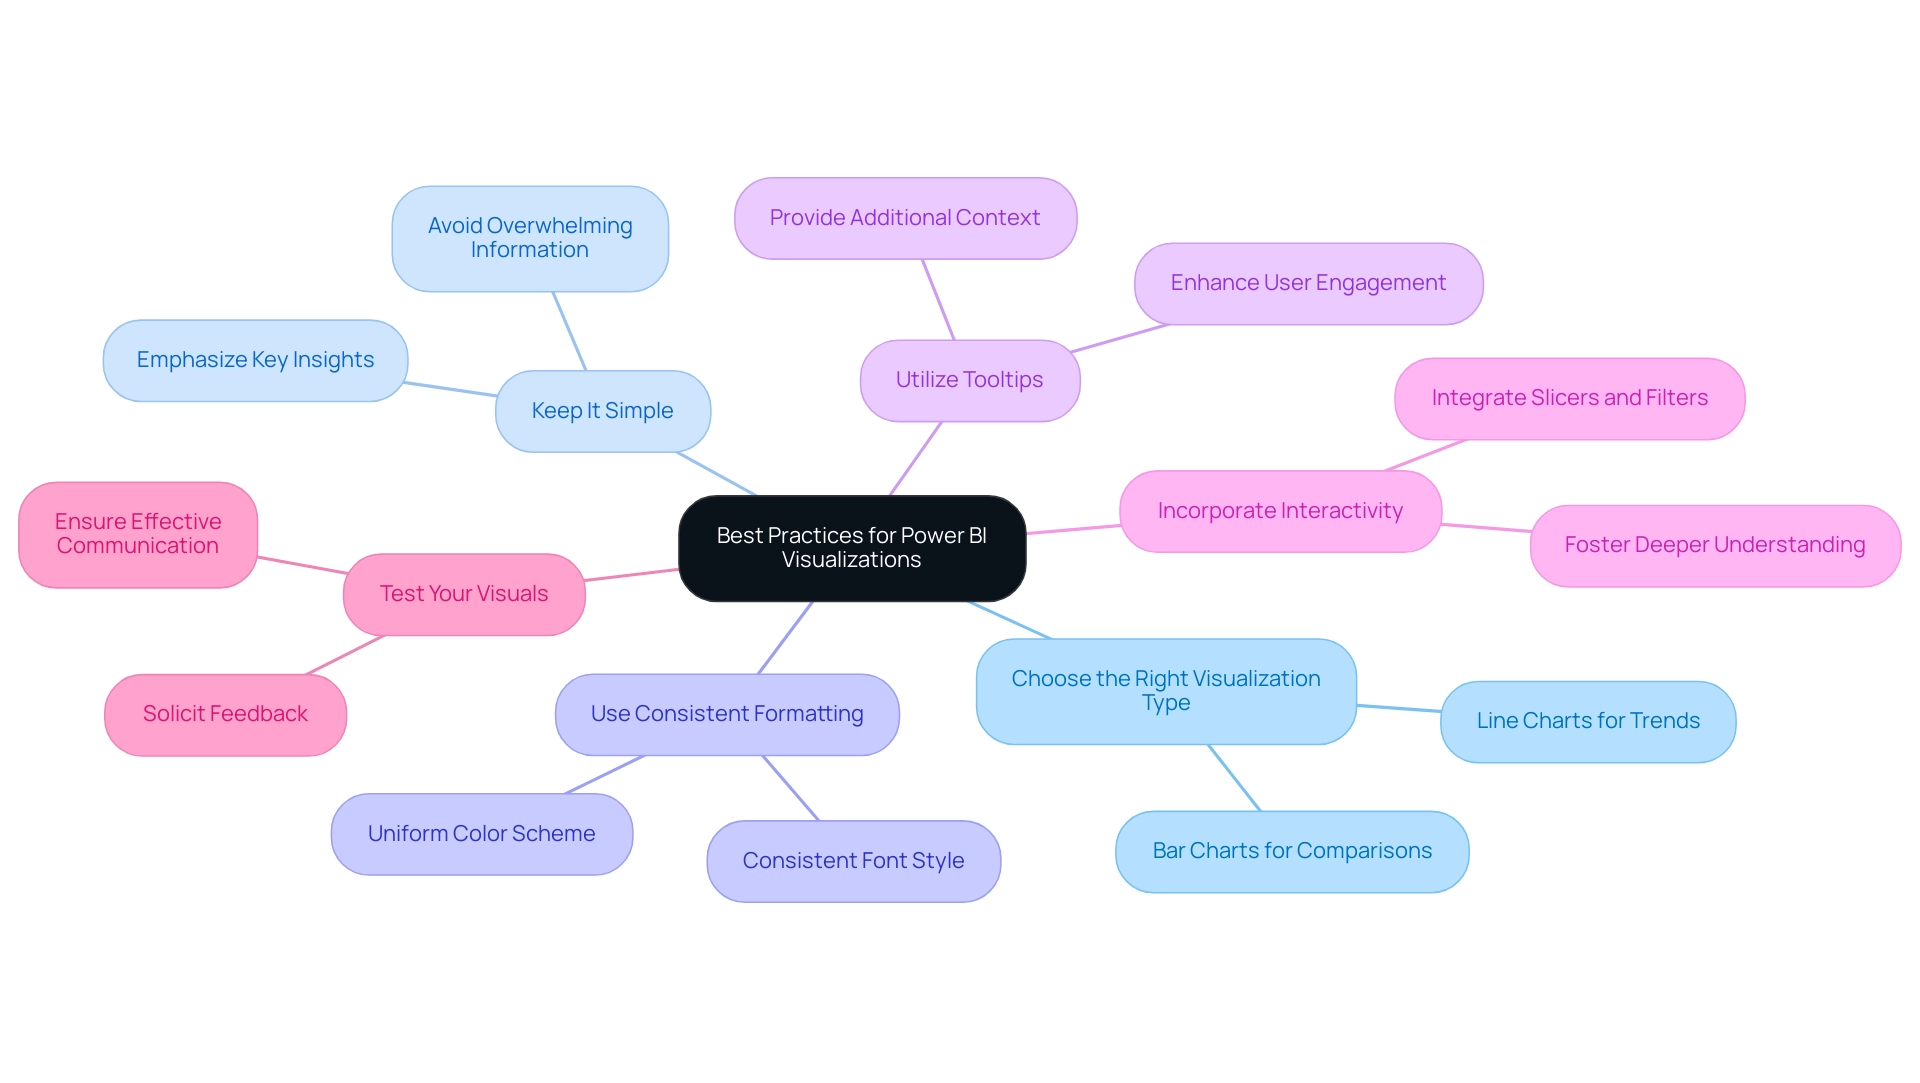
Creating impactful visualizations in Power BI requires a deep understanding of both your information and your audience, as well as proficiency in essential Power BI tools like Power Query for transformation and DAX for advanced calculations. To achieve this, consider the following best practices:
-
Choose the Right Visualization Type: Selecting an appropriate visualization is crucial; for instance, utilize bar charts for comparisons and line charts to illustrate trends effectively.
This choice is vital in ensuring that your data-driven conclusions are communicated clearly. -
Keep It Simple: Clarity is key—avoid overwhelming your visuals with excessive information. Emphasizing key insights will guarantee your documents stay intuitive and easy to navigate, tackling common challenges such as time-consuming creation and inconsistencies.
-
Use Consistent Formatting: A uniform color scheme and consistent font style will lend a professional touch to your report, enhancing readability and user experience, which is essential in a data-rich environment.
-
Utilize Tooltips: Improve user engagement by implementing tooltips that provide additional context when users hover over specific information points, enriching the overall experience and encouraging informed decision-making.
-
Incorporate Interactivity: Empower users by integrating slicers and filters, which allow them to explore various dimensions of the information, fostering a deeper understanding of the content presented and driving operational efficiency.
-
Test Your Visuals: Prior to finalizing your report, solicit feedback from colleagues or stakeholders to ensure that your visualizations convey the intended message effectively, thereby overcoming the challenges of actionable guidance.
Additionally, understanding the Gestalt Principles of visual perception can significantly aid in effective dashboard design and communication of actionable information. These principles help in organizing visual elements in a way that enhances user comprehension. To further enhance operational efficiency, consider how RPA can assist in automating repetitive tasks related to data visualization and reporting, addressing task repetition fatigue and staffing shortages. By adhering to these best practices, you can craft compelling visualizations that not only engage your audience but also communicate insights with precision.
Additionally, as Marco Russo from SQLBI.com recommends,
Watch Dashboard design best practices in BI for design tips; staying updated on the latest trends can significantly enhance your reporting capabilities and ensure your business remains competitive.
Ultimately, with the current average sales this month hovering around $180,000, the ability to present information effectively can play a pivotal role in driving business success.
Publishing and Sharing Reports in Power BI
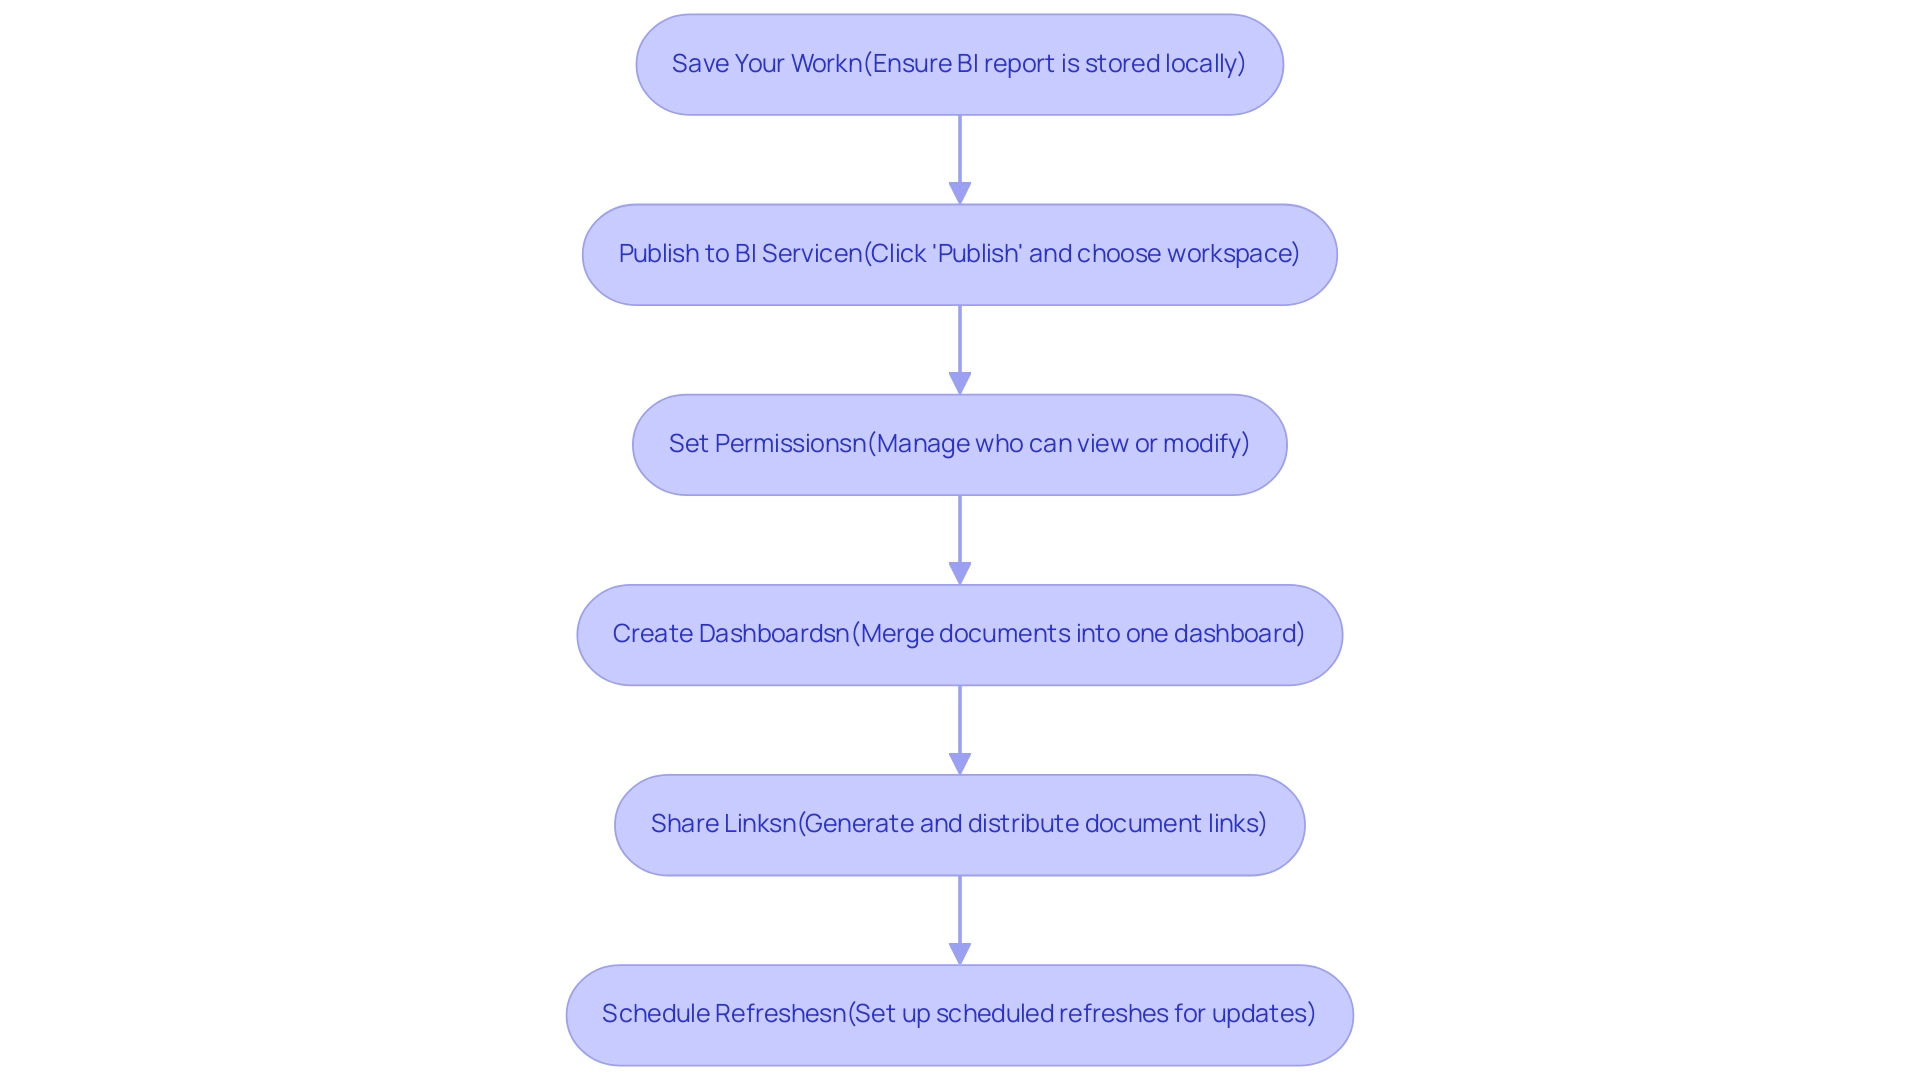
Distributing and sharing documents in BI can change how your organization works together and uses information. Follow these straightforward steps to ensure your documents reach the right audience effectively:
- Save Your Work: Before publishing, ensure your BI report is stored locally to prevent any data loss.
- Publish to BI Service: Click on the ‘Publish’ button in BI Desktop. Sign in to your BI account and choose the desired workspace for your report.
- Set Permissions: After publishing, head over to the Power BI Service. Here, you can manage permissions, indicating who can view or modify your document, ensuring information security and control. Note that without Row-Level Security (RLS) or Object-Level Security (OLS), shared documents provide full access to the underlying semantic model information, which is critical to manage carefully.
- Create Dashboards: Improve information analysis by merging several documents into one dashboard. Pin visuals from different documents to create a cohesive view that highlights key insights. Collaborative semantic models in Business Intelligence allow organizations to utilize well-structured information models across documents, ensuring uniformity in information interpretation.
- Share Links: Utilize the ‘Share’ function to generate a link to your document or dashboard. This link can be easily distributed to colleagues and stakeholders, promoting accessibility and collaboration.
- Schedule Refreshes: For dynamic information sources, set up scheduled refreshes in the BI Service. This guarantees your documents reflect the latest information, keeping your team informed and prepared to make data-driven decisions.
By mastering these steps, you can improve your organization’s data management capabilities and understand how to get data into Power BI. Furthermore, think about participating in our 3-Day BI Sprint, where we will collaborate with you to create a refined, fully operational document customized to your requirements. This service includes personalized guidance, advanced analytics integration, and the creation of a template that you can leverage for future projects, allowing you to focus on utilizing the insights that drive growth and innovation.
Book your free consultation today to get started!
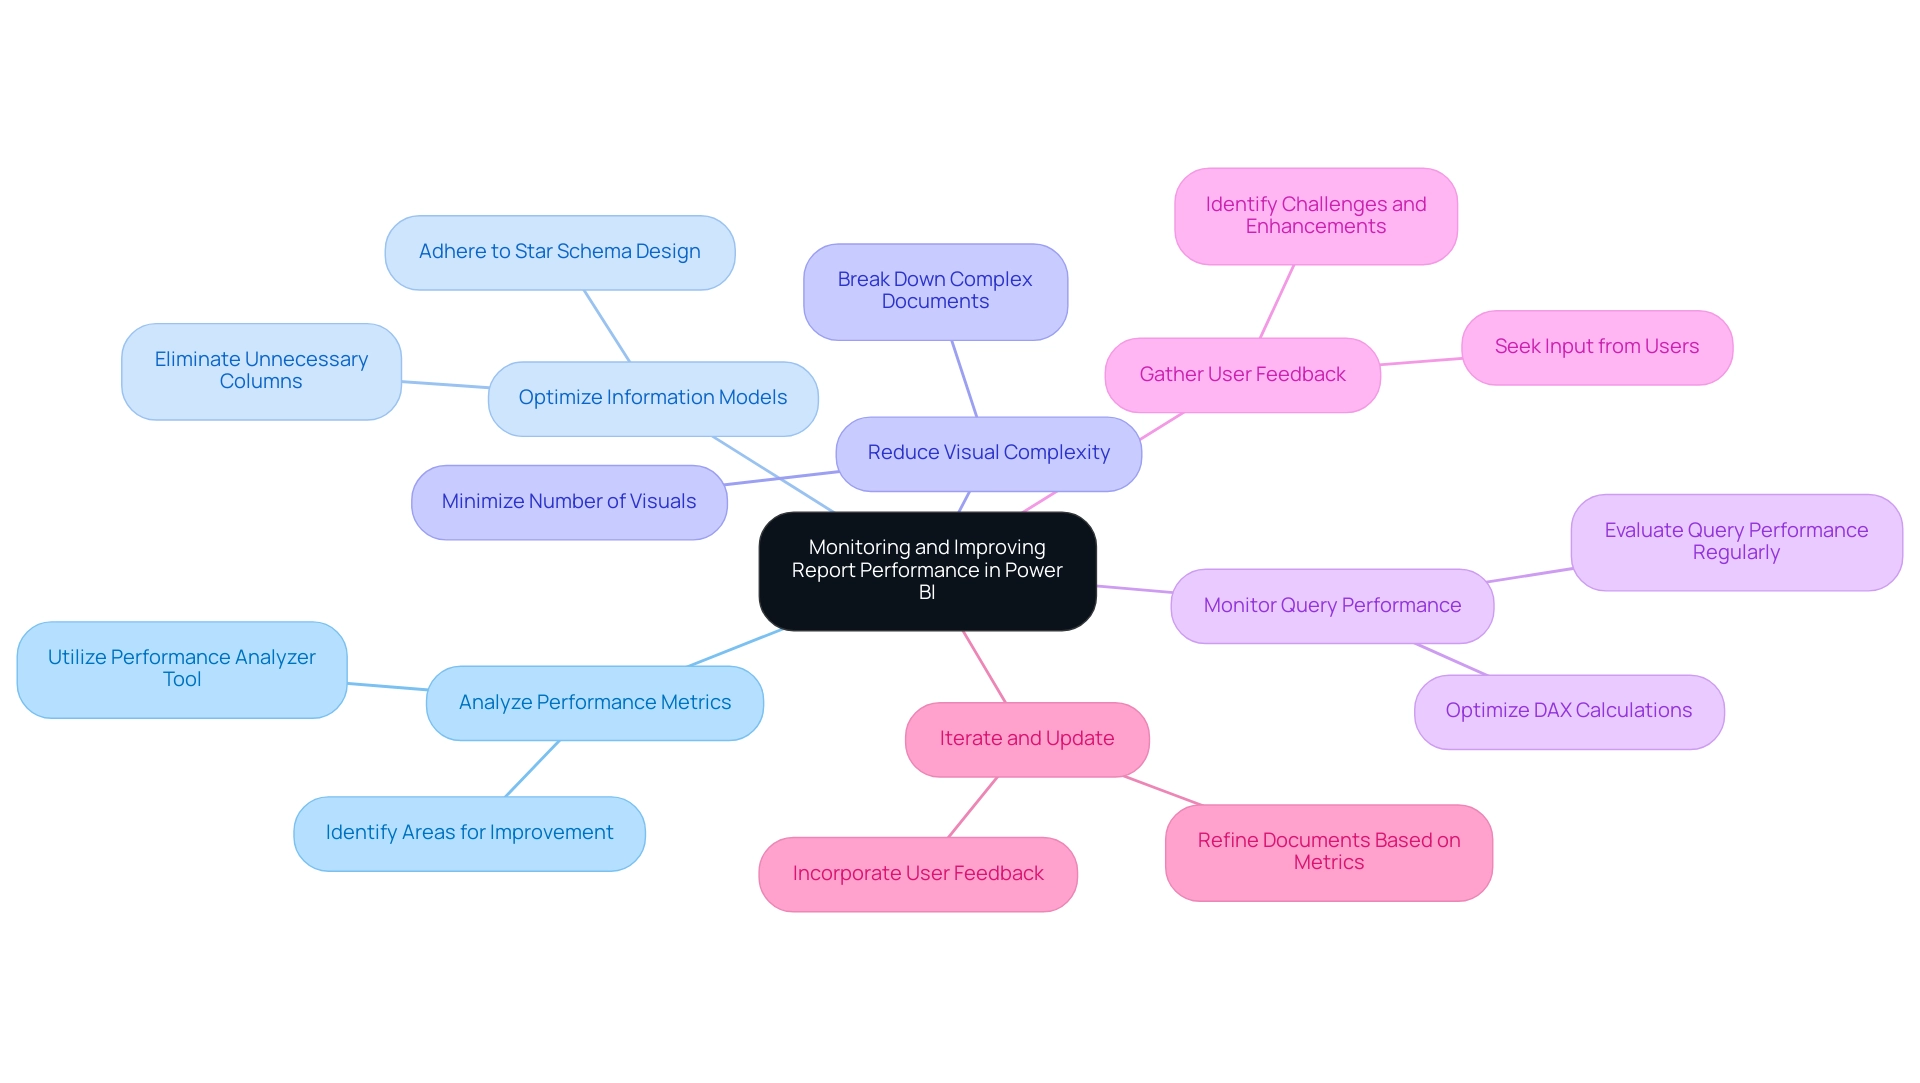
Monitoring and Improving Report Performance in Power BI
To effectively monitor and enhance the performance of your Power BI reports and harness their full potential, consider implementing the following strategies alongside our specialized Power BI services:
-
Analyze Performance Metrics: Utilize the Performance Analyzer tool in Power BI to identify areas where your outputs may experience delays. This tool is invaluable for understanding load times associated with different visuals, allowing for targeted improvements that enhance overall efficiency.
-
Optimize Information Models: Ensure your model operates efficiently by eliminating unnecessary columns and tables. Adhering to star schema design principles can significantly streamline data retrieval and processing, enhancing performance of outputs.
-
Reduce Visual Complexity: To improve load times, minimize the number of visuals on a single page. Breaking down complex documents into multiple pages or tabs can lead to a better user experience and enhanced performance.
-
Monitor Query Performance: Regularly evaluate the performance of the queries used in your analyses. Optimize DAX calculations to enhance efficiency, ensuring that your outputs run smoothly under various conditions.
-
Gather User Feedback: Actively seek input from users to identify challenges they encounter and areas for future enhancements. Their insights can direct your optimization efforts effectively, ensuring your documents meet user needs.
-
Iterate and Update: Commit to continuously refining your documents based on performance metrics and user feedback. This iterative process ensures your documents remain effective and deliver maximum value to your organization.
Additionally, consider utilizing our 3-Day BI Sprint to quickly create professionally designed reports that incorporate these strategies. The General Management App can also enhance your management capabilities, providing comprehensive oversight and smart reviews of your data.
In a practical application of these strategies, consider the ‘Time-Tracking Dashboard for Harvest in Business Intelligence.’ This dashboard effectively displays time usage for a team providing paid services, detailing billable hours and client-specific time allocation. By analyzing total hours and profit margins, the dashboard reveals areas for optimization and tracks performance effectively.
As Denys Arkharov, a BI Engineer at Coupler.io, states, “A notable achievement in my career was my involvement in creating Risk Indicators for Ukraine’s ProZorro platform, a project that led to my work being incorporated into the Ukrainian Law on Public Procurement.” This emphasizes the importance of performance monitoring in driving significant outcomes.
By utilizing these techniques and real-world examples, along with the powerful tools offered by our Power BI services, you can ensure your reports not only perform optimally but also provide the critical insights needed to drive operational efficiency and informed decision-making.
Conclusion
Harnessing the full potential of Power BI is an essential step for organizations looking to thrive in a data-driven landscape. The journey begins with effectively importing data from diverse sources, such as:
- Excel
- SQL databases
- Cloud services
By mastering this foundational skill, organizations can ensure a seamless integration of data that sets the stage for insightful analysis and operational efficiency.
Once data is imported, transforming it with techniques like:
- Using Power Query Editor
- Merging queries
- Creating calculated columns
becomes crucial. These practices not only enhance data preparation but also empower users to derive deeper insights through advanced analytics. Coupled with effective visualization strategies, such as selecting the right chart types and maintaining clarity, organizations can communicate their findings in a compelling manner that drives engagement and informed decision-making.
Publishing and sharing reports effectively further amplifies the impact of insights generated through Power BI. By:
- Setting appropriate permissions
- Creating dashboards that consolidate information
organizations can ensure that stakeholders have access to the data they need, fostering a collaborative environment. Additionally, monitoring report performance through tools like Performance Analyzer and optimizing data models ensures that reports run smoothly and efficiently, ultimately enhancing user experience.
By adopting these strategies, organizations not only improve their operational efficiency but also cultivate a culture of data-driven decision-making. In today’s fast-paced environment, leveraging Power BI to its fullest extent can lead to significant competitive advantages, enabling teams to focus on strategic insights that drive growth and innovation. Embracing these methodologies positions organizations at the forefront of the evolving data landscape, ready to tackle challenges and seize opportunities with confidence.
Introduction
In a world increasingly driven by data, organizations are tasked with navigating the complexities of analytics to unlock transformative insights. The four core types of analytics—Descriptive, Diagnostic, Predictive, and Prescriptive—serve as essential pillars in this journey, empowering businesses to make informed decisions that enhance operational efficiency and strategic planning.
As companies integrate these analytics with Robotic Process Automation (RPA) and Business Intelligence (BI), they position themselves to tackle challenges more effectively, streamline processes, and gain a competitive edge. This article delves into the significance of each analytics type, their real-world applications across various industries, and the future trends that promise to reshape how organizations leverage data for success.
By understanding and implementing these analytics strategies, businesses can not only thrive in a data-driven landscape but also pave the way for innovation and growth in the years to come.
Exploring the Core Types of Analytics: Descriptive, Diagnostic, Predictive, and Prescriptive
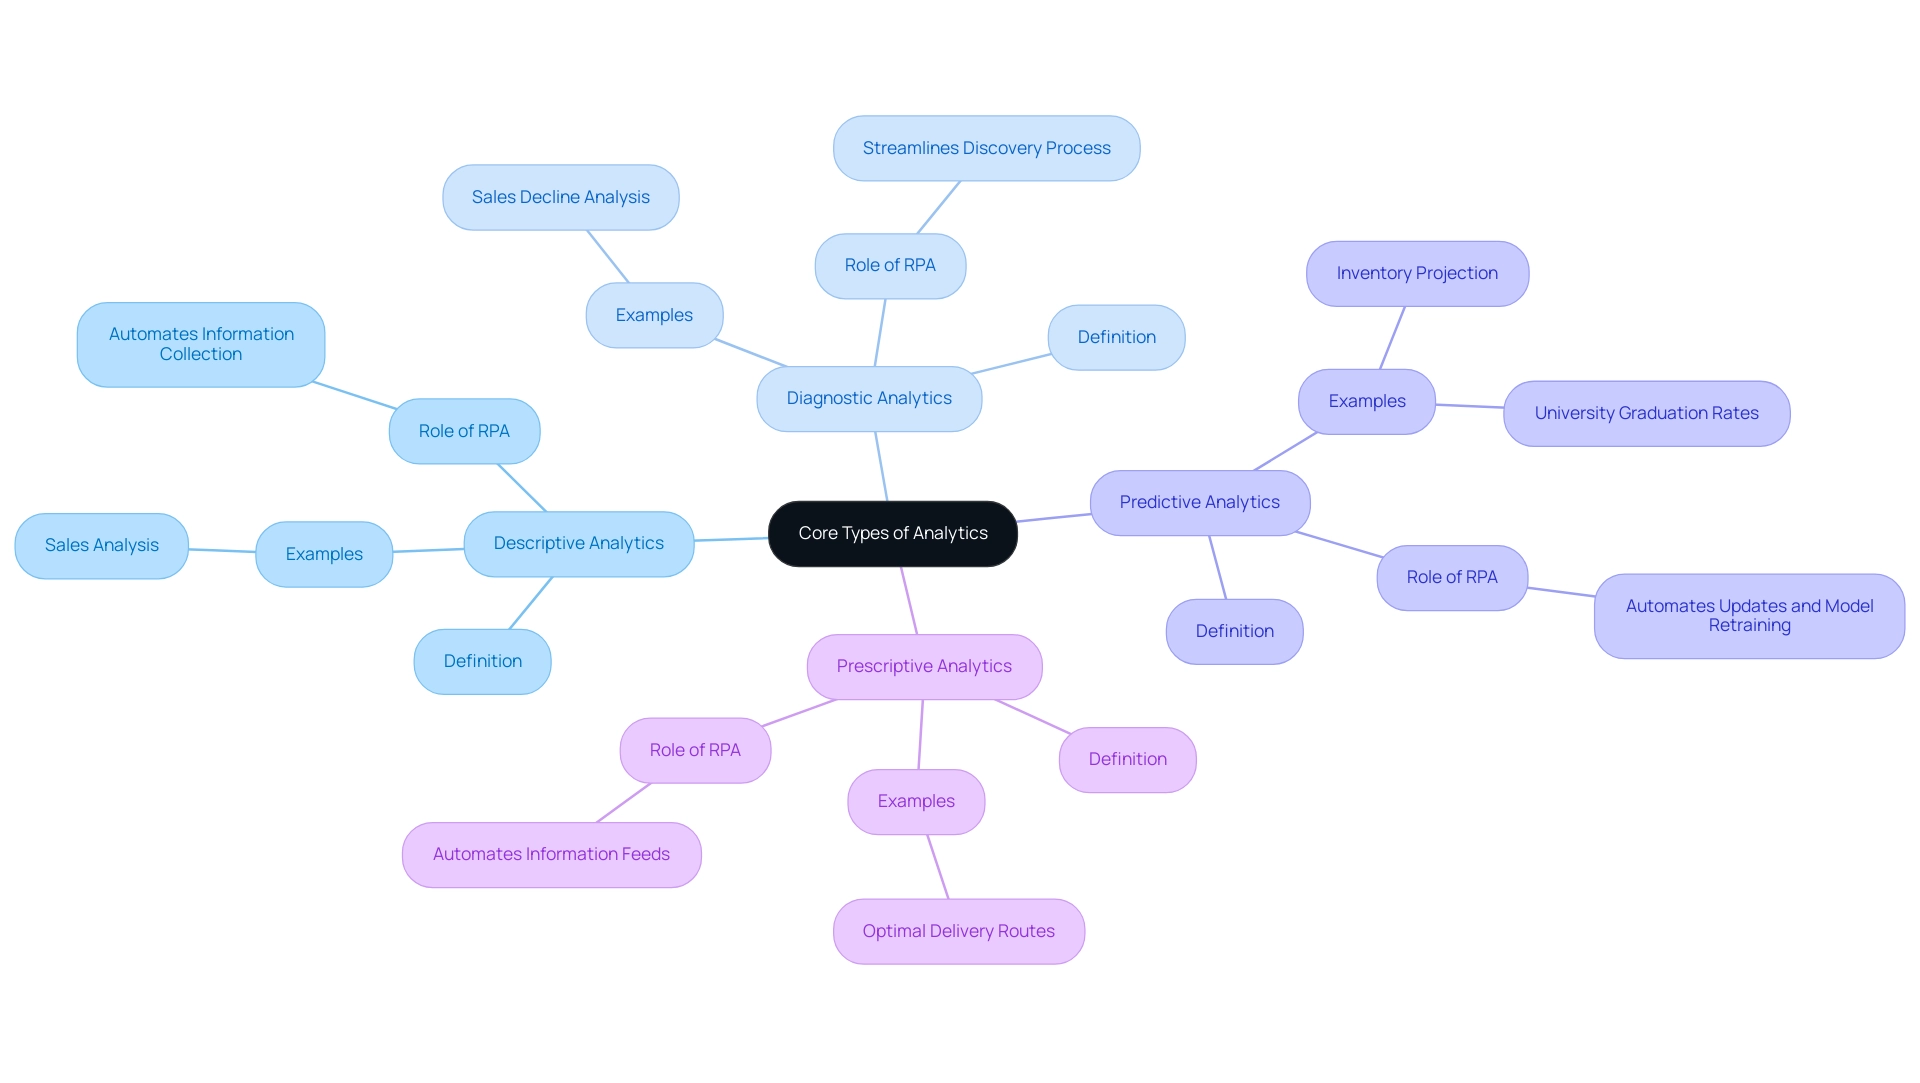
Analytics is a powerful tool that can be broadly categorized into four distinct types, including a different type of analytics, which are Descriptive, Diagnostic, Predictive, and Prescriptive. Each of these plays a crucial role in helping organizations leverage information effectively, especially when complemented by Robotic Process Automation (RPA) and business intelligence strategies.
-
Descriptive Analytics: This foundational type focuses on summarizing historical information to illuminate what has transpired in the past. By employing information aggregation and mining techniques, descriptive analytics offers valuable insights into trends and patterns. For instance, a retail company may examine last year’s sales figures to pinpoint peak sales periods, thereby informing future marketing strategies. RPA can automate the information collection process, ensuring that the information is aggregated efficiently and accurately. The impact of descriptive analysis on business performance can be profound, as it allows organizations to make data-driven decisions that reflect their historical performance and enhances operational efficiency when integrated with RPA.
-
Diagnostic Analysis: Building upon the insights provided by descriptive analysis, diagnostic analysis seeks to uncover the reasons behind certain events. It utilizes techniques such as information discovery and correlation analysis to dig deeper into the information and reveal the underlying causes of performance outcomes. For example, if a company experiences a sales decline in a specific quarter, diagnostic analysis can help identify factors such as market fluctuations or operational challenges that contributed to this drop. RPA can streamline the discovery process by automating the extraction and correlation of relevant information, making it easier to identify issues. Grasping diagnostic analysis becomes essential for tackling challenges, especially as entities encounter obstacles to effective analysis use—such as poor master data quality and limited access to comprehensive information—often worsened by the complexity of the AI landscape.
-
Predictive Analysis: This forward-looking type utilizes statistical models and machine learning techniques to predict future outcomes based on historical data. Predictive analysis empowers organizations by enabling them to anticipate trends and behaviors, facilitating proactive decision-making. For instance, a retail business might utilize predictive data analysis to project inventory needs based on seasonal trends and customer purchasing behavior, thereby optimizing stock levels and reducing costs. RPA can assist in automating updates and model retraining, ensuring that predictions are based on the most current information. Furthermore, approximately 1,400 universities are utilizing predictive analysis to help tackle low graduation rates, demonstrating the practical application of this type of analysis in the education sector, and highlighting the necessity for a strong information strategy that includes RPA to enhance information collection and processing.
-
Prescriptive Analysis: As the most advanced type, prescriptive analysis goes a step further by recommending specific actions to achieve desired outcomes. It merges information analysis with business rules and algorithms to propose optimal strategies for decision-makers. For example, a logistics company could use prescriptive data analysis to determine the best delivery routes, taking into account real-time traffic patterns and customer delivery windows. RPA can improve the efficiency of prescriptive insights by automating the information feeds necessary for real-time decision-making, thereby ensuring that suggestions are based on the most recent information.
Understanding these core types of insights, along with the strategic integration of RPA and business intelligence, equips entities to better align their information strategies with operational goals, ultimately enhancing effectiveness and informed decision-making by utilizing a different type of analytics. Key sectors gaining advantages from large information include finance, healthcare, retail, manufacturing, and transportation, highlighting the importance of analysis across multiple industries. As we approach 2024, trends indicate a growing dependence on these types of analysis, with many entities acknowledging their essential role in gaining a competitive edge in a data-driven environment.
Nevertheless, entities must also tackle obstacles like inadequate primary information quality and hindrances to AI implementation to fully utilize these analytical capabilities.
The Importance of Different Analytics Types in Business Decision-Making
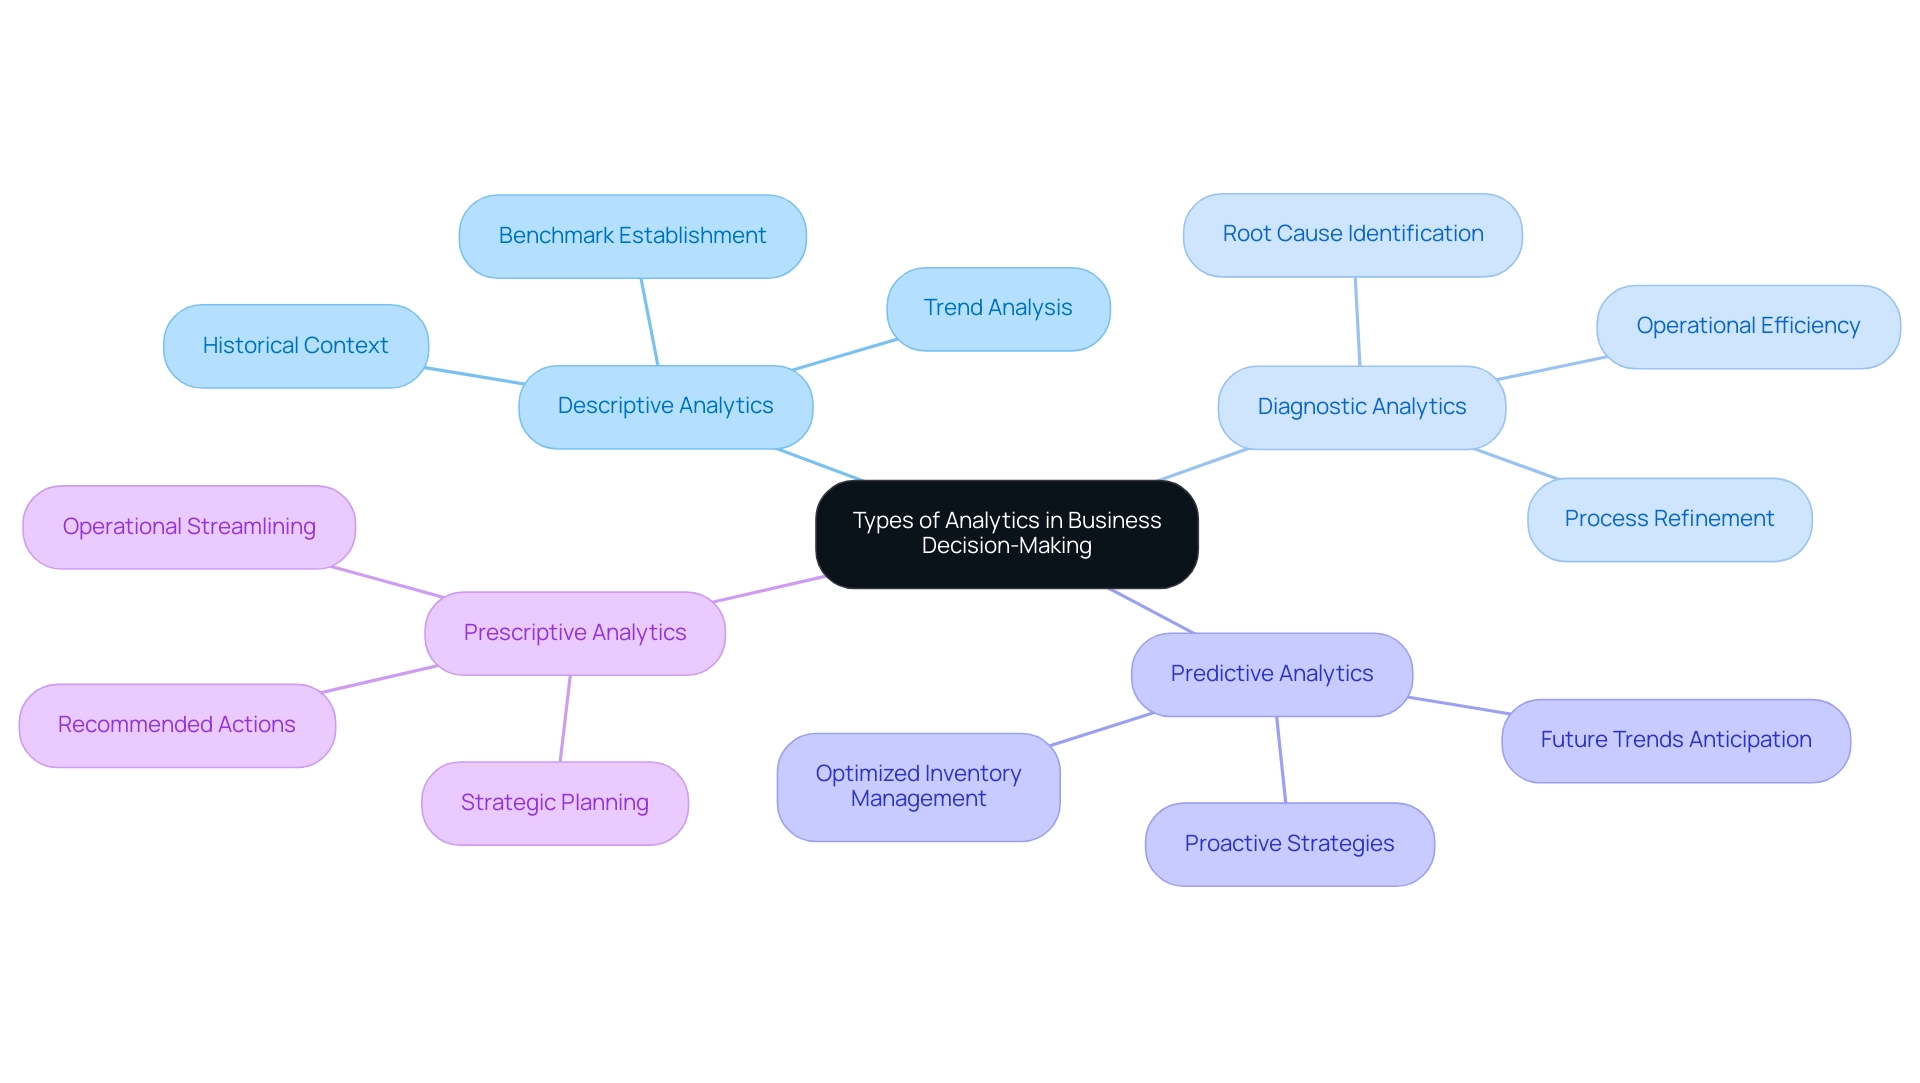
In today’s data-driven landscape, different types of analytics are integral to enhancing business decision-making processes, significantly supported by Robotic Process Automation (RPA) and tailored AI solutions.
-
Descriptive Analytics serves as a foundational element, offering historical context essential for understanding past performances and establishing benchmarks. By analyzing trends and patterns, companies can utilize a different type of analytics through RPA to automate data collection processes, empowering them to make informed decisions that shape future strategies while potentially lowering operational costs.
-
Diagnostic Analytics plays a crucial role in pinpointing the root causes of challenges. Coupled with RPA, it provides entities with the insights needed to address issues effectively, ultimately refining processes and boosting operational efficiency. This analytical approach sheds light on what went wrong and why, enabling targeted improvements through a different type of analytics. Additionally, predictive analytics allows businesses to look ahead, anticipating future trends and fostering a proactive rather than reactive approach. By integrating tailored AI solutions, companies can gain strategic advantages through different types of analytics, such as optimized inventory management, targeted marketing initiatives, and enhanced customer satisfaction. A noteworthy statistic reveals that leading marketers are 1.6 times more likely to believe that open information access contributes to superior performance, further showcasing the value of predictive insights.
-
Prescriptive Analytics elevates decision-making by recommending specific actions derived from analysis. This not only streamlines operations but also enhances strategic planning, providing organizations with clear pathways toward achieving their objectives. With 54% of companies considering the incorporation of cloud computing and business intelligence into their analytical strategies, as highlighted by industry leaders, the potential for transformative outcomes is immense.
Business Intelligence serves as a critical tool in this landscape by employing different types of analytics to transform raw data into actionable insights that drive informed decision-making and operational efficiency. As we near 2024, the significance of data analysis in business decision-making becomes increasingly clear. Data-driven methods are expected to surpass intuition in 65% of B2B sales firms by 2026, indicating a significant shift towards dependence on data analysis in sales approaches.
The case study titled ‘B2B Sales Entities and Data-Driven Strategies’ illustrates this trend, highlighting how firms that leverage data-driven insights, enhanced by RPA and Business Intelligence, are better positioned to improve operational efficiency and innovation while reducing costs. By grasping and efficiently utilizing this different type of analytics, entities can transform their decision-making procedures, leading to improved operational effectiveness, lowered expenses, and notable innovation. The insights gathered from these practices not only improve overall performance but also position businesses to thrive in a competitive marketplace.
Real-World Applications of Analytics in Various Industries
Analysis plays a crucial role across numerous sectors, enabling organizations to utilize information for improved operations and strategic decision-making, particularly when paired with technologies such as Robotic Process Automation (RPA) and Business Intelligence (BI).
-
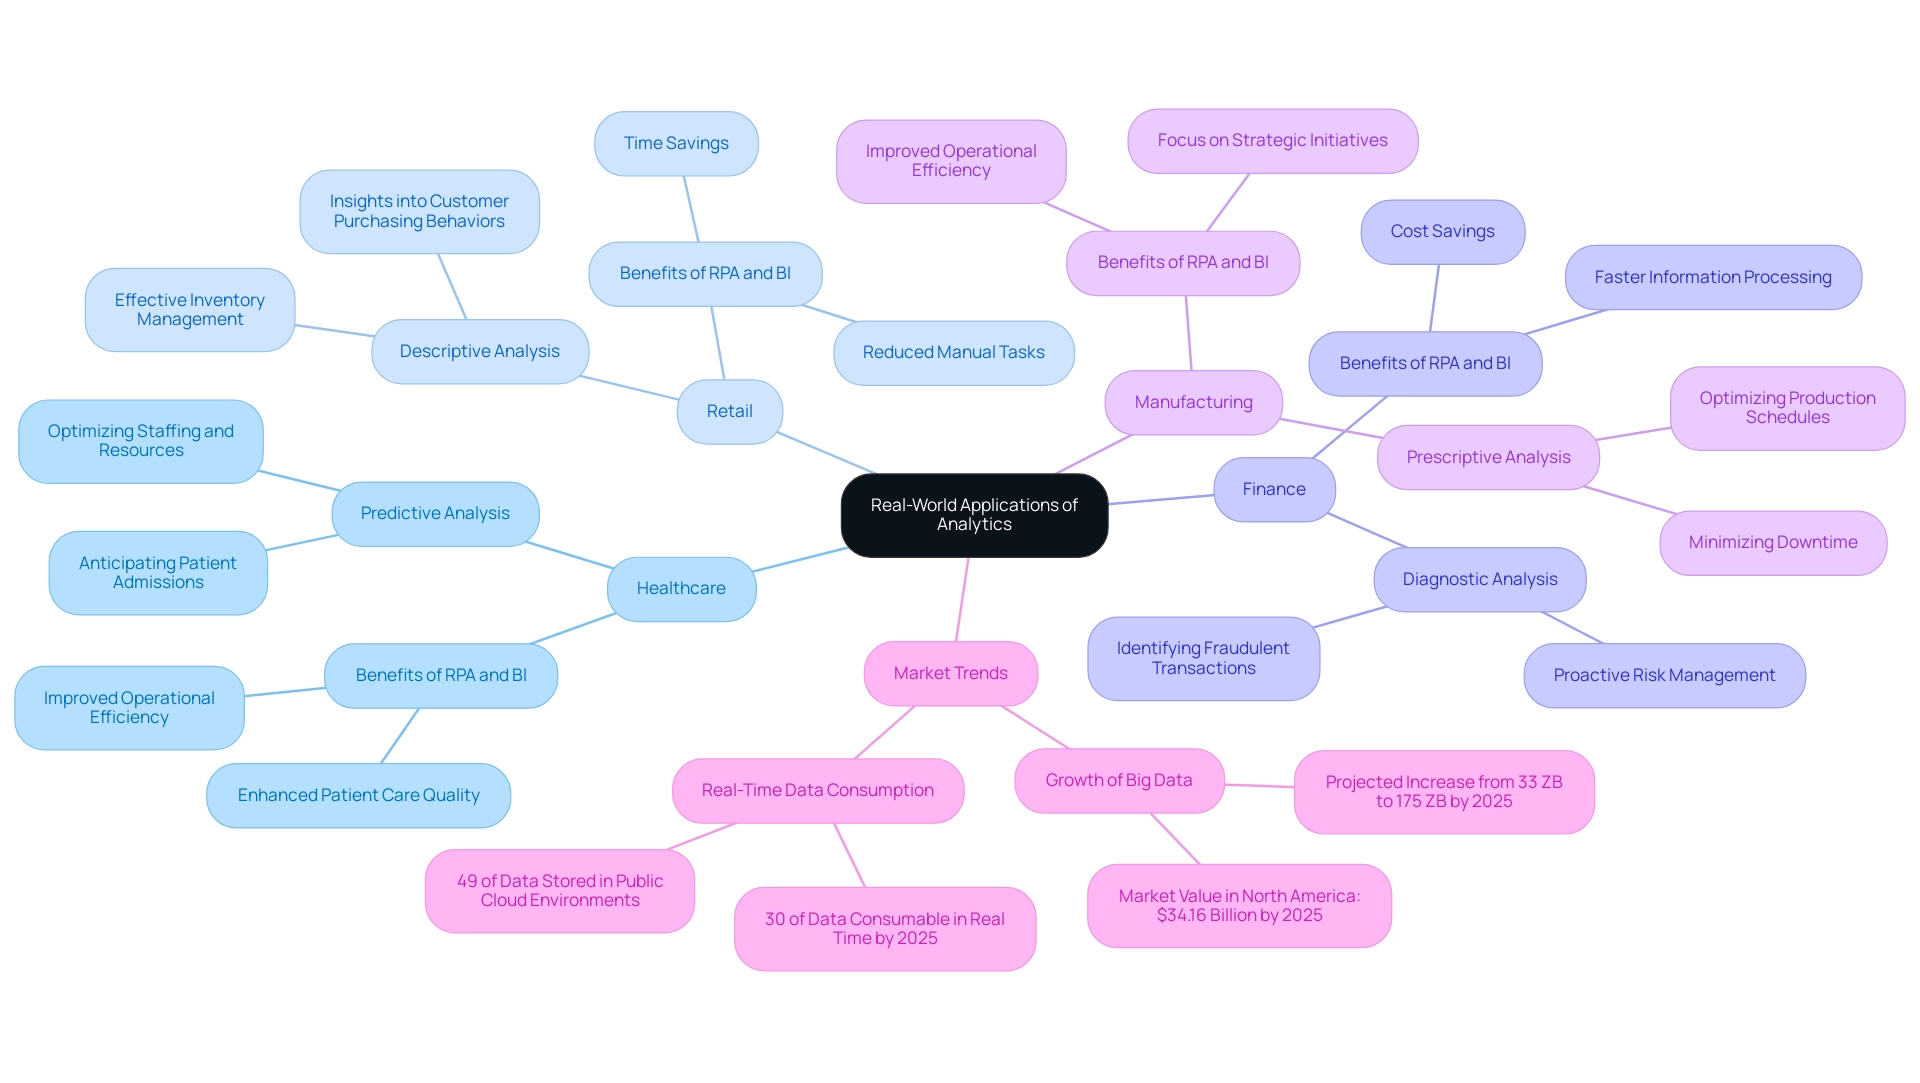
Healthcare: Predictive analysis, supported by RPA, is transforming the healthcare sector by anticipating patient admissions. Hospitals utilize historical information, including electronic health records (EHR) and electronic medical records (EMR), to anticipate peak admission times, optimizing staffing and resource allocation. This proactive approach not only improves operational efficiency but also enhances patient care quality, ensuring resources are available when needed most. As the healthcare sector progresses, it is anticipated that 30% of the information produced will be available in real time by 2025, further improving the capabilities of healthcare analysis.
-
Retail: Retailers are increasingly adopting descriptive analysis, alongside RPA tools, to gain insights into customer purchasing behaviors. By meticulously analyzing sales information, they can pinpoint products that surge in popularity during specific seasons. This knowledge allows for more effective inventory management, reducing excess stock and ensuring that popular items are readily available for customers, ultimately driving sales growth. The automation of these processes through RPA also reduces manual, repetitive tasks, leading to significant time savings.
-
Finance: In the financial sector, diagnostic analysis is crucial for identifying fraudulent transactions. By scrutinizing transaction patterns and anomalies, financial institutions can detect unusual behaviors that may indicate fraud. Integrating RPA in these processes enables faster information processing and enhances the capabilities of proactive risk management, safeguarding assets and maintaining customer trust. Additionally, the implementation of RPA can lead to substantial cost savings by streamlining operations and reducing the need for manual oversight.
-
Manufacturing: The manufacturing sector utilizes prescriptive data analysis, supported by RPA, to fine-tune production schedules. By examining machine performance information, manufacturers can ascertain optimal operation times for specific machinery. This approach minimizes downtime and maximizes productivity, leading to improved operational efficiency. Furthermore, the use of RPA in this context aids in removing repetitive tasks, enabling personnel to concentrate on more strategic initiatives.
These examples highlight the flexibility of data analysis, illustrating how customized solutions, including RPA and BI, can tackle the unique challenges encountered by different sectors using different types of analytics. According to an analysis conducted by Allied Market Research in 2019, the market value of large information in North America is expected to reach $34.16 billion by 2025. With the projected expansion of large information sets, expected to rise from 33 ZB in 2018 to 175 ZB by 2025, entities that adopt analysis tools, complemented by RPA and BI, will be well-positioned to harness the potential of Business Intelligence, converting raw information into actionable insights that drive informed decision-making and operational excellence.
Challenges in Implementing Analytics Solutions
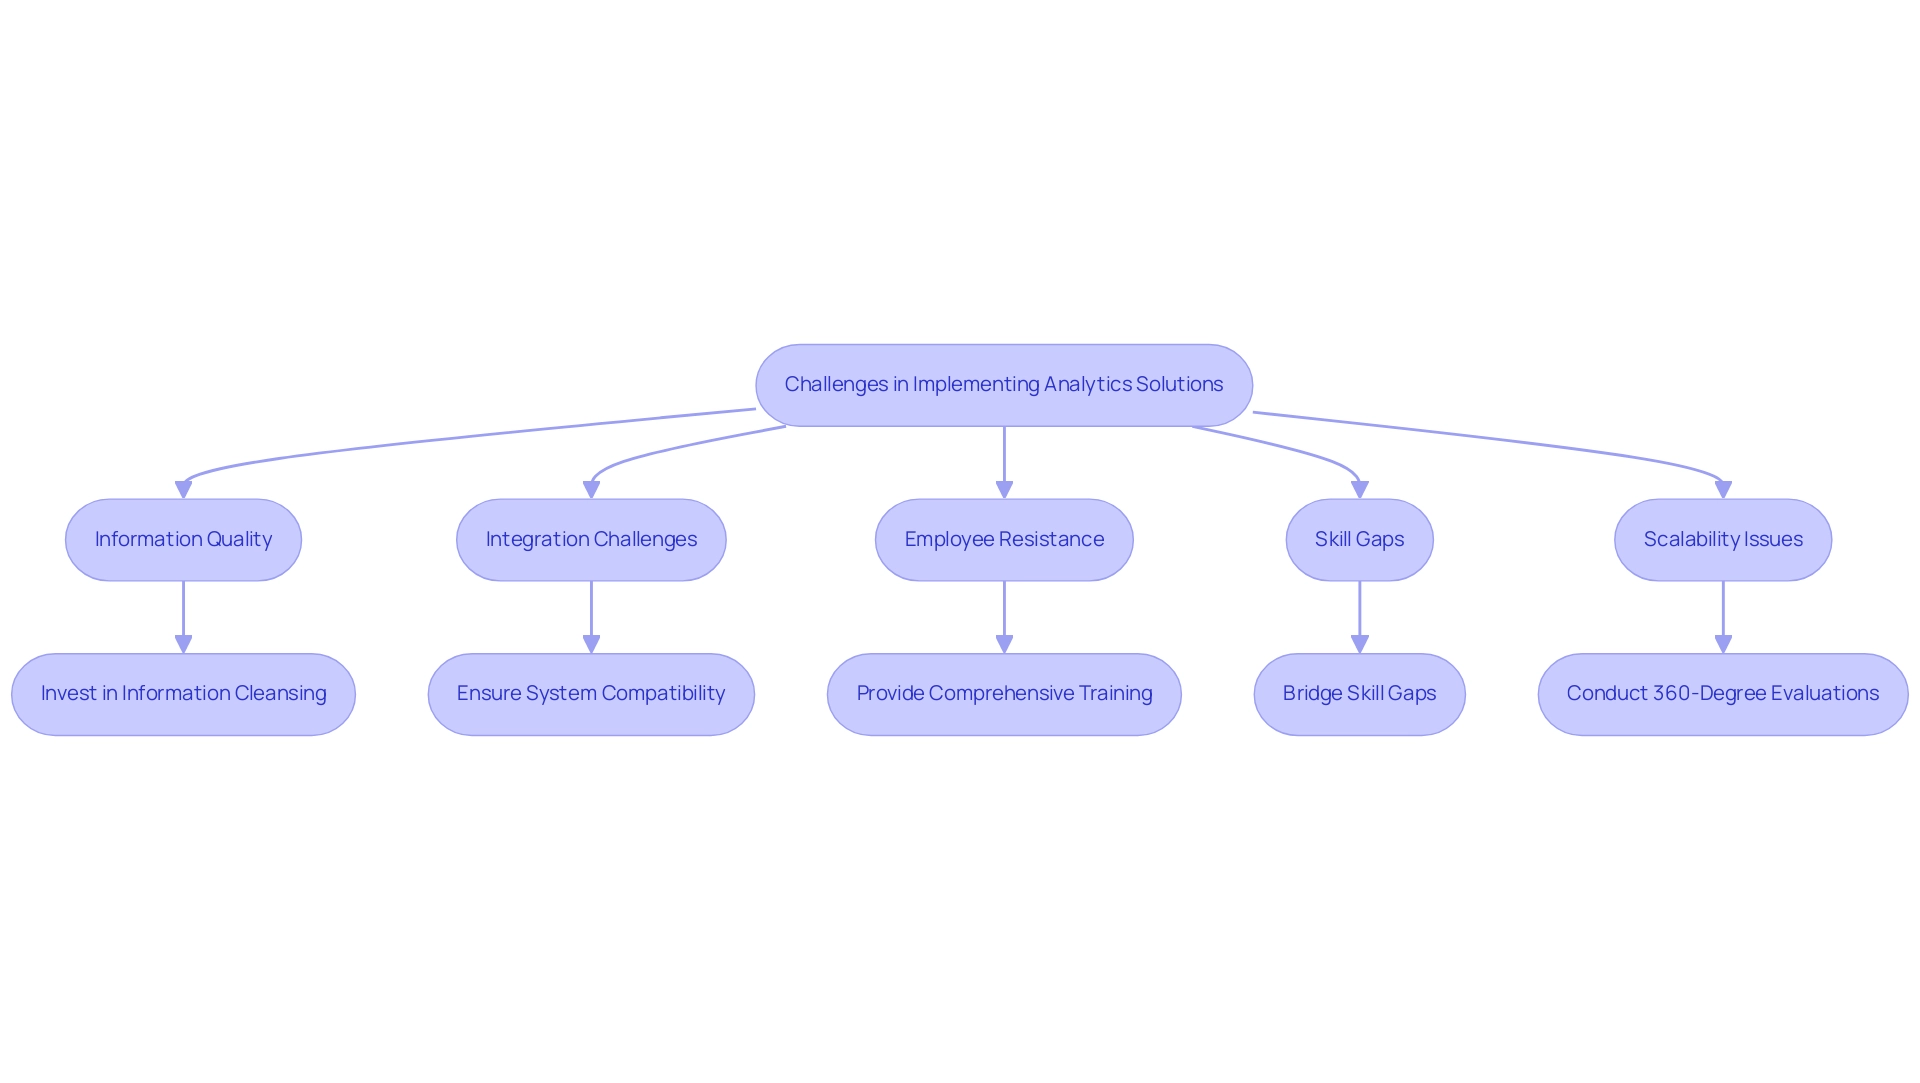
While the potential advantages of different types of analytics are substantial, organizations often face significant hurdles during implementation. A key concern is the quality of information; inaccurate or incomplete information can yield misleading insights when analyzed using a different type of analytics. As a result, it is essential for companies to invest in thorough information cleansing and validation procedures to ensure the reliability of their analysis outputs.
Statistics suggest that 57% of companies that prioritize information quality report improved decision-making effectiveness, highlighting its significance in the analytical process.
Integration poses another challenge, as seamlessly connecting existing systems with different types of analytics tools can be intricate. Organizations must ensure their analysis solutions are compatible with current information infrastructures to maintain an effective information flow. This complexity is further heightened by the rapid growth of different types of analytics, including:
- augmented insights
- edge insights
- data democratization
- DaaS
- synthetic data generation
These are key trends in data analysis for 2024.
North America led the augmented data analysis market in 2023 with a valuation of $3.03 billion due to heightened digital adoption and competitive pressures.
To enhance operational efficiency, businesses can explore Robotic Process Automation (RPA) to streamline repetitive tasks, allowing teams to focus on higher-value work. Furthermore, tailored AI solutions can specifically address organizational challenges, ensuring that technology adoption aligns with business goals. For instance, implementing customized AI models can help in automating customer interactions, thereby improving service delivery and operational efficiency.
Practical training is crucial in this context; companies should invest in workshops that equip their teams with the skills necessary to implement and manage these AI solutions effectively. Such training can focus on real-world applications and best practices, including the use of a different type of analytics like ChatGPT 4.0, to ensure that employees are well-prepared to leverage AI tools.
Change management is also critical; employee resistance can obstruct the adoption of a different type of analytics solutions. To cultivate a culture that embraces data-driven decision-making, companies should concentrate on offering comprehensive training and ongoing support through workshops centered on different types of analytics, including AI integration strategies and ethical practices.
According to Naresh Kumar, Lead Marketing Strategist, enterprises must implement a concrete, cohesive information integration strategy to break down these barriers and create a unified information ecosystem to drive informed decision-making.
Additionally, organizations may encounter skill gaps, as there often exists a shortage of qualified personnel capable of effectively analyzing and interpreting different types of analytics. Investing in training programs or employing specialists can bridge this gap, enabling teams to utilize a different type of analytics to maximize their potential.
A relevant case study titled “Scalability and Performance in Data Analytics” illustrates these challenges. As information volumes rise, companies encounter challenges in ensuring their analytical framework can manage the requirements for storing, processing, and examining large datasets with different types of analytics. Failure to scale can lead to an inability to generate critical business reports.
By performing a 360-degree evaluation of current information systems, Zuci identifies issues and formulates strategies for enhancement, ensuring the infrastructure can handle increasing volumes of information.
By proactively addressing these challenges and utilizing Business Intelligence, entities can significantly improve their ability to implement a different type of analytics successfully, thereby maximizing the advantages of data-driven decision-making.
Future Trends in Analytics
The landscape of analytics is swiftly changing, with several key trends ready to reshape how entities utilize information for strategic advantage:
-
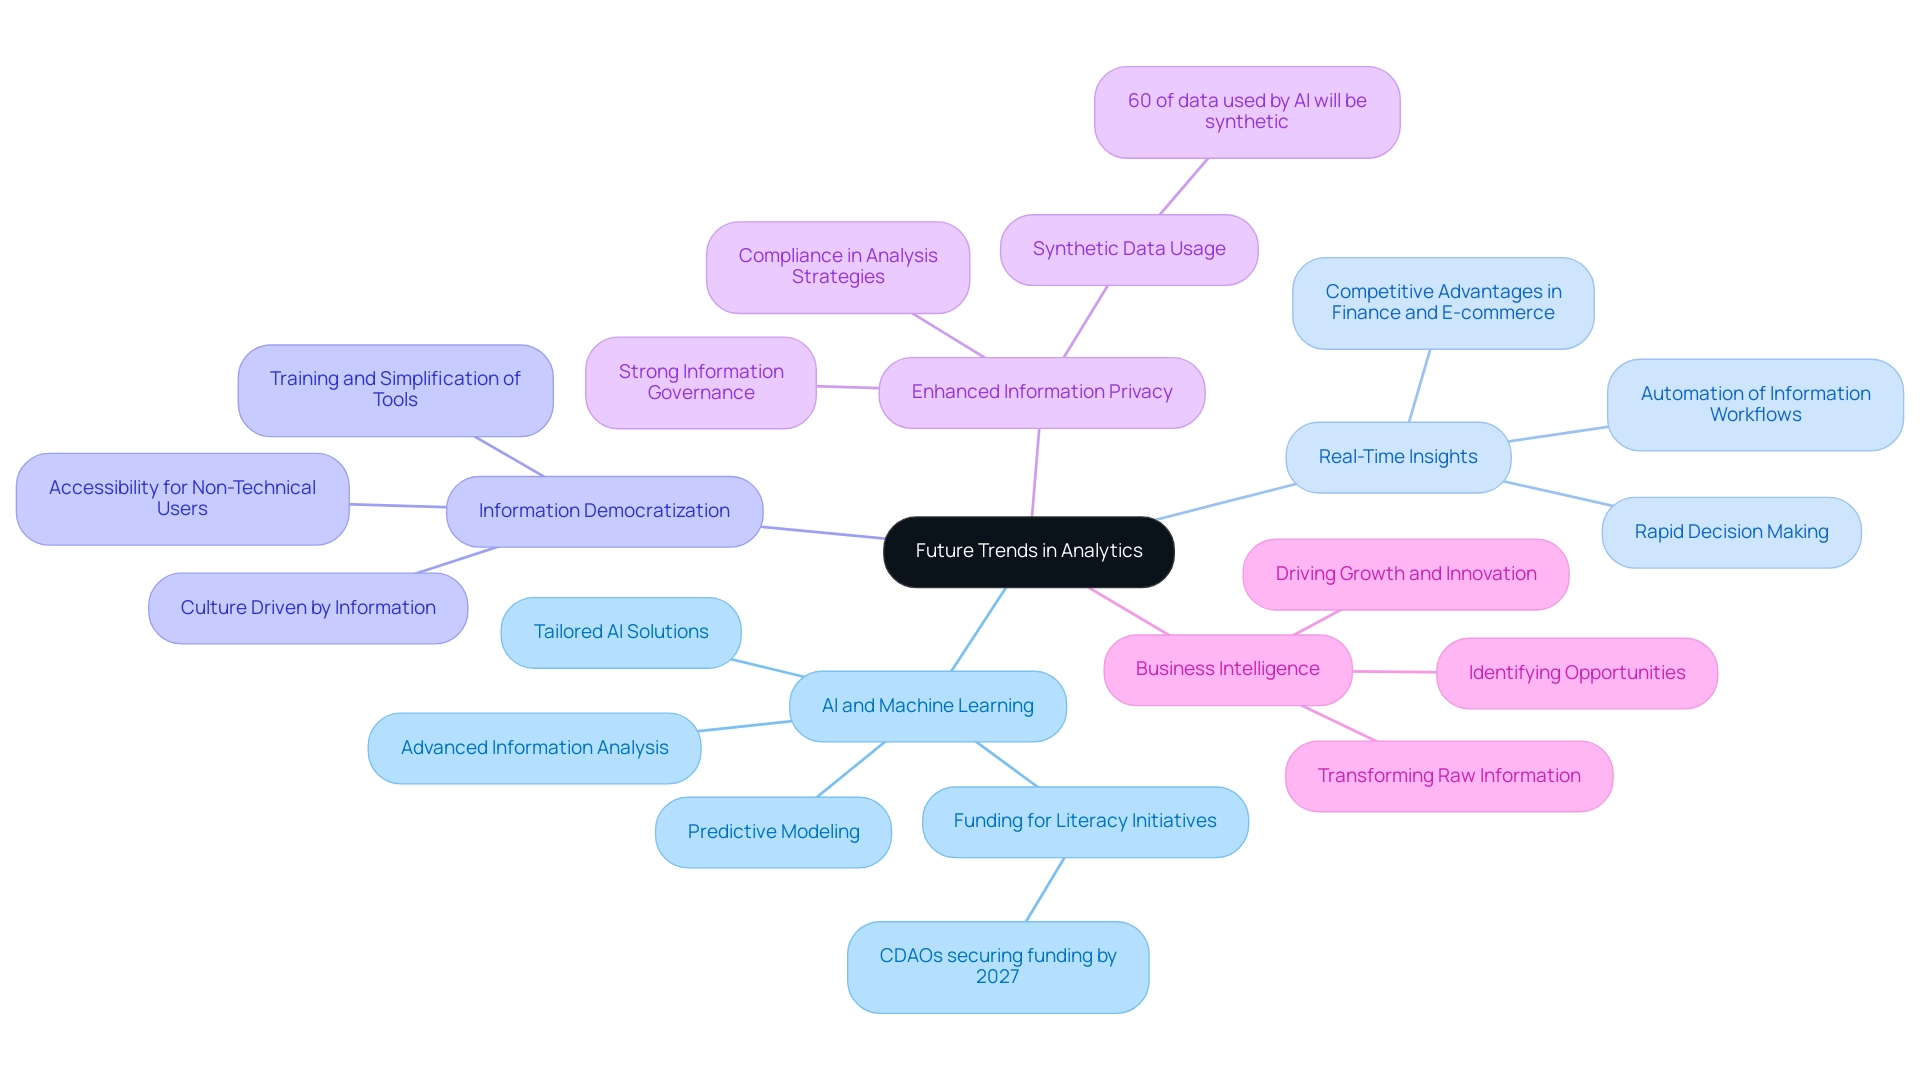
Artificial Intelligence and Machine Learning: The incorporation of AI and machine learning into analytics is anticipated to quicken, paving the way for more advanced information analysis and predictive modeling. These advanced technologies are not only automating processing but also enhancing the depth of insights derived from complex datasets. Furthermore, tailored AI solutions can assist entities in navigating the overwhelming AI landscape, ensuring alignment with specific business goals. Gartner forecasts that by 2027, over half of Chief Data and Analytics Officers (CDAOs) will obtain funding for information literacy and AI literacy initiatives, driven by business shortcomings in achieving anticipated value from generative AI, as mentioned by Ramakrishnan.
-
Real-Time Insights: The need for real-time insights is rising, allowing entities to make rapid, informed choices based on the latest information available. This trend is especially critical in sectors such as finance and e-commerce, where timely insights can create significant competitive advantages. As companies adjust, the anticipation is that real-time insights will become standard practice, enabling agile reactions to market changes, further improved by RPA to automate information workflows and simplify processes.
-
Information Democratization: Firms are increasingly prioritizing information democratization, concentrating on making insight tools accessible to non-technical users. By simplifying these tools and offering thorough training, businesses enable a wider variety of employees to integrate information into their decision-making processes. This shift not only improves overall operational efficiency but also promotes a culture driven by information throughout the entity, supported by RPA to lessen the burden of manual tasks.
-
Enhanced Information Privacy: With increasing concerns over information privacy, entities must prioritize strong information governance and compliance in their analysis strategies. Implementing stringent security measures to protect sensitive information is essential while still extracting valuable insights. As 60% of the information utilized by AI and analytical solutions is anticipated to be synthetic by year-end, ensuring integrity and privacy becomes increasingly paramount.
-
Business Intelligence: Leveraging Business Intelligence is crucial for transforming raw information into actionable insights. This process enables entities to make informed decisions that drive growth and innovation. By incorporating BI tools, businesses can illustrate trends, recognize opportunities, and improve operational efficiency, ultimately aiding strategic goals.
Understanding these trends is crucial for entities seeking to utilize a different type of analytics to drive future growth and innovation. The expected 35% rise in demand for sustainability-enabled monitoring services, as emphasized by research from the University of California, illustrates the increasing convergence of data analysis and responsible resource management. As organizations tend to expand their analytics departments when they reach 500 employees, staying ahead of these trends allows them to harness analytics not merely as a tool, but as a strategic asset for long-term success, supported by RPA and Business Intelligence for informed decision-making.
Specific examples of RPA’s impact include automating data entry and reporting tasks, which significantly reduce manual workloads and enhance overall efficiency.
Conclusion
Organizations today stand at the forefront of a data revolution, with the four core types of analytics—Descriptive, Diagnostic, Predictive, and Prescriptive—serving as vital tools for navigating this landscape. By embracing these analytics, businesses can unlock insights that inform decision-making, streamline operations, and ultimately drive growth. The integration of Robotic Process Automation (RPA) and Business Intelligence (BI) amplifies these benefits, enabling companies to respond swiftly to market demands and enhance operational efficiency.
Real-world applications across diverse sectors, from healthcare to finance, demonstrate the transformative impact of analytics. Predictive analytics anticipates trends, while prescriptive analytics offers actionable recommendations, ensuring organizations are well-equipped to tackle challenges head-on. However, successful implementation requires addressing barriers such as data quality and integration complexities. Investing in comprehensive training and fostering a culture of data literacy will empower teams to leverage these technologies effectively.
Looking ahead, the future of analytics is bright, with emerging trends like real-time analytics and data democratization paving the way for even greater innovation. As organizations continue to adapt and evolve, those that prioritize analytics as a strategic asset will not only enhance their operational capabilities but also secure a competitive edge in an increasingly data-driven world. By embracing these analytics strategies today, businesses can position themselves for sustained success and growth in the years to come.
Introduction
In the world of data visualization, the aesthetic appeal of reports can significantly impact their effectiveness. Power BI themes offer a powerful solution to enhance visual consistency and readability, enabling organizations to communicate insights with clarity and professionalism. By understanding how to leverage these themes, users can not only streamline the report creation process but also address common challenges such as data inconsistencies and user engagement.
This article delves into the intricacies of Power BI themes—from downloading and customizing them to best practices for implementation—equipping readers with the knowledge to elevate their reporting capabilities and align them with organizational branding.
Through thoughtful theme selection and customization, stakeholders can transform raw data into actionable insights, driving informed decision-making and operational efficiency.
Understanding Power BI Themes: An Overview
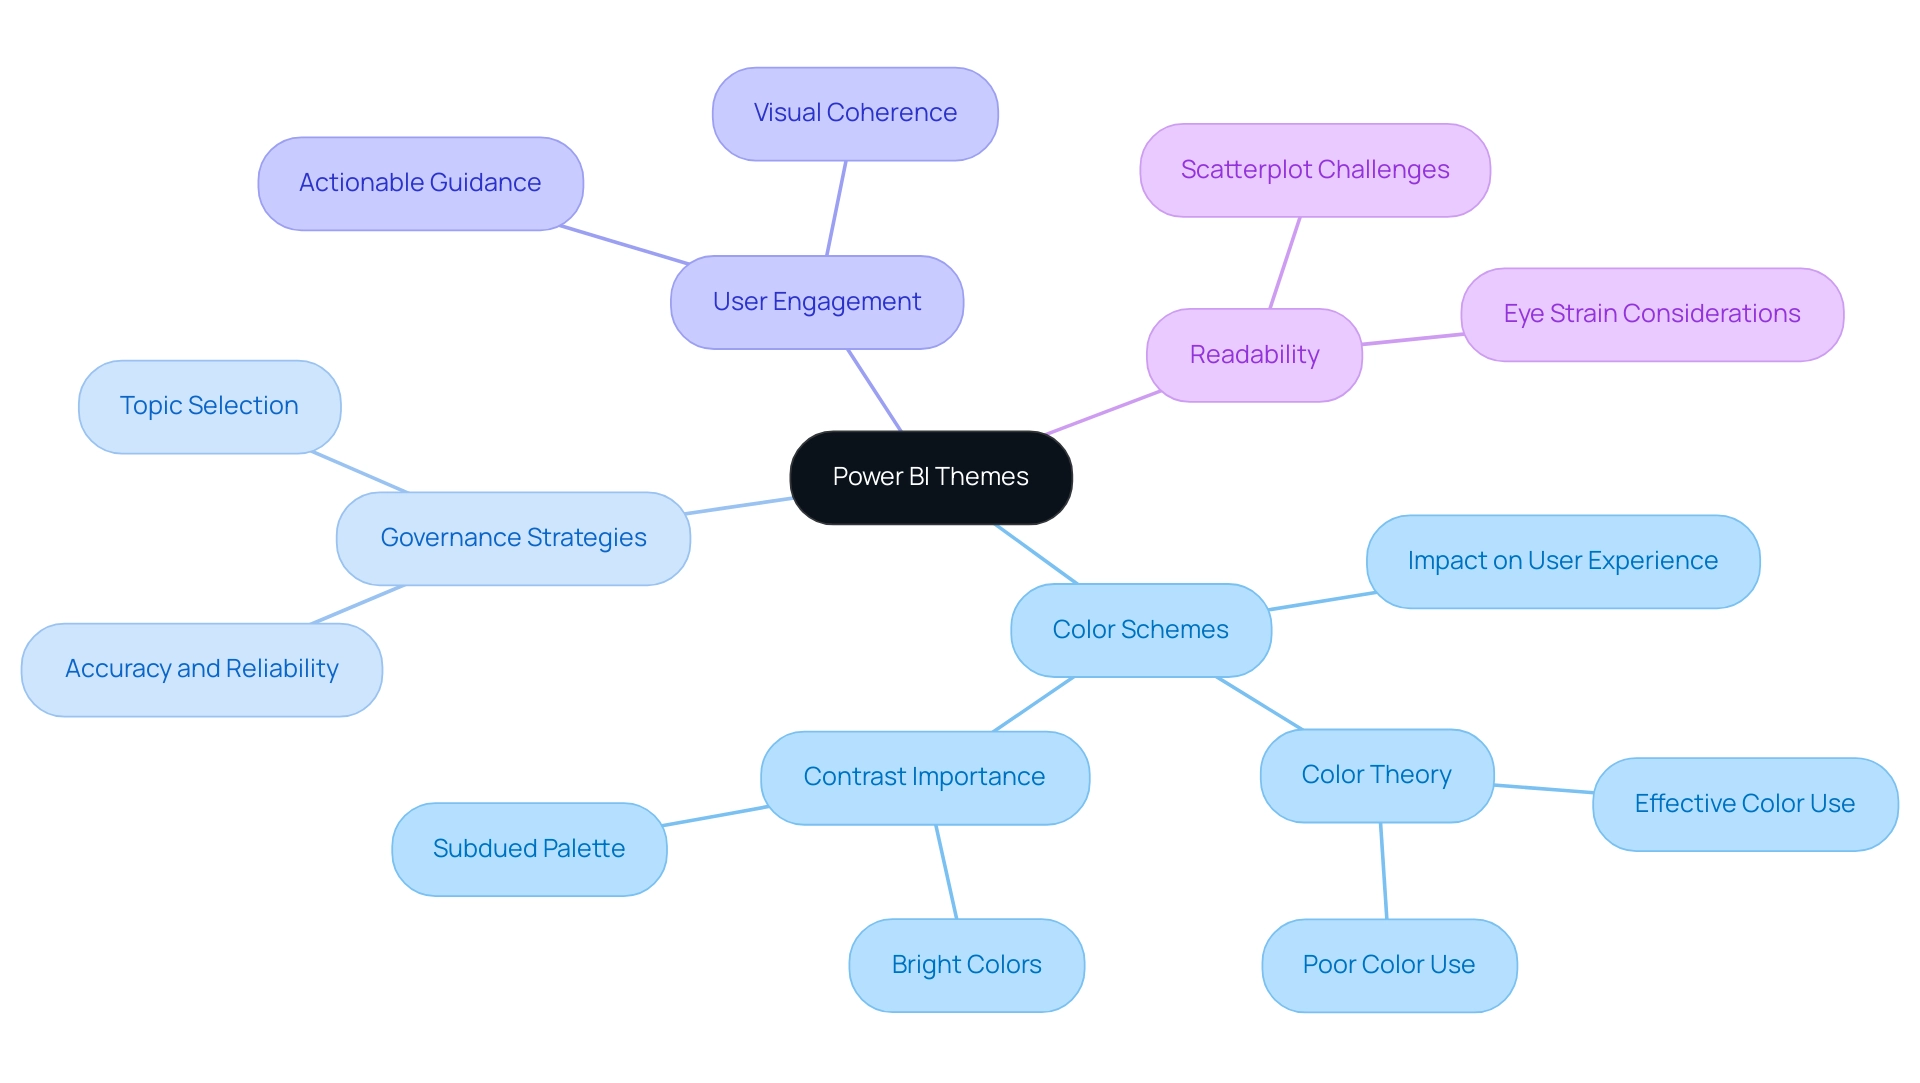
Power BI styles include thoughtfully selected color schemes and formatting choices aimed at enhancing the visual coherence and attractiveness of your documents. By leveraging these themes, users can establish a cohesive aesthetic across different visualizations, mitigating the challenges of time-consuming document creation and enhancing readability. This not only promotes greater user involvement but also tackles common problems like inconsistencies and the absence of actionable guidance.
To effectively combat inconsistencies and build trust in the reports, it is crucial to implement a robust governance strategy that ensures accuracy and reliability. Recognizing that the selection of topics profoundly influences how your data is interpreted, it is vital to choose them wisely. As color theorist Maureen Stone aptly states,
Color used well can enhance and clarify a presentation.
Color used poorly will obscure, muddle and confuse.
This emphasizes the importance of suitable topic selection for effective communication. A notable example is Klaus Schulte’s visualization of Luge competition categories, which utilizes the colors of the German flag to create immediate recognition and connection, illustrating how effective color choices can enhance user experience.
Furthermore, research indicates that scatterplots become increasingly challenging to interpret with six or more categories, reinforcing the need for thoughtful color selection to maintain clarity and impact. Additionally, a case study on the importance of contrast reveals that while bright and vivid colors can grab attention, they may lead to eye strain if overused. Adopting a more subdued color palette can significantly improve readability.
By understanding the available options, you enable yourself to make knowledgeable decisions about how to download Power BI themes or personalize them, ultimately ensuring your documents align with your organization’s branding and communication goals. Moreover, integrating clear, actionable guidance within your reports can provide stakeholders with a clear direction on the next steps, addressing a key concern in report effectiveness.
Step-by-Step Guide to Downloading Power BI Themes
To seamlessly download and apply custom themes in Power BI Desktop, follow these straightforward steps:
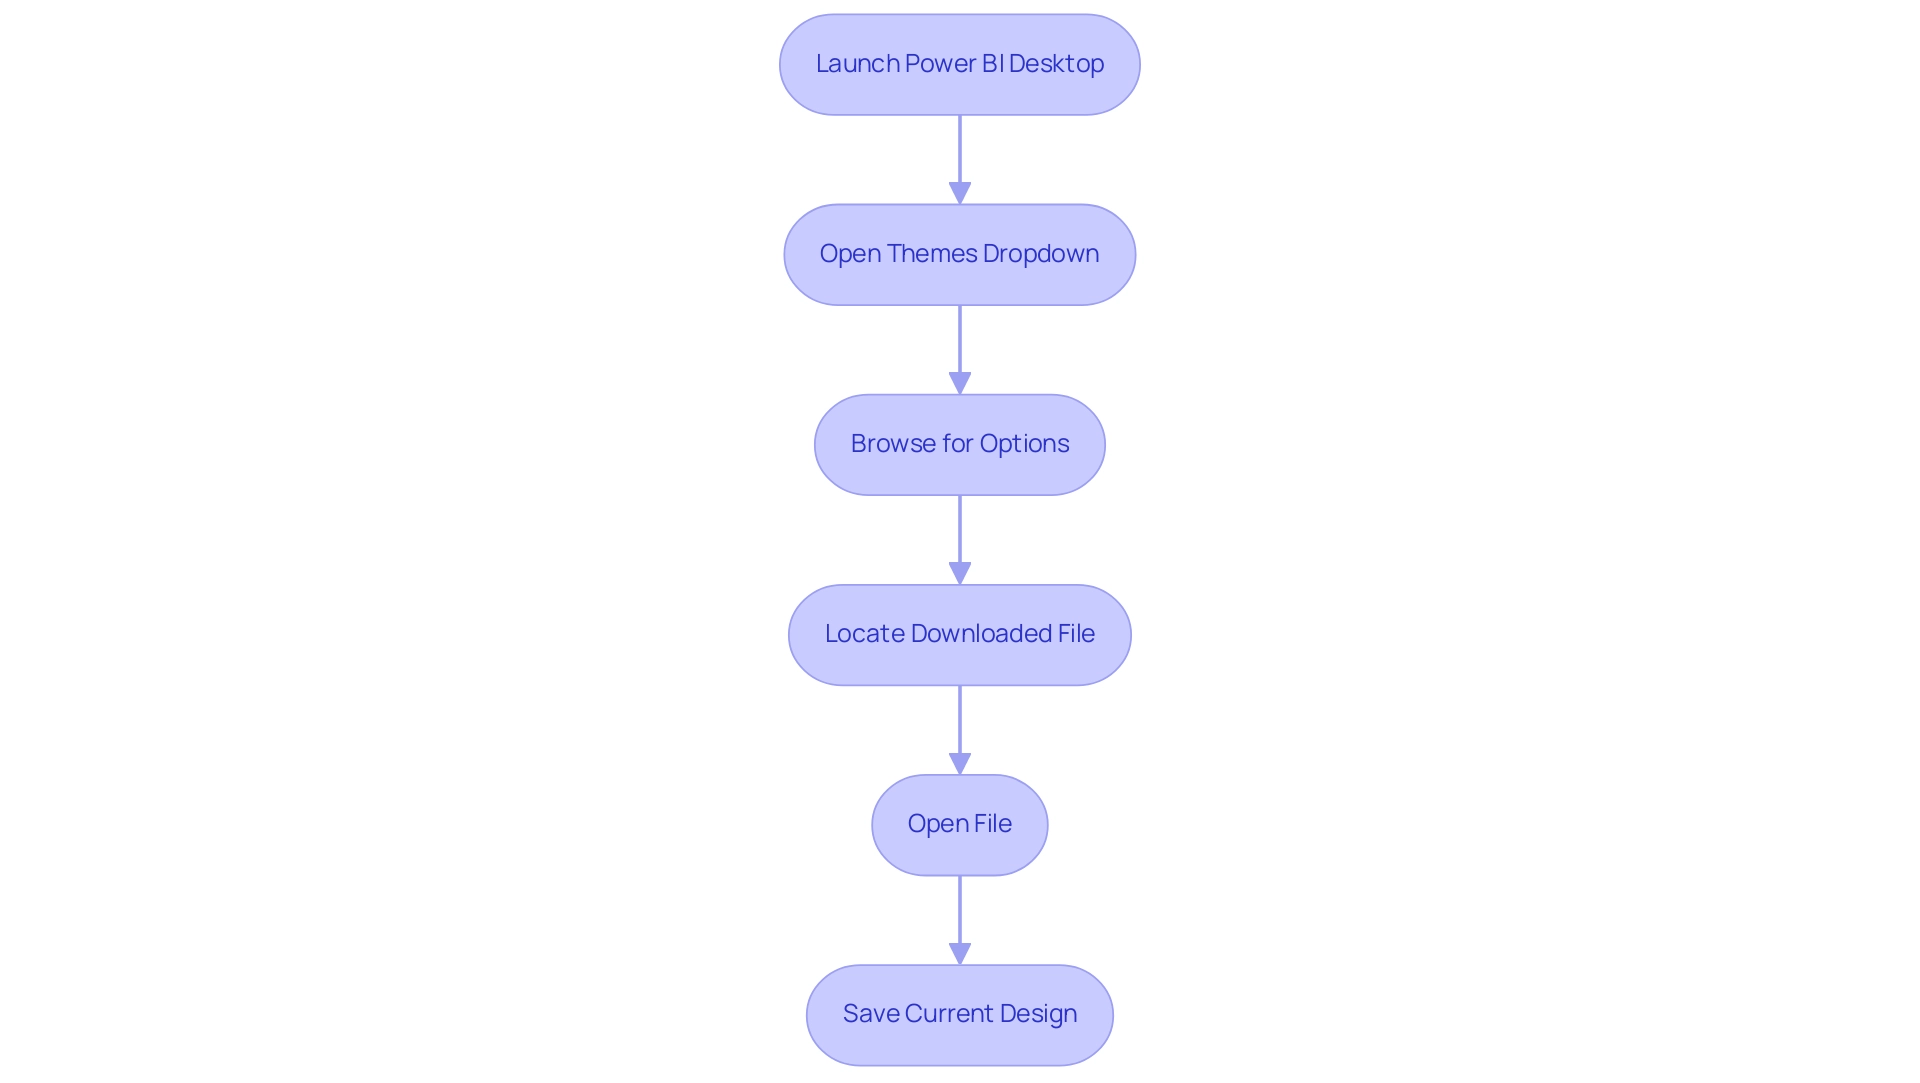
- Launch Power BI Desktop and navigate to the ‘View’ tab at the top of the interface.
- Click on the ‘Themes’ dropdown menu to download Power BI themes and access various style options.
- Select ‘Browse for options,’ which will launch your file explorer to download Power BI themes.
- To find the file after you download Power BI themes, check your computer; it is usually in .json format.
- Select the desired file and click ‘Open.’ This action will instantly apply the design to your report, transforming its appearance.
- If you wish to keep this design for future use, you should download Power BI themes by returning to the ‘Themes’ dropdown and selecting ‘Save current design.’ This enables you to quickly access your personalized design whenever needed.
Personalized designs not only improve visual attractiveness but also align your documents with corporate branding, making them more influential and actionable. By employing these concepts, you can reduce typical obstacles like time-consuming report generation and information inconsistencies. Importantly, custom designs can also provide actionable guidance by visually emphasizing key insights and trends in your data, helping stakeholders make informed decisions.
Significantly, a related post on this topic received 13,746 views, underscoring the growing interest in customizing themes within BI. According to lbendlin, a Super User in the Power BI community, “It is automatic, but only to a certain extent. If you don’t utilize the information, it will cease to be generated after some time. Don’t rely on it.” This highlights the significance of actively interacting with your reports and applying the concepts effectively. For further insights, consider exploring related content on administering BI in the admin portal, as this can also enhance your understanding of ensuring data governance and consistency, and engaging with the BI Community for additional resources.
Where to Find Power BI Themes for Download
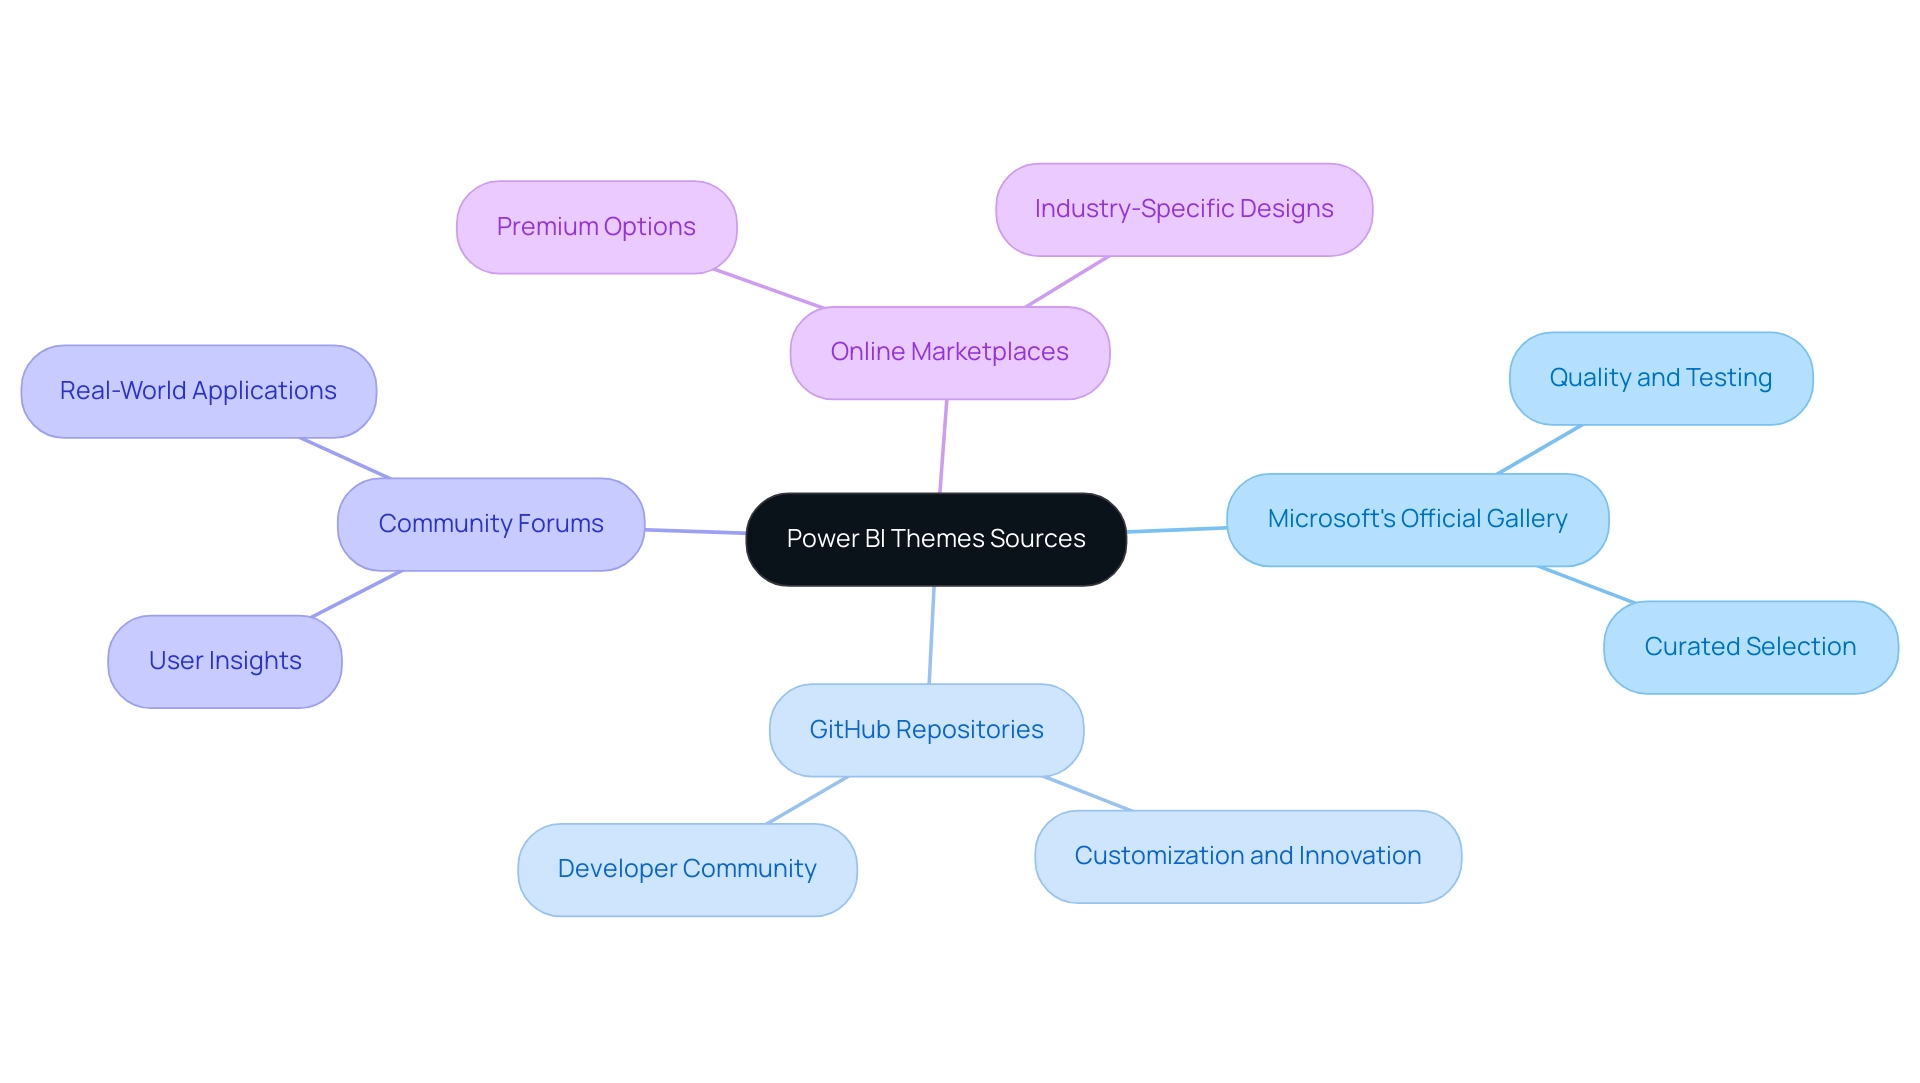
Power BI themes can be sourced from a variety of platforms, each offering unique advantages that cater to different user needs:
-
Microsoft’s Official Gallery: This is a prime resource, showcasing a curated selection of themes developed by Microsoft as well as contributions from the Power BI community. It guarantees that users have access to high-quality, tested designs that fit various reporting needs, ultimately supporting the goal of leveraging Business Intelligence for informed decision-making.
-
GitHub Repositories: A treasure trove for developers, GitHub hosts numerous repositories where creators share their custom BI styles. Merely searching for ‘Power BI styles’ can reveal innovative designs and functionalities that may not be found elsewhere, encouraging creativity and customization while tackling the challenge of time-consuming report creation.
-
Community Forums: Engaging with platforms like Power BI Community and Reddit can lead you to user-shared topics that reflect real-world applications and preferences. These forums not only enable direct downloads but also offer insights from users who have tried these designs in various contexts. As noted by KarlinOz, “I am looking for something to pull the Usage Metrics from all workspaces into one report,” illustrating the common struggle with data inconsistencies and the need for consolidated reporting solutions.
-
Online Marketplaces: For those seeking premium options, platforms like ThemeForest and Creative Market offer a variety of professionally designed layouts for purchase. These marketplaces often feature exclusive designs tailored for specific industries or reporting styles, adding a polished edge to your presentations and enhancing operational efficiency.
Along with using BI styles, integrating RPA solutions such as EMMA RPA and Automate can greatly simplify the reporting process. These tools help automate repetitive tasks, reducing the time spent on report creation and addressing staffing shortages, ultimately boosting employee morale and efficiency.
As we look toward 2024, you can significantly enhance your reporting capabilities by exploring diverse sources to download Power BI themes, allowing for greater customization and alignment with organizational branding. Addressing the need for a consolidated solution for usage metrics is crucial for operational efficiency. A relevant case study is the ‘Azure Function for Graph API Access,’ which proposes a method to surface Graph API information while ensuring that only site owners can access it.
This approach not only enhances data security but also provides a practical solution for users needing consolidated metrics. Monitoring emerging trends in customization and RPA will enable you to maintain an advantage in providing meaningful analyses.
Customizing Downloaded Power BI Themes
Modifying a design after you download Power BI themes is an uncomplicated task that allows you to align your documents with your brand identity while also addressing key operational challenges. Follow these steps to create an effective and visually appealing theme:
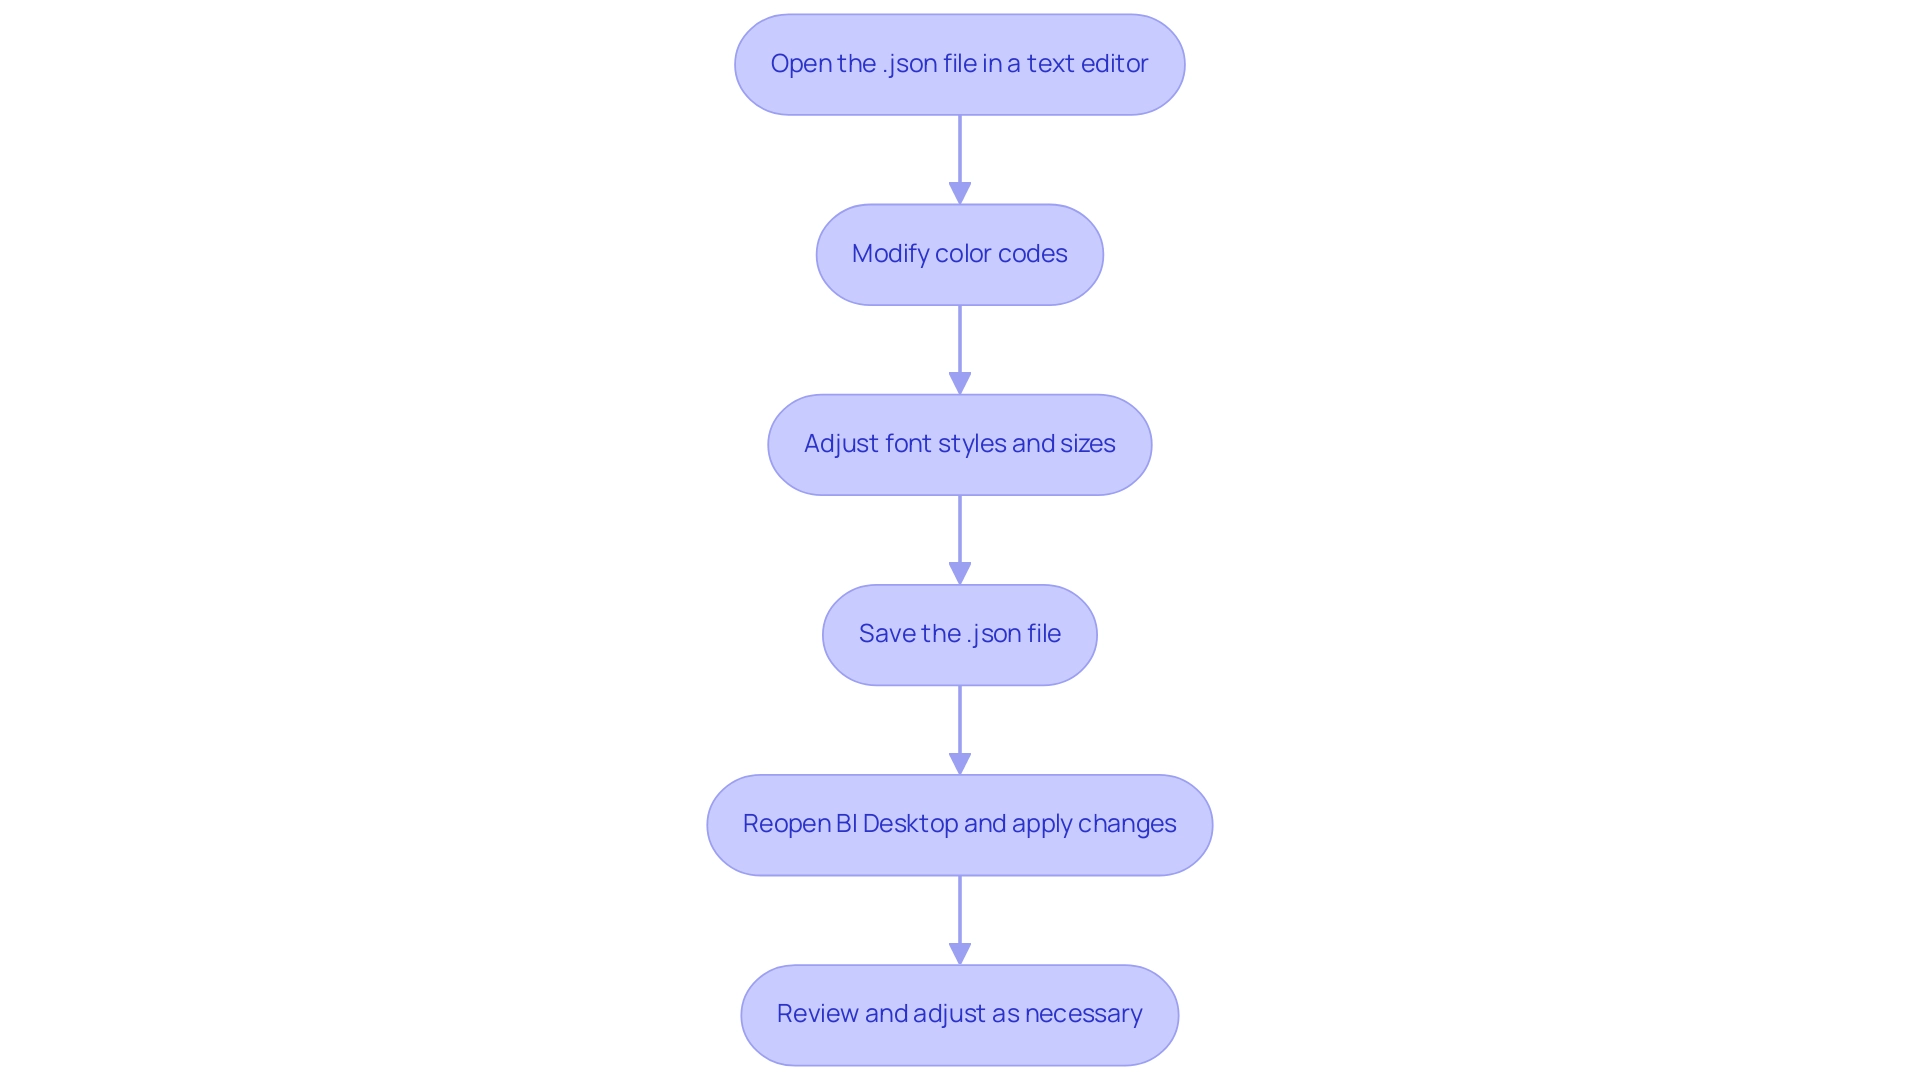
- Start by opening the file (.json) in a text editor, such as Notepad.
- Modify the color codes to reflect your brand’s color scheme, ensuring that your visual elements resonate with your organizational identity.
- Adjust font styles and sizes to fit your preferences; keep in mind that the default settings for the small label class are 9 pt font size, which is crucial for maintaining readability and aesthetics in your documents.
- Save the changes to the .json file to ensure your modifications are retained.
- Reopen BI Desktop and apply the altered design by choosing the ‘Browse for themes’ option.
- Review the changes in your document to ensure consistency and make further adjustments as necessary.
By following these steps, you can effectively download Power BI themes, allowing you to customize them to ensure they align with your brand and enhance the impact of your presentations. As noted by Paul Waller, a designer at endjin, “Whether it’s UX or dashboards for financial and retail services, making concepts look and feel great is essential for clarity.” This approach not only enhances your documents but also strengthens brand recognition and user engagement.
Furthermore, adopting Robotic Process Automation (RPA) can greatly enhance your workflow by automating repetitive tasks, which lessens the time invested in document creation and minimizes errors. By merging tailored AI solutions with your reporting processes, you can unlock valuable Business Intelligence insights that transform raw data into actionable insights, enabling informed decision-making that drives growth and innovation. Moreover, handling various concepts in documents and dashboards enables users to determine if visuals maintain the document style or embrace the dashboard style, ensuring visual uniformity across all platforms.
Best Practices for Implementing Power BI Themes
You can download Power BI themes to enhance your reports.
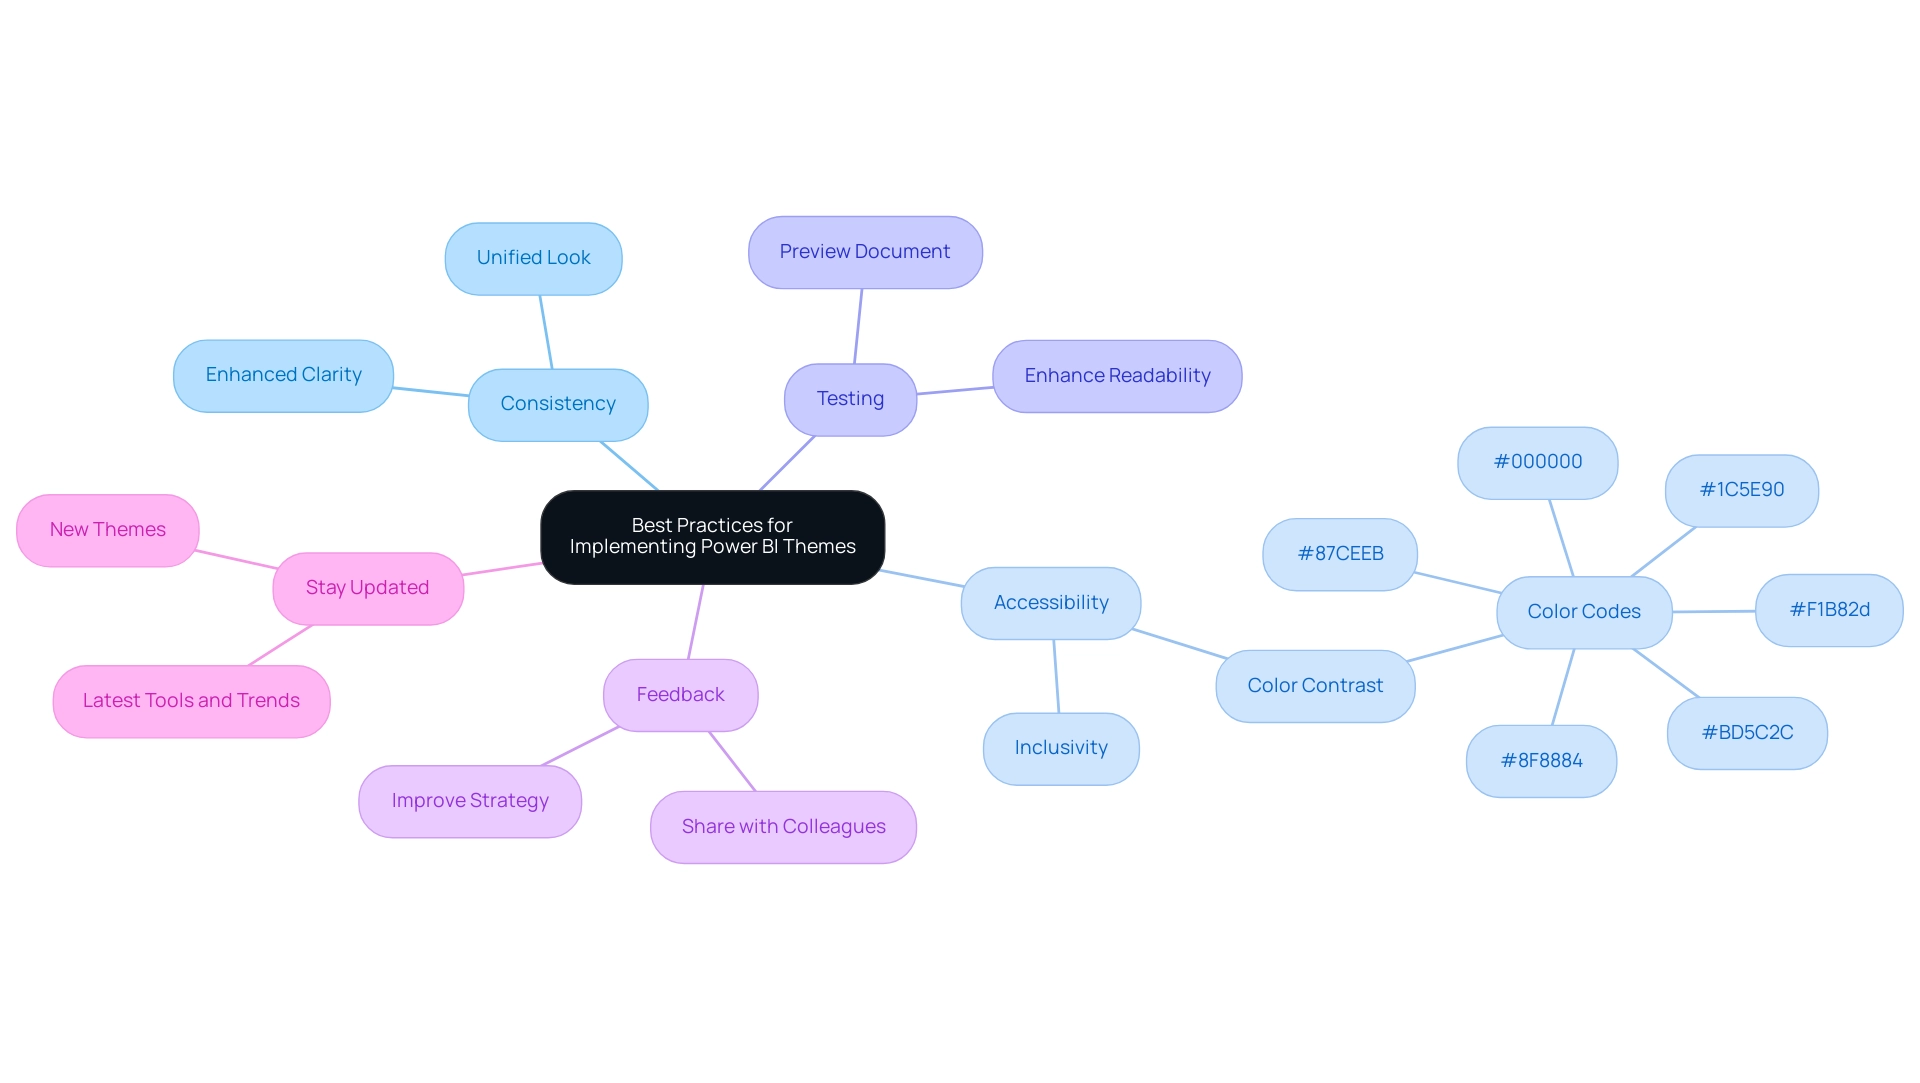
Consistency is Key: To enhance clarity and professionalism, it’s crucial to establish a unified look across all reports, which can be achieved when you download Power BI themes. By utilizing the same concept consistently, you create a unified experience that assists in information interpretation and allows users to download Power BI themes. This aligns with your objective of enhancing operational efficiency by ensuring that your team can easily navigate and utilize the insights derived from information, as well as download Power BI themes.
-
Consider Accessibility: It’s essential to choose color contrasts that are inclusive for all users, particularly those with visual impairments. Utilizing the first six colors—
#F82d,#000000,#C90,#87CEEB,#8F8884, and#BD2C—ensures compatibility with the three main types of color blindness, thereby broadening your audience’s accessibility to your insights. This commitment to inclusivity not only adheres to best practices but also enhances the effectiveness of your data-driven strategies. -
Test Before Finalizing: Always preview your document with the new theme before completing it. This crucial step ensures that your design enhances readability and engagement, allowing you to make adjustments that improve user experience. In the context of utilizing your Business Intelligence tools, this practice can significantly reduce the time spent on document creation and enhance data consistency.
-
Gather Feedback: Sharing your themed reports with colleagues can provide invaluable insights into their effectiveness. By gathering feedback, you can improve your strategy and ensure that your concepts resonate well with your audience. As Olga Cheban, a Technical Content Writer at Coupler.io, states, “I’ve been writing about information, tech solutions, and business for years, and this passion never fades. I find technology fascinating and hope that the content I create helps people discover new solutions and ideas.” Engaging your team in this process can enhance morale and foster a collaborative environment.
You can download Power BI themes to enhance your reports.
Stay Updated: Keep an eye out for new themes so you can download Power BI themes and updates to existing ones. Frequently updating your documents not only sustains interest but also shows a dedication to using the latest tools and trends in visualization. Additionally, referencing the case study titled “Choosing the Right Charts and Graphs” underscores the importance of selecting appropriate chart types for effective data visualization, especially in overcoming challenges related to time-consuming report creation and data inconsistencies. By leveraging these strategies, including the benefits of RPA such as reducing errors and freeing up your team for more strategic tasks, you can effectively overcome the challenges of technology implementation and drive business growth.
Conclusion
Power BI themes are essential tools that enhance both the visual appeal and effectiveness of data reports. By understanding how to download, customize, and implement these themes, users can create a consistent and engaging reporting experience that aligns with organizational branding. The careful selection of color palettes not only mitigates data inconsistencies but also fosters user engagement, making insights more accessible and actionable.
Moreover, adhering to best practices—such as ensuring consistency across reports, prioritizing accessibility, and gathering feedback—can significantly elevate the quality of data presentations. By integrating thoughtful design with robust governance strategies, organizations can transform their reporting capabilities into powerful decision-making tools. This approach not only enhances operational efficiency but also empowers stakeholders with the clarity needed to act on insights.
In conclusion, leveraging Power BI themes is not just about aesthetics; it’s about driving informed decisions and enhancing the overall effectiveness of data visualization. Embracing these strategies will lead to more impactful reports that resonate with audiences and ultimately contribute to organizational success. Now is the time to harness the power of themes to unlock the full potential of data-driven insights.
Introduction
In the dynamic landscape of data analytics, Microsoft Power BI emerges as a powerful ally for organizations seeking to harness their data effectively. The comprehensive documentation surrounding Power BI serves as an invaluable resource, guiding users through the intricacies of data visualization and analysis.
From user manuals to troubleshooting tips, this documentation equips individuals with the knowledge needed to navigate challenges and maximize the platform’s capabilities. As businesses transition towards greater BI adoption, understanding and utilizing these resources becomes essential for overcoming obstacles related to data integration and security.
By exploring real-world applications and leveraging innovative solutions like Robotic Process Automation (RPA), organizations can transform their operational efficiency and decision-making processes, turning data into a strategic asset.
This article delves into the multifaceted benefits of Power BI documentation, revealing practical applications and strategies that empower users to elevate their data analysis efforts and drive business growth.
Understanding Microsoft Power BI Documentation: An Overview
The Microsoft Power BI documentation is an essential resource for individuals eager to utilize the full capabilities of Power BI for analysis and visualization. This comprehensive guide, based on Microsoft Power BI documentation, includes manuals, best practices, and troubleshooting tips tailored to enhance experience while addressing common challenges. As emphasized by Kira Belova,
Embrace the power of BI with PixelPlex to transform your information into a strategic asset.
Comprehending this material is essential for efficiently navigating the platform, enabling individuals to utilize its features to their fullest potential. Beyond facilitating a seamless initial setup, the Microsoft Power BI documentation encourages ongoing learning and adaptation, equipping users to tackle new challenges throughout their information journey. This is particularly important as organizations strive for higher BI adoption levels, transitioning through stages from low (0-10) to full adoption (41-50).
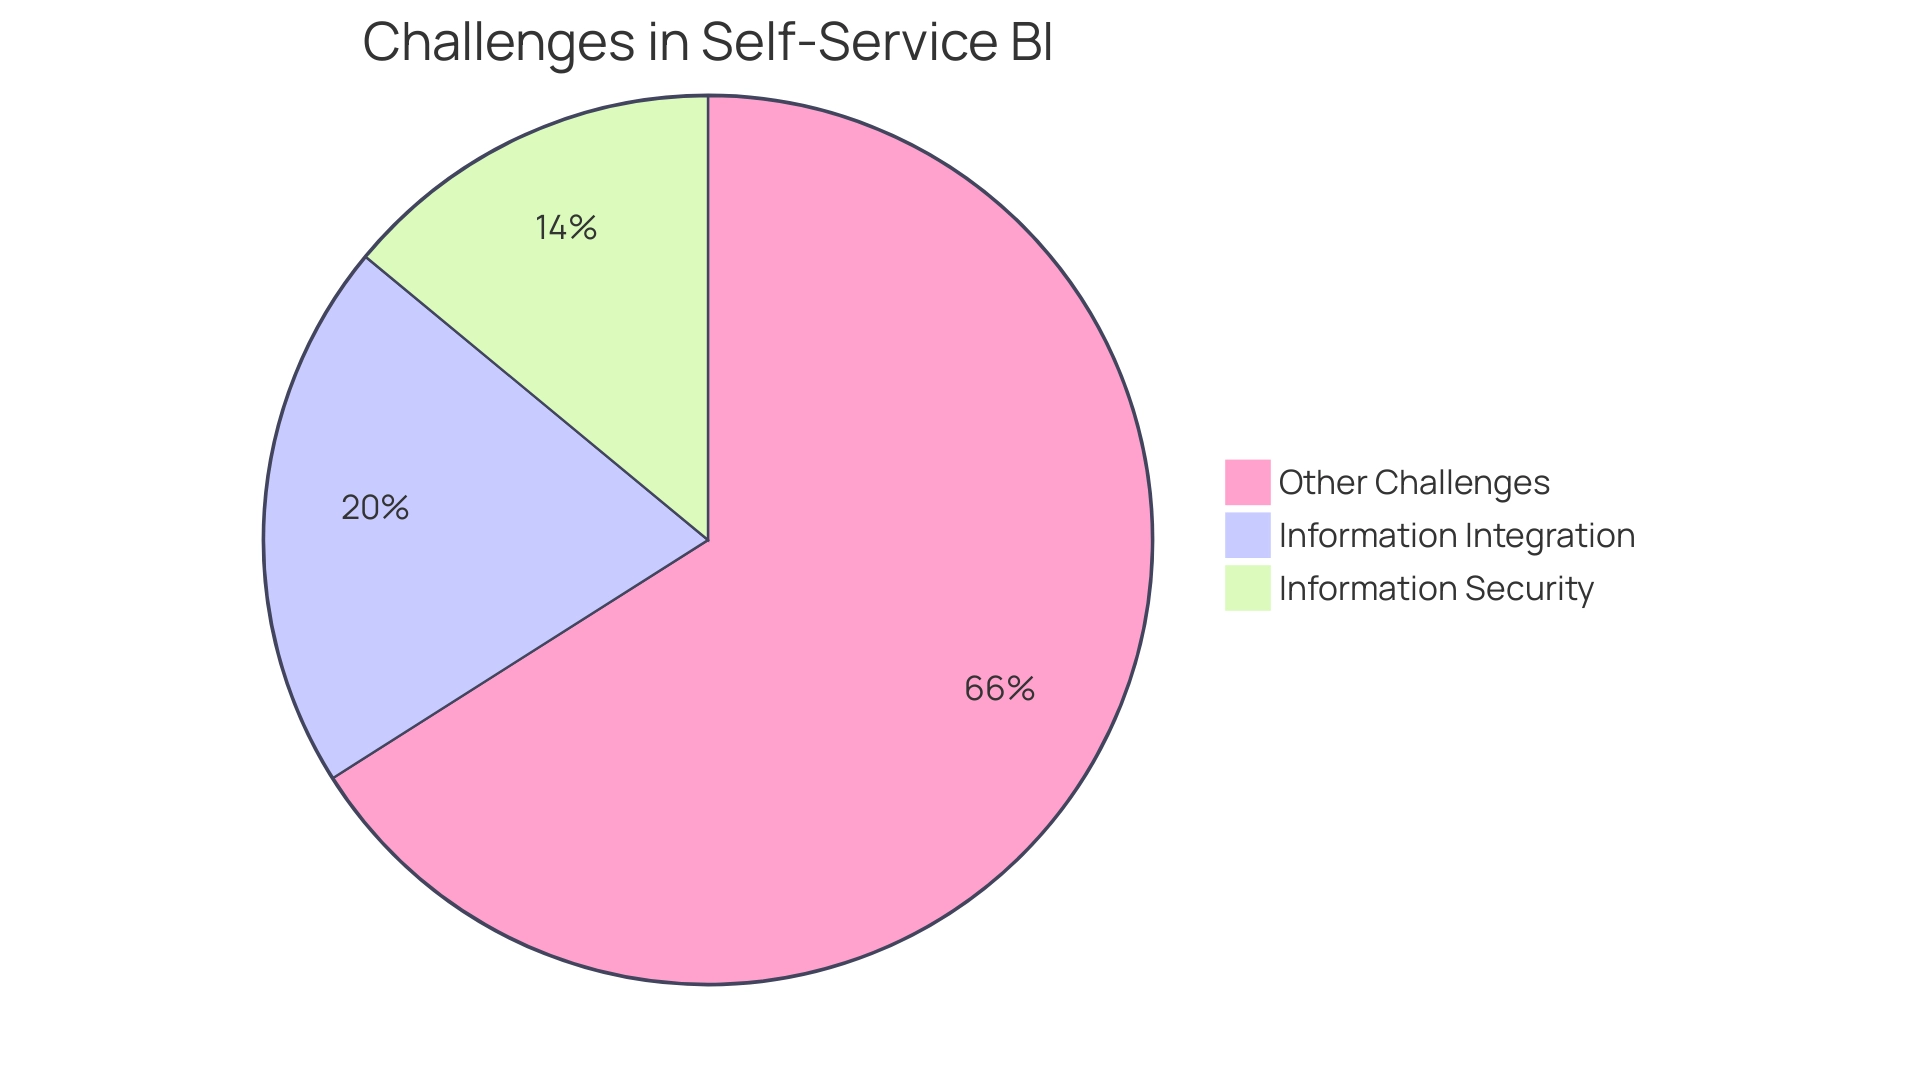
Notably, information integration and information security pose significant challenges in self-service business intelligence, accounting for 20% and 14% of the issues faced, respectively. These challenges can hinder effective information management and decision-making processes. The case study titled ‘Streamlining Operations with GUI Automation’ illustrates how a mid-sized company improved efficiency by automating tasks, enhancing software testing, and integrating legacy systems seamlessly, with outcomes including a 70% reduction in entry errors and an 80% improvement in workflow efficiency.
This case study exemplifies how addressing operational challenges through automation can lead to better data management and informed decision-making. With thorough records and practical solutions such as RPA and customized AI, individuals can significantly enhance their operational efficiency and decision-making processes, transforming challenges into opportunities for growth.
Exploring Resources and Support in Power BI Documentation
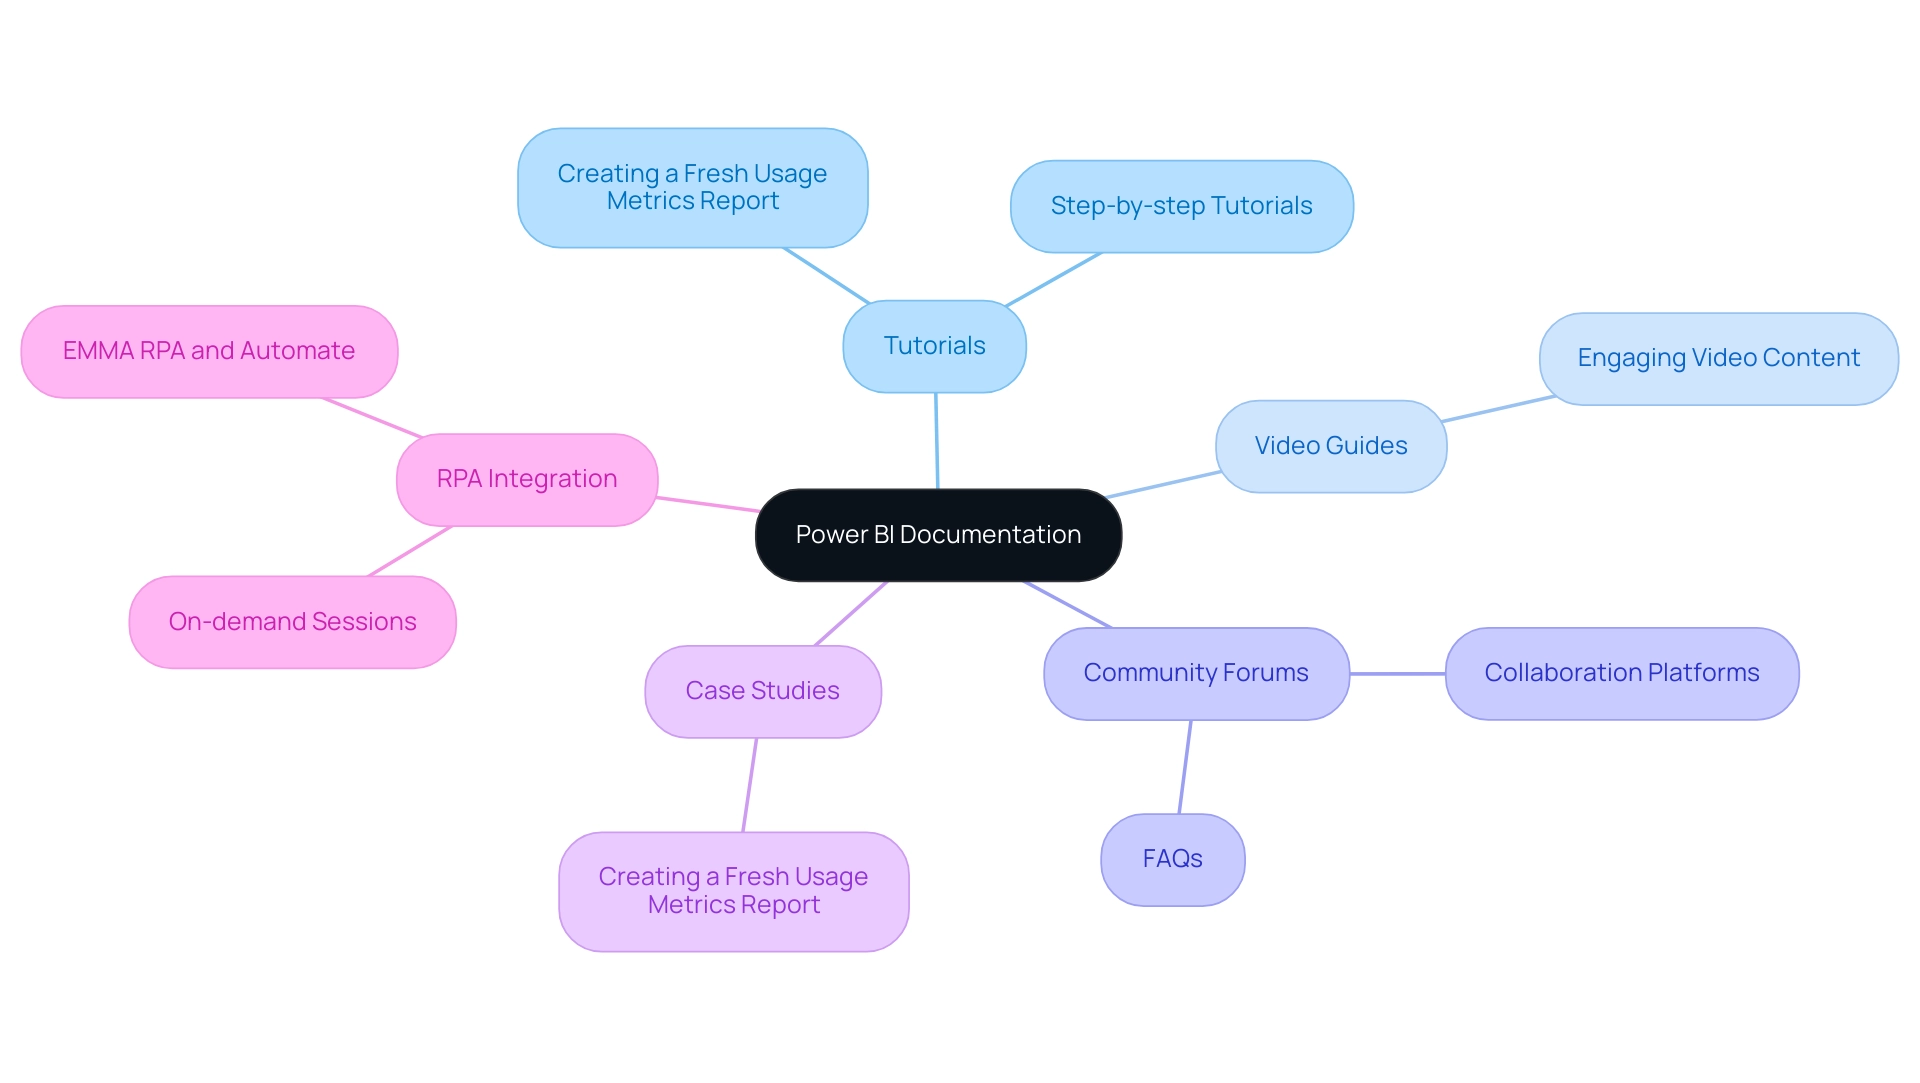
The Microsoft Power BI documentation serves as a vital resource hub, providing an extensive array of tools designed for individuals across all experience levels. It includes step-by-step tutorials and engaging video guides that enable individuals to handle the intricacies of information management effectively. However, individuals often face operational challenges such as time-consuming report creation and data inconsistencies, which can hinder their efficiency.
To address these issues, individuals are encouraged to view on-demand sessions with database experts and the Microsoft product team to learn about Fabric Databases, which significantly supports their learning journey. Community forums and FAQs offer platforms for collaboration and support, allowing participants to share insights and tackle challenges together. Additionally, the Microsoft Power BI documentation includes valuable case studies, such as ‘Creating a Fresh Usage Metrics Report,’ which illustrates how individuals can refresh their browser and create a new report to ensure access to updated metrics.
This practical example motivates individuals to innovate while creating their dashboards. Additionally, it is crucial to recognize that some clients may presently be unable to view or download the usage metrics semantic model from the BI service, emphasizing the necessity for individuals to remain aware of available resources. By actively engaging with these resources, users not only deepen their understanding of BI’s robust functionalities but also enhance their troubleshooting skills, ultimately promoting a more efficient information analysis process.
To further streamline workflows, integrating RPA solutions like EMMA RPA and Automate can significantly reduce the burden of repetitive tasks, allowing teams to focus on more strategic initiatives. Scott Sugar, Head of ProServeIT’s Ho Chi Minh City office, emphasizes the importance of these resources, noting that ‘with over 20 years of experience in the IT industry, understanding the effective use of documentation is crucial for success in data and analytics.’ This method guarantees that individuals can optimize the advantages of BI and RPA, fostering both personal development and operational efficiency.
Integrating Power BI with Other Tools and Platforms
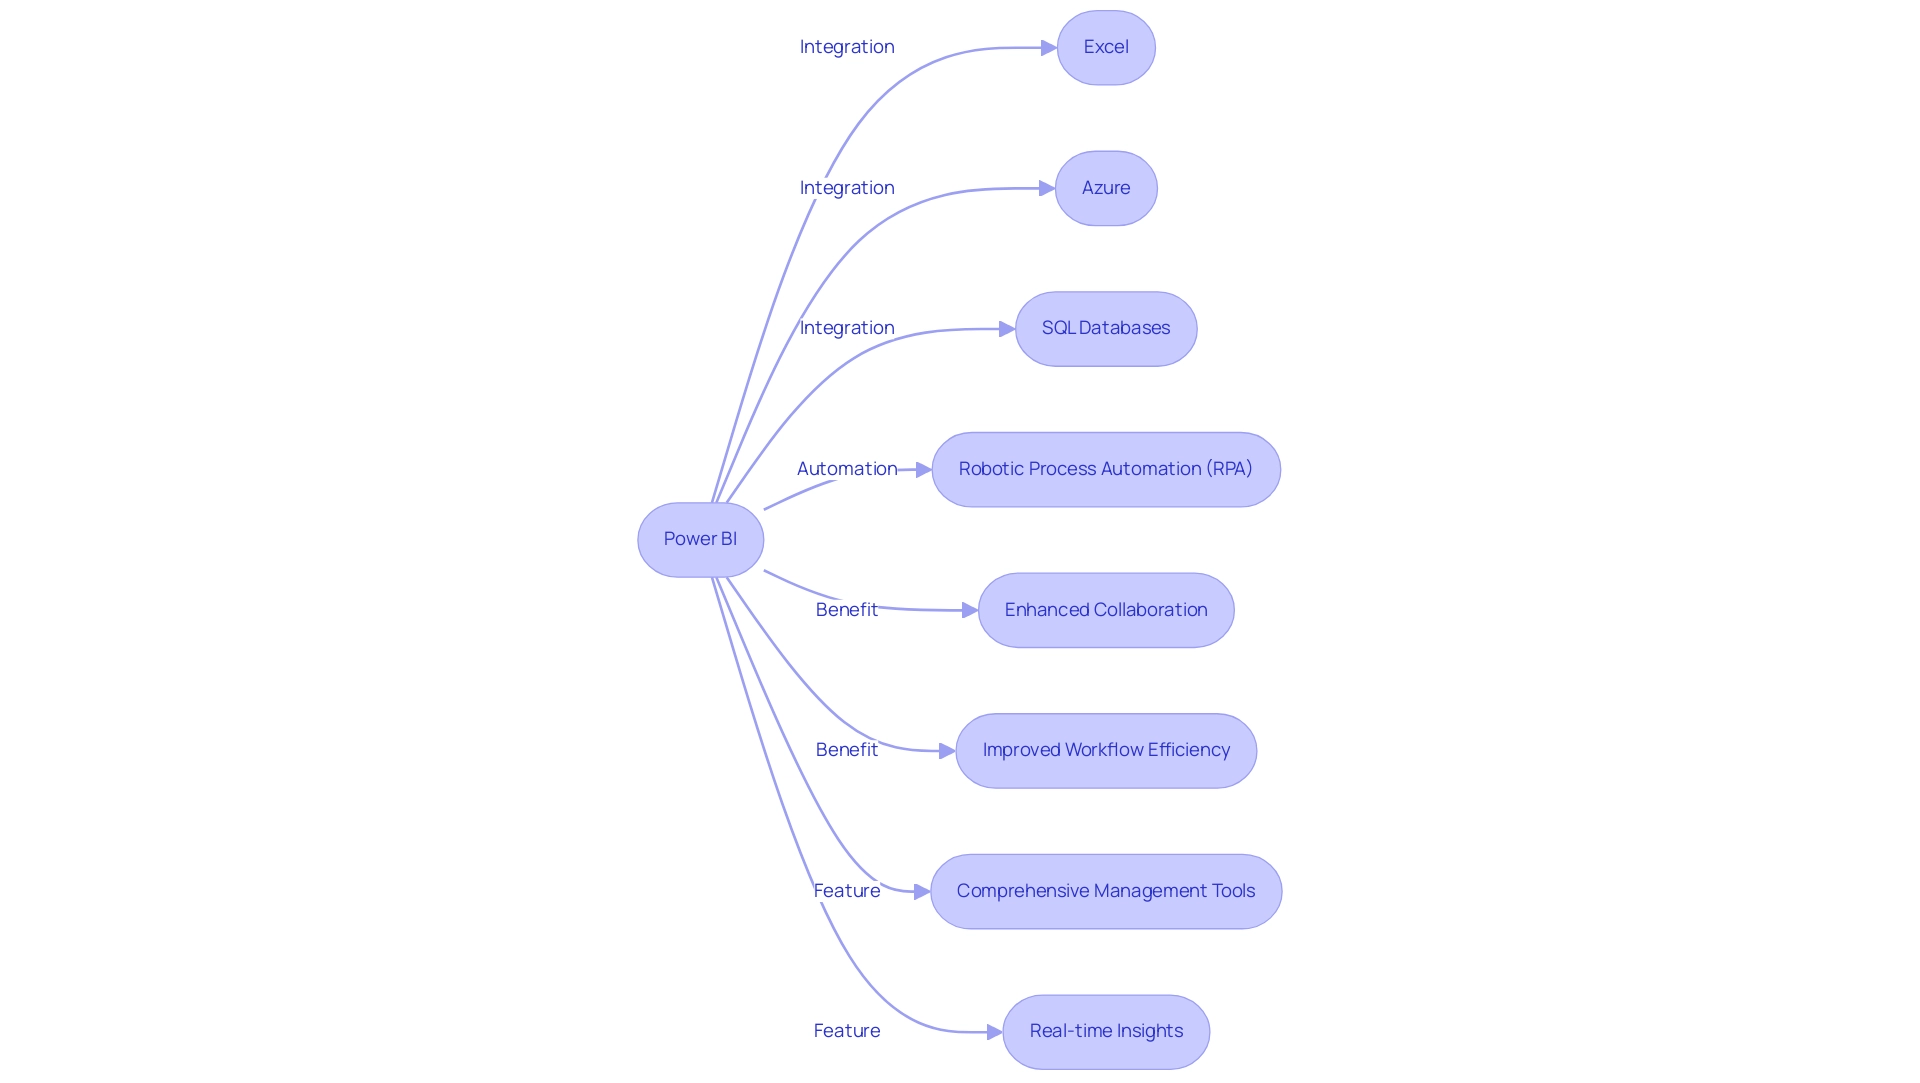
Power BI stands out for its exceptional ability to integrate seamlessly with a variety of tools and platforms, such as Excel, Azure, and SQL databases. With over 120 available connectors, users can effortlessly pull information from multiple sources, crafting a comprehensive view of their business metrics. This integration is not merely about information aggregation; it significantly enhances the analysis process, leading to more informed decision-making.
Furthermore, our BI services provide a 3-Day Sprint that enables the swift development of expertly crafted reports, ensuring effective reporting and information consistency. As emphasized by Amira Bed, a noted Most Valuable Professional, by combining BI with Office 365 and Teams, stakeholders can collaborate on insights in real-time, speeding up decision-making processes. Additionally, the General Management App provides comprehensive management tools and smart reviews, further empowering organizations to streamline operations.
The extensive assortment of connectors and custom visuals in BI not only enriches information integration but also enhances workflow efficiency and information protection. A notable example of Power BI’s flexibility is illustrated in the case study titled ‘Unification of BI Tools through Open API,’ which demonstrates how Power BI’s open API facilitates the unification of various BI tools into a single interface, fostering a collaborative environment tailored to specific workflows. The Microsoft Power BI documentation for these integrations is comprehensive, providing detailed instructions to ensure users can efficiently link their sources.
By mastering these integration capabilities and utilizing Robotic Process Automation (RPA) to automate manual workflows, organizations can significantly enhance their analysis and operational efficiency. RPA enhances BI by streamlining repetitive tasks, allowing teams to focus on strategic initiatives. Furthermore, our actions portfolio offers a range of solutions to enhance your BI experience, and we invite you to book a free consultation to explore how we can support your journey towards data-driven insights that fuel business growth.
Practical Applications of Power BI Documentation in Data Analysis
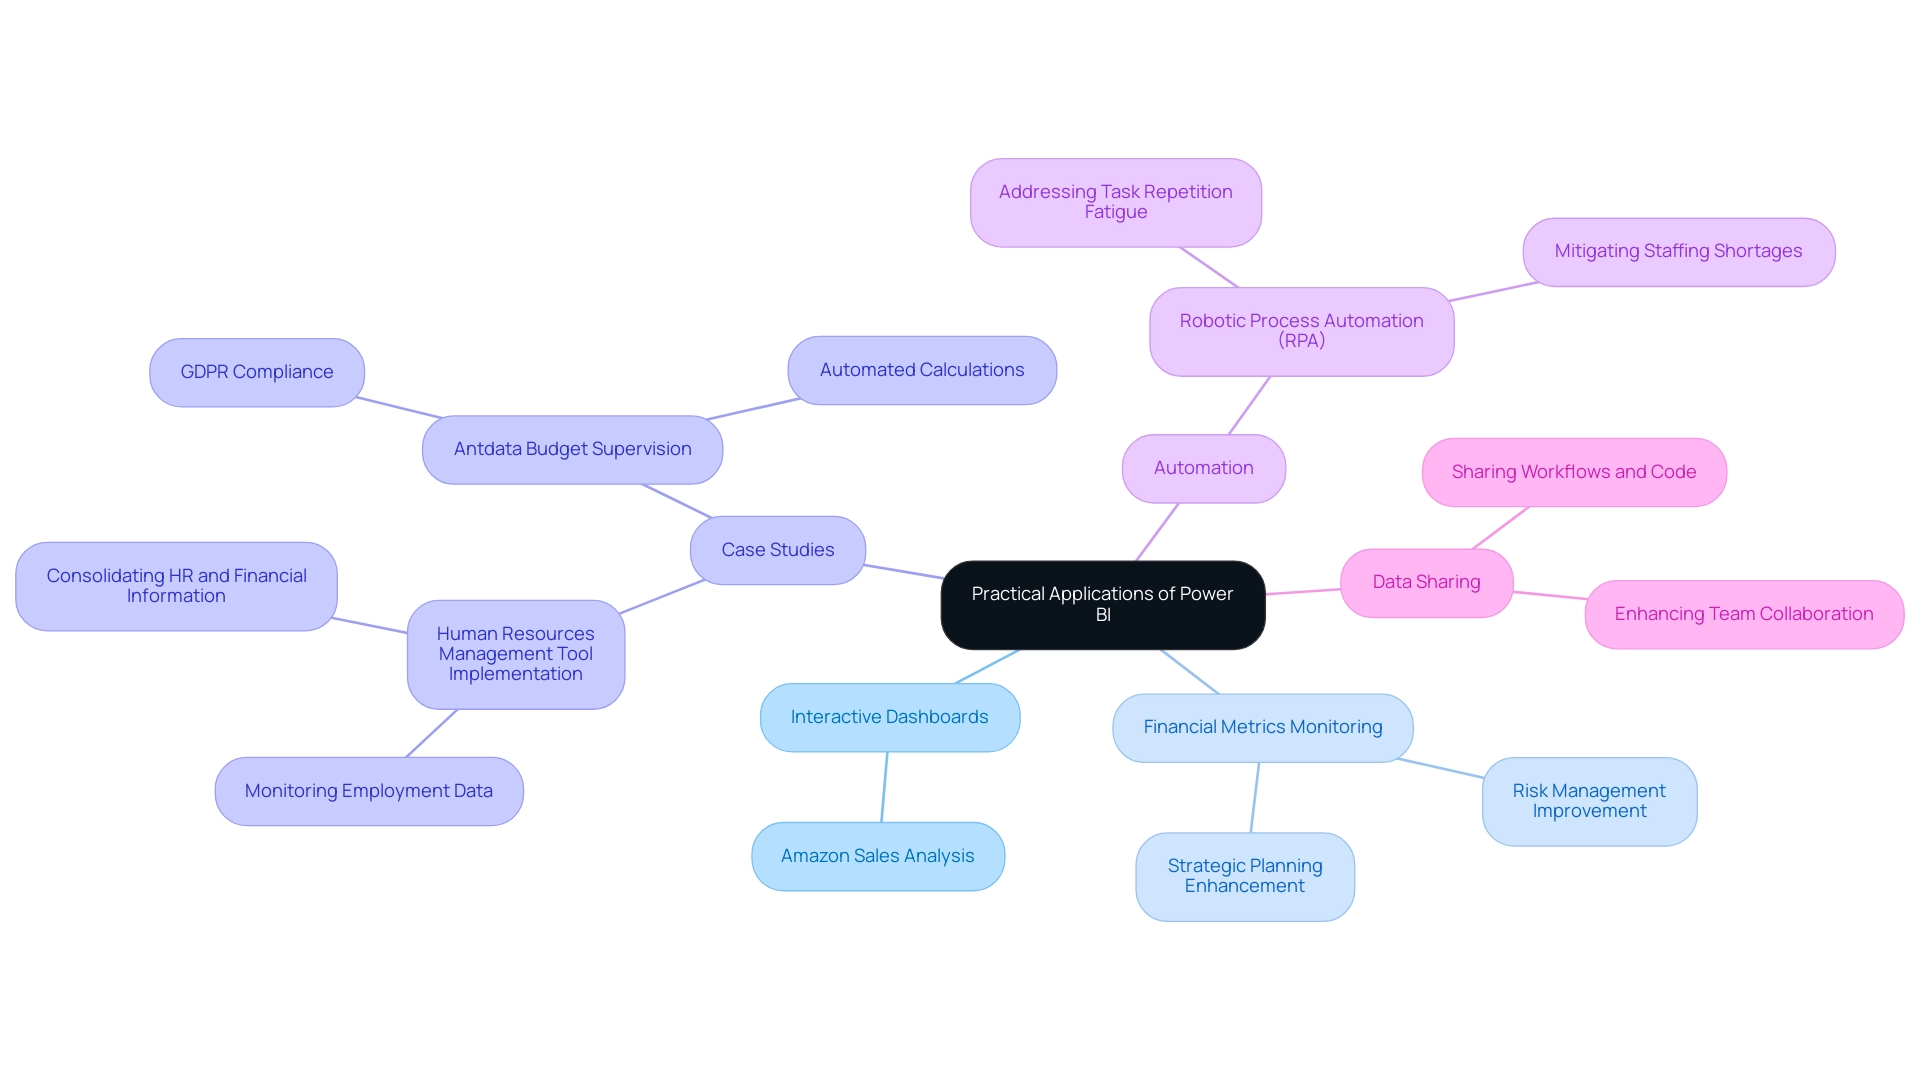
The Microsoft Power BI documentation serves as a treasure trove of practical applications designed to enhance information analysis efforts and drive operational efficiency. Users can navigate through detailed guides to create interactive dashboards that offer real-time visualization of key performance indicators (KPIs). For instance, Amazon utilized BI to visualize and analyze sales and customer insights, overcoming significant challenges in data management such as time-consuming report creation and data inconsistencies.
Additionally, a financial institution adopted BI to monitor key financial metrics, which improved risk management and enhanced strategic planning. Furthermore, the Microsoft Power BI documentation includes case studies that illustrate how organizations have effectively adopted BI to tackle specific business challenges, such as monitoring sales performance and optimizing marketing campaigns. A notable example is Antdata, which implemented a Business Intelligence reporting tool using BI to enhance budget supervision and automate calculations, eliminating manual processes and ensuring compliance with GDPR.
This automation significantly impacted the organization by providing an up-to-date view of its resources. By exploring these real-world applications, individuals can uncover best practices and innovative approaches that empower them to transform their analysis strategies. Moreover, integrating Robotic Process Automation (RPA) solutions can further enhance the efficiency of these processes, addressing challenges like task repetition fatigue and staffing shortages.
Effective sharing of data analysis workflows and code is crucial for maximizing the capabilities of BI, enabling teams to collaborate efficiently and enhance their analytical processes.
Keeping Up with Updates: The Importance of Current Power BI Documentation
Maintaining up-to-date Power BI documentation is essential for individuals looking to optimize their experience with the platform and overcome technology implementation challenges. Microsoft consistently rolls out updates that introduce new features, enhancements, and best practices, all meticulously documented for reference. By staying informed about these updates, individuals can leverage the latest tools and functionalities, significantly enhancing their data analysis capabilities and driving operational efficiency.
Effective records not only highlight new features but also provide step-by-step guidance on how to implement them, ensuring organizations can navigate the complexities of a data-driven landscape competently. As phuang, a frequent visitor, expressed, ‘Thanks a lot! It works perfectly!
Your file really helps me; I had spent many hours in this visual and felt so lost.’ This sentiment highlights the importance of accessible resources in streamlining user engagement and driving efficiency. Furthermore, processing data for usage metrics reports requires that content is viewed from the workspace at least once.
The case study titled ‘Cross-Checking Referential Integrity‘ illustrates how verifying the Assume Referential Integrity setting in relationships can optimize query performance in DirectQuery sources, reinforcing the significance of keeping BI documentation updated to unlock actionable insights and enhance decision-making. Additionally, integrating Robotic Process Automation (RPA) can further streamline workflows for individuals interacting with Power BI, reducing the time spent on repetitive tasks. Tailored AI solutions can assist in navigating the complexities of data management, ensuring that users can focus on deriving insights rather than getting bogged down by the technical details.
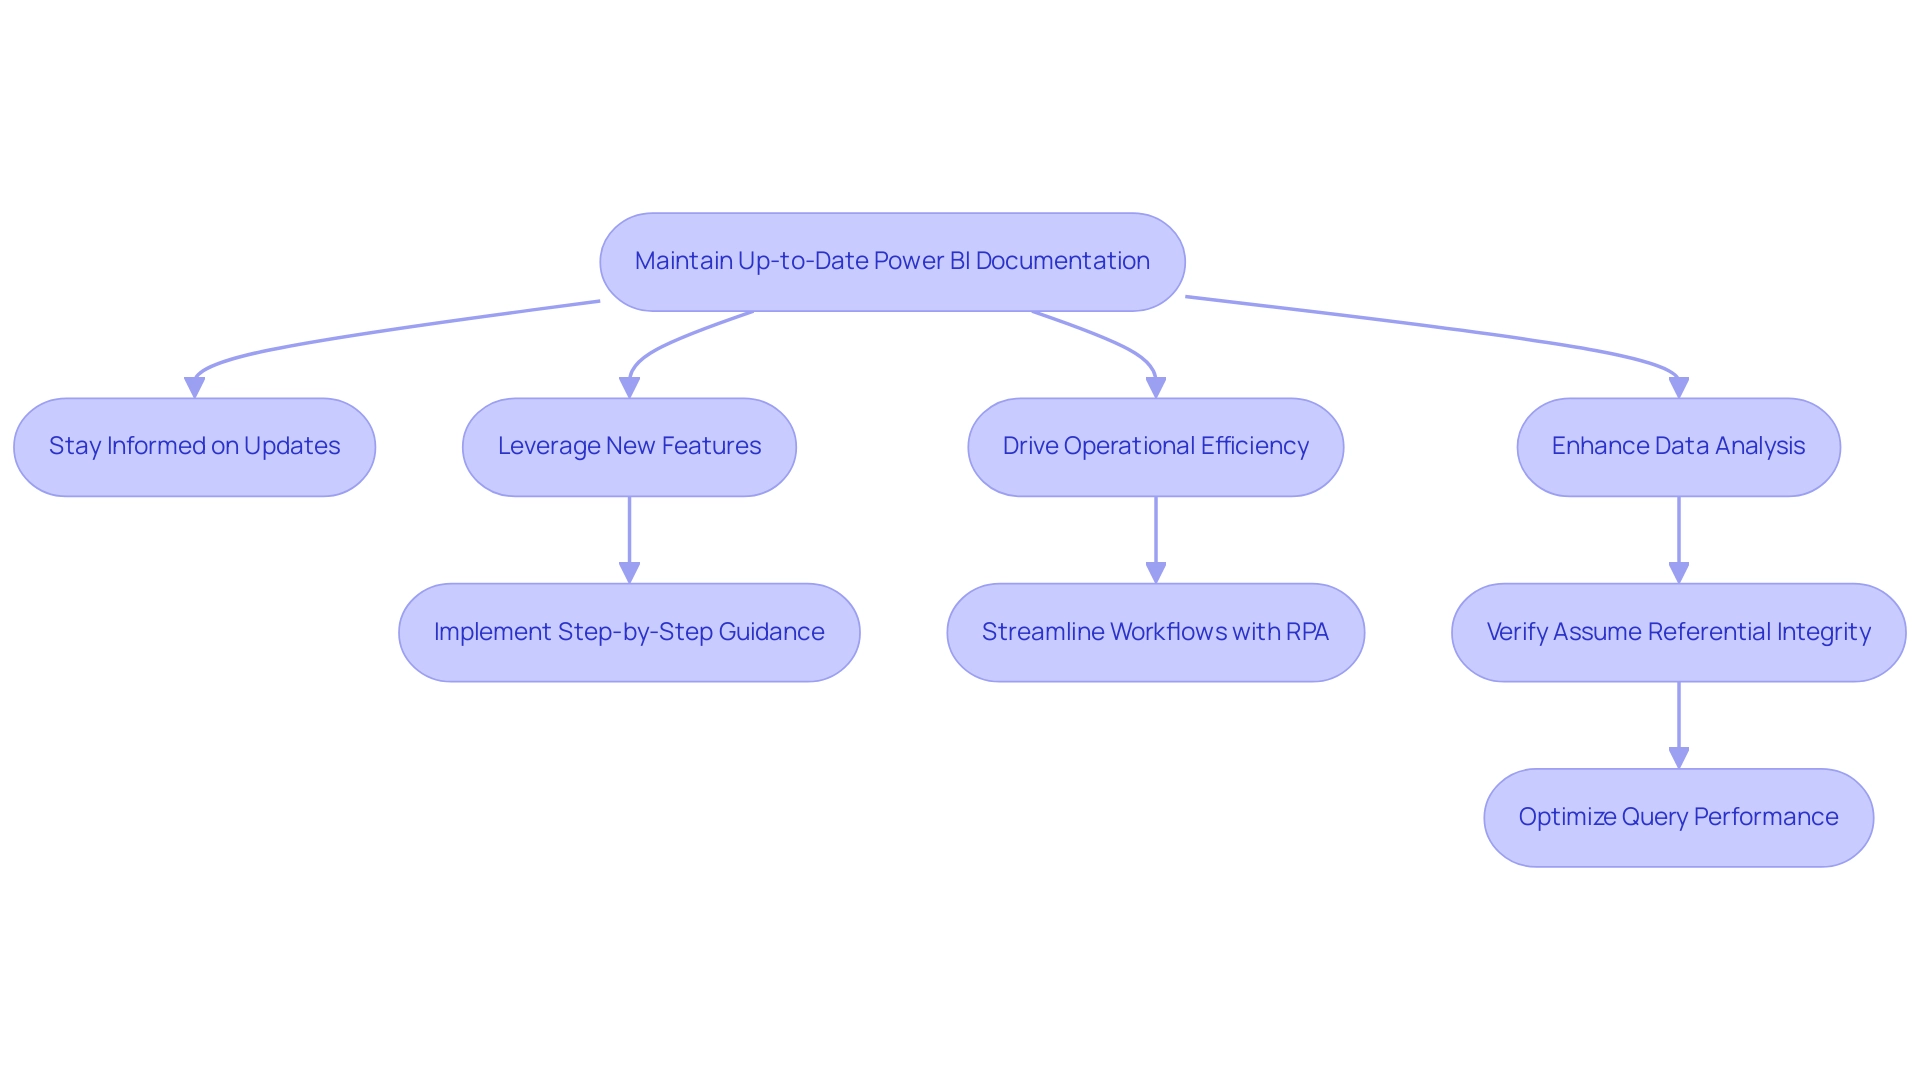
Conclusion
Harnessing the power of Microsoft Power BI documentation is crucial for organizations striving to enhance their data analysis and operational efficiency. This comprehensive resource equips users with the knowledge to navigate complexities and overcome common challenges, such as data integration and security issues. By engaging with user manuals, best practices, and troubleshooting tips, individuals can maximize their use of Power BI, ensuring that data becomes a strategic asset rather than a hurdle.
The integration of Power BI with various tools and platforms further amplifies its capabilities, allowing users to create a cohesive view of their business metrics. The documented case studies provide tangible examples of how organizations have successfully implemented Power BI to streamline operations and improve decision-making processes. Additionally, leveraging solutions like Robotic Process Automation (RPA) can significantly reduce the burden of repetitive tasks, freeing teams to focus on strategic initiatives that drive growth.
Staying current with updates in Power BI documentation is equally essential. Continuous learning through the latest features and enhancements ensures that organizations remain competitive in a data-driven landscape. By actively utilizing these resources, users can foster a culture of innovation and efficiency, transforming challenges into opportunities for success. Ultimately, embracing the full potential of Power BI documentation empowers organizations to elevate their data analysis strategies and drive impactful business outcomes.
Introduction
In the ever-evolving landscape of data analytics, organizations are continually seeking innovative solutions to enhance their reporting capabilities and drive informed decision-making. Power BI Premium emerges as a powerful ally, offering a suite of advanced features designed to tackle common challenges such as time-consuming report creation and data inconsistencies. From improved performance and larger data capacity to integrated AI functionalities, Power BI Premium equips businesses with the tools necessary to navigate complex data environments with confidence.
As organizations embark on the journey to transition to this robust platform, understanding the key features, licensing options, and best practices becomes essential. This article delves into the transformative impact of Power BI Premium, providing a comprehensive guide to maximizing its potential and ensuring a seamless transition that empowers teams to harness actionable insights for strategic growth.
Understanding Power BI Premium: Key Features and Benefits
The premium capacity Power BI offers a robust suite of advanced features that significantly improve analytics capabilities for organizations, addressing common challenges encountered in reporting. The key benefits include:
- Enhanced Performance: By leveraging dedicated cloud resources, users can experience notably faster data refresh rates, leading to improved report performance that meets the demands of dynamic business environments.
- Premium Capacity Power BI: This edition allows for managing larger datasets, facilitating comprehensive analysis without the limitations often encountered in standard versions.
- Advanced AI Features: Integrated AI functionalities, such as Small Language Models and GenAI Workshops, empower users to extract meaningful insights from their information, improving information quality and training capabilities for informed decision-making processes using premium capacity Power BI.
- 3-Day Power BI Sprint: This feature enables organizations to quickly create professionally designed reports, streamlining the reporting process and allowing teams to focus on leveraging insights rather than constructing reports.
- General Management App: This comprehensive management tool aids in smart reviews and actions portfolio, ensuring that organizations can effectively manage their reporting processes.
- Paginated Reports: The ability to create pixel-perfect reports ensures that organizations can produce high-quality outputs tailored for printing and sharing, enhancing the communication of insights.
- Dataflows: These enable streamlined information preparation processes, leading to improved management and consistency across reporting and analytics workflows.
It is important to note that while calculated columns can increase model size and memory consumption, measures can impact query performance but offer flexibility for dynamic reporting. As Amitabh Saxena mentioned on October 23, 2024, “Business Intelligence upgrades enable organizations to traverse intricate information environments with ease and accuracy.”
Additionally, the VertiPaq Engine serves as a powerful example of how premium capacity Power BI’s features contribute to efficiency and performance. As an in-memory columnar database, it processes DAX expressions and manages operations such as aggregations and filtering, significantly reducing memory usage and enhancing query performance. Getting acquainted with these features is essential, as they signify a significant advancement from standard BI capabilities to premium capacity Power BI.
Organizations that embrace BI can anticipate enhancing their information strategies, thus gaining substantial advantages in their analytics efforts, while addressing the difficulties of labor-intensive report generation and ensuring practical guidance in their insights. This visual metaphor of a human figure contemplating a question alongside a robot symbolizing solutions perfectly illustrates the collaborative potential of AI and human intelligence in enhancing data-driven decision-making.
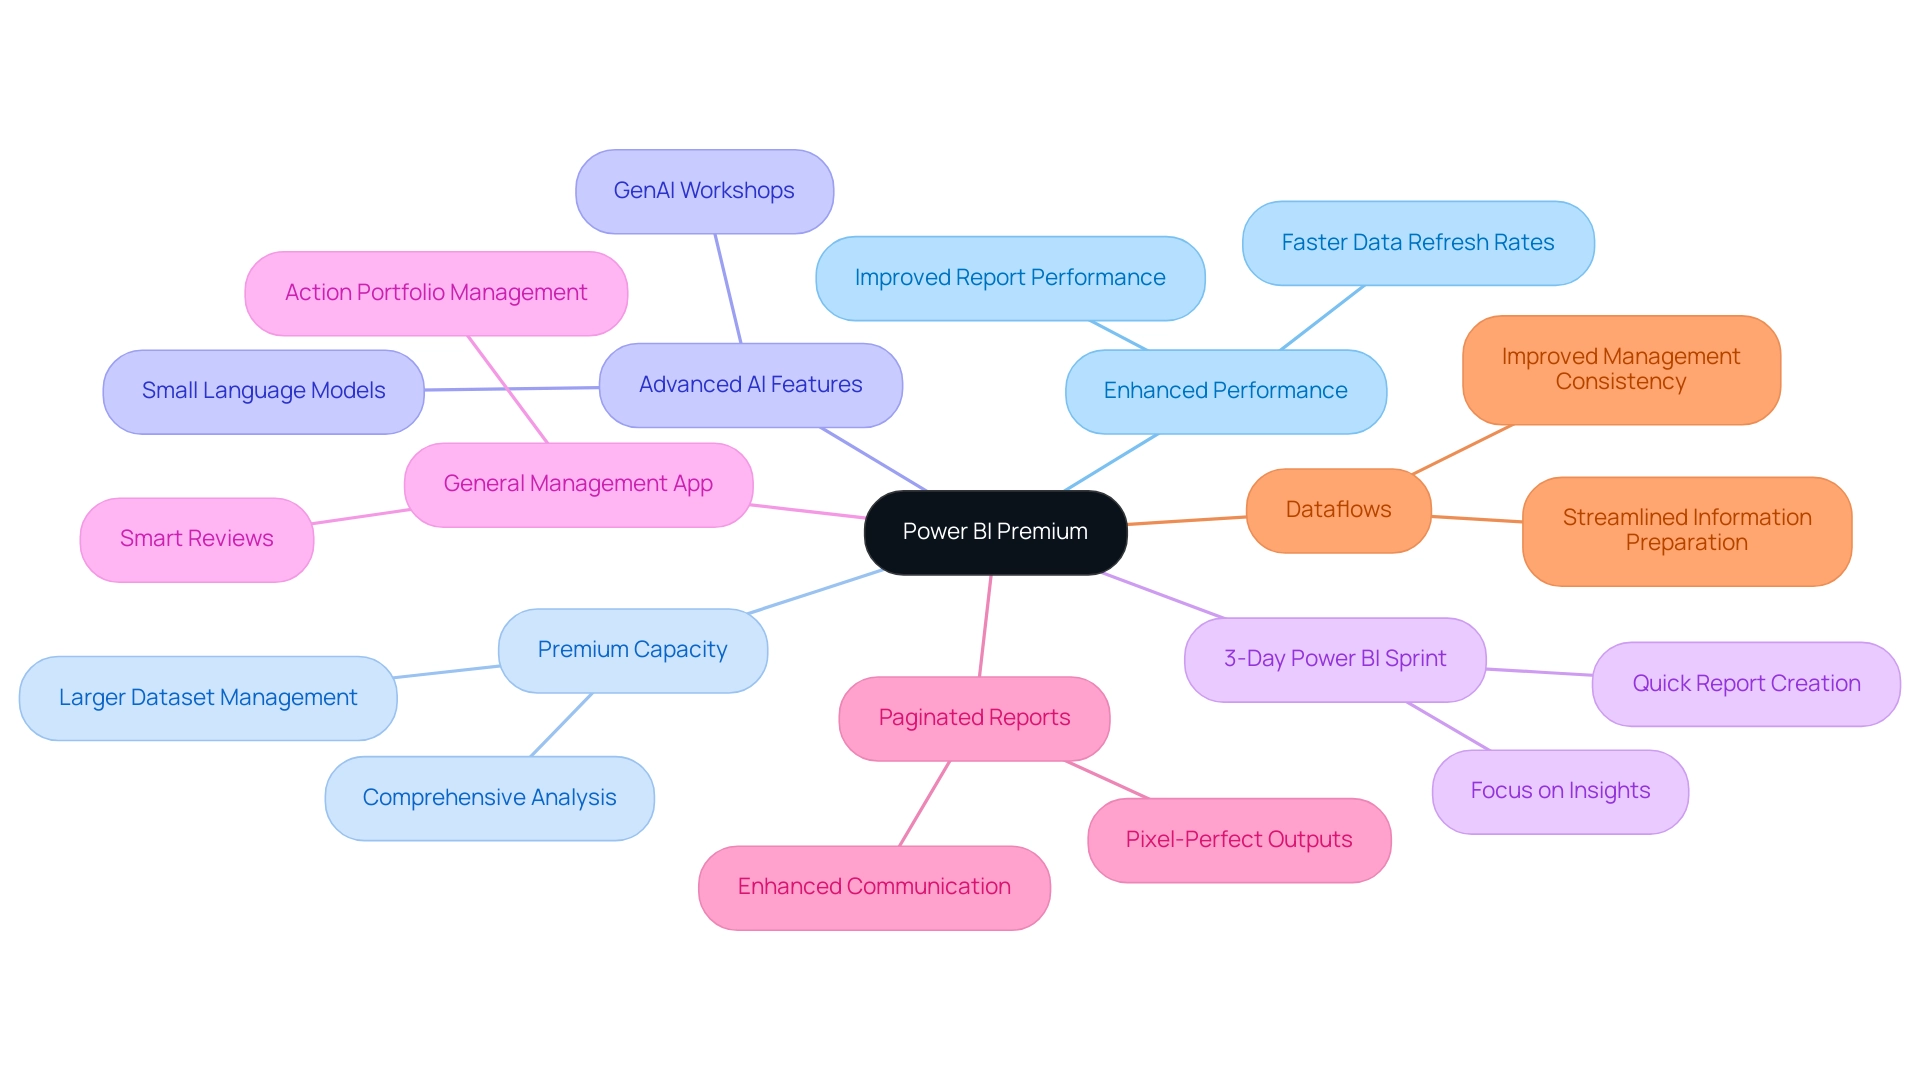
Step-by-Step Guide to Transitioning to Power BI Premium Capacity
Shifting to BI Enhanced capacity can significantly improve your organization’s analytical abilities, especially in tackling typical challenges encountered in utilizing insights from BI dashboards, such as time-consuming report generation and data discrepancies. Here’s a step-by-step approach to ensure a seamless migration:
- Assess Your Current Environment: Begin by evaluating your existing BI setup. This assessment is crucial to identify whether the advanced features of the higher-tier option are necessary for your operations.
- Choose the Right Licensing Option: Review your organization’s specific needs. Choosing the suitable BI plan is crucial, particularly with the impending end of BI SKUs after January 1, 2025. As industry expert Charlie Phipps-Bennett states, “Business Intelligence SKUs will no longer be available after January 1, 2025,” emphasizing the urgency to make this decision promptly.
- Create a High-Quality Workspace: In the Power BI service, establish a new workspace and assign it to enhanced capacity. This workspace will be vital for utilizing the full advantages of enhanced features, including thorough management and smooth information integration.
- Migrate Reports and Datasets: Carefully transfer your existing reports and collections to the new enhanced workspace, ensuring compatibility of all sources. This step is critical to maintain continuity in reporting and to avoid inconsistencies that can lead to confusion and mistrust.
- Set Up Dataflows: Implement workflows to enhance preparation processes and improve quality within the workspace. This practice streamlines operations and optimizes performance, addressing task repetition fatigue effectively.
- Test and Validate: Before complete deployment, perform comprehensive testing of the workspace’s performance and features. This validation will help uncover any potential issues, ensuring a smooth transition. Consider reviewing utilization data to understand if requests were throttled due to capacity issues, which may necessitate autoscaling in the future.
- Train Your Team: Invest in training for your team on the new features available in BI, including predictive analytics and Microsoft Copilot integration. Empowering your staff with knowledge is key to maximizing the benefits of this upgrade.
By adhering to these steps, your organization can effectively transition to premium capacity Power BI, which will unlock enhanced performance and analytics capabilities while preparing for future improvements. Moreover, recent information indicates that your metrics report dataset can retain valuable insights for 30 to 45 days, aiding in monitoring the transition’s success. This guide is part of a comprehensive resource published on November 29, 2024, ensuring you have the latest information at your disposal.
Additionally, integrating RPA solutions can further alleviate the burden of repetitive tasks, enhancing overall operational efficiency and allowing your team to focus on deriving actionable insights from the data.
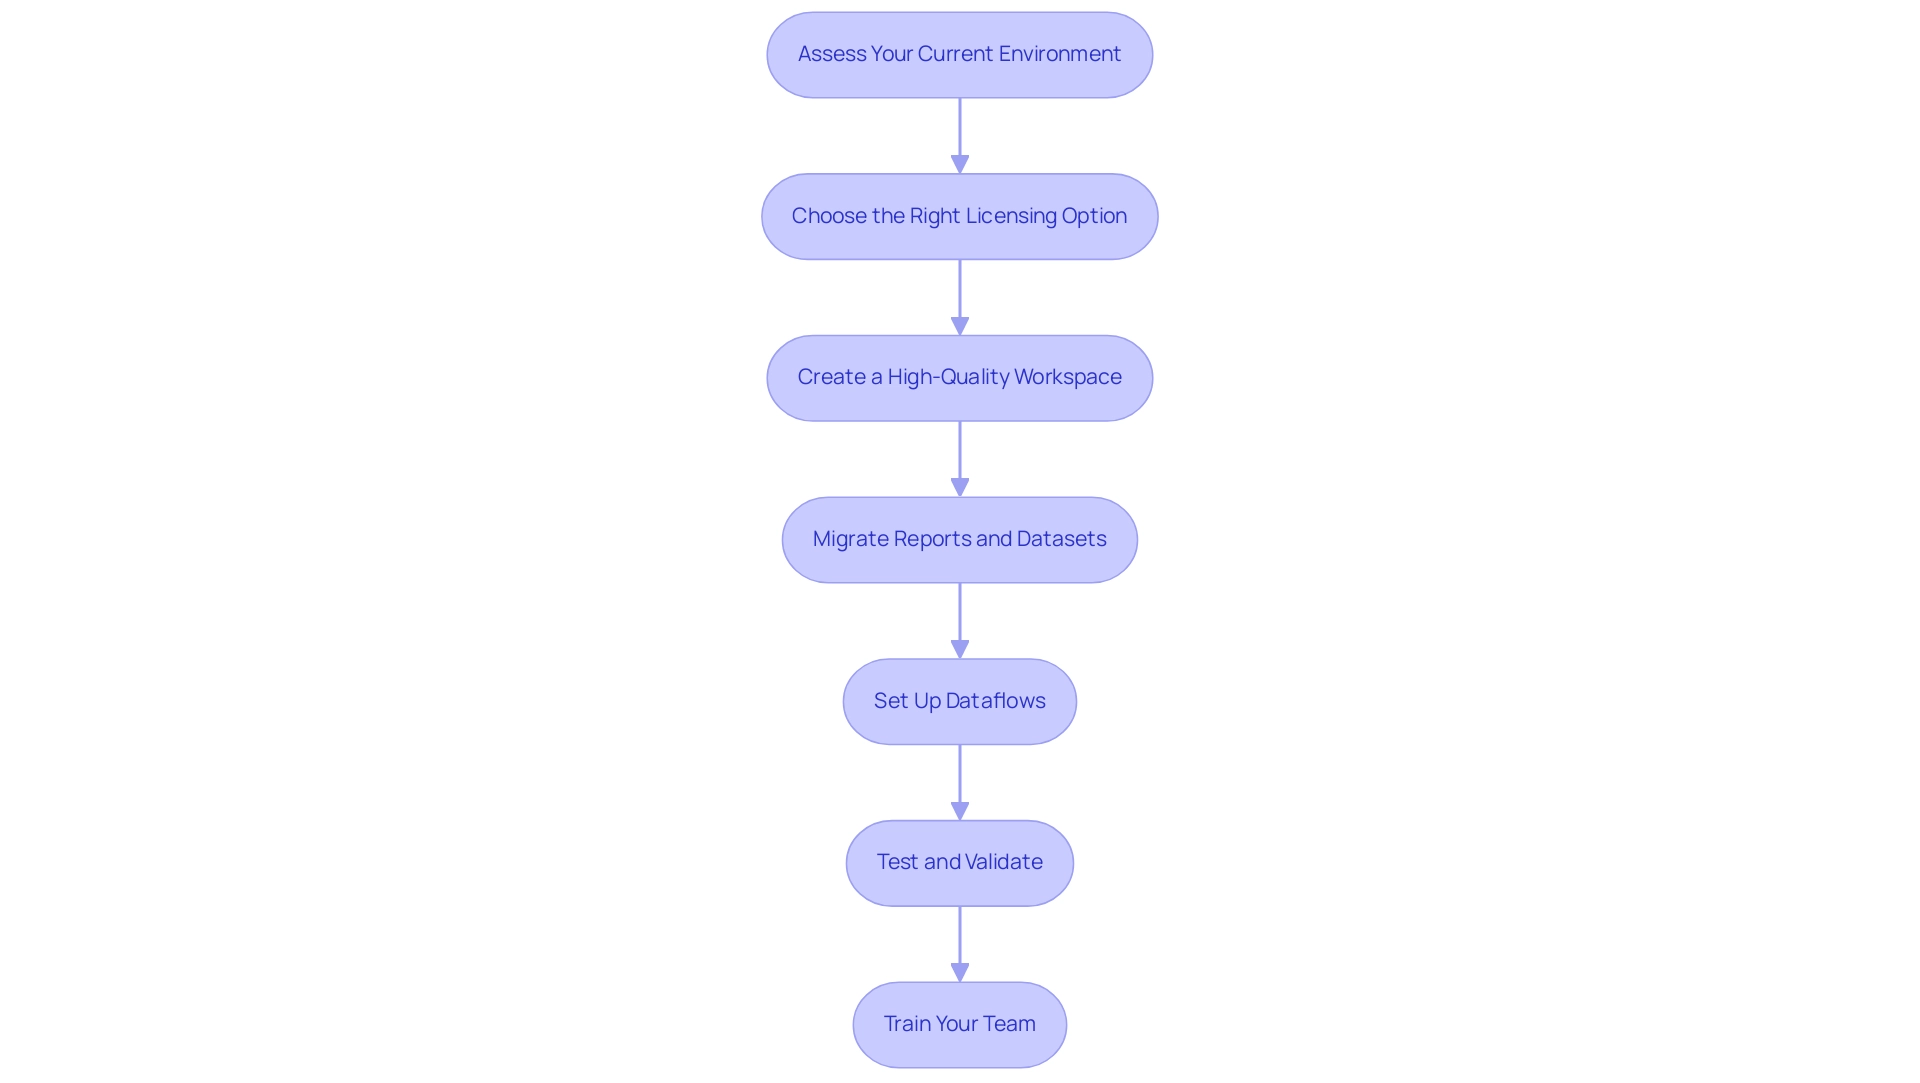
Navigating Power BI Licensing: Choosing the Right Plan for Your Needs
Power BI presents a variety of licensing options tailored to meet the needs of different users and organizations:
- Power BI Pro: This plan is designed for individual users or small teams who require essential collaboration and sharing capabilities.
- BI Enhanced Per Individual (EPI): For individuals requiring advanced features and functionalities on a per-individual basis, the EPI option is ideal and costs 18.70 € per individual each month.
- Premium Capacity Power BI: This option is most suitable for larger organizations that require dedicated resources and superior performance.
When selecting the right plan, consider several critical factors that can directly influence your operational efficiency and data-driven insights:
- The number of users requiring access to Power BI tools.
- The size and complexity of your datasets, as these can impact performance.
- The specific features your organization depends on to drive business objectives.
Organizations often face challenges with BI, such as time-consuming report creation, data inconsistencies, and difficulties in extracting actionable insights. These issues can hinder effective decision-making and limit the potential of Business Intelligence. Expert insights can further inform your decision.
As Julien Guillot from Schneider Electric states, “TTMS has really helped us through the years in the field of configuration and management of protection relays with the use of various technologies.” This underscores the importance of choosing a plan that aligns with your operational needs and leverages the full potential of Business Intelligence.
Additionally, a recent case study titled “Pages Included in the Improved Usage Metrics Report” showcases how the enhanced usage metrics report features several pages, including report usage, report performance, and an FAQ section. These pages provide comprehensive insights into report views, performance metrics, and answers to common questions, enhancing user understanding and engagement.
It’s also important to be aware of current challenges; customers may face issues viewing or downloading the usage metrics semantic model from the BI service. By thoroughly evaluating these elements, your organization positions itself to select the most fitting licensing option for premium capacity Power BI, ensuring that your BI experience is both effective and efficient. Integrating RPA solutions can also streamline processes, reduce repetitive tasks, and enhance overall operational efficiency, aligning with your broader organizational goals.
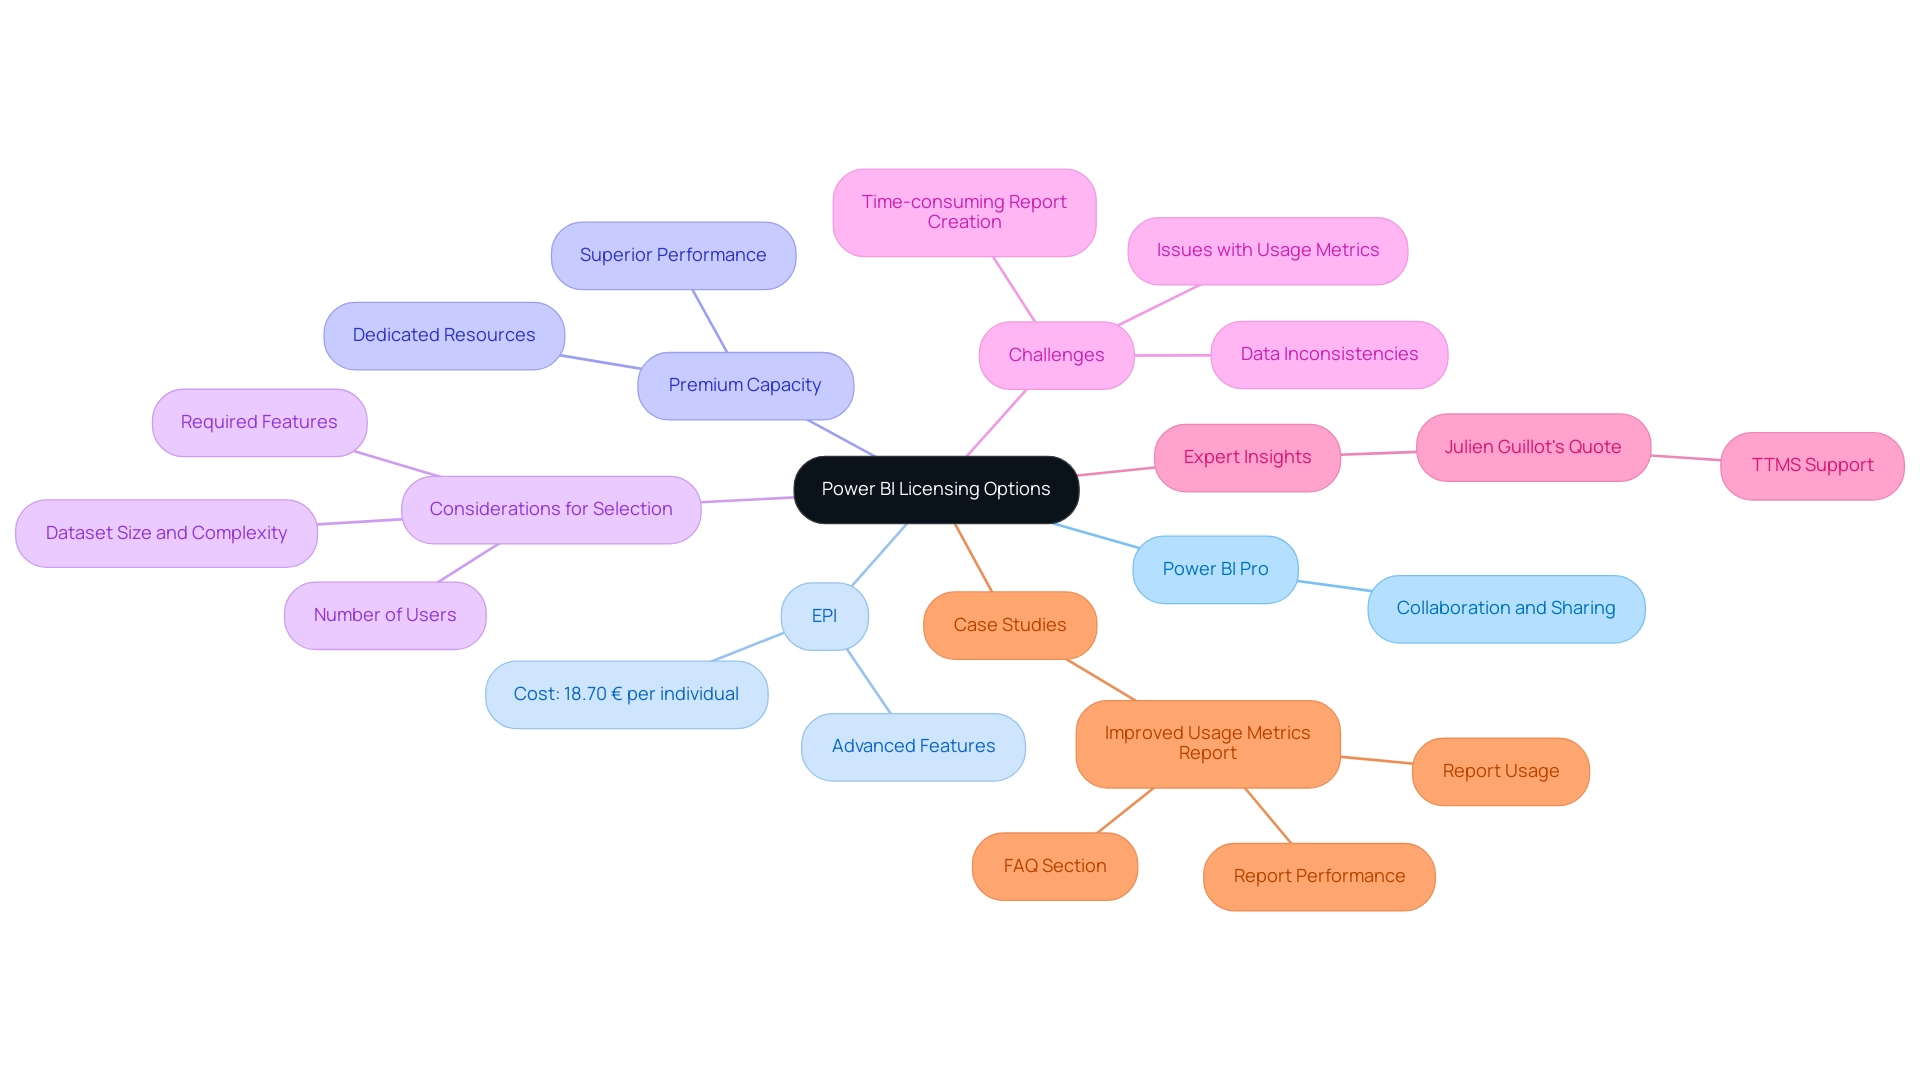
The Impact of Microsoft Fabric on Power BI Premium Users
Microsoft Fabric serves as a transformative platform that greatly enhances the functionality of premium capacity Power BI clients, especially in the areas of reporting and operational efficiency. Its key impacts are noteworthy:
-
Improved Data Integration: With Microsoft Fabric, users experience seamless integration of diverse data sources, simplifying data preparation and enhancing overall efficiency. This improvement has been quantified, with business analysts reporting a 20% increase in access and output, contributing to potential savings of $4.8 million.
-
Enhanced Analytics: The platform enables individuals to utilize advanced analytics features that function seamlessly across the Microsoft ecosystem. This capability enhances analysis and drives informed decision-making, aligning with the need for actionable insights that lead to business growth.
-
Unified Experience: Microsoft Fabric offers an integrated experience across multiple Microsoft tools, enabling smoother management of workflows. This integration is crucial, especially given that 60% of organizations report being ill-prepared for AI-driven cyber threats. As Arish Siddiqui from Dynamics Square observes, “Reskilling and upskilling programs can assist individuals in adjusting to evolving job demands,” emphasizing the need for organizations to improve their information management strategies and utilize solutions like RPA to reduce risks.
To further improve information reporting and operational efficiency, individuals can utilize the 3-Day BI Sprint, which enables the rapid creation of professionally designed reports, and the General Management App that leverages premium capacity Power BI for comprehensive management and intelligent reviews. Additionally, incorporating Robotic Process Automation (RPA) can streamline workflows, reducing repetitive tasks and freeing up teams for more strategic work.
As BI users explore these enhancements, they can derive insights from case studies like ServiceNow Bonding, which highlights the importance of efficient information exchange in today’s fast-paced business environment. Users are encouraged to explore the frequently asked questions section regarding BI and Microsoft Fabric to maximize their platform usage and adapt effectively to upcoming features, ensuring they remain at the forefront of integration advancements. Furthermore, engaging in GenAI Workshops and utilizing Small Language Models can further enhance the effectiveness of AI solutions in driving operational efficiency.
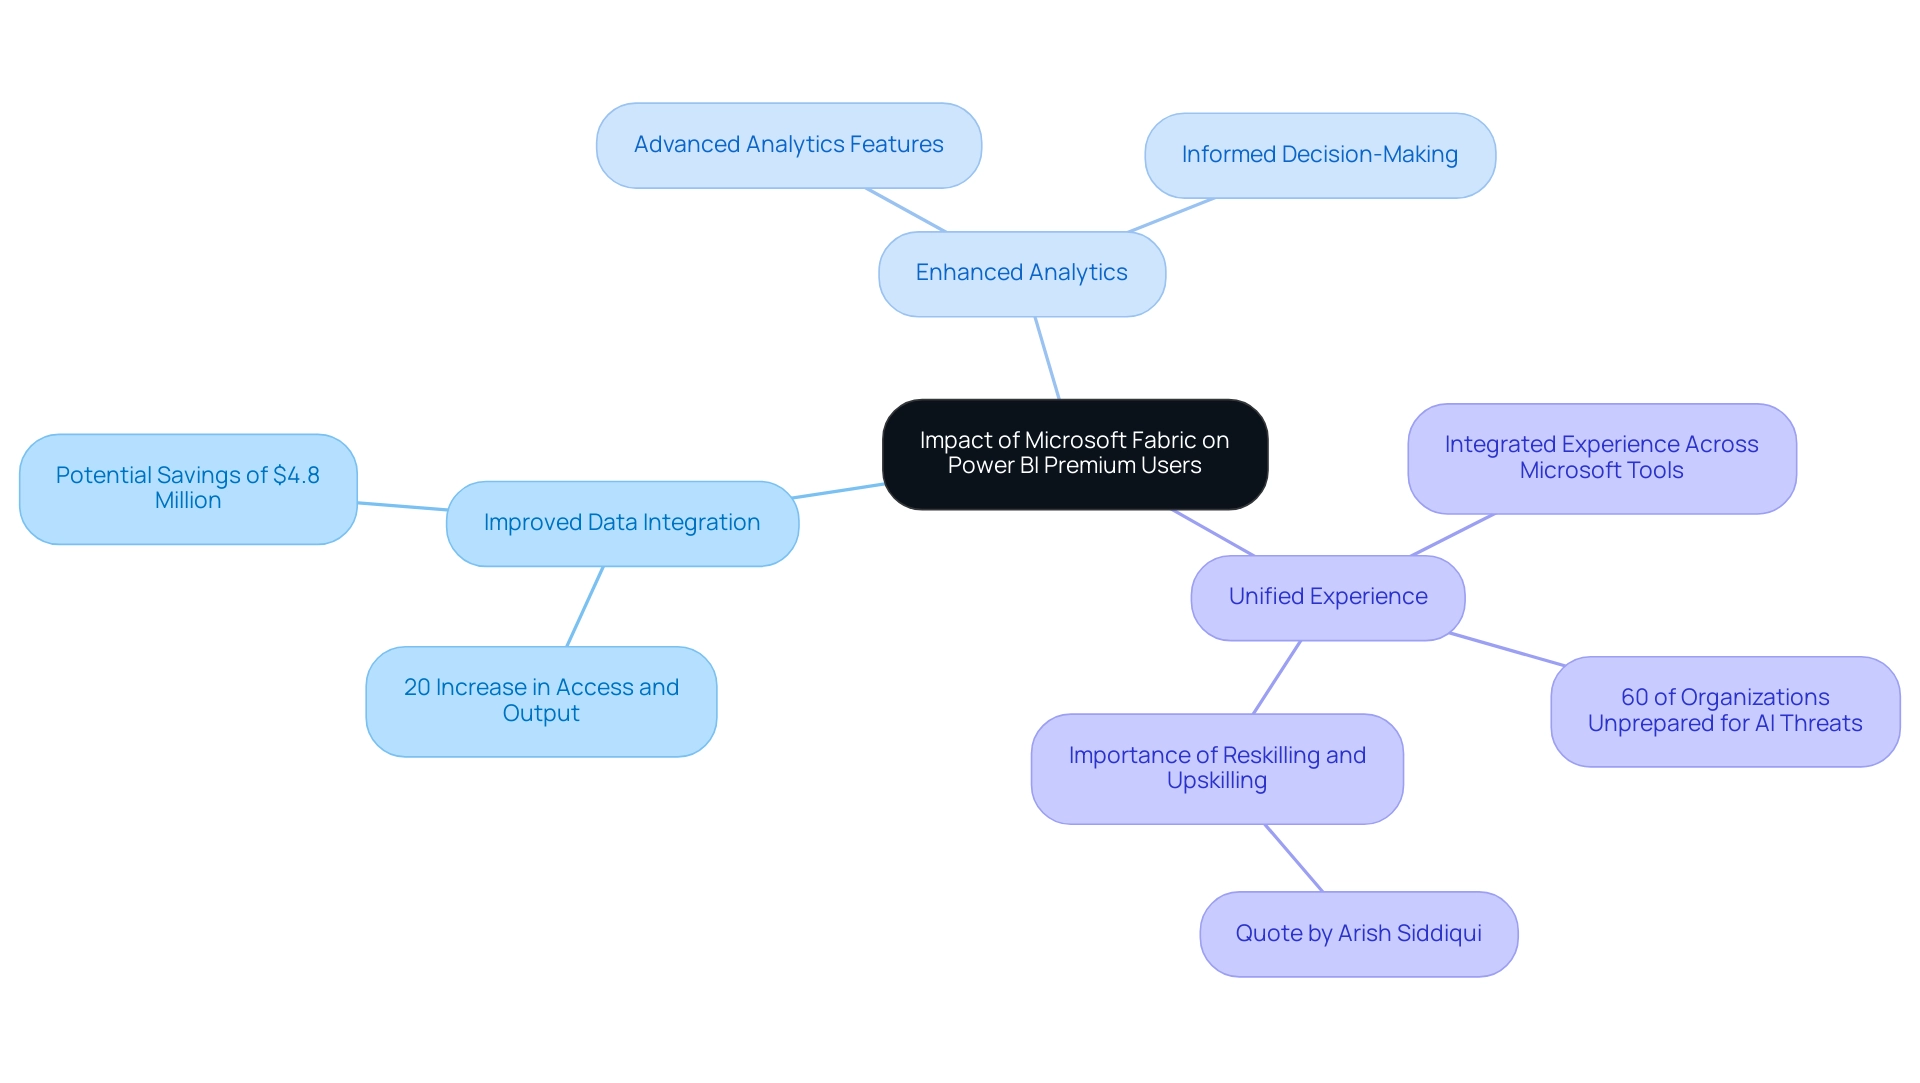
Preparing for the Future: What to Expect After Transitioning to Power BI Premium
Following the transition to Power BI Premium, organizations must focus on several crucial areas to maximize their investment:
-
New Features: Regular updates will unveil innovative functionalities that significantly enhance analytics capabilities. For instance, the introduction of color-coded Sales Velocity charts enables individuals to quickly assess profit levels—green indicating high profit, yellow for moderate, and red for low profit. This visual representation assists in making informed decisions quickly, countering the common challenge of information overload encountered during report creation.
-
Renaming Metrics: Existing scorecard metrics will be renamed to Goals, maintaining their functionality while clarifying the transition process for individuals, and addressing potential confusion arising from inconsistencies in information reporting.
-
Training Needs: As staff acclimate to new tools and processes, continuous learning will be pivotal. Evaluating the training requirements of BI Premium participants will guarantee that your team stays prepared to make the most of the platform’s full potential. Saveen Reddy, Director of Community & Learning at Microsoft Fabric, notes that these tools are perfect for illustrating the proportion of individual series to the whole and how they evolve over time, emphasizing the need for comprehensive training to provide actionable guidance to stakeholders.
-
Performance Monitoring: Establishing metrics to track the effectiveness of the transition is vital. Tracking usage metrics and participant engagement can assist in pinpointing areas for additional improvement, ensuring that the organization is on the correct path to attaining operational efficiency while reducing the risk of inconsistencies. A strong governance strategy is crucial to uphold information integrity and trust across reports.
-
Copilot Summaries: Users can now subscribe to Copilot summaries for BI reports, allowing them to receive insights via email. This feature enhances user engagement and keeps teams informed about key trends, directly addressing the challenge of extracting insights from reports.
-
Case Study: A practical example of effective information management post-transition is illustrated by a new tool that allows users to quickly remove unused sources from their app via a broom icon in the tab. This feature simplifies app management and ensures that only relevant information is retained, promoting clarity and trust in the presented content.
By adopting a proactive stance and being well-prepared for these elements, organizations can fully harness the capabilities of Power BI Premium, fostering continuous improvement in their operational processes and transforming challenges into opportunities for growth. The General Management App plays a critical role in providing actionable guidance, ensuring stakeholders can make informed decisions based on reliable data.
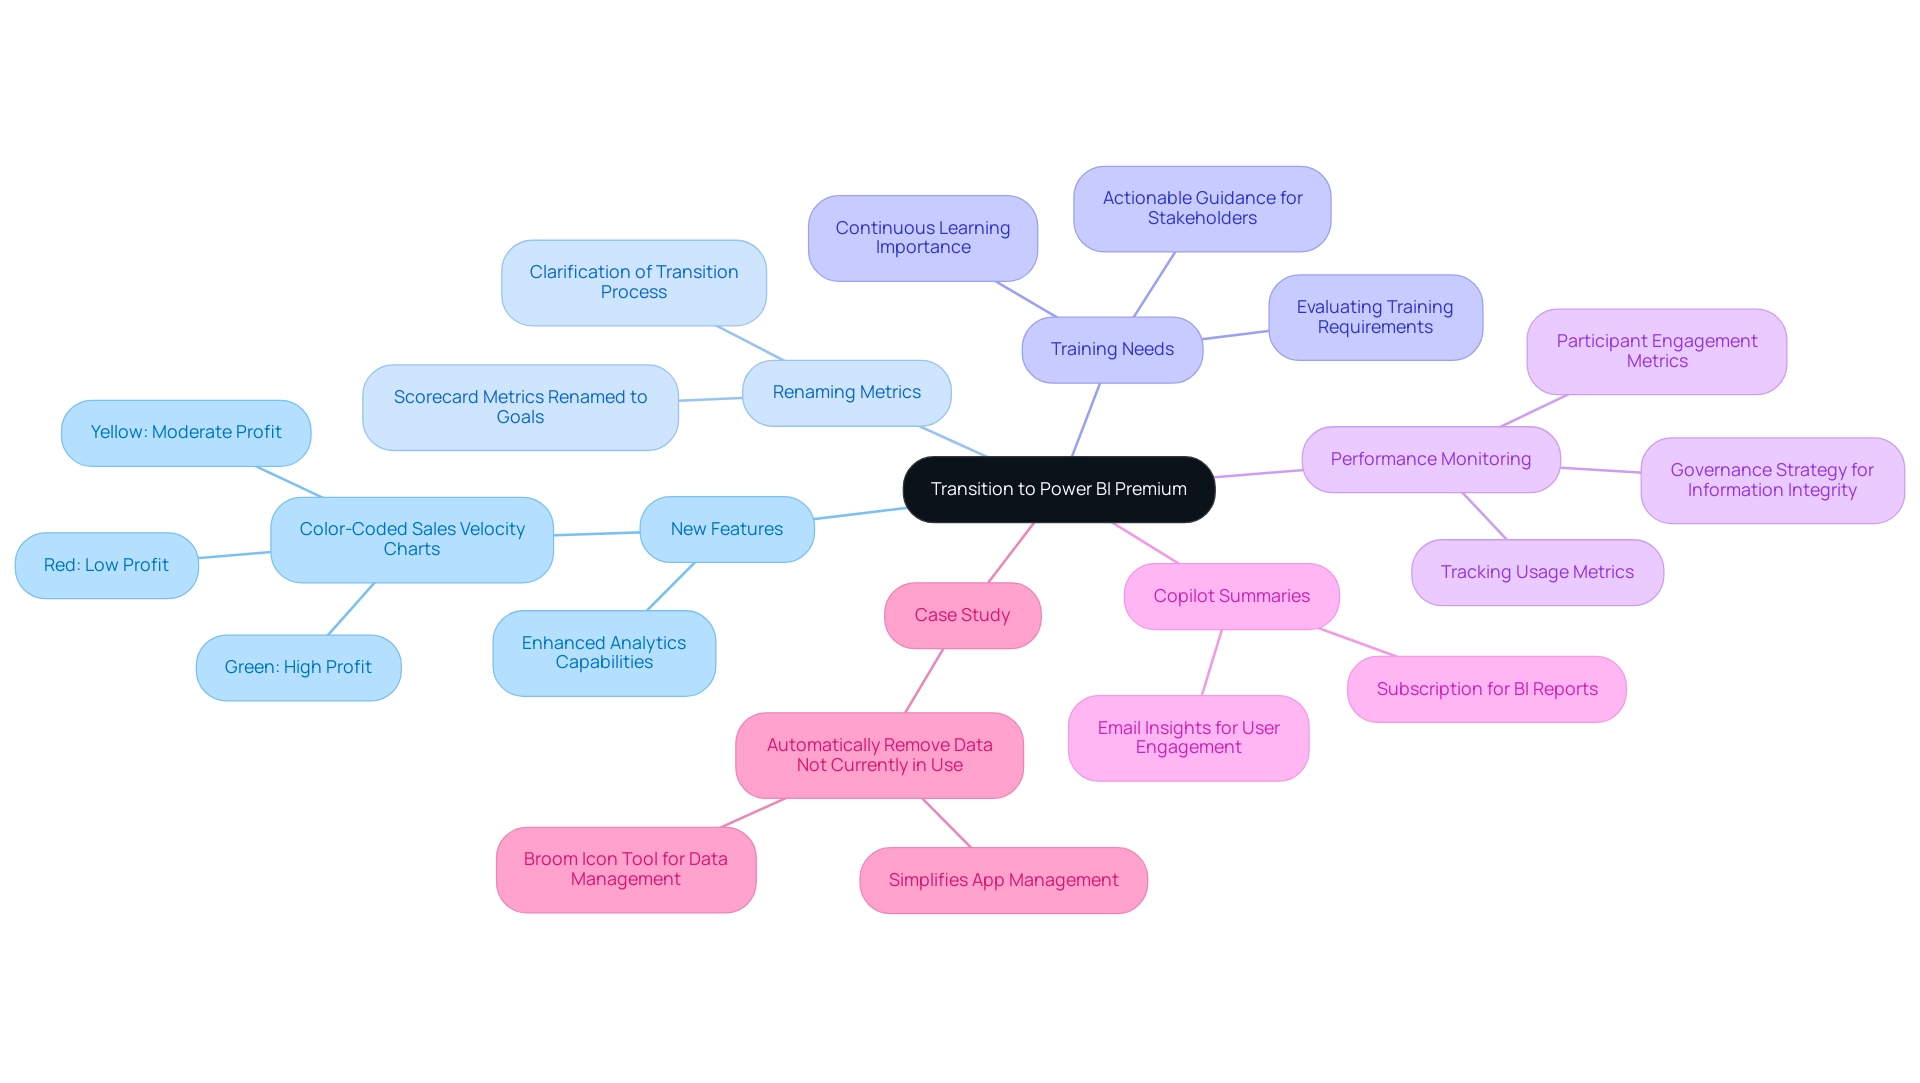
Conclusion
Transitioning to Power BI Premium offers organizations a significant opportunity to elevate their data analytics capabilities and streamline reporting processes. By leveraging its advanced features, such as enhanced performance, larger data capacity, and integrated AI functionalities, businesses can overcome common challenges like data inconsistencies and time-consuming report creation. The step-by-step guide provided ensures a seamless migration, empowering teams to maximize the potential of this powerful platform.
Selecting the right licensing option is crucial for aligning with organizational needs, whether opting for Power BI Pro, Premium Per User, or Premium Capacity. Understanding the impact of Microsoft Fabric further enhances the user experience, enabling improved data integration and advanced analytics that drive informed decision-making. As organizations prepare for the future, they must focus on continuous learning, performance monitoring, and embracing new features to fully capitalize on their investment.
Ultimately, embracing Power BI Premium not only transforms data management but also empowers teams to derive actionable insights that can drive strategic growth. By fostering a culture of data-driven decision-making, organizations can navigate the complexities of today’s business landscape with confidence, turning challenges into opportunities for innovation and efficiency.
Introduction
In the dynamic landscape of data analytics, ensuring that reports and dashboards reflect the most up-to-date information is essential for informed decision-making. Power BI offers a robust suite of data refresh options that cater to diverse user needs, each designed to enhance operational efficiency and accuracy. From manual refreshes to advanced automated solutions, understanding these methods empowers organizations to leverage their data effectively.
This article delves into the intricacies of data refresh in Power BI, exploring best practices, troubleshooting techniques, and innovative strategies that can streamline reporting processes and unlock the full potential of business intelligence. By adopting these insights, organizations can transform their data management practices, driving growth and innovation in an increasingly competitive environment.
Understanding Data Refresh in Power BI
Understanding how to refresh data in Power BI Desktop automatically is a crucial procedure that guarantees your dashboards display the most up-to-date details accessible, thus improving the precision and promptness of insights obtained from your information. Our BI services, including the 3-Day Sprint for rapid report creation and the General Management App for comprehensive management, facilitate this process by ensuring efficient reporting and information consistency. This tool offers various techniques for updating information, such as:
- How to refresh data in Power BI Desktop automatically
- Manual refreshes
- Scheduled refreshes
By default, users can schedule up to 8 refreshes per day with BI Pro. If you need to update your information more often, think about upgrading to Power BI Premium, or learn how to refresh data in Power BI Desktop automatically, which permits update schedules as often as every 15 minutes. This flexibility is essential for maximizing the efficiency of your analysis efforts.
Moreover, for semantic models larger than 1 GB, incremental updates are highly recommended to optimize performance and reduce load times. Recent developments have introduced alternatives for obtaining up-to-date information without incurring costs associated with Premium capacity; for example, storing information in an Azure SQL database and utilizing direct query can be an effective solution. Furthermore, be mindful that an empty custom connectors folder may signify an issue with loading custom connectors, which can impede updates.
For those without access to an enterprise gateway, deploying a personal information gateway offers a practical solution for managing source configurations individually. Understanding how to refresh data in Power BI Desktop automatically not only enhances operational efficiency but also greatly influences the precision of BI reporting, enabling your organization to make informed decisions based on trustworthy information. To explore our complete offerings, including the Actions portfolio, and to discuss how we can assist your organization, we invite you to book a free consultation.
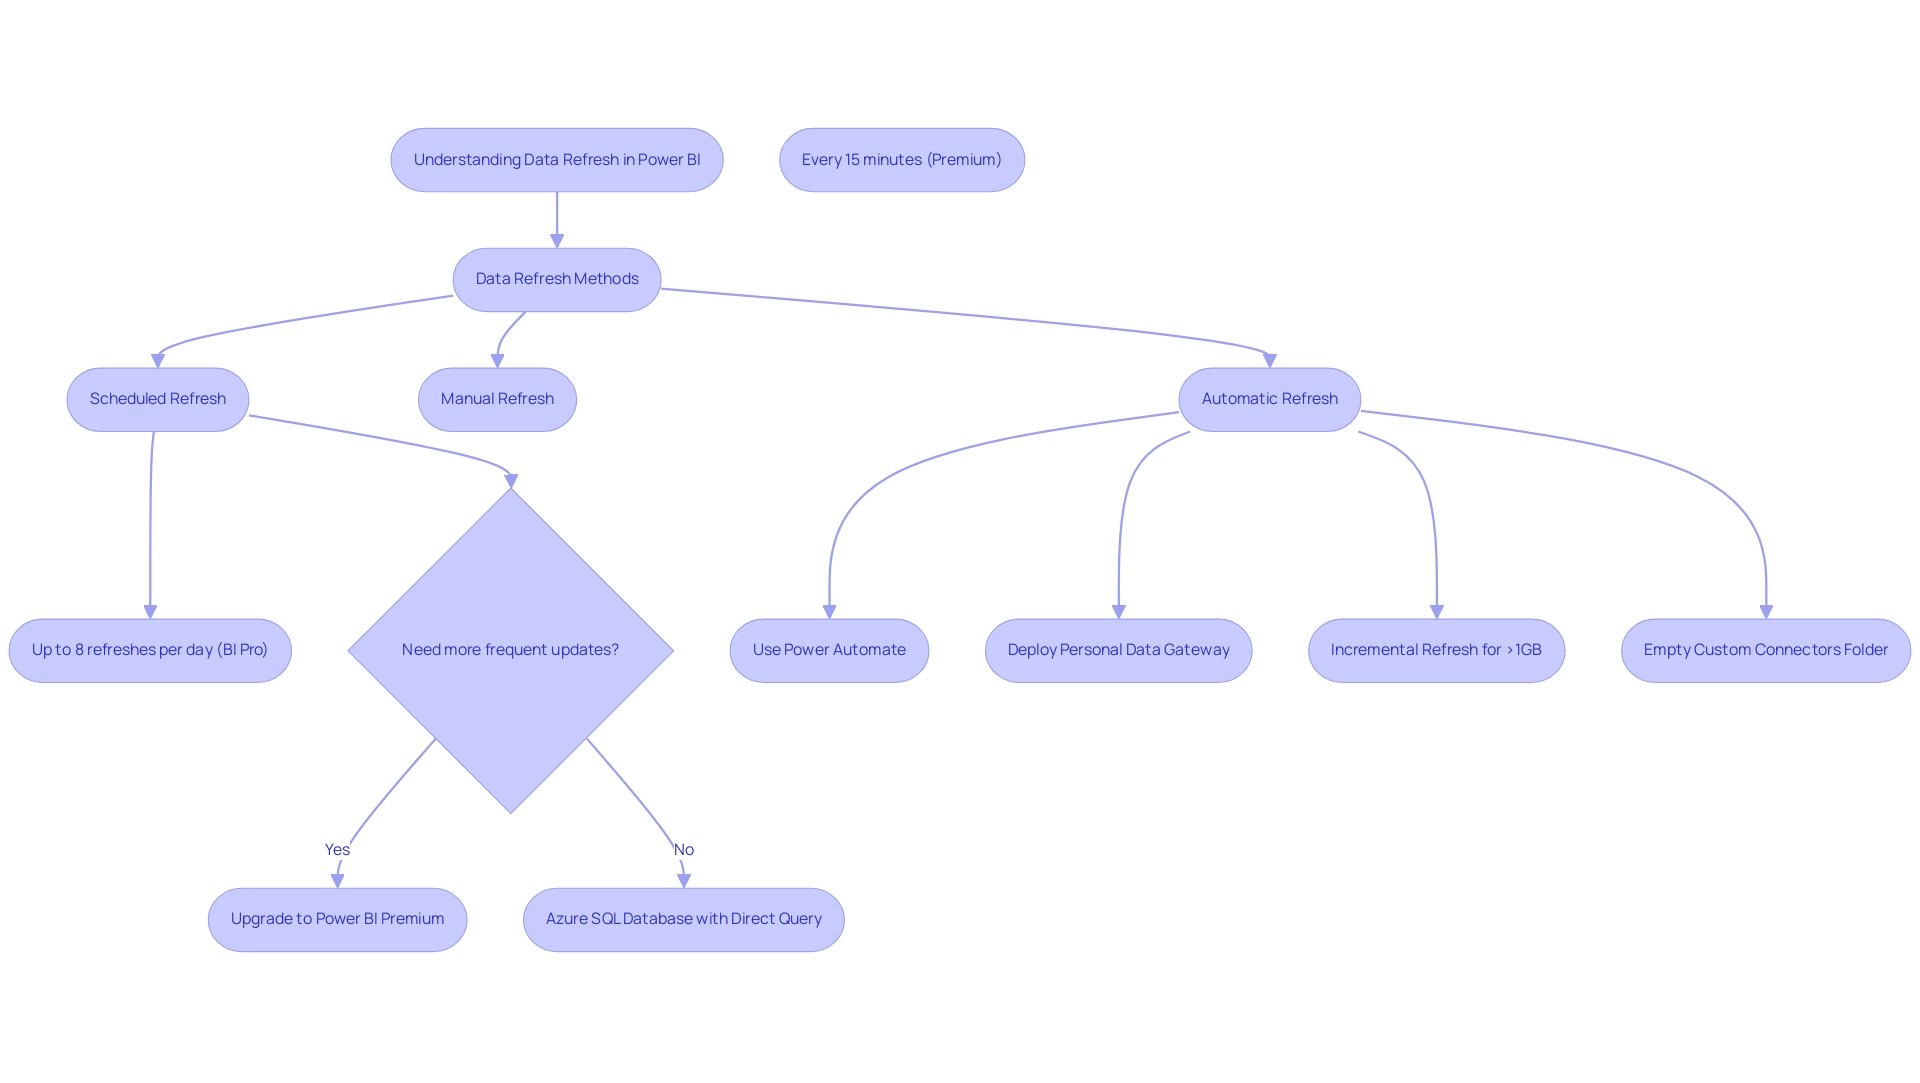
Exploring Refresh Options in Power BI
The business intelligence tool offers a range of update options designed to satisfy various user requirements, each presenting distinct benefits:
- Manual Update: This simple method enables users to manually update information by clicking the update button in either Power BI Desktop or the Power BI Service. It’s especially advantageous for one-time updates, allowing instant access to the most current information.
- On-Demand Refresh: With this option, users can refresh information whenever necessary, bypassing the need for a fixed schedule. This flexibility is perfect for situations where prompt information access is essential, particularly when decisions based on information are required urgently.
- Scheduled Refresh: Users can automate updates at defined intervals, ensuring datasets are consistently refreshed without requiring manual intervention. This method is essential for maintaining the accuracy and relevance of reports over time, addressing the challenges of time-consuming report creation and potential information inconsistencies. It’s important to note that it can take up to 24 hours for new usage information to be imported, emphasizing the need for timely refreshes.
- Direct Query: By establishing a direct connection to the data source, this method facilitates real-time data access, eliminating the need for traditional refreshes. This option is particularly useful for dynamic datasets that require immediate insights, addressing the common challenge of lacking actionable guidance from static documents.
Each refresh method plays a crucial role in optimizing reporting processes, enabling users to select the most effective strategy for their specific use cases. Recent developments have emphasized the necessity of refreshing usage metrics reports after making changes, such as deleting the semantic model, to ensure integrity and accuracy. As Stuart, a Power BI expert, notes, discrepancies can arise between PBIX and Online refreshes, particularly if different datasets are being compared. Staying informed about these options empowers users to enhance their reporting capabilities effectively. Moreover, incorporating RPA solutions can further optimize the update processes by automating repetitive activities related to information management, thus enhancing operational efficiency. For instance, tools such as EMMA RPA can assist in automating the scheduling of data refreshes, ensuring that documents are consistently current without manual intervention. The enhanced usage metrics report illustrates how effective update strategies, complemented by RPA, can lead to better insights into report engagement and performance, ultimately enhancing the overall user experience and driving operational efficiency.
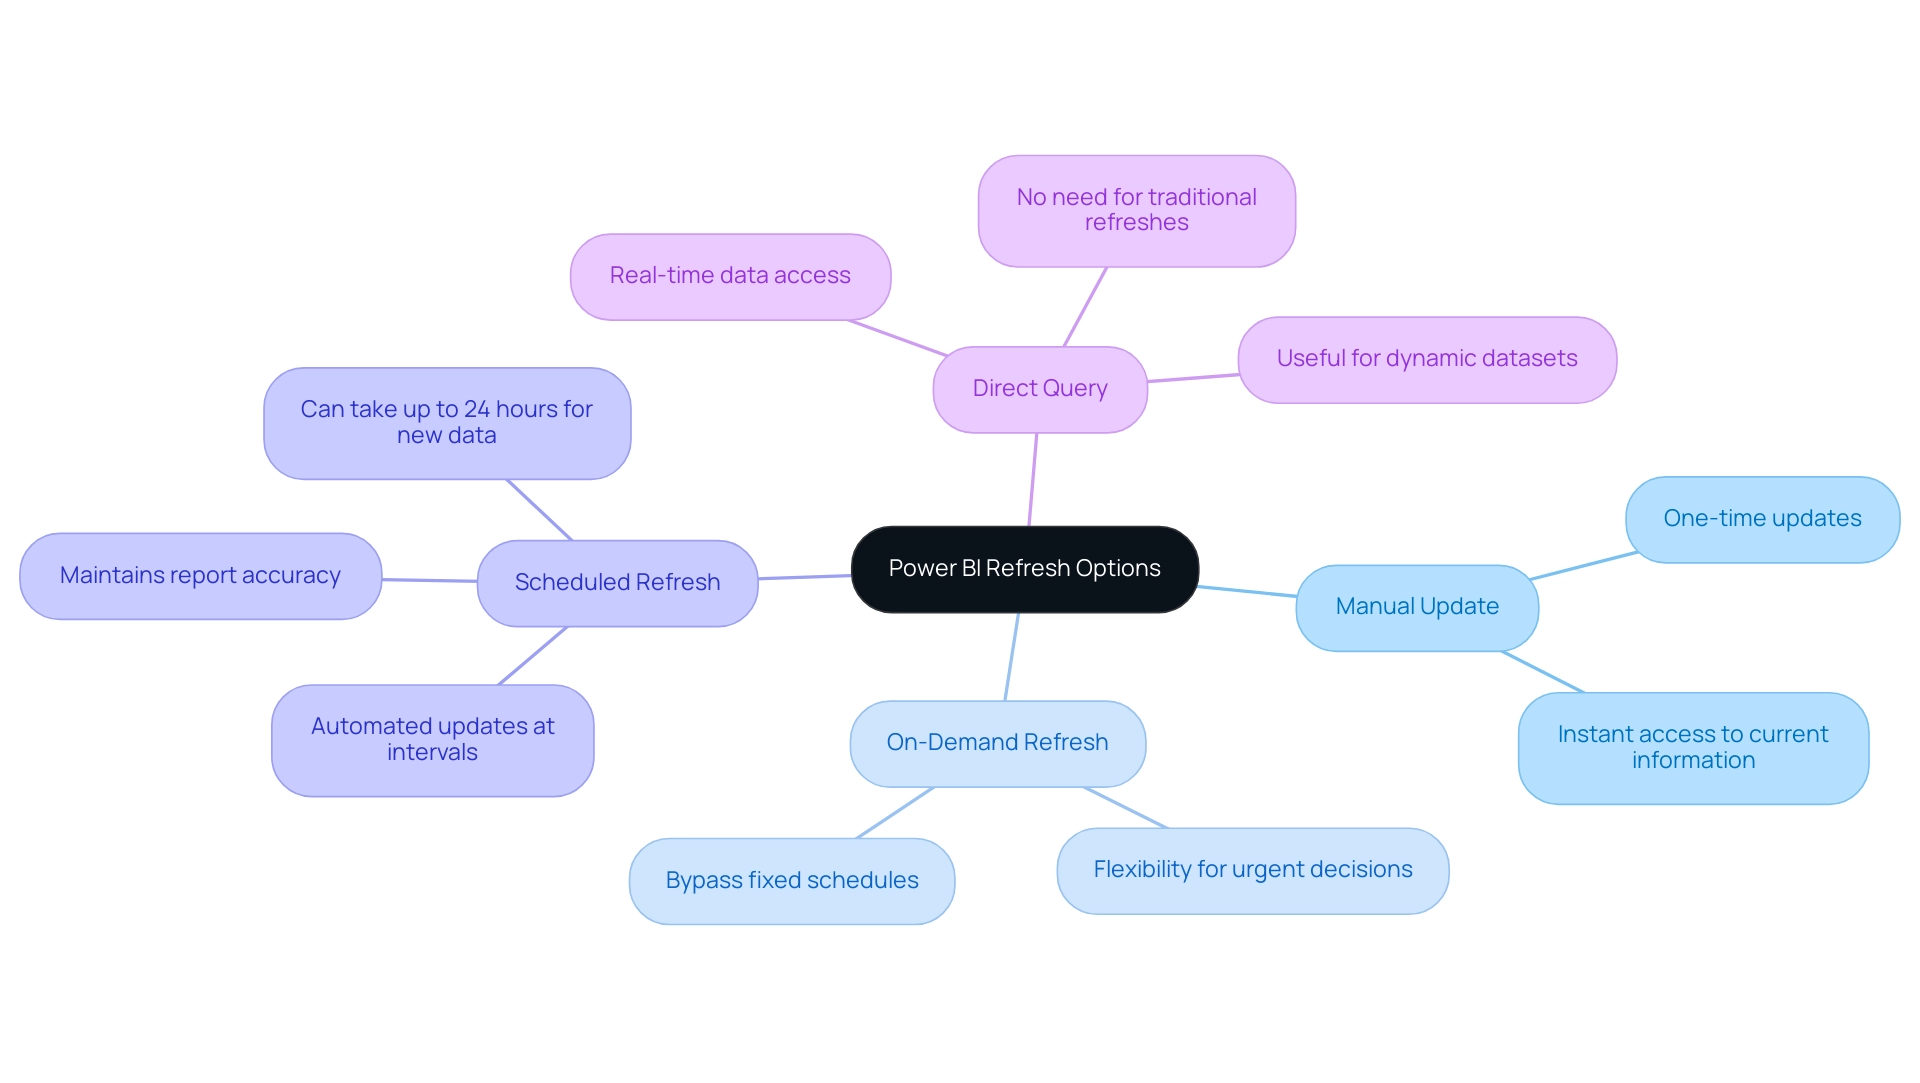
Step-by-Step Guide to Setting Up Automatic Refresh
To configure automatic update in BI effectively, follow these detailed steps:
- Open Power BI Service: Begin by logging into your Power BI account to access your workspace.
- Navigate to Your Dataset: Locate the ‘Datasets’ section within your workspace to find the dataset you wish to update.
- Access Settings: Click the ellipsis (three dots) adjacent to your dataset and select ‘Settings’ from the dropdown menu.
- Locate Scheduled Update: In the settings menu, scroll to the ‘Scheduled update’ section—this is where the magic happens.
- Enable Update: Toggle the switch to ‘On’ to activate scheduled update for your dataset.
- Set Refresh Frequency: Determine the frequency of your refresh—options include daily or weekly—and specify the desired time for these updates.
- Save Changes: Finally, click ‘Apply’ to secure your settings.
By following these steps on how to refresh data in Power BI Desktop automatically, you can automate the update procedure, ensuring your documents stay up-to-date and trustworthy. This automation not only saves time but also addresses common challenges such as how to refresh data in Power BI Desktop automatically, as well as data inconsistencies and the lengthy report creation process.
It’s also essential to regularly verify the update status and history of your semantic models. Monitoring for any update errors, indicated by a warning icon, and reviewing past synchronization cycles can provide valuable insights into your update success rates, ultimately enhancing your operational efficiency. This practice aligns with the findings from case studies illustrating how users can effectively troubleshoot issues by analyzing update history.
As observed by Kasper Langmann, co-founder of Spreadsheet, this process reflects the steps for how to refresh data in Power BI Desktop automatically, highlighting the uniformity across platforms. By incorporating tools like EMMA RPA and Automation, you can further optimize your operations, addressing not only the technical aspects of information updates but also the strategic need to overcome the competitive disadvantage created by insufficient insights.
By adopting these practices, you can significantly enhance the efficiency and accuracy of your reporting, leveraging the power of Business Intelligence and RPA to drive growth and innovation.
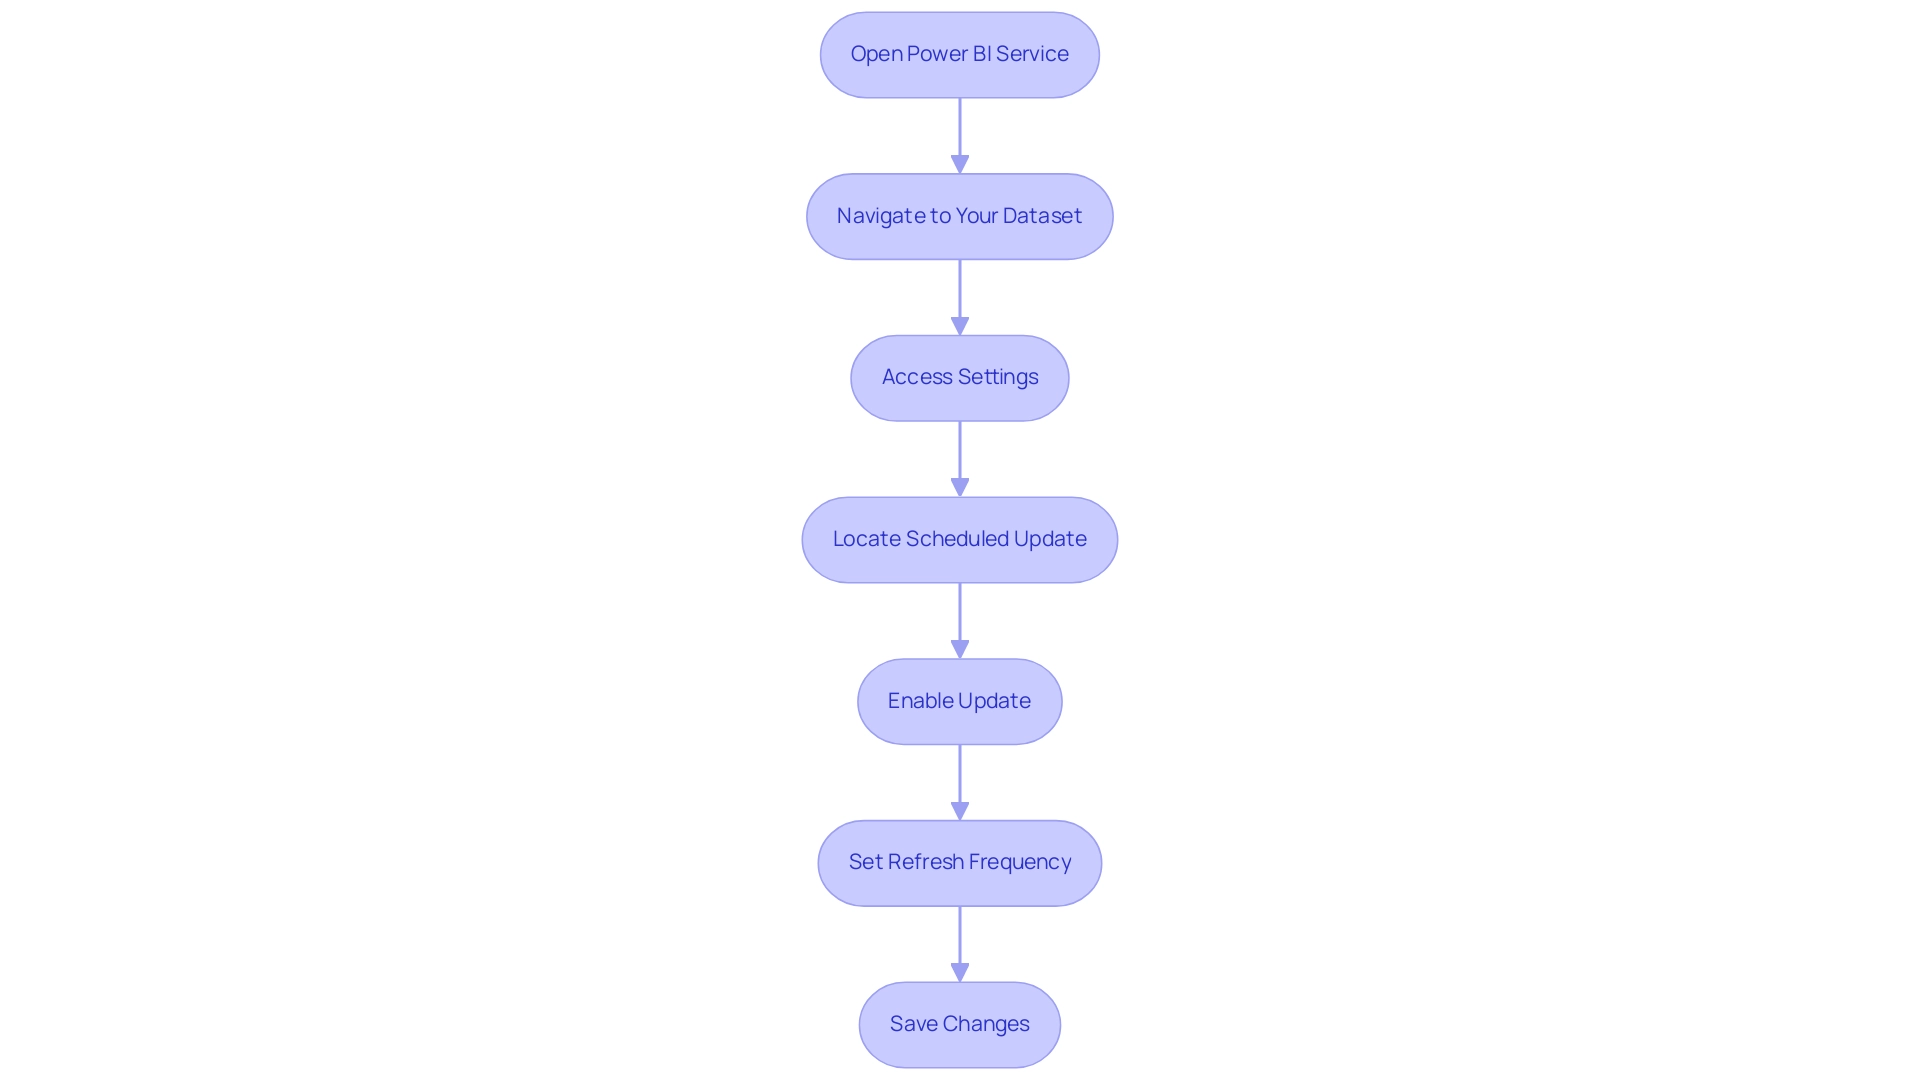
Best Practices for Power BI Data Refresh
To attain optimal refresh performance in Power BI and tackle common challenges such as time-consuming document creation and inconsistencies, implementing the following best practices is essential:
- Limit Information Volume: Focus on reducing the amount of information being refreshed. Utilize filters to ensure that only essential information is updated, which enhances the overall performance of your reports. By applying the 22 DAX best practices for improved Power BI performance, you can discover how to refresh data in Power BI Desktop automatically, which will enhance your approach to information management and ultimately lead to more actionable insights.
- Schedule Updates During Off-Peak Hours: Set your data update schedules for times when user activity is low. This strategy reduces the performance impact and enables a smoother update process, ensuring that your team can access insights without delays, thereby improving decision-making capabilities.
- Monitor Update Status Regularly: Keep a close eye on the update history to quickly identify any failures or issues. This proactive method allows you to tackle issues swiftly, which is essential for understanding how to refresh data in Power BI Desktop automatically, thereby preserving the integrity of your information and ensuring that your insights remain actionable and trustworthy.
- Implement Incremental Updates: For particularly large datasets, adopting incremental update techniques can be a game-changer. This approach updates only the information that has changed, significantly decreasing the time and resources required for a complete update, thereby empowering your team with timely insights that can drive strategic decisions.
- Optimize Your Queries: Review and optimize your queries to enhance performance. Inefficient queries can dramatically increase update times, so ensuring they run effectively is key to a successful information update strategy.
As PaulDBrown, a Community Champion, emphasizes, ‘Did I answer your question regarding how to refresh data in Power BI Desktop automatically?’ Mark my post as a solution! In doing so, you are also helping me. Thank you! Proud to be a Super User!
By incorporating these optimal methods, you not only simplify the update process but also directly tackle the challenges of deriving valuable insights from your information. Creating a clear role hierarchy, as mentioned in the case study on handling user roles and permissions, can streamline permissions management and is essential for enhancing update processes. Staying current with best practices, including insights from industry experts, will further enhance your BI experience and drive operational efficiency.
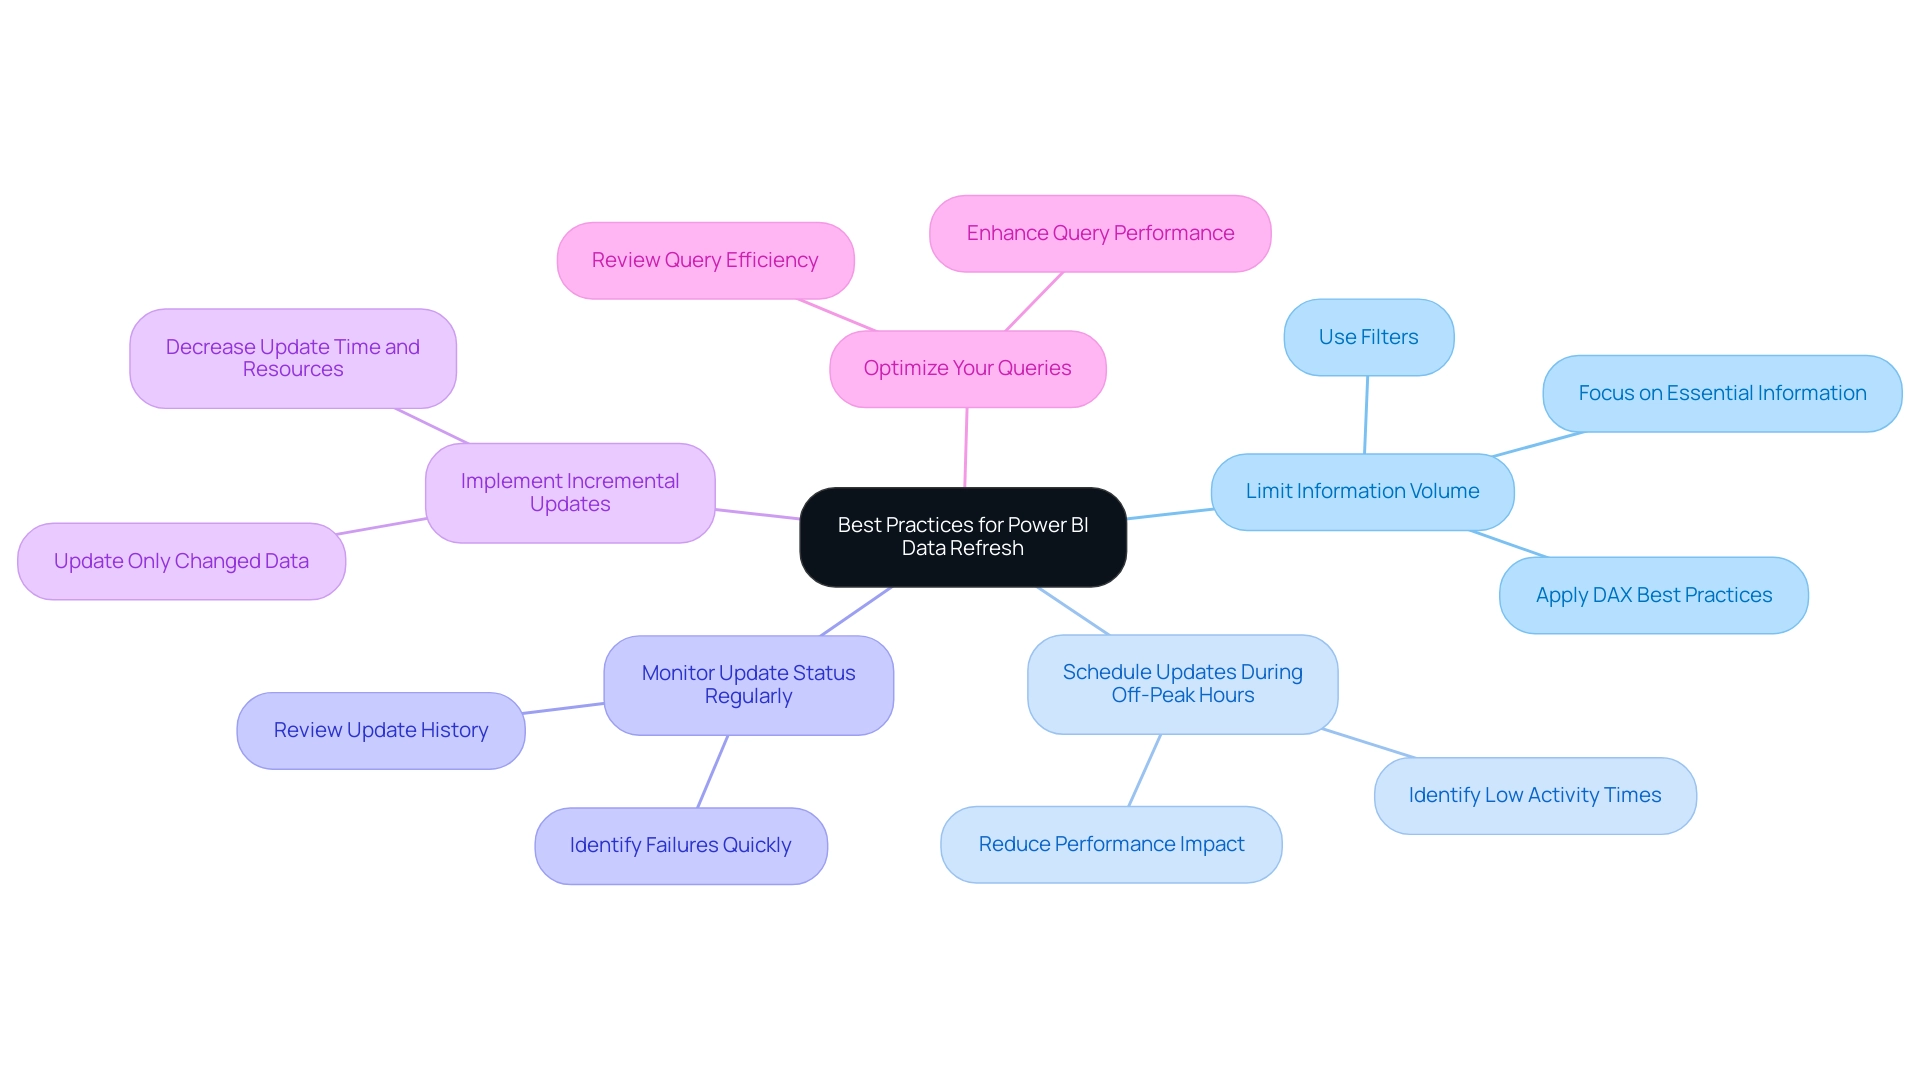
Troubleshooting Data Refresh Issues in Power BI
When encountering refresh challenges in Power BI, applying a structured troubleshooting method can significantly improve outcomes and enhance your organization’s operational efficiency. Here are essential steps to consider:
-
Check Source Credentials: Start by verifying that your source credentials are current and configured correctly. An outdated gateway can lead to errors, such as the Gateway Not reachable message. Installing the latest gateway may resolve this issue, ensuring smoother connectivity and empowering your decision-making process.
-
Review Refresh History: Delve into the refresh history to uncover any error messages. This analysis can offer valuable insights into what went wrong and guide your next actions, ensuring that your BI tools deliver precise information for informed decisions.
-
Test Queries: Execute your queries directly in the source to confirm they yield the expected results. This step helps identify whether the issue lies within Power BI or the information source itself, addressing potential inconsistencies that could hinder operational efficiency.
-
Examine Information Structure: Evaluate your information structure for any inconsistencies or errors that may hinder the update process. Ensuring that the model is clean and optimized is vital for successful refreshes, ultimately improving the reliability of your BI insights.
-
Ownership of Documents: Consider transferring ownership of documents to the responsible individuals to ensure they receive timely email notifications regarding refresh statuses. This enhances accountability and communication within your team.
-
Contact Support: If problems continue to arise, don’t hesitate to reach out to Microsoft support for expert assistance. They can provide tailored solutions and further insights, helping you overcome barriers to effective data utilization.
-
Utilize Usage Metrics: As mentioned by a Microsoft representative, “If you have edit access to that dashboard or document, or possess a Pro license, you can use Usage Metrics.” This tool can improve your comprehension of how dashboards and documents are utilized within your organization, which can be crucial in identifying and addressing update failures.
-
Centralized Monitoring of Dataset Refreshes: A user expressed the need for a centralized report to monitor the status of dataset refreshes across multiple apps and workspaces owned by different administrators. Currently, they rely on email notifications or manual checks to determine if refreshes have failed. Implementing a centralized monitoring solution would address this gap and facilitate easier tracking of refresh statuses, ultimately driving business growth through effective information management.
-
Integrate RPA for Enhanced Efficiency: Consider implementing Robotic Process Automation (RPA) to automate certain troubleshooting processes or information management tasks. By automating repetitive tasks associated with refreshes, your team can concentrate on more strategic initiatives, ultimately enhancing operational efficiency and leveraging the full potential of your BI tools.
By following these troubleshooting steps and integrating RPA solutions, you can effectively mitigate common data refresh issues, ensuring your Power BI reports remain accurate and reliable, while transforming your organization’s data into actionable insights.
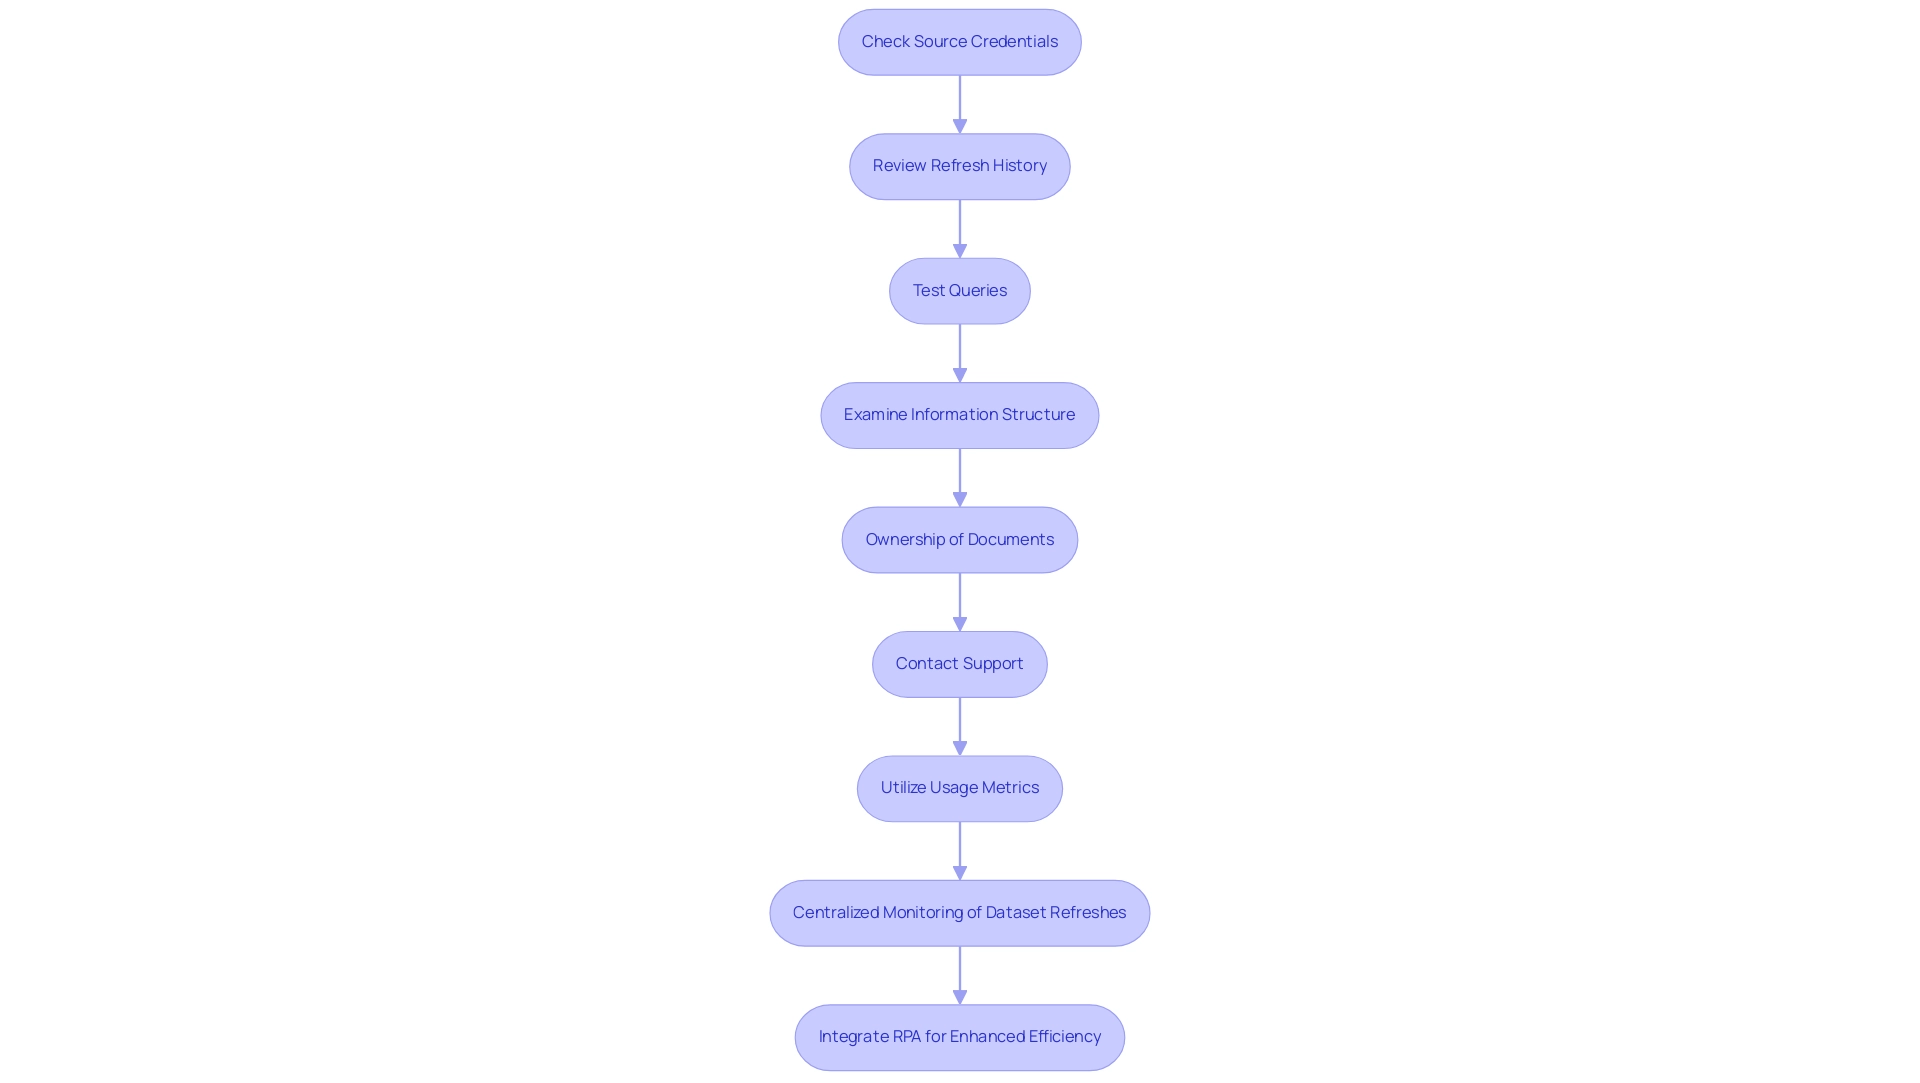
Conclusion
Ensuring that data refresh processes in Power BI are efficient and reliable is paramount for organizations seeking to leverage their data for strategic decision-making. The various refresh methods available—manual, on-demand, scheduled, and direct query—each offer unique benefits tailored to different user needs. By understanding these options, organizations can select the most effective strategies to maintain the accuracy and relevance of their reports, thereby enhancing operational efficiency.
Implementing best practices, such as:
- Limiting data volume
- Scheduling refreshes during off-peak hours
can significantly improve refresh performance. Regularly monitoring refresh statuses and employing incremental refresh techniques are also essential steps in addressing common challenges associated with data management. Furthermore, troubleshooting issues through structured approaches can mitigate potential disruptions, ensuring that users have access to reliable insights.
Ultimately, by adopting these insights and strategies, organizations can transform their data refresh practices in Power BI, driving growth and fostering innovation in an increasingly competitive landscape. Empowered with the right tools and knowledge, teams can not only enhance their reporting capabilities but also unlock the full potential of their business intelligence initiatives.
Introduction
In the realm of data analytics, Power BI emerges as a transformative tool, empowering organizations to harness the full potential of their data. With its diverse range of data sources—from file-based imports to robust cloud integrations—Power BI not only facilitates seamless data management but also addresses the common challenges faced by businesses in today’s data-driven landscape.
Understanding the various types of data sources available is essential for unlocking deeper insights and driving operational efficiency. This article delves into the intricacies of connecting and integrating data within Power BI, offering practical guidance and strategies for maximizing its capabilities.
By exploring the distinctions between Power BI Desktop and Service, the advantages of cloud data integration, and the process of combining multiple data sources, organizations can pave the way for informed decision-making and sustainable growth.
Exploring the Types of Data Sources in Power BI
BI provides a varied selection of sources that can be categorized into separate groups, each fulfilling unique analytical requirements while tackling common issues encountered in management:
-
File-based Sources: Users can effortlessly import information from formats such as Excel, CSV, and XML files, allowing for quick integration and analysis of familiar datasets, thereby reducing the time spent on report creation.
-
Database Sources: Power BI seamlessly connects to major databases including SQL Server, Oracle, and MySQL. This capability allows individuals to retrieve information directly from their current database systems, facilitating real-time analysis and reporting.
The effectiveness of this connection is emphasized by the usual report opening time, which aligns with the 50th percentile of the duration required to open the report, showcasing the rapidity at which individuals can access their information and minimizing discrepancies across different reports.
-
Cloud Services: Integration with cloud-based platforms like Azure SQL Database, Salesforce, and Google Analytics enables individuals to leverage the capabilities of cloud information, improving accessibility and collaboration, while also offering clear, actionable insights that promote informed decision-making.
-
Online Services: The tool connects to multiple online services, such as SharePoint and Dynamics 365, thereby offering individuals extensive access to their organizational information stored in these platforms.
-
Alternative Inputs: The adaptability of BI extends to extra inputs such as OData feeds and web pages, expanding the range of integration choices accessible to users. As organizations increasingly embrace BI, understanding the range of data sources for Power BI is crucial for maximizing its full potential in analytics. However, organizations utilizing Private Links may encounter restrictions with report usage metrics, as these metrics will contain no information due to challenges in transferring client details, illustrating the real-world implications of source limitations.
Moreover, the effectiveness of BI reporting can be impacted by governance issues, which can lead to inconsistencies and confusion among stakeholders. By implementing robust governance strategies, organizations can ensure information integrity and reliability in their reports.
By embracing Business Intelligence and RPA solutions, such as EMMA RPA and Microsoft’s Automate, organizations can automate repetitive tasks, improve efficiency, and specifically address challenges like report creation and information inconsistencies. These tools not only streamline operations but also improve the overall quality of insights obtained from information, ultimately leading to enhanced operational effectiveness and growth.
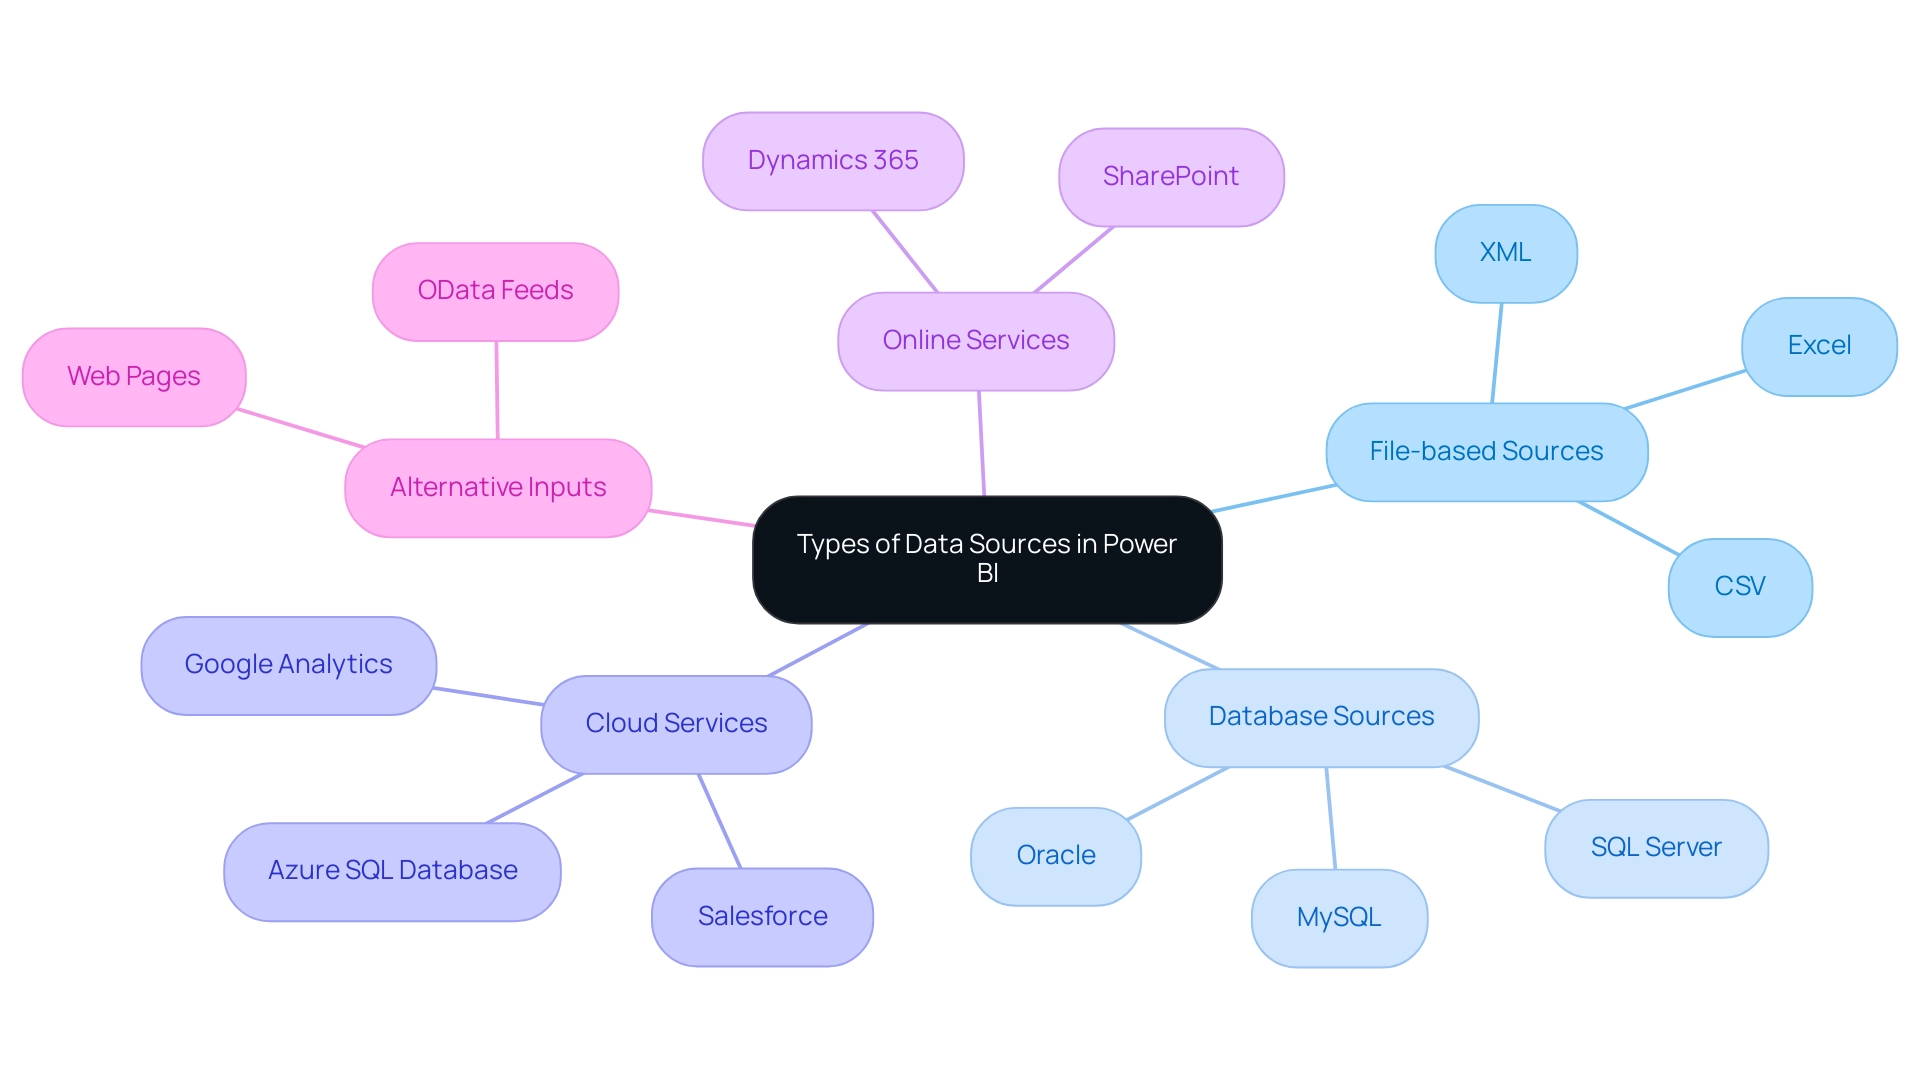
Understanding Data Source Differences: Power BI Desktop vs. Service
BI functions within two separate environments: BI Desktop and BI Service, both providing unique features for handling information crucial for generating insights and enhancing operational efficiency.
-
BI Desktop acts as a robust tool for information modeling and report generation. It enables individuals to connect to a diverse array of data sources for Power BI, perform transformations, and construct detailed visual reports locally.
This environment excels in development and testing phases, providing the flexibility needed for in-depth analysis. Importantly, BI Desktop is a free tool, making it accessible for individual users and small teams looking to overcome challenges such as time-consuming report creation and the lack of actionable insights. -
Power BI Service, on the other hand, is a robust cloud-based platform designed for publishing and sharing reports and dashboards.
While it also supports a variety of data sources for Power BI, its primary focus is on enhancing collaboration and facilitating real-time updates. Users can seamlessly connect to cloud-based sources, ensuring that teams have access to the most current data, addressing issues like data inconsistencies. However, the BI Service has a free version with limitations, while advanced features are available in Pro and Premium versions for a subscription fee.
Understanding the distinctions between these two environments is crucial. As Bhakti Shete aptly puts it,
In conclusion, Power BI Desktop and Power BI Service are two sides of the same coin, each with its unique strengths. Comprehending when to utilize which tool is essential for unlocking the full potential of your journey.
Additionally, integrating RPA solutions can further enhance operational efficiency by automating repetitive tasks associated with information management. The case study titled ‘Difference between BI Desktop and Service’ highlights these core differences, emphasizing that BI Desktop is designed for detailed report creation and individual use, while BI Service is built for online collaboration and sharing within teams. By utilizing the unique characteristics of each platform and incorporating RPA, individuals can optimize their analytics workflows, drive informed decision-making, and ultimately enhance business growth.
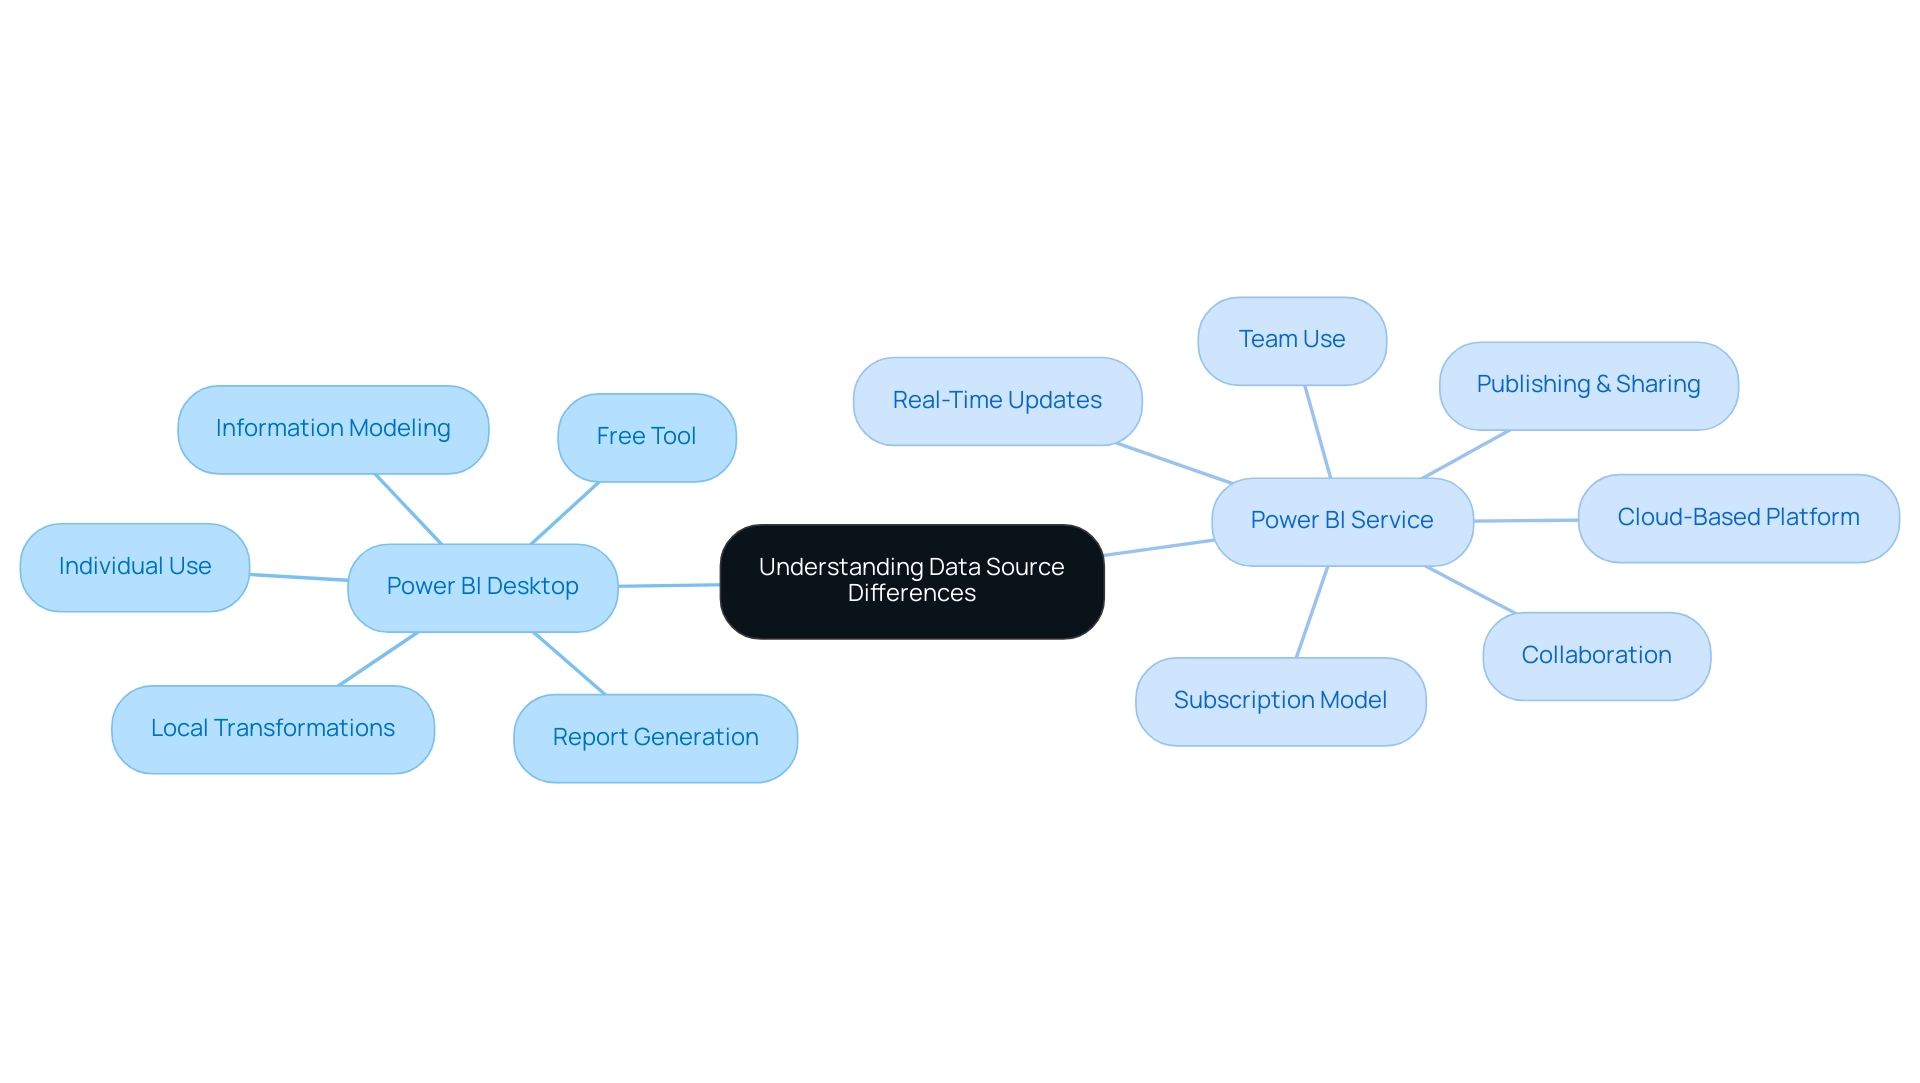
Integrating Cloud Data Sources with Power BI
Integrating cloud data sources for Power BI offers numerous benefits, especially regarding scalability and accessibility. With popular cloud platforms such as Azure SQL Database, Salesforce, and Google Analytics, individuals can effortlessly connect and utilize their information for enhanced analytics. Significantly, SwiftCart announced a 20% rise in customer satisfaction following the incorporation of these cloud solutions, emphasizing the concrete advantages of such integrations.
- Connecting to Azure SQL Database: Creating direct queries to Azure databases enables real-time information analysis, ensuring that decision-makers have access to the most current insights at their fingertips. This capability greatly improves operational efficiency by enabling timely insights, which are vital for driving growth.
- Salesforce Integration: Power BI’s built-in connectors for Salesforce streamline the visualization of CRM information, empowering individuals to transform complex datasets into clear, actionable insights, thus addressing common challenges in report creation and information inconsistencies.
- Google Analytics: By integrating Google Analytics, individuals gain valuable insights into website performance and behavior, information that can inform marketing and operational strategies, optimizing workflows further.
The synergistic approach to integrating these cloud sources not only simplifies access but also enriches the overall analytics experience. As noted by Himanshu Gautam, the self-service features of BI democratize analysis, enabling business users to swiftly access, explore, and uncover insights without relying heavily on IT or analysts. This quote underscores the importance of self-service in leveraging data effectively.
Moreover, the integration of RPA solutions, such as EMMA RPA and Automate, addresses task repetition fatigue and outdated systems, streamlining operations and enhancing efficiency. Automate complements this by providing a risk-free ROI assessment and ensuring professional execution. The compatibility of Power BI with various data sources for Power BI and its cloud integration capabilities enable it to scale with business requirements, as demonstrated in the case study titled ‘Integration and Scalability.’
This integration ultimately enhances decision-making processes, allowing businesses to adapt and thrive in a dynamic market landscape. The absence of effective data-driven insights can place a business at a competitive disadvantage, making the integration of BI and RPA not just beneficial but essential for sustained growth.
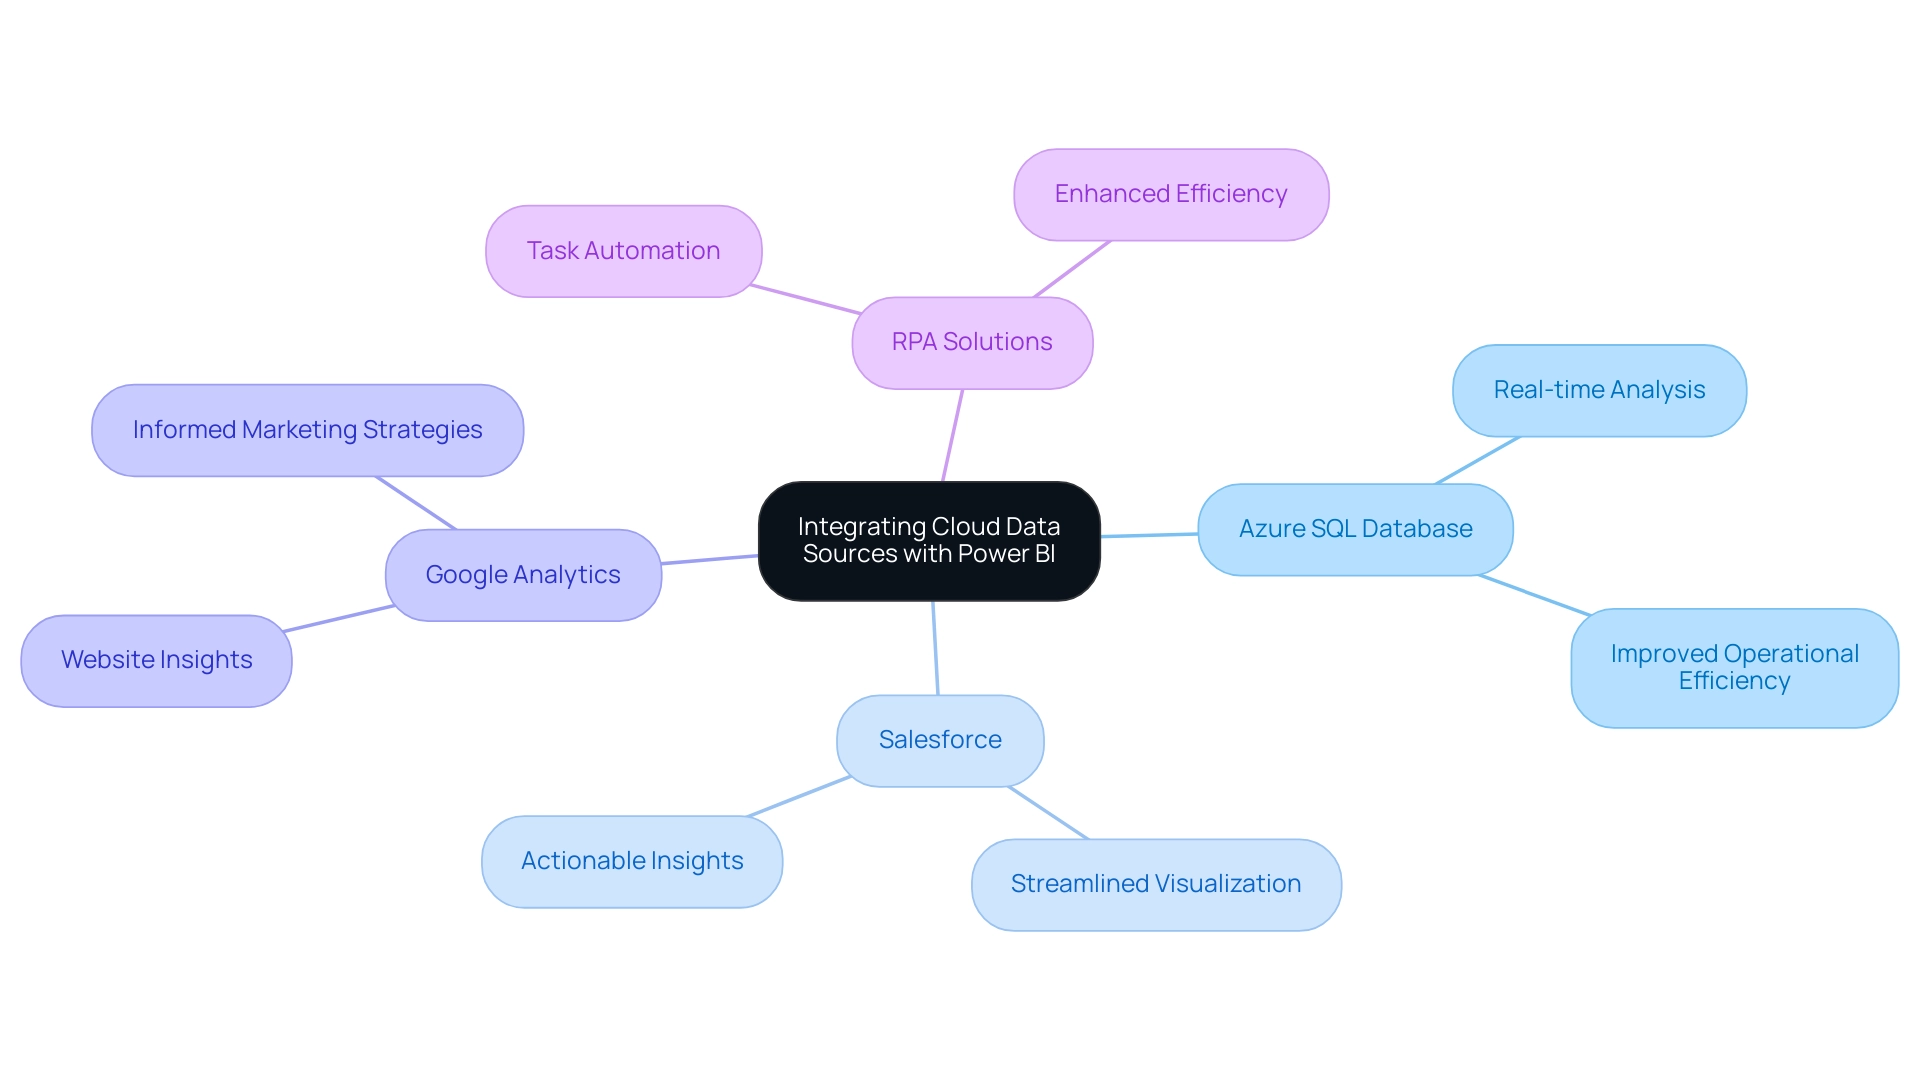
Connecting Data Sources to Power BI: A Step-by-Step Guide
Linking information repositories to Business Intelligence is a simplified procedure that enables users to utilize their information efficiently, essential for fostering informed decision-making and operational effectiveness. Here’s a step-by-step guide to get you started:
- Open Power BI Desktop: Begin by launching Power BI Desktop on your device.
- Select ‘Get Information’: Navigate to the ‘Home’ tab and click on ‘Get Information’ to explore the variety of available information options.
- Choose Your Information Source: Select the appropriate source type from the options provided, whether it’s Excel, SQL Server, or another compatible format.
- Enter Connection Details: For database connections, input the required server name and database credentials to establish the link.
- Load Information: Once the connection is established, select the specific tables or datasets you wish to import and click ‘Load’ to bring the information into BI.
- Transform Information (if needed): Utilize the Query Editor for any necessary transformations before finalizing the load.
Following these steps allows you to effectively connect your data sources for Power BI, enabling meaningful analytics through BI. The user-friendly interface is designed to generate reports with minimal technical expertise, addressing usability concerns effectively. As highlighted by the DataCamp Team,
Learn the basics of BI and how to create a basic report with this step-by-step tutorial.
Furthermore, utilizing BI effectively can contribute to achieving a profit margin target of 0.15, demonstrating its value in business analytics. This approach fosters confidence among users and encourages experimentation with datasets, as illustrated in the case study titled “Realize the Potential of BI,” which emphasizes mastering the tool for impactful reporting.
Alongside utilizing BI, incorporating Robotic Process Automation (RPA) solutions can significantly improve operational efficiency by automating repetitive tasks and tackling issues such as task repetition fatigue and staffing shortages. Tailored AI solutions can also help navigate the overwhelming landscape of AI options, ensuring that businesses can identify technologies that align with their specific goals. Embracing BI and RPA can mitigate common challenges, transforming raw information into actionable insights that drive growth and innovation.
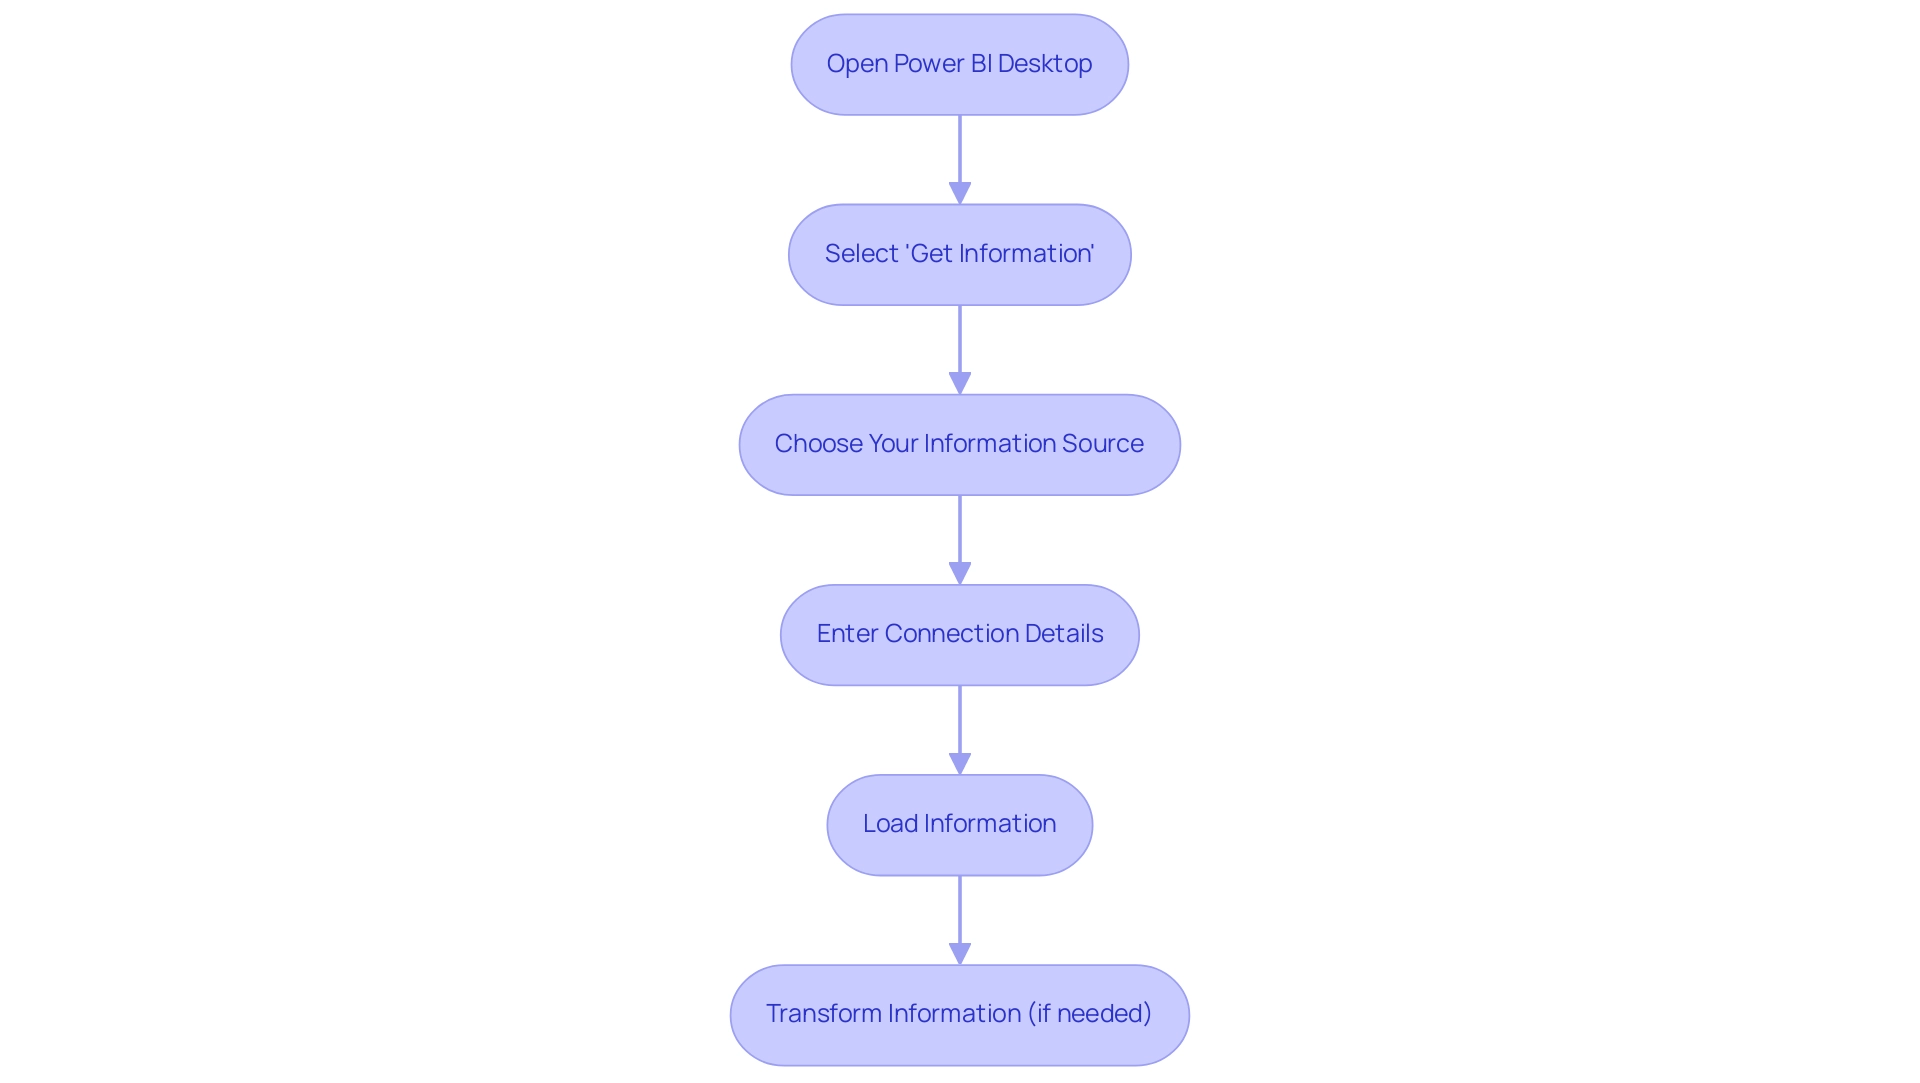
Combining Data from Multiple Sources in Power BI
This tool distinguishes itself as a robust resource for combining information from various sources, an essential capability for attaining thorough analysis. Users can seamlessly integrate information from different databases, cloud services, and file formats to construct a unified dataset that enhances their analytical capabilities.
-
Data Modeling: Within Power BI, individuals can create relationships between disparate tables, enabling intricate queries and dynamic visualizations that reveal nuanced insights.
-
Append Queries: This feature enables individuals to merge information from similar origins, such as various Excel files, leading to a thorough overview that enhances information integrity.
-
Merge Queries: By utilizing this functionality, individuals can combine information from distinct sources based on shared fields, enhancing their datasets for deeper analysis. The capacity to effectively amalgamate data from diverse origins empowers individuals to unearth profound insights and make more informed decisions.
Eyelyn Qin from Community Support highlights a practical approach:
One way to work around, creating dashboard could combine different visuals from different reports.
This capability not only streamlines reporting but also enhances the overall analytical experience. Additionally, users can create visuals in three different workspaces and save copies to a fourth workspace, showcasing the flexibility of BI in managing complex datasets.
Recent advancements, including the incorporation of Python and R scripts into Power BI, further augment its analytics potential. These scripts enable advanced analytics for predictive decision-making and comprehensive risk assessments, allowing organizations to utilize information more effectively. As demonstrated by a Fortune 500 company that utilized Match Enterprise to expedite its merger process—completing it two months ahead of schedule—effective information management is paramount for organizational success.
Furthermore, after importing and shaping the information, users can create a new custom score column by averaging various factors such as quality of life, cost of housing, and public health, illustrating a specific application of modeling that enhances decision-making.
For those looking to enhance their data reporting capabilities, our Power BI services, including the 3-Day Power BI Sprint for rapid report creation and the General Management App for comprehensive management, are designed to provide clear, actionable insights that drive growth and operational efficiency. Additionally, explore our Actions portfolio and book a free consultation to discover how we can further support your data-driven initiatives.
Addressing the challenges of data-driven insights is crucial, and our RPA solutions can help automate repetitive tasks, improving operational efficiency and employee morale.
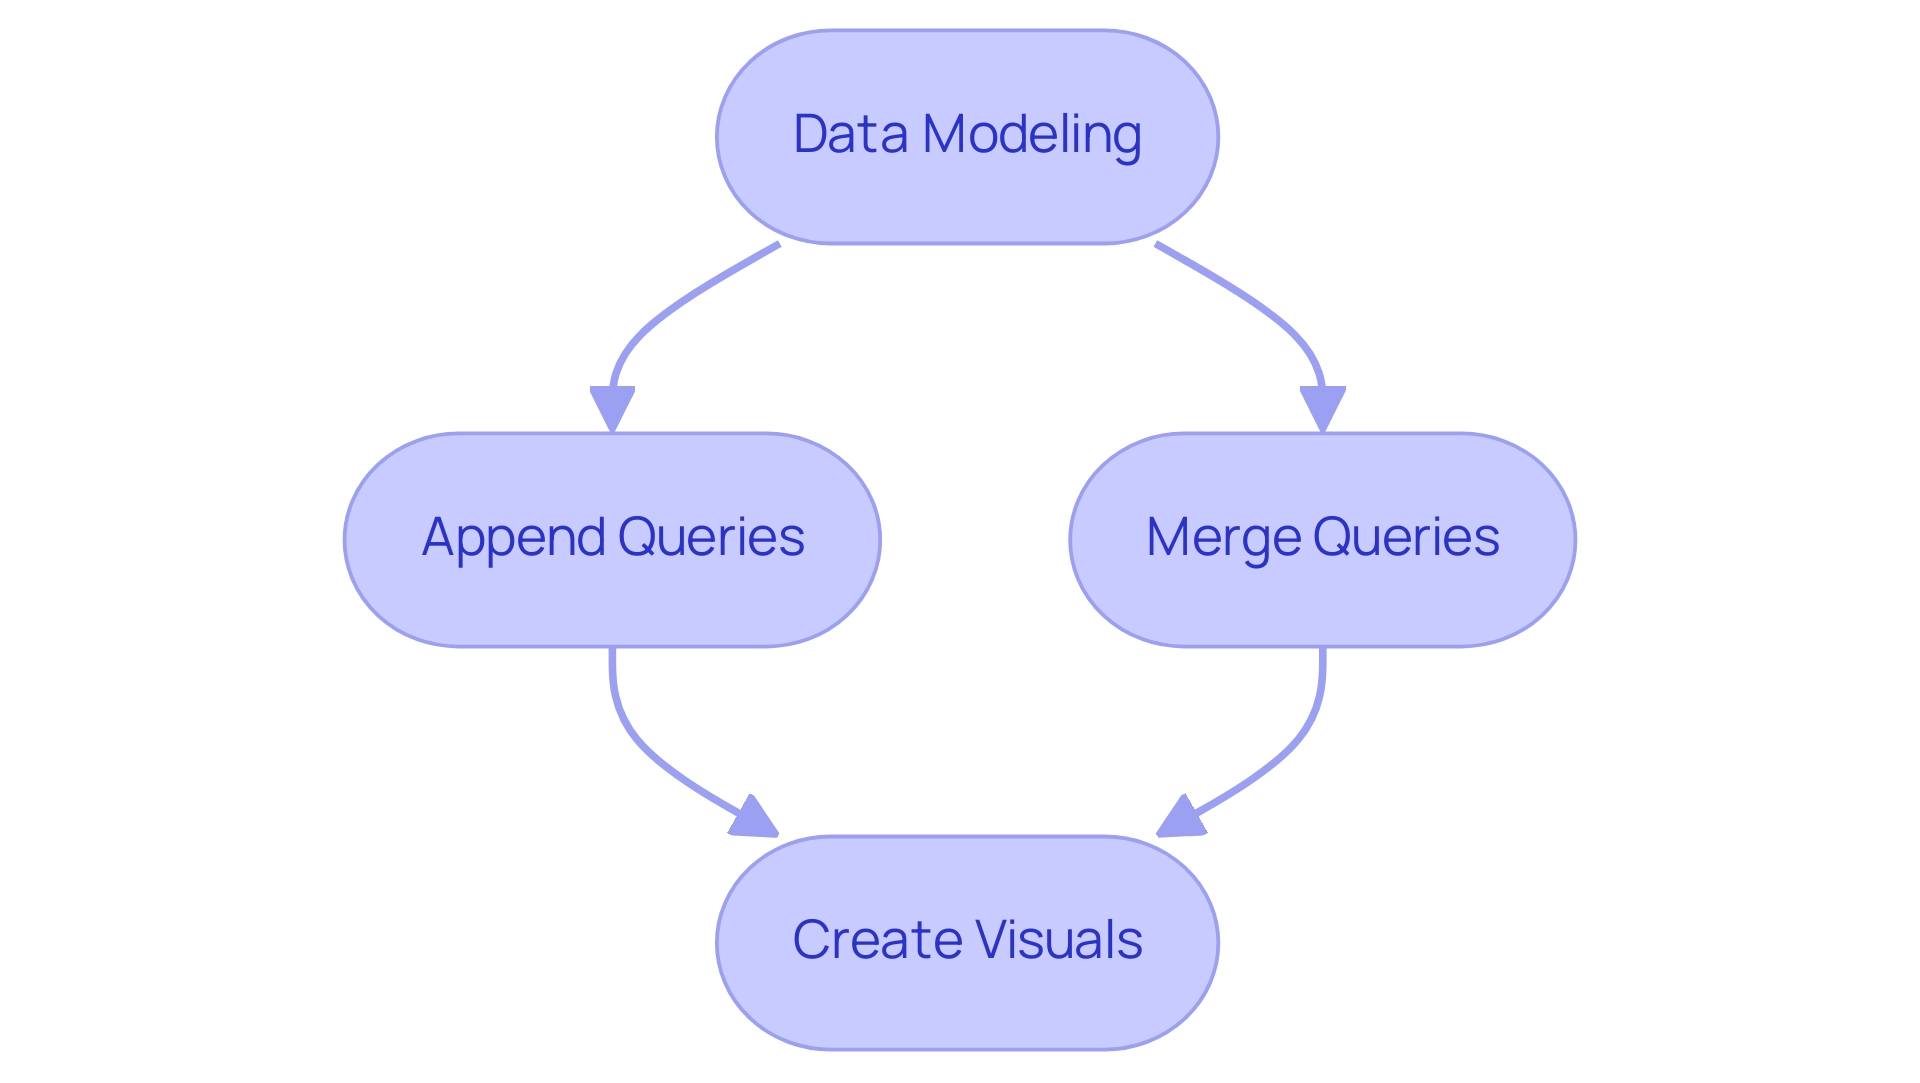
Conclusion
Power BI is a vital tool for organizations aiming to leverage their data effectively, offering diverse data sources that enhance operational efficiency and decision-making.
Recognizing the distinct roles of Power BI Desktop and Power BI Service is essential. Power BI Desktop is ideal for detailed analysis and report creation, while Power BI Service facilitates collaboration and real-time data access. Utilizing both environments allows organizations to optimize their data strategies and provide teams with timely insights.
Integrating cloud data sources such as Azure SQL Database, Salesforce, and Google Analytics further enhances Power BI’s capabilities, providing essential scalability and accessibility. This integration leads to actionable insights that can drive improvements in customer satisfaction and overall business performance.
The straightforward process of connecting data sources to Power BI empowers users of all technical levels, while the ability to merge data from multiple sources creates a comprehensive view that informs strategic decisions.
In conclusion, embracing Power BI not only streamlines data management but also equips organizations to excel in a competitive landscape. By leveraging its features and incorporating RPA solutions, businesses can transform raw data into valuable insights, fostering growth and operational effectiveness. Adopting Power BI is a strategic move toward achieving data mastery in today’s data-driven world.
Introduction
In a world where data drives decisions, Power BI emerges as a vital tool for organizations aiming to harness the full potential of their information. This powerful business analytics solution transforms raw data into insightful visualizations, enabling teams to make informed choices that propel growth and innovation.
As industries like Banking, Financial Services, and Insurance (BFSI) anticipate rapid advancements in business intelligence, the importance of mastering Power BI becomes increasingly clear. From streamlining report generation to enhancing data visualization and integration with other tools, Power BI equips organizations with the capabilities to overcome common challenges and improve operational efficiency.
This article delves into the essential features and best practices of Power BI, providing actionable insights that empower organizations to navigate their data analytics journey with confidence.
Introduction to Power BI: Understanding Its Role in Data Analytics
This tool, developed by Microsoft, distinguishes itself as a revolutionary business analytics instrument that enables organizations to perform data analytics using Power BI to visualize information and share understandings effectively. Its pivotal role in data analytics using Power BI lies in its ability to convert raw information into actionable insights, facilitating informed decision-making crucial for driving growth and innovation. As noted by Inkwood Research, the BFSI (Banking, Financial Services, and Insurance) sector will experience the fastest growth in the business intelligence market from 2023 to 2032, underscoring the significance of BI in this landscape.
With features like the 3-Day BI Sprint, organizations can swiftly produce professionally designed reports, overcoming the challenges of lengthy report generation and information inconsistencies. Furthermore, the General Management App supports comprehensive management and smart reviews, further enhancing reporting capabilities. Data analytics using Power BI connects effortlessly with numerous information sources, enhancing its flexibility for visualization, reporting, and knowledge sharing.
With a business intelligence tool generating a pre-constructed usage metrics document for content over the last 90 days, users can analyze data based on access methods and user engagement, which refreshes daily to offer continuous insights into document usage. This capability not only illustrates user engagement—where a viewer is defined as someone who has opened the report at least once—but also showcases how organizations can utilize BI to boost operational efficiency and productivity. Furthermore, integrating RPA solutions like EMMA RPA and Automate can streamline workflows and improve efficiency, enhancing employee morale.
Comprehending these functionalities is essential for fully leveraging BI’s potential and driving strategic initiatives. To explore how our RPA solutions can complement your use of BI, book a free consultation today.
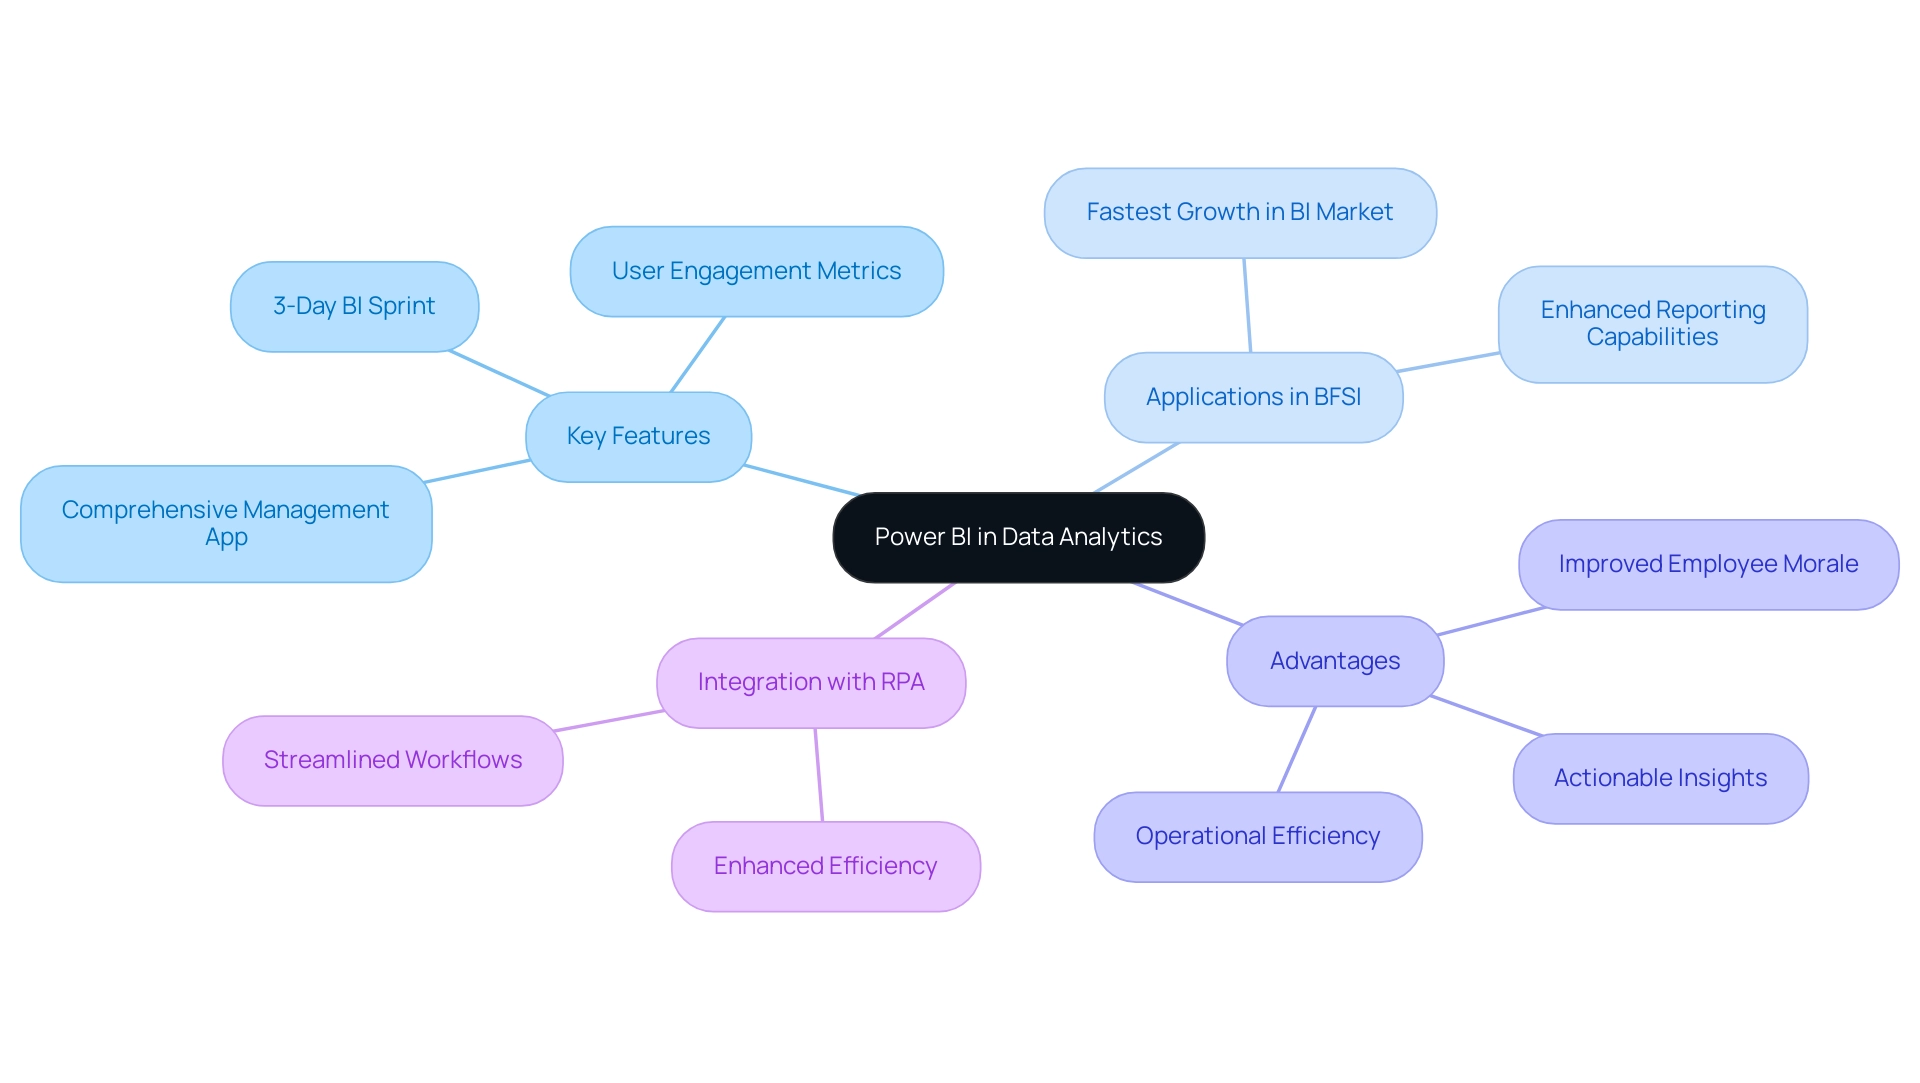
Getting Started with Power BI: Data Transformation and Report Building
To embark on your BI journey, begin by downloading the application from the official website and proceed with the installation. Once Power BI Desktop is configured, connect to your information source by choosing ‘Get Data.’ Choose from various formats such as Excel or SQL Server, and load your information into the platform.
With your information now at your fingertips, exploit the ‘Transform Data’ feature to meticulously clean and shape it. This stage is crucial—remove unnecessary columns or rows and ensure that all types are correct for optimal analysis. Once your information is prepared, you can begin creating documents by simply dragging and dropping fields onto the canvas.
Customize your visuals thoughtfully to convey insights effectively. However, numerous organizations encounter challenges such as:
- Time-consuming report creation
- Inconsistencies
- A lack of actionable guidance in their data analytics using Power BI
These challenges can result in a competitive disadvantage in today’s information-driven market. Significantly, 80% of organizations utilizing cloud-based BI have encountered enhanced scalability, highlighting the benefits of data analytics using Power BI in such environments.
Moreover, based on HG’s information, almost 2 million firms in the United States invested $22.7 billion in data analytics using Power BI solutions in 2023, emphasizing the importance of investing in tools such as BI. As the BFSI sector is expected to undergo the quickest expansion in the business intelligence market from 2023 to 2032, your efforts in mastering data analytics using Power BI will not only prepare information but also position your organization for significant decision-making and informed strategies. By integrating RPA solutions, you can automate repetitive tasks, thereby enhancing operational efficiency and addressing the challenges related to management and reporting.
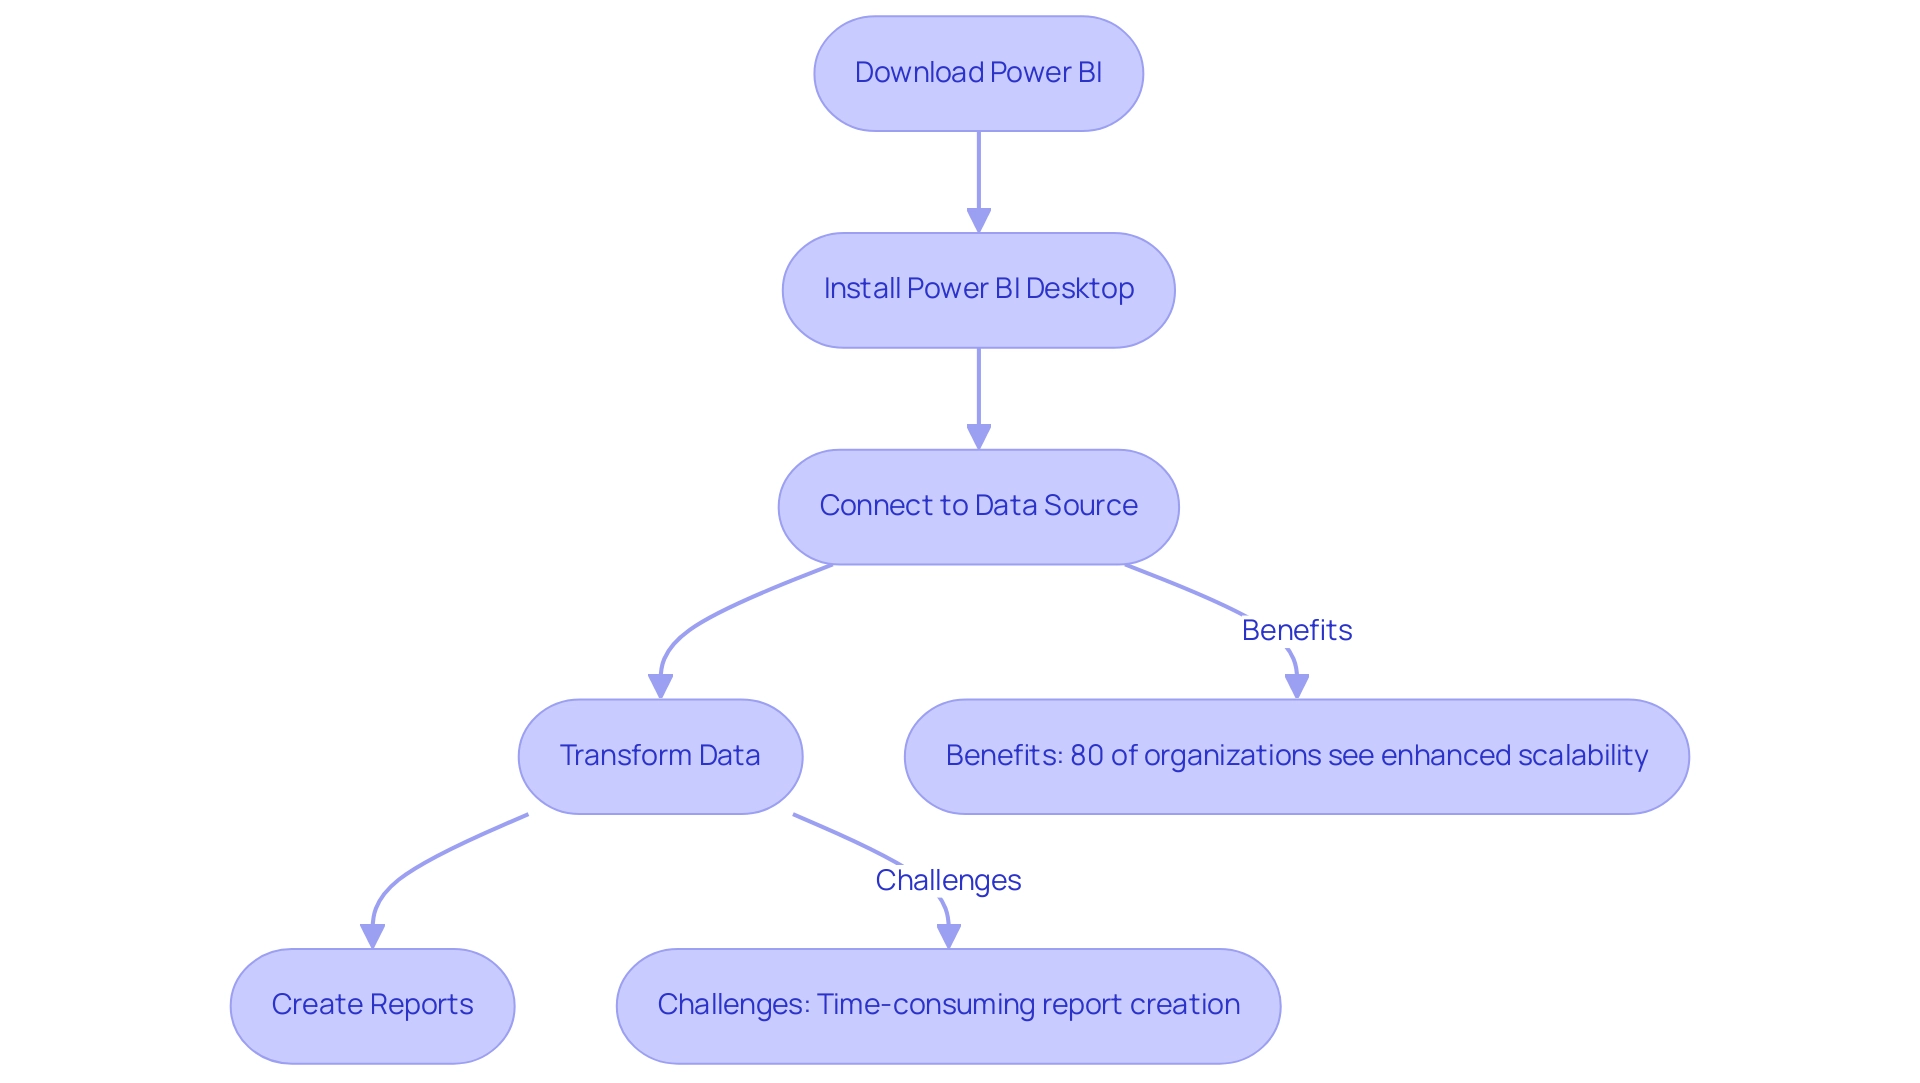
Advanced Power BI Techniques: Mastering Data Modeling and DAX
Modeling information in data analytics using Power BI is an essential process that enables you to establish connections between different tables, ultimately providing a comprehensive view of your datasets. In today’s data-rich environment, where extracting actionable insights is essential for business growth, data analytics using Power BI allows you to navigate to the ‘Model’ view to establish these critical relationships by simply dragging fields. Understanding the context of these relationships is vital; it’s essential to note that only one active relationship can exist between two tables at any given time, while additional relationships remain inactive.
This design helps prevent conflicting outcomes in your analysis and addresses common challenges such as inconsistencies and task repetition fatigue, which can lead to staffing shortages within teams.
A powerful tool at your disposal is DAX (Data Analysis Expressions), a robust formula language that allows you to generate custom calculations tailored to your business needs. Mastering fundamental functions such as SUM, AVERAGE, and COUNT is the first step in your DAX journey. As you gain confidence, delve into more complex functions like CALCULATE and FILTER, which enable sophisticated analytical capabilities and help overcome the time-consuming report creation process often experienced in BI.
Consider integrating case studies such as the management of active and inactive relationships, which illustrate the importance of leveraging inactive relationships through DAX expressions or duplicate dimension tables. This approach not only enhances your modeling flexibility but also maintains optimal performance in data analytics using Power BI, driving insights that are essential for operational efficiency. Furthermore, employing RPA solutions such as EMMA RPA and Automate can greatly reduce task repetition fatigue, enhancing information management and reporting processes.
To further bolster your DAX proficiency, take advantage of the wealth of resources available in BI community forums and Microsoft documentation. Continuous learning is key, and as Amitabh Saxena emphasizes, “Enroll Now” in the upcoming training sessions scheduled for July 30, 31, August 1, 4, 5, 6, 7, 8, 11, 12, and continuing through August 26, 2025. These sessions will be instrumental in assisting you in mastering the latest advancements in modeling techniques, including DAX usage for complex calculations, ultimately empowering you to leverage Business Intelligence effectively.
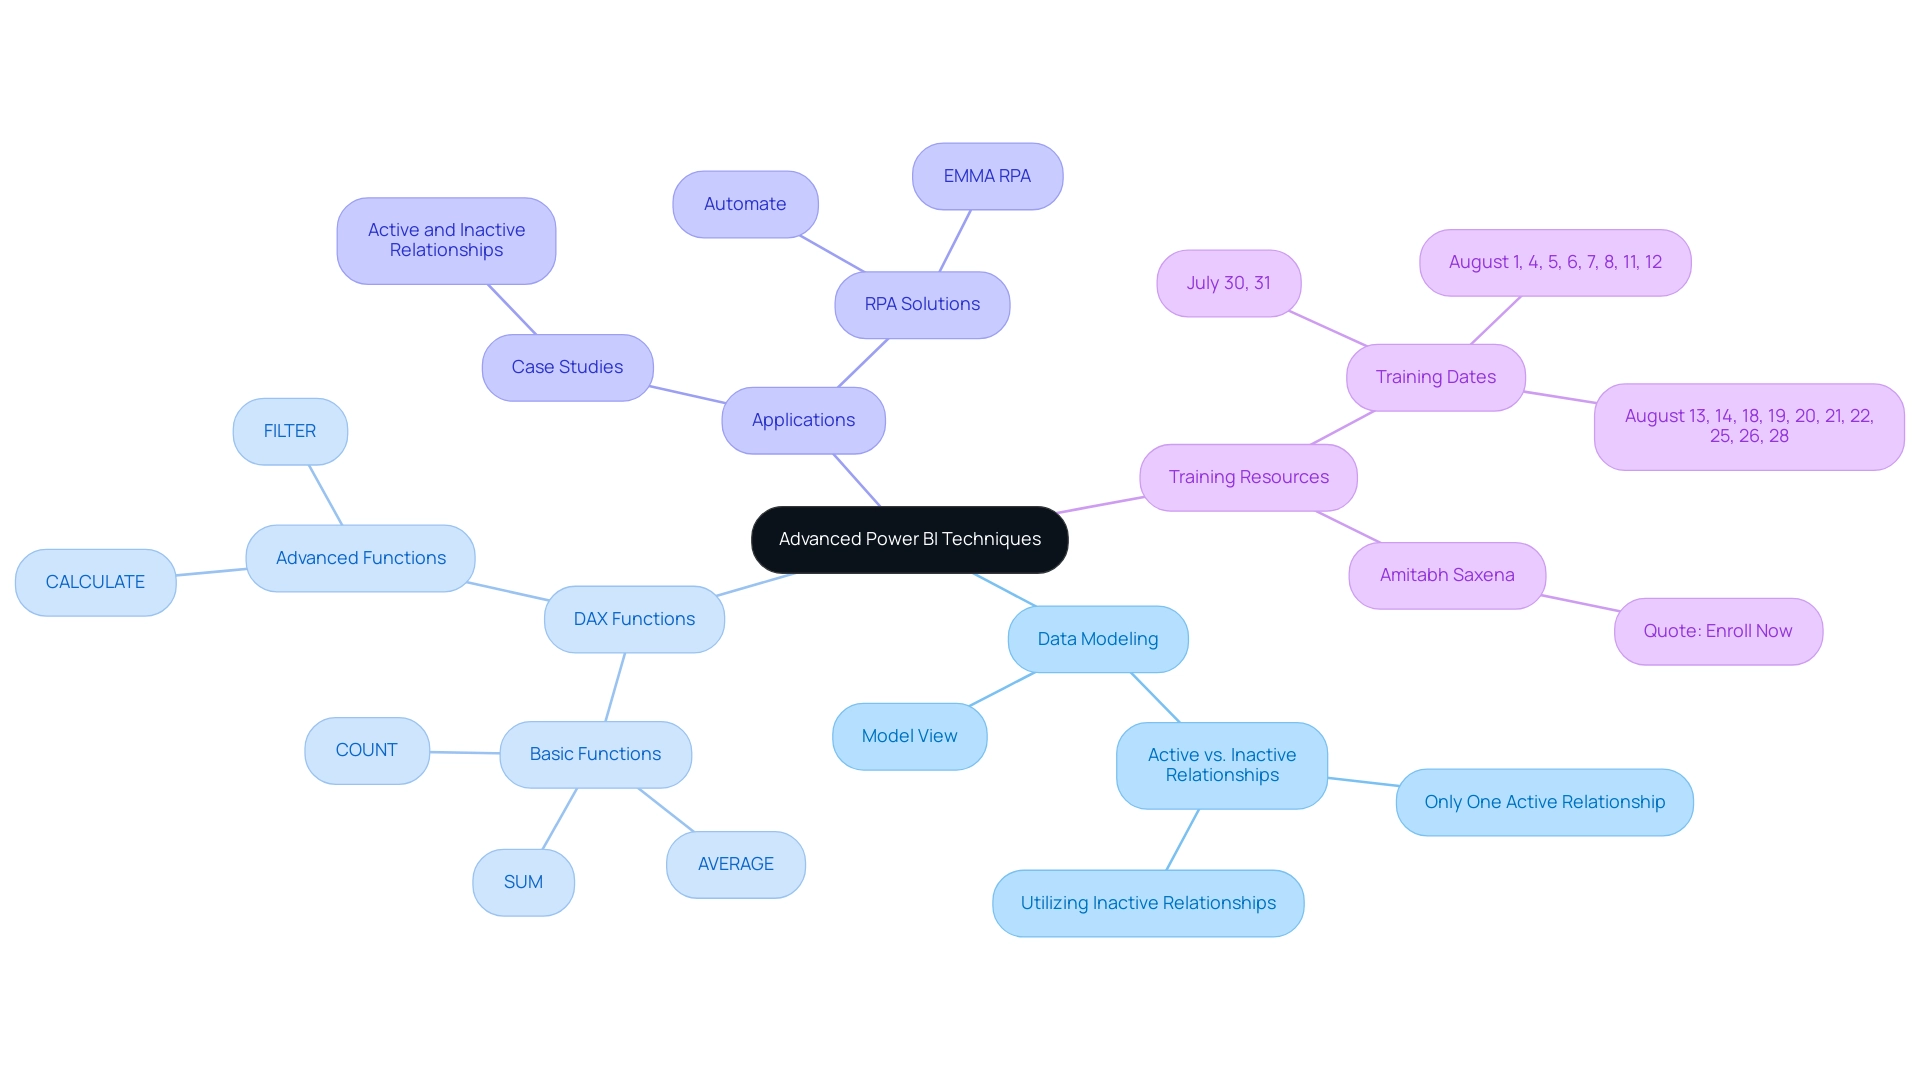
Creating Effective Visualizations in Power BI: Best Practices
Developing impactful visual representations in BI requires a clear comprehension of your audience and the messages you intend to convey. Selecting the appropriate chart type is essential; for instance:
- Bar charts excel at illustrating comparisons.
- Line charts effectively showcase trends over time.
- Pie charts are ideal for displaying parts of a whole.
Integrating Robotic Process Automation (RPA) tools like EMMA RPA or Microsoft Power Automate can further improve this process by automating repetitive tasks related to information preparation, enabling your team to concentrate on strategic insights instead of manual document creation.
It’s also important to consider accessibility, as around 1% of women have some form of color blindness, impacting how your visuals are perceived. To maintain clarity and enhance readability, limit the number of visuals on each page—this prevents clutter and facilitates user engagement. Furthermore, harnessing features such as tooltips and drill-through capabilities provides additional context without overwhelming users.
As Microsoft emphasizes, ‘Environmental, Social, and Governance (ESG) reporting is becoming a priority for businesses worldwide,’ making effective information storytelling increasingly essential. Consistency in color schemes and font choices is equally crucial, as it contributes to a polished, professional appearance that aids interpretation. Always take the time to preview your reports and solicit feedback; this iterative process is vital for refining your visual storytelling.
The integration of Business Intelligence tools, such as data analytics using Power BI’s built-in analytics features, can help ensure consistency, transforming raw information into actionable insights, thereby driving growth and innovation. For example, the case study titled ‘Help the User’ illustrates how combining documentation and help icons can assist users in navigating the dashboard, making exploration intuitive and informative. Additionally, a real-world example of a company that implemented RPA and BI integration led to a 30% reduction in report preparation time, showcasing the tangible benefits of these technologies.
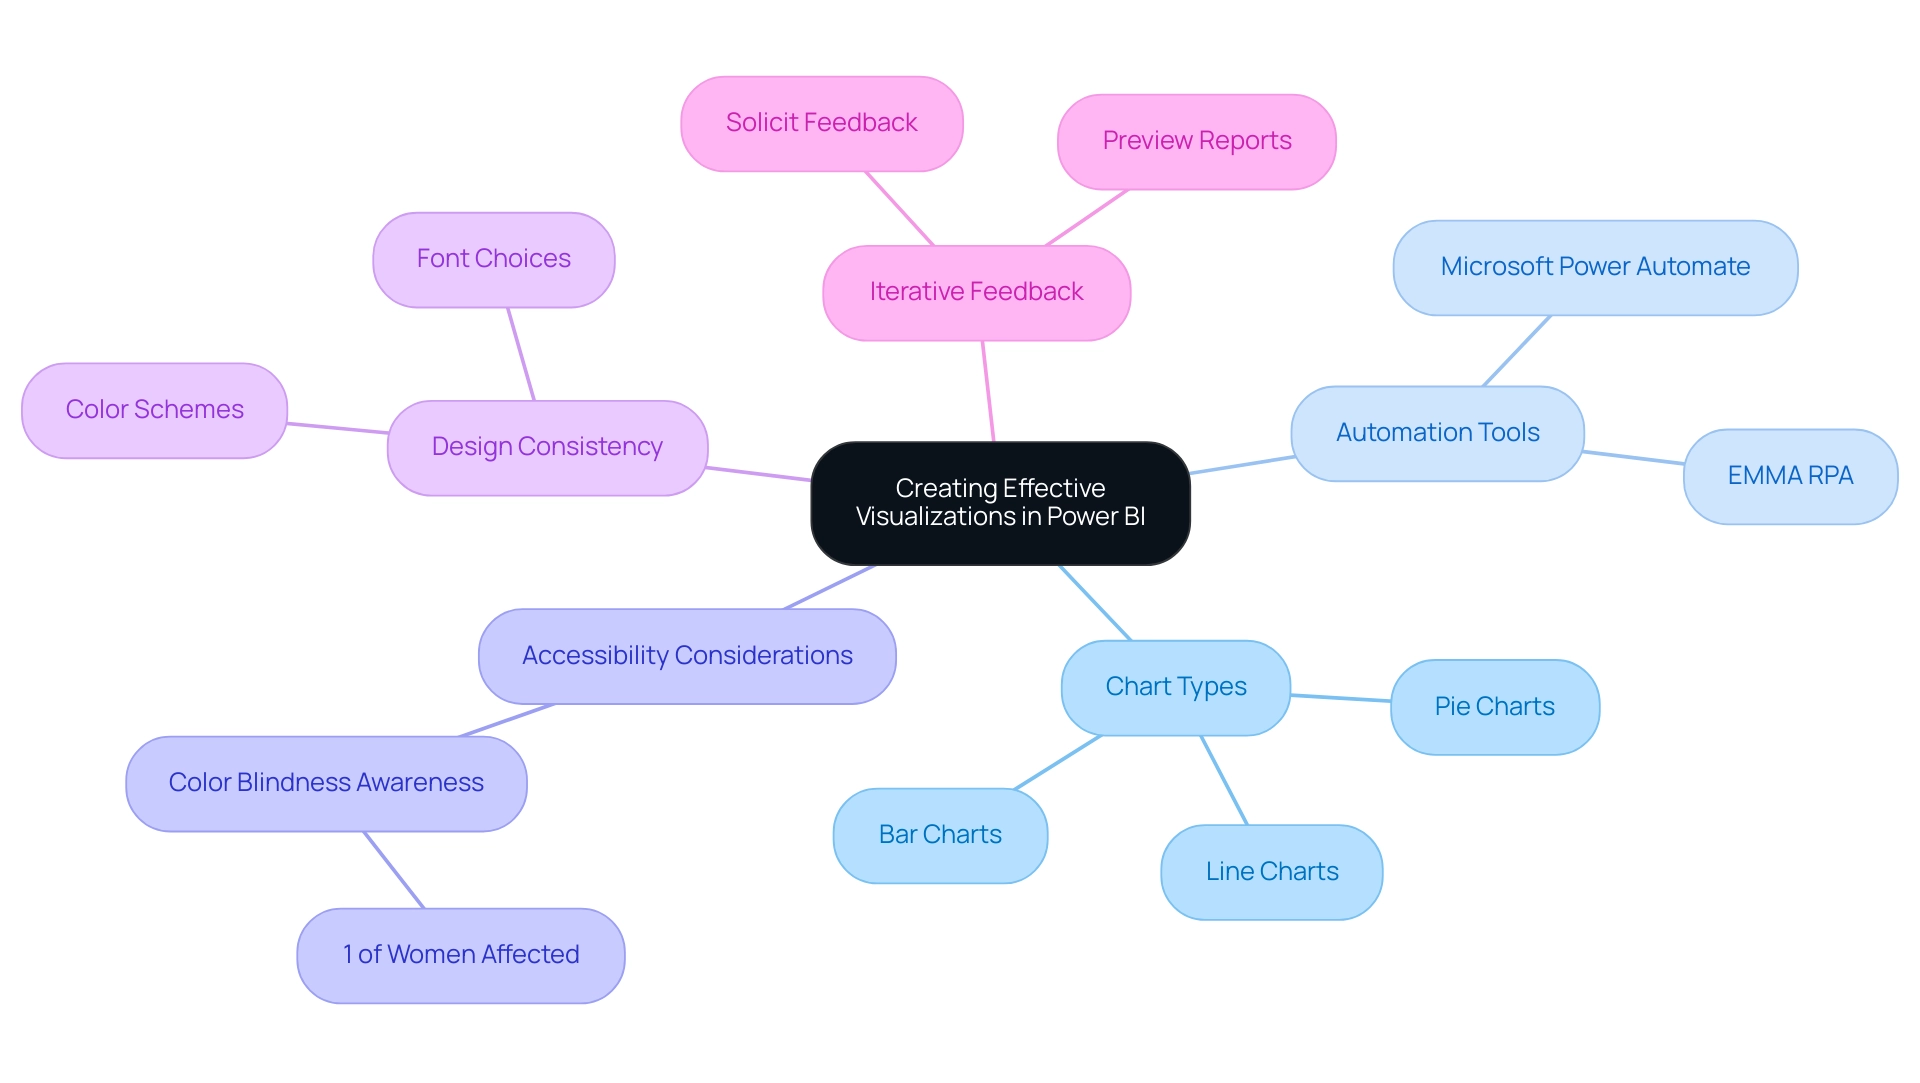
Integrating Power BI with Other Tools: Enhancing Your Data Analysis Workflow
BI not only provides smooth integration with a broad range of tools, including Microsoft Excel, Azure, and SQL databases, but also acts as a strong partner in improving your analysis workflows. With the ability to manage up to 100 TB of information, BI guarantees effective oversight of even the largest datasets. As noted by Jamie O’Brien, ‘Microsoft was named a Leader for the seventeenth year in a row’ in the 2024 Gartner Magic Quadrant for Analytics and Business Intelligence Platforms, underscoring the platform’s strength in the analytics space.
To enhance information preparation, utilize Query for importing and shaping content from various sources before analysis in BI. Linking BI with Azure enables real-time information processing, improving the immediacy and relevance of your insights. Furthermore, the new BI add-in for PowerPoint allows users to integrate live, interactive visuals into presentations, providing an appealing substitute for static screenshots.
Through our 3-Day Power BI Sprint, we promise to deliver a fully functional, professionally designed report tailored to your needs, demonstrating the effectiveness of data analytics using Power BI in addressing common challenges such as:
- Time-consuming report creation
- Data inconsistencies
Case studies, such as automating reporting with Coupler.io, illustrate how clients have saved time and resources, empowering their teams to prioritize strategic initiatives over routine updates. This allows you to focus on leveraging insights for impactful business decisions.
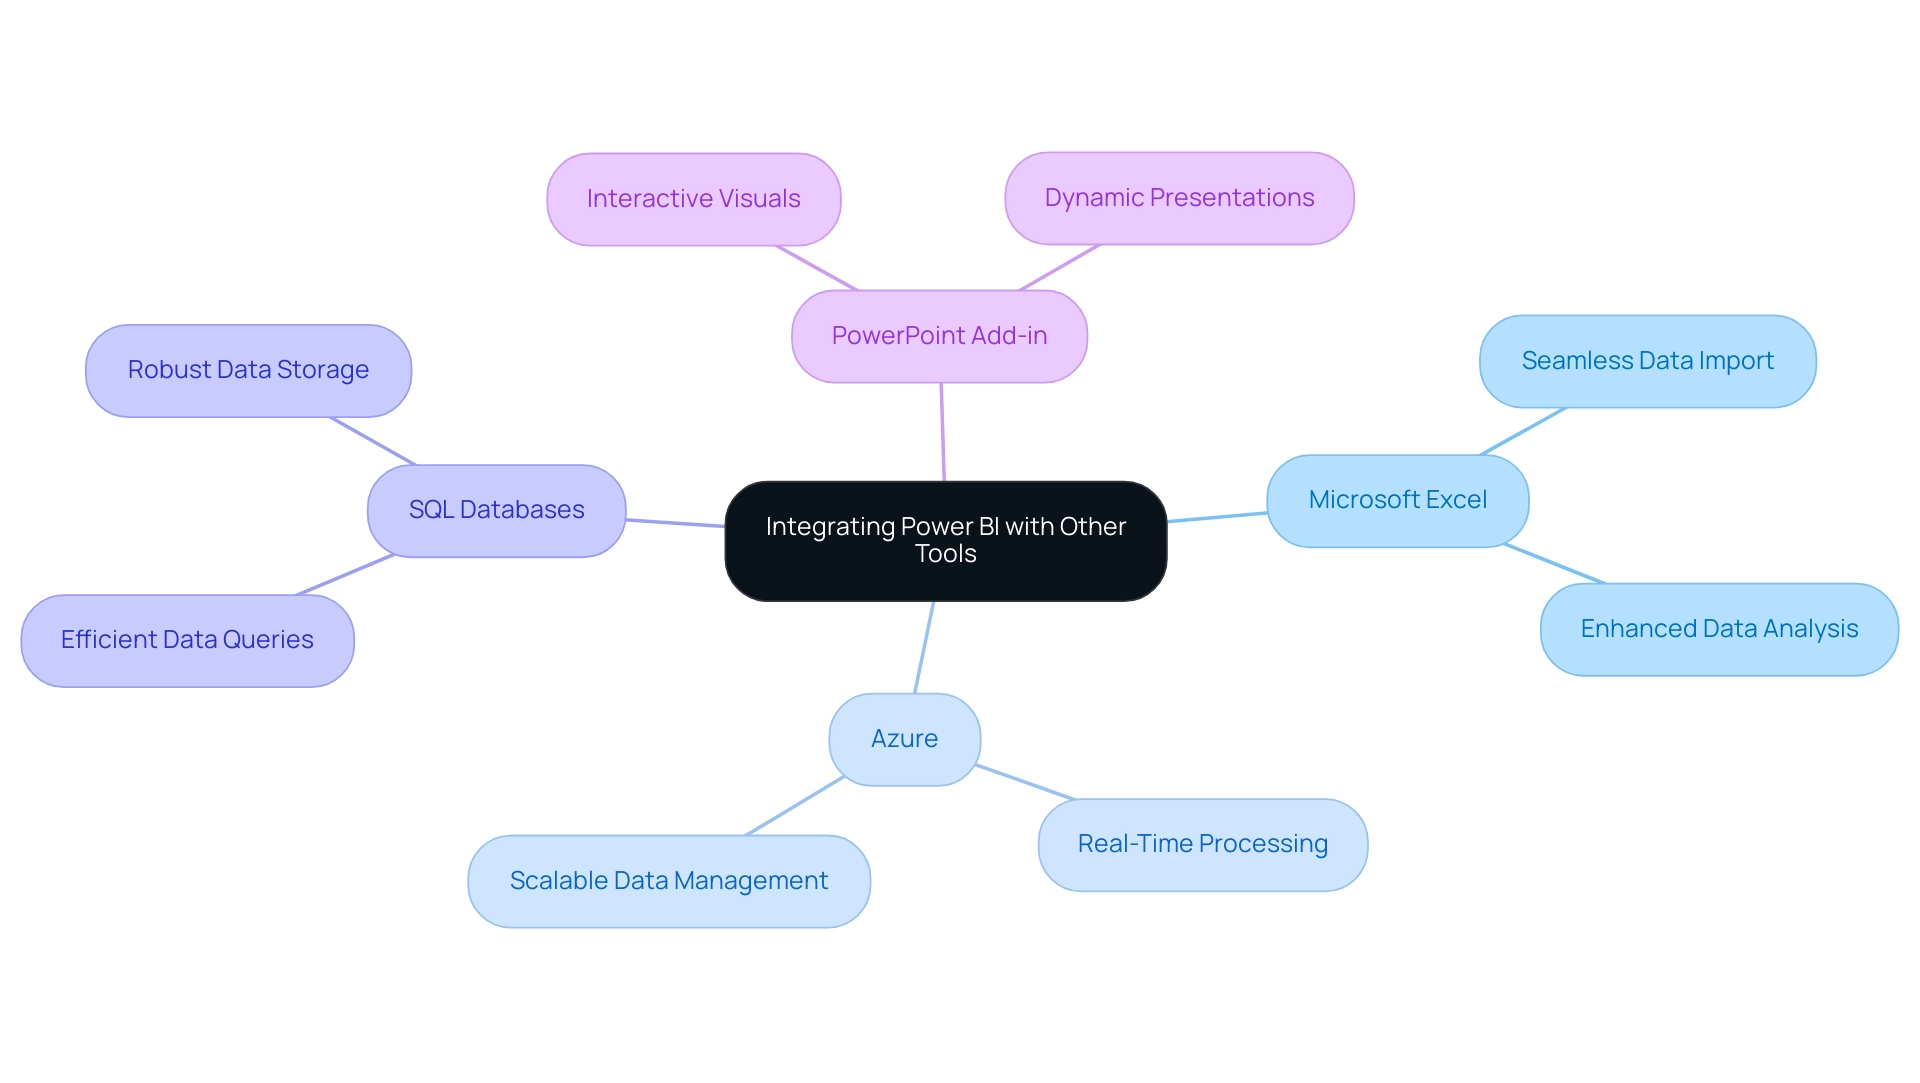
Conclusion
Power BI stands as a transformative force in the realm of data analytics, enabling organizations to convert raw data into actionable insights that fuel growth and innovation. Throughout this article, the essential features of Power BI have been explored, from its user-friendly report-building capabilities to advanced data modeling techniques and effective visualization practices. The integration of Power BI with RPA solutions exemplifies how organizations can streamline their workflows, reduce report preparation times, and enhance operational efficiency.
Mastering Power BI is not merely about gaining technical skills; it’s about empowering teams to make informed decisions that drive strategic initiatives. By leveraging features such as:
- Data transformation
- DAX calculations
- Seamless integration with other tools
organizations can unlock the full potential of their data. This positions them to navigate the complexities of today’s data-driven landscape with confidence.
Ultimately, the journey with Power BI is one of continuous learning and adaptation. As industries like Banking, Financial Services, and Insurance experience rapid advancements in business intelligence, embracing Power BI becomes imperative. The insights gained from this powerful tool can lead to significant competitive advantages, ensuring that organizations not only keep pace with industry trends but also set the stage for future success.
Introduction
In the dynamic landscape of data analytics, organizations are increasingly turning to Power BI embedding to enhance their operational efficiency and improve decision-making processes. By effectively integrating Power BI into their applications, companies can unlock a wealth of data-driven insights that empower teams to act swiftly and strategically.
However, embarking on this journey requires a solid understanding of key requirements, advanced techniques, and best practices that ensure a seamless and secure embedding experience. From establishing the right licenses and workspaces to leveraging automation tools and maintaining robust security protocols, this article delves into the essential elements that organizations must consider to optimize their Power BI embedding strategy.
By following these guidelines, businesses can not only streamline their reporting processes but also foster a culture of data-driven decision-making that propels them towards success.
Getting Started with Power BI Embedding: Key Requirements and Setup
To embark on a successful journey utilizing Power BI embedding, entities must prioritize several key requirements that align with the overarching goals of enhancing operational efficiency and leveraging data-driven insights. Firstly, obtaining a Power BI Pro or Premium license is crucial, as these licenses enable users to share content and embed documents seamlessly within applications, ultimately facilitating informed decision-making. Recent statistics indicate that a significant percentage of organizations are leveraging these licenses, underscoring their value in enhancing collaborative analytics and operational effectiveness.
Establishing a dedicated workspace within Power BI Service is also critical for effectively organizing reports and dashboards, improving accessibility, and addressing challenges such as inconsistencies. This structured environment aligns with the latest updates from Microsoft Fabric, emphasizing the management of all Power BI content within workspaces to ensure security and control over access. Organizations can choose between:
- User-based authentication, which allows individual users to log in, or
- Service principal authentication, designed for automated processes and providing a seamless experience without user intervention.
It’s important to note that the authentication token lifetime is controlled by Microsoft Entra settings, typically lasting one hour. Comprehending the differences among these authentication techniques is essential for choosing the most appropriate choice for your operational workflow, particularly in addressing time-consuming document creation.
Furthermore, companies can gain from practical illustrations, such as the ADWISE Advanced Column visual, which improves readability and reinforces corporate identity through customizable formatting options. This visual facilitates straightforward comparison of values with interpretable difference lines, making it appropriate for contrasting time periods or categories, thus driving actionable insights.
Moreover, integrating RPA solutions can further enhance operational efficiency by automating repetitive tasks related to document generation and data preparation. By reducing the time spent on these tasks, companies can focus more on analyzing insights rather than getting bogged down in manual processes.
Finally, it is vital for firms to familiarize themselves with Power BI embedding using the Power BI REST API. This powerful tool offers various endpoints for embedding reports and dashboards, managing datasets, and more, enabling a comprehensive embedding experience. As Jason Himmelstein noted, ‘We’ve now consolidated similar options and streamlined the button text for better readability and responsive screen sizing.’
By establishing these foundational elements, entities can effectively position themselves for success in Power BI embedding, which ultimately enhances their business intelligence capabilities and operational efficiency.
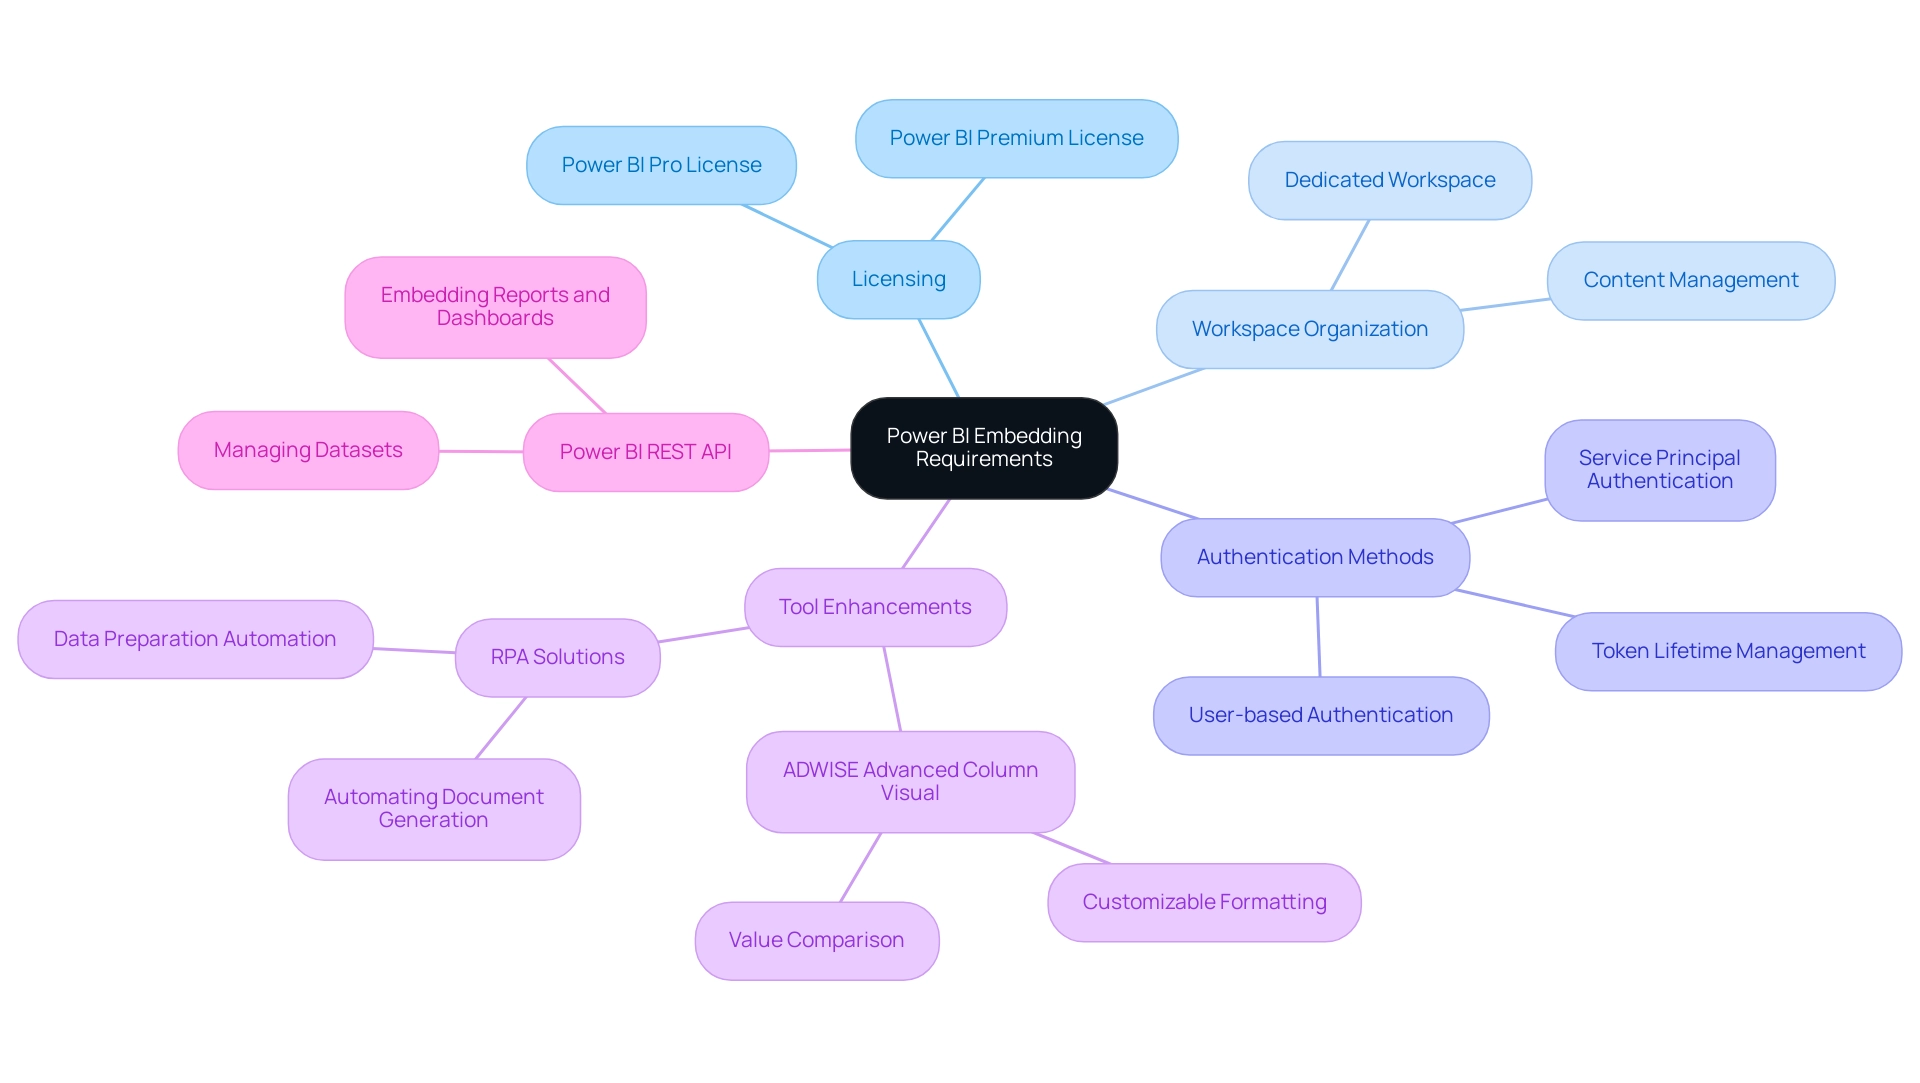
Advanced Techniques for Effective Power BI Embedding
To fully leverage Power BI embedding, organizations should prioritize utilizing the Power BI JavaScript API, which significantly enhances interactivity and audience engagement. This API enables developers to enhance embedded Power BI visualizations with features like bookmarks, filters, and drill-through capabilities, permitting individuals to engage with data in a more impactful way. As mentioned by Josh Caplan, Principal Group Program Manager, “For instance, you could access a document for a particular client and modify that client automatically as the individual interacts with other sections of your application.”
This flexibility ensures that insights are not just static but instead evolve as user interactions unfold, addressing the common challenge of time-consuming document creation and facilitating quicker decision-making.
Incorporating responsive design principles is another advanced technique that organizations should adopt. By designing embedded reports that adjust seamlessly to various screen sizes and resolutions, businesses can deliver a consistent and user-friendly experience across all devices. This adaptability enhances accessibility and significantly boosts client satisfaction.
Significantly, statistics from mobile app analytics dashboards indicate that entities utilizing responsive design have seen a 30% increase in user retention and engagement, which is critical in a data-rich environment where extracting actionable insights can be challenging.
Moreover, integrating Robotic Process Automation (RPA) tools like EMMA RPA and Power Automate can further enhance operational efficiency. These tools automate repetitive tasks and streamline processes, enabling organizations to concentrate on strategic decision-making instead of time-consuming documentation creation. For instance, EMMA RPA can automate information gathering and report creation, significantly reducing the time required to generate insights through Power BI embedding.
Maintaining robust security and performance is critical. Implementing row-level security (RLS) within Power BI is essential for limiting access to information based on roles. This practice protects sensitive information, ensuring that only authorized individuals can access specific elements.
Effectively utilizing RLS not only preserves information integrity and compliance but also tailors insights to meet user needs. A relevant example is the Client Data Accuracy Dashboard, which ensures that all patient data is accurate and complete, enabling healthcare businesses to leverage their data for smart decision-making and growth, with a focus on data privacy and security.
Ultimately, entities must commit to continuous monitoring and optimization of their Power BI embedding environment. Utilizing analytics provided by Power BI helps track usage patterns, identify performance bottlenecks, and optimize loading times. The Key Metric Alert feature identifies top movers and losers with their usage behavior, offering prior period calculations and daily averages to visualize client trends effectively.
Consistently assessing these metrics allows entities to make data-informed choices that improve their embedding strategy, ultimately enhancing the experience for individuals and addressing the challenges linked to utilizing BI insights.
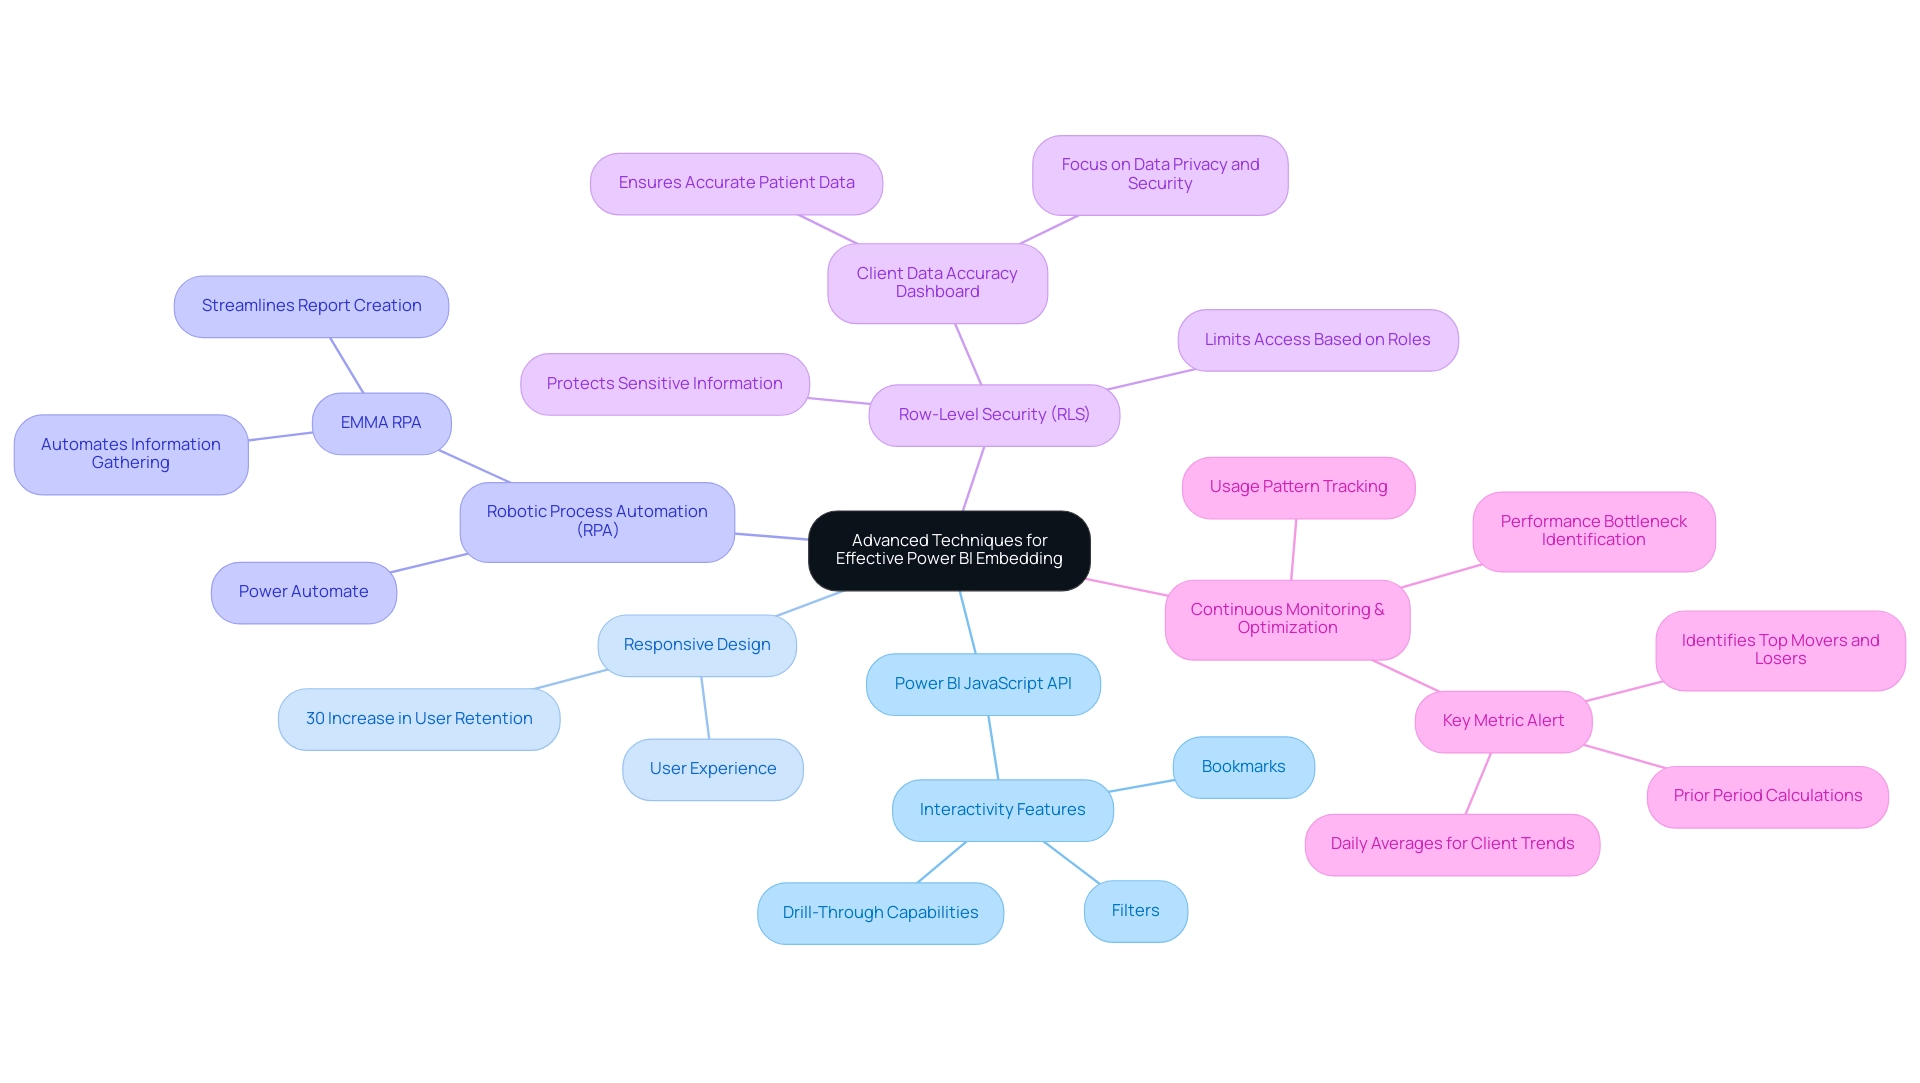
Best Practices for User Experience in Power BI Embedding
To enhance the experience of Power BI embedding, organizations should prioritize simplicity and clarity in their design. This involves using clear headings and concise labels, along with visually distinct elements that allow individuals to navigate reports effortlessly. Applying uniform color themes and visual styles not only assists in navigation but also enables individuals to connect particular visual cues with related information points.
Importantly, focus on color selections is essential; a case study on color considerations for individuals with color vision deficiency shows that careful color choices can greatly improve inclusivity, enabling everyone, regardless of visual capability, to understand information precisely and minimizing frustration. As DataRich, a new member, noted, ‘As someone who is partially color-blind, I appreciate the mention of that.’ This personal perspective emphasizes the significance of inclusive design.
Interactivity is highlighted as another essential aspect of experience. Incorporating features such as tooltips, filters, and slicers empowers individuals to explore data dynamically, providing them with control over how they view and interact with information. By incorporating these interactive components, entities can promote greater involvement and contentment among individuals.
Furthermore, actively considering feedback from participants during the design process is crucial. Carrying out testing sessions can reveal important insights into interactions with documents, emphasizing aspects that may need improvement. Iterating on design based on user feedback guarantees that companies produce documents that are not only effective but also enjoyable to utilize, ultimately fostering a more positive perception of the information experience.
To further improve operational efficiency, companies should consider implementing RPA solutions such as EMMA RPA and Power Automate to automate repetitive tasks involved in document generation. This not only decreases the time spent on document creation but also minimizes discrepancies in information and addresses the absence of actionable guidance by streamlining the documentation process. By enhancing information management through one-to-many tables or creating intermediate tables instead of bi-directional and many-to-many relationships, entities can improve clarity in reporting.
Finally, with a company rating of 4.7 out of 5 from 32 Google reviews, it is evident that individuals are pleased with the documents, further highlighting the significance of prioritizing customer experience.
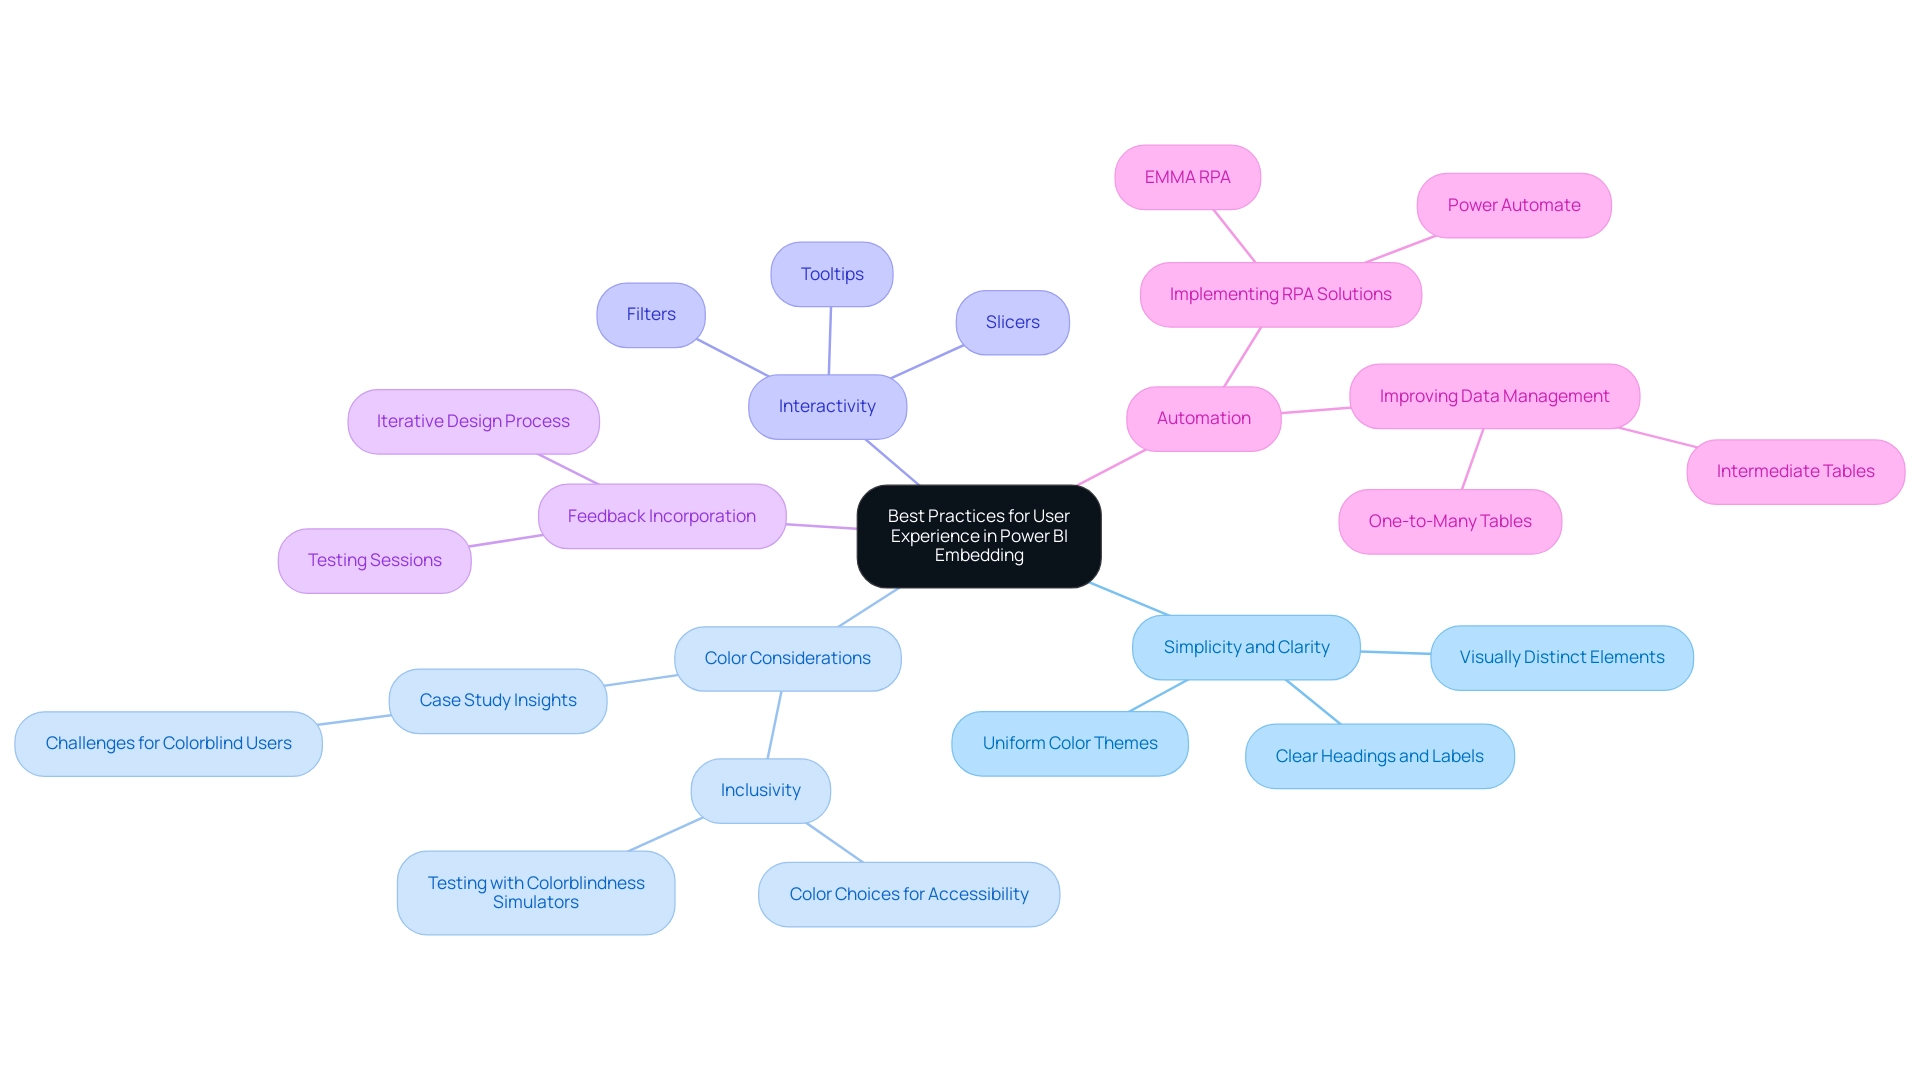
Ensuring Data Security and Compliance in Power BI Embedding
To protect information security and guarantee adherence while utilizing the insights obtained from Power BI analysis, companies must implement strict access controls. Implementing role-based access control (RBAC) is essential; it enables entities to limit access to confidential information based on user roles, ensuring that only authorized individuals can view specified documents. This focused method not only improves security but also conforms to optimal standards for data management, empowering teams to concentrate on actionable insights instead of becoming overwhelmed by creation difficulties.
Our 3-Day Power BI Sprint directly tackles these issues by allowing entities to swiftly produce a fully operational, professionally crafted document on a subject of their choice. This report not only serves immediate analytical needs but can also be used as a template for future projects, ensuring a professional design from the start.
User authentication in Power BI follows the Microsoft Entra auth code grant flow, bolstering the security framework and facilitating seamless integration with Creatum’s comprehensive services. Regular audits and monitoring of user activity are essential for maintaining compliance; entities should conduct periodic reviews of user permissions and access logs to detect unauthorized access attempts or irregularities.
Utilizing Power BI’s integrated compliance capabilities, such as information loss prevention (DLP) policies, greatly assists entities in handling sensitive information efficiently.
Keeping up with pertinent protection regulations, including GDPR and HIPAA, is crucial for aligning embedding practices with legal standards. Furthermore, implementing encryption for both information at rest and in transit provides an extra layer of security, safeguarding sensitive details against potential breaches. By prioritizing these information security practices alongside the advantages of our 3-Day Power BI Sprint, companies can create a secure environment for their analytics initiatives, ultimately empowering them to draw meaningful insights that drive operational efficiency.
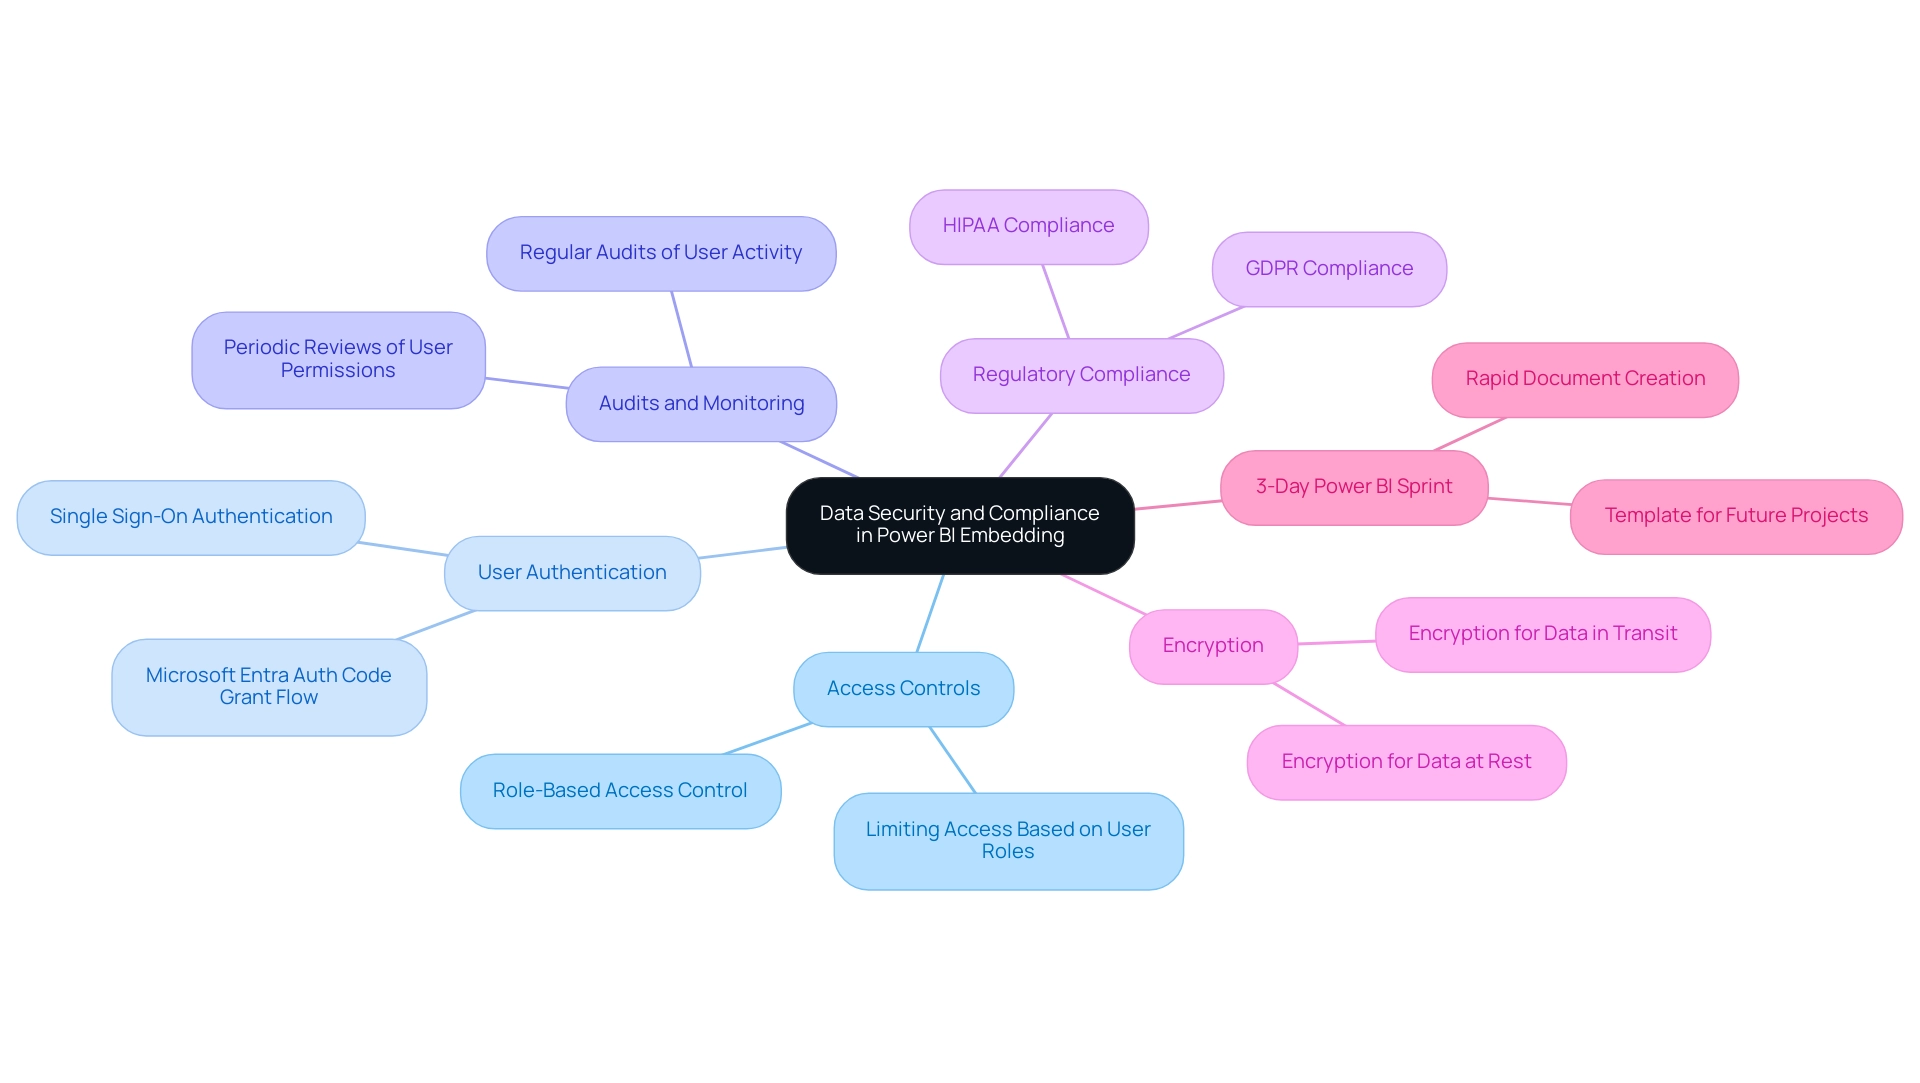
Optimizing Performance for Embedded Power BI Reports
To improve the performance of powerbi embedding visuals, organizations must tackle common challenges such as:
- Time-consuming creation processes
- Inconsistencies in information
- Lack of actionable guidance
A clear governance strategy is essential to ensure consistency and build trust in the insights generated. Prioritizing the minimization of complexity in the document is crucial; reducing the number of visuals on each page can prevent overload that significantly slows down loading times.
Limiting excessive filters or slicers is equally important, as they may complicate queries and adversely affect performance. Additionally, evaluating custom visuals for performance is essential to avoid hindering report efficiency.
Integrating aggregations can further enhance performance. By creating consolidated tables that summarize information at higher levels, entities can reduce the volume that Power BI processes, resulting in faster loading times.
While utilizing DirectQuery allows for real-time data access, it’s vital to be aware of the potential performance trade-offs associated with this method. Verifying the Assume Referential Integrity setting in relationships can also optimize query performance in DirectQuery sources, providing an added layer of efficiency.
Regularly monitoring performance metrics in Power BI is essential for identifying enhancement opportunities. Tools such as Power BI Performance Analyzer offer comprehensive insights into the time required for each operation within a document, assisting businesses in identifying slow-performing queries or visuals.
For instance, the case study titled ‘Optimizing Visual Interactions‘ illustrates that every visual in Power BI interacts with others through cross-filtering or cross-highlighting. Evaluating these interactions is important for relevance; removing unnecessary interactions can significantly enhance the report’s effectiveness and user experience. By making data-driven adjustments based on these insights and establishing a robust governance strategy, organizations can unlock the full potential of their Power BI dashboards, especially through powerbi embedding, ensuring that insights lead to informed decision-making that drives growth and innovation.
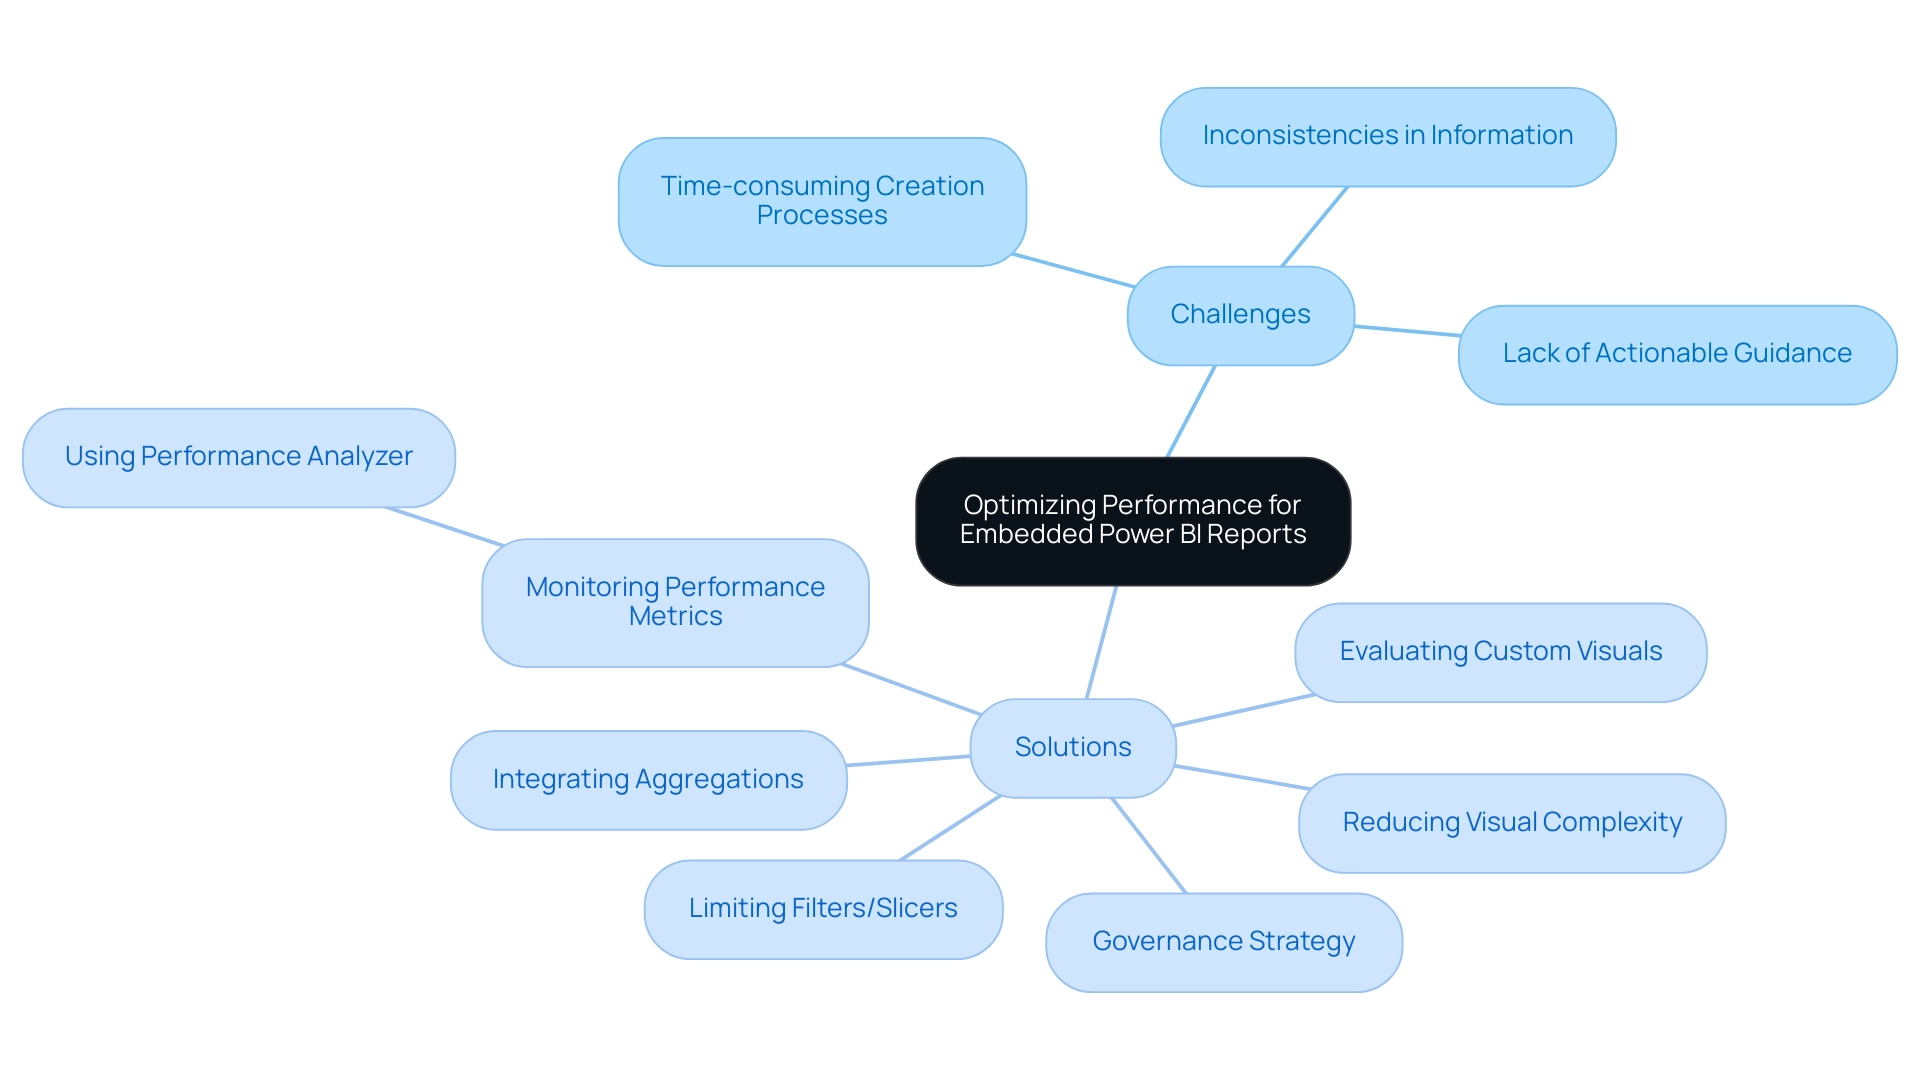
Conclusion
Embarking on the journey of Power BI embedding opens up a world of possibilities for organizations seeking to enhance their operational efficiency and foster data-driven decision-making. By prioritizing essential requirements such as:
- Securing the appropriate licenses
- Establishing dedicated workspaces
- Implementing robust authentication methods
businesses can lay a solid foundation for their embedding strategy. The integration of advanced techniques like the Power BI JavaScript API and responsive design further empowers teams to engage with data dynamically, promoting quicker insights and informed actions.
Moreover, focusing on user experience through simplicity, interactivity, and inclusivity ensures that reports resonate with all users, driving engagement and satisfaction. Employing best practices for data security and compliance, including:
- Role-based access control
- Regular audits
safeguards sensitive information while aligning with regulatory standards.
Ultimately, organizations that commit to continuous optimization and performance monitoring will not only enhance their Power BI embedding experience but will also cultivate a culture of strategic decision-making. By harnessing the full potential of Power BI, businesses can unlock valuable insights that propel them towards greater success, ensuring they remain agile and competitive in today’s data-driven landscape.
