Introduction
In the realm of operational excellence, the significance of Center of Excellence (COE) reporting cannot be overstated. As organizations strive to enhance performance and drive strategic initiatives, effective COE reporting emerges as a critical tool for uncovering insights that propel continuous improvement.
By harnessing advanced technologies such as Robotic Process Automation (RPA) and data visualization tools like Power BI, businesses can streamline their reporting processes, reduce inefficiencies, and foster a culture of accountability and collaboration.
This article delves into the fundamentals of COE reporting, offering practical strategies for implementation, overcoming common challenges, and embracing future trends that will shape the landscape of organizational reporting.
As companies navigate the complexities of data management, understanding how to leverage these insights will empower them to make informed decisions and achieve lasting success.
Understanding the Fundamentals of COE Reporting
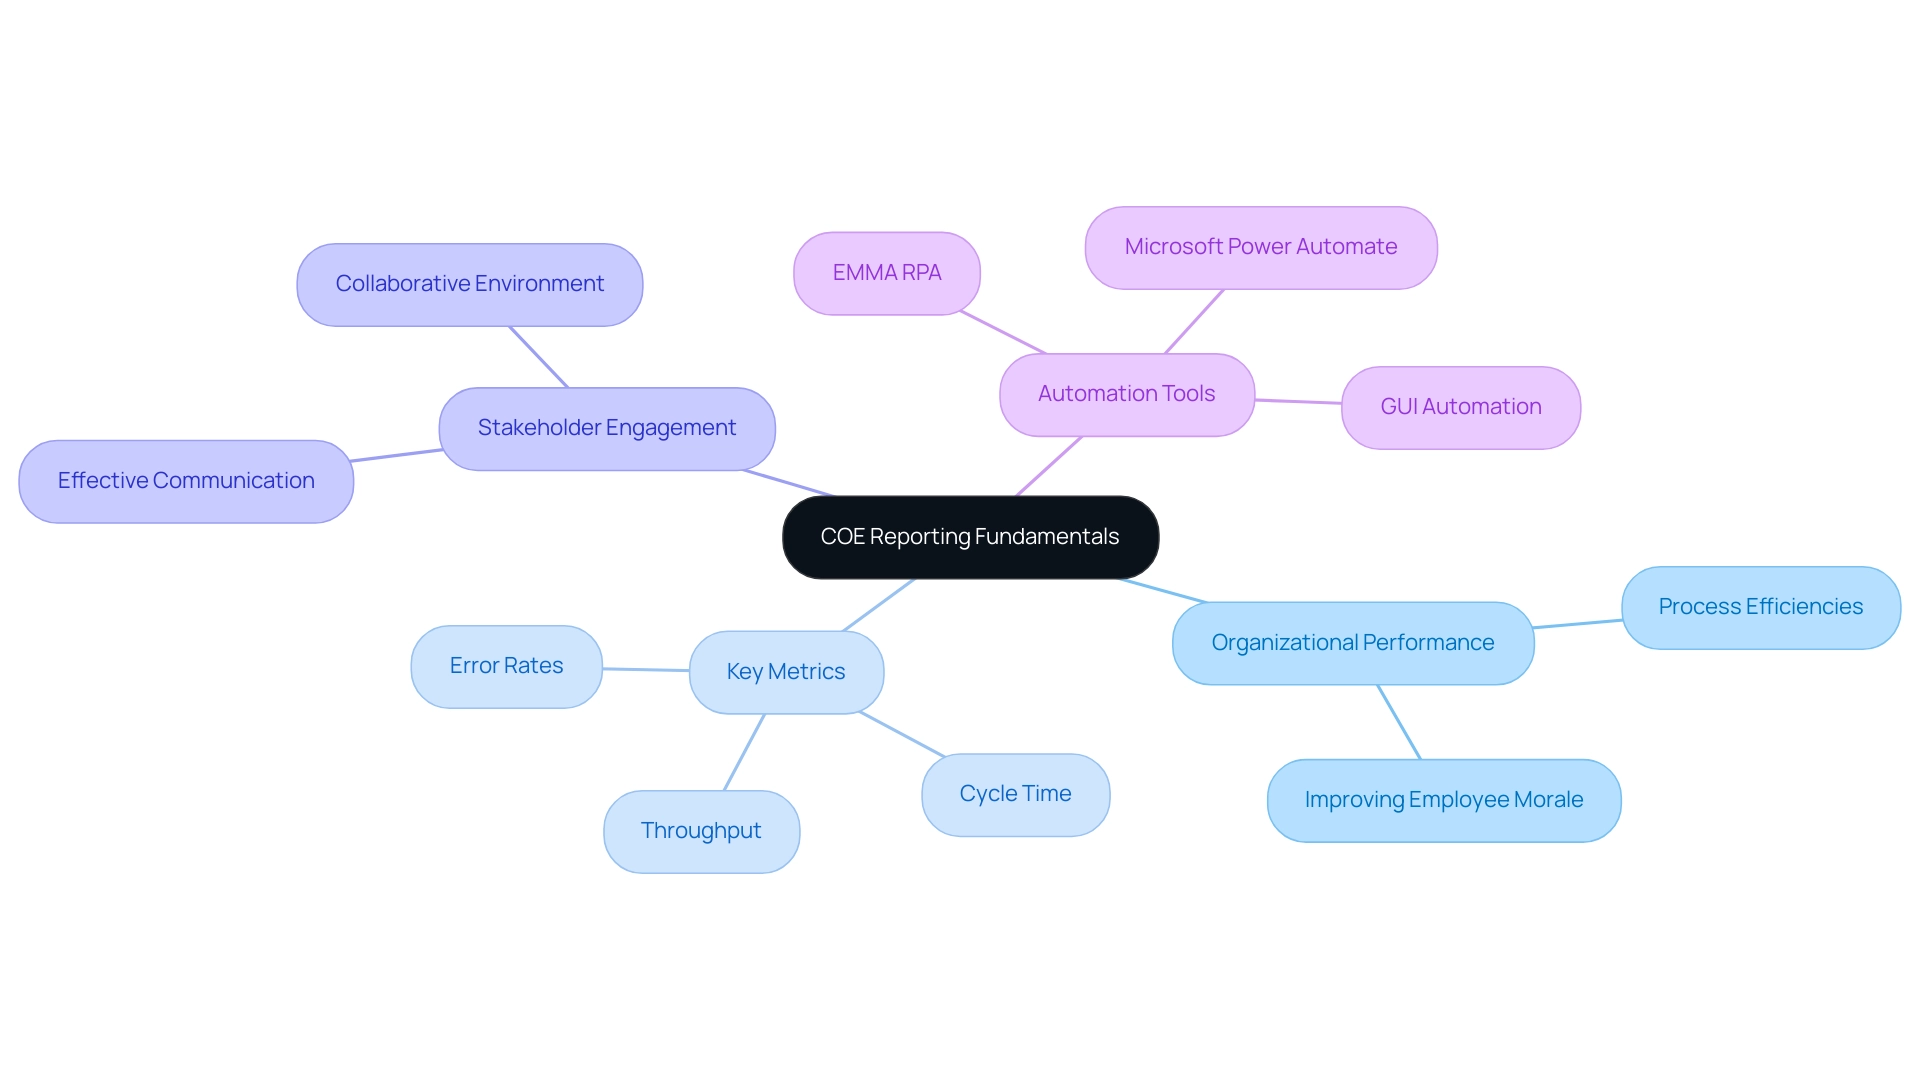
COE reporting serves as a cornerstone for enhancing organizational performance by delivering vital insights into process efficiencies and identifying areas ripe for improvement. With innovative tools like EMMA RPA, which automates repetitive tasks and enhances operational efficiency, and Microsoft Power Automate, which streamlines workflows and integrates various applications, organizations can tackle challenges such as outdated systems and staffing shortages, ultimately improving employee morale. For example, the recent decline in master’s degrees awarded in Business, from 205,800 to 202,400, highlights the necessity for educational institutions to adjust their strategies and enhance operational effectiveness through strong COE documentation.
It is essential to comprehend fundamental metrics like throughput, cycle time, and error rates, as these figures provide a quantifiable basis for assessing operational health. Establishing clear objectives—whether it be reducing operational costs or elevating service delivery standards—is paramount to aligning COE reporting with broader business goals. Furthermore, the importance of stakeholder engagement cannot be overstated.
Effective communication throughout the documentation process ensures that the needs and expectations of all parties are met, fostering a collaborative environment that drives success. As Tameka Ellington from Upward Bound at Cuyahoga Community College emphasizes, ‘Engaging stakeholders is not just beneficial; it’s essential for meaningful outcomes in any reporting initiative.’
The case study on a mid-sized company that implemented GUI automation to streamline operations illustrates how automating information entry and system integration reduced errors by 70% and improved workflow efficiency by 80%.
The automation addressed challenges such as manual data entry errors and slow software testing, showcasing how these tools can revolutionize processes. By concentrating on these elements, entities can utilize COE reporting not only to improve their operational efficiency but also to foster a culture of ongoing enhancement.
Expert Tips for Effective COE Reporting Implementation
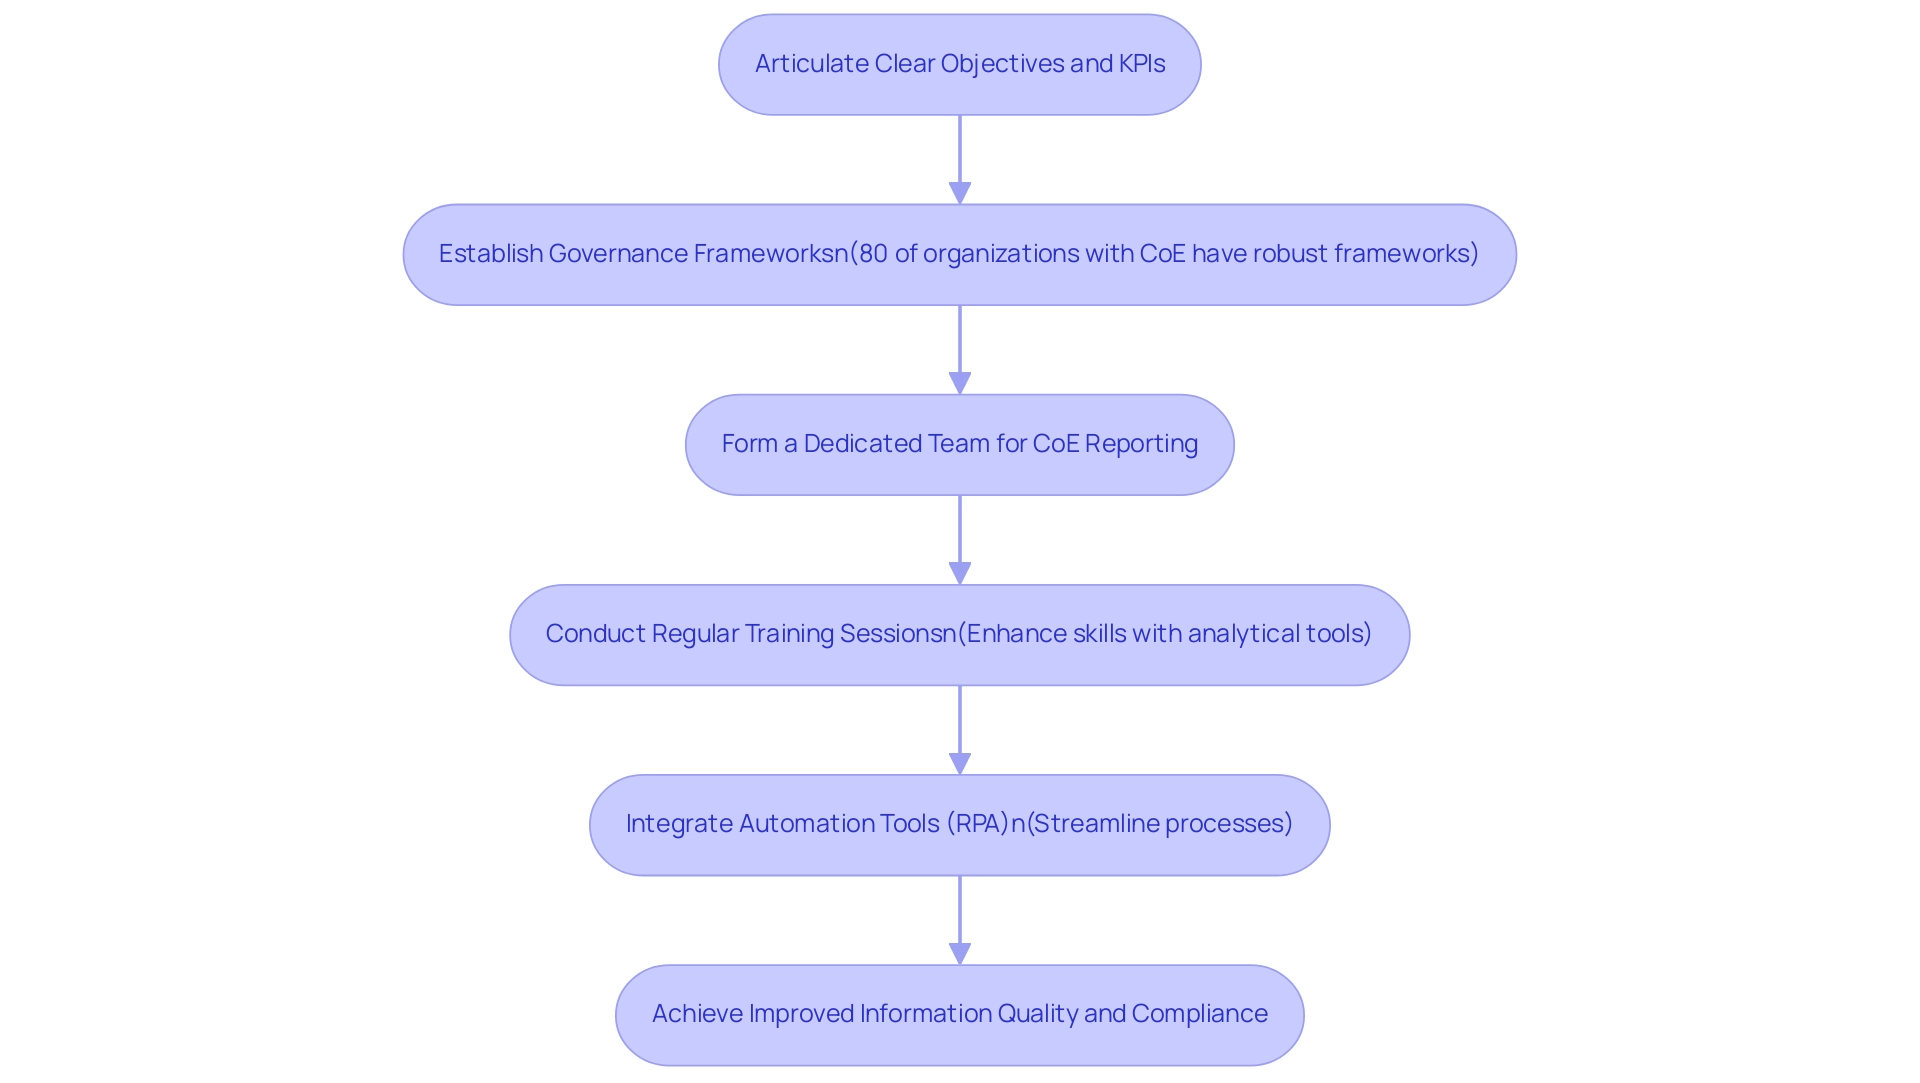
To implement coe reporting effectively, entities should commence by articulating clear objectives and key performance indicators (KPIs) that are directly aligned with their overarching strategic goals. This foundational step is critical, as robust governance frameworks are established in 80% of organizations with coe reporting from a Center of Excellence (CoE), compared to only 45% of those lacking one. According to the Big Information Framework, ‘A CoE enhances governance and quality by establishing and enforcing comprehensive governance frameworks that include policies, standards, and best practices for management.’
A dedicated team focused on coe reporting not only ensures accountability but also fosters continuous improvement across processes. Regular training sessions to improve team members’ skills with analytical tools and software are essential, empowering individuals to harness the full potential of technologies like Power BI. Furthermore, the integration of automation tools, such as robotic process automation (RPA), can significantly streamline information collection and reporting processes, addressing the common challenges of repetitive tasks and outdated systems.
This reduces manual errors and frees up valuable time for deeper analysis, ultimately resulting in improved information quality and compliance with regulations through coe reporting. For instance, the 3-Day Power BI Sprint promises to deliver a fully functional, professionally designed report on a topic of your choice in just three days. This allows teams to focus on insights rather than construction and provides a template for future projects, ensuring a professional design from the start.
A report by the Data Governance Institute emphasizes that entities with a Code experience enhanced information quality and regulatory compliance, showcasing the concrete advantages of implementing these frameworks. These best practices are crucial as organizations seek to utilize science as a catalyst for transformation in governance and performance assessment while tackling repetitive tasks and improving overall productivity.
The Role of Data Visualization in COE Reporting
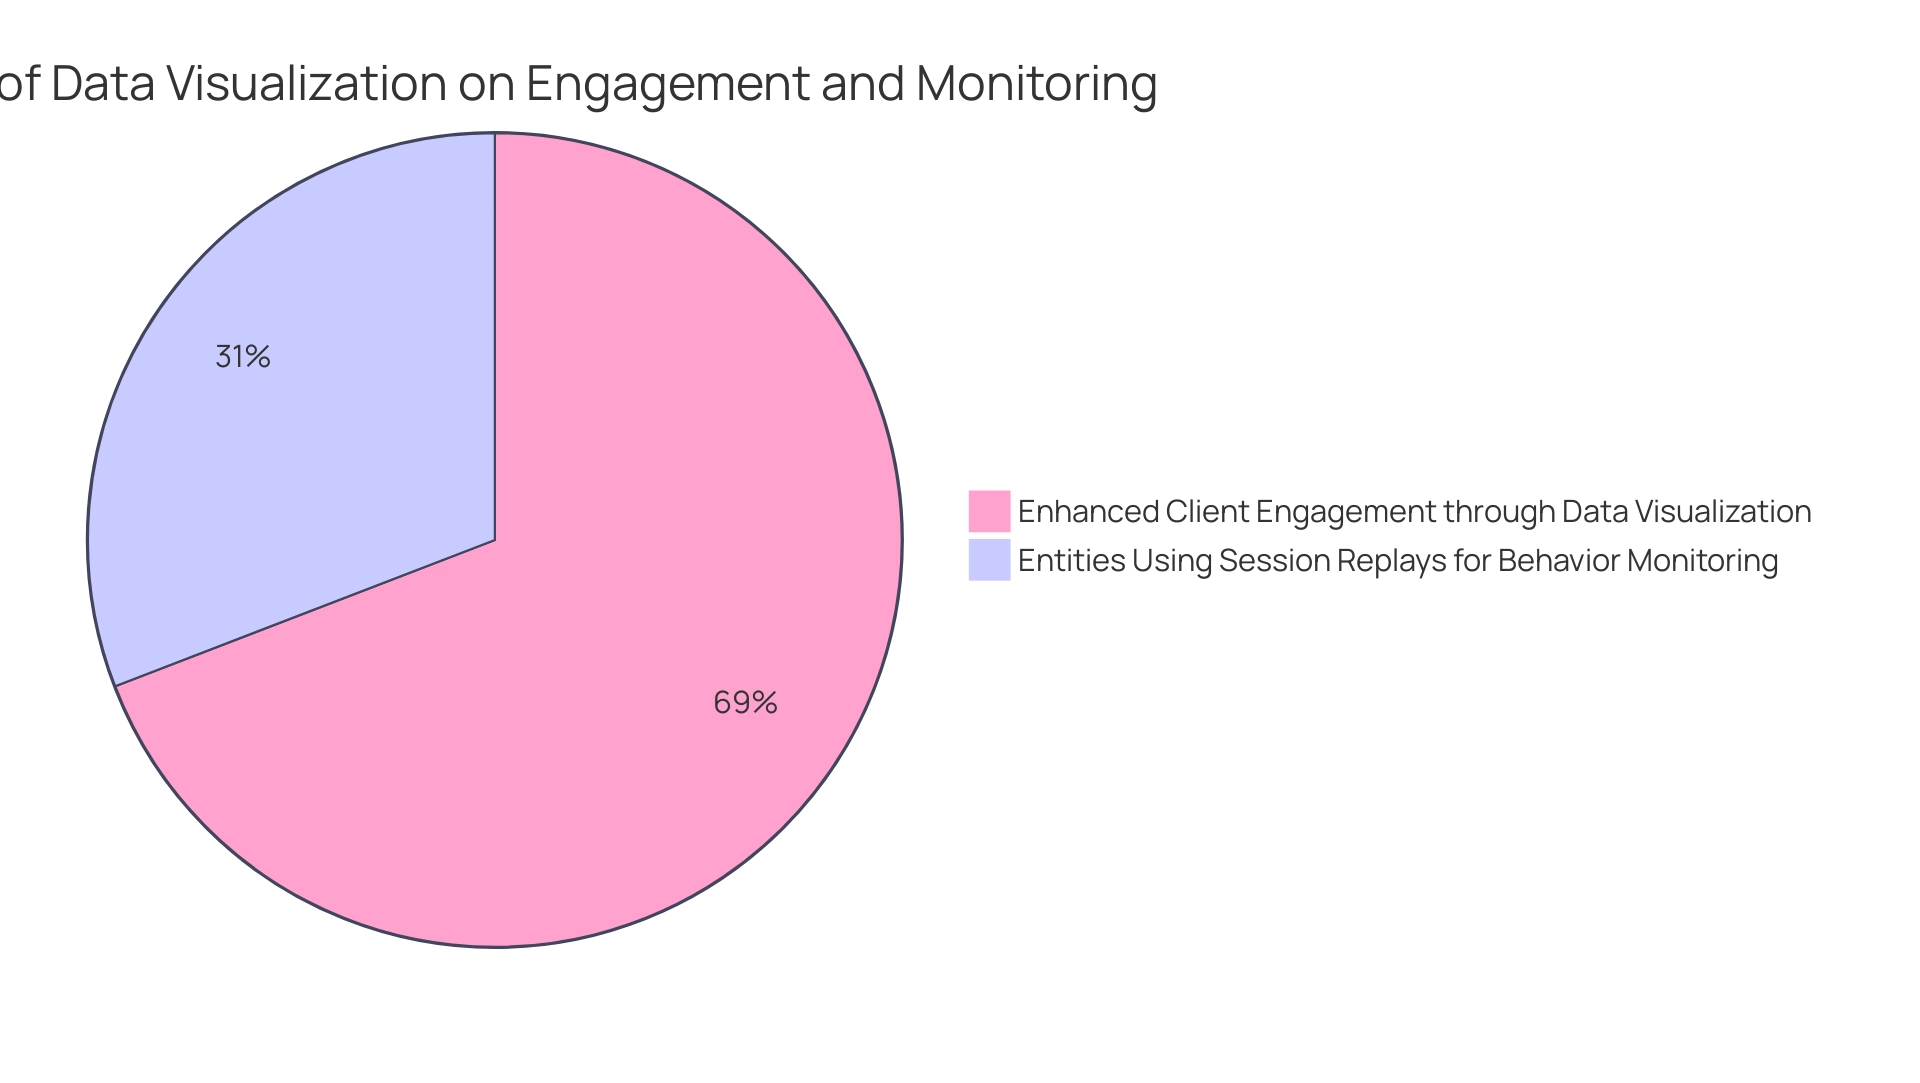
Effective information visualization is essential in COE documentation and coe reporting, as it allows stakeholders to swiftly interpret intricate datasets and make informed choices. With 65% of companies indicating that integrating visual representation into presentations significantly enhances client engagement, the significance of tools like Power BI cannot be overstated. Our Power BI services, featuring the 3-Day Power BI Sprint for quick report generation and the General Management App for thorough supervision, are intended to improve your information presentation abilities.
The General Management App features intuitive dashboards and real-time analytics, allowing for smarter decision-making. Additionally, our Actions portfolio offers tailored solutions to optimize your coe reporting processes, and we invite you to book a free consultation to explore how we can assist you further. As companies increasingly utilize technologies such as Robotic Process Automation (RPA) for workflow efficiency and customized AI solutions for specific business objectives, the incorporation of these tools can simplify report generation and tackle typical issues like information inconsistencies and actionable guidance.
Indeed, a rising trend indicates that 29% of entities are employing session replays to monitor behavior, further highlighting the necessity for efficient analysis practices. As we navigate an information-rich environment—five times more than in 1986—tailoring visualizations to specific audiences, whether executives or operational teams, becomes crucial. This targeted method not only boosts engagement but converts raw information into impactful insights, ultimately propelling organizational growth.
However, many organizations still encounter obstacles in adopting these techniques; thus, understanding and applying best practices in visualization and leveraging Business Intelligence are essential for nurturing a culture driven by information within your organization.
Navigating Challenges in COE Reporting
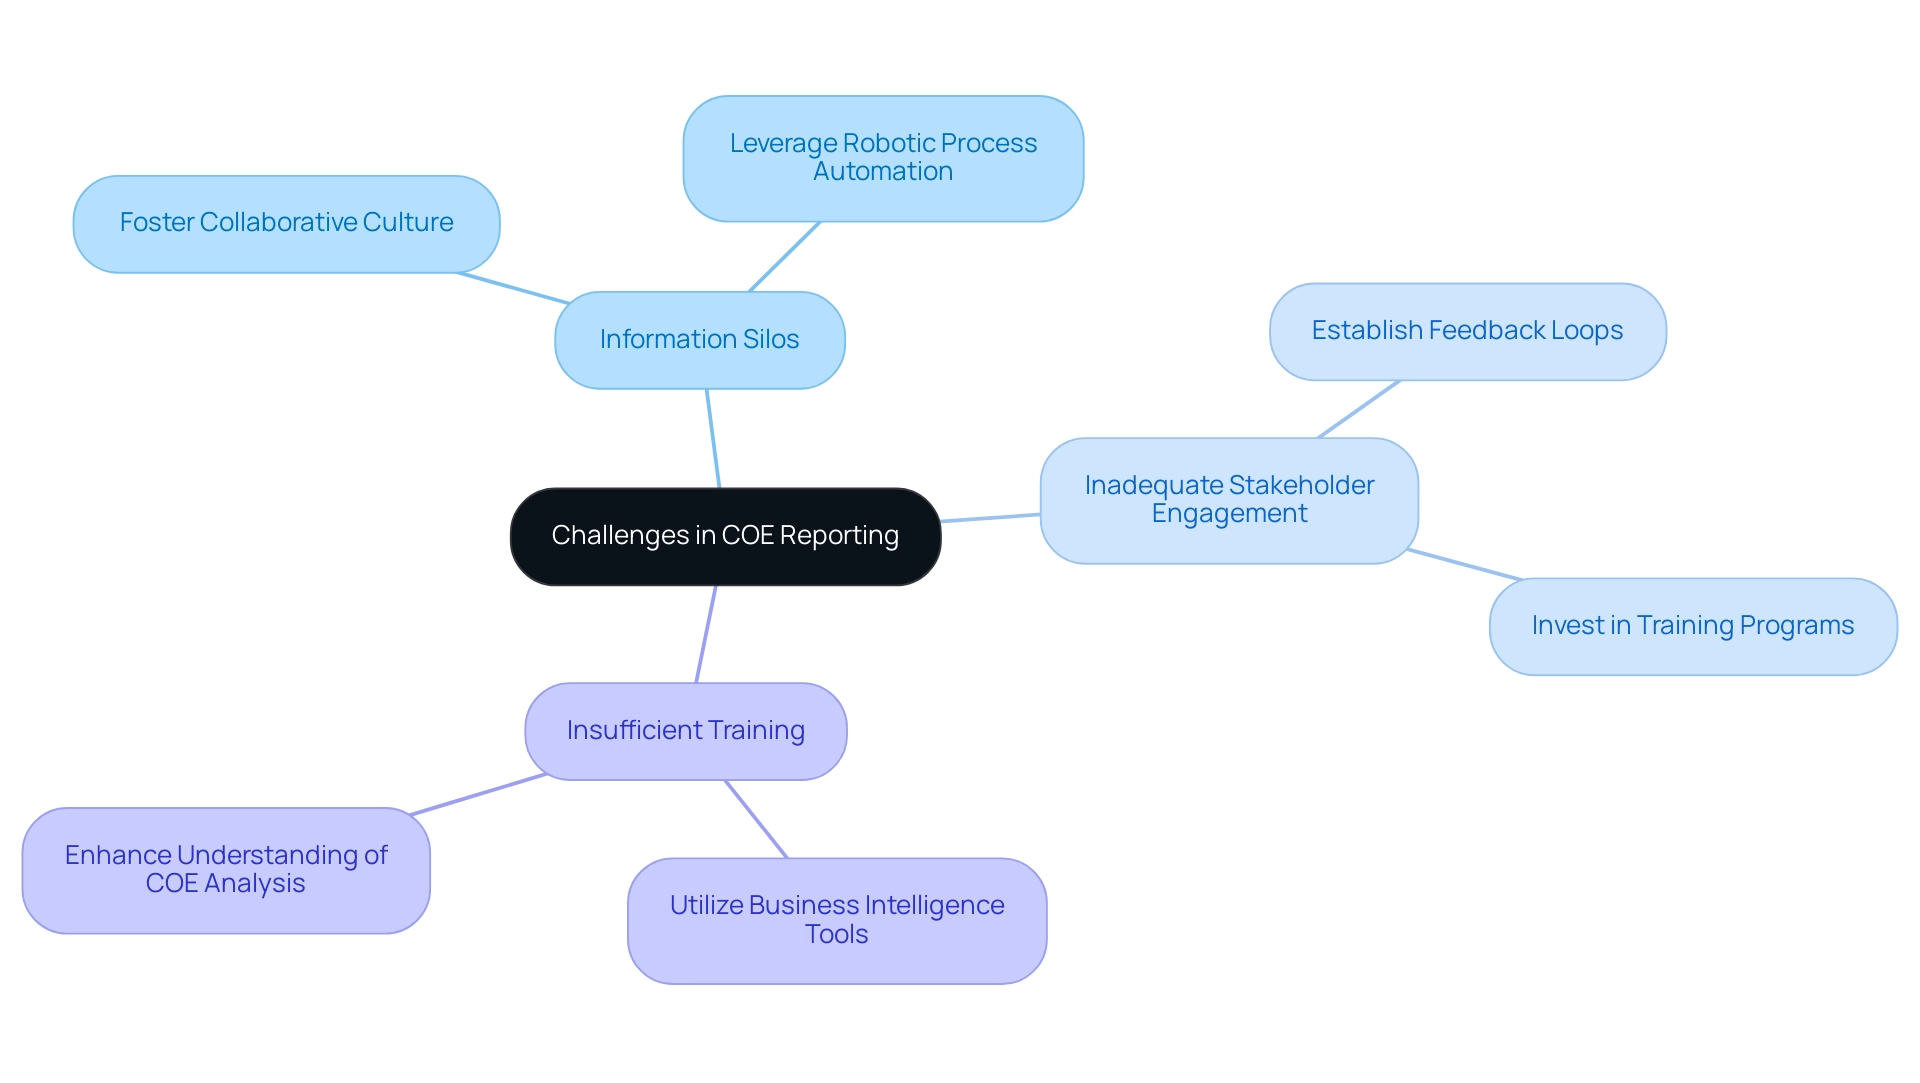
COE documentation frequently faces various obstacles, including:
- Information silos
- Inadequate stakeholder engagement
- Insufficient training
Historical data extending from 2007 to 2024 uncovers ongoing challenges in COE reporting that necessitate a proactive approach. To address these issues, organizations can foster a collaborative culture by actively engaging all relevant departments throughout the documentation process.
Leveraging Robotic Process Automation (RPA) can automate manual workflows, which not only boosts efficiency and reduces errors but also frees up teams to focus on more strategic, value-adding tasks. Establishing regular feedback loops is essential; they ensure that the framework continuously evolves in response to stakeholder input, fostering a sense of ownership and accountability. As highlighted in the case study ‘Bridging Communication Gaps in Offshore Drilling Teams,’ embracing cultural differences and utilizing technology can enhance teamwork and safety, serving as a model for overcoming communication barriers.
Furthermore, investing in comprehensive training programs significantly enhances employees’ understanding of COE analysis and COE reporting, utilizing Business Intelligence tools that transform raw data into actionable insights. This proactive approach not only mitigates resistance to change but also nurtures a data-driven culture that empowers teams to leverage insights effectively. As we progress towards 2024, tackling these common challenges will be vital for enhancing effectiveness and attaining operational excellence.
As a guiding principle, entities should ‘ensure financial consistency by aligning accounting practices in a merger,’ which underscores the importance of stakeholder engagement and collaboration in leveraging RPA and Business Intelligence for informed decision-making in an evolving AI landscape.
Future Trends in COE Reporting Practices
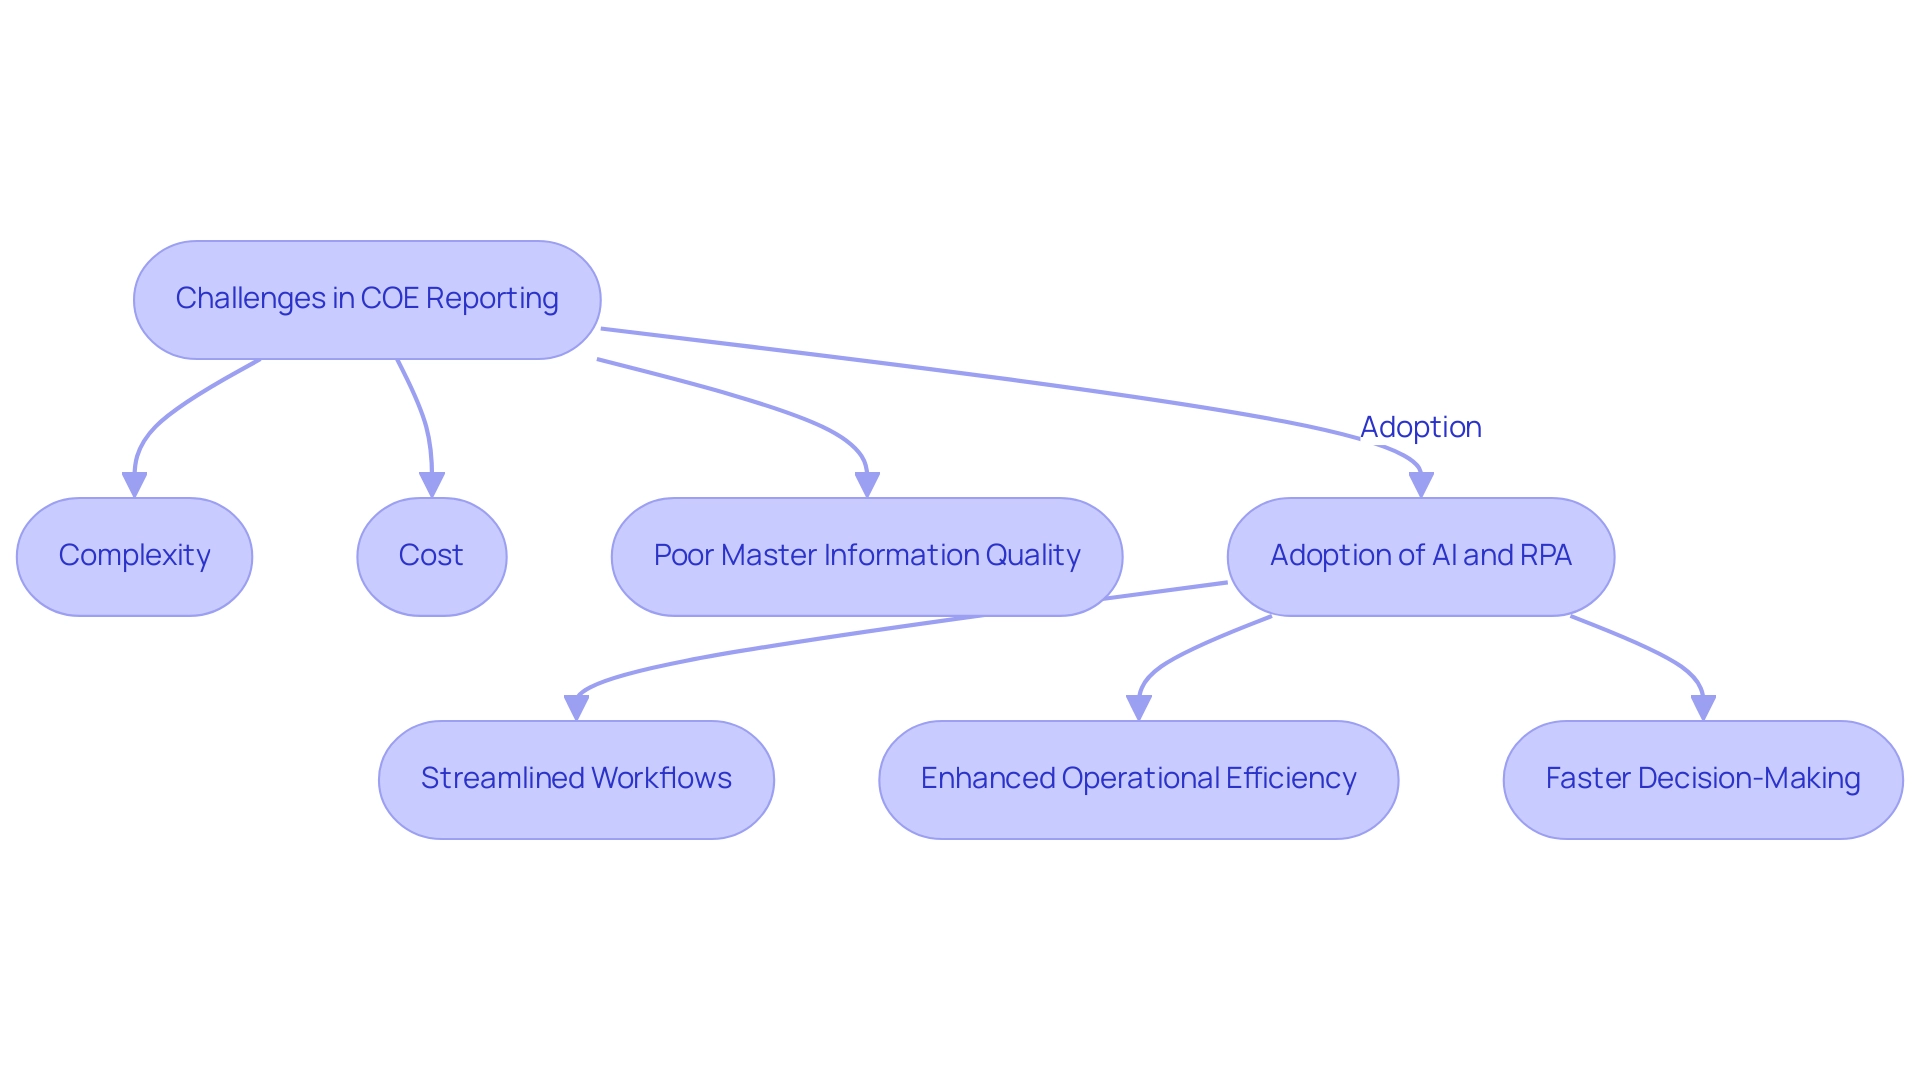
The landscape of COE documentation is experiencing a substantial change propelled by technological advancements, especially as entities strive to address obstacles in implementing AI. The incorporation of artificial intelligence (AI) and machine learning (ML) is transforming how entities examine information, enabling deeper insights and more effective reporting procedures. However, many directors hesitate to adopt these technologies due to perceptions of complexity, cost, and concerns about poor master information quality, which can lead to inefficient operations and flawed decision-making.
By leveraging tailored AI solutions and Robotic Process Automation (RPA), companies can streamline workflows, reduce manual tasks, and enhance operational efficiency. For instance, in the first follow-up of the NPSAS:12 study, 24,770 out of 35,540 eligible sample students responded, resulting in a 70% unweighted response rate, underscoring the significance of effective information collection in understanding educational trends. These technologies empower teams to sift through vast amounts of information quickly, identifying patterns and trends that may have otherwise gone unnoticed.
Furthermore, the use of real-time monitoring tools gives entities instant access to pertinent information, facilitating faster decision-making—a crucial benefit in today’s rapid-paced landscape. As stakeholders place a greater emphasis on ethical information practices, organizations must also prioritize transparency in their reporting. Aurora D’Amico from the National Center for Education Statistics emphasizes, ‘Further information on NPSAS may be obtained from our office,’ highlighting the significance of accessible information for informed decision-making.
Upholding high standards of ethics not only builds trust with stakeholders but also aligns with the growing demand for responsible use of information. A pertinent example is the School Shooting Database Project, which records instances of gun-related incidents in K-12 schools, compiling information from various sources into a comprehensive database. By proactively embracing these trends and leveraging RPA alongside AI, entities can significantly enhance their COE reporting practices, leading to improved operational efficiency and informed strategic decisions.
Furthermore, the importance of Business Intelligence in transforming raw data into actionable insights cannot be overstated, as it plays a crucial role in ensuring that organizations remain competitive and responsive to changing market demands.
Conclusion
Embracing effective Center of Excellence (COE) reporting is vital for organizations aiming to enhance operational performance and foster a culture of continuous improvement. By leveraging advanced technologies such as Robotic Process Automation (RPA) and data visualization tools like Power BI, companies can streamline their reporting processes, tackle inefficiencies, and engage stakeholders more effectively. Understanding the fundamentals of COE reporting, including key performance indicators (KPIs) and stakeholder engagement, lays the groundwork for achieving strategic goals and driving meaningful outcomes.
Organizations must prioritize training and the establishment of data governance frameworks to fully realize the benefits of COE reporting. By integrating automation and visualization techniques, teams can transform complex datasets into actionable insights, ultimately facilitating informed decision-making. As businesses navigate the challenges of data silos and inadequate engagement, the adoption of a collaborative culture and regular feedback loops will enhance reporting effectiveness and empower employees to leverage insights for operational excellence.
Looking ahead, the future of COE reporting is poised for transformation as AI and machine learning technologies become increasingly integrated into reporting practices. Organizations that proactively embrace these innovations will not only improve their operational efficiency but also position themselves to respond swiftly to changing market demands. By committing to ethical data practices and transparency, companies can build trust with stakeholders and ensure their reporting frameworks remain robust and relevant. Ultimately, the journey toward operational excellence through COE reporting is an ongoing process that requires dedication, adaptability, and a focus on continuous improvement.
Introduction
In a world increasingly driven by data, the importance of analytical reports cannot be overstated. These meticulously crafted documents transform raw data into actionable insights, guiding organizations toward informed decision-making and strategic success. By identifying trends, assessing performance, and formulating effective strategies, analytical reports serve as a critical bridge between data collection and execution.
As businesses navigate the complexities of today’s data-centric landscape, understanding the various types of analytical reports and their unique applications becomes essential. From descriptive to prescriptive reports, each type offers distinct advantages, enabling organizations to harness data’s full potential while fostering a culture of evidence-based decision-making.
This article delves into the significance of analytical reports, their key features, real-world applications, and the transformative role they play in empowering organizations to thrive in an ever-evolving market.
Understanding Analytical Reports: Definition and Purpose
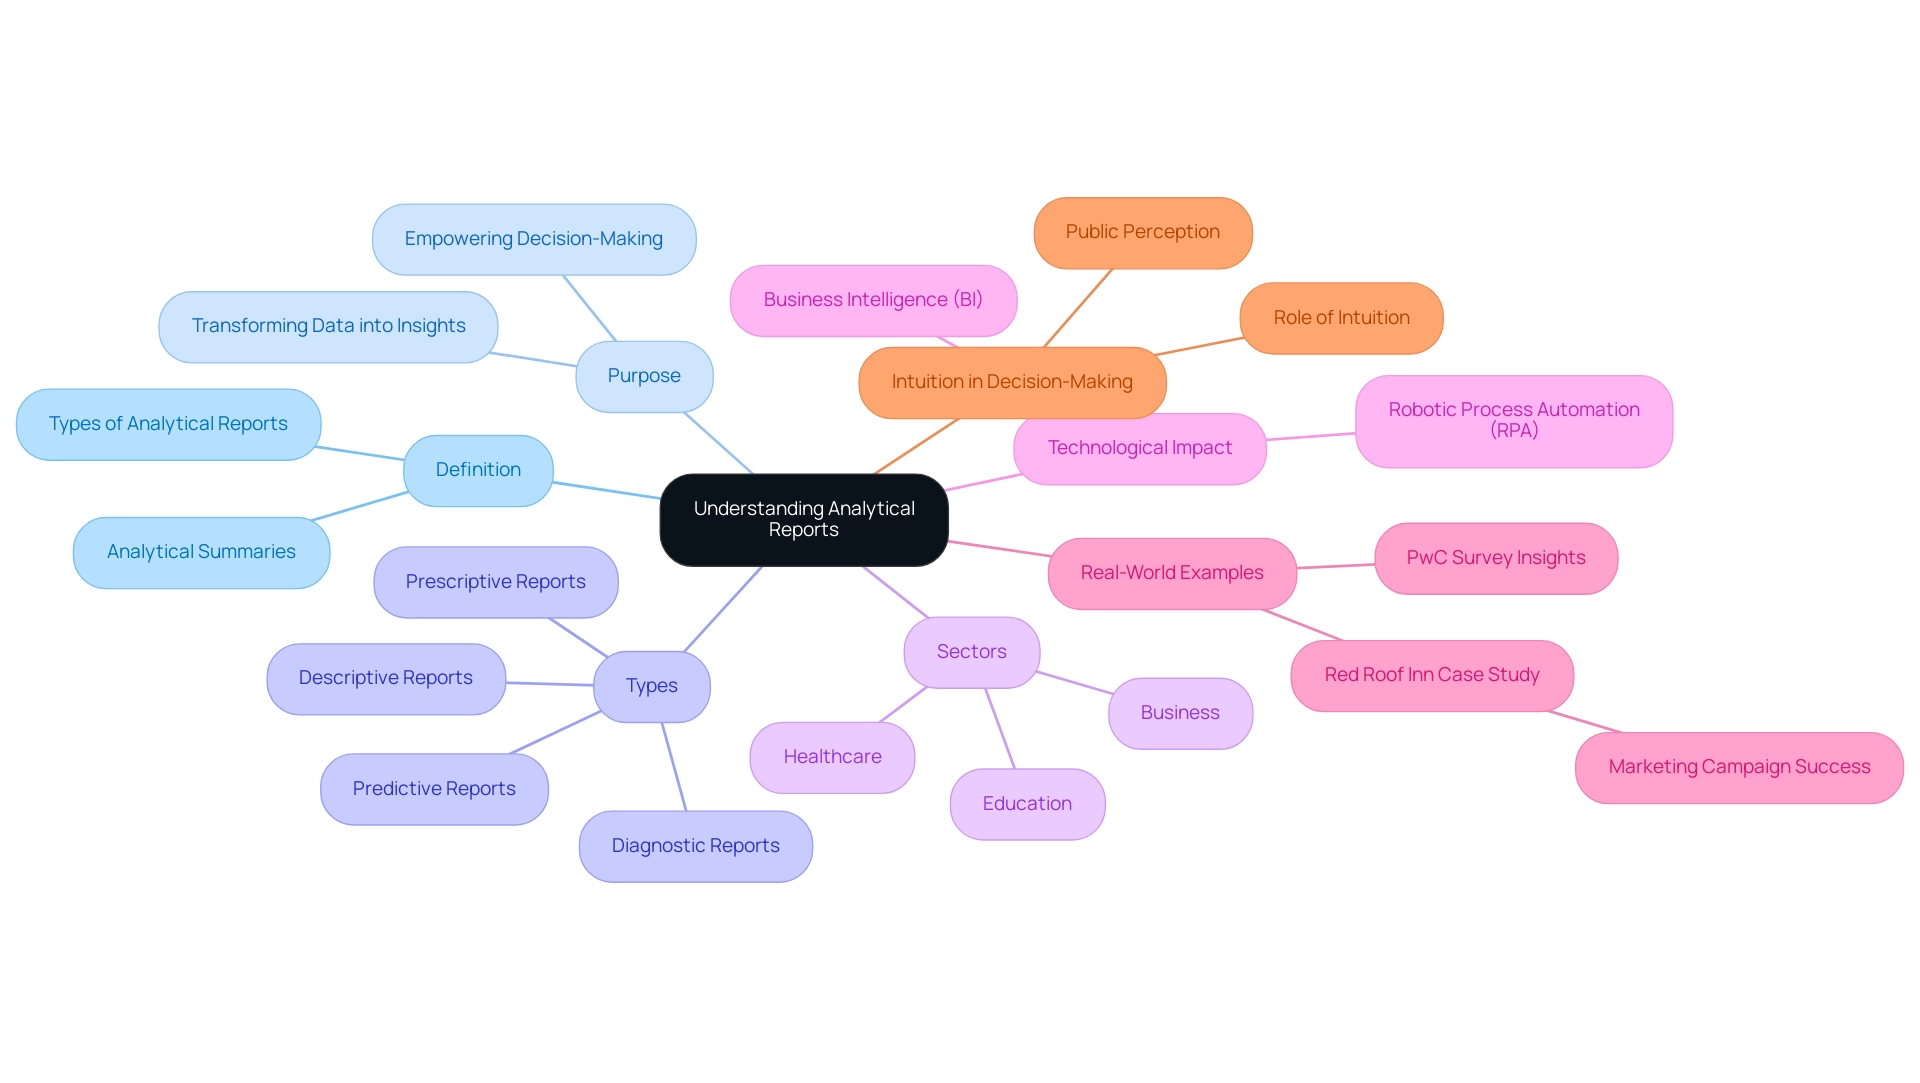
Analytical summaries are carefully organized documents that refine information analysis into insights, which are types of analytical report essential for informed decision-making. Their primary objective is to transform raw information into actionable insights, which can take the form of types of analytical report that empower organizations to detect trends, assess performance, and formulate effective strategies. These documents serve as a crucial link between information gathering and strategic implementation, providing clarity and guidance to stakeholders in diverse fields, including the various types of analytical report used in business, healthcare, education, and others.
Indeed, assessment documents are essential in these sectors; they allow decisions based on empirical evidence and promote a data-oriented culture that improves overall performance. Significantly, a recent survey by PwC showed that organizations utilizing information are three times more likely to indicate substantial improvements in decision-making than those that do not prioritize types of analytical report. This statistic underscores the necessity of types of analytical report in today’s data-centric landscape.
Furthermore, it is important to recognize that while information analysis is paramount, intuition also plays a crucial role in decision-making. As psychologist Gerd Gigerenzer articulates, ‘Intuition is a form of unconscious intelligence that is as needed as conscious intelligence.’ This perspective is echoed in society, where studies show that more than half of Americans rely on their gut feelings to make decisions, even when faced with contrary evidence.
A vivid example can be seen in the case of Red Roof Inn, which adeptly identified marketing opportunities by analyzing data related to flight cancellations and adverse weather conditions near airports. Their focused campaign during adverse weather not only demonstrates the significant influence that data assessments can have on strategic choices but also emphasizes the importance of utilizing Business Intelligence (BI) and Robotic Process Automation (RPA) to optimize workflows and improve operational efficiency. As your organization navigates the overwhelming AI landscape, tailored AI solutions can empower you to cut through the noise and unlock practical information, addressing specific business challenges.
Additionally, by utilizing RPA, you can automate manual, repetitive tasks, boosting efficiency and allowing your team to focus on more strategic, value-adding work. This comprehensive approach ensures you remain competitive in the rapidly evolving market.
Types of Analytical Reports: A Comprehensive Breakdown
In the realm of business analytics, understanding the various types of analytical report is essential for driving operational efficiency. Every document fulfills a distinct role by offering different types of analytical report that can greatly impact decision-making.
-
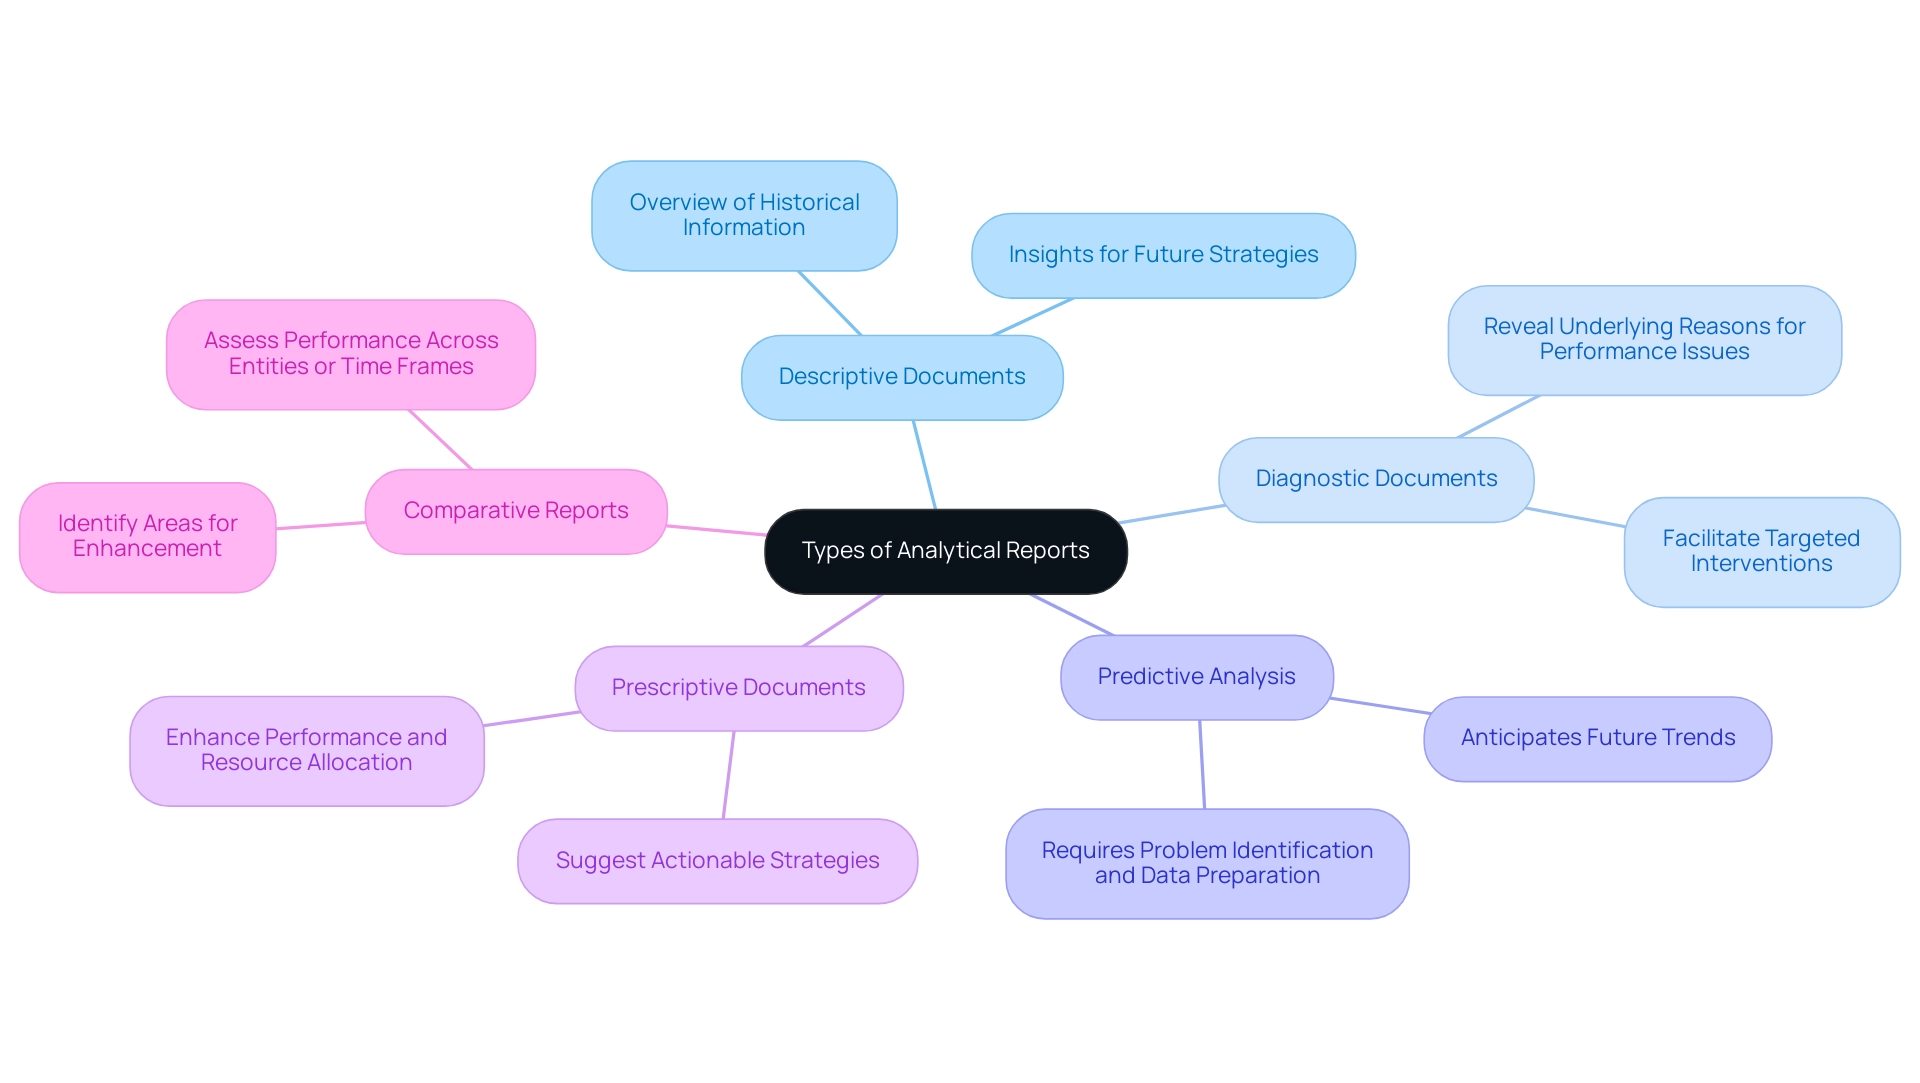
Descriptive Documents: These documents offer a thorough overview of historical information, allowing organizations to understand past performance trends and results.
By reflecting on what has transpired, businesses can derive valuable insights for future strategies. -
Diagnostic Documents: Focused on revealing the underlying reasons for particular performance problems, diagnostic documents explore extensive analysis.
They highlight underlying factors that may be impacting results, facilitating targeted interventions. -
Predictive Analysis: Utilizing sophisticated statistical models and machine learning methods, predictive analysis anticipates future trends based on historical patterns.
To initiate predictive analytics, organizations must identify a problem, define what to predict, and state the desired outcomes, with information preparation being a crucial first step.
This forward-looking perspective allows organizations to anticipate changes and prepare accordingly. -
Prescriptive Documents: These documents advance analysis by not only interpreting information but also suggesting actionable strategies to enhance outcomes.
This makes them invaluable for decision-makers seeking to enhance performance and resource allocation. -
Comparative Reports: By assessing performance across various entities or time frames, comparative reports offer insights into relative effectiveness and emphasize areas ready for enhancement.
As organizations increasingly adopt cloud computing and business intelligence—54% are considering these technologies in their analytical strategies—investing in diverse reporting capabilities becomes essential.
Recent trends indicate that 56% of analytics leaders are increasing their budgets for analytics in 2023, reflecting a strong commitment to utilizing information for strategic advantage.
The integration of cloud and BI tools is transforming how businesses approach analytics, with tailored AI solutions cutting through the overwhelming options available.
Utilizing Robotic Process Automation (RPA) tools like EMMA RPA and Microsoft Power Automate can significantly enhance operational efficiency and improve employee morale.
For instance, EMMA RPA automates repetitive tasks, allowing employees to focus on more strategic initiatives, while Power Automate facilitates seamless integration across applications, streamlining workflows and reducing task repetition fatigue.
As mentioned by IBM, ‘The integration of cloud and BI tools is transforming how businesses approach analytics.’
With the demand for information analysts anticipated to increase by 30-35%, comprehending these documents and their uses is not only advantageous but crucial for operational success.
Key Features of Effective Analytical Reports
Effective analytical documents embody several essential characteristics that empower decision-makers, particularly in navigating the overwhelming AI landscape:
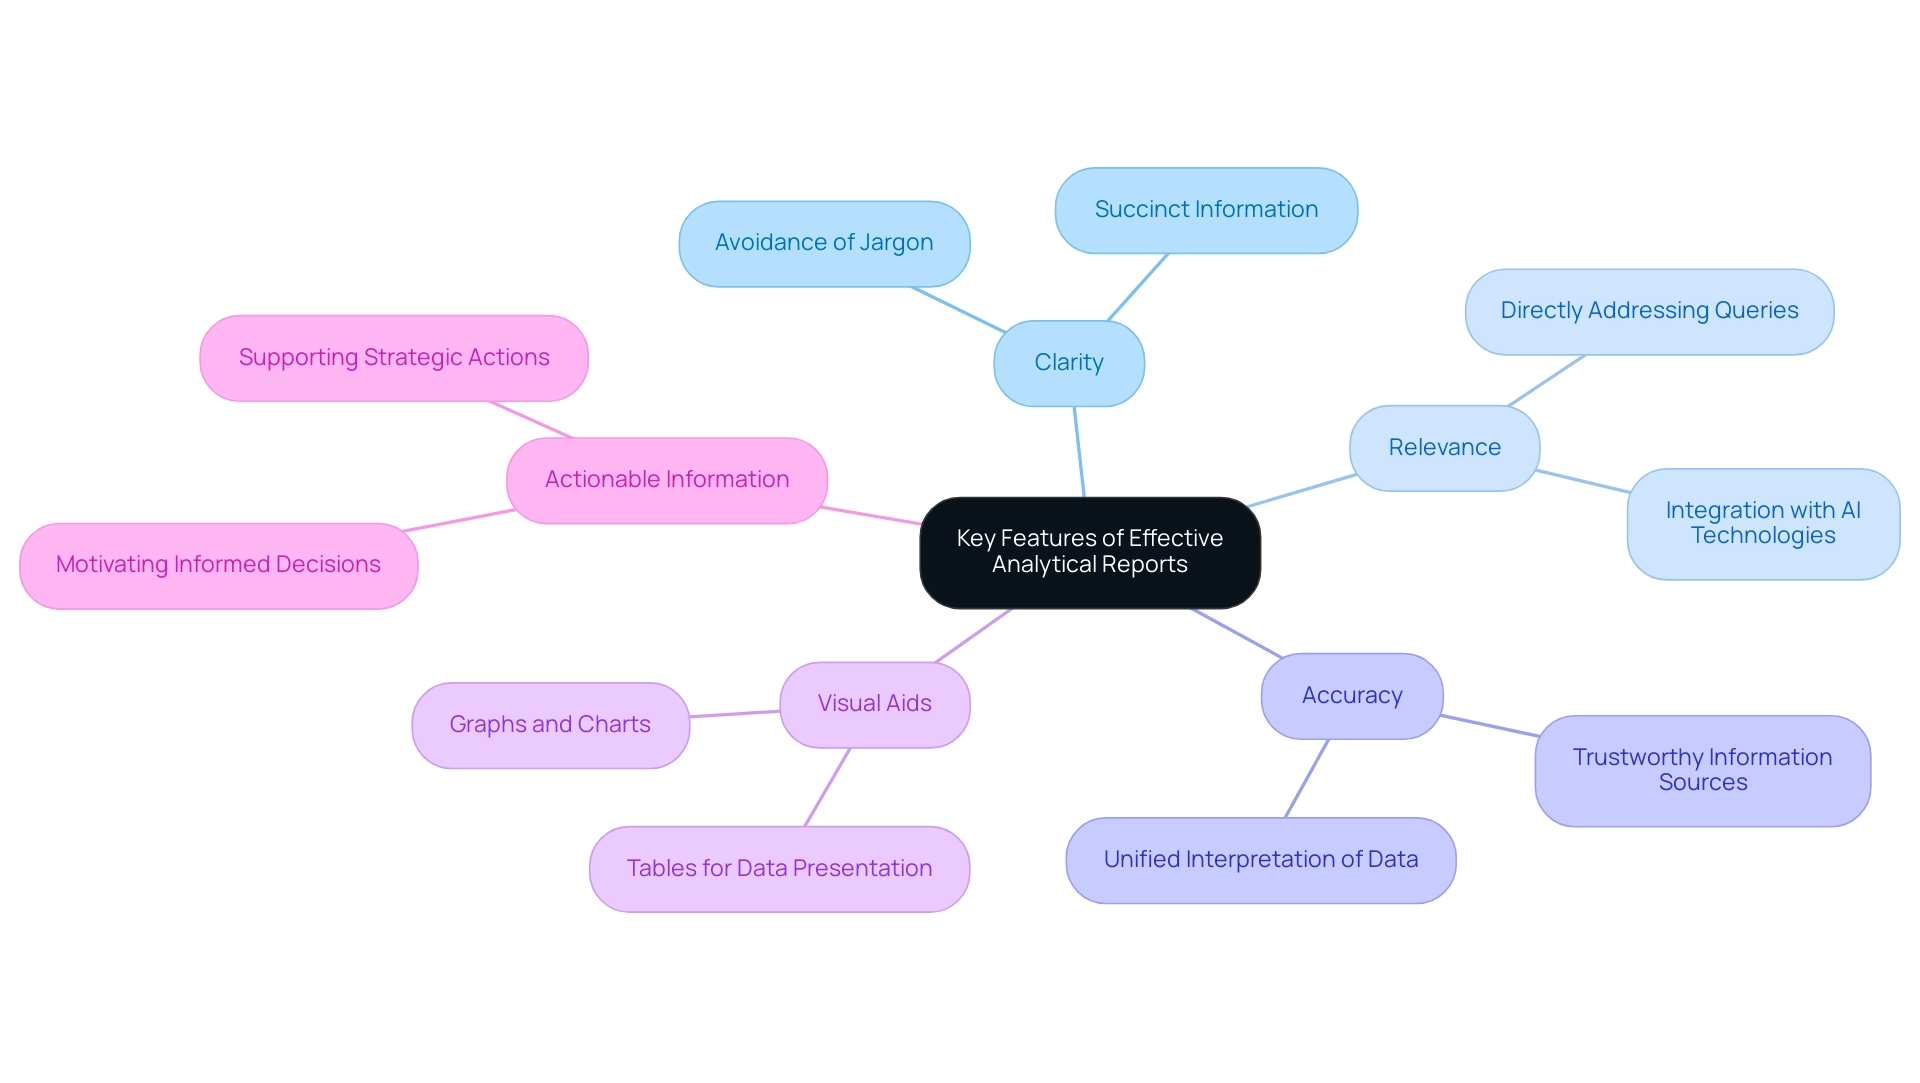
- Clarity: Information should be conveyed clearly and succinctly, steering clear of jargon and convoluted language to ensure comprehension. This clarity is vital as it allows businesses to navigate the multitude of AI choices and concentrate on what corresponds with their objectives, particularly by utilizing types of analytical report that meet their specific requirements.
- Relevance: The information and findings presented must directly tackle the specific queries or challenges at hand, ensuring that stakeholders can focus on what genuinely matters. Pertinent understandings from Business Intelligence can convert unprocessed information into practical strategies that promote growth and innovation, particularly when integrated with customized AI technologies, which are essential types of analytical report.
- Accuracy: Quality documents are constructed upon precise and trustworthy information sources, strengthening the validity of the conclusions reached. As mentioned by Daniel Lakens, a good approach is to interpret all statistics you present, and to trust your conclusions most when all statistical inferences provide converging support for your conclusion. This highlights the significance of a unified interpretation of data to aid well-informed decision-making.
- Visual Aids: Using graphs, charts, and tables can greatly improve comprehension and memory, rendering complex data more approachable and practical.
- Actionable Information: Ultimately, the aim of any types of analytical report is to provide information that motivates informed decision-making and strategic actions. This is especially crucial in today’s data-abundant environment, where efficient use of Business Intelligence empowers companies to achieve a competitive advantage, particularly when utilizing customized AI solutions.
An effective evaluation document also includes a submission letter that outlines its content and context, similar to a cover letter in job applications, which aids in preparing for the findings presented.
For example, in the field of Competitor Intelligence, comprehending competitors’ performance metrics—such as customer satisfaction and market share—allows clients to assess their industry position effectively. This analysis often uncovers whitespace opportunities and differentiators, amplifying the strategic value of analytical assessments. The insights derived from types of analytical report can lead to informed decisions that enhance competitive advantage.
Furthermore, with Agency Analytics able to track and showcase campaign data from more than 80 marketing platform integrations, it illustrates how varied data sources can enhance accuracy and relevance, offering a comprehensive perspective that supports customized AI solutions. Furthermore, in light of Daniel Lakens’ recent inquiry for alternative write-ups that could facilitate meta-analyses, it is crucial to ensure that documents maintain a high level of accuracy and clarity to support such comprehensive evaluations.
Real-World Examples of Analytical Reports
Various industries harness the power of analytical documents to enhance decision-making processes:
-
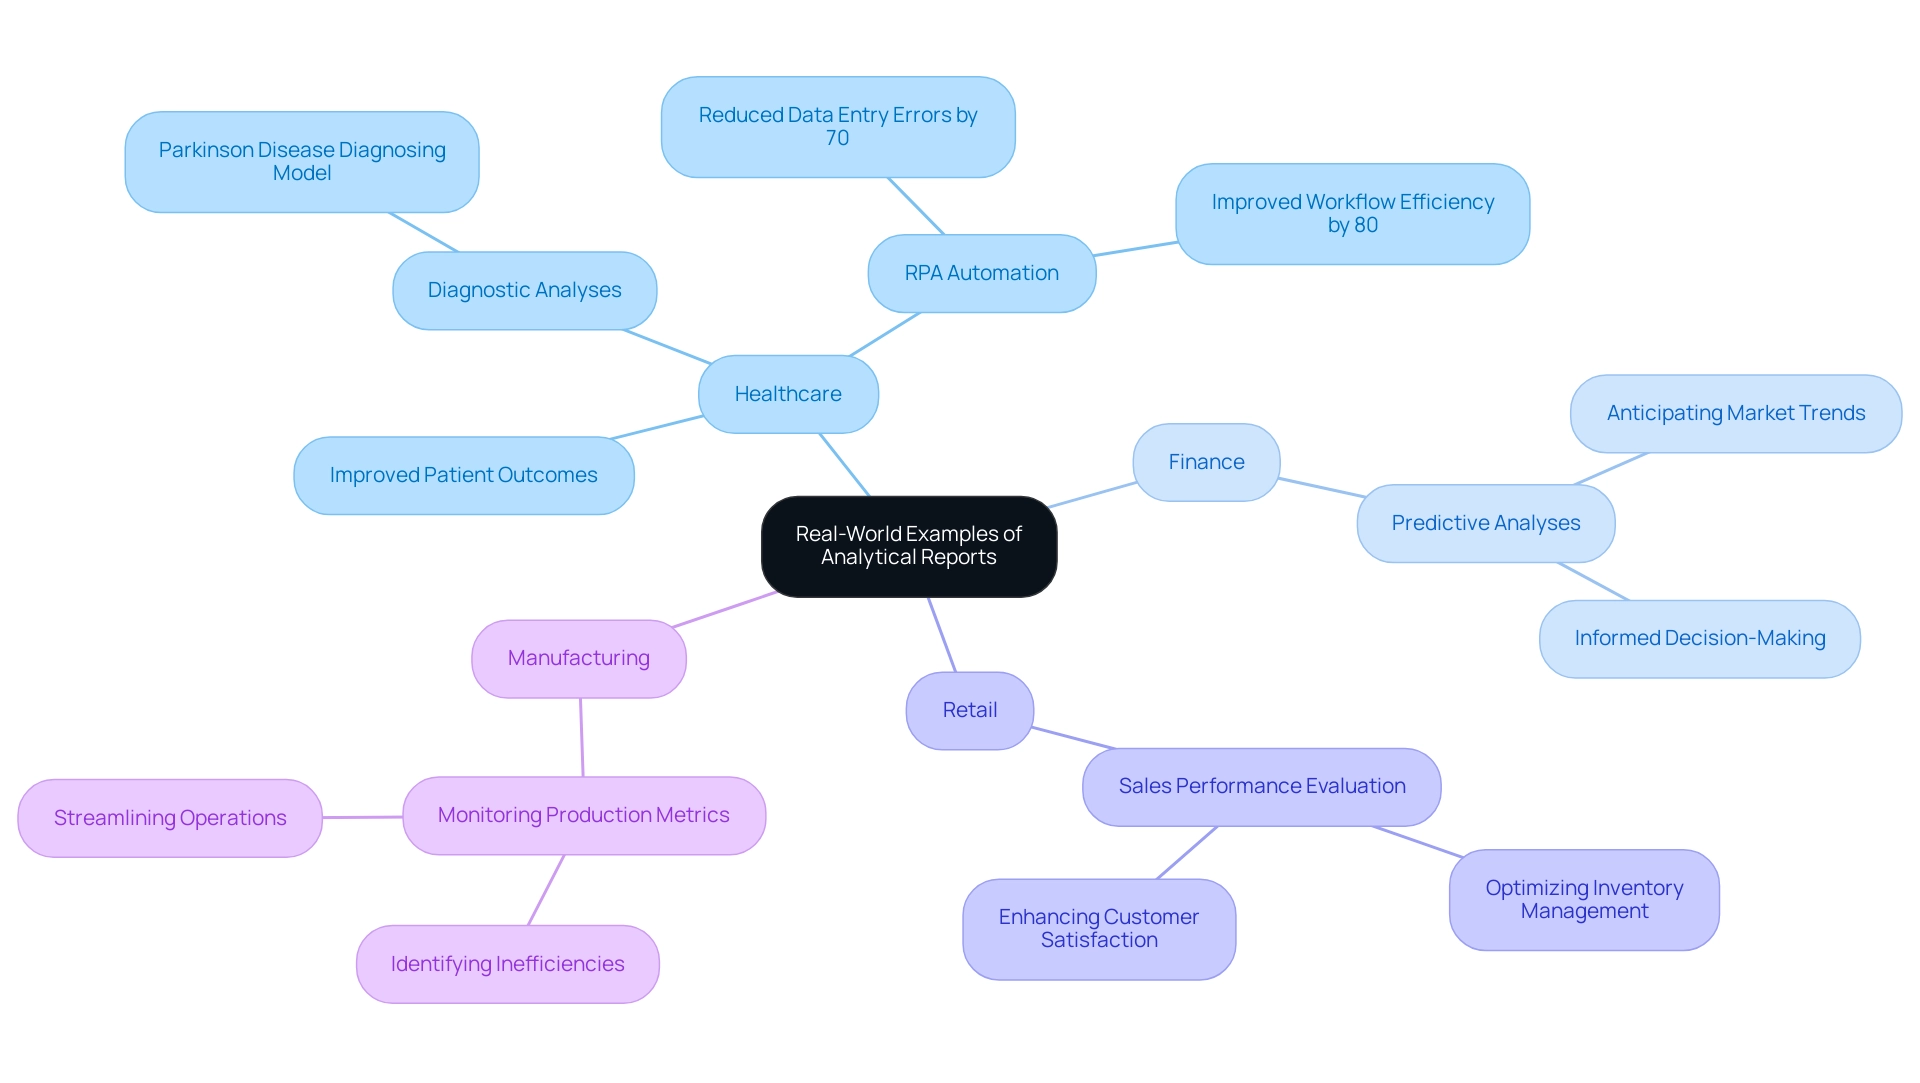
Healthcare: Hospitals utilize diagnostic analyses to evaluate patient outcomes meticulously, allowing them to pinpoint areas needing improvement in care delivery. The systematic literature review encompassing healthcare information from 2011 to 2021 emphasizes the crucial role of types of analytical report in promoting progress in clinical practices. For example, a sensor-equipped robot design for diagnosing Parkinson’s disease has been created, incorporating sensors within the patient’s body to gather information for analysis, significantly enhancing diagnostic capabilities. Additionally, by implementing GUI automation to streamline data entry and software testing, healthcare providers have reduced data entry errors by 70% and improved workflow efficiency by 80%, demonstrating a clear path to enhanced operational efficiency. This implementation involved utilizing RPA to automate repetitive tasks, thus freeing up staff to focus on higher-value activities, which is critical in a sector where time and accuracy are paramount.
-
Finance: In the finance sector, investment firms utilize various types of analytical reports that rely on predictive analyses to anticipate market trends, providing a foundation for strategic investment decisions. As Alshymaa Alghamdi from Umm Al-Qura University states, predictive analytics answers the critical question: ‘What happened?’ thereby facilitating informed decision-making. This highlights the significance of grasping historical occurrences to direct future strategies.
-
Retail: Retail giants like Amazon utilize different types of analytical reports to evaluate sales performance across diverse regions, optimizing inventory management and enhancing customer satisfaction. These evaluative observations enable businesses to make data-informed choices that directly influence their profitability.
-
Manufacturing: Types of analytical report are crucial in manufacturing for monitoring production metrics. By identifying inefficiencies in their processes, organizations can implement targeted strategies to streamline operations and increase productivity. Such applications of analytics are crucial for maintaining competitiveness in a rapidly evolving market.
By leveraging these analytical frameworks alongside RPA, industries not only improve their operational efficiencies but also set a strong foundation for future growth and innovation. The integration of RPA into manual workflows addresses challenges such as human error and process delays, ultimately leading to a more agile and responsive business model.
The Role of Analytical Reports in Informed Decision-Making
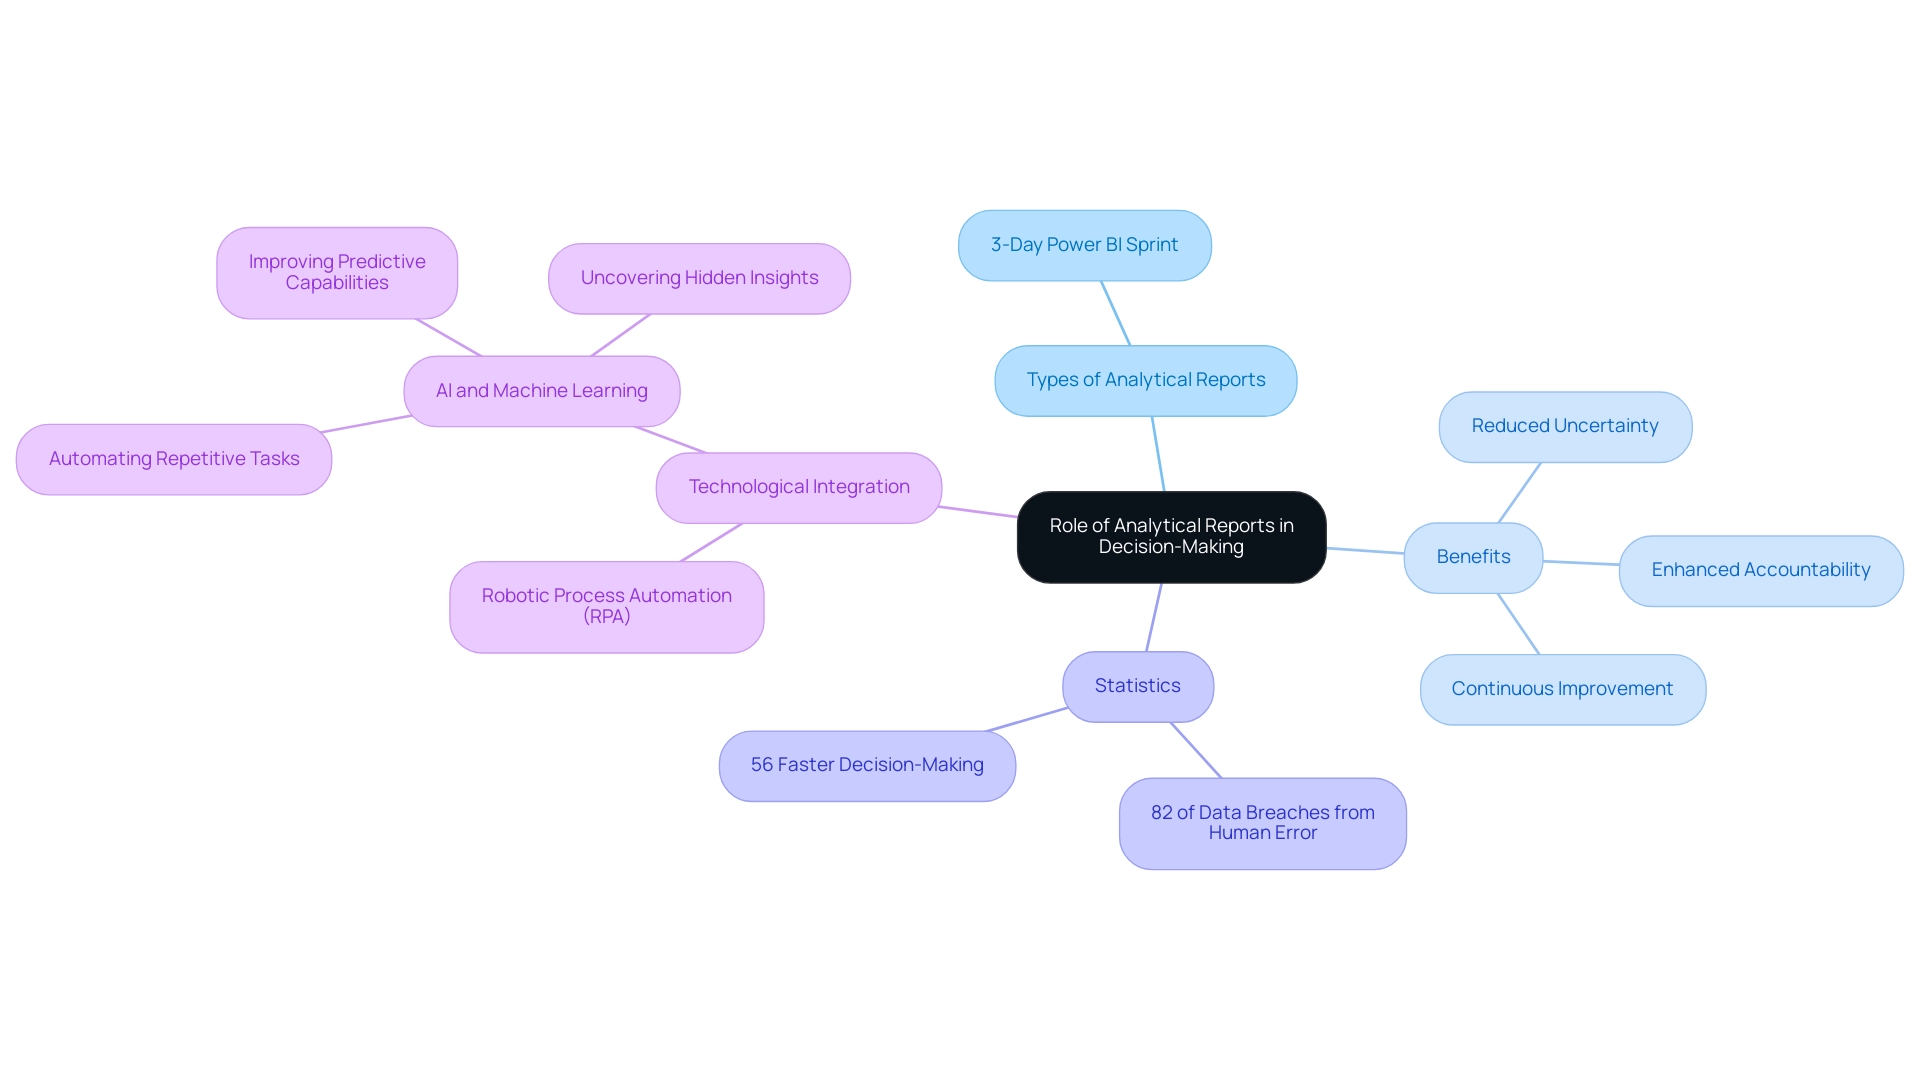
Types of analytical report serve as a cornerstone of informed decision-making, equipping organizations with essential data-driven knowledge that guides strategic initiatives. They enable companies to identify their strengths and weaknesses, gauge market conditions, and reflect on the repercussions of previous actions. For instance, the 3-Day Power BI Sprint enables organizations to create a fully functional, professionally designed document on a topic of their choice quickly.
This not only enables teams to focus on leveraging insights rather than getting bogged down in document creation but also provides a template for future projects, ensuring a professional design from the start. A recent study highlights that a staggering 82% of breaches stem from human error, underscoring the critical need for employee education on privacy best practices to mitigate these risks. By integrating types of analytical report into their decision-making structures, organizations can reduce uncertainty, enhance accountability, and foster a culture of continuous improvement.
According to Catherine Cote from MicroStrategy, 56 percent of respondents stated that analytics resulted in ‘faster, more effective decision-making’ at their companies. This capability empowers leaders to make choices that resonate with their business objectives and enhance operational efficiency, ultimately driving better outcomes in a competitive landscape. Additionally, leveraging Robotic Process Automation (RPA) allows businesses to automate manual workflows, freeing up teams for more strategic tasks.
The integration of advanced technologies like AI and machine learning is revolutionizing this domain, as evidenced by the case study on AI and Machine Learning in Data Analysis, where these technologies automate repetitive tasks and allow analysts to concentrate on strategic decision-making. This not only amplifies the effectiveness of data analysis but also illustrates how organizations can leverage different types of analytical reports to improve decisions and outcomes.
Conclusion
Analytical reports are not just valuable tools; they are essential for organizations aiming to thrive in a data-driven landscape. By transforming raw data into actionable insights, these reports empower decision-makers to identify trends, assess performance, and formulate effective strategies. Understanding the various types of analytical reports—descriptive, diagnostic, predictive, prescriptive, and comparative—provides organizations with the ability to tailor their approach to specific challenges, ensuring the most impactful outcomes.
The key features of effective analytical reports—clarity, relevance, accuracy, visual aids, and actionable insights—serve as the foundation for informed decision-making. By leveraging these characteristics, organizations can cut through the complexities of data and focus on what truly matters. Real-world applications across industries such as healthcare, finance, retail, and manufacturing illustrate the transformative power of analytical reports in driving operational efficiency and strategic growth.
As organizations increasingly embrace advanced technologies like Robotic Process Automation and artificial intelligence, the role of analytical reports becomes even more pronounced. These reports not only enhance decision-making processes but also foster a culture of data-driven innovation. Embracing analytical reporting is crucial for organizations aiming to navigate the complexities of today’s market, ensuring they remain competitive and poised for success. By prioritizing these insights, organizations can effectively harness their data to drive better outcomes and achieve their strategic goals.
Introduction
In the realm of data analytics, Power BI stands out as a powerful tool, enabling organizations to transform raw data into actionable insights. Central to this transformation are parameters, dynamic variables that enhance interactivity and customization in reports. By allowing users to filter data and adjust report values based on their input, parameters not only streamline the reporting process but also foster a deeper engagement with the data.
This article delves into the essential aspects of Power BI parameters, offering a step-by-step guide on their creation, best practices for optimal configuration, practical applications, and troubleshooting common issues. With these insights, organizations can unlock the full potential of their data, driving informed decision-making and operational efficiency in an increasingly competitive landscape.
Understanding Parameters in Power BI
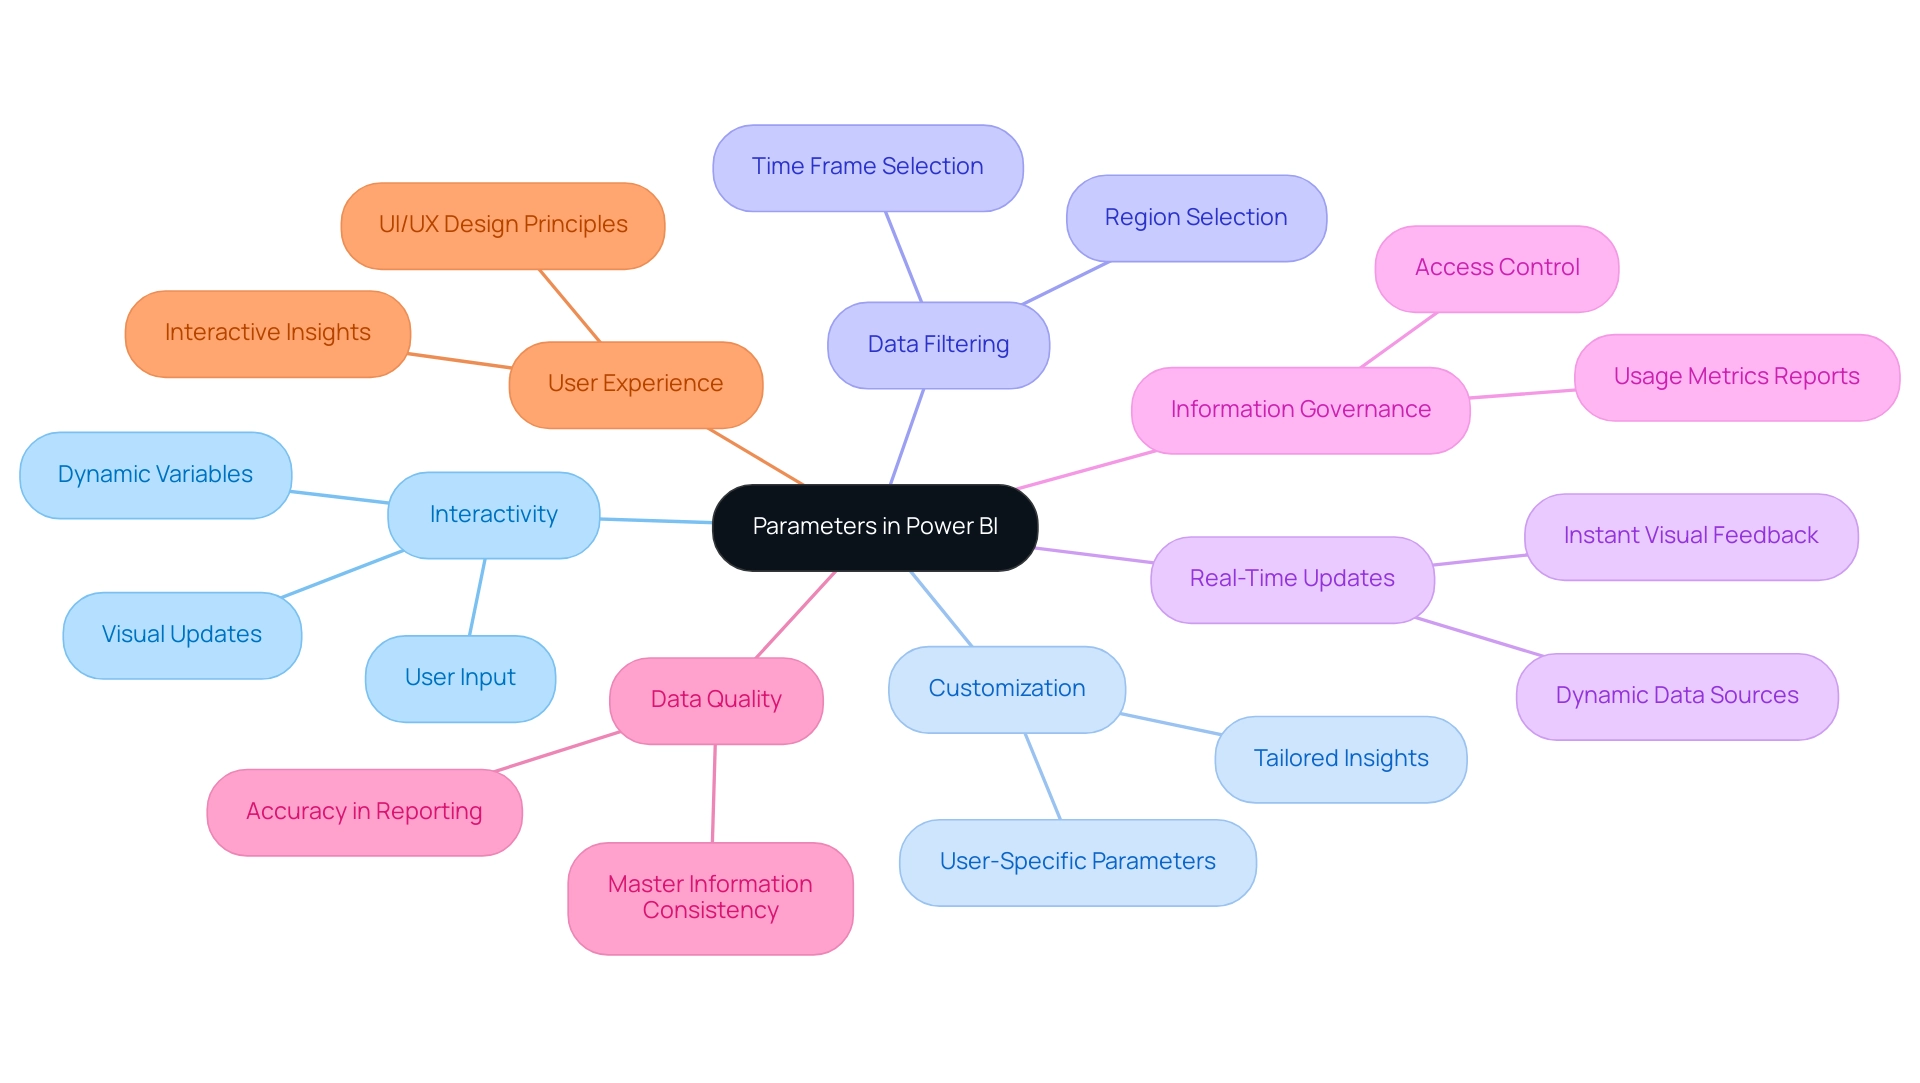
Creating parameters in Power BI serves as dynamic variables that enable users to filter data and adjust values based on their specific input. This capability significantly enhances interactivity and customization, enabling creating parameters in Power BI that can seamlessly adapt to diverse requirements. For instance, users can implement a parameter that enables the selection of a particular region or time frame, resulting in real-time updates to the visuals within the document.
Such functionality is crucial for creating parameters in Power BI, especially when it is vital to maintain updates with changing information sources. Our extensive BI services, including the creative 3-Day BI Sprint, ensure efficient document creation with professional designs, while the General Management App supports thorough oversight and intelligent evaluations. Furthermore, as emphasized in the case study on Business Intelligence Admin Controls for Usage Metrics, the capability to regulate access to usage metrics reports highlights how parameters can improve information governance, offering customized access based on organizational requirements.
Furthermore, tackling challenges like inadequate master information quality is essential; our Power BI services help in creating parameters in Power BI to maintain consistency and accuracy, which are critical for effective decision-making. As RitzCracker, an Advocate II, aptly states, ‘As a graphic designer and BI developer, I have been preaching UI/UX in BI reporting for years. We do not simply make things ‘look attractive’, we offer interactive insights into information that can transform industries!’
This viewpoint highlights the transformative power of variables in delivering tailored insights. Furthermore, our approach to integrating Robotic Process Automation (RPA) and tailored AI solutions within Business Intelligence can help streamline workflows and overcome barriers to data utilization, enhancing overall efficiency. Comprehending how to efficiently use variables is essential for creating parameters in Power BI, which enhances its functionalities, promotes a more interactive user experience, and ultimately facilitates improved decision-making within your organization.
Step-by-Step Guide to Creating Power BI Parameters
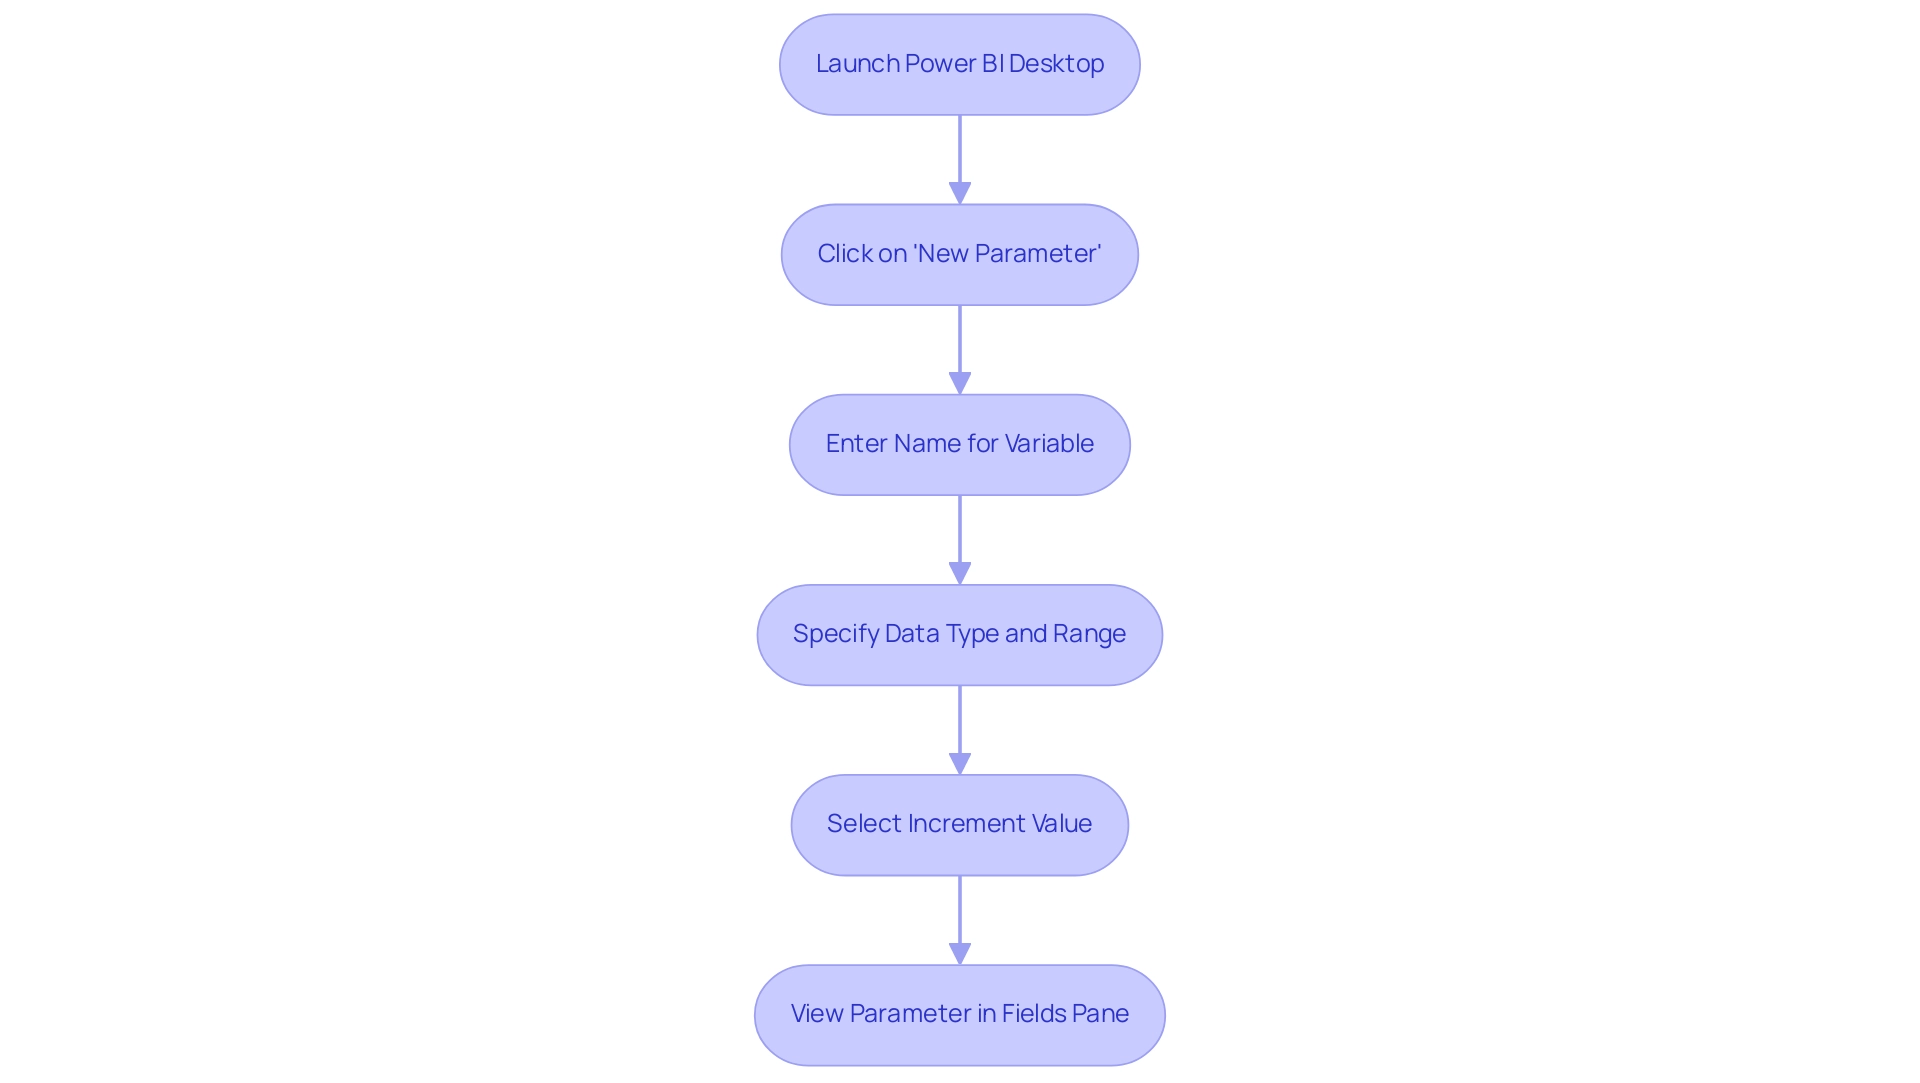
- Launch Power BI Desktop and navigate to the ‘Modeling’ tab.
- Click on ‘New Parameter’ as part of creating parameters in Power BI and select ‘What If Parameter.’
- In the dialog box that appears, enter a name for your variable, such as ‘Sales Target.’
- When creating parameters in Power BI, specify the data type by choosing between options like Decimal or Whole Number, and set the minimum and maximum values to define the range.
- Select the increment value (e.g., 10) to determine how the variable adjusts over its range while creating parameters in Power BI, and then click ‘OK.’
- Your new setting will now be visible in the Fields pane after creating parameters in Power BI. You can enhance your documents by dragging this parameter onto the canvas, allowing for dynamic analysis.
By following these steps, you are proactively tackling common challenges in utilizing Power BI insights, such as time-consuming creation of documents and ensuring consistency of information. It is essential to recognize that a lack of governance strategy can exacerbate these inconsistencies, leading to confusion and mistrust among stakeholders. This enhancement will elevate the interactivity and effectiveness of your reports, allowing you to transform raw information into actionable insights that drive growth and innovation.
Furthermore, examine the case study titled ‘Changing Parameters in Power BI Workspaces,’ which illustrates how users can alter parameters directly in the service, allowing swift modifications to sources without republishing datasets.
Furthermore, as Ploii Tubsamon emphasizes, ‘Step 2: The box below appears after selecting ‘Sample dataset.’ Next, choose ‘Load sample information.’ This foundational step ensures that your documents are both insightful and actionable, ultimately supporting the integrity of your data and the effectiveness of your analysis.
Configuring Your Power BI Parameters for Optimal Use
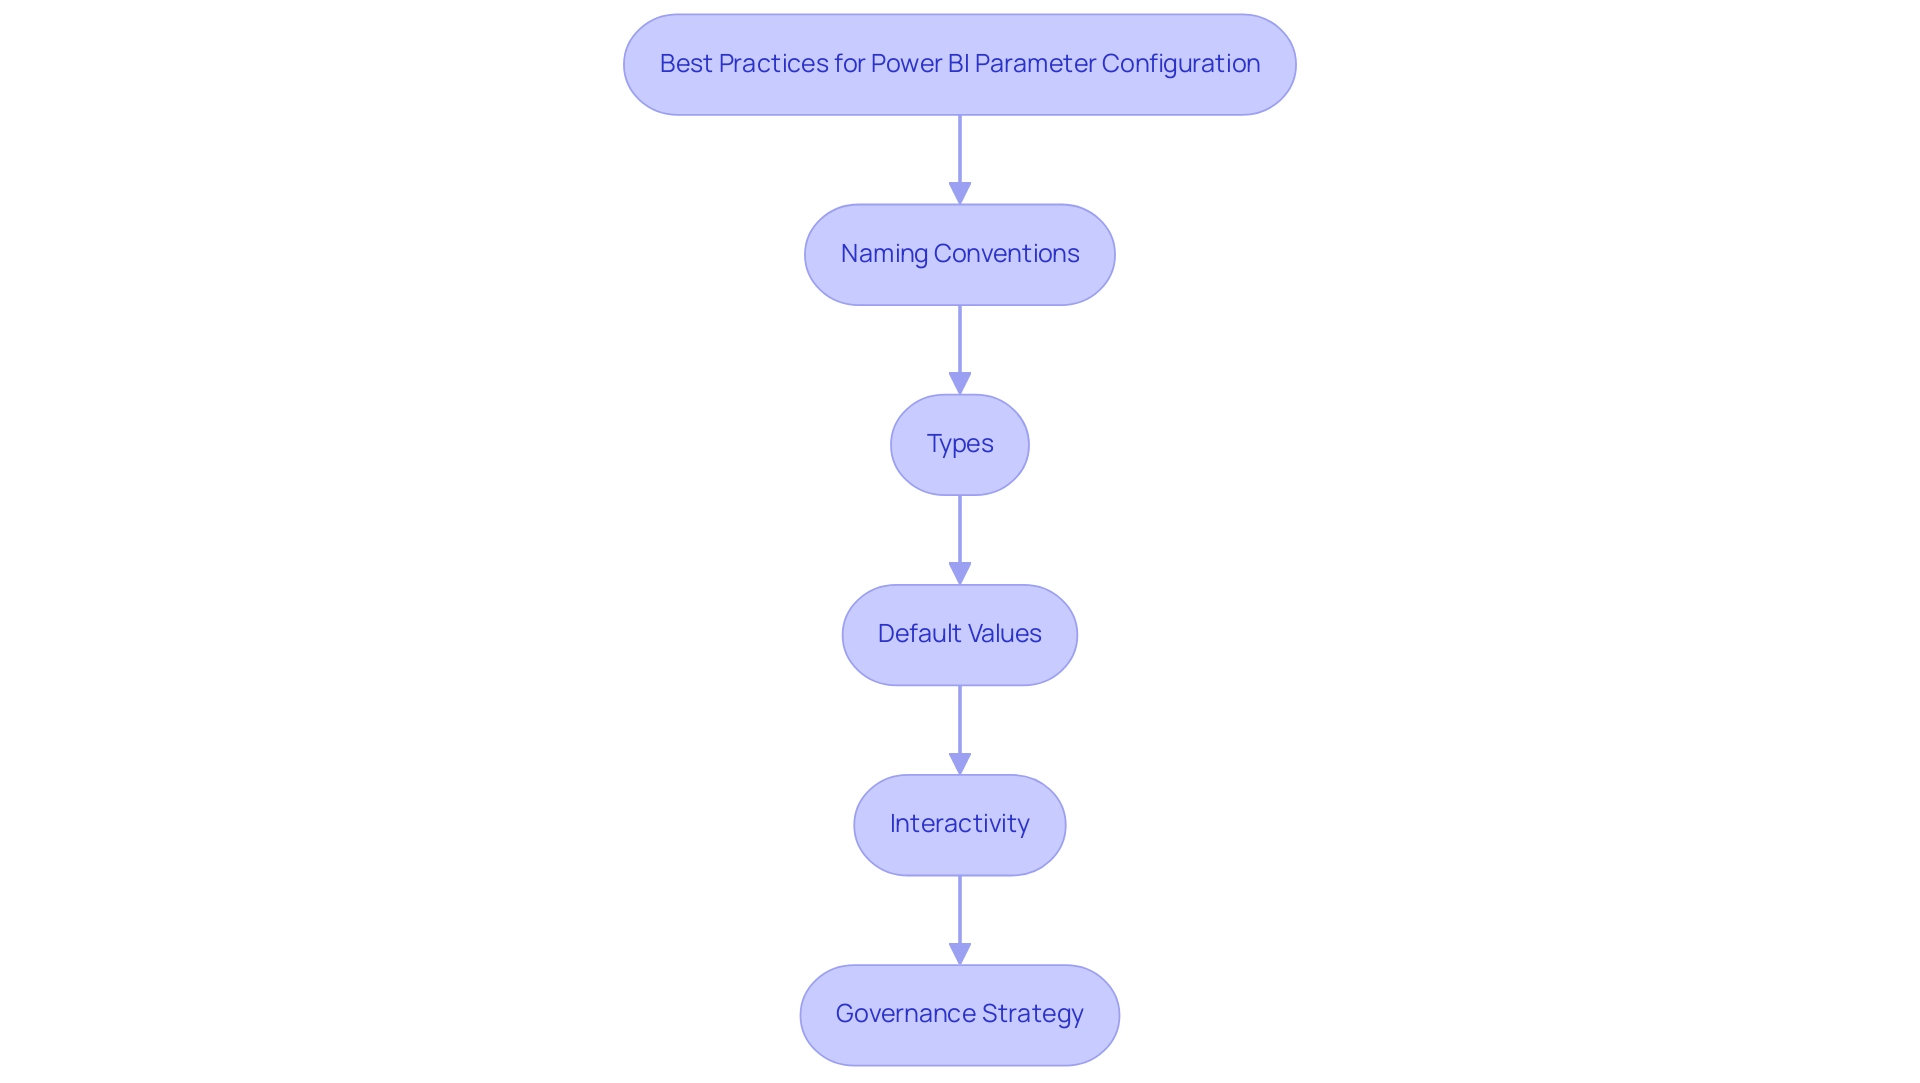
For optimal configuration of your BI parameters, consider the following best practices:
-
Naming Conventions: Use clear and descriptive names for your parameters. As mentioned by Lydia Zhang from the Community Support Team, there are no specific standards for names that you use in Power BI documents. Just ensure that you give the columns/reports/dashboards meaningful and helpful names, which make your users easily understand your business. This method not only improves user understanding but also helps in sustaining uniformity across your documents, tackling the frequent issue of inconsistencies. For example, prefixing calculated tables or columns with ‘ct’ or ‘cc’ assists in differentiating them from view items, further clarifying their function.
-
Types: Choosing the suitable type is essential for ensuring that your inputs align with the anticipated entry, helping to reduce the inefficiencies of lengthy report creation. For instance, utilize text formats for categorical selections and numeric types for quantitative values. This alignment aids in avoiding entry mistakes and guarantees precise filtering.
-
Default Values: Set reasonable default values for your settings. These defaults serve as a guide for users, streamlining their experience without overwhelming them with choices. Standard values can greatly enhance user involvement by offering an initial basis for their information exploration, which is crucial for providing practical advice.
-
Interactivity: Make sure that your settings are strategically connected to visuals within your documents. This setup allows for dynamic responses to user input, creating a more interactive and fluid reporting experience. By enabling real-time updates based on parameter changes, users can obtain insights more efficiently, thereby tackling the absence of actionable guidance in information presentation.
-
Governance Strategy: Establishing a governance approach is essential in preserving integrity and consistency across documents. This strategy should incorporate clear guidelines on information management, ensuring that all users follow best practices, thereby minimizing confusion and mistrust in information presentation.
With over 5,243 users online, the significance and popularity of Business Intelligence emphasize the importance of these strategies. By creating parameters in Power BI and implementing these best practices, you can enhance user engagement and improve the overall functionality of your BI reports. Ultimately, these practices enhance decision-making results and foster your organization’s growth through effective Business Intelligence, converting raw information into actionable insights.
Practical Applications of Parameters in Power BI
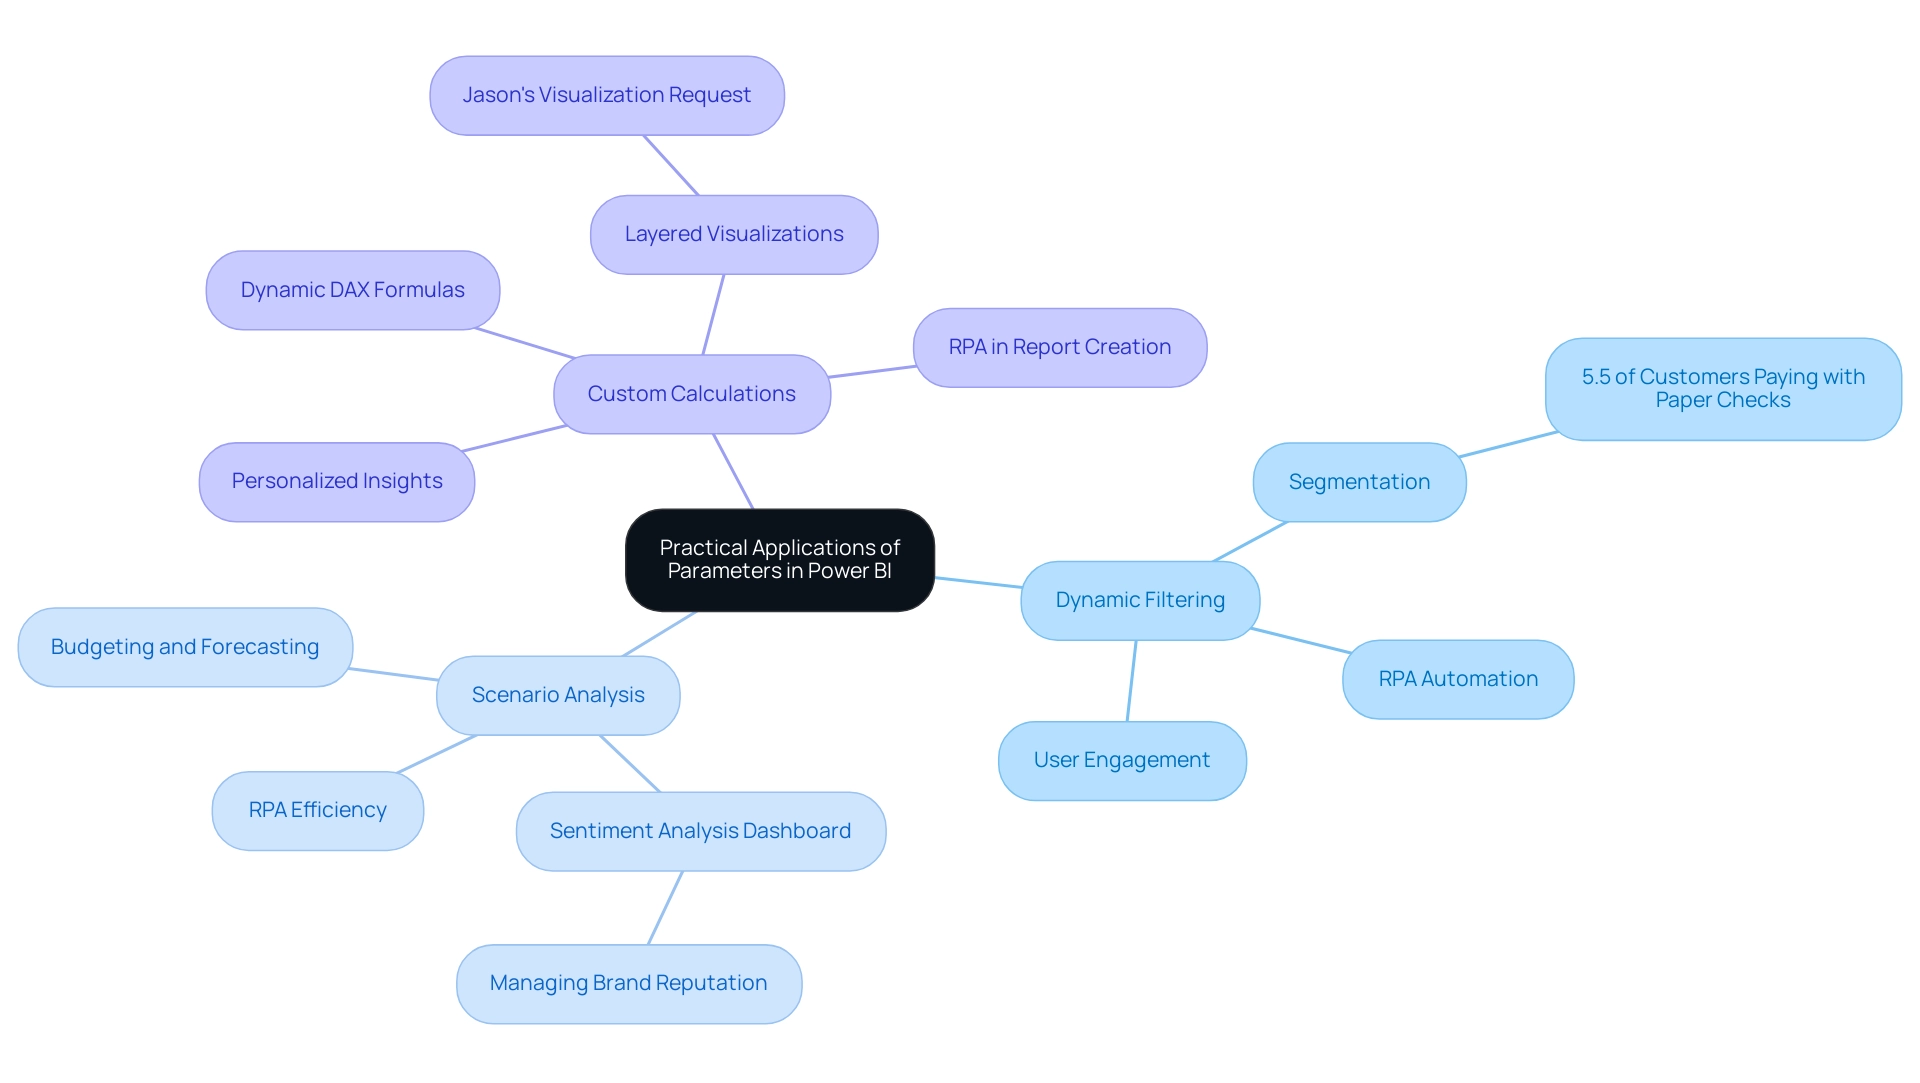
Parameters in Power BI serve as versatile tools for enhancing data management and integration, offering significant benefits across various applications:
- Dynamic Filtering: By enabling users to filter data according to specific criteria—such as date ranges or product categories—dynamic filtering significantly boosts user engagement and data interaction. For example, with 5.5% of customers paying with paper checks, organizations can segment their analysis to focus on this specific group, allowing for targeted strategies and insights. By automating the reporting process through RPA, teams can spend less time on manual input and more time analyzing these insights, reducing errors and freeing up resources for strategic initiatives.
- Scenario Analysis: Creating parameters in Power BI empowers users to create detailed scenarios for budgeting and forecasting. By adjusting key assumptions, users can instantly observe the effects on visuals, fostering informed decision-making that adapts to changing business conditions. A practical application can be observed in the Sentiment Analysis Dashboard, where metrics assist brands in managing their reputation by evaluating user sentiments related to their products. With RPA enhancing information collection and report generation, teams can leverage these insights more efficiently, mitigating challenges such as time-consuming report creation and inconsistencies.
- Custom Calculations: Incorporating variables into DAX formulas opens the door to personalized insights through custom calculations. As users input different values, calculated measures can dynamically adjust, providing tailored analytics that meet the unique needs of stakeholders. As Jason mentioned, “I want to hide an Area level visual behind the Region Level Visual and again a country level visual on top of it,” illustrating the concept of creating parameters in Power BI to enable layered visualizations that enhance data storytelling. Employing RPA in this context can eliminate inconsistencies and save valuable time in the report creation process, further enhancing operational efficiency.
These applications not only enhance the functionality of BI but also align with the strategic goals of operational efficiency, driving better decision-making and ultimately fostering a culture of data-driven insights. By integrating RPA into these workflows, organizations can overcome challenges in leveraging insights from BI dashboards, ensuring they remain agile in a rapidly evolving AI landscape.
Troubleshooting Common Issues with Power BI Parameters
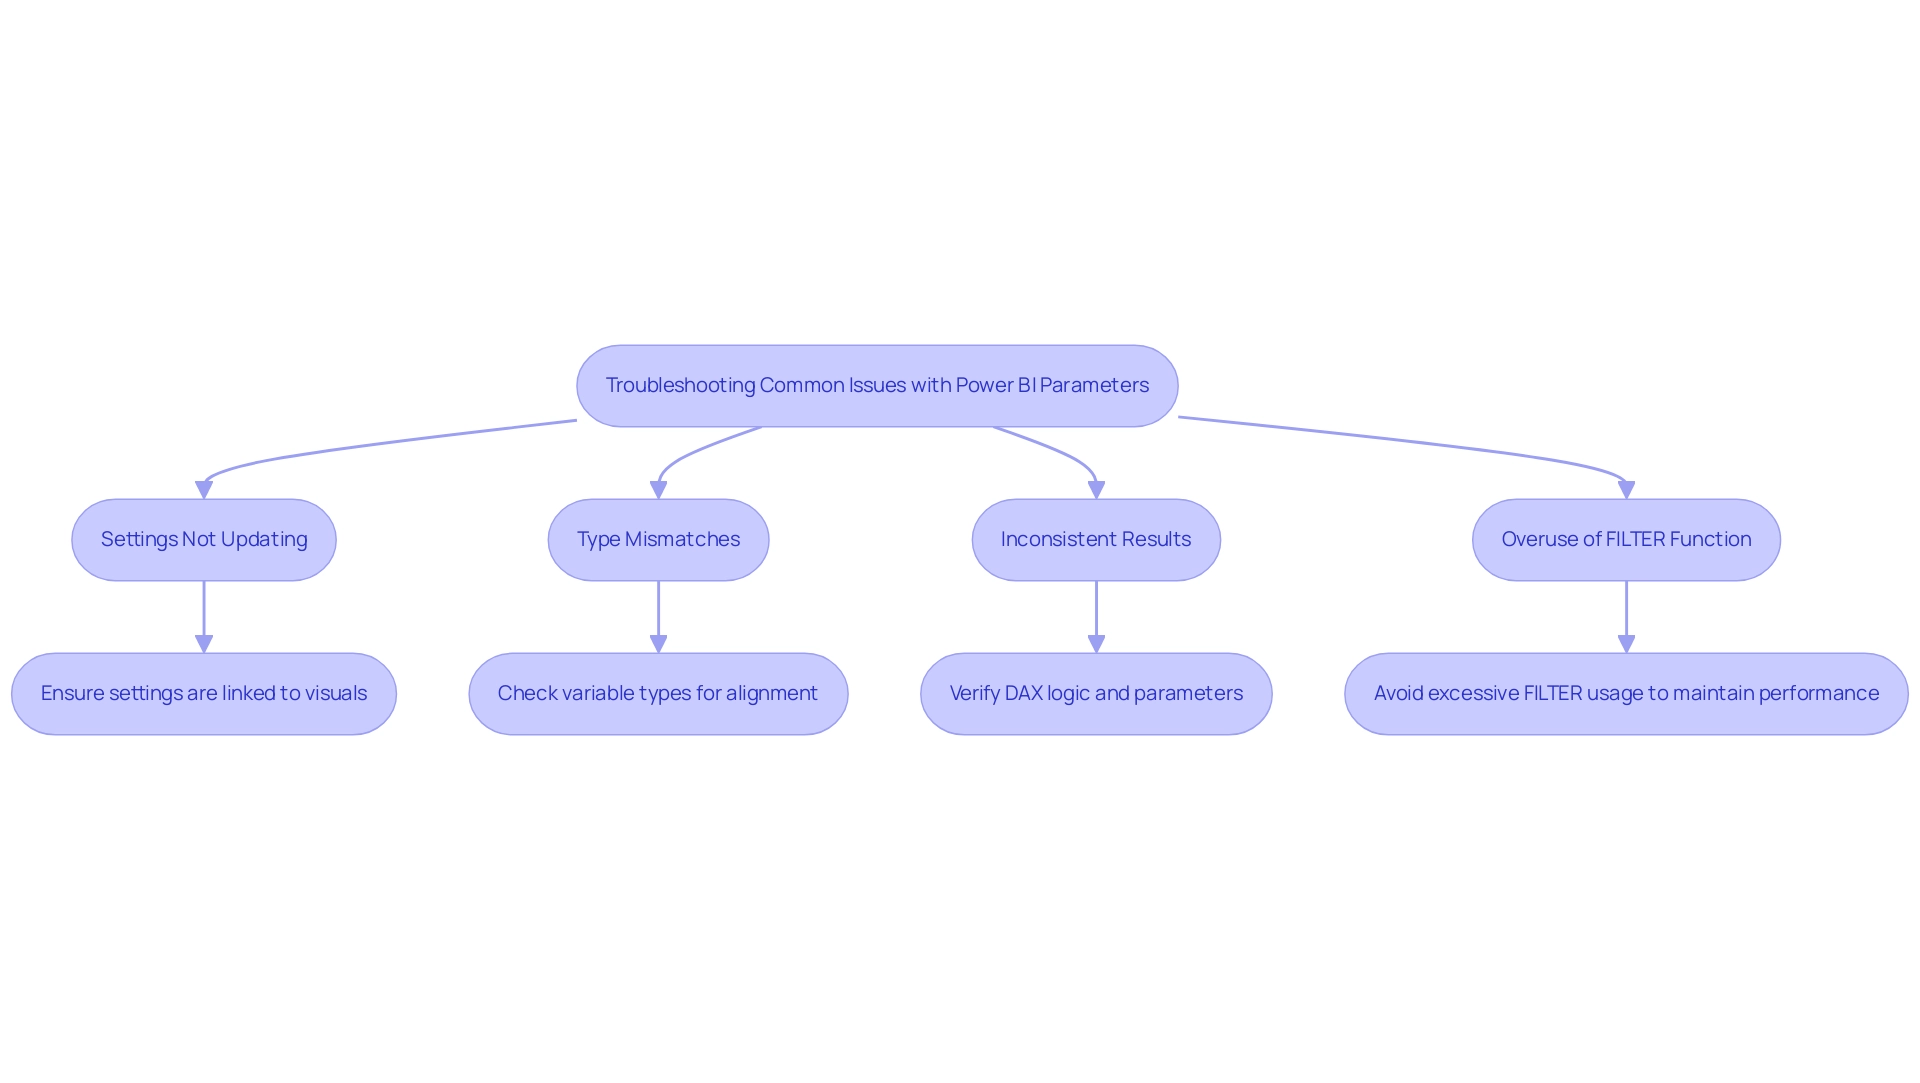
When dealing with variables in Power BI, several common challenges may arise that can hinder your operations. Here are key issues to be aware of and their corresponding solutions:
-
Settings Not Updating: Ensure that settings are correctly linked to the visuals in your report. If you observe they aren’t updating as anticipated, check the configuration settings to ensure all connections are correctly set up.
-
Type Mismatches: A common source of errors arises from type mismatches between your variables and the fields they engage with. Carefully check that the types align, as discrepancies can lead to unexpected results.
-
Inconsistent Results: If the outcomes appear inaccurate, it’s essential to verify the logic used in your DAX formulas. Ensure that the parameters are set with appropriate ranges and that the underlying calculations are functioning correctly.
User experiences highlight the importance of these troubleshooting steps. For example, Rico Zhou recommends updating the report to check for empty columns that might impact visibility. Similarly, a regular visitor observed that utilizing the Merge function instead of Append can assist in preserving integrity when retrieving from multiple tables. Additionally, with 1,496 views on this topic, it’s clear that many users are seeking solutions to these common issues. The case analysis on low-quality information emphasizes the necessity for quality checks, as BI tools such as Query can assist in tackling these challenges and improve decision-making. Furthermore, be cautious of the overuse of the FILTER function, as it can degrade performance when filtering column values directly.
Moreover, organizations often face barriers to adopting AI due to the perception that AI projects are time-intensive and costly. By proactively addressing these common issues, alongside leveraging Business Intelligence insights and considering the implementation of Robotic Process Automation (RPA), you can significantly enhance your proficiency in creating parameters in Power BI to drive operational efficiency. Recognizing and overcoming these challenges will not only improve data quality but also facilitate a smoother integration of AI technologies into your processes.
Conclusion
Parameters in Power BI are essential for transforming data into actionable insights, enhancing interactivity, and fostering user engagement. By understanding their functionality and implementing best practices, organizations can create dynamic reports tailored to specific needs. The step-by-step guide provided illustrates how straightforward it is to establish parameters, while the emphasis on optimal configuration highlights the importance of:
- Naming conventions
- Data types
- Interactivity
in maximizing the effectiveness of reports.
Practical applications of parameters significantly broaden the scope of Power BI, enabling:
- Dynamic filtering
- Scenario analysis
- Custom calculations
These features empower users to make informed decisions quickly, adapting to changing business conditions with ease. Moreover, addressing common troubleshooting challenges reinforces the necessity of a proactive approach to maintaining data integrity and functionality.
Ultimately, harnessing the power of parameters in Power BI not only streamlines reporting processes but also enhances operational efficiency. Organizations that embrace these tools are better positioned to leverage data for strategic insights, driving growth and fostering a culture of informed decision-making in an increasingly competitive landscape. By prioritizing the effective use of parameters, businesses can unlock the full potential of their data, transforming challenges into opportunities for success.
Introduction
In the rapidly evolving landscape of business analytics, the integration of R programming with Microsoft Power BI stands out as a transformative solution for organizations seeking to enhance their data analysis and visualization capabilities. This powerful combination empowers data analysts and business intelligence professionals to tackle complex statistical tasks and create compelling visual narratives, ultimately driving informed decision-making.
As businesses increasingly rely on data-driven insights to navigate competitive markets, the ability to seamlessly merge R’s advanced analytical techniques with Power BI’s user-friendly interface becomes indispensable. From healthcare to finance, diverse industries are leveraging this integration to unlock deeper insights, streamline reporting processes, and elevate operational efficiency.
However, while the potential is immense, organizations must also navigate the challenges of technical expertise and data management to fully harness the benefits of this dynamic duo.
This article delves into the multifaceted advantages of R Power BI integration, real-world applications, and the future trends that will shape its role in business intelligence.
Defining R Power BI: Integration of R with Power BI
The combination of R programming with R Power BI represents a significant advancement in business analytics, enabling users to leverage R’s sophisticated statistical capabilities directly within the R Power BI environment. This synergy not only facilitates the execution of complex analyses and the creation of intricate visualizations but also addresses common challenges in leveraging insights from BI dashboards, such as time-consuming report creation and inconsistencies. Our BI services ensure efficient reporting and clear actionable guidance, highlighted by our 3-Day BI Sprint for rapid report creation and the General Management App for comprehensive management and smart reviews.
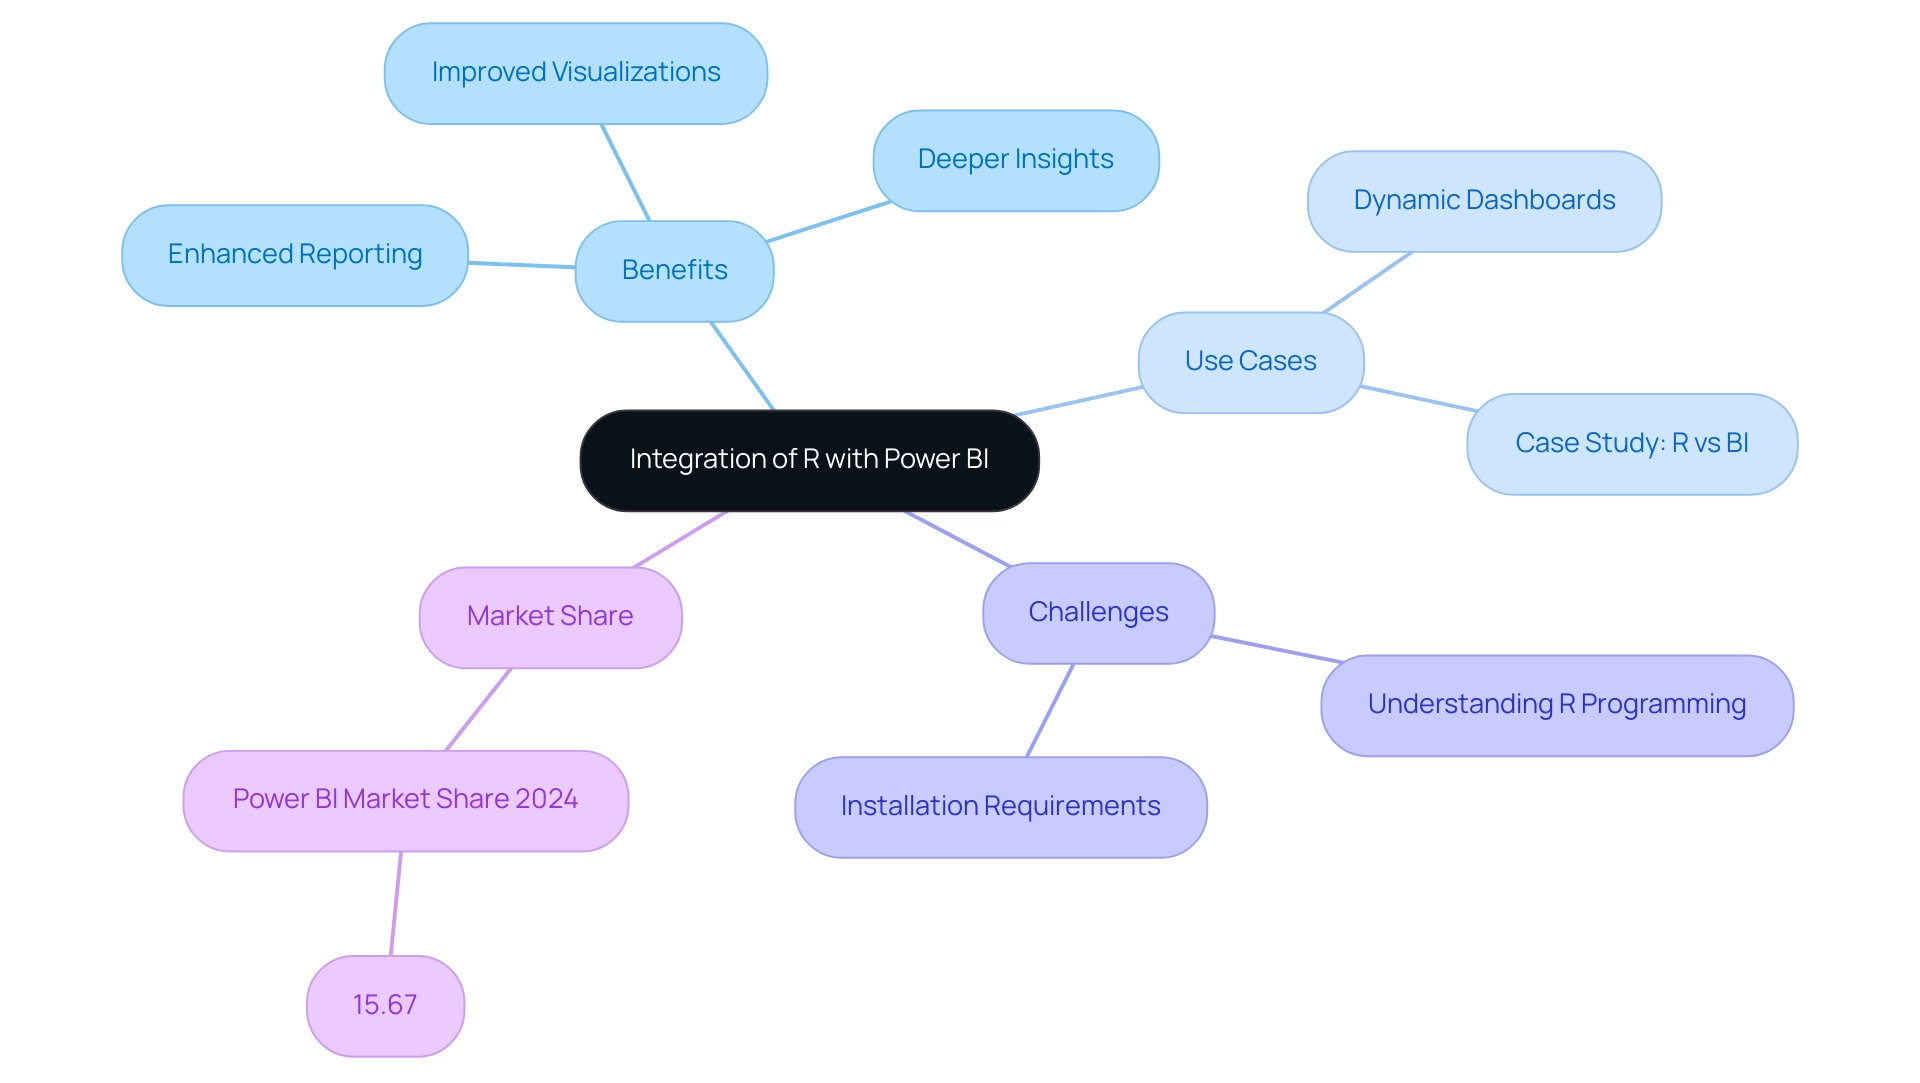
A case study titled ‘Visualization: R vs BI’ illustrates BI’s superiority in visual representation due to its user-friendly interface and capability to connect with external sources, enabling quick crafting of visuals. By incorporating R PowerBI scripts into BI, users gain access to an extensive array of statistical methods and visual representations, facilitating deeper insights and more comprehensive analysis. As enterprises progressively aim to enhance their information-driven decision-making, the integration of R Power BI and Business Intelligence empowers analysts and professionals to improve their reporting capabilities efficiently.
Furthermore, it’s important to note, as Akshay Dabhi points out, that while R incorporation provides powerful capabilities, it might require some understanding of the R programming language and its libraries. With BI commanding a notable 15.67% market share in 2024, its ability to seamlessly integrate R Power BI further enhances its position as a leading tool for advanced information analysis and visualization. This integration not only broadens the scope of analytical techniques available but also equips organizations to present information in a more accessible and visually compelling manner, ensuring stakeholders can easily grasp complex insights.
Additionally, the dynamic dashboards in BI enhance financial reporting, providing clearer insights into cash flow and sales. To overcome outdated systems and improve operational efficiency, businesses can leverage EMMA RPA solutions, ultimately transforming their operations and addressing the competitive disadvantage of not utilizing Business Intelligence effectively.
Benefits of R Power BI Integration: Enhancing Data Analysis and Visualization
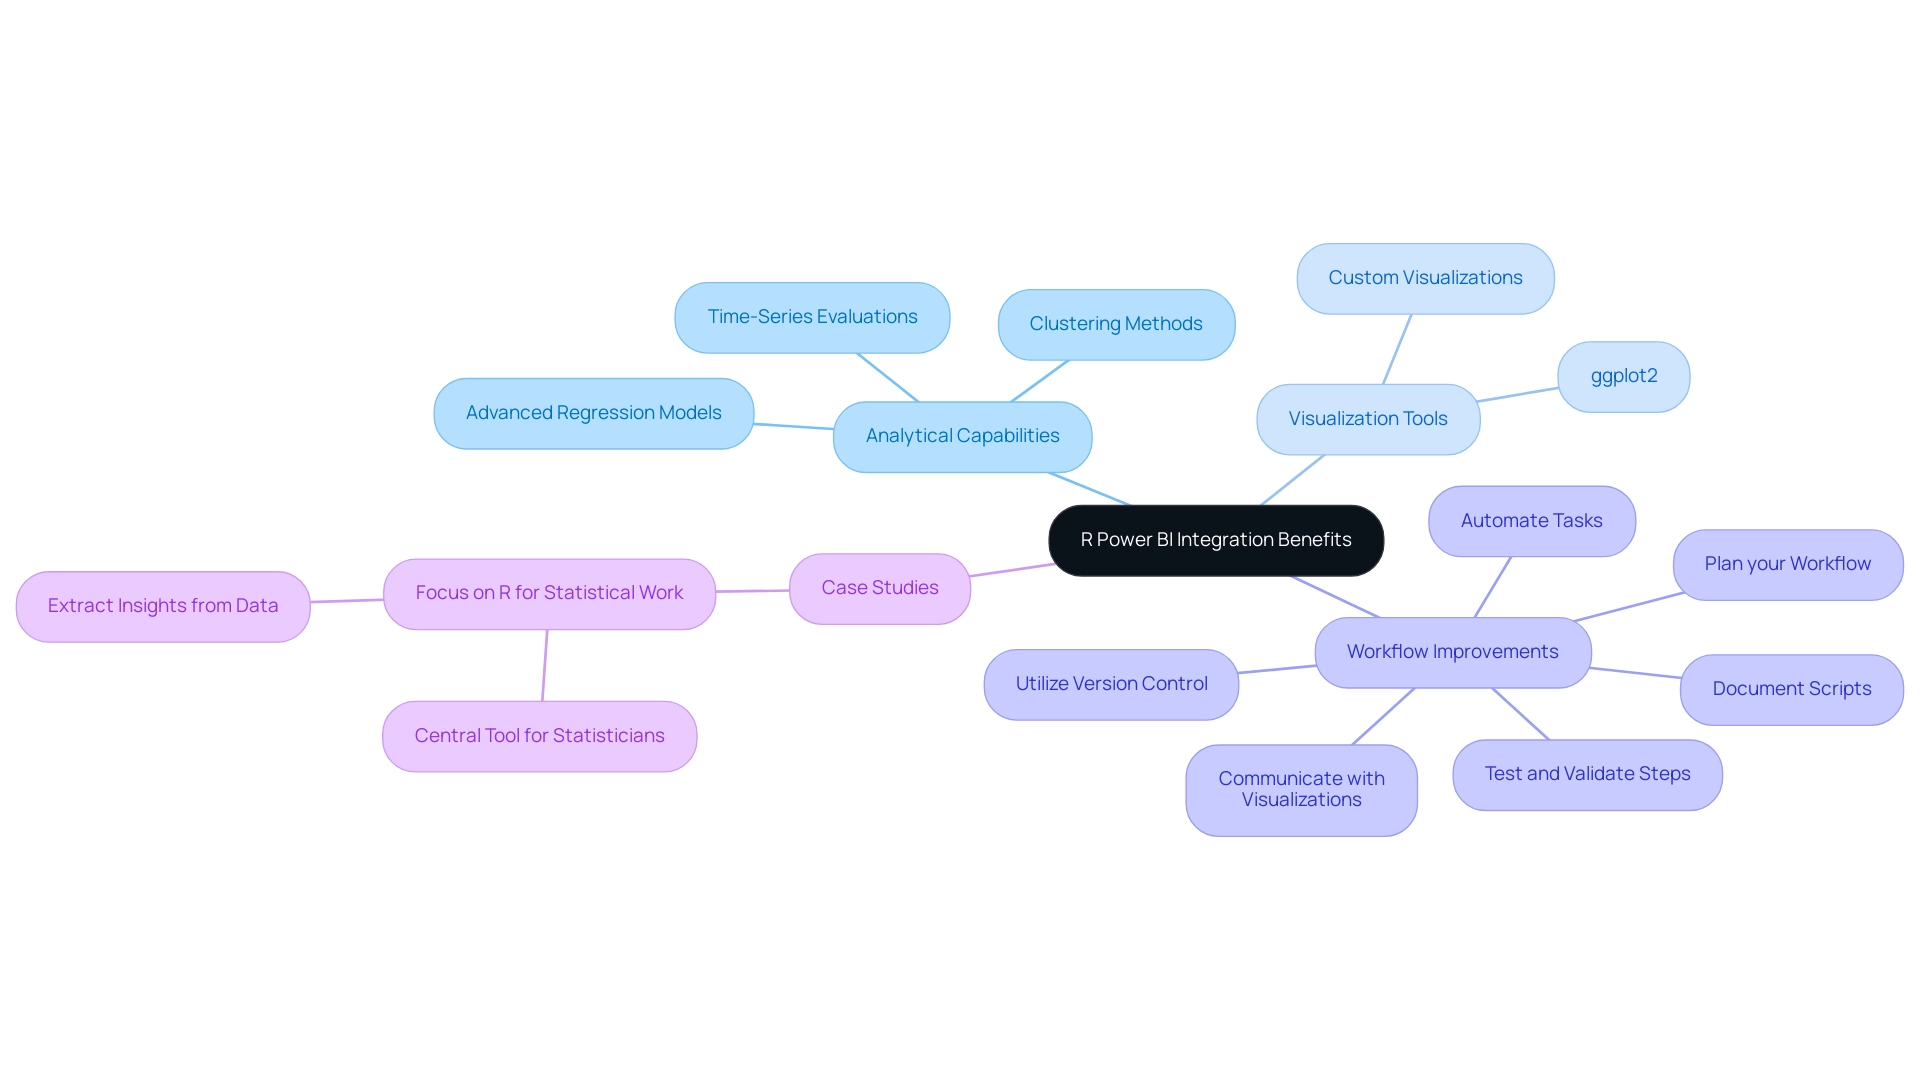
The integration of R Power BI unlocks a wealth of benefits that significantly improve data examination and visualization capabilities. This combination enables users to conduct intricate statistical evaluations that BI does not support inherently, including:
- Advanced regression models
- Clustering methods
- Time-series evaluations via R scripts
This significantly enhances analytical capabilities. Furthermore, R’s powerful visualization libraries, particularly ggplot2, enable the creation of custom visualizations that integrate seamlessly into R Power BI dashboards.
This adaptability encourages narrative construction with information and aids in a more profound comprehension of patterns and trends, essential for making informed choices.
Furthermore, the combination simplifies and automates information evaluation procedures, lessening manual labor and decreasing possible mistakes—a crucial element for operational effectiveness. A recent survey indicated that over 50% of data analysts leverage R for their data analysis needs, affirming its significance in the field. As Akshay Dabhi highlights, while R integration offers powerful capabilities, a solid understanding of the R programming language and its libraries is essential for optimal use.
Utilizing prescriptive analytics in R can also recommend actions that optimize decision-making and achieve desired business outcomes.
Additionally, the 3-Day Power BI Sprint allows organizations to quickly create professionally designed reports, enhancing the efficiency of the reporting process. The General Management App provides extensive management and intelligent evaluations, ensuring that insights are actionable and aligned with business objectives. A pertinent case study, ‘Focus on R for Statistical Work,’ demonstrates that R should be central for statisticians in analysis, providing all necessary tools for statistical work.
To enhance workflows in R for information synthesis, it is recommended to:
- Plan your workflow
- Utilize version control tools like Git
- Automate repetitive tasks
- Document scripts
- Test and validate connection steps
- Communicate effectively with visualizations
Ultimately, the combination of R Power BI and Business Intelligence, along with tailored AI solutions, equips organizations to make informed, data-driven decisions, fostering enhanced operational efficiency and success in business analytics for 2024.
Use Cases of R Power BI Integration: Real-World Applications
Organizations across various sectors are utilizing the strength of R Power BI and Python integration within business intelligence to enhance their analytics capabilities, effectively navigating the overwhelming AI landscape with customized solutions. However, many businesses struggle to extract meaningful insights from their information, which can leave them at a competitive disadvantage.
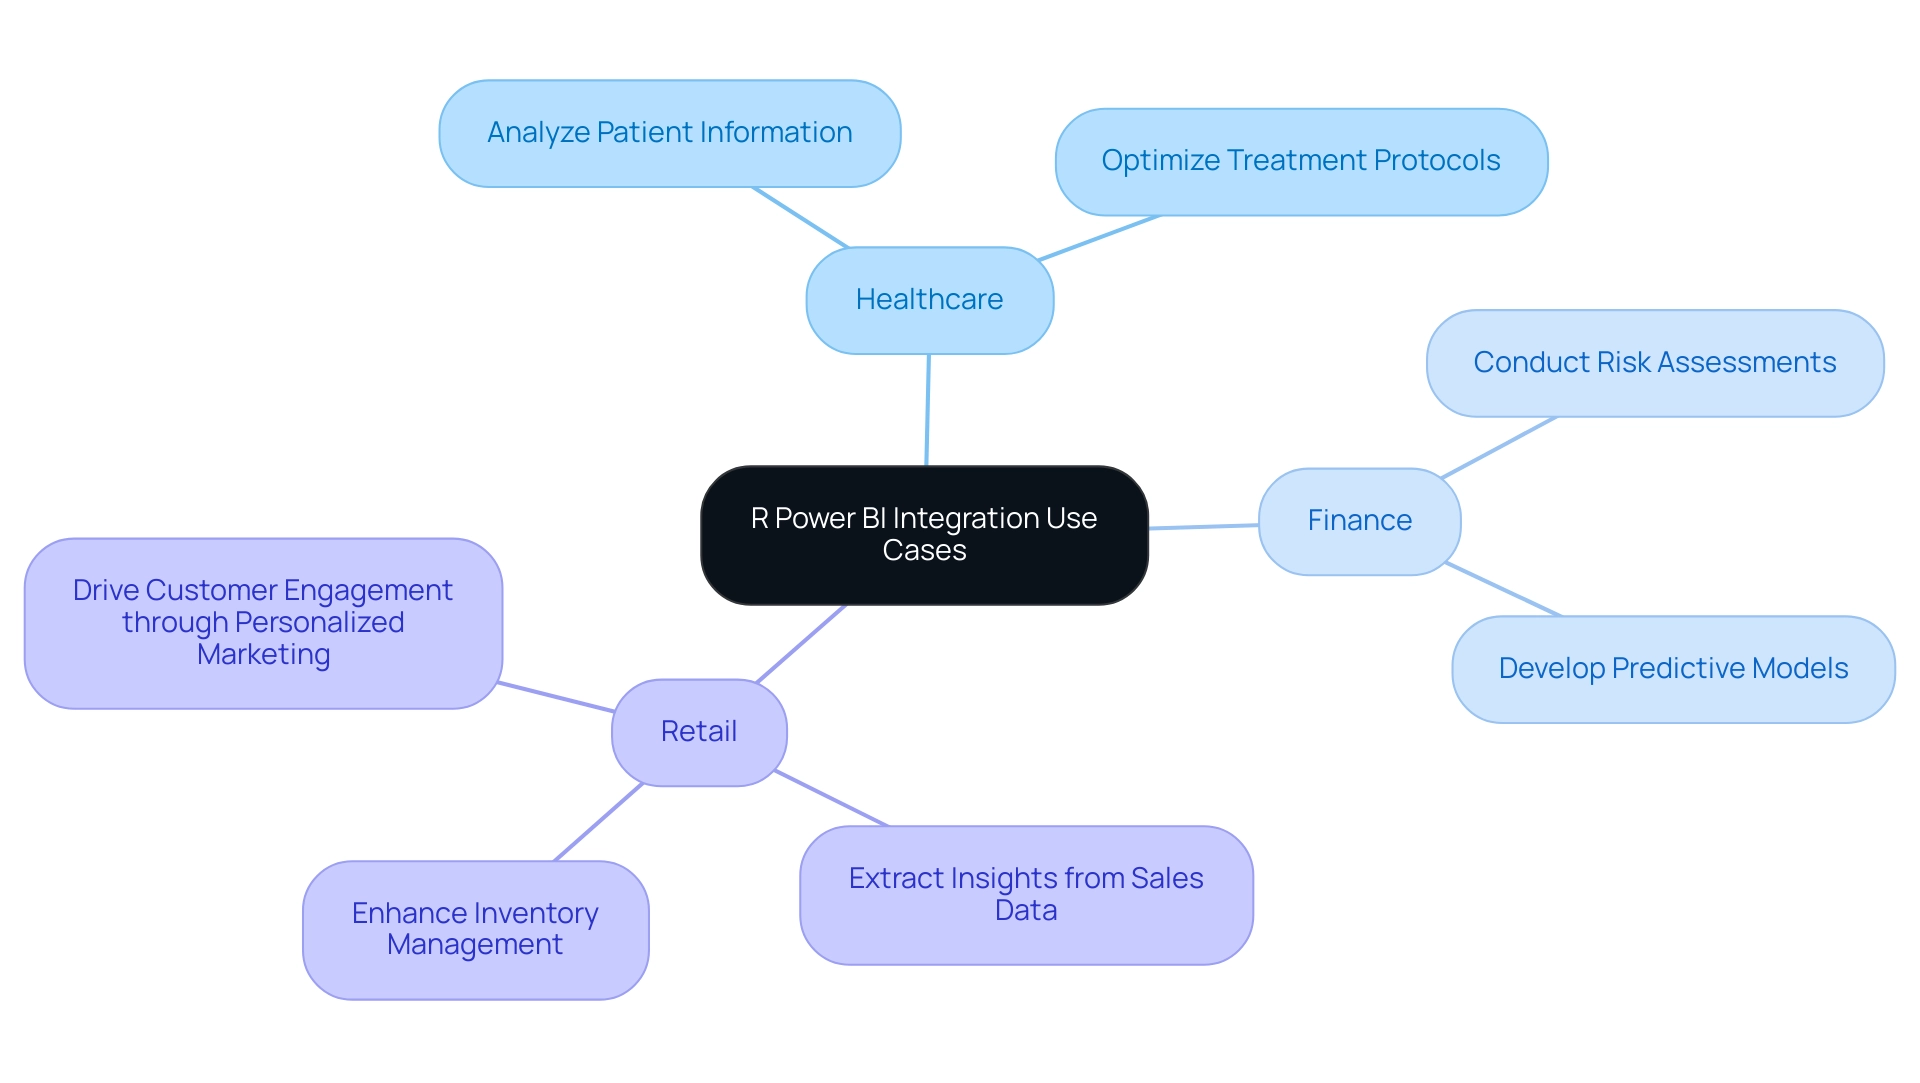
In the healthcare sector, for example, hospitals are utilizing R Power BI to meticulously analyze patient information, enabling them to identify trends in outcomes and optimize treatment protocols for improved patient care.
Similarly, in the finance sector, analysts are leveraging R scripts within R Power BI and Business Intelligence tools to conduct comprehensive risk assessments and develop predictive models that inform strategic investment decisions. Retailers are also using R Power BI to extract valuable insights from sales data, which enhances inventory management and enables personalized marketing efforts that drive customer engagement. Furthermore, the ability to derive actionable insights from Customer Lifetime Value (CLV) analysis is proving crucial for developing effective customer retention strategies.
With Microsoft BI commanding an impressive 15.67% market share in 2024, its popularity underscores its relevance in the industry. As Hemendra Singh, Director and Co-founder of The NineHertz, aptly states, “Being an entrepreneur in the field of the IT sector, it becomes my responsibility to aid my audience with the knowledge of the latest trends in the market.” These real-world applications demonstrate the remarkable versatility of R Power BI integration in addressing specific business challenges and fostering data-driven decision-making, ultimately driving operational efficiency and growth.
By utilizing tailored AI solutions, businesses can cut through the noise and effectively leverage their information to gain a competitive edge.
Challenges and Considerations in R Power BI Integration
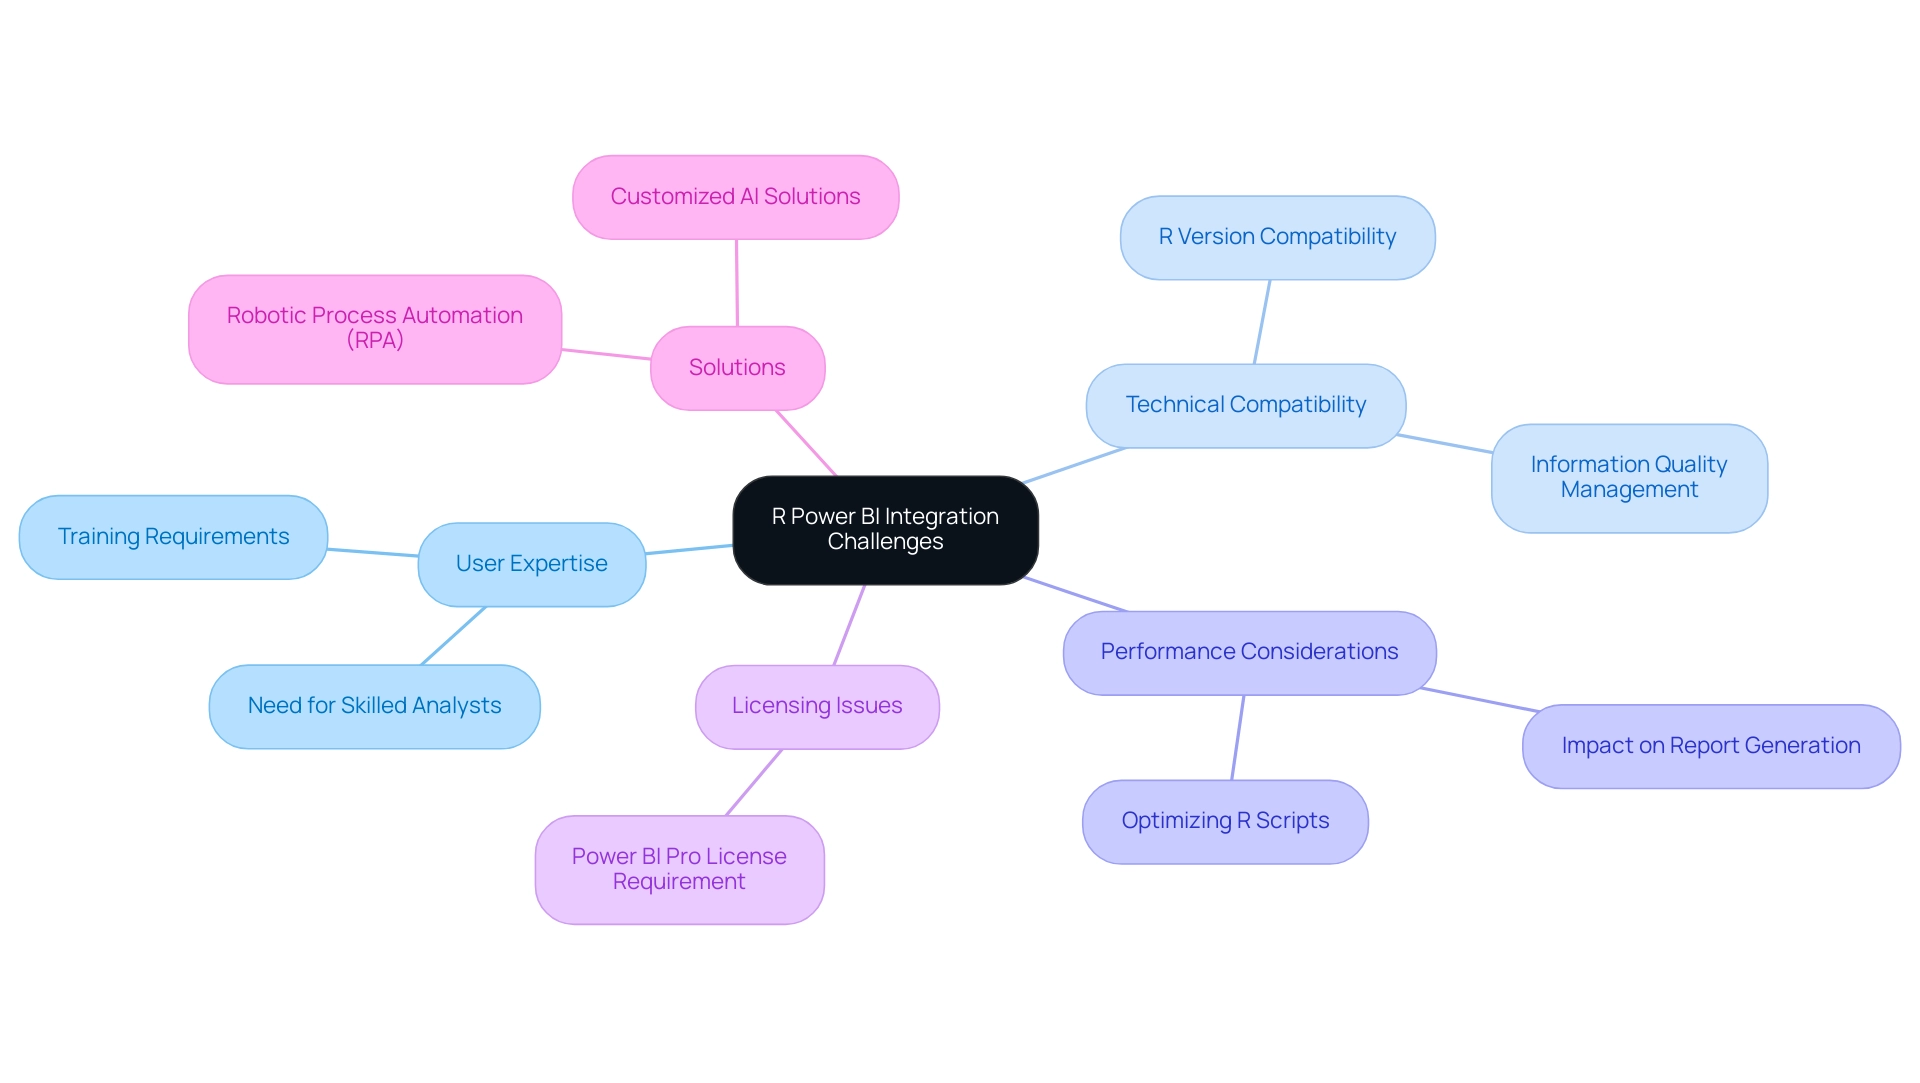
Incorporating R with BI offers organizations remarkable opportunities for advanced analysis, yet it is not without its challenges. A prevalent issue is the critical requirement for users to possess a solid foundation in R programming to fully exploit its capabilities. Without this expertise, organizations may find themselves needing to invest in comprehensive training programs or bring in skilled analysts who are proficient in R. As Janey from the Community Support Team notes,
Logically speaking, if the R script is successfully installed, it should be automatically generated.
This highlights the technical challenges organizations face, particularly regarding the compatibility of R versions with BI. Moreover, ensuring information quality and consistency between R and BI can prove complex, demanding robust management practices to maintain accuracy and reliability. Performance considerations are equally crucial; poorly optimized R scripts have the potential to slow down report generation, impacting user experience.
A key factor to consider is that users typically require a BI Pro license to access shared reports, which can influence the deployment of R-integrated solutions. To overcome these technology implementation challenges, organizations can leverage Robotic Process Automation (RPA) to streamline workflows, enhancing efficiency by reducing manual tasks and errors, ultimately improving report generation times. Furthermore, customized AI solutions can assist in navigating the complexities of the changing information landscape, aligning technologies with specific business objectives.
The BI Dev Dash Competition illustrates how users can successfully navigate these challenges; contestants like Angelica and Allison showcased their skills in cleaning datasets and building interactive reports, emphasizing the importance of both technical prowess and design. Failing to effectively leverage Business Intelligence can leave organizations at a competitive disadvantage, as they may miss out on critical insights that drive innovation and growth. By proactively tackling these challenges and investing in training for R Power BI within BI, organizations can unlock the full potential of their insights capabilities, thereby driving growth and informed decision-making.
For further insights on RPA and AI solutions, organizations are encouraged to explore available resources and training opportunities.
Future Trends in R Power BI Integration
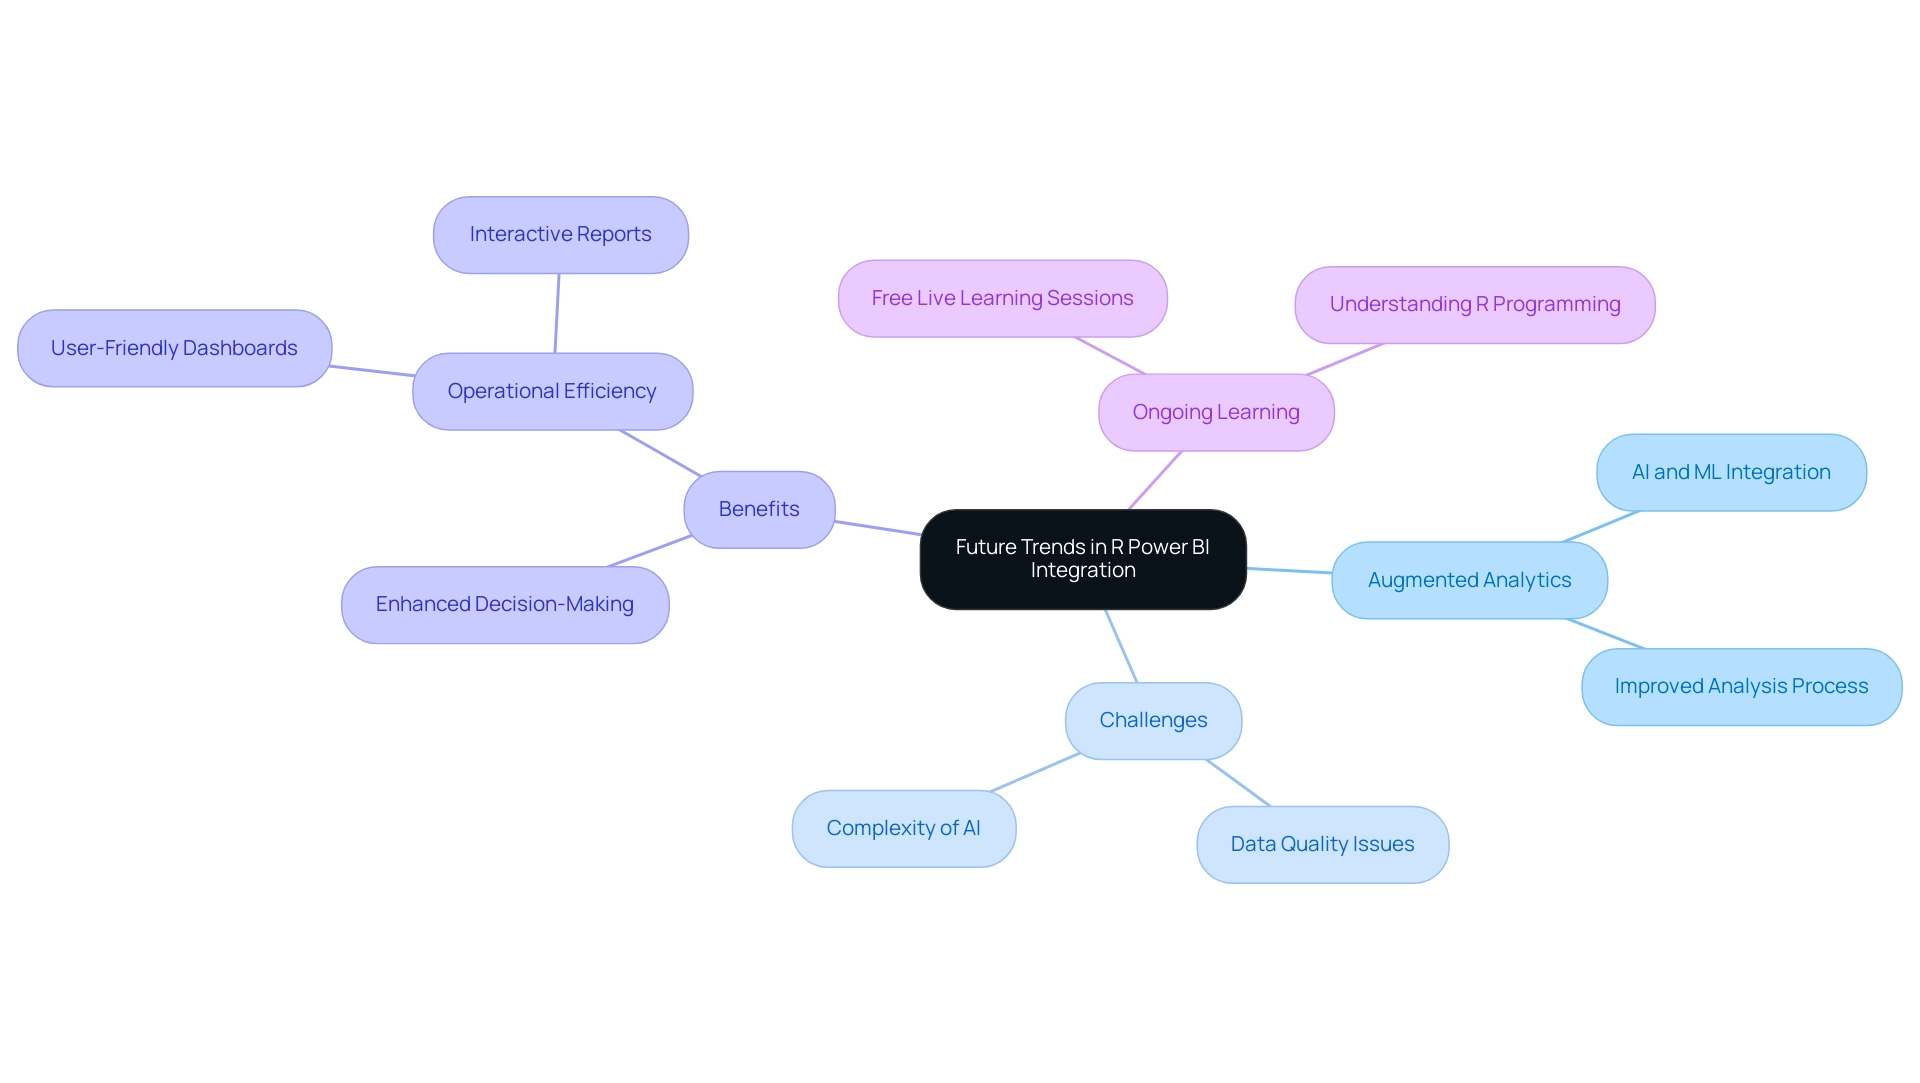
The future of integrating R with Business Intelligence is increasingly bright as organizations recognize the critical role of data-driven decision-making. One significant trend is augmented analytics, where artificial intelligence and machine learning improve the analysis process. This change is anticipated to transform how R is used within Business Intelligence, tackling frequent issues such as inadequate master information quality and the hesitance to embrace AI because of views on complexity, expense, and the notion that AI initiatives are time-consuming.
As companies produce substantial quantities of data, the need for sophisticated analytical abilities will increase, further promoting improvements in R’s compatibility with BI.
According to Akshay Dabhi, “It’s important to note that while R incorporation provides powerful capabilities, it might require some understanding of the R programming language and its libraries.” Organizations that proactively embrace these trends and invest in ongoing learning, such as participating in free live learning sessions, will be well-equipped to utilize R analytics, fostering innovation and maintaining a competitive edge.
Moreover, companies like Digixvalley exemplify how effective use of R in Business Intelligence can significantly enhance operational efficiency through intuitive dashboards. By utilizing their knowledge as a BI consulting partner, they illustrate how R connection can result in enhanced decision-making and efficient operations.
Furthermore, the recent update permitting BI Mobile applications to support folders in workspaces demonstrates practical advancements that improve R compatibility, allowing users to navigate organized items efficiently. As we look toward 2024, the trajectory of R Power BI integration will likely focus on refining augmented analytics and leveraging AI to elevate decision-making capabilities, helping organizations overcome challenges in the daunting AI landscape and addressing common apprehensions about AI accessibility.
Conclusion
The integration of R programming with Microsoft Power BI offers a powerful synergy that revolutionizes data analysis and visualization capabilities. By harnessing R’s advanced statistical techniques within the user-friendly Power BI environment, organizations can perform complex analyses and create compelling visual narratives that drive informed decision-making. This combination not only enhances reporting efficiency but also empowers businesses across various sectors, from healthcare to finance, to extract deeper insights and elevate their operational efficiency.
While the advantages of R Power BI integration are significant, organizations must also consider the challenges that come with it. A solid understanding of R programming is essential for users to fully leverage its potential, necessitating investments in training and data management practices. Additionally, addressing performance and compatibility issues is crucial for ensuring that analytics processes run smoothly and effectively. By proactively tackling these challenges with tailored solutions, such as Robotic Process Automation and ongoing learning opportunities, businesses can unlock the full potential of their data analytics capabilities.
Looking ahead, the future of R Power BI integration is promising, driven by trends such as augmented analytics and the increasing demand for advanced analytical capabilities. Organizations that embrace these developments and invest in continuous improvement will be well-positioned to navigate the evolving landscape of business intelligence. As the capabilities of R and Power BI continue to expand, businesses can expect to achieve greater operational success and maintain a competitive edge in their respective markets.
Introduction
In the realm of data-driven decision-making, the ability to create impactful reports using Power BI is a game changer for organizations striving for operational excellence. This article outlines essential steps that empower users to transform raw data into compelling visual narratives. From defining the purpose of a report to selecting the right visualizations and enhancing interactivity, each phase plays a crucial role in delivering actionable insights. By leveraging advanced features and best practices, businesses can not only streamline their reporting processes but also foster a culture of informed decision-making that drives growth and innovation. Whether a novice or seasoned analyst, understanding these foundational elements can significantly elevate the effectiveness of Power BI reports, ensuring that data becomes a powerful ally in achieving strategic objectives.
Essential Steps for Creating Power BI Reports
-
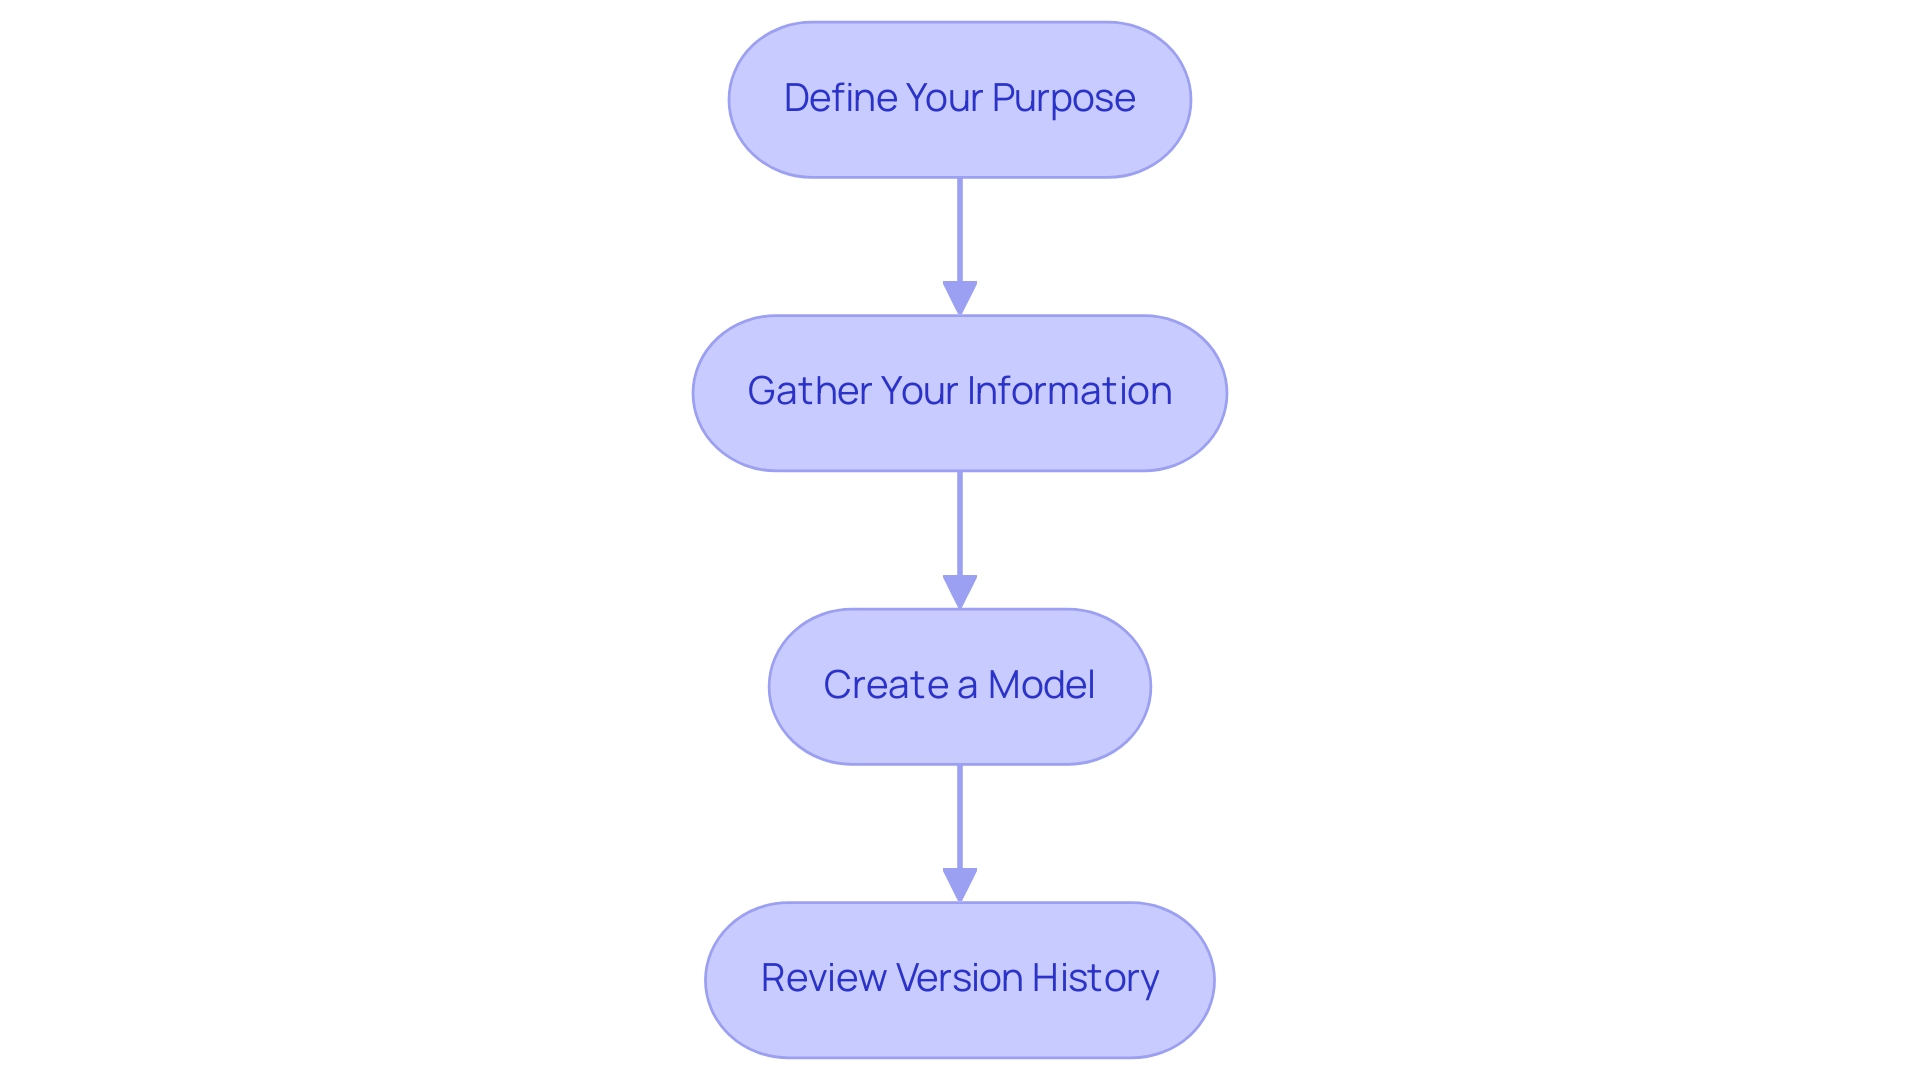
Define Your Purpose: Begin by pinpointing the core objective of your document. What particular understandings do you aim to convey? Creating this clarity will not only determine your information selection but also affect your visualization decisions, resulting in more effective presentations. This focus is essential in a data-rich environment where actionable insights are pivotal for driving growth and innovation.
-
Gather Your Information: Collect information from a variety of sources, ensuring its relevance to the report’s intent. The flexibility of BI enables connections to databases, Excel files, and online services, facilitating comprehensive integration and addressing common challenges such as inconsistencies.
Load Information into Power BI: Launch Power BI Desktop and utilize the ‘Get Information’ feature to import your selected sources. Prioritize information cleanliness and structure, as this is essential for effective reporting. Remember, the quality of your insights depends on the integrity of your data.
- Create a Model: If necessary, establish relationships between different tables. This modeling phase is vital for ensuring accurate reporting and insightful analysis, which is essential for understanding how to build Power BI reports and paving the way for informed decision-making that drives operational efficiency.
Start Learning How to Build Power BI Reports: With your information loaded and structured, initiate the report-building process by selecting a blank report page in Power BI Desktop. Incorporate features like bookmarks, drillthrough pages, and tooltips to streamline information presentation and enhance user interaction. Utilizing these features can significantly reduce the amount of data loaded on a page, improving performance and user experience. Furthermore, think about utilizing the ‘3-Day BI Sprint’ to swiftly generate professionally crafted documents, ensuring efficiency in your reporting process.
- Review Version History: Regularly review and utilize version history to track changes made to reports and dashboards. This practice not only aids in maintaining clarity but also ensures that all stakeholders are aligned with the latest updates. As you engage in this process, consider leveraging Power Automate to streamline workflows, enabling a risk-free ROI assessment and professional execution. Furthermore, automating repetitive tasks can enhance efficiency and employee morale, tackling staffing shortages and outdated systems.
As highlighted by statistical analysis enthusiast Douglas Rocha, > Even though one can assume it is the simplest of all statistical measures since it is only the most common value in the dataset, there isn’t a native DAX function to calculate it. This highlights the necessity of thoughtful planning and execution in your report-building journey. Furthermore, consider the significance of naming conventions for sources and datasets, as discussed in the case study, to document their origins clearly and maintain security without compromising sensitive information.
Furthermore, utilize the General Management App for comprehensive management and smart reviews to enhance your overall reporting strategy.
Selecting Data and Visualization Techniques for Impactful Reports
-
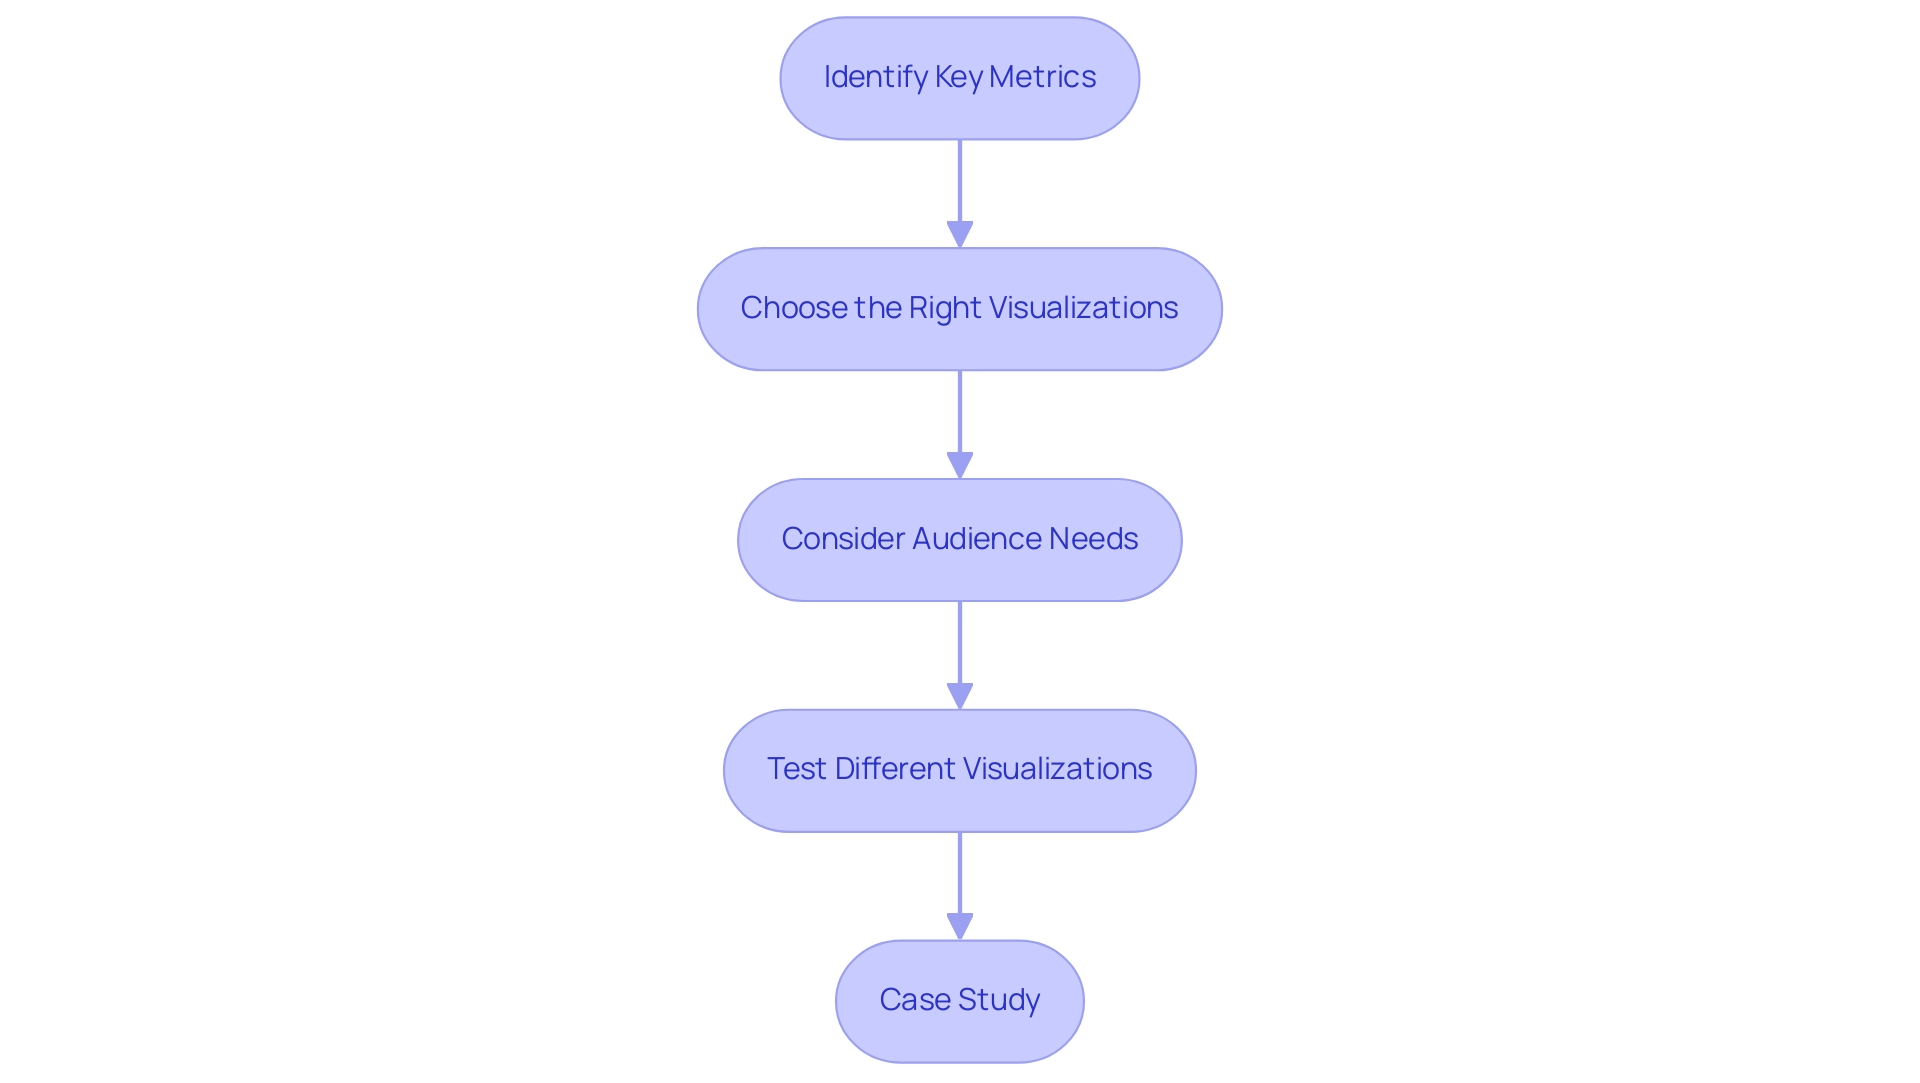
Identify Key Metrics: Start by pinpointing the metrics that are vital for your analysis. Focus on information that directly aligns with your report’s objectives, ensuring relevance and clarity in your presentation. As noted by Dmytro Chashnyk, companies that learn how to build Power BI reports typically see significant improvements, including a 29% increase in revenue and a 34% boost in sales team productivity, highlighting the importance of selecting impactful metrics.
-
Choose the Right Visualizations: Effectively represent your information by selecting the appropriate visualization types. For example, bar charts are ideal for comparisons, while line charts excel at illustrating trends over time. Pie charts effectively showcase parts of a whole, making it easier for stakeholders to grasp complex data at a glance.
-
Consider Audience Needs: Tailor your metric selection and visualizations to the specific needs of your audience. Consider what insights will be most valuable to them, enabling you to create a document that resonates and drives action. By concentrating on audience expectations, you can significantly enhance how to build Power BI reports for effectiveness and engagement.
-
Test Different Visualizations: Leverage Power BI’s flexibility by experimenting with various visualization types. This not only enables you to recognize which formats showcase your data most clearly and engagingly but also empowers you to enhance your documents continuously. Integrating Robotic Process Automation (RPA) can streamline the manual workflows associated with report generation, significantly reducing the time spent on how to build Power BI reports and updating dashboards while also minimizing errors. Real-time dashboards provide immediate insights, enhance operational efficiency, and enable continuous monitoring, offering a significant competitive advantage in today’s fast-paced environment.
-
Case Study: For instance, in the case of CellVerse Inc., understanding how to build Power BI reports for Metrics allowed for centralized monitoring of KPIs across departments, streamlining the tracking process and improving accountability among stakeholders. Furthermore, remember that the usage metrics document only encompasses documents or dashboards that have been accessed in the past 90 days, highlighting the significance of employing current information in your reporting. RPA not only tackles the issues of time-consuming document creation and inconsistencies but also improves the overall precision of your submissions.
Incorporating Visual Elements: Charts, Maps, and More
-
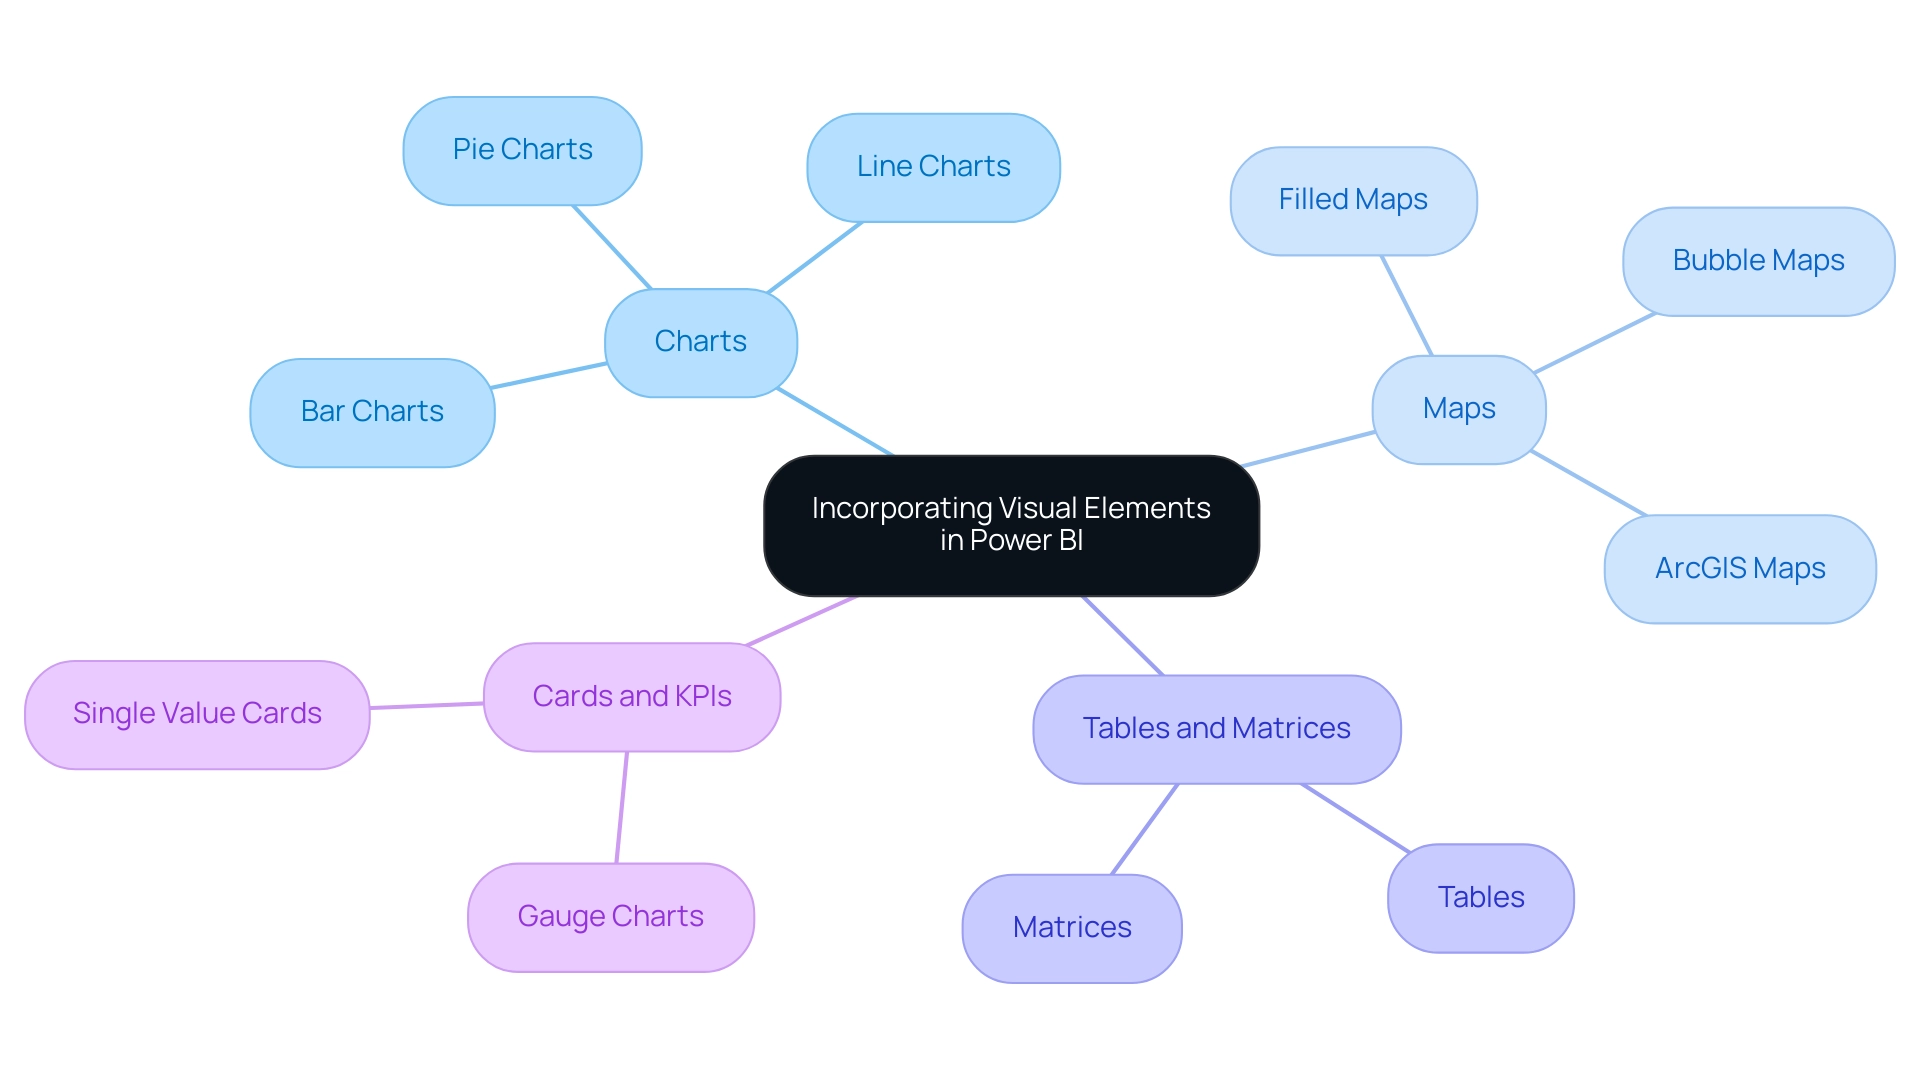
Add Charts: Power BI offers an array of chart types, such as bar, line, and pie charts, each tailored to specific data visualization needs. According to recent statistics, bar charts are the most frequently used visualizations, favored by 40% of document creators. However, are you spending more time creating documents than utilizing insights? To understand how to build Power BI reports efficiently, simply drag and drop the relevant fields into the visualizations pane. This functionality enables creators to choose the most effective tools for their narratives, enhancing the clarity and impact of the information presented. It’s important to note that a lack of governance strategy can lead to inconsistencies across reports. Therefore, visualizing information effectively is crucial to provide stakeholders with clear, actionable guidance. As noted in the industry, “In this article, we will explore in detail how to build Power BI reports, what makes BI the best business intelligence platform, highlight its biggest benefits and standout features, and help you decide whether it is the right choice for your business.”
-
Utilize Maps: For datasets that include geographical information, leveraging maps can significantly enrich your visual storytelling. Power BI accommodates various map types, including filled maps and bubble maps, which can effectively display location-based information. Recent advancements, such as the integration of ArcGIS maps, highlight the importance of this feature for comprehensive information analysis and representation, addressing the challenge of inconsistencies that often arise from a lack of governance.
-
Incorporate Tables and Matrices: When detailed information representation is required, tables and matrices are invaluable tools. They enable the presentation of multiple dimensions of information in a structured manner, allowing users to explore the intricacies of the content more deeply. As creators of documents explore various visual components, the adaptability of tables and matrices can play a vital role in effective presentation, ensuring that contents are not just filled with figures but also offer clear guidance on actionable insights.
-
Use Cards and KPIs: To emphasize key performance indicators (KPIs), consider utilizing cards that showcase single values prominently. Gauge charts, for example, show the current value of a point relative to a predetermined range, resembling a speedometer. This design choice not only draws attention to the most critical metrics but also enhances the overall visual hierarchy of your documents. By effectively highlighting KPIs, you can provide immediate insights into performance targets and results, transforming information into actionable guidance that addresses the confusion stakeholders may feel when reports lack clarity.
Enhancing Interactivity with Slicers and Filters
-
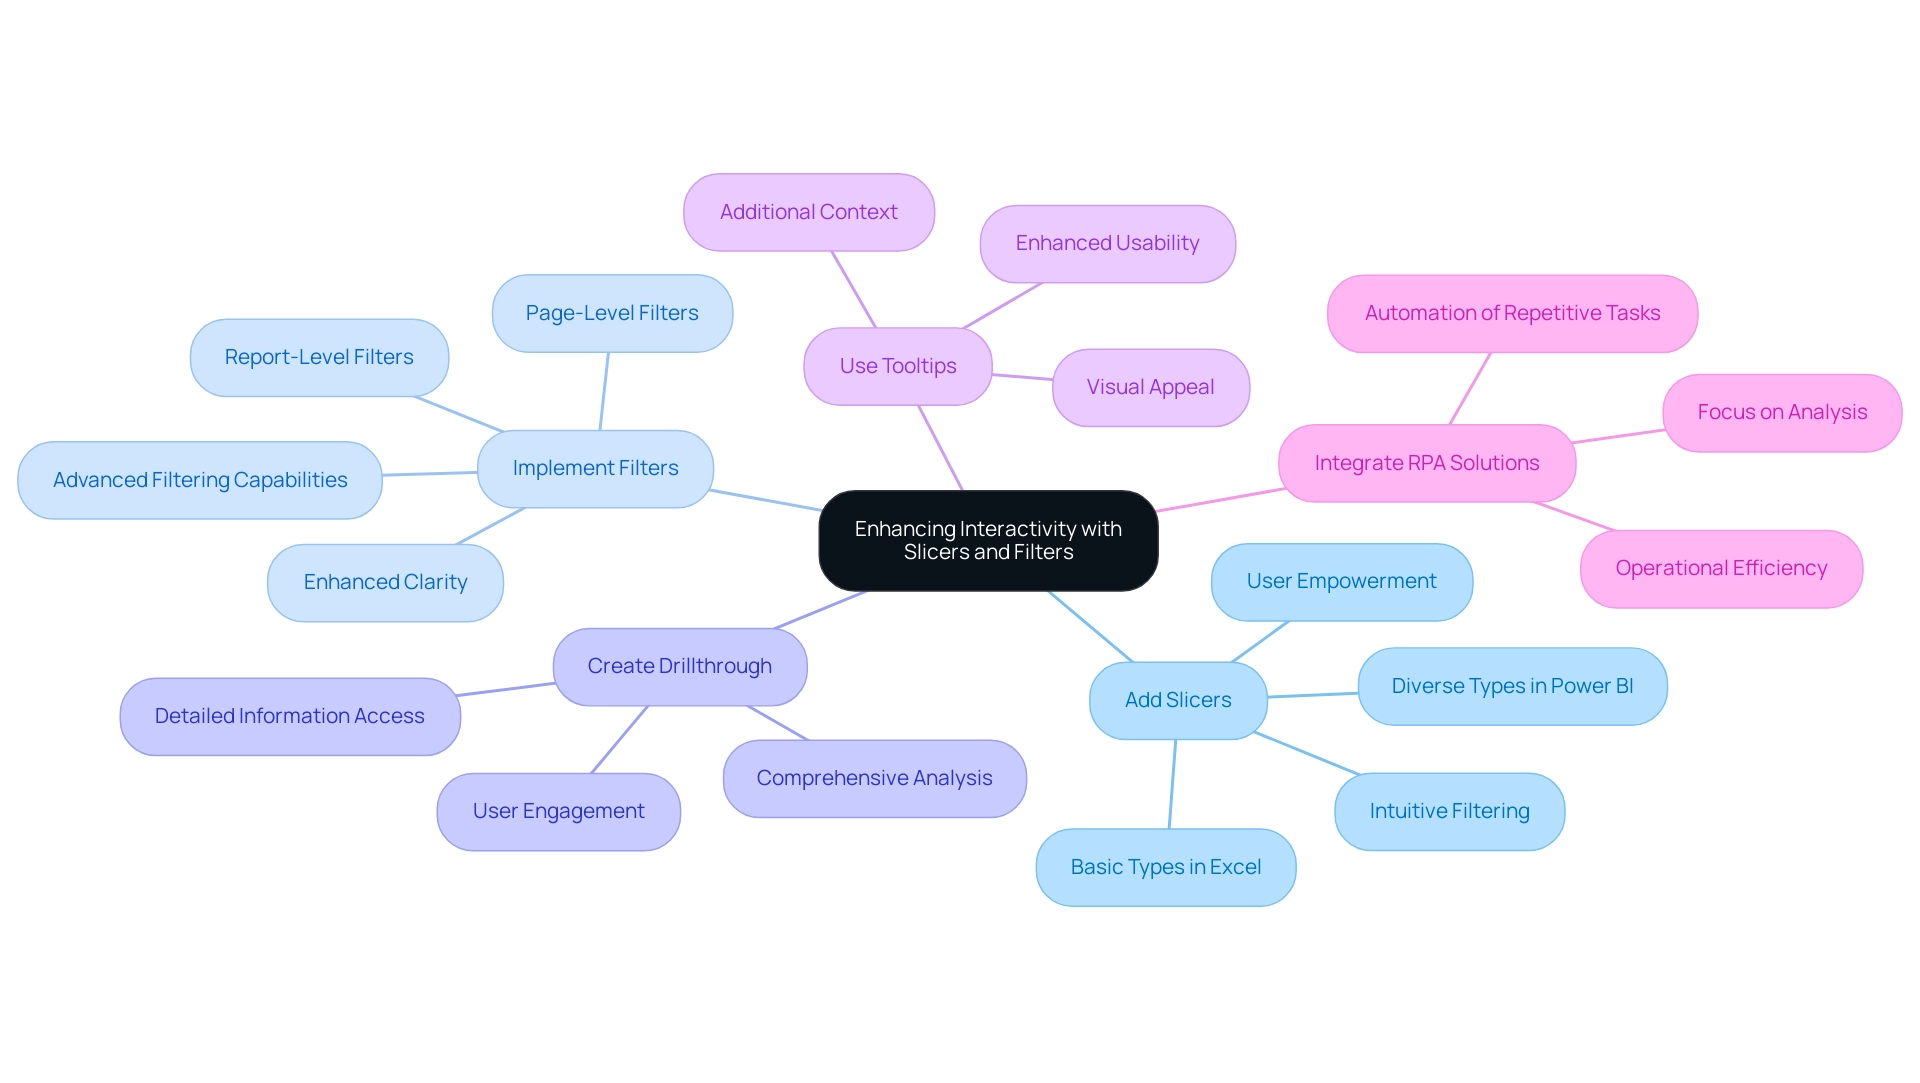
Add Slicers: Slicers serve as a powerful tool for enhancing user interaction with information. By simply dragging a field into the slicer visual, you create an intuitive filter that users can manipulate directly. This strategic integration of slicers empowers users to independently explore information, leading to informed decision-making. Based on industry knowledge, effective slicer implementation can greatly enhance user engagement by enabling simpler information navigation. Significantly, Power BI offers various slicer types that cater to complex structures, whereas Excel provides basic slicer types with limited formatting options. By integrating these features, businesses can leverage actionable insights to drive growth.
-
Implement Filters: Utilize report-level or page-level filters to refine the information displayed in your visualizations. This targeted approach not only sharpens the focus of your document but also enhances clarity, allowing users to concentrate on the most relevant information. As emphasized by Aashi Verma, filters are more suitable when you need precise control over what information is displayed across different levels of your report. This precision is critical in delivering actionable insights. The recent enhancement of advanced filtering capabilities in the filter pane allows for the selection of more than two values, providing users with greater flexibility, addressing the challenges of inconsistencies that can hinder effective BI utilization.
-
Create Drillthrough: Activate drillthrough functionality to enhance information exploration. This feature allows users to click on specific points and access detailed information on a separate page, thereby deepening their understanding of the context. The ability to drill through information enhances user engagement, allowing for a more comprehensive analysis of complex datasets. This capability is essential for overcoming the time-consuming nature of document creation while providing actionable guidance.
-
Use Tooltips: Customizing tooltips can significantly enhance user experience by providing additional context when users hover over data points. This functionality offers deeper insights without cluttering the report, making it easier for users to grasp key information at a glance. Utilizing well-crafted tooltips can enhance the usability and visual appeal of your dashboards, aligning with current best practices in BI. Additionally, implementing best practices for customizing slicers in Excel, such as organized arrangement and consistent design, can further enhance user interaction and visual appeal in BI, ultimately driving operational efficiency and business growth.
-
Integrate RPA Solutions: Consider incorporating Robotic Process Automation (RPA) tools like EMMA RPA and Power Automate alongside Power BI. These solutions can automate repetitive tasks, reduce staffing shortages, and enhance operational efficiency. By optimizing information gathering and document creation processes, RPA can reduce the strain of task repetition fatigue, enabling teams to concentrate on analysis and strategic decision-making.
Finalizing and Sharing Your Power BI Reports
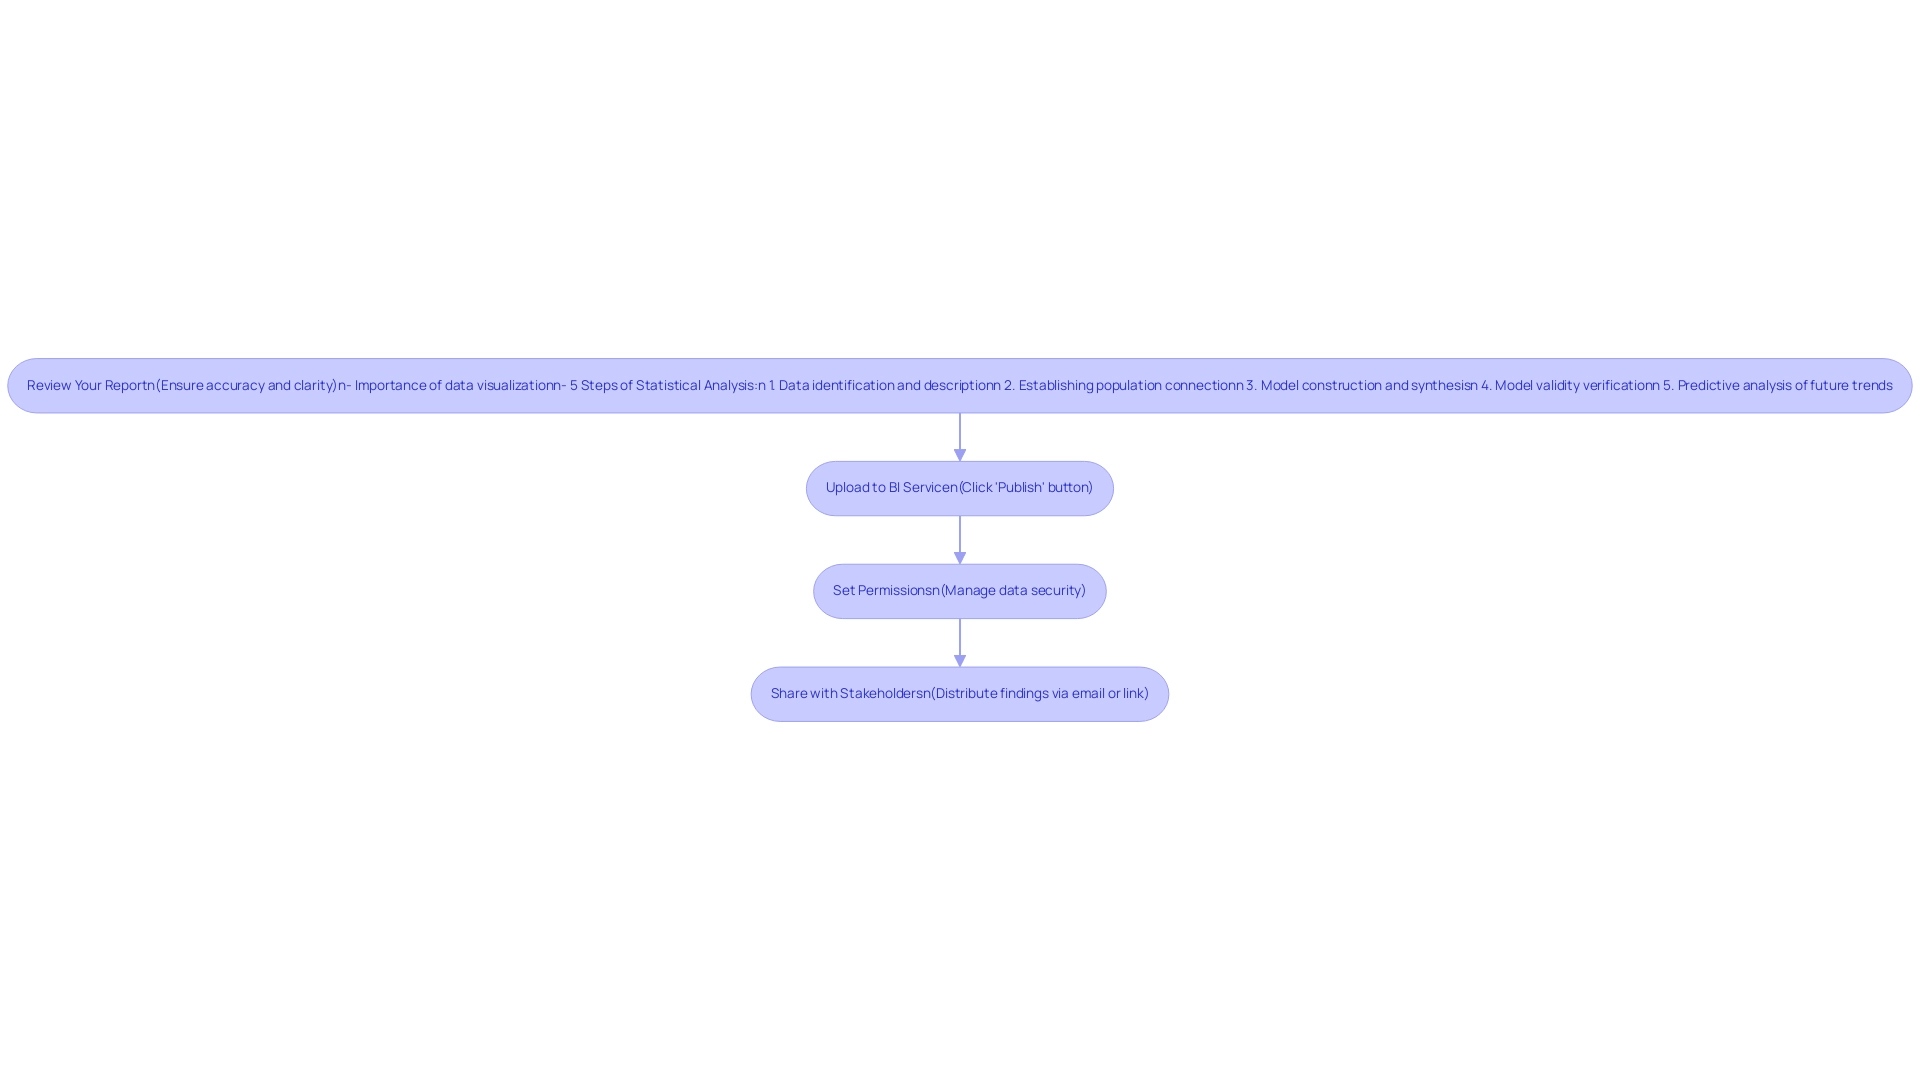
- Review Your Report: Before sharing, conduct a meticulous review of your report to ensure both accuracy and clarity. Verify that all visuals accurately depict the information, as this foundational step significantly impacts the effectiveness of your insights. As Vika Smilansky, Director of Product Marketing, emphasizes,
Data visualization allows you to convey complex information in a way that is easy to understand and interpret, which is crucial for facilitating stakeholder engagement.
Remember, a good analyst spends around 70-90% of their time cleaning information, highlighting the significance of this stage in learning how to build Power BI reports and ensuring accuracy while overcoming challenges related to inconsistent information.
To further enhance the review process, consider the five steps of the statistical analysis process:
1. Data identification and description
2. Establishing population connection
3. Model construction and synthesis
4. Model validity verification
5. Predictive analysis of future trends
Incorporating these steps will help ensure that your understanding of how to build Power BI reports results in a report that is not only accurate but also insightful, enabling informed decision-making that drives growth and innovation.
Referencing the case study titled ‘Statistical Analysis for Organizational Insights,’ we see how statistical analysis offers organizations understanding of customer behavior and operational efficiency. This practical application reinforces the importance of thorough analysis in decision-making and highlights how to build Power BI reports that transform raw data into actionable insights.
-
Upload to BI Service: To make your document accessible online, click the ‘Publish’ button in BI Desktop. This action transfers your document to the BI service, facilitating wider accessibility and collaboration, essential for addressing technology implementation challenges.
-
Set Permissions: After publishing, it is vital to configure permissions meticulously. This enables you to manage who can view or modify the document, thereby upholding data security and ensuring that sensitive information is protected.
-
Share with Stakeholders: Utilize the sharing features available in BI to distribute your findings effectively to relevant stakeholders. You can choose to share via email or generate a link for easier access.
Ensure that stakeholders are familiar with how to build Power BI reports, as well as how to navigate and interact with them, fostering an environment where data-driven decisions can thrive, ultimately enhancing efficiency with RPA solutions. Automating repetitive tasks through tools like EMMA RPA and Power Automate can further streamline workflows, allowing your team to focus on strategic initiatives.
Conclusion
Transforming raw data into actionable insights through Power BI is not just a technical skill; it’s a strategic imperative for any organization aiming for operational excellence. By following the essential steps outlined—from defining the report’s purpose to enhancing interactivity with slicers and filters—users can create impactful reports that resonate with stakeholders and drive informed decision-making.
The importance of selecting the right metrics and visualizations cannot be overstated. Tailoring these elements to meet audience needs ensures that reports are not only informative but also engaging. Incorporating diverse visual elements, such as charts, maps, and KPIs, further enriches the narrative, making complex data accessible and actionable.
Finally, the process of finalizing and sharing reports is critical to fostering a culture of transparency and collaboration. By reviewing reports meticulously and leveraging tools like Power Automate for automation, organizations can enhance efficiency and accuracy in their reporting processes. As businesses increasingly rely on data-driven strategies, mastering Power BI becomes an essential component in achieving strategic objectives and maintaining a competitive edge in today’s fast-paced environment. Embracing these practices will empower teams to harness the full potential of their data, paving the way for sustained growth and innovation.
Introduction
In the rapidly evolving business landscape, organizations are increasingly turning to Robotic Process Automation (RPA) as a strategic solution to enhance operational efficiency and drive growth. This cutting-edge technology allows companies to automate repetitive tasks, freeing up valuable human resources to focus on innovation and strategic initiatives.
As industries from healthcare to finance embrace RPA, they are witnessing remarkable improvements in accuracy, productivity, and cost reduction. However, the journey to successful implementation is not without its challenges. From overcoming resistance to change among employees to navigating integration complexities, understanding the intricacies of RPA adoption is essential.
This article delves into the transformative potential of RPA, exploring its applications, benefits, and the future trends that promise to reshape the automation landscape, empowering organizations to thrive in an increasingly competitive environment.
Understanding Robotic Process Automation (RPA): Definition and Importance
Robotic Process Automation (RPA) is a transformative technology that employs software robots, or ‘bots’, to automate repetitive and rule-based tasks, illustrating what RPA is used for in minimizing the need for human intervention. By imitating human interactions with digital systems, RPA streamlines workflows and improves operational performance. The significance of RPA is highlighted when considering what is RPA used for, as it has the capacity to boost productivity, lower operational costs, and reduce the likelihood of human error.
A recent survey revealed that:
- 53% of entities have initiated RPA implementation.
- 78% anticipate increased investment in the next three years.
- Robots could account for up to 52% of work capacity among RPA adopters, demonstrating the considerable potential for operational effectiveness.
This shift allows businesses to redirect their focus toward strategic initiatives, fostering innovation and growth.
However, the Deloitte Global RPA Survey indicates that:
- 64% of respondents experienced longer-than-expected implementation times, highlighting the challenges entities face during RPA adoption.
- 65% of respondents in a Robocorp survey expressed that they would benefit from usage-based pricing, shedding light on financial considerations in RPA adoption.
Therefore, understanding what RPA is used for and its foundational principles is crucial for fully leveraging its potential in optimizing operational processes.
As RPA continues to develop, organizations that adopt this technology not only boost productivity but also improve employee contentment, with 89% of workers stating increased job satisfaction due to technological progress. By tailoring AI solutions and leveraging business intelligence, you can overcome implementation challenges and make informed decisions that drive growth.
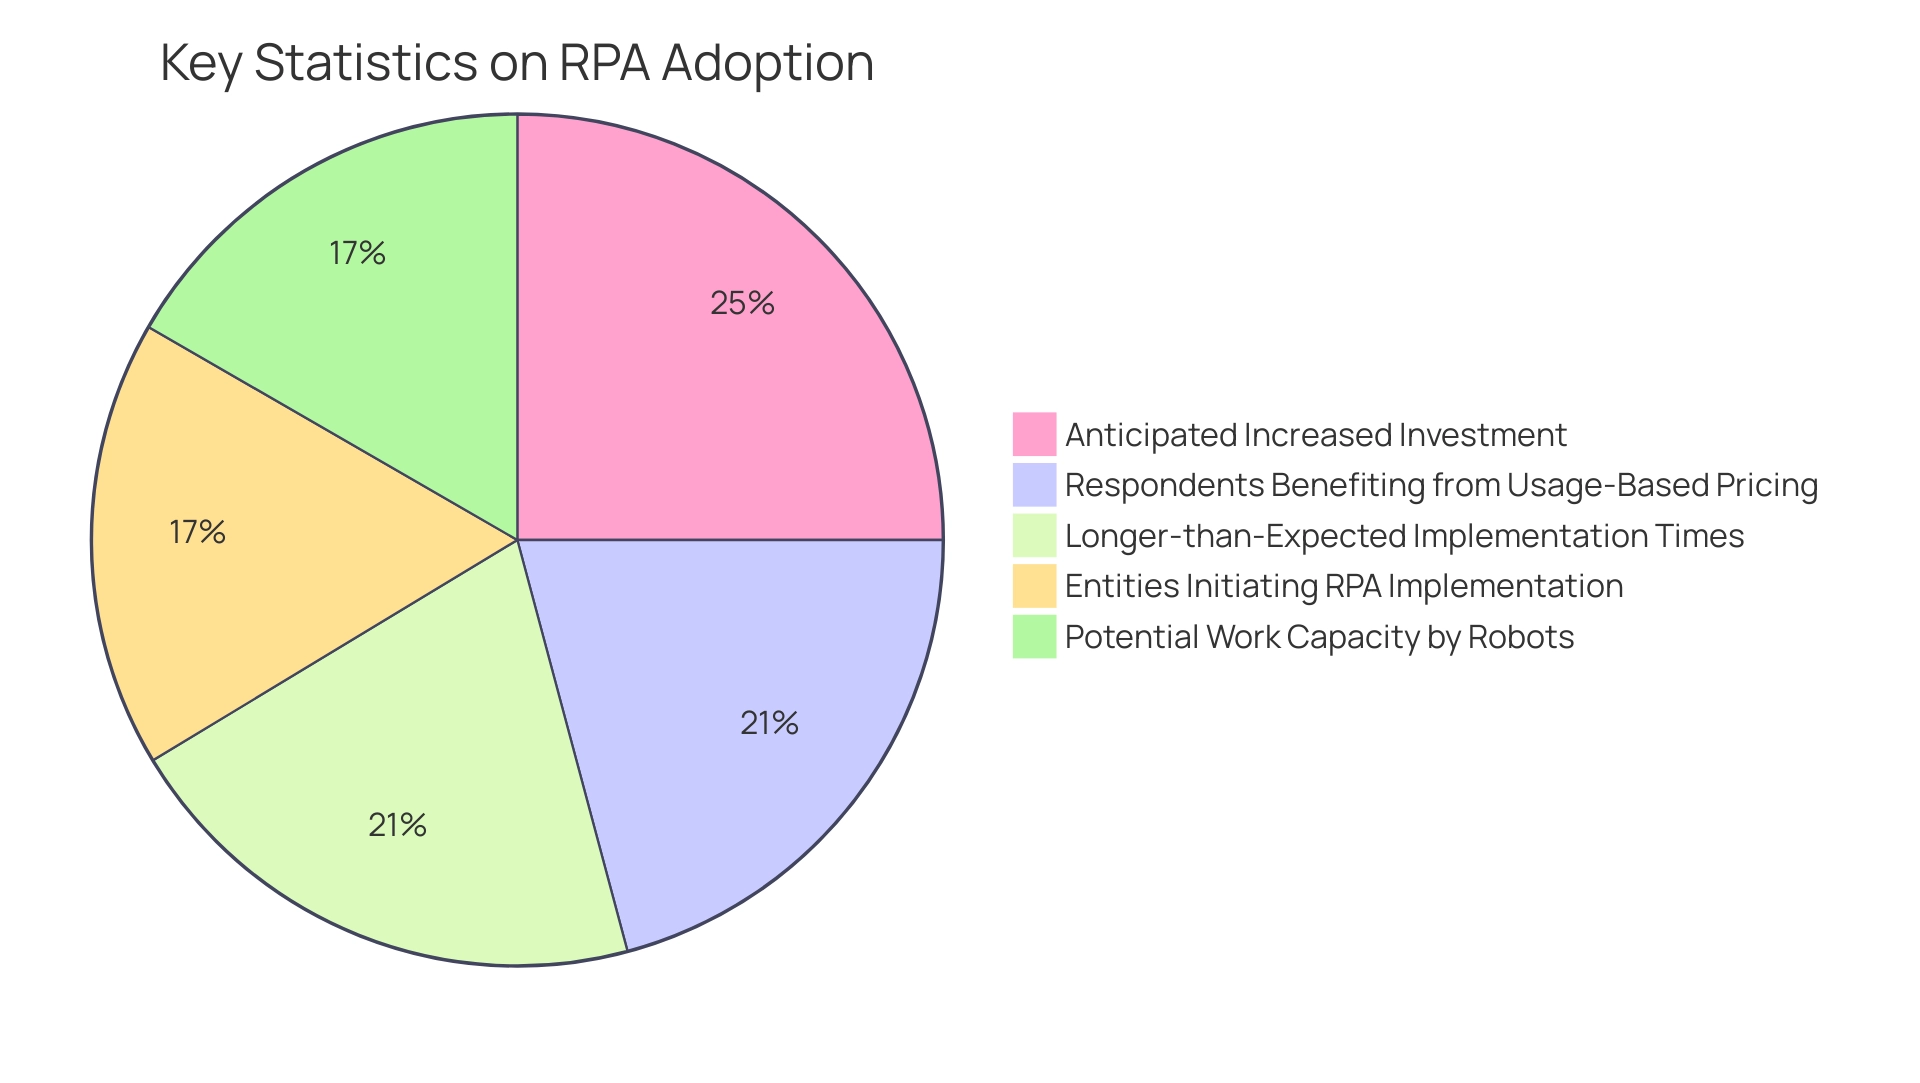
Applications of RPA: Transforming Industries from Healthcare to Finance
Robotic Process Automation (RPA) is swiftly transforming numerous sectors, especially in healthcare, by addressing issues like manual data entry mistakes and staffing shortages, which highlights what RPA is used for in driving significant enhancements in operational performance. For instance, a notable case study demonstrates how a mid-sized healthcare company enhanced its operations by implementing graphical user interface technology. This approach streamlined processes such as patient data entry, appointment scheduling, and claims processing, allowing healthcare professionals to focus more on patient care rather than administrative tasks.
As a result, the company reported a 70% reduction in data entry errors and an 80% improvement in workflow performance, achieving a return on investment within just six months.
In addition to these outcomes, hospitals that have harnessed RPA technologies have experienced significant decreases in patient wait times and enhanced service delivery. RPA tools like EMMA RPA and Microsoft Power Automate play a crucial role in this transformation by automating repetitive tasks, ensuring accuracy, and facilitating seamless integration of data across systems. This not only streamlines operations but also empowers healthcare staff to dedicate more time to patient care.
Beyond healthcare, RPA plays a critical role in the finance sector by automating tasks like invoice processing, compliance checks, and data reconciliation, resulting in faster transaction times and improved accuracy.
Banks that have adopted RPA for customer onboarding have noted heightened customer satisfaction due to streamlined processes. Additionally, RPA is reshaping customer service by automating responses to frequently asked questions, freeing human agents to address more complex issues. These applications demonstrate what RPA is used for in improving operational performance while also lowering expenses, enabling entities to meet changing market demands.
As we enter 2024, the potential for RPA expansion remains significant, fueled by innovations that not only respond to consumer needs but also confront the challenges of handling unstructured data through automation. The Robocorp 2022 RPA survey further indicates that 65% of respondents would benefit from usage-based pricing, reflecting market trends and user preferences that could shape the future landscape of RPA solutions.
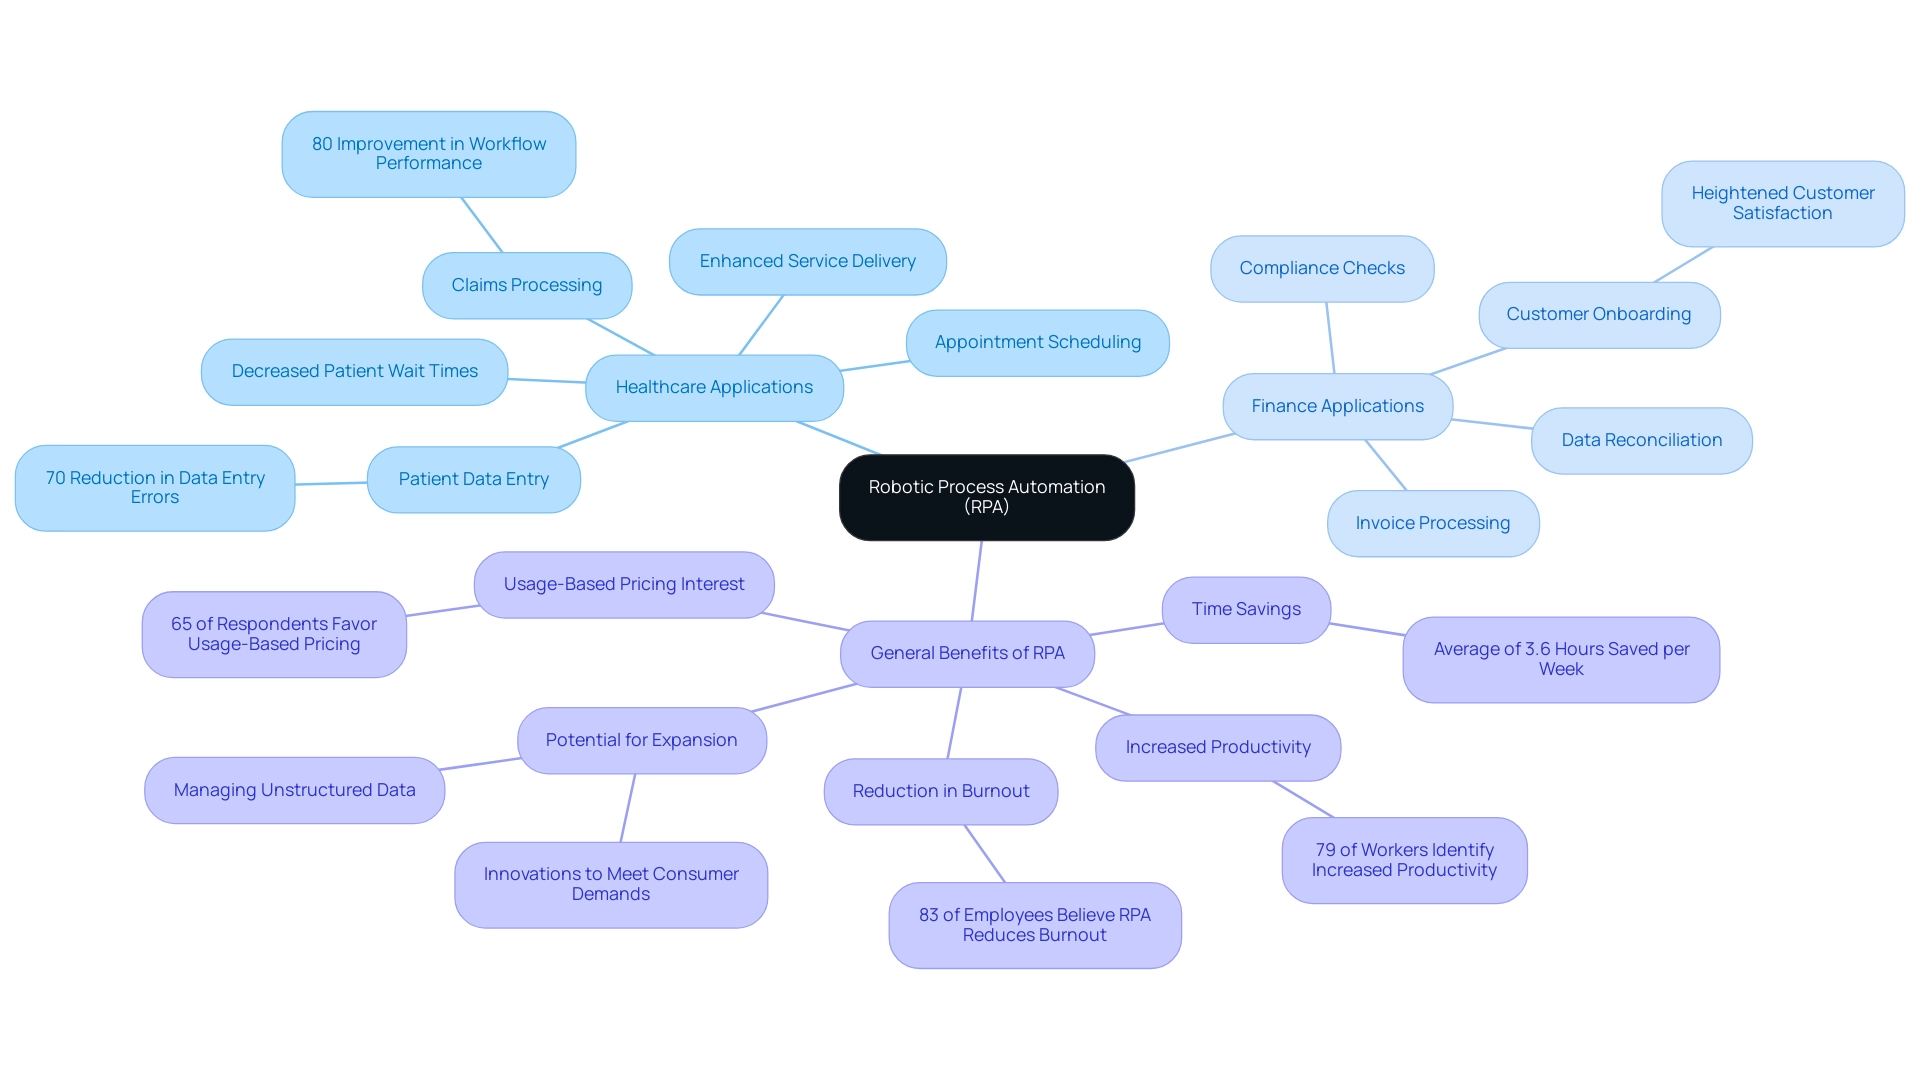
Benefits of Implementing RPA: Efficiency, Accuracy, and Cost Reduction
Adopting Robotic Process Automation (RPA) offers companies a multitude of benefits, particularly in terms of what is RPA used for, such as improving operational effectiveness, boosting accuracy, and achieving substantial cost savings. By automating repetitive tasks, businesses can leverage what is RPA used for to process transactions and manage inquiries at speeds that far surpass human capabilities. This acceleration not only boosts productivity but also enables employees to concentrate on higher-value tasks that require critical thinking and creativity.
Industries like telecom benefit immensely from RPA, especially when considering what is RPA used for, as operators can automate customer service processes and minimize manual data entry, leading to streamlined operations and improved customer experiences. Moreover, RPA dramatically lowers the risk of human error, ensuring processes are executed with consistency and precision. For instance, a financial institution that implemented RPA for reconciliation processes reported a staggering 90% reduction in errors, enhancing compliance and reporting accuracy.
Despite these clear advantages, entities face challenges in scaling RPA; currently, only 3% have successfully expanded their digital workforce. However, the financial incentives of RPA are compelling; a recent case study revealed that 61% of participants either met or exceeded their cost reduction goals, with many achieving a return on investment within just months of deployment. As Yana Pokora, Content Manager at Flobotics, insightfully remarks, ‘We hope this list of RPA stats has convinced you that automation is the next step you should take to enhance the overall productivity of your business.’
To further explore how RPA, tailored AI solutions, and Business Intelligence can transform your operations, read our latest publication. With RPA, the potential for efficiency gains is not merely a promise; it is a tangible reality that showcases what RPA is used for in propelling the success of entities.
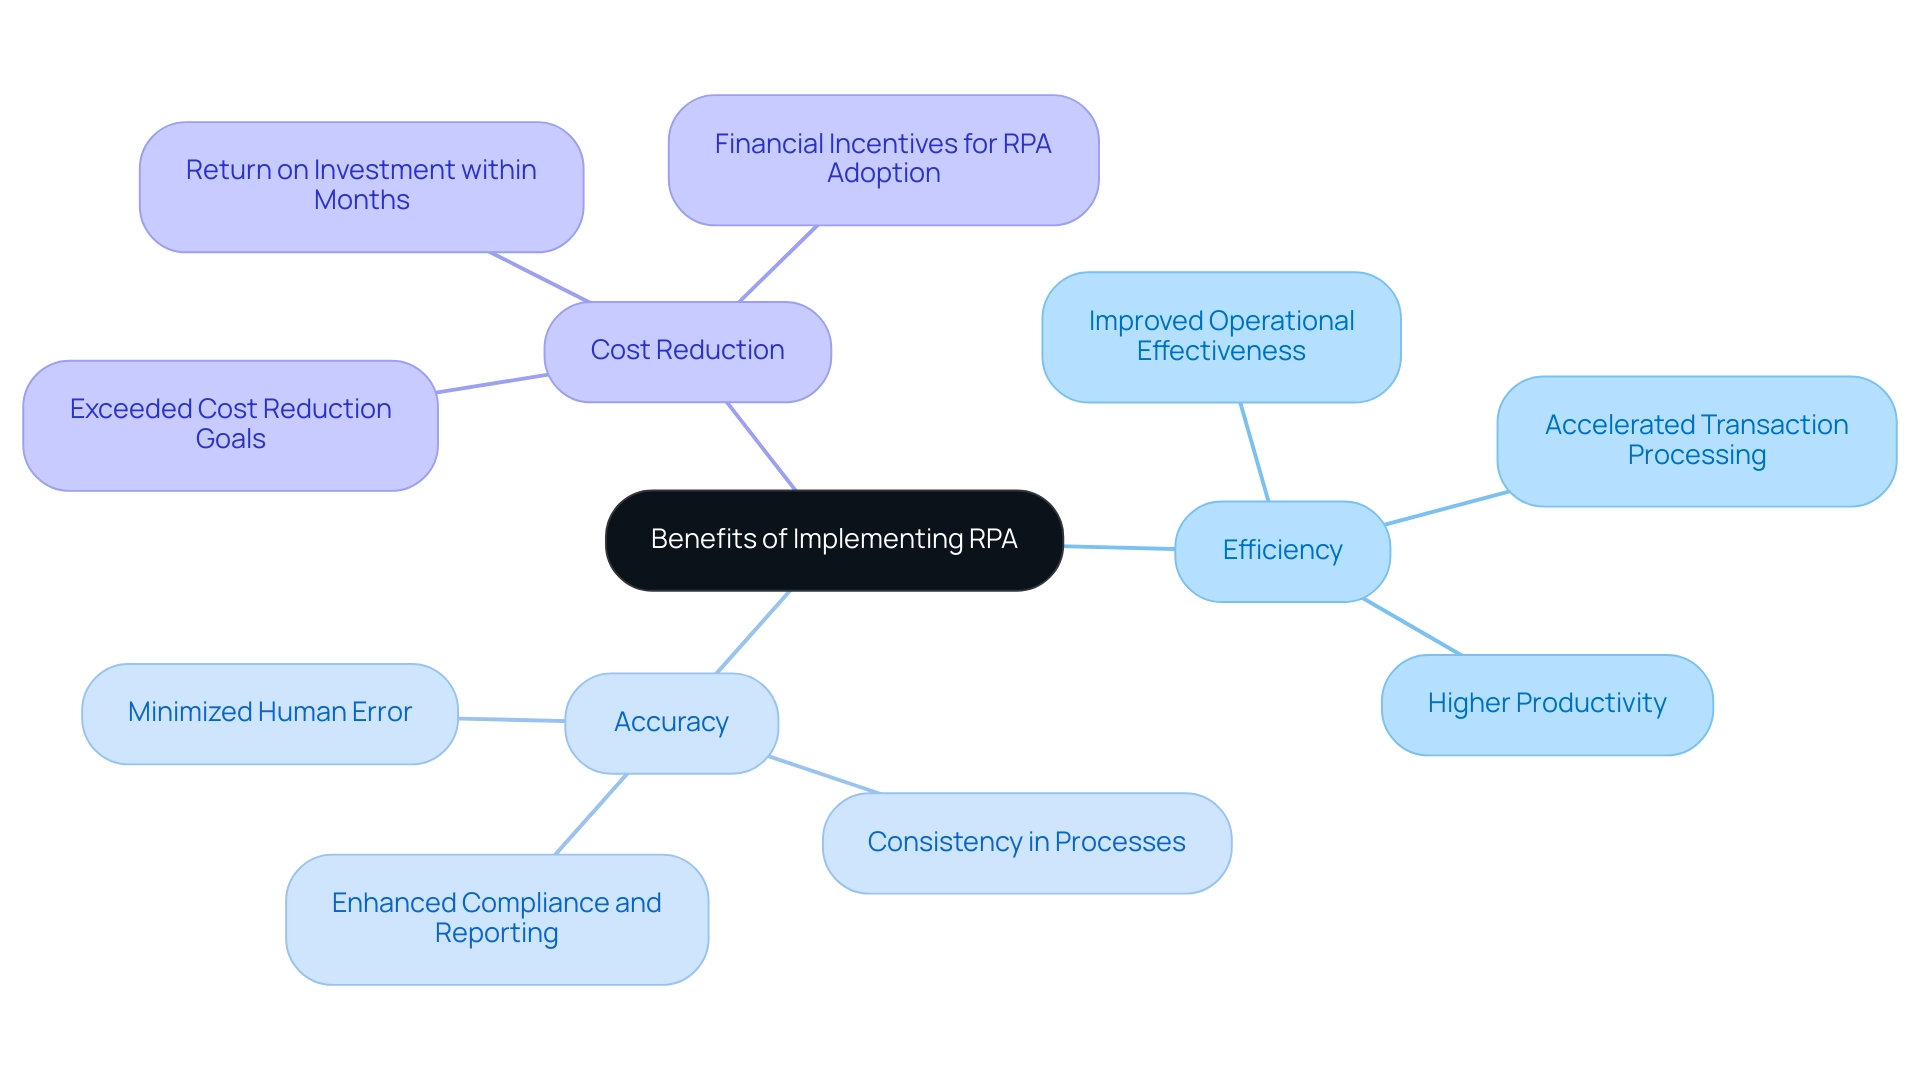
Challenges in RPA Adoption: Overcoming Resistance and Integration Issues
While the advantages of Robotic Process Automation (RPA) are substantial, companies frequently face hurdles during adoption. One of the most pressing issues is resistance to change, as employees may fear job displacement or express skepticism toward new technologies. To combat these fears, it is vital for organizations to communicate the transformative benefits of RPA clearly, emphasizing that it enhances human capabilities rather than replacing them.
Tajammul Pangarkar, CMO at Prudour Pvt Ltd, emphasizes the importance of maintaining balance in the era of technology, stating, ‘When he’s not ruminating about various happenings in the tech world, he can usually be found indulging in his next favorite interest – table tennis.’ Furthermore, RPA is utilized for what is RPA used for by directly addressing repetitive tasks that can drain employee morale and productivity, while also alleviating staffing shortages by automating routine operations. Integration challenges can arise when introducing RPA into existing systems.
A comprehensive assessment of current processes ensures that RPA solutions align with your IT infrastructure. Engaging with experienced consultants can provide insights and strategies for smoother integration. Our GenAI workshops offer hands-on training, empowering your team to utilize AI tools effectively, including seamless integration strategies and ethical practices.
Participants can expect to gain practical skills that enhance their productivity and improve workflow efficiency. A case study titled ‘The Future of Automation’ reveals that RPA platforms are increasingly integrating AI advancements, significantly boosting productivity. Tackling these challenges in advance paves the way for successful RPA implementation, which answers the question of what is RPA used for, enabling employees to embrace technology as a productivity enhancement tool.
Recent studies indicate that users of automated systems save an average of 3.6 hours per week, improving job satisfaction and reducing burnout, with 83% believing it enhances their work experience. Looking ahead, the future of RPA promises smarter, adaptive bots through AI and machine learning integration, further transforming the landscape of automated processes.
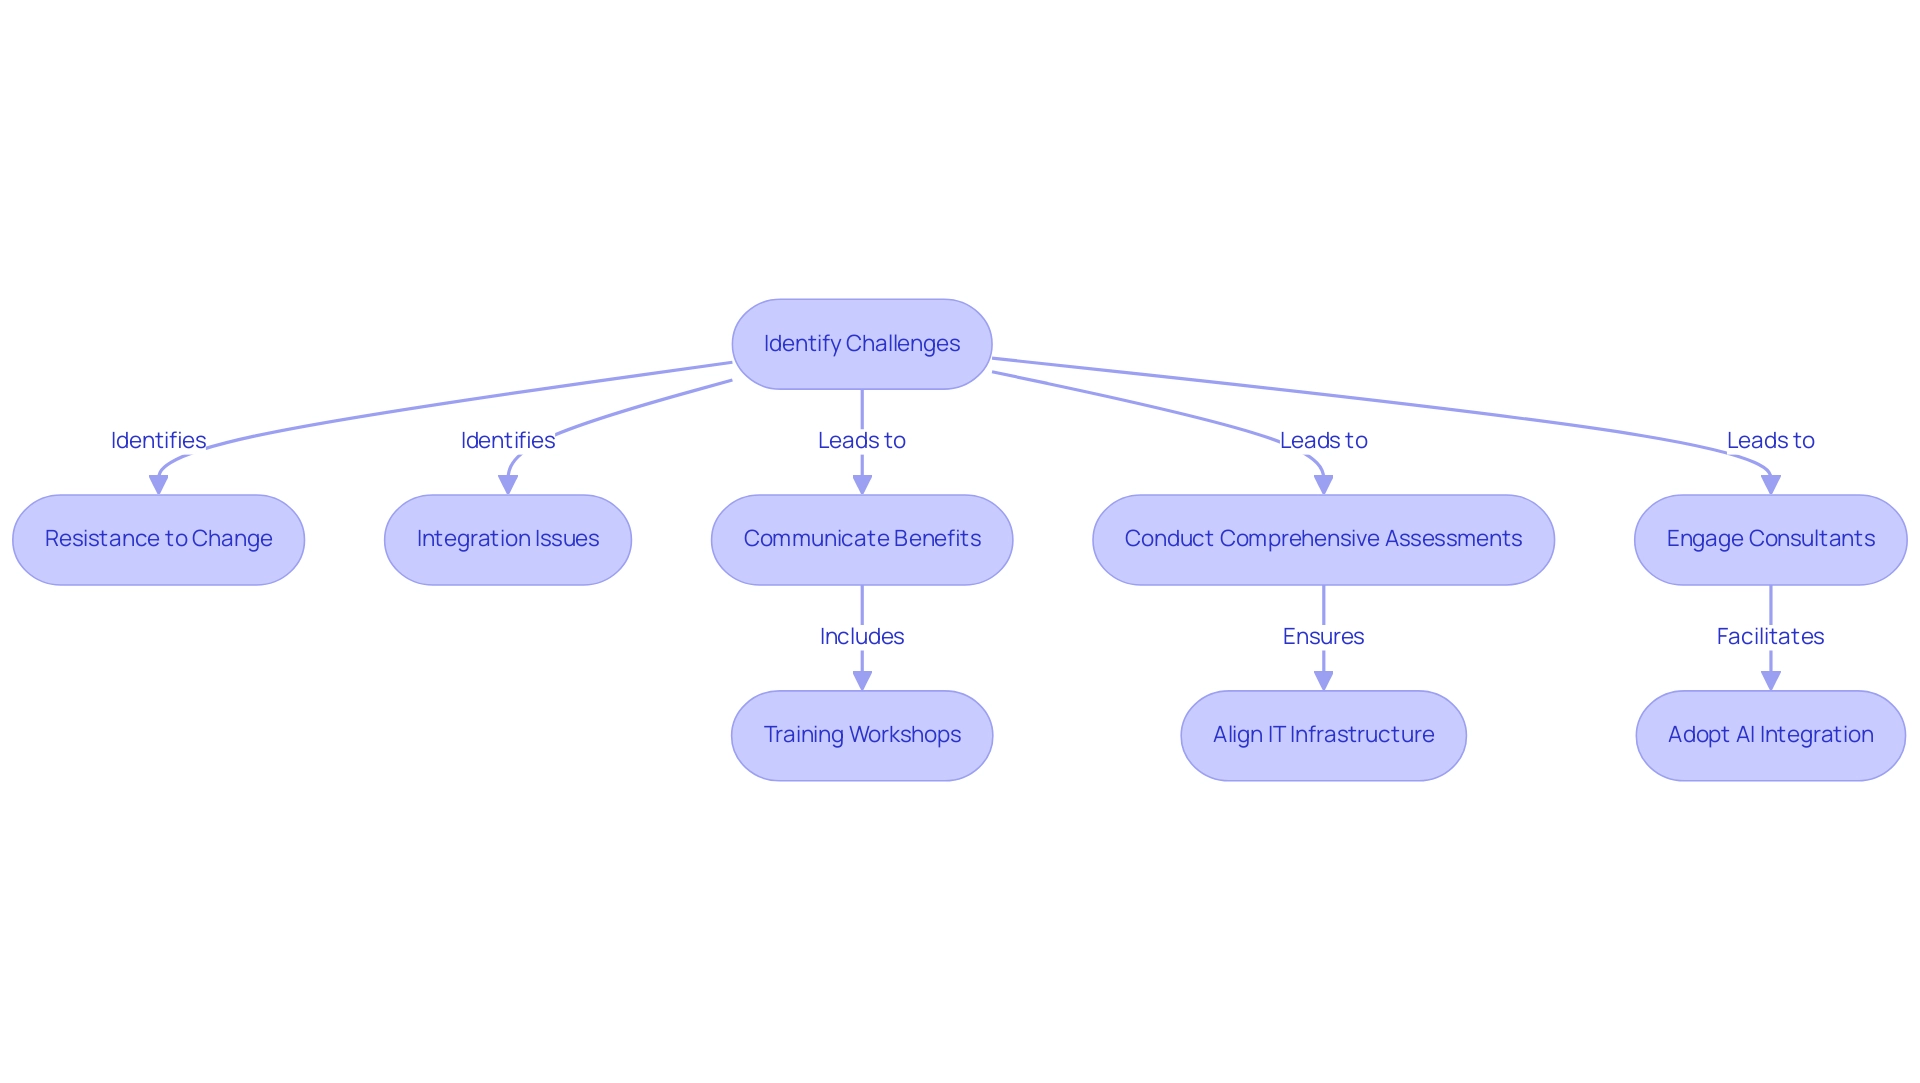
Future Trends in RPA: The Evolution of Automation Technology
The landscape of Robotic Process Automation (RPA) is undergoing a transformative shift, propelled by groundbreaking advancements in artificial intelligence and machine learning. Future trends predict a shift towards intelligent processes, where RPA systems will not merely execute predefined tasks but will also learn from data patterns and enhance their performance over time. This evolution empowers organizations to automate increasingly complex processes, significantly improving decision-making capabilities and reducing operational costs.
Furthermore, the integration of RPA with complementary technologies—such as natural language processing and advanced analytics—will yield more sophisticated solutions. Significantly, a recent study emphasized that:
- 83% of employees utilizing AI-driven processes believe it decreases burnout and promotes job satisfaction, backing the idea that such technology improves workplace dynamics.
- 91% of employees believe that automation saves time and improves work-life balance, with many feeling more satisfied with their jobs due to automation.
According to a report on RPA in clinical trials, what is RPA used for includes managing up to 90% of data entry tasks, which showcases its capabilities in real-world applications. As businesses navigate the ongoing digital transformation, leveraging RPA alongside tailored AI solutions and Business Intelligence is essential for harnessing its full potential and maintaining a competitive edge in the marketplace. Thought leaders in the field emphasize that the combination of RPA with cognitive technologies will unlock unprecedented productivity, underscoring the importance of adapting to these advancements.
Additionally, as organizations face challenges in identifying the right AI solutions, RPA can serve as a guiding framework to streamline workflows and reduce errors, further enhancing operational efficiency.
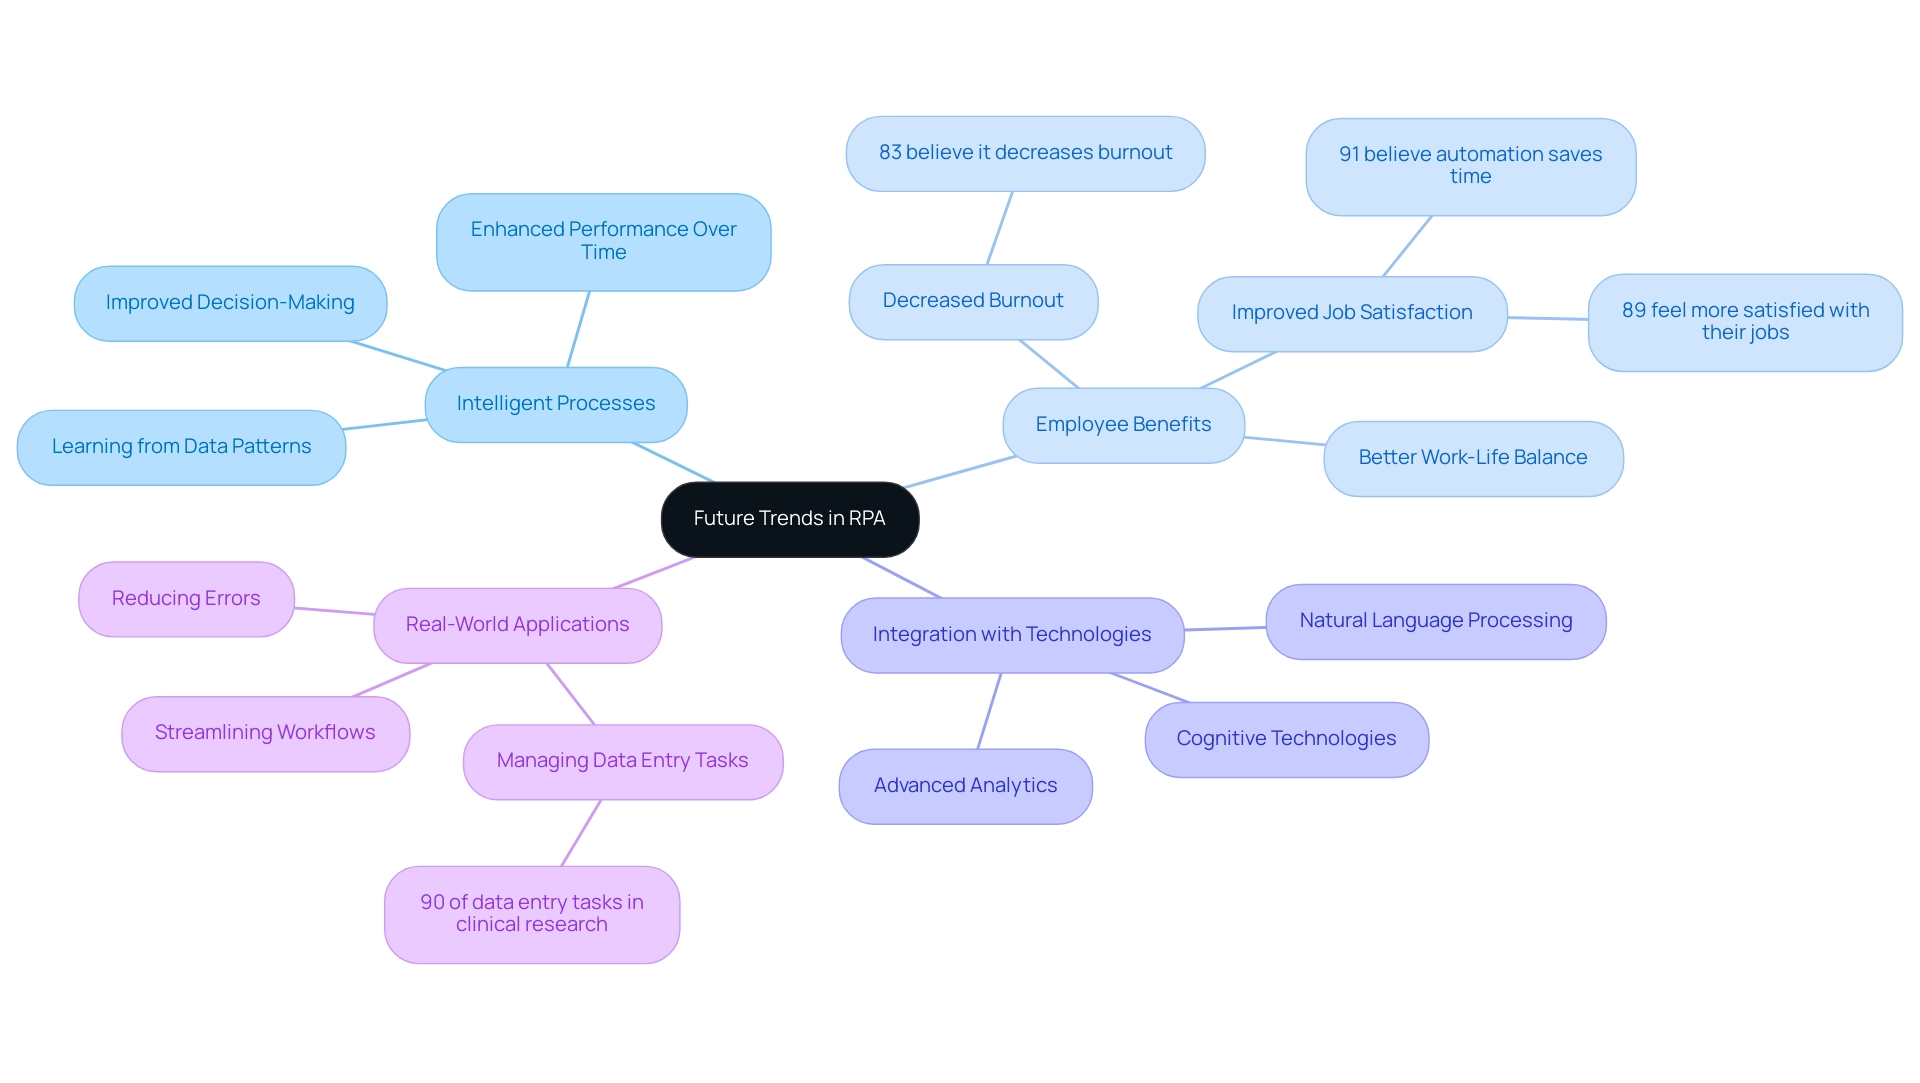
Conclusion
The integration of Robotic Process Automation (RPA) into various industries marks a significant shift towards operational excellence. By automating repetitive and rule-based tasks, organizations not only enhance efficiency but also unlock the potential for higher productivity and reduced costs. Success stories from sectors such as healthcare and finance illustrate how RPA can lead to remarkable improvements, including reduced error rates and faster transaction processing. As companies increasingly invest in RPA technology, the opportunities for growth and innovation continue to expand.
However, the journey toward successful RPA adoption is not without its challenges. Resistance to change among employees and integration complexities can hinder progress. It is essential for organizations to communicate the benefits of RPA clearly and to implement strategies that facilitate a smooth integration into existing systems. By addressing these challenges head-on, businesses can empower their workforce and foster a culture that embraces automation as a tool for enhancement rather than a threat.
Looking ahead, the future of RPA is promising, with advancements in artificial intelligence and machine learning set to drive intelligent automation. This evolution will enable organizations to automate more complex processes, improve decision-making, and further enhance operational efficiency. As RPA continues to evolve, it becomes increasingly clear that embracing this technology is not just a strategic advantage; it is a necessary step for organizations aiming to thrive in a competitive landscape. By harnessing the power of RPA, organizations can position themselves for sustained success and innovation.
Introduction
In the dynamic landscape of modern business, the ability to harness data effectively is no longer optional—it’s essential. Organizations are increasingly turning to various types of analytics to unlock insights that drive operational efficiency and informed decision-making. From understanding what has happened in the past to predicting future trends and prescribing actionable strategies, each analytics type plays a pivotal role in shaping business outcomes.
As companies navigate the complexities of data, integrating technologies like Robotic Process Automation (RPA) can streamline processes and enhance accuracy, empowering teams to focus on strategic initiatives.
This article delves into the four main types of analytics:
- Descriptive
- Diagnostic
- Predictive
- Prescriptive
Illustrating how they can be leveraged to overcome challenges, optimize performance, and ultimately secure a competitive edge in an ever-evolving marketplace.
An Overview of the Four Main Types of Analytics
Analytics types are crucial instruments for businesses seeking to leverage the potential of information, broadly classified into four primary categories: descriptive, diagnostic, predictive, and prescriptive. Each type plays a critical role in the analysis process, driving operational efficiency and informed decision-making.
-
Descriptive Analytics: This type focuses on summarizing historical information, offering insights into what has occurred within the organization.
It lays the groundwork for understanding trends and patterns. -
Diagnostic Analysis: By examining the reasons behind past events, diagnostic analysis identifies correlations and patterns that can inform future strategies. This deeper understanding is vital for addressing underlying issues.
-
Predictive Analytics: Utilizing statistical models and machine learning techniques, predictive analytics forecasts future outcomes based on historical information. This forward-thinking approach is becoming more significant, with research showing that data-driven strategies will surpass intuition in 65% of B2B sales firms by 2026.
-
Prescriptive Analytics: This type goes a step further by offering actionable recommendations based on information analysis. It enables entities to make optimal decisions, ultimately improving their strategies and operational performance.
Integrating these analytics types into business practices is vital, as approximately 25% of business leaders indicate that their Big Data initiatives produce profitable outcomes. Moreover, leading marketers are 1.6 times more likely to believe that open information access leads to higher performance, underscoring the importance of access in analytics.
To enhance operational efficiency in this rapidly evolving AI landscape, leveraging Robotic Process Automation (RPA) can significantly aid in automating manual workflows, thus reducing errors and freeing up your team’s resources for more strategic tasks. RPA can effortlessly merge with various forms of analysis, enabling entities to not only optimize processes but also improve information precision and availability.
However, entities frequently encounter obstacles such as inadequate master information quality and hurdles to AI implementation, which must be tackled to completely achieve the advantages of insight-driven knowledge. A pertinent case study emphasizes that overcoming these barriers is essential for maximizing the advantages of data analysis. As IDC forecasts, by 2025, consumers will possess an estimated 36% of information, highlighting the necessity for businesses to adjust their evaluation approaches to remain competitive, while also maneuvering through the complex AI environment with customized solutions.
To effectively implement RPA solutions, organizations should start by assessing their current workflows and identifying areas where automation can yield the greatest impact.
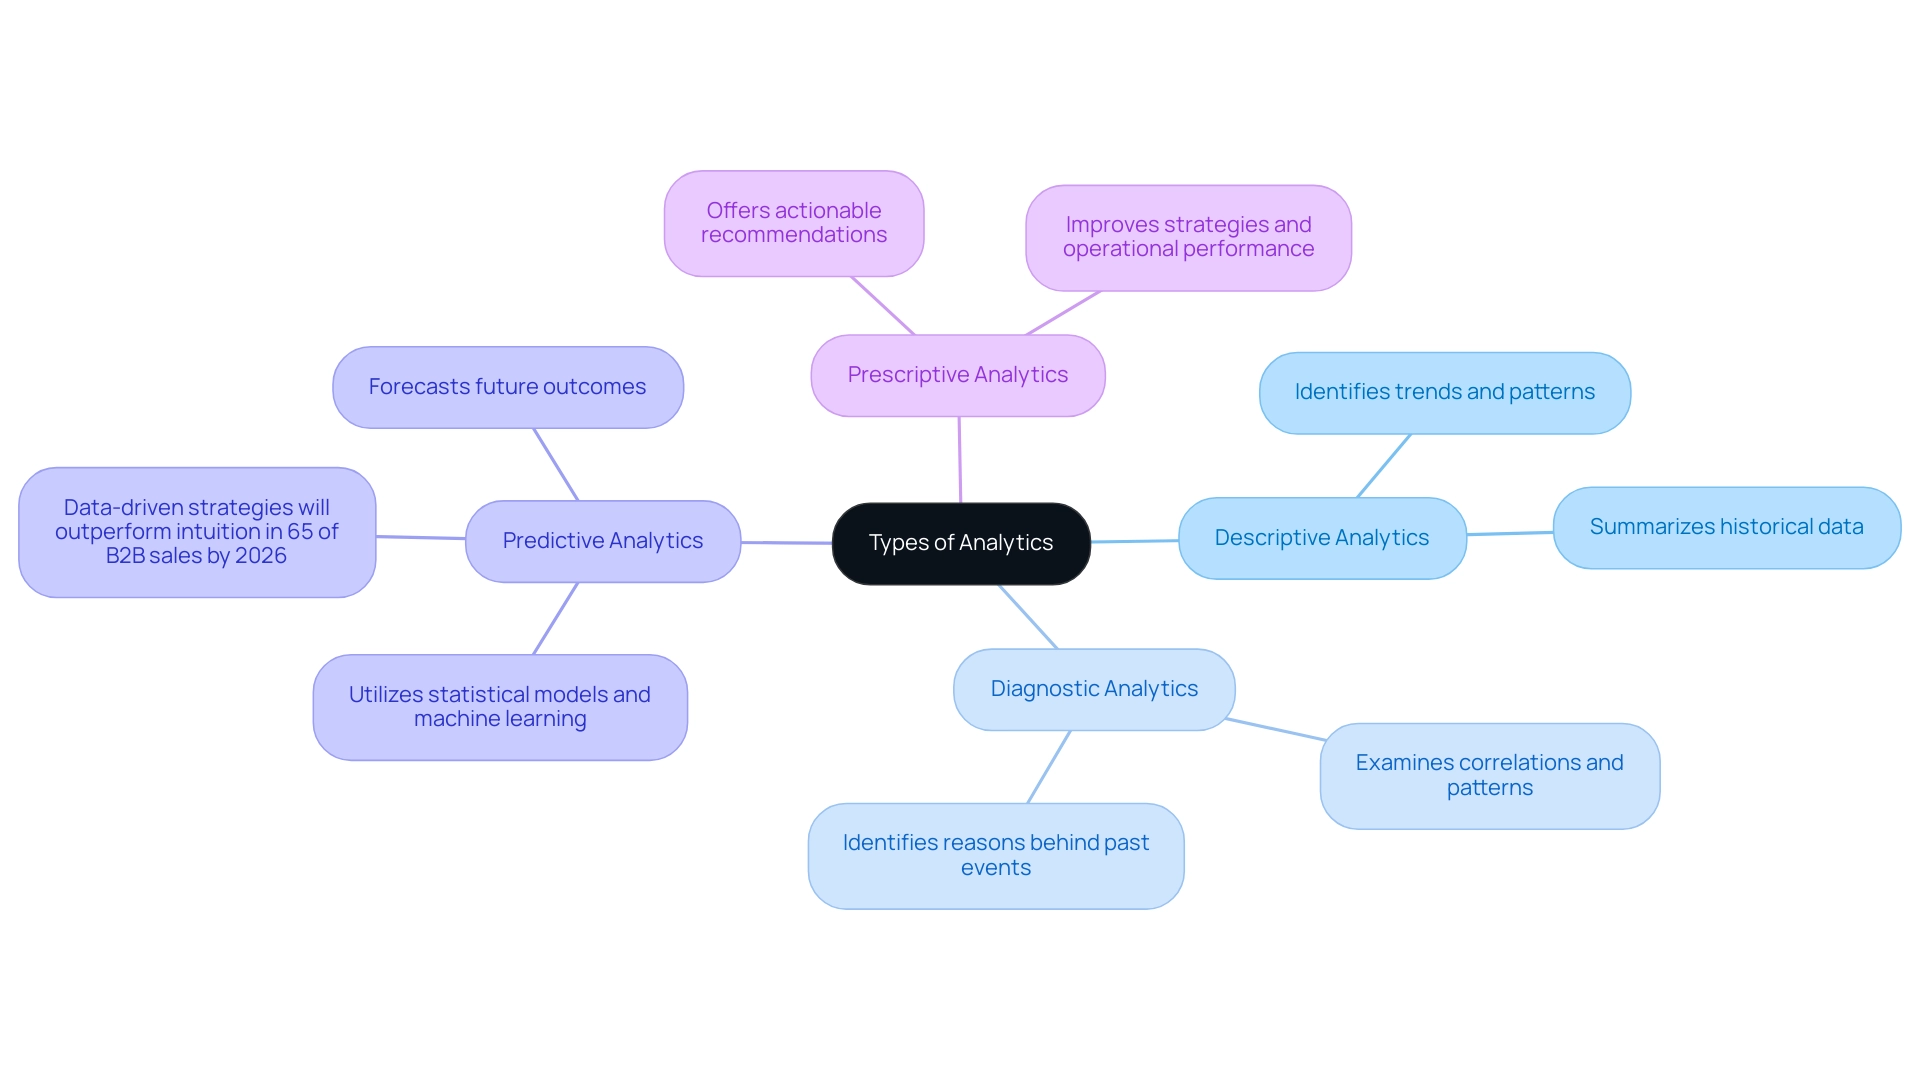
Understanding Descriptive Analytics: What Happened?
Descriptive analytics types play a crucial role in the analysis of historical information, enabling entities to uncover insights about past events and trends. It fundamentally addresses the question: What happened? By systematically collecting and summarizing information, companies can gain valuable insights into their performance metrics, customer behaviors, and operational processes, ultimately empowering the Director of Operations Efficiency.
However, navigating the overwhelming choices in the AI landscape can complicate this process. Tailored AI solutions can assist entities in cutting through the noise, providing targeted technologies that align with specific business goals and challenges. For instance, consider a retail company examining sales information from the previous year.
This analysis can reveal which products experienced peak popularity during specific seasons, guiding future inventory decisions and marketing strategies. Notably, by 2024, historical information analysis is expected to significantly influence retail operations, with many organizations leveraging these insights to enhance sales performance. Moreover, by 2026, it is anticipated that 35% of retailers will implement real-time evaluation tools to monitor stock levels and prevent supply chain interruptions, highlighting the increasing significance of analysis in retail and the incorporation of customized AI solutions.
Additionally, Robotic Process Automation (RPA) can serve a crucial function in improving operational efficiency by automating information gathering and examination processes, enabling companies to concentrate on strategic decision-making. Tools like dashboards and reports are crucial analytics types in this process, as they showcase information in an accessible format, empowering stakeholders to make informed decisions based on historical performance. Major players in the retail analytics market, including Microsoft Corporation, IBM Corporation, Amazon.com Inc., and Adobe Inc., are continuously developing innovative solutions to facilitate different analytics types, ensuring businesses can effectively harness historical information for strategic advantages.
As one analyst aptly stated,
When presentation technology fails, keep your audience engaged with storytelling, alternative visuals, and interactive discussion. Maintain momentum and poise.
This approach emphasizes the significance of effectively conveying insights to drive decision-making and operational efficiency, reinforcing the necessity of harnessing Business Intelligence and RPA to achieve insight-driven conclusions and operational excellence.
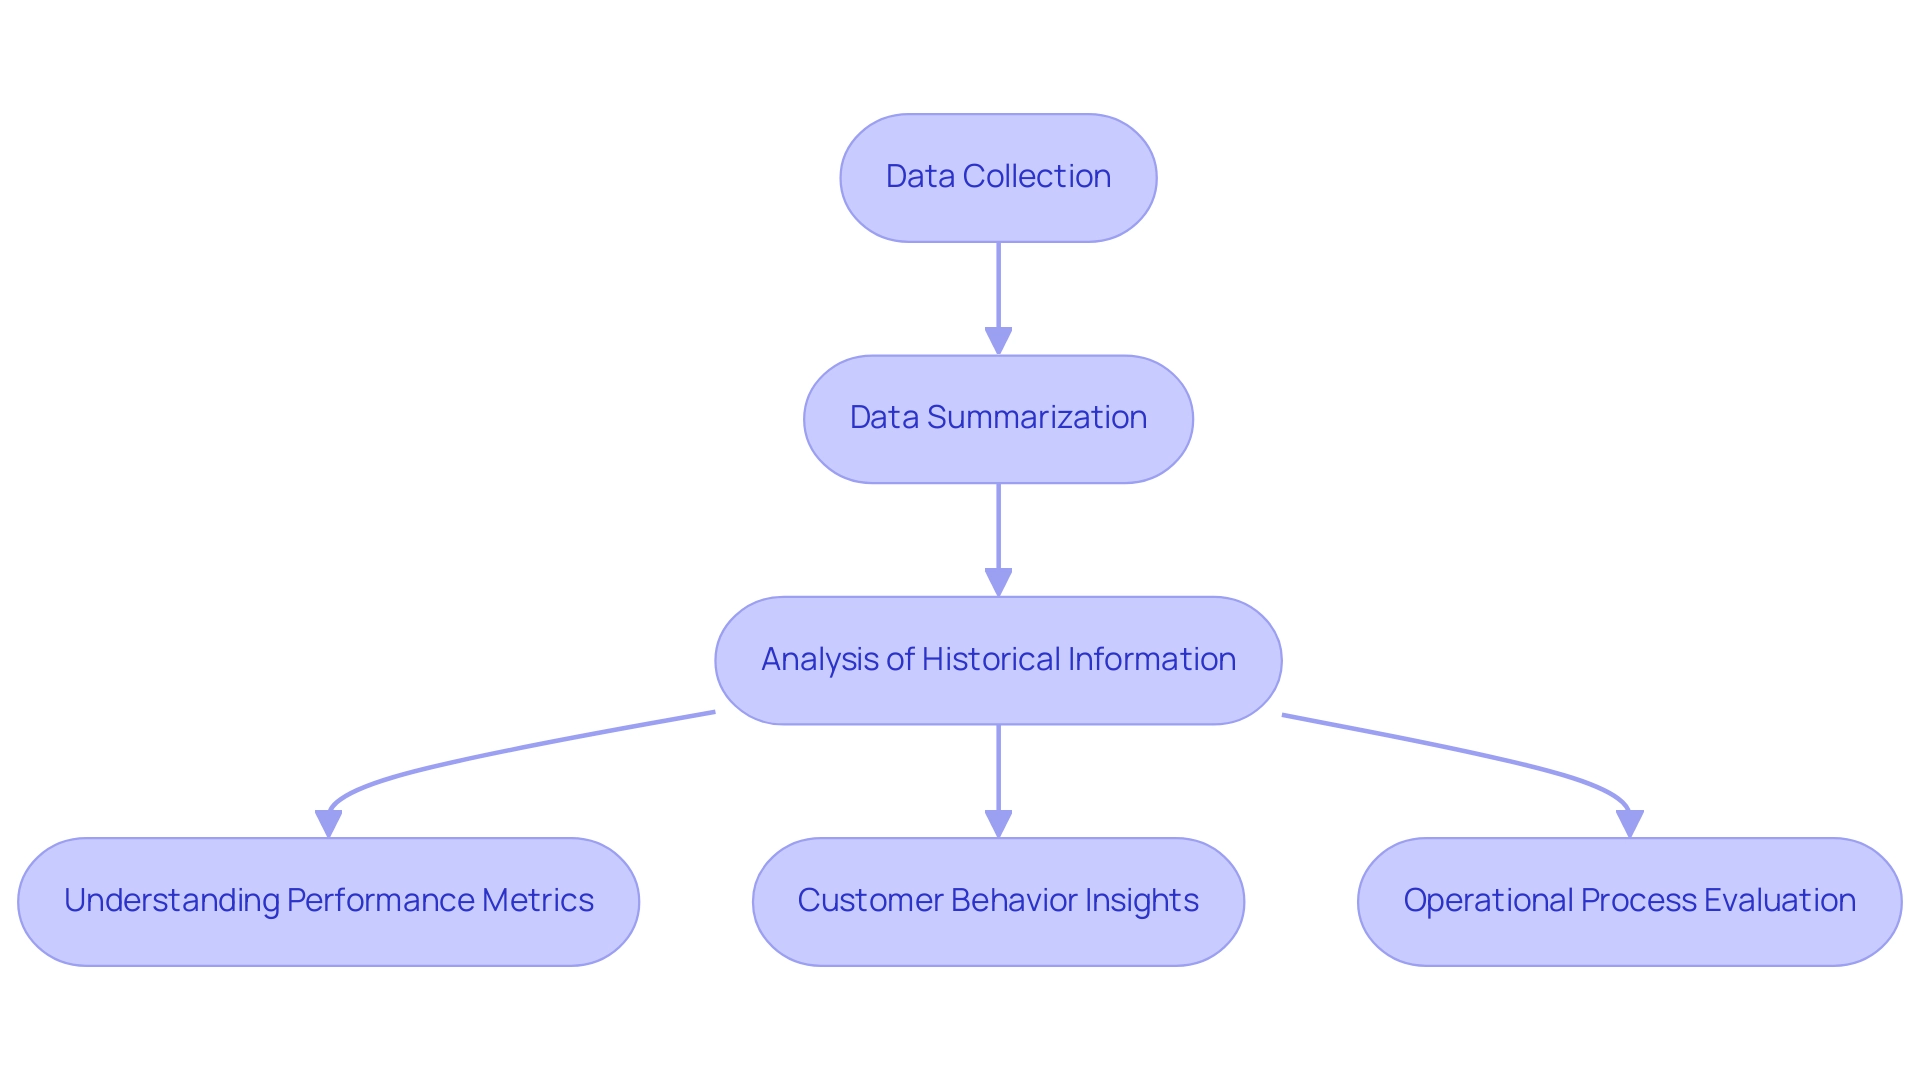
Exploring Diagnostic Analytics: Why Did It Happen?
Diagnostic analysis extends beyond the surface of descriptive analysis by delving into the reasons behind past events, effectively answering the critical question: Why did it happen? By examining historical information, organizations can identify relationships and causal factors that resulted in specific outcomes. For instance, when confronted with a sudden drop in sales, diagnostic analytics types allow businesses to uncover underlying issues such as shifts in customer preferences, emergence of new competitors, or operational inefficiencies.
Employing techniques such as mining information and statistical analysis, companies can recognize patterns and correlations that guide strategic decisions. This is where integrating Robotic Process Automation (RPA) solutions like EMMA RPA, with its intuitive interface for task automation, and Microsoft Power Automate, which enables seamless workflows across applications, can significantly enhance operational efficiency. By automating manual workflows, these tools not only reduce errors but also free up teams to focus on strategic, value-adding work.
For instance, information mining can reveal trends in customer behavior that indicate a need for product adjustments or marketing strategy shifts, further supported by the efficiency gained through RPA. This approach to analytics types is not merely reactive; it fosters a proactive stance toward operational challenges. As highlighted in recent findings, 57% of enterprises reported a significant enhancement in their decision-making effectiveness through the implementation of such analysis.
Furthermore, with 54% of businesses contemplating the incorporation of cloud computing and business intelligence in their information analysis strategies, as emphasized by IBM and Microsoft, the significance of grasping the root causes of sales decline has never been more evident. The case study titled ‘Top Analytics Types Trends’ demonstrates that entities utilizing emerging analytics types alongside RPA solutions are better positioned to gain competitive advantages and make informed decisions. Adopting diagnostic analysis, supported by the innovative features of RPA, provides entities with the insights necessary to manage complexities in information access and use, ultimately improving their capacity to react effectively to market dynamics.
- Book a free consultation to explore how our RPA solutions can transform your operational efficiency.
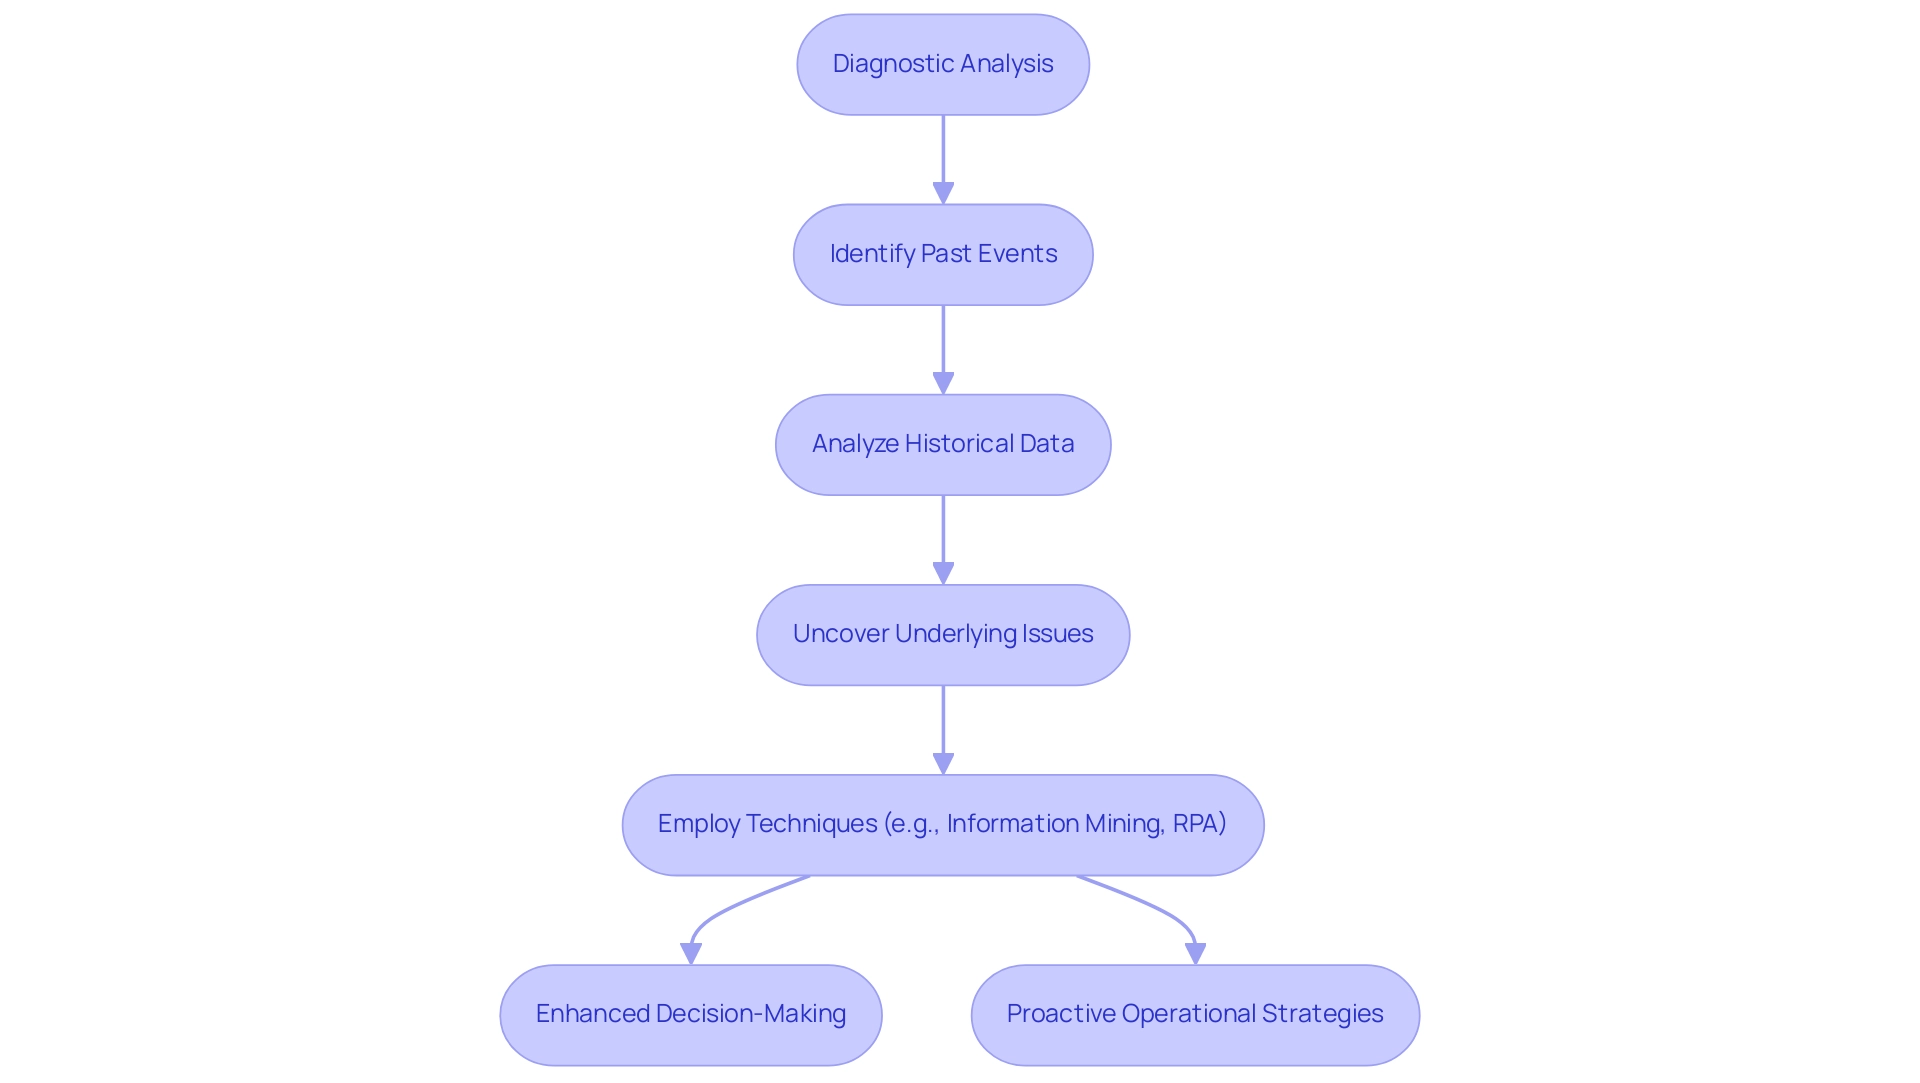
Predictive Analytics: What Is Likely to Happen?
Predictive analysis serves as a powerful tool for anticipating future events using historical data, effectively answering the crucial question: What is likely to happen? By employing advanced statistical algorithms alongside machine learning techniques, organizations can delve into past trends to forecast future outcomes with greater precision. For instance, financial institutions can utilize predictive analytics to evaluate the probability of loan defaults based on historical borrower behaviors, thereby refining lending criteria and mitigating potential risks, ultimately enhancing operational efficiencies.
Moreover, the integration of Robotic Process Automation (RPA) can further streamline these workflows, reducing manual effort and errors while freeing up teams for more strategic, value-adding work. As companies face a rapidly evolving AI landscape, our tailored AI solutions can help cut through the noise, aligning technologies with specific organizational goals and challenges. Additionally, the implementation of Business Intelligence can transform raw information into actionable insights, enabling informed decision-making that drives growth and innovation.
The applications of various analytics types, including predictive analysis, extend beyond risk assessment; businesses can harness this technology for demand forecasting, customer segmentation, and strategic decision-making, all while leveraging RPA to enhance accuracy and efficiency. As highlighted in the case study titled ‘The Future Role of Big Data Analytics for Financial Services,’ the exponential growth of data and open banking regulations are shaping the future of data analysis in finance. Organizations that effectively utilize Big Data insights, alongside RPA, tailored AI solutions, and Business Intelligence, will achieve superior customer experiences and operational efficiencies, gaining a competitive edge.
As the landscape of predictive evaluation evolves, particularly in 2024, advancements are expected to further enhance accuracy and broaden applications across various financial scenarios. With 82% of companies still making decisions based on obsolete information, the necessity for embracing predictive analysis has never been more pressing. This statistic underscores the consequences of outdated decision-making, emphasizing the need for timely and informed choices.
As noted by a representative from a Global Management Consulting Firm, “Remarkable job and great efforts by your research team,” which reflects the importance of comprehensive data analysis in driving effective financial strategies. Investing in predictive insights, enhanced by RPA, tailored AI solutions, and Business Intelligence, not only aids in operational efficiency but also secures a robust position in the fast-paced financial markets. Furthermore, the potential cost reductions associated with these technologies make them even more compelling for companies looking to improve their bottom line.
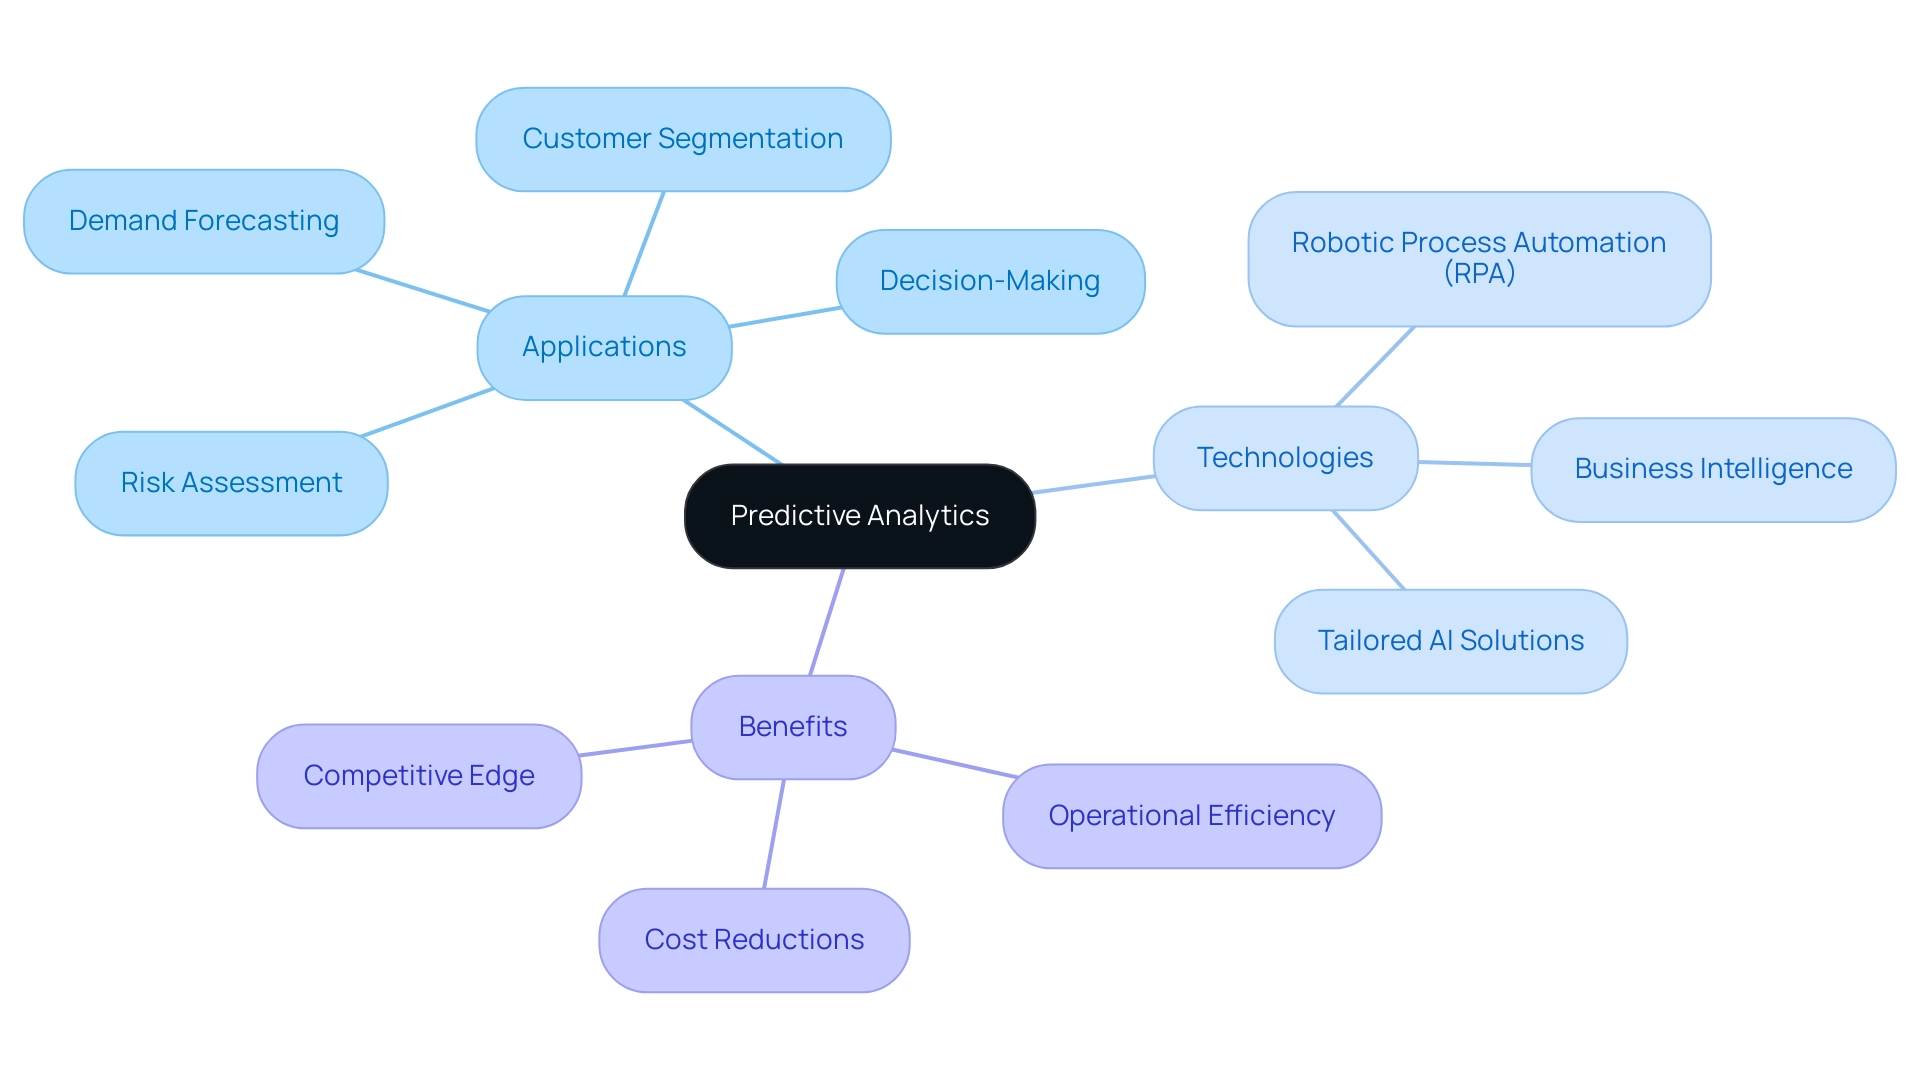
Prescriptive Analytics: What Should Be Done?
Prescriptive analysis goes beyond simple forecasting by providing actionable suggestions obtained from thorough examination, closely aligning with our 3-Day Power BI Sprint’s mission to enable entities to utilize insights effectively. It addresses the pivotal question: What should be done? By examining data and evaluating various scenarios, organizations can pinpoint optimal strategies to achieve their objectives.
For instance, in the logistics sector, a company might utilize prescriptive data analysis to refine delivery routes, factoring in critical elements such as traffic patterns, weather forecasts, and strict delivery timelines. Through our tailored Power BI services, including custom dashboards and expert training, businesses can significantly boost operational efficiency and curtail costs. In just three days, we promise to create a fully functional, professionally designed report on a topic of your choice, allowing you to focus on utilizing the insights.
This advanced form of analysis, complemented by Robotic Process Automation (RPA) to automate manual workflows, empowers organizations to make informed, strategic decisions that enhance growth trajectories and elevate overall performance in a rapidly evolving AI landscape. Additionally, you can use this report as a template for future projects, ensuring a professional design from the start. Recent data suggests that by 2026, automated predictive tools are set to seize 35% of market demand, highlighting the increasing dependence on these resources for operational excellence.
Notable industry collaborations, such as the partnership between Compulsion and Clarabridge, aim to enhance prescriptive data analysis capabilities, illustrating the transformative potential of these insights in modern business environments. The advantages are significant; a survey revealed that 64% of participants acknowledged enhanced efficiency and productivity as key results of utilizing predictive methods, while 56% reported quicker decision-making and 51% recognized positive financial performance. These findings emphasize the role of prescriptive analytics in fostering competitive advantages and driving positive financial outcomes, including new revenue streams and improved customer experiences.
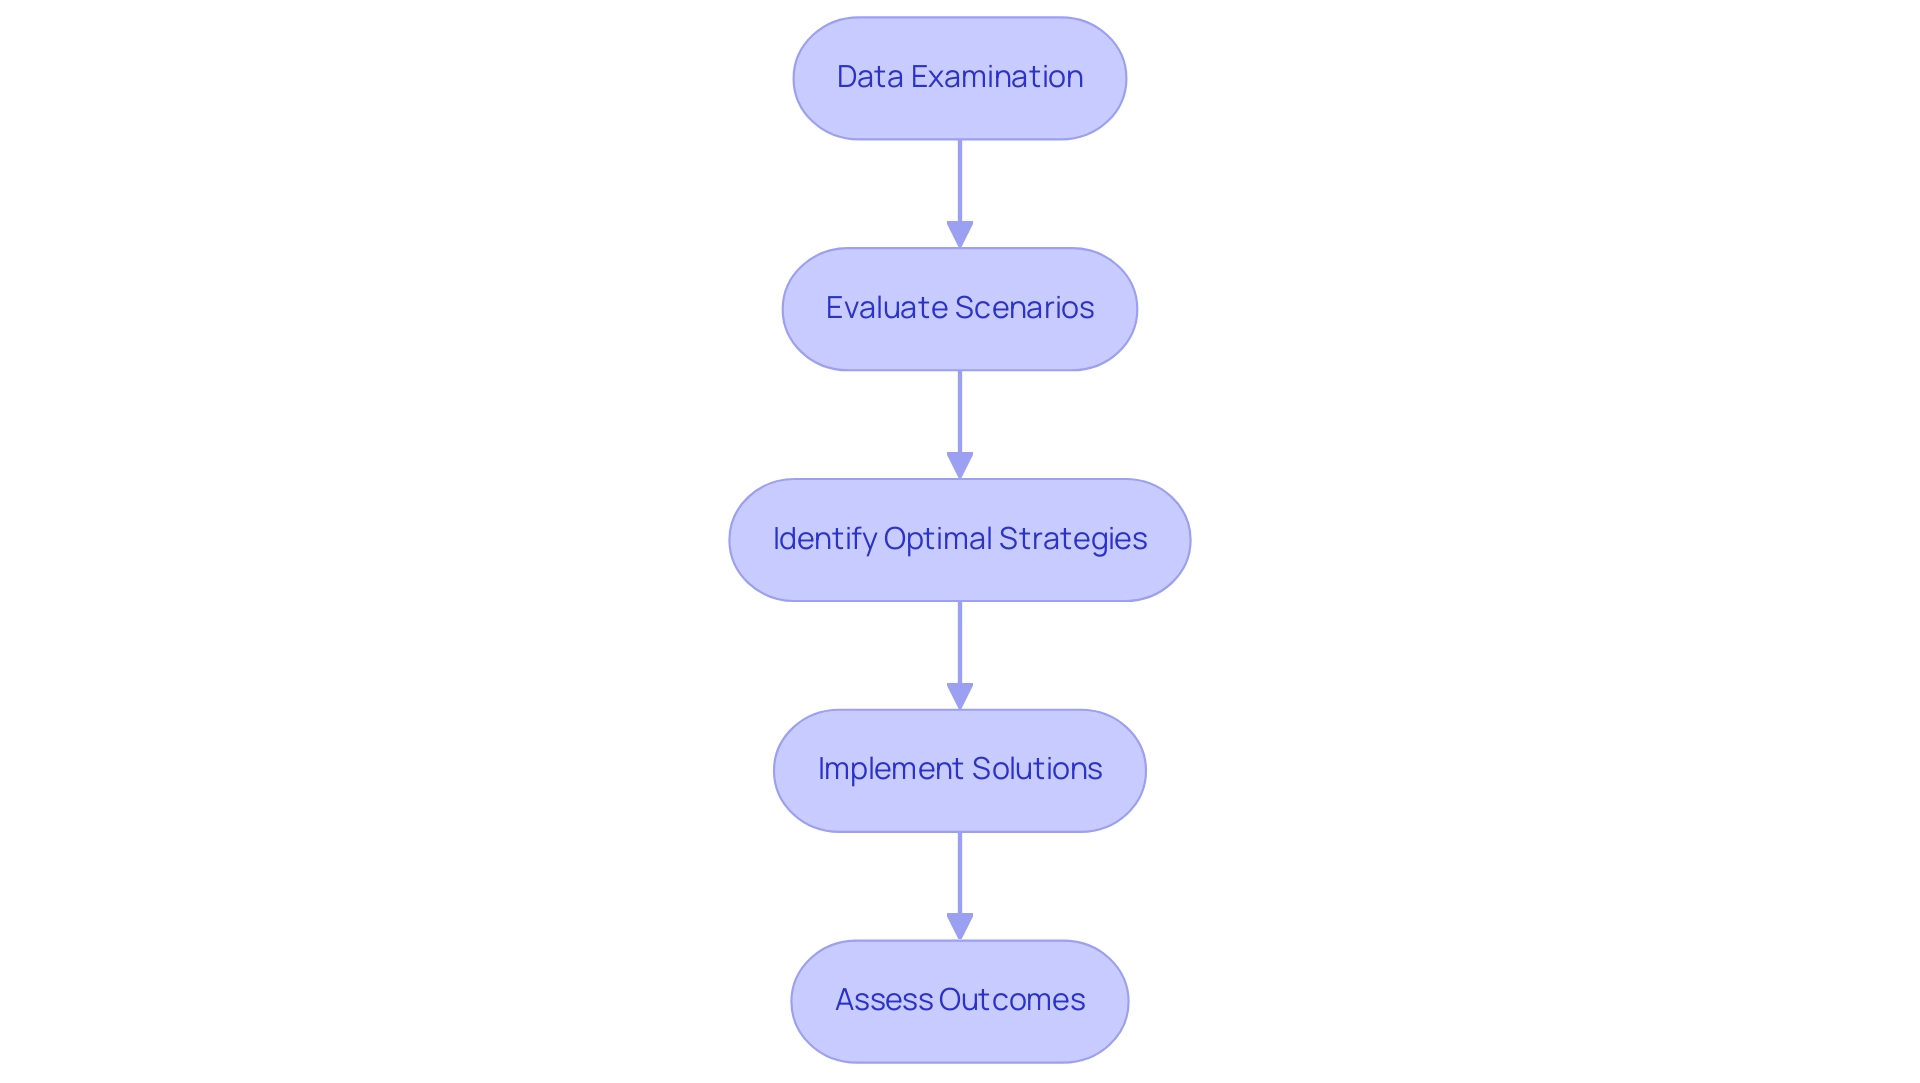
Conclusion
Harnessing the power of analytics is essential for organizations striving to thrive in today’s data-driven landscape. Each of the four main types of analytics—descriptive, diagnostic, predictive, and prescriptive—plays a distinct yet interconnected role in unlocking insights that can drive operational efficiency and informed decision-making.
- Descriptive analytics lays the foundation by summarizing historical data,
- Diagnostic analytics digs deeper to uncover the reasons behind past outcomes.
- Predictive analytics then forecasts future trends, allowing companies to anticipate challenges and opportunities,
- Prescriptive analytics provides actionable recommendations to guide strategic initiatives.
Integrating these analytics types with technologies such as Robotic Process Automation (RPA) enhances their effectiveness, streamlining processes and improving data accuracy. As organizations face challenges like poor data quality and barriers to AI adoption, addressing these issues becomes critical to maximizing the benefits of analytics. The case studies and statistics presented underscore the urgency of adapting analytics strategies in order to remain competitive and responsive in an evolving market.
Ultimately, embracing a comprehensive analytics approach equips businesses with the insights needed to navigate complexities and seize opportunities. By leveraging data effectively, organizations can not only improve operational performance but also secure a significant competitive edge. Now is the time to harness the full potential of analytics to drive strategic growth and operational excellence in a rapidly changing business environment.
Introduction
In a landscape where operational efficiency is paramount, organizations are increasingly turning to Robotic Process Automation (RPA) as a game-changing solution. This innovative technology not only automates repetitive tasks but also empowers businesses to streamline workflows, enhance productivity, and significantly reduce human error.
As companies across various sectors, from healthcare to finance, embrace RPA, they are witnessing remarkable transformations in their operations. With compelling case studies demonstrating substantial ROI and increased employee satisfaction, the time has never been more critical for organizations to explore the diverse applications and benefits of RPA.
However, the journey to successful implementation is not without its challenges. By understanding the nuances of RPA deployment and the strategies for overcoming common obstacles, businesses can unlock new levels of efficiency and position themselves for sustained growth in an ever-evolving marketplace.
Defining Robotic Process Automation (RPA)
Robotic Process Automation (RPA), which embodies the RPA meaning in software, acts as a crucial technology for companies seeking to improve efficiency by automating repetitive, rule-based tasks usually performed by human workers. A compelling case study from a mid-sized healthcare company illustrates the challenges they faced, including:
- Manual data entry errors
- Slow software testing
- Difficulty integrating outdated systems without APIs
By utilizing GUI techniques, they greatly enhanced their efficiency, decreasing data entry mistakes by 70% and speeding up software testing processes by 50%.
By leveraging software robots, or ‘bots’, the RPA meaning in software effectively streamlines workflows, minimizes human error, and allows for a more strategic allocation of human resources. This is especially advantageous in high data processing environments, where efficiency improvements can lead to substantial time and cost savings.
Recent data indicates that:
- 76% of organizations have embraced mechanization
- 53% are already on their RPA journey
- An additional 19% are planning to adopt it in the next two years
This shift underscores RPA’s rise as a strategic initiative, essential for attaining excellence in operations by grasping the RPA meaning in software. Notably, a report from Slack revealed that, on average, workers save 3.6 hours per week by utilizing automation, contributing to increased job satisfaction—with 89% of employees reporting greater job fulfillment due to automation.
The Covid-19 pandemic has further accelerated RPA adoption, emphasizing its role in addressing changing functional challenges. The sector has witnessed considerable investment, with firms such as:
- UiPath securing $1.2 billion
- Automation Anywhere $840 million
- Blue Prism Group $182 million
- Workfusion $180 million
As entities strive to address staffing shortages and antiquated systems, the RPA meaning in software highlights the importance of solutions like EMMA RPA and Microsoft Power Automate for boosting productivity and employee morale. By transforming business operations and providing risk-free ROI assessments—achieved within six months—RPA empowers organizations to unlock new levels of operational efficiency, significantly enhancing software quality and revolutionizing processes in healthcare service delivery.
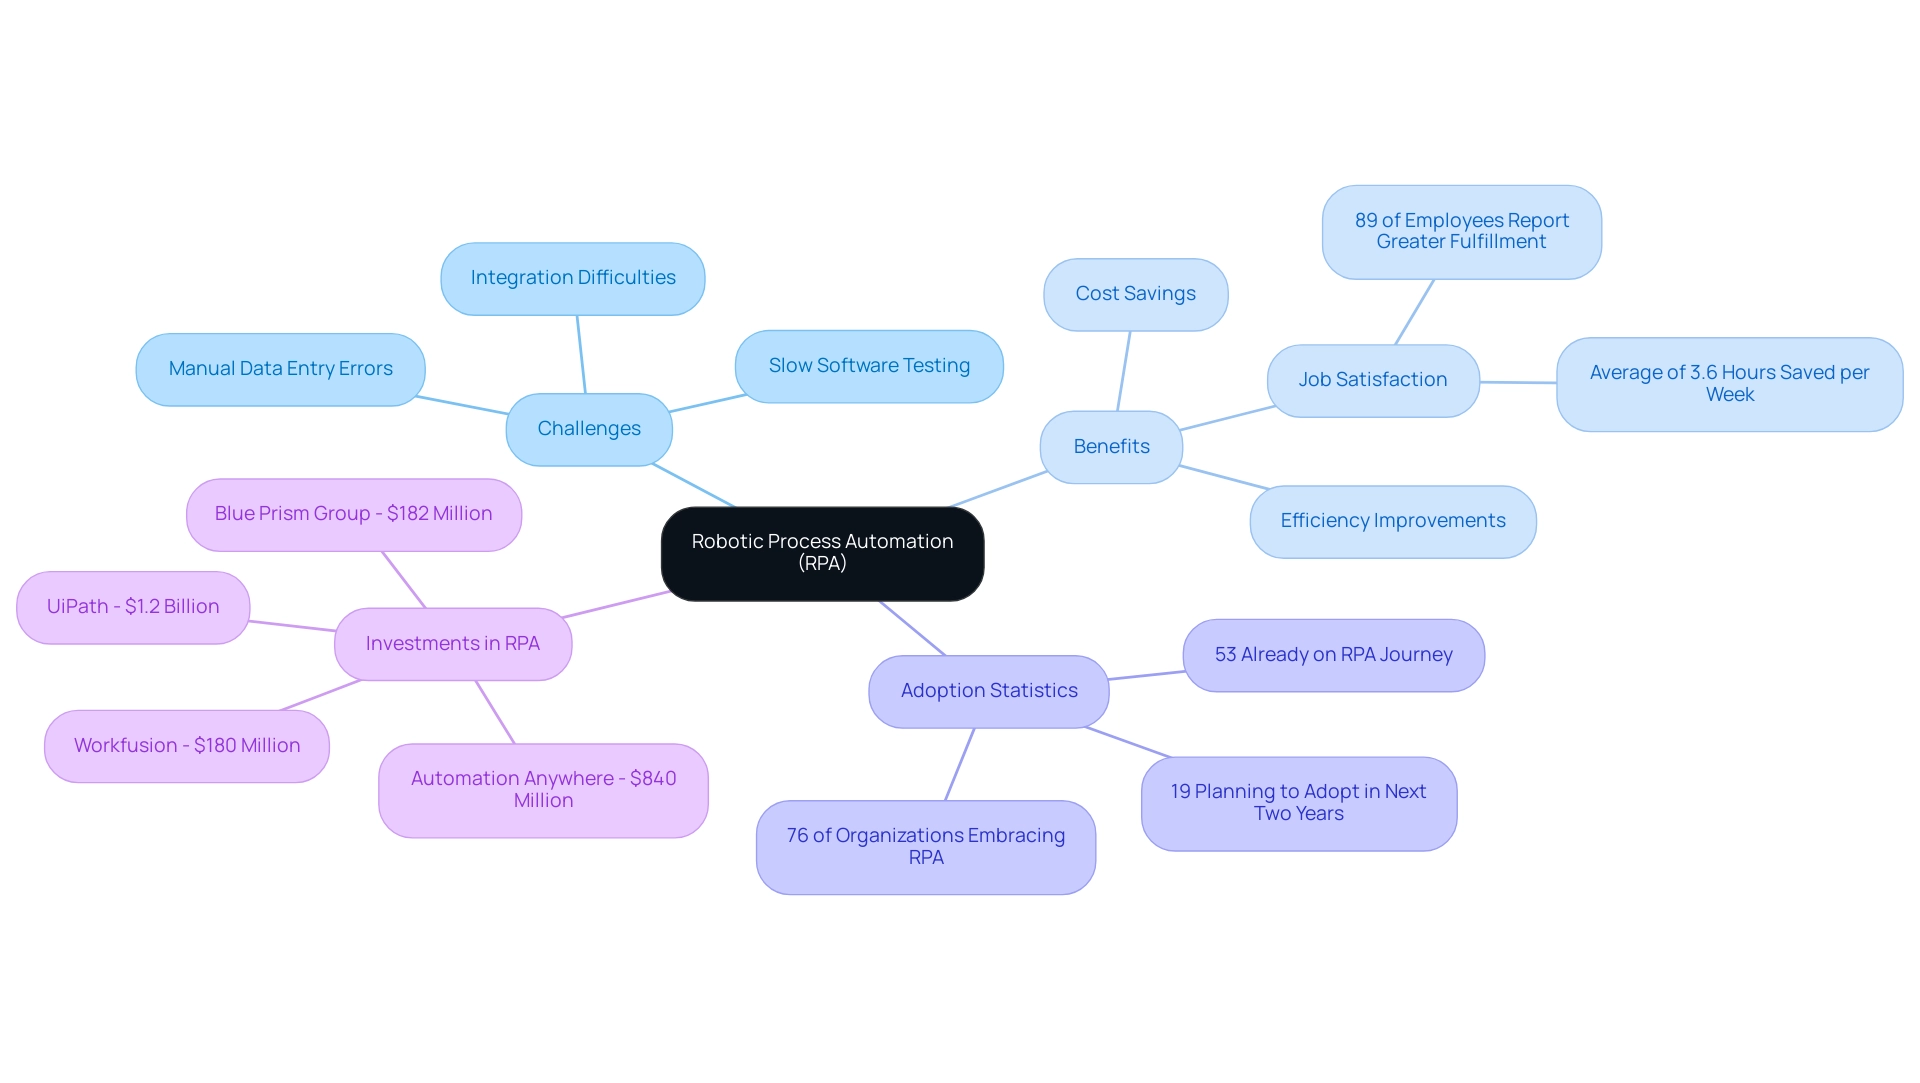
Exploring Different Types of RPA
The classification of Robotic Process Automation (RPA) meaning in software includes three primary types: attended, unattended, and hybrid processes.
-
Attended mechanization involves bots that work alongside human employees, providing real-time assistance in scenarios where immediate responses are essential, such as customer service. For example, a retail company implemented attended technology to assist customer service representatives in resolving inquiries quickly, which enhanced efficiency and improved customer satisfaction by enabling quick resolutions to queries, addressing the common workplace challenge of repetitive tasks that can drain employee morale.
-
Unattended systems operate independently, executing tasks without human oversight, making them particularly effective for back-office operations like data entry and processing. A financial institution employed unattended technology to streamline its invoice processing, alleviating staffing shortages and allowing teams to focus on strategic, value-adding activities. Recent statistics indicate that the use of unattended technology is expected to rise significantly across various industries by 2024, contributing to the overall growth of the RPA market, which is projected to experience a CAGR of 24.7% from 2024 to 2033.
-
Hybrid automation, which combines the strengths of both attended and unattended automation, provides entities the flexibility to optimize workflows across diverse tasks. By utilizing a blend of these strategies, businesses can align RPA solutions with their performance goals, effectively tackling specific challenges such as those highlighted in a survey where 63% of entities faced unmet expectations regarding implementation time, with 64% of participants in the Deloitte Global RPA Survey indicating that the implementation time for RPA was longer than anticipated. Additionally, updating old systems through RPA not only improves efficiency but also enables companies to adjust to changing market demands.
Understanding these distinctions is crucial for developing a tailored RPA strategy that incorporates the RPA meaning in software, drives efficiency, and meets the evolving needs of the workforce in a rapidly changing AI landscape.
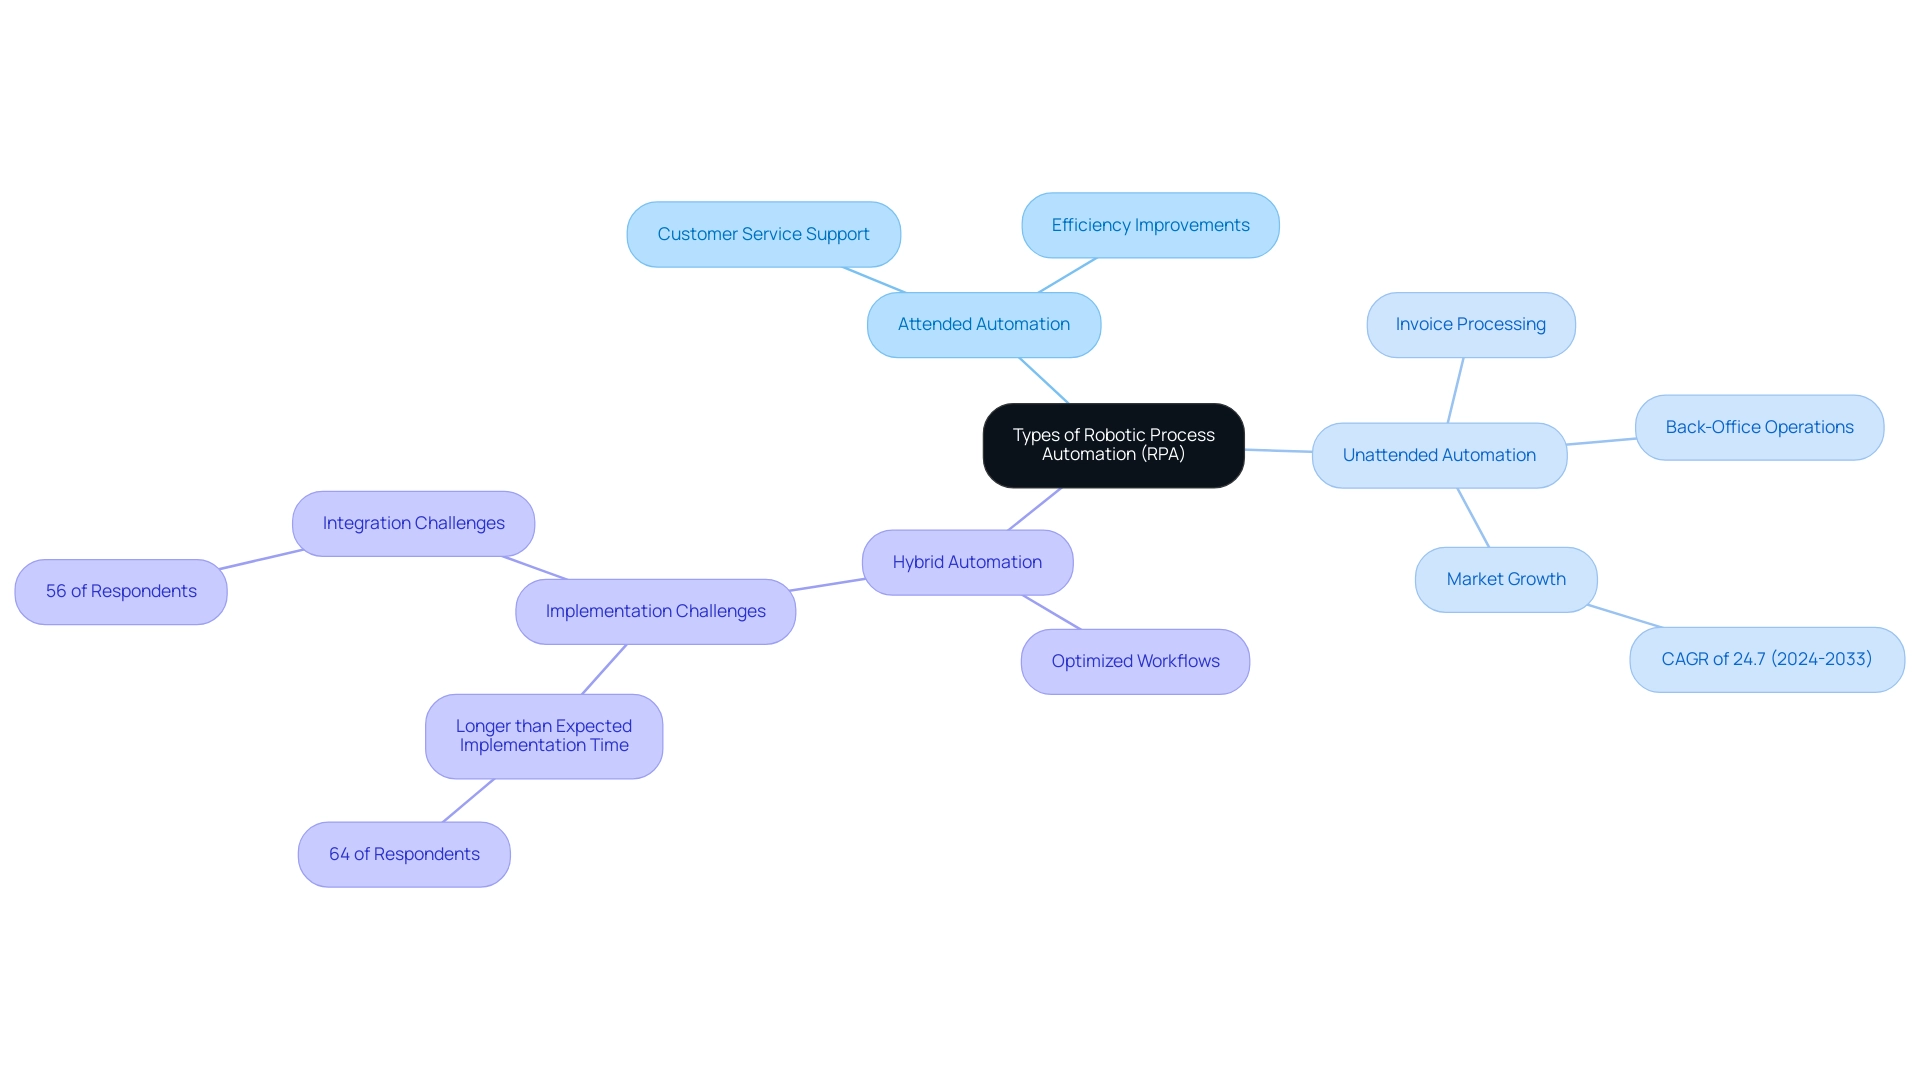
Benefits of Implementing RPA in Business
The implementation of Robotic Process Automation (RPA) highlights the rpa meaning in software, providing companies a multitude of benefits, including substantial cost savings, heightened efficiency, and improved accuracy. The rpa meaning in software is that it can manage up to 90% of data entry tasks in clinical research, significantly lowering operational costs while minimizing the risk of human error. This mechanization leads to quicker processing durations, enabling businesses to react promptly to client needs.
Industry leaders such as UiPath and Automation Anywhere exemplify the strategic value of RPA, showcasing remarkable productivity gains post-implementation. According to the Deloitte Global RPA Survey, over 90% of C-level executives employing intelligent processes believe their organizations excel at adapting to evolving business trends. Moreover, understanding the rpa meaning in software enhances performance, ensures compliance, and strengthens cybersecurity—all while driving down costs.
A case study on job satisfaction revealed that:
- 34% of workers experienced role changes due to smart technology
- 89% noted increased job satisfaction
- 83% of employees using AI-powered automation report reduced burnout and enhanced job satisfaction
By adopting RPA, organizations can enhance excellence in operations and nurture a culture of innovation, reflecting the rpa meaning in software, while unlocking new growth opportunities.
Companies like [Company Name] have reported significant productivity gains, stating, ‘[insert quote here],’ which underscores the tangible benefits of RPA in real-world applications. To further enhance your operational efficiency, consider exploring our tailored AI solutions that complement RPA and leverage Business Intelligence to transform data into actionable insights, driving informed decision-making. Engage with us to discover how we can support your journey towards greater productivity and lower costs.
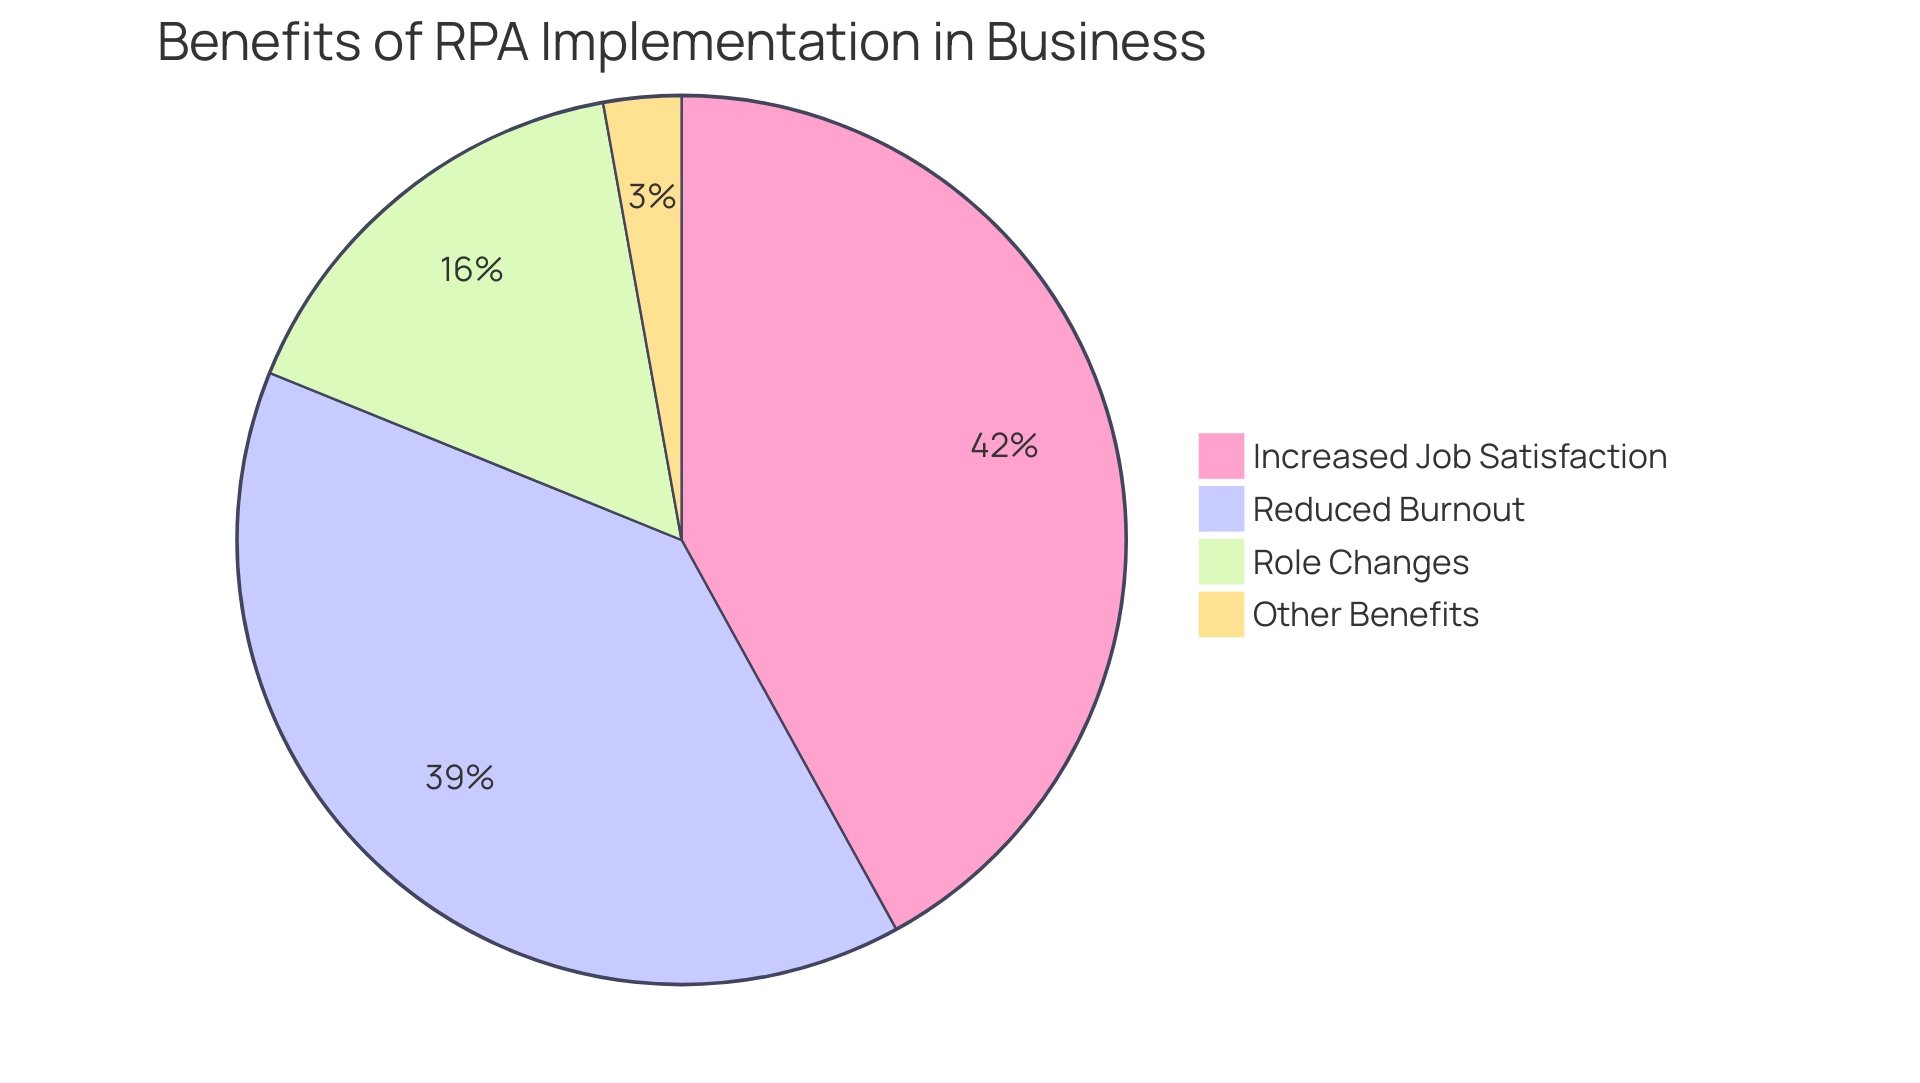
Real-World Applications of RPA Across Industries
Robotic Process Automation (RPA) is revolutionizing operations across various industries, and understanding RPA meaning in software is essential for leveraging its benefits in finance, healthcare, and manufacturing. A compelling case study demonstrates how a mid-sized healthcare company employed GUI processes to streamline operations, addressing challenges such as:
- Manual data entry errors
- Slow software testing
- Difficulty integrating outdated systems without APIs
By implementing RPA, the company reduced data entry errors by 70%, accelerated testing processes by 50%, and improved overall workflow efficiency by 80%, achieving ROI within just six months.
This efficiency not only transformed their administrative tasks but also allowed healthcare professionals to dedicate more time to patient interaction, enhancing overall patient care.
In finance, RPA is streamlining processes like invoice processing and compliance reporting, leading to significant reductions in processing times. Workers save an average of 3.6 hours per week through automation, enabling them to focus on more strategic tasks. The manufacturing sector is also benefiting, utilizing RPA for inventory management and order processing to enhance supply chain efficiency.
Moreover, the integration of AI technologies within RPA platforms is evolving, with tailored AI solutions providing targeted technologies that align with specific business goals.
However, security concerns remain a barrier for 70% of executives. Recent statistics reveal that:
- 53% of entities have initiated RPA implementations
- 19% planning to adopt it within the next two years
- 78% of existing RPA users expect increased investment in the next three years
This indicates a growing recognition of the RPA meaning in software to enhance operational capabilities. These real-world applications illustrate RPA’s adaptability and effectiveness, making it an essential tool for entities aiming to optimize their processes and drive productivity.
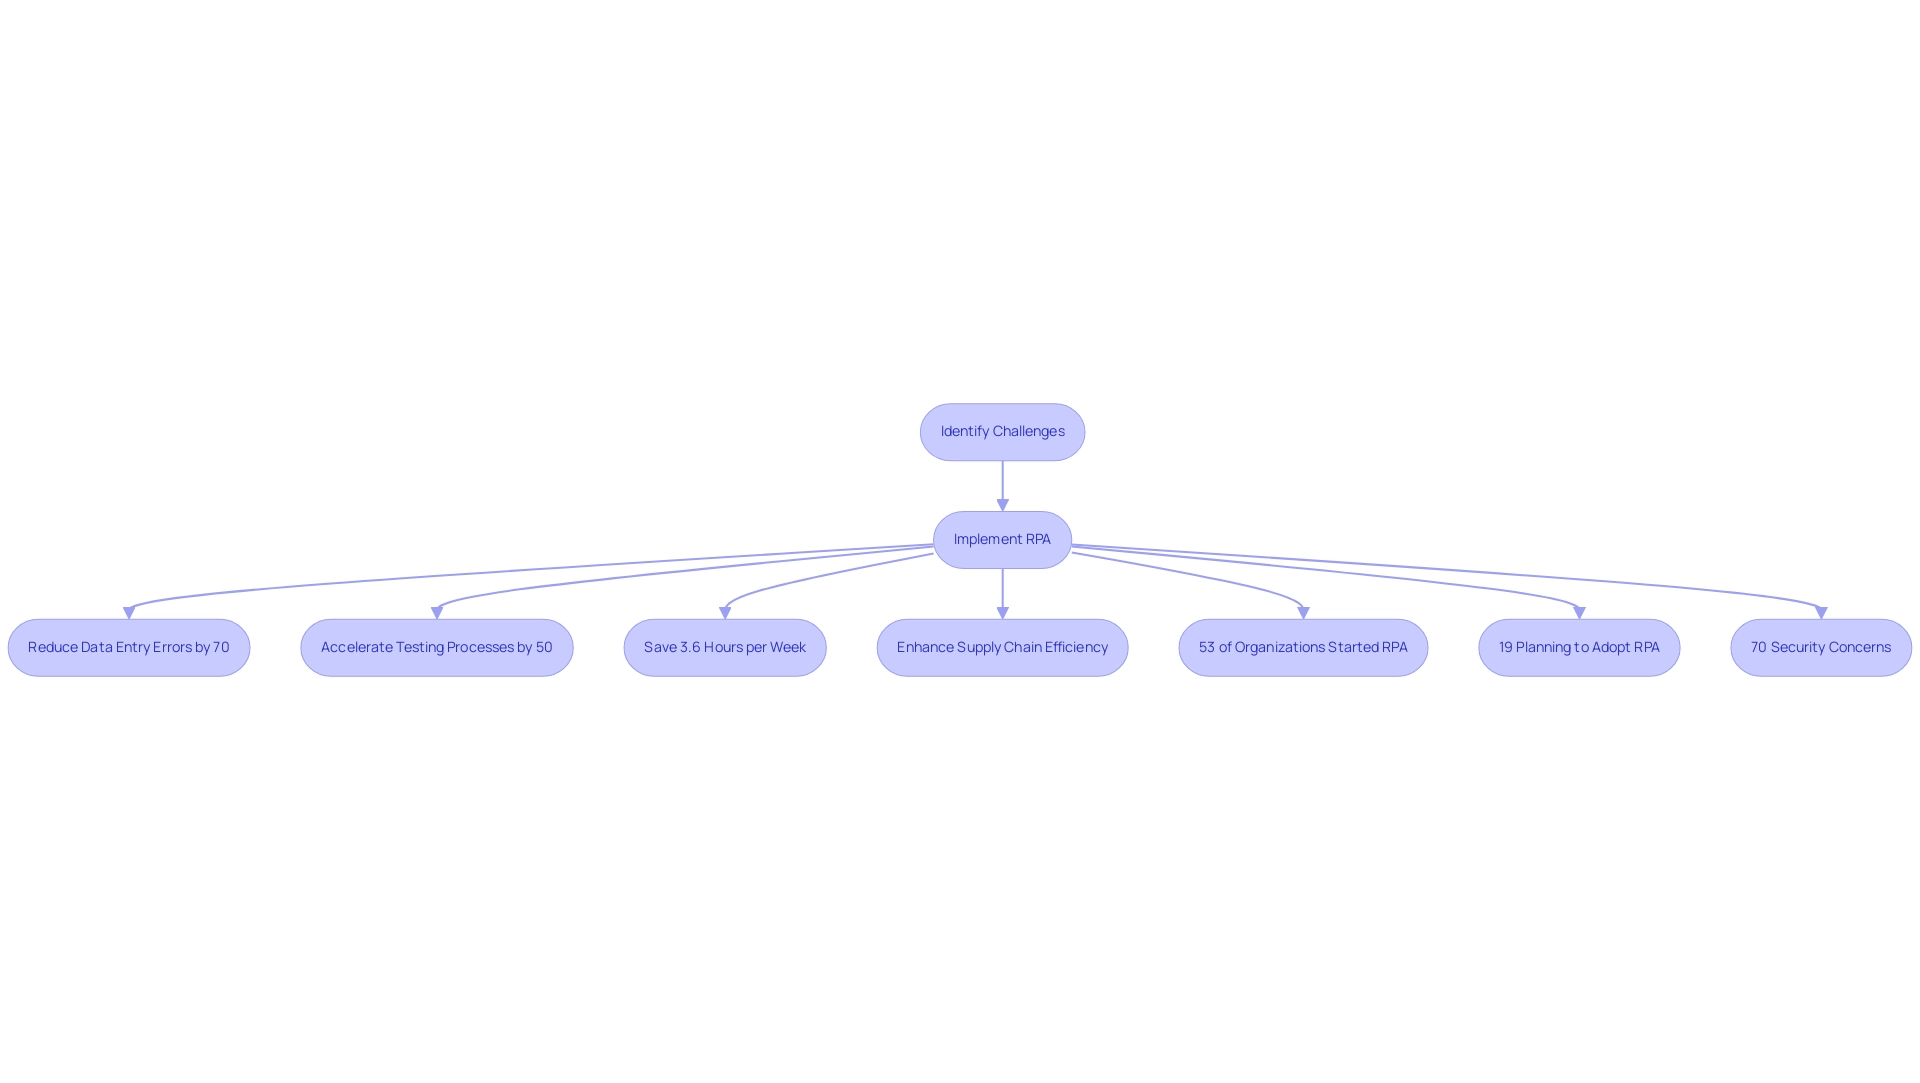
Challenges and Considerations in RPA Deployment
While understanding the RPA meaning in software offers significant advantages, companies must navigate several challenges during deployment. Resistance to change from employees can emerge as a primary obstacle, potentially stalling the adoption process. To address this, it’s crucial for entities to ensure that existing workflows are meticulously defined before starting mechanization, which helps prevent confusion and inefficiencies.
Furthermore, investing in comprehensive training programs and robust change management strategies is essential to facilitate a seamless transition, fostering an environment conducive to acceptance and adaptation. The concept of RPA meaning in software indicates that automated processes are less prone to human error, leading to improved accuracy and compliance with regulations; this reinforces the need for effective training and management. Additionally, the RPA meaning in software highlights how it can significantly reduce operational costs and free up personnel to focus on more strategic, value-adding tasks.
Understanding RPA meaning in software is crucial, as the scalability of RPA solutions is an essential element; entities should evaluate their robotic tools to ensure they can progress with business expansion. A case study titled ‘Identifying and Prioritizing Processes for Streamlining’ highlights the challenges of pinpointing processes for enhancement, particularly within complex organizational workflows. By conducting process discovery exercises and involving subject matter experts, organizations can better identify automation opportunities.
By proactively addressing these challenges and modernizing outdated systems, businesses not only enhance their operational efficiency but also foster a culture of continuous improvement that empowers employees and drives innovation, ultimately improving the overall customer experience.
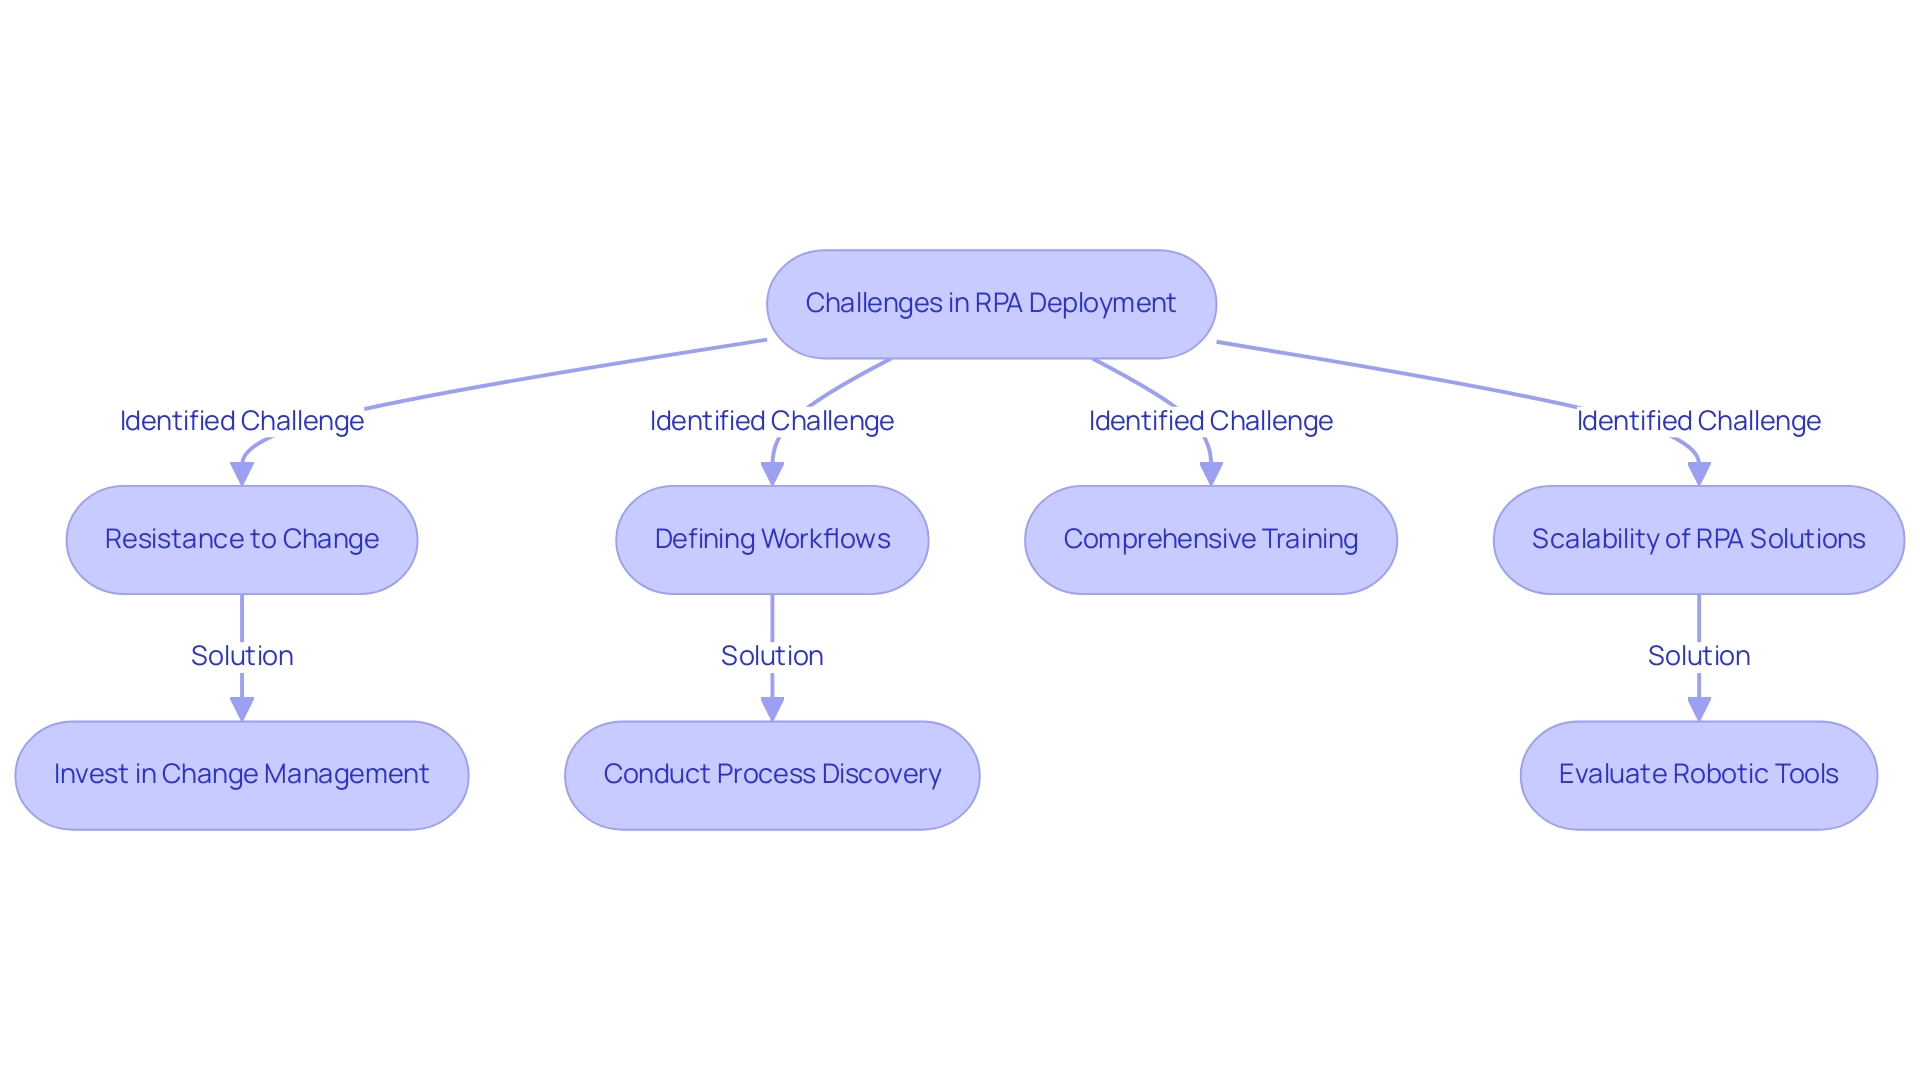
Conclusion
Embracing Robotic Process Automation (RPA) is a transformative step for organizations aiming to enhance operational efficiency and productivity. By automating repetitive tasks, RPA not only minimizes human error but also liberates valuable human resources for more strategic initiatives. The compelling case studies presented illustrate how businesses across various sectors, such as healthcare and finance, have successfully implemented RPA to achieve substantial improvements in workflow efficiency, resulting in significant cost savings and increased employee satisfaction.
However, the journey to effective RPA deployment is not without its challenges. Resistance to change, the need for comprehensive training, and the careful selection of processes for automation are critical factors that organizations must address to ensure a smooth transition. By focusing on these areas and leveraging the right mix of attended, unattended, and hybrid automation, companies can seamlessly integrate RPA into their operations, paving the way for sustained growth and innovation.
As industries continue to adapt to evolving market demands, the value of RPA becomes increasingly evident. Organizations that proactively embrace this technology will not only enhance their operational capabilities but also position themselves as leaders in their respective fields. The time to explore and invest in RPA is now, as it holds the key to unlocking new levels of efficiency and driving long-term success in an ever-competitive landscape.
Introduction
In an increasingly digital landscape, organizations are recognizing the critical need to streamline their invoice processing to enhance operational efficiency and reduce costs. Automated invoice processing stands out as a transformative solution, leveraging advanced technologies like Robotic Process Automation (RPA) and Artificial Intelligence (AI) to eliminate manual errors and accelerate workflows.
Despite the clear advantages, many companies remain hesitant to adopt these innovations, often due to misconceptions about complexity and cost. This article delves into the essential components of automated invoice processing, highlighting its benefits, implementation strategies, and the tools necessary for success.
By addressing common challenges and providing practical solutions, organizations can unlock the full potential of automation, paving the way for improved cash flow management, compliance, and overall productivity. As businesses prepare for a future where efficiency is paramount, understanding and embracing automation becomes not just beneficial, but imperative.
Understanding Automated Invoice Processing
Automating invoice processing harnesses advanced technology to effectively manage and streamline the entire billing lifecycle, from receipt to payment. This innovative method includes the capture of billing data, validation against purchase orders, and routing for approval—all accomplished without manual intervention. By implementing robotic process technology (RPA) and artificial intelligence (AI), organizations can significantly improve accuracy, speed, and efficiency in automating invoice processing.
However, it’s noteworthy that fewer than 20% of firms have fully automated invoice processing, indicating substantial room for growth in this critical area of automating invoice processing. As of 2022, India took the lead in streamlining processes by generating over 1.5 billion e-invoices, illustrating the global shift towards efficiency. Companies like IKEA are also recognizing the environmental benefits; in 2021, they reported saving approximately 5,000 trees annually by transitioning to e-invoicing.
Furthermore, Stampli has emerged as a leader in accounts payable (AP) automation, offering user-friendly integration and a no-code implementation process, making it a valuable tool for entities aiming to enhance their AP processes. Grasping the subtleties of automated billing management is crucial for any organization aiming to enhance operational efficiency and reduce risks related to manual handling—particularly as payment fraud increased by 47% in 2020. It’s crucial to address the common perceptions that AI projects are time-intensive and costly, as well as the importance of improving poor master data quality, which is foundational for successful AI integration.
As we move into 2024, the ongoing development of RPA and AI will further transform financial document management, emphasizing the need for businesses to remain informed and flexible.
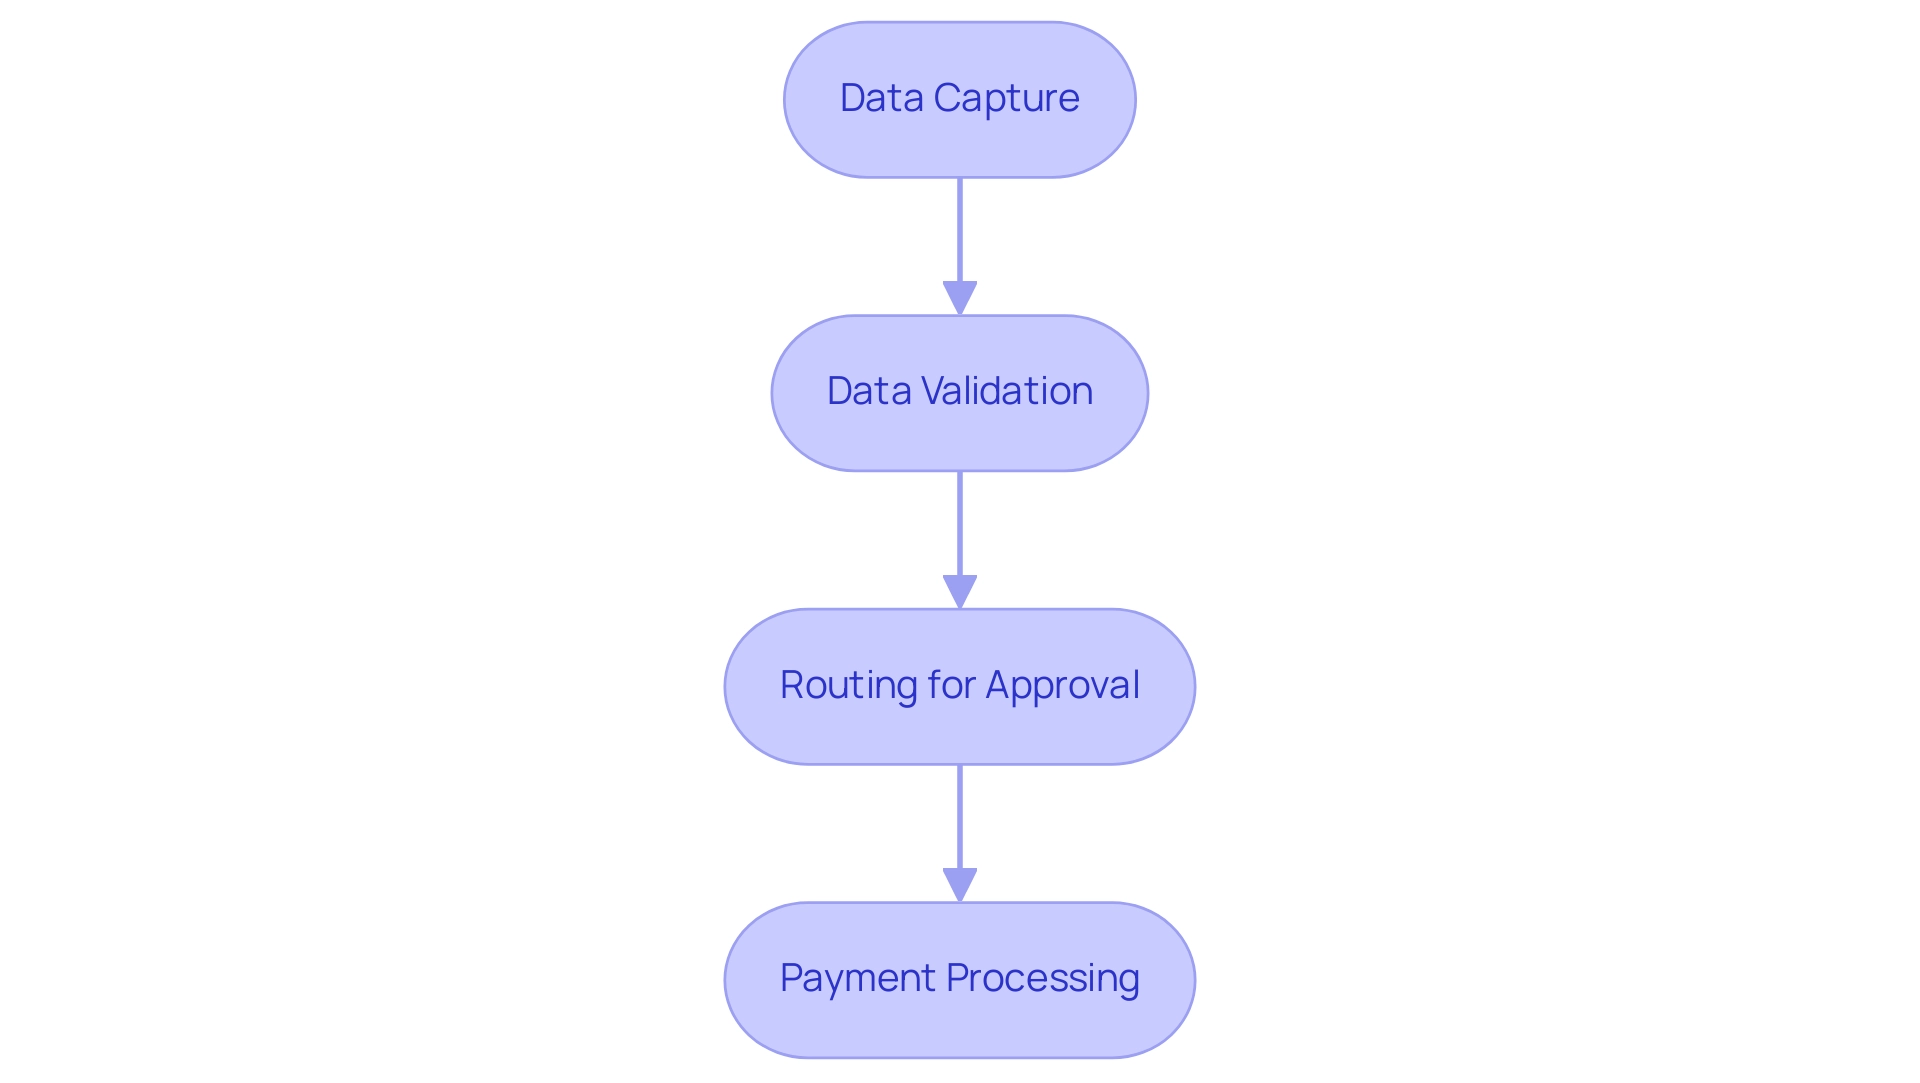
Key Benefits of Automating Invoice Processing
The practice of automating invoice processing presents a multitude of compelling benefits that can significantly enhance operational efficiency, especially in the context of South Africa, which is responsible for 63.9% of late payments—an alarming increase from 15.3% the previous year. By leveraging Robotic Process Automation (RPA), entities can explore key advantages:
-
Increased Efficiency: Automating invoice processing drastically reduces the time dedicated to manual data input and handling. This shift empowers teams to concentrate on high-value tasks, ultimately boosting overall productivity. For instance, automating invoice processing can save entities more than 70% of the time spent on accounts payable, allowing finance teams to process up to thirty invoices per hour compared to just five manually. Enhanced accuracy is achieved through automating invoice processing, which minimizes human intervention and leads to a substantial reduction in errors typically associated with manual processing. This increased accuracy not only enhances the reliability of financial data but also builds trust in the entity’s financial operations. Cost savings from automating invoice processing result from streamlined workflows that lower operational costs by reducing labor expenses and improving invoice cycle times. With an increase in processing speed, companies can realize significant savings. Research indicates that mechanization can significantly enhance productivity, emphasizing the necessity for companies to update their workflows in a swiftly changing AI environment.
-
Enhanced Cash Flow Management: The mechanization of billing approvals and payments speeds up cash flow cycles and bolsters supplier relationships. Swift processing ensures timely payments, which enhances the entity’s credibility and reliability among vendors.
-
Better Compliance and Audit Trails: Automated systems create clear, accessible records of all transactions, facilitating compliance and simplifying audit processes. This openness is vital for fulfilling regulatory obligations and upholding institutional integrity.
Recognizing these advantages enables entities to make educated choices regarding the implementation of automating invoice processing. As Shaun Jex, a Financial Automation Content Specialist, aptly observes,
Though the drawbacks of these outdated AP methods are well known, paper checks still account for 40% of transactions — leaving plenty of opportunity for companies to modernize their workflows. Embracing mechanization is no longer just an option; it is a necessary move towards operational excellence in 2024.
Furthermore, by unlocking the power of Business Intelligence, organizations can transform raw data into actionable insights, enabling informed decision-making that drives growth and innovation while cutting through the noise of the evolving AI landscape.
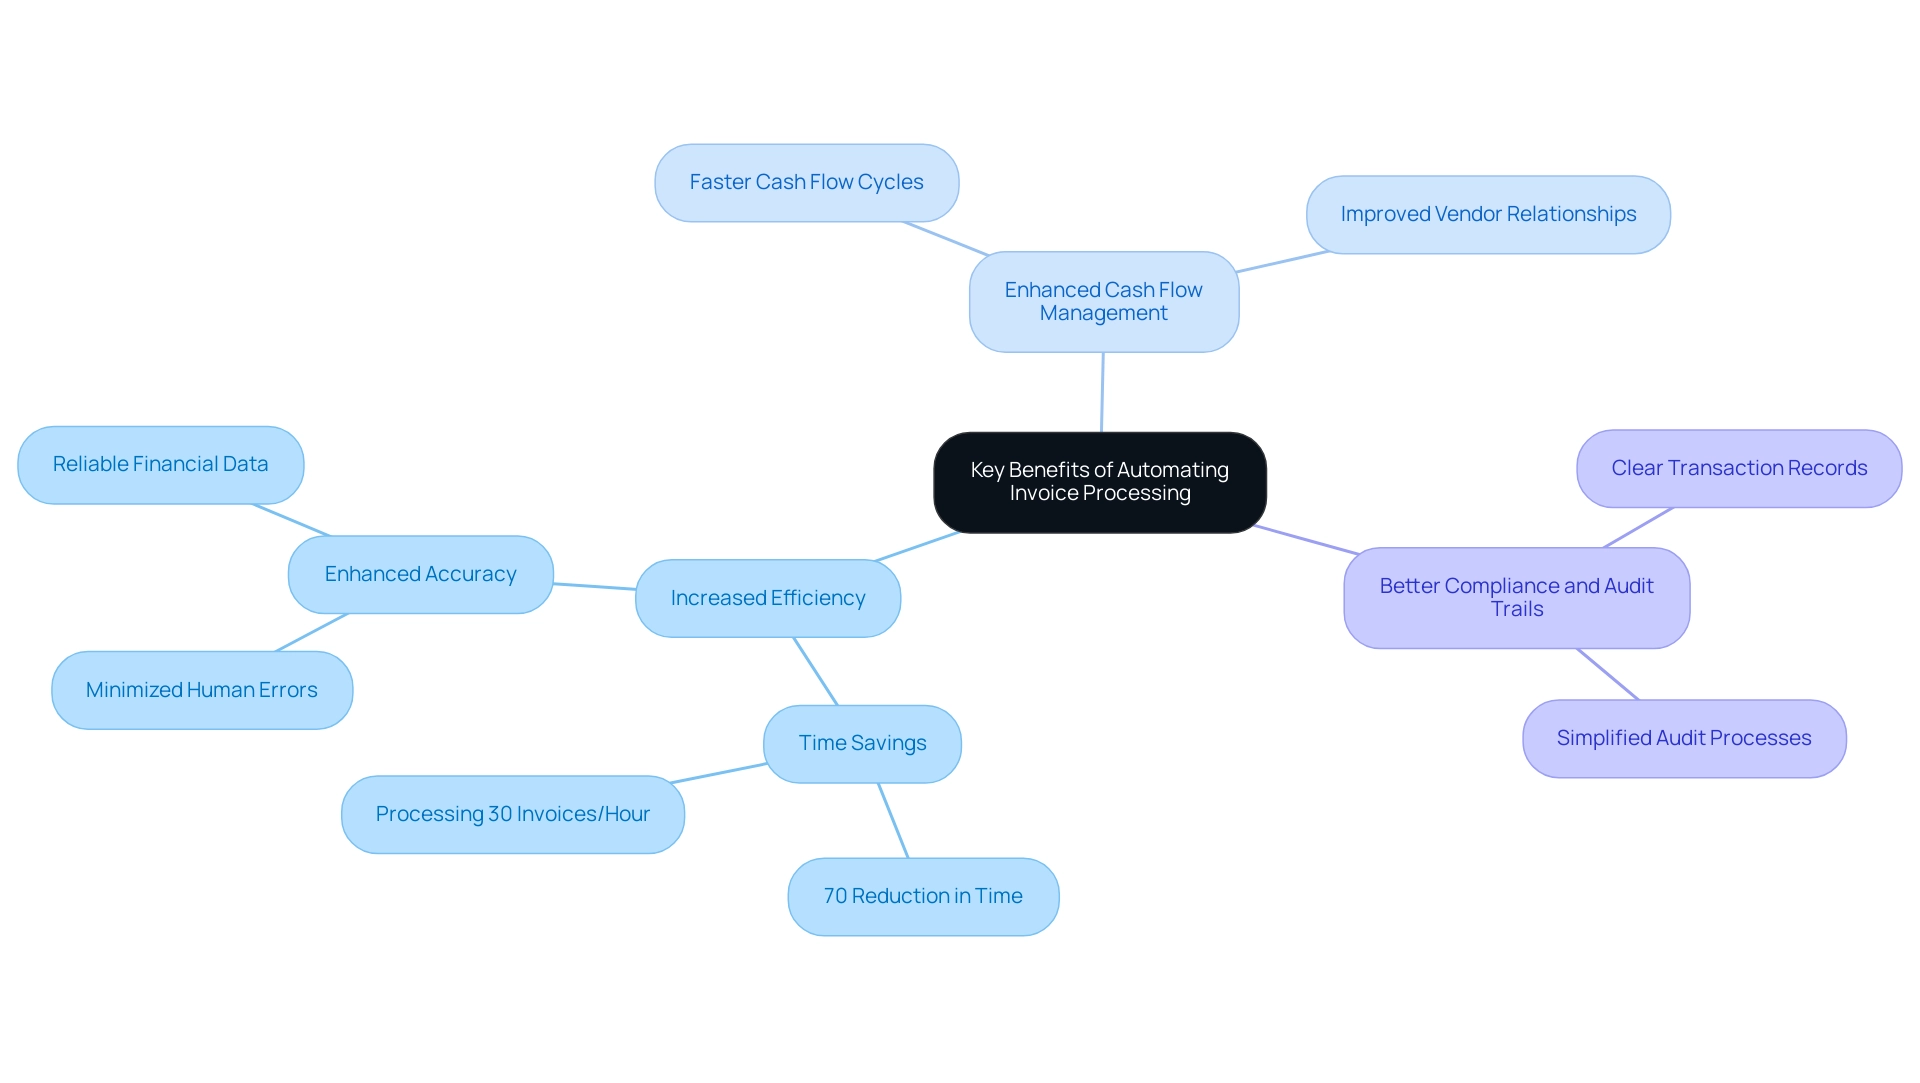
Step-by-Step Guide to Implementing Invoice Automation
Implementing automated billing management is a strategic decision that can greatly improve operational efficiency, especially as we move toward a future where over 100 million workers may need to switch careers due to reasons like remote work and mechanization by 2030. Follow these empowering steps to ensure a successful transition:
-
Assess Current Processes: Begin by analyzing your existing invoice processing workflow. Identify bottlenecks that impede efficiency and areas ripe for improvement, particularly in repetitive tasks that drain morale and productivity. A thorough evaluation establishes the foundation for automating invoice processing efficiently.
-
Define Objectives: Establish clear, measurable goals for your automated initiative. Consider objectives such as reducing processing time, enhancing accuracy, or increasing overall throughput. Clearly outlined objectives will direct your strategy, ensuring alignment with your operational efficiency targets by automating invoice processing.
-
Choose an Automation Solution: Research and select a suitable Robotic Process Automation (RPA) or Artificial Intelligence (AI) solution that aligns with your business needs. Be sure to consider solutions that can seamlessly integrate with your existing systems, addressing the challenges posed by outdated technologies.
-
Map Out the Workflow: Create a detailed workflow diagram that illustrates the process of automating invoice processing, from receipt to payment. This visual representation assists all stakeholders in comprehending the new process and recognizing any potential challenges, ensuring transparency in how mechanization will alleviate staffing shortages.
-
Train Your Team: Empower your staff with comprehensive training and resources on the new system. Ensuring that your team is well-versed in the updated processes is crucial to overcoming resistance and fostering a culture of efficiency, especially in a time when talent retention is critical.
-
Implement and Test: Roll out the automated solution in stages to minimize disruption. Testing each part of the process before full implementation helps to identify issues early on, ensuring that the system works as intended, thus mitigating risks associated with process changes.
-
Monitor and Optimize: After implementation, continuously oversee the performance of the automated system. Gather feedback and data to identify areas for further optimization. Regular adjustments will enhance efficiency and adapt to evolving business needs, demonstrating the ROI benefits of your initiative.
By following these steps, businesses can effectively transition to automating invoice processing, driving productivity and reducing the risk of being a bottleneck in operations. Crucially, our risk-free ROI guarantee ensures that you only pay if the system is delivered as planned. As noted by Kellie Parks from Calmwaters Cloud Accounting, “I realized that I would not be able to grow that way because I would be the bottleneck of the business.”
Embracing technology is essential for fostering growth and efficiency in today’s rapidly evolving work environment. Additionally, a study found that 55.2% of firms report that automation has made their onboarding processes smoother, and specific case studies show that GUI automation can reduce data entry errors by 70% and accelerate testing processes by 50%, highlighting the broader benefits of automation across different functions.
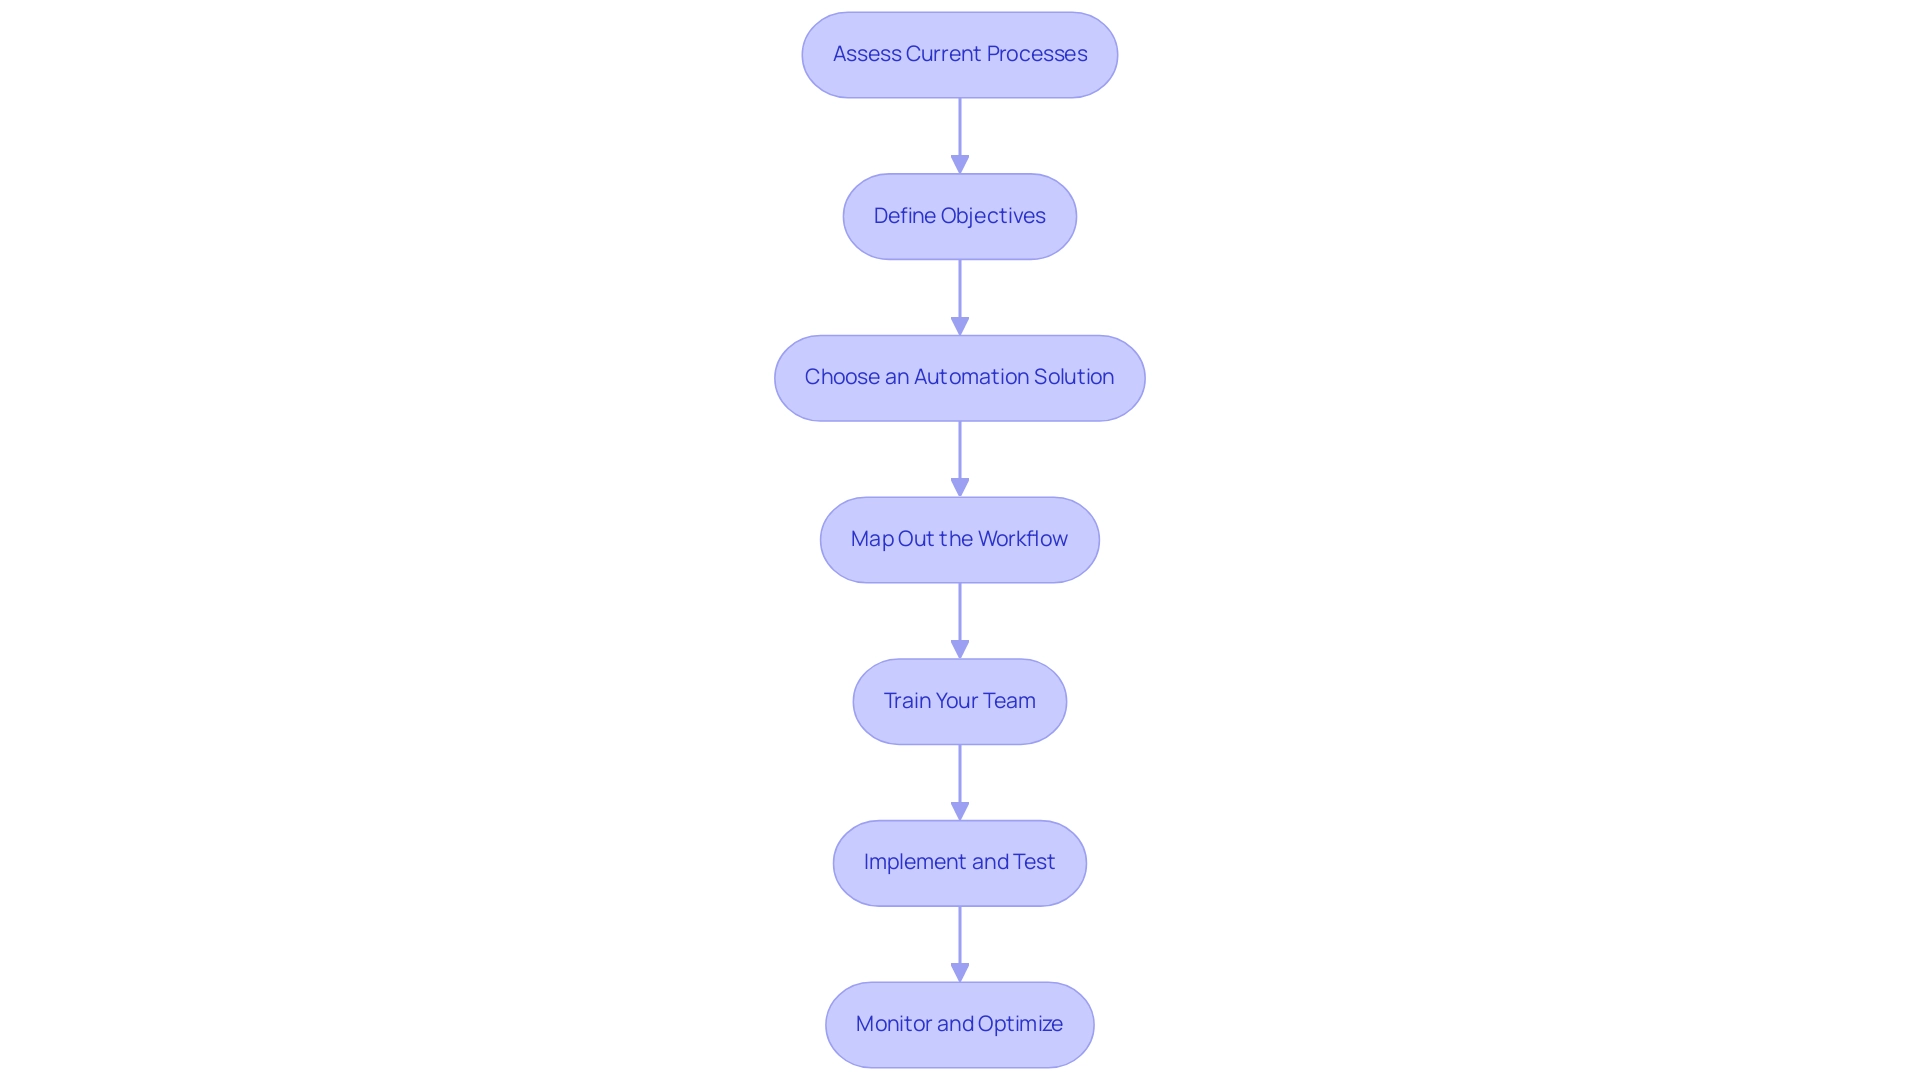
Essential Tools and Technologies for Invoice Automation
To effectively automate billing management in healthcare and financial sectors, organizations should leverage a range of advanced tools and technologies that enhance efficiency and accuracy while fostering collaboration to address conflicting account plans:
- Optical Character Recognition (OCR): This transformative technology efficiently captures and extracts data from paper bills, converting them into a digital format that streamlines processing and minimizes manual entry errors.
- Robotic Process Automation (RPA) technologies excel in automating invoice processing as well as other repetitive tasks such as data entry, bill validation, and routing approvals.
-
By automating invoice processing, companies can free up valuable human resources for more strategic initiatives, ultimately enhancing productivity in a rapidly evolving AI landscape.
-
Billing Management Software: Comprehensive solutions like Coupa and SAP Concur provide platforms that handle the complete billing lifecycle, from receipt to payment, ensuring seamless integration and oversight.
- This enables entities to maintain effective communication and collaboration throughout the process.
- Artificial Intelligence (AI) significantly enhances data validation processes and anomaly detection, which is crucial for automating invoice processing and reducing the risk of errors.
-
Tailored AI solutions provide insights that support informed decision-making, driving growth and innovation.
-
Business Intelligence (BI): In today’s data-rich environment, leveraging BI is crucial for transforming raw data into actionable insights.
-
This capability allows entities to make informed decisions that enhance operational efficiency and competitive advantage.
-
Cloud Storage Solutions: Utilizing cloud-based systems guarantees secure storage and easy accessibility of billing data, facilitating collaboration and ensuring that critical information is always within reach.
However, entities must also consider the high implementation costs associated with these technologies, which can be a significant barrier for small and medium-sized enterprises in the billing and invoicing software market. To handle unforeseen costs, businesses can implement strategies like performing comprehensive cost-benefit evaluations, seeking scalable options, and negotiating with suppliers to improve their billing management efforts.
Choosing the best mix of these tools is crucial for a successful project, allowing entities to streamline operations, lower expenses, and boost overall efficiency while ensuring effective communication and collaboration.
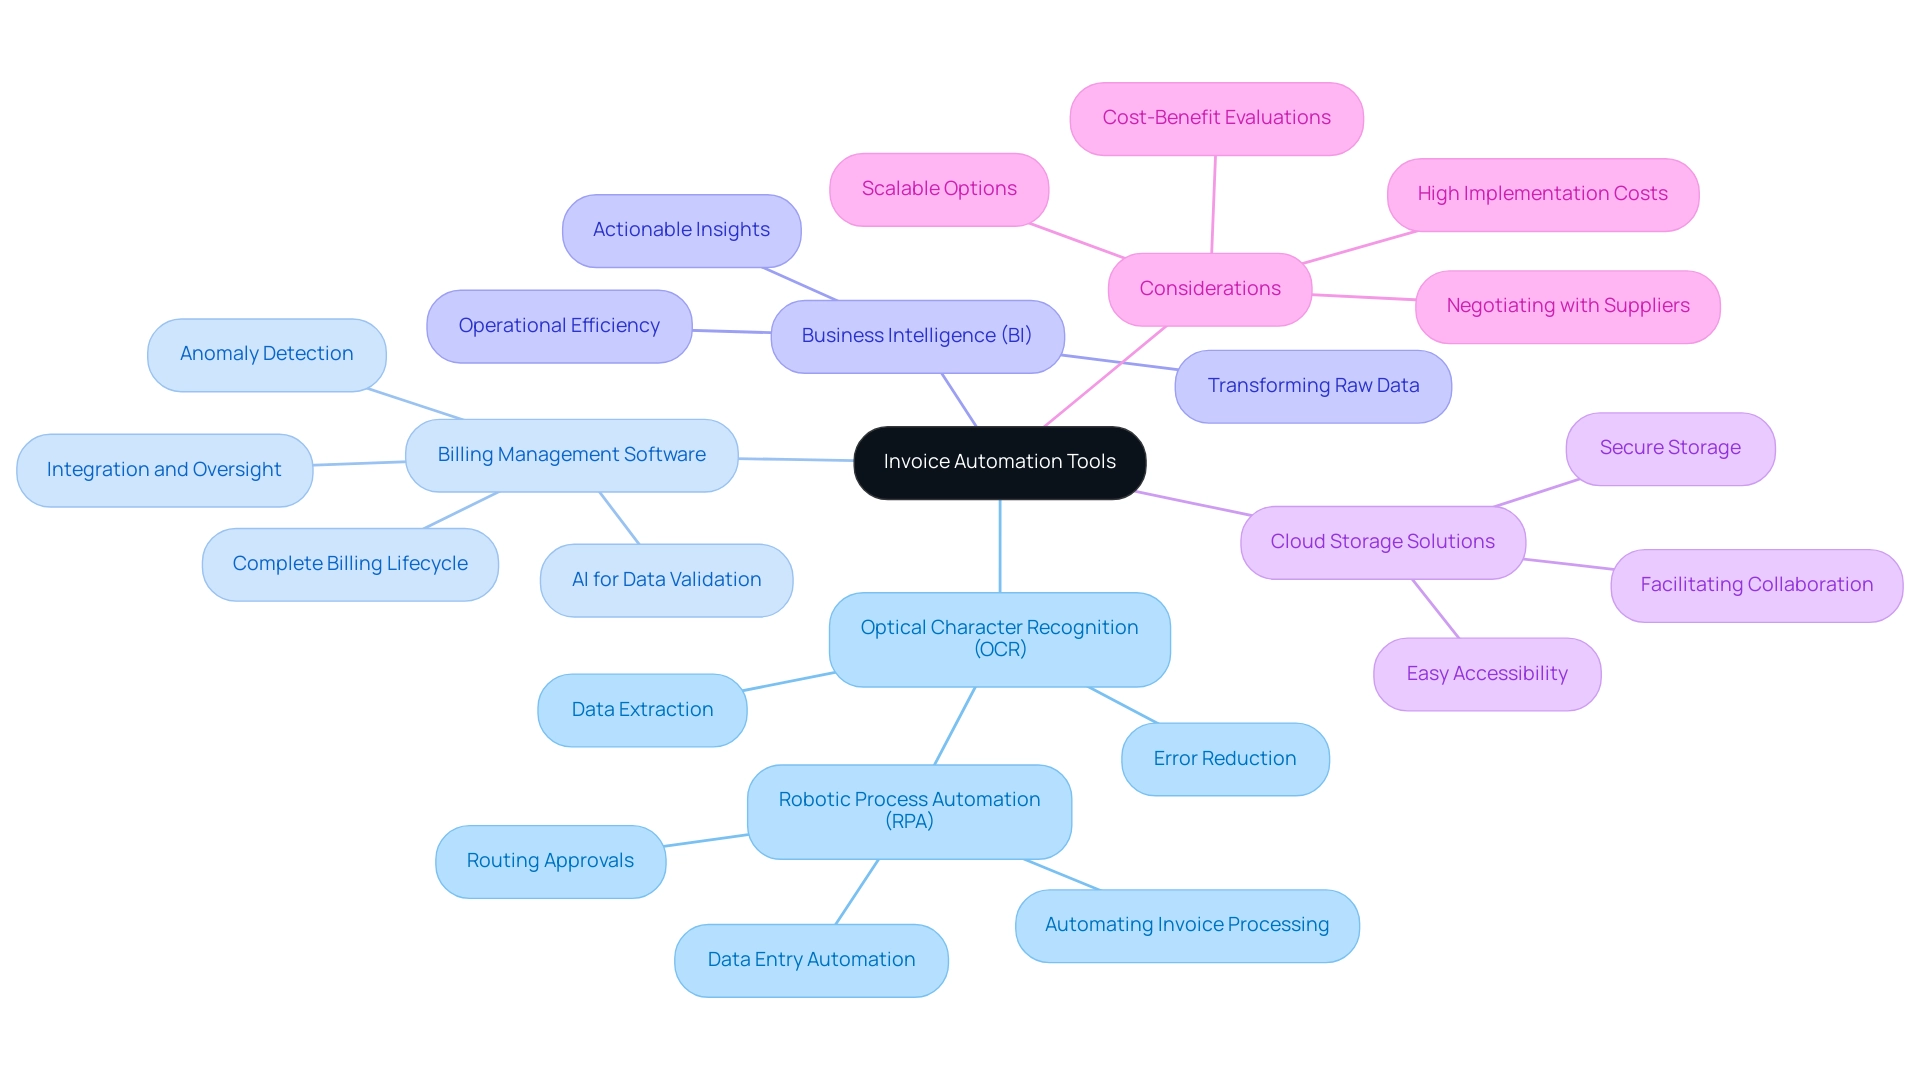
Overcoming Challenges in Automated Invoice Processing
Implementing automating invoice processing can yield significant operational benefits, yet organizations often face several key challenges.
-
Resistance to Change: Employee resistance in adopting new technologies is a common barrier. To effectively counter this, involve team members in the mechanization process from the outset and provide robust training programs to enhance their comfort with the new systems.
Engaging employees helps foster a sense of ownership and reduces resistance. -
Integration Issues: Achieving seamless incorporation of automated solutions with existing systems can be intricate. Similar to the experience of a mid-sized healthcare company that faced manual data entry errors and slow software testing, organizations should prioritize thorough testing prior to deployment and actively seek support from vendors.
This proactive approach minimizes disruptions and ensures a smoother transition. -
Data Quality Concerns: Automation is only as effective as the data it processes. Inaccurate or incomplete data can significantly hinder efforts to automate.
Therefore, it is essential to invest in data cleansing and validation processes before implementation to ensure high-quality inputs for automated systems, as observed in successful implementations that led to a 70% reduction in data entry errors. -
Cost Considerations: Initial setup costs can pose a barrier to adoption. To tackle this, organizations should perform a thorough ROI analysis that clearly illustrates the long-term savings and efficiency improvements linked to automated processes.
For instance, the mid-sized company achieved ROI within 6 months after implementing GUI mechanization, providing a compelling case for stakeholders.
The relevance of mechanization in operational processes is underscored by the forecasted growth of the cloud mechanization market by $103.9 billion, emphasizing the increasing importance of adopting automated solutions. Moreover, the Industrial Automation Services Market is anticipated to grow from $147.06 billion in 2019 to $264.69 billion by 2026, emphasizing wider trends that influence billing management. Furthermore, the anticipated rise of the automated farming equipment market to $23.06 billion by 2028 illustrates the growing demand for automation across various sectors, reinforcing the need for organizations in finance and healthcare to embrace solutions like automating invoice processing.
By anticipating these challenges and implementing targeted strategies to address them, including conducting a thorough ROI analysis, organizations can significantly enhance their likelihood of a successful automation initiative, thus improving overall operational efficiency.
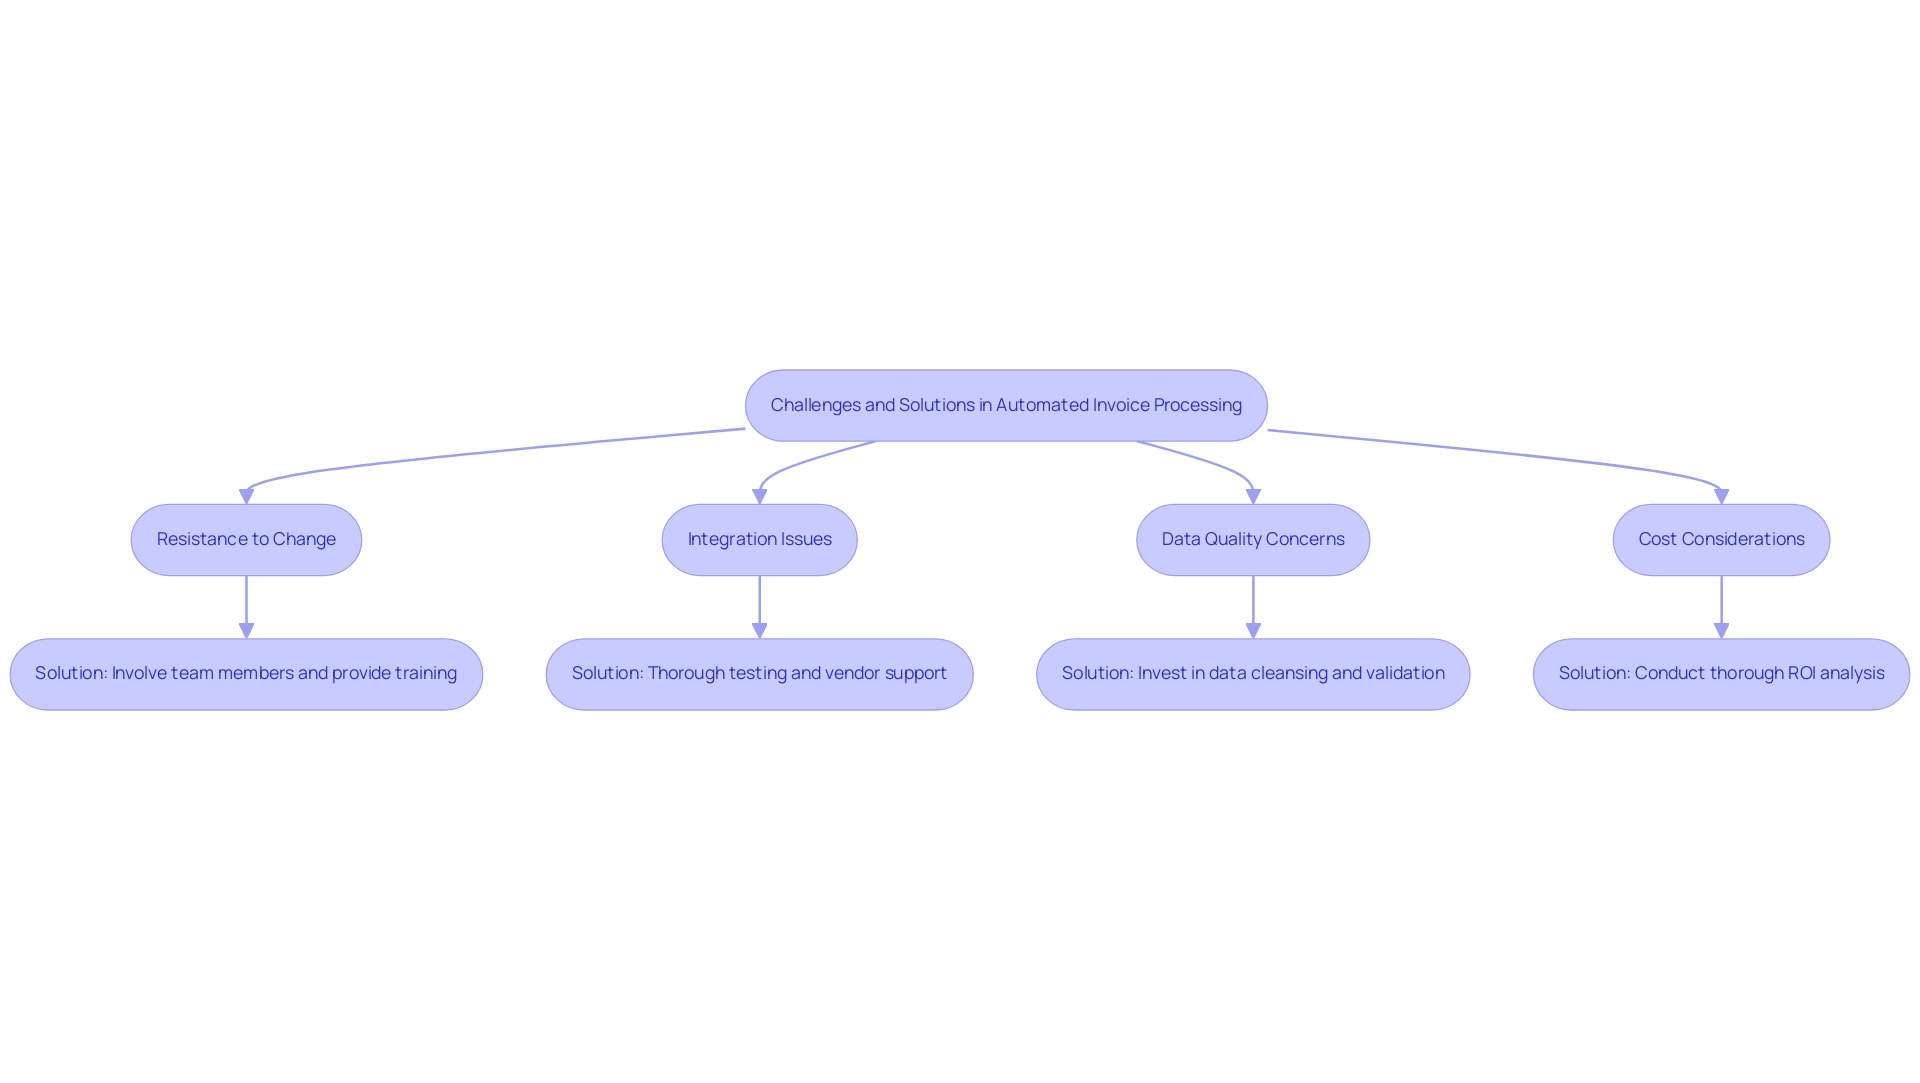
Conclusion
Embracing automated invoice processing is not simply a trend; it represents a critical evolution for organizations striving for operational excellence in a fast-paced digital environment. The article outlines how leveraging technologies like RPA and AI can significantly enhance efficiency, accuracy, and cost-effectiveness in invoice management. By automating key processes, organizations can reduce manual errors, accelerate workflows, and ultimately improve cash flow management, all while fostering better compliance and audit trails.
Implementing such automation requires a clear strategy, beginning with an assessment of current processes and setting measurable objectives. The step-by-step guide provided highlights the importance of choosing the right tools, training teams, and continuously monitoring performance to ensure that the transition is smooth and effective. Overcoming challenges like resistance to change and integration issues is essential, as these barriers can hinder the potential benefits of automation.
In conclusion, the shift towards automated invoice processing is imperative for organizations looking to thrive in an increasingly competitive landscape. By addressing common misconceptions and embracing the necessary tools and strategies, businesses can unlock substantial operational improvements. As the future unfolds, those who prioritize automation will position themselves for success, enhancing not only their efficiency but also their ability to adapt to evolving market demands. The time to act is now; automation is not just advantageous but essential for sustainable growth and efficiency in the years to come.
Introduction
In the rapidly evolving landscape of automation, understanding the nuances of the Gartner Magic Quadrant is essential for organizations seeking to enhance their operational efficiency. This framework not only provides a visual representation of market dynamics but also categorizes vendors into distinct groups, offering a strategic lens through which to evaluate potential partners in Robotic Process Automation (RPA) and Business Intelligence.
As organizations navigate the complexities of selecting the right RPA solutions, insights from recent reports and case studies reveal the transformative potential of automation, demonstrating significant improvements in workflow efficiency and error reduction.
By leveraging these insights, stakeholders can make informed decisions that align with their unique operational challenges and long-term goals, ultimately driving productivity and innovation in their organizations.
Understanding the Gartner Magic Quadrant: An Overview
The RPA Magic Quadrant 2023 serves as a pivotal research methodology that offers a visual representation of a market’s trajectory, maturity, and key players. It systematically evaluates vendors based on their execution capabilities and the completeness of their vision, categorizing them into four distinct groups: Leaders, Challengers, Visionaries, and Niche Players. This structured method enables companies to efficiently determine which vendors correspond best with their unique challenges and business objectives, especially in the context of the RPA Magic Quadrant 2023 and Business Intelligence.
As Kim Manis, Vice President of Product Management, emphasizes,
The last year has been a truly exciting period of innovation with hundreds of features and enhancements that assist us in more effectively empowering every individual and team who wishes to derive greater value from their data.
The most recent update of the Warehouse Management Systems Magic Quadrant, published on 5/2/24, further highlights the changing nature of the market and the significance of utilizing current insights for efficiency. Moreover, the case study titled ‘Streamlining Operations with GUI Automation’ illustrates how a mid-sized company faced challenges such as manual data entry errors and slow software testing, ultimately achieving a 70% reduction in errors and an 80% improvement in workflow efficiency through RPA.
By engaging with the insights provided through the RPA Magic Quadrant 2023, stakeholders can make informed decisions regarding RPA vendors, ensuring that their selections are strategic and beneficial to their operations. It is also important to note that by clicking ‘Submit’, users agree to Gartner’s Terms of Use and Privacy Policy, an essential consideration for those engaging with the Magic Quadrant. Staying updated with the latest trends and insights, such as those indicated in the forthcoming Critical Capabilities for Warehouse Management Systems report scheduled for 7/27/23, enhances the decision-making process further.
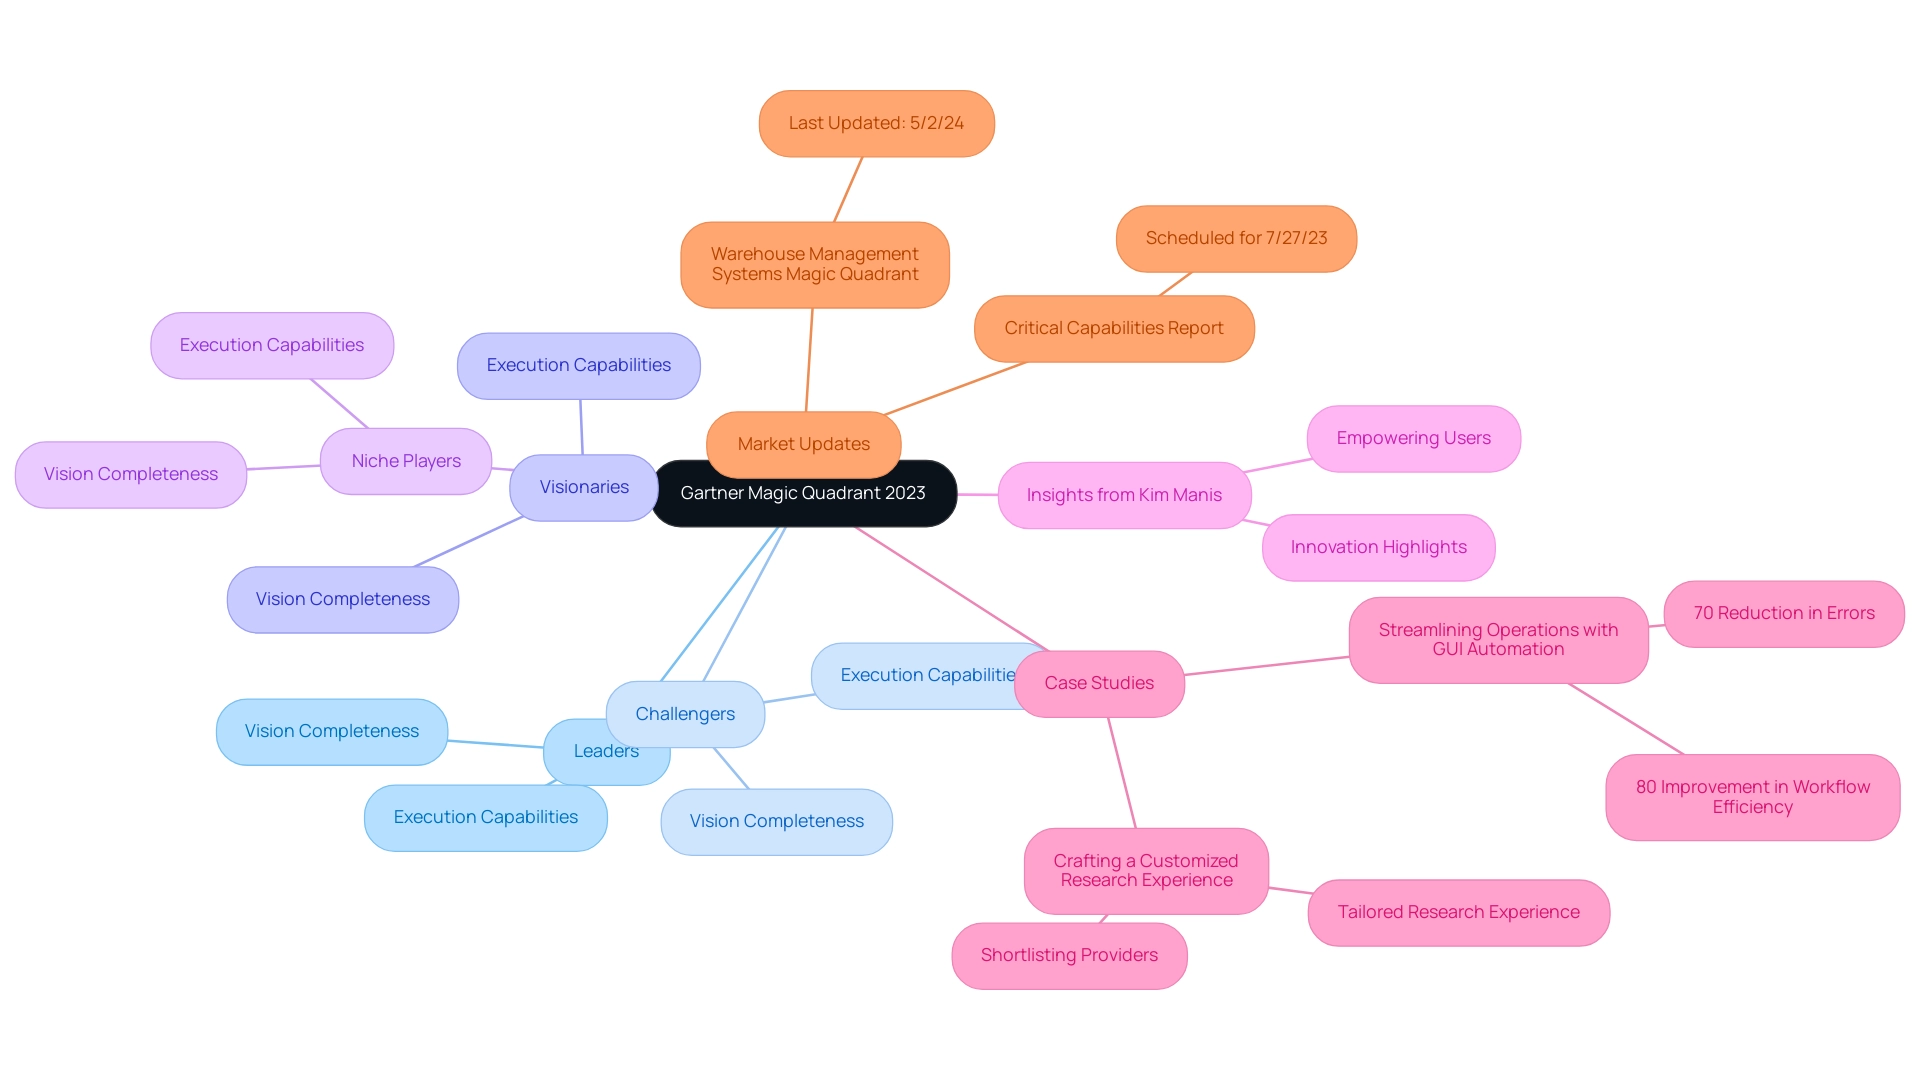
Key Insights from the 2023 RPA Magic Quadrant: Leaders and Challengers
The RPA Magic Quadrant 2023 highlights established leaders recognized for their comprehensive capabilities and proven execution in the field of Robotic Process Automation (RPA). These vendors, including UiPath and Automation Anywhere, provide robust frameworks and extensive support systems, making them ideal partners for entities seeking to automate manual workflows and enhance operational efficiency while reducing costs and increasing productivity. UiPath holds a market share of 30%, while Automation Anywhere closely trails with 25%, due to their impressive feature sets that attract businesses seeking dependable services.
Moreover, RPA can significantly reduce errors by automating repetitive tasks, allowing teams to focus on more strategic, value-adding work. Additionally, challengers like Cyclone Robotics, although not as feature-rich, are proving their worth through remarkable innovation and experimentation. Cyclone Robotics’ ascent from a Niche Player to the only Challenger in the RPA Magic Quadrant 2023 underscores its adaptability and competitive edge.
This rapid evolution enables them to offer customized solutions at potentially reduced costs, presenting unique benefits for entities with specific needs. As Kevin Kimes, Senior Analyst Relations Manager at UiPath, aptly notes, ‘They also demonstrate an incredible ability to innovate and experiment,’ which speaks to the potential value these challengers can offer. Gartner emphasizes that challengers possess this innovative capacity, reinforcing the importance of considering their offerings.
Grasping these dynamics is crucial for entities to choose partners who not only satisfy immediate automation needs but also correspond with long-term strategic goals, ultimately utilizing RPA and Business Intelligence to foster data-driven insights, excellence in operations, and increased productivity.
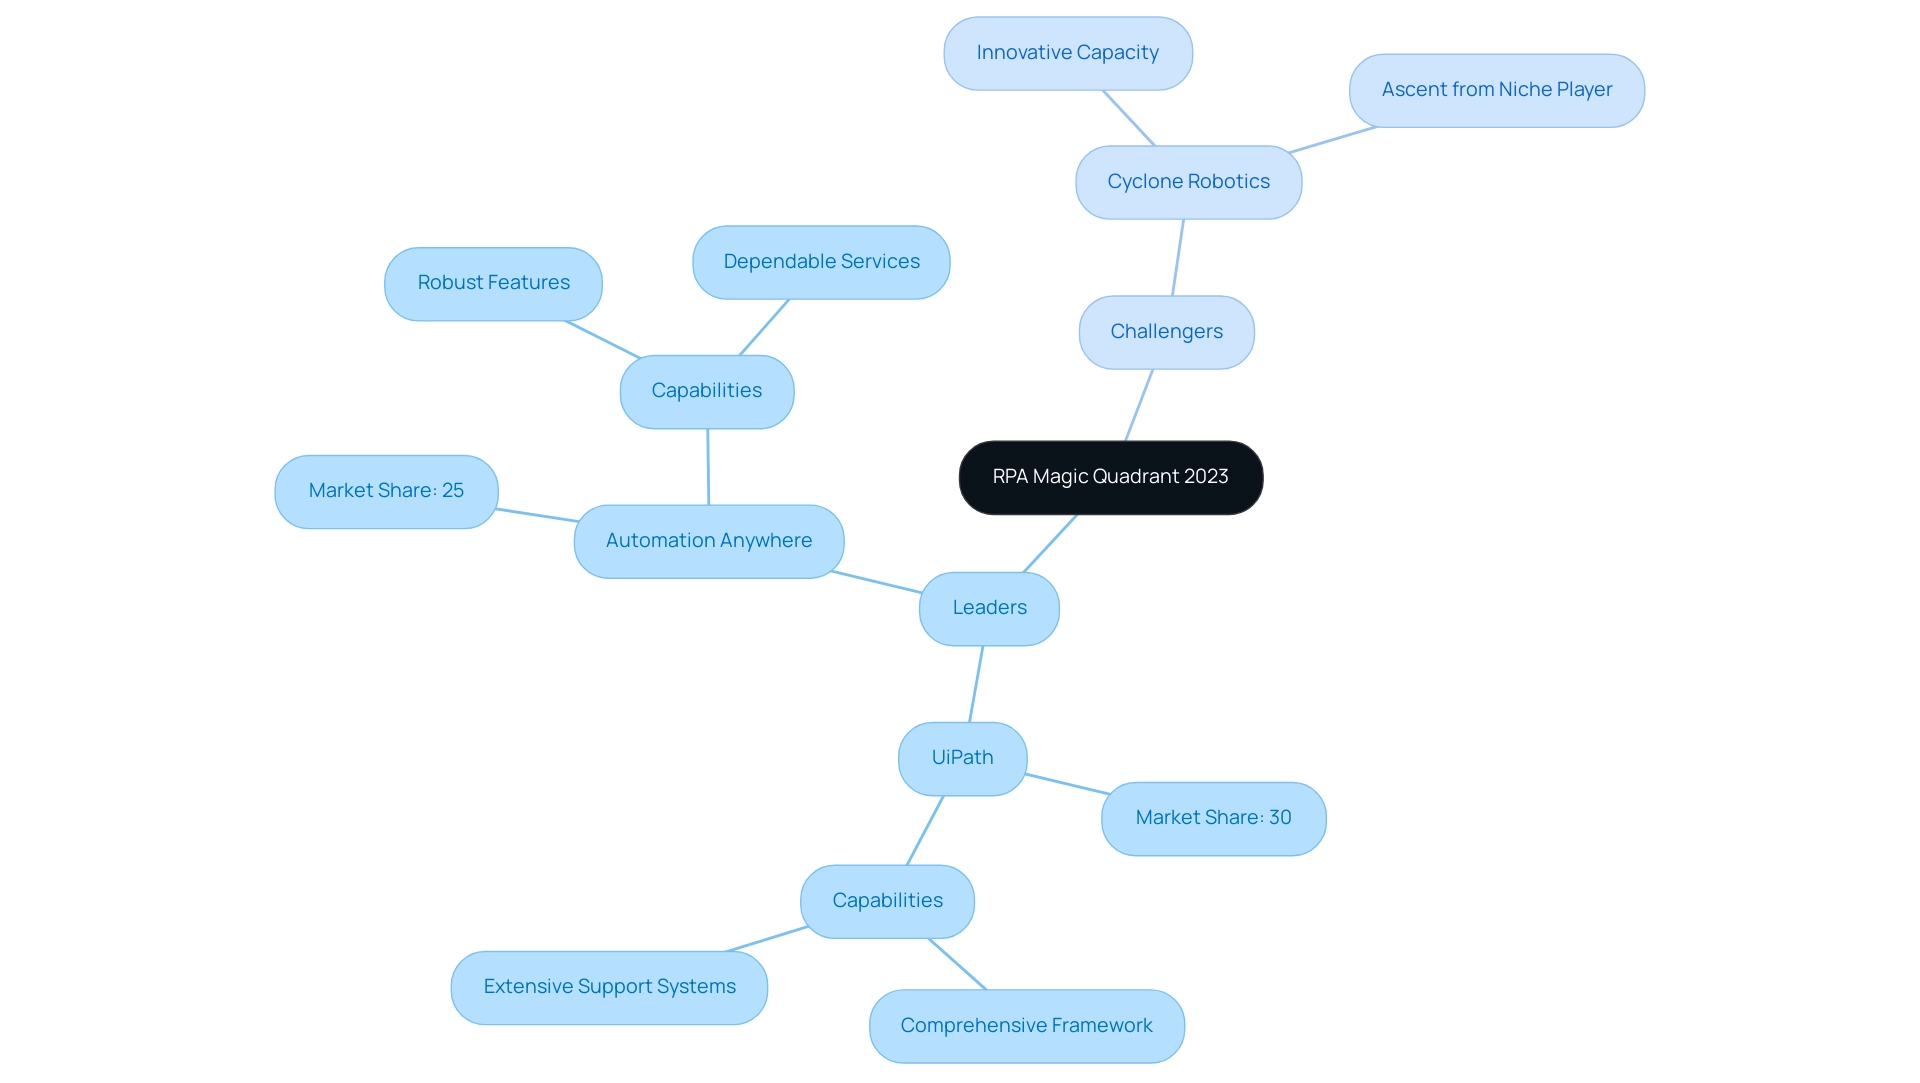
Analyzing the Visionaries and Niche Players in the 2023 RPA Magic Quadrant
The RPA Magic Quadrant 2023 categorizes Visionaries as vendors that demonstrate exceptional innovation and unique solutions, although they may have some limitations in scalability or proven track records compared to industry leaders. For example, EMMA RPA offers revolutionary capabilities aimed at improving efficiency and employee morale, addressing common challenges like staffing shortages and outdated systems. Similarly, Microsoft Power Automate enables businesses to transform their operations, showcasing how Visionary vendors can effectively meet specific operational challenges.
A notable insight from Gartner predicts that by 2025, 90% of RPA vendors will incorporate generative-AI automation, highlighting the innovative trajectory within the industry. In contrast, Niche Players often focus on specific industries, such as healthcare or finance, providing tailored solutions that respond directly to the unique demands of these sectors. As companies explore their RPA options, it’s crucial to thoroughly evaluate these vendors, particularly given the RPA Magic Quadrant 2023 report indicating minimal shifts, where most Leaders maintained their positions while Cyclone Robotics advanced to Challenger status.
This competitive landscape underscores the importance of assessing innovative features that align closely with operational challenges, ultimately driving enhanced productivity and operational efficiency. To further explore how these solutions can benefit your company, book a free consultation today. Additionally, consider the visual representation of RPA integration in the workplace, as illustrated by a human collaborating with robotic figures, emphasizing the synergy between technology and human effort.
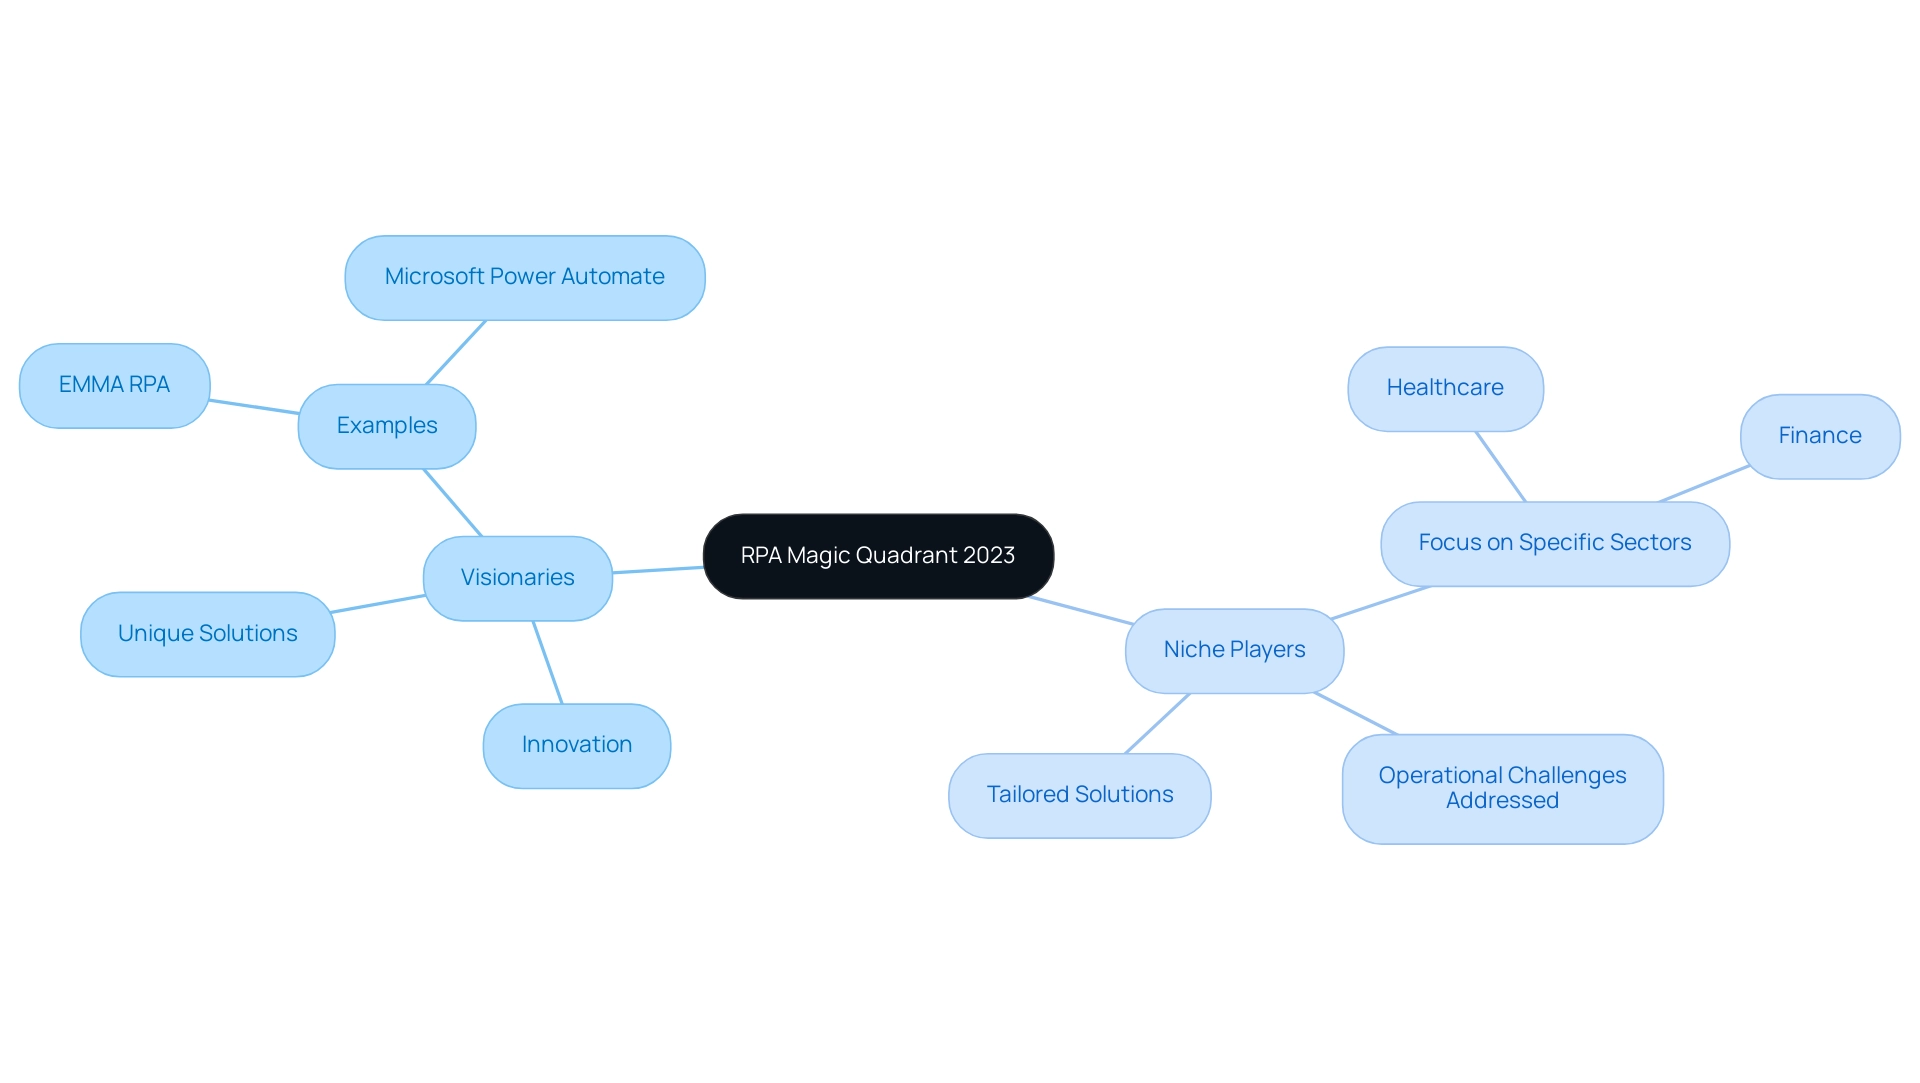
Evaluating Vendor Capabilities: Key Features to Consider
When choosing RPA providers, it’s vital to assess several key characteristics that can greatly impact the success of these initiatives as outlined in the RPA Magic Quadrant 2023. First and foremost, ease of use is critical; a user-friendly interface fosters quick adoption among team members, reducing the learning curve associated with new technology. Additionally, robust integration capabilities with existing systems are paramount, ensuring that the RPA solution can seamlessly connect with your enterprise’s current technology stack.
This adaptability is especially crucial as organizations frequently encounter challenges arising from outdated systems that impede productivity and innovation, with over 90% of C-level executives believing their organizations handle change efficiently.
Scalability is another essential factor, particularly for organizations expecting growth or heightened technological requirements. A scalable RPA solution enables businesses to grow their initiatives without the hassle of changing vendors, ensuring continuity and efficiency in operations while addressing staffing shortages. Furthermore, strong support services can play a pivotal role in the success of RPA implementation, providing essential training and assistance during the transition period to combat the exhaustion and morale issues associated with repetitive tasks.
In 2023, the development of low-code RPA platforms is democratizing process management, allowing non-technical business users to design workflow processes with minimal coding skills. This trend towards accessibility in technological advancements is crucial for entities seeking to enhance productivity through tailored AI solutions and Business Intelligence. Notably, this shift is expected to contribute to the 61% of RPA users who reported successful cost reductions, emphasizing the importance of selecting the right vendor to achieve cost efficiency.
Moreover, RPA’s capability to handle up to 90% of data entry tasks in clinical research underscores the effectiveness of these solutions in specific industries. As you explore the realm of RPA solutions, keeping in mind the RPA Magic Quadrant 2023 and essential characteristics such as the need to upgrade obsolete systems and tackle talent retention issues will enable your entity to leverage the full capabilities of technology, ultimately enhancing efficiency and reducing costs.
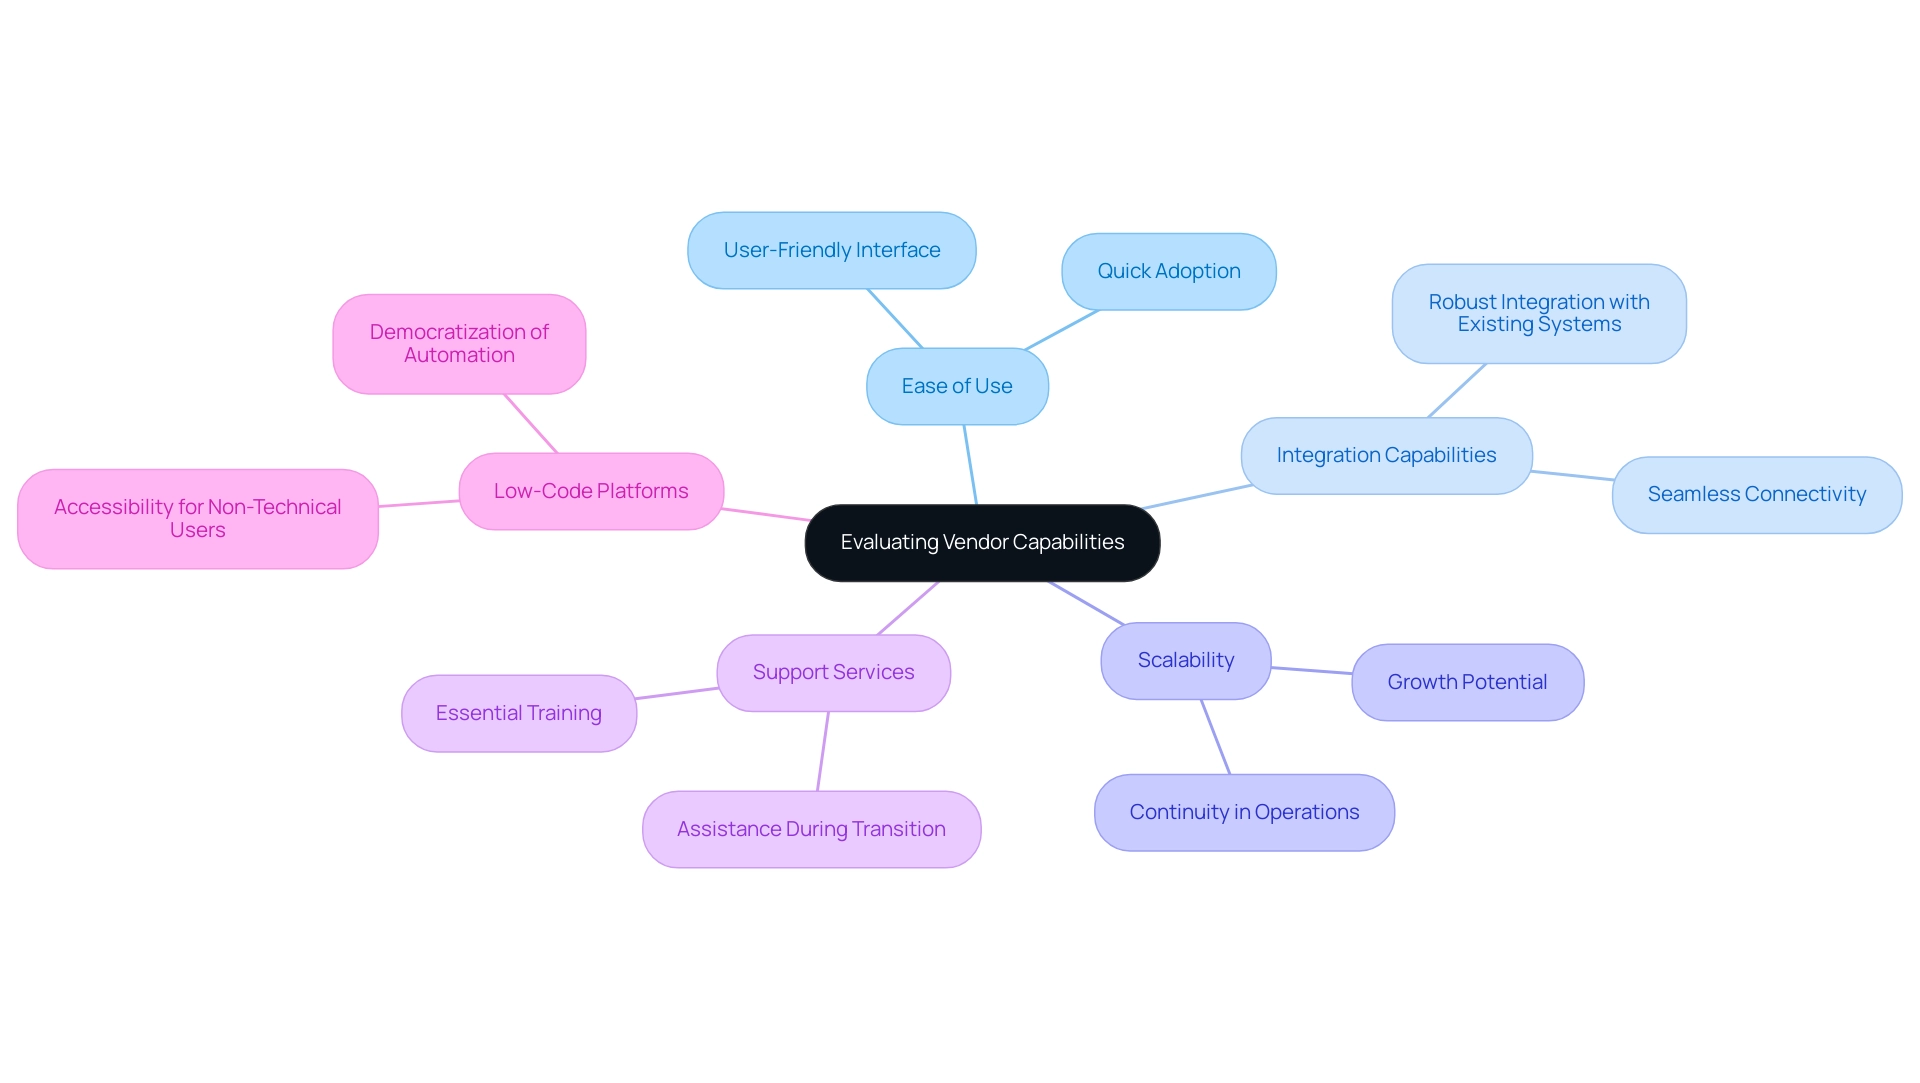
Implementation Best Practices for RPA Solutions
To drive successful RPA implementation, organizations must commence with a well-defined strategy that articulates specific goals and anticipated outcomes. Engaging stakeholders from various departments early in the process is crucial; doing so fosters a collection of diverse perspectives and secures essential buy-in. It’s vital to pinpoint processes ripe for automation—these are often repetitive, rule-based tasks that consume considerable time.
A recent study suggests that:
- 91% of employees believe that technology improves their work-life balance
- 89% noting heightened job satisfaction as a direct outcome
Moreover, mechanization enables workers to save an average of 3.6 hours per week, further reinforcing its value. Our promise is clear: you only pay if we deliver the promised process automation, effectively taking the ROI risk on your behalf because we are confident in our delivery.
Together, we will:
- Access a process of yours that you would like to automate
- Calculate the efforts it takes to automate that process
- Estimate the time savings you will see after the project
- Automate the process with the help of certified professionals on our side
To facilitate this transition, investing in employee training is imperative. Equipping team members with the knowledge to leverage new technologies ensures that RPA is viewed as a tool to augment their roles rather than a threat.
Lastly, establishing metrics to evaluate the RPA solution’s performance post-implementation allows entities to pursue continuous improvement and optimization. As Tajammul Pangarkar, CMO at Prudour Pvt Ltd, notes, successful RPA adoption hinges on strategic engagement with all stakeholders involved, reflecting their insights and concerns throughout the project lifecycle. With 53% of companies now implementing RPA and 78% of users anticipating further investment over the next three years, the time to act is now.
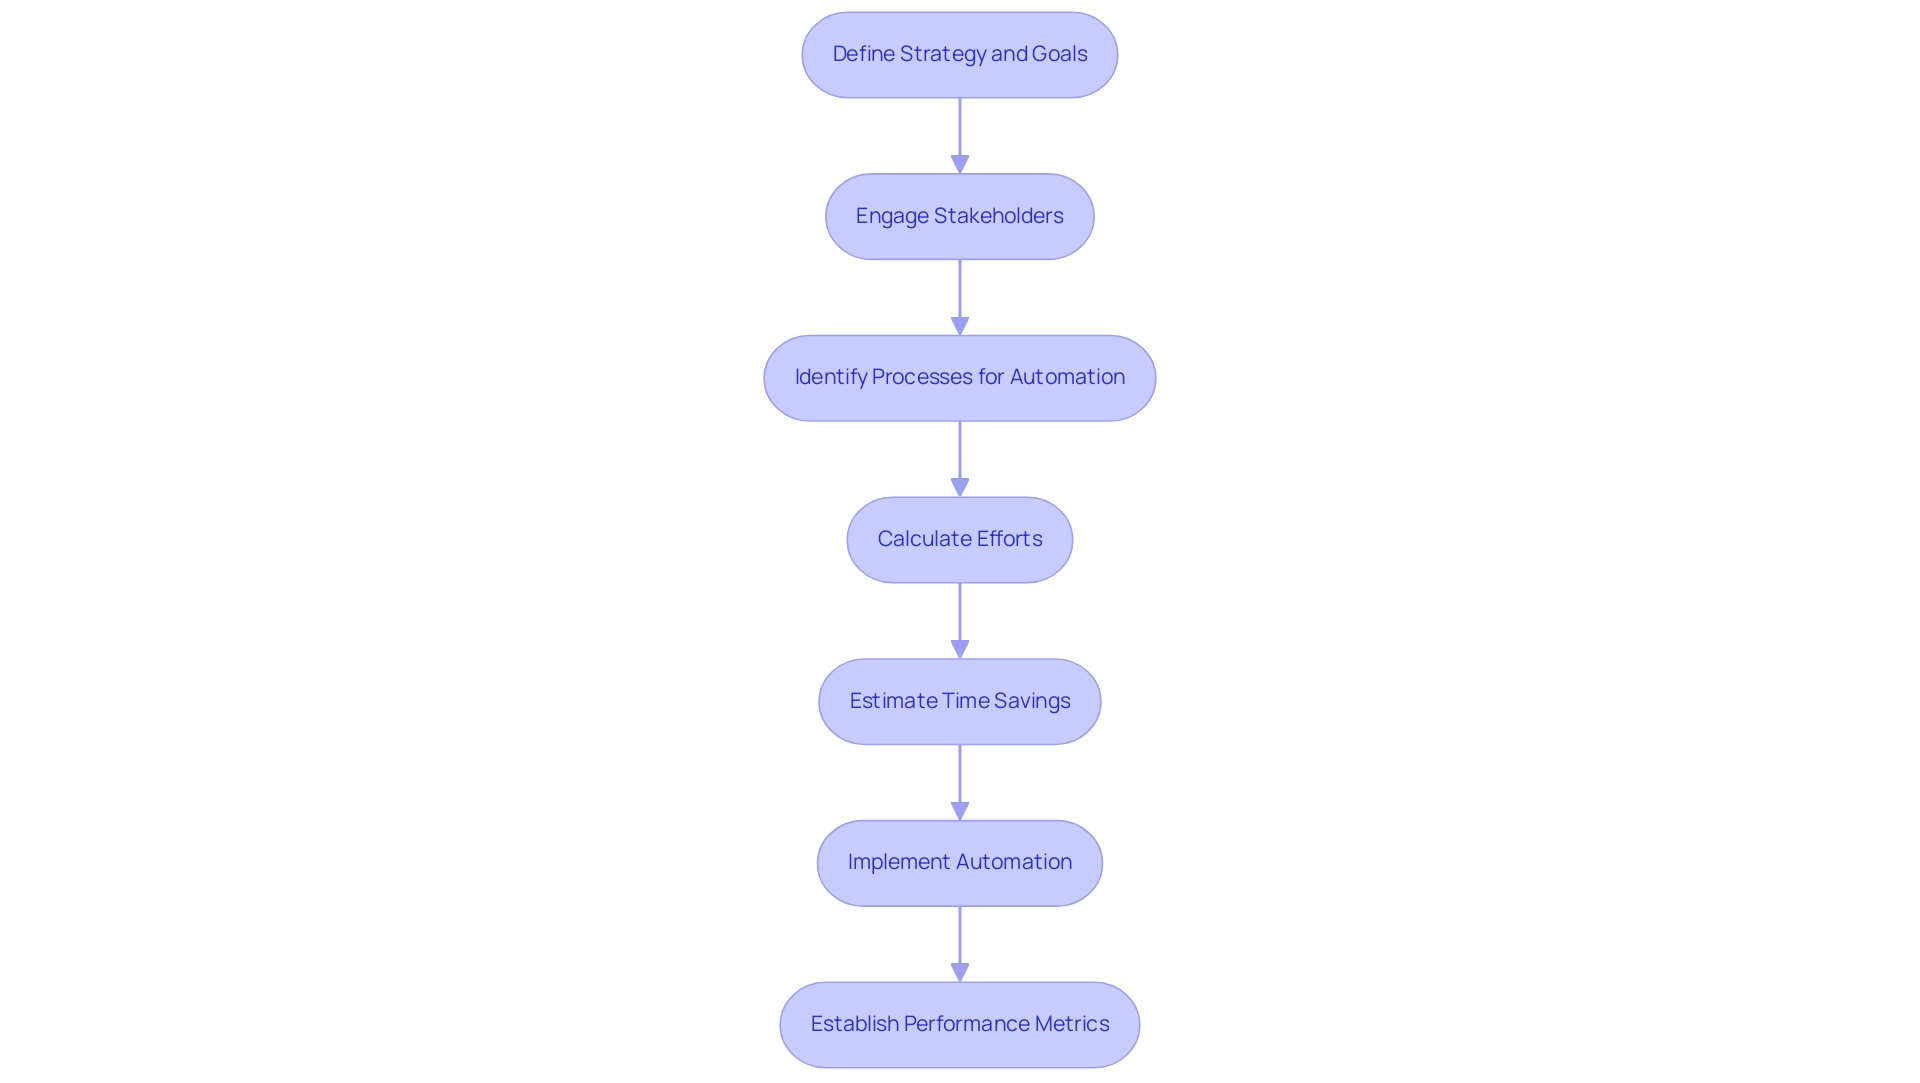
Measuring Success and ROI of RPA Implementations
To effectively assess the success of RPA implementations, organizations must establish clear key performance indicators (KPIs) such as time savings, cost reductions, and error rates both prior to and after the implementation. This is particularly vital in addressing common workplace challenges like:
- Repetitive tasks that drain employee morale
- Staffing shortages that hinder operational capacity
- Outdated systems that stifle innovation, leading to inefficiencies and increased operational costs
A relevant example arises from an Icelandic healthcare organization, which successfully lowered its overall yearly total cost expenses by over $75,000 through strategic mechanization.
Moreover, a client in the finance sector achieved an astonishing 300,000% ROI from a single RPA implementation, highlighting the potential returns that can be realized. To calculate the ROI, organizations should compare the costs associated with implementing RPA against the financial benefits derived from enhanced efficiency and productivity. Furthermore, evaluating the reliability of automated systems is essential; this can be achieved by comparing downtimes and disruptions before and after the implementation of these systems, illustrating how such processes lead to reduced errors and enhanced operational quality.
For instance, the mid-sized company that implemented GUI automation:
- Reduced data entry errors by 70%
- Accelerated testing processes by 50%
- Improved workflow efficiency by 80%
Tracking user satisfaction and engagement is essential to assess how well employees are adapting to the new automated processes. Regularly reviewing these metrics ensures that the RPA solutions are achieving their intended results.
As Bart Teodorczuk, RPA Tech Lead at Flobotics, emphasizes, ‘Our team, sourced only from the ‘Big Four’ of accounting, will analyze your processes and current RPA setup and recommend the metrics and KPIs to measure best suited for your business goals and needs.’ This proactive approach enables entities to make necessary adjustments to optimize performance continually. The success of RPA not only lies in deployment but also in ongoing measurement and adaptation.
Specific KPIs that organizations might consider include:
- Process cycle time
- First-pass yield
- Operational cost savings
This provides a comprehensive framework for evaluating RPA performance and enhancing operational efficiency.
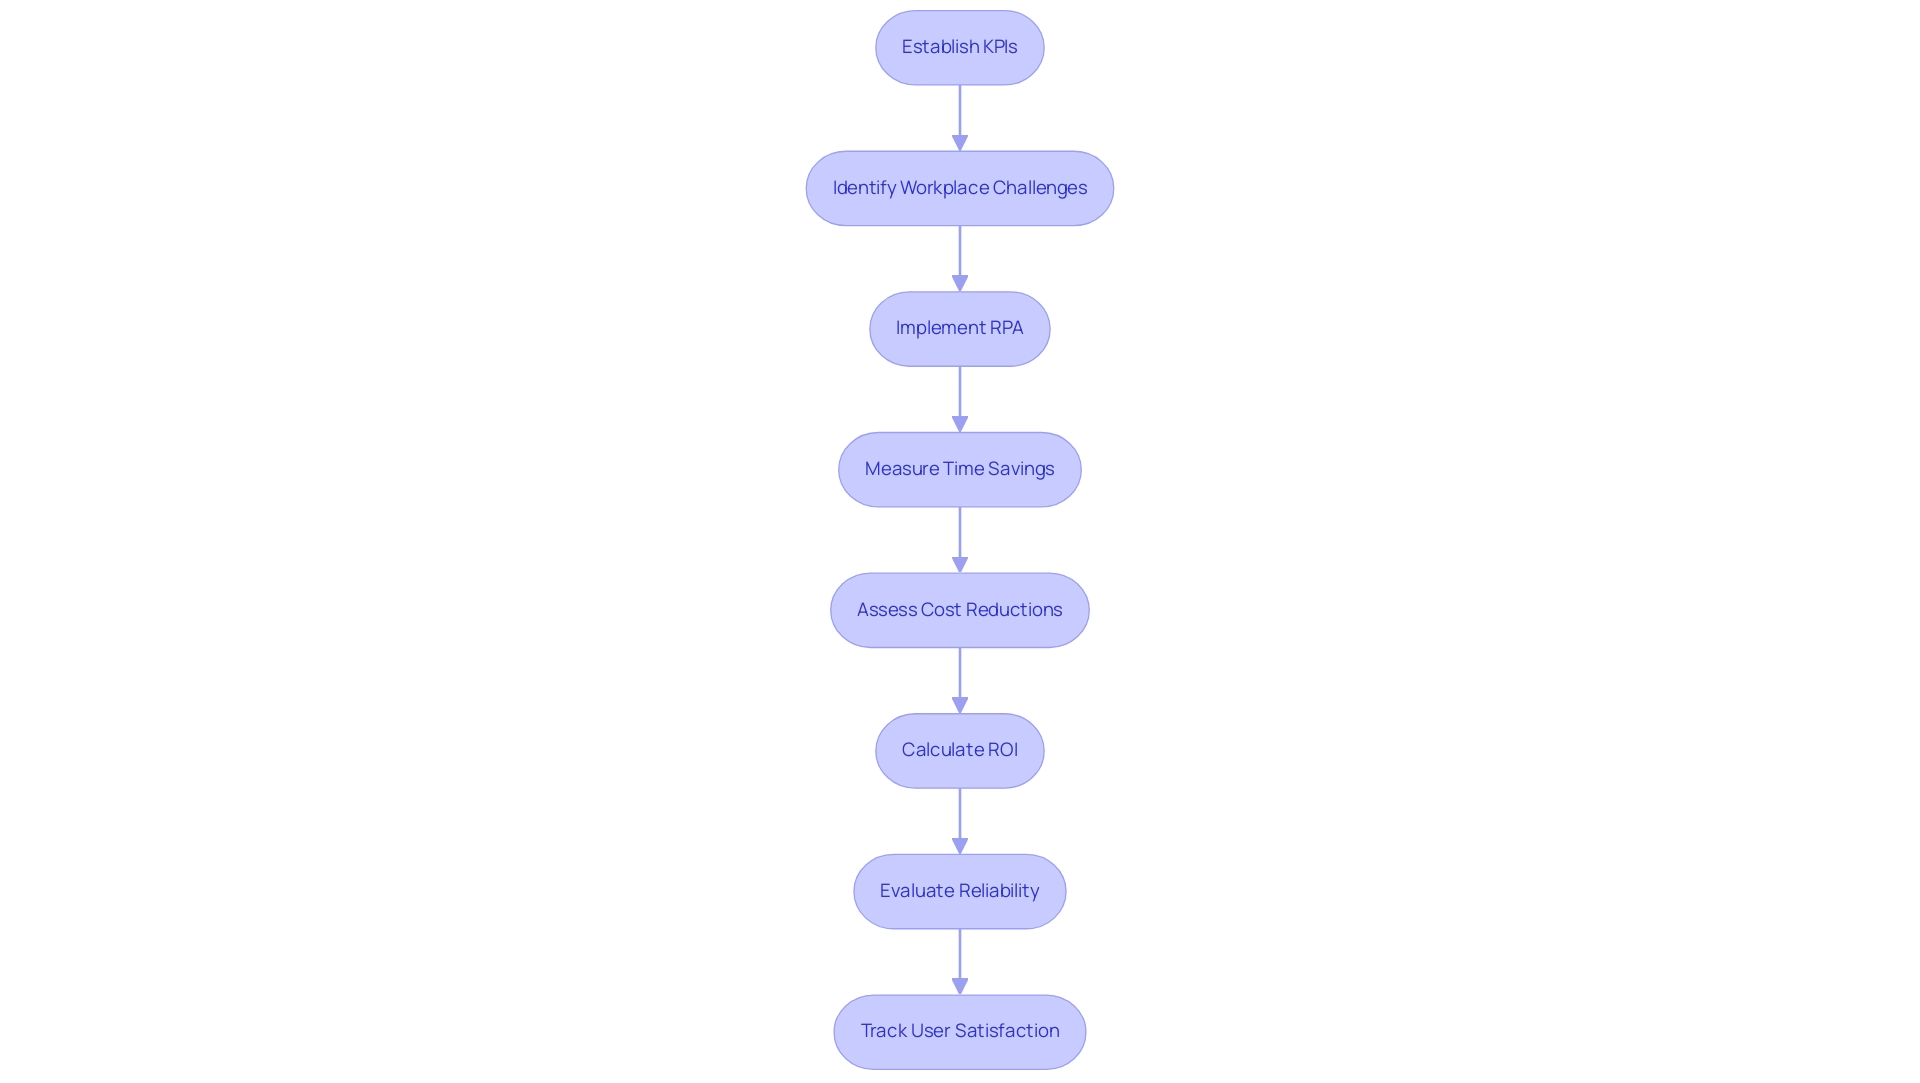
Conclusion
In the landscape of Robotic Process Automation (RPA) and Business Intelligence, leveraging the insights from the Gartner Magic Quadrant is crucial for organizations aiming to enhance operational efficiency. The framework categorizes vendors into Leaders, Challengers, Visionaries, and Niche Players, providing a strategic perspective to help organizations identify partners that align with their unique operational challenges and goals. The transformative potential of automation is evident in the case studies presented, showcasing significant improvements in workflow efficiency and error reduction.
As organizations evaluate RPA vendors, key features such as:
- Ease of use
- Robust integration capabilities
- Scalability
must be prioritized. These elements not only facilitate smooth implementation but also ensure that the chosen solutions can adapt to evolving needs. Furthermore, engaging stakeholders early in the implementation process and establishing clear performance metrics are essential practices that drive successful RPA adoption. By focusing on strategic engagement and continuous improvement, organizations can fully harness the benefits of automation, leading to enhanced productivity and significant cost savings.
Ultimately, the successful integration of RPA solutions can redefine operational landscapes, empowering employees to focus on strategic tasks while leaving repetitive processes to automation. With the right vendor partnerships and a commitment to ongoing evaluation, organizations are well-positioned to navigate the complexities of the automation journey, driving innovation and operational excellence in their respective fields. The time to act is now—embracing automation not only addresses immediate operational challenges but also paves the way for sustainable growth and enhanced competitiveness in the future.
