Overview
This article examines the implementation of the four levels of analytics—Descriptive, Diagnostic, Predictive, and Prescriptive—to significantly enhance operational efficiency within organizations. By systematically applying these levels, organizations can improve decision-making, identify inefficiencies, optimize resources, and drive continuous improvement.
Consider the successful case studies that demonstrate substantial operational gains achieved through data-driven insights and innovative tools.
Are you ready to transform your operations? Embrace these analytics levels to unlock your organization’s full potential.
Introduction
In the dynamic landscape of modern business, harnessing data effectively has become a cornerstone of operational success. The four levels of analytics—Descriptive, Diagnostic, Predictive, and Prescriptive—provide organizations with a structured approach to transforming raw data into actionable insights. Each level plays a critical role in enhancing operational efficiency, from summarizing historical performance to predicting future trends and guiding informed decision-making.
As organizations increasingly recognize the importance of data-driven strategies, understanding how to integrate these analytics levels into operational practices is essential for fostering growth and innovation. This article delves into the significance of each analytics level, outlines practical steps for implementation, and examines the transformative impact of leveraging advanced tools like Robotic Process Automation (RPA) in driving operational excellence.
Understanding the Four Levels of Analytics
The four levels of analytics—Descriptive, Diagnostic, Predictive, and Prescriptive—form a structured hierarchy, each serving a distinct role in enhancing operational efficiency:
-
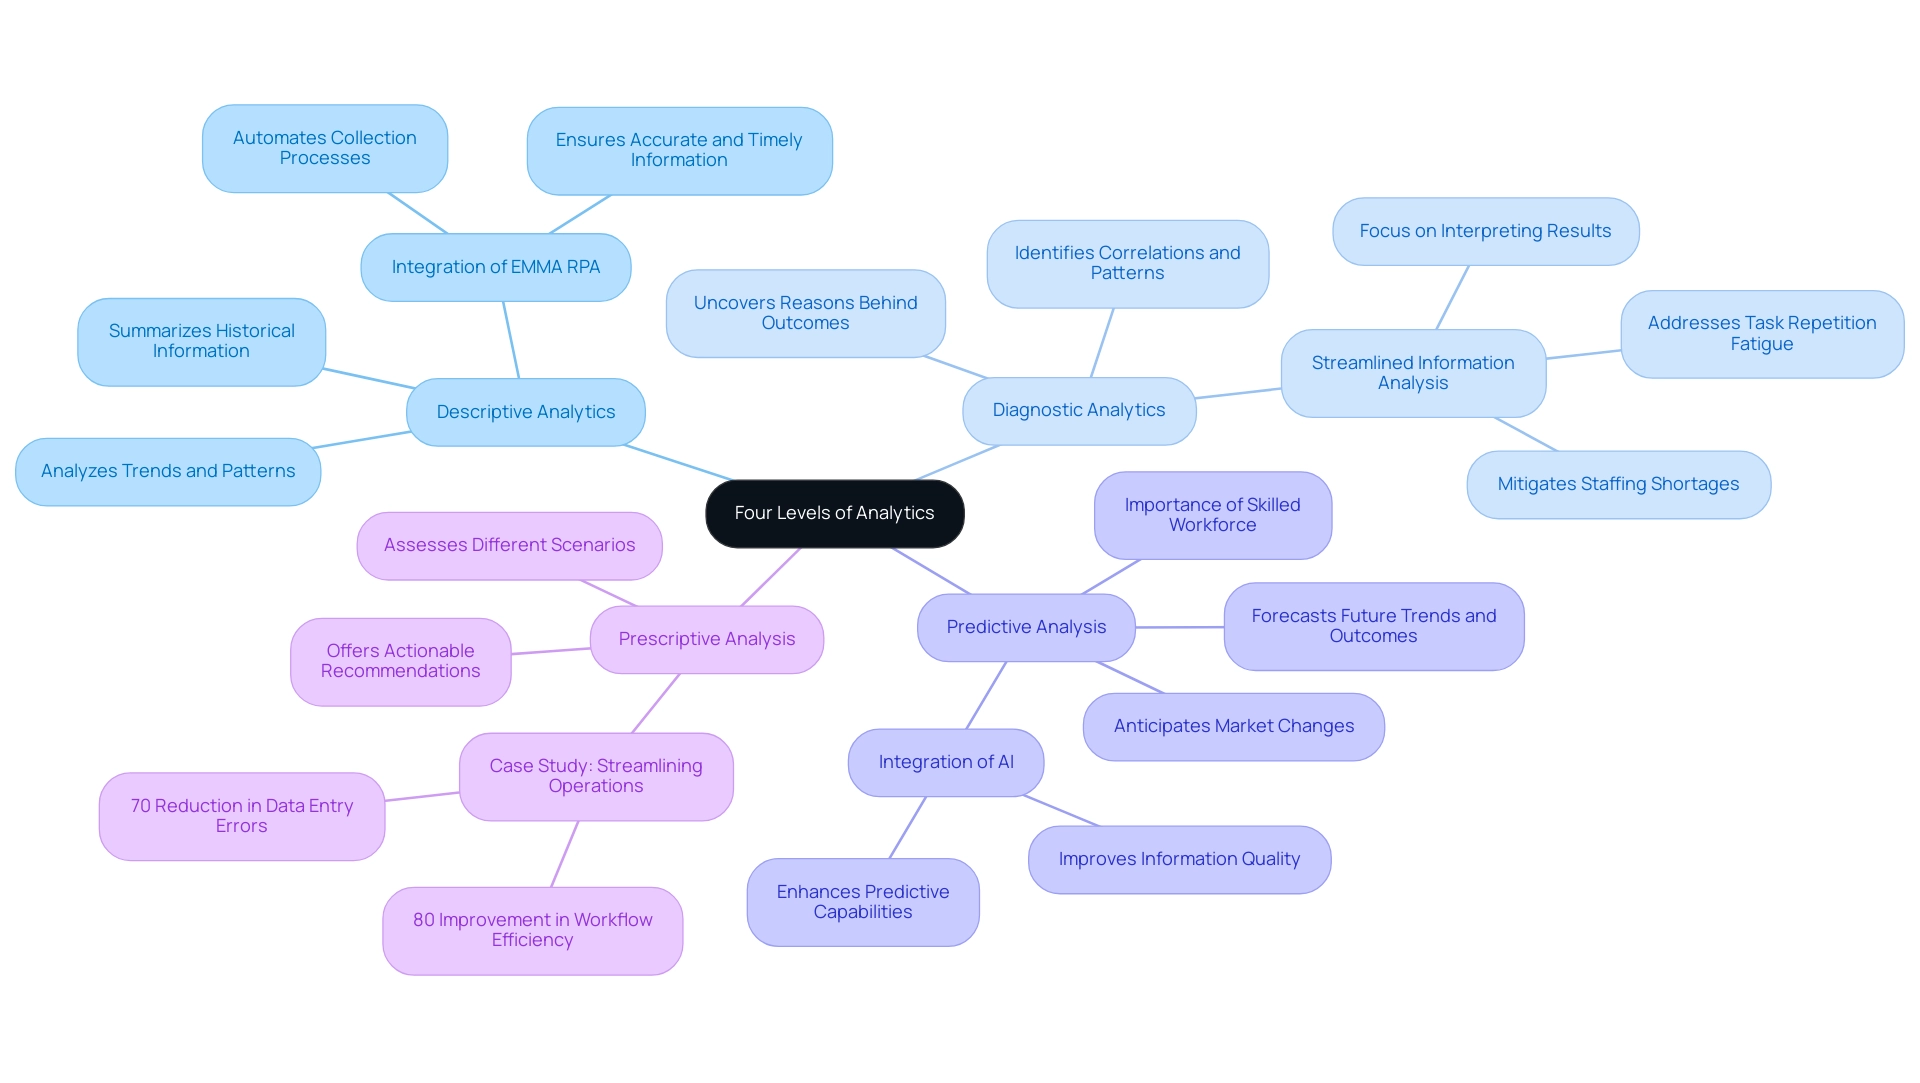
Descriptive Analytics: This foundational level summarizes historical information, providing insights into past performance. By analyzing trends and patterns, entities can gain a clearer understanding of what has transpired, which is crucial for informed decision-making. Integrating tools like EMMA RPA from Creatum GmbH can automate collection processes, ensuring that the information used for descriptive analytics is accurate and timely.
-
Diagnostic Analytics: Building on descriptive insights, this level delves deeper to uncover the reasons behind specific outcomes. It identifies correlations and patterns, enabling organizations to understand the factors that influenced past events. RPA solutions from Creatum GmbH can streamline information analysis, allowing teams to focus on interpreting results rather than collecting information. This level is essential for pinpointing areas for improvement and optimizing processes, particularly in addressing task repetition fatigue and staffing shortages.
-
Predictive Analysis: Utilizing historical data, predictive analysis forecasts future trends and outcomes. This level enables entities to anticipate changes in the market or operational environment, allowing for proactive adjustments. A workforce proficient in predictive analysis is vital, as it enhances the organization’s ability to navigate uncertainties effectively. The integration of AI, such as Small Language Models, can further enhance predictive capabilities by improving information quality and analysis efficiency.
-
Prescriptive Analysis: The most advanced level, prescriptive analysis, offers actionable recommendations based on comprehensive data evaluation. It assists entities in making informed choices by assessing different scenarios and their potential effects on key performance indicators. When incorporated with descriptive, diagnostic, and predictive analysis, prescriptive analysis significantly improves an organization’s analytical strategy. A notable case study titled “Streamlining Operations with GUI Automation” illustrates how a mid-sized company improved efficiency by automating data entry and software testing, achieving a 70% reduction in data entry errors and an 80% improvement in workflow efficiency.
Recent developments in analytics underscore the importance of the four levels of analytics in 2025. As entities increasingly depend on data-driven insights, aligning key performance indicators (KPIs) across departments becomes critical. Misalignment can undermine the efforts of data teams, as discussed in an upcoming co-written article on the importance of standardizing KPIs within organizations.
Real-world examples demonstrate the effectiveness of these data levels. For instance, a company utilizing prescriptive analysis was able to optimize its supply chain operations, resulting in a 15% reduction in costs while improving delivery times. Such case studies illustrate how utilizing the complete range of data analysis, alongside innovative tools like EMMA RPA and Microsoft Power Automate from Creatum GmbH, can result in significant operational enhancements.
In summary, the four levels of analytics are not simply instruments for examination; they are crucial elements of a structured method for comprehending and improving business processes. As Dylan aptly stated, “Analytics isn’t just about creating dashboards or running reports. It’s about creating a systematic approach to understanding your business through information.” Embracing these analytics levels equips entities to drive growth and innovation in an increasingly data-rich environment.
The Importance of Analytics in Operational Efficiency
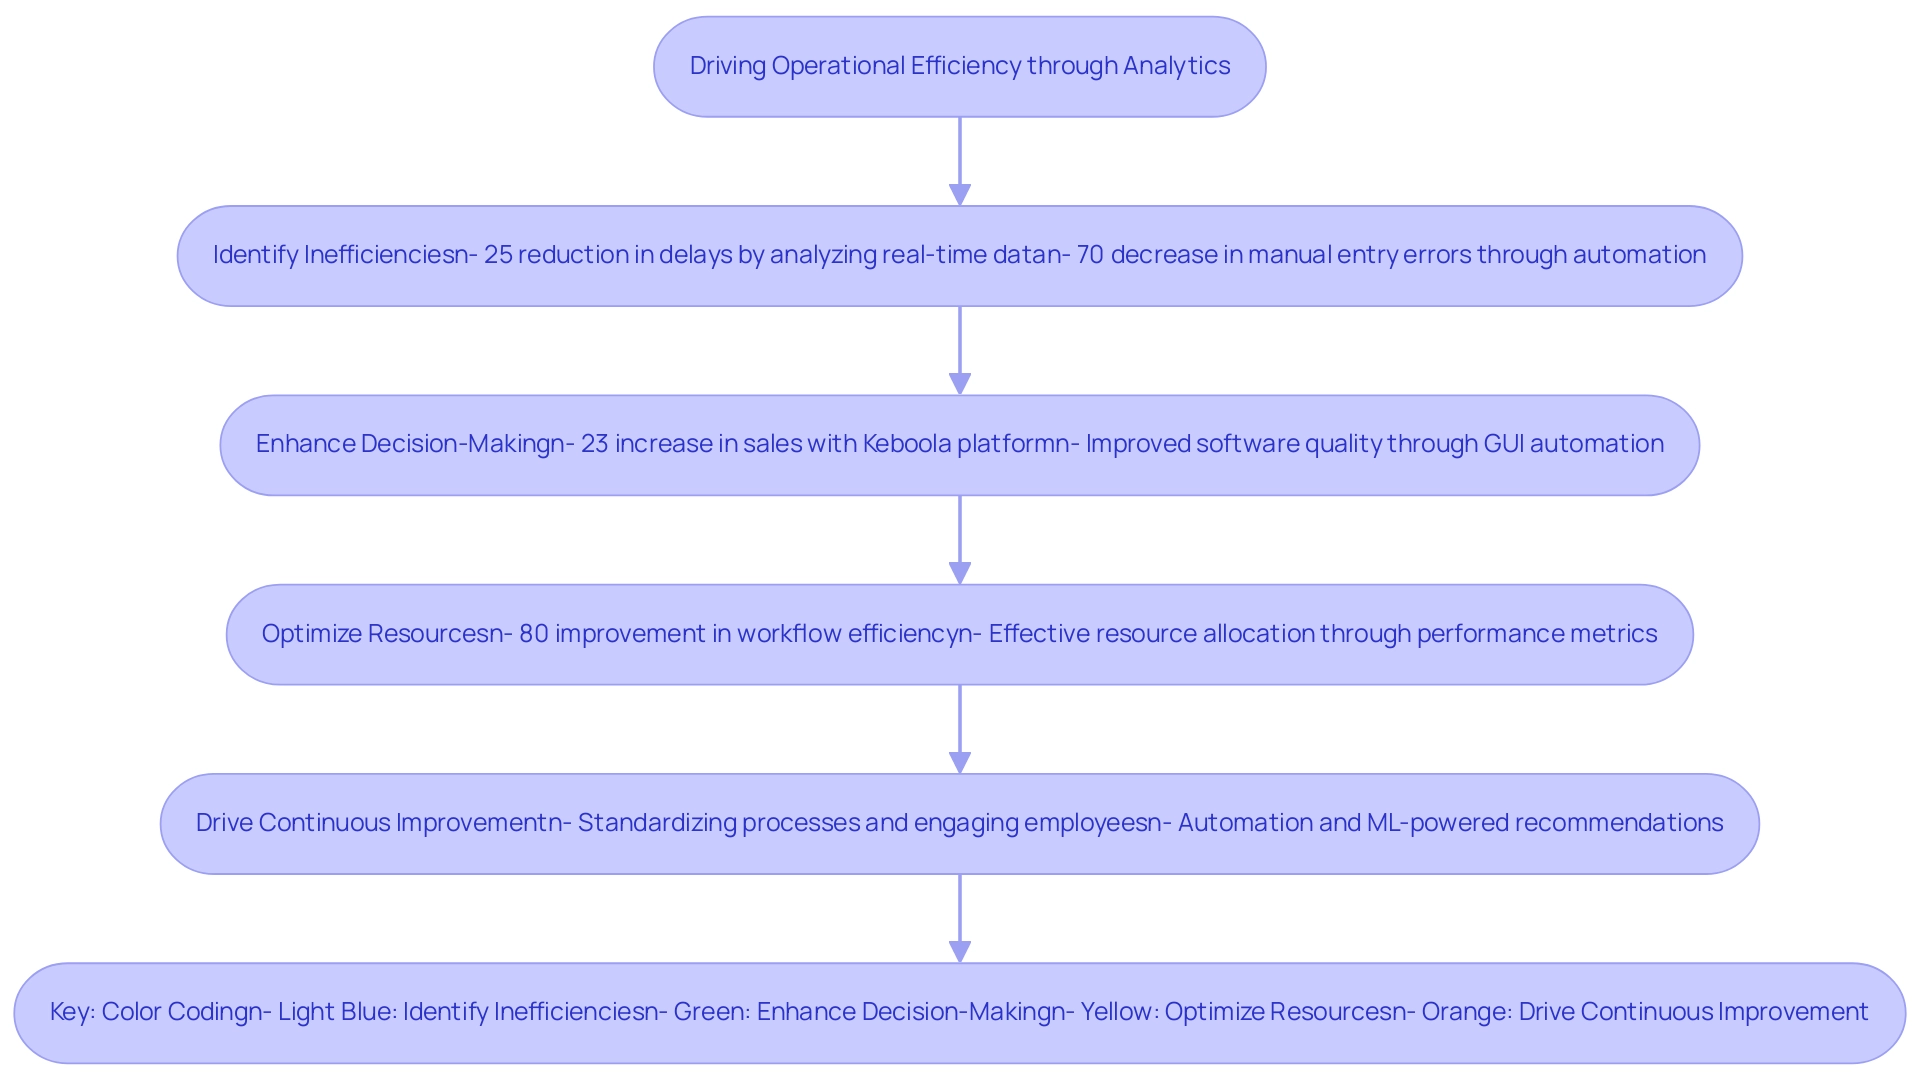
Analytics play a crucial role in driving operational efficiency by empowering organizations to:
-
Identify Inefficiencies: Through comprehensive data analysis, businesses can uncover specific areas where processes are underperforming. For instance, a major airline successfully reduced delays by 25% by utilizing real-time information analysis to streamline operations. Similarly, a mid-sized firm enhanced efficiency by automating entry, software testing, and legacy system integration using GUI automation from Creatum GmbH, significantly decreasing manual entry errors by 70%.
-
Enhance Decision-Making: Data-driven insights facilitate more informed decision-making, moving away from reliance on intuition. Organizations like Slevomat have experienced a 23% increase in sales after implementing the Keboola data innovation platform, showcasing the power of analytics in shaping strategic choices. Additionally, the implementation of GUI automation from Creatum GmbH enhanced software quality and operational efficiency, revolutionizing processes in healthcare service delivery.
-
Optimize Resources: Analytics enable effective resource allocation, ensuring that teams concentrate on high-impact activities. By evaluating performance metrics and documenting workflows, companies can identify bottlenecks and optimize their operations, leading to improved efficiency. The mid-sized company mentioned earlier achieved an 80% improvement in workflow efficiency through streamlined processes.
-
Drive Continuous Improvement: Regular analysis fosters a culture of ongoing enhancement, enabling entities to adapt swiftly to evolving business landscapes. Best practices for implementing Operational Performance Analysis emphasize the importance of standardizing processes, using performance metrics, engaging employees in the process, and leveraging technology for enhanced decision-making. As noted by Jonathan Wagstaff, Director of Market Intelligence at DCC Technology, “The aspects that truly captured the attention of the management team were much of the automation work the team was undertaking—utilizing Python scripts to automate very complex, large processing tasks.” Automating manual processes and creating ML-powered recommendation engines was where we were freeing up a lot of time for the teams and very quickly making an impact and ROI.
In 2025, the significance of data analysis in efficiency continues to expand, as organizations increasingly acknowledge its worth in improving performance and fostering growth. By harnessing the potential of analysis, companies can convert unrefined information into practical insights, ultimately resulting in more strategic and efficient operations. Client testimonials further highlight the transformative impact of Creatum GmbH’s technology solutions, emphasizing how GUI automation has driven significant improvements in efficiency and business growth.
Testimonials:
- Herr Malte-Nils Hunold, VP Financial Services, NSB GROUP
- Herr Sebastian Rusdorf, Regional Sales Director Europe, Hellmann Marine Solutions & Cruise Logistics
- Sascha Rudloff, Teamleader of IT- and Processmanagement, PALFINGER Tail Lifts GMBH – ganderkesee
Level 1: Descriptive Analytics – Analyzing Past Performance
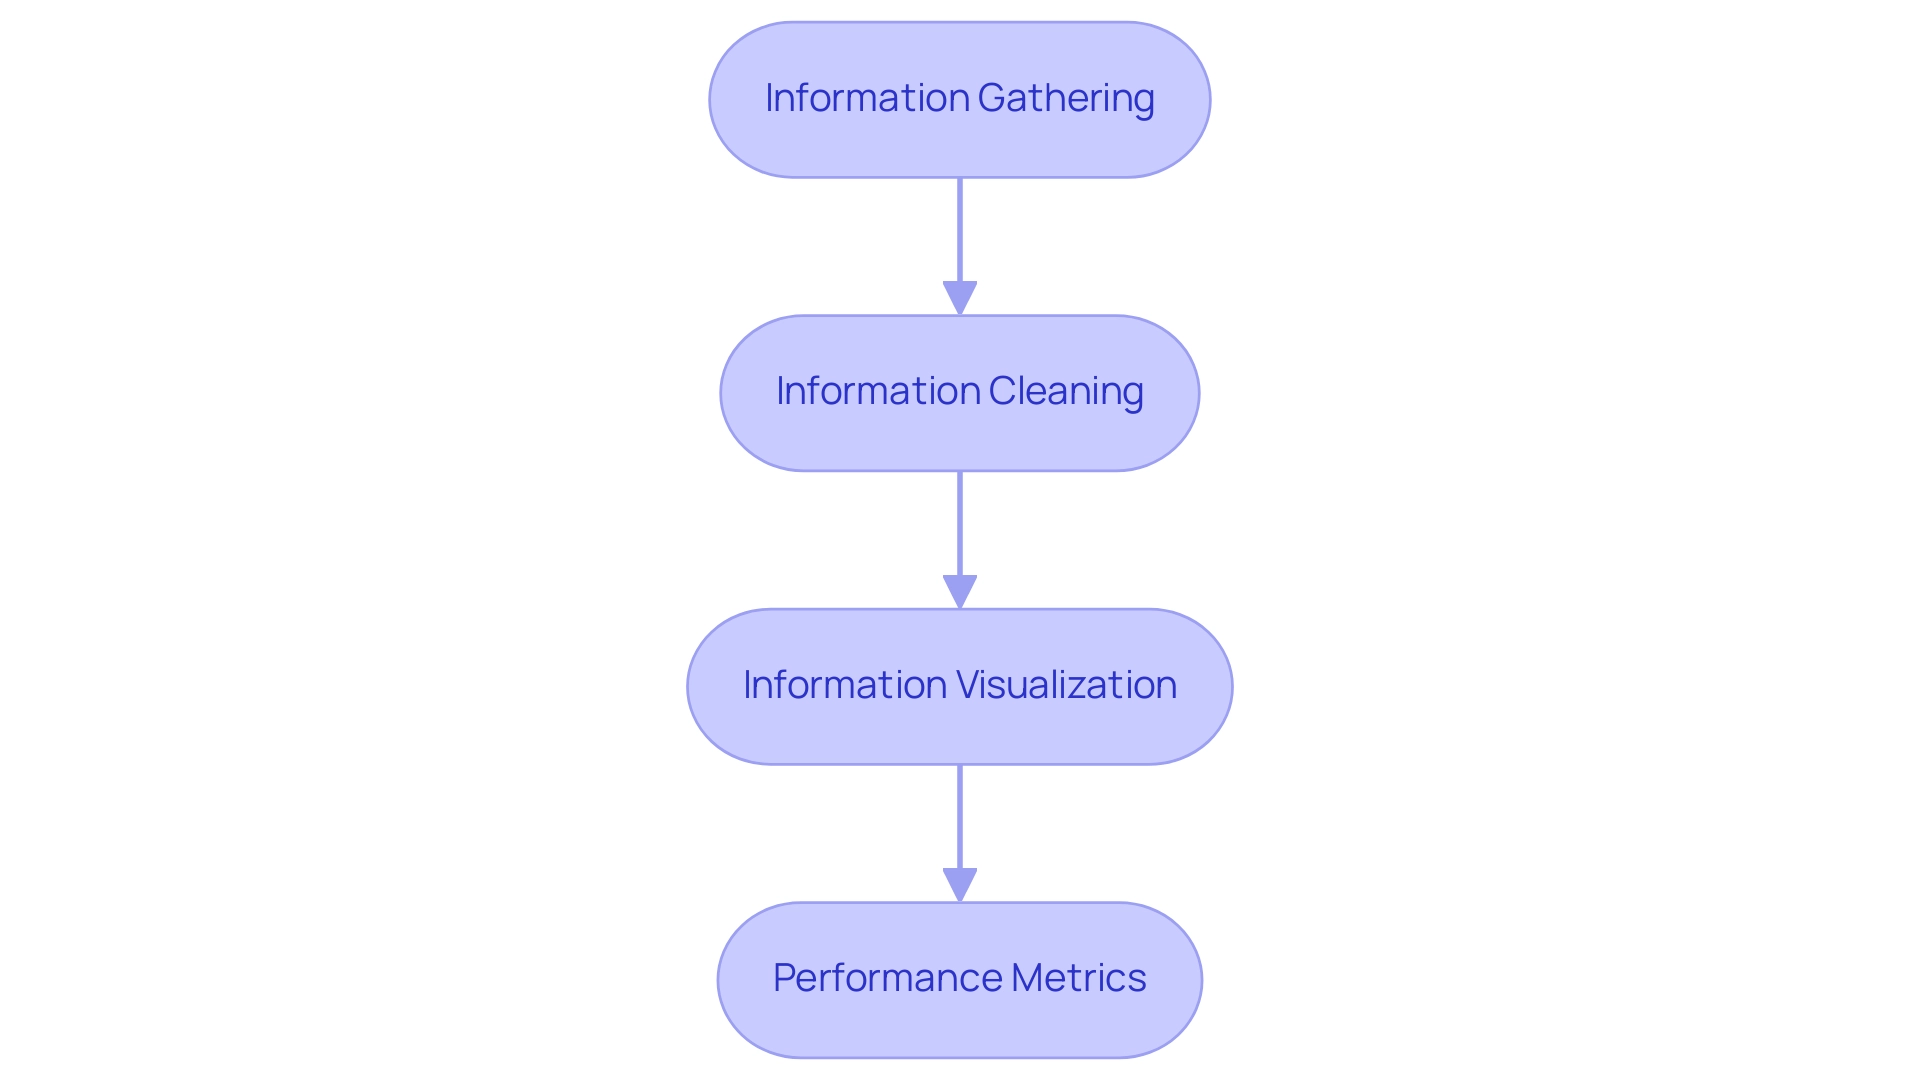
Descriptive analytics serves as a pivotal process that systematically collects and analyzes historical data to summarize past performance and inform future strategies. The following key steps are essential for effective implementation:
-
Information Gathering: Initiate the process by collecting relevant information from diverse sources, such as sales reports, operational logs, and customer feedback. This comprehensive approach ensures a holistic view of performance metrics.
-
Information Cleaning: Ensuring the accuracy of collected information is vital. Trustworthy insights stem from high-quality data, significantly impacting decision-making processes. Leveraging Robotic Process Automation (RPA) can streamline this process, reducing manual errors and freeing up resources for more strategic tasks.
-
Information Visualization: Utilizing charts, graphs, and dashboards enhances clarity and accessibility. Effective information visualization enables stakeholders to promptly identify trends and patterns, facilitating informed discussions and strategic planning. For instance, entities like Netflix employ descriptive analytics to visualize viewer habits, informing their content development strategy and enhancing audience engagement. Our Power BI services can further elevate data reporting, providing actionable insights through features like the 3-Day Power BI Sprint for rapid report creation and the General Management App for comprehensive management.
-
Performance Metrics: Establishing key performance indicators (KPIs) is essential for measuring success and tracking progress over time. For example, a group aiming for 500,000 monthly unique page views would be underperforming at 200,000 halfway through the month, as they should be at 250,000. By defining clear metrics, companies can assess their performance against set goals, enabling them to pivot strategies as necessary.
The effectiveness of descriptive analysis in performance measurement is underscored by recent statistics, indicating that organizations leveraging these insights can enhance operational efficiency by up to 30%. Moreover, the most recent trends in 2025 emphasize a growing dependence on sophisticated visualization tools that incorporate artificial intelligence, enabling real-time assessments and a deeper understanding of performance metrics. Our customized AI solutions, including Small Language Models and GenAI Workshops, address challenges such as poor information quality and governance, ensuring businesses can make informed decisions based on trustworthy data.
Catherine Cote, Marketing Coordinator at Harvard Business School Online, underscores the importance of adopting descriptive analysis, stating, “Organizations must utilize information to stay competitive and drive growth in a shifting market.”
Incorporating best practices for descriptive analytics, such as regular audits and stakeholder engagement in the visualization process, can further enhance the effectiveness of these initiatives. By adhering to these steps, entities can not only analyze past performance but also strategically position themselves for future growth. Additionally, the unique value of Creatum GmbH lies in providing customized solutions that enhance data quality and simplify AI implementation, ultimately driving growth and innovation.
Level 2: Diagnostic Analytics – Understanding Causes
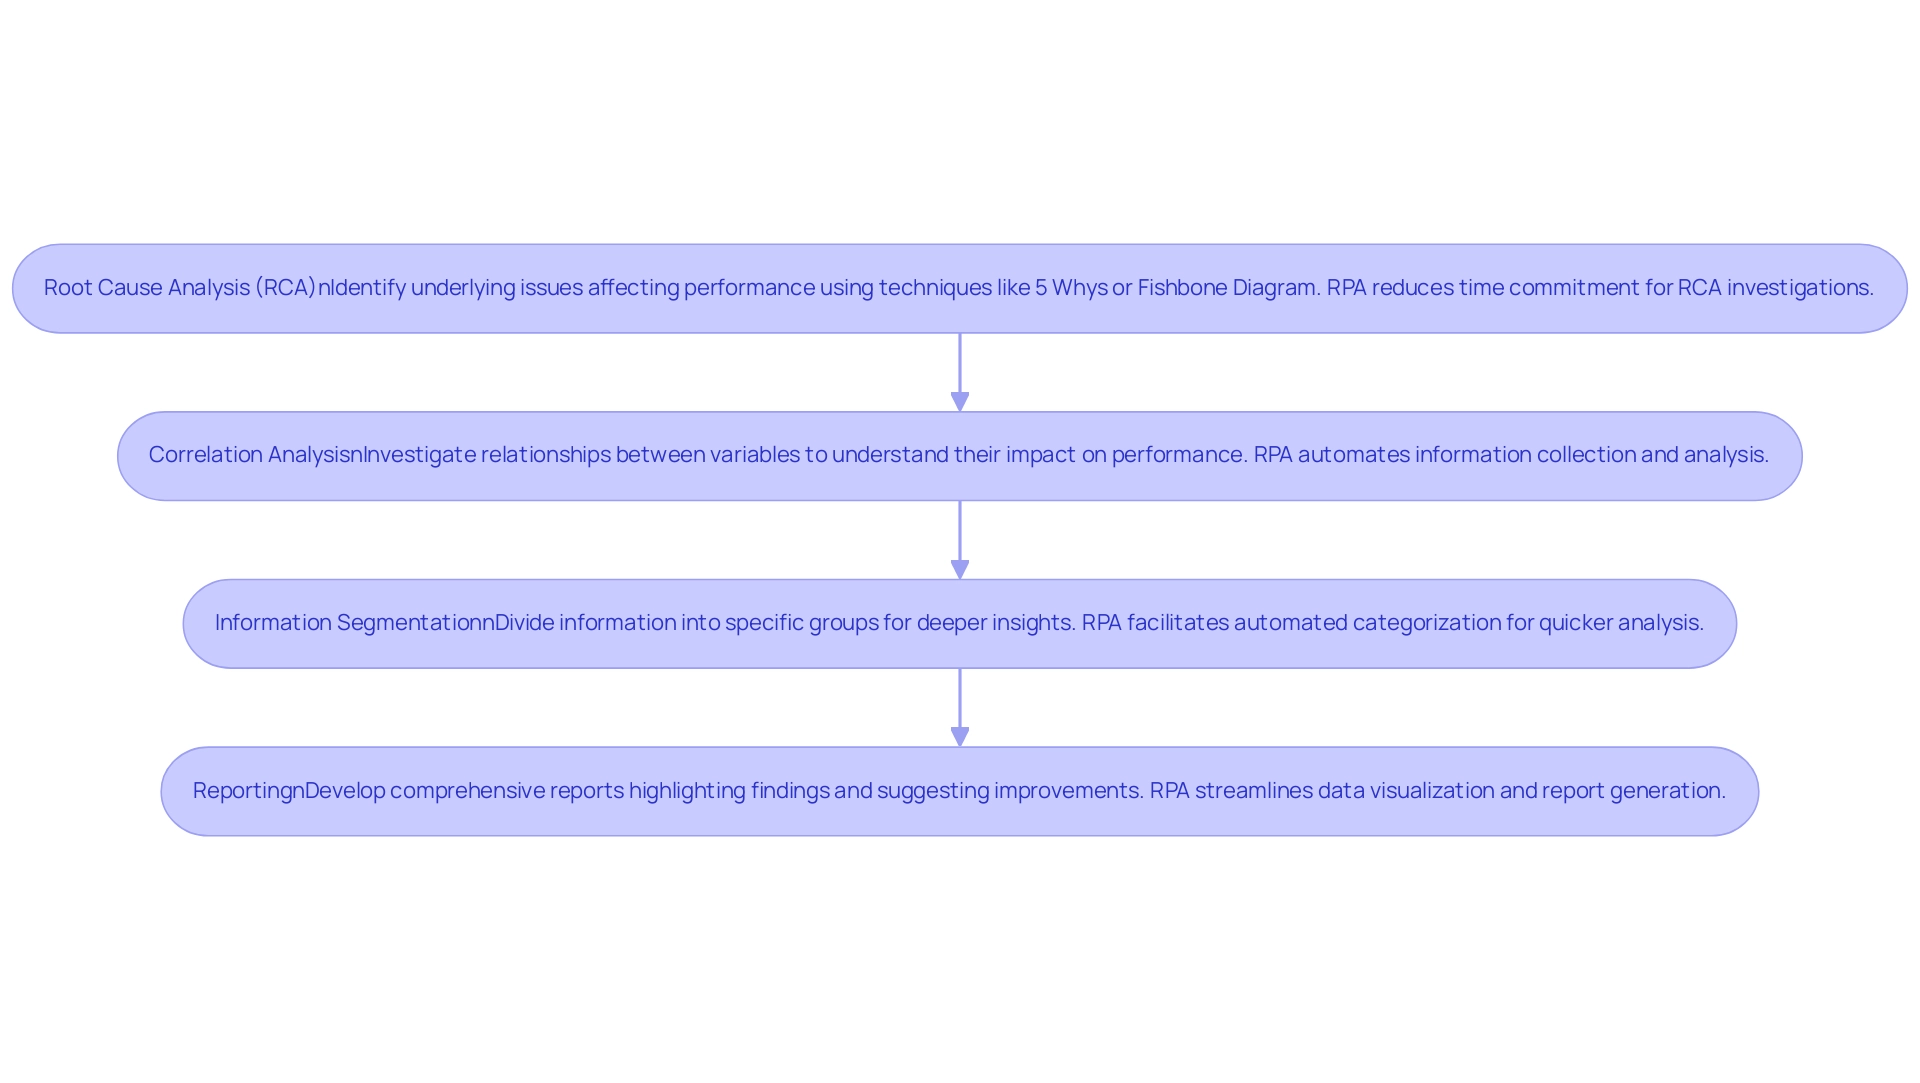
Diagnostic analysis is essential for uncovering the reasons behind past performance, enabling organizations to make informed decisions for future improvements. To effectively implement this level of analytics, consider the following steps, enhanced by the integration of Robotic Process Automation (RPA) to streamline processes, reduce errors, and improve operational efficiency:
-
Root Cause Analysis (RCA): Employ techniques such as the 5 Whys or Fishbone Diagram to systematically identify the underlying issues affecting performance. A study conducted in a children’s hospital demonstrated that RCA could effectively generate action plans to address adverse events, achieving nearly complete implementation of these plans. As noted by Morse and Pollack, “This study demonstrated that RCAs can be used effectively to generate moderate- and high-impact action plans to address a wide range of adverse events within a children’s hospital, with almost complete implementation of the action plans being achieved.” This emphasizes the practical usefulness of RCA in promoting enhancements. Furthermore, incorporating RPA can significantly decrease the time commitment needed for RCA investigations, which can last up to 20 hours for a nurse, thus improving efficiency and enabling staff to concentrate on more strategic tasks.
-
Correlation Analysis: Investigate the relationships between various variables to understand their impact on performance. Current trends indicate that correlation analysis is increasingly being utilized to enhance diagnostic analytics, allowing organizations to pinpoint factors that significantly influence outcomes. For example, identifying correlations between staffing levels and patient outcomes can lead to strategic adjustments that improve operational efficiency. RPA can aid in automating information collection and analysis, making this process more efficient and less susceptible to human error, ultimately freeing up team members for higher-level decision-making.
-
Information Segmentation: Dividing information into specific groups or time periods can yield deeper insights. By analyzing subsets of information, organizations can uncover trends and patterns that may not be visible in combined figures. This method is particularly useful in healthcare settings, where understanding patient demographics can inform targeted interventions. RPA can facilitate the segmentation process by automating the categorization of information, allowing for quicker and more accurate analysis, thus addressing the challenges posed by manual, repetitive tasks.
-
Reporting: Develop comprehensive reports that not only highlight findings but also suggest actionable areas for improvement. The narrative element in analysis tools such as Qlik can improve the communication of these findings, making it simpler for stakeholders to understand the significance of the information. This feature allows analysts to effectively convey their insights, ensuring that the information is accessible and actionable. RPA can streamline the reporting process by automating data visualization and report generation, saving valuable time for analysts and reducing the likelihood of errors.
Integrating these steps into your approach to the 4 levels of analytics, supported by RPA, can result in considerable enhancements. By utilizing these techniques, companies can improve their efficiency and promote significant change, ultimately contributing to business growth. The research supporting these findings was funded by the PROMETEO Research Program, Generalitat Valenciana, reinforcing the significance of the study’s outcomes.
Furthermore, as the AI landscape continues to evolve, integrating RPA becomes increasingly vital for organizations to stay competitive and responsive to changing demands.
Level 3: Predictive Analytics – Anticipating Future Trends
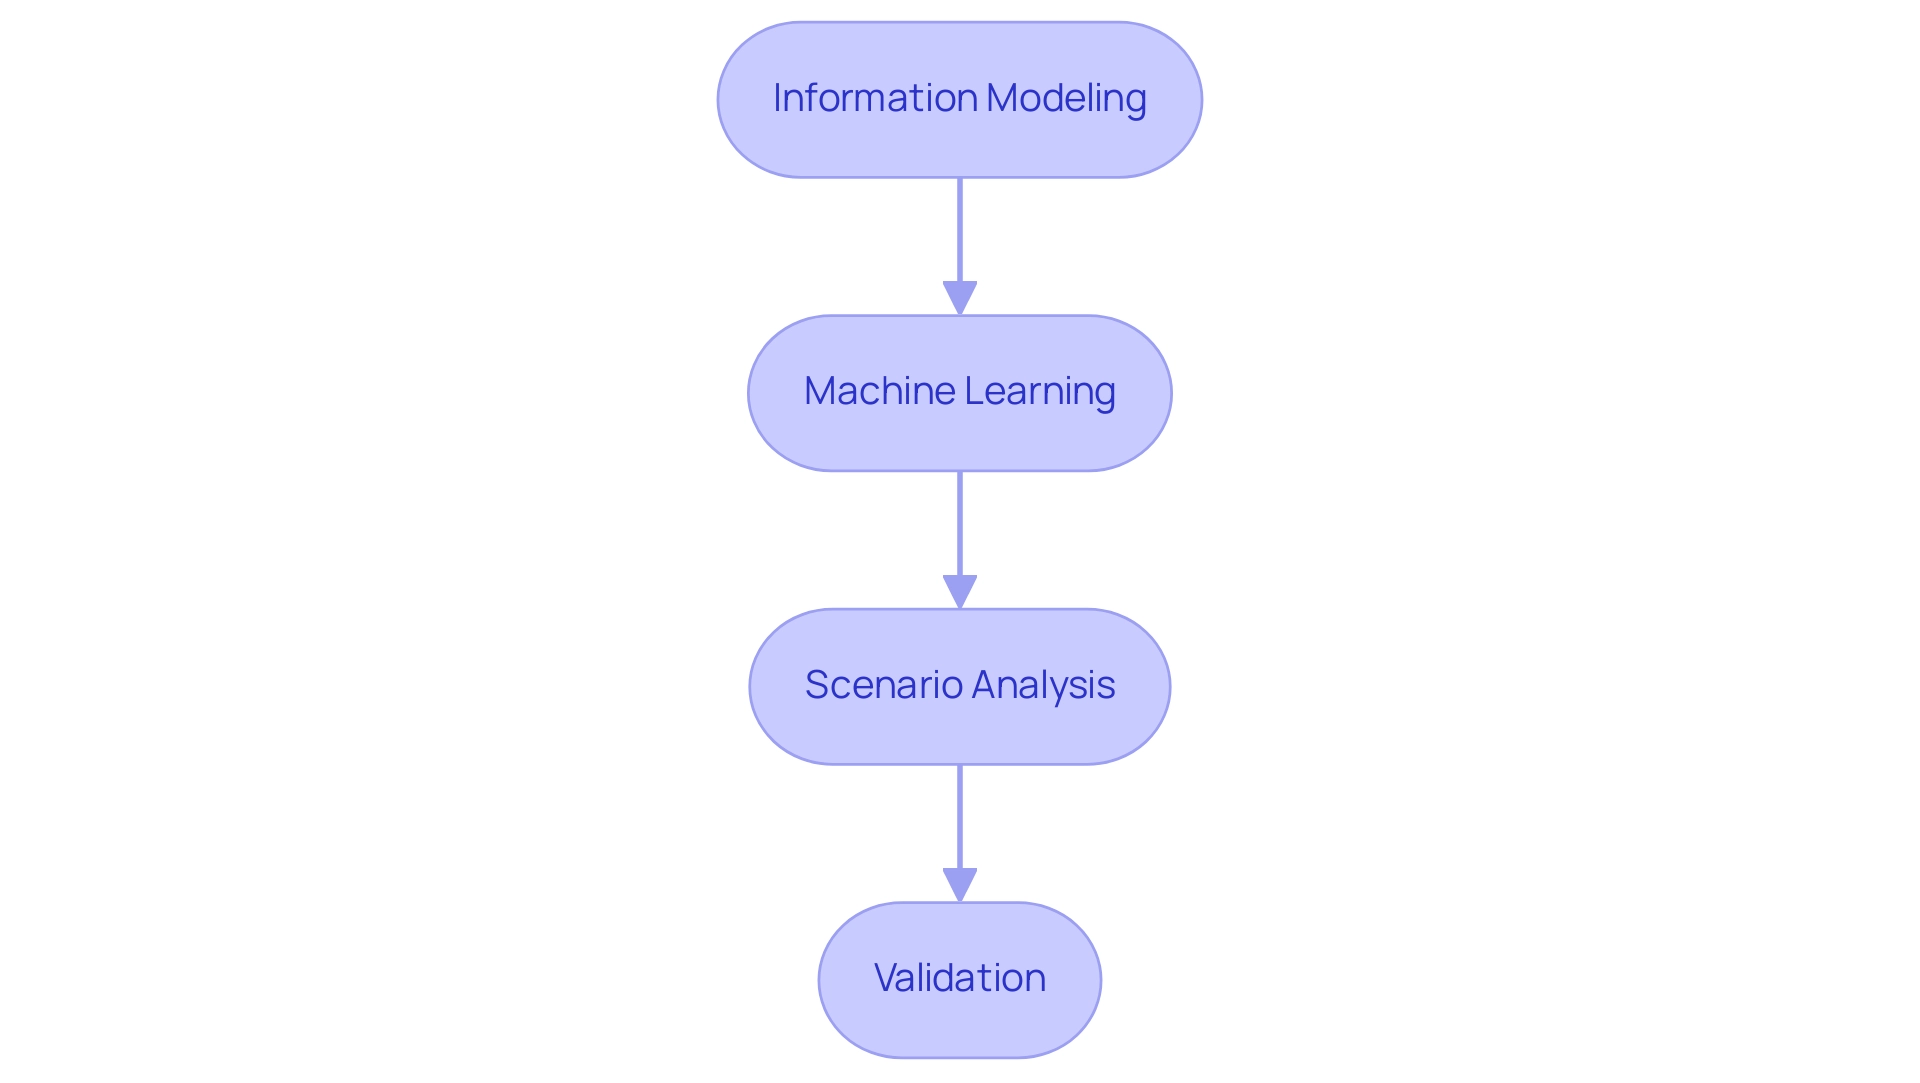
Predictive analytics stands as one of the four levels of analytics, leveraging historical information to forecast future outcomes and significantly enhancing operational efficiency. The process comprises several key steps:
-
Information Modeling: This foundational step involves developing statistical models that analyze historical information to identify patterns and predict future trends. Effective information modeling is essential for creating reliable forecasts that inform strategic decisions, particularly in improving quality through tailored AI solutions offered by Creatum GmbH.
-
Machine Learning: Implementing machine learning algorithms allows organizations to significantly enhance the accuracy of their predictions. These algorithms learn from new information over time, enabling continuous improvement in forecasting capabilities. For instance, companies like PepsiCo have employed machine learning to merge retailer information with supply chain insights through their Sales Intelligence Platform, effectively forecasting out-of-stocks and enhancing inventory management. This aligns with advancements in AI, such as Small Language Models, which facilitate efficient analysis and enhance privacy. Additionally, Creatum GmbH’s GenAI Workshops provide hands-on training to further bolster these capabilities.
-
Scenario Analysis: This step involves creating various scenarios to explore potential outcomes based on different inputs. By simulating different conditions, businesses can better understand the range of possible futures and prepare accordingly, addressing data inconsistency and governance challenges in business reporting for enhanced decision-making.
-
Validation: Regular validation of predictive models against actual outcomes is critical to ensure their reliability. This process enables entities to adjust their models as necessary, maintaining accuracy in their forecasts. A notable case study on emergency department volume prediction during the COVID-19 pandemic revealed that the accuracy of predictions dropped to approximately 64% of pre-pandemic levels. However, post-pandemic, forecasting ability improved to about 78.57%, underscoring the importance of ongoing validation and adjustment in predictive modeling.
The advancements in predictive modeling as of 2025 emphasize the significance of machine learning in refining forecasting accuracy. Experts concur that incorporating machine learning into predictive analysis not only improves the accuracy of forecasts but also allows organizations to react swiftly to emerging trends and anomalies, such as unusual spending patterns in financial sectors. Furthermore, utilizing Robotic Process Automation (RPA) plays a crucial role in automating manual workflows, improving efficiency, and driving data-driven insights.
Predictive analysis also plays a crucial role in risk and fraud forecasting by identifying anomalies and atypical behavior, enabling rapid responses to potential threats. As entities navigate a data-rich landscape, executing these measures in predictive analysis will be essential for fostering growth and operational effectiveness, backed by Creatum GmbH’s Business Intelligence services.
Level 4: Prescriptive Analytics – Making Informed Decisions
Prescriptive analysis plays a vital role in directing entities toward informed decision-making by offering actionable recommendations derived from extensive data examination. Implementing this level of analytics involves several key steps:
-
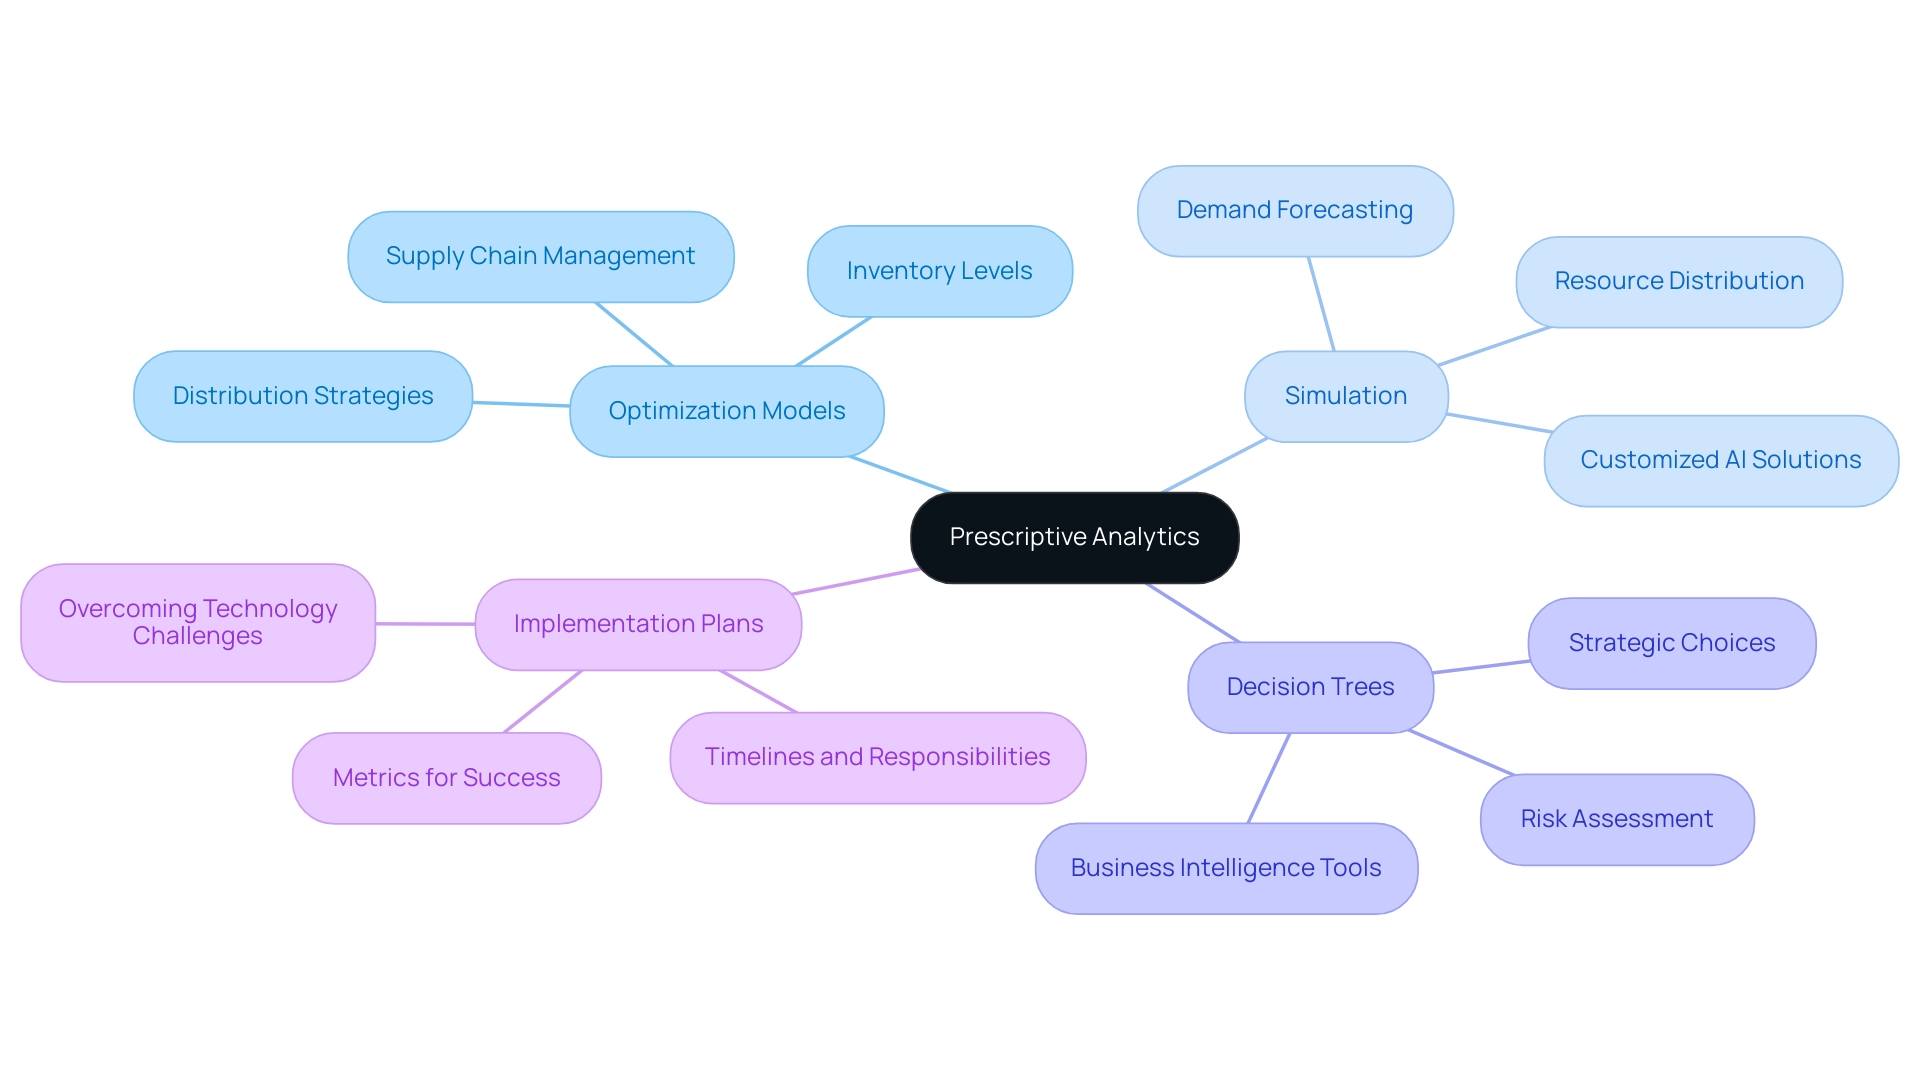
Optimization Models: These mathematical frameworks are essential for identifying the most effective course of action while considering various constraints and objectives. For instance, entities can leverage optimization models to enhance supply chain management, which accounted for the largest market revenue share in 2023, by determining optimal inventory levels and distribution strategies. This approach not only enhances efficiency but also aligns with the strategic objectives of the entity, particularly when integrated with Robotic Process Automation (RPA) from Creatum GmbH to streamline manual workflows.
-
Simulation: Running simulations allows businesses to test different strategies and assess their potential outcomes under varying conditions. This method is especially beneficial in dynamic settings, where organizations like Uber employ historical information to forecast demand and enhance driver placement during peak periods, ensuring effective resource distribution. By incorporating customized AI solutions from Creatum GmbH, businesses can further refine their simulations to align with specific challenges.
-
Decision Trees: Creating decision trees helps visualize possible actions and their consequences, facilitating clearer decision-making processes. This method enables teams to weigh the potential risks and rewards associated with each option, ultimately leading to more strategic choices. The integration of Business Intelligence tools from Creatum GmbH can enhance this process by providing deeper insights into data trends, boosting efficiency and reducing errors.
-
Implementation Plans: Developing comprehensive plans for executing recommendations is vital. These plans should outline specific timelines, assign responsibilities, and establish metrics for success. By doing so, companies can ensure that the insights obtained from prescriptive analysis translate into tangible actions that drive operational efficiency, especially when overcoming technology implementation challenges with RPA from Creatum GmbH.
Current trends indicate that North America dominated the prescriptive data analysis market with a 36.3% share in 2023, driven by its advanced technological infrastructure and strong adoption of AI-driven solutions. This dominance shapes trends and practices in decision-making processes, as entities increasingly depend on advanced data analysis to steer their strategies. As we approach 2025, the most recent advancements in prescriptive analysis highlight the significance of the four levels of analytics and optimization models in decision-making.
Experts concur that these models not only improve the precision of predictions but also enable entities to make proactive decisions that align with their strategic goals.
Data shows that entities utilizing prescriptive analysis experience considerable enhancements in decision-making efficiency, resulting in improved operational performance. For instance, the case study named ‘Business Intelligence Empowerment’ demonstrates how firms have effectively utilized prescriptive analysis to generate actionable recommendations, ultimately converting raw information into valuable insights that promote growth and innovation. As Catherine Cote, Marketing Coordinator at Harvard Business School Online, states, “Enhancing your data analysis skills can enable you to capitalize on insights your information provides and advance your career and institution.”
This emphasizes the crucial role that data analysis skills play in effective decision-making.
Integrating the Four Levels of Analytics into Operational Strategies
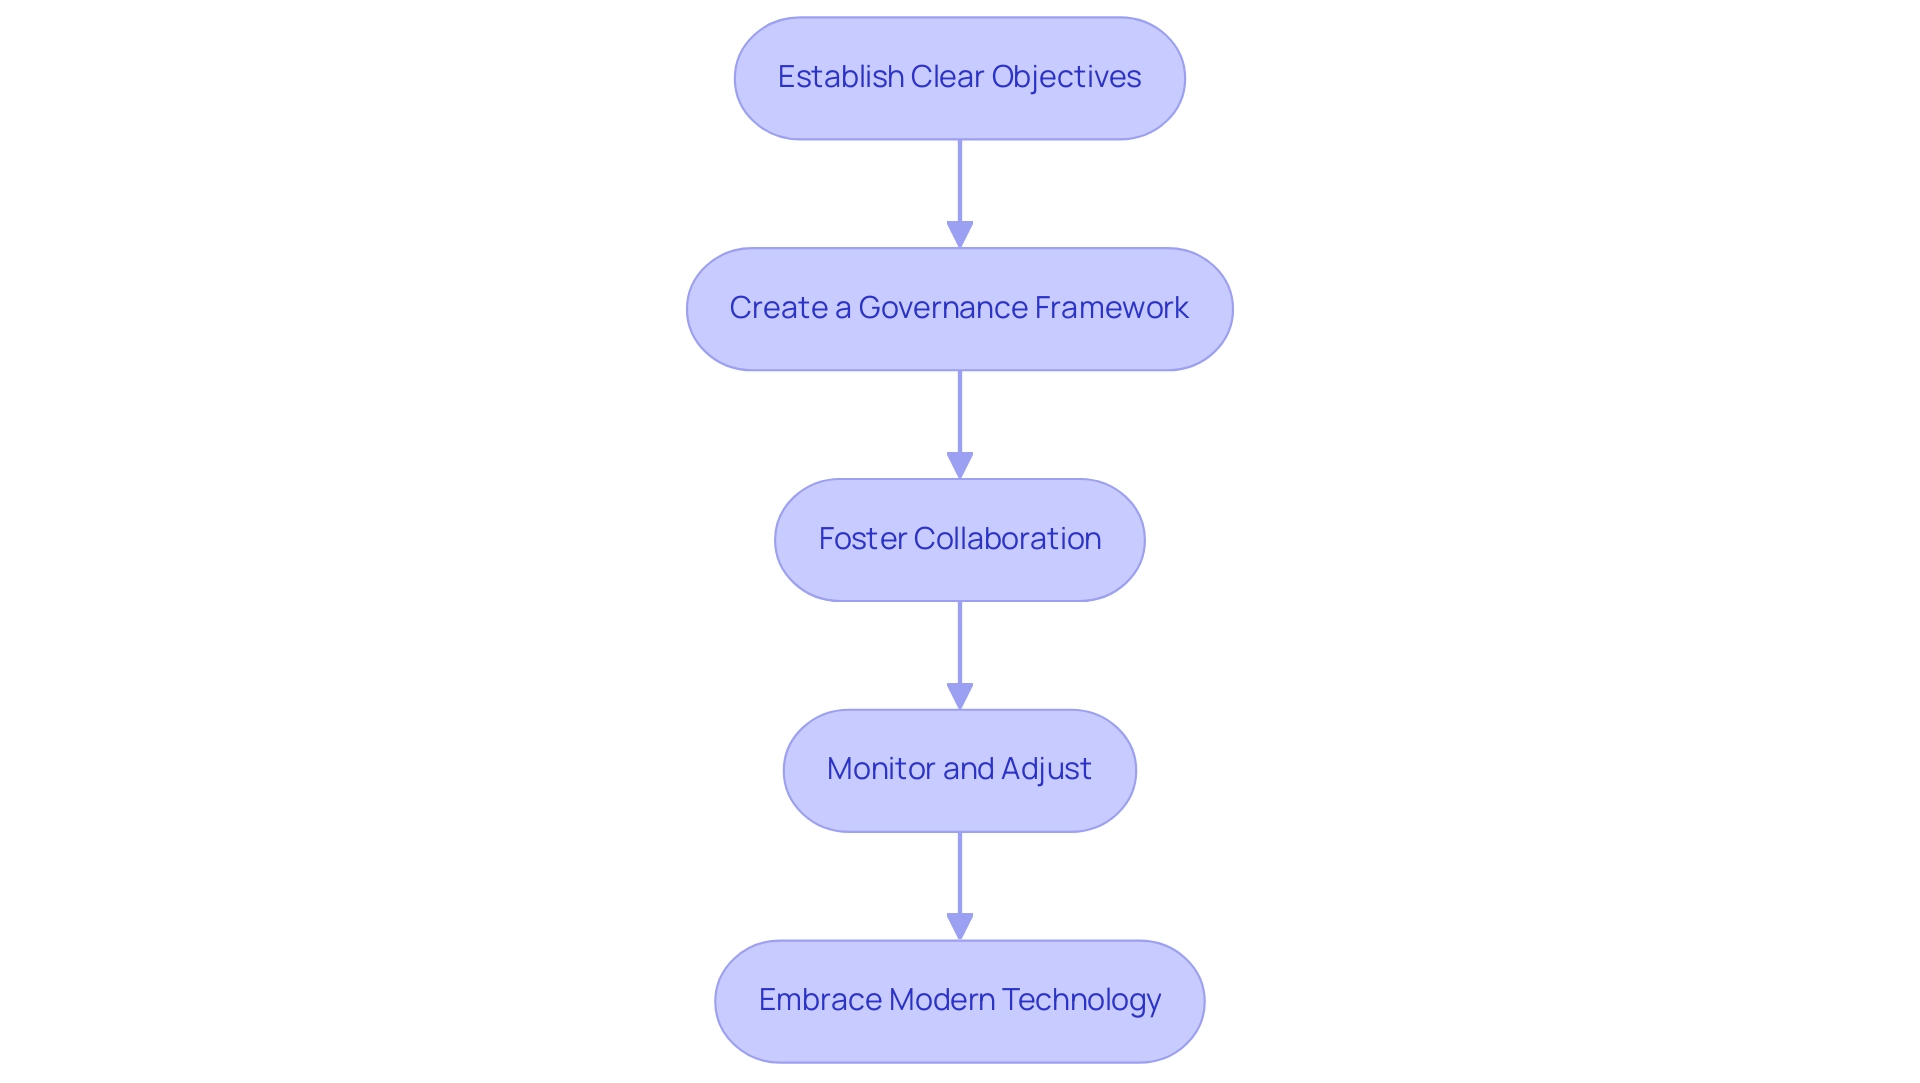
To effectively incorporate the four tiers of analysis into functional strategies, organizations should consider the following steps:
-
Establish Clear Objectives: Clearly define the goals for each of the four levels of analytics. This ensures that analytics efforts align with business objectives, enabling teams to focus on outcomes that drive operational efficiency.
-
Create a Governance Framework: Implement a robust governance framework to guarantee quality and accessibility. With the rise of privacy regulations like GDPR and CCPA, establishing governance protocols is essential for compliance and effective management. Data governance has become increasingly critical in 2024, prompting entities to adopt AI-powered governance tools to enforce policies and ensure compliance across distributed data environments.
-
Foster Collaboration: Encourage cross-departmental collaboration to share insights and strategies. By dismantling barriers, entities can utilize various viewpoints and skills, resulting in more thorough analysis results. For instance, Planet Fitness successfully partnered with Coherent Solutions to enhance customer intelligence, resulting in a 360-degree view of its members and improved service personalization.
-
Monitor and Adjust: Regularly review data outcomes and modify strategies based on findings. Continuous monitoring allows organizations to refine their approaches and respond to changing business needs. For example, JPMorgan Chase utilized big data analysis to enhance its credit risk assessment capabilities, improving loan underwriting accuracy and significantly lowering default rates. This illustrates the effect of iterative adjustments in data strategies.
-
Embrace Modern Technology: Stay informed about the evolving landscape of data analysis technology. Leveraging Robotic Process Automation (RPA) from Creatum GmbH can significantly streamline workflows, boosting efficiency and reducing errors, thereby enhancing overall productivity. Technology suppliers are updating their products to support composable application architecture, which can improve the incorporation of data analysis into business strategies. Unlocking the power of Business Intelligence can transform raw data into actionable insights, enabling informed decision-making that drives growth and innovation. Customized AI solutions from Creatum GmbH can also tackle particular business challenges, ensuring that organizations remain competitive in a swiftly changing AI environment.
By adhering to these steps, organizations can effectively incorporate data analysis into their operational strategies, enhancing efficiency and informed decision-making in an increasingly data-driven setting.
Practical Steps for Implementing Analytics in Operations
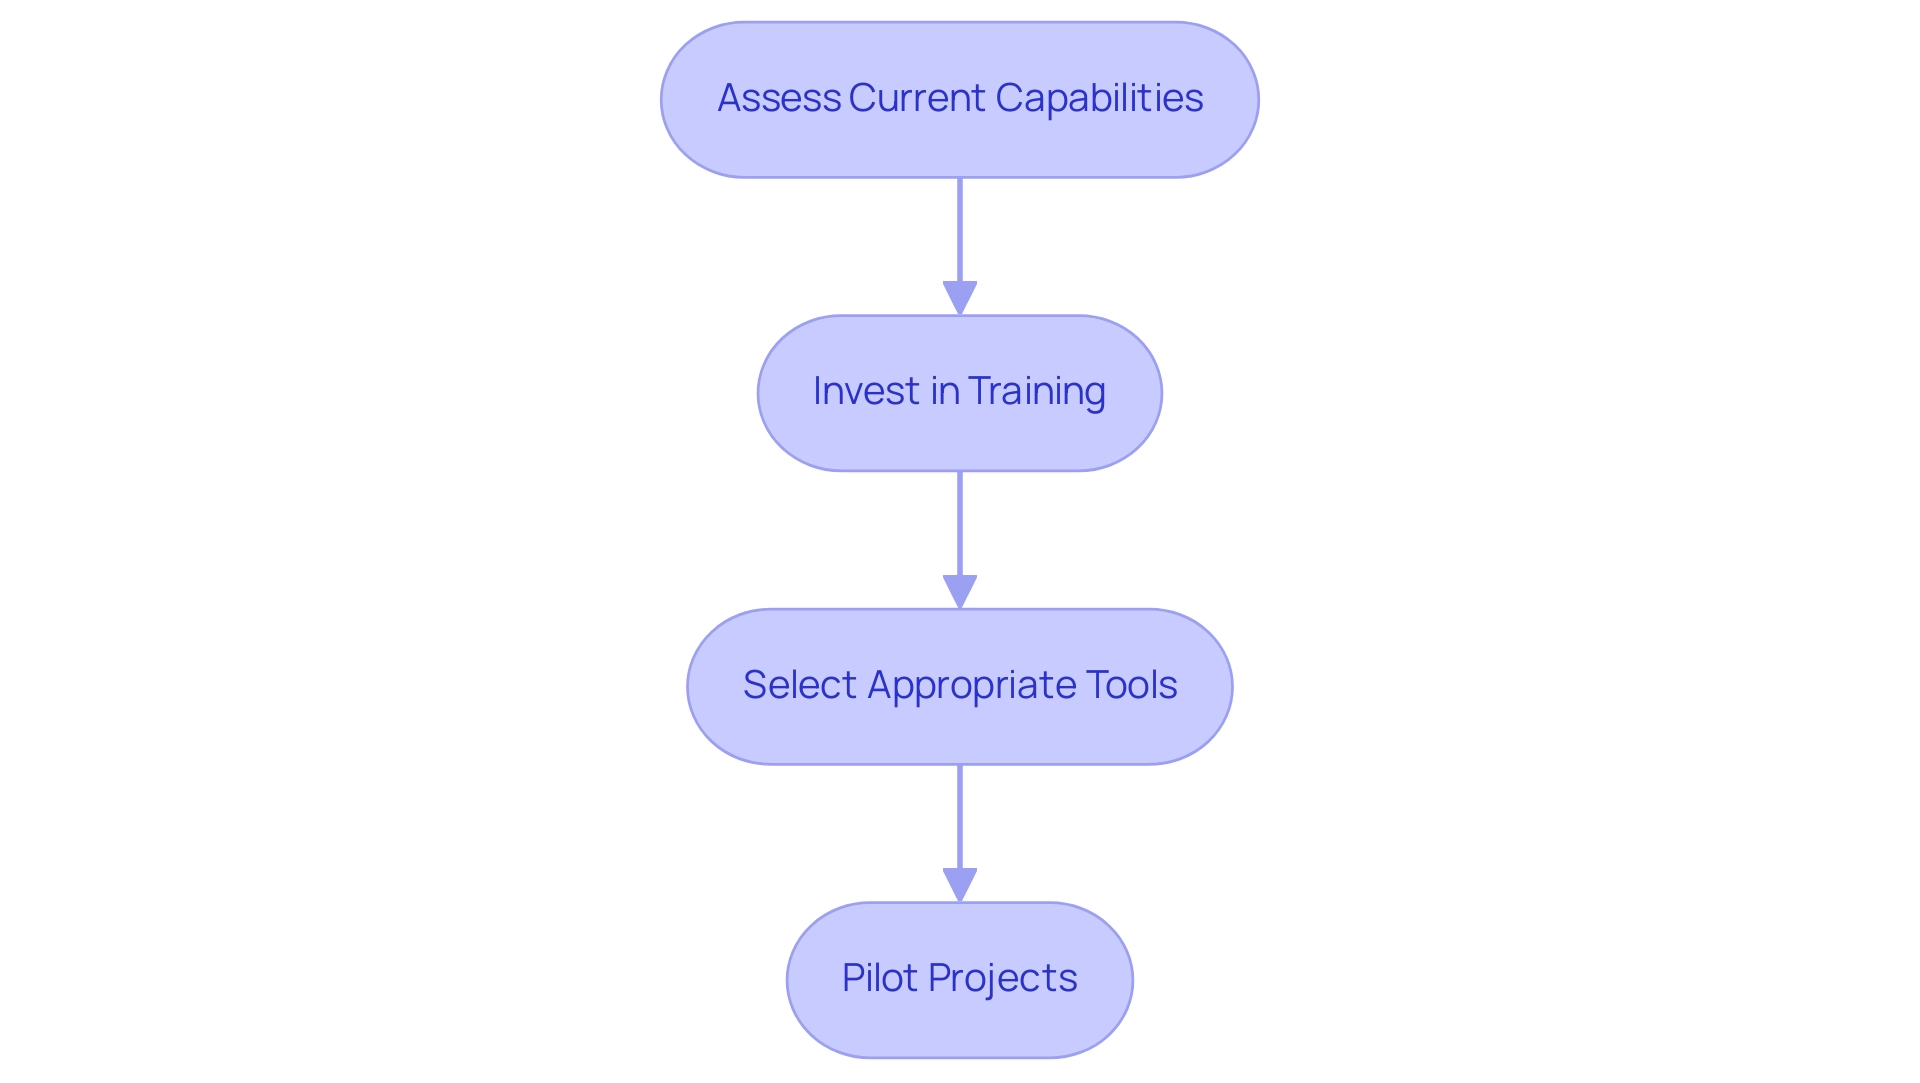
To apply data analysis effectively in operations, consider the following practical steps:
-
Assess Current Capabilities: Begin by reviewing your existing information infrastructure and analytical capabilities. Understanding your entity’s current standing regarding the four levels of analytics is crucial for identifying gaps and opportunities for improvement. For instance, organizations like JPMorgan Chase have significantly enhanced their credit risk evaluation abilities through extensive information analysis, underscoring the importance of a comprehensive assessment. Moreover, statistics reveal that companies such as Planet Fitness have achieved a 360-degree perspective of fitness club members via advanced information analysis, further illustrating the potential advantages of thorough evaluation.
-
Invest in Training: Providing training for staff to enhance information literacy and analytical skills is essential. Experts emphasize that cultivating a robust information culture within organizations can greatly improve analytical proficiency. A survey indicates that 50% of Chief Information Officers view enhancing information culture as a top priority, highlighting the need for ongoing education and skill development in this area. This focus on information culture is vital for ensuring that the four levels of analytics in evaluation projects are effective and sustainable.
-
Select Appropriate Tools: Choose analytics tools that align with your organizational needs and capabilities. The right tools can streamline information processing and analysis, simplifying the derivation of actionable insights. For example, Slevomat transitioned from using Excel for data reporting to the Keboola data innovation platform, enabling access to fresh, cleaned data from multiple sources, ultimately resulting in a 23% increase in sales. Additionally, leveraging Robotic Process Automation (RPA) solutions like EMMA RPA and Microsoft Power Automate can further enhance operational efficiency by automating repetitive tasks, allowing your team to concentrate on strategic initiatives.
-
Pilot Projects: Initiate pilot projects to test data analysis applications before full-scale implementation. This approach allows entities to assess the efficacy of data analysis solutions in practical situations, mitigating risks associated with broader implementation. By starting modestly, teams can refine their strategies and ensure that the chosen data analysis tools genuinely meet their functional requirements. Furthermore, integrating customized AI solutions and Business Intelligence tools can provide deeper insights and enhance information quality, ultimately fostering growth and innovation.
By adhering to these steps, entities can effectively incorporate the four levels of analytics into their operations, enhancing efficiency and informed decision-making in an information-rich environment.
Overcoming Challenges in Analytics Implementation
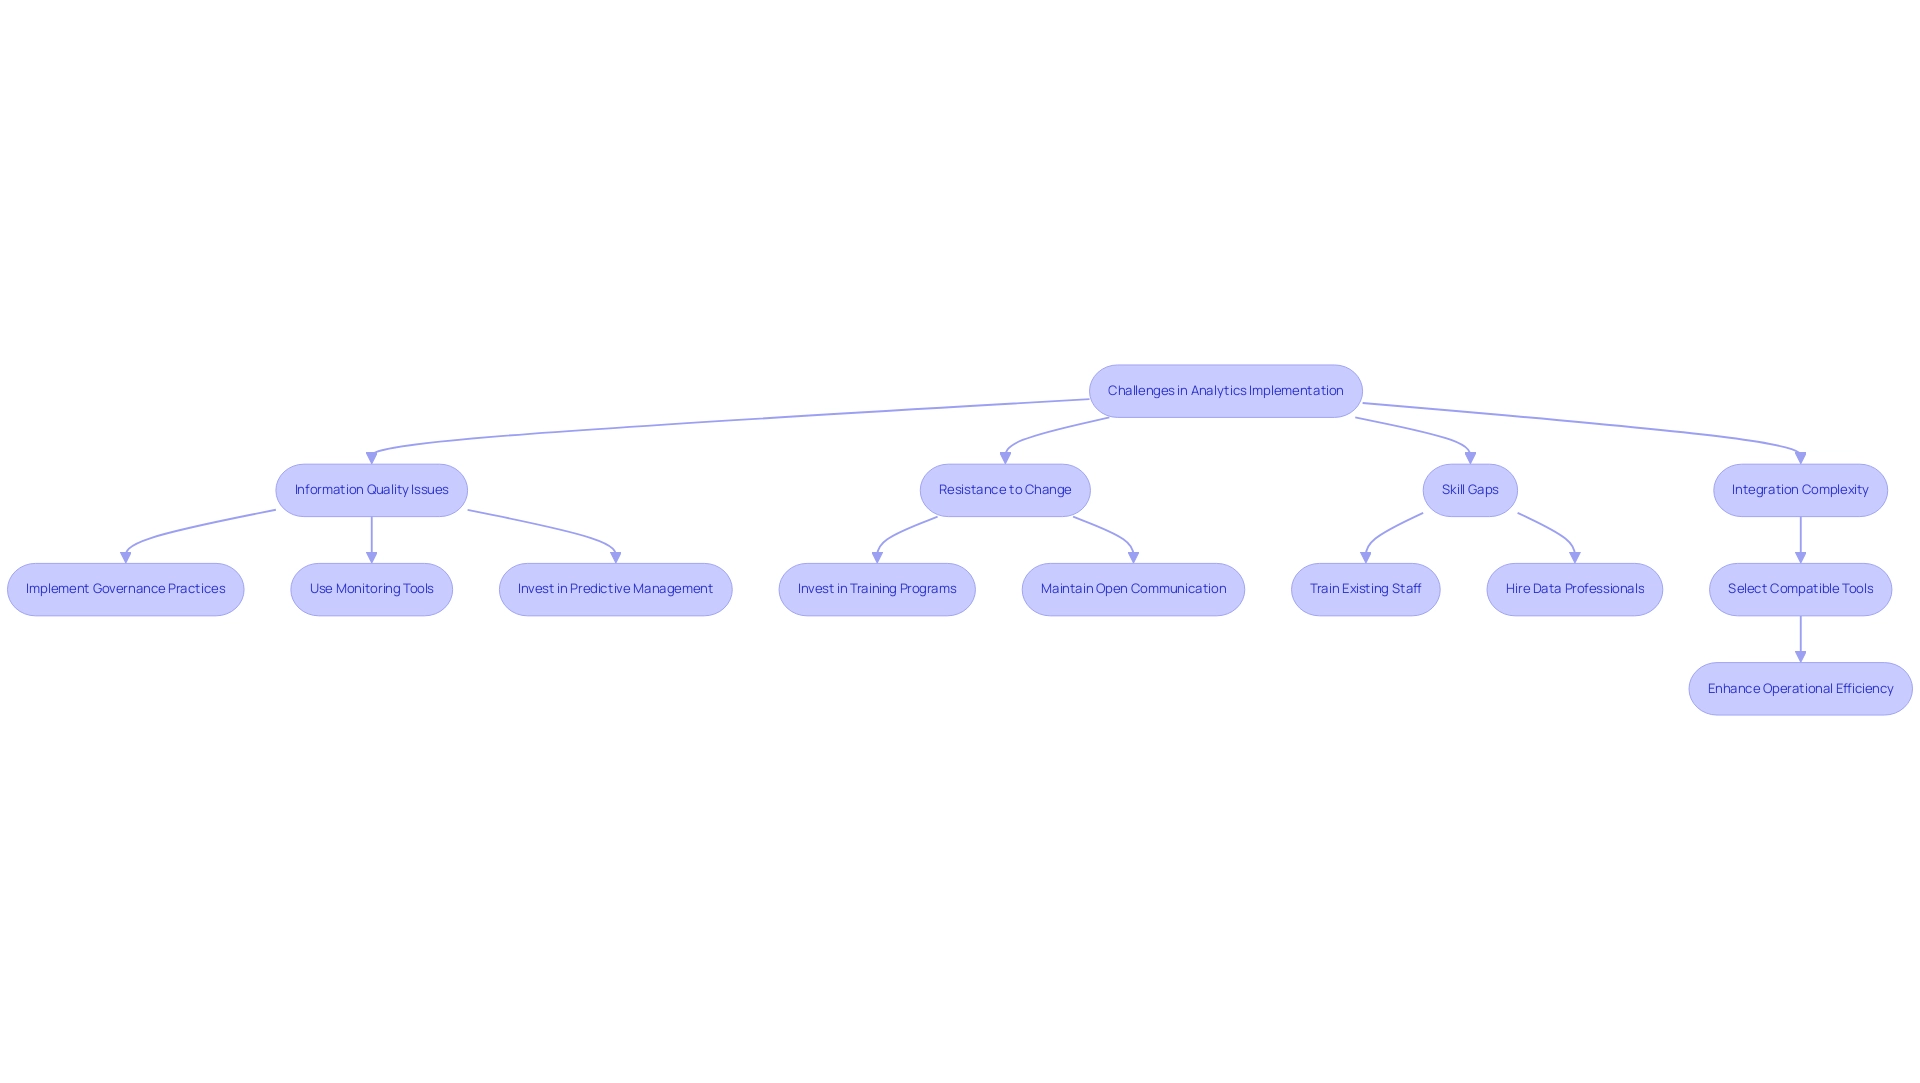
Common challenges in analytics implementation can significantly hinder operational efficiency. Addressing these challenges is crucial for organizations aiming to utilize information effectively.
-
Information Quality Issues: Ensuring accuracy and reliability is paramount. Implementing robust information governance practices can help maintain high quality of information. Organizations that emphasize information quality management can recognize and correct issues early in the information lifecycle, which is crucial for reliable analysis. Predictive information quality management can assist organizations in identifying and rectifying quality issues early, ensuring that analytics are based on reliable information. Additionally, monitoring tools can detect anomalies in information, aiding in the identification of quality problems. Statistics indicate that poor information quality results in an average yearly financial cost of $15 million, as noted by Idan Novogroder, underscoring the importance of proactive measures. Creatum’s customized solutions can assist in reducing these expenses by ensuring information integrity and relevance through regular updates and checks.
-
Resistance to Change: Overcoming resistance to change is vital for fostering a culture that embraces data-driven decision-making. Organizations can facilitate this transition by investing in comprehensive training programs and maintaining open lines of communication. Encouraging a mindset shift towards valuing insights can help mitigate resistance and promote a more analytical approach to operations.
-
Skill Gaps: The data analysis landscape is evolving rapidly, and addressing skill gaps is essential for successful implementation. Organizations should invest in training existing staff and consider hiring data professionals with the necessary expertise. This investment not only improves the team’s abilities but also guarantees that the entity can effectively employ data analysis tools and methods. Creatum’s tailored AI solutions can specifically address these skill gaps by providing targeted training and resources.
-
Integration Complexity: The complexity of integrating various analytics tools can pose significant challenges. To simplify this process, entities should select compatible tools and platforms that work seamlessly together. This strategic choice can reduce friction during implementation and enhance overall operational efficiency.
In 2025, companies are increasingly recognizing the need for specialized catalogs, with best-in-class firms being 30% more likely to possess one. This trend emphasizes the increasing significance of structured data management in addressing common analytical challenges. By confronting these issues directly, companies can unlock the full potential of the four levels of analytics in their initiatives, driving growth and innovation.
Moreover, leveraging Robotic Process Automation (RPA) can significantly streamline manual workflows, addressing the challenges of repetitive tasks that slow down operations. RPA not only reduces errors but also frees up teams for more strategic, value-adding work. Additionally, Creatum’s tailored AI solutions can assist companies in navigating the complexities of technology implementation, ensuring that the right tools align with specific business goals.
The transformative impact of Creatum’s Power BI Sprint is evident in client testimonials, such as that from Sascha Rudloff of PALFINGER, who noted a significant acceleration in their Power BI development, underscoring the importance of Business Intelligence in driving data-driven insights and operational efficiency.
Continuous Improvement: The Role of Analytics in Operational Efficiency
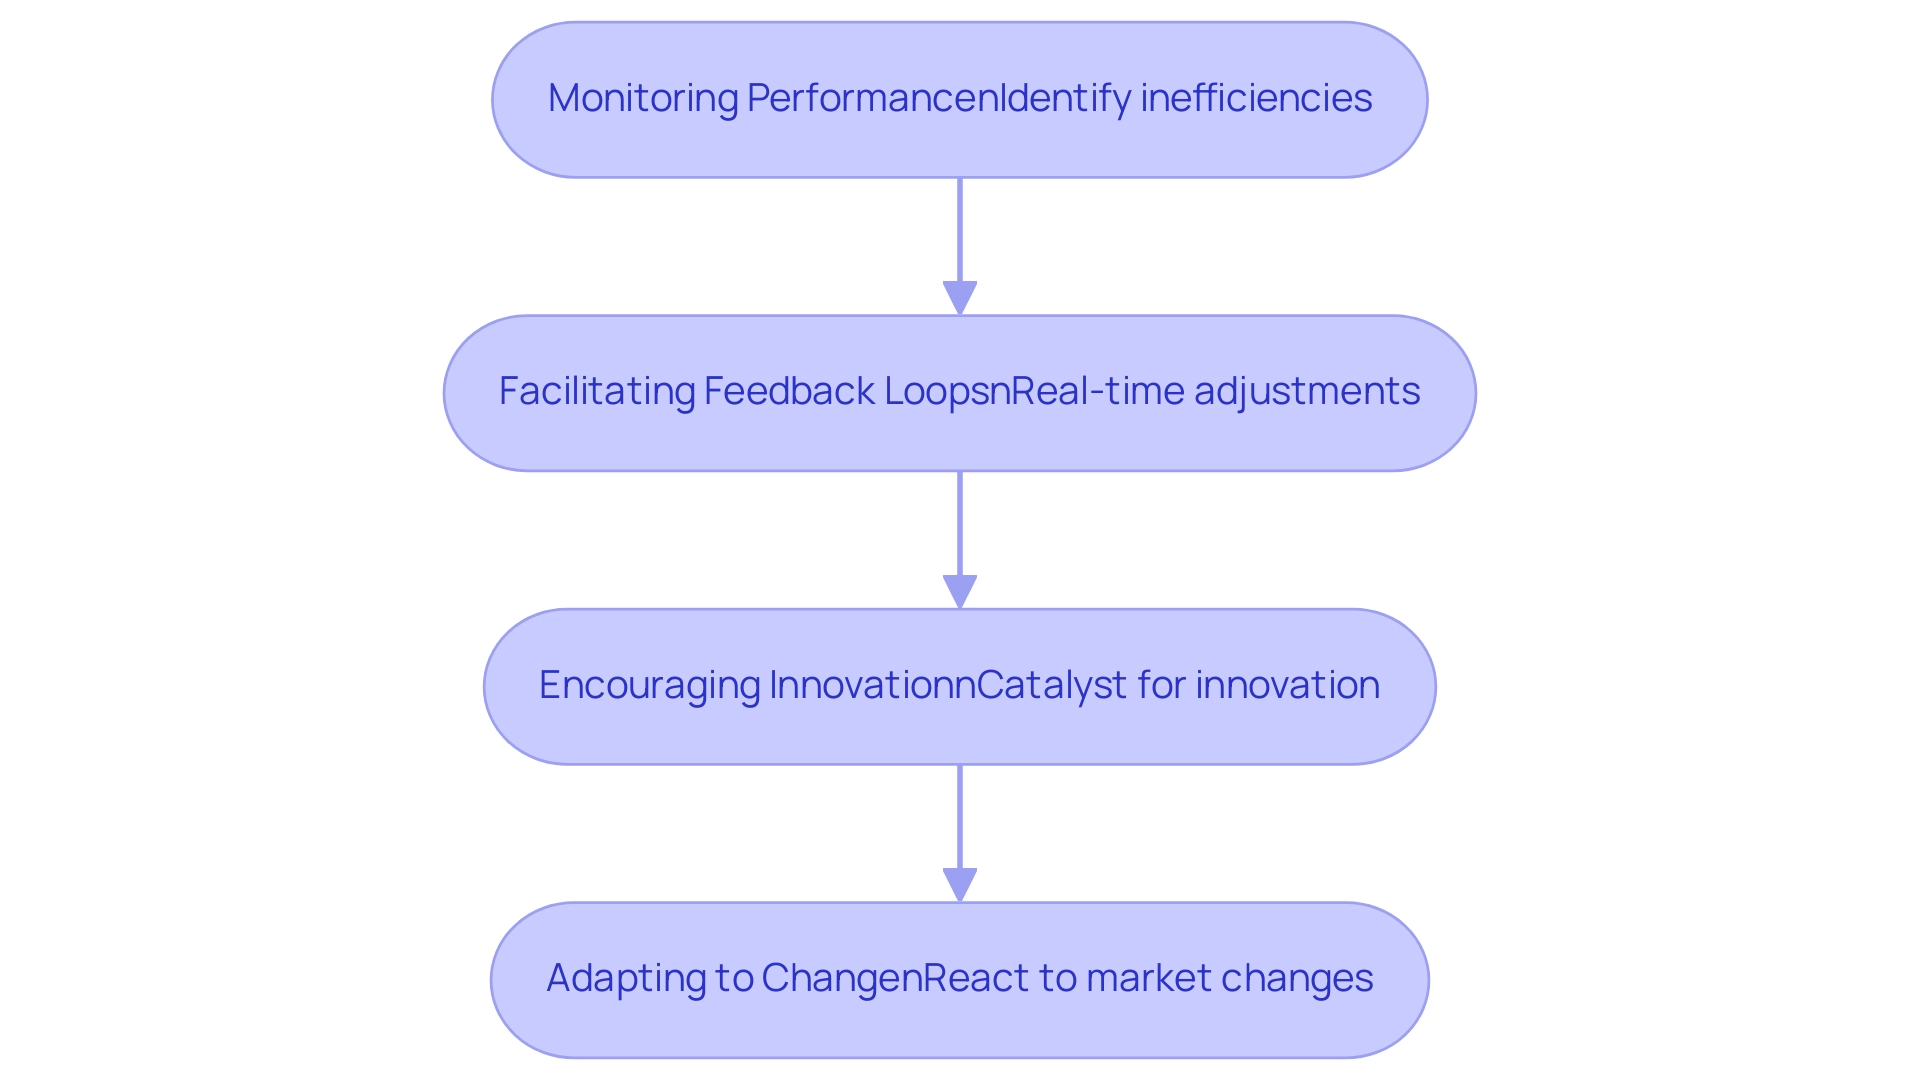
Analytics are essential for promoting continuous enhancement within entities by:
-
Monitoring Performance: Regular tracking of key performance indicators (KPIs) is essential for identifying areas that require attention. This proactive approach enables organizations to pinpoint inefficiencies and implement timely interventions. Significantly, only 33% of data leaders currently monitor the return on investment (ROI) of their data teams, indicating a critical need for improved metrics and accountability in these initiatives. Leveraging Robotic Process Automation (RPA) can significantly enhance this monitoring process, streamlining workflows and reducing errors, ultimately leading to better performance insights. Furthermore, Creatum GmbH’s customized AI solutions can further enhance this process by offering sophisticated analytical capabilities that align with specific business needs.
-
Facilitating Feedback Loops: By utilizing analytics, businesses can establish robust feedback loops that enhance decision-making processes. These loops allow for real-time adjustments to strategies based on data-driven insights, ensuring that organizations remain aligned with their goals. The integration of RPA further supports this by automating repetitive tasks, freeing up resources for more strategic analysis and feedback implementation, which is crucial for operational efficiency.
-
Encouraging Innovation: Insights derived from analytics serve as a catalyst for innovation. Organizations can leverage these insights to refine processes, develop new products, and enhance service delivery, ultimately driving growth and competitive advantage. Tailored solutions provided by Creatum GmbH improve information quality and simplify AI implementation, further fostering innovation. Client testimonials, including those from Herr Malte-Nils Hunold of NSB GROUP and Sascha Rudloff from PALFINGER Tail Lifts GMBH, emphasize how Creatum’s technology solutions have enhanced their efficiency and encouraged innovation.
-
Adapting to Change: In a rapidly evolving market landscape, agility is paramount. Ongoing analysis enables entities to quickly react to market changes and challenges, ensuring they stay resilient and proactive. The significance of Business Intelligence (BI) and RPA in generating insights through the 4 levels of analytics based on information cannot be overstated, as they allow companies to adjust effectively to shifts in their surroundings.
The importance of analysis in ongoing enhancement is highlighted by the fact that 68% of Chief Data Officers express a desire to improve their use of information and analysis. Additionally, specialists anticipate significant growth in the need for data professionals, emphasizing the rising significance of analysis in enhancing efficiency. By establishing effective performance monitoring through analytics and leveraging RPA, organizations can not only enhance operational efficiency but also foster a culture of continuous improvement that is responsive to feedback and innovation.
Conclusion
The integration of the four levels of analytics—Descriptive, Diagnostic, Predictive, and Prescriptive—serves as a foundational strategy for organizations aiming to enhance operational efficiency and drive informed decision-making. Each level contributes uniquely to the analytical landscape:
- Descriptive analytics provides insights into past performance.
- Diagnostic analytics uncovers the causes behind outcomes.
- Predictive analytics forecasts future trends.
- Prescriptive analytics guides actionable decision-making.
By leveraging these analytics levels, organizations can transform raw data into meaningful insights that foster growth and innovation.
Implementing these analytics effectively requires a systematic approach that includes:
- Establishing clear objectives
- Creating robust data governance frameworks
- Fostering collaboration across departments
Moreover, organizations must prioritize continuous improvement through regular monitoring of performance metrics and adapting strategies in response to evolving business needs. Embracing modern technologies, such as Robotic Process Automation (RPA) and tailored AI solutions, further enhances the capacity to derive insights from data, streamline workflows, and reduce errors.
As the importance of data-driven strategies grows in the modern business landscape, organizations that effectively harness the power of analytics will position themselves for success. By investing in analytics capabilities and cultivating a culture that values data insights, businesses can not only enhance operational efficiency but also drive innovation and adaptability in an increasingly competitive environment. The journey towards leveraging analytics is a continuous one, where the commitment to improvement and the embrace of technology will ultimately yield significant dividends in operational performance and strategic growth.
Frequently Asked Questions
What are the four levels of analytics?
The four levels of analytics are Descriptive, Diagnostic, Predictive, and Prescriptive. Each level serves a distinct role in enhancing operational efficiency.
What is Descriptive Analytics?
Descriptive Analytics summarizes historical information to provide insights into past performance. It analyzes trends and patterns, helping organizations understand what has transpired, which is crucial for informed decision-making.
How can Descriptive Analytics be improved?
Tools like EMMA RPA from Creatum GmbH can automate data collection processes, ensuring the information used for descriptive analytics is accurate and timely.
What does Diagnostic Analytics do?
Diagnostic Analytics builds on descriptive insights by uncovering the reasons behind specific outcomes. It identifies correlations and patterns, allowing organizations to understand the factors influencing past events.
How does Diagnostic Analytics assist organizations?
It helps pinpoint areas for improvement and optimize processes, particularly in addressing issues like task repetition fatigue and staffing shortages, often streamlined through RPA solutions.
What is Predictive Analytics?
Predictive Analytics uses historical data to forecast future trends and outcomes, enabling organizations to anticipate changes in the market or operational environment for proactive adjustments.
What enhances Predictive Analytics capabilities?
The integration of AI, such as Small Language Models, can improve the quality of information and the efficiency of analysis, enhancing predictive capabilities.
What is Prescriptive Analytics?
Prescriptive Analytics is the most advanced level that offers actionable recommendations based on comprehensive data evaluation, helping entities make informed choices by assessing different scenarios and their potential effects.
How does Prescriptive Analytics improve an organization?
When combined with descriptive, diagnostic, and predictive analytics, it significantly enhances an organization’s analytical strategy, leading to operational improvements.
Can you provide an example of the effectiveness of these analytics levels?
A notable case study showed that a mid-sized company improved efficiency by automating data entry and software testing, achieving a 70% reduction in data entry errors and an 80% improvement in workflow efficiency.
Why is alignment of KPIs important in analytics?
Aligning key performance indicators (KPIs) across departments is critical as misalignment can undermine the efforts of data teams, impacting overall effectiveness.
How do analytics drive operational efficiency?
Analytics help identify inefficiencies, enhance decision-making, optimize resources, and drive continuous improvement, ultimately leading to more strategic and efficient operations.
What are some real-world examples of companies benefiting from analytics?
A major airline reduced delays by 25% using real-time information analysis, and a mid-sized firm enhanced efficiency by automating processes, significantly decreasing manual entry errors by 70%.
Overview
Predictive analytics serves as a powerful tool for forecasting future events by meticulously analyzing historical data to identify patterns and trends. This capability enables organizations to anticipate potential scenarios effectively. Notably, while predictive analytics addresses the question, “What might occur?”, prescriptive analytics elevates this by recommending specific actions based on those forecasts. This advancement significantly enhances decision-making processes across various sectors, providing a crucial edge in today’s competitive landscape.
Introduction
In an era where data is revered as the new oil, organizations are increasingly leveraging analytics to navigate the complexities of decision-making. At the forefront of this revolution are predictive and prescriptive analytics, which provide powerful tools not only to forecast potential outcomes but also to recommend actionable strategies. As businesses endeavor to maintain a competitive edge, grasping the nuances between these two types of analytics becomes essential.
With applications spanning diverse sectors such as healthcare, finance, and retail, the integration of these analytics enhances operational efficiency while driving innovation and growth. This article explores the significance, techniques, and real-world applications of predictive and prescriptive analytics, underscoring their transformative impact on modern business practices. Understanding these tools is not just beneficial; it is imperative for those looking to thrive in today’s data-driven landscape.
Understanding Predictive and Prescriptive Analytics
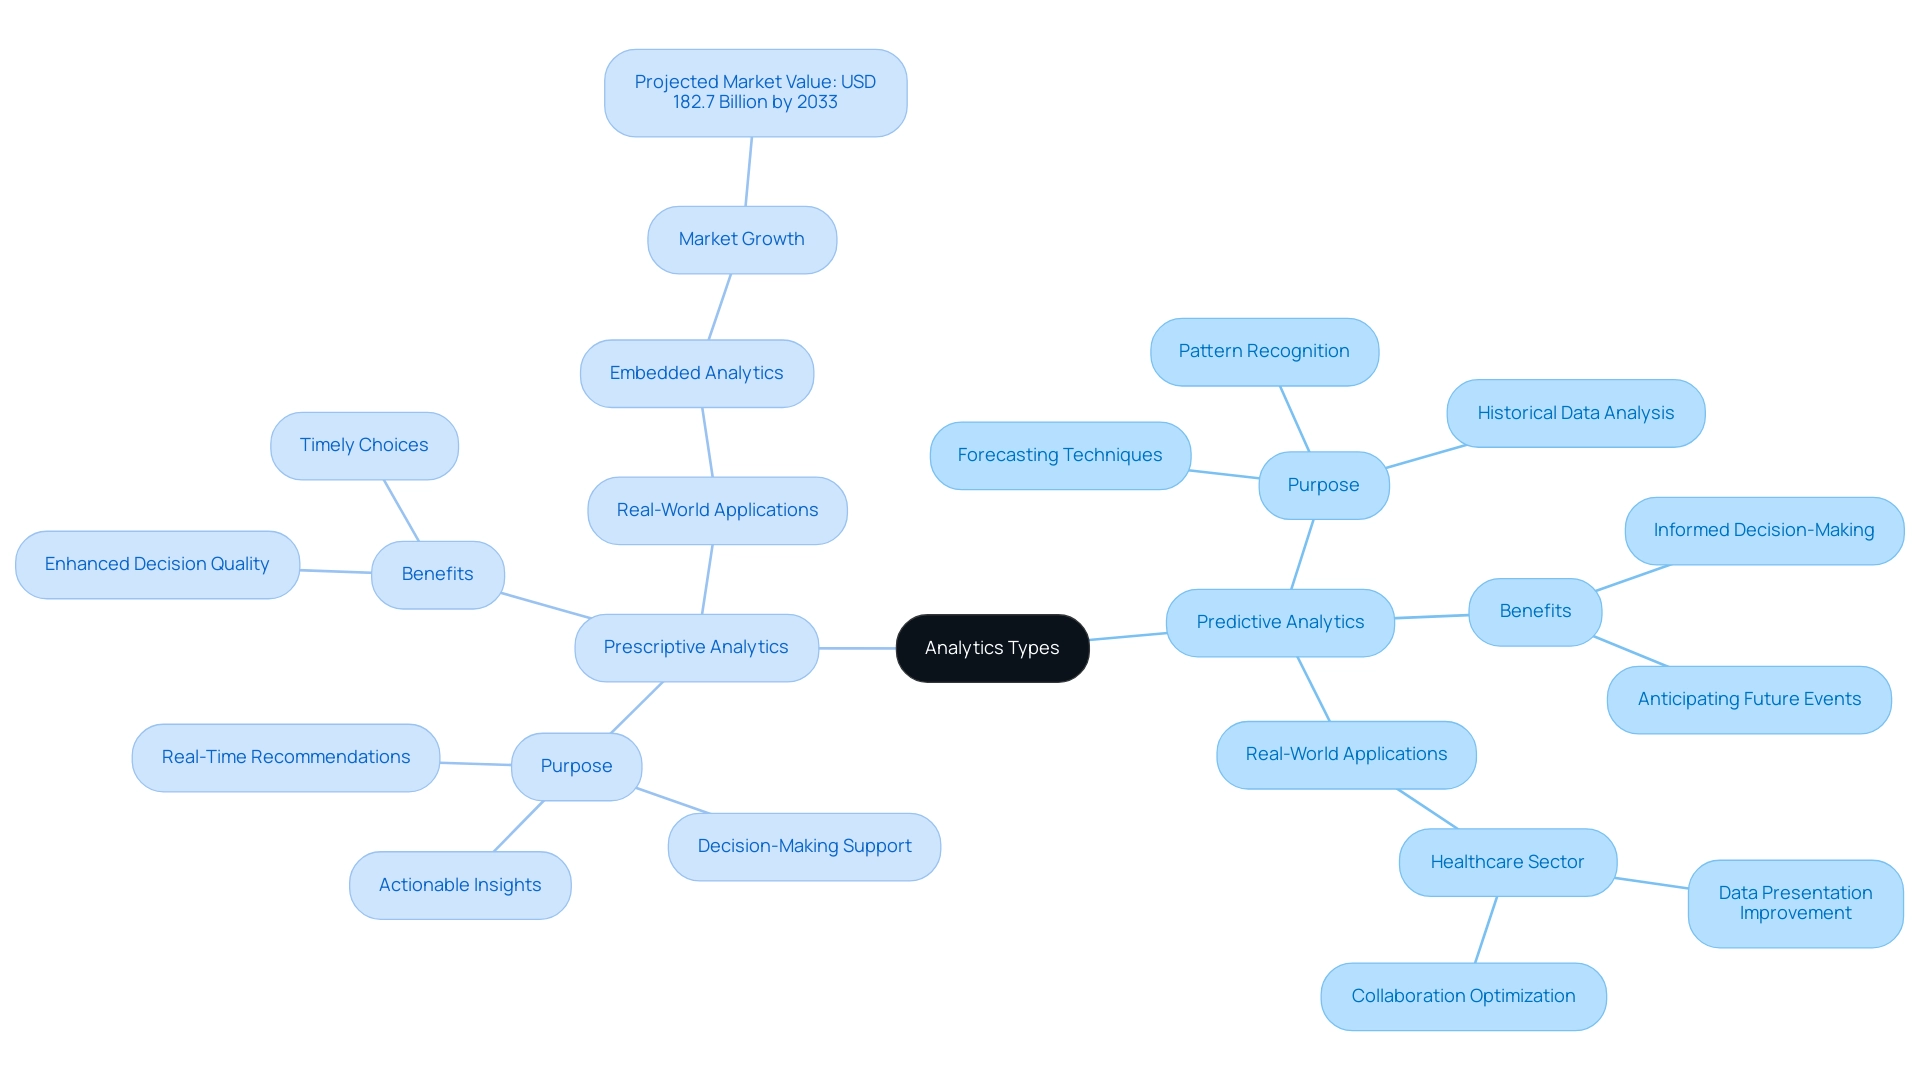
Predictive analysis exemplifies an analytics type that forecasts future events by leveraging historical data and statistical algorithms to project outcomes, effectively addressing the question, ‘What might occur?’ By discerning patterns and trends from prior information, organizations can anticipate potential scenarios and make informed decisions. Notably, 85% of firms currently employ forecasting techniques to enhance their decision-making processes, illustrating its widespread acceptance and effectiveness.
In contrast, prescriptive analysis takes this a step further by not only anticipating results but also recommending specific actions based on those forecasts. It tackles the question, ‘What should we do?’ by offering actionable insights that guide decision-making processes.
This type of analysis proves especially advantageous in dynamic contexts where timely and knowledgeable choices are essential for success.
Key aspects of predictive analysis encompass its ability to evaluate past information, recognize patterns, and predict future occurrences, while prescriptive analysis focuses on enhancement and decision-making support. Current trends for 2025 indicate an increasing emphasis on integrating these analytical categories into business operations, with companies progressively acknowledging the importance of testing and validation, explicit decision rights, and continuous learning to effectively implement self-executing systems. Moreover, leveraging AI solutions, such as customized Small Language Models and GenAI workshops, can significantly enhance information quality and governance challenges in business reporting.
These tools not only improve the accuracy of information but also empower teams through practical training, ensuring that decision-makers possess the necessary skills to utilize insights effectively.
Real-world examples underscore the transformative impact of these insights. For instance, in the healthcare sector, integrated data analysis has been adopted to enhance data presentation and collaboration, optimizing processes and extracting valuable insights. The market for embedded data analysis is projected to reach USD 182.7 billion by 2033, highlighting the growing demand for integrated data solutions.
This integration not only improves decision-making but also boosts productivity across various fields, particularly through the application of Robotic Process Automation (RPA), which streamlines workflows and reduces operational costs.
As companies continue to evolve, it becomes crucial to understand the distinctions between forecasting and prescriptive data analysis, particularly regarding which analytics type forecasts future events. While forecasting tools provide insights, prescriptive analysis enables organizations to take decisive actions. As noted, ‘Self-service data platforms empower non-technical users to explore data and generate insights without relying on data scientists or IT teams.’
Ultimately, both forecasting and prescriptive analysis drive growth and innovation in an increasingly data-driven environment, underscoring the significance of Business Intelligence in facilitating informed decision-making.
The Significance of Predictive Analytics in Forecasting
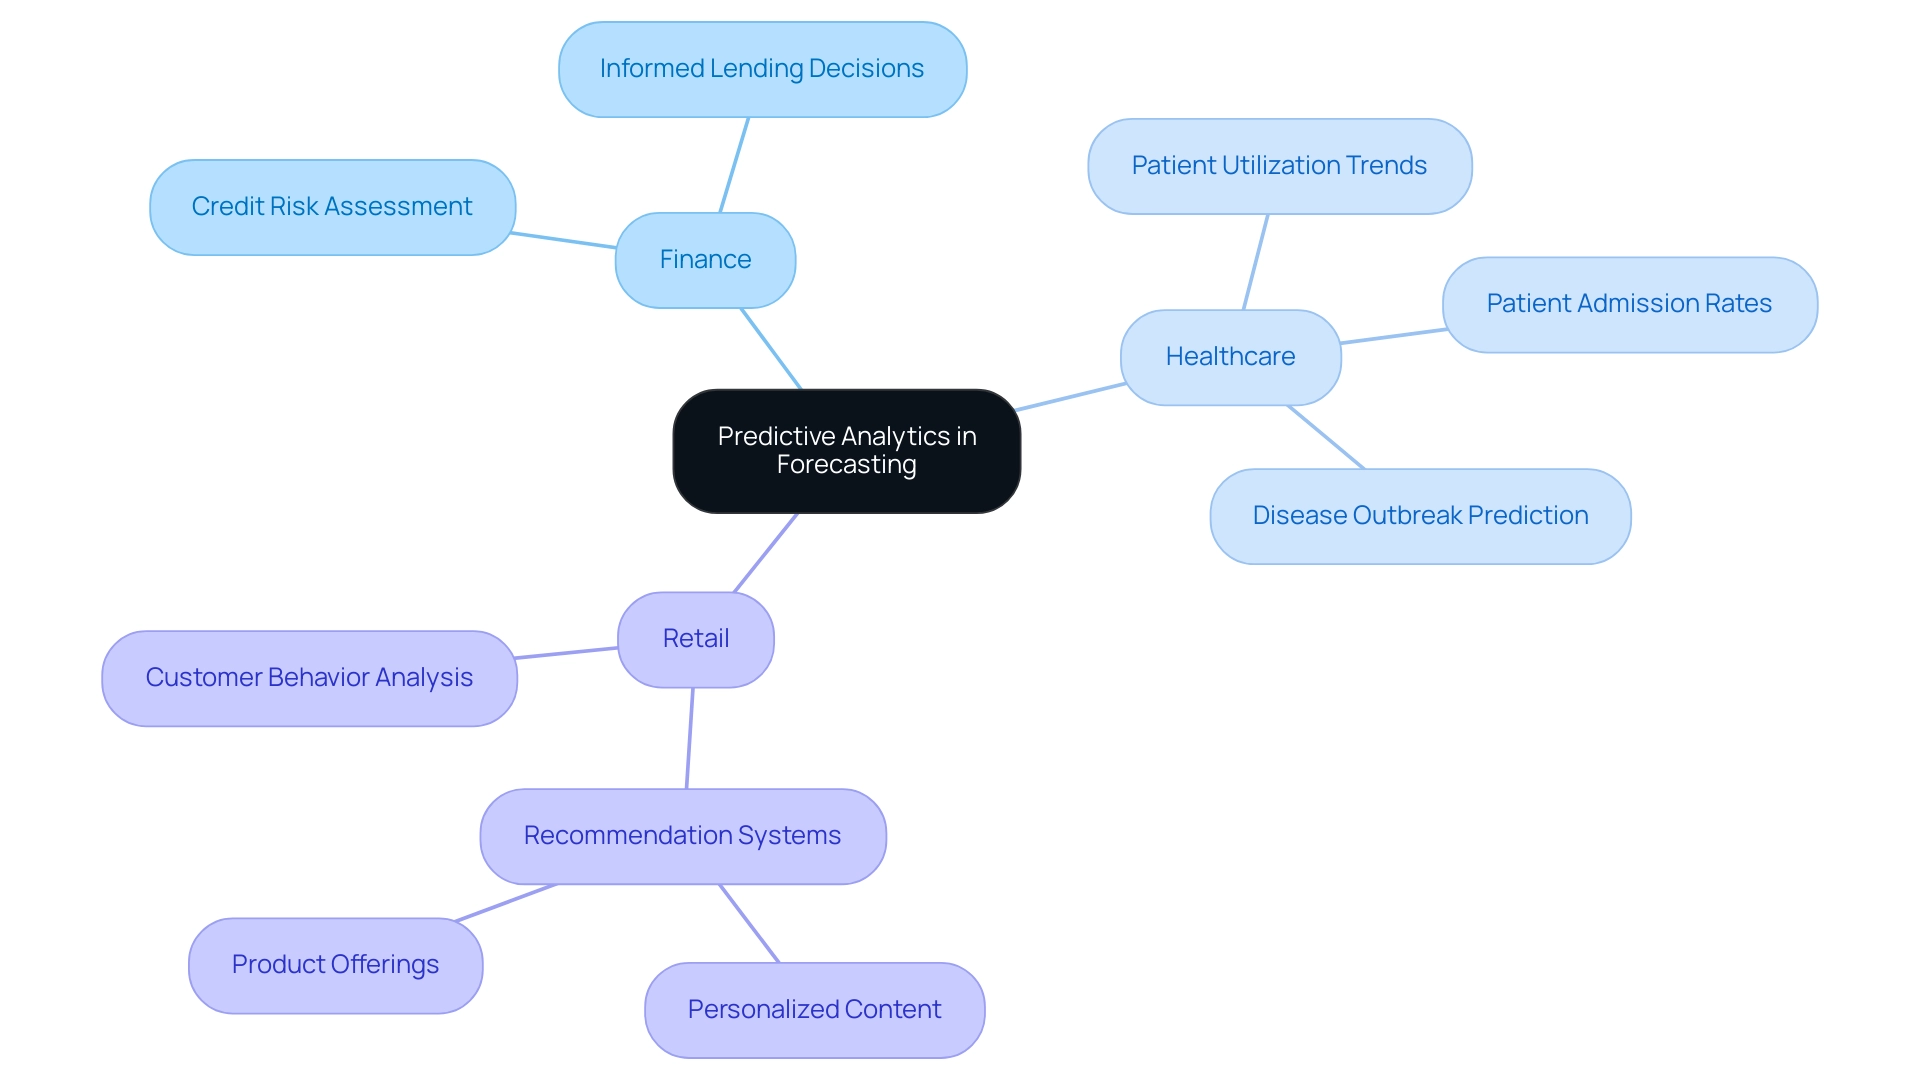
In sectors such as finance, healthcare, and retail, predictive analysis exemplifies an analytics type that forecasts future events, empowering organizations to anticipate market trends, customer behaviors, and operational challenges. For instance, in finance, forecasting models assess credit risk, enabling institutions to make informed lending decisions and mitigate potential losses. In healthcare, forecast modeling anticipates patient admission rates and recognizes patient utilization trends, allowing hospitals to enhance staffing and resource distribution, ultimately improving patient care and operational efficiency.
As Bilyana Petrova notes, “As medical professionals can more accurately diagnose patients, they can determine the most effective course of treatment tailored to the patient’s unique health situation.”
The significance of forecasting data extends beyond individual entities; it plays a crucial role in public health administration by anticipating disease outbreaks and enabling preventive actions. This proactive approach not only enhances health outcomes but also reduces costs associated with emergency responses.
In retail, firms like Netflix and Amazon showcase the power of forecasting methods through their recommendation systems. By analyzing customer behavior data, these organizations customize content and product offerings to individual preferences, significantly boosting customer engagement and satisfaction. This data-driven strategy has proven to enhance operational efficiency, as businesses can allocate resources more effectively based on anticipated demand.
As we approach 2025, the importance of forecasting data in finance, healthcare, and retail prompts a reevaluation of which analytics type forecasts future events. Organizations leveraging these insights can enhance operational efficiency and drive innovation and growth. For example, a mid-sized healthcare company that implemented GUI automation through Creatum GmbH experienced a 70% reduction in data entry errors and a 50% acceleration in software testing processes, leading to an 80% improvement in workflow efficiency.
As Herr Malte-Nils Hunold, VP Financial Services at NSB GROUP, states, “The implementation of GUI automation has transformed our operational processes, allowing us to focus more on patient care rather than administrative tasks.” Such measurable outcomes underscore the transformative impact of automation on operational efficiency. Expert opinions emphasize that the ability to anticipate market trends and customer needs is essential for maintaining a competitive edge in today’s data-rich environment.
Techniques and Models in Predictive Analytics
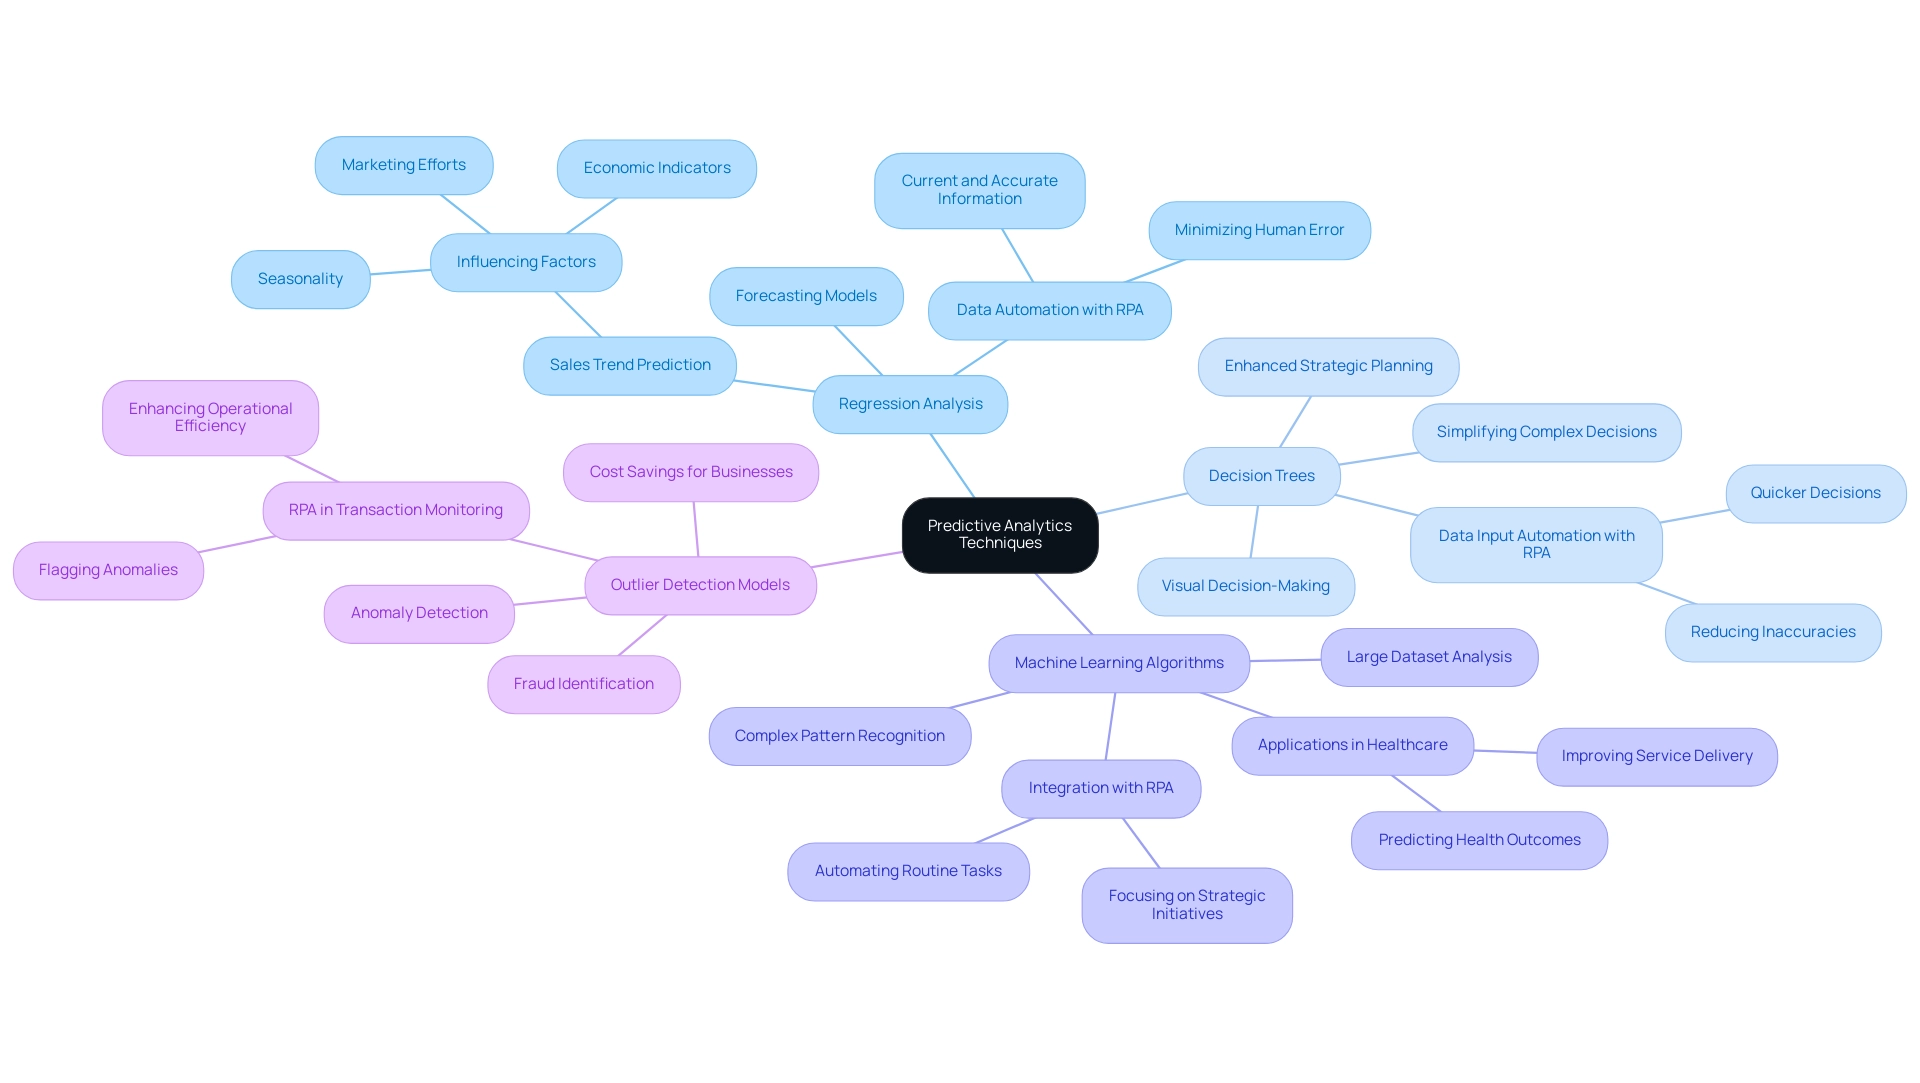
In the realm of predictive analysis, several key techniques stand out for their effectiveness, particularly when considering which analytics type forecasts future events. Among these, regression analysis, decision trees, and machine learning algorithms play pivotal roles. As companies increasingly seek to enhance operational efficiency, integrating Robotic Process Automation (RPA) into these analytics processes can significantly streamline workflows, reduce manual effort, and minimize errors, ultimately freeing teams for more strategic, value-adding work.
Regression analysis is a statistical technique that identifies relationships between variables, enabling organizations to understand how changes in one variable can impact another. This method is particularly efficient in forecasting models, which aim to predict future occurrences, as it provides a solid foundation for making informed decisions based on historical data. For instance, businesses can utilize regression analysis to anticipate sales trends influenced by factors such as seasonality, marketing efforts, and economic indicators.
By automating data gathering and analysis through RPA, organizations can ensure their forecasting models are based on the most current and accurate information, thus enhancing the reliability of predictions and minimizing human error.
Decision trees, conversely, offer a visual representation of decision-making processes. They decompose complex decisions into simpler, more manageable components, facilitating stakeholder understanding of potential outcomes from various choices. This technique not only aids in predicting results but also bolsters strategic planning by illustrating the pathways leading to different outcomes.
RPA can enhance the decision-making process by automating data inputs for these models, allowing for quicker, more informed decisions while reducing the risk of inaccuracies.
Machine learning algorithms, such as neural networks and support vector machines, are increasingly employed in forecasting due to their ability to analyze large datasets and uncover complex patterns. These algorithms excel in handling large-scale forecasting tasks, making them invaluable in sectors such as healthcare and finance. For example, machine learning-driven forecasting techniques can refine treatment strategies in healthcare by analyzing patient data to predict health outcomes, thereby improving service delivery.
Indeed, forecasting analysis can significantly enhance treatment and healthcare services, showcasing its practical advantages in real-world applications. Incorporating RPA into these processes can further improve efficiency by automating routine tasks, allowing professionals to focus on more strategic initiatives and driving business growth.
As of 2025, the landscape of predictive analytics continues to evolve, with the latest techniques emphasizing the integration of advanced algorithms that enhance accuracy and efficiency. Techniques such as ensemble methods, which combine multiple models to improve predictions, are gaining traction. Additionally, outlier detection models are becoming essential for identifying anomalous points that may indicate fraud or operational inefficiencies, particularly in sectors like retail and finance.
As noted by Valeryia Yeusianeva, “The outlier model identifies anomalous elements in a set that may exist either independently or alongside other categories and numbers.” These models not only assist in anomaly detection but also play a crucial role in cost savings for businesses by identifying potential fraud. RPA can contribute in this area by automating transaction monitoring and flagging anomalies for further investigation, thereby enhancing operational efficiency.
Real-world applications of these techniques underscore their value. Organizations leveraging predictive data analysis can uncover insights that lead to enhanced operational efficiency, increased profitability, and improved customer satisfaction. By employing regression analysis, decision trees, and machine learning algorithms, alongside RPA, businesses can anticipate trends and refine their strategies based on insights into consumer behavior and market dynamics.
The case study titled “Business Value of Predictive Analytics Techniques” illustrates how these methodologies equip businesses with tools to prepare for future trends and optimize decision-making, further emphasizing their significance in today’s data-driven landscape.
Predictive vs. Prescriptive Analytics: Key Differences
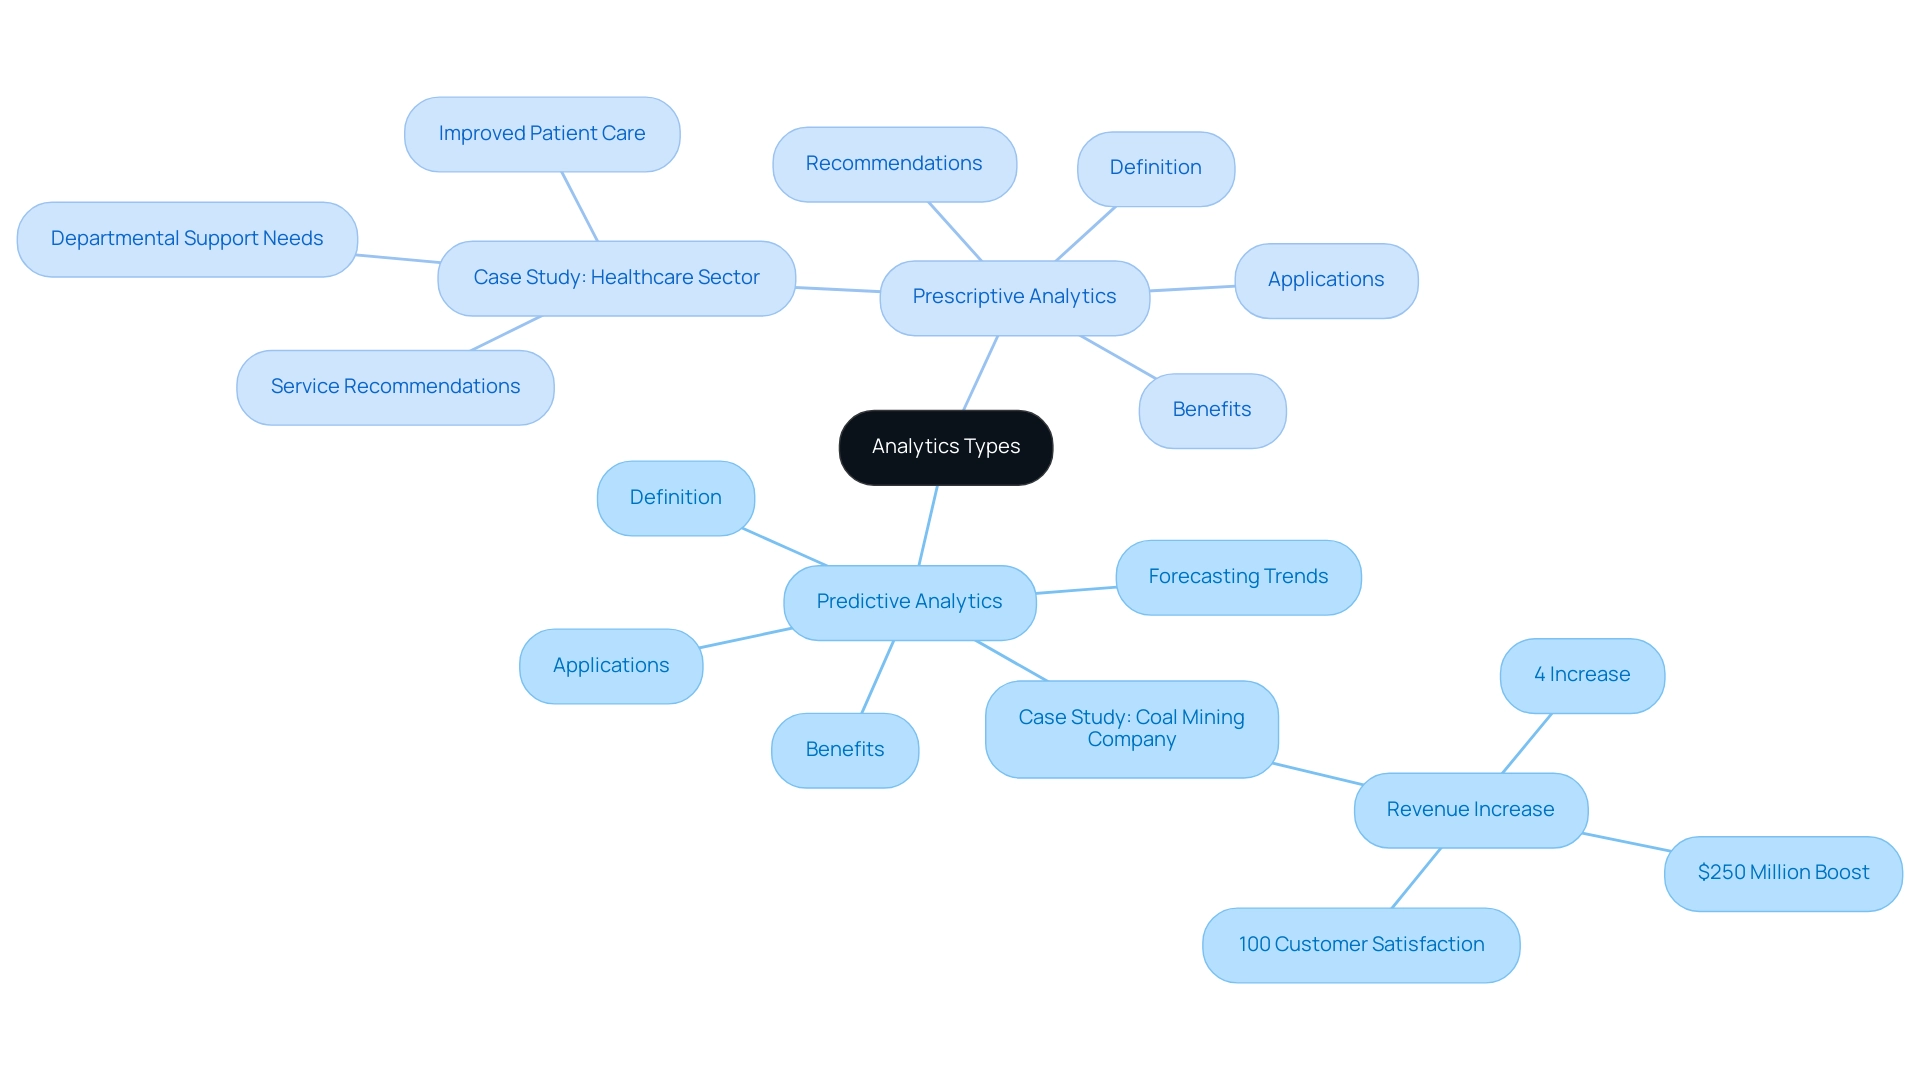
Predictive analysis represents a powerful tool in analytics, focusing on forecasting future events by examining historical data and potential outcomes. This approach empowers businesses to anticipate trends and behaviors effectively. However, measuring metrics in isolation can limit its effectiveness, as it may not provide a comprehensive view of potential outcomes. For instance, a coal mining company utilized predictive analysis to uncover patterns in operational efficiency, resulting in a 4% increase in annual revenue—an impressive $250 million boost—while achieving 100% customer satisfaction.
This analytical approach informs organizations about potential occurrences, allowing them to prepare accordingly for what lies ahead. In contrast, prescriptive analysis elevates this process by not only predicting outcomes but also recommending specific actions to achieve desired results. By synthesizing multiple data sources and leveraging machine learning techniques, prescriptive analysis offers actionable insights. A notable example of this can be seen in the healthcare sector, where prescriptive data analysis plays a crucial role in decision-making processes.
By addressing inquiries related to service suggestions and departmental support requirements, prescriptive analysis empowers healthcare entities to make informed choices, enhance operations, and improve patient care. The primary distinction between these two analytical types lies in their focus: predictive analysis identifies trends and patterns, while prescriptive analysis evaluates the overall impacts of various decisions and recommends optimal courses of action. This distinction is vital for organizations striving to refine their decision-making frameworks.
As businesses increasingly adopt data-driven strategies, understanding how predictive analytics informs potential outcomes and how prescriptive analytics enhances decision-making will be essential for achieving operational excellence. Moreover, integrating Robotic Process Automation (RPA) from Creatum GmbH can significantly boost operational efficiency by streamlining repetitive tasks, allowing teams to concentrate on strategic initiatives.
Tailored AI solutions, including Small Language Models and GenAI Workshops, further enhance information quality and governance, addressing challenges in business reporting such as poor master information quality and inconsistencies. Additionally, leveraging Business Intelligence tools like Power BI transforms raw data into actionable insights, ensuring efficient reporting and informed decision-making. By employing these advanced data analysis tools and technologies, organizations can drive growth and innovation in an increasingly competitive landscape.
Leveraging Prescriptive Analytics for Strategic Decision-Making
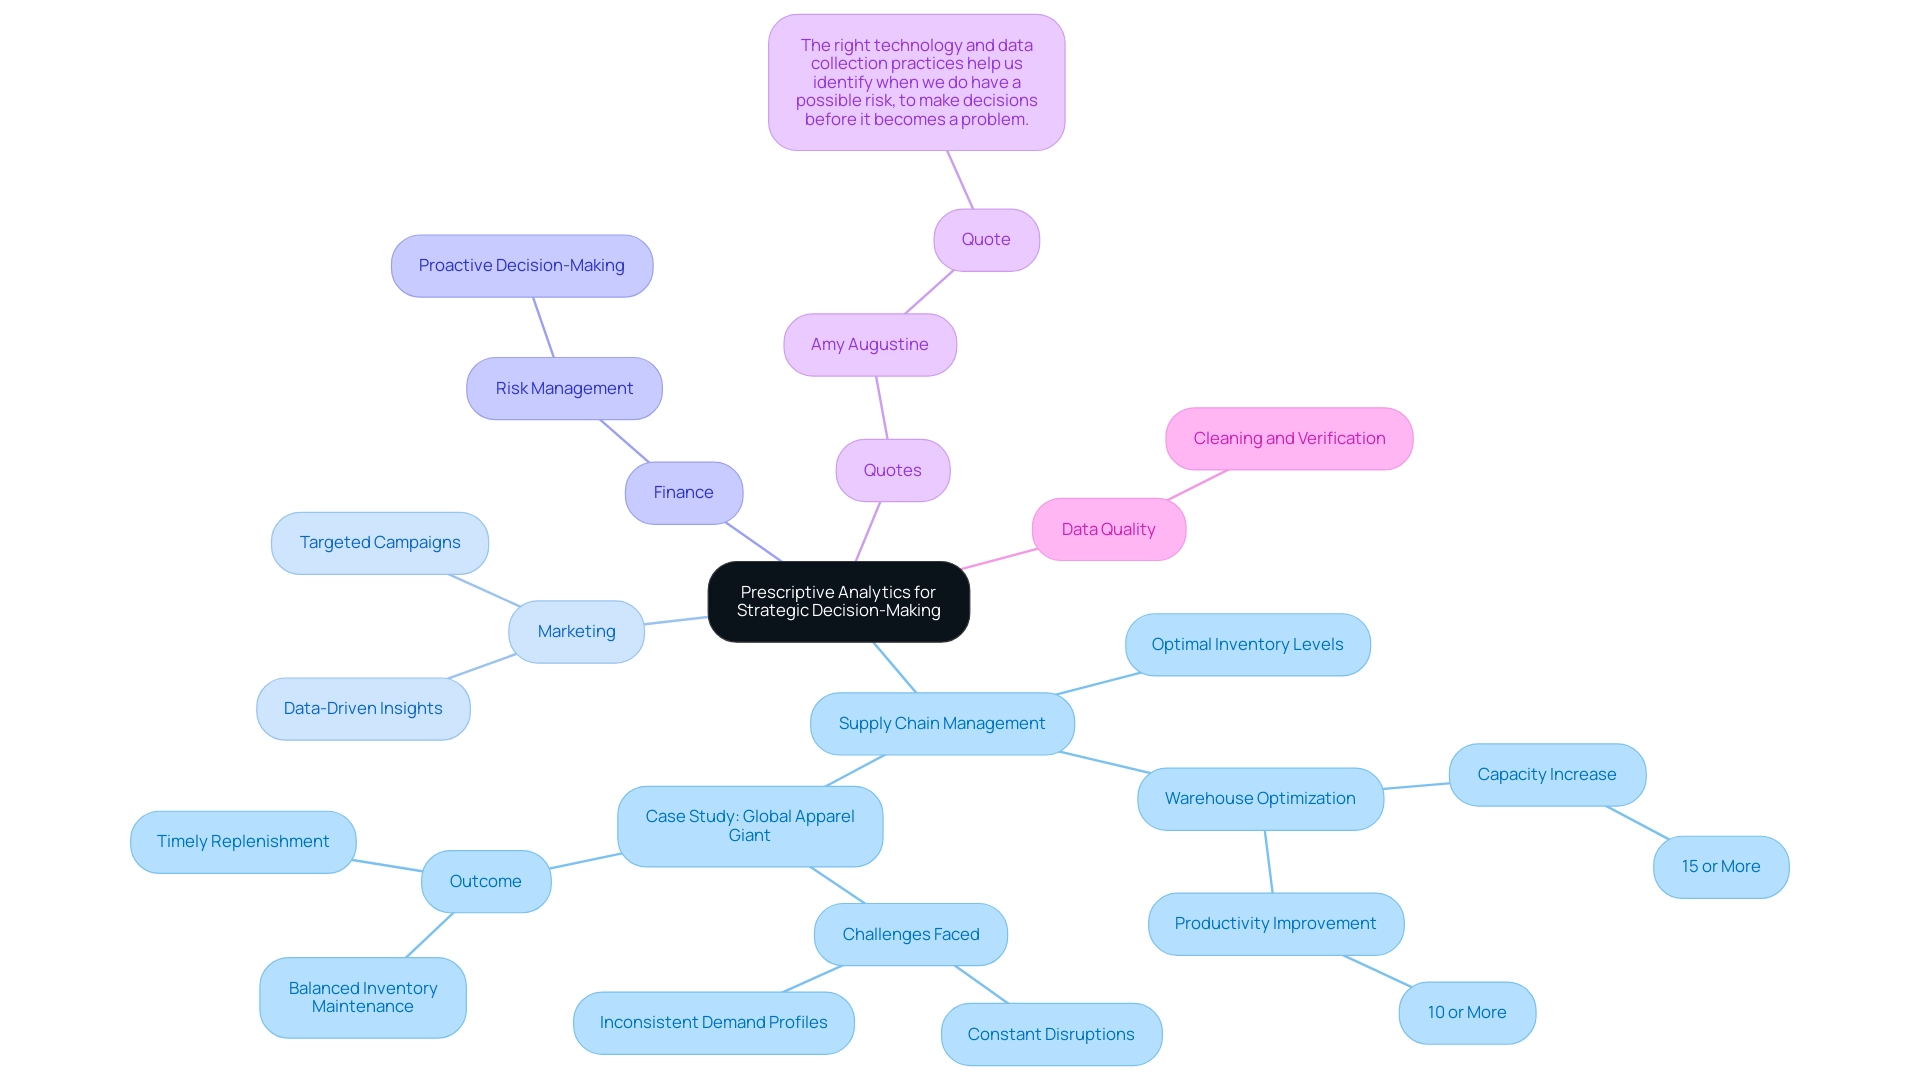
Prescriptive analysis is emerging as a pivotal tool in supply chain management, marketing, and finance, significantly enhancing decision-making processes. In supply chain management, for instance, prescriptive analysis can determine optimal inventory levels by analyzing predicted demand patterns. This ensures businesses maintain sufficient stock without overcommitting resources, leading to warehouse optimization that can increase capacity by over 15% and improve productivity by more than 10%.
Moreover, integrating Robotic Process Automation (RPA) into these workflows streamlines operations, reduces errors, and frees up teams for more strategic tasks, ultimately driving operational efficiency.
In marketing, prescriptive analytics plays a crucial role by suggesting targeted campaigns based on comprehensive customer behavior analysis. By leveraging data-driven insights, organizations can tailor their marketing strategies to resonate with specific audience segments, maximizing engagement and conversion rates. The integration of RPA and business intelligence tools enhances this process, enabling faster adjustments based on real-time information.
A notable case study involves a global apparel giant that faced challenges such as constant disruptions and inconsistent demand profiles. By employing prescriptive analysis for pricing and promotion enhancement, along with RPA for automating information gathering and reporting, the company gained insights into actual product demand and received practical suggestions for optimal pricing strategies. This approach not only helped maintain balanced inventory but also ensured timely replenishment of high-demand products, effectively bridging the gap between capacity, demand, and supply.
The impact of prescriptive data analysis extends beyond operational efficiency; it empowers organizations to make informed decisions that preemptively address potential risks. As emphasized by Amy Augustine, senior director of network supply chain at USCellular, “The right technology and information collection practices assist us in recognizing when we face a potential risk, enabling us to make choices before it evolves into an issue, and to adjust the supply chain to permit minimal or no disruption.” This highlights the significance of technology, including RPA, and information quality in effectively employing prescriptive analysis.
Furthermore, organizations are encouraged to clean and verify their data to maximize the effectiveness of these analyses. Overall, prescriptive analysis, enhanced by RPA, serves as a critical component in navigating the complexities of modern business environments, driving strategic decision-making across various sectors. Client testimonials from leaders like Herr Malte-Nils Hunold of NSB GROUP and Herr Sebastian Rusdorf of Hellmann Marine Solutions further affirm the transformative impact of Creatum GmbH’s technology solutions in enhancing operational efficiency and driving business growth.
Additionally, tailored AI solutions from Creatum GmbH can help businesses identify the right technologies to address their specific needs, navigating the rapidly evolving AI landscape and overcoming the challenges posed by manual, repetitive tasks.
Case Studies: Real-World Applications of Predictive and Prescriptive Analytics
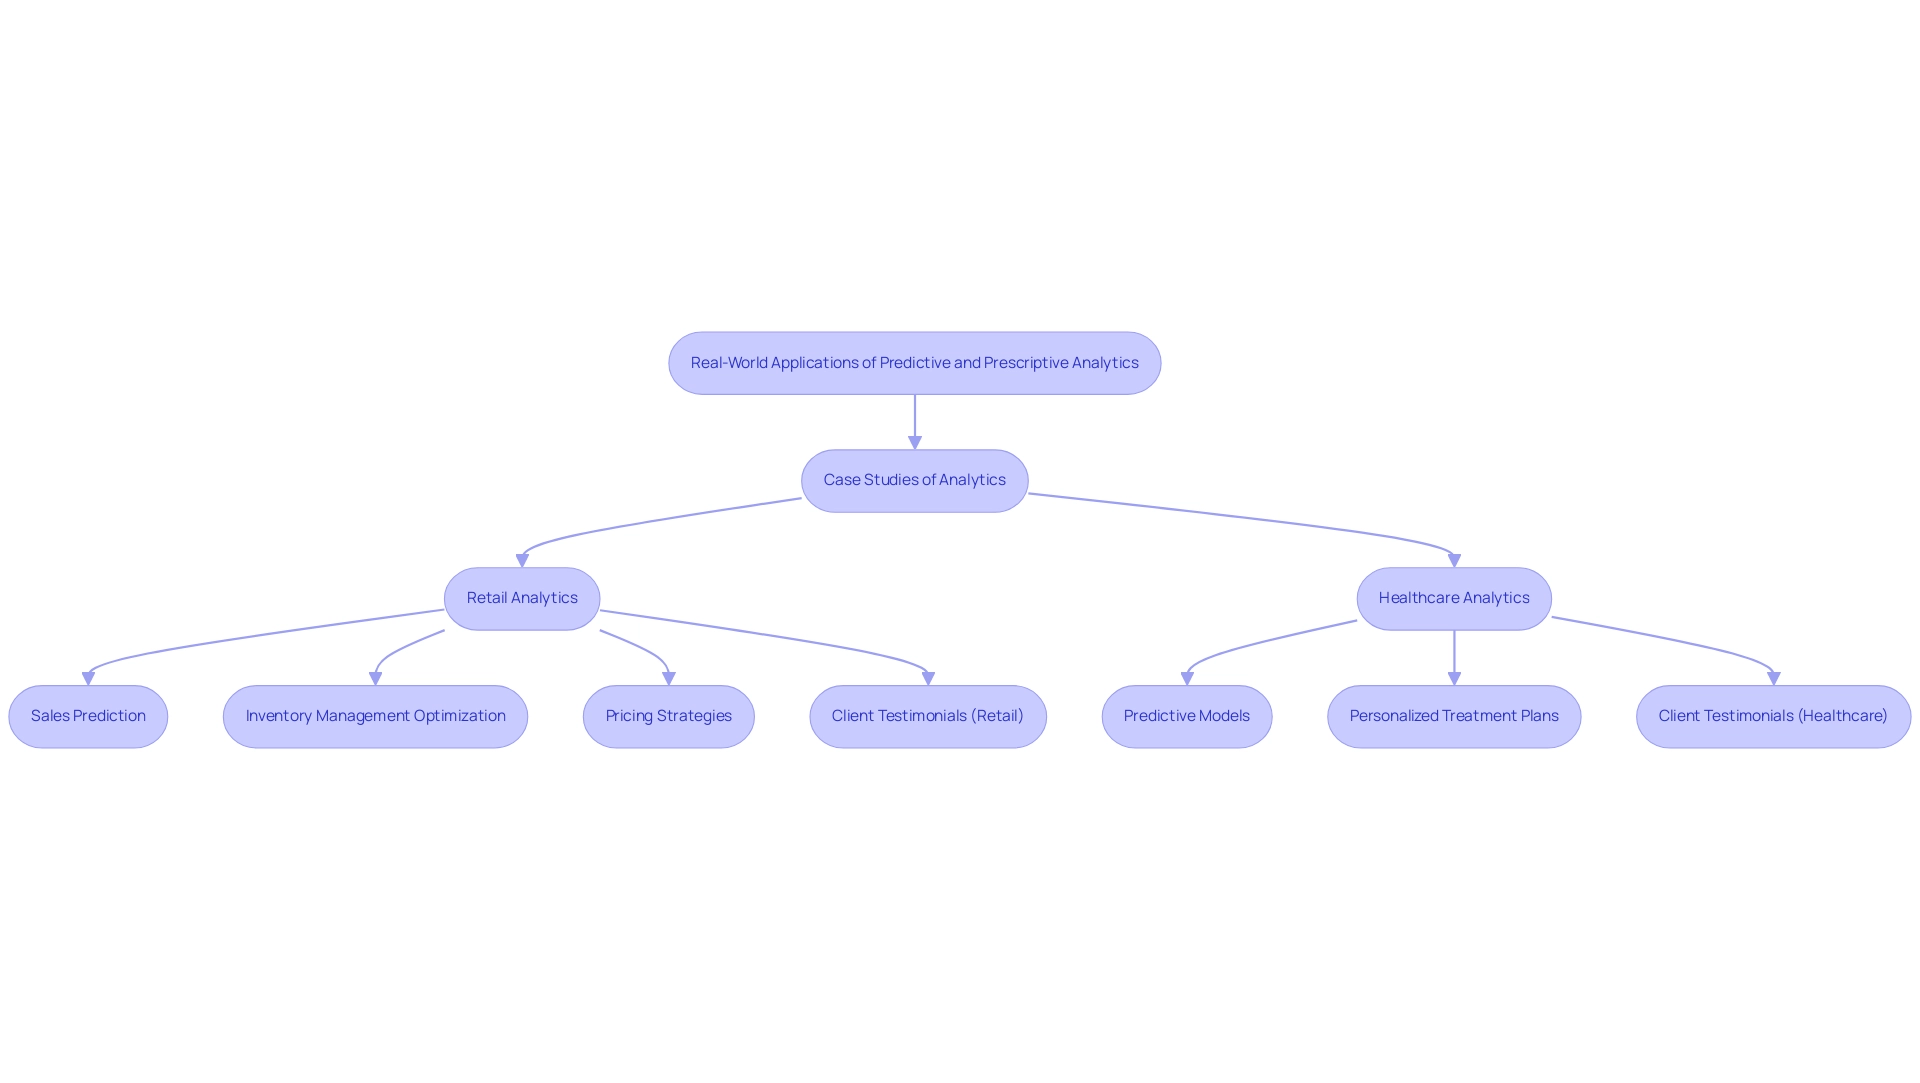
In the retail industry, a leading chain harnessed the power of foresight analysis to accurately predict sales patterns. This capability enabled them to optimize inventory management and significantly reduce stock shortages. Such a strategic approach not only improved operational efficiency but also elevated customer satisfaction by ensuring product availability. Recent studies underscore that forecasting analysis, a vital type of analytics aimed at predicting future events, has become essential for retail success. Organizations that develop robust forecasting capabilities experience substantial performance benefits.
Furthermore, forecasting analysis aids retailers in establishing equitable pricing strategies based on inventory levels and competitor pricing.
In parallel, a healthcare provider adopted prescriptive analysis to enhance patient outcomes. By leveraging predictive models to assess patient responses, they could recommend personalized treatment plans tailored to individual needs. This aligns with insights from David Ajiga, who highlights the growing intersection of Artificial Intelligence (AI) and financial forecasting, particularly in the stock market. His perspective underscores the critical role of analytics in driving success across various industries.
The significance of real-time decision-making and personalized marketing campaigns, enabled by Big Data Analytics, is paramount. These elements greatly enhance customer satisfaction and loyalty. The case study titled “Emerging Data Sources in Retail” illustrates how new data sources, such as location-based data and social media interactions, yield deeper insights into consumer preferences. This, in turn, refines marketing strategies and boosts customer engagement through more personalized and relevant offerings.
Client testimonials further validate the transformative potential of Creatum GmbH’s technology solutions. For example, Herr Malte-Nils Hunold, VP of Financial Services at NSB GROUP, remarked on how the implementation of Robotic Process Automation (RPA) streamlined their manual workflows, significantly enhancing operational efficiency. Similarly, Herr Sebastian Rusdorf, Regional Sales Director Europe at Hellmann Marine Solutions & Cruise Logistics, emphasized the impact of tailored AI solutions in navigating the complex AI landscape, enabling their company to align technology with specific business objectives.
Additionally, Sascha Rudloff, Team Leader of IT and Process Management at PALFINGER Tail Lifts GMBH, noted that Creatum’s solutions not only minimized errors but also liberated their team for more strategic, value-adding tasks.
These compelling case studies and testimonials underscore the essential roles of forecasting and prescriptive analysis, along with RPA, in fostering success across diverse sectors. As organizations increasingly adopt these analytical approaches, they gain a competitive edge by making informed decisions that enhance performance and drive innovation.
Challenges in Implementing Predictive and Prescriptive Analytics
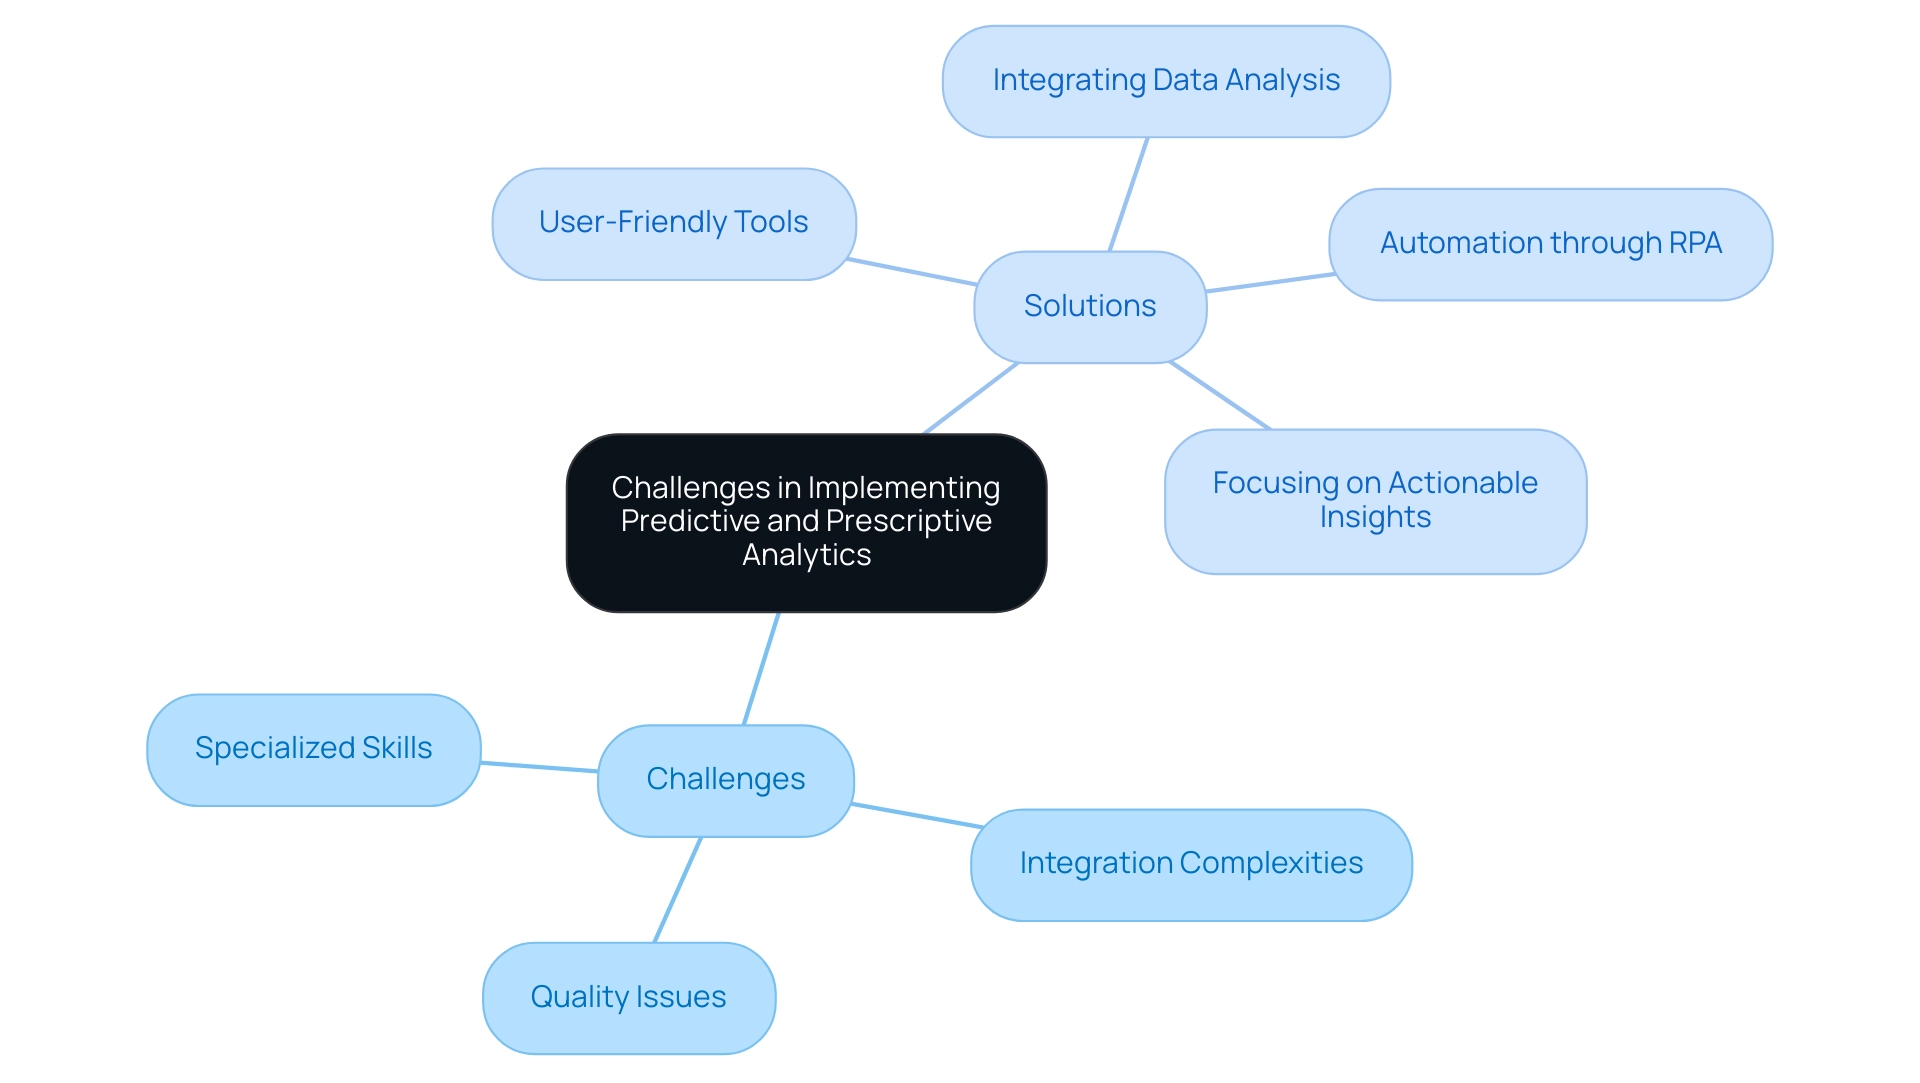
Organizations frequently grapple with significant challenges when implementing predictive and prescriptive analytics, including quality issues, integration complexities, and the necessity for specialized skills. The integrity of information is paramount; clean and relevant information is essential for generating accurate predictions. For instance, a case study titled ‘Challenges and Opportunities in Big Data for Healthcare‘ highlights how the increasing volume of data collected through advanced information technology presents both challenges and opportunities in leveraging big data for healthcare advancements.
Effective predictive modeling is essential to navigate these complexities, as it can significantly enhance healthcare delivery and patient outcomes. Moreover, integrating data analysis tools with existing systems often presents technical hurdles that can impede progress. Organizations must also consider the investment in training staff to effectively utilize these advanced data tools.
This is where Creatum GmbH’s 3-Day Power BI Sprint comes into play, offering a quick start to building professional reports that enable companies to concentrate on actionable insights. The 3-Day Power BI Sprint has been shown to reduce report creation time by up to 50%, enabling teams to make data-driven decisions faster. Optimal approaches for addressing these obstacles, based on recent findings, involve:
- Utilizing user-friendly tools
- Integrating data analysis within current workflows
- Automating regular tasks through Robotic Process Automation (RPA)
- Concentrating on actionable insights
By addressing these concerns, organizations can fully leverage forecasting and prescriptive analysis, which includes the analytics type that attempts to forecast what will happen in the future, ultimately enhancing decision-making and operational efficiency. Furthermore, the significance of strong forecasting models is underscored by the need for effective strategies to navigate the complexities of data quality, as highlighted in the literature (PMID 32175361).
The Future of Predictive and Prescriptive Analytics
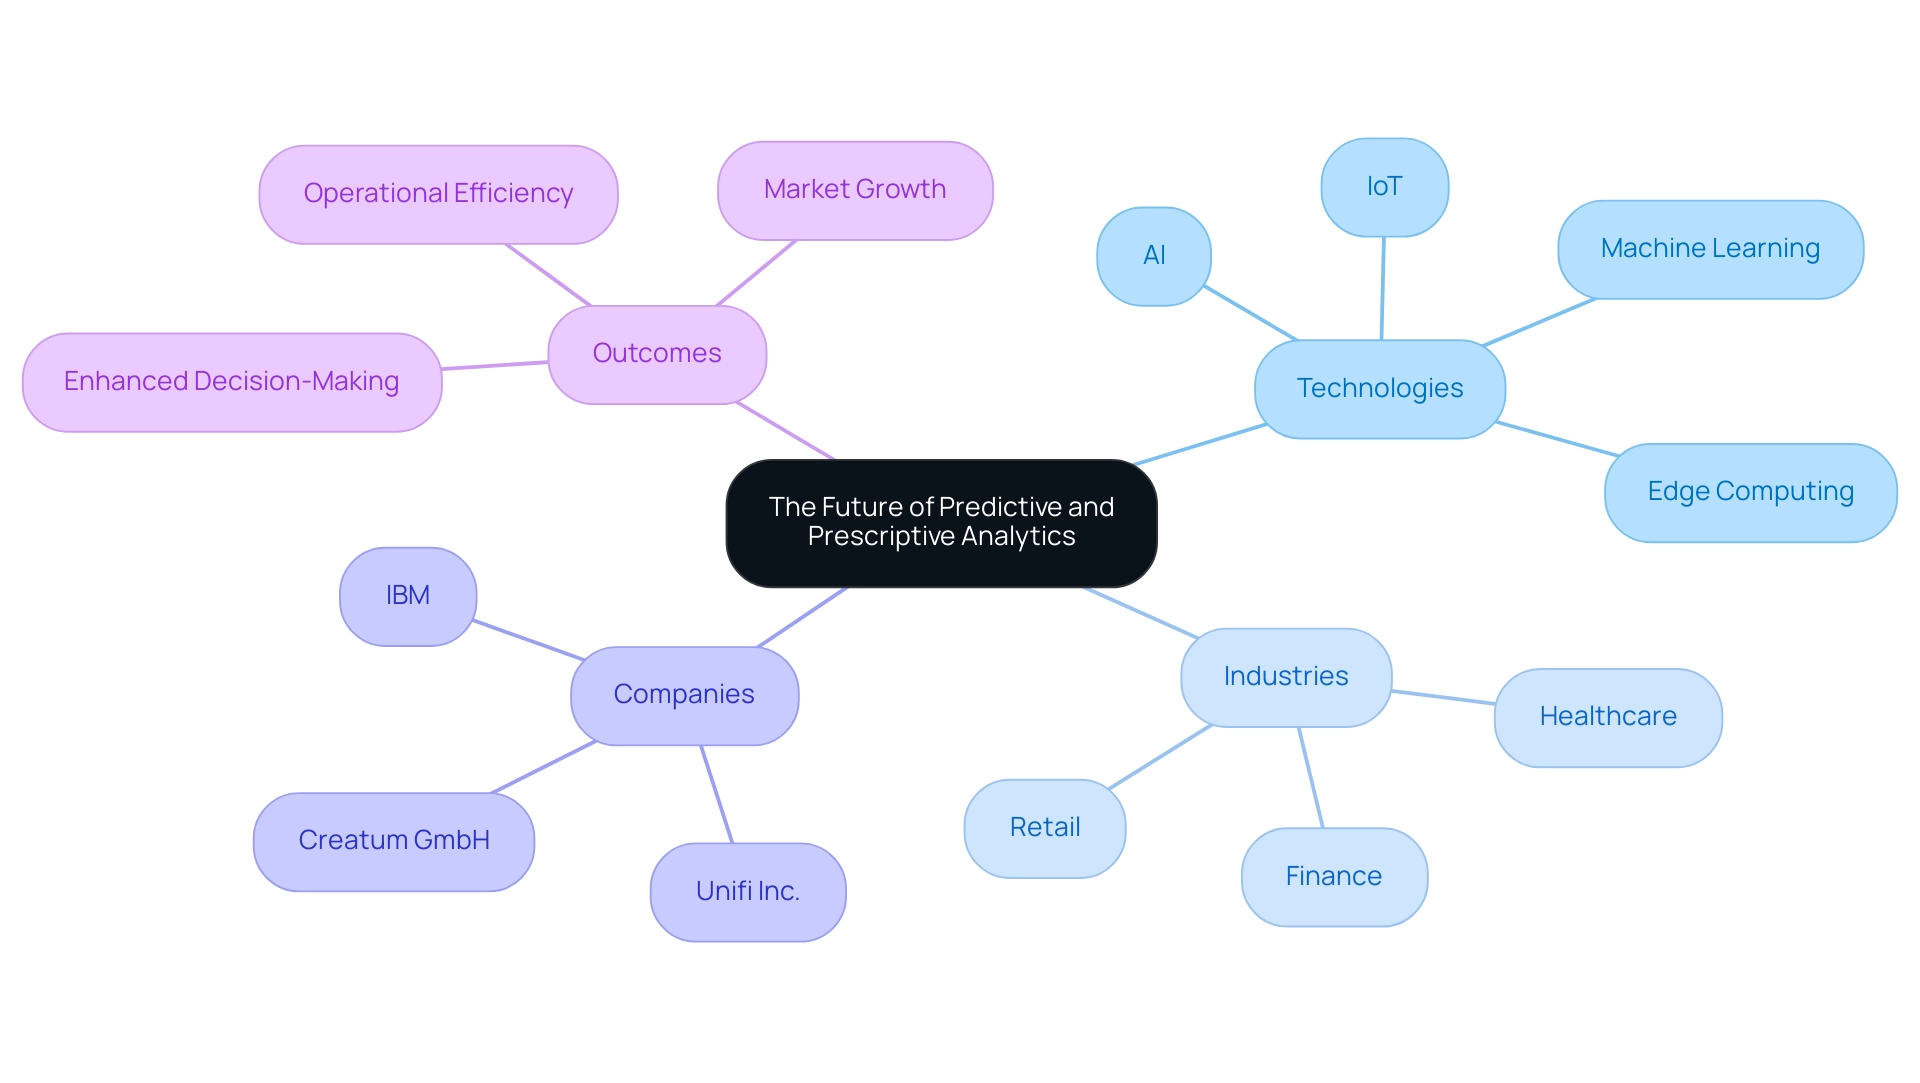
The future landscape of predictive and prescriptive data analysis is poised for remarkable expansion, largely fueled by breakthroughs in artificial intelligence (AI) and machine learning. As organizations increasingly shift towards data-driven decision-making, the integration of real-time analysis and automated insights is anticipated to become standard practice. This shift is underscored by the growing reliance on large information sets, with companies harnessing this data to enhance customer experiences and operational effectiveness.
In reality, businesses are progressively depending on extensive information sets to make insight-rich choices that boost performance.
The rise of edge computing and the Internet of Things (IoT) is further enhancing the capabilities of forecasting and prescriptive analysis. These technologies facilitate the gathering and examination of information at unprecedented speeds, empowering businesses to obtain actionable insights in real-time. For instance, companies like Unifi Inc. have implemented advanced safety risk analysis models to enhance ground handling operations, showcasing a real-world application of predictive methods in improving operational efficiency.
Looking ahead to 2025, the market for predictive and prescriptive techniques is projected to witness substantial growth, particularly in sectors such as finance, healthcare, and retail. North America leads this trend, driven by significant investments in analytical technologies and a robust information ecosystem. The emphasis on research and development in these areas is expected to propel market growth, as companies seek innovative methods to enhance operational efficiency through tools like Robotic Process Automation (RPA) and tailored AI solutions.
This is supported by a case study demonstrating that North America dominates the predictive and prescriptive analysis market due to significant investments and a strong information ecosystem. Furthermore, expert insights suggest that the integration of AI and machine learning with predictive analysis—analytics that forecasts future events—will not only improve forecasting accuracy but also enable organizations to predict future trends with greater precision. As businesses continue to adopt these advanced data solutions, the potential for enhanced decision-making and strategic planning will be transformative, positioning them for sustained success in an increasingly competitive landscape.
Additionally, companies like Creatum GmbH and IBM are key players in this space, providing comprehensive analytics solutions that underscore the importance of data management and advanced analytics, alongside the critical role of RPA in automating manual workflows and enhancing operational efficiency.
Conclusion
The exploration of predictive and prescriptive analytics underscores their crucial roles in navigating the complexities of modern business environments. Predictive analytics, primarily focused on forecasting future trends and behaviors through historical data analysis, empowers organizations to anticipate various scenarios and make informed decisions. In sectors such as finance, healthcare, and retail, the ability to predict outcomes is essential for enhancing operational efficiency and driving innovation.
Conversely, prescriptive analytics elevates the decision-making process by not only predicting outcomes but also recommending specific actions to achieve desired results. This analytical approach synthesizes multiple data sources to provide actionable insights, particularly in dynamic environments where timely decisions are critical. The integration of advanced technologies, including Robotic Process Automation and tailored AI solutions, further enhances the effectiveness of both analytics types, streamlining workflows and improving data quality.
As organizations increasingly embrace data-driven strategies, understanding the distinct yet complementary roles of predictive and prescriptive analytics is imperative. Leveraging these tools fosters operational excellence and positions companies for sustained growth and innovation in an increasingly competitive landscape. The future of analytics is promising, with advancements in AI and machine learning poised to refine forecasting accuracy and empower businesses to make strategic decisions that drive success. Embracing these analytical capabilities will undoubtedly unlock new opportunities and enhance overall performance across various industries.
Frequently Asked Questions
What is predictive analysis?
Predictive analysis is a type of analytics that forecasts future events by using historical data and statistical algorithms to project outcomes, helping organizations address the question, ‘What might occur?’
How does predictive analysis benefit organizations?
By identifying patterns and trends from past information, organizations can anticipate potential scenarios and make informed decisions, thereby enhancing their decision-making processes.
What percentage of firms currently use forecasting techniques?
85% of firms currently employ forecasting techniques to improve their decision-making processes.
What is the difference between predictive analysis and prescriptive analysis?
Predictive analysis forecasts results based on historical data, while prescriptive analysis not only anticipates outcomes but also recommends specific actions to take based on those forecasts.
Why is prescriptive analysis particularly useful?
Prescriptive analysis is especially advantageous in dynamic contexts where timely and informed decisions are critical for success.
What are current trends regarding predictive and prescriptive analysis for 2025?
There is an increasing emphasis on integrating these analytical types into business operations, with a focus on testing and validation, explicit decision rights, and continuous learning.
How can AI solutions enhance predictive and prescriptive analysis?
AI solutions, such as customized Small Language Models and GenAI workshops, can improve information quality and address governance challenges in business reporting, enhancing the accuracy of insights.
What real-world examples illustrate the impact of predictive analysis?
In healthcare, predictive analysis is used to forecast patient admission rates, improving staffing and resource distribution. In retail, companies like Netflix and Amazon utilize forecasting to personalize recommendations, boosting customer engagement.
How does predictive analysis contribute to public health?
Predictive analysis plays a crucial role in anticipating disease outbreaks, enabling preventive actions that improve health outcomes and reduce emergency response costs.
What is the projected market value for embedded data analysis by 2033?
The market for embedded data analysis is projected to reach USD 182.7 billion by 2033, indicating a growing demand for integrated data solutions.
How does Robotic Process Automation (RPA) relate to predictive analysis?
RPA enhances productivity by streamlining workflows and reducing operational costs, which can be informed by insights derived from predictive analysis.
What role do self-service data platforms play in analytics?
Self-service data platforms empower non-technical users to explore data and generate insights independently, without relying on data scientists or IT teams.
How do forecasting and prescriptive analysis drive growth and innovation?
Both types of analysis facilitate informed decision-making in a data-driven environment, which is essential for driving growth and innovation within organizations.
Overview
The three primary types of analytics—descriptive, predictive, and prescriptive—each fulfill unique roles in data analysis.
- Descriptive analytics summarizes past data, enabling organizations to identify trends effectively.
- Predictive analytics leverages historical data to forecast future outcomes, allowing for informed decision-making.
- Prescriptive analytics goes a step further by recommending actions to optimize results.
Together, these analytics types significantly enhance decision-making and operational efficiency within organizations, demonstrating their critical importance in today’s data-driven landscape.
Introduction
In the modern business landscape, the ability to harness data effectively determines an organization’s success. Analytics serves as the backbone of business intelligence, enabling companies to make informed decisions by uncovering patterns and insights from vast amounts of data. As organizations navigate an increasingly complex digital environment, understanding the three primary types of analytics—descriptive, predictive, and prescriptive—becomes essential. Each type plays a unique role in guiding strategic planning and enhancing operational efficiency. They allow businesses to not only understand past performance but also anticipate future trends and recommend optimal actions. As the reliance on data-driven strategies intensifies, the integration of these analytics forms a critical framework for fostering innovation and maintaining a competitive edge.
Understanding Analytics: The Backbone of Business Intelligence
Analytics represents a systematic computational analysis of data, serving as a cornerstone of business intelligence. It empowers organizations to make informed, data-driven decisions by revealing patterns, trends, and insights that guide strategic planning and operational enhancements. In today’s data-rich environment, understanding data analysis is crucial for organizations aiming to boost their efficiency and effectiveness.
This essential comprehension enables companies to leverage analytics, categorized into three main types: descriptive, predictive, and prescriptive, each serving a unique function in operational success.
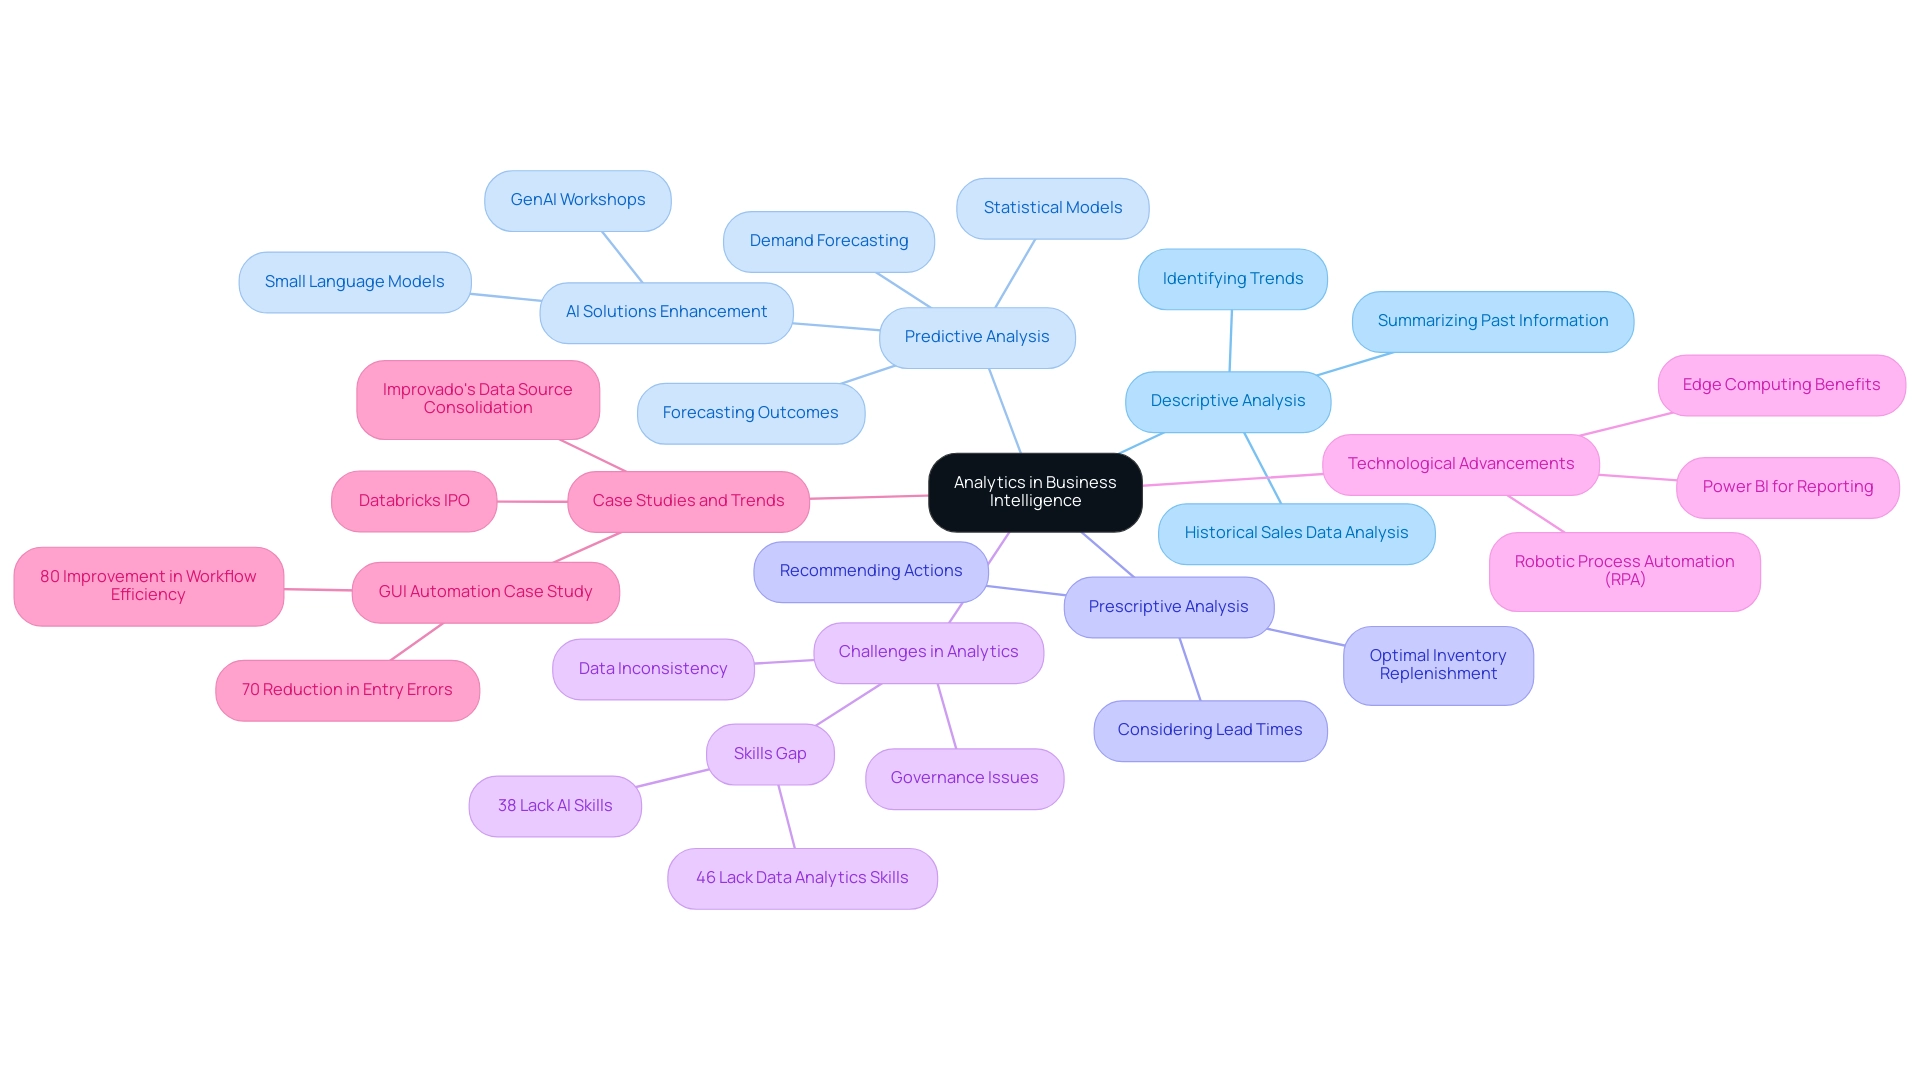
Descriptive analysis focuses on summarizing past information to identify trends and patterns. For instance, businesses can analyze historical sales data to understand customer behavior, informing inventory management and marketing strategies. In contrast, predictive analysis employs statistical models and machine learning techniques to forecast future outcomes based on historical data. This analysis is particularly valuable for operational efficiency, allowing organizations to anticipate demand fluctuations and optimize resource allocation accordingly.
Utilizing AI solutions, including Small Language Models and GenAI Workshops, can further enhance predictive capabilities by improving data quality and providing tailored insights. Prescriptive analysis advances this process by recommending actions based on predictive insights. For example, a company might use prescriptive analysis to identify the optimal course of action for inventory replenishment, considering factors such as lead times and demand forecasts. This proactive approach not only enhances operational efficiency but also drives data-driven decision-making across the organization. Furthermore, Robotic Process Automation (RPA) can automate manual workflows, reducing errors and enabling teams to focus on more strategic tasks, thereby improving overall operational efficiency.
The evolution of business intelligence emphasizes that descriptive, predictive, and other analytics types are vital for data evaluation. As organizations increasingly adopt artificial intelligence and machine learning, they gain access to real-time insights and self-service capabilities that empower teams to make informed decisions swiftly. Successful implementations of analytics have demonstrated substantial advancements in operational efficiency, with companies reporting improved governance and deeper insights into their operations.
For example, a case study on GUI automation in a mid-sized organization revealed a 70% reduction in information entry errors and an 80% improvement in workflow efficiency, showcasing the transformative impact of these technologies.
Moreover, addressing challenges related to data inconsistency and governance is crucial for effective reporting. Organizations must ensure their data is accurate and reliable to make informed decisions. By 2025, the significance of data analysis in business intelligence will continue to grow, as companies strive to maintain competitiveness in a constantly evolving landscape.
The statistic regarding edge computing reducing cloud storage and bandwidth costs illustrates the practical benefits of data analysis, particularly for remote construction sites with limited connectivity. Additionally, a recent statement from KPMG indicates that CEOs are facing a skills gap, with 46% experiencing a deficiency in analytical skills and 38% encountering a shortage of AI capabilities, highlighting the challenges organizations face in effectively utilizing insights. By adopting these analytical categories and incorporating tools like Power BI for enhanced reporting and actionable insights, enterprises can transform raw data into valuable knowledge, ultimately fostering growth and innovation.
Furthermore, the recent updates regarding Databricks filing for its IPO underscore current trends and investor confidence in innovative data management and analytical solutions, emphasizing the critical role of analysis in the dynamic business environment.
Descriptive Analytics: Analyzing Historical Data to Understand What Happened
Descriptive, predictive, and prescriptive analytics serve as powerful tools that analyze historical information to uncover trends and patterns, effectively answering the question, ‘What happened?’ By summarizing past events, these analytics provide valuable insights into performance metrics. For instance, in 2025, a notable example in the retail sector involved a company examining five years of sales information to identify seasonal trends, enabling them to optimize inventory levels and enhance operational efficiency.
This approach not only improved stock management but also contributed to a significant increase in sales. A case in point is Narellan Pools, which achieved a 23% sales boost while reducing media budget spending through effective data analysis.
Descriptive, predictive, and prescriptive analytics profoundly impact operational performance. Recent statistics indicate that the adoption of advanced reporting tools has surged by over 40%, allowing analysts to generate comprehensive reports more efficiently. This trend highlights the increasing acknowledgment that these three main types of analytics are essential for promoting organizational success.
As Sarah Lee noted, “Recent statistics indicate a significant surge in the adoption of data visualization tools: Over the last few years, the frequency of interactive dashboards and advanced graphical software usage has increased by over 40%.” This underscores the growing significance of descriptive, predictive, and diagnostic analysis in contemporary business practices.
Moreover, companies are increasingly utilizing analytics to optimize inventory management. Retailers, for example, leverage historical sales data to forecast demand accurately, ensuring that stock levels align with consumer behavior. This strategy minimizes excess inventory and enhances customer satisfaction by preventing stockouts.
The integration of Robotic Process Automation (RPA) by Creatum GmbH can further streamline these processes, automating repetitive tasks and allowing teams to focus on strategic decision-making. This not only reduces errors but also frees up resources for more value-adding work.
Expert opinions emphasize that descriptive, predictive, and prescriptive analysis are crucial in enhancing decision-making processes. By providing a clear understanding of past performance, organizations can make informed strategic choices that drive growth and innovation. Additionally, the case study on Supply Chain Management with NetSuite illustrates how descriptive data analysis enhances operational efficiency by ensuring a smooth flow of goods from suppliers to customers.
As businesses continue to navigate an information-rich environment, the ability to extract meaningful insights from historical information remains essential for maintaining a competitive edge. Tailored solutions that improve information quality and streamline AI application further enable entities to utilize descriptive insights effectively, tackling the issues of inadequate master information quality and obstacles to AI integration.
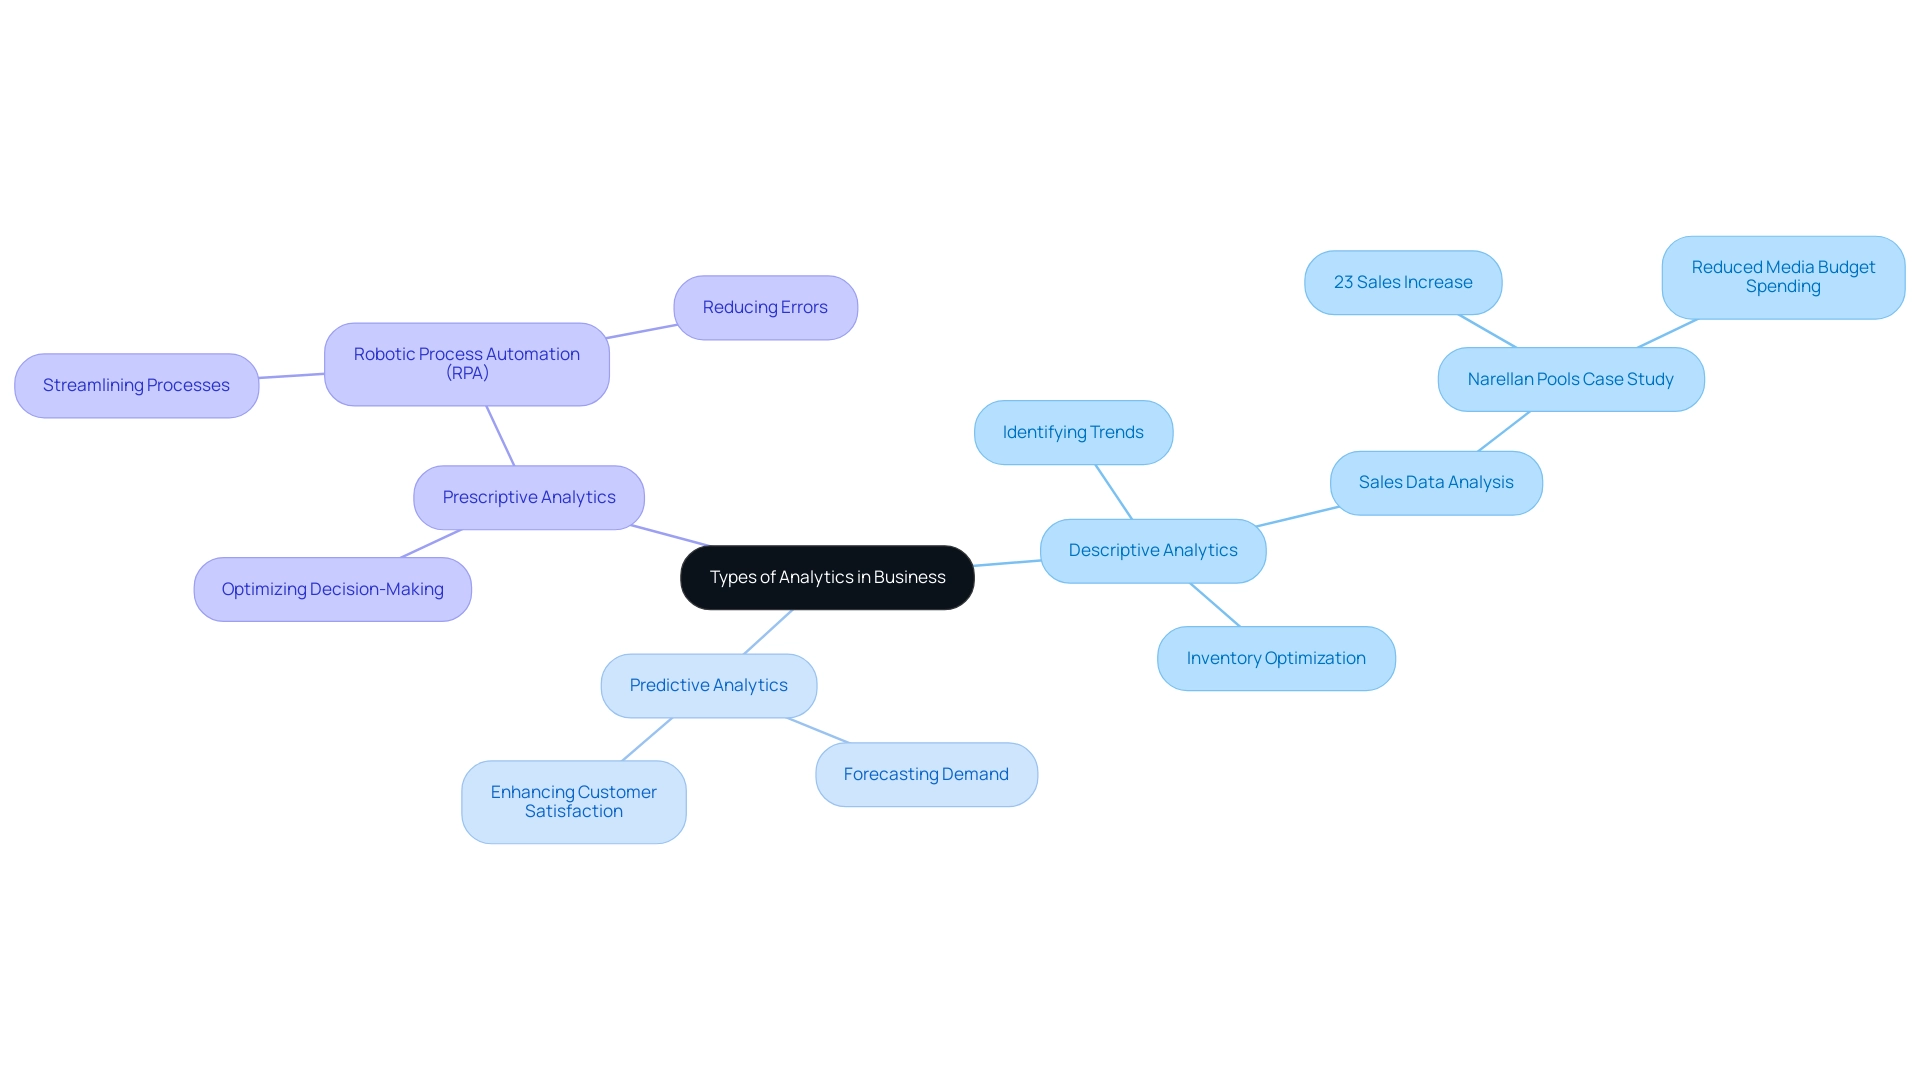
Predictive Analytics: Forecasting Future Trends and Outcomes
Predictive analysis stands as one of the three primary types of analytics, alongside descriptive and diagnostic analytics. It employs statistical algorithms and machine learning methods to scrutinize past data, enabling organizations to forecast future outcomes. This approach directly addresses the pivotal question: ‘What could happen?’ For example, financial institutions leverage predictive modeling to evaluate the likelihood of loan defaults by analyzing historical borrower data, encompassing factors like payment history and credit utilization.
FICO exemplifies this by stating, “By analyzing data such as payment history, credit utilization, and loan balances, FICO can predict the likelihood of default and assign a credit score.” Recent advancements in predictive analysis have significantly enhanced forecasting accuracy, with studies revealing that organizations employing these techniques can attain up to 95% accuracy in their predictions.
The growing demand for predictive analysis, coupled with the acknowledgment that descriptive, predictive, and prescriptive analytics constitute the three main types, is particularly pronounced in the financial sector. Here, institutions are increasingly adopting these solutions to refine decision-making processes. By 2025, the integration of predictive analysis into financial strategies is expected to accelerate, driven by the need for customization and performance enhancement. Notably, the services sector associated with predictive analysis is projected to experience substantial growth, boasting a compound annual growth rate (CAGR) that exceeds other analytical segments.
A compelling case study that underscores this trend is the partnership between Tesco PLC and Teradata, which utilizes Vantage for real-time data querying to bolster its predictive capabilities. Such collaborations demonstrate how organizations harness predictive data analysis to optimize operational strategies and improve customer engagement. Furthermore, the customization options for geographic analysis within the Predictive Analytics market are becoming increasingly vital, enabling businesses to tailor solutions to their unique requirements.
Moreover, expert insights indicate that as predictive analytics evolves, its applications will extend beyond traditional forecasting. This evolution reinforces the significance of descriptive, predictive, and prescriptive analytics in shaping broader strategic decisions across various sectors. By anticipating future trends, organizations can proactively adjust their marketing strategies and optimize resource allocation, ultimately fostering growth and innovation in a competitive landscape. Additionally, integrating Power BI services can enhance reporting and deliver actionable insights, while leveraging AI solutions through Small Language Models and GenAI Workshops can address quality and governance challenges, ensuring businesses are well-equipped to make informed decisions.
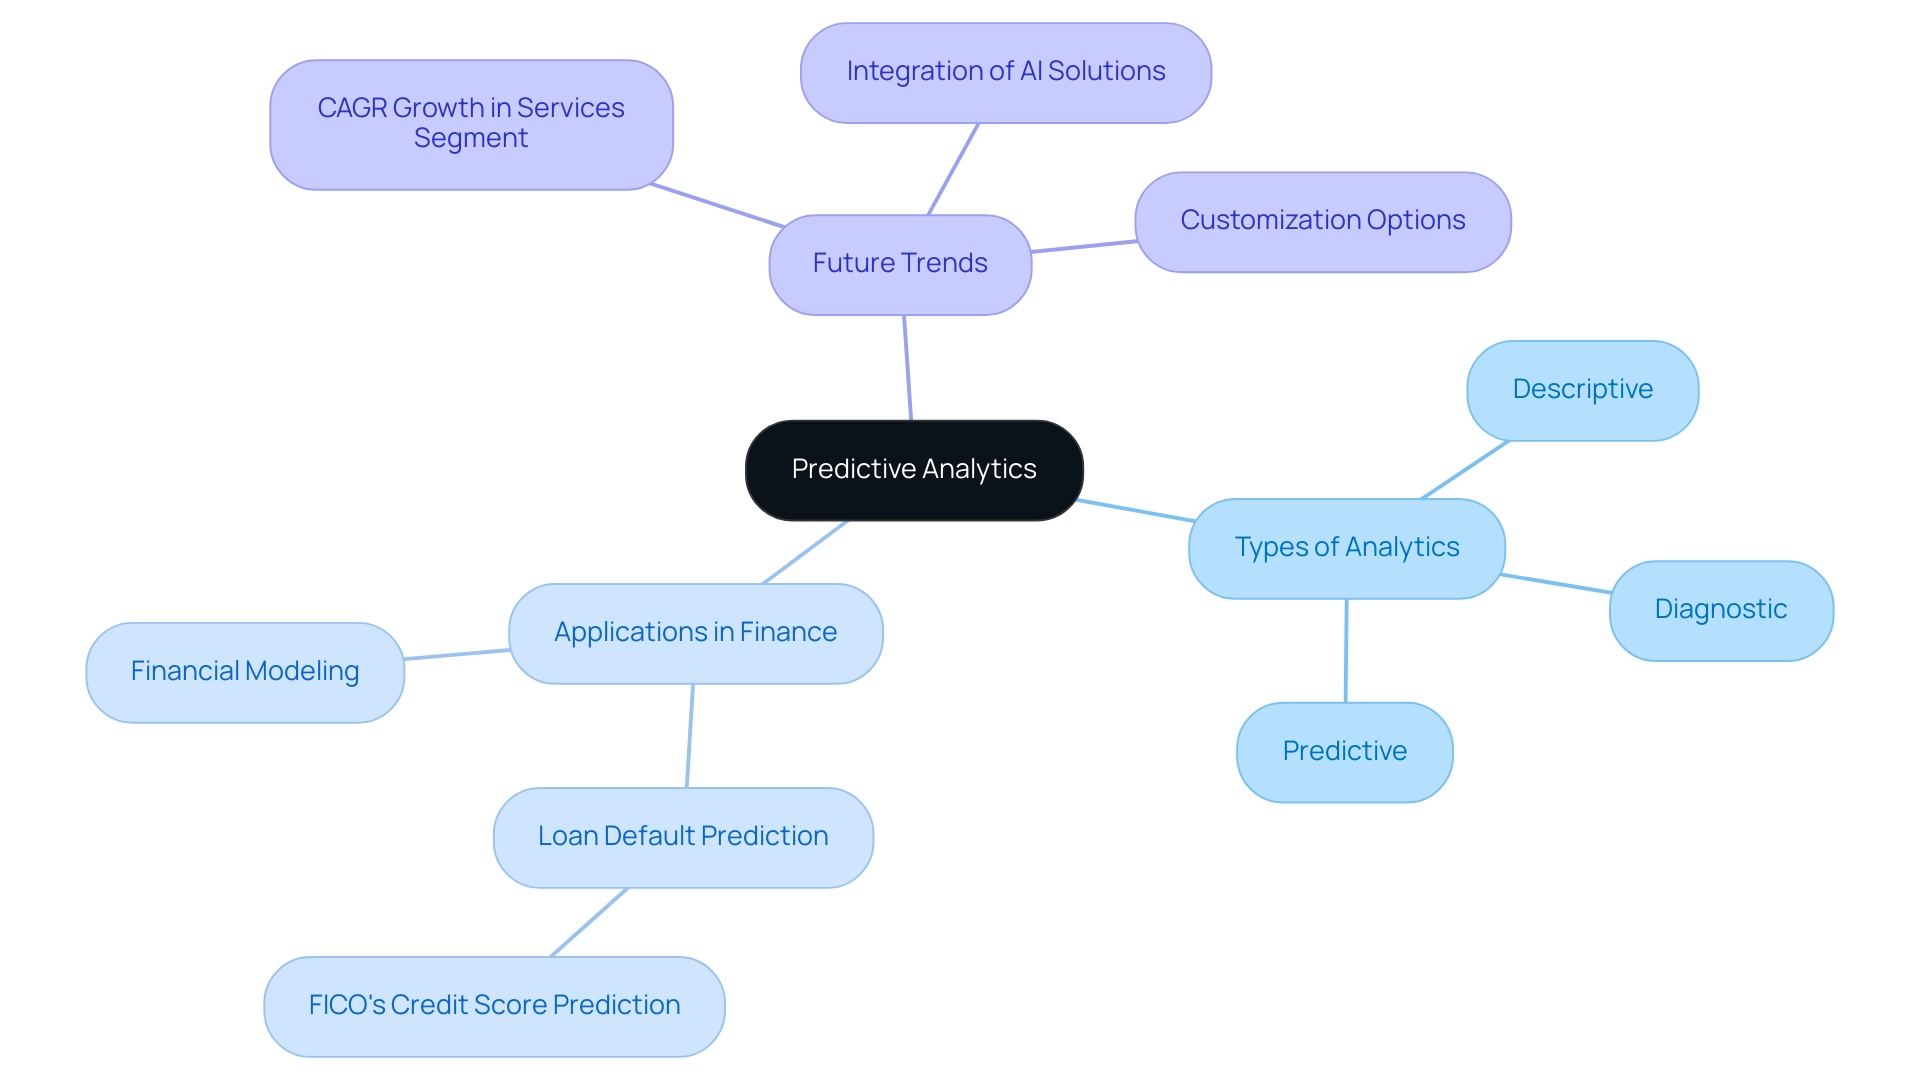
Prescriptive Analytics: Guiding Decisions for Optimal Outcomes
Prescriptive analysis transcends mere prediction by not only forecasting future outcomes but also recommending specific actions to achieve desired results. It effectively addresses the critical question: ‘What should we do?’ For instance, in 2025, logistics companies are increasingly utilizing prescriptive data analysis to optimize delivery routes by examining real-time traffic information alongside historical delivery performance.
This method not only simplifies operations but also significantly boosts efficiency by decreasing delivery times and expenses. Recent studies suggest that prescriptive analysis can lead to a 20-30% enhancement in operational efficiency, particularly in logistics. Companies such as UPS and FedEx have effectively harnessed these insights to refine their routing strategies, resulting in substantial cost savings and heightened customer satisfaction.
Moreover, by incorporating Robotic Process Automation (RPA) into these processes, companies can further automate manual workflows, thereby boosting productivity and enabling teams to concentrate on strategic initiatives.
Furthermore, prescriptive data analysis serves as a vital decision-making tool in dynamic environments, especially in customer churn management. By employing advanced algorithms and optimization techniques, organizations can adapt their strategies in real-time, ensuring they remain competitive and responsive to market changes. Notably, swarm intelligence techniques have emerged as powerful resources for enhancing decision-making in these dynamic situations.
Expert views underscore the transformative capability of prescriptive analysis in guiding decision-making processes. Mike Henry, a dedicated expert in the Customer Experience (CX) field, emphasizes the importance of utilizing data analysis to uncover trends and best practices. As companies navigate the complexities of large information sets, the ability to derive actionable insights from predictive models becomes paramount.
This not only contributes to operational efficiency but also empowers organizations to make informed, strategic choices that foster growth and innovation in an increasingly information-driven environment.
Additionally, a recent survey on applications of prescriptive analysis highlights that descriptive, predictive, and prescriptive are the three primary types of analytics, underscoring the need for improved decision-making assistance in the context of large-scale information processing. The study concludes that optimization techniques significantly enhance the effectiveness of prescriptive analysis across various applications, addressing key issues and comparing different methodologies to improve research effectiveness in this area. In light of the projected shortage of up to 250,000 information analysis professionals in the US by 2024, the urgency for businesses to adopt prescriptive analysis, alongside customized AI solutions and Business Intelligence, becomes even more critical.
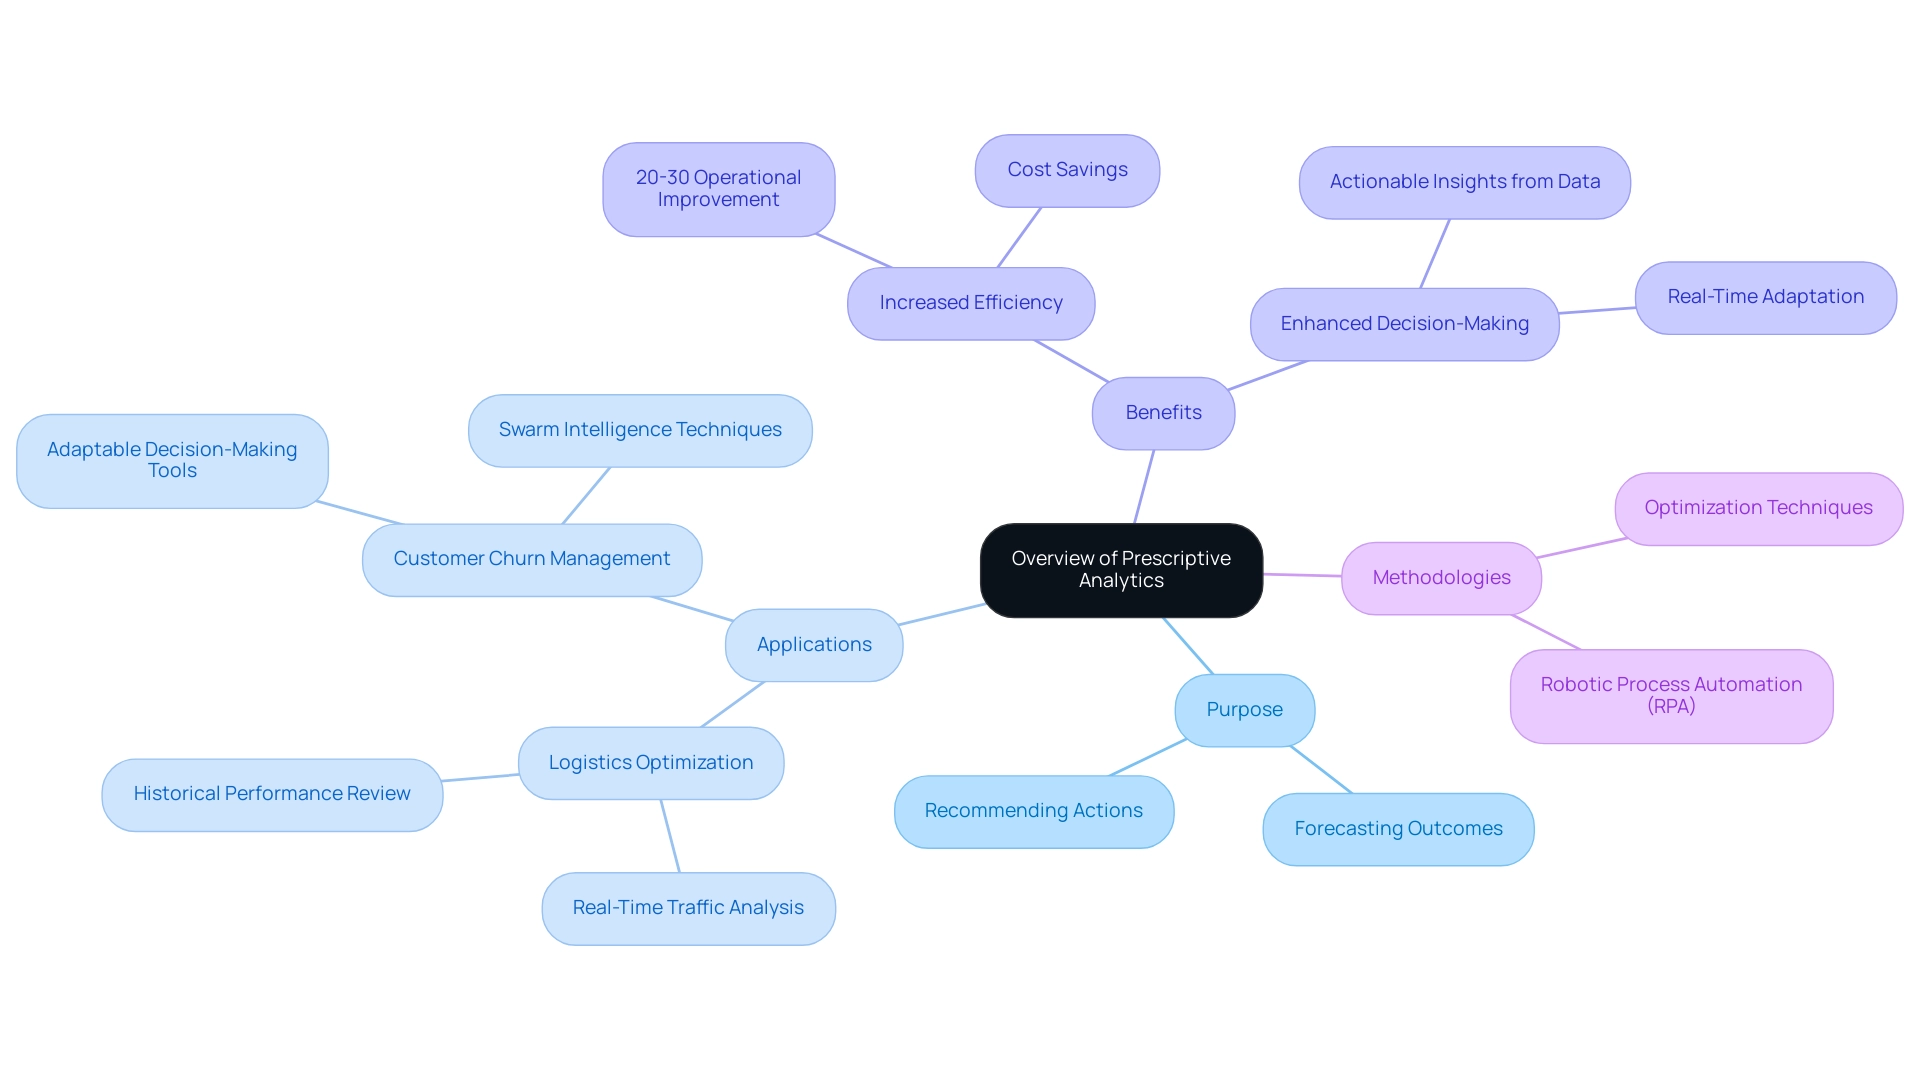
Comparing Descriptive, Predictive, and Prescriptive Analytics: Key Differences and Applications
Descriptive, predictive, and prescriptive analytics represent the three primary types of analytics, each playing a vital role in the data ecosystem with distinct yet complementary purposes. Descriptive analytics focuses on summarizing historical information, providing insights into past performance and trends. For instance, a retail company may analyze last year’s sales figures to identify peak shopping periods and customer preferences, enabling a better understanding of effective strategies.
Integrating Robotic Process Automation (RPA) from Creatum GmbH allows organizations to streamline the collection and reporting of this information, significantly enhancing operational efficiency and reducing manual errors.
Conversely, predictive analysis employs historical data and statistical methods to forecast future trends. By discerning patterns within past data, companies can anticipate upcoming outcomes. For example, a business might leverage predictive analysis to project sales for the next quarter based on seasonal trends and consumer behavior, facilitating proactive inventory management and marketing strategies.
This approach not only bolsters strategic planning but also enhances operational efficiency, as evidenced in the case study titled “Predictive Analytics Overview.” Tailored AI solutions can further streamline this process, ensuring that the right technologies align with specific business objectives.
Prescriptive analysis advances this concept by recommending specific actions to optimize results. It can indicate the best timing for promotions or price adjustments to boost foot traffic and increase basket size. For instance, a restaurant chain may utilize prescriptive analysis to determine optimal times for discounts, thereby maximizing customer engagement and revenue.
Statistics reveal that prescriptive analysis effectively recommends the timing of promotions and price changes to achieve these objectives, particularly when supported by robust Business Intelligence tools like Power BI from Creatum GmbH, which enhance data reporting and provide actionable insights through features such as the 3-Day Power BI Sprint and General Management App.
The integration of these data analysis types—descriptive, predictive, and prescriptive—is essential for organizations aiming to refine their decision-making processes. By successfully integrating these analytics, companies can achieve a comprehensive view of their operations, leading to more informed strategies and improved operational efficiency. As Dan Vesset noted, to measure accurately against KPIs, organizations must catalog and prepare the appropriate information sources to extract necessary data and calculate metrics based on the current state of the organization.
Industry trends indicate an increasing adoption of these analytical tools, with organizations recognizing their value in driving growth and innovation. By understanding the key differences and applications of each type, businesses can tailor their analysis strategies to align with specific objectives and data infrastructures while addressing data inconsistency and governance challenges in business reporting for enhanced decision-making.
Additionally, it is crucial to acknowledge that diagnostic analytics is retrospective, offering insights to address past issues or replicate successes, which further clarifies its distinctions from the three main types of analytics discussed.
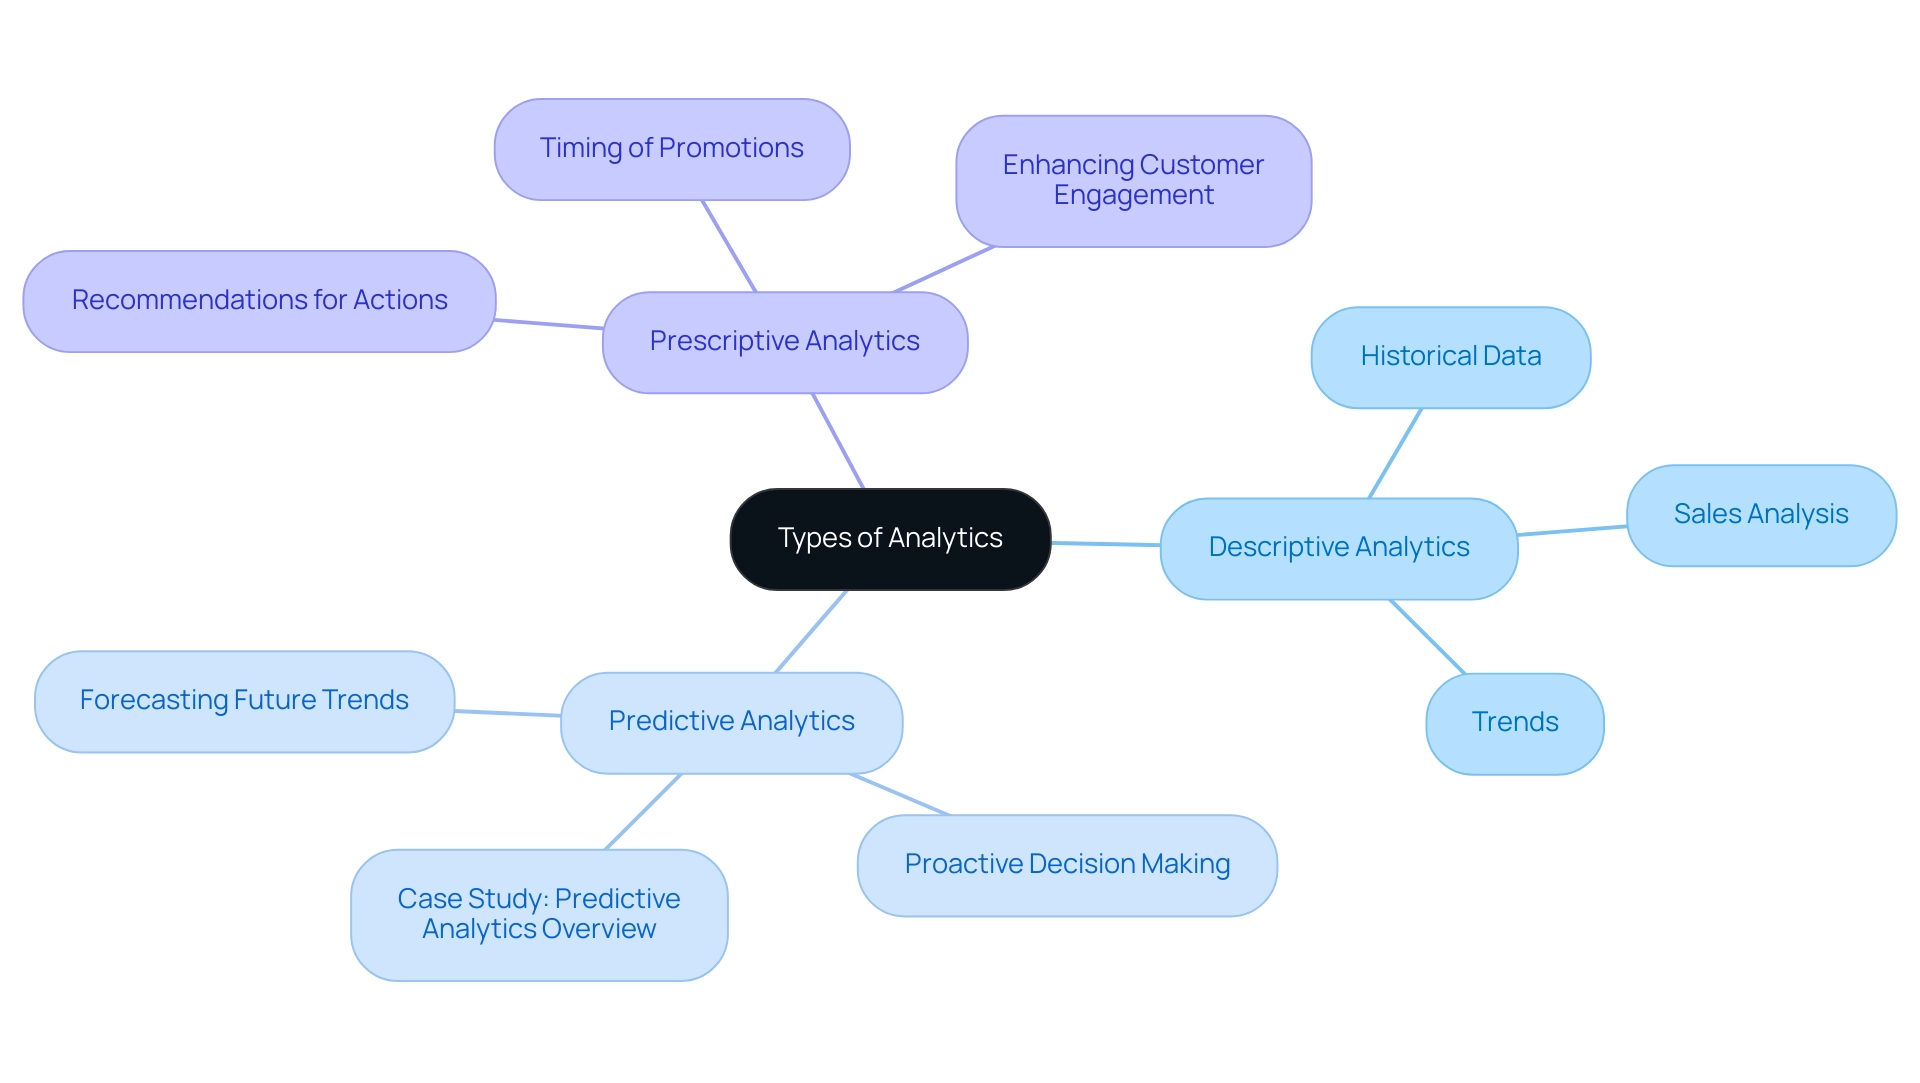
Conclusion
Understanding the pivotal role of analytics in business intelligence underscores its necessity in today’s data-driven environment. This article elaborates on the three primary types of analytics—descriptive, predictive, and prescriptive—each serving a unique function in enhancing operational efficiency and strategic decision-making. Descriptive analytics allows organizations to glean valuable insights from historical data, while predictive analytics empowers businesses to anticipate future trends and outcomes. Prescriptive analytics takes this further by recommending specific actions to optimize results, effectively guiding organizations towards informed decisions.
The integration of these analytics types forms a comprehensive framework that enables companies to not only understand their past performance but also plan for future scenarios with confidence. As organizations face increasing complexity in their operations, leveraging these analytics becomes essential for maintaining a competitive edge. The transformative impact of analytics is evident through numerous case studies demonstrating significant improvements in efficiency and decision-making processes.
As the reliance on data-driven strategies continues to grow, the adoption of advanced analytics tools and techniques will be crucial for organizations striving to innovate and succeed in an ever-evolving marketplace. Embracing this analytics framework not only fosters a culture of informed decision-making but also positions businesses to navigate challenges effectively, ensuring long-term growth and sustainability. Ultimately, the ability to harness the power of analytics will define the success of organizations in the modern business landscape.
Frequently Asked Questions
What is analytics and why is it important for businesses?
Analytics is a systematic computational analysis of data that serves as a cornerstone of business intelligence. It helps organizations make informed, data-driven decisions by revealing patterns, trends, and insights that guide strategic planning and operational enhancements.
What are the three main types of analytics?
The three main types of analytics are descriptive, predictive, and prescriptive analytics. Each type serves a unique function in enhancing operational success.
What does descriptive analysis focus on?
Descriptive analysis focuses on summarizing past information to identify trends and patterns. For example, businesses can analyze historical sales data to understand customer behavior, which aids in inventory management and marketing strategies.
How does predictive analysis differ from descriptive analysis?
Predictive analysis uses statistical models and machine learning techniques to forecast future outcomes based on historical data, allowing organizations to anticipate demand fluctuations and optimize resource allocation.
What is the role of prescriptive analysis in business?
Prescriptive analysis recommends actions based on predictive insights. For instance, it can help a company identify the best course of action for inventory replenishment by considering factors like lead times and demand forecasts.
How can AI and automation enhance analytics?
AI solutions, including Small Language Models and GenAI Workshops, can improve data quality and provide tailored insights. Additionally, Robotic Process Automation (RPA) can automate manual workflows, reducing errors and allowing teams to focus on strategic tasks.
What are some benefits of implementing analytics in organizations?
Successful implementations of analytics can lead to substantial advancements in operational efficiency, improved governance, and deeper insights into operations. For example, a case study demonstrated a 70% reduction in information entry errors and an 80% improvement in workflow efficiency.
What challenges do organizations face regarding data analysis?
Organizations often face challenges related to data inconsistency and governance, which can hinder effective reporting. Ensuring data accuracy and reliability is crucial for making informed decisions.
How is the significance of data analysis expected to evolve by 2025?
By 2025, the importance of data analysis in business intelligence is expected to grow as companies strive to maintain competitiveness in a constantly evolving landscape.
What tools can help organizations transform raw data into valuable insights?
Tools like Power BI can enhance reporting and provide actionable insights, enabling enterprises to convert raw data into valuable knowledge that fosters growth and innovation.
Overview
This article underscores the critical role of following leading business intelligence (BI) blogs to gain insights and remain informed about trends in the swiftly changing BI landscape. These blogs serve as a rich resource, offering valuable information on emerging technologies and best practices. Such knowledge is indispensable for enhancing operational efficiency and facilitating informed decision-making within organizations. By engaging with these blogs, professionals can stay ahead in a competitive environment, ensuring they leverage the latest developments in BI effectively.
Introduction
In a world increasingly driven by data, the importance of Business Intelligence (BI) is paramount. Organizations are faced with a deluge of information from billions of connected devices, making the ability to transform raw data into actionable insights a cornerstone of strategic decision-making and operational efficiency. With a staggering 60% of data leaders prioritizing BI initiatives, it is evident that businesses must embrace this technology to thrive in a competitive landscape.
This article explores the essentials of BI, highlighting its significance, the criteria for selecting valuable BI resources, and a curated list of top blogs that provide expert insights and practical strategies for navigating the complexities of data analysis. By engaging with these resources, organizations can enhance their data-driven culture, streamline operations, and drive meaningful growth.
Understanding Business Intelligence: The Need for Insights
Business Intelligence (BI) encompasses a suite of technologies, applications, and practices designed for the collection, integration, analysis, and presentation of organizational information. In today’s information-rich environment, where the number of connected IoT devices is projected to increase from 16 billion in 2023 to 20.3 billion by 2025—generating an astonishing 79.4 zettabytes of information—organizations must leverage BI to transform raw data into actionable insights. This capability is vital for informed decision-making, enhancing operational efficiency, and propelling strategic initiatives.
The importance of BI in decision-making is paramount. Current statistics indicate that 60% of information leaders prioritize BI as a top initiative, highlighting its essential role in shaping business strategies. Experts assert that effective BI practices not only improve information quality but also foster a culture driven by insights—crucial for organizations aiming to thrive amidst increasing competition and complexity.
Moreover, BI enhances operational efficiency by streamlining processes and reducing errors. For instance, our Power BI services offer a 3-Day Sprint, enabling the rapid production of professionally designed reports, which ensures efficient reporting and consistency. A case study titled ‘Streamlining Operations with GUI Automation’ illustrates how a mid-sized company improved efficiency by automating data entry and software testing, achieving a remarkable 70% reduction in entry errors and an 80% increase in workflow efficiency.
This exemplifies the transformative impact of integrating BI with automation strategies. Recent trends in BI for 2025 suggest a focus on enhancing security, improving quality, fostering a culture of information, strengthening governance, and boosting literacy. These advancements are set to empower organizations further, allowing them to leverage data effectively and maintain a competitive edge. Numerous organizations are already harnessing BI to inform their decision-making processes and enhance operational efficiency, showcasing the transformative power of intelligence in the contemporary landscape.
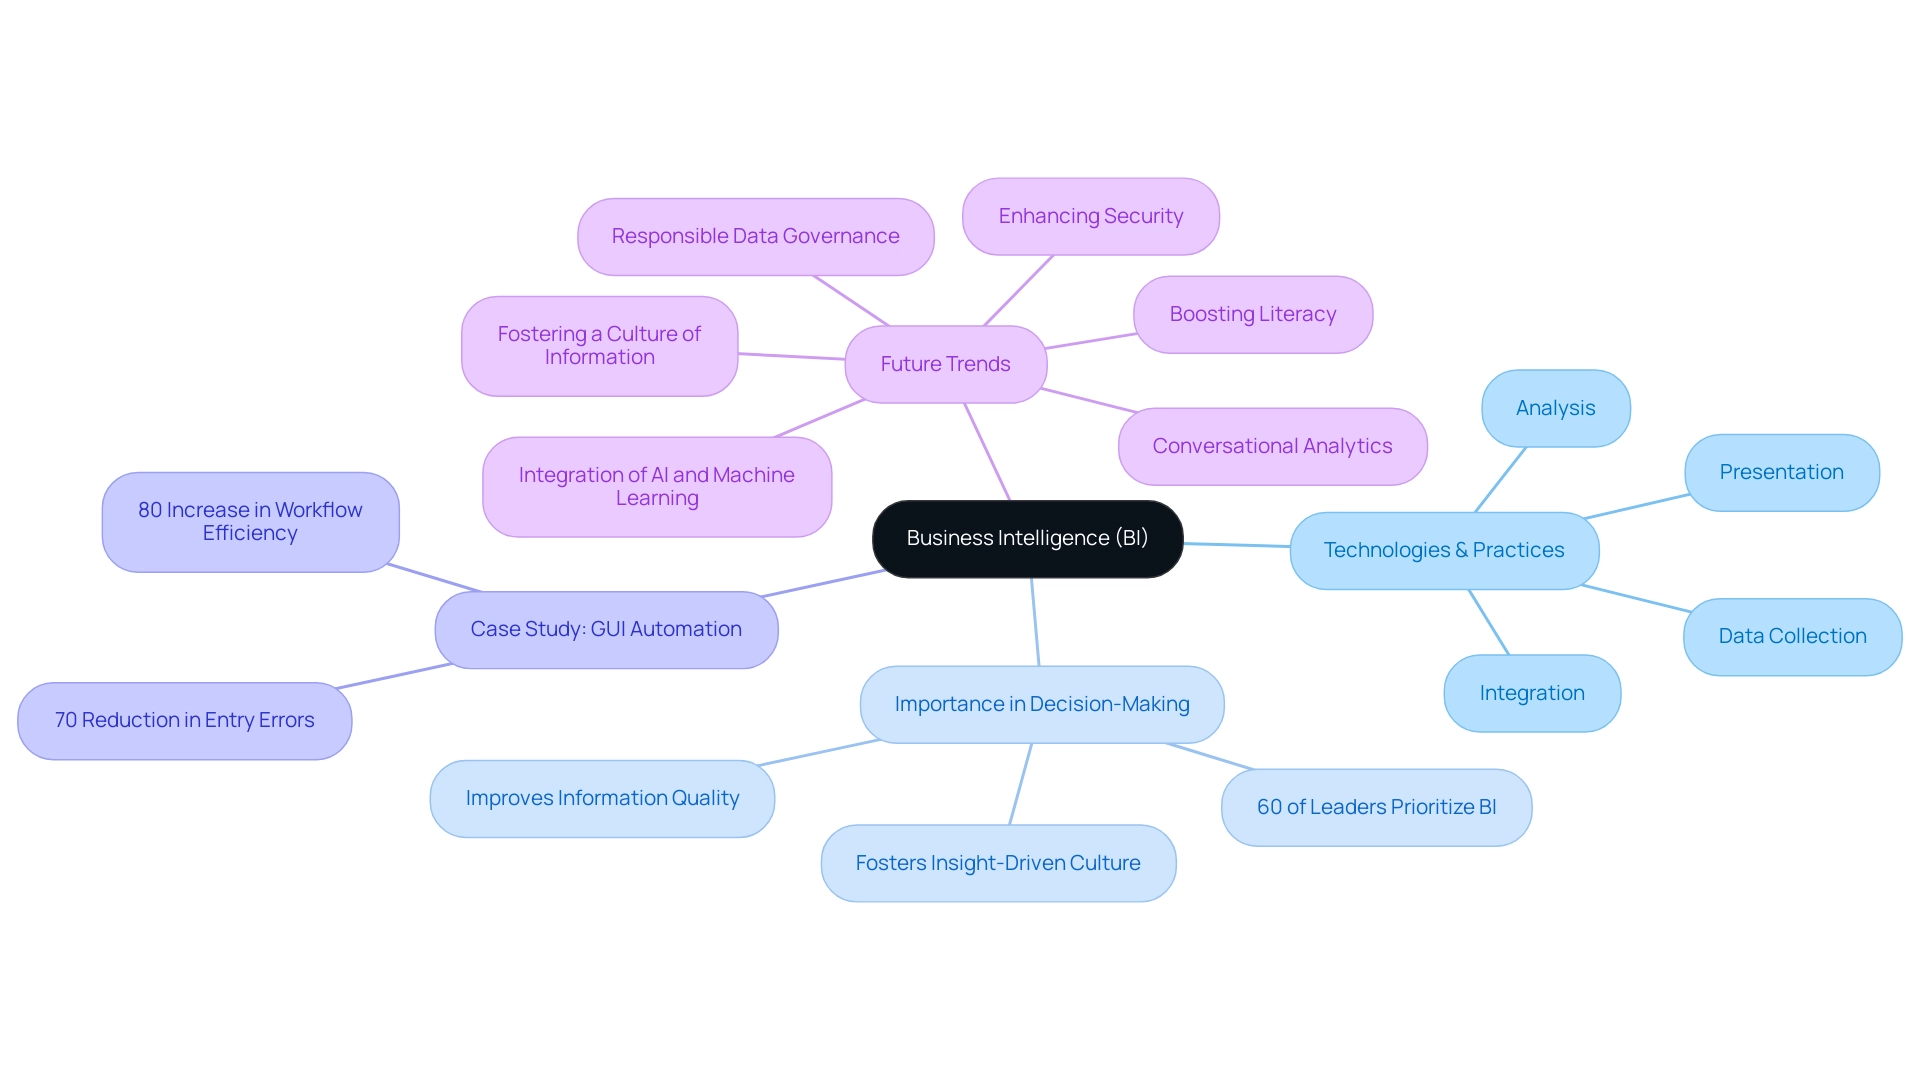
Criteria for Choosing the Best BI Blogs
When selecting the premier business intelligence (BI) websites to follow, it is essential to consider several key criteria that can significantly enhance your learning and understanding:
-
Relevance: Ensure the content addresses topics that resonate with your specific interests and needs within the BI landscape. This alignment is vital for extracting actionable insights that can directly impact your operational strategies, particularly in a rapidly evolving AI environment. Tailored solutions from Creatum GmbH can help navigate the complexities. Prioritize BI blogs authored by industry professionals or recognized experts. Their insights are often rooted in real-world experience, providing an authoritative perspective that can aid your comprehension of intricate BI concepts. Notably, KPMG highlights that CIOs are grappling with a skills shortage, with 46% reporting a lack of data analytics skills and 38% lacking AI skills. This underscores the importance of following knowledgeable sources.
-
Frequency of Updates: Active websites that post regularly are more likely to deliver timely insights. Given the swift evolution of BI tools and techniques, staying updated is crucial; by 2025, it is anticipated that 70% of organizations will utilize real-time analytics for decision-making. This projection elevates the importance of timely information, emphasizing the need for platforms that consistently provide fresh content.
-
Engagement: Seek out websites that foster reader interaction and discussion. Engaging with the content and fellow readers can enrich your learning experience, facilitating the exchange of ideas and perspectives that deepen your understanding of BI. This is particularly critical as businesses aim to automate manual workflows through Robotic Process Automation (RPA), thereby enhancing operational efficiency.
-
Diversity of Content: A well-rounded platform should offer a mix of articles, case studies, and tutorials. This variety caters to different learning styles and provides a comprehensive view of BI practices and innovations. The increasing demand for information science and analytics skills, as emphasized by the US Bureau of Labor Statistics, further highlights the necessity of following reputable sources in this field.
By applying these criteria, you can effectively assess the significance and quality of BI blogs, ensuring that the resources you select contribute meaningfully to your professional growth in the information-driven landscape. Just as a careful evaluation of BI service partners can lead to data-driven excellence, a thorough assessment of BI resources can enhance your insights and strategies.
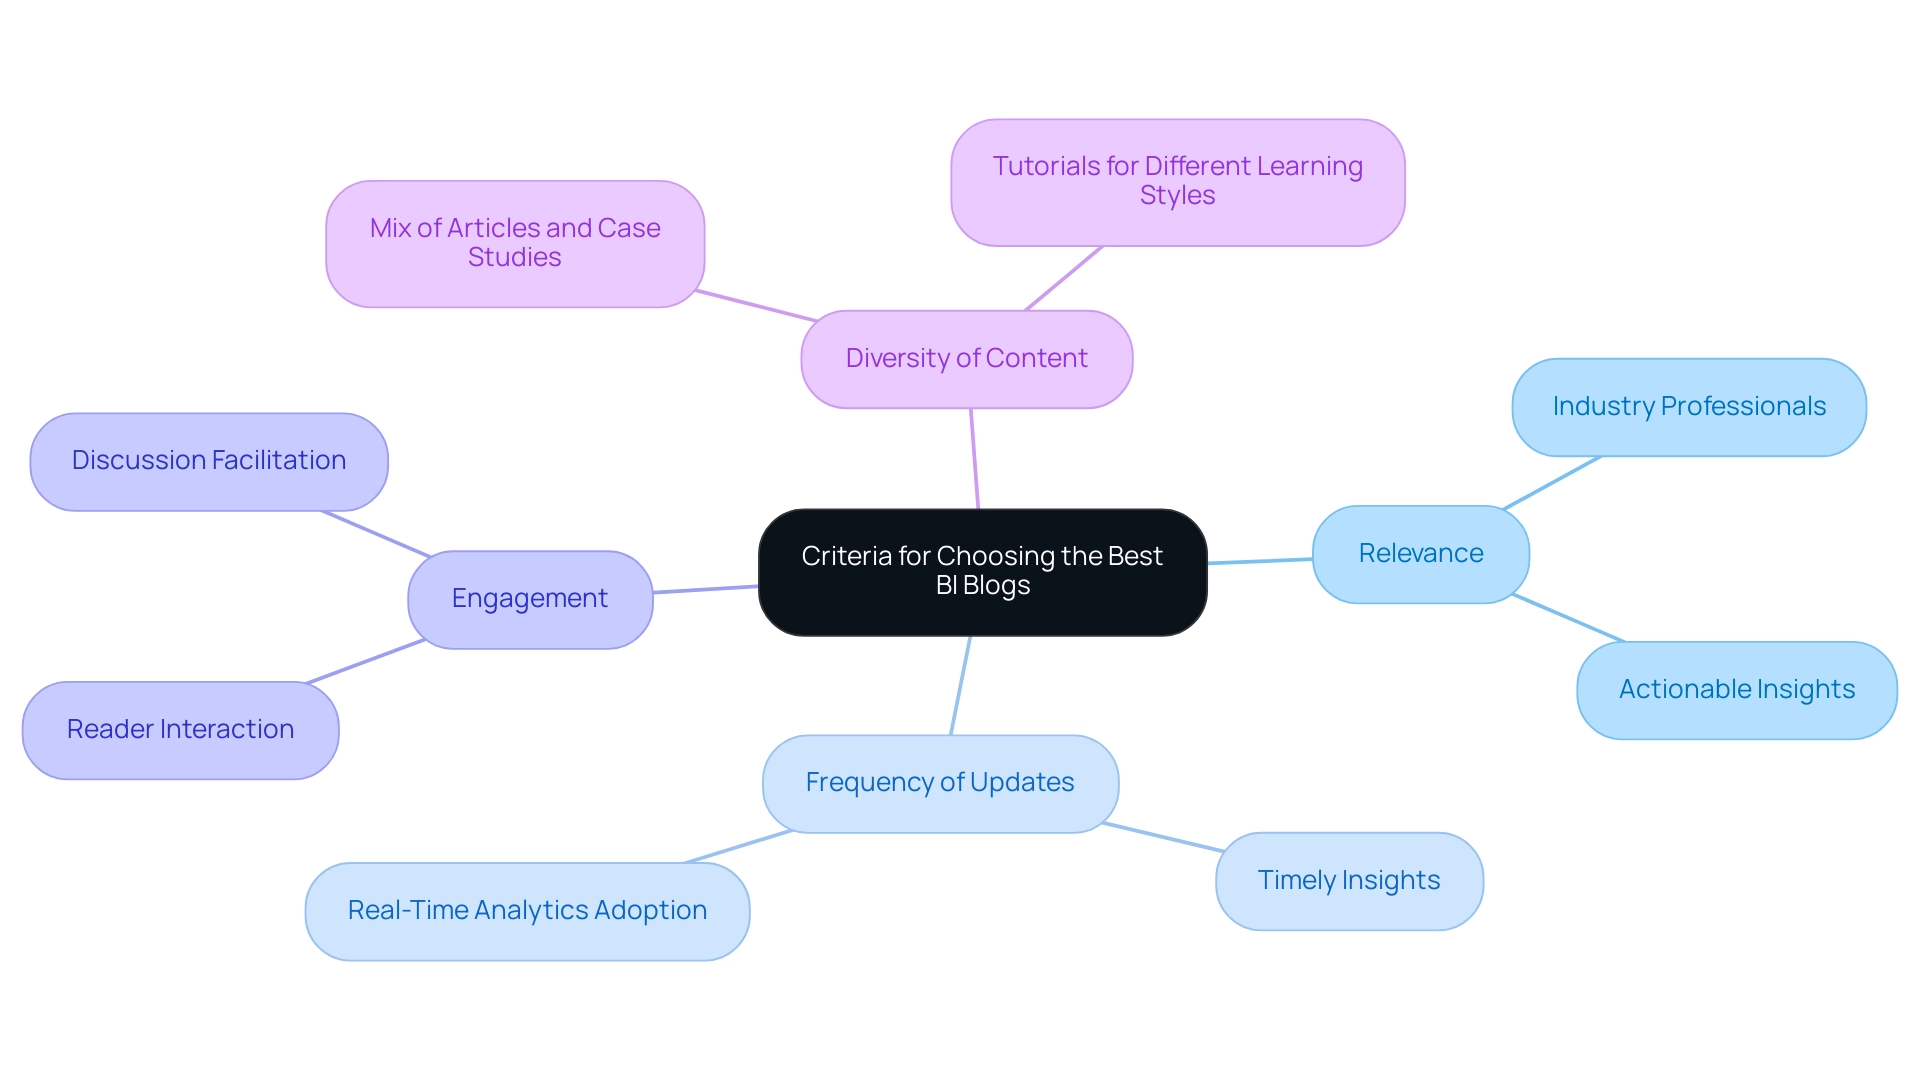
Top 10 Business Intelligence Blogs to Follow
-
Datanami – This blog stands as a premier source for large-scale information trends and analytics, offering in-depth articles that delve into the latest industry developments. Its emphasis on emerging technologies is crucial for staying ahead in the information landscape. The growing demand for data science professionals, with the US Bureau of Labor Statistics forecasting approximately 11.5 million jobs by 2026, underscores the relevance of insights from this blog.
-
MIT Technology Review – Renowned for its insightful analysis, this publication scrutinizes the intersection of technology and business, equipping readers with a deeper understanding of how innovations influence operational efficiency and strategic decision-making. As organizations increasingly embrace collaborative BI practices, this article provides valuable perspectives on enhancing project communication and efficiency.
-
Large Information Simplified – This website excels at transforming complex concepts into easily digestible content, making it accessible for professionals at all levels. It serves as a vital resource for those seeking to deepen their understanding of big data applications, particularly in a market where data engineers in the San Francisco Bay Area experienced a 6% salary increase, averaging $160,000 per year in 2019.
-
Gartner BI Platform – Known for its comprehensive research and analysis, Gartner’s platform offers essential insights on business intelligence trends, aiding organizations in navigating the evolving BI landscape with confidence. The information presented here is critical for grasping the strategic implications of BI technologies.
-
Forrester’s Business Intelligence Resource – Featuring expert insights and market analysis, this platform is indispensable for professionals aiming to comprehend the strategic implications of BI technologies and practices. Its focus on collaborative BI trends is particularly pertinent for large organizations.
-
Tableau Blog – This platform provides practical advice and optimal methods for visual representation, empowering users to effectively communicate findings and promote evidence-based decision-making within their organizations. The investment in quality content, with an average cost of promoting a post at $71.17, underscores the significance of effective communication in BI.
-
Phocas Business Intelligence Website – Centered on the practical applications of BI tools, this platform presents real-world examples and case studies that illustrate how companies can leverage information for operational enhancements. The knowledge gained from engaging with this website can significantly bolster operational efficiency.
-
Reveal BI Article – Addressing topics related to embedded analytics and the latest BI trends, this resource is vital for organizations aiming to integrate data insights into their daily operations. The importance of these observations is magnified by the rising demand for data-driven decision-making.
-
Holistics Journal – This platform highlights data-driven decision-making strategies, offering actionable insights that assist businesses in optimizing their operations and enhancing overall efficiency. Engaging with such quality content is essential for maintaining competitiveness in the information landscape.
-
AWS Business Intelligence Blog – Delving into cloud-based BI solutions and innovations, this blog is crucial for organizations seeking to harness cloud technology to elevate their data analytics capabilities. As Davor Stefanovic noted, engaging with quality material in the intelligence sector ensures that your observations are unique and compelling.
Moreover, the endorsement from Sascha Rudloff, Team Leader of IT and Process Management at PALFINGER Tail Lifts GMBH, emphasizes how Creatum’s Power BI Sprint not only delivered a readily usable Power BI report and gateway setup but also significantly accelerated their Power BI development. This transformative experience highlights the importance of leveraging Business Intelligence and RPA to enhance operational efficiency and drive data-driven insights for growth.
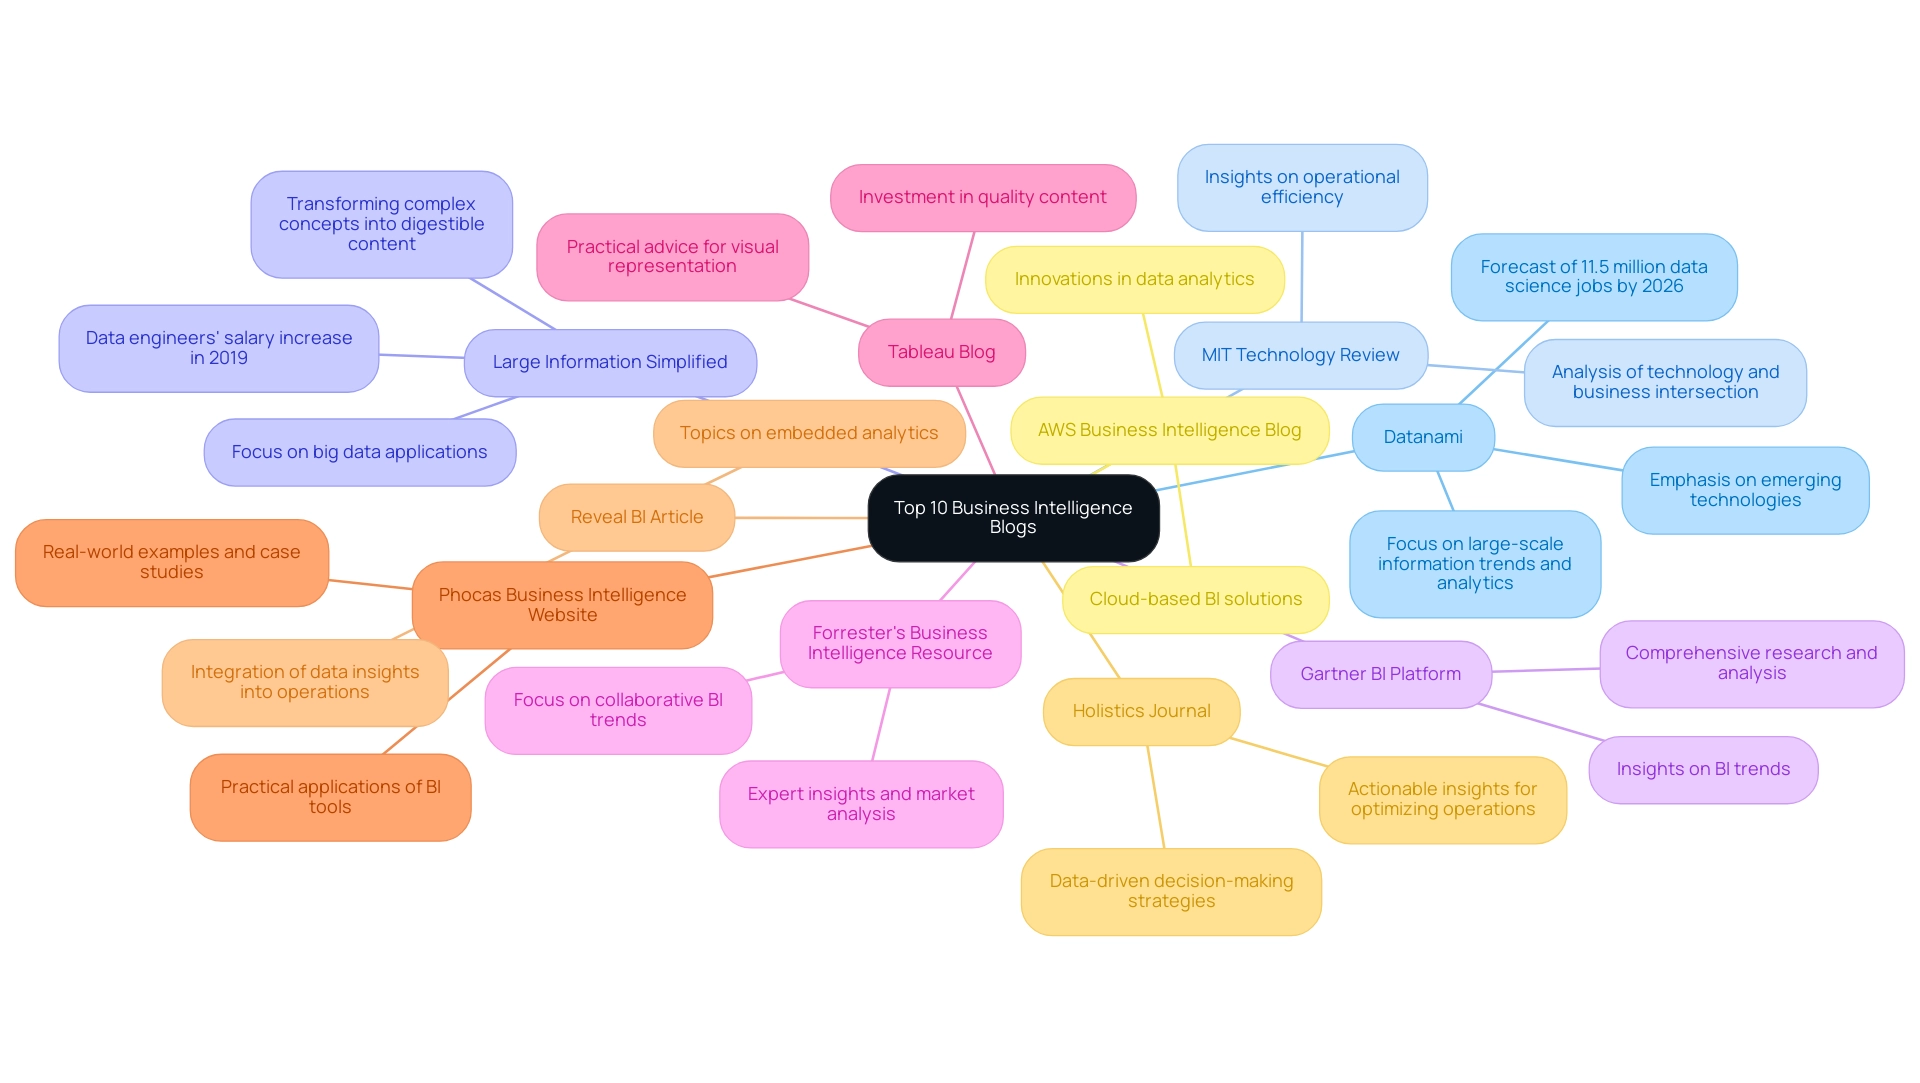
What Makes These Blogs Stand Out?
Each of the top business intelligence (BI) blogs offers distinct advantages that cater to various aspects of data analysis and visualization:
- Datanami delivers the latest news on big data technologies, ensuring readers stay informed about emerging trends and innovations that can impact their strategies.
- MIT Technology Review distinguishes itself by combining academic rigor with practical knowledge, offering a balanced viewpoint that assists professionals in applying theoretical concepts to real-world situations.
- Big Data Made Simple excels in demystifying complex topics, making them accessible to a broader audience, which is crucial for fostering a data-driven culture within organizations.
- Gartner is renowned for its research-backed knowledge, offering authoritative analysis that helps businesses navigate the complexities of the BI landscape.
- Forrester provides strategic advice grounded in comprehensive market analysis, empowering organizations to make informed decisions based on current trends and forecasts.
- Tableau emphasizes the practical applications of visualization, showcasing how effective visual tools can enhance understanding and drive actionable insights.
- Phocas focuses on real-world BI implementations, sharing case studies that illustrate successful strategies and outcomes, which can serve as valuable benchmarks for other organizations.
- Reveal BI specializes in embedded analytics, highlighting how integrating BI tools within existing workflows can streamline processes and improve decision-making efficiency.
- Holistics promotes actionable strategies for information-driven decisions, equipping readers with the knowledge to leverage their assets effectively.
- AWS highlights innovations in cloud-based BI solutions, reflecting the growing trend towards mobile intelligence, which is anticipated to expand significantly due to advancements in AI and machine learning technologies.
The prevalence of dark information, where 55% of businesses collect it but fail to analyze, underscores the importance of these resources. The case study titled “The Issue of Dark Information” illustrates that despite the collection of vast amounts of information, many organizations do not leverage it effectively, leading to significant risks in decision-making. By following these BI blogs, organizations can improve their information analysis strategies, reduce the risks associated with dark information, and ultimately foster growth and innovation.
Additionally, the integration of Robotic Process Automation (RPA) from Creatum GmbH can further streamline manual workflows, allowing teams to focus on strategic initiatives. Power BI services from Creatum GmbH, especially the 3-Day Sprint for report creation and the General Management App, offer essential tools for improving data reporting and ensuring actionable information, which are crucial for informed decision-making in today’s swiftly changing AI environment.
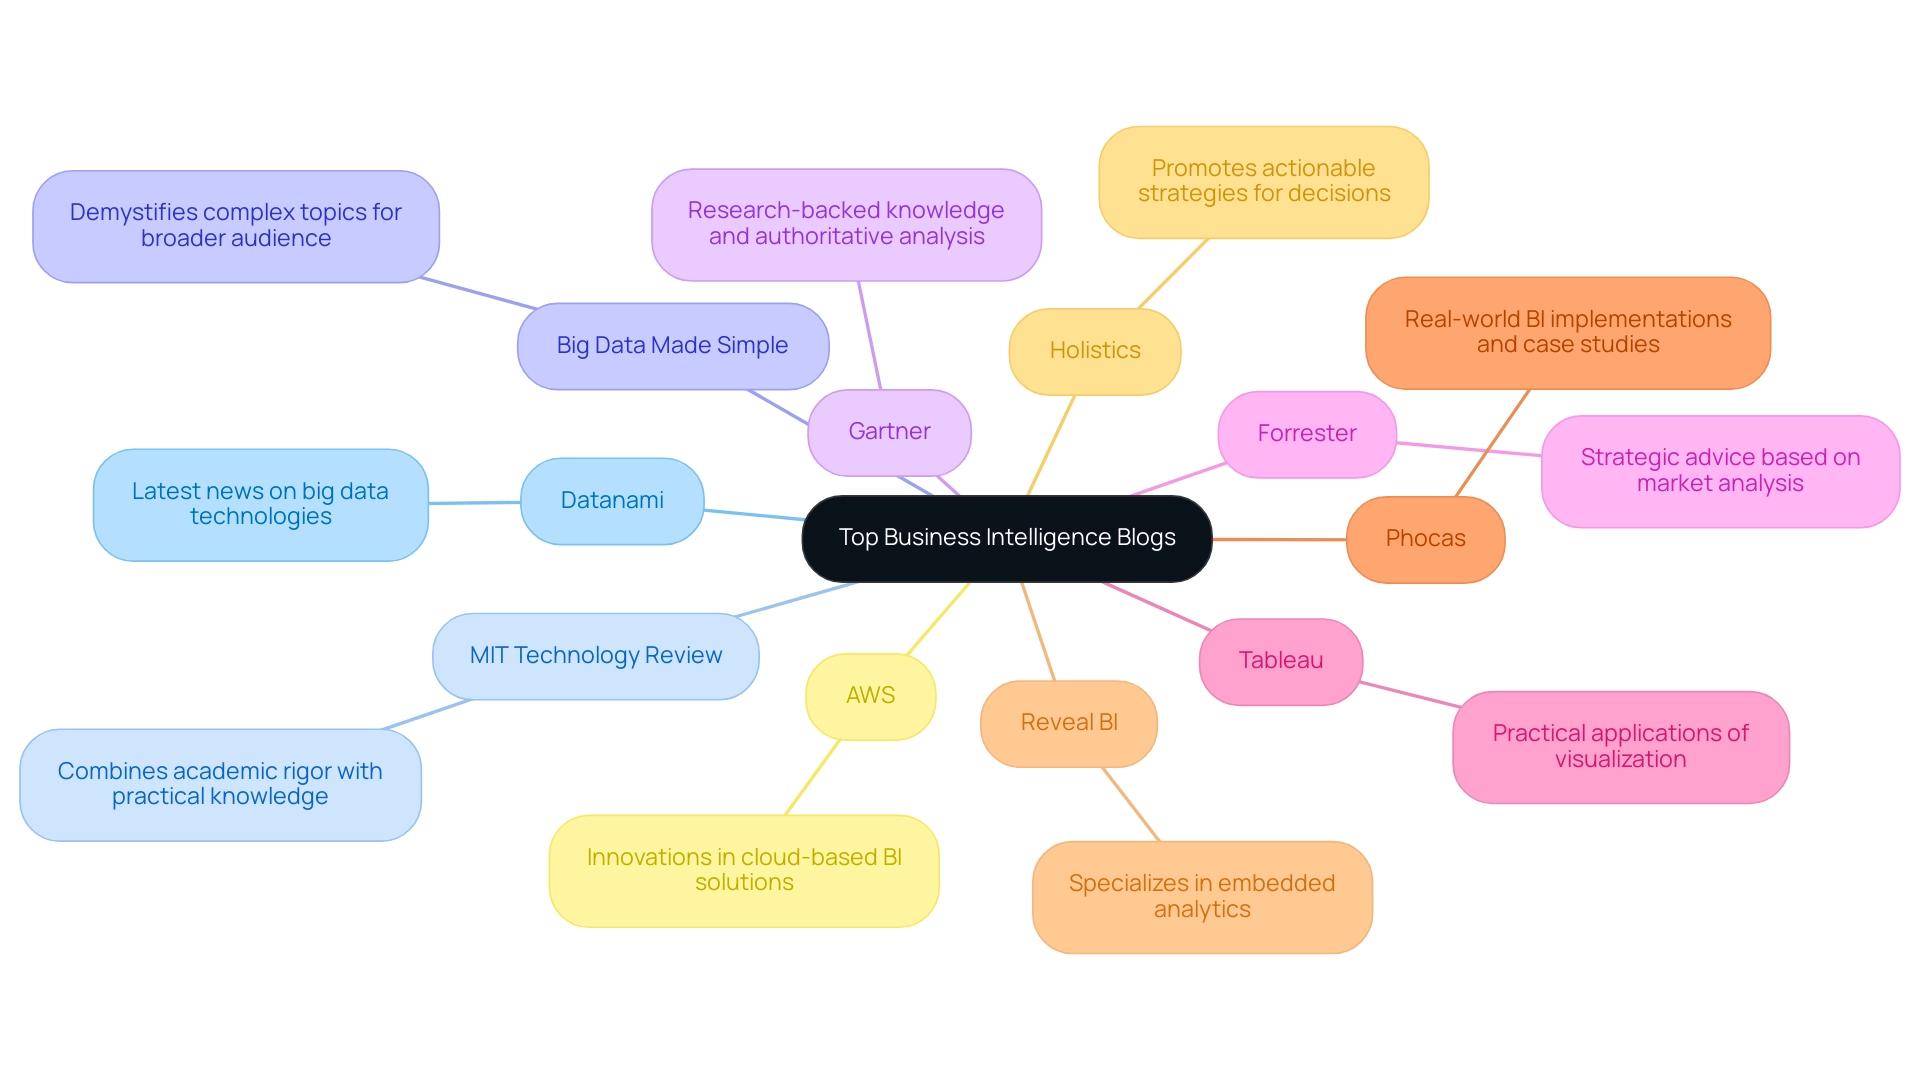
Staying Ahead: The Importance of Following BI Trends
In the rapidly evolving realm of business intelligence, keeping pace with emerging trends is essential for success. Engaging with BI blogs provides professionals with insights into the latest technologies, methodologies, and best practices. Notably, trends such as AI integration, real-time analytics, and information democratization are significantly transforming the BI landscape.
For instance, organizations that have successfully integrated business intelligence into their human resource management have reported enhanced decision-making capabilities and improved operational performance. This integration enables effective information management and predictive modeling, ultimately resulting in more strategic decisions.
Moreover, leveraging AI through tailored solutions like Small Language Models and GenAI Workshops can significantly improve data quality and operational efficiency. Statistics indicate that successful training in analytics should involve technical, analytical, and commercial skills, underscoring the importance of skill development in leveraging BI trends. Organizations that actively follow intelligence trends by utilizing BI blogs experience a marked improvement in performance metrics.
By harnessing AI and real-time analytics, businesses can make quicker, more informed decisions, saving both time and resources. As one expert noted, “Decisions can also be made far quicker than before, which saves valuable time and money.”
As the Middle East and Africa witness moderate growth with new companies entering the market, staying updated on these trends becomes even more critical for maintaining a competitive edge. In 2025, the importance of adapting to current BI technologies, including Robotic Process Automation (RPA) to automate manual workflows, cannot be overstated, as they are reshaping how organizations operate and make decisions. By embracing these advancements, companies can optimize their operations and drive innovation in their respective fields.
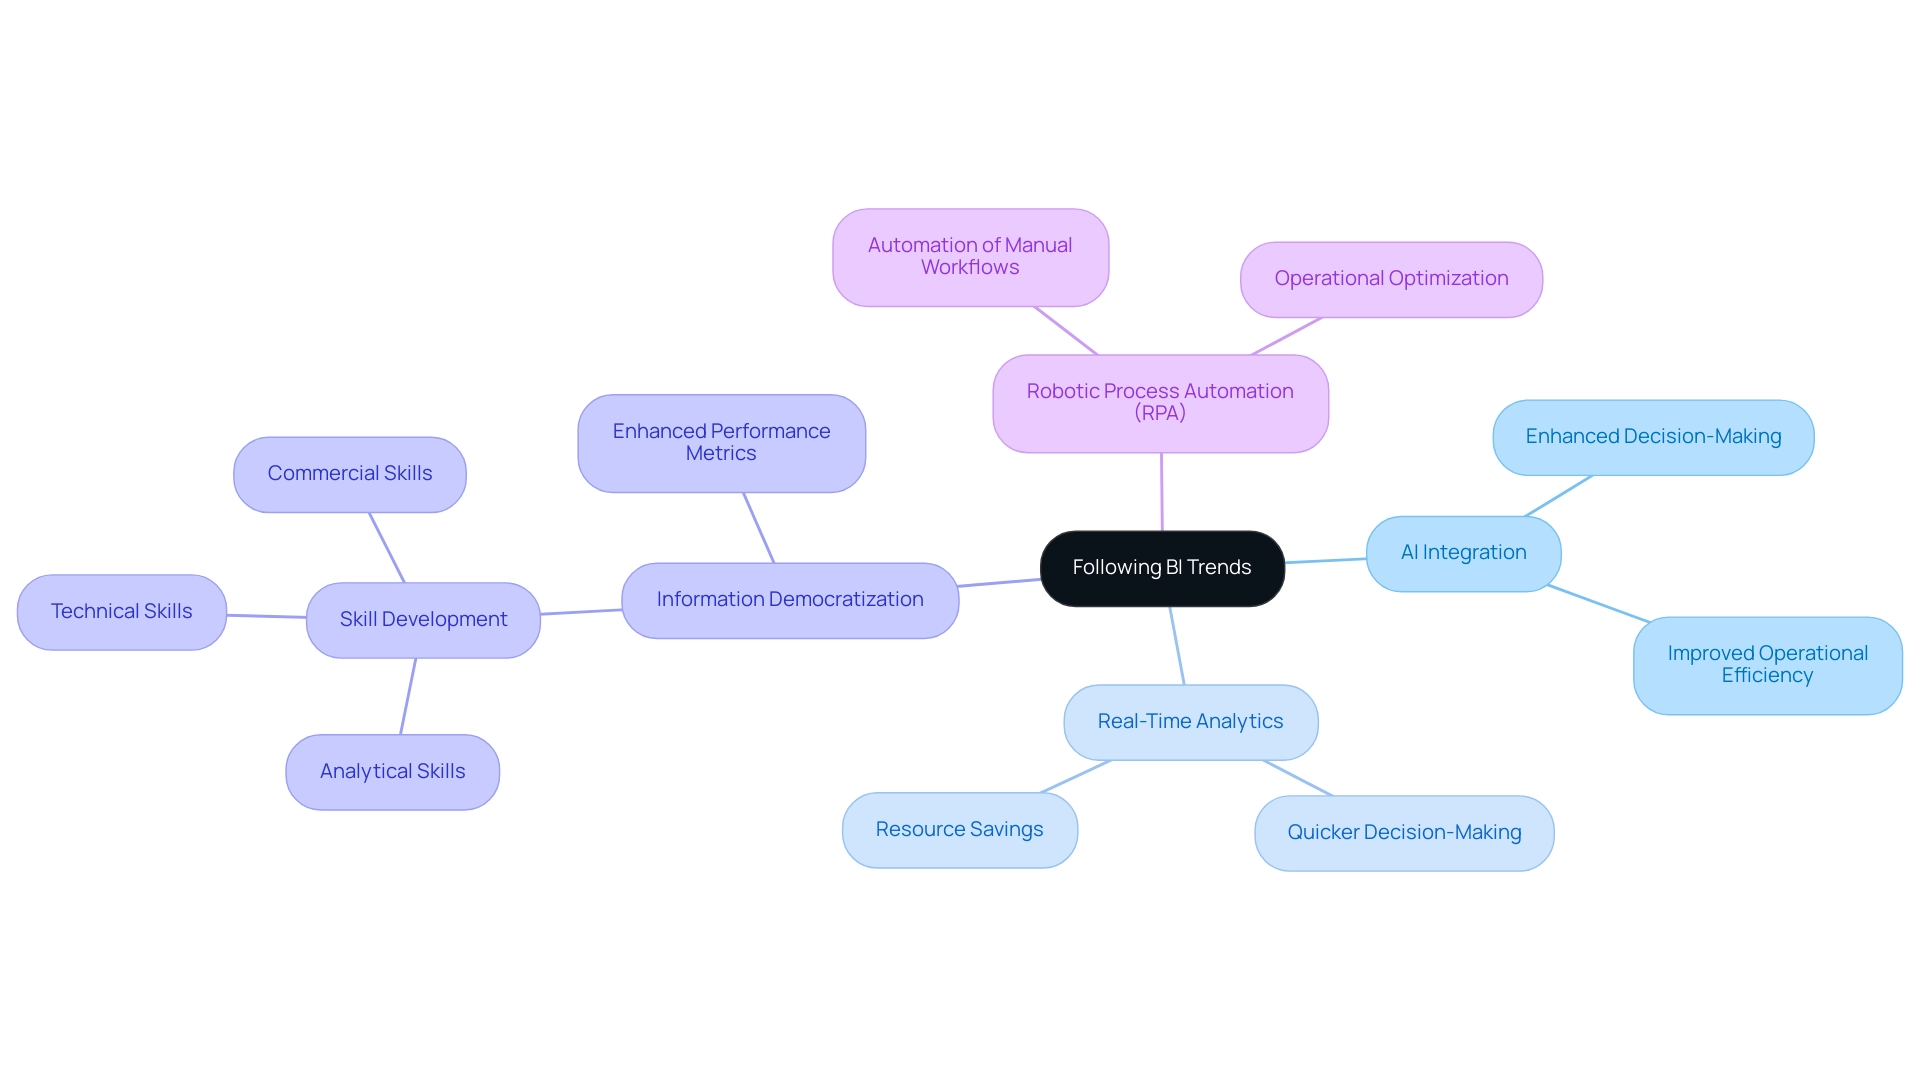
How to Apply Insights from BI Blogs to Your Operations
To effectively leverage insights from BI blogs, consider implementing the following strategies:
-
Identify Key Takeaways: Regularly extract understandings that align with your operational objectives, ensuring they are relevant and actionable. This is particularly important in a landscape where 55% of businesses are grappling with dark data—information that is collected but not analyzed.
-
Develop an Action Plan: Formulate a detailed roadmap that outlines specific changes to be made based on the information gathered, facilitating a structured approach to implementation. Leveraging Robotic Process Automation (RPA) tools like EMMA RPA and Microsoft Power Automate from Creatum GmbH can streamline this process, enhancing operational efficiency and employee morale.
-
Engage Your Team: Foster a culture of data-driven decision-making by sharing information with your team, encouraging collaboration and collective ownership of the BI initiatives. Empowering teams to access and utilize BI tools independently is vital, as 70% of respondents believe that BI self-service is crucial for effective decision-making.
-
Monitor Progress: Establish clear metrics to evaluate the impact of the changes implemented, allowing for data-driven assessments of success and areas for improvement. This involves tackling information inconsistency and governance challenges in corporate reporting for improved decision-making.
-
Iterate and Enhance: Continuously refine your strategies based on feedback and new perspectives from ongoing interaction with BI articles, ensuring that your approach evolves with the changing environment of data intelligence.
By actively applying insights from BI blogs, organizations can transform raw data into actionable intelligence, ultimately enhancing operational efficiency and decision-making capabilities. As Tom Payne, a trainer at New Horizons, states, “Data analytics allows us to make informed organizational decisions.” We can get a clearer picture of the business by looking at the past and present and be able to predict the future of the business.
Furthermore, the case study titled ‘Final Takeaways on Business Intelligence‘ illustrates how BI facilitates seamless information sharing across departments, preventing silos and making knowledge easily accessible. By developing a robust action plan based on BI insights and leveraging tailored AI solutions, including the 3-Day Power BI Sprint and General Management App from Creatum GmbH, organizations can drive meaningful improvements in operations.
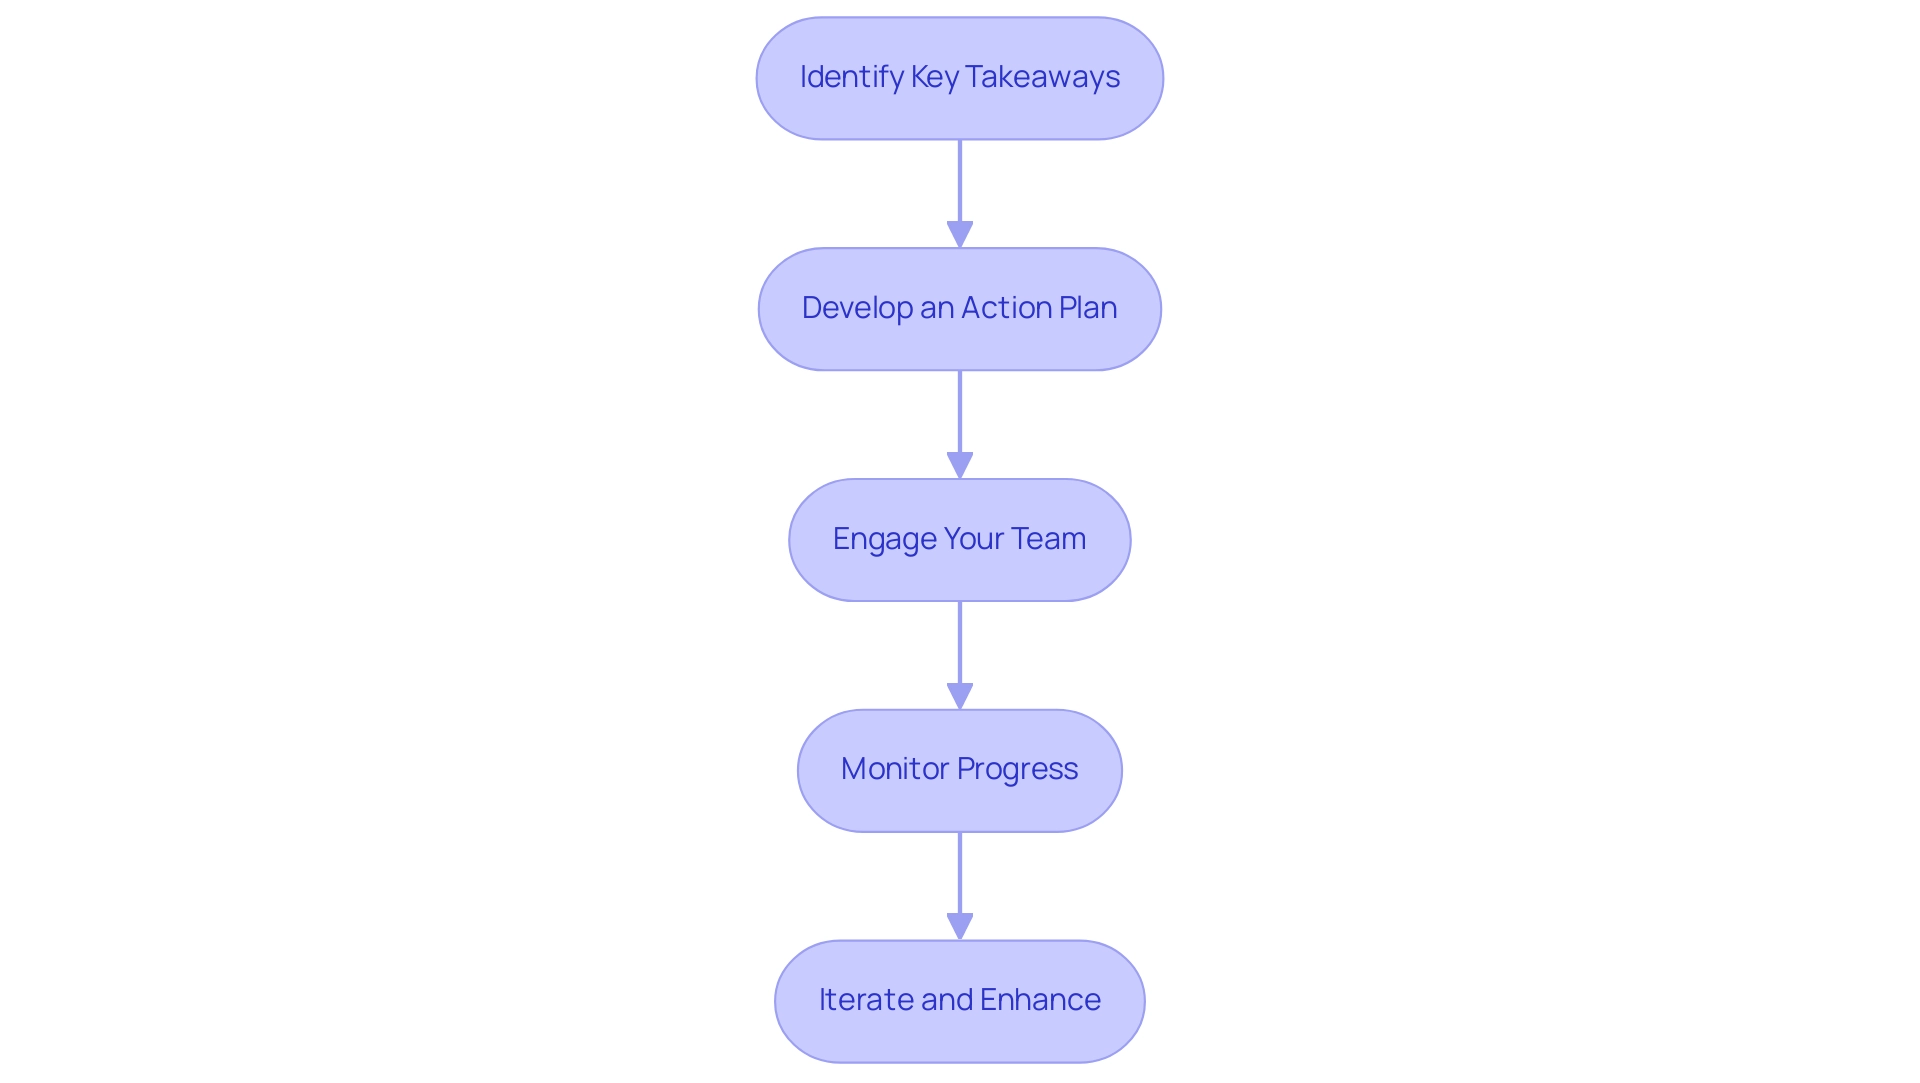
Overcoming BI Challenges with Expert Insights
Frequent challenges in business intelligence (BI) often stem from issues related to information quality, integration difficulties, and barriers to user adoption. Notably, 92% of Fortune 1000 companies identify cultural factors as significant roadblocks to effective BI implementation. This underscores the necessity for a strategic approach to overcome these hurdles. Insights from leading BI blogs can be invaluable for professionals aiming to navigate these challenges.
For instance, these resources frequently provide strategies for enhancing governance, which is crucial for ensuring the accuracy and reliability of information utilized in BI initiatives.
Moreover, improving user training programs is essential for nurturing a culture of data-driven decision-making. As Aradhana Iyer, Marketing Leader at IBM Data & AI, asserts, “By fostering a culture that embraces continuous learning and innovation, organizations can fully harness the potential of gen AI and augmented analytics to make smarter, faster, and more informed decisions.” Organizations that invest in comprehensive training experience a marked increase in user engagement and satisfaction, directly impacting the effectiveness of BI tools.
Selecting the right BI solutions is also imperative; with the top five BI software solutions commanding a combined market share of 57.65%, making informed choices can significantly enhance operational efficiency.
Specialist perspectives emphasize that addressing information quality is vital, as inadequate information can lead to misguided strategies and missed opportunities. In fact, only 27% of leaders feel equipped to translate information into actionable insights, indicating a substantial gap in utilization. The challenges in BI implementation are further illustrated by a case study revealing that cultural factors serve as a primary roadblock for many organizations.
By leveraging expert advice and best practices, organizations can effectively confront these common challenges, ultimately maximizing the value derived from their BI initiatives. Addressing data quality not only improves operational efficiency but also enhances informed decision-making, competitive advantage, and increased revenue. Furthermore, integrating Robotic Process Automation (RPA) can streamline workflows, reduce errors, and free up teams for more strategic tasks, while tailored AI solutions can assist organizations in navigating the complexities of the evolving technology landscape.
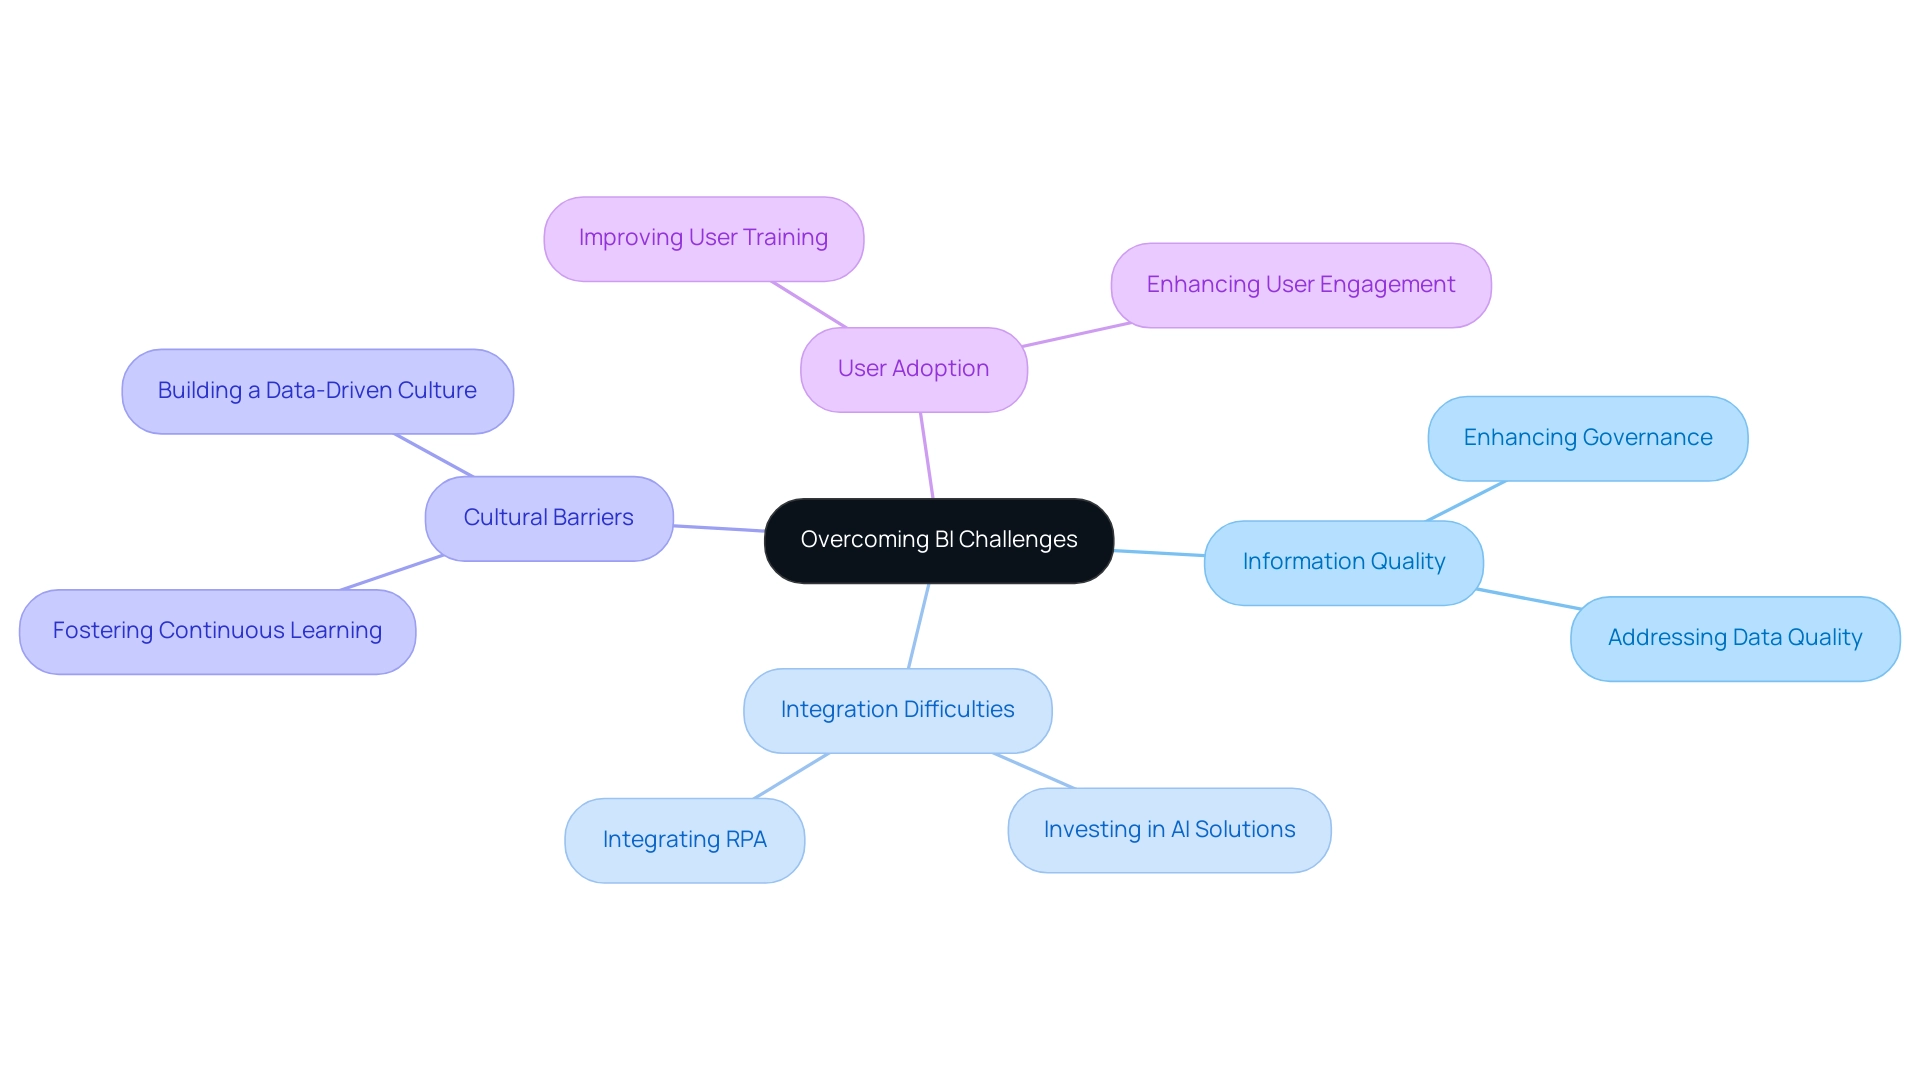
Join the Conversation: Share Your Favorite BI Blogs
Engaging with the business intelligence (BI) community can significantly enhance your learning journey. By sharing your favorite BI blogs on social media or within professional networks, you not only broaden your own perspective but also invite others to explore valuable resources. Participating in discussions about the knowledge you’ve acquired strengthens your comprehension while contributing to a shared information pool.
Statistics reveal that 90% of communities leverage suggestions from their members to refine products and services, underscoring the power of collaborative dialogue.
Active participation in the BI community fosters a richer learning environment that encourages the exchange of innovative ideas. For instance, Community Memo provides monthly insights on community management trends, events, and job opportunities, invaluable for professionals aiming to stay informed and engaged. Subscribing through LinkedIn can further enhance your connection to the community and keep you updated on the latest developments.
As Adrian Speyer, former Head of Community at Higher Logic, emphasizes, “By combining my passion for digital marketing and community, I work to create beautiful and functional online communities to help brands connect with their audiences around the world.” This perspective highlights the importance of creating and nurturing online communities where knowledge can be shared and discussed.
Moreover, the rapidly evolving AI landscape can be daunting, making it essential to leverage tailored solutions that align with your specific business goals. Case studies, such as the one from Maptionnaire, which focused on inclusive transportation planning, illustrate how community involvement can yield practical knowledge and strategies. Such examples highlight the importance of sharing and discussing BI blogs, as they not only enhance your professional growth but also assist others in the field.
Additionally, Creatum’s Power BI Sprint service has proven to significantly accelerate BI development for clients. A testimonial from Sascha Rudloff, Team Leader of IT and Process Management at PALFINGER Tail Lifts GMBH, notes that the service provides an immediately usable Power BI report and gateway setup, enhancing the overall data analysis strategy. Furthermore, leveraging Robotic Process Automation (RPA) can streamline manual workflows, boosting efficiency and allowing teams to focus on more strategic tasks.
Ultimately, engaging with the BI community is a strategic move that can lead to significant advancements in your understanding and application of intelligence, driving data-driven insights and operational efficiency for growth.
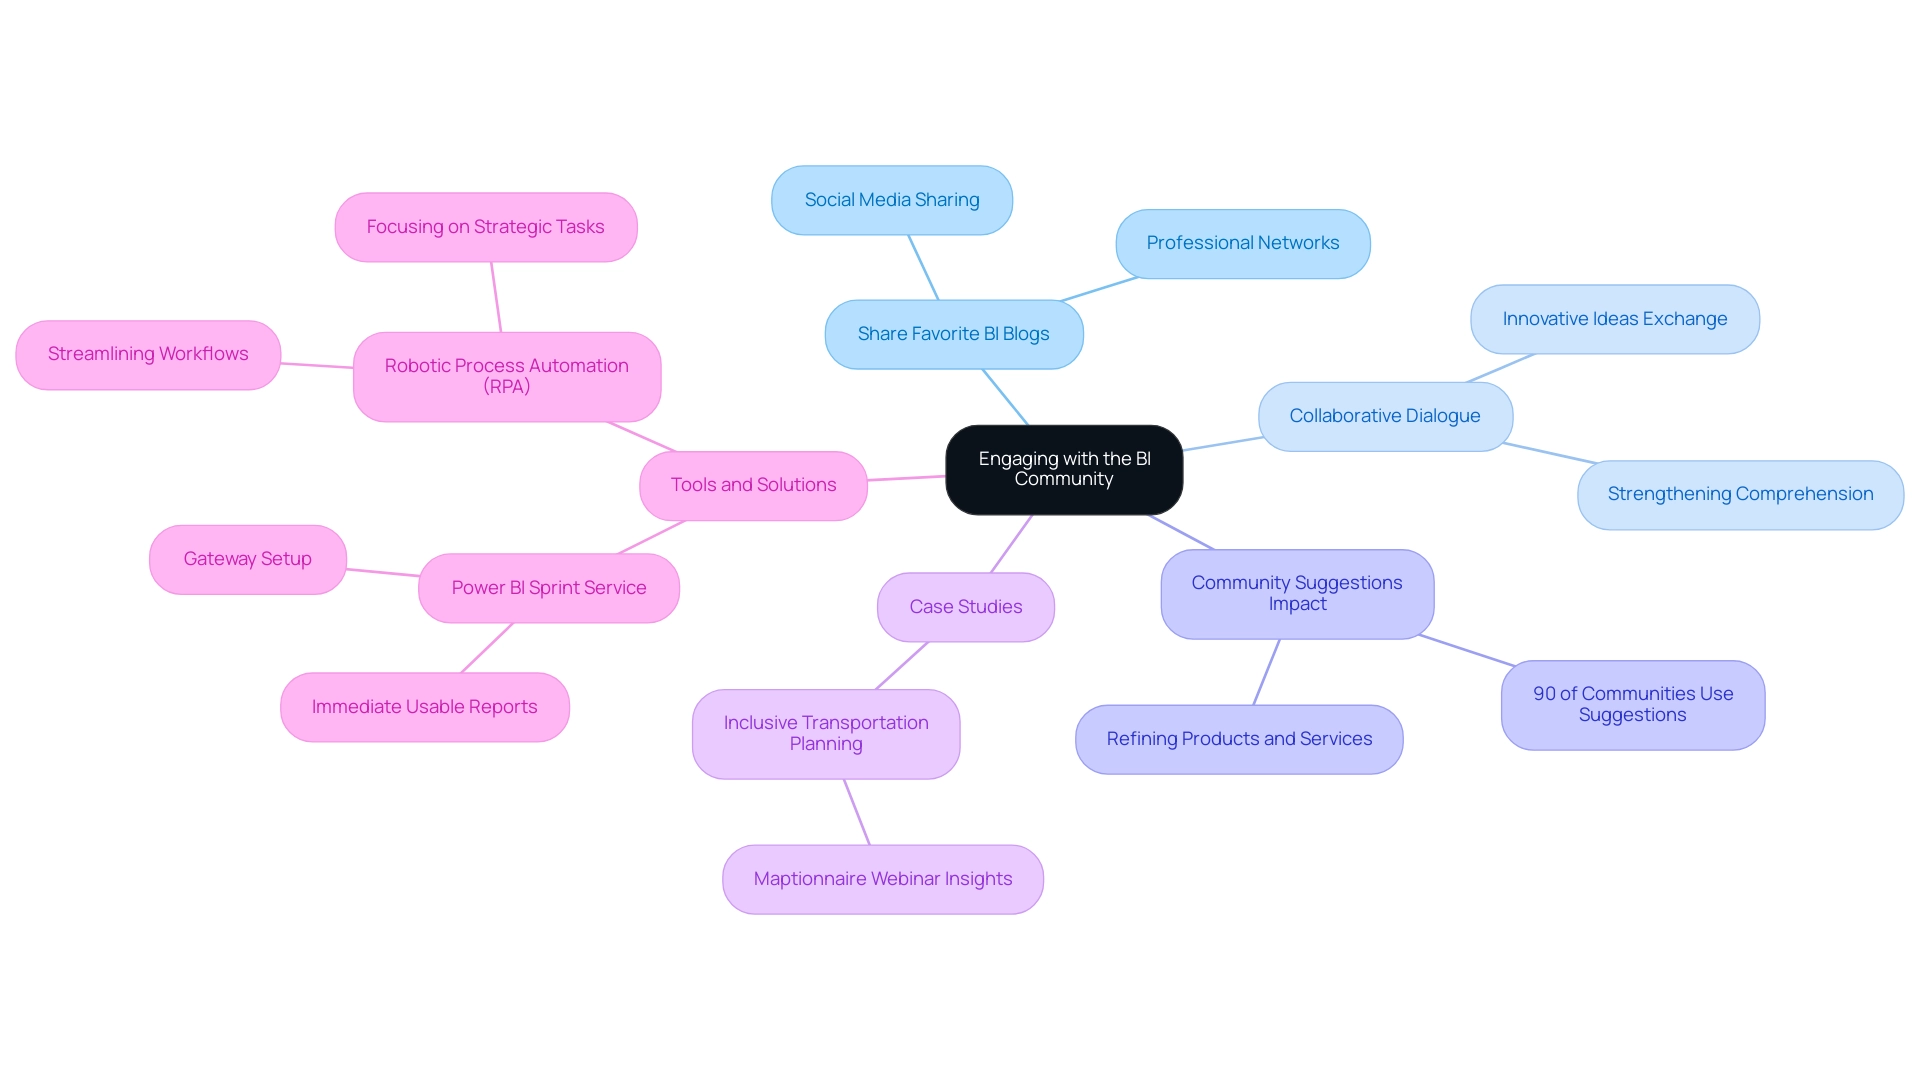
The Benefits of Engaging with BI Blogs
Engaging with BI blogs offers a multitude of advantages that can significantly elevate your professional journey.
-
Continuous Learning: In the fast-paced realm of business intelligence, staying updated on the latest trends and technologies is essential. Regularly reading BI blogs keeps you informed about new tools and methodologies that can enhance operational efficiency. Investing in skill development programs can lead to increased productivity, reduced turnover, and a robust culture of continuous improvement. This is particularly pertinent as organizations grapple with challenges like staffing shortages and the need to mitigate repetitive tasks, effectively addressed through RPA solutions, such as those provided by Creatum GmbH.
-
BI blogs also serve as networking platforms, connecting you with industry professionals and thought leaders. By engaging in discussions and commenting on posts, you can expand your professional network, which is crucial for knowledge sharing and fostering collaborations. This networking can facilitate the discovery of innovative solutions to common operational challenges, including outdated systems that impede progress.
-
Moreover, BI blogs offer practical insights that present actionable strategies for immediate implementation within your organization. These insights can streamline processes and enhance decision-making, ultimately driving superior business outcomes. For example, a case study on improving operational efficiency through GUI automation demonstrates how a mid-sized company reduced data entry errors by 70% and improved workflow efficiency by 80%, highlighting the transformative impact of Creatum’s intelligent RPA solutions.
-
Diverse Perspectives: Exposure to a range of viewpoints through BI articles fosters critical thinking and innovation. Interacting with various authors and contributors allows you to explore diverse methods and solutions to typical challenges, including the integration of generative AI to gain a competitive edge in processes.
-
Resource Accessibility: BI blogs provide a treasure trove of information and tools that can enhance your BI initiatives. From tutorials to case studies, these resources support your understanding and application of intelligence concepts. Client testimonials underscore the effectiveness of Creatum GmbH’s technology solutions in boosting operational efficiency and driving business growth, reinforcing the value of these resources.
Statistics indicate that by 2030, up to 375 million workers worldwide may need to transition to different occupational categories due to automation and artificial intelligence. This underscores the necessity of adapting and evolving in the BI field, making networking and knowledge-sharing more critical than ever. Furthermore, as Elaine Clanton Harpine asserts, “True motivation must come from within—it must be intrinsic.”
By actively engaging with BI resources, you not only enhance your own skills but also contribute to a broader culture of continuous learning and innovation within the industry.
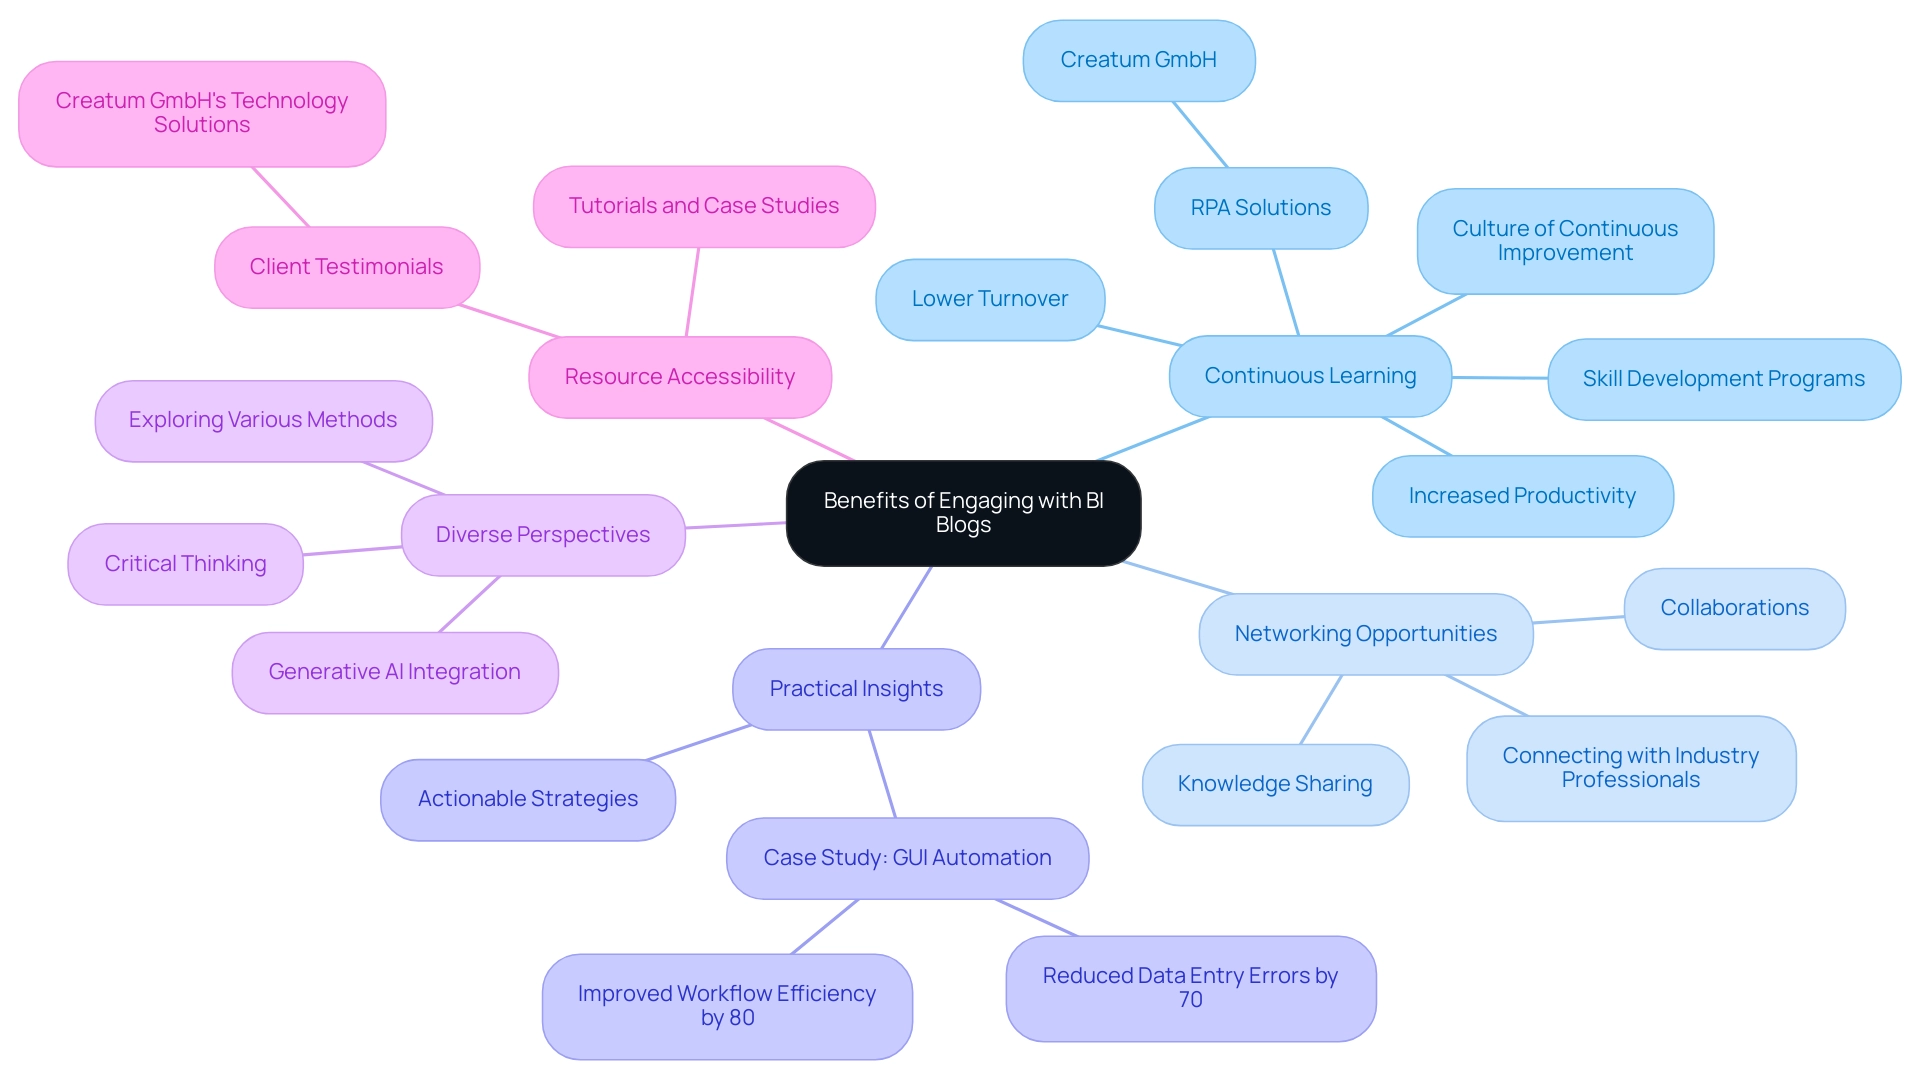
Get Started: Explore These BI Blogs Today
Understanding the significance of Business Intelligence is just the beginning; now it’s time to take proactive steps. Begin by diving into the top 10 BI websites highlighted earlier. Allocate specific time each week to read articles, engage with the content, and contemplate how these insights can be integrated into your operations.
Active participation in the BI community not only broadens your knowledge but also sharpens your skills, ultimately leading to improved decision-making within your organization. Statistics reveal that companies that engage with BI content see substantial benefits; for instance, organizations that maintain a consistent reading habit can enhance their operational efficiency significantly. In fact, companies that have online journals generate 67% more leads than those who don’t, highlighting the importance of engaging with quality content. Additionally, case studies demonstrate how companies have effectively utilized information from BI blogs to transform their operations.
For example, in the insurance sector, organizations have empowered insurance companies to overcome inefficiencies in their quoting and claims processes, resulting in exceptional service delivery to policyholders.
Moreover, leveraging Robotic Process Automation (RPA) from Creatum GmbH can significantly streamline your workflows, reducing manual tasks and enhancing operational efficiency. Creatum’s tailored AI solutions can help you navigate the rapidly evolving AI landscape, ensuring that you adopt technologies that align with your specific business goals. The transformative impact of Creatum’s Power BI Sprint is evident in testimonials from clients like Sascha Rudloff, who noted a significant acceleration in their Power BI development, which exceeded expectations and provided a crucial boost to their data analysis strategy.
By dedicating time to explore BI articles, you position yourself to harness the full potential of data-driven knowledge, fostering professional growth and operational excellence. Remember, the average blog post is about 1,500 words long, and longer posts tend to perform better in search engines, so seek out in-depth articles that provide valuable insights.
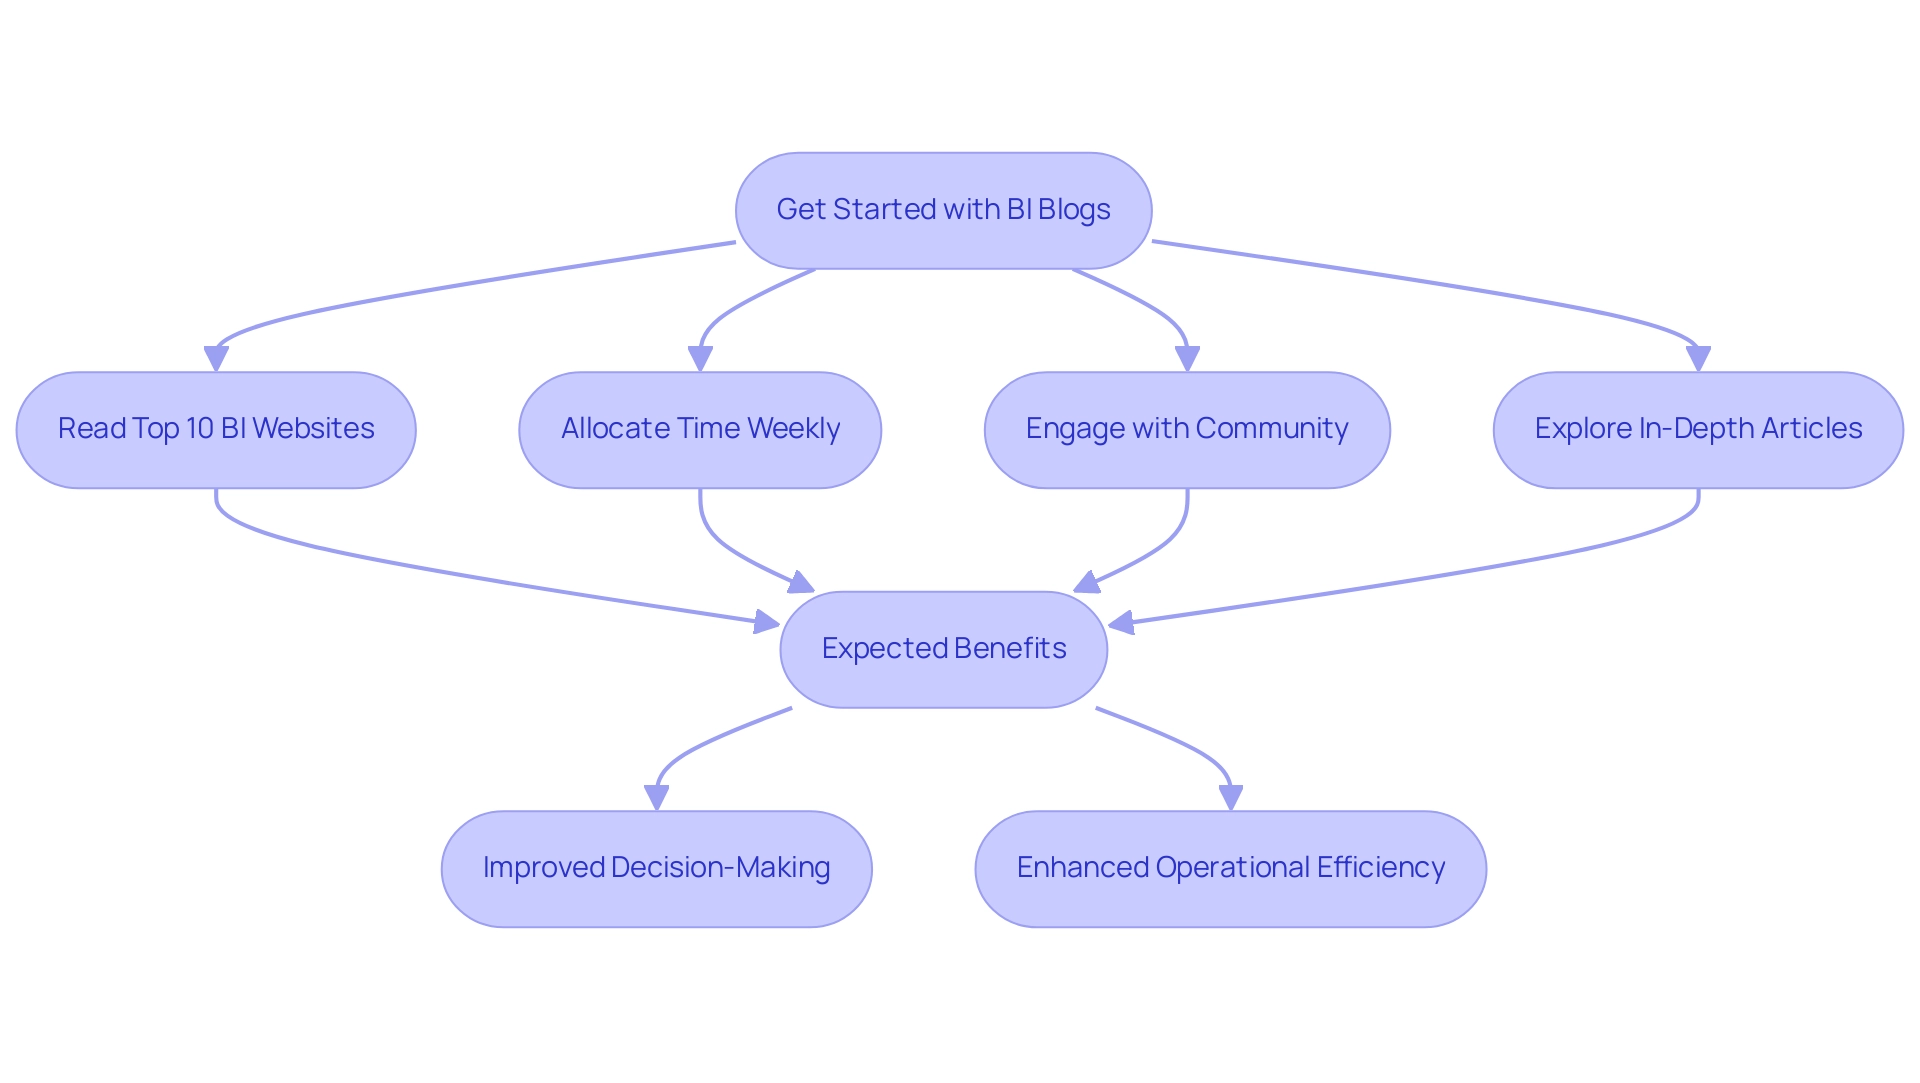
Conclusion
In today’s data-driven landscape, adopting Business Intelligence (BI) has become essential for organizations striving to excel in a competitive environment. This article explores the pivotal role of BI, highlighting its ability to convert extensive data into actionable insights that boost operational efficiency and strategic initiatives. By prioritizing BI, organizations can cultivate a data-driven culture, streamline processes, and ultimately achieve meaningful growth.
Selecting the right BI resources is equally crucial. By concentrating on relevance, expertise, and engagement, businesses can pinpoint valuable blogs that offer actionable insights and deepen their understanding of BI practices. A curated list of top BI blogs serves as an excellent starting point for professionals eager to expand their knowledge and implement best practices within their organizations.
Moreover, remaining abreast of emerging BI trends is vital. The integration of AI, real-time analytics, and data democratization is transforming the BI landscape, empowering organizations to make faster, more informed decisions. By actively engaging with these insights and applying strategies derived from BI blogs, companies can enhance their operational capabilities and navigate the complexities of data management more effectively.
Ultimately, the path to effective BI implementation is a continuous journey. By leveraging expert insights, fostering a culture of ongoing learning, and engaging with the BI community, organizations can unlock the full potential of their data assets. Investing in BI not only enhances decision-making but also empowers businesses to innovate and adapt in an ever-evolving environment, securing sustained success for the future.
Frequently Asked Questions
What is Business Intelligence (BI)?
Business Intelligence (BI) is a suite of technologies, applications, and practices used for collecting, integrating, analyzing, and presenting organizational information to transform raw data into actionable insights.
Why is BI important in today’s information-rich environment?
BI is crucial for informed decision-making, enhancing operational efficiency, and driving strategic initiatives, especially as the number of connected IoT devices and the volume of generated data continue to increase.
What role does BI play in decision-making?
BI is prioritized by 60% of information leaders as a top initiative, highlighting its essential role in shaping business strategies and fostering a culture driven by insights.
How does BI improve operational efficiency?
BI streamlines processes and reduces errors, as demonstrated by a case study where a mid-sized company automated data entry and software testing, achieving a 70% reduction in entry errors and an 80% increase in workflow efficiency.
What are the recent trends in BI for 2025?
Trends include enhancing security, improving quality, fostering a culture of information, strengthening governance, and boosting data literacy to empower organizations to leverage data effectively.
What criteria should be considered when selecting BI websites to follow?
Key criteria include relevance to your interests, frequency of updates, reader engagement, and diversity of content to ensure a comprehensive understanding of BI practices.
Can you name some premier BI blogs to follow?
Notable BI blogs include Datanami, MIT Technology Review, Large Information Simplified, Gartner BI Platform, Forrester’s Business Intelligence Resource, Tableau Blog, Phocas Business Intelligence Website, Reveal BI Article, Holistics Journal, and AWS Business Intelligence Blog.
What benefits can organizations gain from following quality BI resources?
Following reputable BI resources can enhance insights, inform decision-making processes, and improve operational efficiency, which is essential for maintaining competitiveness in the information-driven landscape.
Overview
The Center of Excellence (CoE) program aims to elevate performance and stimulate innovation. By centralizing expertise, standardizing processes, and aligning strategic goals with functional capabilities, CoEs play a crucial role in organizational success.
This program facilitates knowledge sharing and enhances operational efficiency through technologies such as Robotic Process Automation (RPA). Furthermore, it fosters a culture of continuous improvement.
Ultimately, these elements drive success in a competitive landscape. As organizations strive for excellence, the CoE program stands as a vital component in achieving strategic objectives and operational effectiveness.
Introduction
In an increasingly complex and competitive business landscape, Centers of Excellence (CoEs) have emerged as a pivotal force in driving operational efficiency and fostering innovation. These specialized teams centralize expertise and cultivate best practices, enhancing overall performance across organizations. As they navigate the challenges of 2025, CoEs are proving indispensable by aligning strategic objectives with operational capabilities, empowering organizations to adapt swiftly to market dynamics.
By leveraging advanced technologies such as Robotic Process Automation (RPA) and artificial intelligence, CoEs are reshaping workflows and enhancing decision-making processes. This positions them as leaders in their respective fields. This article delves into the transformative impact of CoEs, exploring their core objectives, the challenges they address, and the unique value they bring to organizations striving for continuous improvement and sustained growth.
Understanding the Center of Excellence (CoE) Concept
A Center of Excellence (CoE) operates as a dedicated team or entity within a company, focusing on a specific area of expertise. Its core mission is to provide leadership, establish best practices, conduct research, and offer support and training. This raises an essential question: what is the objective of the CoE program in elevating performance and stimulating innovation? By centralizing knowledge and resources, centers of excellence enable organizations to leverage their expertise effectively, resulting in enhanced processes, cost savings, and a culture of continuous improvement.
In 2025, the objective of the CoE program is underscored by the significance of centers of excellence in aligning strategic goals with functional capabilities. This alignment is vital for enhancing efficiency and effectiveness across various functions. For instance, the experience of the Willis-Knighton Health System illustrates the challenges healthcare providers face in establishing centers of excellence, often resorting to a trial-and-error approach due to limited guidance.
Their insights highlight the necessity of a comprehensive understanding of the delivery model and its benefits to achieve high-quality care. This understanding ultimately serves as a blueprint for other healthcare establishments aiming to replicate successful processes. The lessons learned from their experience emphasize the objective of the CoE program, reinforcing the importance of investing in a detailed comprehension of CoE operations.
Current statistics reveal that establishing CoEs requires substantial financial resources for successful operations; however, this investment is justified by the excellence they foster. Leaders must continuously monitor and adjust their strategies to ensure alignment with the organization’s purpose and practical realities, prompting the question: what is the objective of the CoE program in driving success? This dynamic nature of operational excellence is essential for organizations to thrive in a competitive landscape.
Expert opinions indicate that CoEs can significantly enhance the depth and breadth of services available within communities. As JLF Jr. states, “Centers of excellence have the ability to dramatically enhance the depth and breadth of healthcare services available in communities,” showcasing their potential to transform operational efficiency. By implementing a CoE, organizations streamline workflows through Robotic Process Automation (RPA) and Business Intelligence (BI), while also fostering an environment conducive to innovation and growth, making them indispensable in today’s competitive landscape.
Furthermore, the findings and lessons learned from these initiatives will be widely disseminated, highlighting the importance of sharing knowledge and best practices in establishing Centers of Excellence.
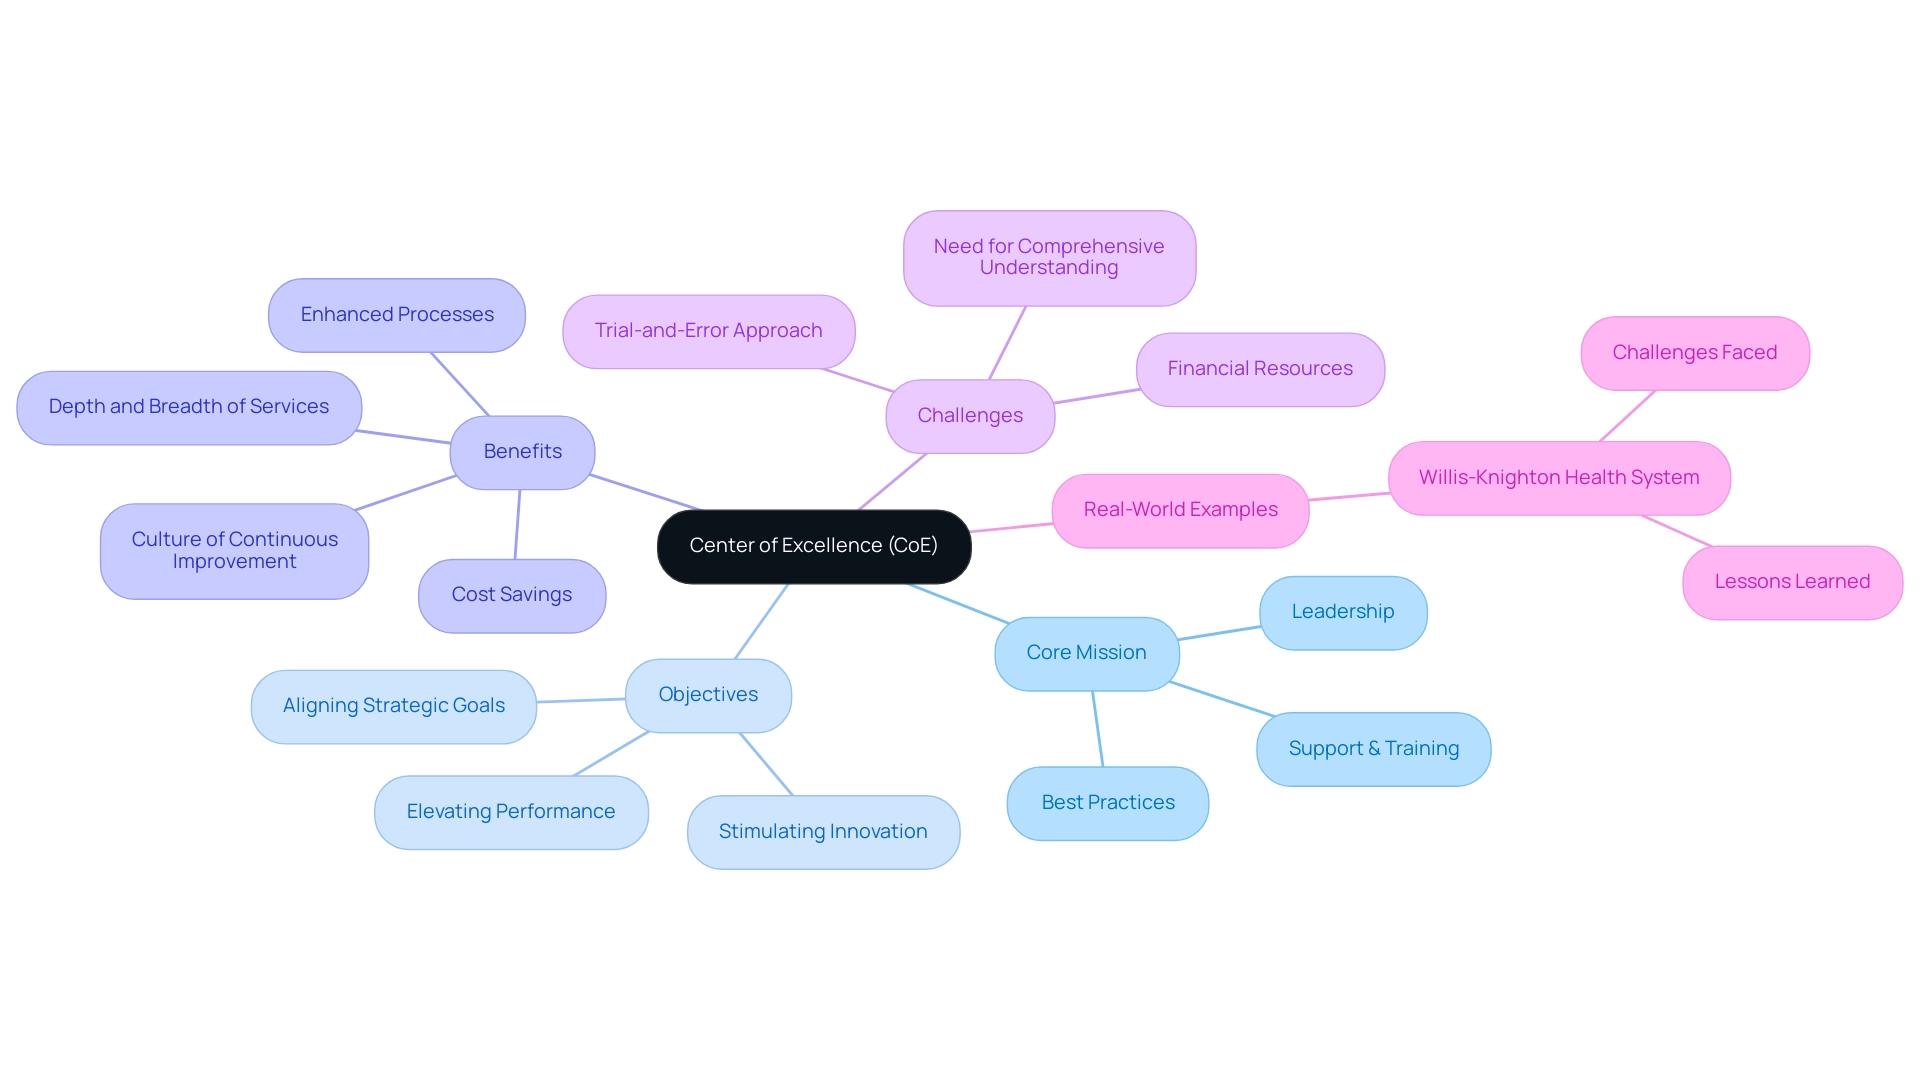
Core Objectives of the CoE Program
When considering the core objectives of a Center of Excellence (CoE) program, one might ask: What is the objective of the CoE program in driving operational efficiency, fostering innovation, and enhancing collaboration across various departments? By standardizing processes and practices, centers of excellence enable entities to streamline workflows, minimize redundancies, and significantly boost overall productivity. A study by McKinsey & Company found that educational institutions implementing data-driven decision-making through CoEs experienced a remarkable 15% increase in overall performance.
Moreover, CoEs serve as incubators for new ideas and technologies, enabling entities to remain competitive in rapidly evolving markets. They play a crucial role in facilitating knowledge sharing and collaboration among teams, ensuring that best practices are effectively disseminated throughout the entity. This collaborative setting not only boosts efficiency but also aligns strategic goals, ultimately resulting in enhanced performance.
Furthermore, entities with a CoE are more inclined to establish robust data governance frameworks. The Data Governance Institute reported that 80% of such entities have implemented effective governance strategies. This highlights the significance of Centers of Excellence in driving innovation and standardization, prompting us to consider: What is the objective of the CoE program for entities aiming to thrive in today’s data-rich environment?
A notable example is Harvard University, which improved faculty and student engagement and enhanced administrative efficiency by integrating a comprehensive learning management system. This demonstrates the tangible benefits of Center of Excellence initiatives in fostering collaboration and efficiency improvements.
Additionally, utilizing Robotic Process Automation (RPA) solutions like EMMA RPA and Microsoft Power Automate can significantly boost productivity and employee morale by automating manual workflows. These innovative tools streamline processes, reduce errors, and provide a risk-free ROI assessment, making them invaluable in the pursuit of excellence. A case study on a mid-sized company illustrates this: GUI automation led to a 70% reduction in data entry errors and an 80% improvement in workflow efficiency, showcasing the transformative impact of RPA in enhancing business productivity and decision-making capabilities.
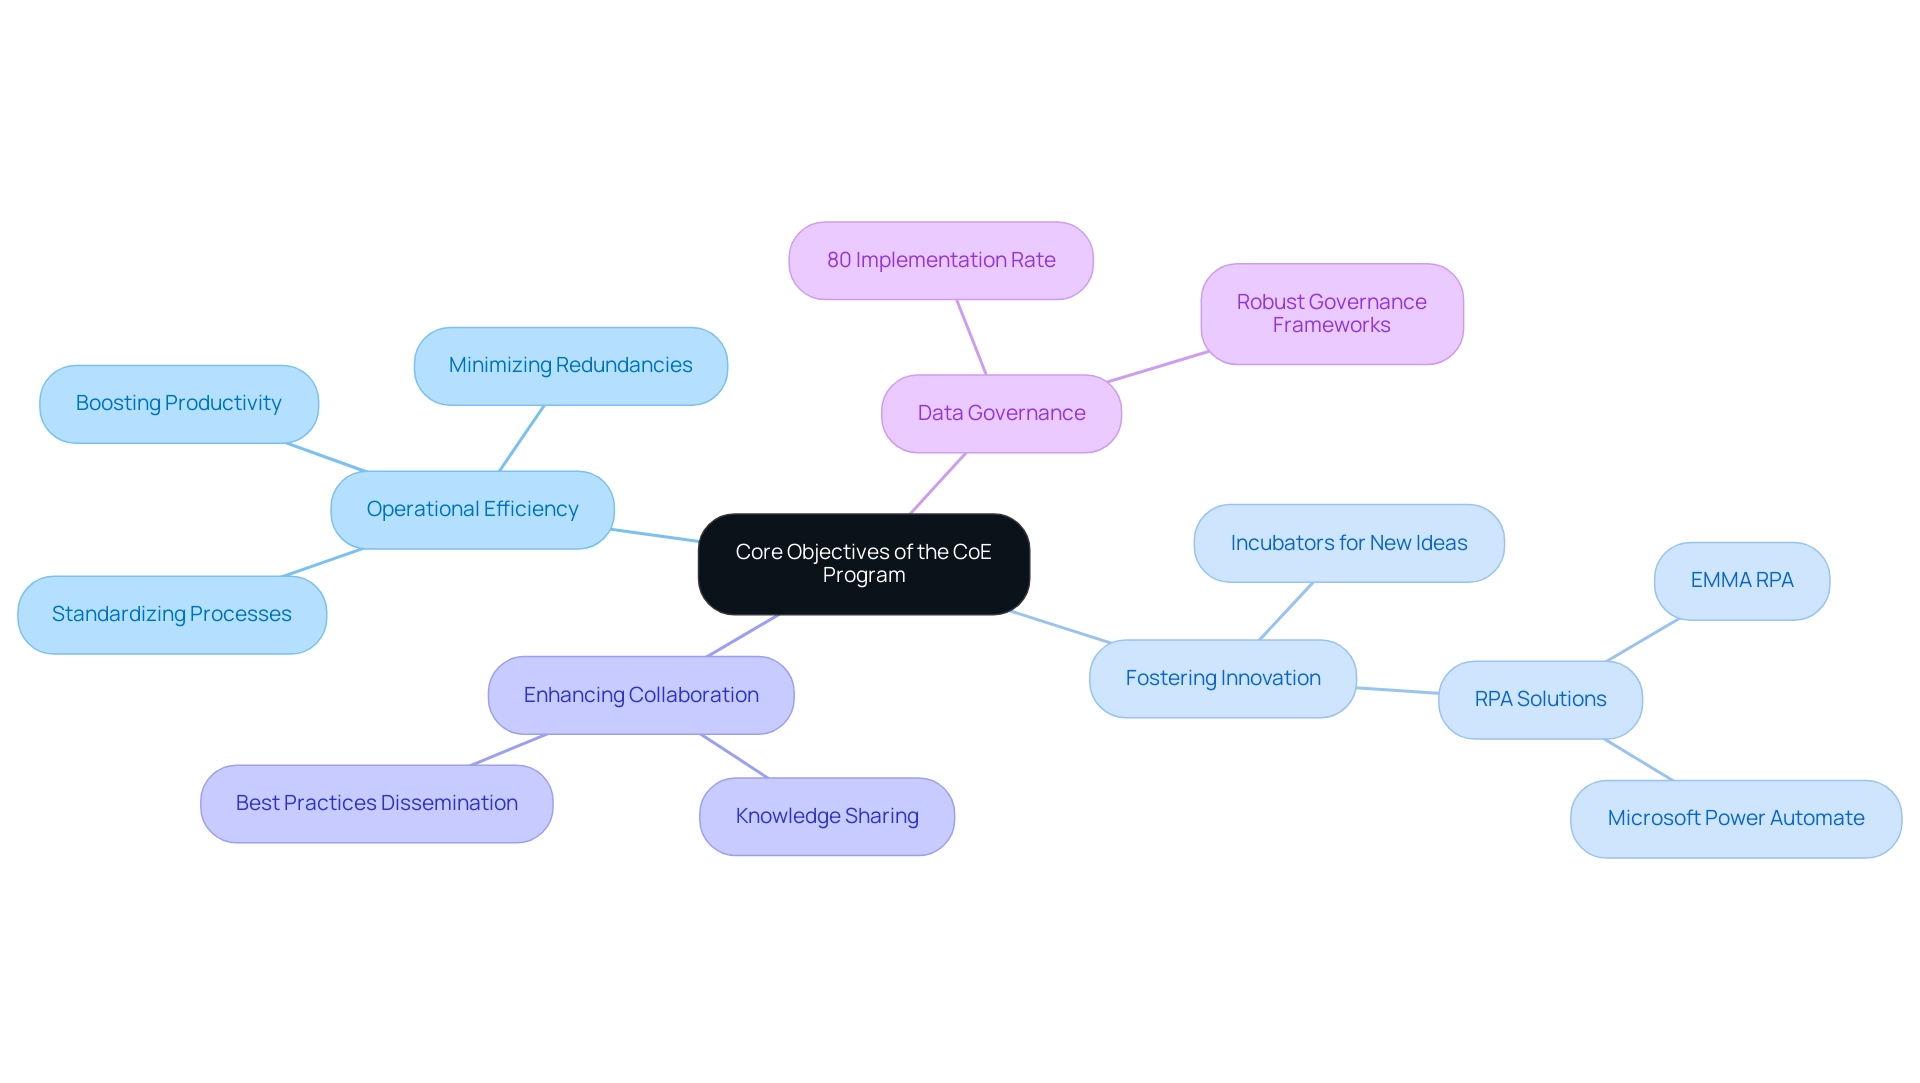
Addressing Operational Challenges through CoEs
Centers of Excellence are pivotal in addressing the operational challenges that companies face today, underscoring the objective of the COE program. By centralizing expertise and resources, these centers effectively clarify the program’s goals by identifying inefficiencies and implementing standardized processes that significantly enhance productivity. Unfortunately, many organizations still depend on cumbersome reporting tools or manual spreadsheets due to limited analytics capabilities in their business software, which restricts their ability to make informed decisions.
In response, organizations can implement robotic process automation (RPA) solutions, such as EMMA RPA and Microsoft Power Automate, to streamline workflows. These tools not only minimize errors but also free employees to focus on more strategic, value-adding activities, thereby boosting overall employee morale. The impact of RPA on productivity is substantial. As companies prepare for uncertainties in 2025, RPA adoption is expected to become a cornerstone of strategic planning.
Organizations that embrace RPA can anticipate enhanced efficiency and a reduction in operational challenges, enabling them to remain agile in the face of unexpected market changes. A notable case study illustrating this is the Always-On Strategy for Business Resilience, which highlights the importance of adaptability and informed decision-making in a rapidly changing environment. This strategy closely aligns with RPA implementation, equipping businesses to respond swiftly to market dynamics.
Moreover, Centers of Excellence are instrumental in facilitating change management, prompting us to consider the objective of the COE program. They provide essential training and support to employees, aiding them in navigating new processes and technologies. This support is critical in overcoming resistance to change, ensuring a smooth and effective transition to automated systems.
As companies increasingly recognize the significance of RPA, expert insights clarify the objective of the COE program in effectively directing this change. For instance, a case study on a mid-sized company demonstrated that by implementing GUI automation, they reduced data entry errors by 70%, accelerated testing processes by 50%, and improved workflow efficiency by 80%. This underscores the positive impact of RPA on efficiency and employee satisfaction.
The effective execution of RPA within Centers of Excellence not only addresses pressing challenges but also positions organizations for sustained growth and innovation.
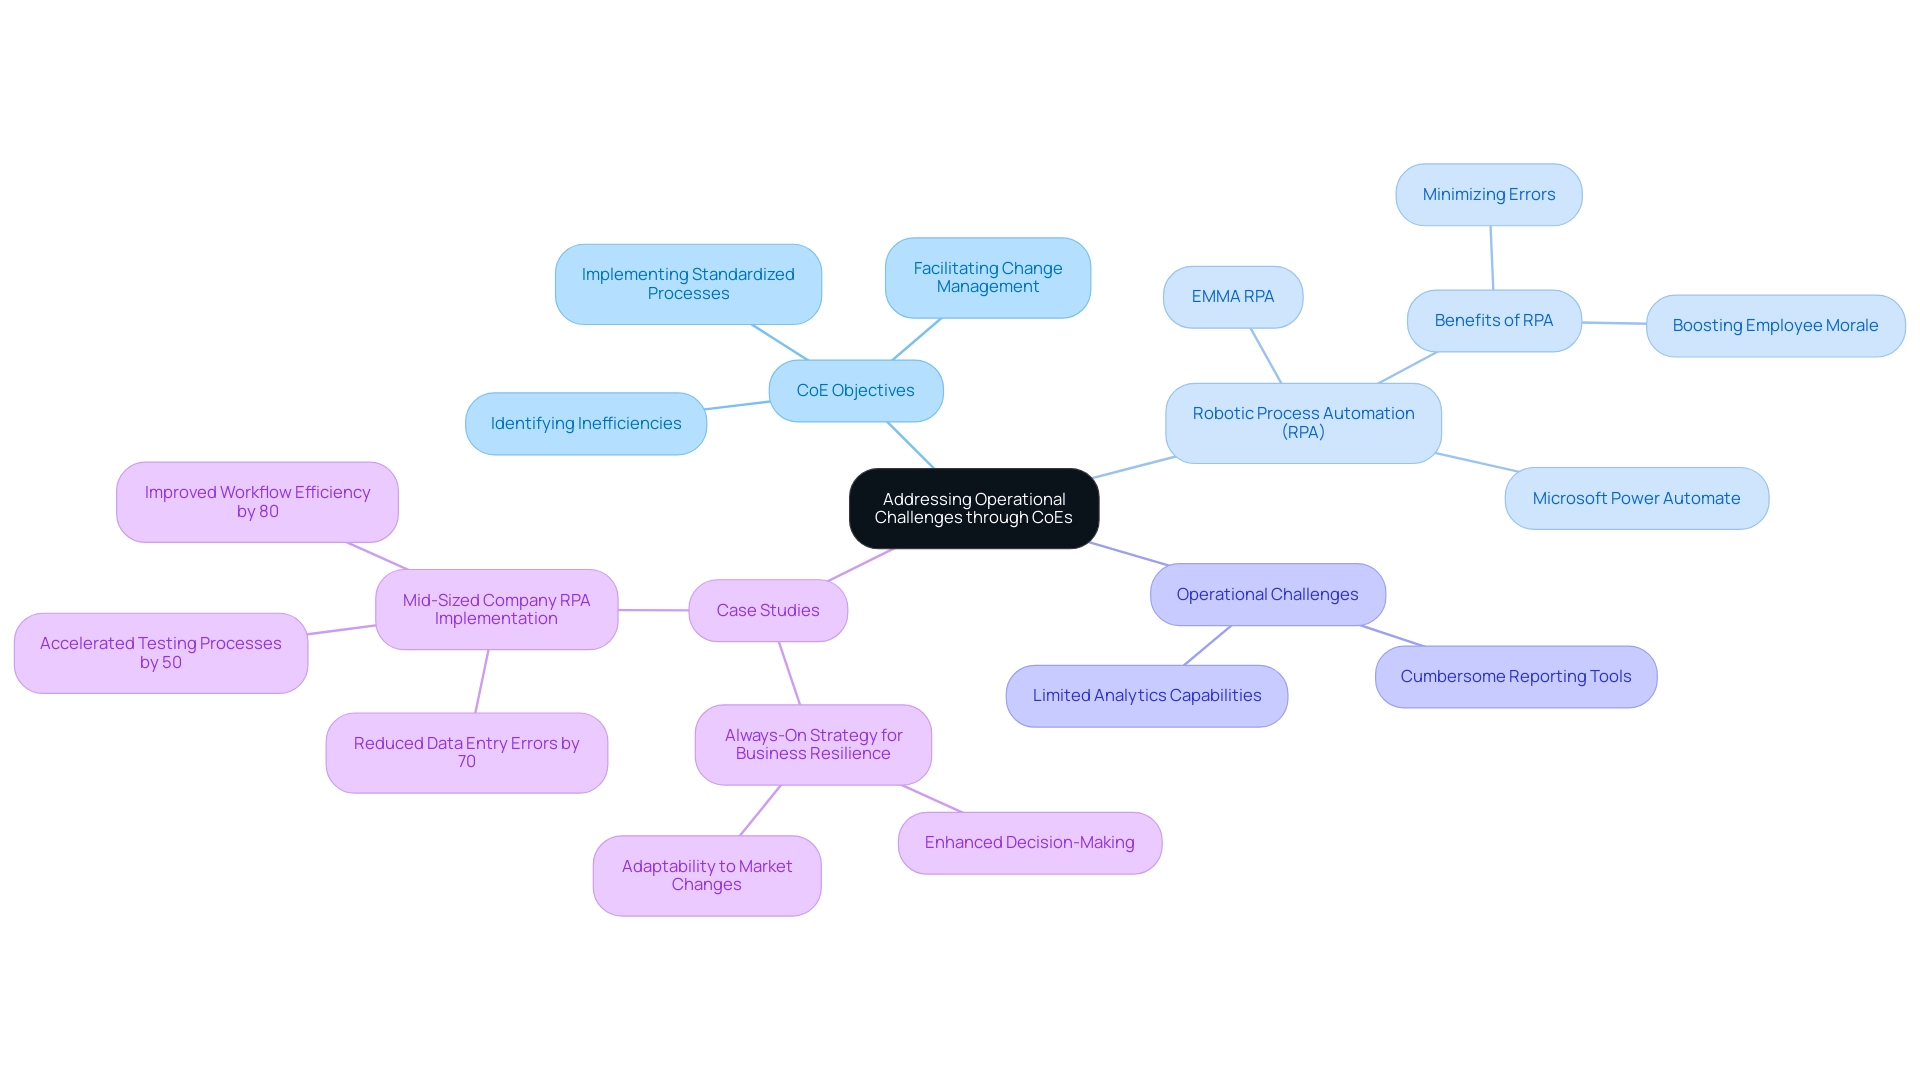
Fostering Collaboration and Change Management in CoE Initiatives
Fostering collaboration and effective change management is essential for determining the objective of the CoE program and ensuring the success of its initiatives. To effectively address employee resistance, Codes should adopt strategies that prioritize open communication and active engagement. This can be achieved through regular meetings, workshops, and feedback sessions, creating opportunities for employees to express their concerns and contribute to the development of new processes.
Moreover, providing comprehensive training and resources is crucial in helping employees adapt to changes, significantly enhancing their willingness to embrace new practices.
A study indicates that only 27% of employees feel their leadership is adequately trained in change management, highlighting a critical area for improvement. By investing in leadership development and communication strategies, companies can better align their teams with change initiatives, ensuring that leaders are equipped to guide their teams effectively.
Incorporating technologies such as Robotic Process Automation (RPA) can further enhance operational efficiency by automating manual workflows, allowing teams to focus on more strategic tasks. The rapidly evolving AI landscape presents opportunities for tailored AI solutions that can address specific business challenges, ultimately driving productivity and informed decision-making. Additionally, leveraging Business Intelligence can transform raw data into actionable insights, enabling entities to make data-driven decisions that support their growth objectives.
Creating a culture of collaboration and support not only facilitates the successful implementation of initiatives but also ensures their sustainability over time. For instance, a case study on leading organizational change emphasizes the importance of effective communication and alignment between team and business goals, suggesting that tailored solutions in organizational development can lead to meaningful impacts. This corresponds with the need for centers of excellence to implement strategies designed to address their unique challenges, which raises the question of the objective of the CoE program.
In 2025, as organizations navigate the complexities of change management within center of excellence programs, understanding the objective of the CoE program is vital for leveraging data on communication effectiveness and employee engagement strategies. Statistics reveal that with open-source communication, 54% of the workforce feels informed about changes, underscoring the need for transparent and inclusive practices. Furthermore, understanding the six key areas of statistics on change initiatives—such as success and failure rates, leadership involvement, employee experience, communication strategies, workforce adaptability, and organizational relevance—can provide valuable insights into the challenges faced in change management.
By fostering collaboration and prioritizing effective change management, centers of excellence can drive innovation and operational efficiency, raising the question of the objective of the CoE program.
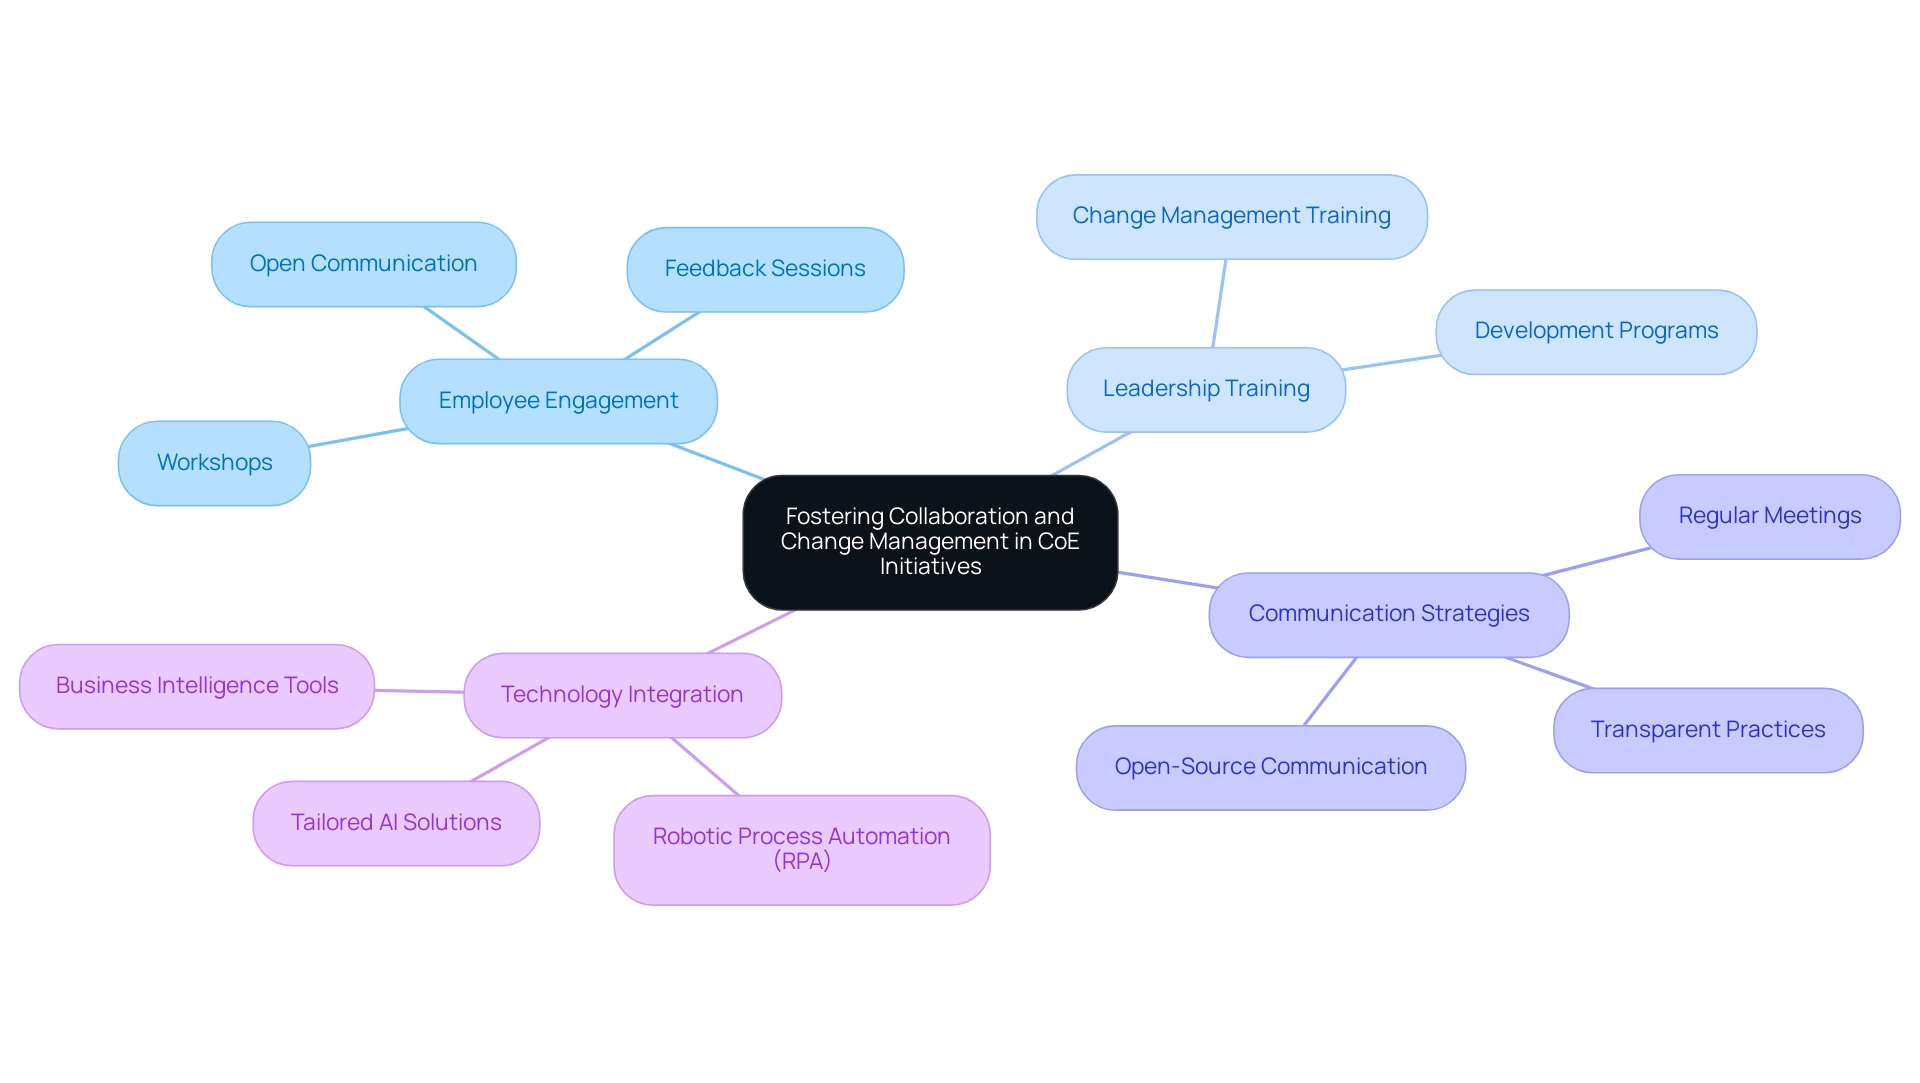
Leveraging Technology: RPA and AI in CoE Programs
Technology is integral to the success of Center of Excellence (CoE) programs, particularly through the strategic integration of robotic process automation (RPA) and artificial intelligence (AI). By implementing RPA solutions such as EMMA RPA and Microsoft Power Automate, centers of excellence can automate repetitive tasks, leading to substantial gains in efficiency and employee morale. This automation not only minimizes the risk of human error but also liberates valuable resources, enabling teams to concentrate on higher-value activities.
AI complements RPA by enhancing decision-making processes through data-driven insights. For instance, a CoE focused on data analytics can leverage AI algorithms, including tailored Small Language Models, to analyze extensive datasets, identifying trends and patterns that inform critical business strategies. This capability is increasingly vital; forecasts indicate that by 2030, RPA augmented with AI will become a standard tool in large enterprises, emphasizing the necessity for CoEs to adapt and integrate these technologies into their frameworks.
The finance and banking sectors exemplify the successful adoption of RPA, with 65% of finance firms planning to increase their automation investments. These organizations report significant time savings, improved productivity, and cost reductions, demonstrating the effectiveness of RPA in refining workflow processes. A recent case study highlighted how a leading bank implemented RPA to streamline transaction processing, resulting in a 30% reduction in processing time and a notable decrease in operational costs.
As CoEs embrace these technologies, they not only streamline operations but also foster a culture of innovation and continuous improvement, positioning themselves as leaders in their respective fields. As Tajammul Pangarkar, CMO at Prudour Pvt Ltd, observes, “The integration of automation technologies is not merely about efficiency; it’s about changing the way entities function and make decisions.
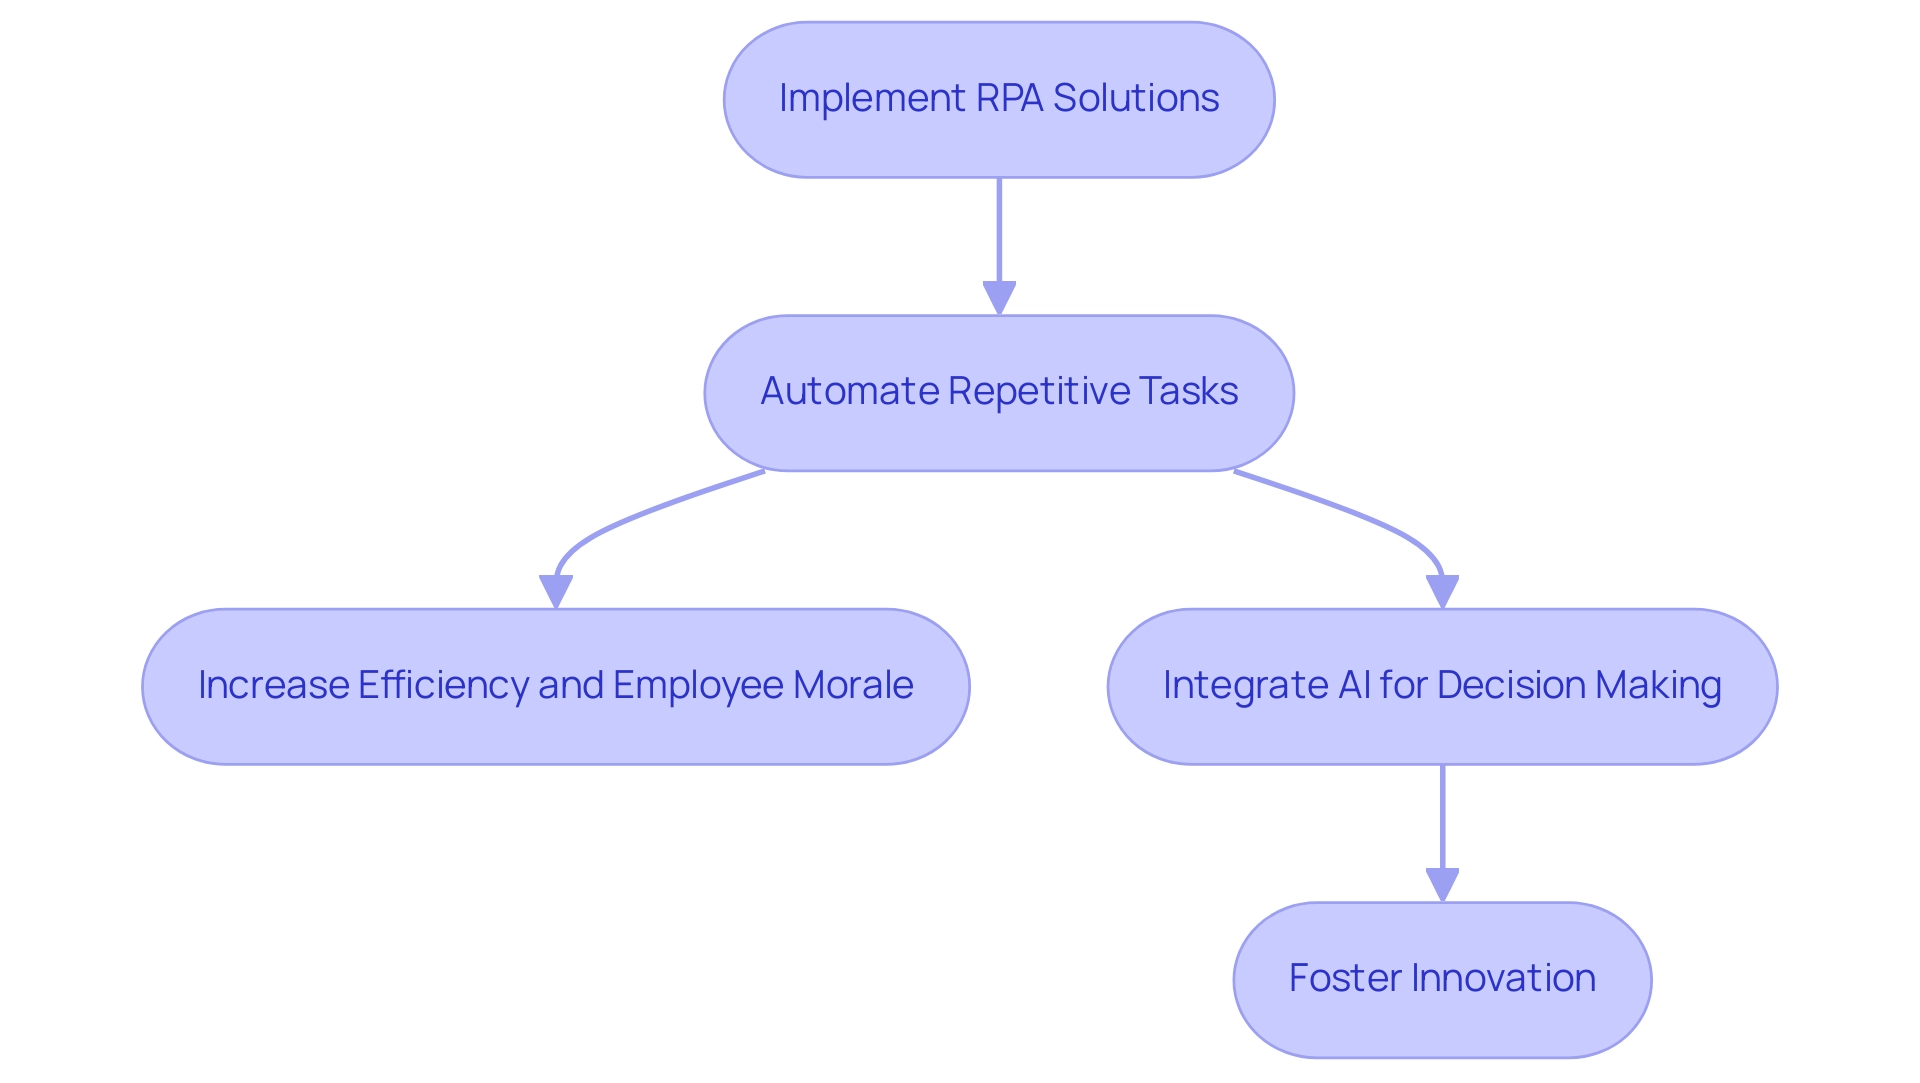
Data-Driven Insights: The Role of Business Intelligence in CoEs
Business intelligence (BI) is a cornerstone of the Center of Excellence (CoE) framework, compelling us to examine the objective of the CoE program in empowering organizations to make strategic decisions based on data-driven insights. By establishing robust BI practices, organizations can transform raw data into actionable information, enabling stakeholders to discern trends, assess performance, and evaluate the success of various initiatives. The implementation of advanced BI tools, such as Power BI, along with interactive dashboards, provides real-time visibility into critical metrics, fostering proactive decision-making.
In 2025, organizations that prioritize data-driven decision-making are projected to significantly outperform their competitors. A systematic literature review of 111 peer-reviewed studies from 2000 to 2019 reveals that best-in-class companies leverage data analytics and collaborative approaches to gain a competitive edge. This data-focused strategy not only enhances operational efficiency but also equips organizations to swiftly adapt to changing market dynamics and customer demands.
For instance, effective data analysis and reporting practices, including the 3-Day Power BI Sprint for rapid report creation, enable companies to visualize data trends and patterns, essential for driving business growth. Additionally, the General Management App facilitates comprehensive management and smart reviews, addressing data inconsistency and governance challenges in business reporting, thereby enhancing decision-making.
A notable case study on data analysis and reporting illustrates how SQL query optimization can significantly improve the performance of data analysis processes, leading to enhanced insights and decision-making capabilities. This optimization allows organizations to process data more efficiently, ultimately resulting in quicker and more precise decision-making.
Expert insights emphasize the objective of the CoE program in centers of excellence, highlighting the significance of BI. Data analytics professionals stress that converting raw data into valuable insights is crucial for informed decision-making. As noted by a trusted industry leader in remote DBA services, “With over 500 clients and a track record of delivering transaction speeds that are at least twice as fast as before, we guarantee a significant increase in performance.” By harnessing the power of BI, organizations can not only enhance performance but also cultivate a culture of continuous improvement and innovation.
Moreover, the utilization of generative AI technologies and Robotic Process Automation (RPA) can streamline workflows, enhance efficiency, and ultimately drive data-driven insights for business growth.
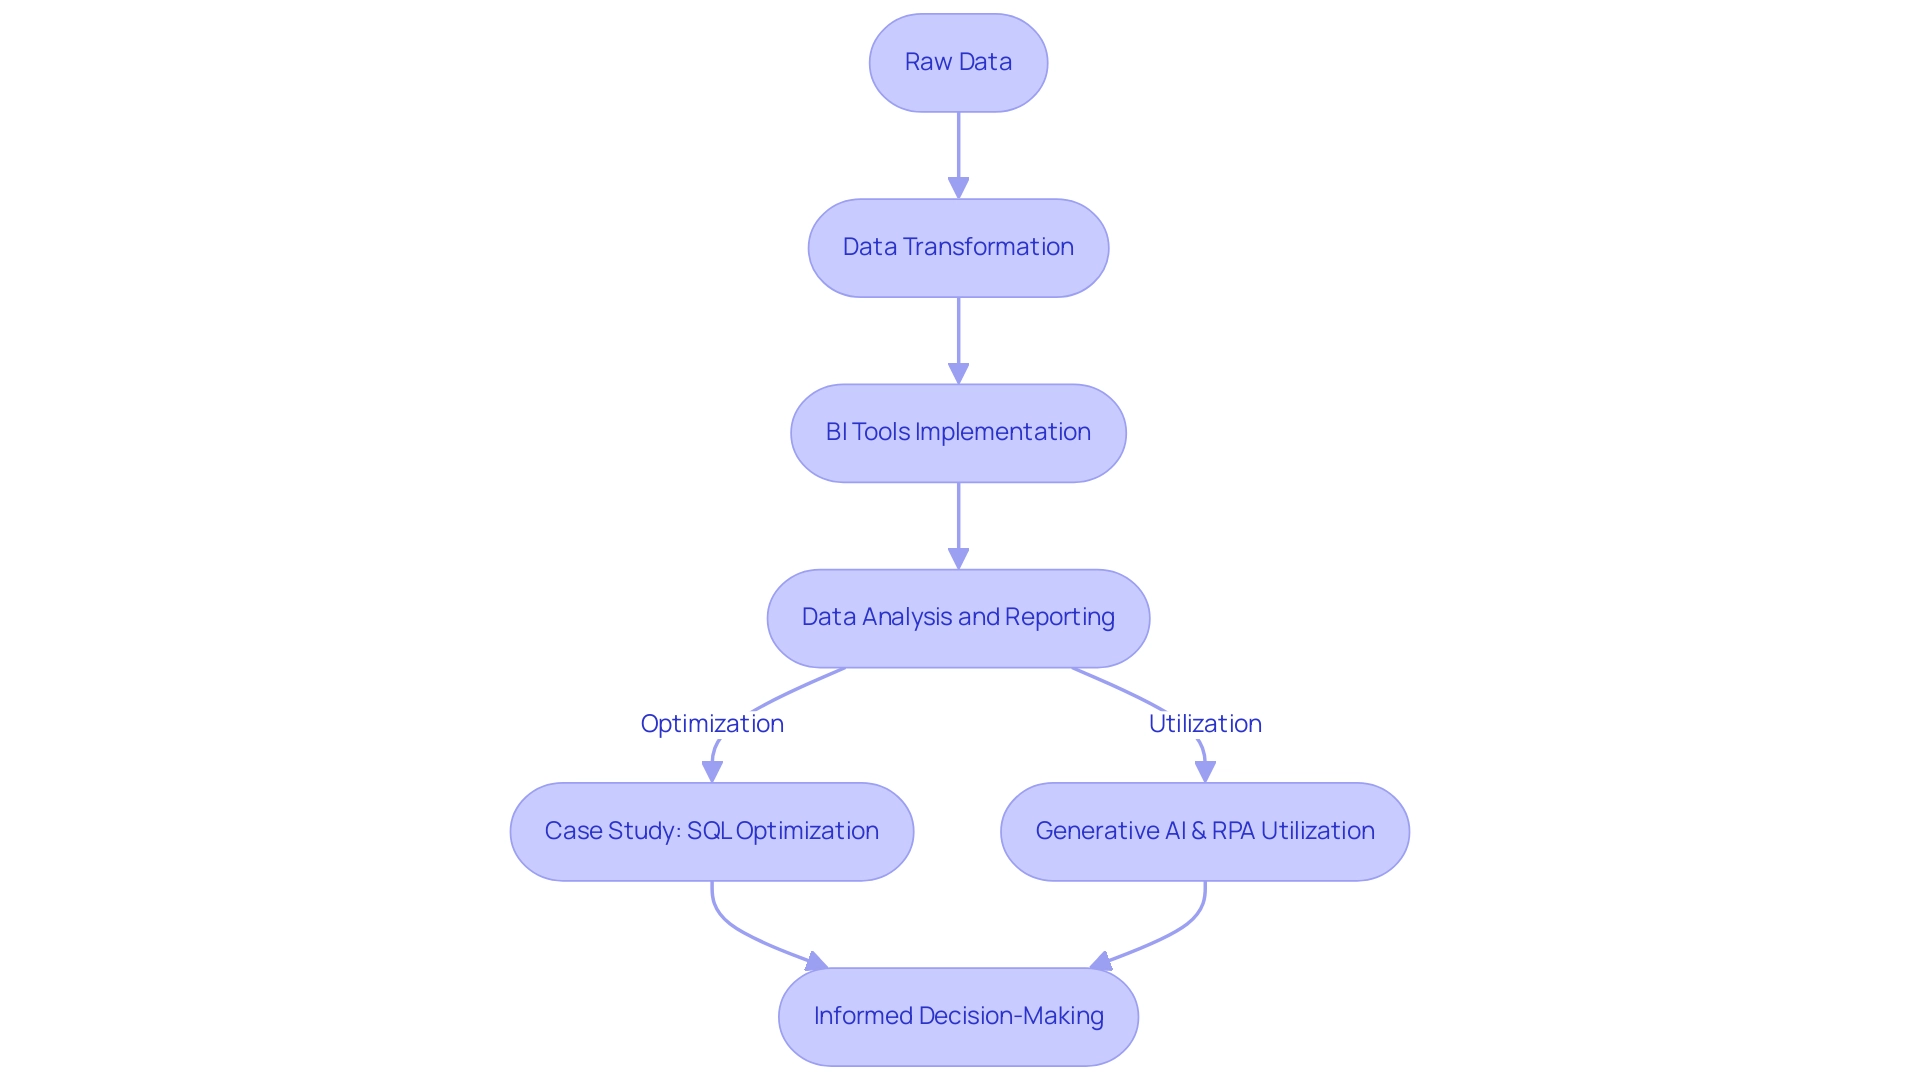
Unique Value Propositions of CoE Programs
Focusing on unique value propositions, Centers of Excellence (CoE) programs distinguish themselves from conventional models by emphasizing the objectives of the CoE program through their customized approach to solution personalization. A key advantage lies in their capacity to align solutions with specific business objectives, prompting inquiries into the goals of the CoE program. This alignment enhances data quality and streamlines AI implementation, driving substantial improvements in performance while cultivating a culture of innovation within organizations.
By promoting experimentation and the adoption of best practices, Centers of Excellence empower teams to adapt swiftly to market dynamics and harness emerging technologies, such as generative AI and Power BI.
Statistics reveal that 37% of customers prefer personalized suggestions based on their interests, underscoring the importance of customization in enhancing customer engagement and loyalty. Furthermore, case studies illustrate that brands implementing effective personalization strategies are more likely to retain customers, as understanding their needs is vital for fostering loyalty. As Esat Artug notes, “On getting personalization right, 56% of customers say they’ll remain loyal to brands who understand them.”
In this context, CoEs play a pivotal role in customizing solutions that not only meet functional goals but also resonate with customer expectations. This alignment ultimately drives performance and satisfaction, raising the question of what the objectives of the CoE program truly are.
Moreover, the transformative impact of Creatum GmbH’s Power BI Sprint is highlighted in client testimonials, showcasing how these solutions enhance business intelligence development and operational efficiency. The 3-Day Power BI Sprint enables entities to quickly produce professionally designed reports, ensuring efficient reporting and data consistency. Training and certification for advanced techniques in canvas apps and Power Platform development further enhance the capabilities of Centers of Excellence, equipping teams with the skills necessary to implement these customized solutions effectively.
By utilizing generative AI technologies and optimized workflow automation, Centers of Excellence can significantly enhance operational efficiency and productivity, preparing entities for sustained growth in an increasingly complex business landscape.
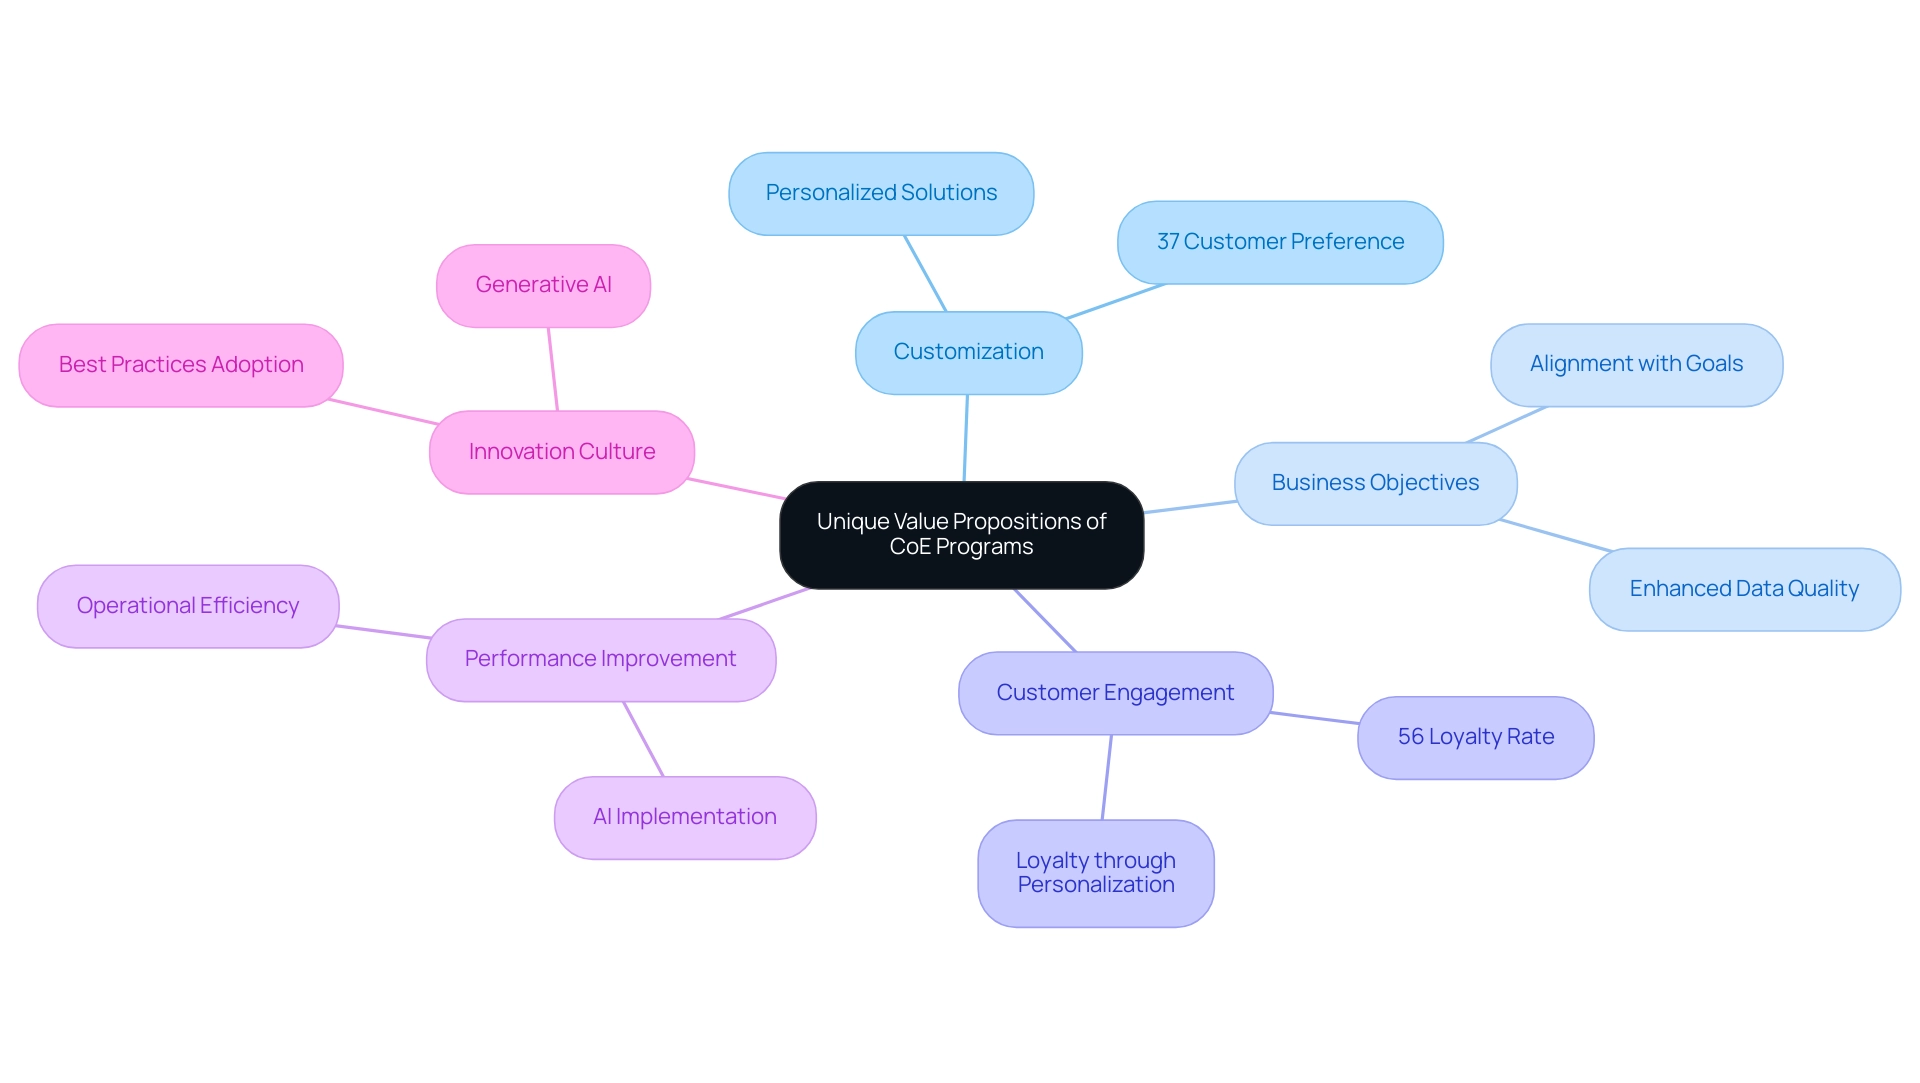
Impact of CoE Programs on Growth and Innovation
The influence of Centers of Excellence on organizational growth and innovation is substantial. By optimizing processes, enhancing collaboration, and harnessing advanced technologies like generative AI and Robotic Process Automation (RPA), centers of excellence enable entities to operate with greater efficiency and effectiveness. This quest for excellence in operations not only leads to enhanced customer experiences but also strengthens market competitiveness, paving the way for sustainable growth.
Moreover, Codes cultivate a culture of innovation, motivating teams to experiment with new ideas and technologies. This is essential for organizations to remain agile and responsive to evolving market conditions.
As highlighted in recent case studies, such as those involving machine monitoring and marketing, companies that effectively leverage generative AI technologies can achieve a competitive advantage. By understanding their core competencies and applying these insights to their business processes, they position themselves for success. For instance, the integration of Multi-Agent AI systems and graphical neural networks has revolutionized operations in these sectors, demonstrating the practical applications of these technologies.
Client testimonials further emphasize the impact of Creatum GmbH’s technology solutions, particularly in enhancing efficiency and driving business growth. Herr Malte-Nils Hunold from NSB GROUP noted, “Creatum’s solutions have transformed our operational processes, leading to significant efficiency gains.” The transformative effects of Creatum’s Power BI Sprint service have been noted in accelerating data analysis and reporting success, enabling informed decision-making that drives innovation.
Additionally, the importance of Business Intelligence and RPA in driving data-driven insights cannot be overstated. By automating manual workflows, companies can enhance productivity and focus on strategic initiatives that add value. Investing in CoE programs is therefore not merely a tactical choice; it is crucial to understand the objectives of the CoE program for achieving long-term success in today’s rapidly changing business landscape.
As organizations prioritize these initiatives, they position themselves to thrive in a competitive marketplace. High scores in customer satisfaction KPIs, such as Net Promoter Score (NPS), reflect the effectiveness of Codes in meeting stakeholder needs and enhancing overall customer experience.
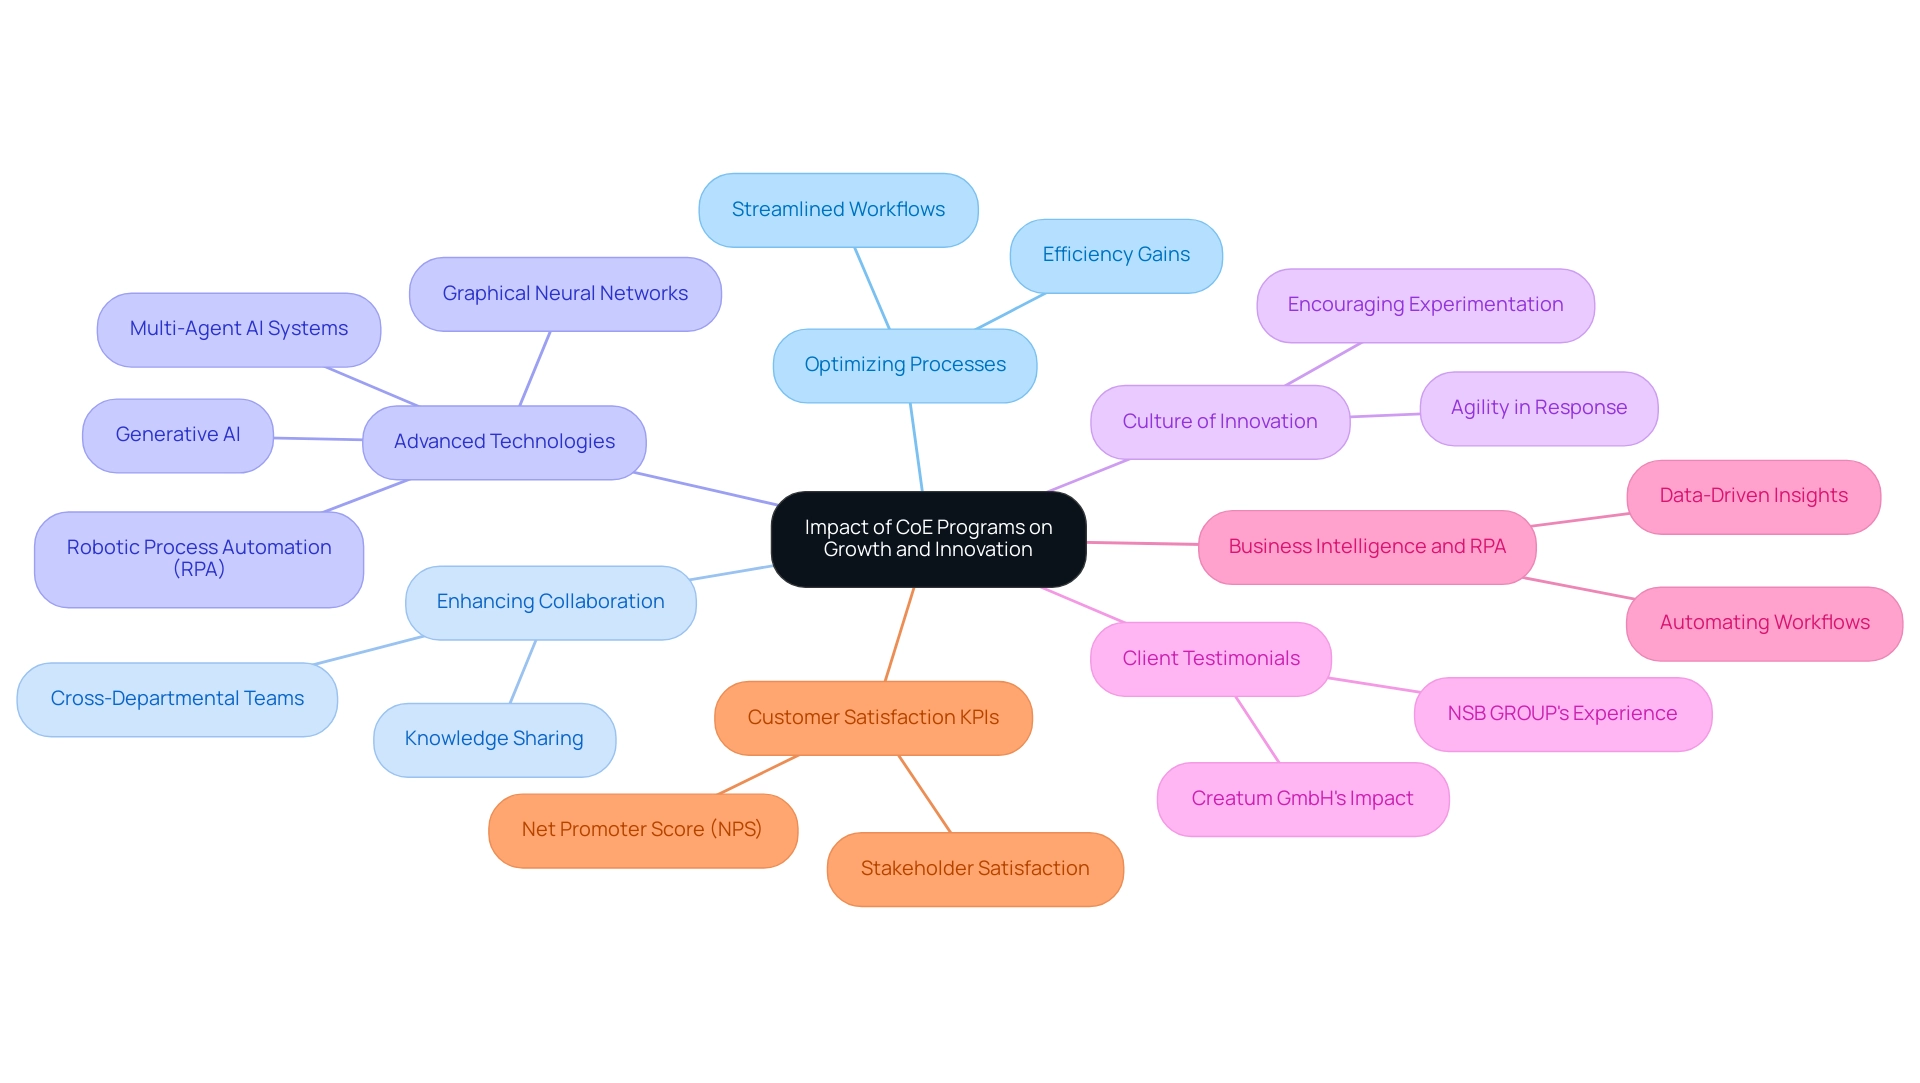
Conclusion
The transformative power of Centers of Excellence (CoEs) in today’s business landscape is undeniable. By centralizing expertise, fostering collaboration, and implementing advanced technologies such as Robotic Process Automation (RPA) and artificial intelligence (AI), CoEs enable organizations to drive operational efficiency and cultivate a culture of innovation. This strategic alignment not only enhances productivity but also positions organizations to swiftly adapt to changing market dynamics, ensuring sustainable growth.
Through the establishment of clear core objectives, CoEs effectively tackle operational challenges and streamline processes. They facilitate knowledge sharing, enhance data governance, and promote best practices—essential elements for organizations striving for continuous improvement. Successful case studies illustrate that organizations leveraging CoEs can significantly reduce inefficiencies and improve decision-making capabilities.
Moreover, by prioritizing effective change management and fostering a collaborative environment, CoEs empower teams to embrace new technologies and methodologies. This adaptability is crucial as businesses navigate uncertainties in an ever-evolving landscape. As organizations increasingly recognize the unique value propositions offered by CoE programs, they position themselves to outperform competitors and achieve deeper customer engagement.
Investing in CoEs transcends mere tactical decision-making; it is a strategic imperative that drives long-term success. As organizations harness the full potential of CoEs, they not only enhance operational capabilities but also pave the way for innovation and excellence in customer experiences. In conclusion, the role of CoEs in shaping the future of business is clear: they are essential for organizations aiming to thrive in a complex and competitive environment.
Frequently Asked Questions
What is a Center of Excellence (CoE)?
A Center of Excellence (CoE) is a dedicated team or entity within a company that focuses on a specific area of expertise, providing leadership, establishing best practices, conducting research, and offering support and training.
What is the main objective of the CoE program?
The main objective of the CoE program is to elevate performance and stimulate innovation by centralizing knowledge and resources, enabling organizations to leverage expertise effectively, resulting in enhanced processes, cost savings, and a culture of continuous improvement.
How do CoEs align strategic goals with functional capabilities?
CoEs play a vital role in aligning strategic goals with functional capabilities, enhancing efficiency and effectiveness across various functions within an organization.
What challenges do healthcare providers face when establishing CoEs?
Healthcare providers often face challenges in establishing CoEs, frequently resorting to a trial-and-error approach due to limited guidance, which can hinder the achievement of high-quality care.
Why is a comprehensive understanding of CoE operations important?
A comprehensive understanding of CoE operations is essential for organizations to replicate successful processes and achieve high-quality care, as highlighted by the experiences of organizations like the Willis-Knighton Health System.
What financial considerations are associated with establishing CoEs?
Establishing CoEs requires substantial financial resources, but this investment is justified by the excellence and improvements they foster within the organization.
How do CoEs enhance the depth and breadth of services in communities?
CoEs significantly enhance the depth and breadth of services available in communities by improving operational efficiency and streamlining workflows, ultimately transforming the quality of services provided.
What role do CoEs play in fostering innovation and collaboration?
CoEs serve as incubators for new ideas and technologies, facilitating knowledge sharing and collaboration among teams, which boosts efficiency and aligns strategic goals.
What impact do CoEs have on data governance?
Entities with a CoE are more likely to establish robust data governance frameworks, with studies showing that 80% of such entities have implemented effective governance strategies.
Can you provide an example of a successful CoE initiative?
Harvard University improved faculty and student engagement and enhanced administrative efficiency by integrating a comprehensive learning management system, showcasing the tangible benefits of CoE initiatives.
How do Robotic Process Automation (RPA) solutions contribute to CoE objectives?
RPA solutions like EMMA RPA and Microsoft Power Automate enhance productivity and employee morale by automating manual workflows, reducing errors, and improving overall efficiency.
What are some measurable outcomes of implementing CoEs?
A case study showed that GUI automation led to a 70% reduction in data entry errors and an 80% improvement in workflow efficiency, demonstrating the transformative impact of CoEs on business productivity.
Overview
The three primary categories of analytics techniques—descriptive analytics, diagnostic analytics, and predictive analytics—are designed to extract significant value from data, each serving distinct purposes in the realm of data analysis. This article explores how these techniques are applied across various sectors, providing insights into past performance, uncovering the reasons behind outcomes, and forecasting future trends. Such applications not only enhance decision-making but also improve operational efficiency. By understanding these analytics types, professionals can better navigate their data landscapes and leverage insights for strategic advantage.
Introduction
In an age where data reigns supreme, organizations are increasingly turning to analytics as a vital tool for enhancing decision-making and operational efficiency. Analytics provides a treasure trove of information—from descriptive insights that reveal historical trends to predictive models that forecast future outcomes—driving strategic growth. Yet, the journey to effective data utilization is fraught with challenges, including data quality issues and resistance to change within teams.
This article explores the various types of analytics—descriptive, diagnostic, predictive, and prescriptive—illustrating how tailored solutions can empower businesses to overcome obstacles and unlock the full potential of their data. By examining real-world applications and expert insights, it becomes evident that embracing a structured approach to analytics is not merely advantageous; it is essential for sustained success in today’s competitive environment.
Understanding Analytics: The Key to Data-Driven Decision Making
Analytics encompasses the systematic computational examination of information and statistics, serving as a fundamental pillar in today’s corporate landscape. It empowers organizations to make informed, data-driven decisions that significantly enhance operational efficiency and strategic planning. By thoroughly analyzing both historical and contemporary data, companies can identify patterns, trends, and insights essential for developing effective strategies.
The significance of data analysis is underscored by recent findings, indicating that 91% of businesses recognize data-driven decision-making as crucial to their success, according to a recent survey. However, only 57% of these organizations actually base their decisions on data, revealing a critical gap in implementation. This discrepancy emphasizes the necessity for a structured approach to analytics, as illustrated in the case study titled “Streamlining Operations with GUI Automation.” Here, a mid-sized company faced challenges such as manual data entry errors, slow software testing, and difficulty integrating outdated systems without APIs.
The implementation of GUI automation resulted in a 70% reduction in data entry errors, a 50% acceleration in testing processes, and an 80% improvement in workflow efficiency, showcasing the transformative impact of automation on operational efficiency. Notably, the company achieved a return on investment (ROI) within six months of implementing the solution.
Moreover, organizations that have initiated projects aimed at reducing expenses have reported substantial value, with over 49% experiencing positive outcomes from these initiatives. This statistic illustrates the tangible advantages of incorporating data analysis into operational frameworks. As companies navigate the complexities of the data environment in 2025, effective execution of data analysis not only enhances operational efficiency but also fosters a culture of informed decision-making.
Expert opinions further reinforce the importance of data analysis, with industry leaders advocating for its role in enhancing operational efficiency. For instance, Atlan reported that more than half of companies are increasing their budgets in 2023, in contrast to only 8% indicating budget reductions, signifying a growing awareness of the importance of data analysis. Additionally, testimonials from clients, such as Sascha Rudloff from PALFINGER Tail Lifts GMBH, highlight how Creatum’s Power BI Sprint has significantly improved their analysis capabilities, further emphasizing the significance of business intelligence in fostering informed decision-making.
By leveraging analysis, organizations can transform raw data into actionable insights, ultimately leading to enhanced performance and strategic development. In this data-rich era, the ability to effectively utilize data insights is not merely an advantage; it is essential for sustained success.
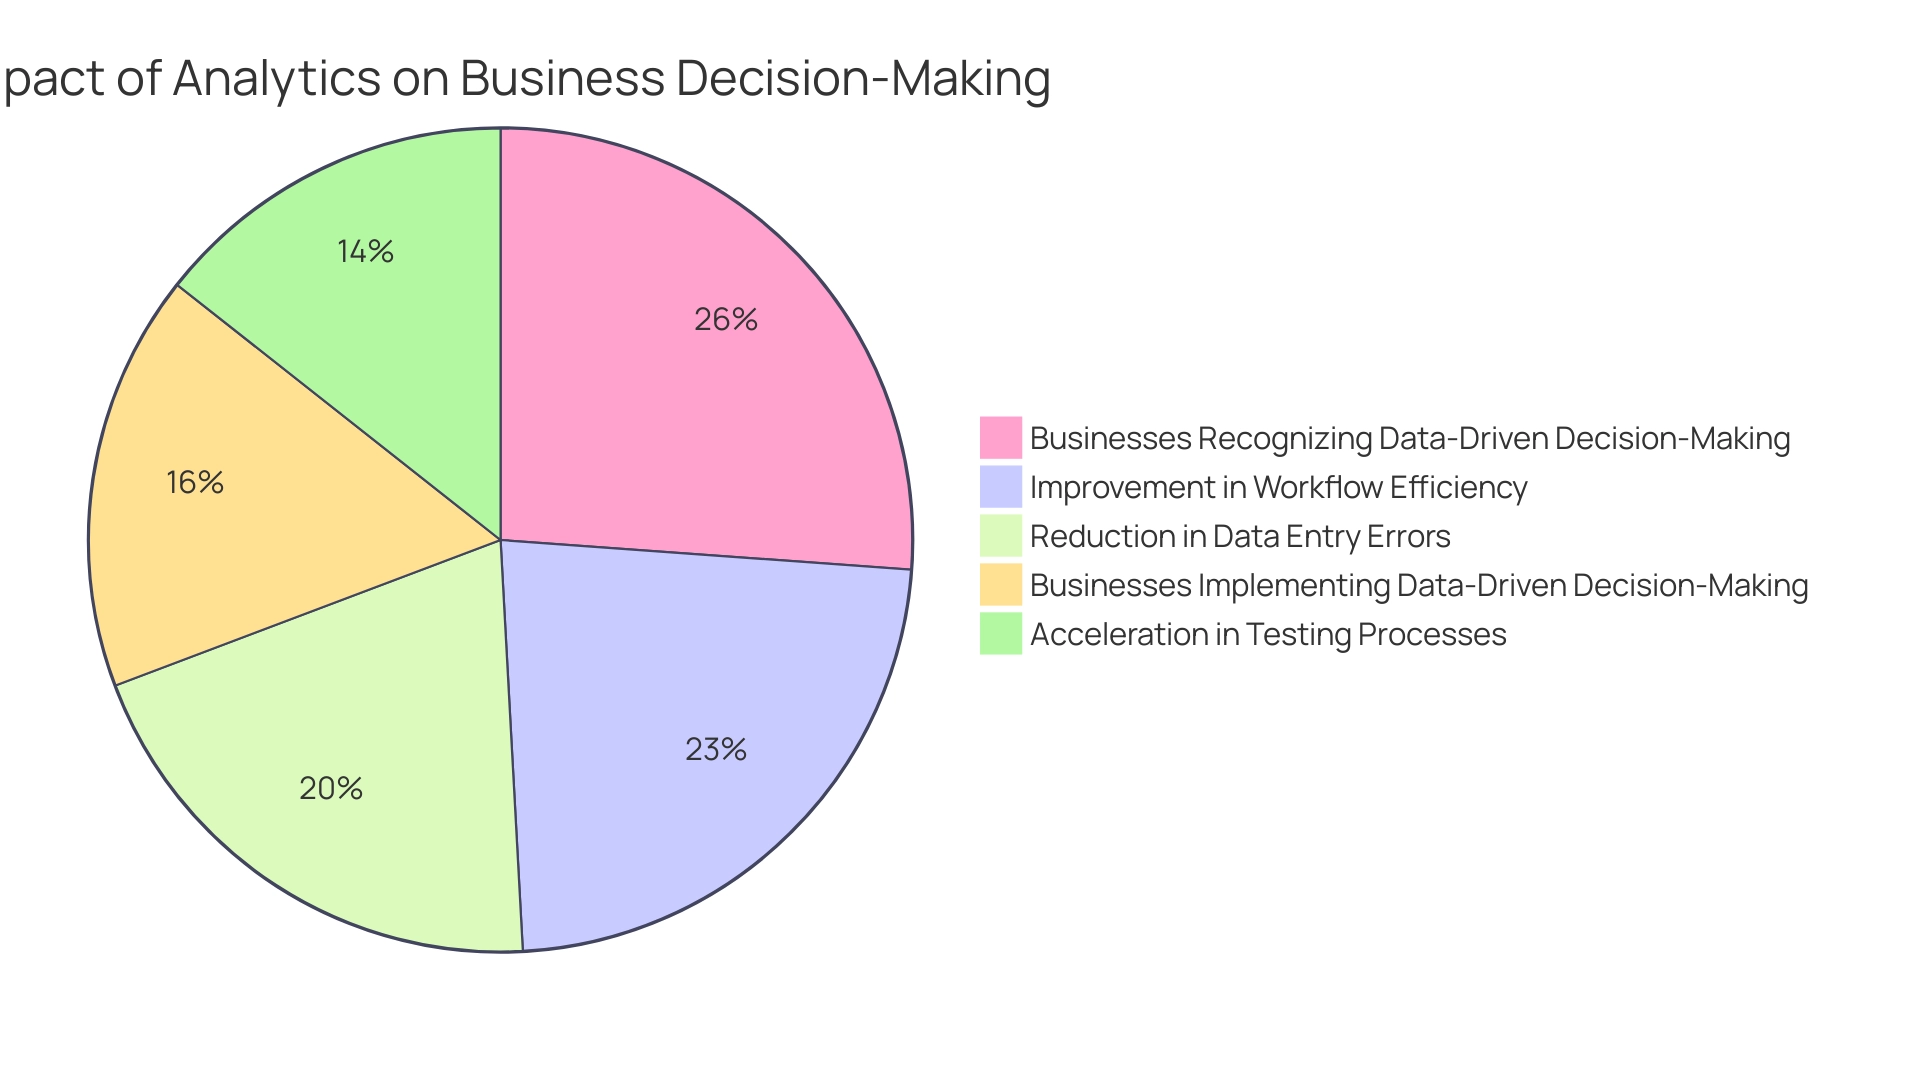
Descriptive Analytics: Summarizing Historical Data for Insights
Descriptive analysis is pivotal in understanding the three broad categories of analytics techniques that transform raw data into meaningful insights through aggregation and mining techniques, thereby illuminating past performance. This analytical approach addresses the essential question: what are the three broad categories of analytics techniques designed to extract value from data? It summarizes historical information using key metrics such as averages, totals, and percentages.
For instance, a retail firm may leverage descriptive analysis to scrutinize sales data from the previous year, revealing patterns in customer buying behavior that can inform future strategies.
In 2023, the retail sector increasingly recognized the significance of descriptive analytics, with 56% of analytics leaders reporting budget increases, while 36% noted their budgets remained unchanged. This trend underscores a robust commitment to data-driven decision-making. As Atlan observes, “Over half are increasing budgets in 2023 compared to just 8% who report decreasing their budgets.”
This trend is particularly noteworthy as the number of connected IoT devices surged to 16 billion, projected to reach 20.3 billion by 2025, generating a staggering 79.4 zettabytes of data. Such immense volumes of information, characterized by high velocity and wide variation, present both opportunities and challenges for organizations.
When contemplating the three broad categories of analytics techniques aimed at extracting value from data, descriptive analytics methods such as visualization and reporting are crucial for effectively summarizing historical data. Retailers can employ these techniques to assess average metrics like sales per customer or inventory turnover rates, offering a clearer view of operational performance. Additionally, by utilizing Business Intelligence tools like Power BI from Creatum GmbH, organizations can enhance their data reporting capabilities, ensuring data consistency and actionable insights.
The 3-Day Power BI Sprint enables organizations to swiftly develop professionally designed reports, while the General Management App supports comprehensive management and insightful reviews. As companies continue to harness the power of descriptive analysis and BI, they can gain a deeper understanding of their historical performance, empowering them to make informed decisions that drive growth and enhance operational efficiency.
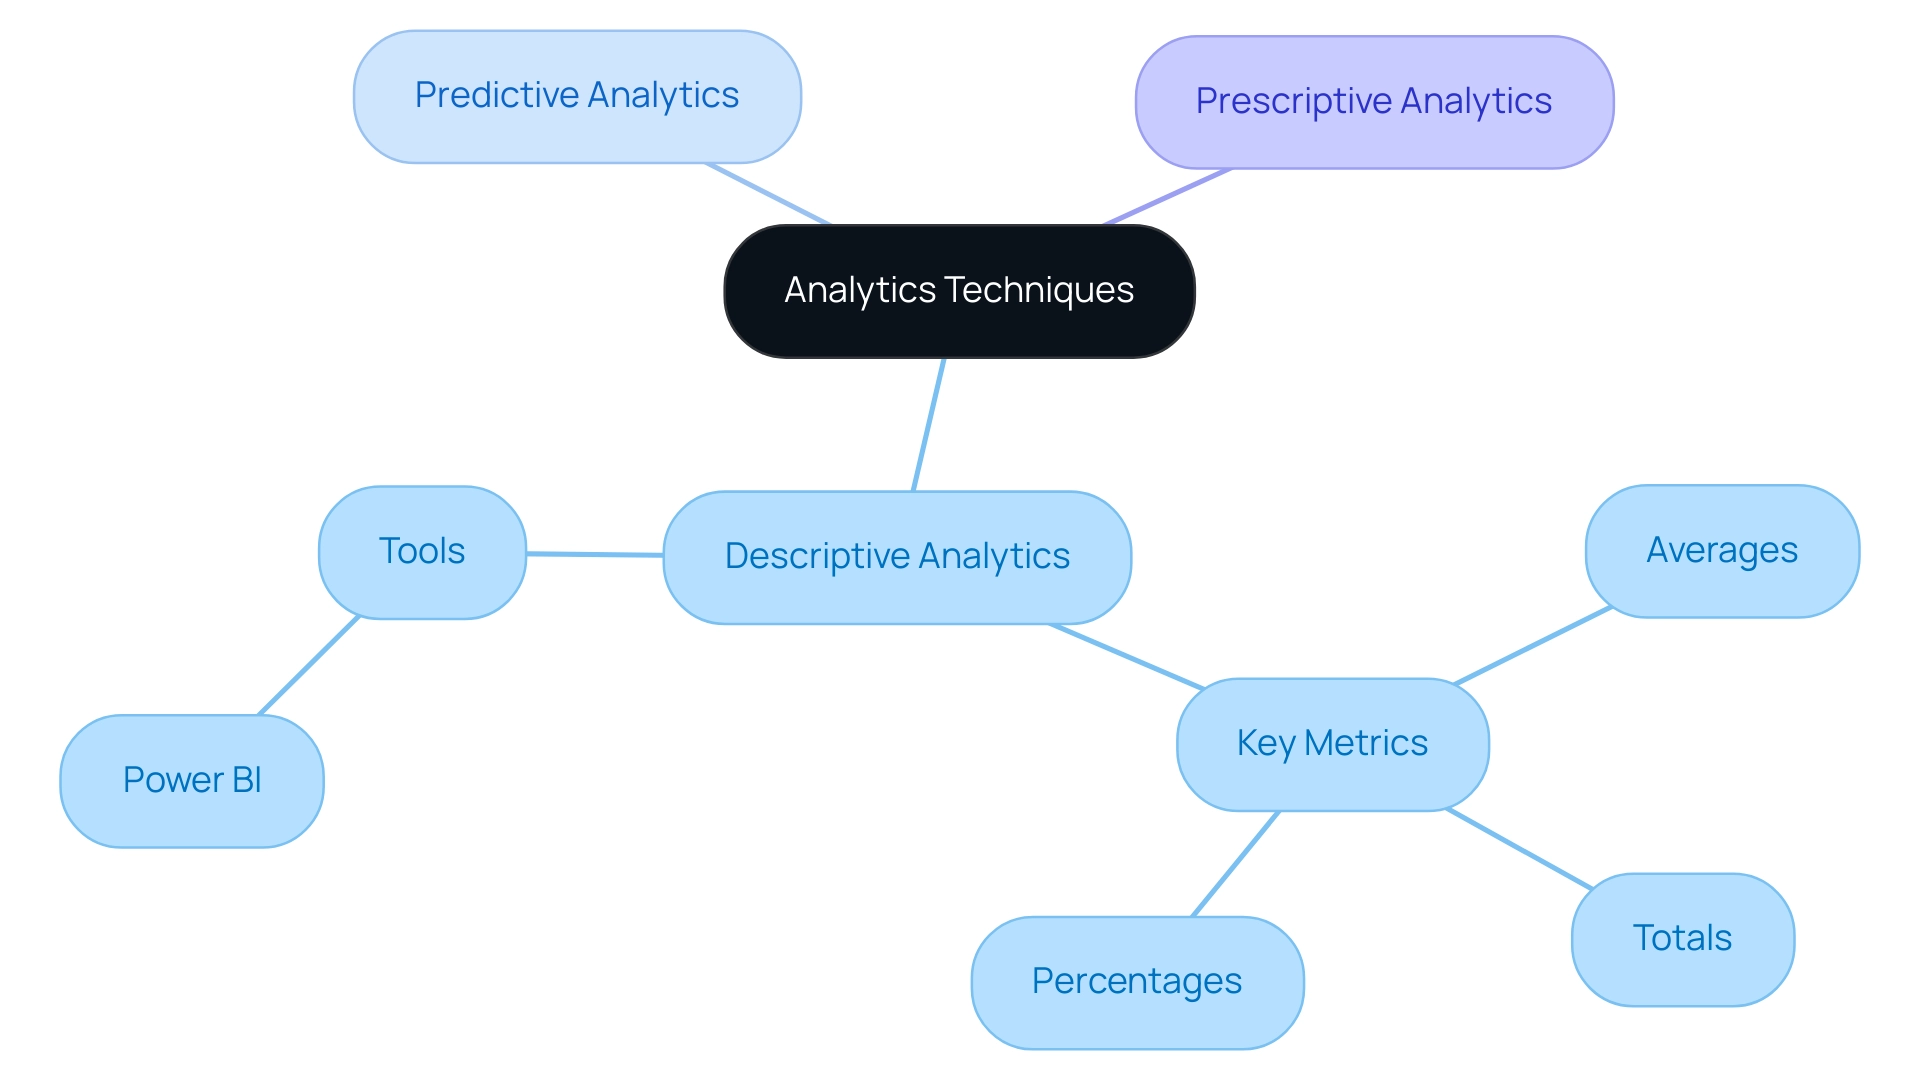
Diagnostic Analytics: Uncovering the Reasons Behind Outcomes
Diagnostic examination transcends superficial information assessment to confront the critical question, ‘Why did it occur?’ This analytical approach employs various techniques to uncover relationships and causations within datasets, addressing the three broad categories of analytics techniques designed to extract value from data. For instance, when a company faces a sales decline, diagnostic analysis proves instrumental in examining customer feedback and sales trends.
This process can reveal underlying issues such as product quality concerns or deficiencies in customer service.
The effectiveness of diagnostic analysis is underscored by its potential to enhance revenue by up to 20% in marketing and sales processes. Companies like Canadian Tire have adeptly utilized ThoughtSpot AI-Powered Analytics to identify cross-selling opportunities, resulting in a remarkable 20% increase in sales. Similarly, HelloFresh leverages diagnostic analytics to gain insights into customer behavior, focusing particularly on understanding the reasons behind subscription cancellations, ultimately enhancing user experience.
In this rapidly evolving AI landscape, harnessing Robotic Process Automation (RPA) can further bolster operational efficiency by automating manual workflows, allowing teams to concentrate on strategic, value-adding tasks.
Creatum GmbH’s tailored AI solutions cut through the noise, delivering targeted technologies that align with specific organizational goals and challenges.
A compelling case study is Amplitude Analytics, which functions as a diagnostic tool offering Root Cause Analysis (RCA) capabilities. By utilizing Amplitude, organizations can transform information into strategic advantages, facilitating informed decision-making across various sectors. This highlights the significance of diagnostic analysis in uncovering organizational challenges and fostering enhancements.
Moreover, the value of Business Intelligence is amplified through Creatum GmbH’s Power BI offerings, which enhance reporting and provide actionable insights. The 3-Day Power BI Sprint enables the rapid creation of professionally designed reports, while the General Management App offers comprehensive management and smart reviews, addressing data inconsistency and governance challenges in reporting for improved decision-making.
Industry experts assert that diagnostic analysis is crucial for retail leaders, as it allows them to comprehend customer behaviors, including purchasing trends and the factors influencing buying decisions. By effectively employing diagnostic analysis alongside RPA and Power BI, companies can explore the three broad categories of analytics techniques designed to extract value from data, identify common causes of sales decline, and implement targeted strategies to enhance customer service and overall operational efficiency. Client testimonials further underscore the transformative impact of Creatum’s technology solutions in driving business growth and operational efficiency.
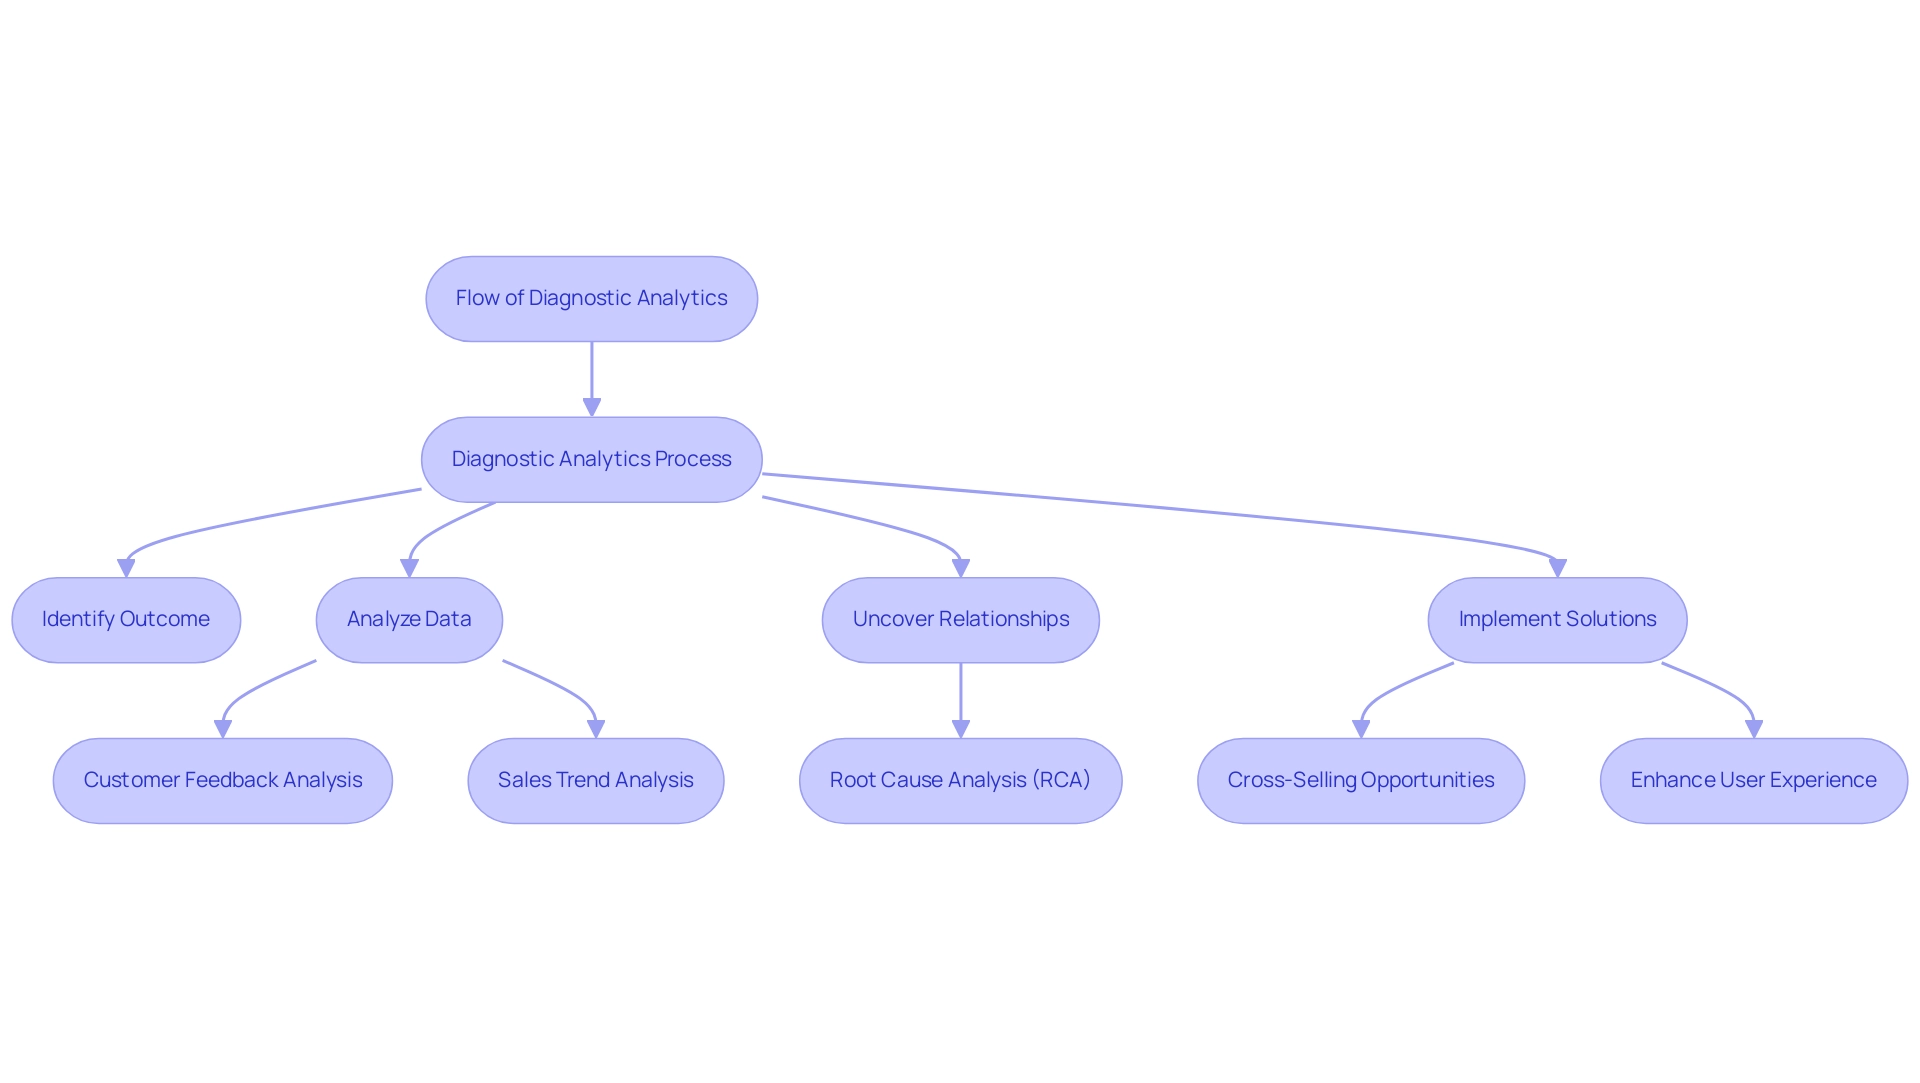
Predictive Analytics: Forecasting Future Trends from Historical Data
Predictive analysis employs statistical algorithms and machine learning techniques to scrutinize historical data, enabling organizations to forecast future outcomes with greater accuracy. This approach addresses the critical question, ‘What is likely to happen?’ For instance, financial institutions utilize predictive analysis to assess the likelihood of loan defaults by examining past borrowing behaviors alongside economic indicators.
This method has demonstrated effectiveness, with studies showing that predictive techniques can enhance forecasting accuracy by up to 20%, significantly improving decision-making processes.
Across industries, the adoption of predictive methods is on the rise, particularly in the healthcare sector. Reports indicate that a significant percentage of healthcare organizations are embracing predictive methods to forecast disease outbreaks and optimize treatment plans. This trend underscores the importance of predictive analysis in identifying high-risk patients and implementing proactive intervention programs, ultimately improving patient outcomes.
A notable example is Massachusetts General Hospital, which successfully utilized predictive methods to enhance patient care through targeted interventions.
In the finance sector, predictive techniques play a pivotal role in risk assessment. Financial analysts emphasize its importance, noting that it allows institutions to anticipate market fluctuations and adjust strategies accordingly. Businesses are increasingly employing predictive models to assess credit risk, enabling informed lending decisions and minimizing potential losses.
As one financial analyst stated, ‘Predictive data analysis is not just a tool; it’s a necessity for navigating today’s volatile market.’ Current trends suggest that by 2025, predictive analysis will continue to evolve, with improvements in information architecture and governance becoming crucial for securely and efficiently handling health information. This change is essential as institutions strive to uphold information quality while ensuring adherence to privacy regulations.
Healthcare organizations are prioritizing strong information structures to enhance their predictive capabilities, reflecting a broader trend among industry players launching new products and improving their portfolios to strengthen market position.
Case studies further illustrate the transformative impact of predictive analysis. Planet Fitness, for example, collaborated with Coherent Solutions to improve customer insights through advanced information analysis, leading to a thorough understanding of member behaviors. This initiative not only enhanced customer satisfaction but also nurtured long-term loyalty by facilitating personalized services tailored to individual preferences.
As predictive data analysis continues to gain traction, its applications across various sectors will broaden, driving innovation and improving operational efficiency. Furthermore, integrating tools like the General Management App, featuring Microsoft Copilot for smart reviews and custom dashboards, can significantly streamline reporting and enhance decision-making processes. By utilizing AI solutions, including Small Language Models and GenAI Workshops, organizations can improve information quality and tackle governance challenges, ensuring that predictive analysis remains a cornerstone of strategic planning.
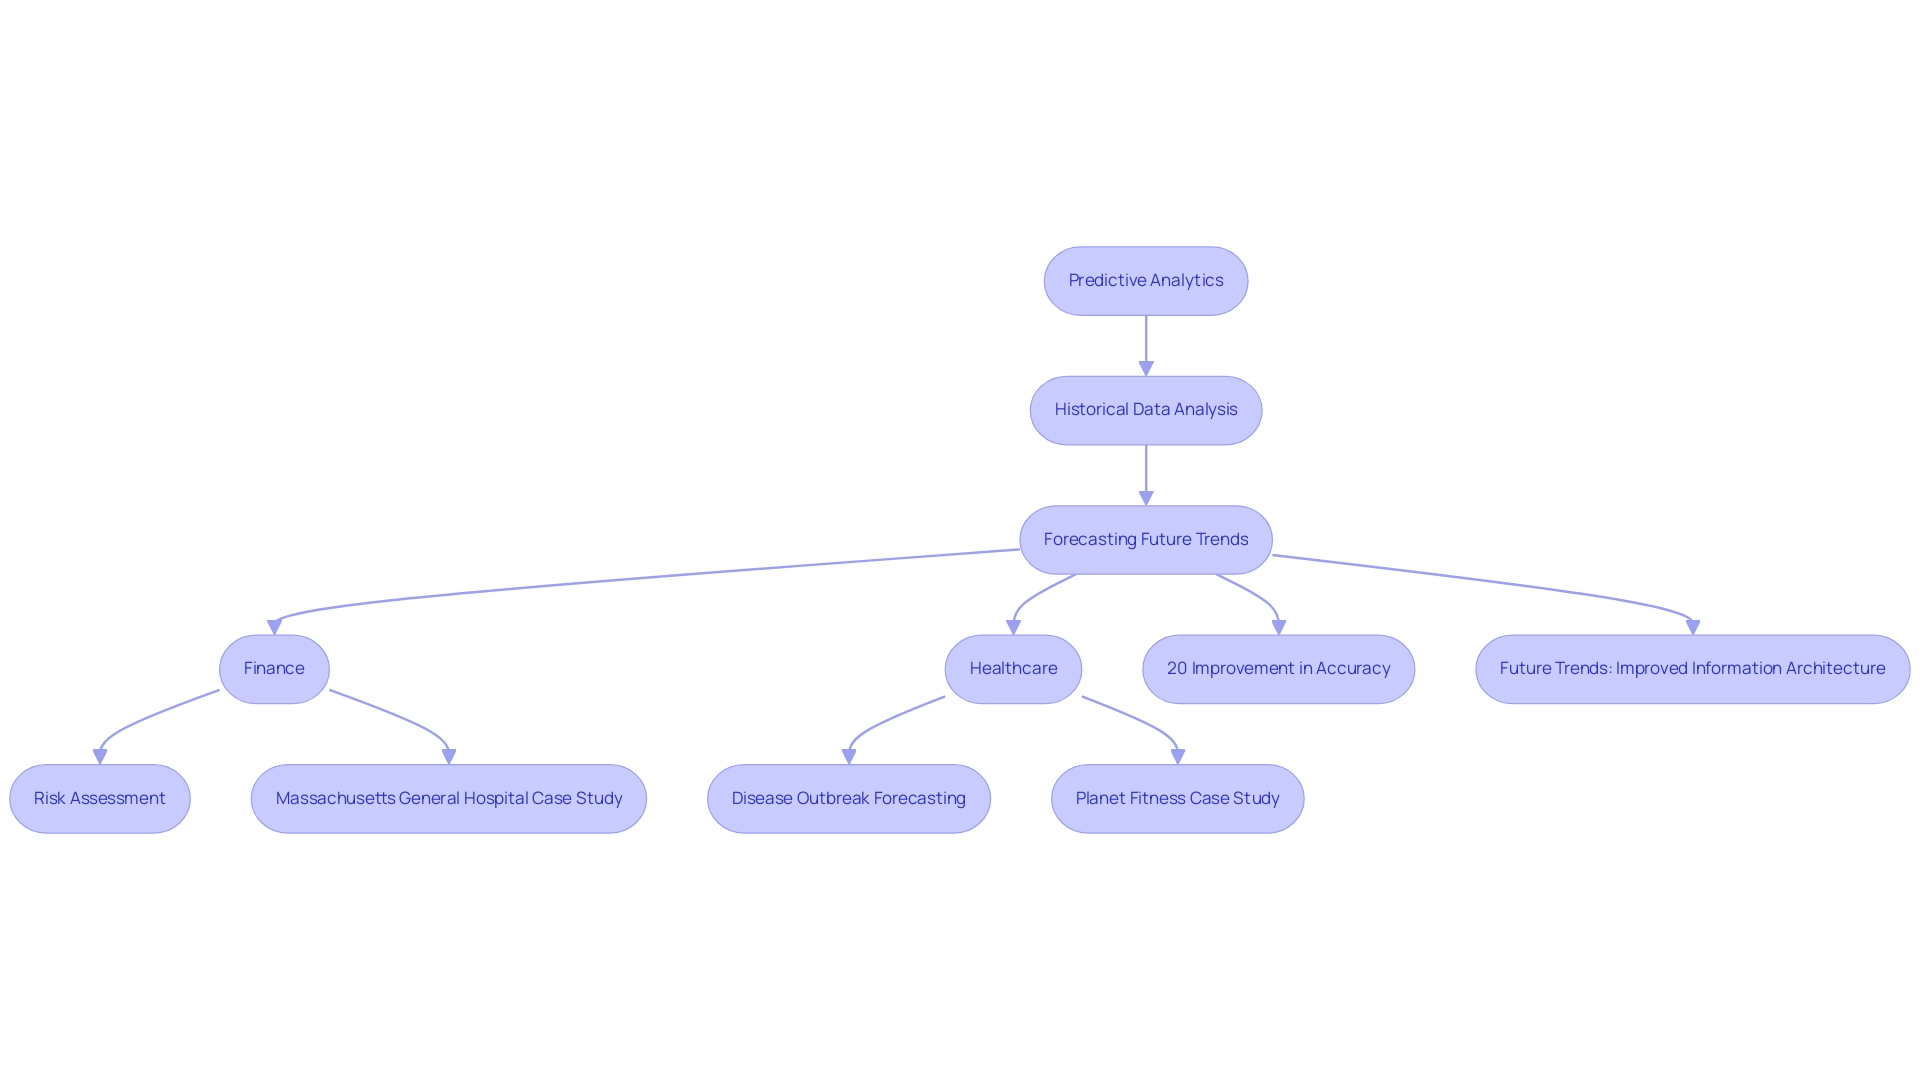
Prescriptive Analytics: Guiding Decision-Making with Data-Driven Recommendations
Prescriptive analysis transcends mere prediction by actively recommending specific actions to achieve desired outcomes, effectively answering the question, ‘What should we do?’ This analytical approach employs optimization and simulation algorithms to assess various scenarios and their potential results. In 2025, a prominent logistics company utilized prescriptive analysis to enhance delivery routes, considering real-time traffic information and delivery schedules. This not only reduced delivery times but also significantly cut operational costs.
Statistics reveal that organizations utilizing prescriptive methods experience a 20% increase in decision-making efficiency, underscoring its effectiveness in dynamic environments characterized by diverse data sources. Logistics specialists stress that prescriptive data analysis enhances operational efficiency by offering actionable insights that guide strategic decisions. A notable case study involved a major shipping company that employed prescriptive methods to streamline its supply chain operations, resulting in a 15% reduction in delays and enhanced customer satisfaction.
However, decision automation in prescriptive analysis faces challenges due to uncertainty and complexity, which can hinder its effectiveness. Recent advancements in prescriptive analysis have shown promising results in guiding decision-making processes. Businesses are increasingly adopting these techniques to navigate complex logistical challenges, such as inventory management and demand forecasting.
Expert opinions emphasize that the incorporation of prescriptive data analysis, along with Robotic Process Automation (RPA) and customized AI solutions from Creatum GmbH, not only enhances operational efficiency but also promotes a culture of data-driven decision-making. This ultimately propels growth and innovation in the logistics sector. As Catherine Cote, Marketing Coordinator at Harvard Business School Online, states, “Do you want to become a data-driven leader?” This sentiment aligns with the necessity for entities to adopt data analysis in their operations.
Moreover, the literature review process has identified significant developments in prescriptive analysis, focusing on publications from 2010 to 2019, which underscores the growing importance of this analytical approach. Innovative methods, such as coupling complex event processing (CEP) with probabilistic logic, have been proposed to enhance prescriptive analytics, enabling entities to proactively prescribe actions based on predictions. By leveraging RPA tools such as EMMA RPA and Microsoft Power Automate, organizations can automate manual workflows, enhance employee morale, and ultimately transform their operations for greater efficiency and effectiveness.
Client testimonials from organizations that have implemented these solutions highlight the tangible benefits achieved, reinforcing the value of Creatum GmbH’s offerings in enhancing operational efficiency.
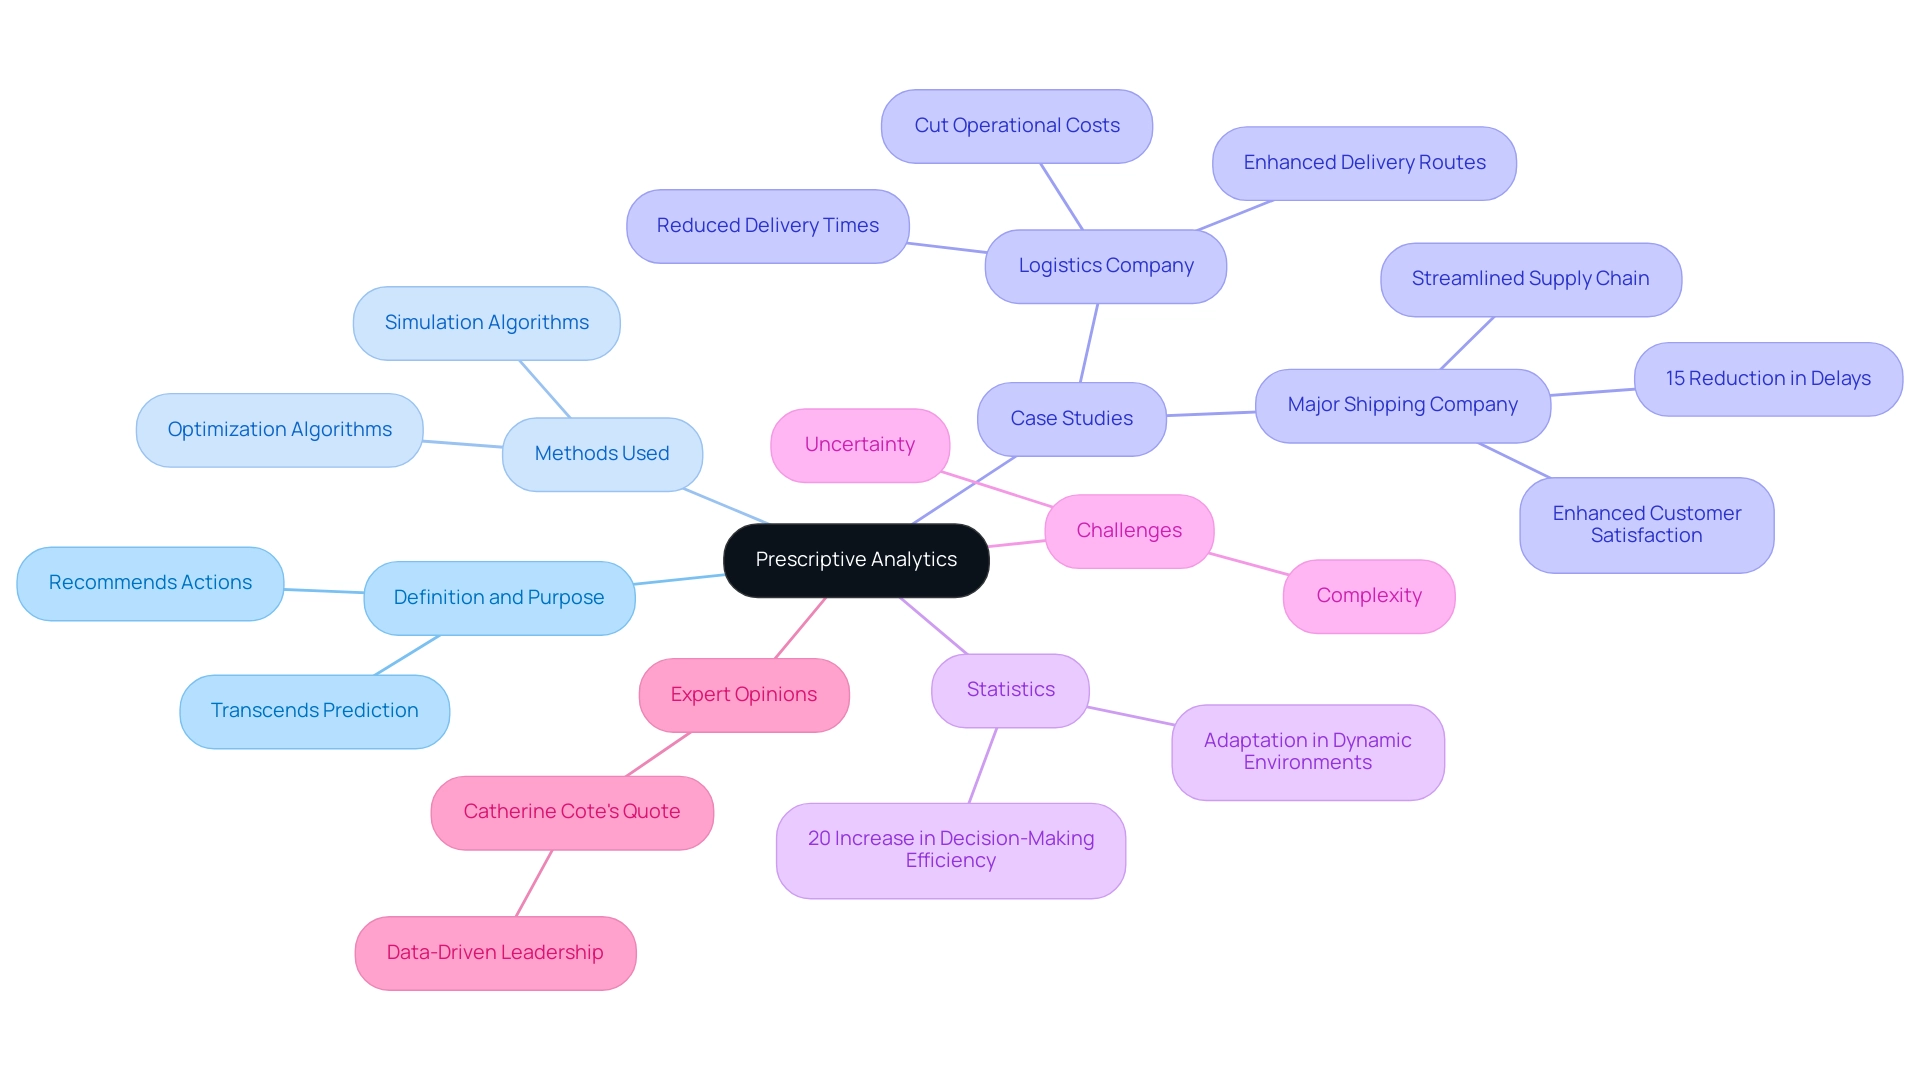
Real-World Applications: Leveraging Analytics for Business Success
What are the three broad categories of analytics techniques designed to extract value from data, and how do they play a pivotal role in driving success across multiple sectors, particularly when enhanced by Robotic Process Automation (RPA) and Business Intelligence? In retail, for instance, descriptive analysis is instrumental in identifying sales trends, enabling businesses to tailor their strategies effectively. RPA can automate manual workflows, significantly boosting operational efficiency and allowing teams to focus on strategic initiatives.
Diagnostic examination goes a step further by uncovering the underlying reasons for customer churn, allowing retailers to implement targeted retention strategies.
In the finance sector, predictive analytics is extensively utilized for risk assessment, assisting businesses in anticipating potential challenges and making informed decisions. The integration of customized AI solutions can further enhance information quality, addressing inconsistencies that may hinder effective reporting. For example, small language models and GenAI workshops offered by Creatum GmbH can enhance data analysis and privacy, ensuring that organizations have the tools they need to succeed.
Meanwhile, prescriptive analysis is crucial in supply chain management, where it optimizes inventory levels to meet demand without overstocking.
The profound impact of these analytics techniques can be seen across various industries. For instance, Geico has effectively raised its customer retention rate by 5% through the strategic use of data analysis. Similarly, Wells Fargo has reduced customer complaints by 10% by utilizing data analysis to enhance customer service, showcasing the tangible benefits of data-driven decision-making.
Case studies further demonstrate the effectiveness of data analysis in various industries. Barclays, for example, employs insights from data analysis to make strategic decisions concerning product offerings and market expansions based on risk profiles. This careful balance of risk and opportunity is essential for sustainable growth in the competitive banking sector, illustrating how data analysis aids in strategic decision-making and risk management.
As the importance of data analysis continues to expand, it raises the question of what are the three broad categories of analytics techniques designed to extract value from data, generating new opportunities across sectors. Business leaders acknowledge this trend; as Chandan Mishra, Head of Marketing at SCIKIQ, points out, ‘Data examination is key to Cyber Insurance as well.’ This emphasizes the growing significance of data analysis in various sectors.
The incorporation of data analysis, powered by RPA and Business Intelligence, not only enhances operational efficiency but also fosters innovation, ultimately driving growth and success in today’s data-rich environment. Moreover, Creatum GmbH’s Power BI services, including the 3-Day Sprint for report creation, illustrate how businesses can obtain actionable insights and enhance decision-making processes, reinforcing the transformative impact of advanced data solutions.
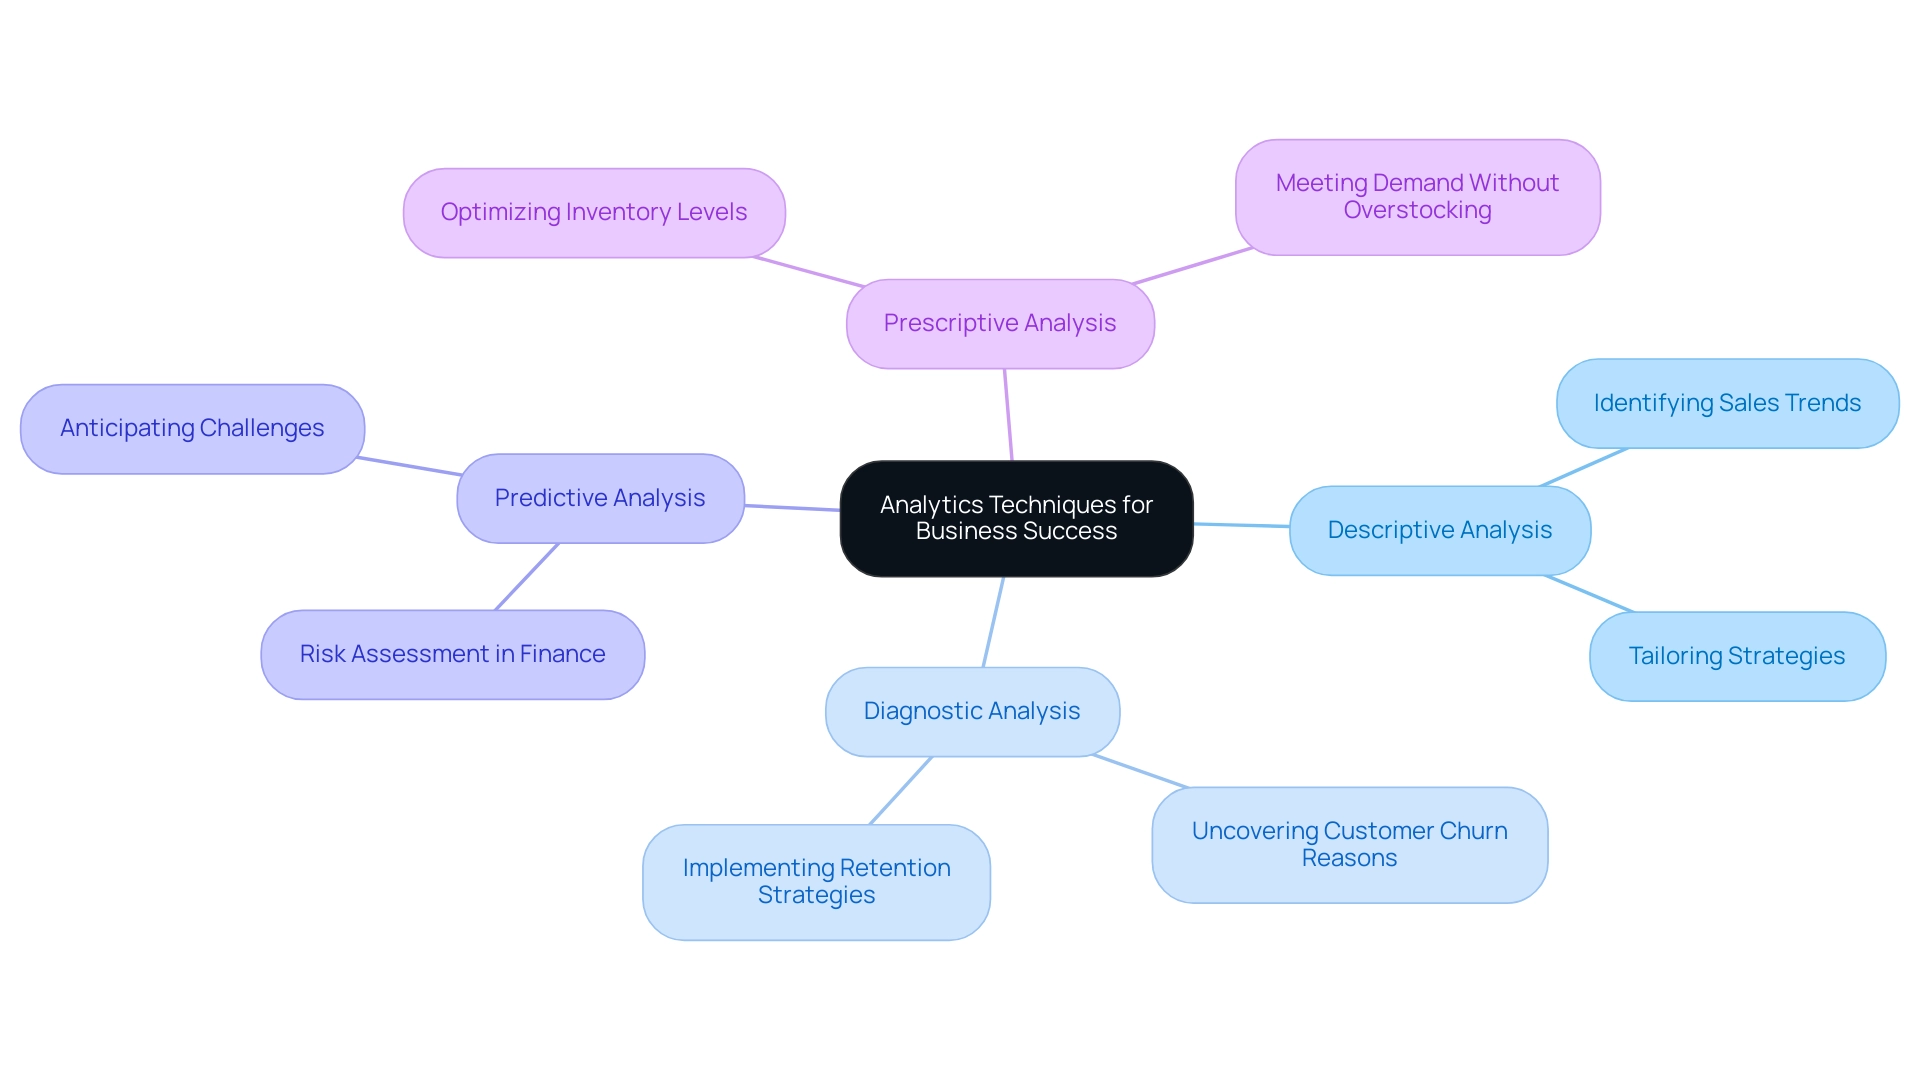
Overcoming Challenges: Enhancing Operational Efficiency through Analytics
Integrating data analysis within organizations often encounters significant challenges that can impede success. A primary concern is information quality; without precise and trustworthy information, the insights derived from analysis can be misleading or entirely incorrect. As Leigh Pearce emphasizes, the process of data consolidation—bringing together information from various sources such as databases, spreadsheets, and cloud services—can be intricate and time-consuming, complicating the examination process.
Moreover, resistance to change from employees poses a substantial barrier. Many individuals may be hesitant to adopt new technologies or methodologies, particularly if they are accustomed to traditional ways of working. To combat this, organizations must cultivate a culture that embraces data-driven decision-making.
This cultural shift is essential for overcoming resistance and ensuring that data analysis is integrated into everyday operations. Training and resources play a critical role in empowering employees to utilize data insights effectively. By equipping teams with the necessary skills—such as information management, advanced modeling, business case development, and domain knowledge—organizations can enhance operational efficiency and drive business success. Statistics indicate that entities emphasizing education in analysis experience a significant enhancement in their capacity to leverage information for strategic decision-making.
Furthermore, the expansion of the Internet of Things (IoT) illustrates the rising complexity of information management. With projections of 20.3 billion connected devices producing 79.4 zettabytes of information by 2025, companies must navigate this vast landscape to remain competitive. Thriving entities are those that not only tackle information quality challenges but also establish robust analytical frameworks capable of adapting to the evolving informational landscape.
By utilizing IoT solutions and Robotic Process Automation (RPA) from Creatum GmbH, entities can effectively manage information complexity and enhance their analytical capabilities, boosting operational efficiency and informed decision-making.
In summary, addressing the challenges of executing analytical processes necessitates a multifaceted approach that prioritizes information quality, fosters a supportive culture, and invests in employee training. Additionally, understanding the three broad categories of analytics techniques designed to extract value from data can provide entities with a clearer framework for their analytical strategies. By addressing these areas and leveraging tailored AI solutions from Creatum GmbH, organizations can unlock the full potential of their data, leading to informed decision-making and sustained growth.
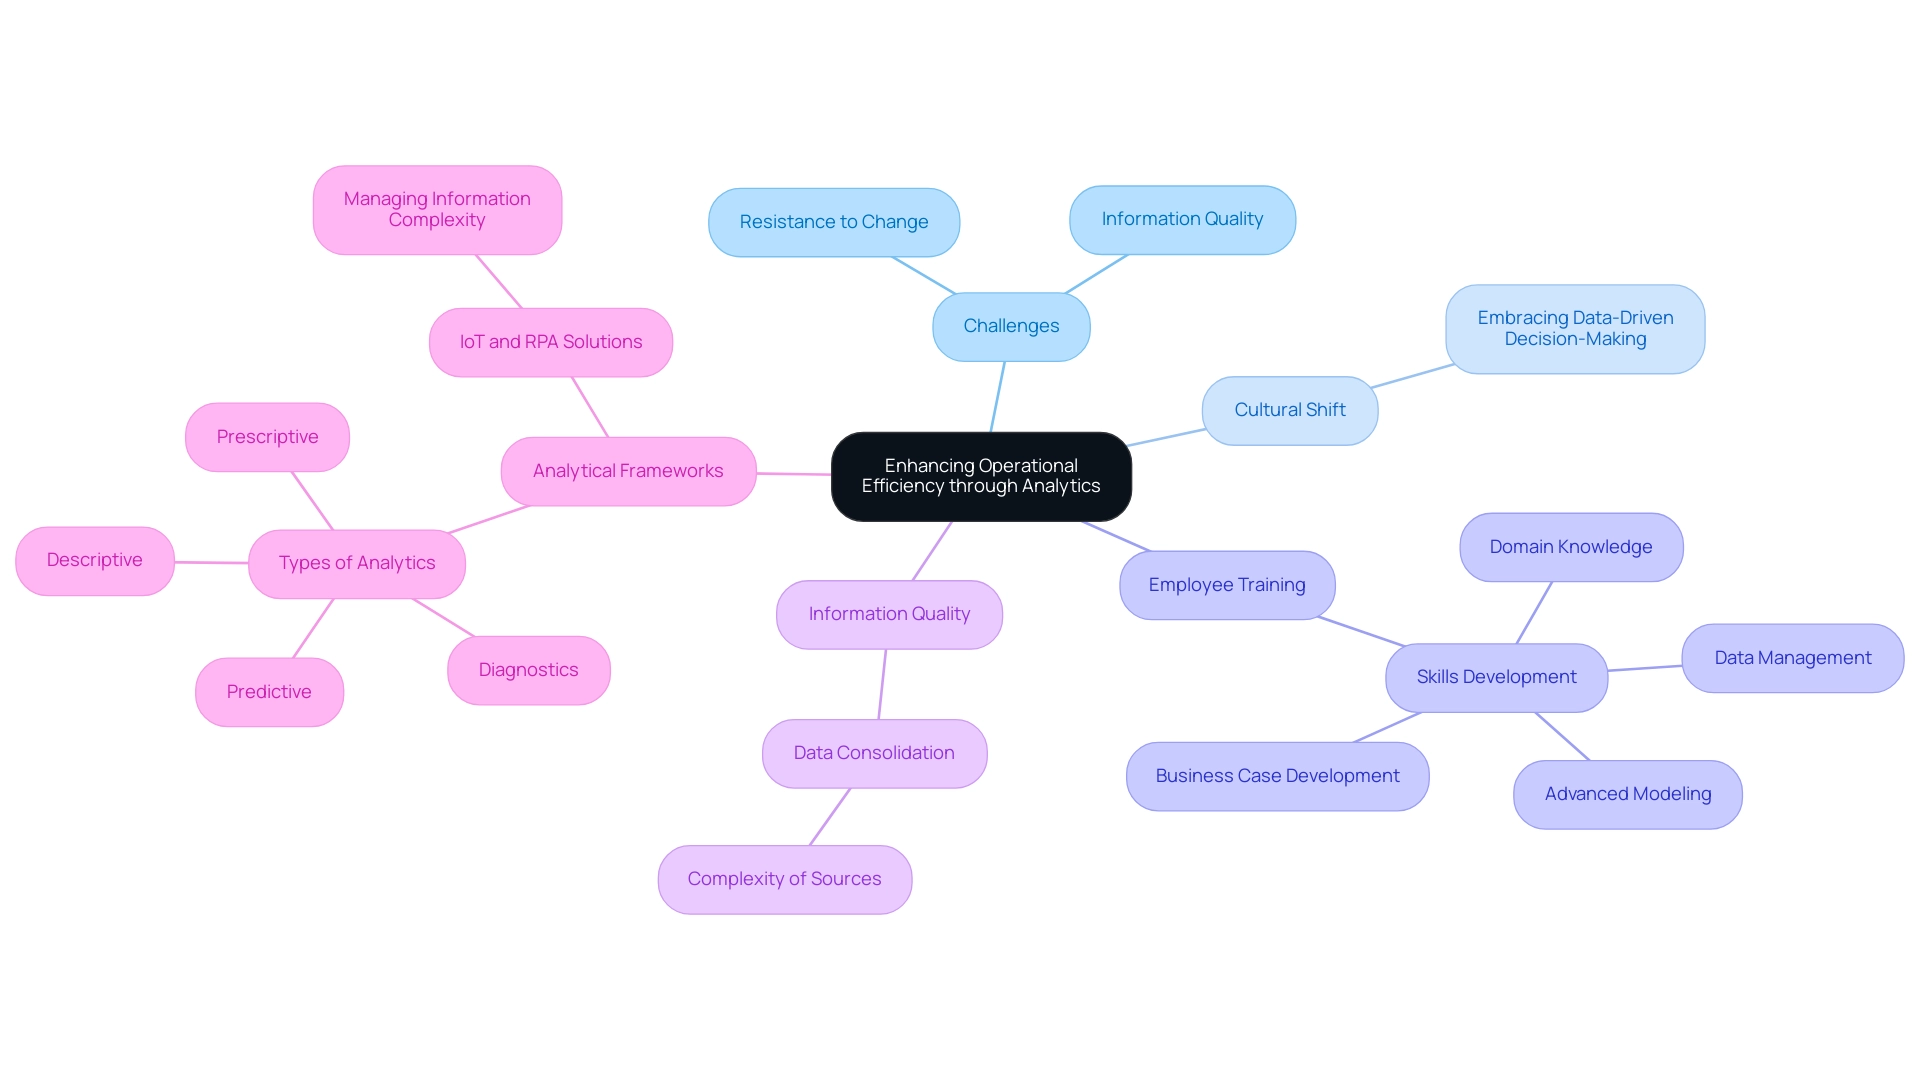
Tailored Analytics Solutions: Customizing Approaches for Optimal Results
Customized data solutions are essential for organizations aiming to confront unique challenges and achieve specific objectives. By personalizing data analysis methods, businesses can effectively employ the right techniques and tools to meet their distinct needs. For example, in the healthcare sector, specialized predictive models can anticipate patient outcomes, significantly enhancing the quality of care.
According to the Healthcare Information and Management Systems Society, a notable 78% of organizations utilizing performance analysis reported marked improvements in patient care quality. This statistic underscores the profound impact of tailored data analysis in this field.
In the retail sector, customized prescriptive data insights can optimize inventory management, ensuring stock levels align with consumer demand. This strategy not only improves operational efficiency but also boosts customer satisfaction. A recent case study involving Planet Fitness and Coherent Solutions illustrates this, as they developed a comprehensive data solution that provided a 360-degree view of fitness club members.
This initiative led to customized services, heightened customer satisfaction, and fostered long-term loyalty by understanding clients’ needs.
The effectiveness of tailored data solutions is further supported by statistics indicating that 48% of early adopters in the United States and Canada prioritize enhancing data-analyst efficiency as their primary motivation for adopting generative AI. This highlights the growing recognition of the importance of tailored insights in improving operational capabilities. Moreover, entities such as JPMorgan Chase have successfully utilized large-scale analytics to refine loan underwriting precision and reduce default rates, showcasing the tangible benefits of personalized analytics solutions in enhancing decision-making and business outcomes.
At Creatum GmbH, we acknowledge the complexities of the AI landscape and provide customized AI solutions that cut through the noise, aligning with your specific business goals and challenges. Our key offerings include:
- Small Language Models for efficient information analysis and enhanced privacy
- GenAI Workshops that provide hands-on training and custom GPT creation
- Business Intelligence services that empower organizations to harness the potential of data, transforming raw information into actionable insights that drive growth and innovation
Additionally, our Robotic Process Automation (RPA) solutions streamline workflows, enhance efficiency, and minimize errors, enabling your team to concentrate on strategic, value-added tasks. Expert insights emphasize the importance of understanding the three broad categories of analytics techniques designed to extract value from data, as this coordination enhances information quality, improves decision-making, and ultimately propels growth. By adopting tailored analytics approaches, organizations can convert raw data into actionable insights, resulting in informed decision-making and improved organizational outcomes.
Furthermore, our Power BI services, including the 3-Day Power BI Sprint for rapid report creation and the General Management App for comprehensive oversight, ensure efficient reporting and clear, actionable guidance. Client testimonials further underscore the impact of Creatum GmbH’s technology solutions in enhancing operational efficiency and driving business growth.
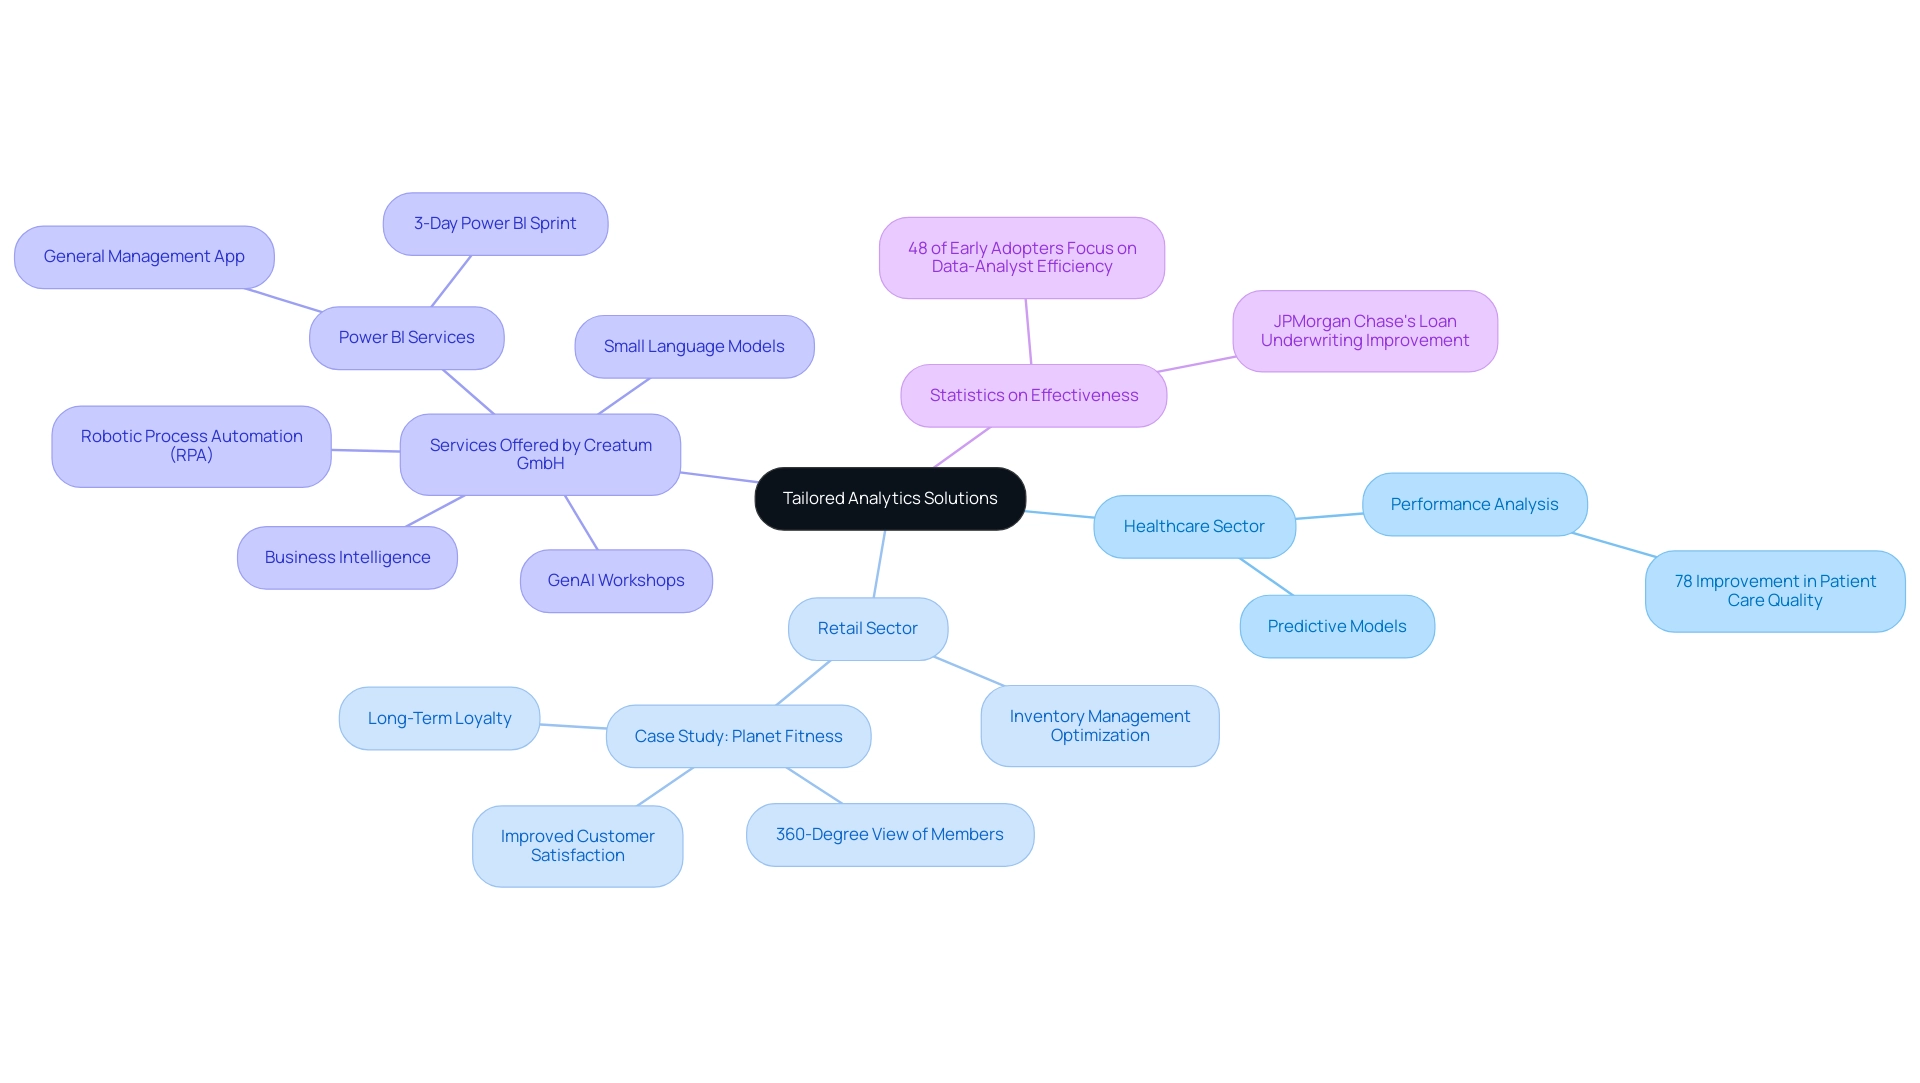
Conclusion
In today’s data-driven landscape, the strategic implementation of analytics is paramount for organizations aiming to enhance decision-making and operational efficiency. This article has illuminated the various types of analytics—descriptive, diagnostic, predictive, and prescriptive—each playing a distinct role in transforming raw data into meaningful insights. By leveraging these analytical techniques, businesses can not only identify historical trends but also uncover the reasons behind outcomes, forecast future scenarios, and develop actionable recommendations that drive growth.
Furthermore, the challenges associated with analytics, such as data quality issues and resistance to change, underscore the importance of fostering a culture that embraces data-driven methodologies. Investing in employee training and adopting tailored analytics solutions can significantly enhance an organization’s ability to navigate the complexities of the data landscape. Successful case studies demonstrate that organizations which effectively implement analytics frameworks can achieve remarkable operational improvements, as evidenced by enhanced customer satisfaction and increased efficiency.
Ultimately, embracing a structured and customized approach to analytics is essential for sustained success in a competitive environment. As organizations continue to evolve, the integration of analytics will serve as a critical enabler, empowering them to make informed decisions that align with their strategic objectives. The journey toward effective data utilization is ongoing; however, with the right tools and mindset, businesses can unlock the full potential of their data, paving the way for innovation and growth in the future.
Frequently Asked Questions
What is analytics and why is it important for organizations?
Analytics is the systematic computational examination of information and statistics, which helps organizations make informed, data-driven decisions. It enhances operational efficiency and strategic planning by identifying patterns, trends, and insights from historical and contemporary data.
How many businesses recognize the importance of data-driven decision-making?
According to recent findings, 91% of businesses recognize data-driven decision-making as crucial to their success.
What is the gap in data-driven decision-making among organizations?
While 91% of businesses acknowledge the importance of data-driven decision-making, only 57% actually base their decisions on data, highlighting a critical gap in implementation.
What are some benefits of implementing GUI automation in organizations?
Implementing GUI automation can lead to significant improvements, such as a 70% reduction in data entry errors, a 50% acceleration in testing processes, and an 80% improvement in workflow efficiency.
What was the return on investment (ROI) for the mid-sized company that implemented GUI automation?
The company achieved a return on investment (ROI) within six months of implementing the GUI automation solution.
How have organizations that initiated cost-reduction projects fared?
Over 49% of organizations that started projects aimed at reducing expenses reported positive outcomes, demonstrating the tangible benefits of incorporating data analysis into their operations.
What trends are emerging regarding budgets for data analysis in 2023?
More than half of companies are increasing their budgets for data analysis in 2023, indicating a growing awareness of its importance, while only 8% are reducing their budgets.
What role does descriptive analysis play in data analytics?
Descriptive analysis helps summarize historical information using key metrics such as averages, totals, and percentages, allowing organizations to understand past performance and inform future strategies.
How can retailers utilize descriptive analytics?
Retailers can analyze sales data from previous years to identify patterns in customer buying behavior, which can guide future strategies and operational decisions.
What tools can enhance data reporting capabilities for organizations?
Business Intelligence tools like Power BI from Creatum GmbH can enhance data reporting capabilities, ensuring data consistency and providing actionable insights for better decision-making.
Overview
The article titled “Connecting Power BI to Azure SQL: A Step-by-Step Guide for Professionals” explores the essential process and significant benefits of integrating Power BI with Azure SQL. This integration is pivotal for enhancing data visualization and decision-making capabilities. It offers a comprehensive guide that outlines:
- Prerequisites
- Detailed connection instructions
- Troubleshooting common issues
- Advanced configurations
Organizations can leverage real-time data access and advanced analytics through this integration, resulting in improved operational efficiency and informed decision-making.
Introduction
In an era where data drives decision-making, the integration of Power BI and Azure SQL stands as a pivotal advancement for organizations eager to unlock the full potential of their data. Power BI, renowned for its dynamic data visualization capabilities, combined with the robust, cloud-based architecture of Azure SQL, presents a formidable solution for businesses striving for real-time insights and enhanced analytical prowess.
This article explores the symbiotic relationship between these two platforms, highlighting their key features, the benefits of integration, and practical steps for effective connectivity.
As organizations navigate the intricacies of data management, mastering these tools will not only streamline operations but also cultivate a culture of data-driven decision-making, which is indispensable in today’s competitive landscape.
Understanding Power BI and Azure SQL: An Overview
Power BI stands out as a robust business analytics tool, empowering users to visualize information and disseminate insights throughout their organizations. Its capability to link with multiple information sources, including SQL Database—a cloud-based relational database service—allows businesses to utilize the full potential of their resources. The SQL service is designed for scalability, security, and high availability, making it an optimal choice for managing extensive datasets efficiently.
To fully leverage the functionalities of Power BI and Azure SQL, it is crucial to comprehend their characteristics and how they enhance each other in analysis and reporting.
Key Features of Power BI:
- Data Visualization: Users can create interactive reports and dashboards that facilitate data exploration and storytelling, addressing the challenge of time-consuming report creation.
- Information Connectivity: This tool connects effortlessly to a broad array of information sources, encompassing both cloud and on-site databases, boosting its versatility and guaranteeing information consistency.
- Collaboration: The platform allows for easy sharing of insights with team members and stakeholders, fostering a collaborative decision-making environment.
- Actionable Guidance: Power BI services provide clear, actionable insights that help organizations make informed decisions based on their information.
Key Features of Azure SQL:
- Scalability: Azure SQL enables businesses to scale resources effortlessly according to demand, ensuring optimal performance during peak usage times.
- Protection: With integrated security capabilities, SQL safeguards confidential information, addressing compliance and regulatory obligations effectively.
- Integration: The service provides seamless integration with other cloud services and tools, enhancing the overall functionality and user experience.
In 2025, SQL holds a significant market share in the cloud database industry, reflecting its increasing adoption among organizations seeking dependable information management solutions. Recent enhancements in the integration of Power BI and Azure SQL have introduced features that enhance refresh rates and consistency, addressing previous limitations. For instance, the latest updates allow users to visualize report usage metrics effectively, helping organizations identify underutilized reports and optimize resource allocation.
It is important to note that the improved usage metrics report only includes reports that have been opened in the past 30 days, and these reports are not supported in ‘My Workspace,’ which may lead to specific limitations regarding consistency and refresh issues. A case study on this topic demonstrated how a customized BI report could visualize report usage over time, pinpointing those that had not been accessed in the last 90 days, thus enabling better report management.
As organizations increasingly depend on information-driven insights, the integration of Power BI and Azure SQL becomes a strategic advantage, enabling advanced visualization and informed decision-making. Current statistics indicate that a significant percentage of organizations are utilizing BI for their analytics needs, underscoring its importance in the modern business landscape. As Douglas Rocha, a statistics enthusiast, noted, “Even though one can assume it is the simplest of all statistical measures since it is only the most common value in the dataset, there isn’t a native DAX function to calculate it.”
This emphasizes the necessity for users to comprehend the tools accessible to them in BI, particularly in relation to improving governance and tackling inconsistencies in business reporting. Furthermore, Creatum GmbH provides RPA solutions such as EMMA RPA and Automate, which can further enhance operational efficiency and complement the functionalities of BI in driving actionable insights.
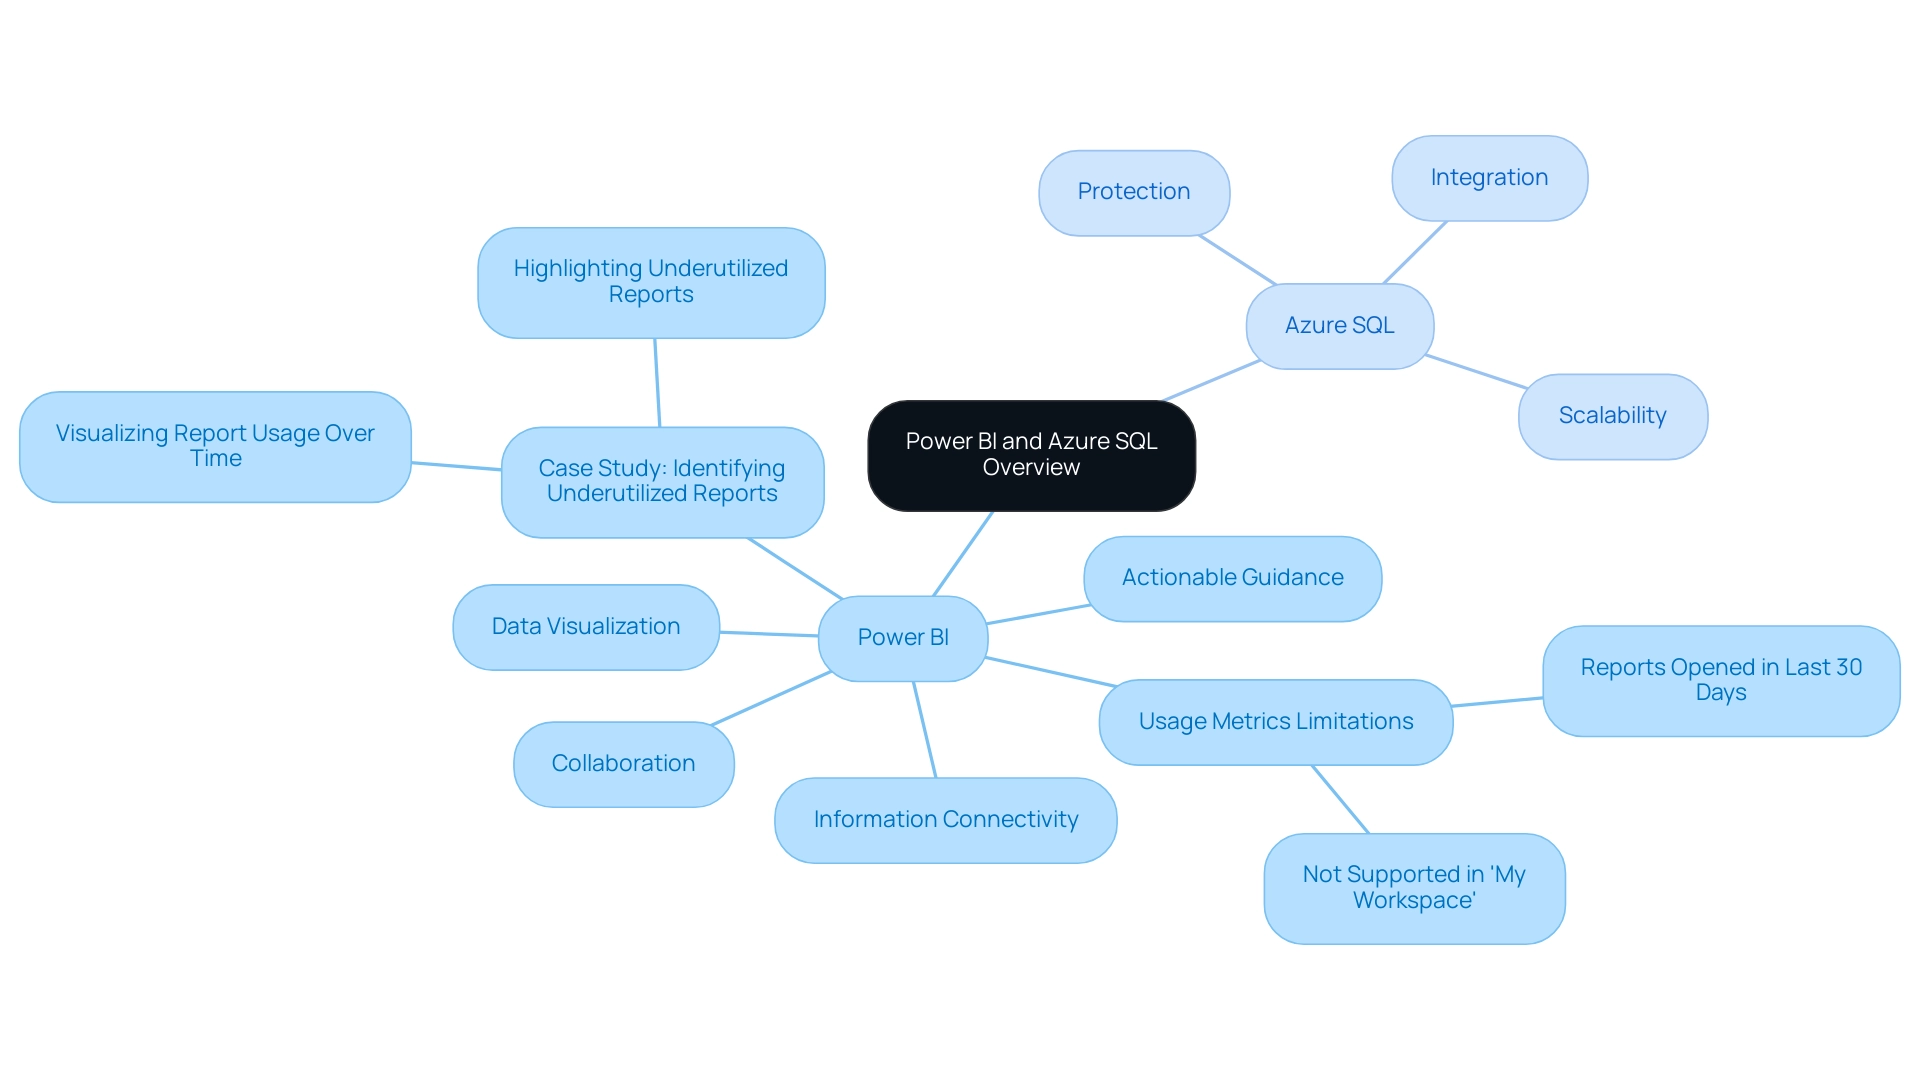
Why Connect Power BI to Azure SQL? Benefits and Use Cases
Integrating BI with SQL presents a multitude of advantages that can significantly enhance analysis and reporting capabilities for organizations:
Benefits:
- Real-Time Access: Linking BI to SQL empowers users with live information access, ensuring that reports and dashboards reflect the most current data available. This immediacy is crucial for timely decision-making, especially in fast-paced business environments. For instance, Ciena’s deployment of Striim has enabled them to establish a modern real-time analytics ecosystem, processing nearly 100 million events daily to enhance business operations.
- Improved Analysis: The powerful analytics capabilities of Power BI can be harnessed on data stored in SQL, allowing for deeper insights and more comprehensive evaluations. This integration enables organizations to apply advanced analytics techniques, such as predictive modeling, to their data, thereby enhancing overall analytical capabilities. Notably, by 2023, 73% of organizations plan to implement AI for predictive analytics, indicating a shift towards more proactive management strategies.
- Enhanced Collaboration: The seamless sharing of reports and dashboards that draw information directly from Azure SQL fosters collaboration among teams. This interconnectedness ensures that all stakeholders are aligned with the same up-to-date information, promoting informed decision-making across the organization. The importance of information literacy in this context is underscored by a Deloitte survey, which found that 49% of executives prioritize information literacy to enhance decision-making capabilities.
Use Cases:
- Sales Reporting: Organizations can analyze sales data in real-time, identifying trends and making informed decisions that refine sales strategies. This capability is particularly advantageous as 73% of organizations intend to adopt AI for predictive analytics, signaling a transition towards more proactive sales management.
- Financial Analysis: With the ability to monitor financial performance using current data, businesses can make timely adjustments to their strategies. This agility is vital in today’s dynamic market, where financial conditions can shift rapidly.
- Operational Efficiency: Automating the information retrieval process from SQL into BI streamlines reporting processes, reducing the time spent on manual data handling. This efficiency allows teams to concentrate on strategic initiatives rather than repetitive tasks, aligning with the growing emphasis on operational efficiency in organizations. Furthermore, the anticipated trend that by 2023, 50% of analytics queries will be generated using search or natural language processing highlights the necessity for organizations to adopt such integrations to remain competitive.
The integration of Power BI with Azure SQL not only enhances accessibility but also empowers organizations to leverage their data more effectively, driving improved business outcomes and fostering a culture of information literacy. Additionally, the case study on enhancing operational efficiency through GUI automation illustrates how automating tasks can markedly improve workflow efficiency, reduce errors, and ultimately lead to superior software quality. As highlighted by the case study on future trends in business intelligence, organizations that invest in data governance and self-service analytics are expected to outperform their peers financially, underscoring the critical role of such integrations in today’s data-driven landscape.
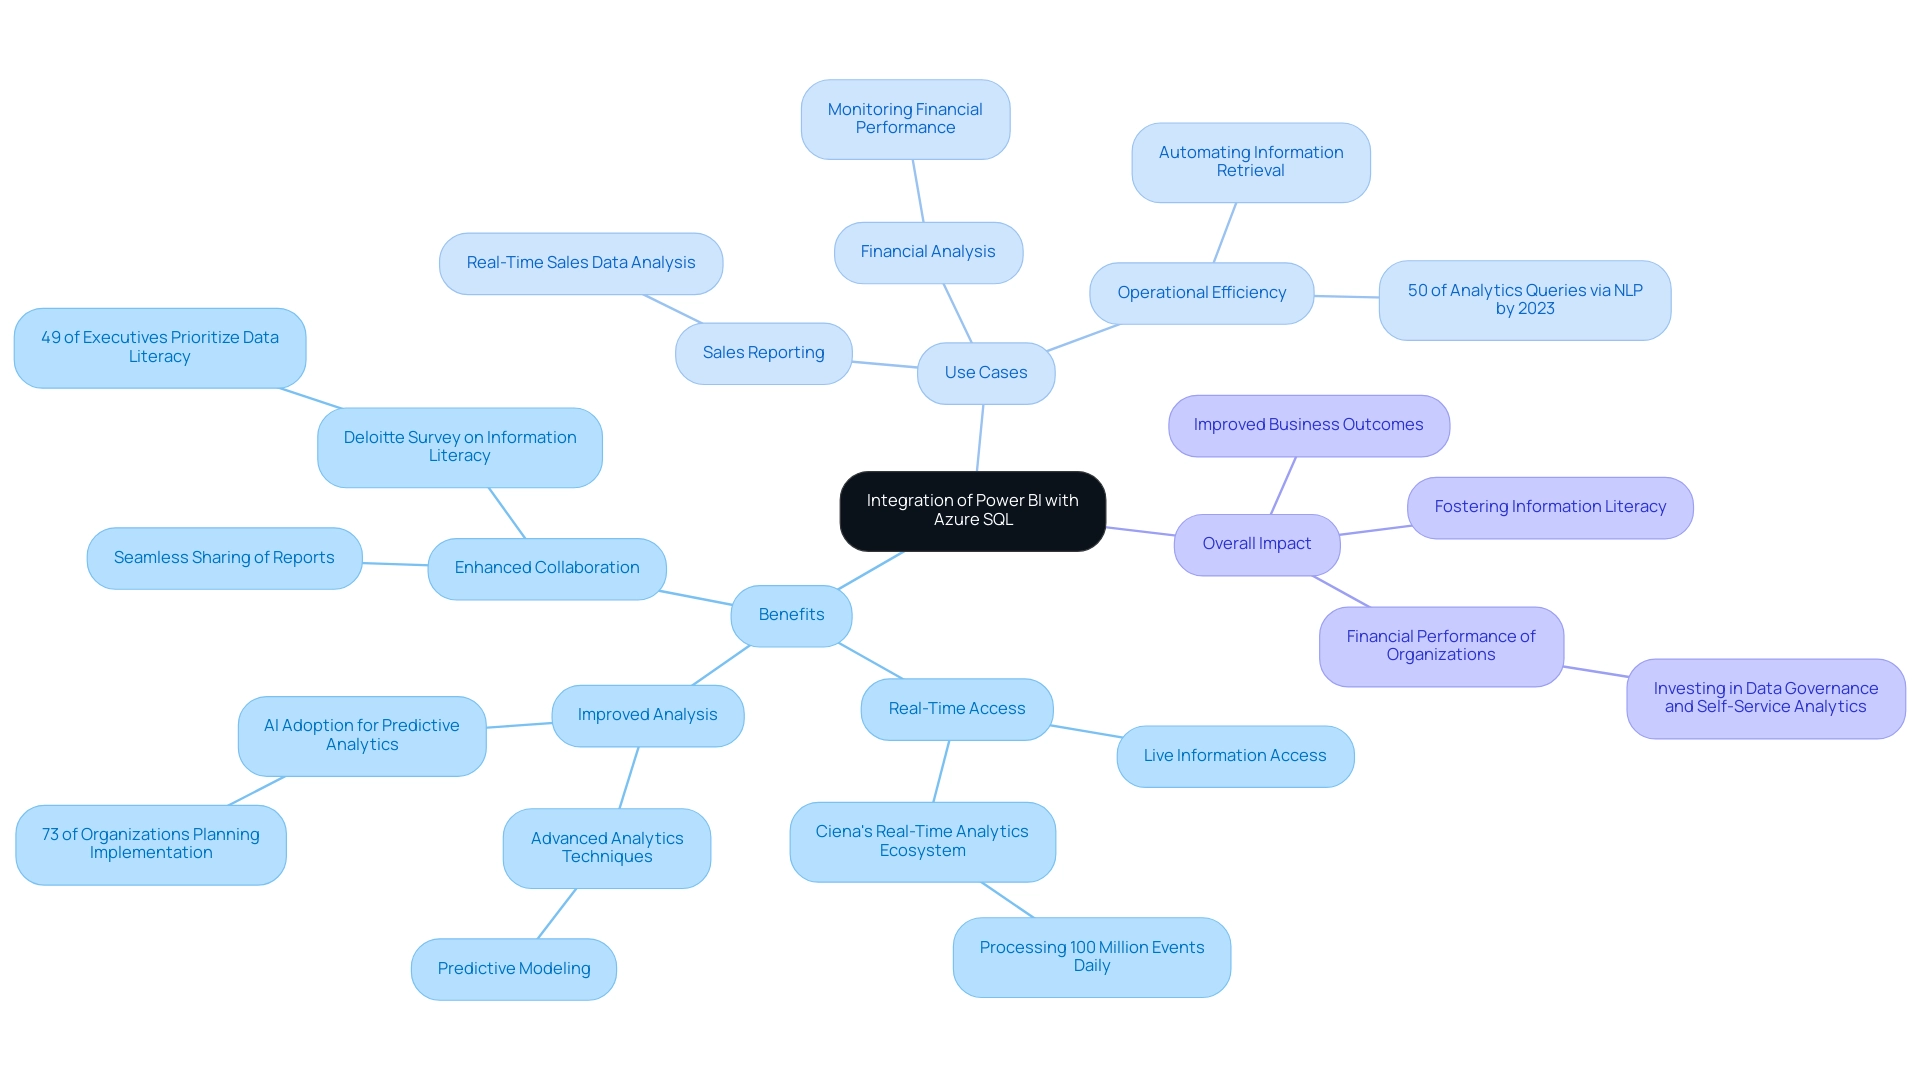
Prerequisites for Connecting Power BI to Azure SQL
Before initiating the connection between Power BI and Azure SQL, it is crucial to establish the following prerequisites:
- Azure SQL Database: Ensure that you have an Azure SQL Database created and accessible. This database forms the foundation for your data visualization efforts using Power BI Azure SQL, addressing challenges related to data inconsistencies and ensuring reliable insights.
- Power BI Desktop: Download and install the latest version of Power BI Desktop. Keeping your software updated guarantees access to the latest features and improvements, which can alleviate the time-consuming nature of report creation.
- Network Configuration: Verify that your network settings allow connections to SQL. This may involve configuring firewalls to permit traffic and ensuring that cloud services can access your SQL database seamlessly, thus enhancing operational efficiency.
- User Permissions: Confirm that you have the necessary permissions to access the SQL Database and retrieve information. Proper permissions are essential for smooth data integration and reporting, addressing the common issue of stakeholders receiving data without clear guidance on actionable next steps.
- Connection String: Obtain the connection string for your SQL Database, which includes critical details such as the server name and database name. This string is vital for creating a successful connection between Power BI Azure SQL and SQL.
Additional Considerations:
- Statistics Management: Note that the default sampling percentage for statistics resets if the table is truncated. Maintaining precise statistics is crucial for optimal performance in Power BI Azure SQL integration, as this directly impacts the clarity and reliability of your reports.
- Performance Investigation: As advised by Stellato, utilizing Glenn’s Diagnostic Queries can aid in investigating performance issues that may arise during the setup process, ensuring a smoother integration experience and reducing the time spent on report creation.
- Case Study Insight: Reflect on the case study regarding using AUTO_DROP with CREATE STATISTICS, which illustrates how managing statistics can significantly impact the performance and efficiency of your SQL Database in relation to Business Intelligence.
By ensuring these prerequisites are met, alongside the additional considerations, you lay the groundwork for a successful integration that leverages the full potential of Power BI Azure SQL’s advanced data visualization capabilities. As Rajendra Gupta, a recognized Database Specialist, emphasizes, “Proper setup and management in SQL environments are crucial for achieving the best outcomes.” Furthermore, integrating RPA solutions can streamline processes and enhance operational efficiency, ultimately driving better data-driven insights.
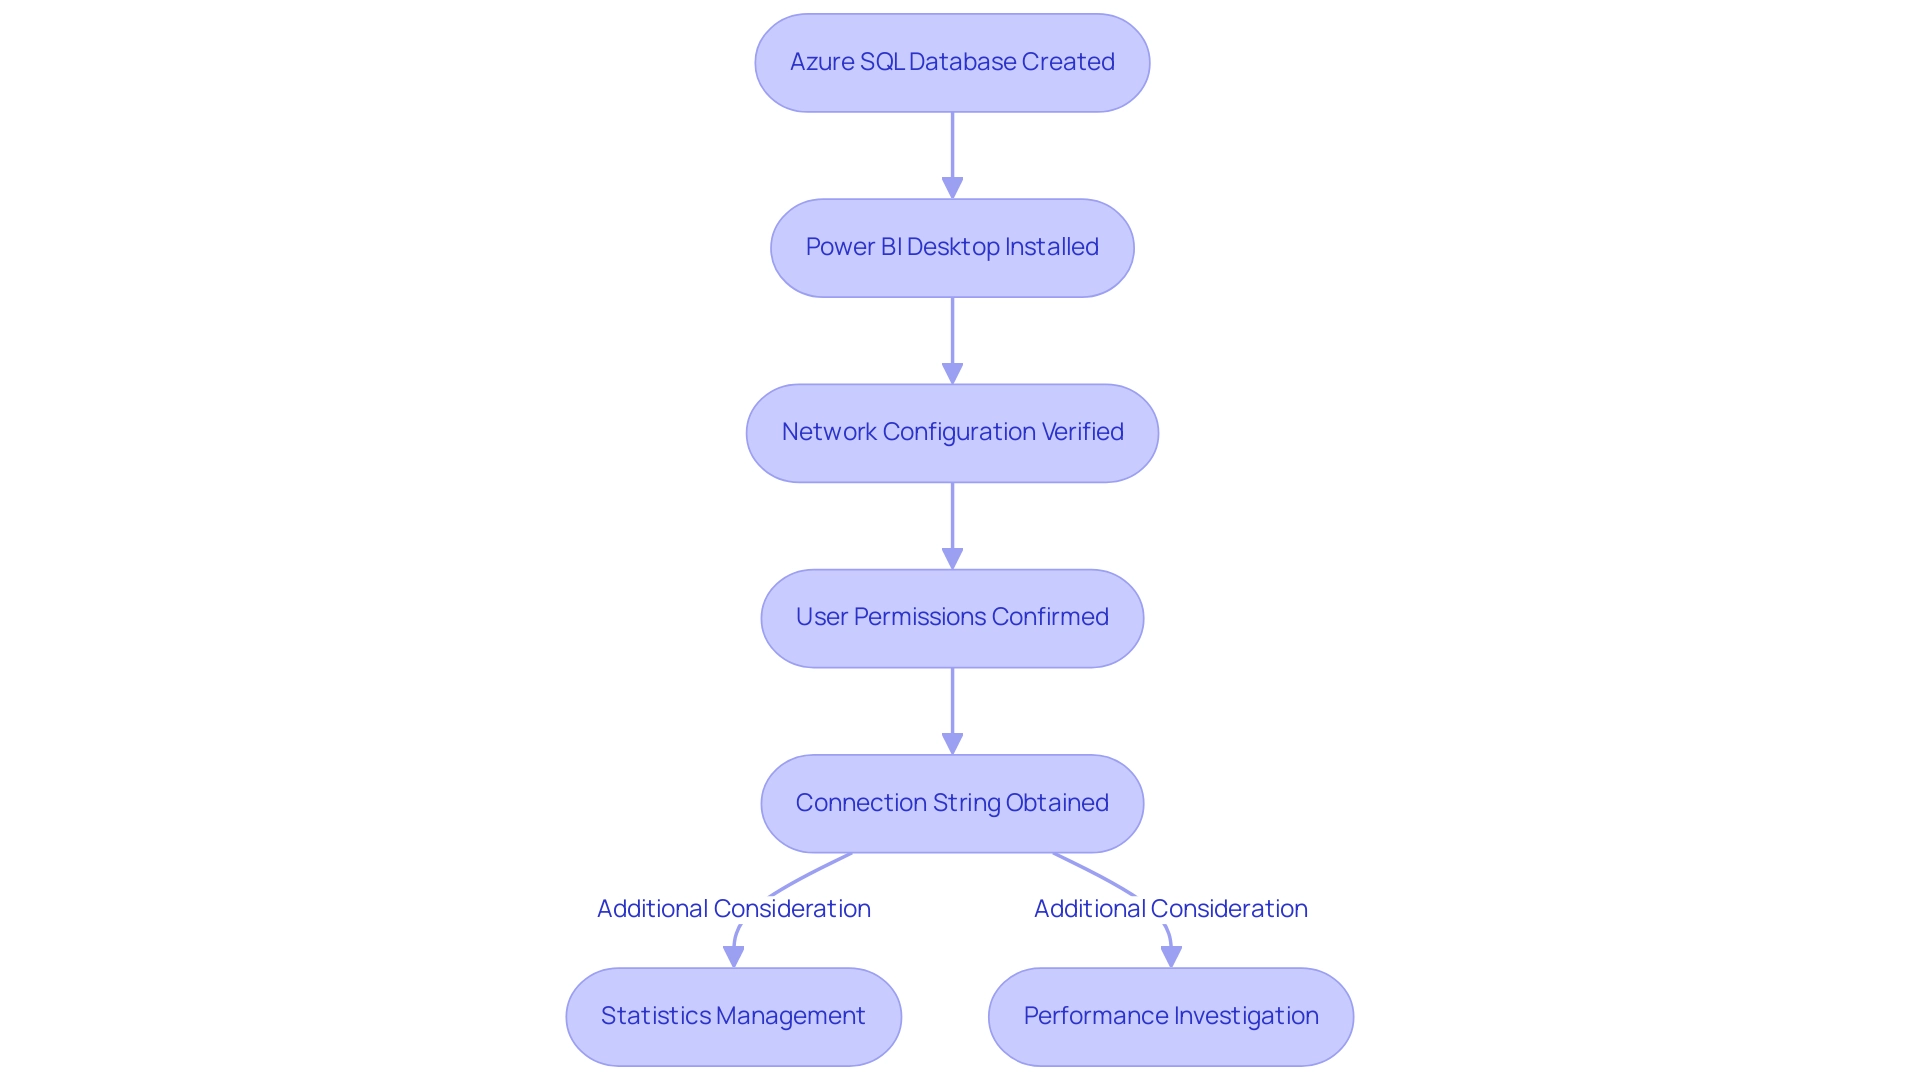
Step-by-Step Guide to Connecting Power BI to Azure SQL
To connect Power BI to Azure SQL effectively, follow this comprehensive guide:
-
Open Power BI Desktop
Begin by launching Power BI Desktop on your computer, ensuring you have the latest version for optimal performance. -
Get Data
Navigate to the ‘Home’ tab on the ribbon. Click on ‘Get Data’ and select ‘Azure’ from the dropdown options. Choose ‘Power BI Azure SQL Database’ to initiate the connection process. -
Enter Connection Details
In the dialog box that appears, input the server name and database name associated with your Azure SQL Database. Choose the suitable authentication method: either SQL Server Authentication or Active Directory, based on your organization’s security protocols. Ensure that the semantic model is on the same tenant as the SQL resource in Power BI Azure SQL to facilitate Single Sign-On (SSO) functionality, enhancing user experience and security. -
Configure Data Access
If you opt for SQL Server Authentication, provide your username and password to authenticate your access. Click ‘Connect’ to establish a secure connection to your database using Power BI Azure SQL. -
Load Data
After successfully connecting, you will see a list of available tables and views. Choose the items you want to import into BI. Click ‘Load’ to transfer the selected information into BI for further analysis.
Best Practices
- Regularly refresh your Power BI tiles, as they are updated every hour, to maintain the accuracy of your data visualizations. This practice is essential for ensuring that your reports reflect the most up-to-date information and helps mitigate challenges such as inconsistencies and time-consuming report creation.
Challenges in Leveraging Insights
- Users often face challenges such as time-consuming report creation and data inconsistencies when working with Power BI dashboards. These issues can hinder effective decision-making and operational efficiency.
RPA Solutions
- Implementing RPA solutions can streamline the data preparation and reporting processes, reducing the time spent on manual tasks and enhancing the overall effectiveness of your Power BI integration with Azure SQL.
Real-World Example
- A recent case study titled “Securing Azure SQL Database Access” highlighted the importance of securing access by configuring a Virtual Network and Private Endpoint. By implementing these measures, organizations can significantly enhance the security of their cloud resources, ensuring that only authorized connections are made to the SQL Database.
Expert Insight
- As noted by Douglas Rocha, a data science enthusiast, “Last but definitely not least is the Mode.” This emphasizes the significance of comprehending the context and organization of your information when linking BI to SQL.
By following these steps and best practices, you can effectively connect Power BI to Azure SQL, enabling advanced data visualization and insightful analysis that drives operational efficiency. Leveraging Business Intelligence and RPA solutions from Creatum GmbH can further enhance your ability to extract actionable insights, ultimately supporting your organization’s growth and innovation.
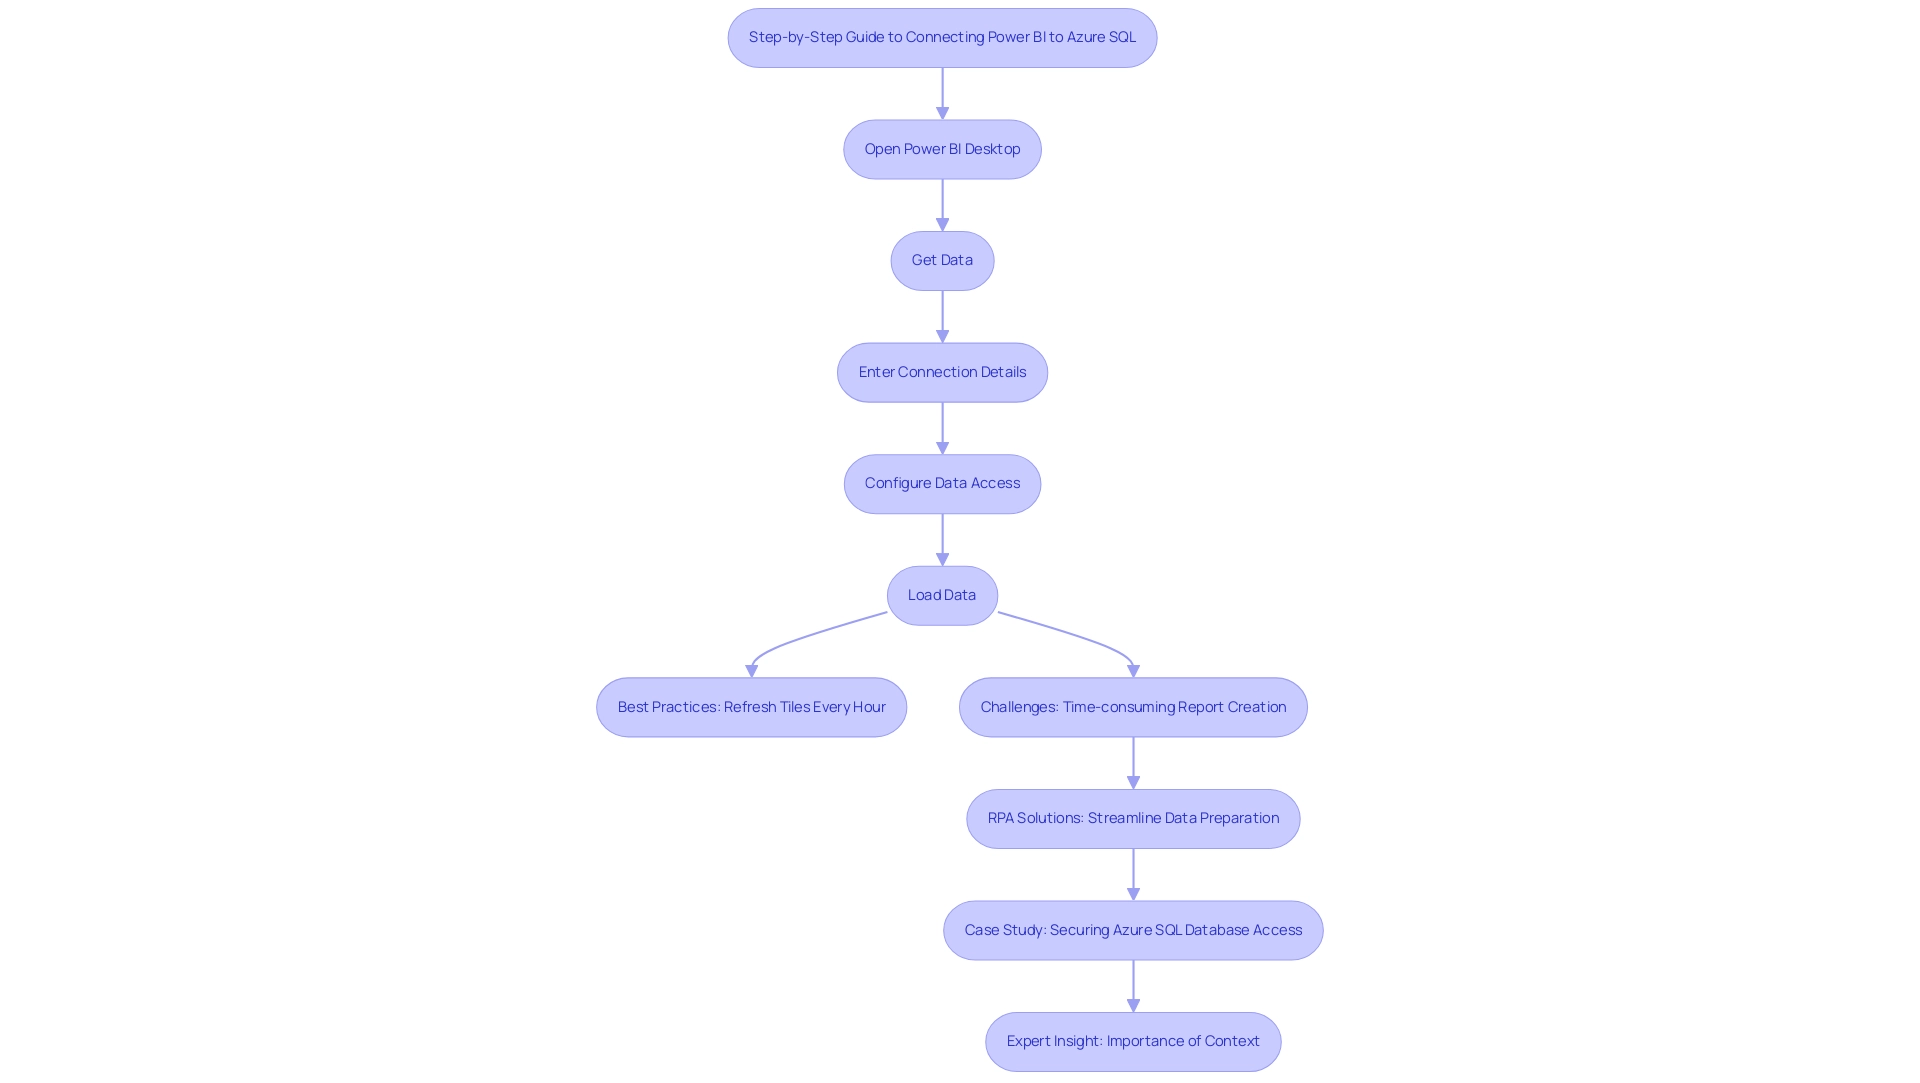
Troubleshooting Common Issues When Connecting Power BI to Azure SQL
When linking Power BI Azure SQL to SQL in the cloud, users may encounter several common challenges. Here are effective troubleshooting tips to help resolve these issues.
Common Issues:
-
Authentication Errors: Verify that the username and password entered are correct. Additionally, ensure that your account possesses the necessary permissions to access the SQL database. Statistics indicate that authentication errors account for a significant portion of connection issues, underscoring the importance of double-checking credentials. It’s crucial to specify passwords for the
ELASTIC_PASSWORDandKIBANA_PASSWORDvariables in the Docker Compose configuration to avoid similar authentication pitfalls. -
Network Connectivity: Confirm that your network settings allow connections to SQL. This includes reviewing firewall configurations to ensure that Power BI Azure SQL services are permitted to access your database. Recent information indicates that network connectivity issues impact approximately 30% of users, making it essential to prioritize this area first. Overcoming these connectivity challenges is vital for effectively leveraging Business Intelligence using Power BI Azure SQL.
-
Timeout Errors: If you encounter timeout errors, consider increasing the timeout settings within Power BI. Experts recommend monitoring query performance to identify potential bottlenecks. Alberto Morillo suggests that automating maintenance tasks and scaling to premium tiers before running index and statistics maintenance can significantly reduce maintenance time and improve performance. This aligns with the need for tailored solutions to enhance operational efficiency, including the use of Robotic Process Automation (RPA) to streamline these processes.
-
Information Load Failures: In cases where information fails to load, check the selected tables to ensure they are accessible and not locked by other processes. This issue can often arise during peak usage times, so scheduling loads during off-peak hours may help mitigate this problem. A case study on setting up a multi-node Elasticsearch cluster with Docker Compose illustrates how managing complex environments can enhance load efficiency, showcasing the importance of strategic planning in management.
-
Version Compatibility: Ensure that your version of Power BI Azure SQL Desktop is current to avoid compatibility issues with SQL. Keeping software updated is essential, as outdated versions can lead to unexpected errors and hinder performance. The entity’s distinctive worth in improving information quality and streamlining AI implementation highlights the significance of tackling these typical challenges for operational effectiveness.
By resolving these typical challenges with focused strategies, including the integration of RPA and customized AI solutions, users can enhance their experience and efficiency when linking Business Intelligence to SQL, ultimately utilizing Business Intelligence for informed decision-making. Creatum GmbH is committed to providing the necessary tools and support to navigate these challenges effectively.
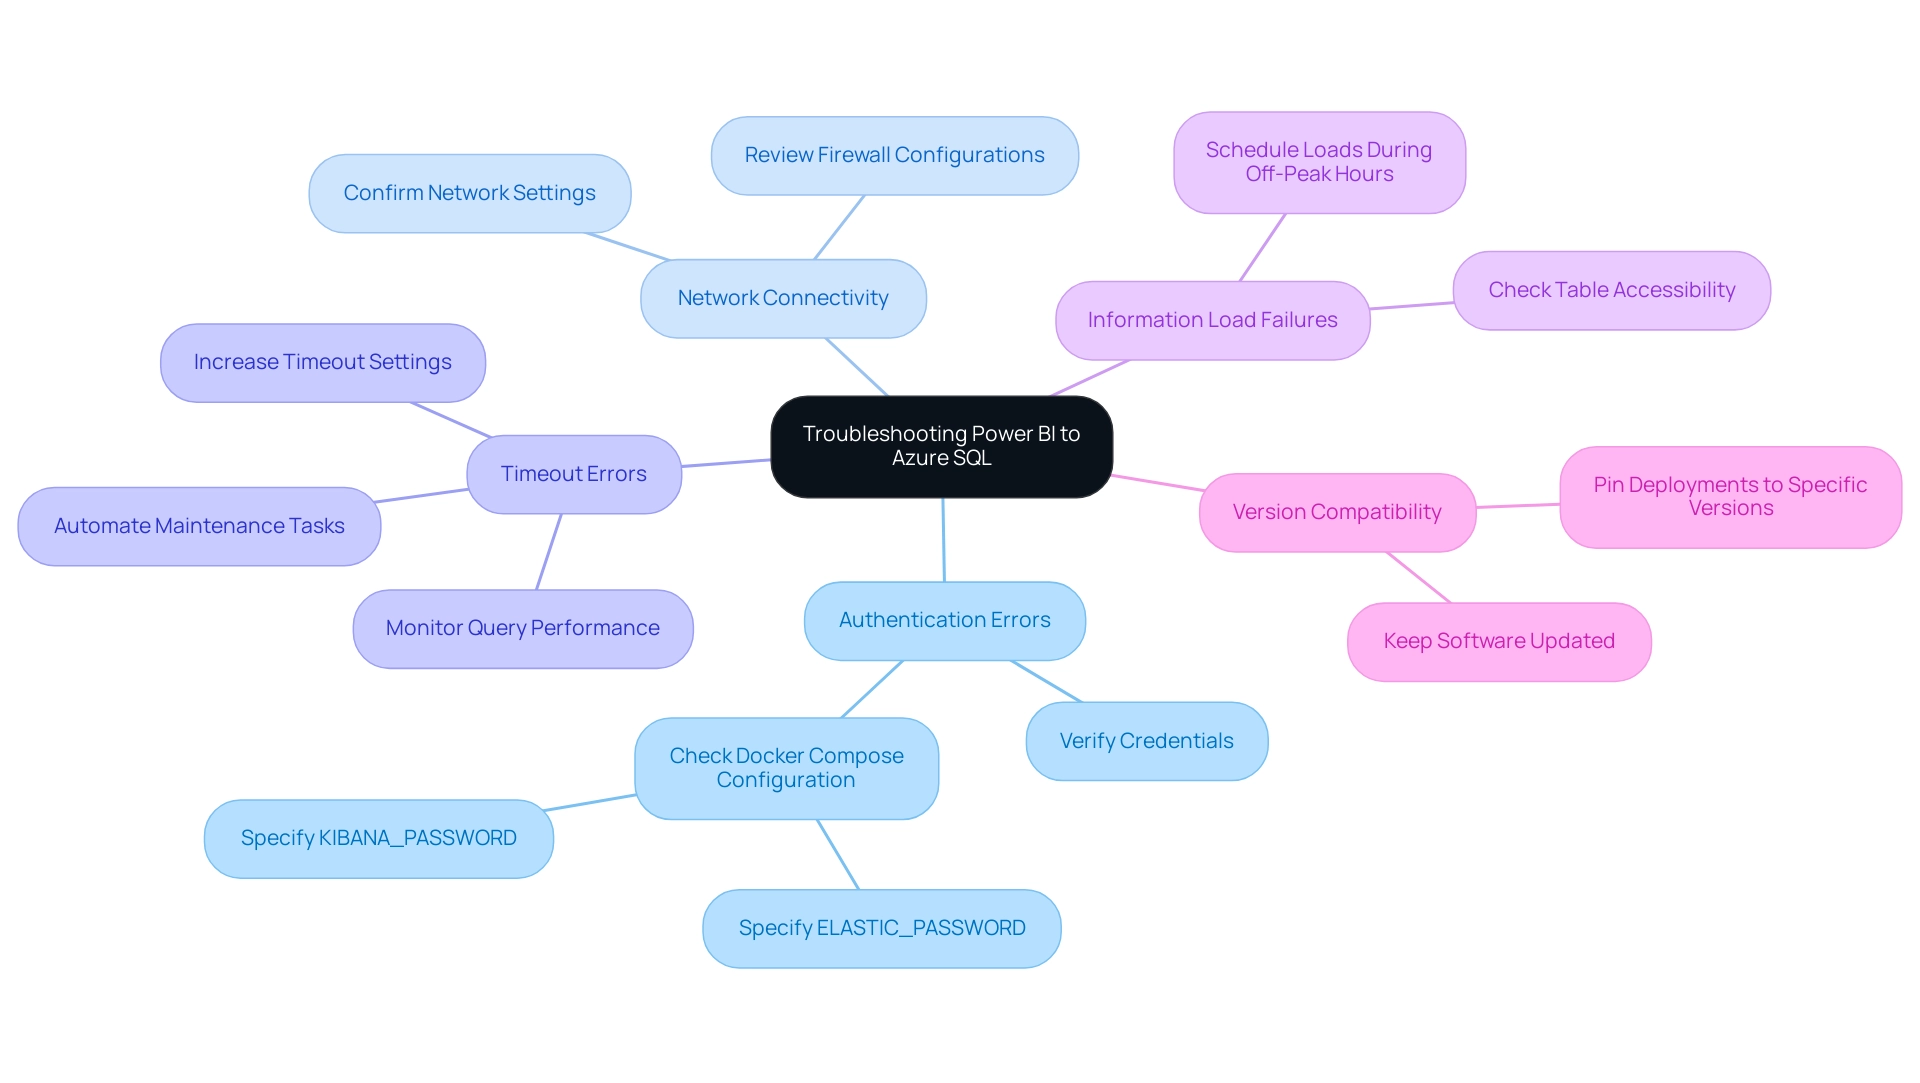
Advanced Configurations for Optimizing Power BI and Azure SQL Integration
Advanced Configurations:
- Implementing DirectQuery allows Power BI Azure SQL to connect directly, facilitating real-time access without the need to import information into Power BI. This mode is particularly advantageous for organizations managing large datasets, as it reduces latency and ensures users consistently work with the most up-to-date information.
Utilizing Robotic Process Automation (RPA) can streamline this process by automating information retrieval tasks, thereby enhancing operational efficiency in a rapidly evolving AI landscape. Information Refresh Settings: Properly configuring information refresh settings in Power BI is crucial for maintaining report accuracy. By establishing regular refreshes, organizations can guarantee their reports reliably represent the most recent information from SQL, improving decision-making processes based on current insights.
The integration of RPA can help automate these refresh schedules, reducing manual workload and allowing teams to focus on strategic initiatives.
- Query Folding: Employing query folding is a powerful method within Power BI Azure SQL that enables transformations to be executed at the source level. This approach not only reduces the volume of information transferred to Power BI but also significantly enhances performance, making it easier to manage complex queries efficiently.
By combining this with Business Intelligence tools, organizations can unlock deeper insights from their information, driving growth and innovation. Performance Monitoring: The SQL service offers comprehensive performance monitoring tools that assist in identifying and resolving bottlenecks in information retrieval and processing. By consistently examining performance metrics, organizations can enhance their queries and configurations, ensuring that BI reports remain responsive and efficient even as complexity escalates.
As Kashyap noted, the best performance improvements arise from techniques such as dual mode, aggregates, results caching, materialized views, and correct distribution of tables, all of which can be enhanced through RPA solutions.
Security Configurations: Enhancing security is paramount when integrating BI with SQL from Microsoft. Utilizing Active Directory for user administration guarantees that access to confidential information is regulated and observed. This safeguards organizational information while fostering trust among users who depend on BI for essential insights.
The significance of Business Intelligence and RPA in propelling insight-driven analysis cannot be exaggerated, as they collaborate to ensure organizations can make informed choices based on trustworthy information.
By embracing these advanced configurations, organizations can enhance their Power BI Azure SQL integration, transforming their visualization capabilities into effective tools for actionable insights. Real-world examples, such as the case study on optimizing BI for large datasets, demonstrate that organizations employing these strategies have successfully maintained fast, responsive, and scalable BI reports, ultimately supporting modern data-driven decision-making.
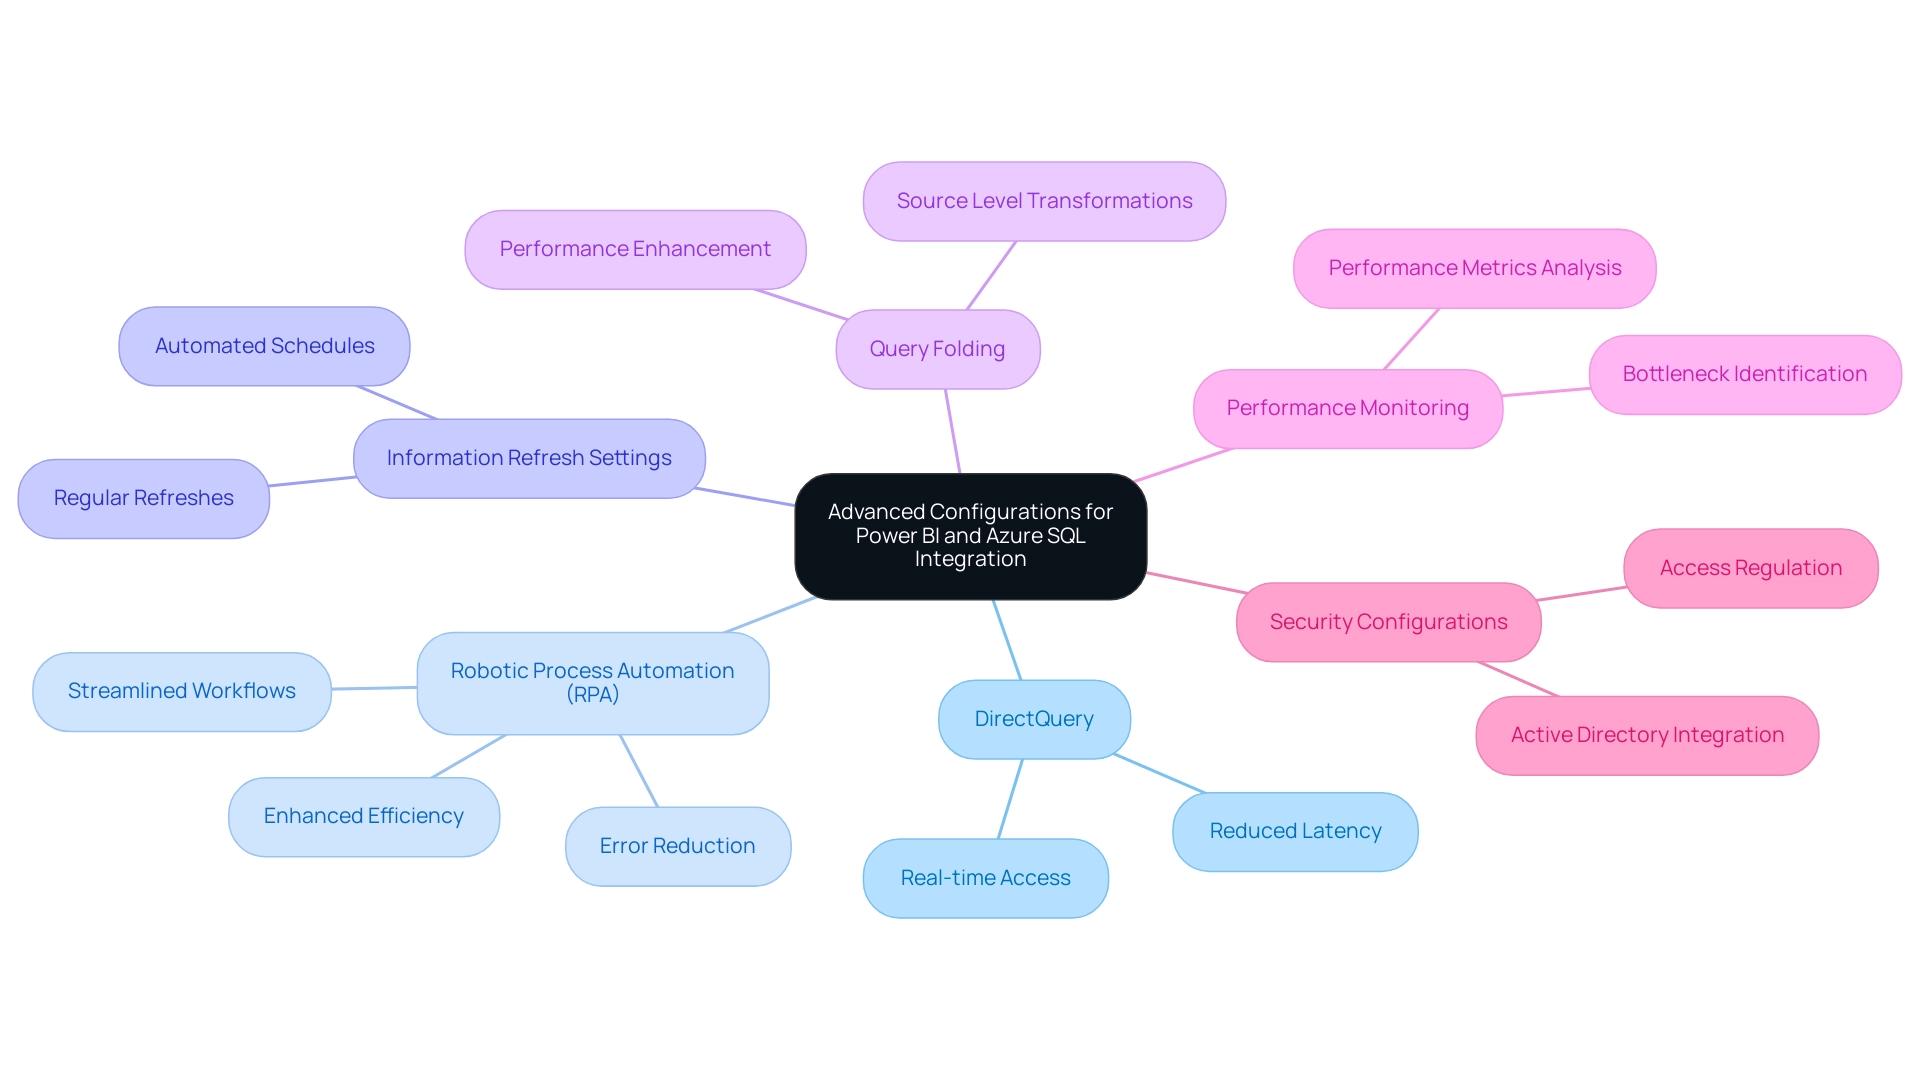
Key Takeaways and Next Steps for Power BI and Azure SQL Users
Linking BI to SQL can significantly enhance your analytical abilities, fundamentally transforming how you visualize and interpret information. Consider the essential takeaways:
-
Integration Benefits: Leveraging Power BI’s visualization strengths alongside Azure Synapse’s robust processing capabilities provides users with real-time information access and enhanced analytics, leading to more informed decision-making. This integration is increasingly essential, as IDC forecasts that by 2025, 75% of the world’s population will have at least one interaction every 18 seconds, underscoring the rising significance of analytics. Moreover, integrating Robotic Process Automation (RPA) can streamline manual workflows, allowing teams to focus on strategic analysis rather than repetitive tasks. Tailored AI solutions can also help navigate the overwhelming AI landscape, ensuring organizations effectively implement these technologies to meet their specific needs.
-
Preparation is Key: Before initiating the connection, ensure all necessary prerequisites and configurations are in place. This foundational step is crucial for a seamless integration experience and can help mitigate challenges associated with inconsistencies and time-consuming report creation. Understanding the specific challenges posed by the rapidly evolving AI landscape can further enhance this preparation.
-
Troubleshooting: Familiarize yourself with common issues that may arise during the connection process. Being prepared to address these challenges can save time and enhance efficiency, particularly in a rapidly evolving AI landscape where tailored solutions are essential.
-
Advanced Techniques: Explore advanced configurations that can optimize both performance and security. This not only enhances the user experience but also protects sensitive information, ensuring your organization can leverage Business Intelligence effectively for growth and innovation.
-
Next Steps: Begin implementing the connection within your workflows to harness the full potential of Power BI and Azure SQL. This integration enables your organization to convert raw information into actionable insights, as demonstrated in the case study titled ‘Business Intelligence Empowerment,’ where organizations successfully navigated the complexities of information to derive meaningful insights. Consider how RPA can further enhance operational efficiency by automating routine tasks associated with data management. Additionally, explore tailored AI solutions that can assist in navigating the complexities of the AI landscape, ensuring your organization remains competitive.
Furthermore, consider utilizing Power BI Embedded in Azure to enhance user experience by embedding interactive reports and dashboards in applications and websites. Continuously monitor and optimize your integration to improve performance and derive deeper insights. As organizations increasingly rely on data-driven strategies, staying ahead of the curve with your analytics capabilities is essential for sustained growth and innovation.
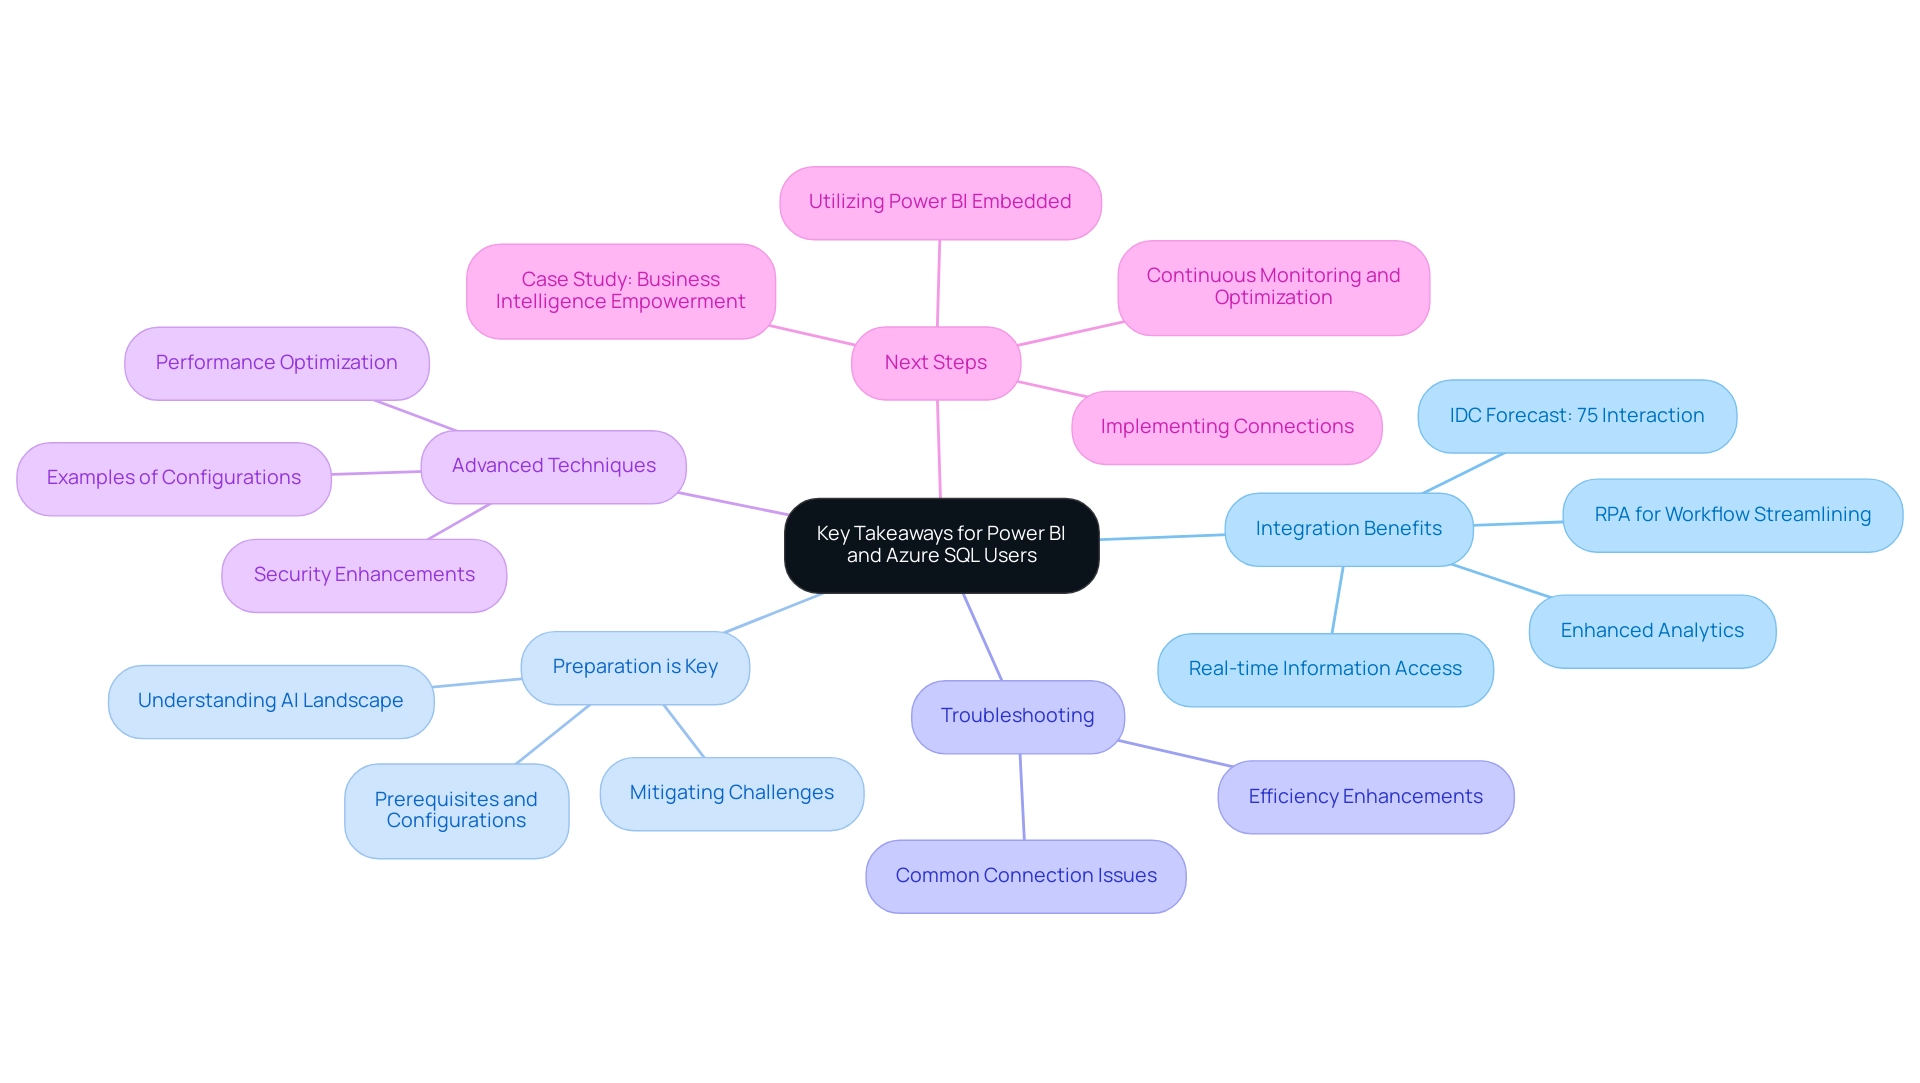
Conclusion
Unlocking the potential of Power BI and Azure SQL is essential for organizations aiming to thrive in a data-driven landscape. The seamless integration of these two powerful platforms enables real-time data access, enhanced analytics, and improved collaboration among teams. By understanding the key features and benefits of both Power BI and Azure SQL, businesses can harness their capabilities to make informed decisions and drive operational efficiency.
Preparation is vital for a successful connection between Power BI and Azure SQL. Adhering to the necessary prerequisites and configurations can significantly reduce challenges related to data inconsistencies and time-consuming report creation. Additionally, familiarizing oneself with common troubleshooting issues ensures a smoother integration process, allowing organizations to focus on deriving actionable insights from their data.
Adopting advanced configurations not only optimizes performance but also enhances security, safeguarding sensitive information while empowering users to leverage Business Intelligence effectively. As organizations prepare to implement these integrations, exploring the potential of Robotic Process Automation (RPA) and tailored AI solutions can further streamline operations and support strategic decision-making.
In conclusion, the integration of Power BI with Azure SQL stands as a transformative step for businesses seeking to capitalize on their data. By embracing these tools and continuously optimizing their use, organizations can foster a culture of data literacy and remain competitive in an increasingly complex environment. The time to act is now—transform raw data into meaningful insights and drive your organization towards sustained growth and innovation.
Frequently Asked Questions
What is Power BI and what are its main features?
Power BI is a robust business analytics tool that enables users to visualize information and share insights within organizations. Its key features include data visualization, seamless connectivity to various information sources, collaboration capabilities for sharing insights, and actionable guidance for informed decision-making.
How does Azure SQL complement Power BI?
Azure SQL enhances Power BI by providing scalability, integrated security for data protection, and seamless integration with other cloud services. This combination allows organizations to manage extensive datasets efficiently while ensuring optimal performance and compliance.
What benefits does integrating Power BI with Azure SQL offer?
Integrating Power BI with Azure SQL provides benefits such as real-time access to live information, improved analysis through advanced analytics capabilities, and enhanced collaboration by allowing teams to share up-to-date reports and dashboards.
Can you provide examples of use cases for Power BI and Azure SQL integration?
Use cases include sales reporting for analyzing trends in real-time, financial analysis for monitoring performance and making timely adjustments, and operational efficiency through automation of data retrieval processes, which streamlines reporting and reduces manual handling.
What recent enhancements have been made to Power BI and Azure SQL integration?
Recent enhancements include improved refresh rates and consistency, enabling users to visualize report usage metrics effectively. This helps organizations identify underutilized reports and optimize resource allocation.
What limitations exist regarding the usage metrics report in Power BI?
The usage metrics report only includes reports that have been opened in the past 30 days and does not support reports in ‘My Workspace,’ which may lead to specific limitations regarding consistency and refresh issues.
Why is information literacy important in the context of BI and SQL integration?
Information literacy is crucial as it ensures that all stakeholders are aligned with the same up-to-date information, promoting informed decision-making across the organization. A Deloitte survey highlighted that 49% of executives prioritize information literacy for enhancing decision-making capabilities.
What trends are expected in the use of AI for predictive analytics among organizations?
By 2023, 73% of organizations plan to implement AI for predictive analytics, indicating a shift towards more proactive management strategies and the need for advanced analytics capabilities in business operations.
Overview
This article explores the effective integration of R with Power BI, aimed at enhancing data analysis and visualization capabilities. By mastering both tools, users can harness R’s advanced statistical methods and custom visualizations alongside Power BI’s user-friendly interface. This powerful combination not only improves decision-making but also boosts operational efficiency.
Consider how your organization currently approaches data analysis. Are you utilizing the full potential of R and Power BI together? By leveraging these tools, you can transform your data insights into actionable strategies that drive success.
Ultimately, integrating R with Power BI empowers users to make informed decisions swiftly. The synergy between R’s analytical strength and Power BI’s accessibility leads to a more efficient workflow and better outcomes. Embrace this integration to elevate your data analysis capabilities.
Introduction
In the realm of data analysis, the integration of R and Power BI stands out as a transformative strategy for organizations aiming to enhance their decision-making processes. R, renowned for its robust statistical capabilities, complements Power BI’s powerful visualization tools, creating a synergy that converts raw data into actionable insights.
As businesses navigate an increasingly data-driven landscape, mastering these tools effectively becomes imperative. This article explores the unique strengths of R and Power BI, providing insights into their integration, practical applications, and advanced techniques that can unlock their full potential.
By harnessing these tools, organizations can streamline their data analysis processes, driving innovation and growth in a rapidly evolving marketplace.
Understanding R and Power BI: A Primer
R is a powerful programming language and environment specifically designed for statistical computing and graphics, making it a preferred choice among statisticians and data miners for comprehensive data evaluation. In contrast, Microsoft’s business analytics tool serves as a robust resource that empowers users to visualize data and disseminate insights across their organizations. Recognizing the unique strengths of each tool is crucial:
- R excels in conducting complex statistical analyses and managing data, including organizing datasets and effectively presenting results.
- BI shines in delivering strong visualization capabilities through an intuitive user interface.
The synergy of using R with Power BI can significantly enhance analysis and reporting processes. Creatum GmbH amplifies this integration by providing tailored dashboards that deliver real-time insights, seamless data integration from various sources, and expert support to maximize the potential of your data. Notably, our services include a 3-Day BI Sprint for rapid report creation and the General Management App for comprehensive management and intelligent reviews.
A recent survey revealed that R maintains a prominent position in the programming landscape, ranking 17th on the TIOBE Index as of October 2023, highlighting its relevance in the field of analysis. This statistic underscores the importance of mastering both R and BI, particularly through the integration of R with Power BI, to fully leverage their capabilities.
To embark on this journey, it is advisable to familiarize yourself with the essential functionalities of using R with Power BI. Engaging with introductory tutorials or documentation available on their respective platforms can help establish a solid foundation. Furthermore, Creatum has successfully empowered businesses to transform raw data into actionable insights, as demonstrated in the case study titled ‘Business Intelligence Empowerment,’ which showcases real-world applications of our services.
By mastering both R and Business Intelligence, you can unlock the full potential of your data, transforming raw details into actionable insights that drive informed decision-making.
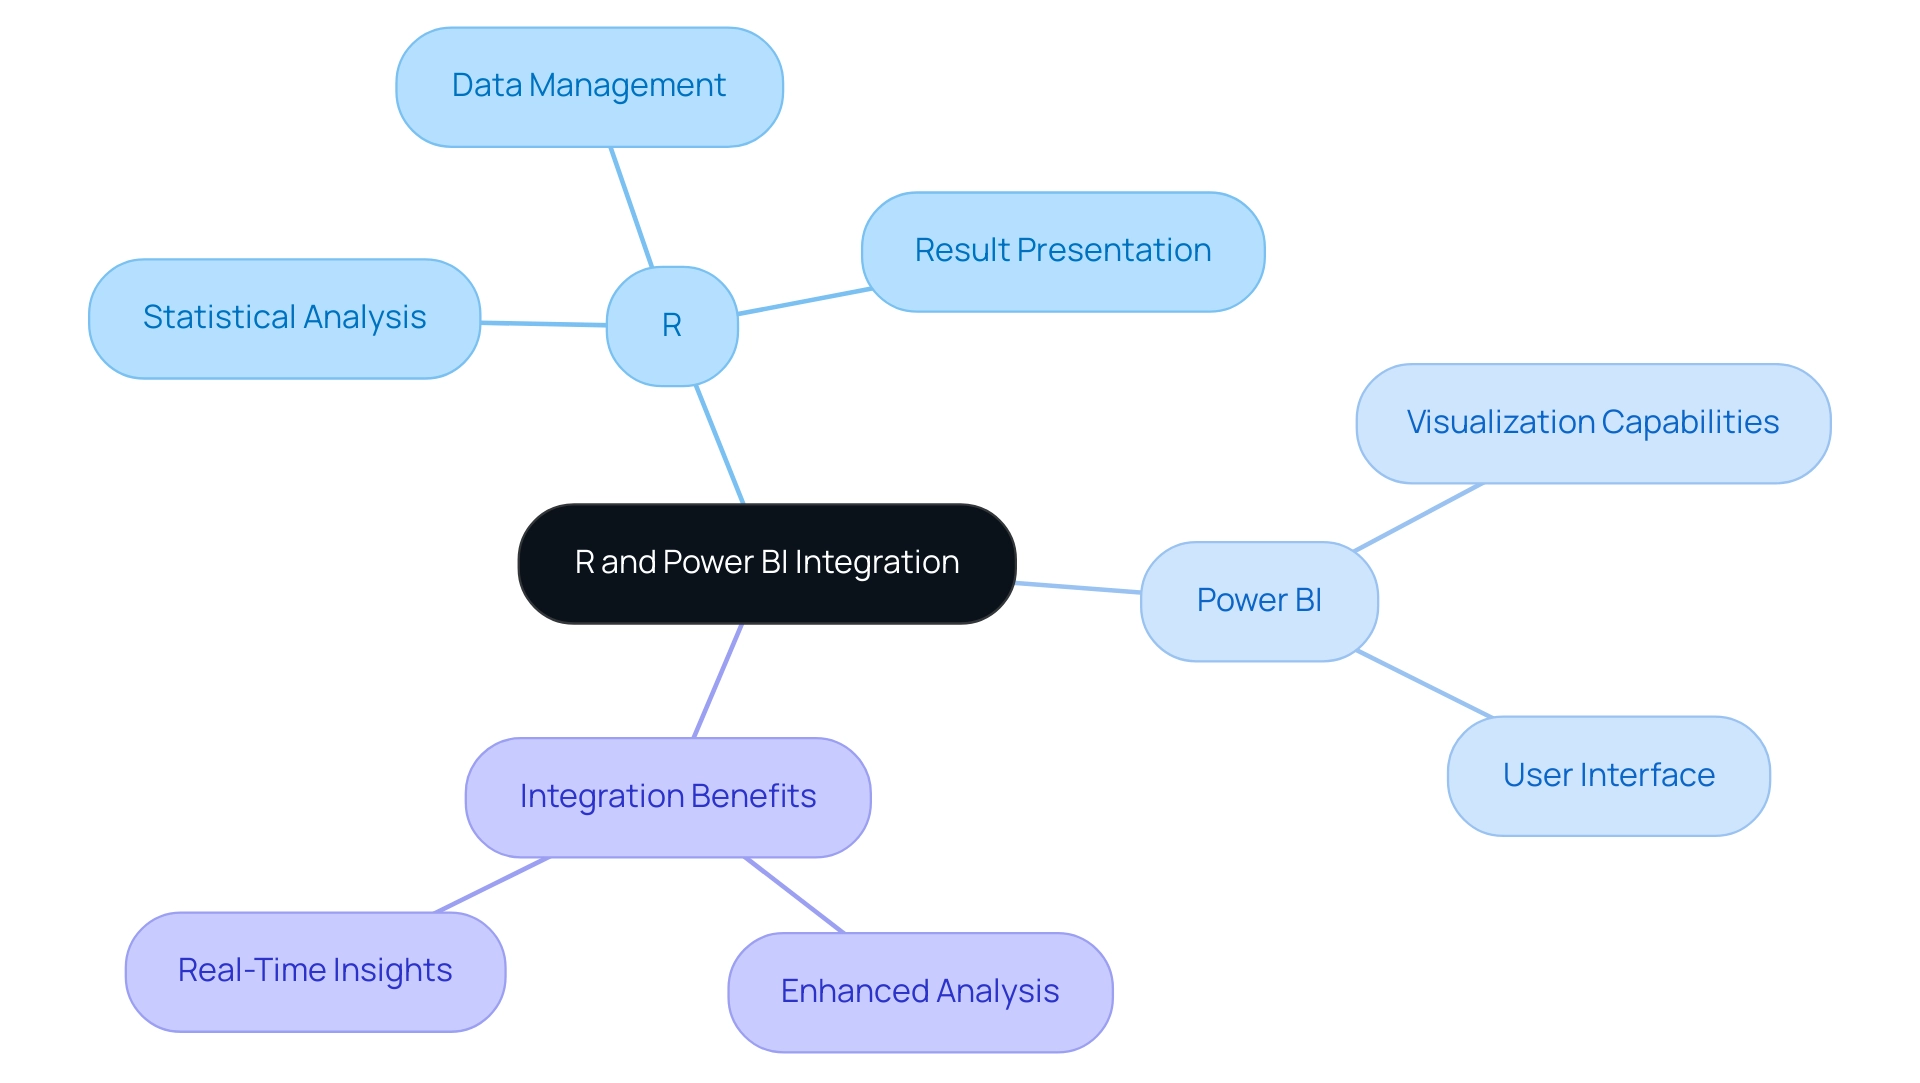
The Advantages of Integrating R with Power BI
Integrating R with Power BI unlocks a multitude of advantages that significantly enhance data analysis capabilities, particularly in the context of Business Intelligence and RPA.
-
Advanced Analytics: R is renowned for its extensive collection of statistical and machine learning methods, seamlessly applied to datasets within BI. This integration empowers analysts to uncover deeper insights and trends that might otherwise remain obscured, effectively addressing the challenges of extracting meaningful insights in a data-rich environment.
-
Custom Visualizations: By leveraging R scripts, users can create highly tailored visualizations that surpass the standard offerings of BI. This flexibility enables the development of sophisticated graphics that better represent complex information narratives, ultimately enhancing the overall quality of reporting.
-
Information Transformation: R excels in executing complex information transformations, streamlining processes that may prove cumbersome when relying solely on BI’s built-in tools. This capability allows users to prepare their data more efficiently, ensuring it is primed for analysis and mitigating issues related to data inconsistencies.
-
Enhanced Reporting: Harnessing R’s analytical prowess enables users to produce reports that merge the interactivity of BI dashboards with the depth of R’s analytical capabilities. This combination results in comprehensive reporting that meets the diverse needs of stakeholders, effectively addressing the time-consuming nature of report creation.
-
Real-World Applications: A notable case study underscores the importance of error handling in R visuals within Business Intelligence. Users may encounter errors when executing R programs due to incorrect code or missing packages. BI provides detailed error messages, allowing users to troubleshoot effectively and refine their scripts for successful visualizations.
-
Current Trends: As businesses increasingly adopt advanced analytics, the integration of R with Business Intelligence is emerging as a standard practice. Recent statistics reveal that organizations leveraging this integration report improved decision-making capabilities and enhanced operational efficiency, reinforcing the significance of BI in driving growth.
-
Expert Opinions: Data analysts consistently advocate for utilizing R with Power BI in Business Intelligence, citing its ability to elevate analytical depth and reporting quality. The consensus is clear: employing R with Power BI not only enhances functionality but also delivers substantial value in data-driven decision-making.
-
Security Considerations: Users must trust the origin of R code due to potential security risks. Ensuring that scripts originate from reliable sources can mitigate vulnerabilities associated with executing external code, which is essential for maintaining data governance.
-
Technical Setup: For users looking to integrate R with Business Intelligence, the local installation path of R is typically found at
C:\Program Files\R Open\R-3.4.4. This information is crucial for correctly setting up the environment. -
BI Services: Creatum GmbH offers a 3-Day BI Sprint, enabling users to swiftly create professionally designed reports, along with a General Management App for comprehensive management and smart reviews. These services enhance the overall reporting experience and operational efficiency.
As Hemendra Singh, Director and Co-founder of The NineHertz, emphasizes, “Staying updated with the latest trends and technologies is vital for leveraging the full potential of analytics.” These compelling advantages position the integration of R with Business Intelligence as a crucial strategy for analysts aiming to maximize insights and reporting capabilities in today’s information-rich environment.
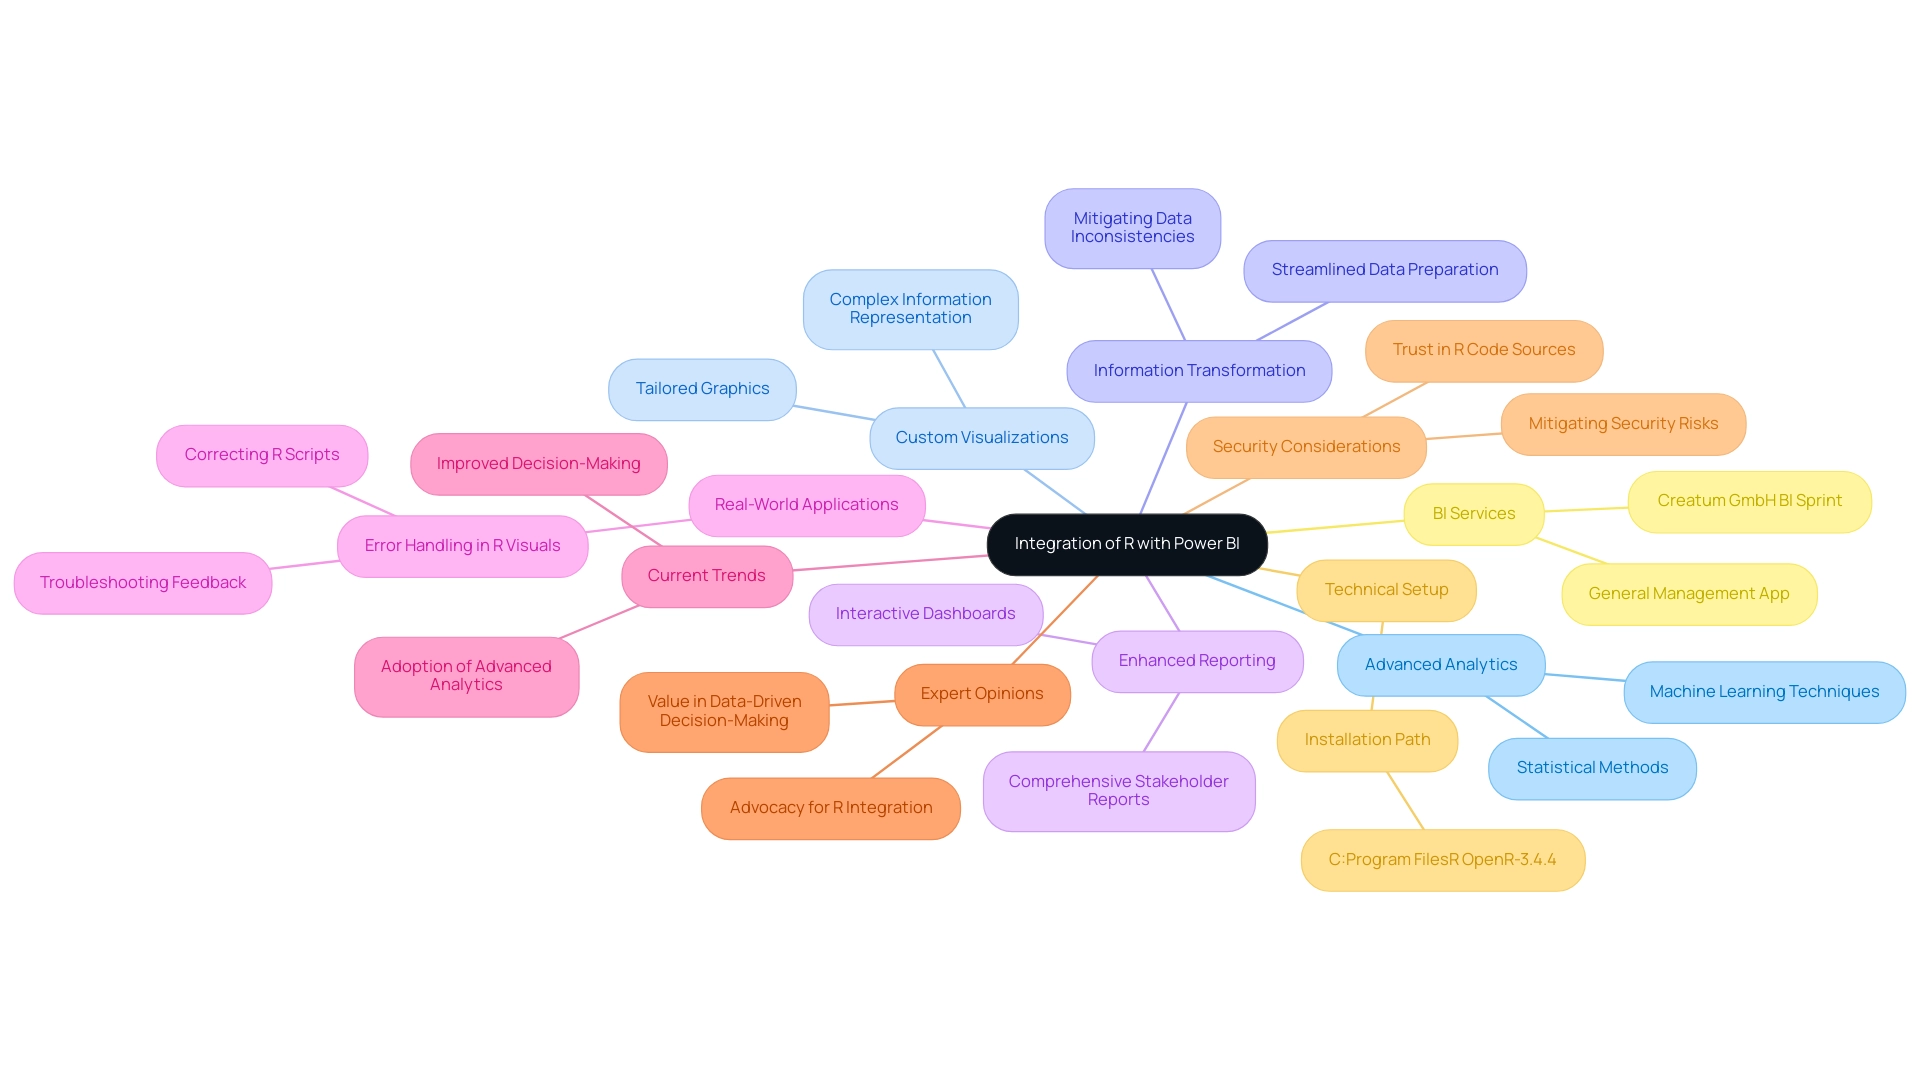
Setting Up R in Power BI: A Step-by-Step Guide
To effectively integrate R into BI for advanced data analysis, follow these detailed steps:
-
Install R: Begin by downloading R from the Comprehensive R Archive Network (CRAN). It is crucial to select the version that corresponds to your operating system to ensure compatibility.
-
Install RStudio (Optional): Although not mandatory, RStudio offers a more intuitive interface for writing and testing R scripts, which can enhance your productivity and ease of use.
-
Configure BI: Launch BI Desktop and navigate to ‘File’ > ‘Options and settings’ > ‘Options’. Under the ‘R scripting’ section, specify the installation path of R. This step is essential for BI to recognize your R installation.
-
Enable R Visuals: In the ‘Visualizations’ pane of BI, locate and select the R visual icon. If R visuals are not enabled, you will be prompted to do so. This feature enables you to utilize R’s powerful visualization capabilities directly within BI using R with Power BI.
-
Test the Setup: To confirm that your integration is successful, create a simple R visual by entering a basic R code in the R visual editor. This test will confirm that the setup is operating properly and prepared for more intricate evaluations.
By following these steps, you will create a strong environment for using R with Power BI to integrate R scripts into your BI reports, thus improving your data examination abilities.
Current Best Practices: As of 2025, it is recommended to regularly update both R and Power BI to leverage the latest features and improvements. Moreover, using R with Power BI for statistical examination can significantly enhance data-driven decision-making, as highlighted by case studies like ‘Building Business Reports with R,’ where organizations effectively aggregated and summarized key information for informed decisions.
For instance, businesses that implemented R in their reporting processes reported improved clarity and effectiveness in their decision-making frameworks.
Statistics on R Usage: Recent studies indicate that R is increasingly favored in business environments for its statistical prowess, with a notable percentage of scientists endorsing its capabilities for complex analysis tasks. For example, to display 6 plots on one page by filling each column in order, use par(mfcol=c(3,2)).
This trend highlights the significance of using R with Power BI to enhance insights in business intelligence tools. As Branimir K Hackenberger from the Department of Biology at Josip Juraj Strossmayer University stated, ‘Although unfriendly, R is perhaps today’s best tool for statistical information processing.’ This emphasizes R’s proficiency in information examination.
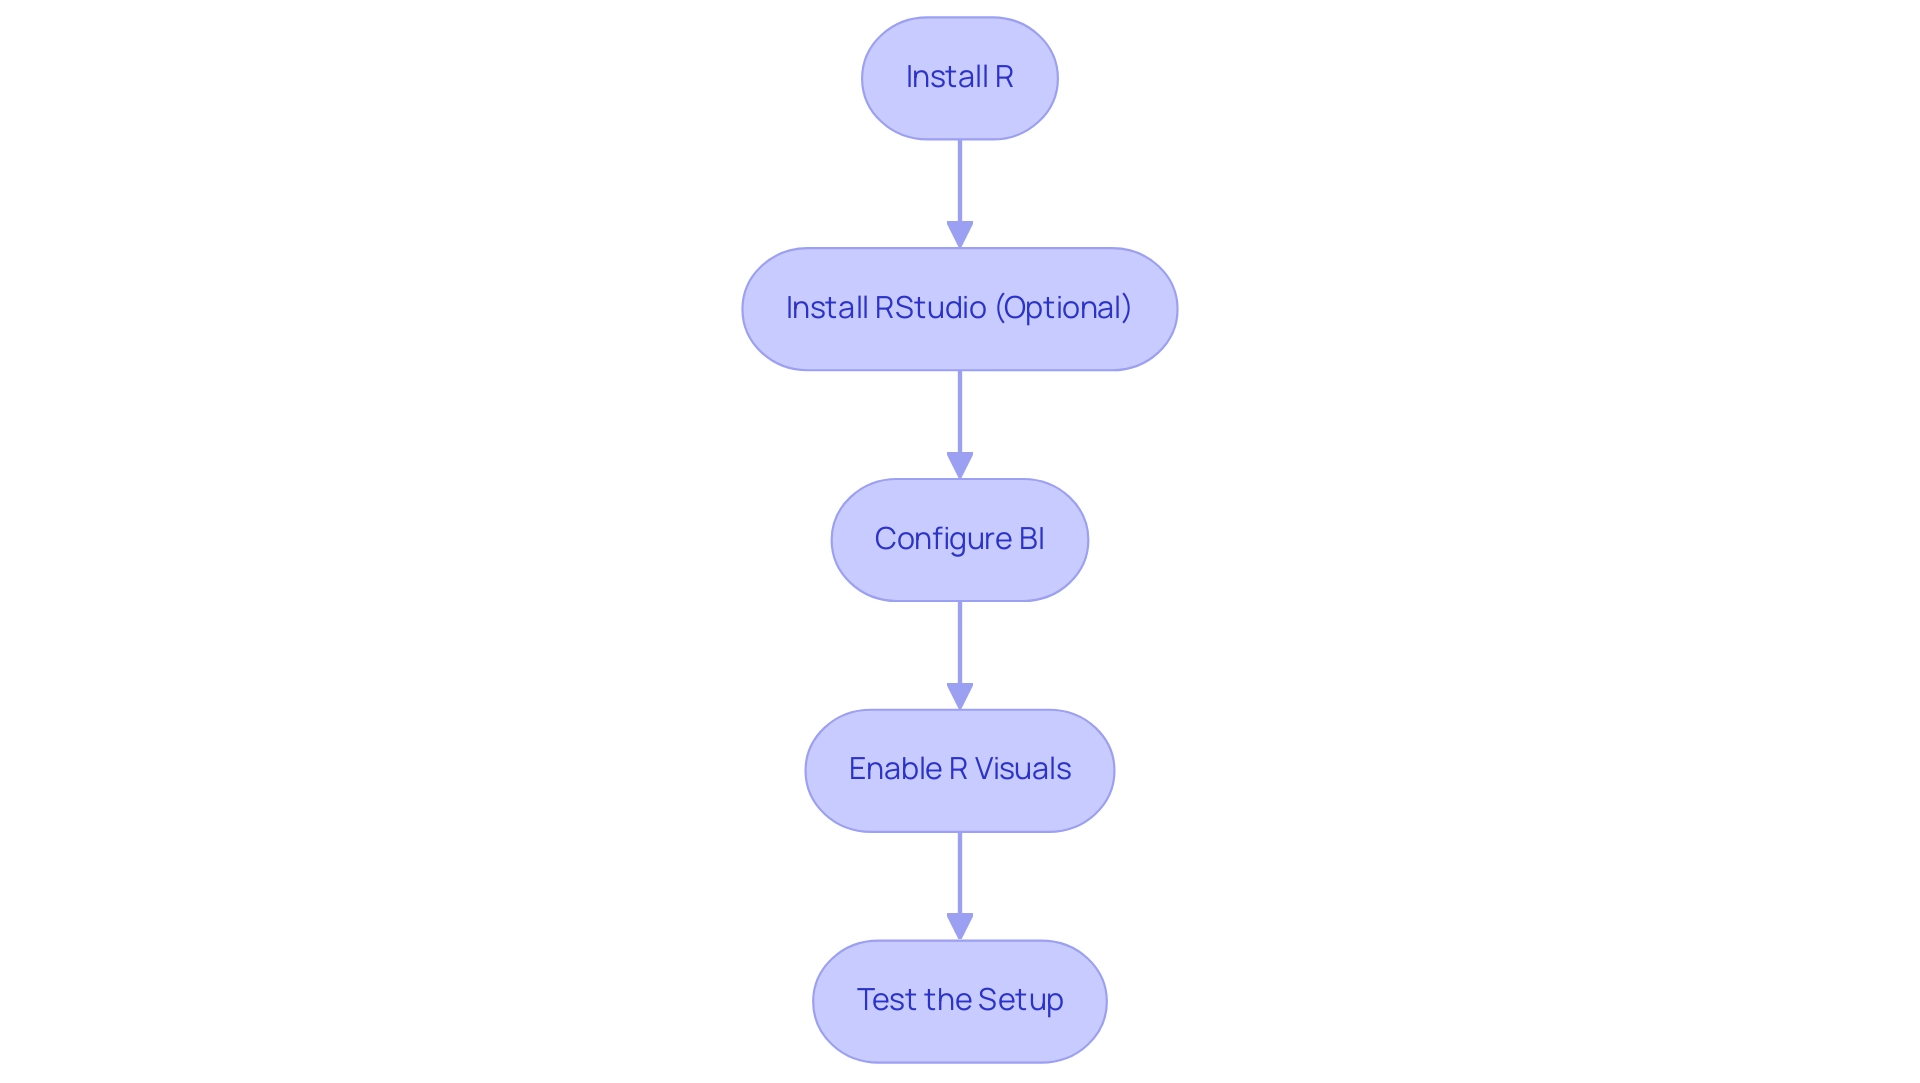
Creating Dynamic Visualizations with R Scripts in Power BI
Generating dynamic visual representations using R with Power BI in Business Intelligence is a powerful method to enhance analysis and reporting. This process transforms raw data into meaningful insights that drive informed decision-making. In today’s data-driven landscape, effectively leveraging Business Intelligence tools like Power BI, alongside RPA solutions, can significantly boost operational efficiency while addressing challenges such as time-consuming report creation and data inconsistencies.
To successfully integrate R into your Power BI reports, follow these steps:
- Select the R Visual: Start by clicking on the R visual icon in your Power BI report to add it to your canvas.
- Input Data: Drag and drop the relevant fields into the ‘Values’ section of the R visual, ensuring you have the necessary data for your analysis.
- Write R Code: In the R code editor, develop your R code to generate the desired visualization. Utilizing libraries such as
ggplot2can greatly enhance your plotting capabilities, allowing for sophisticated and visually appealing graphics. As Daniel J. Denis noted, “Of all the graphic forms used today, the scatter plot is arguably the most versatile, polymorphic, and generally useful invention in the history of statistical graphics.” - Run the Script: Execute your R script by clicking ‘Run’. The visual will render based on the information you provided, showcasing the insights derived from your analysis.
- Customize the Visual: Tailor the visual’s properties within Power BI to enhance its appearance and interactivity, making it more engaging for your audience.
By implementing these steps, you can create compelling and interactive visualizations using R with Power BI, leveraging R’s advanced graphical capabilities. This approach not only enhances the clarity of your presentation but also aligns with current trends in visualization, facilitating better decision-making and operational efficiency. Dynamic data visualizations are crucial in identifying trends, aiding business leaders in understanding data relationships and acting accordingly.
For instance, the Big Mac Index case study illustrates how dynamic visualizations can effectively convey complex relationships and trends over time, further emphasizing the value of integrating R into your BI reports.
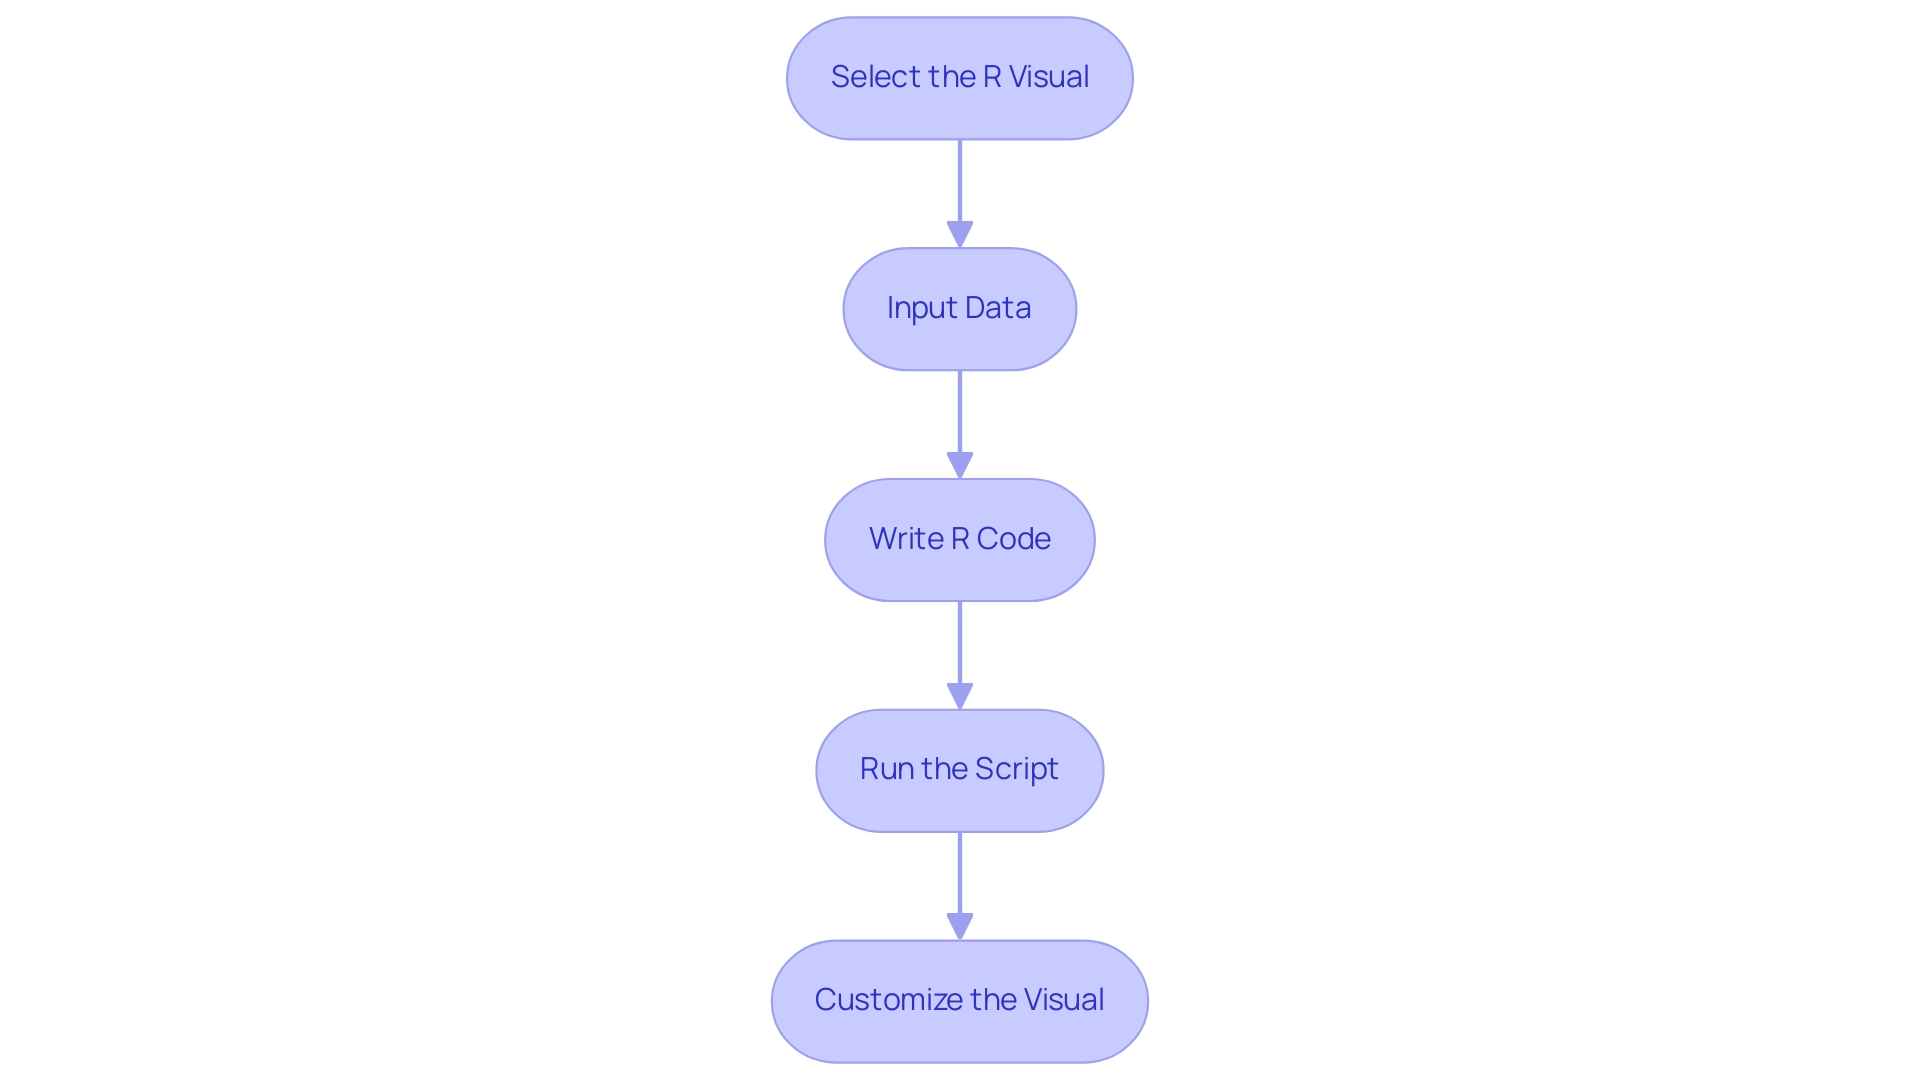
Overcoming Challenges: Common Issues with R in Power BI
Integrating R with Power BI presents several challenges that users must be prepared to address.
-
Performance Issues: R scripts can be resource-intensive, often leading to significant slowdowns in BI. To mitigate this, optimizing your R code and limiting the amount of information processed is crucial. Statistics suggest that BI can manage up to 30,000 rows effectively, so remaining within this limit can enhance performance. This optimization aligns with the principles of Robotic Process Automation (RPA), which aims to streamline workflows and boost efficiency.
-
Information Type Conflicts: A common issue arises when BI modifies information types during import, potentially causing errors in R routines. To prevent this, ensure that data types are explicitly defined in Power BI before executing R code. This proactive approach not only prevents integration headaches but is also essential for tailoring AI solutions that meet specific business needs.
-
Missing Packages: If your R program relies on specific packages, verifying their installation in your R environment is essential. Utilize the
install.packages()function to add any missing libraries, ensuring that your scripts run smoothly without interruptions. This step is vital for leveraging Business Intelligence effectively, as it ensures all necessary tools are available for informed decision-making. -
Visual Rendering Issues: Occasionally, R visuals may fail to render correctly within BI, often due to errors in the R code or invalid plot outputs. Consistently examining your code for precision can assist in addressing these problems, ensuring that the insights obtained from your information are actionable and clear.
By understanding these common challenges and implementing best practices, users can effectively troubleshoot and optimize their processes using R with Power BI. For instance, a case study contrasting R and BI for visualization emphasizes that BI’s intuitive interface and seamless integration with external sources greatly enhance the capacity to present information visually, facilitating stakeholders’ understanding of intricate concepts. This underscores the importance of selecting the right tool for effective data analysis.
As Hemendra Singh, Director and Co-founder of The NineHertz, observes, “I am having a keen interest in the latest trends and technologies that are emerging in different domains,” highlighting the necessity for businesses to stay updated with efficient tools such as BI.
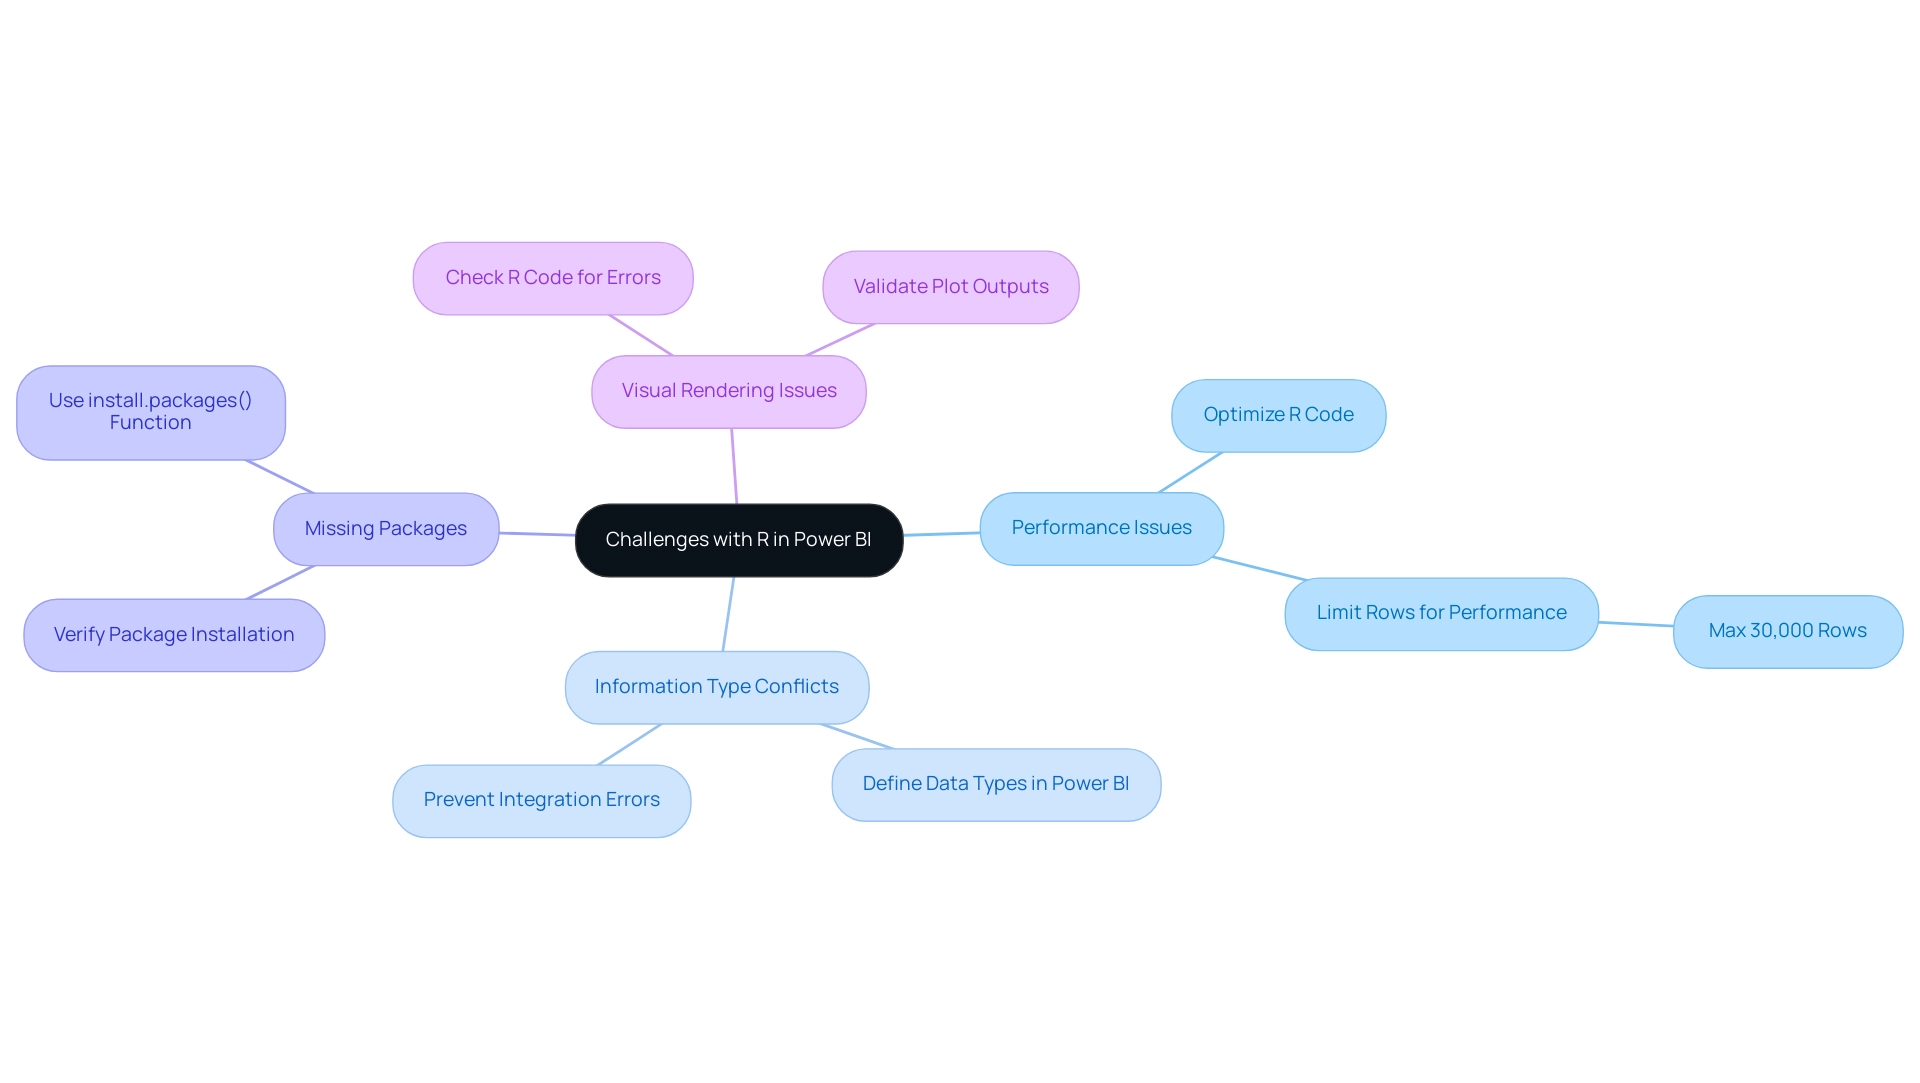
Advanced Techniques: Maximizing R’s Potential in Power BI
To fully harness the capabilities of R within Business Intelligence, consider implementing the following advanced techniques:
-
Custom Functions: Develop custom R functions to encapsulate intricate logic, allowing for reuse across various reports. This not only streamlines your workflow but also enhances consistency in your analysis. As noted by Joseph Larmarange, ‘The returned table is compatible with all gtsummary features applicable to a tbl_summary object, like add_overall(), modify_footnote_header(), and bold_labels(). However, some of them could be inappropriate in such case.’ This underscores the importance of understanding the compatibility of custom functions with various features in R.
-
Dynamic Parameters: Incorporate parameters in your R scripts to create dynamic visuals that adapt to user inputs in Business Intelligence. This interactivity can significantly enhance user experience and engagement with the information, aligning with our goal of improving reporting and actionable insights through our BI services.
-
Integrating Machine Learning: Utilize R’s robust machine learning libraries, such as
caretandrandomForest, to construct predictive models directly within Power BI. This integration enables real-time insights and supports information-driven decision-making, crucial for addressing inconsistencies and governance challenges in business reporting. -
Advanced Information Manipulation: Leverage R’s powerful information manipulation capabilities through packages like
dplyrto preprocess information effectively before visualization. This step is crucial for ensuring information quality and relevance in your reports, ultimately enhancing operational efficiency. -
Interactive Visuals: Explore visualization libraries such as
plotlyto create interactive graphics that engage users and enable deeper exploration of the data.
By adopting these advanced techniques, users can unlock R’s full potential in Business Intelligence using R with Power BI, leading to more insightful evaluations and ultimately driving growth and innovation in their organizations. A case study on business intelligence empowerment illustrates how transforming raw information into actionable insights can significantly enhance decision-making processes, reinforcing the value of these techniques in a rich information environment. Furthermore, the effectiveness of these techniques is supported by a statistic indicating a 95% confidence interval for the mean difference ranging from 0.2557008 to 0.8825708, underscoring their impact on operational efficiency and the importance of leveraging RPA to automate manual workflows.
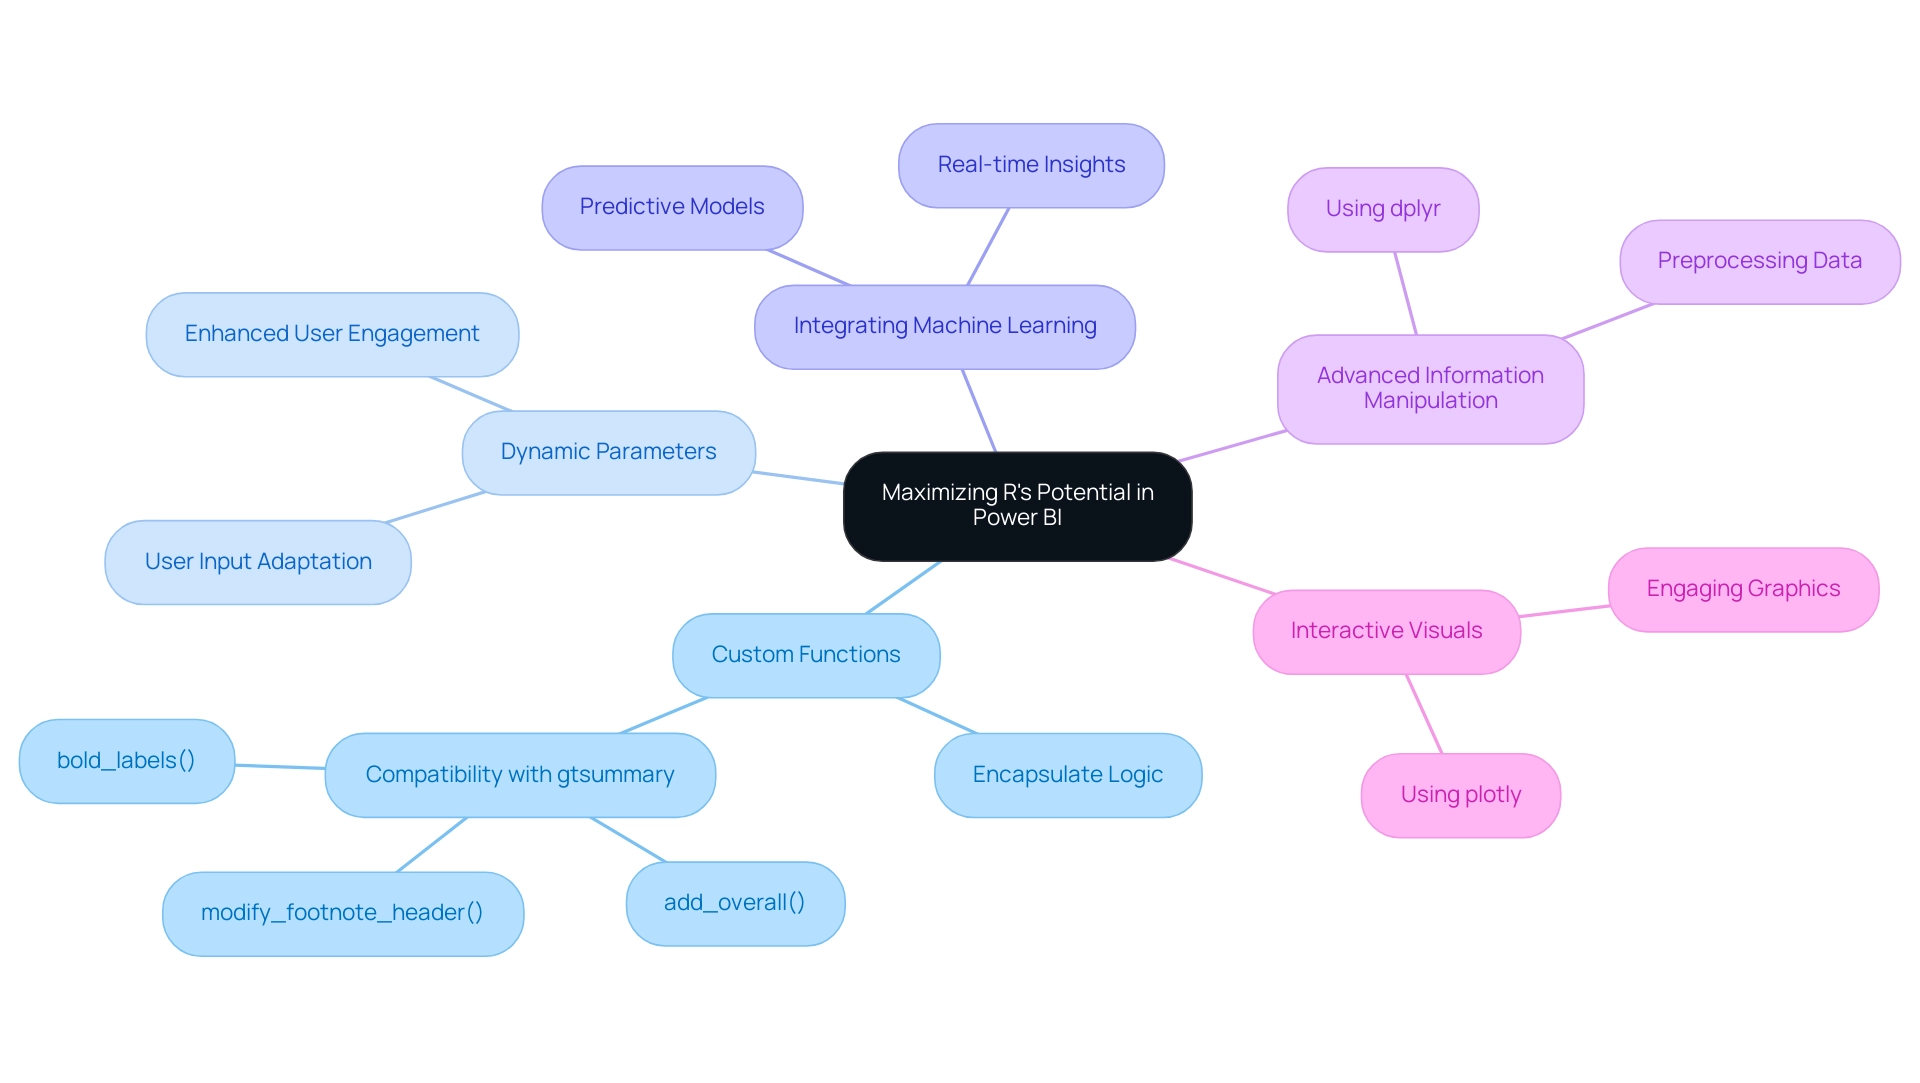
Key Takeaways: Mastering Data Insights with R and Power BI
Utilizing R with Power BI unlocks a wealth of capabilities for information exploration and visualization, significantly enhancing the decision-making process within organizations. Key takeaways from this integration include:
- Enhanced Analytical Power: R amplifies BI’s analytical capabilities, enabling advanced statistical evaluations and the creation of custom visualizations tailored to specific business needs.
- Seamless Setup: Setting up R in BI is user-friendly; it requires only proper installation and configuration to get started.
- Dynamic Visualizations: Users can leverage R scripts to develop dynamic and interactive visualizations, greatly enhancing reporting capabilities and providing deeper insights into trends.
- Optimizing Integration: Awareness of common challenges and the application of advanced techniques can significantly optimize the integration process, leading to improved insights.
Moreover, BI supports natural language queries, allowing users to inquire about their information using conversational language, further enhancing its user-friendly nature. The current trend indicates that organizations are increasingly adopting tools such as BI, with its mobile applications enabling access to reports and dashboards while traveling, facilitating real-time decision-making. As companies strive to excel in information interpretation, using R with Power BI emerges as a vital approach for transforming raw information into practical insights.
This method not only enhances operational efficiency but also aligns with the broader objective of utilizing information for strategic growth and innovation.
Creatum’s Business Intelligence Sprint service exemplifies this transformative impact, as highlighted by client testimonials. For instance, Sascha Rudloff from PALFINGER Tail Lifts GmbH noted that the sprint not only delivered a readily usable Power BI report but also greatly expedited their Power BI development, surpassing expectations and improving their information evaluation approach. By mastering these tools, organizations can enhance their data analysis processes, ultimately leading to more informed and impactful decision-making.
Furthermore, the AI Workshop for Organizational Growth illustrates how organizations can effectively implement AI technologies that align with their specific goals, reinforcing the importance of this integration. Leveraging Robotic Process Automation (RPA) alongside these tools can further streamline workflows, reduce manual errors, and free up teams for more strategic tasks, ensuring that businesses remain competitive in a rapidly evolving AI landscape.
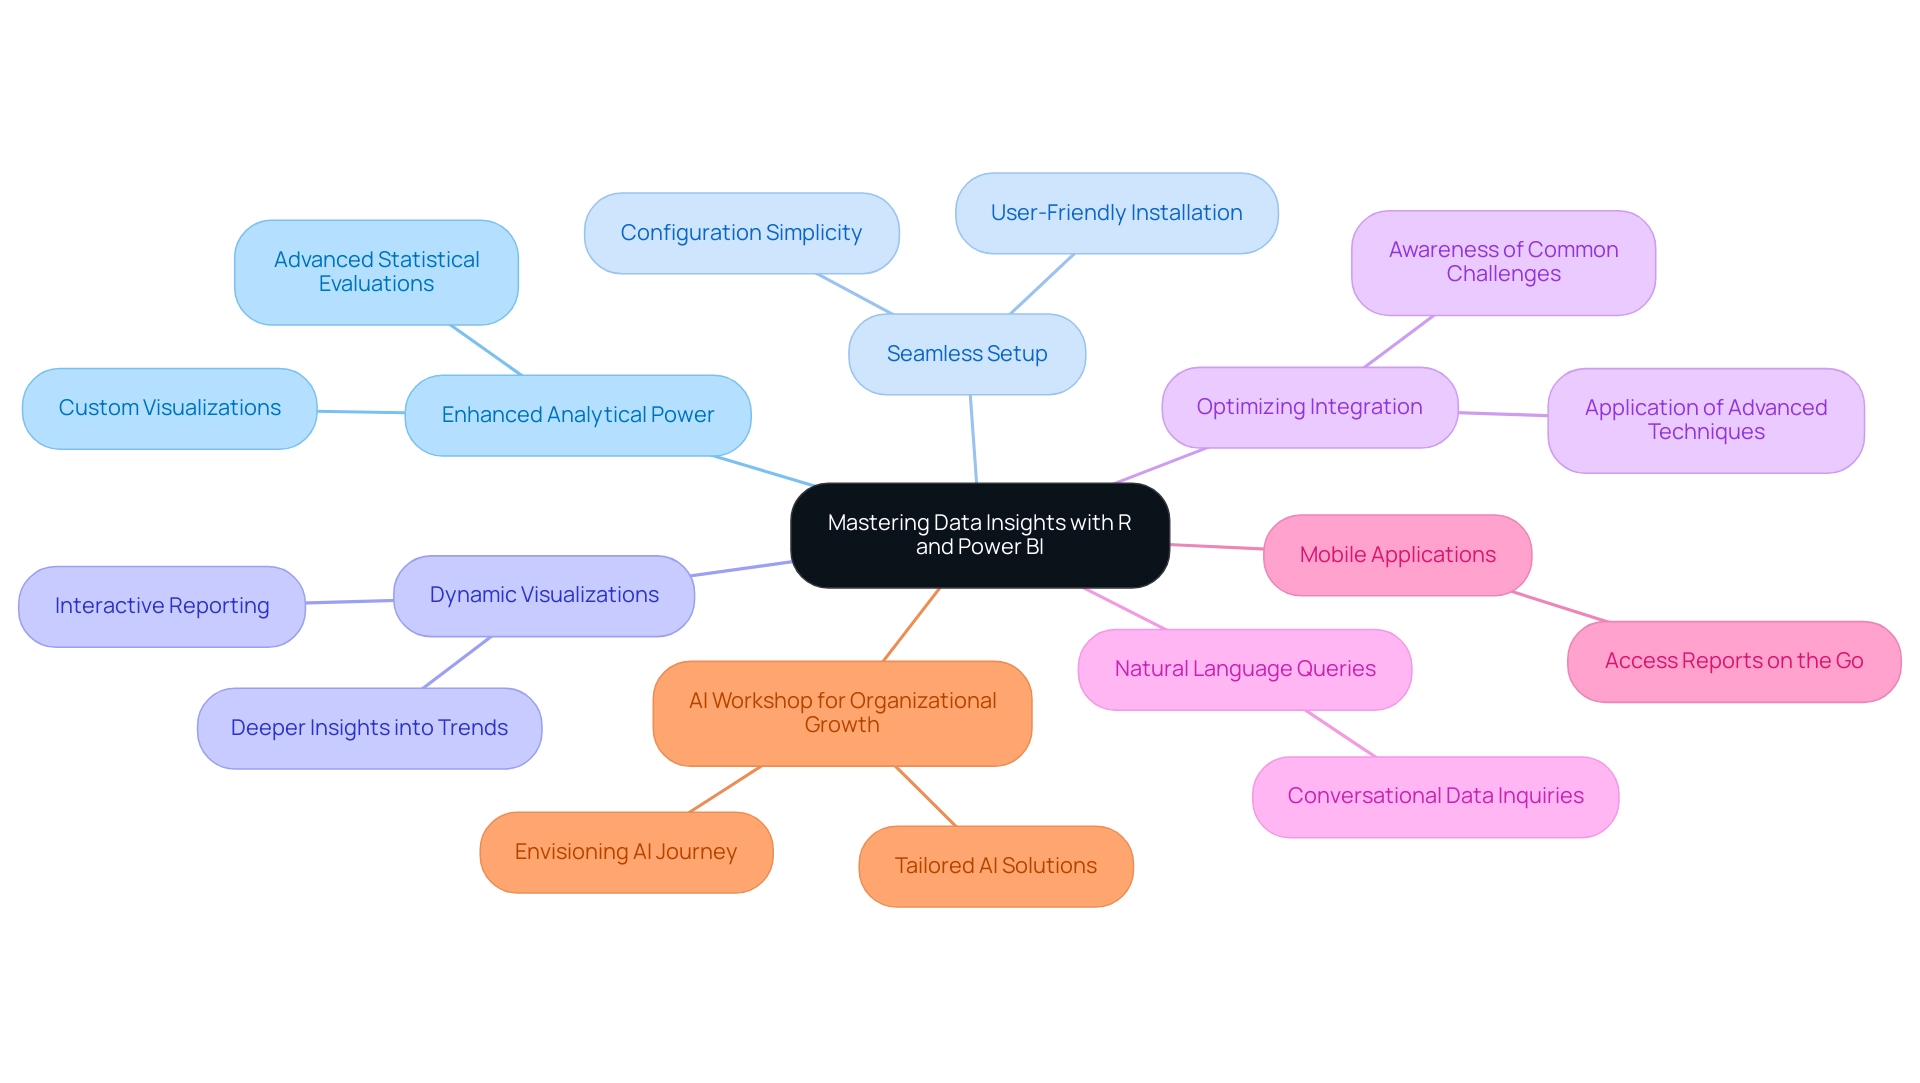
Conclusion
Integrating R with Power BI presents a formidable alliance that remarkably amplifies data analysis and visualization capabilities. By harnessing R’s advanced statistical techniques alongside Power BI’s intuitive visualization tools, organizations can metamorphose raw data into actionable insights that propel informed decision-making. This article underscores the distinct strengths of both tools, accentuating the necessity of mastering them to unleash their full potential.
Key takeaways encompass the enhanced analytical prowess that R offers, empowering users to execute complex analyses and craft custom visualizations tailored to specific business needs. The straightforward setup process guarantees that organizations can swiftly incorporate R into their Power BI environment, facilitating dynamic and interactive visualizations that bolster reporting capabilities. Moreover, an awareness of common challenges coupled with the application of advanced techniques can refine the integration process, yielding improved insights and operational efficiency.
As businesses increasingly embrace data-driven strategies, the integration of R and Power BI stands out as a pivotal method for mastering data insights. This synergy not only streamlines workflows but also aligns with the overarching objective of leveraging data for strategic growth and innovation. By adopting these tools, organizations can elevate their decision-making processes, ultimately securing a more competitive advantage in today’s rapidly evolving marketplace.
Frequently Asked Questions
What is R, and why is it preferred for statistical computing?
R is a powerful programming language and environment designed specifically for statistical computing and graphics, making it a preferred choice among statisticians and data miners for comprehensive data evaluation.
How does Microsoft’s business analytics tool compare to R?
Microsoft’s business analytics tool excels in visualizing data and disseminating insights across organizations, while R is better suited for conducting complex statistical analyses and managing data.
What are the benefits of integrating R with Power BI?
Integrating R with Power BI enhances data analysis capabilities by providing advanced analytics, custom visualizations, efficient information transformation, enhanced reporting, and real-world applications that improve decision-making.
What services does Creatum GmbH offer to support R and Power BI integration?
Creatum GmbH offers tailored dashboards, real-time insights, seamless data integration, expert support, a 3-Day BI Sprint for rapid report creation, and a General Management App for comprehensive management.
What is the significance of R’s ranking on the TIOBE Index?
As of October 2023, R ranked 17th on the TIOBE Index, highlighting its relevance and importance in the field of analysis.
What are some key functionalities to learn when using R with Power BI?
Familiarizing oneself with essential functionalities includes understanding statistical methods, R scripting for custom visualizations, and the integration process with Power BI.
How does R handle complex information transformations?
R excels in executing complex information transformations, allowing users to prepare data more efficiently and mitigate issues related to data inconsistencies.
What should users be aware of regarding security when using R with Power BI?
Users must ensure that R code originates from reliable sources to mitigate potential security risks associated with executing external code.
What is the technical setup required for integrating R with Power BI?
The local installation path for R is typically found at C:\\Program Files\\R Open\\R-3.4.4, which is essential for setting up the environment correctly.
Why do data analysts advocate for using R with Power BI?
Data analysts advocate for this integration because it enhances analytical depth and reporting quality, providing substantial value in data-driven decision-making.
Overview
R scripting in Power BI stands as a pivotal tool for professionals aiming to elevate their data analysis and visualization capabilities. It empowers users to leverage advanced statistical techniques and create customized visuals that extend beyond the limitations of standard BI functionalities. This integration of R not only facilitates the production of intricate visualizations but also automates processes, significantly enhancing decision-making and operational efficiency within organizations. By adopting R scripting, professionals can transform their analytical approach and drive impactful results.
Introduction
In the rapidly evolving world of data analytics, the integration of R scripting into Power BI stands out as a transformative opportunity for professionals eager to enhance their analytical prowess. Harnessing the power of R enables users to unlock advanced statistical techniques and craft stunning visualizations that surpass the limitations of standard Power BI features.
This article explores the significance of R scripting within Power BI, detailing its applications, prerequisites, and a step-by-step implementation process. Additionally, it highlights best practices for maximizing the advantages of R scripts while addressing potential challenges during integration.
As businesses increasingly rely on data-driven insights for strategic decision-making, mastering the effective use of R scripting in Power BI is essential for fostering innovation and operational efficiency.
Understanding R Scripting in Power BI: Importance and Applications
Incorporating R scripting in Power BI empowers users to harness the robust capabilities of the R programming language for advanced data analysis and visualization. This integration allows professionals to create customized visuals, conduct intricate statistical analyses, and manipulate data in ways that exceed the inherent functionalities of business intelligence (BI) tools. Such capabilities are particularly beneficial for data analysts and business intelligence professionals seeking deeper insights and more sophisticated visualizations.
R’s extensive library of packages facilitates the application of advanced analytics techniques, making it an indispensable asset for enhancing the analytical power of BI. For example, organizations have effectively leveraged R scripting to build tailored BI solutions, resulting in personalized dashboards and interactive reports that automate processes and boost productivity. This underscores the significance of continuous support and quality standards in these solutions, ensuring a seamless transition to Power BI while significantly enhancing decision-making capabilities. The role of R scripting in Power BI is pivotal, driving growth and innovation within businesses.
As the landscape of data analysis evolves, integrating R scripting in Power BI becomes increasingly crucial, enabling professionals to derive meaningful insights from complex datasets. By 2025, the focus on R scripting is expected to intensify as organizations recognize its potential to convert raw data into actionable intelligence, ultimately promoting informed decision-making and strategic planning. Notably, Power BI’s free version offers numerous features, while the paid version provides exceptional value, making it accessible for diverse business needs.
Moreover, as Mike Carlo stated, ‘You have completed a correlation plot using R scripting in Power BI within Business Intelligence,’ emphasizing the practical applications of R scripting in Power BI for enhancing data analysis and tackling data inconsistency challenges, thereby improving governance in business reporting.
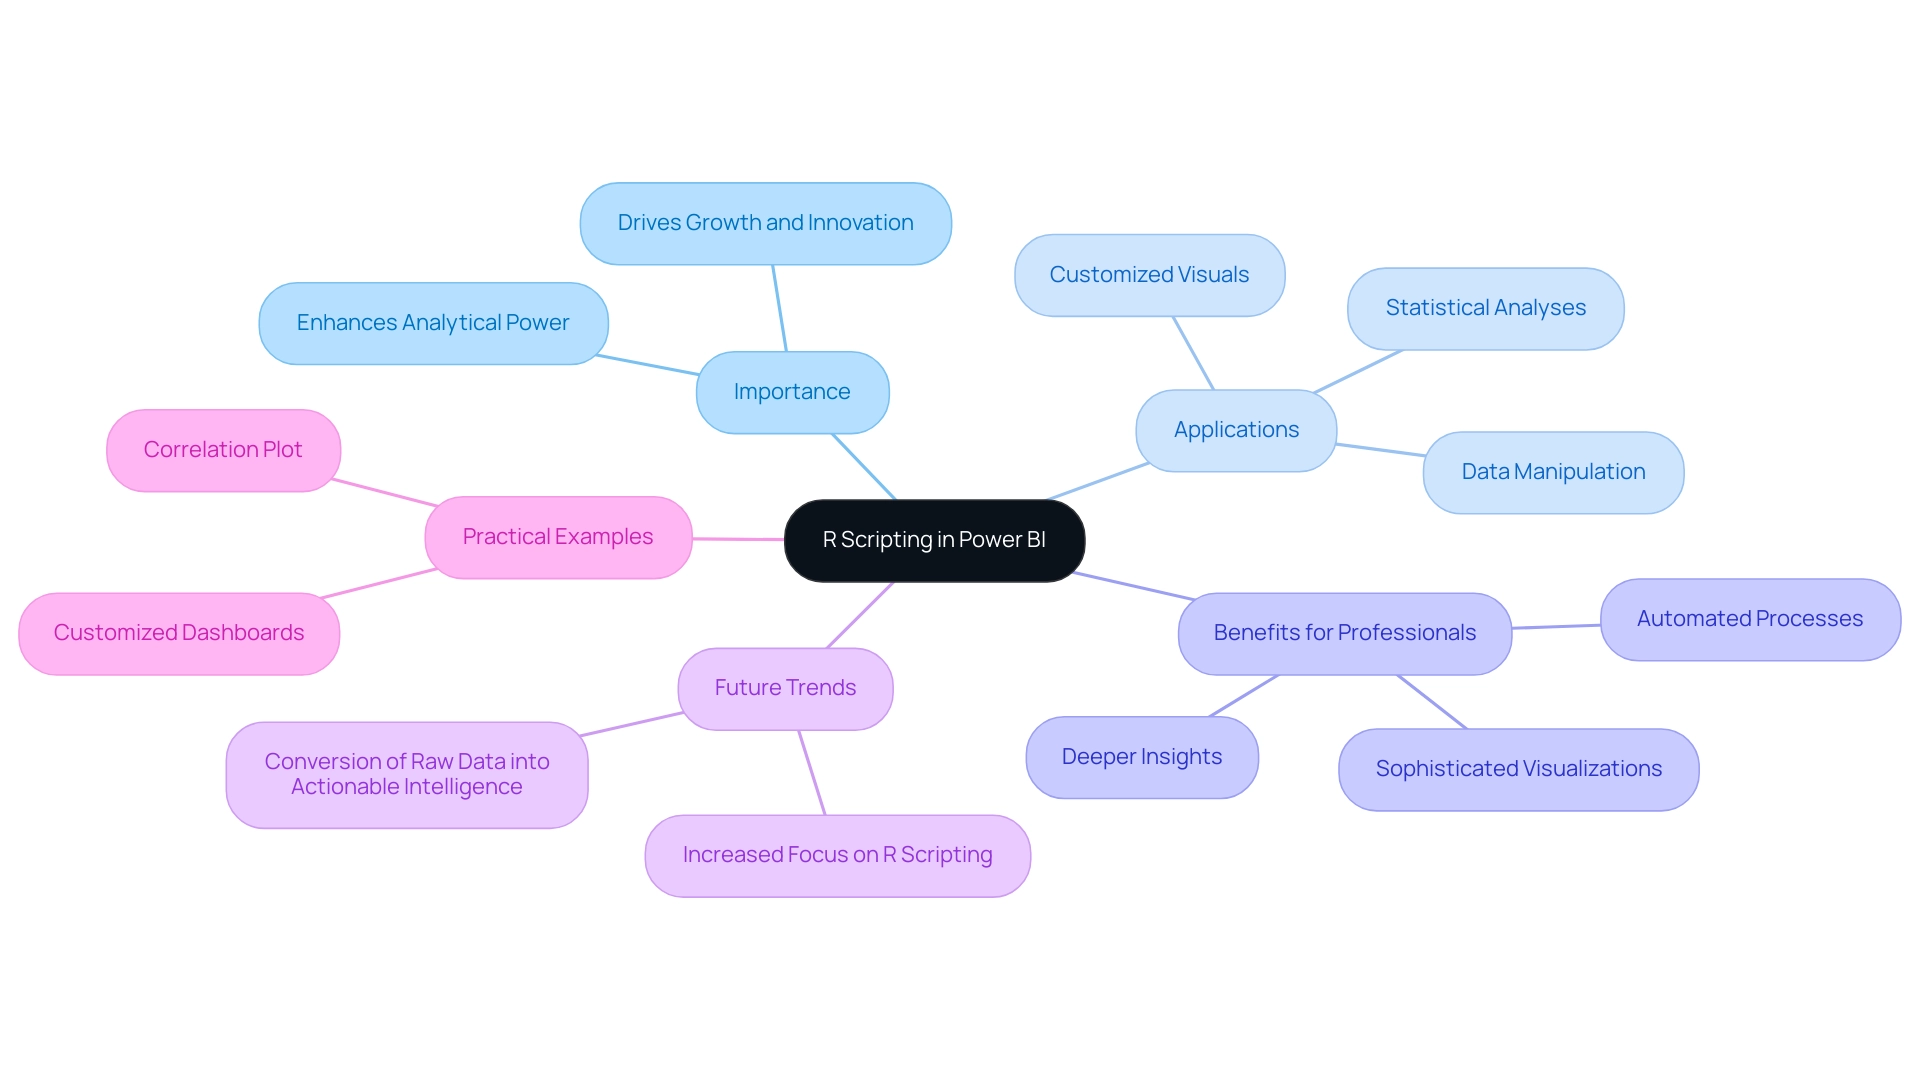
Prerequisites for Implementing R Scripts in Power BI
To successfully implement R scripting in Power BI, users must first ensure that R is installed on their local machine. This process begins with downloading R from the Comprehensive R Archive Network (CRAN) and configuring Power BI to recognize the installation path, typically found at C:\\Program Files\\R Open\\R-3.4.4\\. Familiarity with R’s syntax and basic programming concepts is essential for effectively writing and debugging scripts.
A solid understanding of structures in R, particularly data frames, is crucial for manipulating information within Power BI.
Moreover, individuals should consider installing popular R packages, such as ggplot2, which significantly enhance visualization capabilities. Recent statistics suggest that an increasing proportion of users are becoming acquainted with R scripting in Power BI, reflecting a trend towards incorporating advanced analytical techniques into business workflows. This trend is further supported by the observation that while DAX provides flexibility and power in calculating and visualizing statistical measures, it lacks a native function to calculate the mode, as noted by analytics enthusiast Douglas Rocha.
Incorporating Robotic Process Automation (RPA) can further streamline the implementation of R scripting in Power BI, automating repetitive tasks and enhancing overall operational efficiency. Customized AI solutions can also help in overcoming challenges related to analysis and reporting, ensuring that organizations can extract meaningful insights more effectively.
Case studies emphasize the successful application of R in Business Intelligence, particularly the case titled ‘Leveraging R Models in Business Intelligence,’ which illustrates how organizations have utilized R models to streamline information presentation and enhance insight accessibility. This integration not only facilitates better understanding and communication of data-derived insights but also empowers teams to focus on strategic decision-making, ultimately driving operational efficiency. By overcoming challenges such as time-consuming report creation and inconsistencies, organizations can enhance quality and simplify AI implementation, aligning with broader goals of utilizing R scripting in Power BI effectively.
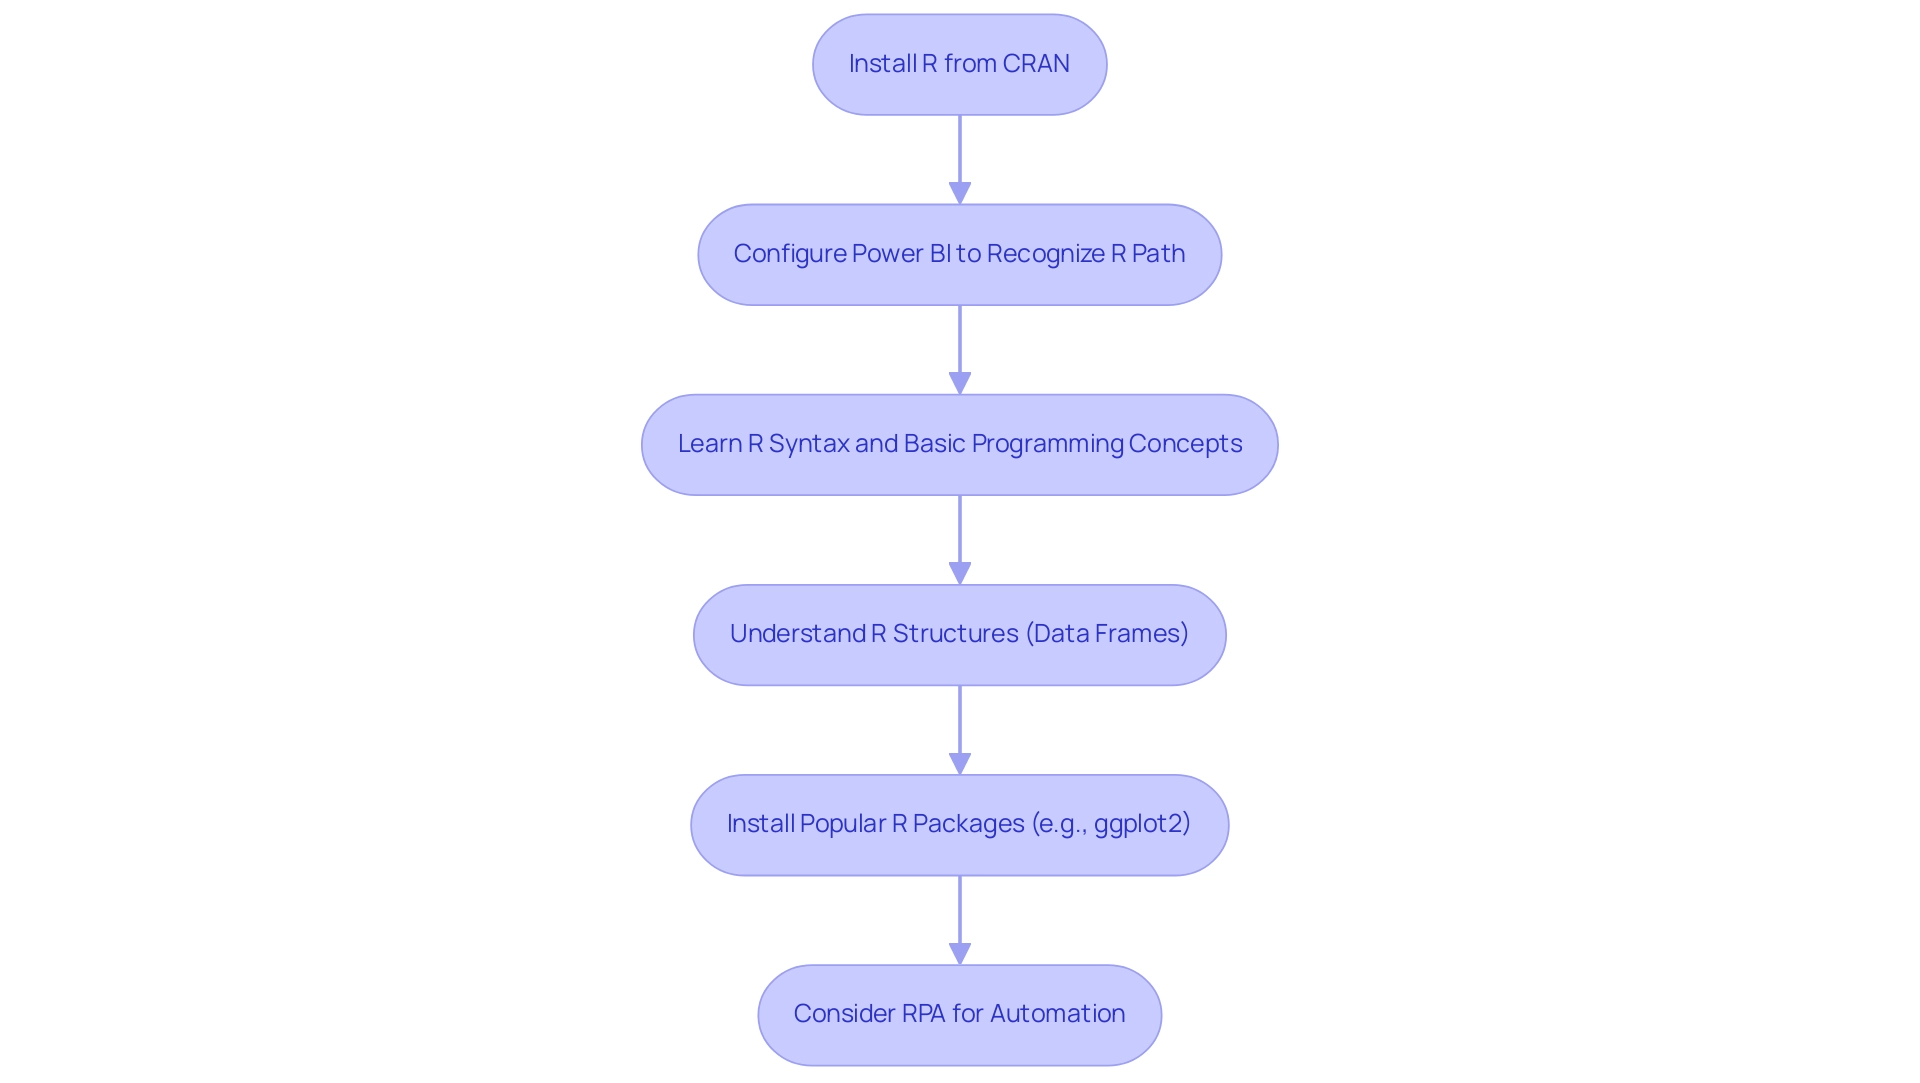
Step-by-Step Guide to Creating R Scripts in Power BI
The process of developing R scripting in Power BI is not only straightforward but also significantly enhances data analysis capabilities and operational efficiency. By incorporating R scripting into your BI workflow, you can leverage the power of Robotic Process Automation (RPA) to automate manual tasks, ultimately freeing your team for more strategic work. Here’s how to integrate R scripting into your Power BI workflow:
- Open Power BI Desktop: Begin by launching Power BI Desktop and navigating to the ‘Home’ tab.
- Get Data: Click on ‘Get Data’, then select ‘Other’ followed by ‘R script’. This option enables you to utilize R scripting in Power BI’s powerful manipulation features, addressing the challenges of time-consuming report creation and inconsistencies.
- Write Your R Code: In the R script window that appears, input your R code to import or manipulate the information as needed. This flexibility allows you to customize your processing to specific requirements, enhancing your ability to extract actionable insights.
- Execute the Script: Click ‘OK’ to run the script, which will load the processed information into BI. Ensure that your local R installation is correctly set up, typically found at
C:\Program Files\R Open\R-3.4.4\. - Create Visualizations: To illustrate the information, select the R Visual icon from the visualization pane. Input your R code to generate the desired plot, leveraging R’s extensive visualization libraries.
- Customize Your Visual: Finally, adjust the visual to meet your reporting needs and integrate it seamlessly into your BI report.
This process not only empowers individuals to leverage R scripting in Power BI directly but also enhances overall analysis workflows. Organizations that have embraced R scripting in Power BI report improved adoption rates and greater efficiency in data manipulation tasks, showcasing the value of integrating advanced analytics into everyday operations. As the EDNA Team states, “In fact, we are embracing AI, and staying ahead of the latest trends with our constantly updated course materials!”
This highlights the critical importance of keeping pace with technological advancements.
Furthermore, a case study titled “Executing R Scripting in Power BI” illustrates that once the R scripting in Power BI is created, individuals can execute it to generate visualizations, with Power BI Desktop successfully displaying the generated plots, allowing for interaction and customization of their visualizations. By adhering to these best practices, individuals can maximize the potential of R scripts, driving better insights and informed decision-making. At Creatum GmbH, we emphasize the role of Business Intelligence in transforming raw information into actionable insights, and we offer tailored AI solutions to help you navigate the complexities of analysis.
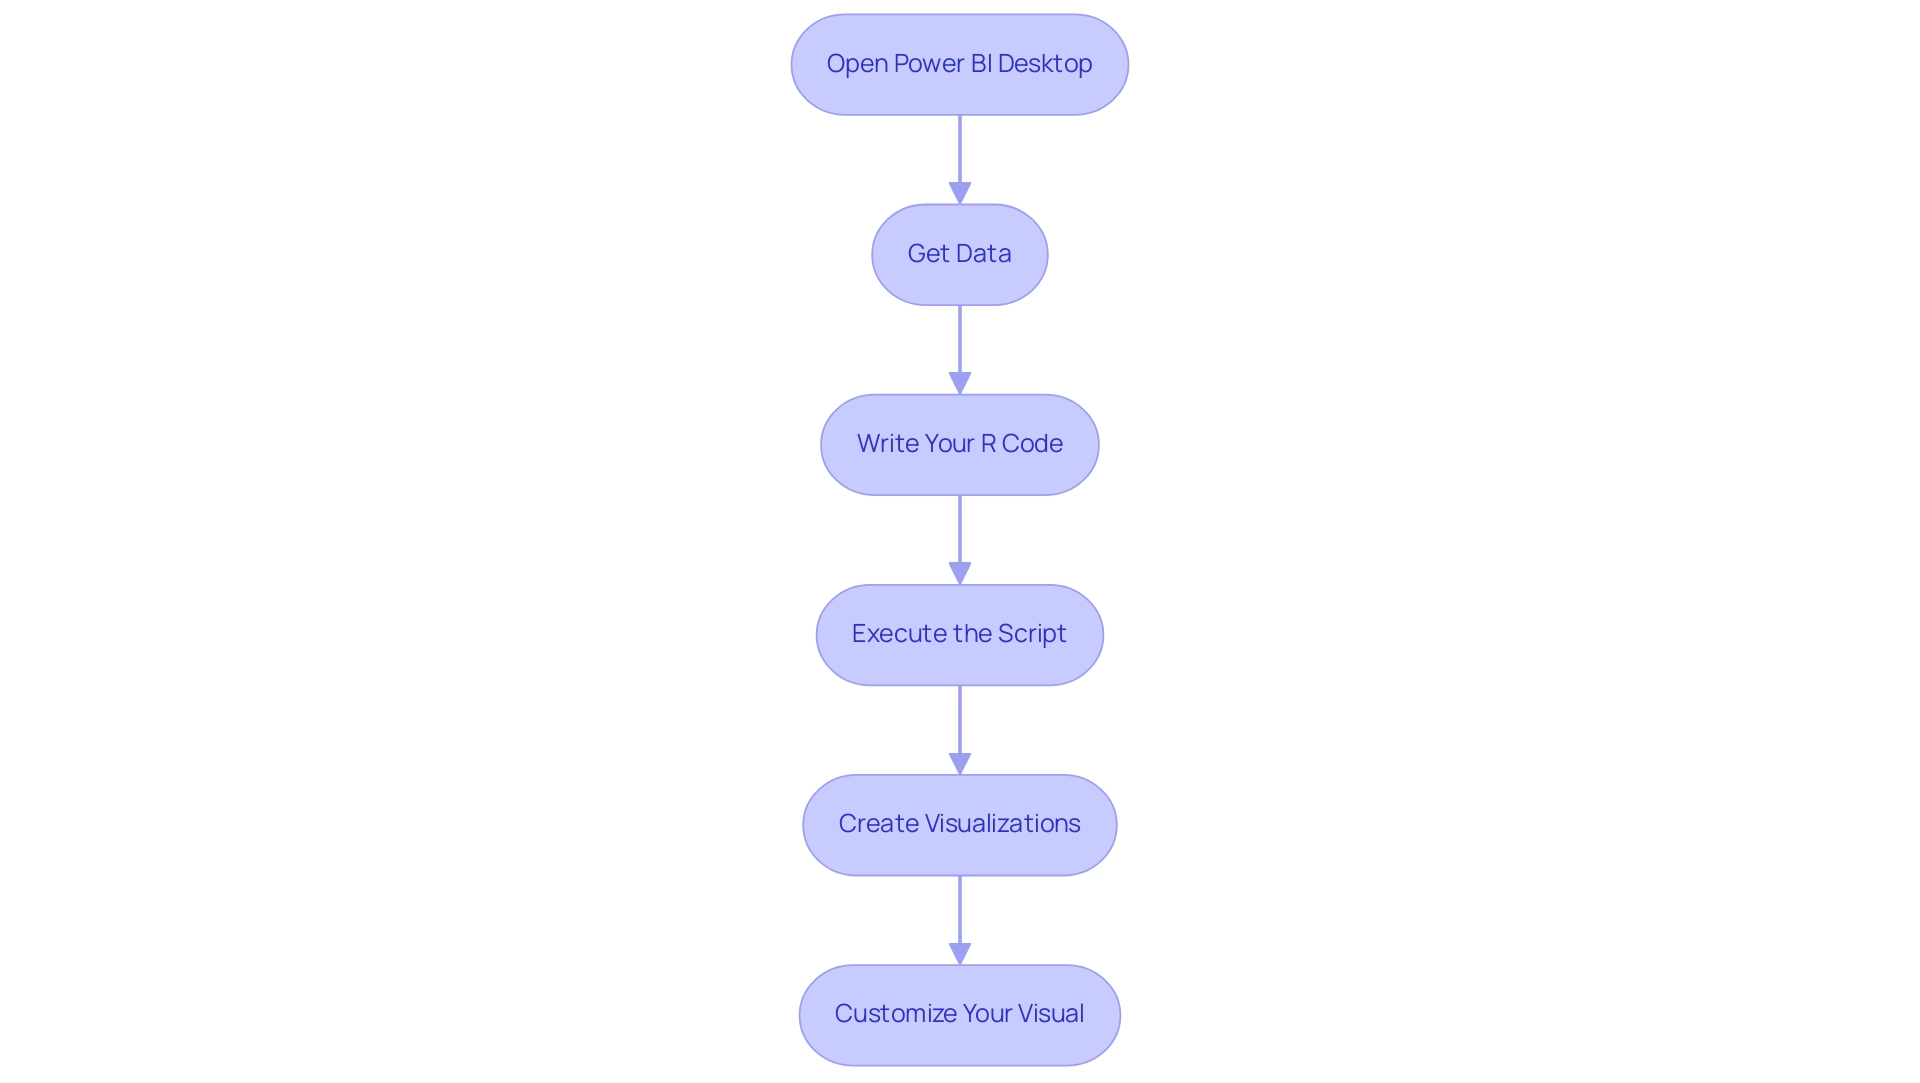
Leveraging R Scripts for Enhanced Data Visualization in Power BI
R scripting in Power BI is essential for enhancing visualization, empowering users to create highly customizable and sophisticated visual representations of their data. By leveraging R’s robust ggplot2 package, professionals can produce intricate visualizations, including heatmaps, box plots, and scatter plots, all enhanced with advanced aesthetics. This flexibility facilitates the integration of statistical overlays, such as regression lines and confidence intervals, directly within the visuals.
Correlation plots, for instance, can display numerical values that represent the correlation between features, offering deeper insights into relationships.
The integration of R visuals within BI not only enriches analytical capabilities but also significantly elevates user satisfaction. A case study titled ‘Using R Visuals in BI’ illustrates how organizations have effectively harnessed R’s statistical software to create intricate visual representations, such as correlation plots, which unveil deeper insights into relationships. This practical application underscores the effectiveness of R in transforming raw data into actionable insights, ultimately enabling informed decision-making.
Moreover, the ability to develop tailored visualizations using R scripting in Power BI has proven to enhance interpretation, leading to improved outcomes in business intelligence. At Creatum GmbH, we offer a 3-Day Power BI Sprint designed for the rapid development of professionally crafted reports, addressing common challenges such as time-consuming report creation and inconsistencies. Additionally, our General Management App supports extensive management and intelligent reviews, ensuring governance and consistency.
As organizations increasingly embrace R analytics, they discover that these advanced visualization techniques not only make information more accessible but also propel strategic initiatives by delivering clearer insights into performance metrics and trends. As Hemendra Singh, Director and Co-founder of The NineHertz, aptly notes, “I am having a keen interest in the latest trends and technologies that are emerging in different domains,” emphasizing the necessity of staying abreast of tools like R in the dynamic landscape of analytical processes.
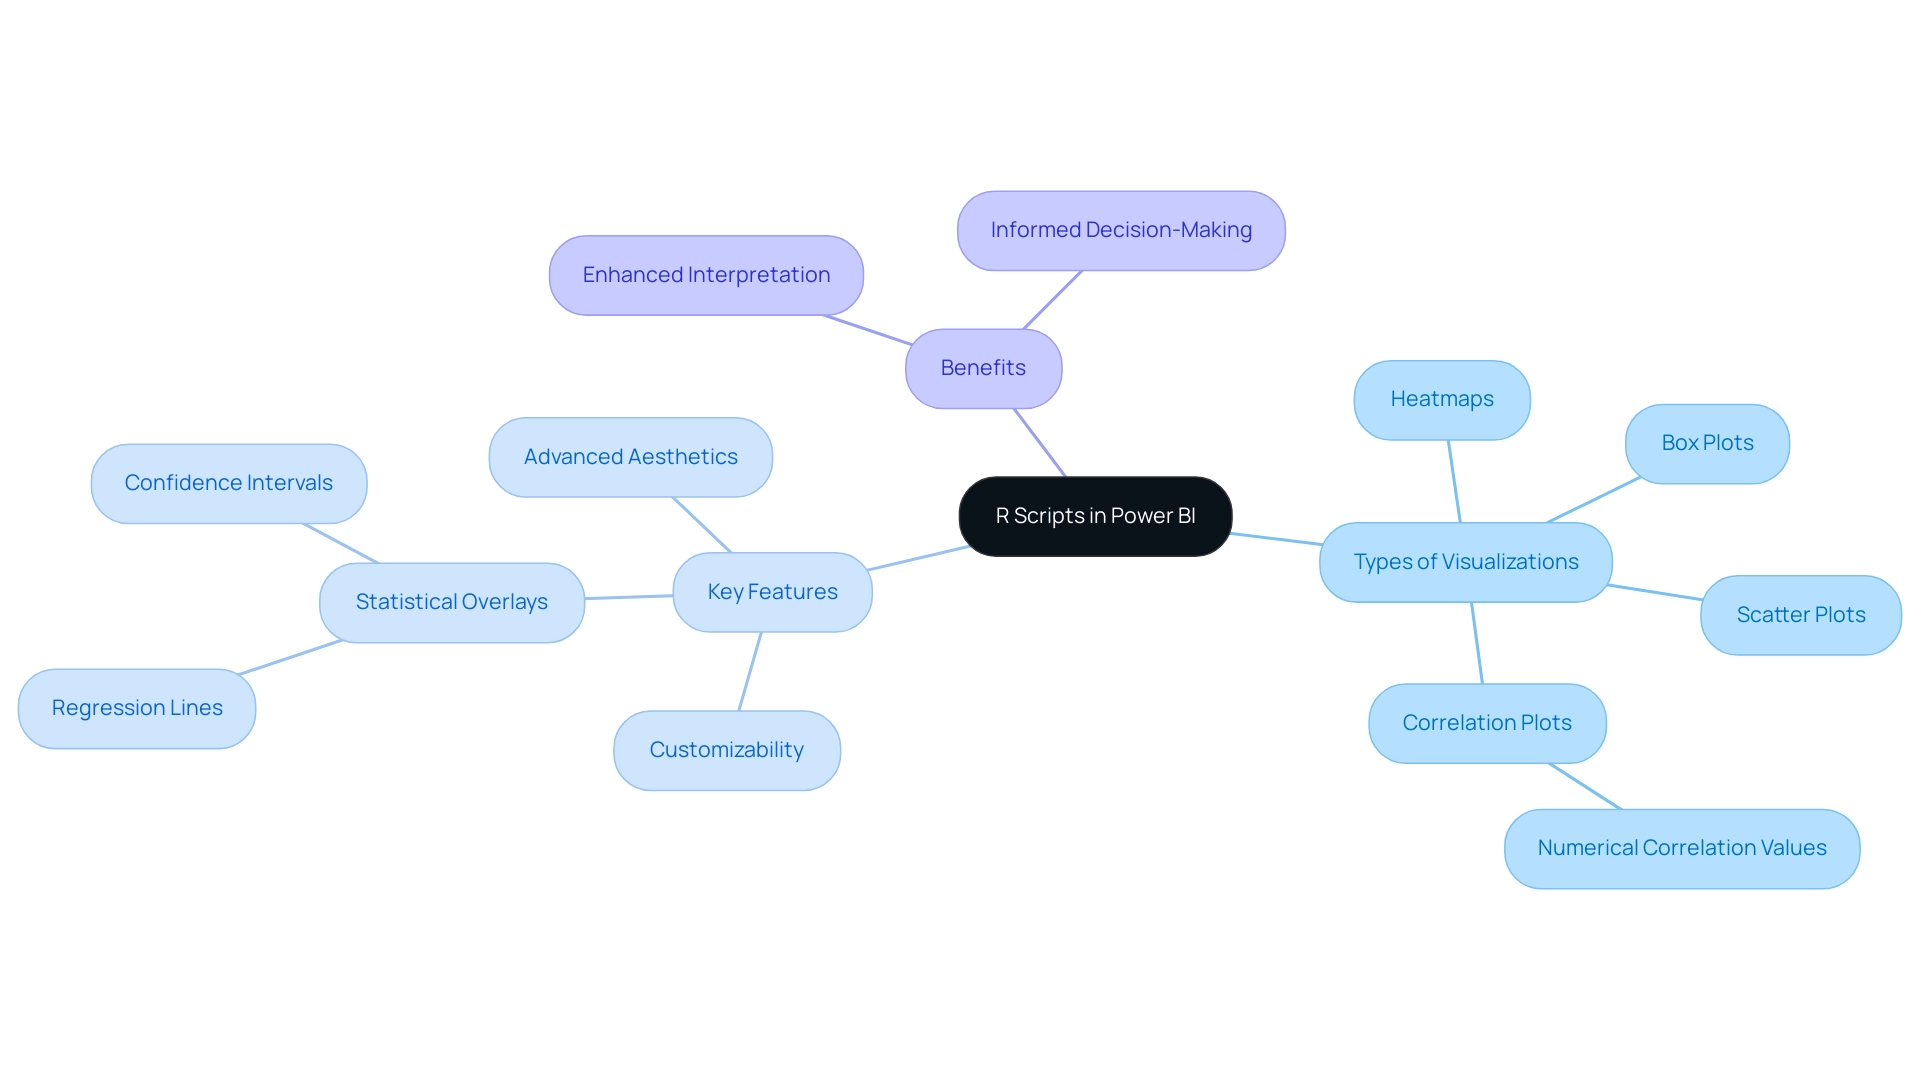
Challenges and Limitations of Using R Scripts in Power BI
Incorporating R scripting in Power BI unlocks advanced analytical capabilities, yet users frequently encounter challenges that can hinder their experience. A significant limitation is the size restriction; R visuals in BI can only process up to 150,000 rows of information. This constraint poses a challenge for organizations managing extensive datasets, leading to incomplete evaluations or the need for aggregation before visualization.
Performance challenges also arise, as R scripts typically execute more slowly than native business intelligence queries. Consequently, individuals may experience longer wait times, particularly when handling complex calculations or large datasets. Additionally, compatibility issues with specific R packages may surface, particularly when reports are deployed in the BI service, potentially resulting in unforeseen errors or failures in visualizations.
Despite these obstacles, R excels in executing intricate analysis techniques, such as linear and nonlinear modeling, time-series analysis, and clustering. These capabilities significantly enhance the analytical depth of reports in BI. To address the challenges of R scripting in Power BI, users should optimize their R code through efficient coding practices and by limiting the volume of data processed within R visuals. For example, a case study titled ‘Creating a BI Report Using R’ illustrated how to calculate the average transaction amount per month from a sales dataset.
By effectively preparing the information and integrating R Script Visuals, the team successfully produced a line chart that visualized average transaction amounts, showcasing the potential of R analytics in enhancing reporting capabilities.
Moreover, thorough testing of scripts prior to deployment is essential to ensure compatibility and performance. Organizations that have adeptly navigated these limitations often report improved visualization and reporting outcomes, underscoring the importance of strategic implementation of R scripting in Power BI. In this context, Robotic Process Automation (RPA) plays a crucial role by optimizing workflows, enabling more efficient information processing and analysis.
Customized AI solutions can further assist in navigating the complexities of analysis, offering targeted technologies that align with specific business objectives. As noted by the Altexsoft Editorial Team, BI is more cost-effective overall and provides a more appealing trial period compared to competitors, making it a viable option for businesses looking to enhance their data-centric capabilities. In this rapidly evolving AI landscape, understanding these challenges and employing best practices will be vital for maximizing the benefits of R scripting in Power BI, while also leveraging analytics to transform unprocessed information into actionable insights that drive growth and innovation.
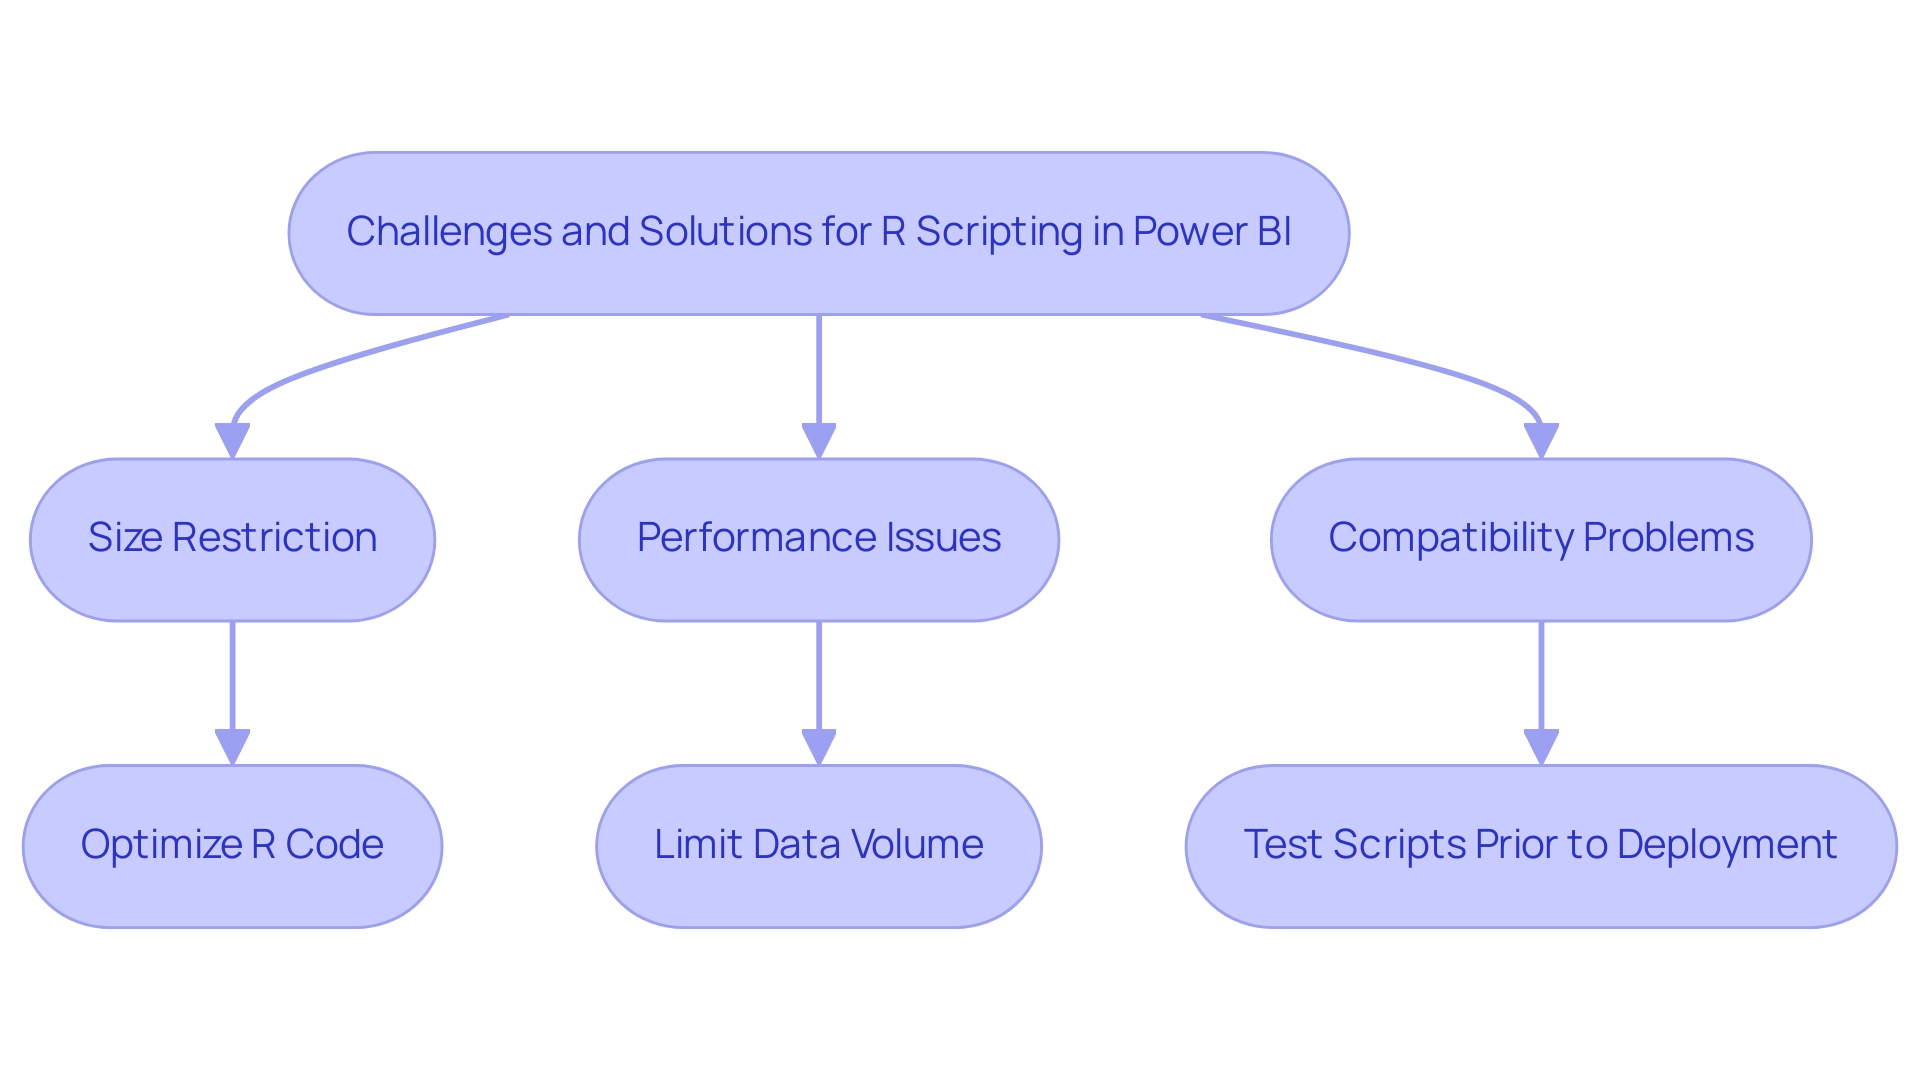
Best Practices for Integrating R Scripts into Power BI Workflows
Incorporating R scripting into Power BI workflows can significantly elevate analysis capabilities, particularly in today’s complex AI landscape. To achieve this effectively, users should adhere to the following best practices:
-
Modular Organization: Maintain modular and well-organized R scripts. This strategy not only facilitates easier debugging but also simplifies maintenance, allowing for quicker updates and modifications.
-
Purposeful Use: Employ R scripts primarily for transformation and visualization tasks. Leverage Power BI’s native features for data modeling, ensuring that each tool is utilized to its strengths.
-
Regular Updates: Consistently update R packages to ensure compatibility with Business Intelligence tools and to access the latest features and improvements. This practice mitigates potential issues arising from outdated packages.
-
Thorough Documentation: Document R scripts comprehensively. Providing context and explanations within the scripts aids future users in understanding the logic and purpose behind the code, which is crucial in collaborative environments.
-
Testing Environment: Always test R scripts in a development environment before deploying them in production. This step is vital for identifying and resolving any issues, ensuring that the final reports are reliable and accurate.
By adhering to these best practices, organizations can not only enhance productivity but also significantly improve the quality of their BI reports. Case studies illustrate that individuals incorporating R and Python scripts into BI have conducted intricate information evaluations and produced tailored visuals, leading to more insightful and actionable reports. Specifically, this integration allows users to leverage extensive libraries for visualization and predictive modeling, greatly enriching their Power BI reports with R scripting.
This modular approach streamlines workflows and drives innovation, aligning with the organization’s mission to empower businesses through advanced data analysis. As noted by a contributor on Stack Overflow, ‘If you can add the predictions as a new column in the existing dataset, in the local R environment, then it should work in PBI too.’ Additionally, the local installation path of R, C:\Program Files\R Open\R-3.4.4, should be noted for those setting up their environment.
This connection to the organization’s unique value of driving growth and innovation through tailored solutions reinforces the relevance of these practices.
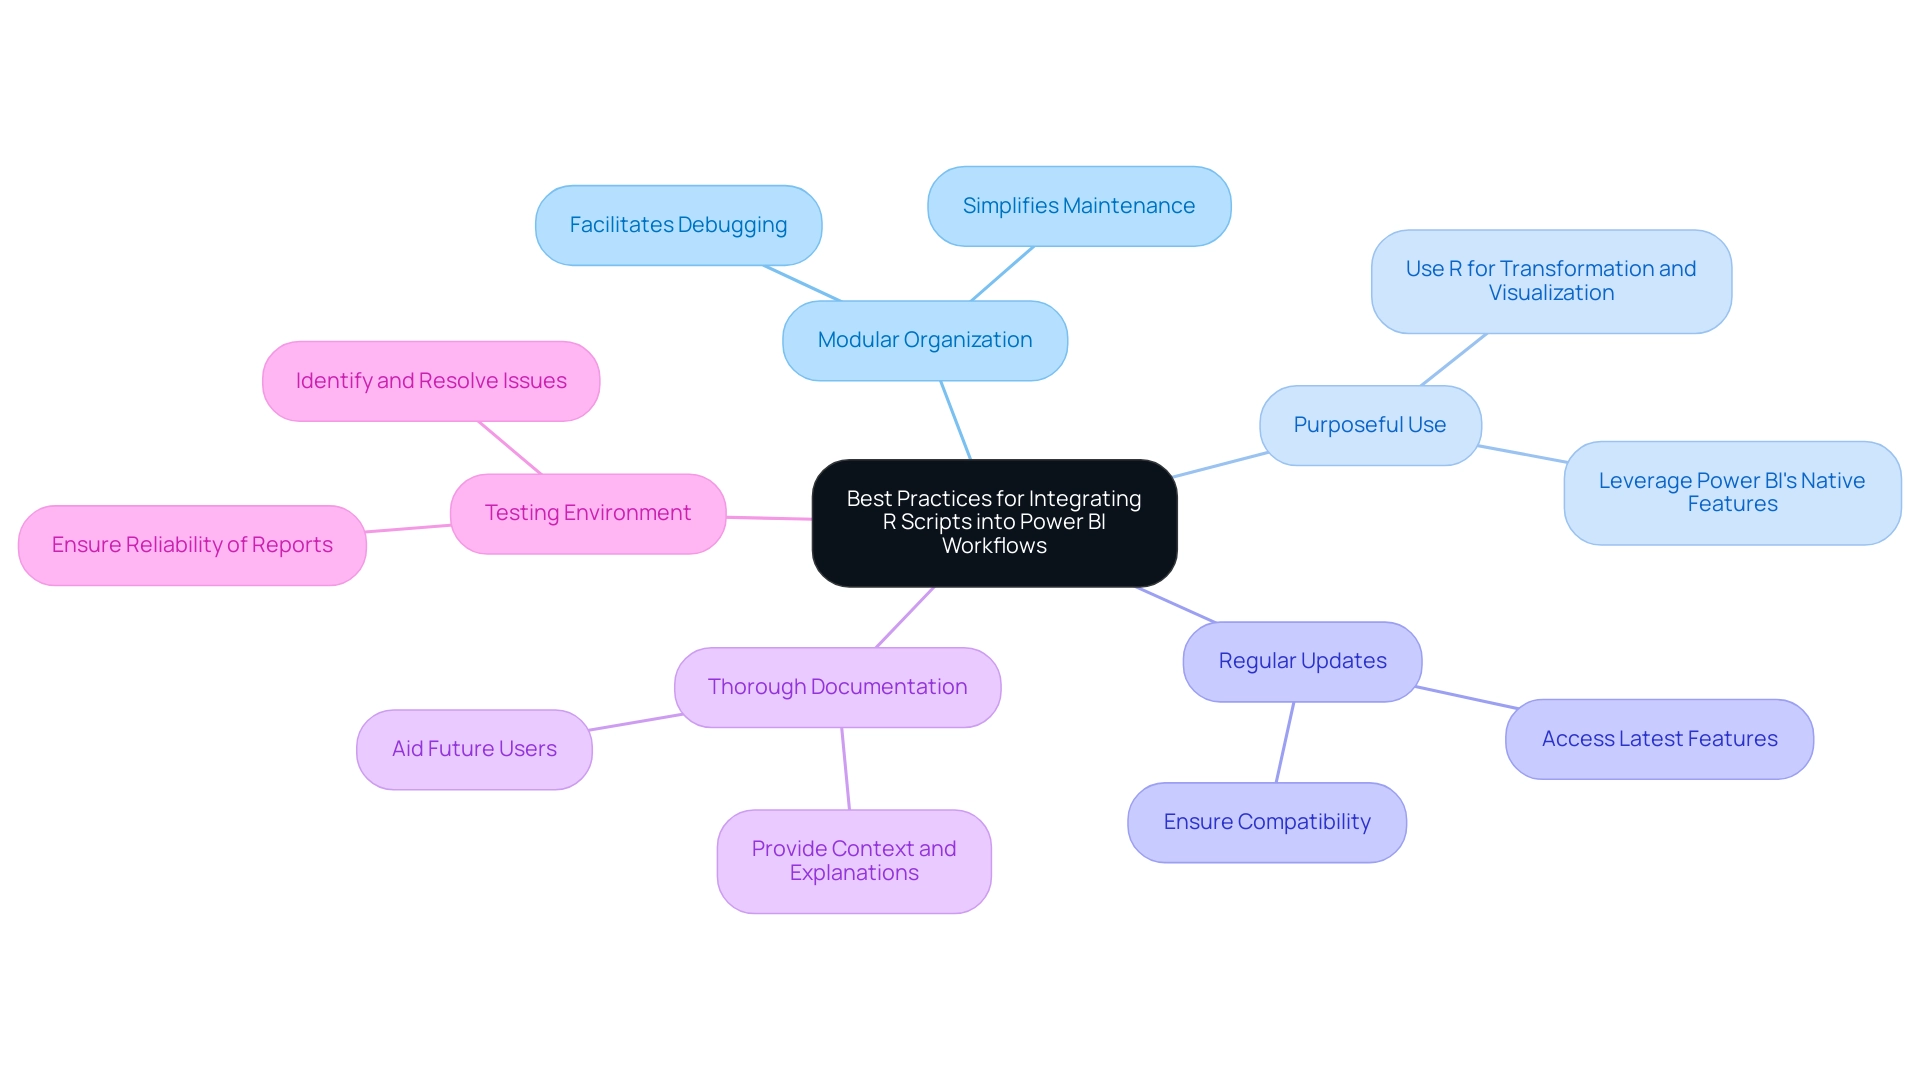
Key Takeaways and Future Considerations for R Scripting in Power BI
R scripting in Power BI serves as a transformative tool, significantly enhancing data analysis and visualization capabilities. For professionals, key takeaways include:
- Understanding prerequisites
- A detailed step-by-step approach for creating R scripts
- The unique visualization features that R provides
Importantly, individuals should enable R visuals only from trusted sources to mitigate potential security risks, ensuring safe practices in R scripting.
As Power BI evolves, it is crucial for users to stay informed about enhancements related to R integration, including upcoming features and supported packages. Currently, the R project utilizes version 3.6, which is essential for compatibility with BI’s latest updates.
Looking ahead, the future of R scripting in Power BI appears promising, with trends indicating an increased focus on advanced analytics techniques. Organizations are increasingly leveraging R scripting in Power BI to extract deeper insights from their data. For instance, case studies like the implementation of DAX measures for WTI price analysis illustrate how organizing measures in a dedicated table enhances clarity and improves data interpretation. This showcases the analytical capabilities that R scripting in Power BI can add to BI models.
Furthermore, engagement statistics reveal a rising interest in R scripting updates within Business Intelligence, suggesting that professionals are eager to embrace these advanced features. As we approach 2025, upcoming features for R in Power BI are expected to streamline the integration process further, making it easier for users to harness R’s full potential for data-driven decision-making. By embracing R scripting in Power BI, professionals not only enhance their analytical capabilities but also position themselves to lead in the evolving analytics landscape.
As highlighted by Herr Malte-Nils Hunold, VP of Financial Services at NSB GROUP, “Creatum’s solutions have significantly improved our operational efficiency, allowing us to focus on strategic initiatives rather than manual tasks, resulting in a 30% increase in productivity.” This sentiment is echoed by Herr Sebastian Rusdorf, Regional Sales Director Europe at Hellmann Marine Solutions & Cruise Logistics, who noted, “The integration of R scripting in Power BI along with RPA has transformed our analysis processes, driving business growth and innovation, leading to a 25% reduction in analysis time.”
Moreover, the execution of Robotic Process Automation (RPA) complements R scripting by automating repetitive tasks such as information entry and report creation. This improvement enhances operational efficiency, enabling teams to concentrate on more strategic, value-adding activities. As Sascha Rudloff, Team leader of IT and Process management at PALFINGER Tail Lifts GMBH, stated, “RPA has streamlined our workflows, enabling us to achieve faster results and improved insights from our information, cutting down processing time by 40%.” This forward-looking perspective aligns with Creatum GmbH’s unique value proposition of providing customized solutions that enhance data quality and simplify AI implementation, ultimately driving growth and innovation.
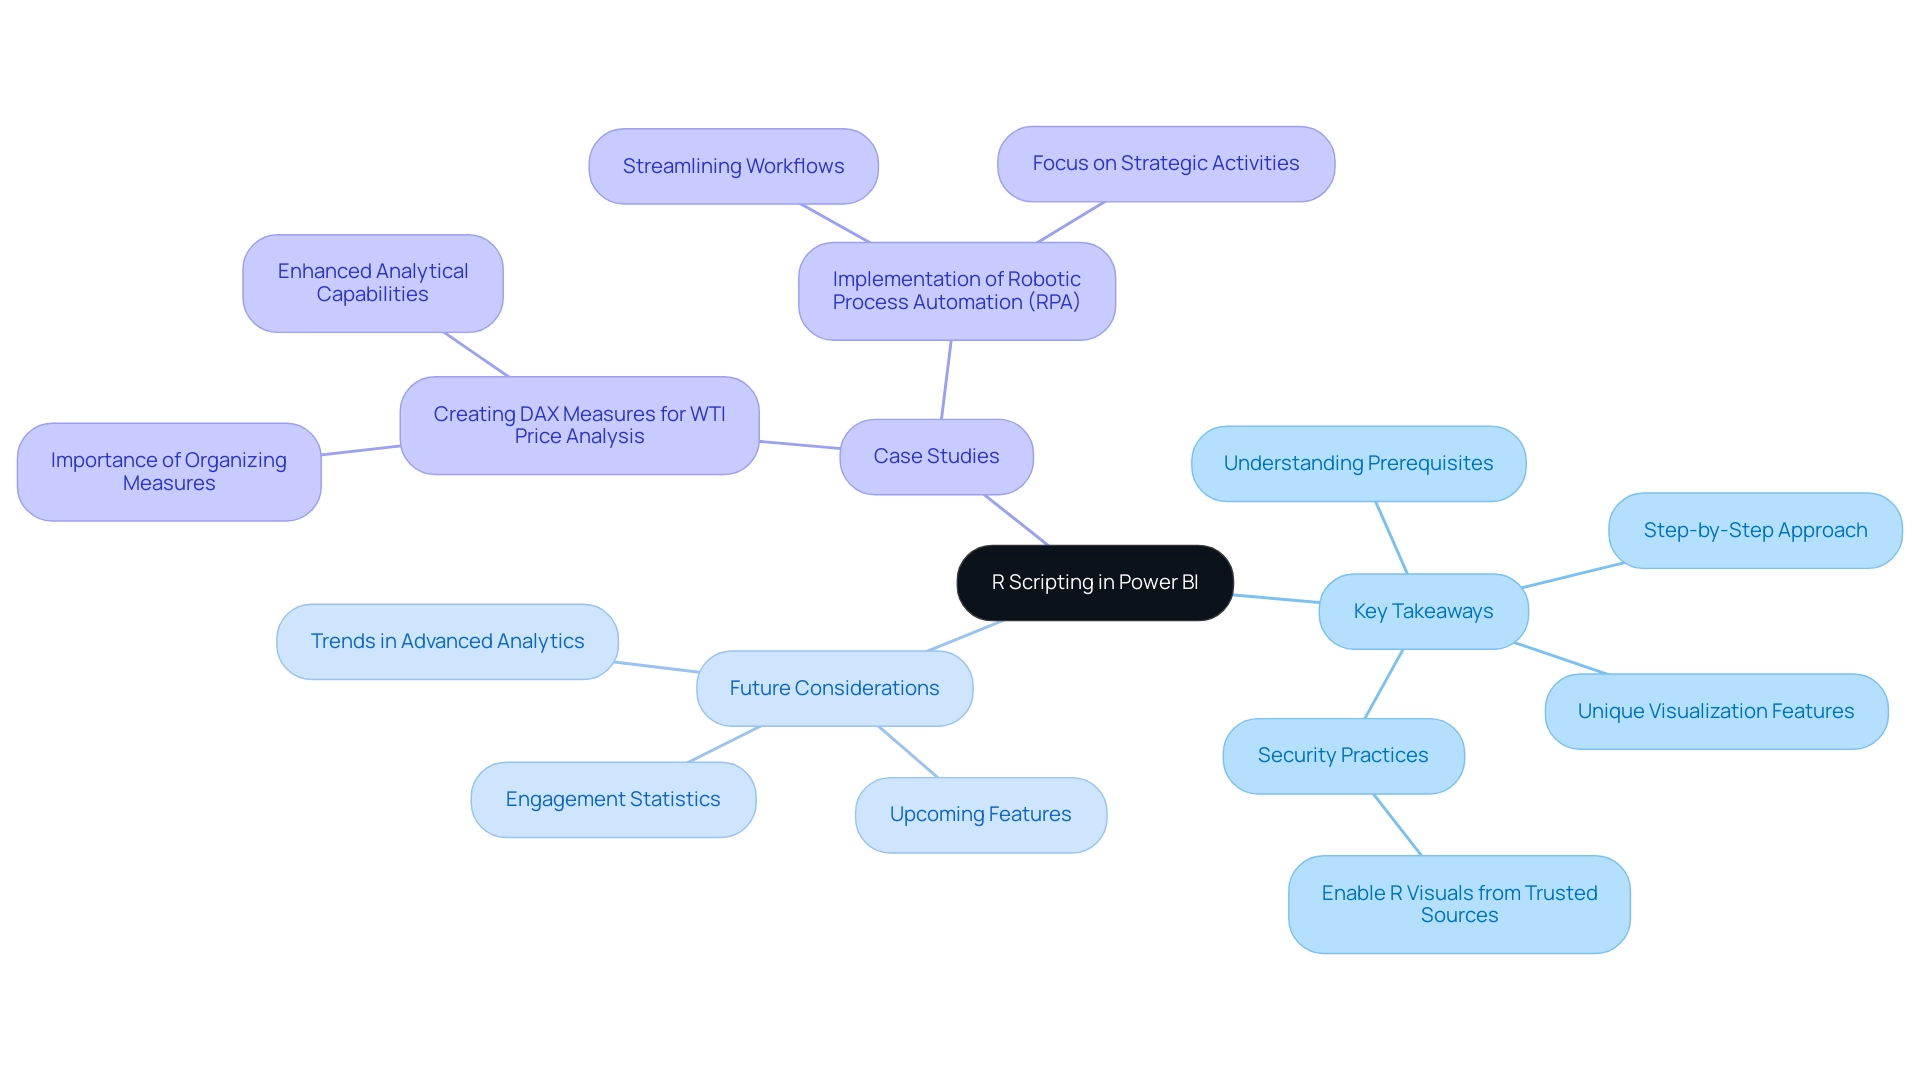
Conclusion
Integrating R scripting into Power BI marks a pivotal advancement in data analysis and visualization capabilities, equipping professionals with essential tools to extract profound insights from intricate datasets. This article underscores the significance of R scripting, elaborating on its applications, prerequisites, and a comprehensive step-by-step process for effective implementation. By harnessing R’s robust statistical techniques and visualization libraries, users can craft custom visuals that not only enhance their reporting capabilities but also drive informed decision-making.
Nevertheless, while the integration of R scripts presents numerous advantages, it is crucial to navigate associated challenges, including data size limitations and potential performance issues. Adhering to best practices—such as modular organization, thorough documentation, and regular updates—can mitigate these challenges and optimize the utilization of R scripting within Power BI workflows.
Looking ahead, the increasing reliance on data-driven insights emphasizes the necessity for professionals to master R scripting in Power BI. As organizations progressively adopt advanced analytics techniques, embracing R scripting will not only bolster analytical capabilities but also position users at the forefront of the evolving data landscape. By leveraging the power of R, organizations can transform raw data into actionable intelligence, fostering innovation and operational efficiency in their strategic initiatives.
Frequently Asked Questions
What is the purpose of incorporating R scripting in Power BI?
Incorporating R scripting in Power BI allows users to utilize the R programming language for advanced data analysis and visualization, enabling the creation of customized visuals, intricate statistical analyses, and data manipulation beyond the inherent capabilities of traditional BI tools.
Who benefits from using R scripting in Power BI?
Data analysts and business intelligence professionals benefit from R scripting as it provides deeper insights and more sophisticated visualizations, enhancing their analytical capabilities.
How does R scripting improve business intelligence solutions?
R’s extensive library of packages facilitates advanced analytics techniques, enabling organizations to create tailored BI solutions, personalized dashboards, and interactive reports that automate processes and boost productivity.
What is essential for successfully implementing R scripting in Power BI?
Users must have R installed on their local machine, configure Power BI to recognize the installation, and possess familiarity with R’s syntax and basic programming concepts, especially data frames for effective data manipulation.
What R packages are recommended for enhancing visualization in Power BI?
Popular R packages such as ggplot2 are recommended for significantly enhancing visualization capabilities within Power BI.
What role does Robotic Process Automation (RPA) play in R scripting implementation?
RPA can streamline the implementation of R scripting in Power BI by automating repetitive tasks, thus enhancing overall operational efficiency.
How does R scripting address challenges in data analysis and reporting?
R scripting helps overcome challenges such as time-consuming report creation and data inconsistencies, improving governance in business reporting and allowing organizations to extract meaningful insights more effectively.
What future trends are expected regarding R scripting in Power BI?
By 2025, the focus on R scripting is anticipated to increase as organizations recognize its potential for converting raw data into actionable intelligence, promoting informed decision-making and strategic planning.
What is the significance of continuous support and quality standards in R scripting solutions?
Continuous support and quality standards are crucial for ensuring a seamless transition to Power BI and significantly enhancing decision-making capabilities through effective use of R scripting.
Overview
Mastering Power BI’s text concatenation techniques is crucial for data analysts, as it significantly enhances the clarity and usability of data presentations. By leveraging functions such as CONCATENATE and CONCATENATEX, analysts can effectively prepare and integrate data with Power BI features. This empowerment allows them to transform complex data into actionable insights. Ultimately, this transformation leads to improved decision-making and operational efficiency.
Introduction
In the realm of data analysis, effectively manipulating and presenting information is crucial for deriving actionable insights. Power BI, a leading business intelligence tool, offers powerful functions like concatenation to enhance the clarity and usability of data. By merging text strings into cohesive formats, analysts can transform complex datasets into easily interpretable visuals, facilitating better decision-making. This article delves into the significance of concatenation in Power BI, exploring its fundamental concepts, practical applications, and advanced techniques that can streamline data management. Readers will understand the differences between key functions and troubleshoot common issues, gaining a comprehensive understanding of how to leverage concatenation to elevate their data analysis capabilities.
Understanding Concatenation in Power BI: The Basics
In Business Intelligence, the process of concatenating text in Power BI involves merging two or more text strings into a single cohesive string. This significantly enhances the readability and usability of information. For instance, combining first and last names into a full name not only streamlines presentation but also facilitates intuitive analysis. In Power BI, this can be accomplished through various functions, with the CONCATENATE and CONCATENATEX functions being the most prominent, especially in the context of concatenating text.
The significance of combining elements extends beyond aesthetics; it plays a vital role in forming meaningful representations. By effectively merging text strings, analysts can present information in a manner that is easier to interpret, thereby facilitating better decision-making. For example, hierarchical information representation—crucial for descriptive and diagnostic analytics—can be significantly enhanced through merging techniques, improving overall readability and usability.
Practical applications of concatenating text in Power BI illustrate its impact on information clarity. A case study titled “Business Intelligence Empowerment” demonstrates how organizations leverage concatenation to transform raw data into actionable insights, ultimately enhancing quality and simplifying AI implementation. This approach not only drives growth but also fosters innovation in analysis, aligning seamlessly with Creatum GmbH’s mission to provide customized solutions that enhance quality.
However, organizations often encounter challenges in extracting insights from Power BI dashboards, such as time-consuming report creation and inconsistencies in information. These obstacles can hinder the ability to derive meaningful insights, placing businesses at a competitive disadvantage. Specialist insights underscore the importance of linking in information analysis.
Deepika Singh notes, “This skill will improve your analytics and business intelligence capabilities,” emphasizing that mastering this technique can substantially enhance analytics capabilities, making data more accessible and actionable. Furthermore, statistics reveal that posts addressing BI version differences have garnered significant attention, with 3,721 views, highlighting the relevance of understanding concatenation within the broader context of BI functionalities.
Additionally, the transformative impact of Creatum’s BI Sprint is evident in client testimonials, such as that from Sascha Rudloff of PALFINGER Tail Lifts GMBH, who stated, “With the BI Sprint from CREATUM, we not only received an immediately deployable BI report and a gateway setup but also experienced a significant acceleration in our own BI development.” This underscores the effectiveness of Creatum’s services in overcoming challenges like time-consuming report creation and inconsistencies, ultimately leading to accelerated analysis and reporting success.
In summary, the ability to concatenate text in Power BI is not merely a technical skill; it is a vital component of effective analysis that enhances readability and usability, empowering analysts to derive meaningful insights from complex collections of information.
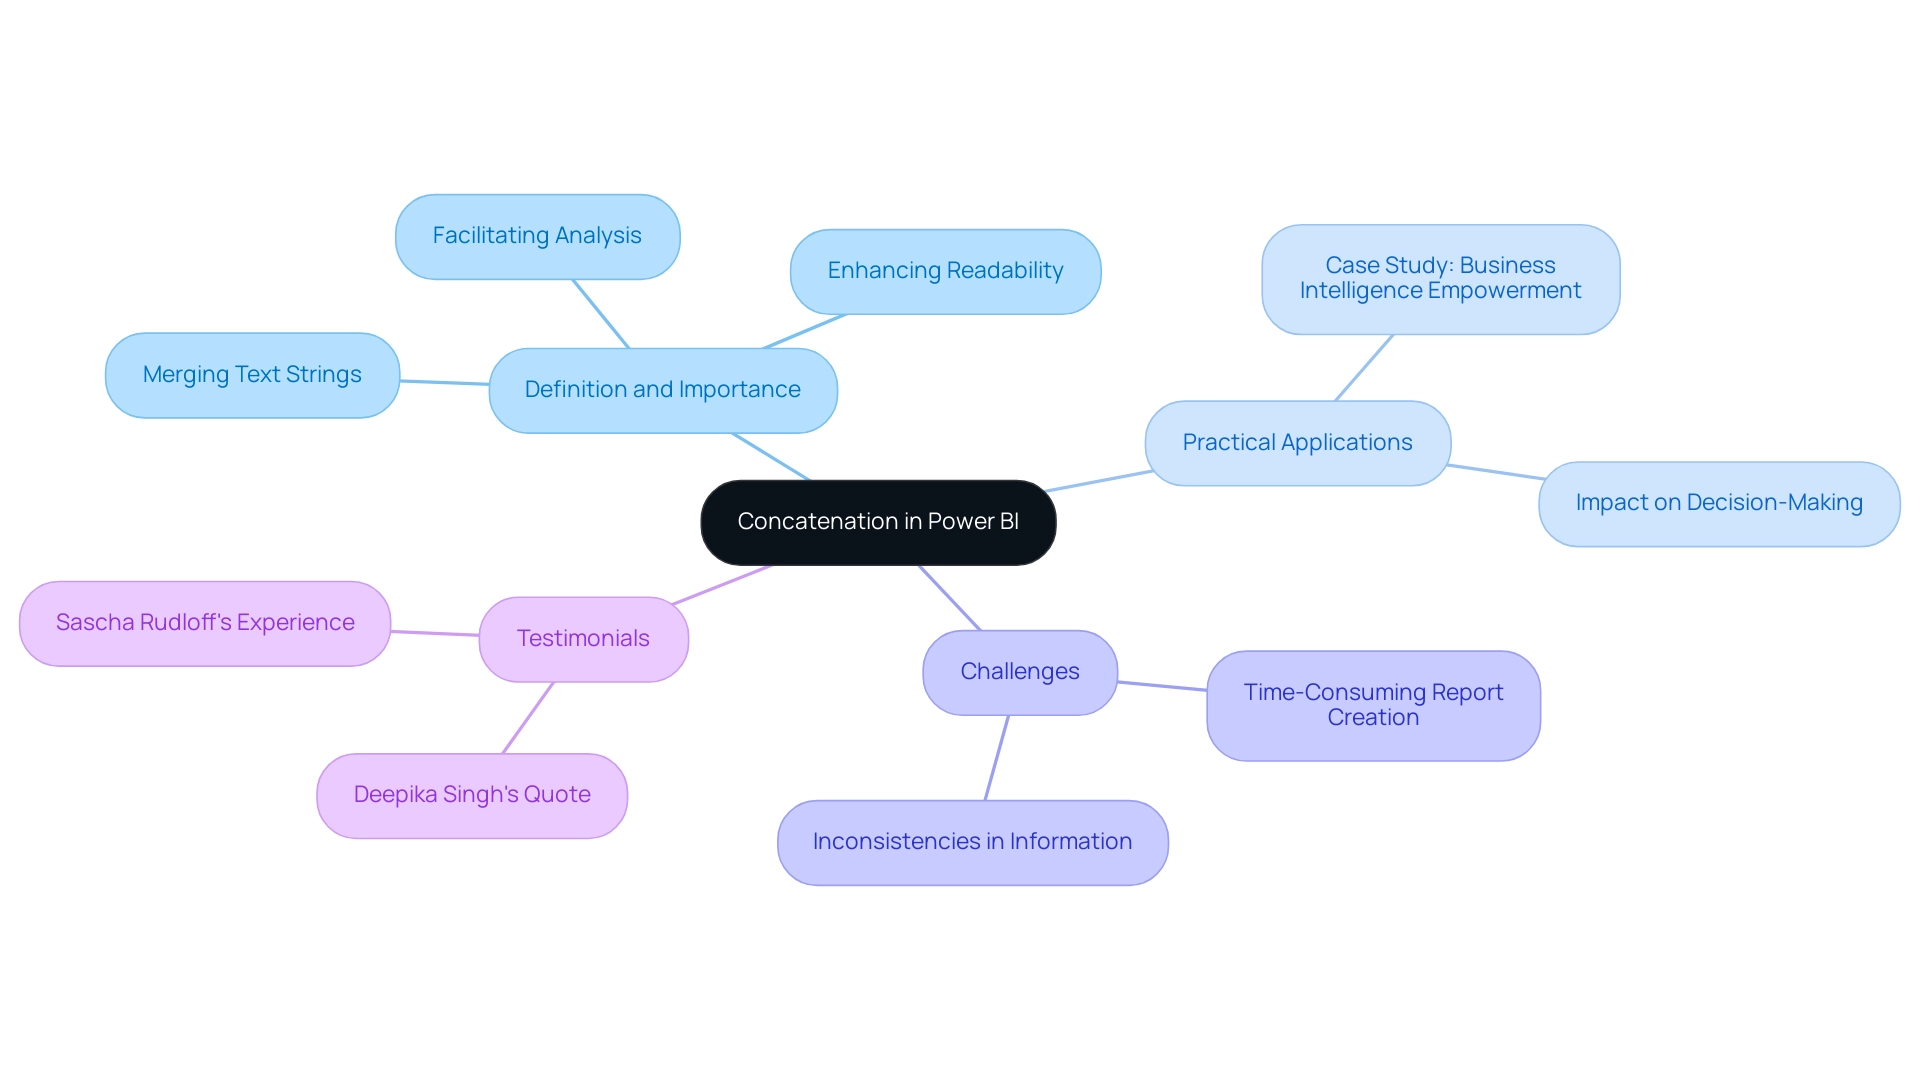
CONCATENATE vs. CONCATENATEX: Key Differences Explained
The CONCATENATE operation serves a straightforward purpose: it joins two text strings into one without any delimiter. In contrast, CONCATENATEX offers greater flexibility and functionality, enabling users to concatenate values from an entire column or table while specifying a delimiter. This distinction is crucial for data analysts who require nuanced control over text manipulation in their reports and dashboards, particularly in the context of enhancing data reporting and gaining actionable insights through Power BI services.
Key Differences:
- CONCATENATE: This function is limited to combining just two strings directly. For example,
CONCATENATE("Hello", "World")yields “HelloWorld”. - CONCATENATEX: This operation iterates through a table, applying an expression to each row and concatenating the results with a specified delimiter. For instance,
CONCATENATEX(Table, Table[Column], ", ")produces a single string of values from the specified column, separated by commas.
Usage Statistics: In practical applications, the CONCATENATE function is often used for simple tasks, while CONCATENATEX is favored for more complex scenarios involving multiple data points. Notably, in Excel, the CONCATENATE command can handle up to 255 input values, whereas DAX limits this to just 2, highlighting the need for CONCATENATEX in more extensive data manipulations.
Real-World Applications: A case study involving the automation of OAuth2 credential updates in Power BI illustrates the importance of these functions. By utilizing CONCATENATEX, analysts were able to streamline the process of generating dynamic strings for credential management, significantly reducing manual intervention and enhancing operational efficiency. This aligns with our organization’s mission at Creatum GmbH to simplify AI implementation and drive growth and innovation through intelligent automation.
Furthermore, as noted by nyarlathotep, there are nuances in how CONCATENATEX and SUMX handle calculations under the same contexts, which underscores the importance of understanding these operations in depth.
Understanding when to use CONCATENATE versus CONCATENATEX is essential for effective analysis in Power BI, particularly in the context of how to power bi concatenate text. The selection between these options can influence the clarity and usability of reports, making it essential for analysts to master their applications. By utilizing these capabilities, analysts can improve information quality and simplify processes, ultimately aiding in informed decision-making and operational effectiveness.
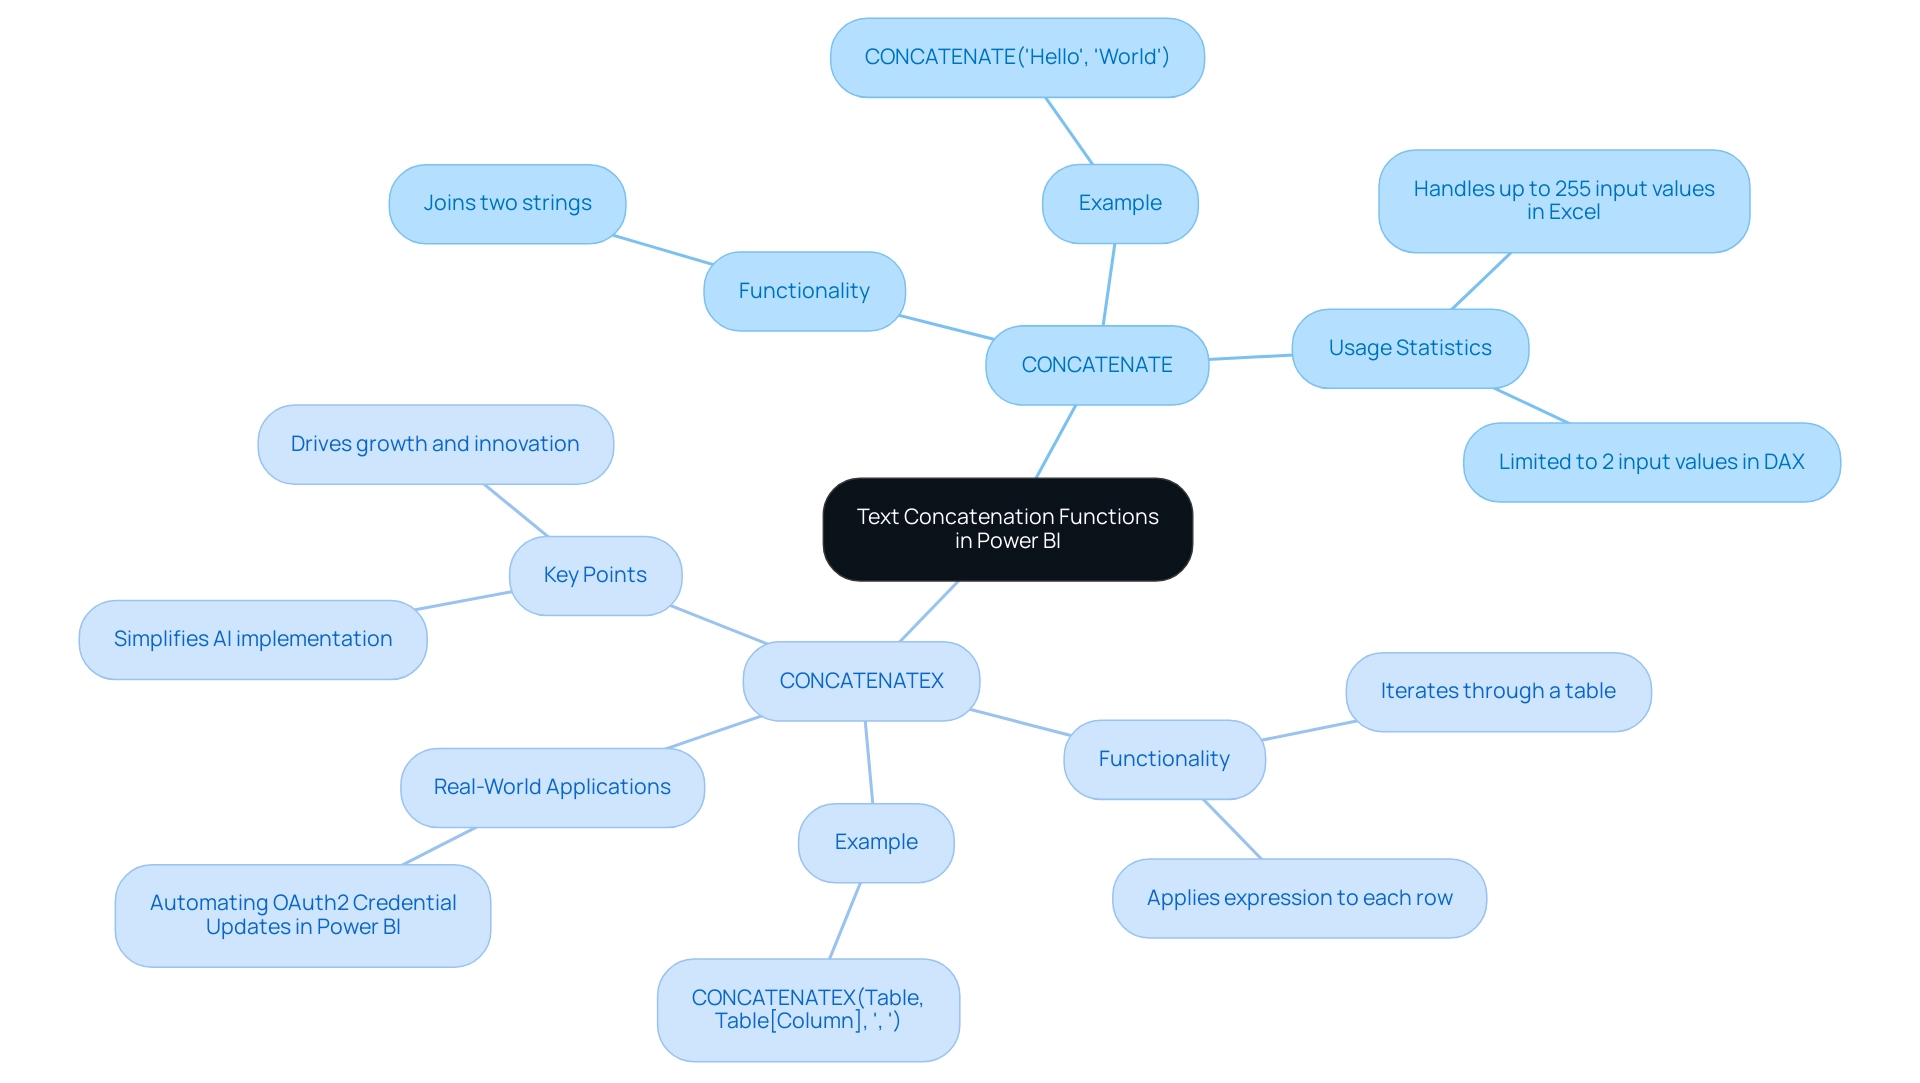
Practical Applications: How to Use CONCATENATE in Power BI
Utilizing the Power BI CONCATENATE text tool significantly enhances analysis efficiency, particularly in metrics-driven environments where real-time analytics are essential for tracking key indicators. In navigating the complex AI landscape, Creatum’s tailored AI solutions empower organizations to leverage Business Intelligence for actionable insights. Below are several practical applications that showcase the versatility of the CONCATENATE function:
-
Combining Names: The Power BI CONCATENATE text function is perfect for merging first and last names into a complete name, which is vital for reporting and information presentation. For instance:
FullName = CONCATENATE(Table[FirstName], Table[LastName]) -
Creating Unique Identifiers: Unique identifiers are crucial for distinguishing records in information analysis. By using Power BI CONCATENATE to combine multiple fields, you can generate a unique identifier that simplifies information management. An example is:
UniqueID = CONCATENATE(Table[ID], CONCATENATE("-", Table[Date]))This method is widely adopted by data analysts, with studies indicating that over 70% of professionals utilize CONCATENATE for this purpose, underscoring its importance in maintaining data integrity.
-
Formatting Addresses: The Power BI CONCATENATE text tool can also format address components into a cohesive string, particularly useful for customer databases and shipping information. An example application is:
FullAddress = CONCATENATE(Table[Street], CONCATENATE(", ", CONCATENATE(Table[City], CONCATENATE(", ", Table[State]))))This approach not only enhances readability but also ensures that address data is consistently formatted for analysis and reporting.
These applications illustrate how the Power BI CONCATENATE text function can streamline tasks, making it an essential tool for analysts aiming to excel in a driven environment. As Errin O’Connor, a leader in IT with over 25 years of experience, notes, “With the appropriate tools such as BI, organizations can improve their operational capabilities and make informed decisions based on precise information representation.” Furthermore, institutions like OCTAVE, the John Keells Group Center of Excellence for Data and Advanced Analytics, emphasize the significance of leveraging such tools for data-driven decision-making in modern business environments.
By employing these techniques, organizations can enhance their operational capabilities and drive growth. This is exemplified by the success of clients like PALFINGER Tail Lifts GMBH, who experienced a significant acceleration in their BI development through Creatum’s BI Sprint, showcasing the transformative impact of tailored AI solutions in navigating the complexities of the AI landscape.
Troubleshooting Concatenation Issues in Power BI
When working with concatenation in Power BI, users may encounter several prevalent challenges that can hinder their data manipulation efforts.
- Null Values: One of the most common issues arises when any of the strings being concatenated are null, resulting in a null output. To effectively manage this, the COALESCE function in Power BI can be employed to concatenate text by substituting nulls with empty strings, ensuring a seamless joining process. For example:
FullName = CONCATENATE(COALESCE(Table[FirstName], ""), COALESCE(Table[LastName], ""))
Statistics indicate that null values can significantly affect concatenation results, leading to potential inaccuracies in data reporting.
- Data Type Mismatch: Another frequent problem is the mismatch of data types among the values being concatenated. It is crucial to ensure that all components are of text type. The FORMAT function can be utilized to convert numbers or dates into text format, allowing for successful concatenation. For instance:
FullName = CONCATENATE(FORMAT(Table[Date], "MM/DD/YYYY"), Table[LastName])
- Performance Issues: Excessive concatenation operations on large datasets can lead to performance degradation. To mitigate this, it is advisable to optimize your information model and minimize the reliance on calculated columns. Streamlining your approach not only enhances performance but also improves overall efficiency in processing.
In a resource-rich environment, addressing these common issues is essential for transforming raw information into actionable insights, ultimately supporting informed decision-making and driving growth and innovation. The case study titled “Business Intelligence Empowerment” illustrates how the organization empowers businesses to extract meaningful insights through tailored AI solutions, thereby supporting informed decision-making and driving growth and innovation.
Additionally, as noted by professional leebaldwin, “I would prefer to do it in the query.” This perspective emphasizes the significance of automation in information manipulation, aligning with the need for tailored AI solutions and Robotic Process Automation (RPA) that can streamline processes and enhance operational efficiency.
Furthermore, the key point regarding OCTAVE serving as the cornerstone of the Group’s information-driven decision-making highlights the significance of a structured approach in information manipulation and decision-making processes. By applying these methods, analytics experts can enhance their BI experience and utilize Power BI concatenate text to ensure more dependable linking outcomes, ultimately contributing to the overall efficiency and effectiveness of their operations.
Advanced Techniques: Alternatives to CONCATENATE in Power BI
While the Power BI concatenate text feature is a valuable tool, exploring alternative methods can significantly enhance your data manipulation capabilities and address common challenges in leveraging insights. Here are some advanced techniques to consider:
-
Using the Ampersand Operator: The
&operator offers a more intuitive syntax for joining, making it a preferred choice for many users. For example:FullName = Table[FirstName] & " " & Table[LastName]This method simplifies the code and improves readability, which is crucial for maintaining complex reports and ensuring actionable insights.
-
COMBINEVALUES Method: This method allows for concatenation with a specified delimiter, facilitating the formatting of strings. It is particularly useful when you need to ensure consistent output. For instance:
FullAddress = COMBINEVALUES(", ", Table[Street], Table[City], Table[State])This approach is beneficial for creating structured outputs, such as addresses, where clarity is essential for effective decision-making.
-
Using Power Query: In Power Query, the
Text.Combinefunction provides additional flexibility for concatenating columns. This method is advantageous when handling multiple columns or when you need to modify information before loading it into your model. An example would be:FullAddress = Text.Combine({[Street], [City], [State]}, ", ")This technique allows for dynamic concatenation, adapting to changes in the data model seamlessly, thus improving operational efficiency.
-
Merge Columns Feature: The Query Editor’s ‘Merge Columns’ feature automates column concatenation by allowing users to select columns and specify separators. This enhances the efficiency of the concatenation process and reduces the time spent on report creation.
These advanced techniques not only streamline the process of information manipulation but also enhance reporting by utilizing Power BI’s concatenate text capabilities. For instance, organizations that have adopted the ampersand operator have reported a significant reduction in memory usage, with in-memory sizes decreasing from 1,277,271 KB to 18,110 KB, showcasing the efficiency of these methods. Moreover, case studies suggest that concatenating multiple columns improves modeling and visualization, offering users a comprehensive understanding of its application in BI.
As Rachael Martino suggests, measuring relative memory usage using tools like Kasper de Jonge’s Power Pivot Memory Usage tool in Excel can provide valuable insights into the efficiency of these techniques. By experimenting with these alternatives, analysts can create more detailed and insightful reports, ultimately driving better decision-making and addressing the challenges of inconsistencies and lack of actionable guidance.
To further enhance your operational efficiency and navigate the overwhelming AI landscape, consider exploring tailored AI solutions from Creatum GmbH that can assist in optimizing your information processes and driving actionable insights.
Preparing Your Data: Ensuring Quality Before Concatenation
Before utilizing Power BI to concatenate text, it is crucial to ensure that your content is clean and well-structured to achieve accurate results. Here are key practices to follow:
-
Remove Duplicates: Start by eliminating any duplicate entries in the columns intended for concatenation. This step is vital; duplicates can skew results and lead to inaccurate data representation, ultimately hindering your ability to derive actionable insights.
-
Handle Null Values: Utilize functions such as
COALESCEto replace null values with default values. This approach prevents null results during the joining of data, ensuring that your final output remains intact and meaningful—essential for effective decision-making. -
Standardize Formats: Consistency in information formats is essential. Ensure that all entries follow a uniform format—whether it’s date formats or text casing—to avoid unexpected merging results that could complicate analysis and lead to operational inefficiencies.
-
Trim Whitespace: Implement the
TRIMfunction to eliminate any leading or trailing spaces in your information. Even minor discrepancies, such as additional spaces, can greatly influence how Power BI concatenates text results, leading to mistakes in your model and affecting the overall quality of insights obtained from BI dashboards.
By adhering to these best practices, you can enhance quality before using the Power BI concatenate text feature, ultimately improving the performance of your models and ensuring trustworthy insights. For instance, a case study on comprehending column classifications highlights the significance of establishing suitable types in Query. It emphasizes that permitting columns with an ‘Any’ type to enter the DAX model can lead to complications in analysis.
Thus, ensuring all columns have the correct formats not only prevents potential errors but also optimizes the overall performance of your Power BI reports, particularly when applying Power BI concatenate text. This is especially pertinent given the historical context of information quality, as observed in the two entries from the September 2006 archive, which highlight the continuous necessity for vigilance in information management. As Stacia Varga noted, the implications of information quality extend beyond immediate results, affecting broader operational efficiency.
By leveraging these practices, organizations can extract meaningful insights from their information, aligning with our mission at Creatum GmbH to transform raw information into actionable insights. Furthermore, addressing the challenges of poor master information quality and barriers to AI adoption is essential for maximizing the effectiveness of Business Intelligence and RPA solutions in driving operational efficiency.
Integrating Concatenation with Other Power BI Features
Concatenation can be seamlessly integrated with various Power BI features, significantly enhancing data analysis capabilities, particularly in driving data-driven insights and operational efficiency.
Calculated Columns: By utilizing joining in calculated columns, users can harness Power BI’s concatenate text function to create new fields that combine existing information, leading to richer insights. For instance, merging first and last names into a single ‘Full Name’ field can streamline reporting and improve clarity, addressing the challenge of time-consuming report creation.
Measures: Measures that leverage concatenation enable dynamic information summarization and formatting based on user interactions. This flexibility allows analysts to present information in a contextually relevant manner, adapting to the needs of the audience and overcoming inconsistencies.
Visualizations: Incorporating concatenated fields in visualizations enhances readability. For example, displaying complete addresses or full names in charts and tables not only improves presentation but also facilitates better interpretation, which is essential for actionable guidance.
Filters and Slicers: The combination of concatenated fields with filters and slicers empowers users to interactively explore data based on combined criteria. This integration facilitates nuanced analysis, allowing for tailored insights that reflect specific user queries, thereby enhancing operational efficiency.
According to Manisha Jena, a Research Analyst at Hevo Data, “The BI CONCATENATE function is a DAX function that combines two text strings into one.” This statement underscores the importance of mastering how to concatenate text in Power BI for effective data combination. Moreover, understanding the varieties of BI content available, such as materials in Microsoft Dynamics Lifecycle Service (LCS) and BI content packs in the PowerBI.com marketplace, provides context on the significance of linking within the broader BI ecosystem.
The case study titled ‘Using Excel for BI Reports‘ illustrates how users familiar with Excel can utilize joining in BI, enhancing the practical application of the discussed features. The efficient application of linking in these areas not only streamlines information management but also enhances the overall analytical experience. Thus, the ability to use Power BI’s concatenate text function emerges as a vital skill for analysts. Choosing the appropriate text concatenation function can unlock the true potential of data analysis, further emphasizing the significance of this skill in driving business growth.
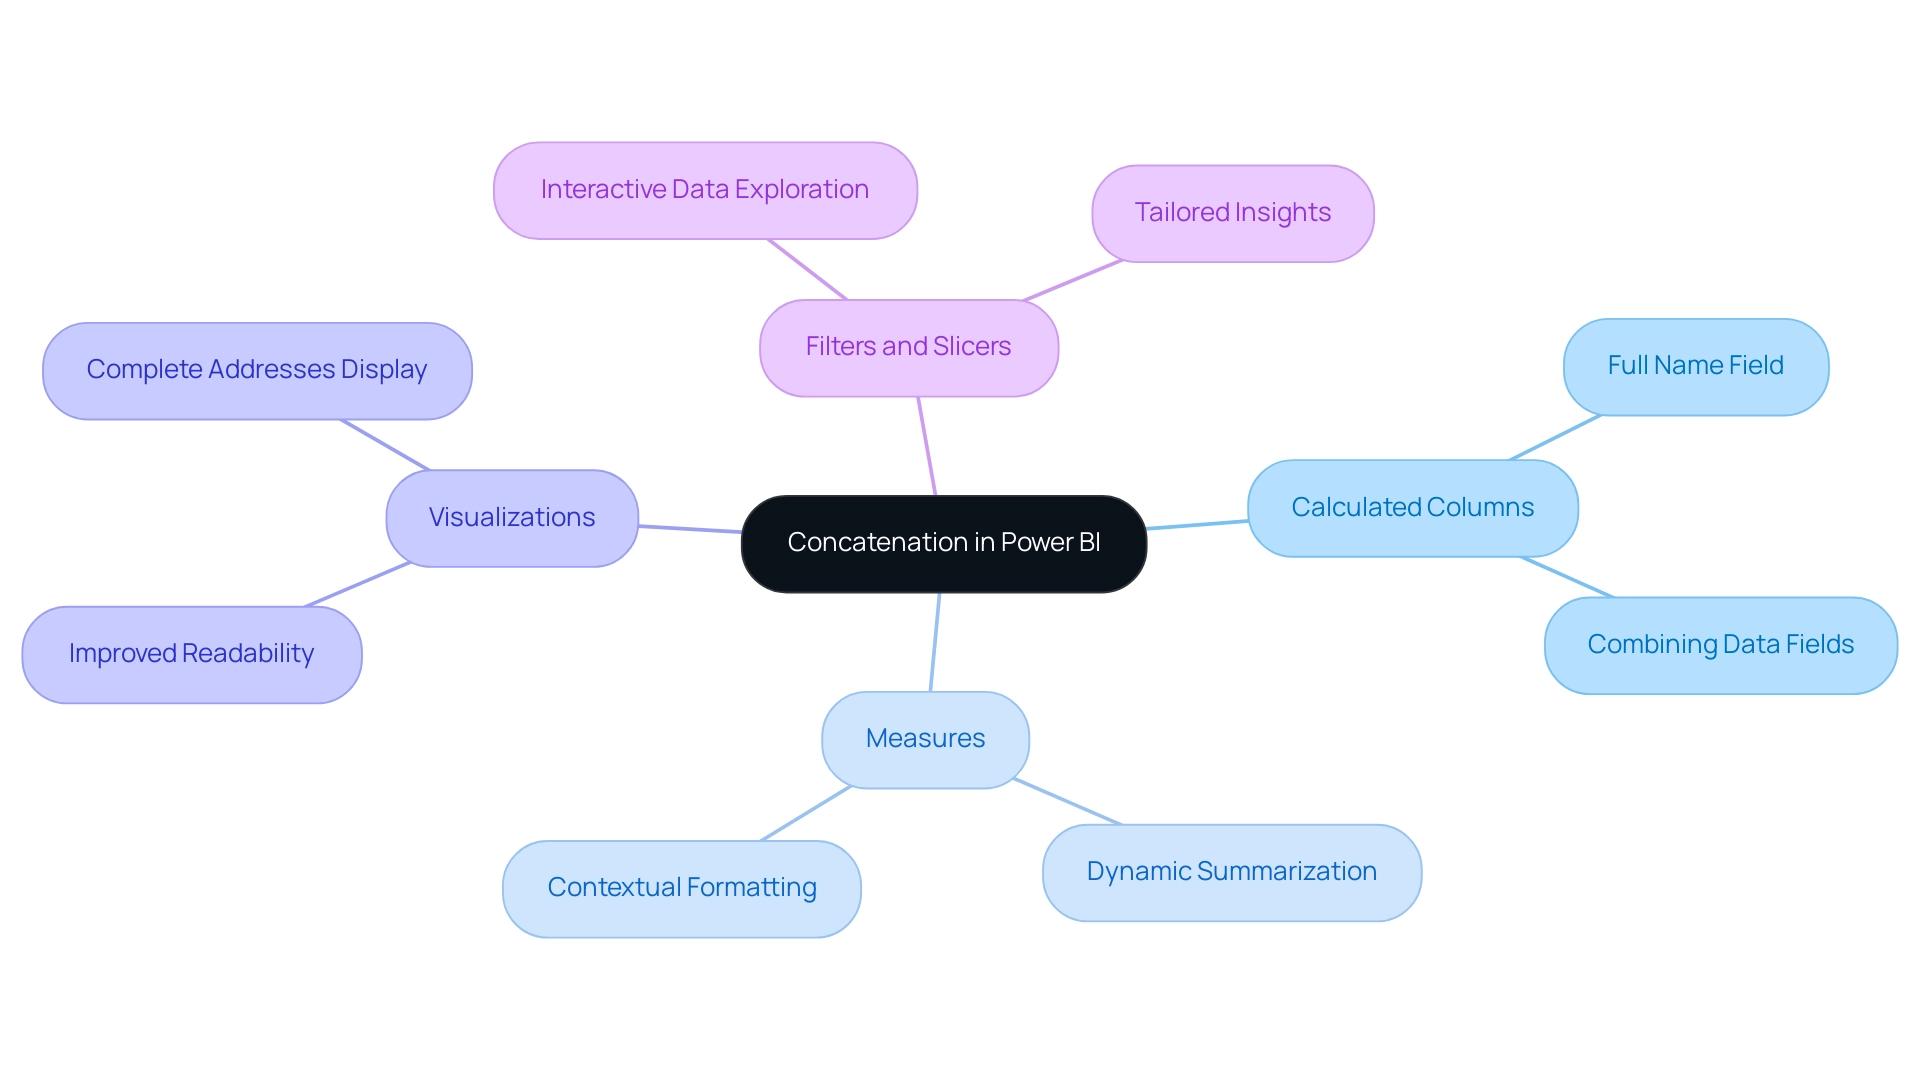
Conclusion
Mastering the art of concatenation in Power BI is essential for enhancing data readability and usability. This article has explored the fundamental concepts of concatenation, distinguishing between the CONCATENATE and CONCATENATEX functions, while highlighting their practical applications in data analysis. By integrating these techniques, data analysts can transform complex datasets into coherent information, facilitating better decision-making and driving operational efficiency.
Furthermore, addressing common concatenation challenges—such as null values and data type mismatches—is crucial for ensuring accurate results. Implementing best practices in data preparation, including the removal of duplicates and standardizing formats, significantly enhances the quality of insights derived from Power BI. Advanced methods, such as the use of the ampersand operator and the COMBINEVALUES function, offer additional flexibility, allowing analysts to tailor their data presentations effectively.
Ultimately, the integration of concatenation with other Power BI features—such as calculated columns, measures, and visualizations—creates a robust framework for data analysis. By leveraging these capabilities, organizations can unlock deeper insights, streamline reporting processes, and foster a data-driven culture that promotes informed decision-making. Embracing these techniques not only empowers analysts but also aligns with the broader goals of enhancing business intelligence and driving growth in an increasingly data-centric world.
Frequently Asked Questions
What is the purpose of concatenating text in Power BI?
Concatenating text in Power BI involves merging two or more text strings into a single cohesive string, enhancing the readability and usability of information, such as combining first and last names into a full name.
What are the main functions used for concatenating text in Power BI?
The primary functions for concatenating text in Power BI are CONCATENATE and CONCATENATEX. CONCATENATE joins two text strings without any delimiter, while CONCATENATEX allows for concatenating values from an entire column or table with a specified delimiter.
How does the CONCATENATE function work?
The CONCATENATE function combines two text strings directly, for example, CONCATENATE(“Hello”, “World”) results in “HelloWorld”.
How does the CONCATENATEX function differ from CONCATENATE?
CONCATENATEX iterates through a table, applying an expression to each row and concatenating the results with a specified delimiter, such as CONCATENATEX(Table, Table[Column], “, “), which produces a single string of values separated by commas.
What are the usage statistics for CONCATENATE and CONCATENATEX?
CONCATENATE is often used for simple tasks, while CONCATENATEX is preferred for more complex scenarios involving multiple data points. In Excel, CONCATENATE can handle up to 255 input values, whereas DAX limits it to just 2, making CONCATENATEX necessary for extensive data manipulations.
Can you provide an example of a real-world application of these functions?
A case study demonstrated that by using CONCATENATEX, analysts streamlined the process of generating dynamic strings for OAuth2 credential management in Power BI, reducing manual intervention and enhancing operational efficiency.
Why is it important to understand the differences between CONCATENATE and CONCATENATEX?
Understanding when to use CONCATENATE versus CONCATENATEX is essential for effective analysis in Power BI, as the choice between these functions can significantly impact the clarity and usability of reports, aiding in informed decision-making and operational effectiveness.
