Overview
BI charts play a pivotal role in data visualization, transforming complex datasets into clear visuals. This transformation enables organizations to swiftly analyze trends and make informed decisions. How effectively are you leveraging these tools? The significance of BI charts is underscored by their ability to enhance comprehension and drive strategic initiatives. Particularly in Power BI, tailored solutions can profoundly improve data representation and operational efficiency. By adopting these practices, organizations can elevate their data-driven strategies and foster a culture of informed decision-making.
Introduction
In the realm of business intelligence, effective data visualization is paramount for making informed decisions. Business Intelligence (BI) charts emerge as essential instruments that transform complex datasets into accessible visuals. These charts simplify information for stakeholders and highlight trends and insights that can drive strategic actions.
As organizations increasingly rely on data to navigate market complexities, understanding the different types of charts available—such as waterfall, bar, and line charts—becomes crucial.
This article delves into the significance of BI charts, explores their various types, and provides practical guidance on creating and customizing these visualizations to enhance clarity and impact. With the right approach, businesses can leverage these tools to unlock actionable insights and foster growth in an ever-evolving data landscape.
What Are BI Charts and Their Importance in Data Visualization?
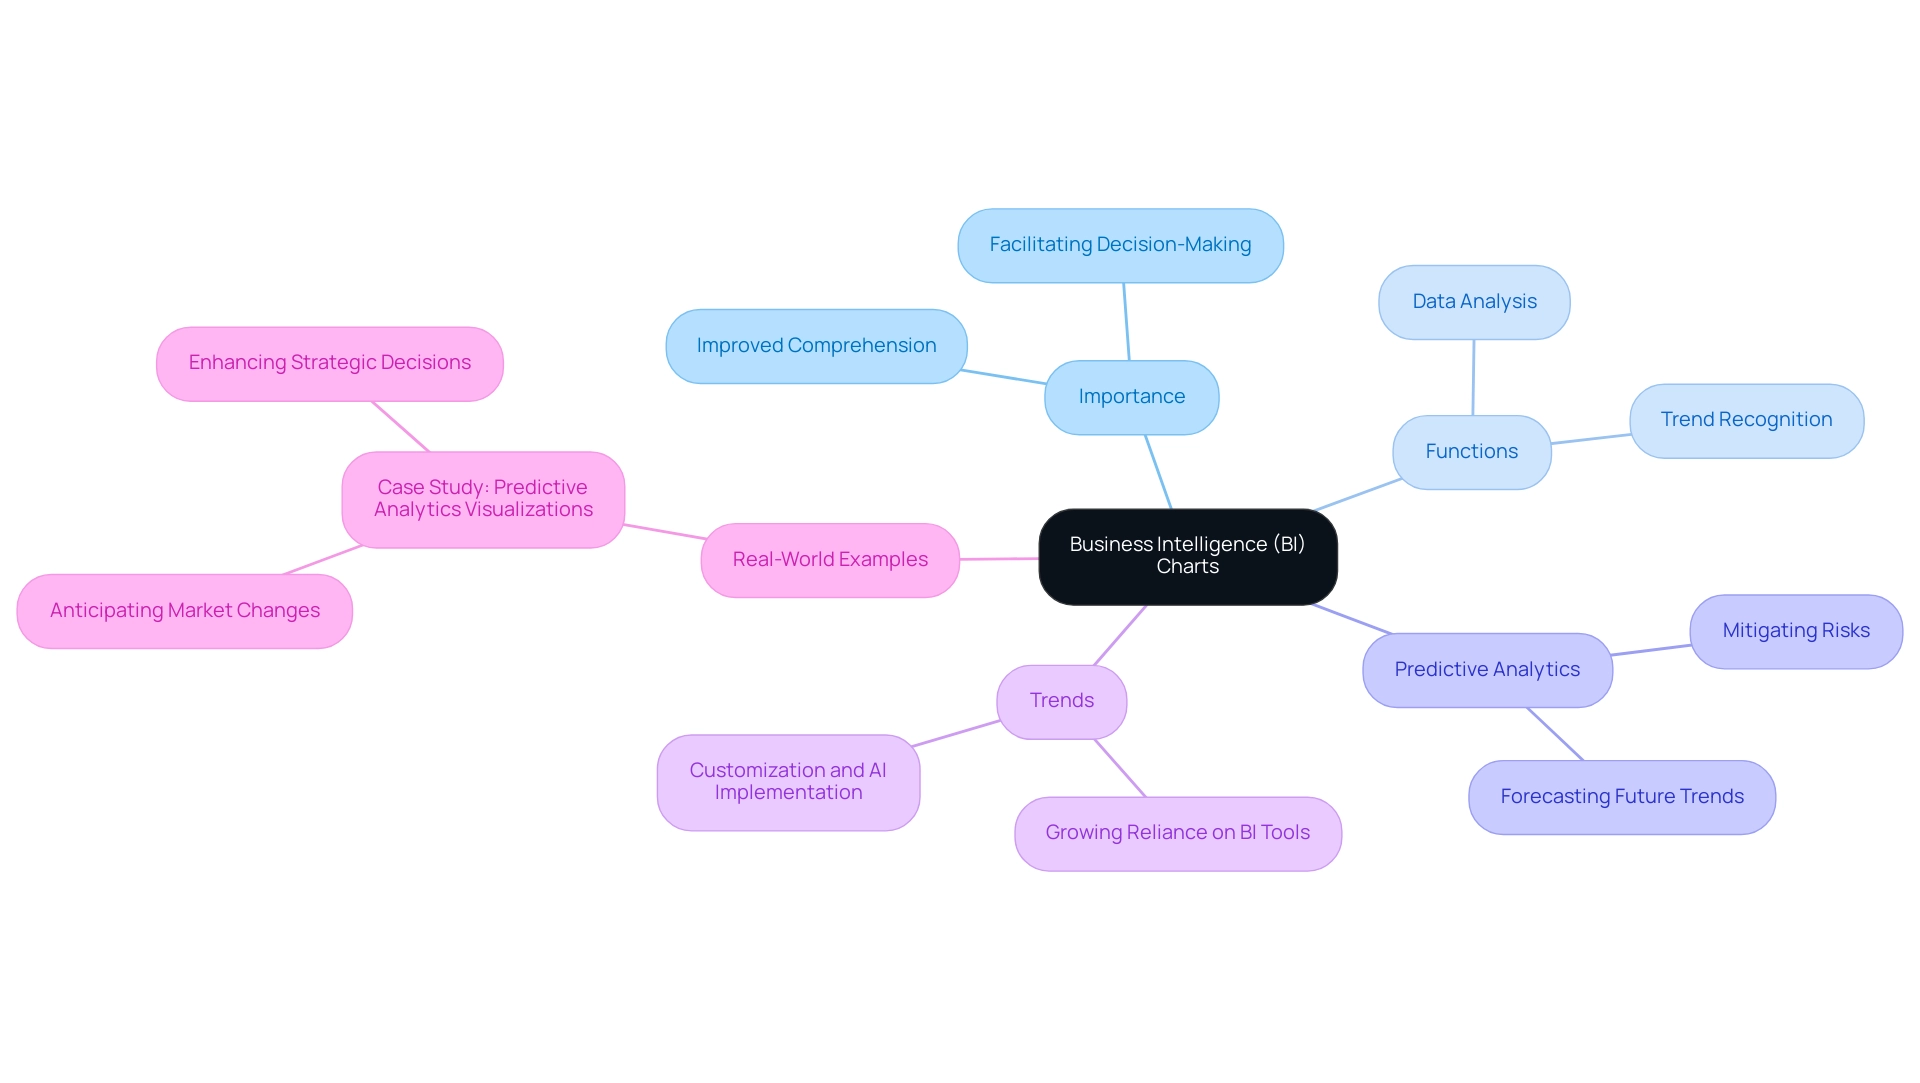
Business Intelligence (BI) visuals are essential tools that empower organizations to analyze and interpret complex datasets with precision. By transforming unprocessed information into clear visuals, these representations streamline details, enabling stakeholders to recognize insights and trends swiftly. In the context of Power BI, BI visuals not only enhance the communication of insights but also facilitate rapid, informed decision-making.
The significance of BI graphs in information representation lies in their ability to improve comprehension and promote strategic initiatives within organizations. For instance, predictive analytics representations allow companies to forecast future trends based on historical data, enabling them to anticipate market shifts and mitigate risks. This capability is vital in today’s data-rich environment, where organizations must navigate complexities to maintain a competitive edge.
Recent trends indicate a growing reliance on BI charts, with 2025 poised to be a pivotal year for the adoption of these tools. As organizations increasingly recognize the value of visualization, the demand for tailored solutions that enhance quality and simplify AI implementation has surged. This aligns with Creatum GmbH’s unique value proposition, which emphasizes customized AI solutions that enable businesses to leverage information effectively.
Moreover, continuous learning is crucial in the realm of business intelligence. Engaging in initiatives like MDS@Rice equips individuals with the latest skills and knowledge, ensuring they stay ahead in the data-driven landscape.
Real-world examples underscore the impact of BI charts on decision-making. Organizations utilizing these graphical tools, as highlighted in the case study on predictive analytics representations, have reported enhanced clarity in their analyses, leading to more strategic and informed decisions. As Mussarat Nosheen aptly states, “Information representation is an essential element of contemporary business intelligence, allowing organizations to convert intricate information into actionable insights.”
This sentiment reflects a growing consensus on the vital role BI visuals play in shaping effective business strategies.
Exploring Different Types of Charts in Power BI
Power BI offers a wide variety of BI charts, each meticulously designed to meet specific visualization requirements. Understanding these options is crucial for effectively conveying insights, especially in light of common challenges such as time-consuming report creation, inconsistencies, and the lack of actionable guidance that can erode trust in the data presented. The primary chart types include:
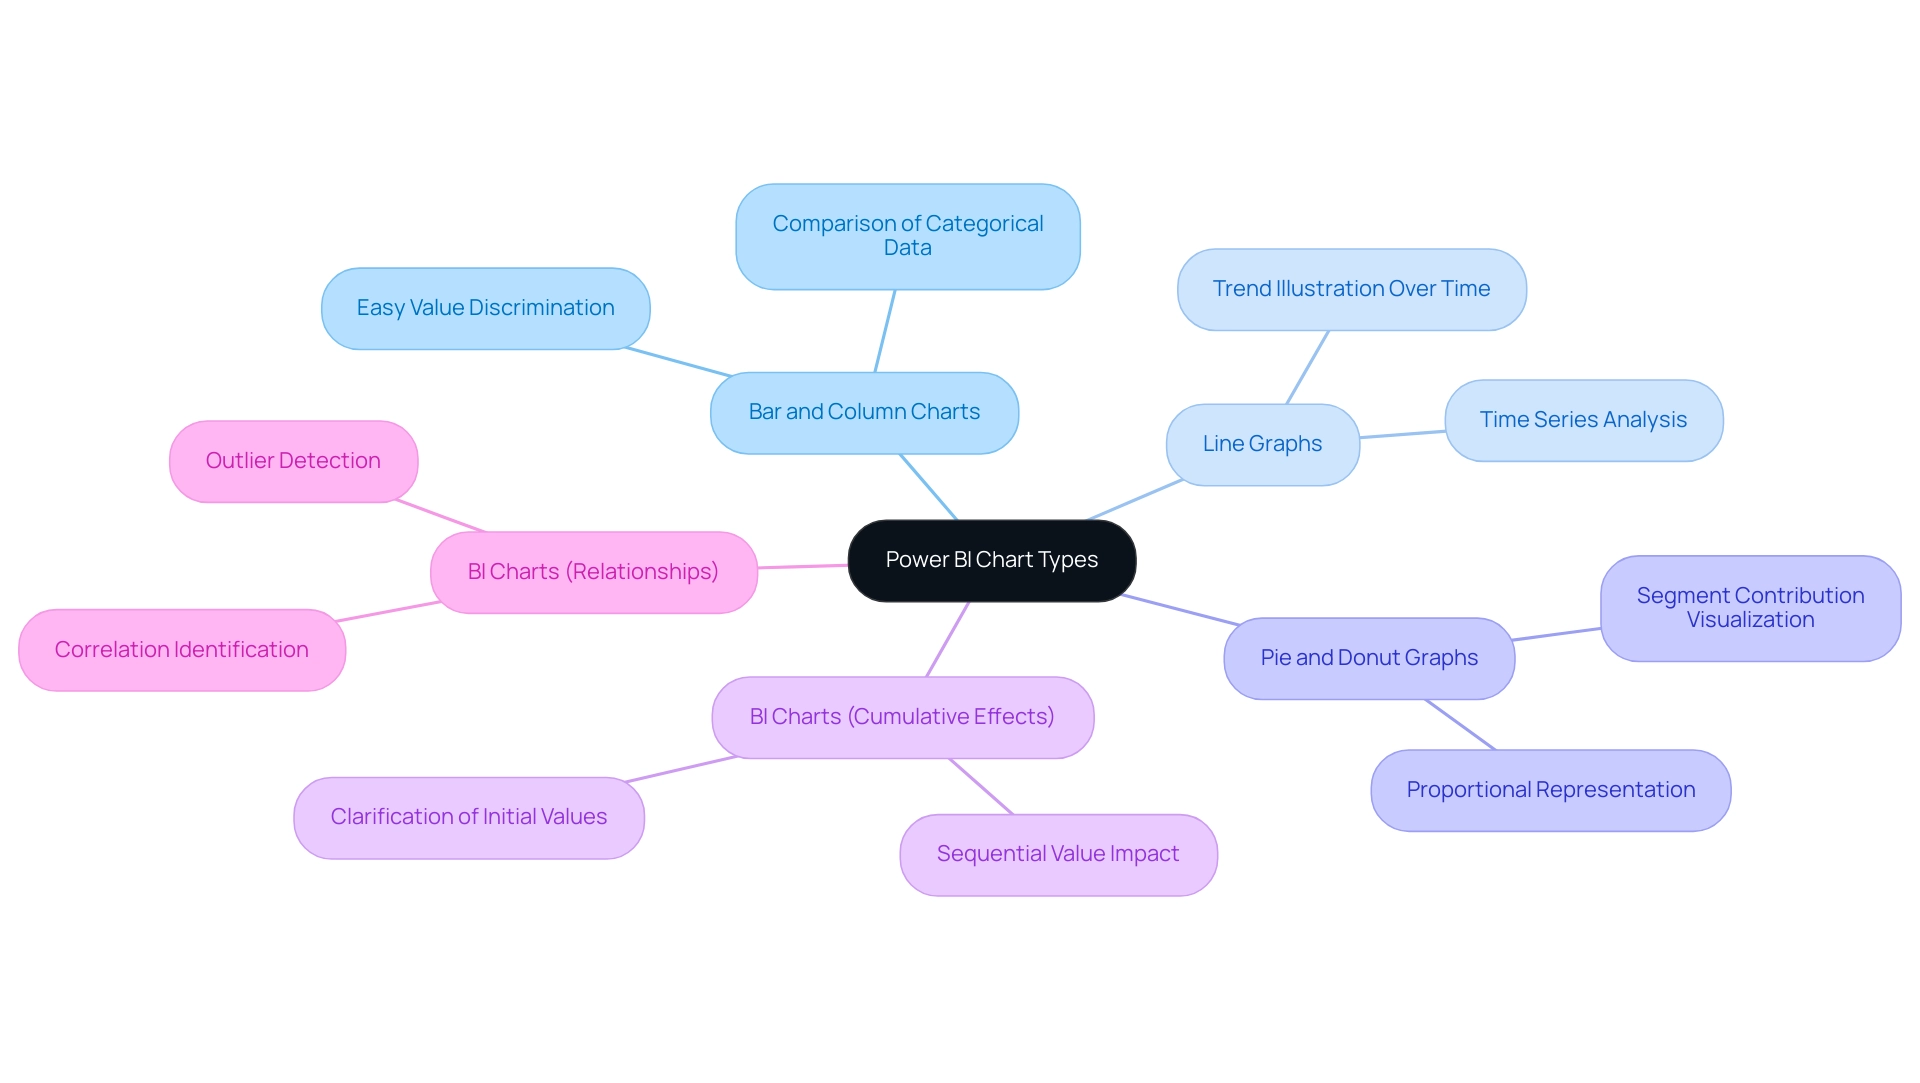
- Bar and Column Charts: Excellent for comparing categorical data, these charts allow users to easily discern differences in values across categories.
- Line Graphs: Ideal for illustrating trends over time, line graphs enable users to track changes and patterns in data, making them essential for time series analysis, akin to BI charts.
- Pie and Donut Graphs: Effective for displaying proportions of a whole, these visuals help to visualize how individual segments contribute to the total, similar to BI charts.
- BI Charts: Particularly useful for visualizing the cumulative effects of sequentially introduced values, BI charts clarify how initial values are impacted by subsequent additions or subtractions.
- BI Charts: These are valuable for showcasing relationships between two variables, enabling users to identify correlations and outliers within their information.
In 2025, the latest updates to Power BI introduced enhanced features for these visual types, significantly improving usability and functionality. For instance, network diagrams have gained popularity for illustrating intricate connections, particularly in hierarchical information contexts. A case study on network diagrams demonstrated their effectiveness in displaying complex relationships, while also emphasizing the importance of clarity in design to prevent overwhelming users.
Expert opinions underscore the significance of selecting the appropriate graph type according to the information narrative being conveyed. As organizations increasingly adopt business intelligence tools, understanding the most popular types of graphs, such as BI charts, bar, and line, becomes essential for effective data analysis. Notably, out of 1,523 surveyed individuals, 843 voted ‘Yes’ on the effectiveness of these chart types, while 520 voted ‘No’, and 160 abstained, indicating a strong preference for certain representations.
Successful case studies illustrate how various organizations utilize these representations to derive actionable insights, ultimately enhancing operational efficiency and informed decision-making. As highlighted by Sascha Rudloff, Team Leader of IT and Process Management at PALFINGER Tail Lifts GMBH, “Mit dem Power BI Sprint von CREATUM haben wir nicht nur einen sofort einsetzbaren Power BI Bericht und ein Gateway Setup erhalten, sondern auch eine signifikante Beschleunigung unserer eigenen Power BI Entwicklung erlebt.” This testimonial underscores the transformative impact of Creatum’s Power BI Sprint on business intelligence development, particularly in addressing the challenges of report creation and providing clear, actionable guidance that enhances information quality and simplifies AI implementation.
Understanding Waterfall Charts: Definition and Use Cases
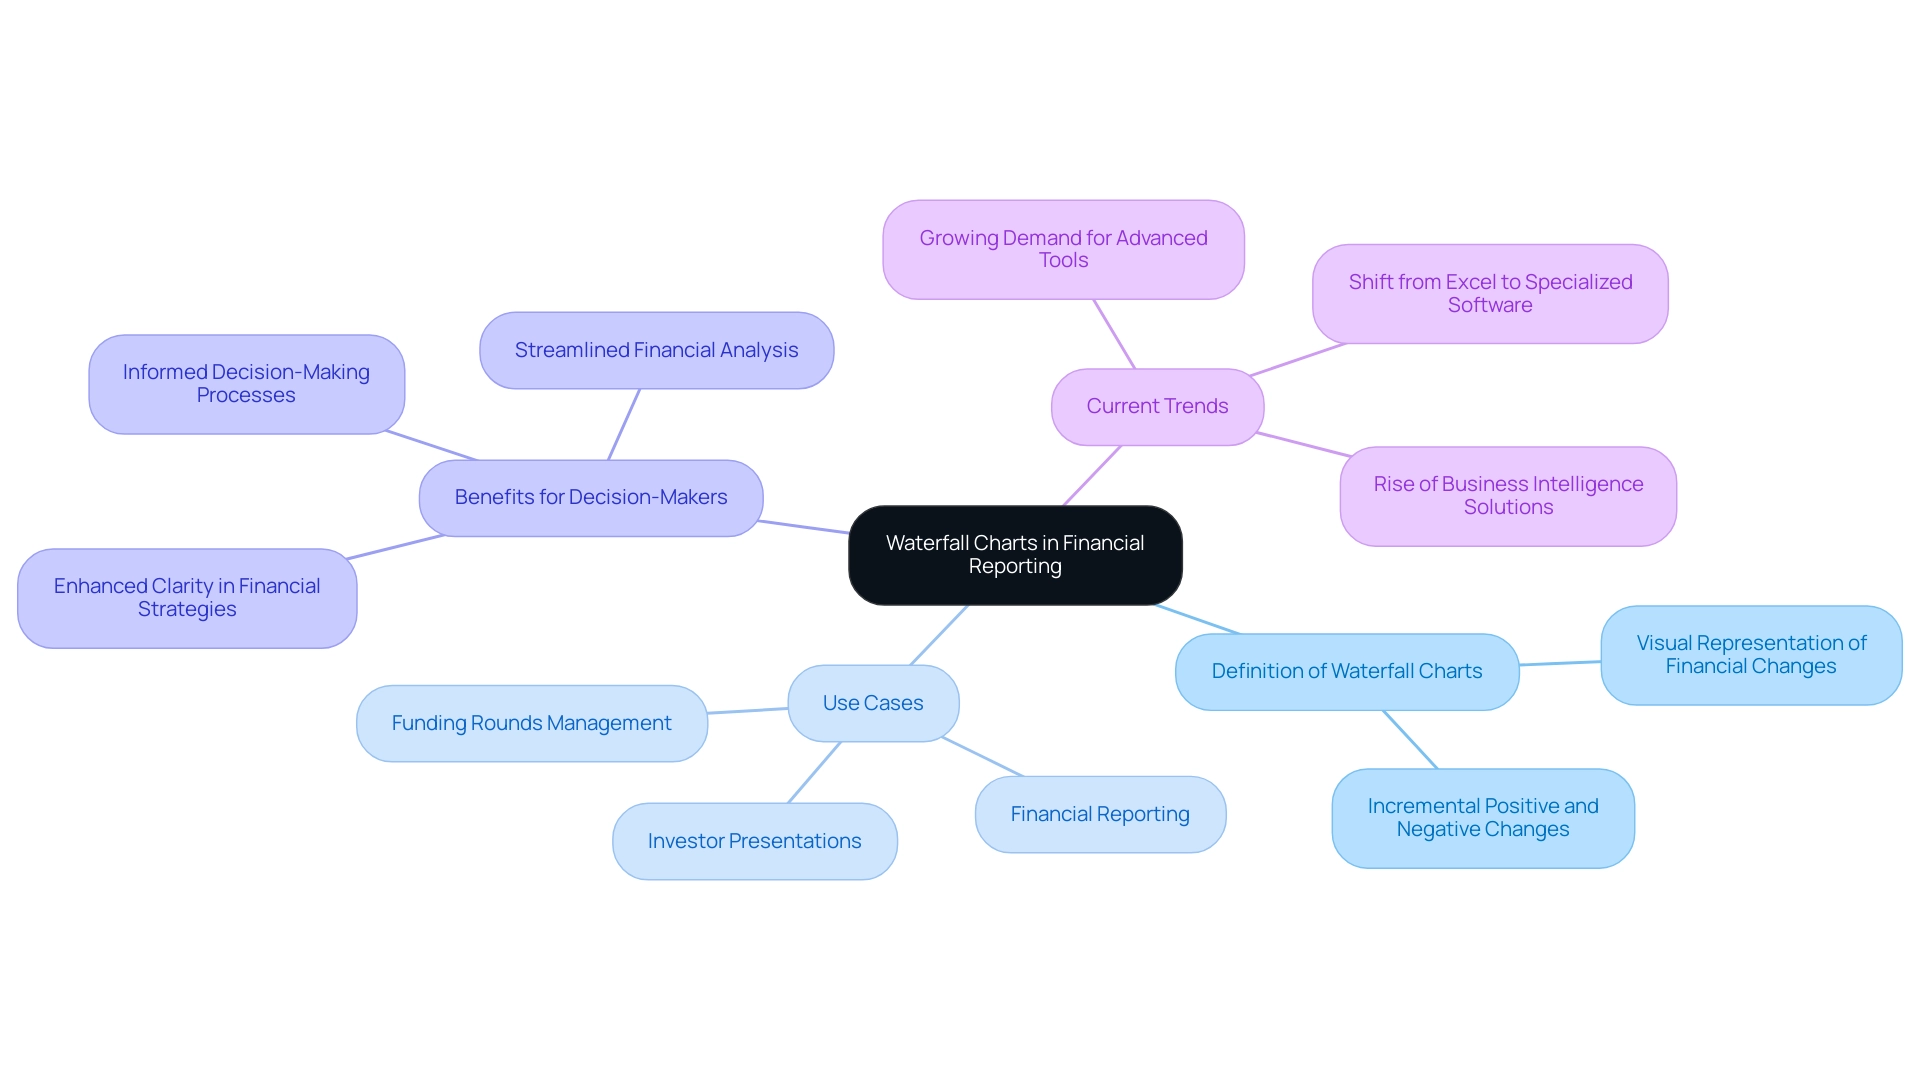
A cascading diagram serves as a powerful representation tool, effectively illustrating how a starting value is influenced by a series of incremental positive and negative changes. This visualization proves particularly advantageous in financial reporting, as it clearly depicts profit and loss over time, alongside the impact of various factors on revenue streams. For instance, a cascading diagram can adeptly showcase the progression of sales figures from one period to another, highlighting both increases and decreases in a visually clear manner.
The utility of cascading diagrams extends beyond mere representation; they are vital resources for decision-makers, distilling complex data into easily digestible insights. Current trends indicate that as businesses expand their investor bases and secure additional financing, the demand for sophisticated financial evaluation tools, such as graphical representations, becomes increasingly essential. Statistics reveal that organizations utilizing flow charts in their financial reporting have experienced heightened clarity in their financial strategies, ultimately fostering more informed decision-making processes.
Moreover, tiered analysis is poised to gain traction as a financial tool, particularly as companies expand and their shareholder pools grow. Case studies further underscore the rising significance of tiered analysis within the financial landscape. For example, Eqvista’s tiered analysis tool has proven instrumental for companies navigating intricate funding rounds, enabling them to manage future investments with greater efficacy. This tool streamlines the calculation of financial rounds upon exit, aligning with the overarching goal of enhancing financial strategy and decision-making processes.
As Excel becomes increasingly inadequate for sequential analysis—due to an expanding number of shareholders and complex scenarios—the demand for advanced tools like Eqvista is on the rise. By leveraging such tools, companies can gain deeper insights into their financial cycles, thereby refining their financial strategies and enhancing overall operational efficiency.
In today’s data-rich environment, employing Business Intelligence (BI) through tools like Power BI and BI charts can significantly augment the effectiveness of sequential diagrams. Creatum GmbH’s Power BI services facilitate efficient reporting and data consistency, empowering organizations to convert raw data into actionable insights. With offerings like the 3-Day Power BI Sprint, businesses can swiftly produce professionally crafted reports that amplify the insights derived from flow diagrams.
As the need for clear and actionable financial insights continues to escalate, BI charts, bolstered by robust BI solutions, are set to emerge as a pivotal component of business intelligence and financial reporting by 2025.
Step-by-Step Guide to Creating Waterfall Charts in Power BI
Creating BI charts, such as a waterfall chart in Power BI, is a straightforward process that significantly enhances visualization and facilitates informed decision-making across various business functions. This capability is particularly vital in the realm of Business Intelligence, where converting raw data into actionable insights is essential for driving growth and operational efficiency. Moreover, integrating Robotic Process Automation (RPA) can streamline information handling processes, further enhancing the effectiveness of BI tools like Power BI.
To effectively create and customize your chart, follow these steps:
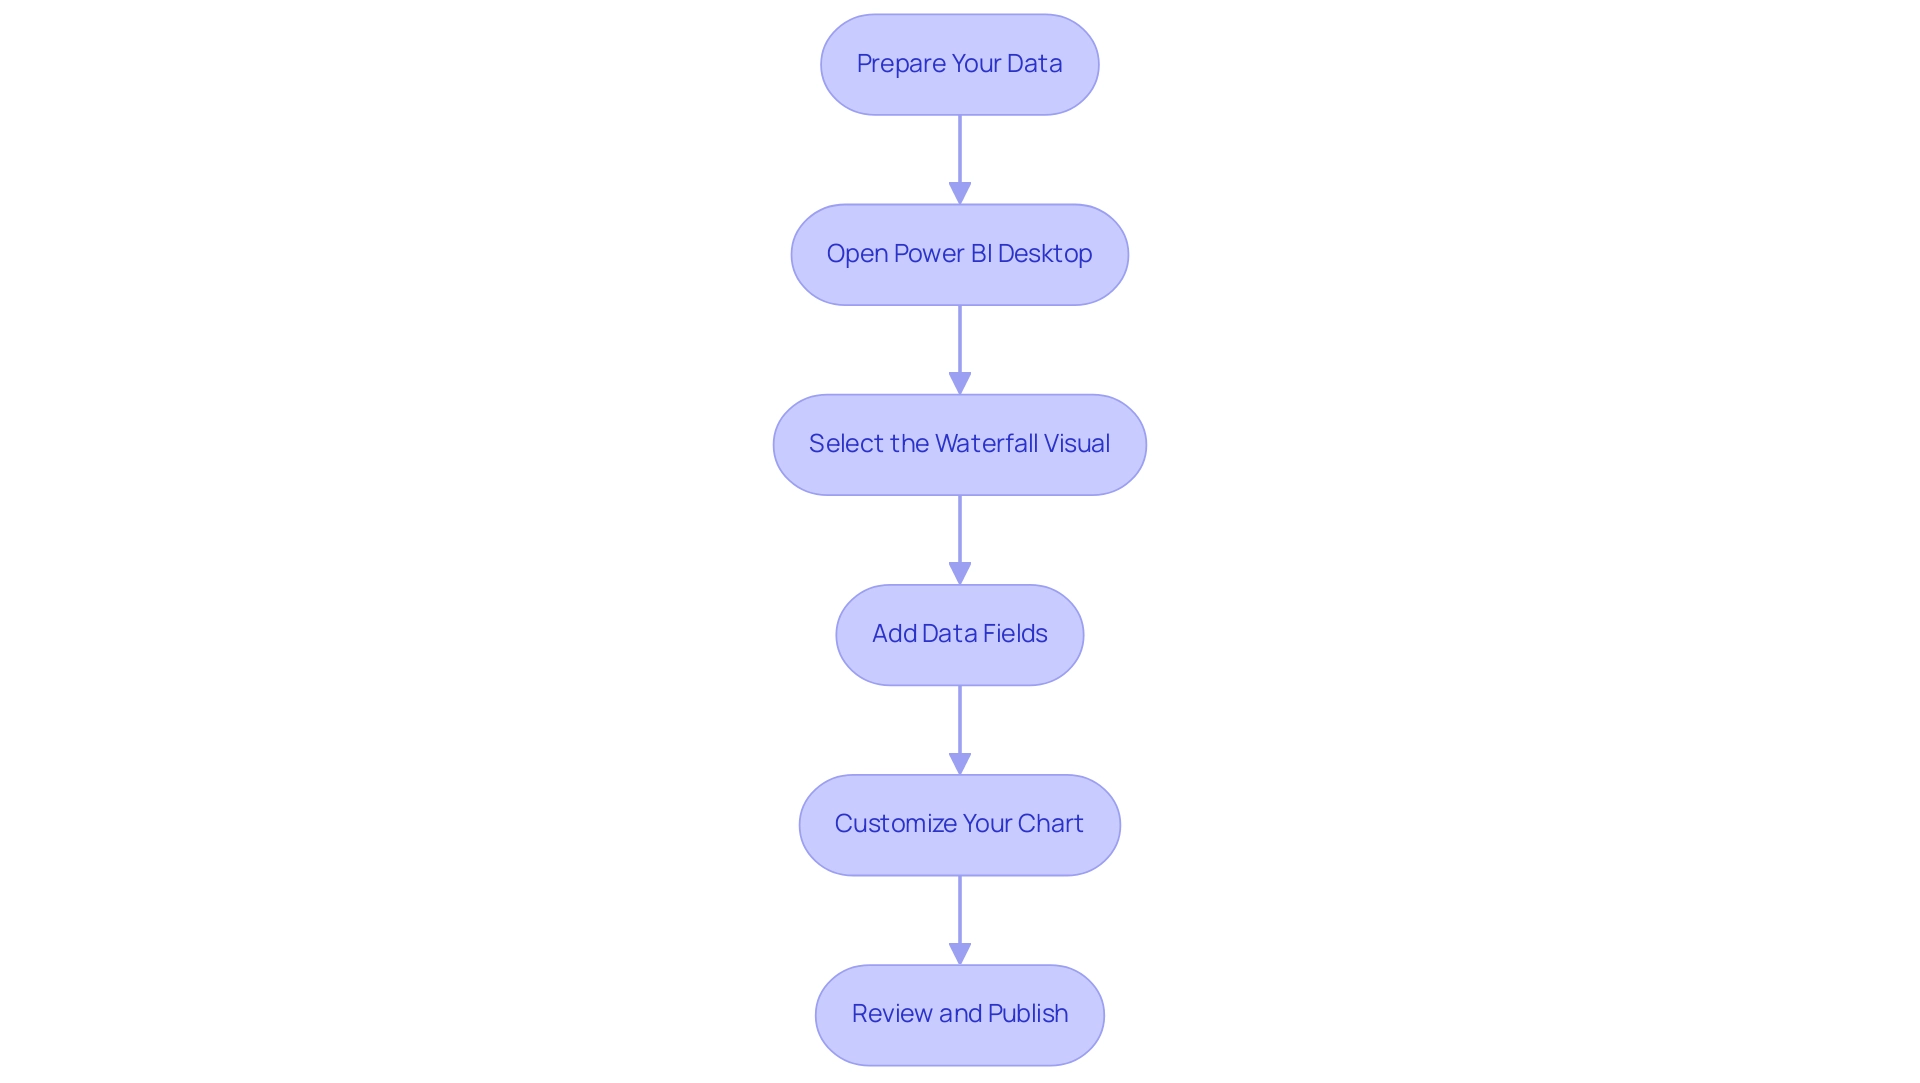
- Prepare Your Data: Ensure your dataset includes the necessary values for both the initial state and subsequent changes. This foundational step is crucial for accurate representation in BI charts, helping to mitigate challenges such as data inconsistencies.
- Open Power BI Desktop: Launch the application and load your prepared dataset to begin the visualization process.
- Select the Waterfall Visual: In the Visualizations pane, locate and select the waterfall icon to initiate the creation of the visual. Add Data Fields: Drag and drop the relevant fields into the ‘Values’ and ‘Category’ areas. This step establishes how your information will be illustrated in the graph, enabling a clear representation of changes over time.
- Customize Your Chart: Tailor the appearance of your chart by adjusting colors, labels, and titles. Customization enhances clarity, ensuring that your audience can easily interpret the data displayed in BI charts, which is essential for effective decision-making.
- Review and Publish: After finalizing your visualization, review it for accuracy and clarity. Once satisfied, save your work and publish it to the Power BI service for sharing with stakeholders.
In practical applications, note that March has the largest positive variance while July has the largest negative variance, effectively demonstrated using BI charts. Furthermore, these charts allow users to perform ‘what-if’ evaluations, simulating various scenarios and illustrating possible results, including the effect of price alterations on customer loyalty.
While these types of graphs are beneficial, it’s crucial to acknowledge options like bar graphs, stacked bar graphs, and diverging bar graphs, each providing distinct benefits and drawbacks based on the information displayed. As Jon Oringer wisely noted, it’s essential to question whether specific tools are truly needed, aligning with a strategic focus on operational efficiency. Additionally, addressing issues like lengthy report preparation and inconsistencies in information can enhance the overall efficacy of insights obtained from Power BI dashboards.
By adhering to these measures and integrating best practices, users can effectively illustrate their information using BI charts, thereby enhancing their decision-making abilities and leveraging Business Intelligence and RPA to propel business growth.
Customizing Your Waterfall Chart for Enhanced Clarity
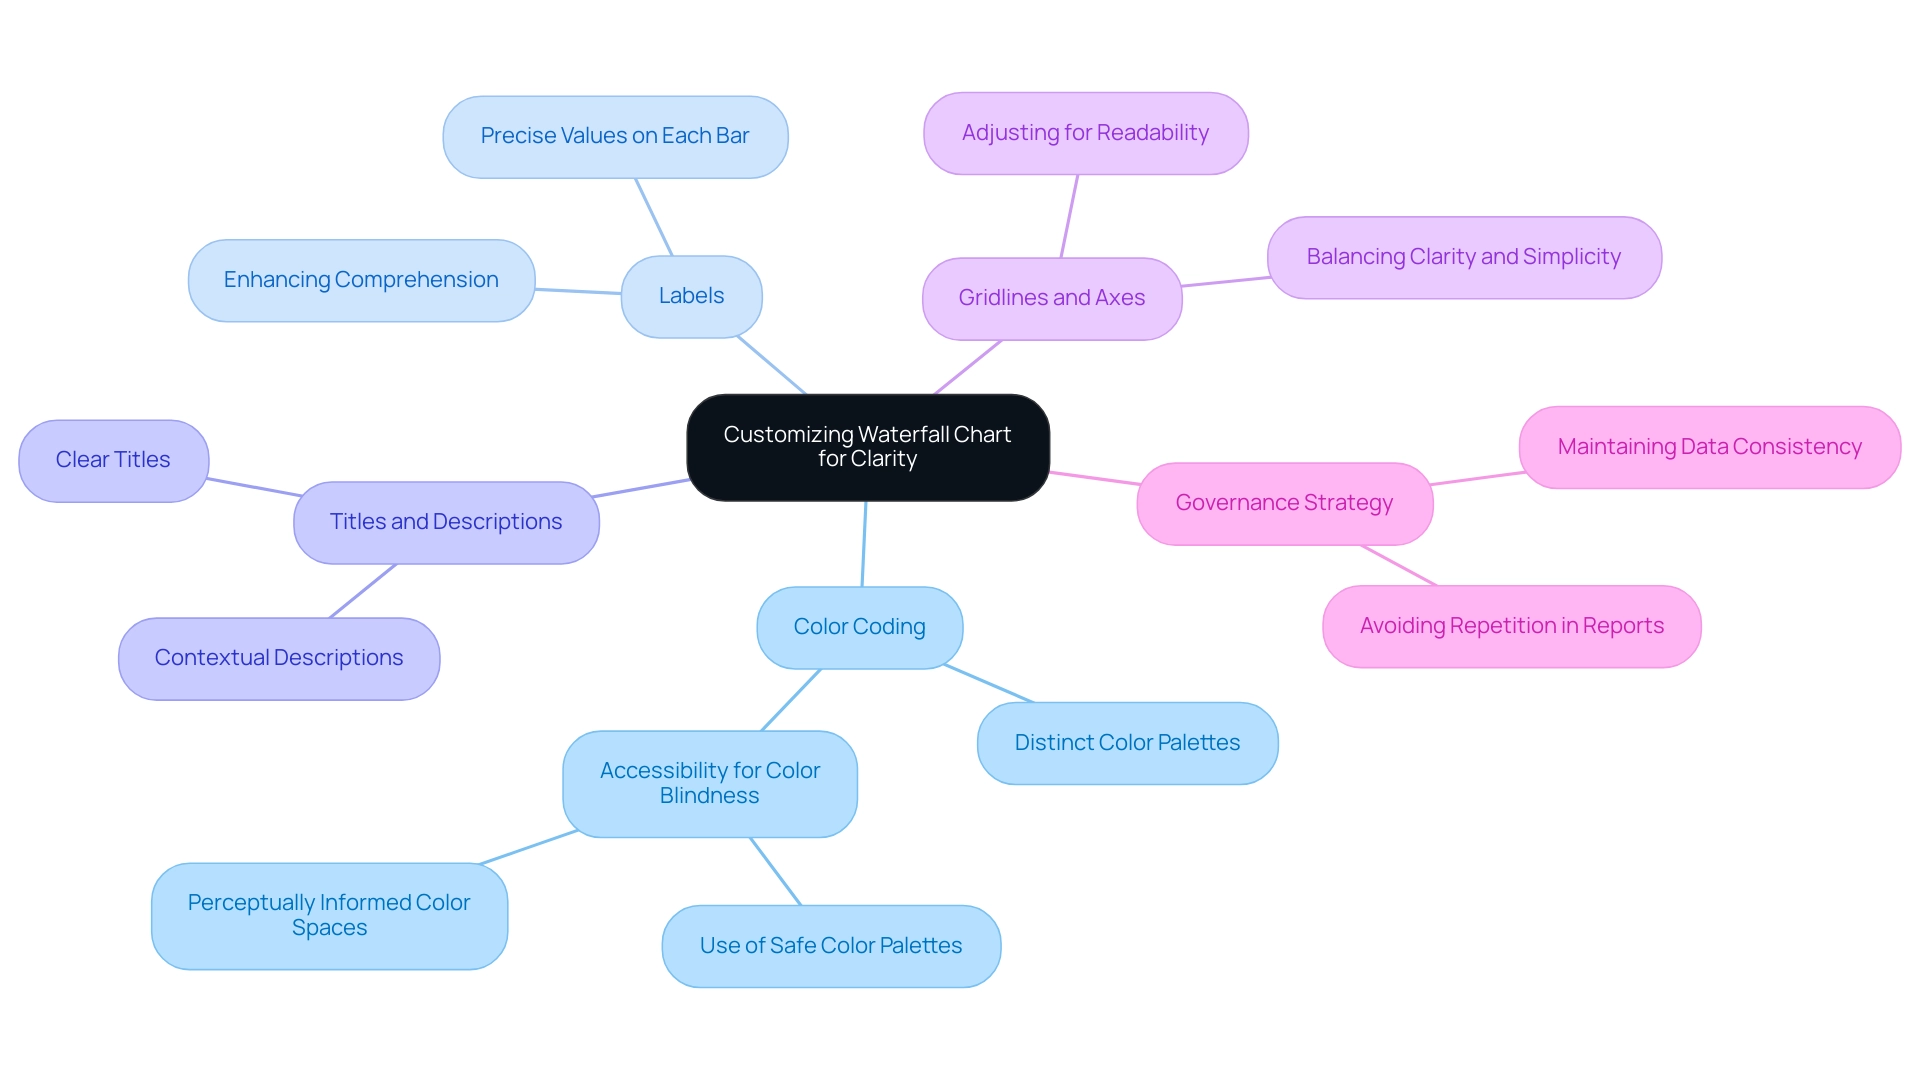
Customizing a waterfall chart in Power BI significantly enhances its clarity and effectiveness, thereby improving storytelling. Here are essential tips for customization:
-
Color Coding: Implement distinct color palettes to differentiate between positive and negative changes. This practice not only aids immediate understanding but also addresses accessibility requirements, ensuring that individuals with color blindness, including those with Protanopia—the most prevalent type of color blindness—can interpret the information accurately. Utilizing perceptually informed color spaces can further enhance differentiation among nominal classes.
-
Labels: Incorporate labels on each bar to provide precise values. This addition enhances the visual’s informational worth and enables viewers to quickly grasp the information, thus enhancing overall comprehension.
-
Titles and Descriptions: Clear titles and contextual descriptions are essential for guiding viewers through the visual. They assist in framing the narrative of the information, making it easier for the audience to comprehend the significance of the details presented.
-
Gridlines and Axes: Adjusting gridlines and axes can enhance readability without overcrowding the visual. Achieving a balance between clarity and simplicity is vital for sustaining viewer involvement. Research shows that effective customization of graphs can greatly influence viewer understanding. These strategies are not merely aesthetic options; they are fundamental elements of effective information presentation. For instance, a case study on accessibility in visual representation highlights the importance of creating inclusive visualizations that cater to diverse audiences. It recommends strategies such as using color palettes safe for color-blind viewers and employing dual encoding techniques to convey information effectively. Additionally, Helgeson & Moriarty observed that incorporating specific elements results in no enhancement in memory for the information, underscoring the necessity for careful customization.
By applying these customization strategies, users can develop more impactful BI charts that effectively convey their narratives, ultimately fostering informed decision-making. Furthermore, addressing challenges such as investing excessive time in constructing reports instead of leveraging insights from BI charts, along with inconsistencies, through tools like Robotic Process Automation (RPA) and customized AI solutions can further enhance productivity. This ensures that stakeholders receive clear, actionable insights from their BI charts. It is also crucial to avoid repeating information in tables or figures, as this can detract from the clarity and effectiveness of the presentation.
A governance strategy is essential to maintain data consistency and trustworthiness across reports.
Best Practices for Effective Waterfall Chart Usage
To maximize the effectiveness of waterfall charts in business intelligence, adhering to several best practices is essential:
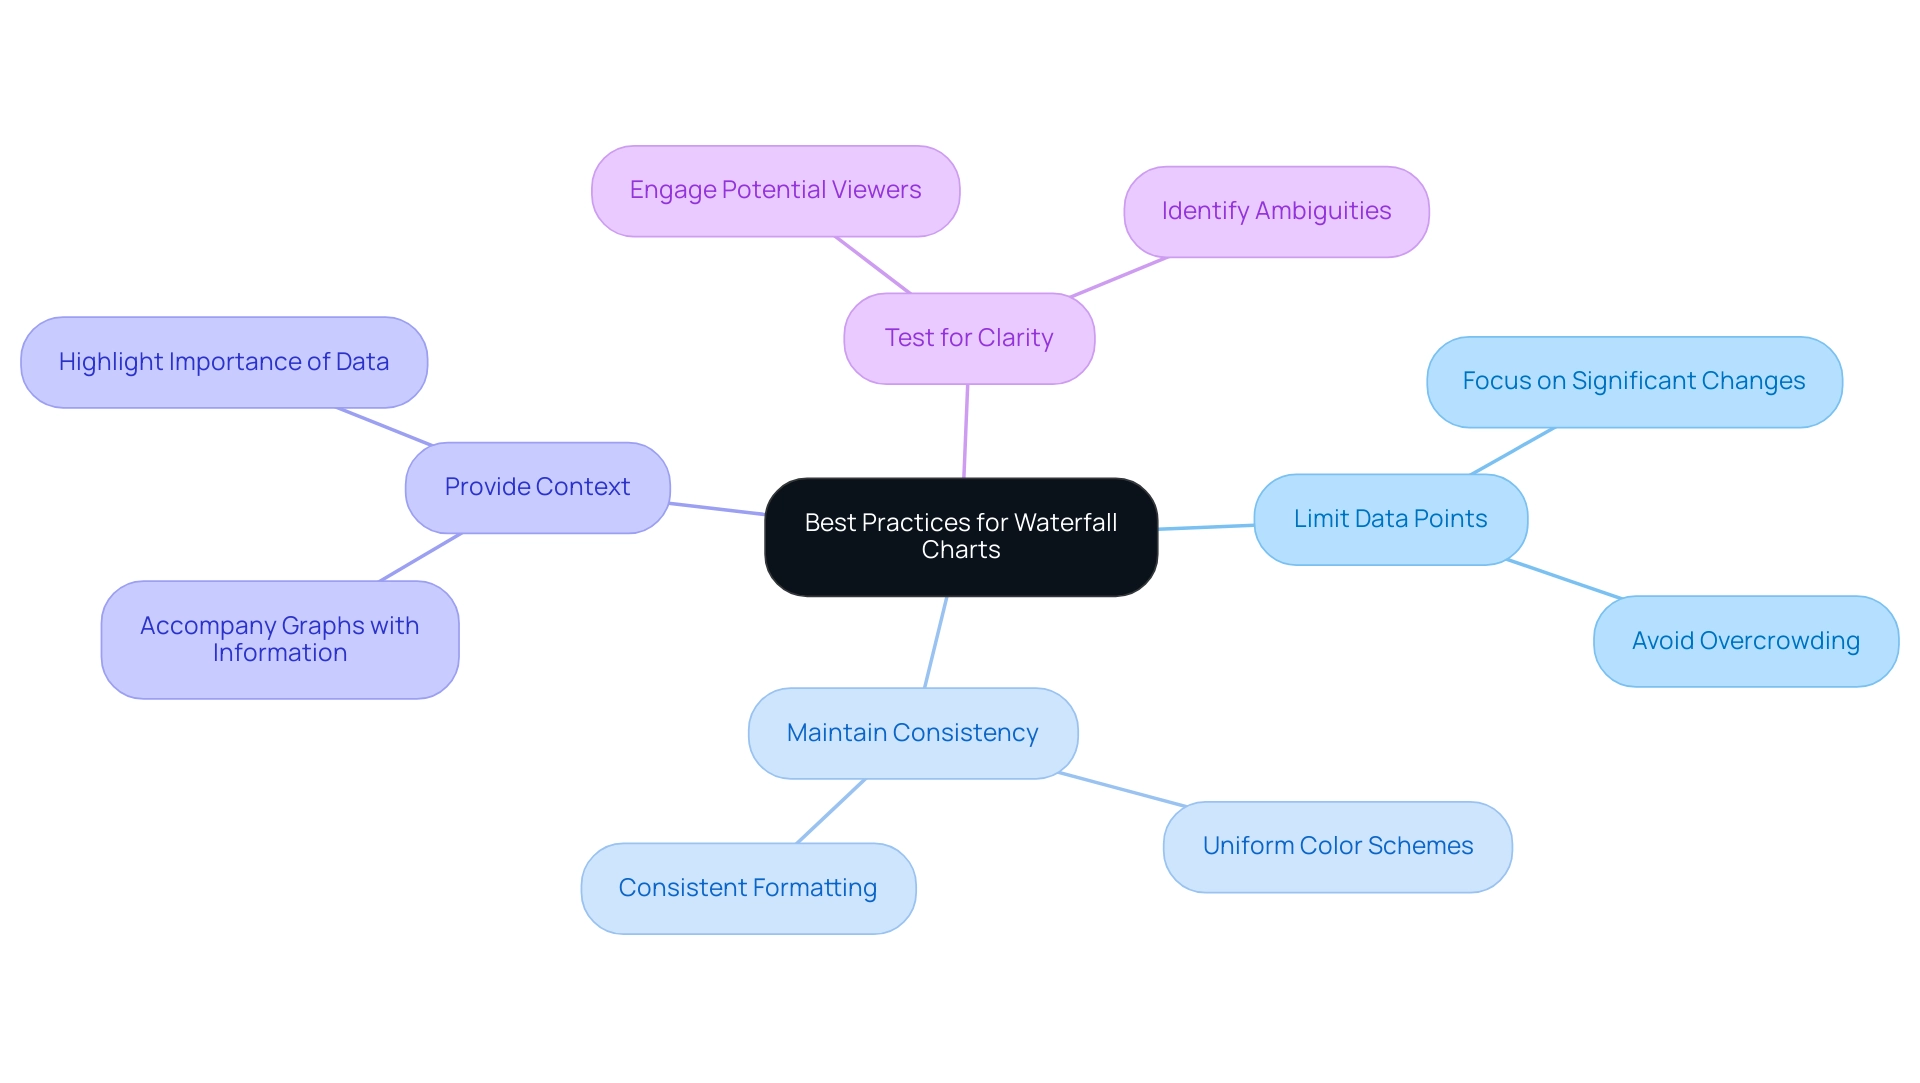
- Limit Data Points: Focus on the most significant changes to avoid overcrowding the chart. A streamlined approach enhances clarity and allows viewers to grasp key insights quickly.
- Maintain Consistency: Employ uniform color schemes and formatting throughout all visuals. This intentional choice not only improves understanding but also prevents misleading interpretations of the information.
- Provide Context: Always accompany graphs with contextual information. This assists viewers in grasping the importance of the presented information, making the insights more actionable.
- Test for Clarity: Before finalizing, test the visual with potential viewers to ensure it communicates the intended message clearly. This step can reveal ambiguities and enhance overall effectiveness.
Organizations that implement these best practices often experience significant improvements in data visualization through BI charts. For instance, financial companies frequently utilize graphical representations to demonstrate financial gains and losses, effectively highlighting the cumulative impact of individual elements on overall outcomes. A case study involving employee headcount changes within a team over a year illustrates how a well-constructed flow diagram can clearly depict starting quantities, positive and negative changes, and the resulting ending quantity.
This case study also emphasizes the process of creating BI charts in Excel, detailing the use of an invisible series and mathematical adjustments to accurately represent information.
Moreover, the transformative effect of Creatum’s Power BI Sprint has empowered organizations like PALFINGER Tail Lifts GMBH to significantly enhance their analysis and reporting capabilities. As noted by Sascha Rudloff, Teamleader of IT- and Process Management, “With the Power BI Sprint from Creatum, we not only received an immediately deployable Power BI report and a gateway setup but also experienced a significant acceleration in our own Power BI development. The outcomes of the sprint surpassed our expectations and offered a vital enhancement to our analysis strategy.” By leveraging such innovative solutions alongside best practices in information presentation, businesses can refine their decision-making processes and stimulate growth in 2025 and beyond.
Incorporating Robotic Process Automation (RPA) can further simplify manual workflows, enabling teams to focus on strategic initiatives that enhance organizational value. This underscores the significance of efficient information representation practices.
Alternatives to Waterfall Charts: When to Use Other Visualizations
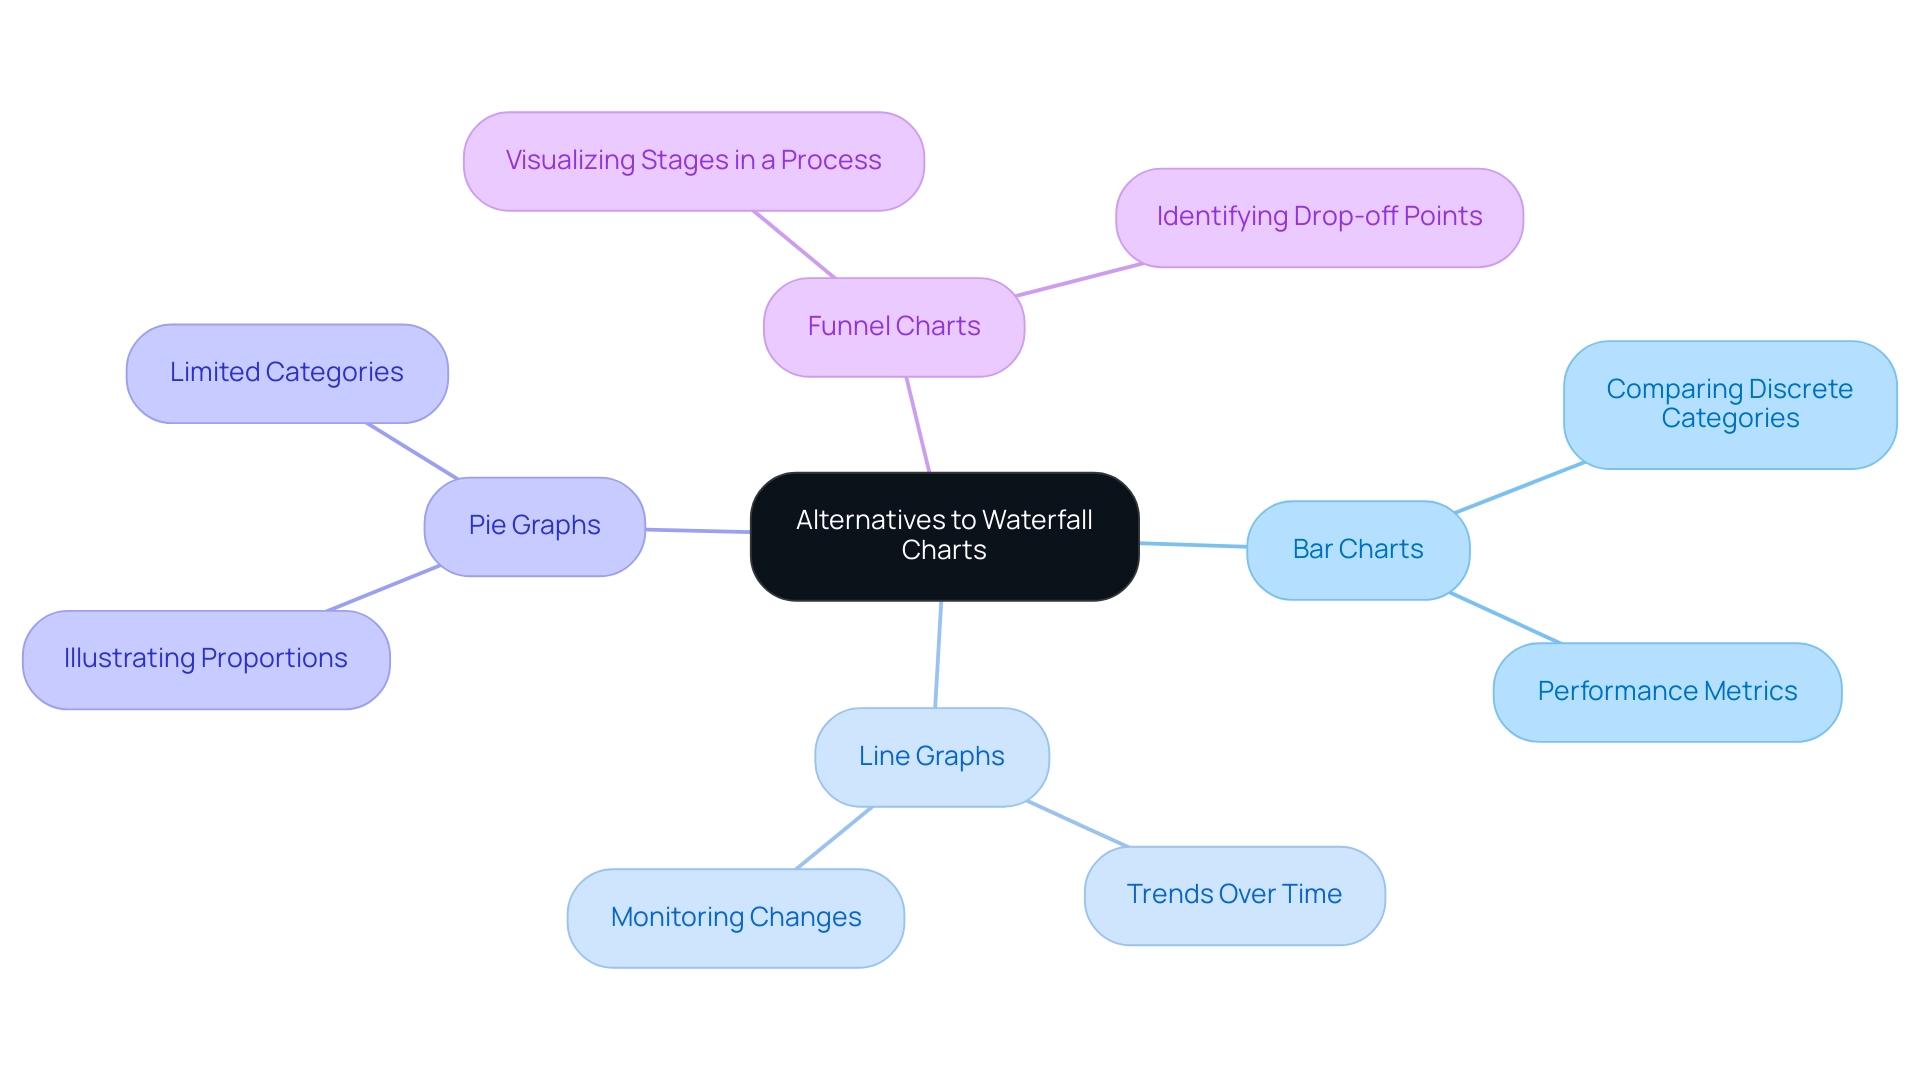
While waterfall graphs serve as powerful tools for visualizing cumulative information, there are specific scenarios where alternative visualizations may prove more effective. Understanding when to employ various types of BI charts can significantly enhance information analysis and decision-making, particularly within the realm of Business Intelligence (BI) and operational effectiveness. Consider the following alternatives:
-
Bar Charts: These are particularly effective for comparing discrete categories, enabling quick visual comparisons across different groups. Organizations frequently use bar graphs to evaluate performance metrics across various departments, simplifying the process of identifying areas needing improvement and fostering targeted strategies for growth.
-
Line Graphs: Best suited for illustrating trends over time, line graphs are invaluable for monitoring changes in data points, such as sales figures or website traffic. They provide a clear visual representation of growth or decline, empowering teams to make informed strategic choices based on historical data, which is crucial in a rapidly evolving AI landscape.
-
Pie Graphs: Although often debated, pie graphs can effectively illustrate proportions within a whole, particularly when the number of categories is limited. They assist stakeholders in quickly grasping the distribution of resources or market share among competitors, facilitating data-driven insights that enhance operational efficiency.
-
Funnel Charts: These charts excel in visualizing stages in a process, such as sales funnels. They enable organizations to identify drop-off points in customer journeys, facilitating targeted strategies to improve conversion rates and optimize workflows through Robotic Process Automation (RPA).
Selecting the appropriate illustration hinges on the specific data available and the narrative you wish to convey. A recent case study titled “Business Intelligence Empowerment” emphasized how a retail company effectively utilized bar graphs to compare sales performance across various regions, resulting in actionable insights that fueled targeted marketing initiatives. This case study underscores the importance of transforming raw data into actionable insights through effective visualization, which is essential for creating BI charts.
Moreover, expert advice highlights that understanding the strengths and weaknesses of each diagram type is crucial. As Sara Dholakia notes, it is essential to consider the audience’s familiarity with the subject matter of your data and the context they possess versus what you should provide. For instance, while waterfall diagrams excel in illustrating how an initial value is influenced by a series of positive and negative values, they may not be as effective in scenarios requiring straightforward comparisons of categories.
In navigating the overwhelming AI landscape, tailored AI solutions can assist organizations in selecting the most suitable BI chart representation techniques that align with their specific business goals. Statistics indicate that users can explore various display tools, such as Datylon, with a free 14-day trial, allowing them to experiment with different chart types without commitment. This flexibility encourages organizations to discover the most suitable representation methods tailored to their specific needs, ultimately enhancing operational efficiency.
In summary, employing the appropriate graphical method not only improves clarity but also enables organizations to make knowledgeable choices that foster growth and innovation. A keen mind and vision for technical illustration and data representation are essential for success in the field, ensuring that the chosen methods align with the overarching goals of business intelligence and operational excellence.
Key Takeaways: Choosing the Right BI Chart for Your Data
When selecting BI charts for data visualization in Power BI, it is essential to consider the following key takeaways:
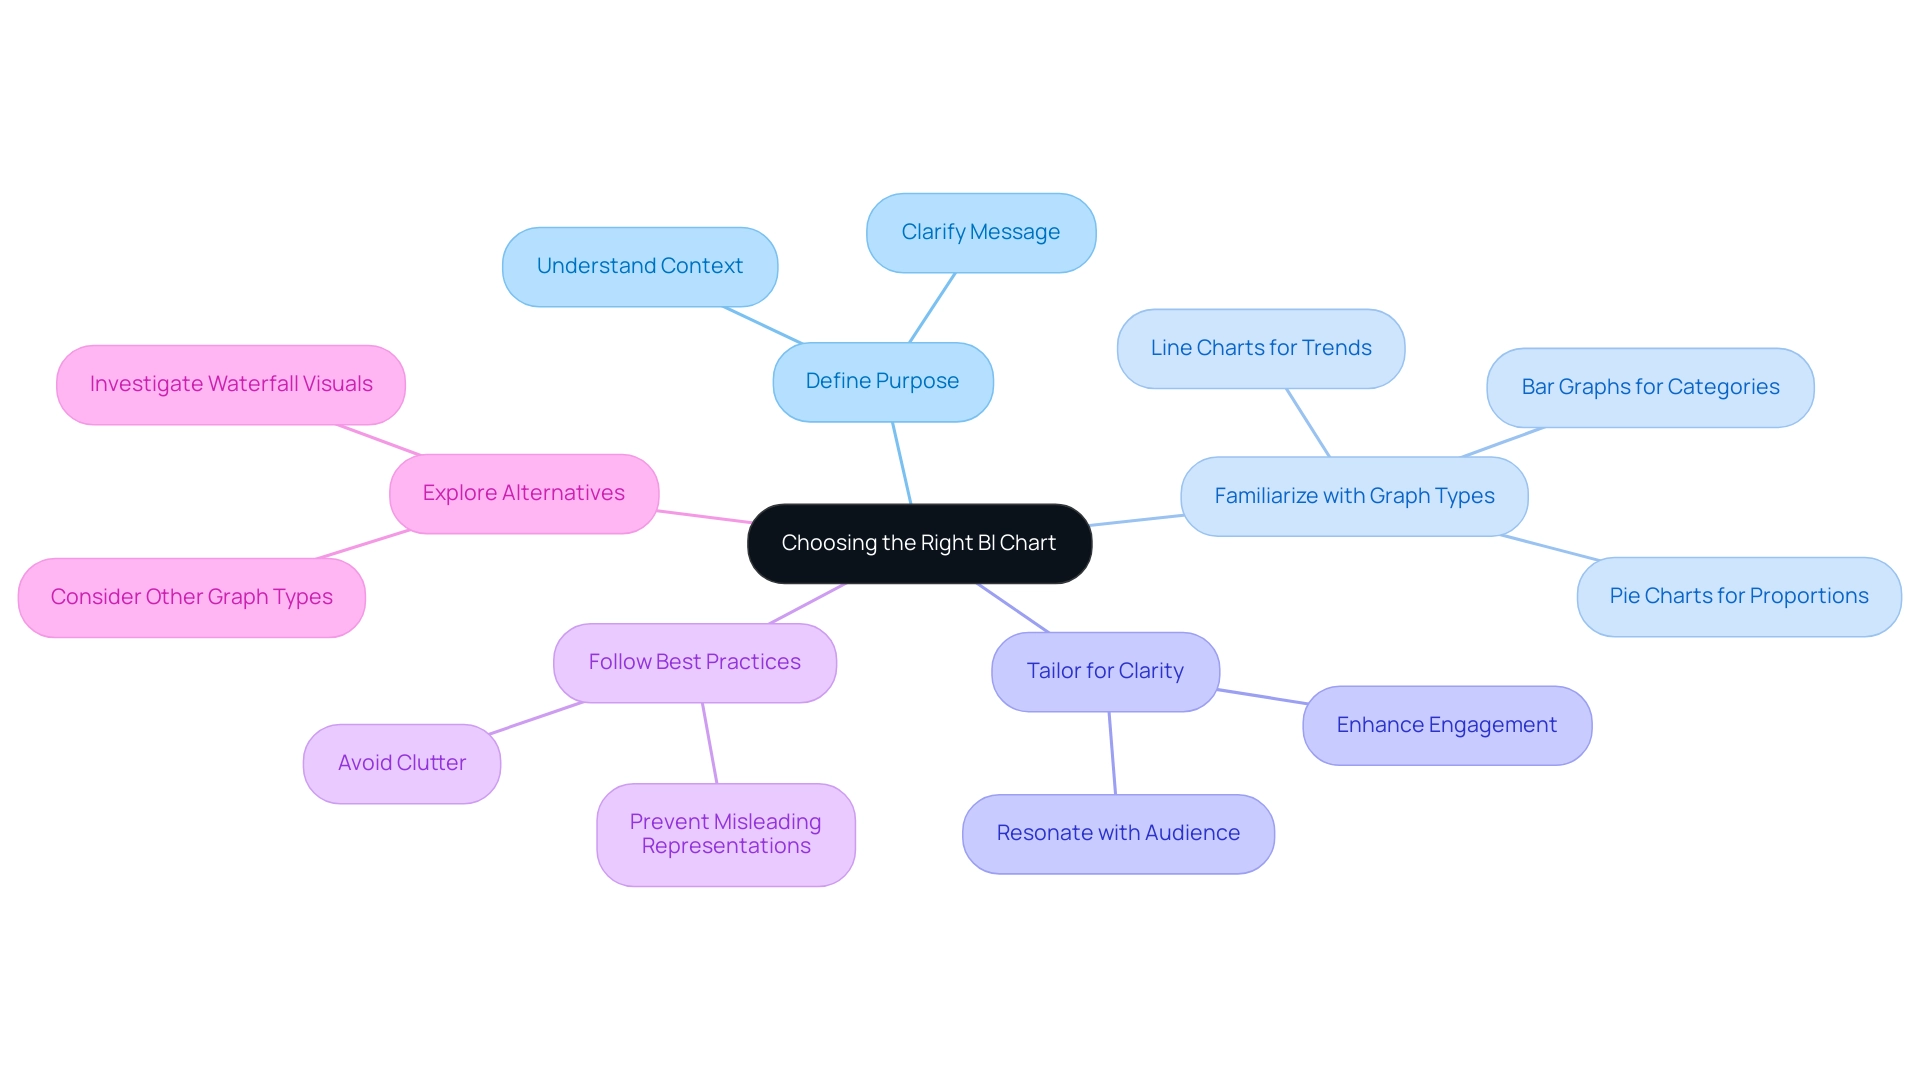
- Clearly define the purpose of your data and the specific message you wish to convey. Grasping the context will direct your selection of visuals.
- Familiarize yourself with the different types of graphs available, such as bar graphs, which are especially effective for presenting lengthy text in category labels and organized information.
- Tailor your visuals to enhance clarity and engagement, ensuring that they resonate with your audience.
- Follow best practices to avoid common pitfalls in visualization, such as cluttered visuals or misleading representations.
- Investigate options besides waterfall visuals when needed, as other graphical types may offer a more precise representation of your information.
By utilizing these principles, users can leverage the power of BI charts to effectively convey insights, ultimately enhancing decision-making processes. For example, organizations that have strategically selected suitable BI charts have reported significant enhancements in their capability to extract actionable insights from their information. With over 1,500,000 Zebra BI users creating insightful reports, the effect of appropriate visual selection on data insights is evident.
As Raimonds Simanovskis noted, “We are launching AI assistants to help our users to make complex things easier,” which underscores the potential of AI tools in simplifying the selection and use of BI visuals. Furthermore, the transformative impact of Creatum GmbH’s Power BI Sprint is highlighted in a recent testimonial from Sascha Rudloff, Team leader of IT- and Process management at PALFINGER Tail Lifts GMBH, who stated, “Die Ergebnisse des Sprints haben unsere Erwartungen übertroffen und waren ein wichtiger Impuls für unsere Datenanalysestrategie.” This reinforces the importance of proper chart selection and the role of tailored AI solutions from Creatum GmbH in driving data-driven insights and operational efficiency.
Embracing these best practices not only streamlines the visualization process but also drives growth and innovation in a data-rich environment.
Conclusion
In the intricate realm of business intelligence, effective data visualization through BI charts is essential for organizations striving to make informed decisions. By transforming complex datasets into intuitive visuals, these charts enhance understanding and unveil actionable insights that propel strategic actions. This article underscores the necessity of familiarizing oneself with various chart types, including waterfall, bar, and line charts, to effectively convey data insights and navigate market complexities.
The practical guidance on creating and customizing waterfall charts demonstrates how organizations can improve clarity and impact in their visualizations. By adhering to best practices—such as limiting data points, maintaining consistency, and providing context—businesses can optimize the effectiveness of their charts, ensuring that stakeholders can readily extract meaning from the data presented.
As reliance on data continues to escalate, so too does the imperative for organizations to adopt tailored BI solutions that align with their distinct objectives. By leveraging appropriate visualization techniques and following best practices, businesses can unlock the full potential of their data, fostering growth and innovation in an ever-evolving landscape. The insights derived from these visualizations not only inform decision-making but also pave the way for a data-driven future.
Frequently Asked Questions
What are Business Intelligence (BI) visuals?
BI visuals are tools that help organizations analyze and interpret complex datasets by transforming unprocessed information into clear visual representations, enabling stakeholders to quickly recognize insights and trends.
How do BI visuals enhance decision-making?
In the context of Power BI, BI visuals improve communication of insights and facilitate rapid, informed decision-making by providing clear visual data representations.
Why are BI graphs significant for organizations?
BI graphs enhance comprehension of data and promote strategic initiatives by allowing companies to forecast future trends using predictive analytics, which helps them anticipate market shifts and mitigate risks.
What is the trend regarding the adoption of BI charts?
There is a growing reliance on BI charts, with 2025 expected to be a pivotal year for their adoption as organizations increasingly recognize the value of visualization.
How does Creatum GmbH contribute to the field of BI?
Creatum GmbH focuses on customized AI solutions that help businesses leverage information effectively, aligning with the increasing demand for tailored BI solutions.
What role does continuous learning play in business intelligence?
Continuous learning, such as participating in initiatives like MDS@Rice, is crucial for individuals to acquire the latest skills and knowledge necessary to thrive in the data-driven landscape.
Can you provide examples of the impact of BI charts on decision-making?
Real-world examples show that organizations using BI charts, particularly in predictive analytics, have reported enhanced clarity in their analyses, leading to more strategic and informed decisions.
What are the primary chart types available in Power BI?
The primary chart types in Power BI include: Bar and Column Charts for comparing categorical data, Line Graphs for illustrating trends over time, Pie and Donut Graphs for displaying proportions of a whole, and BI Charts for visualizing cumulative effects of sequentially introduced values and relationships between two variables.
What recent updates have been made to Power BI charts?
In 2025, Power BI introduced enhanced features for various visual types, including popular network diagrams for illustrating complex relationships, emphasizing the importance of clarity in design.
How important is it to select the appropriate graph type?
Selecting the right graph type is crucial as it affects the effectiveness of the information narrative being conveyed, with a strong preference shown for certain representations among surveyed individuals.
What benefits have organizations experienced from using Power BI?
Organizations have reported enhanced operational efficiency and informed decision-making through the use of Power BI, as illustrated by successful case studies and testimonials like that of PALFINGER Tail Lifts GMBH.
Overview
Power BI apps and workspaces fulfill distinct yet complementary roles within the Business Intelligence ecosystem.
- Apps prioritize user experience and accessibility, streamlining access to curated reports for end-users.
- In contrast, workspaces emphasize collaborative development and content management, facilitating real-time collaboration among developers.
This distinction is crucial, as it highlights how each component enhances operational efficiency and supports data-driven decision-making. Understanding these roles can empower organizations to leverage Power BI more effectively.
Introduction
In the rapidly evolving landscape of data analytics, Power BI emerges as a pivotal tool for organizations aiming to harness data-driven insights. At the core of its functionality are Power BI Apps and Workspaces, each serving a distinct yet complementary role in the data management ecosystem.
- Workspaces act as collaborative hubs where teams can develop and refine reports, fostering innovation and teamwork in data analysis.
- In contrast, Power BI Apps cater to end-users, presenting curated content in an accessible format that enhances user experience and decision-making.
As organizations navigate the complexities of data governance, user engagement, and operational efficiency, understanding the nuances between these two components becomes increasingly vital. This exploration delves into the functionalities, advantages, and practical applications of Power BI Apps and Workspaces, illuminating their integral roles in modern business intelligence strategies.
Understanding Power BI Apps and Workspaces
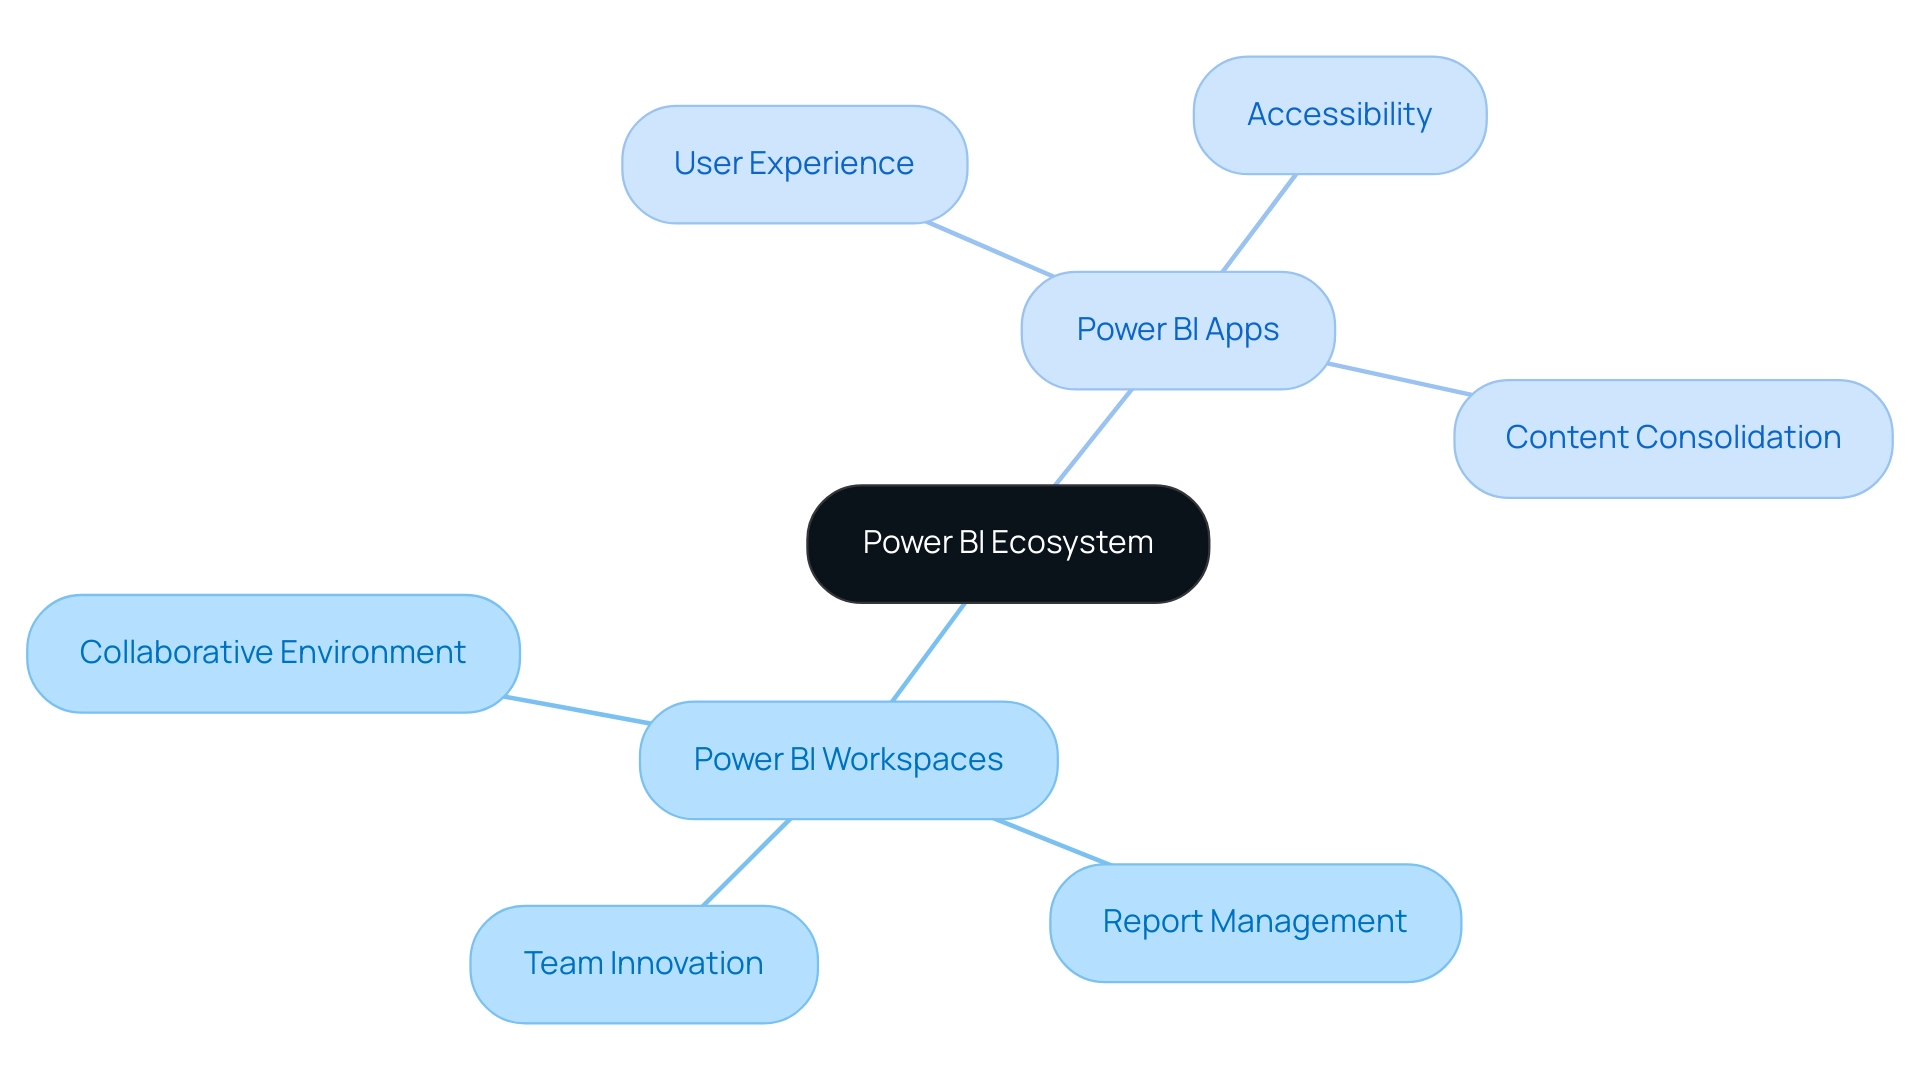
In the BI ecosystem, the comparison between Power BI apps and workspaces underscores their essential roles, each catering to distinct user needs. A BI Workspace serves as a collaborative environment where teams of developers and analysts can create, manage, and share reports and dashboards. This space is specifically designed for collaborative efforts on models and visualizations, fostering teamwork and innovation in analysis—crucial elements for driving operational efficiency and leveraging Business Intelligence effectively.
Conversely, when examining Power BI apps versus workspaces, it becomes clear that Power BI tools are tailored for end-users, consolidating related reports and dashboards into a single, user-friendly interface. This distinction is vital as it highlights the differing roles these tools play within the management lifecycle. While workspaces focus on the development and enhancement of data insights, apps prioritize experience and accessibility, ensuring stakeholders can easily access the information they require.
As Santhiya Balachandar notes, “Once your app is ready, you can share it with individuals in multiple ways: automatic installation, direct links, or via the Power BI app marketplace.”
Recent statistics reveal that the usage metrics report ranks reports based on view count, with the highest rank reflecting the most viewed content. This metric is essential for organizations to discern which reports hold the most value for their users. However, it is crucial to recognize that the usage metrics report is unsupported in My Workspace and has specific limitations regarding data collection, which can affect how organizations track engagement and address challenges related to data inconsistency.
A case study on the application of BI tools demonstrates their effectiveness in distributing reports and dashboards to a wide audience within organizations. By ensuring that only necessary individuals have access to build and edit content, this method isolates production-ready material and delivers a read-only version to end recipients. The outcome of utilizing Business Intelligence tools has been a simplified access to business insights, enabling users to engage with the most recent information while facilitating secure information sharing and enhancing decision-making through a unified platform for analysis and collaboration.
As organizations continue to explore the capabilities of BI, understanding the distinctions between Power BI apps and workspaces becomes increasingly significant. The latest updates on BI Workspaces features further enhance their functionality, making them indispensable for teams aiming to optimize their management processes. Additionally, there has been recent inquiry regarding how to automatically refresh information in a BI report connected to Fabric Lakehouse, underscoring the ongoing evolution and importance of these tools in contemporary information management.
Key Features of Power BI Apps
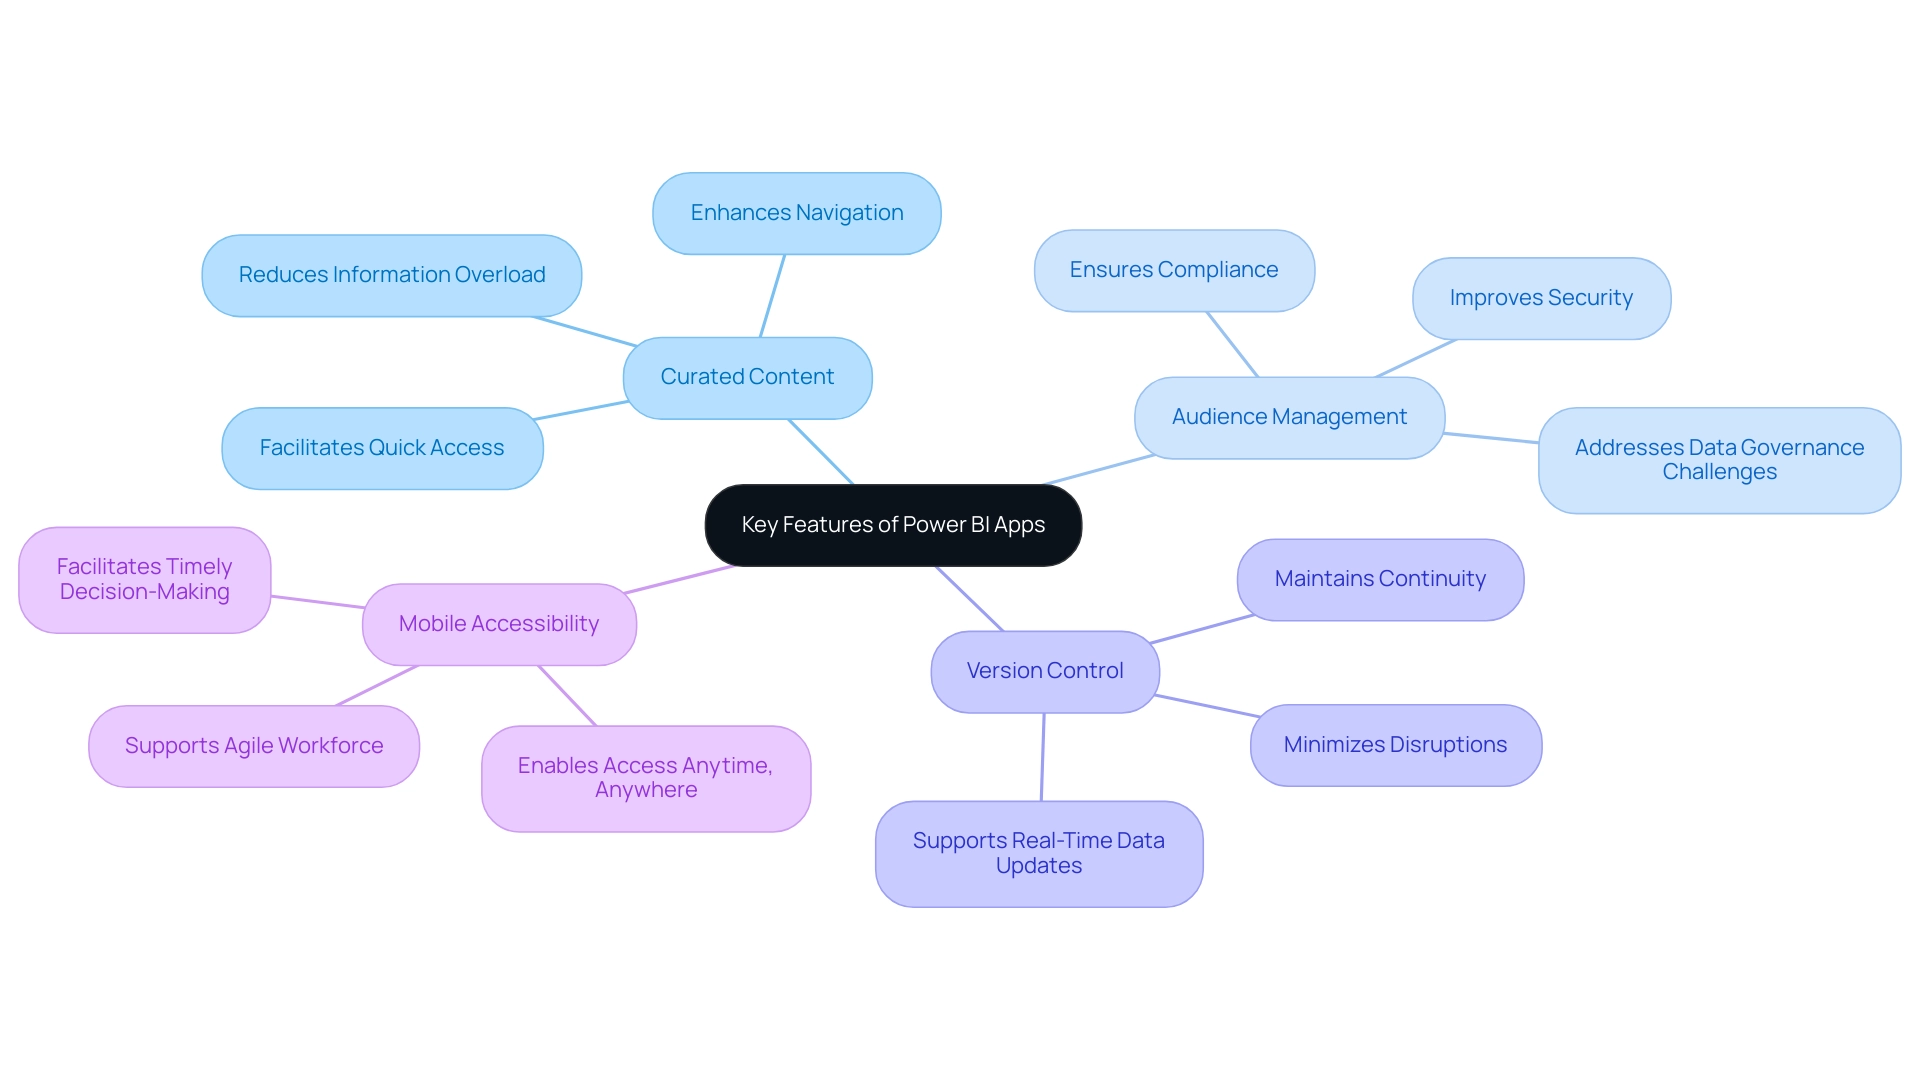
Business Intelligence (BI) applications are designed to significantly enhance user experience and improve information accessibility through several key features:
-
Curated Content: BI applications provide individuals with a well-structured assortment of related reports and dashboards in one centralized location. This enhances navigation and facilitates quick access to essential information. Such a feature is particularly beneficial in environments where information overload can hinder decision-making, ensuring that users can effectively extract actionable insights.
-
Audience Management: A standout feature in the comparison of Power BI apps versus workspace is the ability for administrators to tailor content visibility based on user roles. This capability ensures that sensitive information is accessible only to authorized personnel, thereby bolstering security and compliance with regulatory standards. It is crucial for addressing data inconsistency and governance challenges in business reporting, especially in the context of Power BI apps versus workspace.
-
Version Control: Business Intelligence applications incorporate a robust change management system, allowing developers to update reports within Power BI apps versus workspace without immediately affecting the end-user experience. This feature is vital for maintaining continuity and minimizing disruptions during updates, which is essential for organizations reliant on real-time data.
-
Mobile Accessibility: In today’s dynamic work environments, these applications are optimized for mobile devices, enabling individuals to access insights anytime and anywhere. This flexibility supports a more agile workforce, facilitating timely decision-making even when users are away from their desks.
Collectively, these features enhance the usability and effectiveness of BI, particularly in the context of Power BI apps versus workspace as a business intelligence tool. Organizations utilizing Business Intelligence applications have reported significant improvements in user experience, with studies indicating that tailored content and mobile accessibility can lead to a 30% increase in user engagement.
As industry experts have noted, the ability to curate content effectively is transformative for data analysts. Curated content not only simplifies the user experience but also fosters better insights and decision-making. Daryl Plummer emphasizes that AI is part of a broader disruption that will compel organizations to reassess their strategies and innovations, aligning with the evolving capabilities of BI applications.
Furthermore, according to Forrester, End User Computing (EUC) technologies will be crucial for organizations in 2023 to sustain productivity and mitigate risks, underscoring the significance of BI solutions in today’s data-driven landscape. Additionally, Creatum GmbH’s extensive services aimed at enhancing customer experience (CX) performance for financial institutions exemplify the practical application of Business Intelligence solutions, demonstrating how customized approaches can lead to substantial and lasting transformation. With anticipated updates in 2025, BI apps are set to introduce even more sophisticated audience management features, further solidifying their role as essential tools for organizations striving to enhance their information strategies.
Exploring the Functionalities of Workspaces
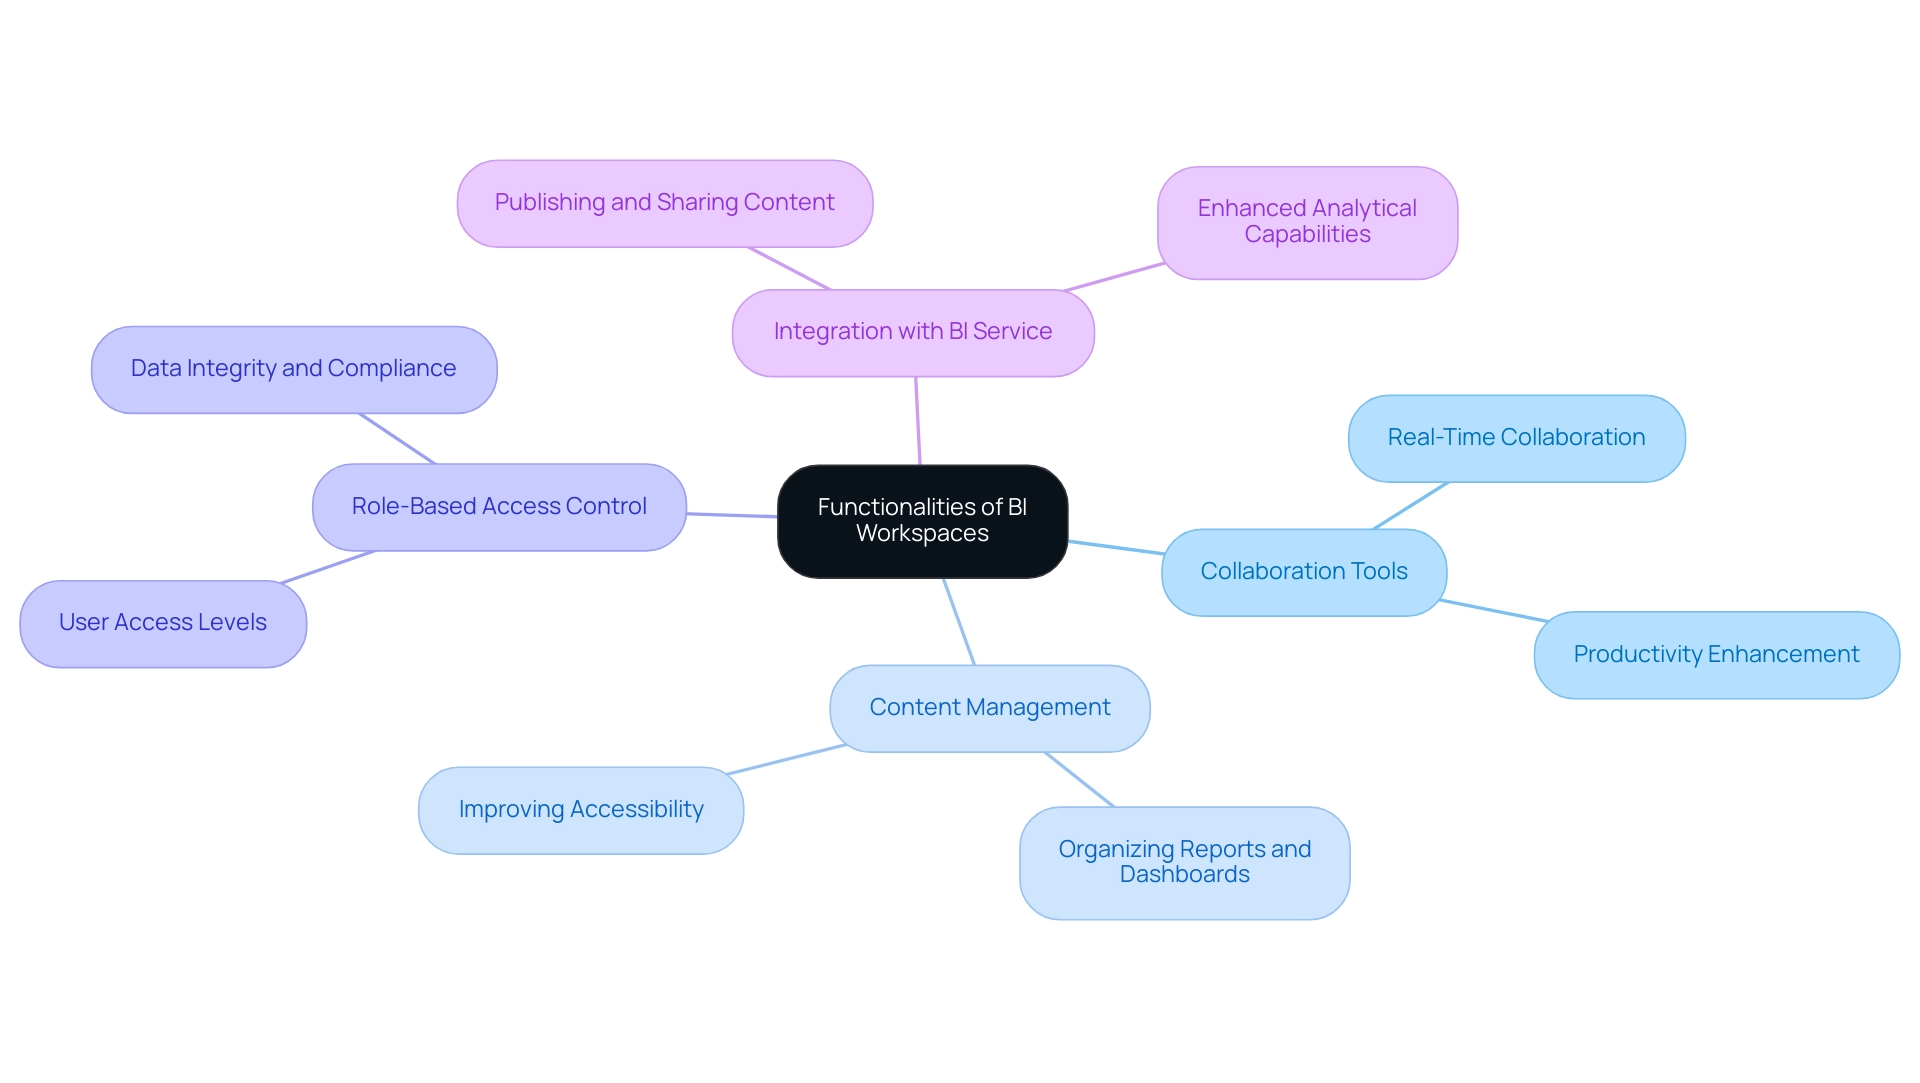
When discussing Power BI apps versus workspaces, it is evident that both are essential for fostering collaborative data analysis and report creation. Their key functionalities include:
-
Collaboration Tools: Workspaces empower multiple users to engage in real-time collaboration, enabling the sharing of insights and feedback. This feature is crucial, as statistics indicate that effective collaboration can significantly enhance productivity and decision-making processes. As Tomas Kutac noted, “One of the biggest mistakes teams make is relying solely on BI Desktop.” While it’s effective for building reports, it’s not designed for real-time teamwork.
-
Content Management: Users can systematically organize reports, dashboards, and datasets, streamlining the management of extensive information volumes. This structured approach not only improves accessibility but also enhances the overall efficiency of information handling, addressing common challenges in leveraging insights from the comparison of Power BI apps versus workspaces.
-
Role-Based Access Control: Administrators have the ability to assign varying access levels to users, ensuring that sensitive information remains protected while still promoting collaborative efforts. This security measure is vital in maintaining data integrity and compliance, particularly in regulated environments.
-
Integration with BI Service: Workspaces are seamlessly linked to the BI Service, facilitating the effortless publishing and sharing of content. This integration allows teams to leverage the full capabilities of BI, enhancing their analytical abilities and driving data-driven insights crucial for informed decision-making.
Recent enhancements in BI Workspaces have further improved these functionalities, addressing feedback and evolving collaboration needs. For instance, a user recently expressed a desire to create a metrics report for reports within the same workspace, which garnered 9,990 views, highlighting the growing demand for comprehensive analytics tools. However, it is important to note that duplicate reports may appear in usage metrics due to the deletion and recreation of reports or their inclusion when considering Power BI Apps versus workspaces.
A case study involving national and regional clouds revealed that usage metrics are not available in these environments, ensuring compliance with local regulations while maintaining security and privacy. This underscores the importance of understanding the operational landscape when utilizing BI Workspaces, particularly regarding compliance and security.
Additionally, to refresh the usage metrics report, users must authenticate to enable backend API calls for tenant telemetry, providing a more comprehensive understanding of the functionalities and requirements of BI Workspaces.
In summary, the functionalities of BI Workspaces are essential for teams aiming to enhance their analysis capabilities, driving efficiency and collaboration in a rich environment. Our BI services at Creatum GmbH, including the 3-Day BI Sprint for swift report creation and the General Management App for thorough management, are designed to address inconsistencies and governance challenges, ultimately supporting business growth and innovation.
The Power BI App Lifecycle: From Creation to Maintenance
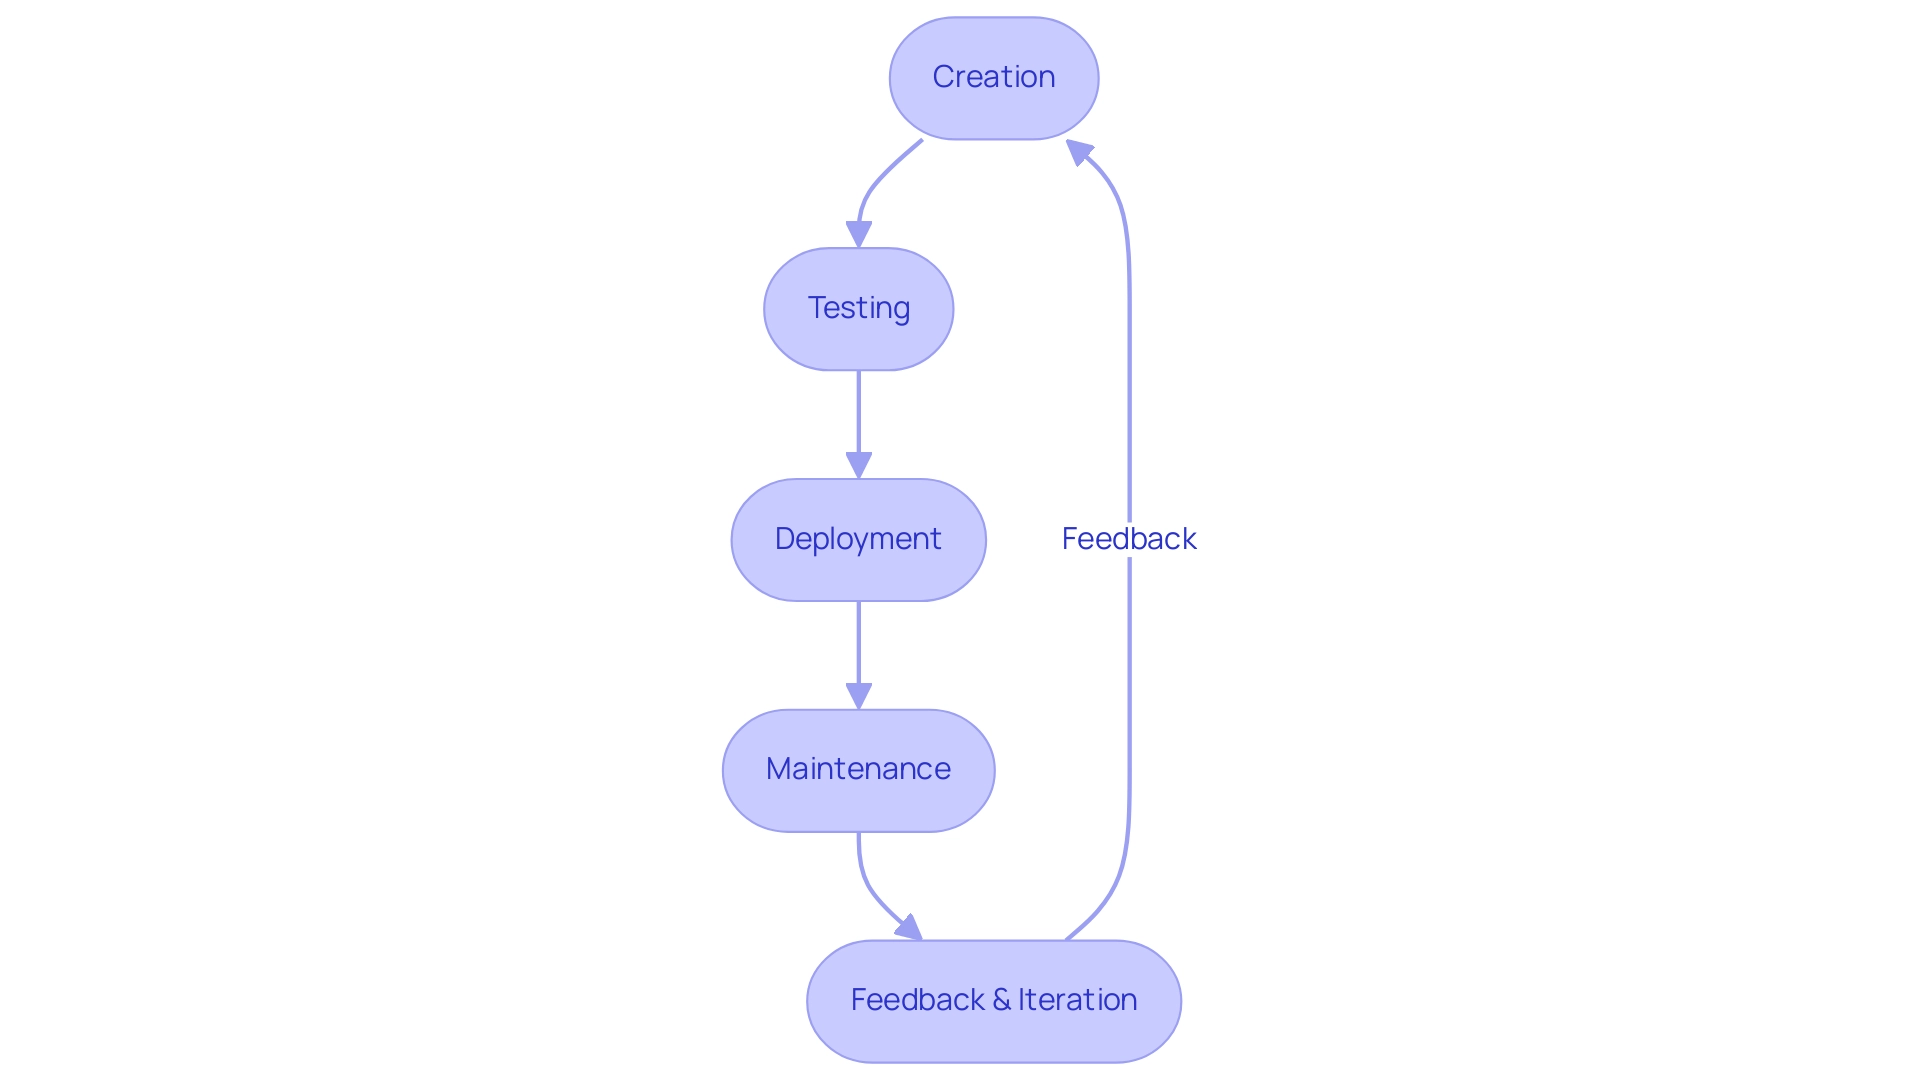
The lifecycle of Power BI Applications encompasses a structured process that involves several critical stages, particularly when comparing Power BI apps and workspaces.
-
Creation: Within Workspaces, developers kick off the process by designing and publishing reports and dashboards tailored to individual needs. This stage is vital as it lays the groundwork for effective data-driven insights, significantly enhancing operational efficiency. However, challenges such as time-consuming report creation and data inconsistencies can impede this process.
-
Testing: Prior to deployment, applications undergo rigorous testing to validate functionality and ensure an optimal user experience. This phase is crucial, as it helps identify potential issues that could obstruct user engagement and the extraction of actionable insights.
-
Deployment: Following successful testing, applications are published, providing end-users with access to curated content that bolsters their decision-making capabilities. This access is essential for effectively leveraging Business Intelligence, especially in the context of Power BI apps versus workspaces, enabling organizations to transform raw information into actionable insights that drive growth and innovation.
-
Maintenance: Ongoing maintenance is critical for keeping Apps relevant and effective. This includes regular data refreshes, report updates, and access management, which collectively contribute to sustained user satisfaction and engagement. Notably, organizations report an average of 3,989 views on posts encouraging interaction, underscoring the importance of active engagement in this phase, particularly in gathering feedback for future iterations.
-
Feedback and Iteration: Continuous enhancement relies on collecting feedback from users, allowing organizations to adjust their applications to meet evolving business needs. This iterative process is supported by step-by-step methods available in the Admin portal for accessing usage metrics across all Power BI apps versus workspaces, ensuring that insights from users directly inform future updates.
Furthermore, case studies on Content Lifecycle Management Approaches illustrate how various strategies can be employed based on team size and project scope, ranging from simpler self-service content publishing for smaller teams to advanced enterprise solutions for larger organizations. As the landscape of BI Applications evolves, staying attuned to feedback and lifecycle management trends is crucial for enhancing the efficiency of these tools. As vanessafvg, a Super User, emphasizes, “If I took the time to answer your question and I came up with a solution, please mark my post as a solution and/or give kudos freely for the effort.”
This underscores the significance of contributions in the app development process. Additionally, tracking user activities in BI is essential for ongoing maintenance and improvement, ensuring that organizations can respond effectively to user needs. Moreover, integrating RPA solutions from Creatum GmbH can further enhance operational efficiency by automating repetitive tasks, thereby allowing teams to concentrate on strategic initiatives.
When to Use Power BI Apps: Practical Applications
Business Intelligence applications serve as a vital resource across various organizational contexts, particularly in the following domains:
-
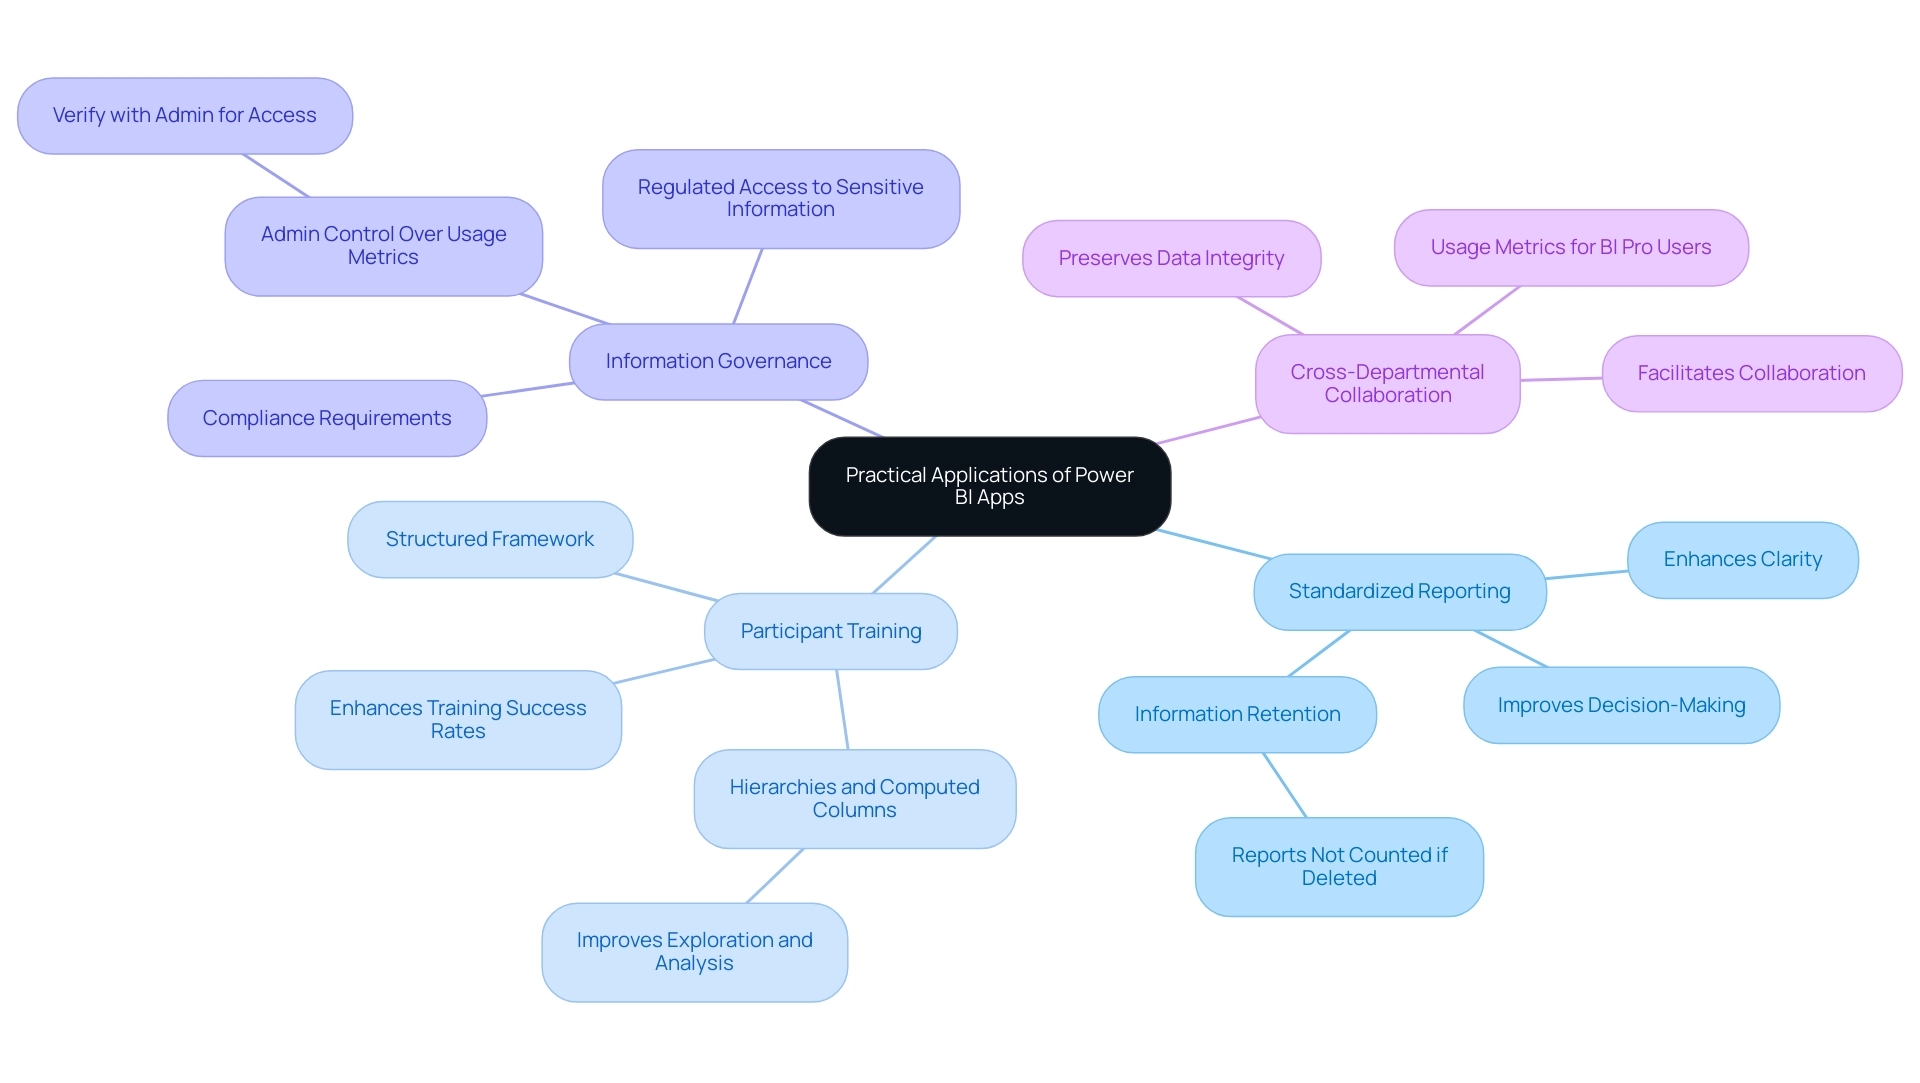
Standardized Reporting: Organizations aiming to distribute consistent reports across multiple departments find Business Intelligence tools to be an effective solution. By facilitating standardized reporting, these applications enhance clarity and ensure alignment among stakeholders with the same insights, ultimately improving decision-making processes. Notably, if reports are removed after being viewed, they are not counted by the admin APIs, underscoring the importance of information retention and management in the context of Power BI Apps versus workspace. This is critical in an information-rich environment where extracting meaningful insights can be challenging, as organizations often grapple with time-consuming report creation and inconsistencies.
-
Participant Training: New individuals frequently encounter challenges in navigating complex data environments. BI Apps provide a structured framework that streamlines access to resources, facilitating learning and adaptation. This structured approach has been shown to significantly enhance training success rates, fostering a more competent workforce. Furthermore, users can establish hierarchies and computed columns in BI, which improves exploration and analysis, further aiding operational efficiency and addressing the absence of actionable direction that many organizations face.
-
Information Governance: In an era where privacy and compliance are paramount, Power BI Tools enable regulated access to sensitive information. Organizations with strict compliance requirements can leverage these applications to ensure that only authorized personnel can access essential data, thereby enhancing governance and security. The case study on admin control over usage metrics illustrates how administrative settings can significantly impact access to features, emphasizing the need for organizations to verify with their admin if they are unable to run usage metrics.
-
Cross-Departmental Collaboration: When various teams require access to the same data insights, Business Intelligence tools excel in facilitating collaboration while preserving data integrity. This capability is crucial for organizations that depend on cross-functional teams to drive initiatives, as it ensures that everyone is working with the same, accurate information. Moreover, usage metrics reports are a feature accessible solely to BI Pro users, which is a significant consideration for organizations contemplating the implementation of BI applications.
These practical applications underscore the strategic importance of BI solutions in enhancing business intelligence initiatives. As organizations increasingly adopt standardized reporting practices, the effectiveness of Business Intelligence tools in streamlining these processes becomes even more evident, with studies indicating that standardized reporting can lead to improved operational efficiency and reduced errors. Additionally, it was revealed at the 2021 Microsoft Business Application Summit that an impressive 97% of Fortune 500 companies now utilize BI, highlighting its widespread adoption and relevance. Looking ahead to 2025, the integration of BI applications into daily operations is expected to evolve, offering even more comprehensive solutions for data management and reporting.
Pros and Cons: Power BI Apps vs Workspaces
In evaluating Power BI Apps versus Workspaces, distinct advantages and disadvantages emerge, particularly within the context of today’s complex AI landscape that businesses navigate:
Power BI Apps present several pros:
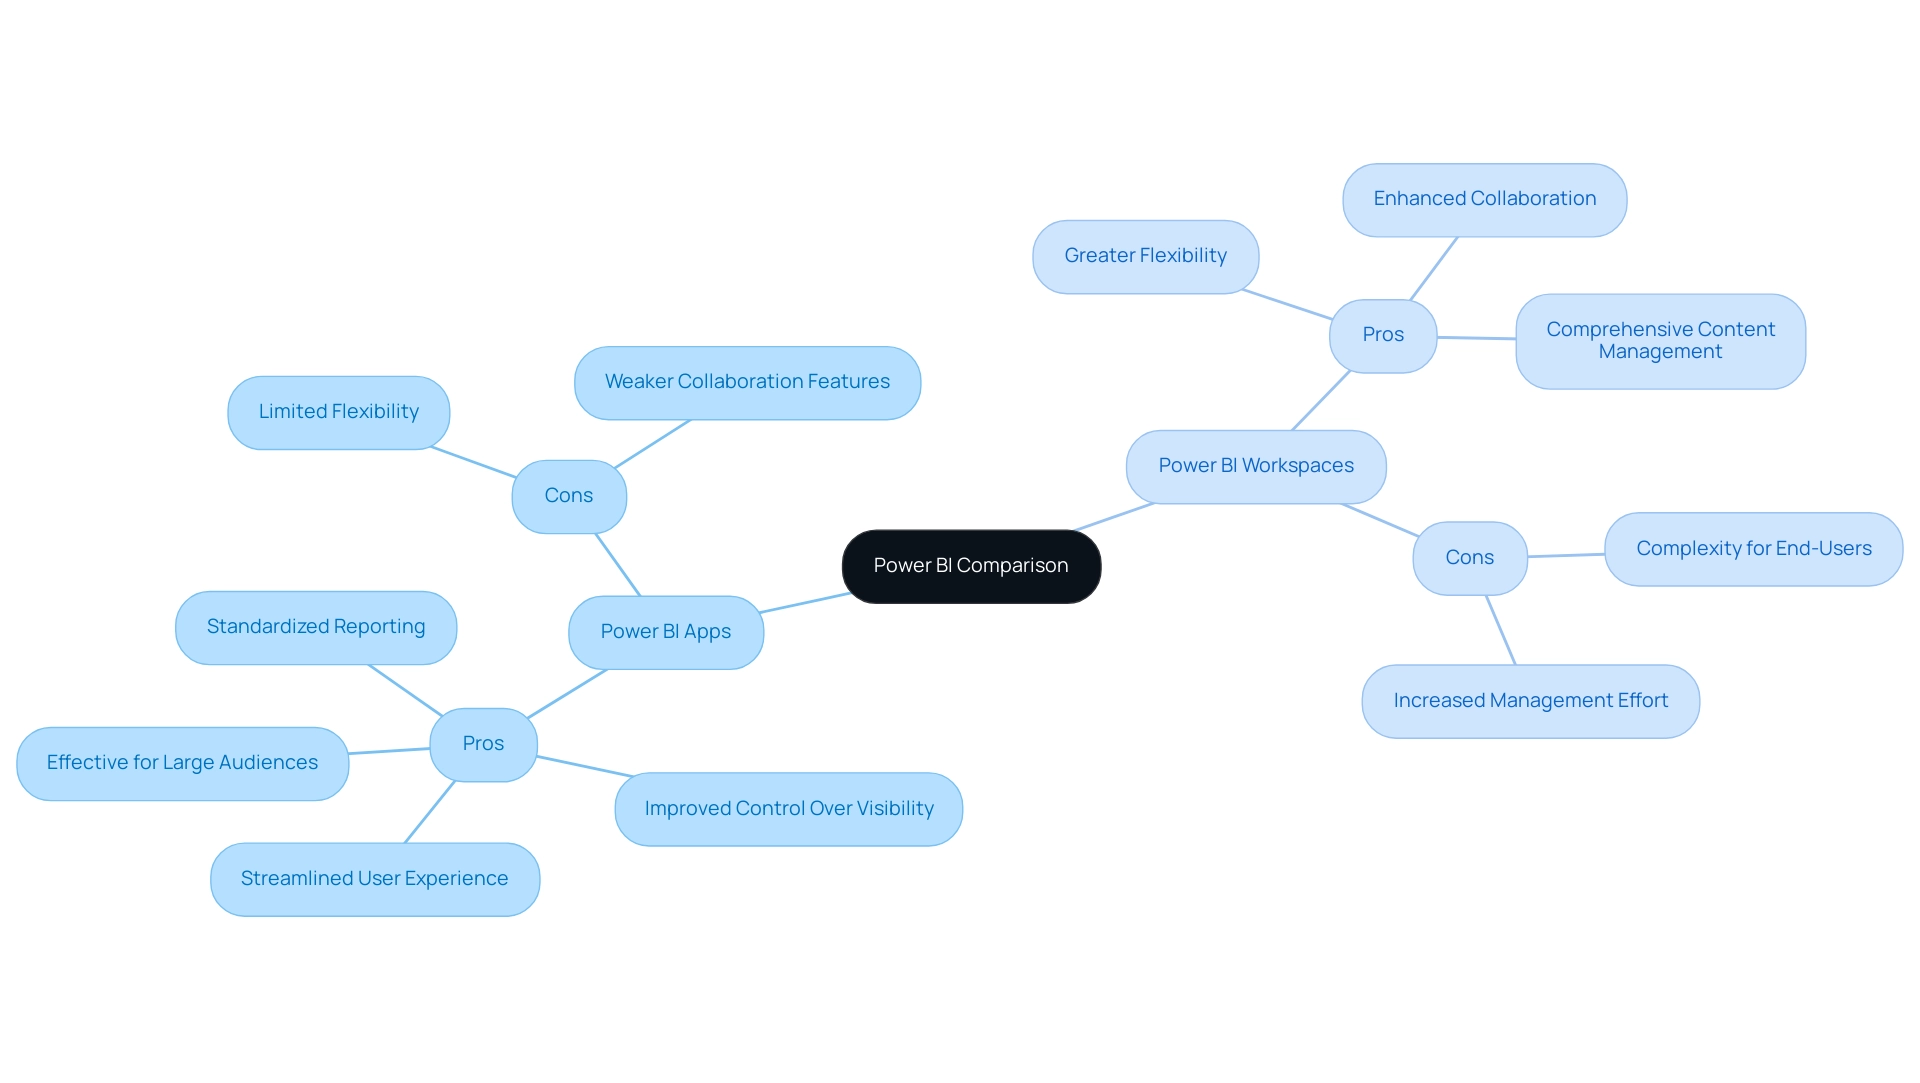
- They offer a streamlined user experience with curated content, enabling users to access relevant information swiftly.
- Improved control over information visibility and access ensures sensitive details are shared appropriately.
- They are particularly effective for standardized reporting across various departments, fostering consistency in data presentation.
- Case studies indicate that BI Applications excel in packaging reports for large audiences, enhancing organization and distribution.
However, Power BI Apps also have their cons:
- Developers face limited flexibility compared to Workspaces, which may restrict customization options for advanced users.
- Collaboration features may not match the robustness found in Workspaces, potentially hindering teamwork on data projects.
On the other hand, Power BI Workspaces offer notable advantages:
- They provide greater flexibility for developers to create and manage content, allowing tailored solutions that meet specific organizational needs.
- Enhanced collaboration features facilitate teamwork, making it easier for groups to collaborate on projects and share insights.
- Comprehensive content management capabilities support effective governance and organization of BI assets.
Yet, there are drawbacks to consider:
- The complexity of Workspaces can overwhelm end-users, leading to confusion and underutilization of features.
- They require more management effort to ensure information governance, which can strain resources if not adequately addressed.
When it comes to performance, typical report opening times vary by consumption method and browser type, providing a quantitative measure of the efficiency differences between the two tools. This comparison empowers organizations to discern which tool aligns more closely with their operational objectives, especially when considering the latest user satisfaction ratings and case studies that illustrate the effectiveness of BI Apps in packaging reports for extensive user groups. As Data Analyst Santhiya Balachandar states, “I am passionate about transforming information into actionable insights,” underscoring the importance of effective management tools in enhancing operational efficiency.
Moreover, the transformative impact of Creatum’s BI Sprint has been significant; as noted by Sascha Rudloff, Team Leader of IT and Process Management at PALFINGER Tail Lifts GMBH, “The outcomes of the Sprint surpassed our expectations and were a vital catalyst for our analytics strategy.” By understanding these dynamics and leveraging Creatum’s customized AI solutions, businesses can navigate the intricate AI landscape and make informed decisions that enhance their reporting capabilities and overall management strategies.
Integrating Power BI Apps with Other Tools for Enhanced Efficiency
Integrating BI applications with other tools can significantly enhance operational efficiency across various business functions. For instance, consider the following integrations:
-
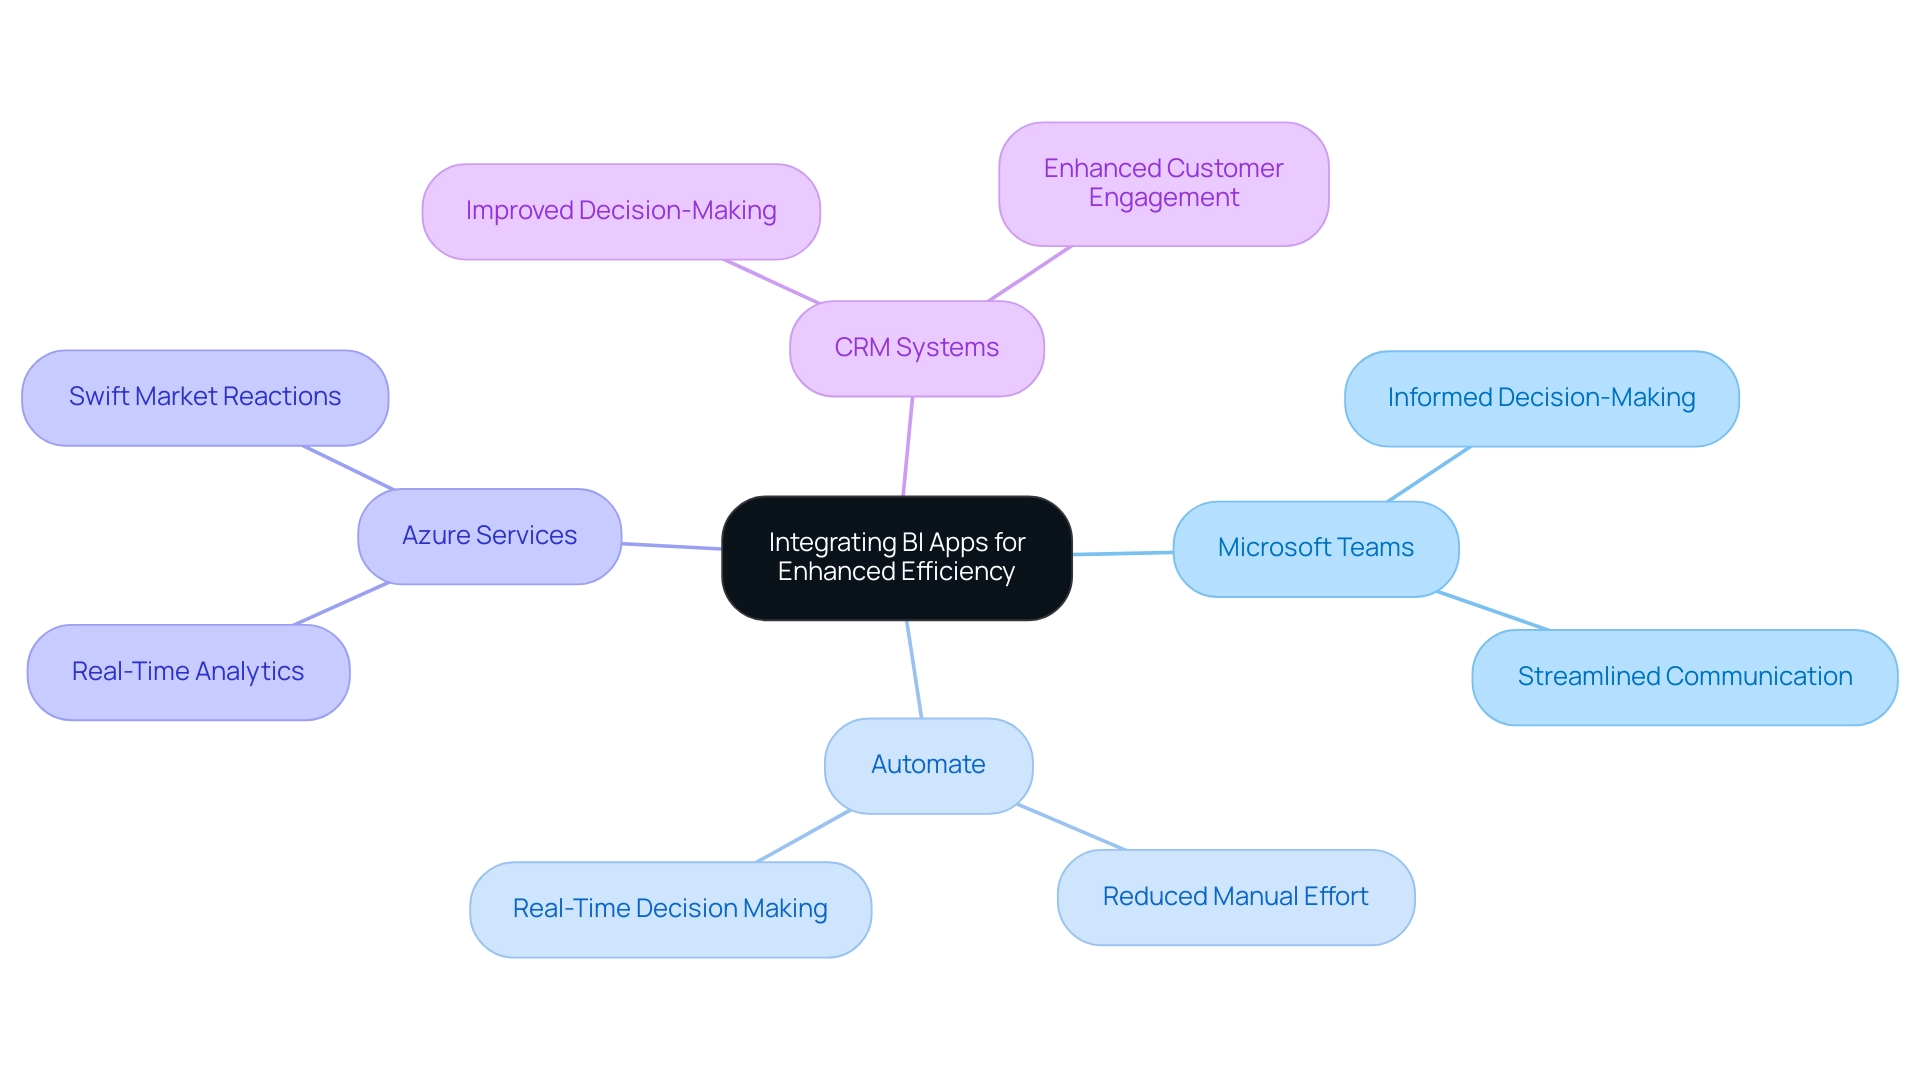
Microsoft Teams: By integrating BI Apps within Teams, users gain access to essential insights directly within their collaboration platform. This fosters a more informed decision-making environment, streamlining communication and ensuring insights are readily available where teams are already working. However, it is crucial to consider limitations such as feature disparities and permissions management, as highlighted in the case study titled “Considerations for BI in Teams.”
-
Automate: Automating workflows between BI and other applications allows organizations to streamline data processes and reduce manual effort. This integration minimizes the risk of errors and accelerates the flow of information, enabling teams to focus on strategic initiatives rather than repetitive tasks. Notably, BI navigation history is saved approximately every 15 seconds, supporting real-time decision-making. This aligns with our 3-Day BI Sprint, where we assist you in creating fully functional reports that can be integrated seamlessly into your workflows.
-
Azure Services: Leveraging Azure for information storage and processing enhances the performance of Business Intelligence applications, enabling real-time analytics. This capability allows businesses to react swiftly to evolving market conditions and make data-driven decisions with confidence, further supported by our extensive BI services that include custom dashboards and advanced analytics.
-
CRM Systems: Integrating Business Intelligence applications with CRM systems empowers organizations to visualize customer information effectively. This integration not only improves decision-making but also enhances customer engagement by providing insights that drive personalized interactions.
These integrations underscore the adaptability of BI applications in enhancing overall business intelligence strategies. As organizations increasingly rely on information to guide their operations, the ability to seamlessly link BI with tools such as Microsoft Teams and Automate becomes essential for enhancing efficiency and achieving operational excellence. By leveraging our tailored AI solutions and RPA capabilities, businesses can boost productivity and drive growth through informed decision-making.
The Future of Power BI Apps: Trends and Innovations
The future of BI Apps is poised for transformative advancements that will redefine their role in business intelligence. Key trends include:
-
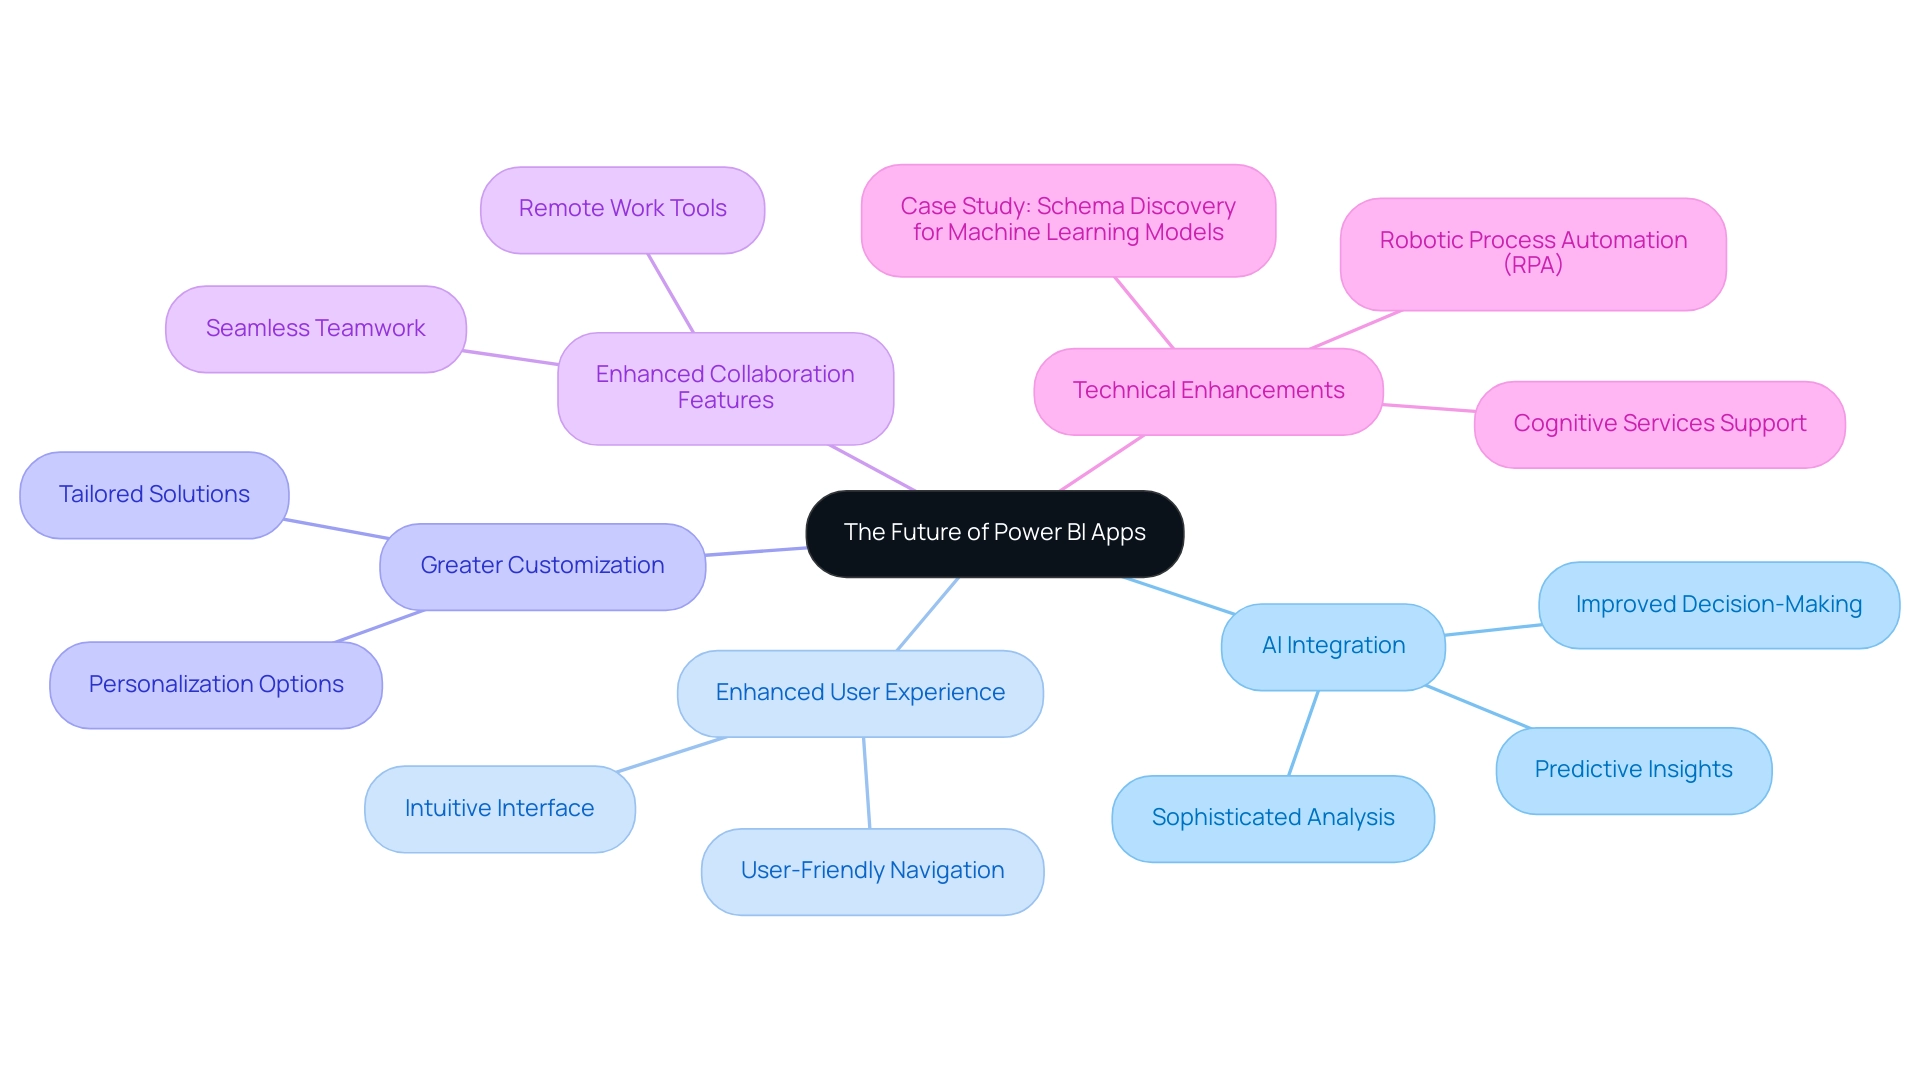
AI Integration: The incorporation of advanced AI capabilities will empower users with sophisticated analysis and predictive insights, making complex information accessible to all stakeholders. This integration is anticipated to substantially improve decision-making procedures, as AI’s incorporation in BI streamlines intricate analysis.
-
Enhanced User Experience: Ongoing updates will focus on user-friendly navigation and an intuitive interface, ensuring that users can easily access and understand information.
-
Greater Customization: Future iterations of Business Intelligence tools are likely to provide improved personalization options, enabling organizations to modify applications to meet specific operational requirements and preferences. This aligns with the organization’s distinct value in offering tailored solutions that enhance information quality and simplify AI implementation.
-
Enhanced Collaboration Features: With the rise of remote work, BI Apps will likely introduce more collaborative tools, facilitating seamless teamwork and communication across distances.
Additionally, Cognitive Services are supported for Premium capacity nodes EM2, A2, or P1, further enhancing the technical capabilities of Power BI Apps. Our customized AI solutions, including Small Language Models and GenAI Workshops, will assist organizations in enhancing information quality and streamlining AI implementation.
Furthermore, leveraging Robotic Process Automation (RPA) can streamline manual workflows, boosting efficiency and freeing up teams for more strategic tasks. A relevant case study titled “Schema Discovery for Machine Learning Models” illustrates how data scientists use Python to develop and deploy Machine Learning models, requiring explicit schema generation for web services. Additionally, Creatum GmbH offers a 3-Day BI Sprint for quickly creating professionally designed reports and a General Management App for comprehensive management and smart reviews.
These trends collectively signal a promising future for understanding the differences between Power BI Apps and workspaces, solidifying their position as essential components of effective business intelligence strategies.
Conclusion
Power BI Apps and Workspaces are pivotal in shaping effective data management strategies within organizations. Power BI Workspaces act as collaborative environments, empowering teams to innovate and refine their data reports, thereby enhancing teamwork and operational efficiency. In contrast, Power BI Apps focus on delivering curated content to end-users, ensuring quick and easy access to essential data insights for informed decision-making.
The distinct functionalities of these components underscore their significance in the data analytics landscape. Workspaces bolster collaborative efforts and streamline content management, while Apps prioritize user experience and security, enabling organizations to maintain control over sensitive information. This complementary relationship cultivates a robust environment where data-driven insights can flourish, ultimately driving growth and innovation.
As organizations adapt to the complexities of modern data management, grasping the unique advantages and practical applications of Power BI Apps and Workspaces is crucial. By effectively leveraging these tools, businesses can navigate challenges related to data governance, user engagement, and operational efficiency, positioning themselves for success in the increasingly competitive realm of business intelligence. Embracing the full potential of Power BI not only enhances reporting capabilities but also empowers teams to make strategic decisions that foster sustained organizational growth.
Frequently Asked Questions
What is the primary purpose of a BI Workspace in the Power BI ecosystem?
A BI Workspace serves as a collaborative environment for teams of developers and analysts to create, manage, and share reports and dashboards, fostering teamwork and innovation in analysis.
How do Power BI apps differ from workspaces?
Power BI apps are tailored for end-users and consolidate related reports and dashboards into a user-friendly interface, prioritizing experience and accessibility, while workspaces focus on the development and enhancement of data insights.
What are the ways to share a Power BI app once it is ready?
A Power BI app can be shared through automatic installation, direct links, or via the Power BI app marketplace.
What is the significance of usage metrics reports in Power BI?
Usage metrics reports rank reports based on view count, helping organizations identify which reports are most valuable to users. However, it is important to note that these reports are unsupported in My Workspace and have limitations regarding data collection.
How do BI tools facilitate the distribution of reports and dashboards within organizations?
BI tools ensure that only necessary individuals have access to build and edit content, isolating production-ready material and providing a read-only version to end recipients, which enhances secure information sharing and decision-making.
What key features enhance user experience in Business Intelligence applications?
Key features include curated content, audience management, version control, and mobile accessibility, all of which improve information accessibility and usability.
Why is audience management an important feature in Power BI apps?
Audience management allows administrators to tailor content visibility based on user roles, ensuring sensitive information is accessible only to authorized personnel, which enhances security and compliance.
How does version control benefit users of BI applications?
Version control allows developers to update reports without immediately affecting the end-user experience, maintaining continuity and minimizing disruptions during updates.
What impact does mobile accessibility have on Business Intelligence applications?
Mobile accessibility enables users to access insights anytime and anywhere, supporting a more agile workforce and facilitating timely decision-making.
What improvements in user engagement have been reported by organizations using BI applications?
Organizations have reported significant improvements in user experience, with studies indicating that tailored content and mobile accessibility can lead to a 30% increase in user engagement.
Overview
This article examines seven bi-clustering techniques that significantly enhance data analysis by simultaneously organizing both rows and columns of a dataset. Such an approach reveals intricate patterns that traditional methods often overlook. Among these techniques are:
- Spectral Biclustering
- BiMax
- Iterative Signature Biclustering
Each offering unique applications in critical fields like bioinformatics and marketing analytics. These methods not only drive innovation but also improve decision-making in data-rich environments, showcasing their transformative potential. Professionals in these sectors should consider integrating these techniques to unlock deeper insights and foster more informed strategies.
Introduction
In the realm of data analysis, bi-clustering stands out as a powerful technique that transcends traditional methodologies, offering a unique lens through which to explore complex datasets. This dual-clustering approach organizes both rows and columns of data matrices simultaneously, revealing hidden patterns and relationships that often remain obscured. Particularly valuable in fields such as bioinformatics, bi-clustering not only enhances the understanding of intricate data interactions—like those between genes and conditions—but also paves the way for groundbreaking insights that drive innovation and informed decision-making.
As organizations increasingly harness the potential of bi-clustering, the integration of advanced algorithms and machine learning is set to redefine the landscape of data analysis. This evolution makes bi-clustering an essential tool for navigating the challenges of an ever-evolving digital world. Are you ready to explore how bi-clustering can transform your data analysis practices?
Understanding Bi-Clustering: A Comprehensive Overview
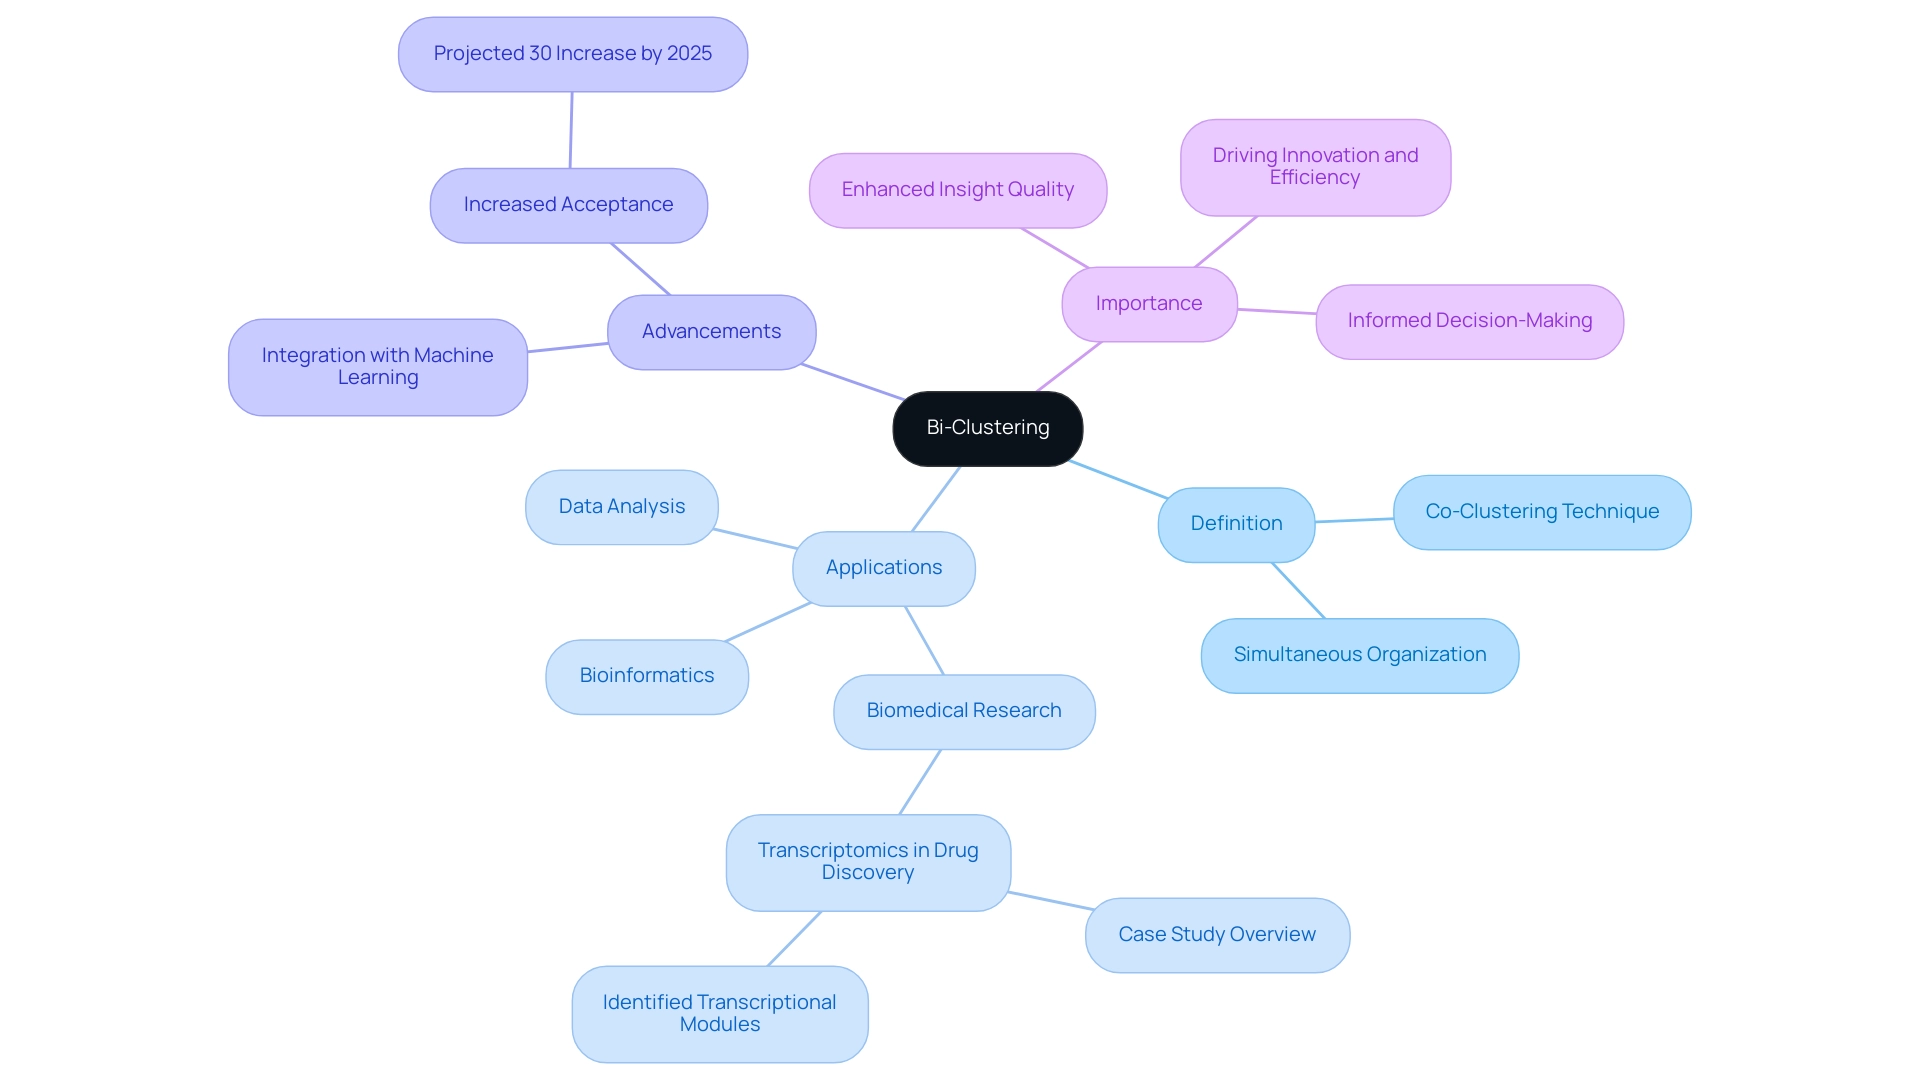
Bi clustering, often referred to as co-clustering or two-mode clustering, is an advanced mining technique that simultaneously organizes both rows and columns of a matrix. This approach is particularly advantageous in contexts where the interplay between two distinct types of information must be examined, such as the relationship between genes and conditions in bioinformatics. By employing bi clustering to cluster both dimensions, this technique uncovers intricate patterns that traditional clustering methods may overlook, thereby offering a more comprehensive insight into the underlying data structure.
Recent advancements in dual-clustering methods have significantly enhanced their applicability across various fields. For instance, in biomedical research, clustering algorithms have been effectively utilized to analyze complex datasets, leading to breakthroughs in understanding disease mechanisms. A notable case study involves the examination of transcriptomic profiles from eight drug discovery projects, which successfully identified transcriptional modules associated with desired therapeutic effects.
Statistics indicate that the application of dual clustering in information evaluation is on the rise, with a notable increase of 30% in acceptance among researchers and institutions projected for 2025. This expanding trend underscores the growing integration of dual clustering with machine learning methods, further enhancing the precision and effectiveness of information examination procedures. As Yang Li pointed out, ‘This presentation illustrates the examination and views of Yang Li,’ emphasizing the significance of expert perspectives in comprehending these techniques.
The importance of bi clustering in information analysis cannot be overstated. It not only enhances the quality of insights derived from complex datasets but also facilitates more informed decision-making. As organizations continue to navigate the challenges of data-rich environments, the ability to extract meaningful patterns through bi clustering will be crucial for driving innovation and operational efficiency.
By leveraging customized solutions that enhance information quality and simplify AI implementation, such as Robotic Process Automation (RPA) and Business Intelligence (BI), businesses can fully harness the potential of bi clustering to achieve their strategic goals.
The Significance of Bi-Clustering in Data Analysis
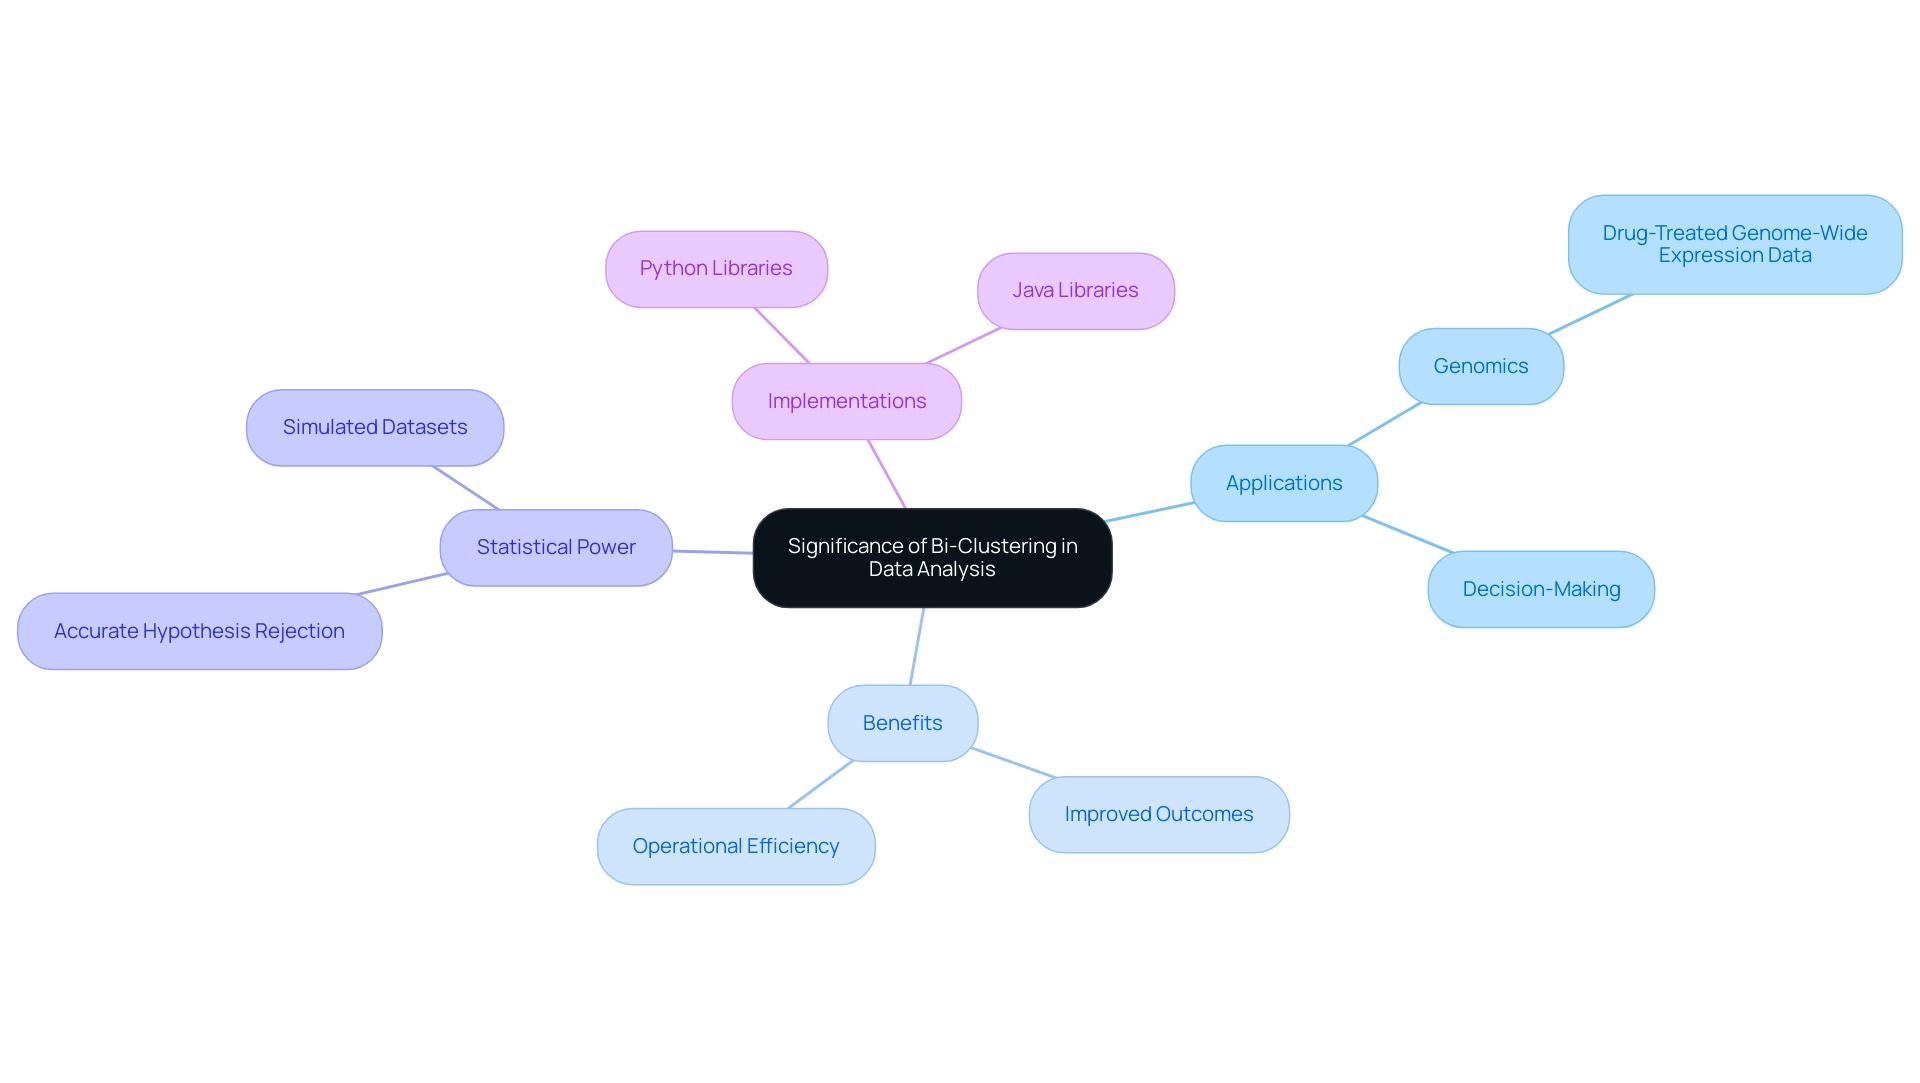
Bi clustering serves as a pivotal method in information evaluation, empowering analysts to unveil hidden patterns and connections within complex datasets. This technique proves particularly beneficial in genomics, where bi clustering aids in identifying gene groups exhibiting similar expression patterns across diverse conditions. A notable case study on bi clustering within drug-treated genome-wide expression data exemplified its efficacy in revealing drug-induced gene modules.
The results indicated that subsequent conservation and enrichment evaluations could validate gene-drug connections, offering crucial insights into the impact of medications on gene expression.
The influence of dual clustering extends beyond genomics; it significantly enhances decision-making processes across various fields. By leveraging dual clustering, organizations can formulate more informed strategies, ultimately leading to improved outcomes. As of 2025, the benefits of dual clustering in decision-making are increasingly recognized, with statistical analyses underscoring its importance.
For instance, the probability of accurately rejecting the null hypothesis—known as statistical power—can be markedly improved through effective clustering techniques. This relevance is underscored by simulated datasets for cluster evaluation, which have showcased various configurations for subgroup sizes and feature differences, assessing both statistical power and accuracy.
Moreover, popular implementations of bi clustering are predominantly developed in Python and Java, with an array of libraries available to facilitate its application. Experts emphasize the growing importance of dual grouping in information evaluation. Jing Zhao, an assistant research scientist at Sanford Research, highlights that as organizations strive for data-driven decisions, the capacity to extract meaningful insights from complex datasets becomes essential.
By incorporating bi clustering into their analytical frameworks, businesses can enhance operational efficiency while fostering innovation and growth in an increasingly competitive landscape. This aligns with the broader narrative of utilizing Business Intelligence and Robotic Process Automation (RPA) to streamline workflows and drive data-driven insights, ultimately supporting business growth in a rapidly evolving AI landscape.
Exploring Different Types of Bi-Clustering Techniques
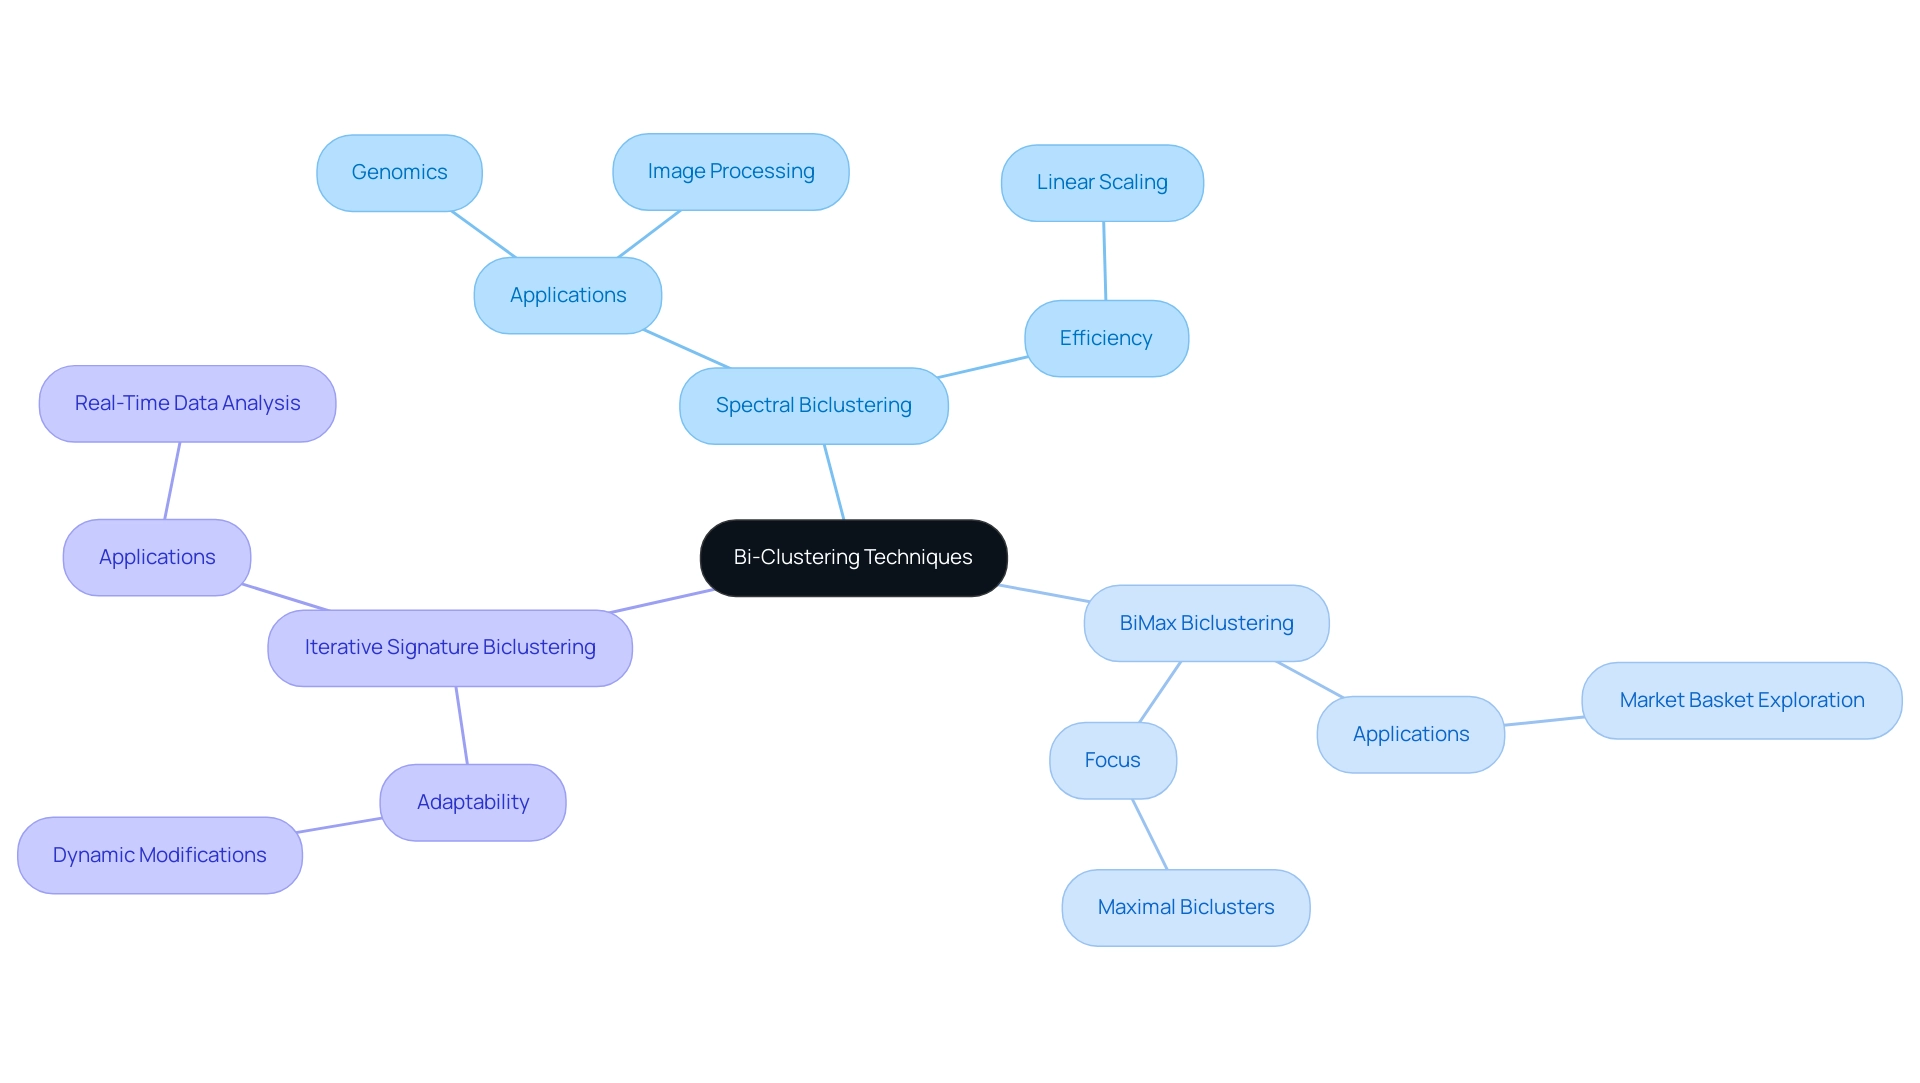
Bi-clustering techniques serve as vital instruments in analysis, each offering unique methodologies and applications tailored to specific types and analytical goals. Prominent techniques include:
-
Spectral Biclustering: This method leverages the spectral properties of matrices to uncover clusters within the information. By analyzing eigenvalues and eigenvectors, it identifies patterns that may not be apparent through traditional clustering methods. Its capability to handle complex datasets makes it particularly valuable in fields such as genomics and image processing. Notably, the runtime of this algorithm scales linearly with the total number of complete iterations, enhancing its efficiency in processing large collections.
-
BiMax Biclustering: Designed for binary information, BiMax focuses on discovering maximal biclusters, which are submatrices exhibiting uniformity in both rows and columns. This method is especially efficient for applications like market basket exploration, where understanding co-occurrence patterns is vital.
-
Iterative Signature Biclustering: This strategy enhances clusters repeatedly based on correlation patterns, allowing dynamic modifications as new information is introduced. Its adaptability makes it suitable for real-time data analysis, particularly in environments where data is continuously evolving.
Each of these techniques has its strengths, making them applicable to various data scenarios. For instance, a recent performance evaluation of dual-cluster algorithms demonstrated that the proposed dual-cluster method outperformed traditional one-way clustering techniques in identifying true latent patterns, achieving the highest average Rand index criterion. This highlights the effectiveness of bi-clustering in revealing insights that might be overlooked by other methodologies. The evaluation was guided by 35 cancer datasets, ensuring a robust assessment of clustering precision.
As analytics progresses, the latest dual-clustering techniques continue to emerge, providing improved capabilities for analysis. Understanding these techniques and their applications is essential for utilizing information effectively and promoting informed decision-making. Moreover, integrating Robotic Process Automation (RPA) into these analytical processes can further enhance operational efficiency by reducing errors and freeing up teams for more strategic, value-adding work.
RPA can streamline workflows related to bi-clustering techniques, enabling organizations to automate manual tasks and focus on deriving actionable insights from information. Additionally, our tailored AI solutions offer customized methods that enhance quality and simplify AI implementation, ultimately driving growth and innovation in analysis. As noted by Ricardo J. G. B. Campello, both authors read and approved the final manuscript, underscoring the collaborative effort in evaluating these methodologies.
Technique 1: Spectral Biclustering – An In-Depth Look
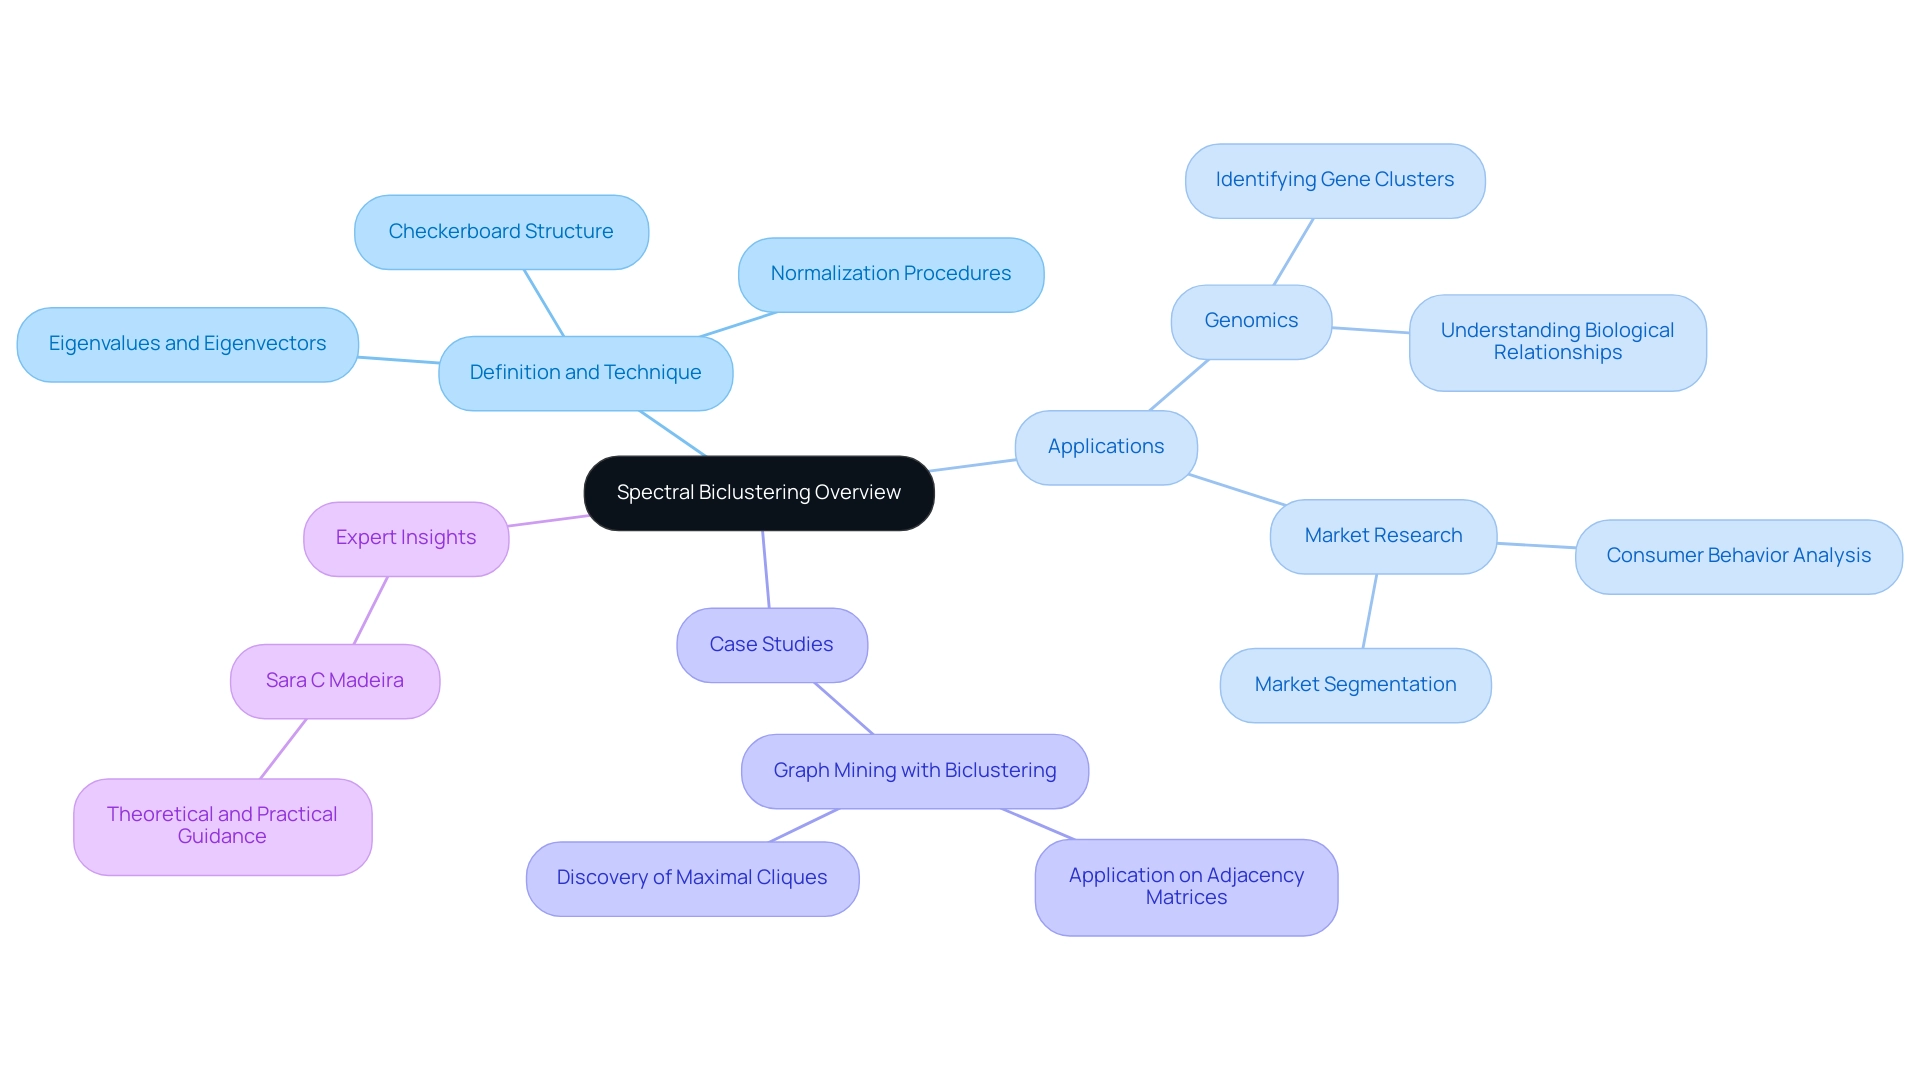
Bi clustering, particularly Spectral Biclustering, represents a sophisticated analytical technique that leverages the eigenvalues and eigenvectors of a matrix to identify clusters within datasets effectively. This method excels in scenarios marked by a checkerboard structure, where relationships between points are not immediately apparent. By transforming the information into a spectral domain, analysts uncover intricate connections between rows and columns, establishing bi clustering as an invaluable asset across various fields, especially in genomics and market research.
The efficacy of Spectral Biclustering is underscored by its capacity to process large datasets with remarkable efficiency. For instance, algorithms tested on a computer equipped with 2.27 GHz dual quad-core Intel Xeon CPUs and 48 GB of main memory have shown significant performance in managing complex data structures. Normalization procedures are integral to this modeling process, enabling bi clustering to discern bidirectional structures, thereby enhancing the clarity and accuracy of the analysis.
In the realm of genomics, the applications of bi clustering, specifically Spectral Biclustering, are particularly noteworthy. It has proven instrumental in identifying clusters of genes and conditions, facilitating a deeper understanding of biological relationships. A compelling case study titled “Graph Mining with Biclustering” illustrates this application, demonstrating how bi clustering algorithms can be employed on adjacency matrices to uncover coherent modules within networks.
This approach has led to the discovery of maximal cliques, providing new insights into the interpretation of relationships within complex genomic information through bi clustering.
Expert opinions further emphasize the importance of this method in enhancing information evaluation. As noted by Sara C Madeira, a prominent researcher in the field, “We aim to provide theoretical and practical guidance about biclustering analysis.” This statement highlights the significance of such guidance in harnessing the full potential of bi clustering.
The ongoing exploration of this technique continues to reveal its transformative impact on information interpretation, particularly in the rapidly evolving field of genomics, where bi clustering plays a crucial role.
Technique 2: BiMax Biclustering – Key Features and Applications
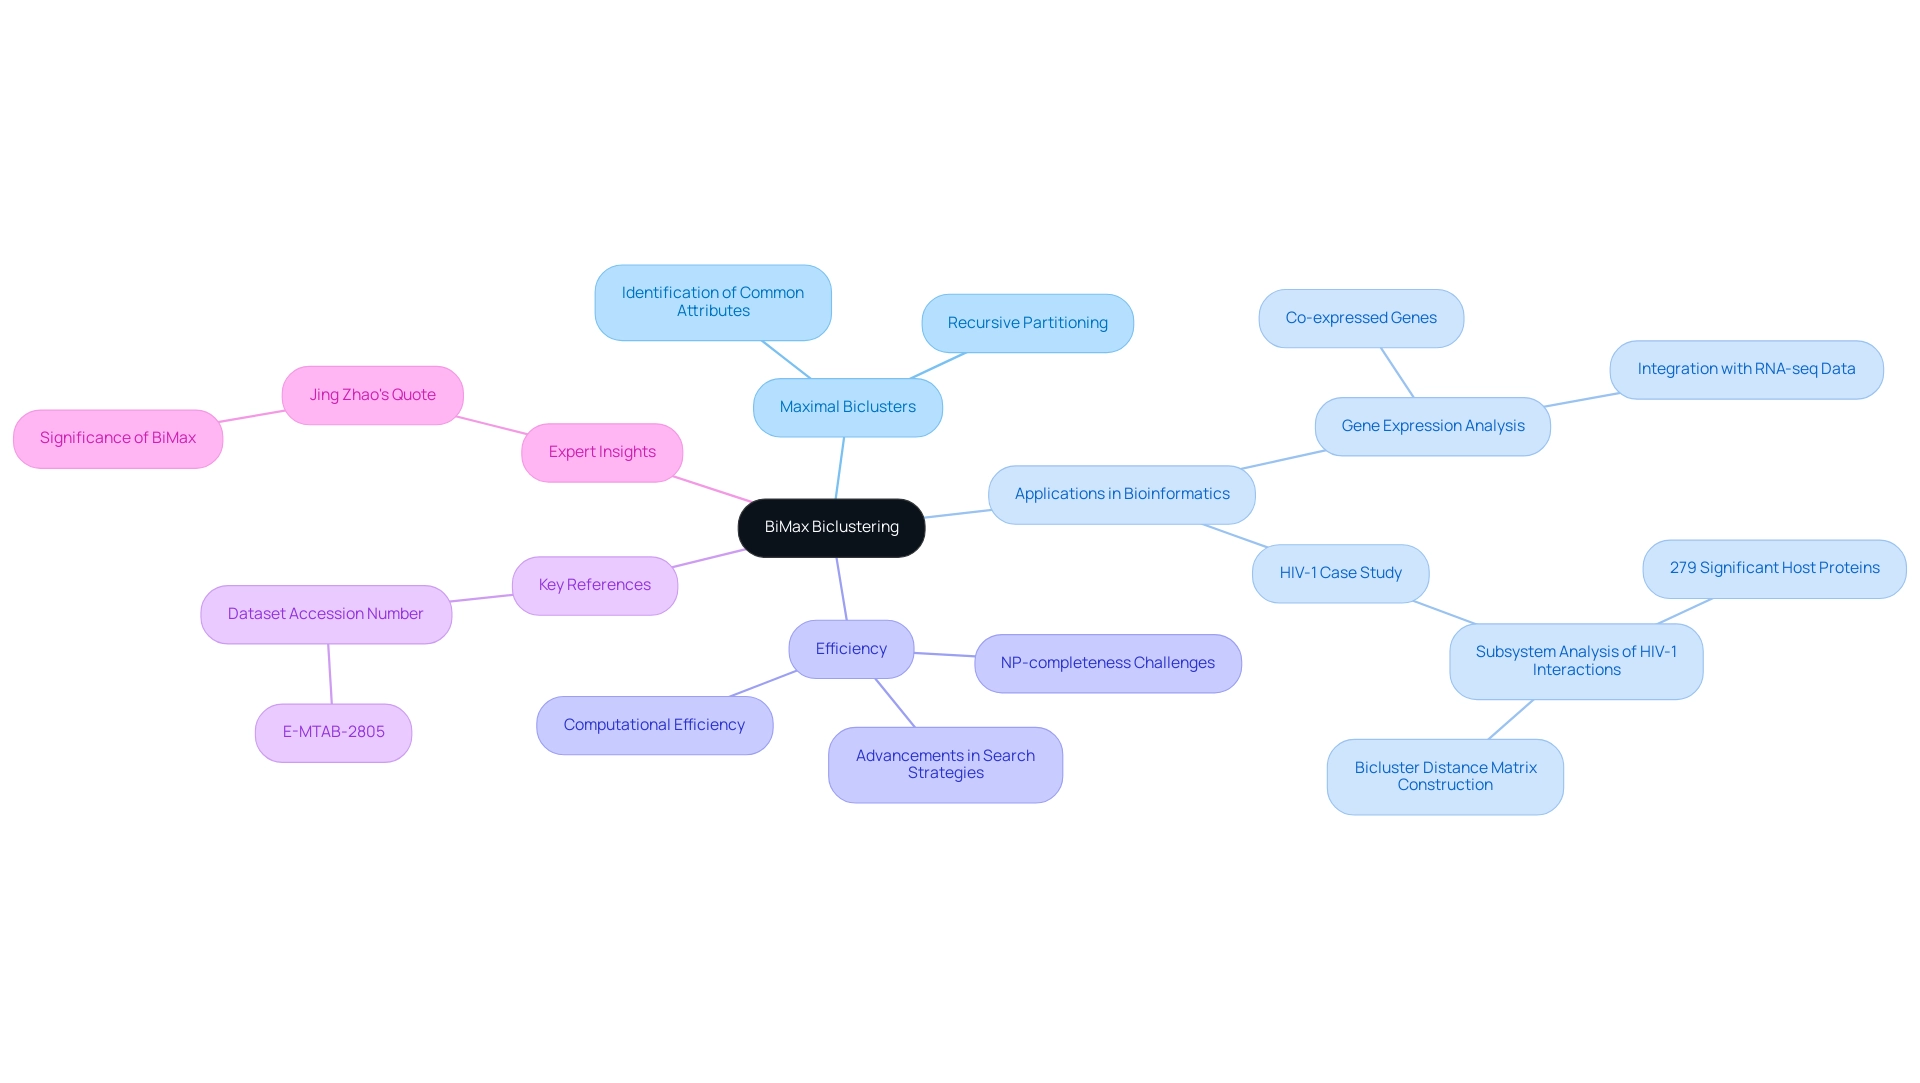
Bi clustering stands out as a powerful technique specifically designed to identify maximal biclusters within binary matrices. This method works by recursively partitioning the information into submatrices that exclusively contain 1’s, thereby revealing groups of items that share common attributes. Its application in bioinformatics is particularly noteworthy, especially in analyzing gene expression data, where it effectively uncovers co-expressed genes across various conditions.
The efficiency of BiMax in processing binary data has made it a favored choice among researchers engaged in bi clustering within the field.
As we look to 2025, the significance of bi clustering using BiMax bicluster analysis continues to expand, with applications proliferating across diverse areas of bioinformatics. For instance, recent studies underscore its utility in gene expression analysis, aiding in the identification of significant patterns that inform research on genetic interactions and disease mechanisms. The synergy of bicluster analysis with RNA-seq data further enhances the capacity to study individual cell heterogeneity, offering deeper insights into cellular behaviors and responses.
Moreover, the computational efficiency of bi clustering through BiMax bicluster analysis is pivotal to its adoption. Despite the inherent challenges posed by NP-completeness in grouping algorithms, advancements in search strategies have bolstered its performance, establishing it as a viable option for large datasets. A notable case study involving the subsystem analysis of HIV-1 interactions utilized BiMax to identify 279 significant sets of host proteins interacting with the virus, showcasing its practical application in real-world scenarios.
This case study highlights the effectiveness of BiMax in facilitating the construction of a bi clustering distance matrix, essential for understanding complex biological interactions.
Furthermore, the dataset accession number for Buettner (E-MTAB-2805) serves as a solid reference point for readers interested in specific sources related to cluster analysis research. Jing Zhao, an assistant research scientist at Sanford Research and an assistant professor at the Department of Internal Medicine, University of South Dakota Sanford School of Medicine, emphasizes the significance of BiMax in advancing bioinformatics research, stating, “BiMax provides a robust framework for uncovering hidden patterns in complex datasets, ultimately driving innovation in the field.”
Overall, bi clustering with BiMax dual clustering not only simplifies analysis in bioinformatics but also empowers researchers to derive meaningful insights from intricate information sets, ultimately fostering innovation and growth in the field.
Technique 3: Iterative Signature Biclustering – Methodology and Use Cases
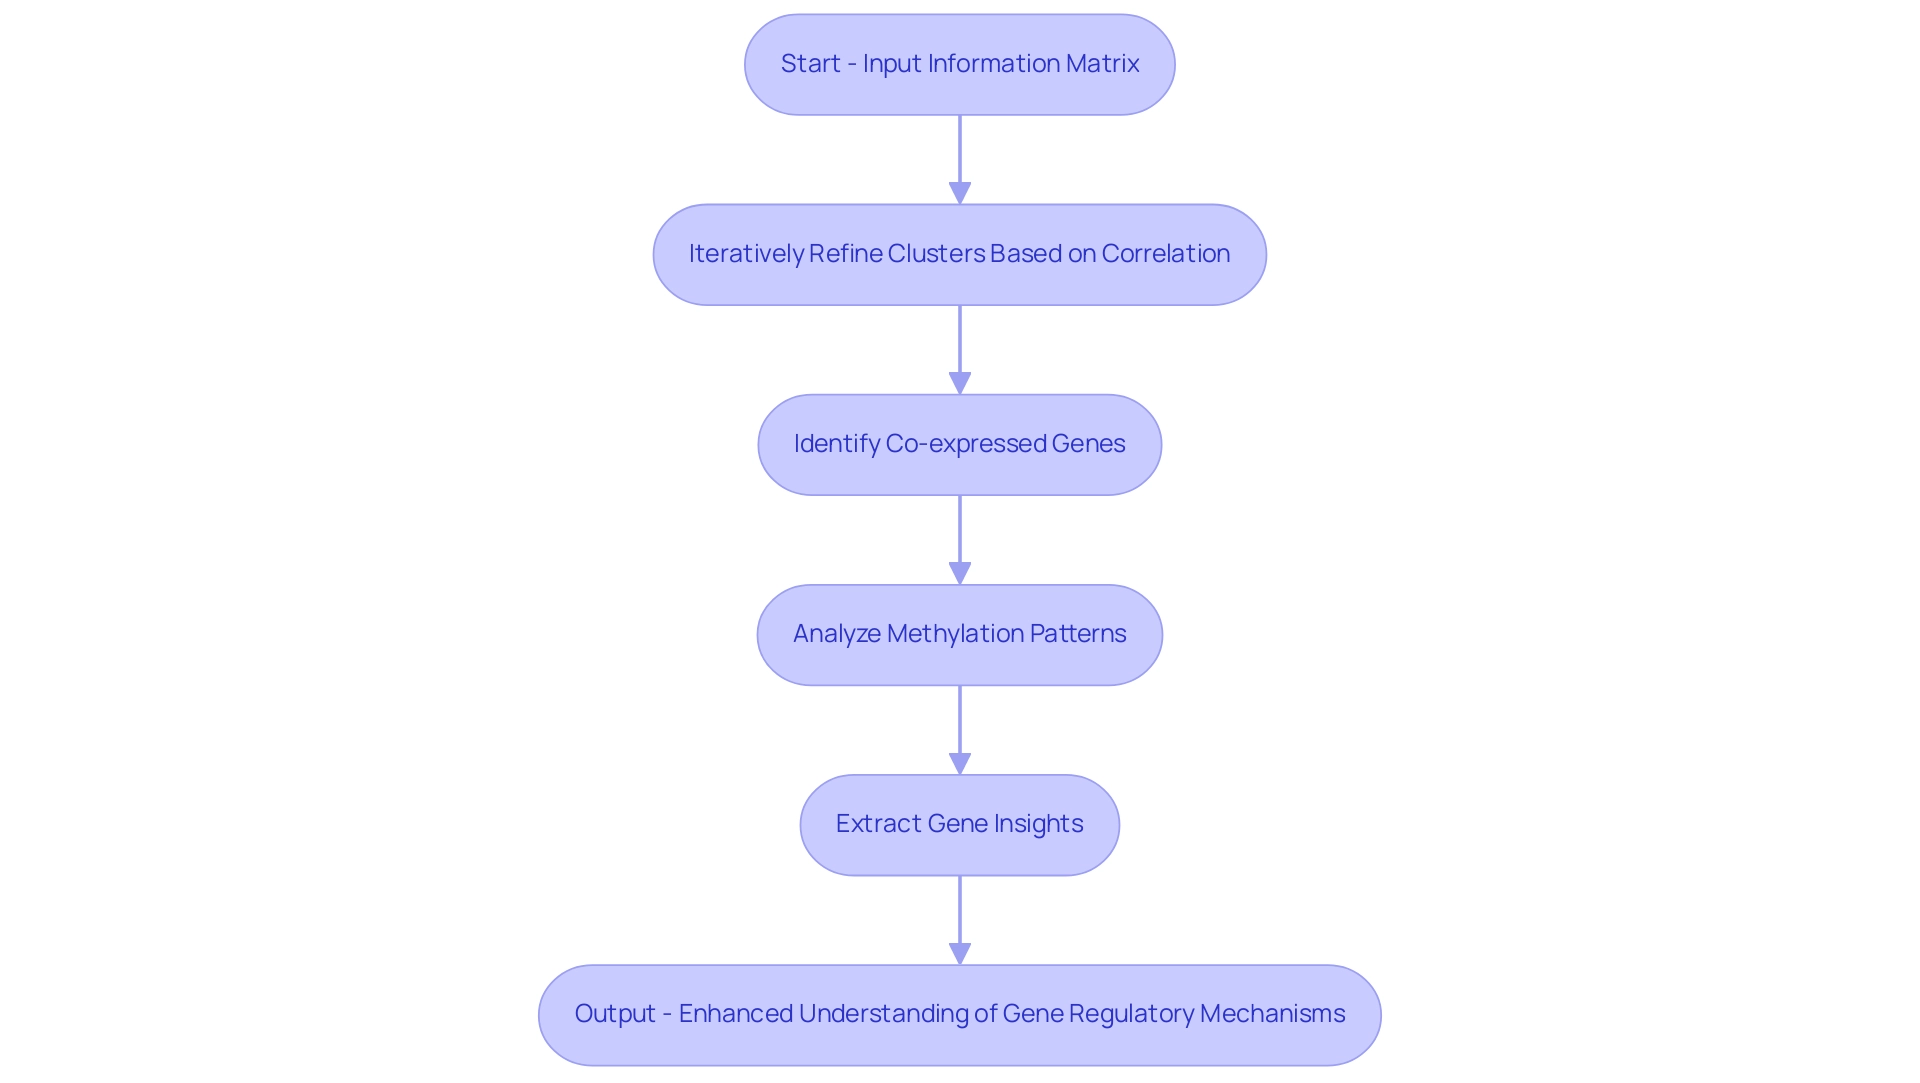
The Iterative Signature Algorithm (ISA) is a powerful technique designed to identify correlated blocks within information matrices. By iteratively refining clusters based on the correlation between rows and columns, ISA proves particularly effective for analyzing gene expression information. This method has been instrumental in various biological studies, revealing co-expressed genes and shedding light on intricate gene regulatory mechanisms.
For instance, in a study examining the role of DNA methylation in breast cancer, ISA facilitated the identification of distinct methylation patterns associated with different breast cancer subtypes. Such insights are crucial, as they can lead to better-targeted therapies and improved clinical outcomes for patients.
Sara C Madeira, the corresponding author, emphasizes, “We aim to provide theoretical and practical guidance about bi clustering analysis,” underscoring the significance of ISA in this field. The iterative nature of ISA not only enhances the quality of clusters but also adapts to the growing complexity of datasets, making it a robust choice for researchers. In 2025, the methodology continues to evolve, with advancements aimed at developing more efficient bi clustering algorithms to manage increasingly large datasets.
Statistics indicate that ISA has successfully extracted 1,906 genes from a dataset of 17,815 genes, demonstrating its effectiveness in distilling meaningful insights from vast amounts of information. The pattern of bi clustering simplifies its description, aiding in the identification of relationships and noise, which is invaluable for researchers navigating the complexities of modern biological studies. As the landscape of biological research grows, the uses of ISA in revealing relationships and minimizing interference in evaluations remain invaluable, establishing it as a crucial instrument for researchers aiming to navigate the complexities of contemporary biological studies.
Leveraging Bi-Clustering Techniques for Enhanced Data Insights
Utilizing dual-clustering methods empowers organizations to significantly enhance their analytical capabilities, particularly in the rapidly evolving AI landscape. Each method offers unique advantages that can be tailored to specific datasets and analytical goals. For example, bi-clustering can uncover hidden patterns in gene expression data, leading to breakthroughs in biomedical research, or it can effectively segment customers in marketing analytics, facilitating targeted campaigns that resonate with distinct consumer groups.
As data volumes continue to surge—projected to reach 20.3 billion IoT connections by 2025—businesses must implement innovative strategies to navigate this complexity. Bi-clustering serves as a robust toolset for extracting meaningful insights, especially in scenarios where traditional analysis methods may prove inadequate. This aligns with the demand for customized AI solutions from Creatum GmbH, which cut through the noise and provide targeted technologies that address specific business objectives and challenges.
A compelling case study in this domain is the application of dual clustering in graph mining, illustrating how relationships between entities can be revealed within networks. By representing a matrix as a bipartite graph, grouping algorithms can identify coherent modules, enhancing the understanding of network structures. This approach has demonstrated effectiveness in both binary and weighted networks, showcasing the versatility of bi-clustering across various contexts.
The impact of dual-clustering on information insights is profound, with experts emphasizing its role in improving computational searches and streamlining the visualization of complex patterns. As Kelly C. Powell, Marketing Head & Engagement Manager at Creatum GmbH, aptly states, “We collect your requirements, we offer a solution, we succeed together!” This collaborative approach is essential as organizations prioritize information governance—an area of focus for 60% of information leaders—making combined clustering techniques crucial for managing and extracting value from the growing volume of information.
In summary, the advantages of bi-clustering for data insights are unmistakable: it enhances analytical capabilities, drives innovation, and supports informed decision-making. The structure of bi-clustering simplifies representation, aiding in the identification of relationships and improving computational searches. As businesses look to the future, mastering these techniques will be vital for remaining competitive in an increasingly data-driven environment, underscoring the importance of Business Intelligence in driving operational efficiency and growth.
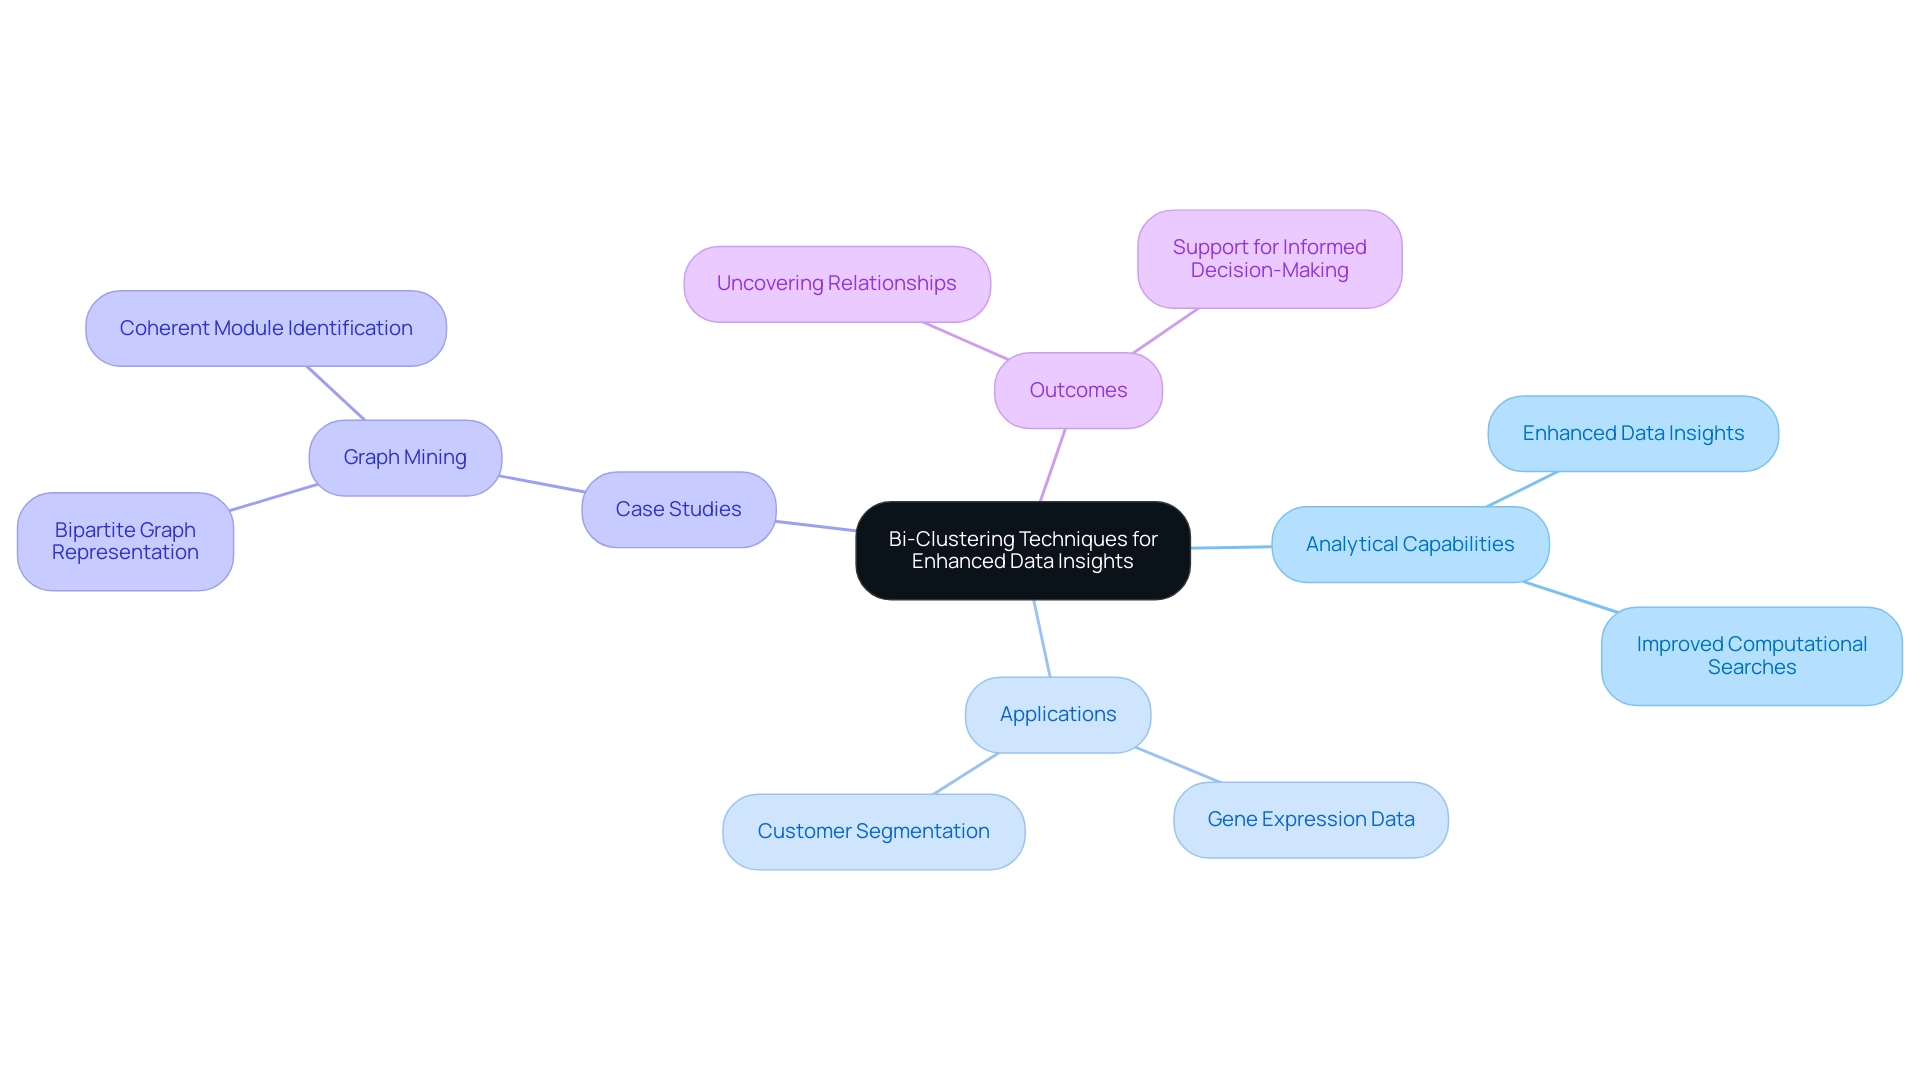
Conclusion
The exploration of bi-clustering techniques highlights their immense potential to transform data analysis practices across various fields. By simultaneously clustering both rows and columns, bi-clustering uncovers intricate patterns that traditional methods might overlook. This makes it an invaluable tool for sectors such as bioinformatics and marketing analytics. Furthermore, advancements in algorithms and machine learning integration are enhancing the effectiveness of bi-clustering, driving significant improvements in data insights and decision-making processes.
As organizations grapple with the complexities of ever-increasing data volumes, the adoption of bi-clustering will be pivotal in navigating these challenges. The ability to reveal hidden relationships within datasets fosters innovation and supports strategic initiatives that can lead to improved operational efficiencies. The case studies and statistics highlighted throughout this article underscore the growing recognition of bi-clustering as a critical component in the data analysis toolkit.
Ultimately, mastering bi-clustering techniques empowers organizations to harness the full potential of their data, paving the way for informed decision-making and competitive advantage in an increasingly data-driven landscape. Embracing these methodologies is essential for any organization aiming to thrive in the modern digital era, reinforcing the significance of bi-clustering as a key driver of innovation and growth in data analysis.
Frequently Asked Questions
What is bi clustering?
Bi clustering, also known as co-clustering or two-mode clustering, is an advanced mining technique that simultaneously organizes both rows and columns of a matrix, allowing for the examination of relationships between two distinct types of information.
In what contexts is bi clustering particularly useful?
Bi clustering is particularly advantageous in contexts such as bioinformatics, where it can analyze the relationship between genes and conditions, uncovering intricate patterns that traditional clustering methods may overlook.
How has bi clustering been applied in biomedical research?
In biomedical research, bi clustering algorithms have been utilized to analyze complex datasets, leading to breakthroughs in understanding disease mechanisms, such as identifying transcriptional modules associated with therapeutic effects in drug discovery projects.
What is the projected trend for the acceptance of dual clustering methods?
Statistics indicate a projected increase of 30% in the acceptance of dual clustering methods among researchers and institutions by 2025, highlighting the growing integration of these methods with machine learning.
What are the benefits of bi clustering in information analysis?
Bi clustering enhances the quality of insights derived from complex datasets, facilitates informed decision-making, and is crucial for organizations navigating data-rich environments, ultimately driving innovation and operational efficiency.
How does bi clustering contribute to decision-making processes?
By leveraging dual clustering, organizations can formulate more informed strategies and improve outcomes, as effective clustering techniques can significantly enhance the probability of accurately rejecting the null hypothesis.
What programming languages are commonly used for implementing bi clustering?
Popular implementations of bi clustering are predominantly developed in Python and Java, with various libraries available to facilitate its application.
How can businesses leverage bi clustering for growth?
By incorporating bi clustering into their analytical frameworks, businesses can enhance operational efficiency, foster innovation, and support data-driven decision-making, aligning with the use of Business Intelligence and Robotic Process Automation (RPA).
Overview
This article delves into best practices for maximizing performance with the string_split function in SQL Server. It highlights essential strategies that include:
- Ensuring compatibility
- Avoiding use in WHERE clauses
- Utilizing temporary tables
- Validating outputs
These practices collectively enhance operational efficiency and streamline data processing tasks, ultimately providing actionable insights for professionals looking to optimize their SQL performance.
Introduction
In the realm of data management, efficiently manipulating strings is crucial for organizations aiming to harness the full potential of their datasets. The string_split function, introduced in SQL Server 2016, serves as a powerful tool for breaking down strings into manageable components. This capability significantly enhances data processing tasks. By transforming complex, comma-separated values into structured formats, this function simplifies workflows and boosts productivity, paving the way for informed decision-making.
As SQL Server continues to evolve, anticipated advancements promise even greater capabilities. It is essential for businesses to grasp the intricacies of string_split and its applications in real-world scenarios. This exploration delves into the benefits, challenges, and best practices associated with this function. It offers insights into how organizations can optimize their data handling processes and drive growth in an increasingly data-driven landscape.
Understanding the string_split Function: A Key to Efficient Data Handling
The string_split function, introduced in SQL Server 2016, serves as a robust solution for disaggregating strings into individual components based on a specified delimiter. This table-valued procedure produces a single-column table where each row corresponds to a substring. For instance, executing SELECT value FROM STRING_SPLIT('apple, banana,cherry', ',') yields three distinct rows: ‘apple’, ‘banana’, and ‘cherry’.
This functionality is particularly advantageous for managing comma-separated values, significantly enhancing processing tasks by simplifying the manipulation of lists contained within a single string.
The benefits of employing the string_split method extend beyond mere convenience. It streamlines workflows by diminishing the complexity associated with parsing strings, thereby boosting overall handling efficiency. Organizations have reported a notable increase in productivity when leveraging this feature for information extraction and transformation tasks.
For example, companies utilizing the function have automated the processing of large datasets, resulting in quicker decision-making and more accurate insights. This trend aligns with the broader movement towards Robotic Process Automation (RPA) to enhance operational efficiency in a rapidly evolving AI landscape, a key focus of Creatum GmbH’s solutions.
As SQL Server evolves, anticipated enhancements in the handling capabilities of the string_split feature for SQL Server 2025 promise to further improve functionality. The proposed STRING_SPLIT_WK method is expected to produce an output format that includes a key indicating the sequence of values in the original string, thereby enhancing the method’s utility in scenarios requiring ordered information retrieval. As Aaron Bertrand notes, “It doesn’t even have to guarantee the values would be returned in that order, because I can explicitly say ORDER BY [key] (or add other functionality, like return only the first, last, or nth price).”
This advancement aligns with the growing demand for efficient information processing solutions in an increasingly information-driven landscape, underscoring the significance of Business Intelligence and RPA in driving insights and operational efficiency for business growth, a key offering of Creatum GmbH.
Expert opinions underscore the importance of utilizing the string_split function in contemporary information management practices. By enabling the breakdown of complex strings into manageable components, it empowers organizations to harness the full potential of their information, fostering growth and innovation. Creatum GmbH’s case study titled ‘Customized Solutions for Quality‘ illustrates how their solutions enhance quality and simplify AI implementation, ultimately driving growth and innovation for businesses.
As companies continue to navigate the complexities of data processing, this tool remains an essential resource for enhancing operational efficiency and ensuring high-quality data results. For further insights and resources, professionals can refer to MSSQLTips.com, which offers valuable information on SQL Server functionalities.
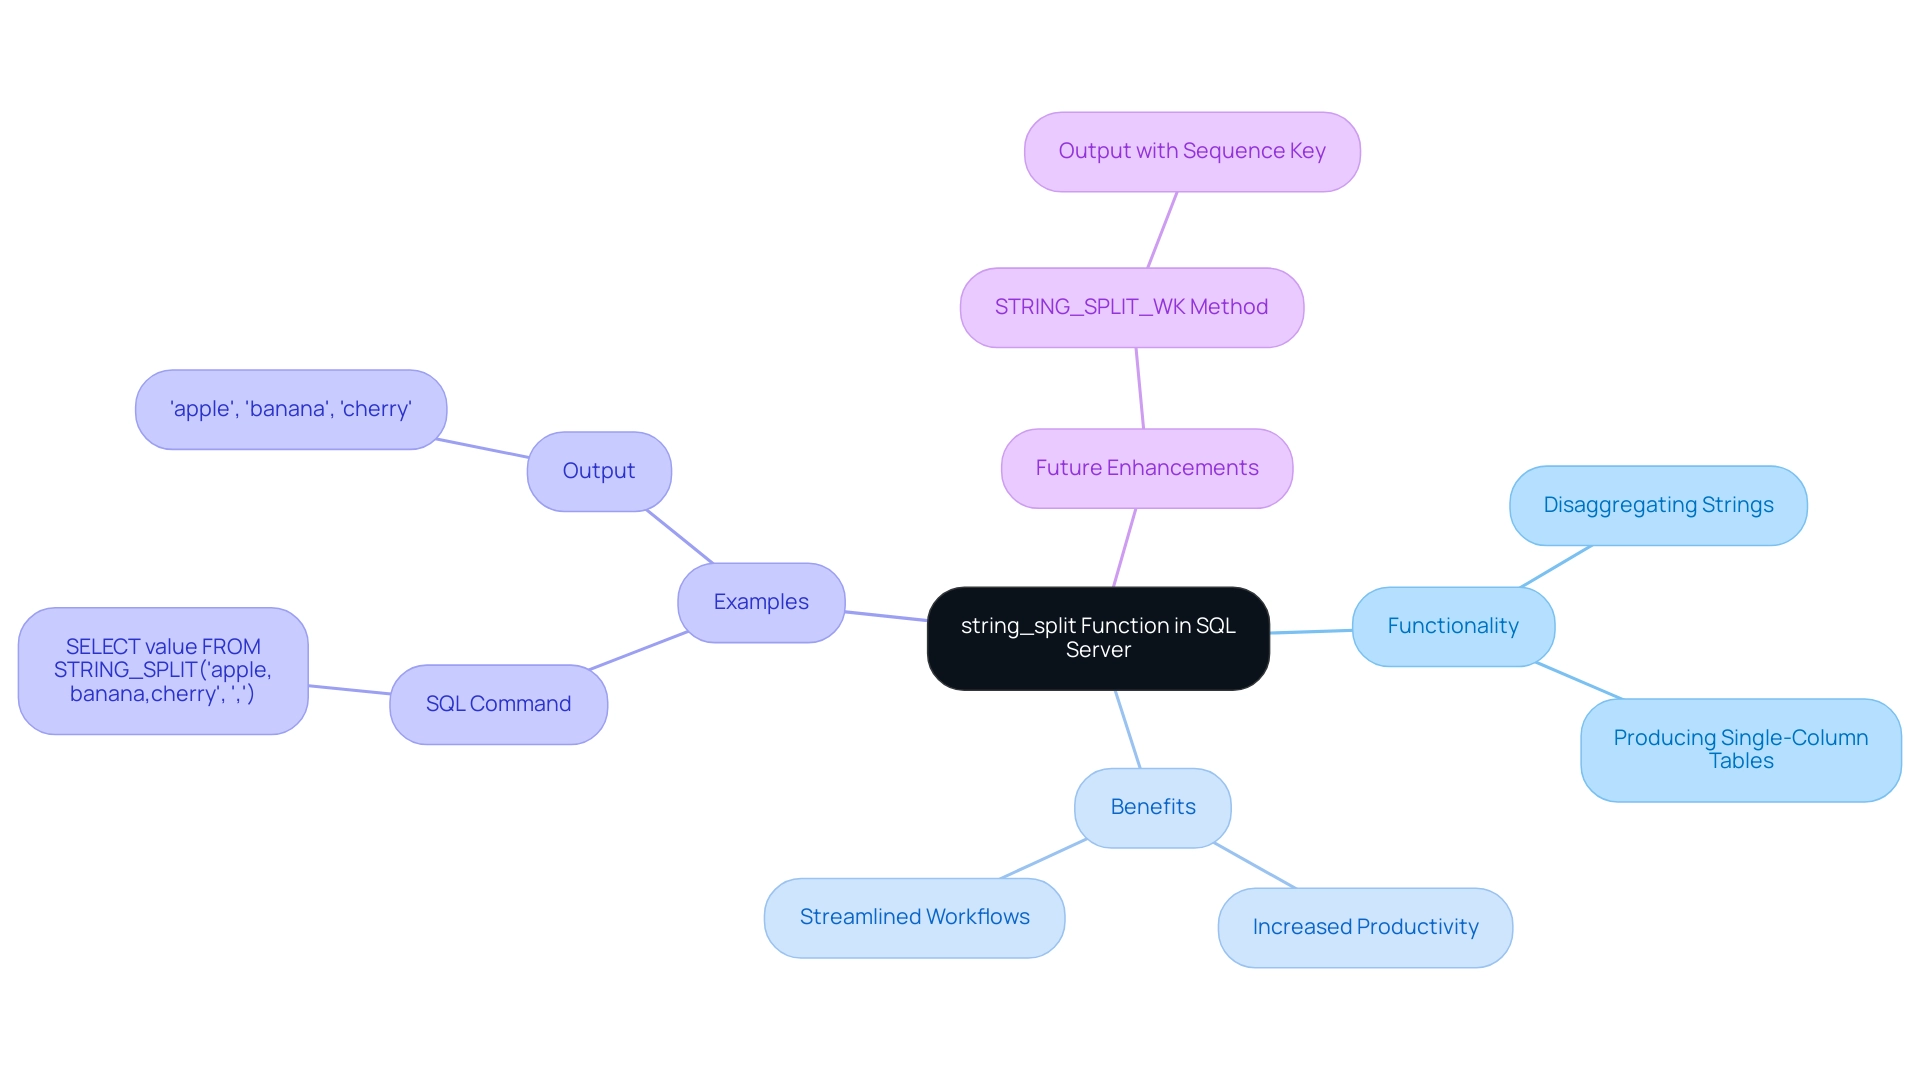
Common Challenges with string_split: Identifying and Overcoming Limitations
The string_separate method in SQL Server serves as a powerful tool for parsing strings, yet it presents several limitations that users must navigate. One notable constraint is its support for only single-character delimiters, which can pose a significant hurdle when dealing with more intricate string formats. This limitation restricts the function’s applicability in scenarios where multi-character delimiters are necessary.
Moreover, the order of the output produced by the splitting function is not guaranteed. This implies that the substrings returned may not preserve the original order from the input string, potentially complicating analysis and interpretation. Additionally, the function does not inherently remove duplicates from the output, leading to unnecessary entries that may distort analysis if not handled correctly.
To efficiently tackle these challenges, users can preprocess their strings to standardize delimiters before applying the string_split function. This preprocessing step enhances the utility of the operation by ensuring that the input is formatted correctly. Furthermore, employing additional SQL functions such as DISTINCT or GROUP BY can help sort and filter the results after the split, allowing for a more refined output that meets specific analytical needs.
For instance, organizations that have implemented robotic process automation (RPA) through Creatum GmbH have successfully streamlined their workflows by addressing such information manipulation challenges. In a case study, a mid-sized company improved efficiency by automating information entry and software testing, which were previously hindered by manual, repetitive tasks. This implementation of RPA not only enhanced operational efficiency and reduced errors but also allowed teams to focus on strategic initiatives, ultimately driving growth and innovation.
Additionally, Creatum GmbH offers tailored AI solutions and Business Intelligence that can further assist organizations in navigating the rapidly evolving AI landscape. As SQL Server progresses, especially with the improvements brought by SQL Server 2022, comprehending and addressing the limitations of the string_split function will be essential for optimizing performance and maintaining data integrity.
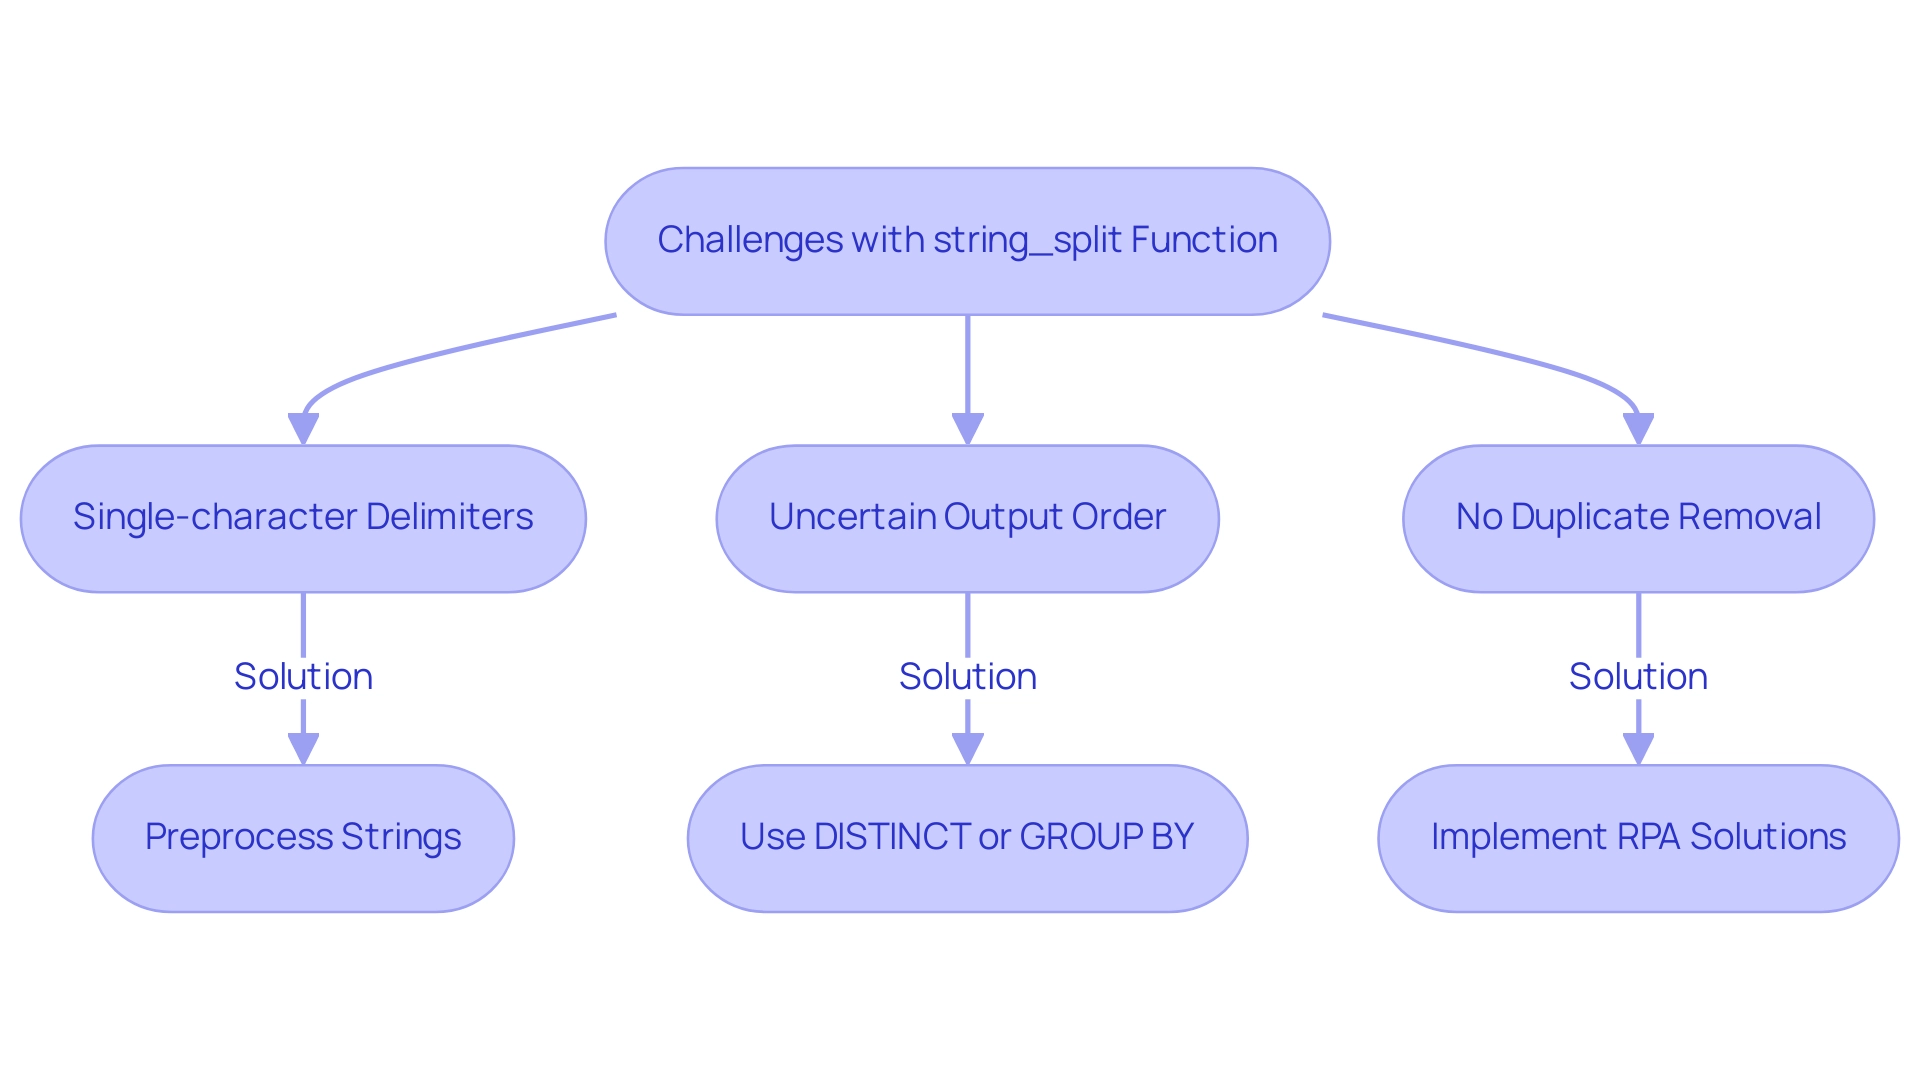
Best Practices for Using string_split: Ensuring Optimal Performance
To achieve optimal performance with the string_split function in SQL Server, follow these best practices:
- Check Compatibility Level: Ensure your SQL Server instance operates at a compatibility level of at least 130. This is essential for effectively utilizing
string_split. - Strategic Placement: Avoid using the function within WHERE clauses, as this can significantly hinder performance. Instead, leverage it in SELECT statements or JOIN operations to maintain efficiency.
- Utilize Temporary Tables: If you anticipate handling a substantial number of substrings, consider employing a temporary table to store the results. This approach can enhance performance by reducing memory overhead and streamlining information processing.
- Validate Outputs: Always validate the output of the function to ensure it aligns with your expectations, particularly when dealing with complex strings. This step is crucial for maintaining data integrity and accuracy.
Incorporating these practices not only optimizes the performance of the string_split function but also aligns with broader strategies for enhancing operational efficiency through Robotic Process Automation (RPA) at Creatum GmbH. As organizations increasingly leverage RPA to automate manual workflows, they can significantly reduce errors and free up resources for more strategic tasks. As Jeff Moden aptly noted, “Divide’n’Conquer is a VERY effective performance tool and not just when it comes to functions and the like.”
Organizations that have adopted these best practices report significant advancements in their processing capabilities, enabling them to extract actionable insights more effectively. For instance, the case study titled ‘Business Intelligence Empowerment’ illustrates how organizations transformed raw information into actionable insights, facilitating informed decision-making. By focusing on performance optimization and integrating RPA, businesses can drive growth and innovation, transforming their data-rich environments into valuable resources for informed decision-making.
Moreover, with SQL Server 2022 introducing advanced time series capabilities, the potential for optimizing performance continues to expand. It is essential for organizations to adopt these best practices to stay ahead.
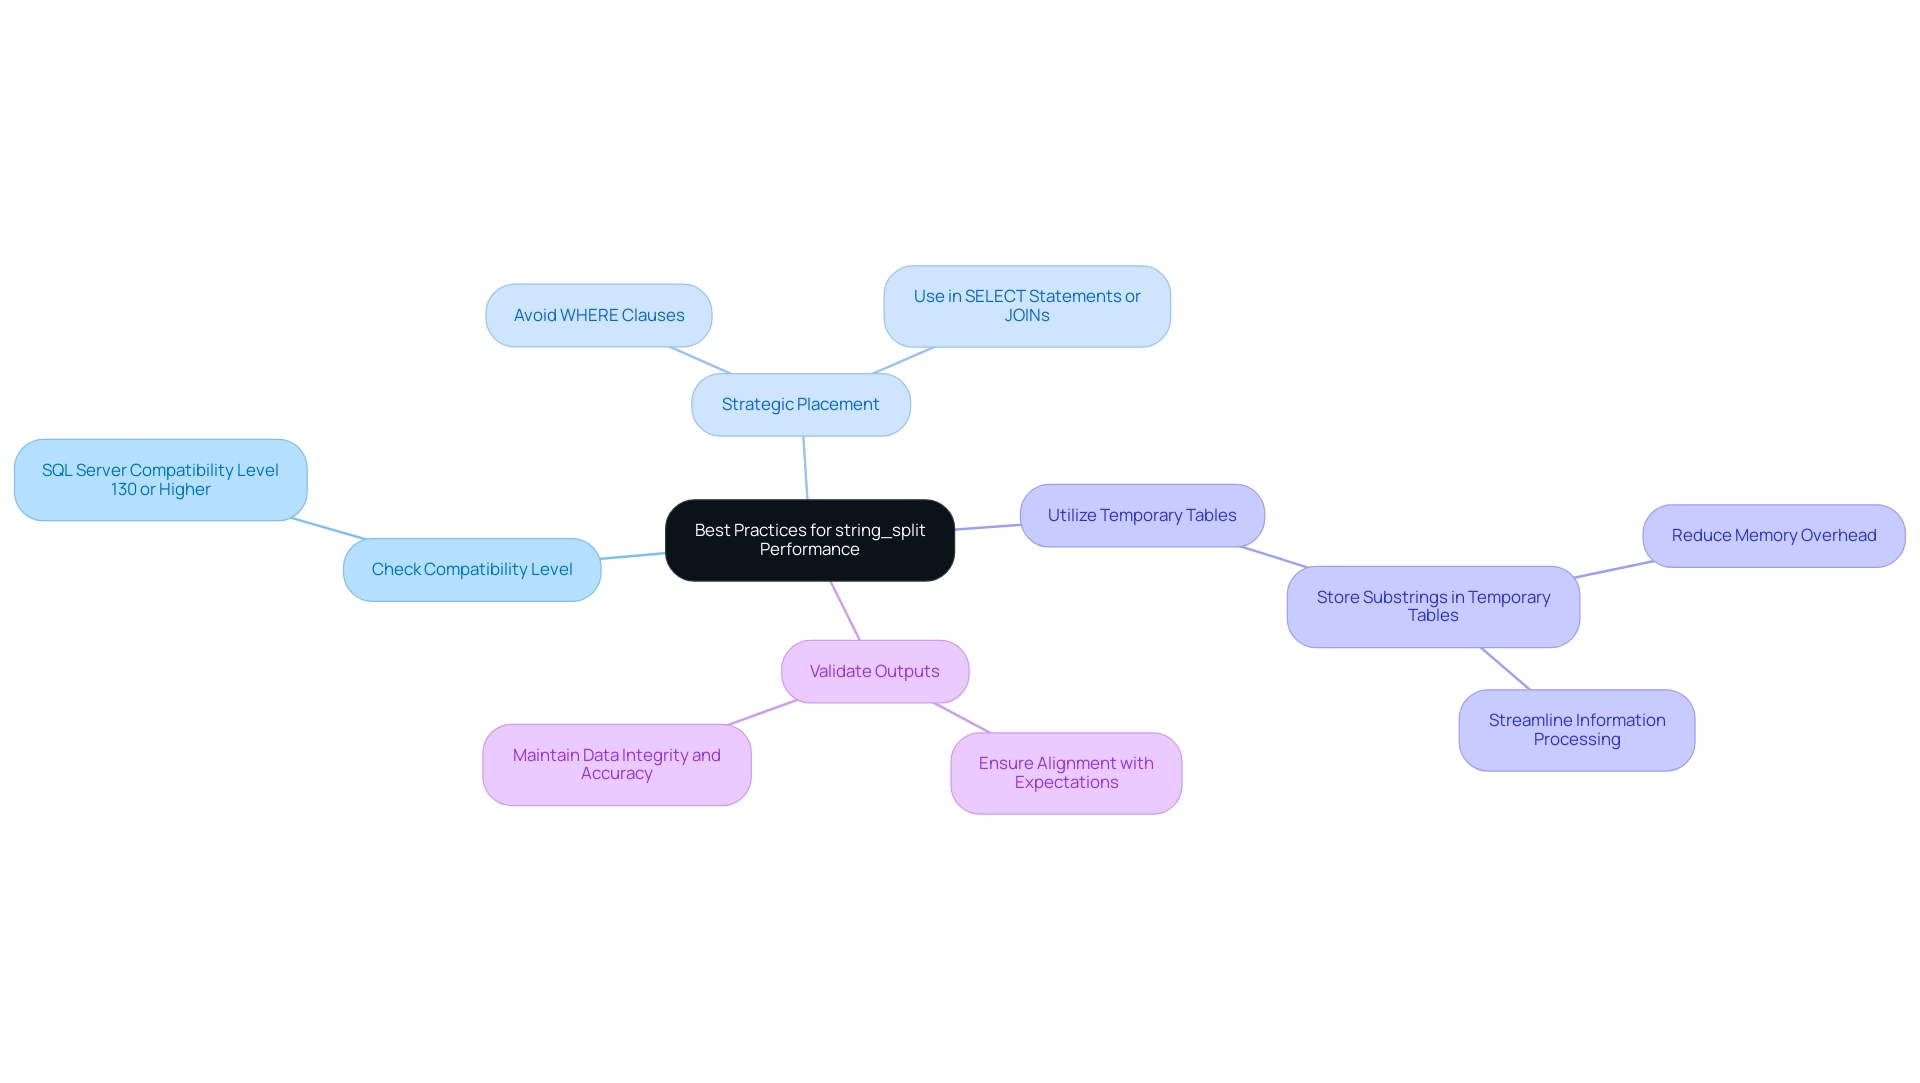
Exploring Alternatives to string_split: When and Why to Use Different Approaches
Beyond the use of string_split, SQL Server offers various alternative methods for effective string manipulation, which can be enhanced through Robotic Process Automation (RPA). One notable approach is XML parsing, excelling in handling complex delimiters and multi-character separators. This method is particularly beneficial when the structure demands a more nuanced splitting technique, enabling the automation of repetitive tasks that can significantly hinder operations.
Moreover, creating a custom user-defined procedure (UDF) allows for tailored solutions that maintain the order of substrings and filter out duplicates, effectively addressing specific data processing needs. It is advisable to name custom procedures as string_split for compatibility with SQL Server 2016 and newer, ensuring seamless integration and operational efficiency.
Another modern option is the OPENJSON method, advantageous for strings formatted as JSON arrays. This function not only simplifies the parsing process but also aligns well with contemporary formats, making it a valuable tool for developers keen on leveraging RPA in their workflows.
Each of these alternatives presents unique benefits and should be evaluated based on the specific context of the information being processed. For instance, while the string_split function is straightforward, it does not guarantee the order of output rows, a critical factor in certain applications. Case studies highlight that options like DelimitedSplit8k_LEAD and JSON Splitter provide enhanced functionality, including support for multiple character delimiters and the ability to retrieve ordinal positions, thus offering more reliable information manipulation solutions.
Thom A. from Rant SQL Server notes that “DelimitedSplit8k_LEAD is a great alternative to ensure you get the ordinal position when splitting.”
It is essential to note that the string_split function requires a compatibility level of at least 130 in SQL Server. Ultimately, selecting the right method hinges on understanding the specific requirements of the task at hand and leveraging the strengths of each approach, particularly in the context of driving data-driven insights and operational efficiency for business growth. Furthermore, the integration of Business Intelligence is crucial as it transforms raw information into actionable insights, enabling informed decision-making that drives growth and innovation.
By addressing the challenges posed by manual, repetitive tasks, Creatum GmbH can enhance operational efficiency and streamline workflows effectively.
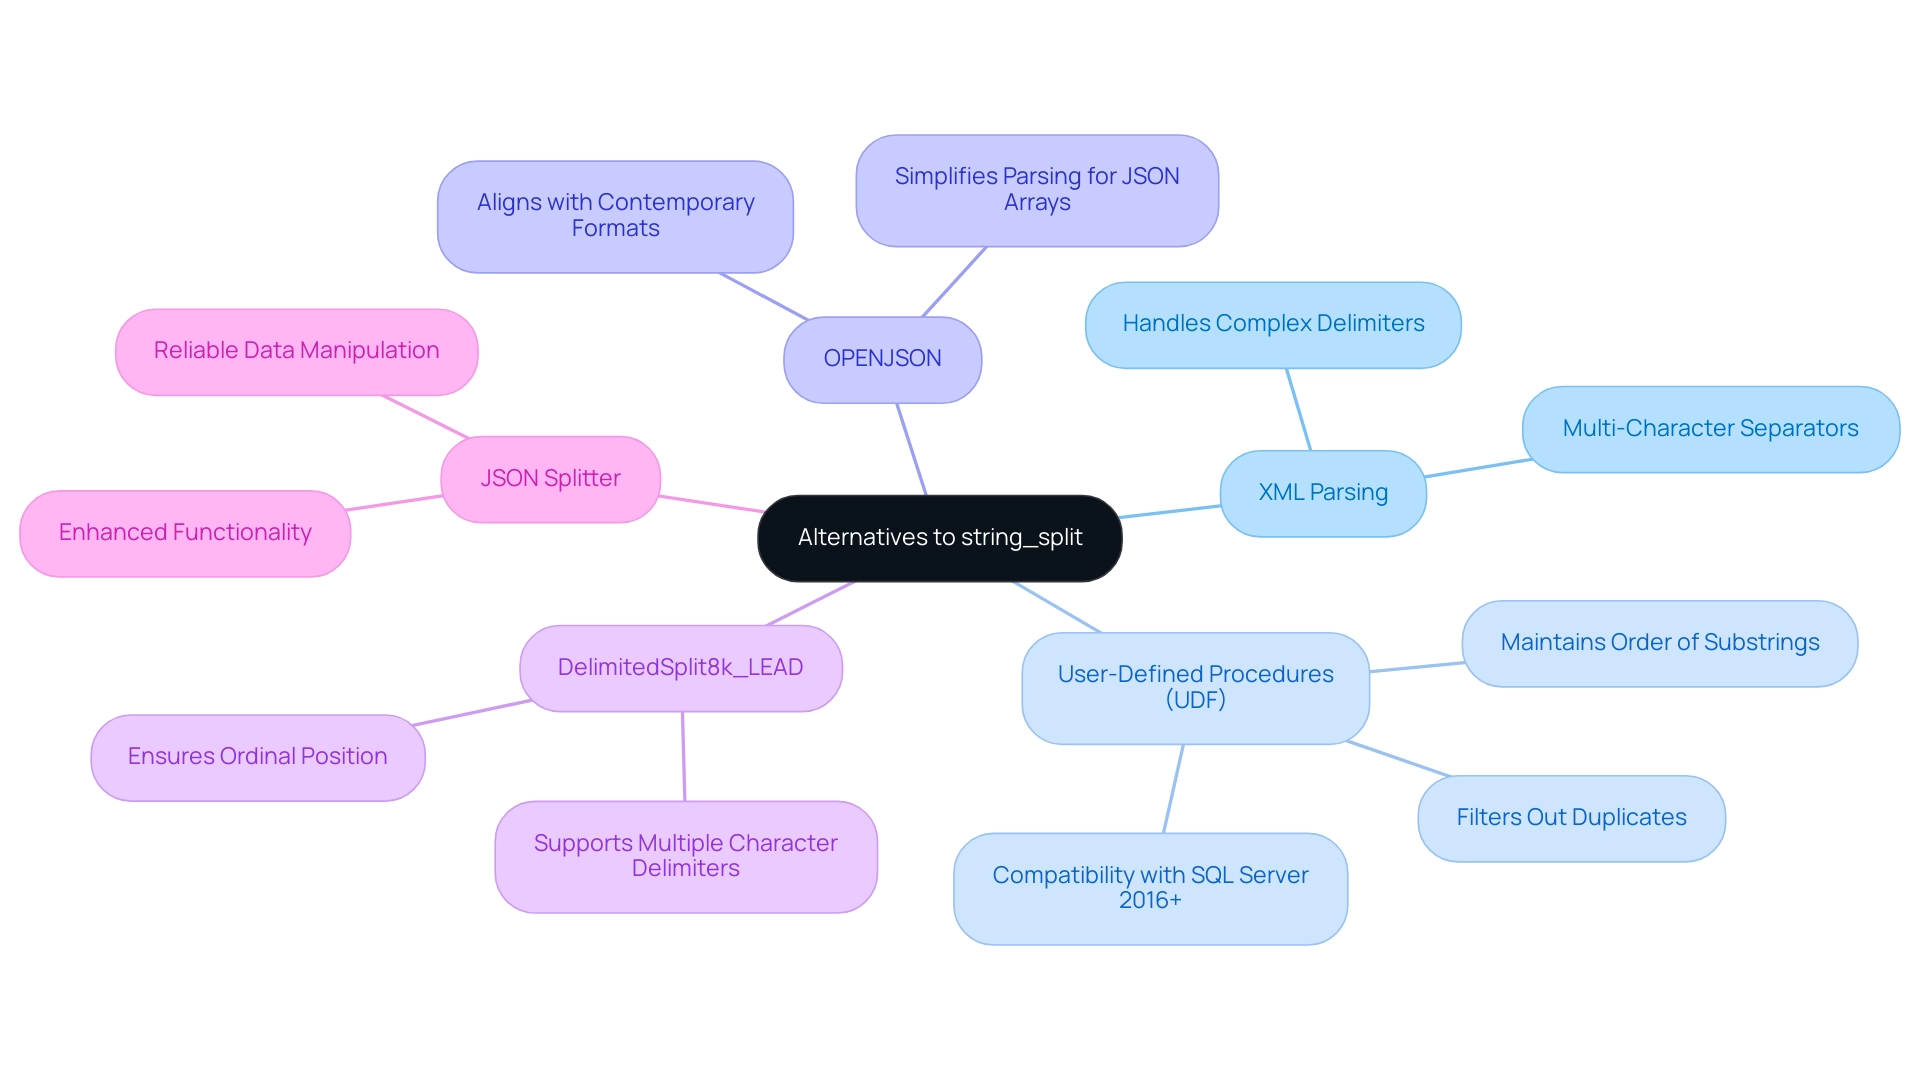
Real-World Applications of string_split: Enhancing Operational Efficiency
The function serves as a powerful tool in various real-world applications, significantly enhancing operational efficiency across multiple domains. In migration projects, for example, the function effectively parses and transforms comma-separated values from legacy systems into structured formats compatible with modern databases. This capability streamlines the migration process and minimizes the risk of loss or corruption, aligning with the goals of Robotic Process Automation (RPA) to automate manual workflows and enhance operational efficiency, particularly through solutions like EMMA RPA and Microsoft Power Automate offered by Creatum GmbH.
In reporting applications, the function string_split excels at extracting individual elements from concatenated fields, facilitating more granular analysis. This level of detail enables organizations to extract deeper insights from their information, ultimately supporting more informed decision-making. As cbeleites aptly notes, “Do not confuse a single random split into train and test with a properly designed study to measure prediction quality,” emphasizing the importance of structured approaches in analysis. This is crucial for driving insights and operational efficiency for business growth.
Furthermore, the function plays a vital role in ETL (Extract, Transform, Load) processes, where it is used to clean and prepare information for analysis. By ensuring that information integrity is maintained throughout the workflow, organizations can trust the quality of their insights, leading to better strategic outcomes. The incorporation of cardinality estimation feedback can further improve query execution plans, optimizing the use of the split function in these processes.
As SQL Server 2025 progresses, improvements in functionalities like string_split will further enable companies to enhance their information management procedures. The launch of advanced time series features in SQL Server 2022, such as DATE_BUCKET and GENERATE_SERIES, has already established a standard for enhanced manipulation abilities, paving the way for even more sophisticated uses of string_split in operational efficiency initiatives. A relevant case study titled “Business Intelligence Empowerment” illustrates how organizations can extract meaningful insights from data, supporting informed decision-making and driving growth and innovation while leveraging AI solutions to improve data quality and training.
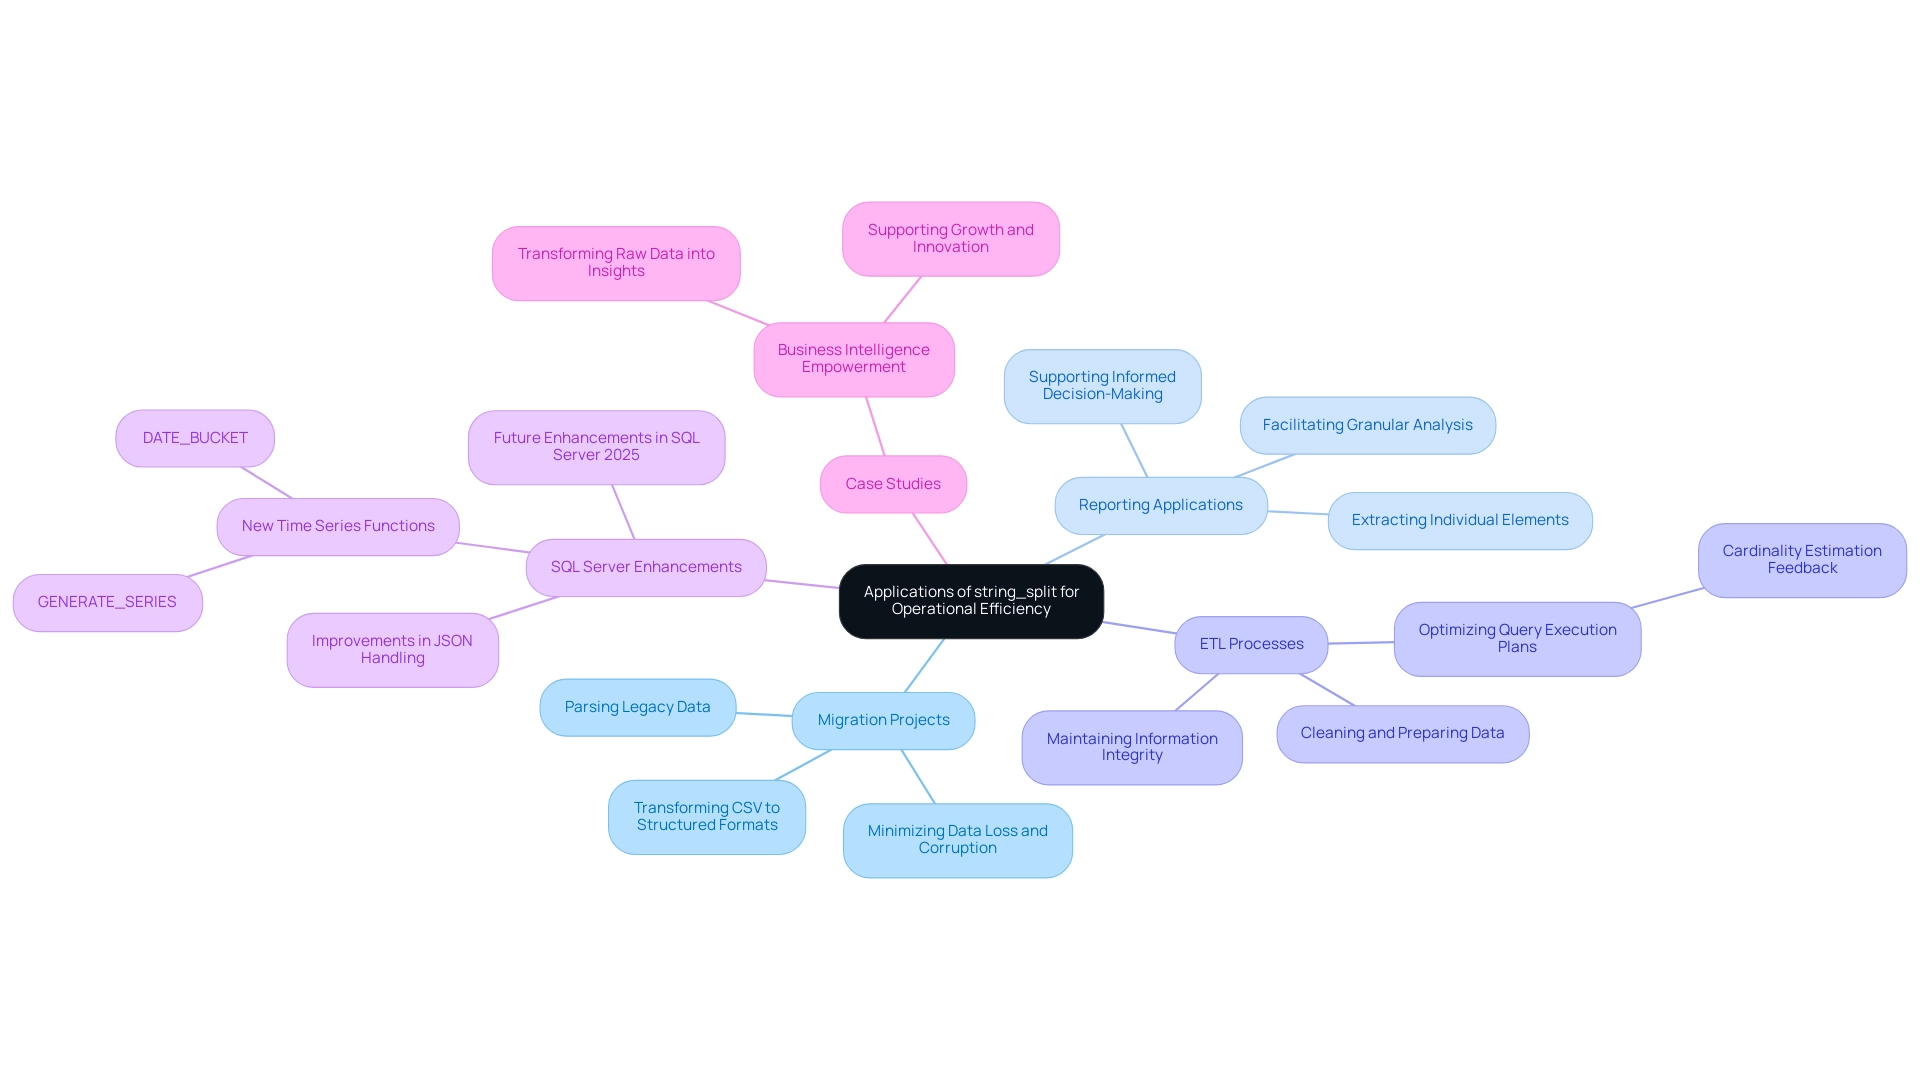
Integrating string_split with Other Functions: Maximizing Its Utility
To fully harness the capabilities of string_split, it is imperative to integrate it with other SQL operations. By employing CROSS APPLY alongside a string-splitting function, one can join the resulting substrings with additional tables, paving the way for more complex queries that reveal deeper insights. As Ronen Ariely highlights, “There is a simple solution for using STRING_SPLIT and guarantee the order, but it is highly not recommended for production, from the performance aspect.”
This underscores the importance of selecting the right combination of operations for optimal performance.
For instance, when analyzing a dataset comprising 230,000 rows, utilizing STUFF with FOR XML PATH has demonstrated a significant performance edge over alternative methods. Moreover, integrating this technique with aggregate operations like COUNT or SUM can illuminate the frequency of specific values within your dataset, yielding valuable insights into trends. This methodology not only enhances analysis but also empowers informed decision-making, transforming raw data into actionable insights that align with our organization’s mission to elevate quality and streamline AI implementation.
Incorporating filtering functions such as WHERE or HAVING in conjunction with string_split amplifies the ability to refine results based on targeted criteria, thus enhancing the overall efficacy of your queries. Leveraging Robotic Process Automation (RPA) to automate these manual workflows, which frequently involve repetitive tasks, allows organizations to significantly enhance operational efficiency and minimize errors, enabling teams to concentrate on strategic initiatives. Real-world applications, as illustrated in the case study ‘Business Intelligence Empowerment,’ reveal that organizations employing these combinations can achieve remarkable improvements in operational efficiency and information quality, ultimately fostering growth and innovation.
Furthermore, grasping how data manipulation intersects with advertising and profiling can provide additional context regarding the critical nature of effective data management in today’s data-rich landscape.
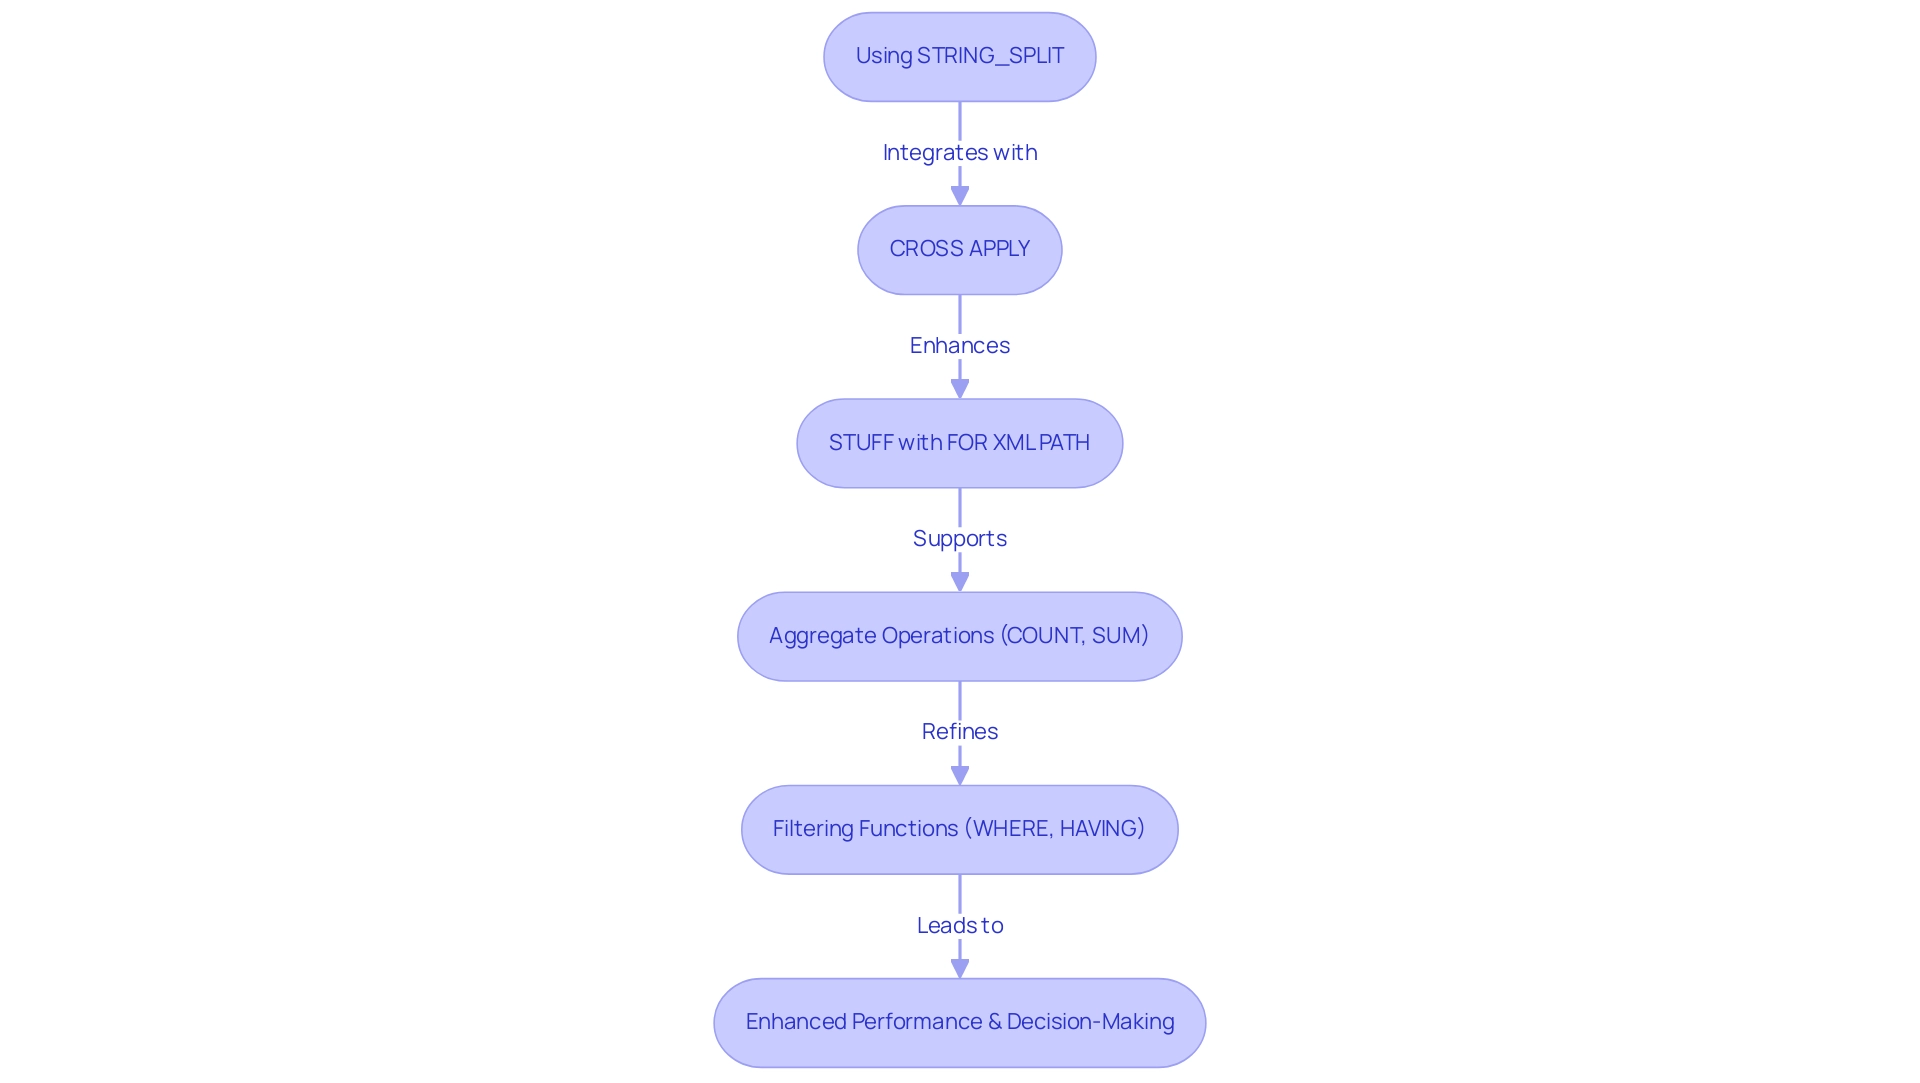
Conclusion
The string_split function in SQL Server is pivotal for enhancing data management efficiency. By breaking complex strings into manageable components, it simplifies the processing of comma-separated values, streamlining workflows and boosting productivity. Anticipated advancements like STRING_SPLIT_WK promise to further enhance its capabilities, addressing the demands of an evolving data landscape.
However, string_split has limitations, including its restriction to single-character delimiters and unpredictable output order. Organizations can mitigate these challenges through preprocessing and by employing additional SQL functions for refined results. Best practices, such as strategic placement in queries and the use of temporary tables, are essential for optimizing performance and ensuring data integrity.
Exploring alternatives like XML parsing and the OPENJSON function can also yield tailored solutions for specific needs. Each method presents unique advantages that merit evaluation based on the context of the data being processed.
Integrating string_split with other SQL functions maximizes its utility, enabling organizations to transform raw data into actionable insights. By adopting these tools and strategies, businesses can enhance their data handling processes, ensuring high-quality outcomes that support informed decision-making in a competitive environment. Embracing these approaches will be crucial for driving growth and innovation in today’s rapidly evolving data landscape.
Frequently Asked Questions
What is the string_split function in SQL Server?
The string_split function, introduced in SQL Server 2016, is a table-valued procedure that disaggregates strings into individual components based on a specified delimiter, producing a single-column table where each row corresponds to a substring.
How does the string_split function enhance data processing?
It simplifies the manipulation of lists contained within a single string, streamlining workflows by reducing the complexity associated with parsing strings. This leads to increased productivity and efficiency in information extraction and transformation tasks.
What are the advantages of using the string_split function for organizations?
Organizations report improved operational efficiency and faster decision-making when using the string_split function, as it automates the processing of large datasets and enhances the accuracy of insights.
What improvements are expected in the string_split function for SQL Server 2025?
The anticipated STRING_SPLIT_WK method is expected to include a key indicating the sequence of values in the original string, enhancing its utility for ordered information retrieval.
What limitations does the string_split function have?
The string_split function supports only single-character delimiters, does not guarantee the order of output, and does not remove duplicates from the output.
How can users address the limitations of the string_split function?
Users can preprocess their strings to standardize delimiters before using the function and employ additional SQL functions like DISTINCT or GROUP BY to refine the output after the split.
How does Creatum GmbH utilize the string_split function in their solutions?
Creatum GmbH leverages the string_split function to enhance operational efficiency and streamline workflows, particularly in robotic process automation (RPA), helping organizations improve data handling and reduce errors.
Where can professionals find more insights on SQL Server functionalities?
Professionals can refer to MSSQLTips.com for valuable information and resources regarding SQL Server functionalities.
Overview
The DAX DATEDIFF function stands as a cornerstone for Power BI professionals, facilitating precise calculations of date differences. This capability significantly enhances data analysis and reporting functions. Consider its practical applications:
- In project management, it streamlines timelines.
- In sales analysis, it provides critical insights into performance.
- For employee tenure, it aids in understanding workforce dynamics.
Mastering DAX DATEDIFF not only fosters operational efficiency but also empowers informed decision-making within a data-driven environment. Are you leveraging this powerful tool to its fullest potential?
Introduction
In the dynamic realm of data analysis, mastering Data Analysis Expressions (DAX) is essential for professionals seeking to unlock the full potential of Power BI. This powerful formula language facilitates advanced data manipulation and enhances operational efficiency through its robust functionalities. As organizations strive to transform raw data into actionable insights, understanding DAX becomes crucial for informed decision-making.
With the increasing complexity of data environments, the DATEDIFF function stands out as a vital tool, enabling users to calculate time intervals and derive meaningful conclusions from temporal data. As businesses navigate the challenges of data analysis in 2025, the integration of DAX with emerging technologies like Robotic Process Automation (RPA) further amplifies its impact, driving growth and innovation across various sectors.
This article delves into the intricacies of DAX, exploring its applications, syntax, common pitfalls, and the transformative power it holds for data-driven organizations.
Understanding DAX and Its Role in Power BI
Analysis Expressions (DAX) stands as a cornerstone for advanced manipulation in Power BI, Excel, and SQL Server Analysis Services. This robust formula language encompasses a diverse array of functions, operators, and constants that can be intricately combined to perform calculations and yield valuable insights. DAX DATEDIFF is indispensable for crafting calculated columns, measures, and custom aggregations, significantly amplifying the analytical prowess of Power BI.
In 2025, the role of DAX in enhancing operational efficiency is paramount. Organizations leveraging DAX can refine their analysis processes, transforming raw information into actionable insights that empower informed decision-making. Recent statistics reveal that implementing DAX has resulted in a notable enhancement in information quality and analysis speed, with numerous businesses reporting a decrease in time spent on manual processing tasks.
The presence of outliers in datasets, such as cars sold for over 180 thousand Reais, highlights the necessity of robust analysis techniques like DAX to ensure data integrity.
Real-world applications of DAX DATEDIFF exemplify its versatility and effectiveness. A notable case study showcases the use of DAX DATEDIFF to create statistical dashboards in Power BI, illustrating how users can derive complex statistical measures without solely relying on the Measure feature. This method not only simplifies analysis but also demonstrates the flexibility that DAX offers compared to more basic methods.
Conversely, the case study titled ‘Statistical Dashboards Without DAX‘ underscores the limitations of simpler approaches, reinforcing the value of DAX DATEDIFF in comprehensive analysis.
Moreover, the integration of Power BI services, such as the 3-Day Power BI Sprint for rapid report creation and the General Management App for comprehensive management, significantly enhances overall reporting capabilities. Coupled with AI solutions like Small Language Models and GenAI Workshops, organizations can further elevate information quality and training, ensuring their teams are equipped to utilize these tools effectively.
Additionally, Robotic Process Automation (RPA) plays a crucial role in complementing DAX and Power BI services by automating manual workflows. This integration not only boosts efficiency but also minimizes errors, allowing teams to concentrate on more strategic, value-adding tasks. By addressing challenges related to poor master information quality, RPA and DAX DATEDIFF together forge a powerful synergy that markedly enhances operational efficiency.
Expert opinions further underscore the significance of DAX in today’s information landscape. Douglas Rocha, a statistics enthusiast, states, “Last but definitely not least is the Mode,” emphasizing the critical role of DAX in mastering analysis. Analysts assert that mastering DAX DATEDIFF is essential for professionals aiming to unlock the full potential of Power BI, especially in a data-rich environment where the ability to extract meaningful insights is crucial.
As organizations continue to navigate the complexities of data analysis, utilizing the DAX DATEDIFF function remains a vital tool for enhancing data quality and simplifying AI implementation, ultimately fostering growth and innovation in 2025. Furthermore, events like FabCon Vegas, scheduled from March 31 to April 2, present valuable opportunities for professionals to deepen their understanding of DAX DATEDIFF and its various applications in the industry.
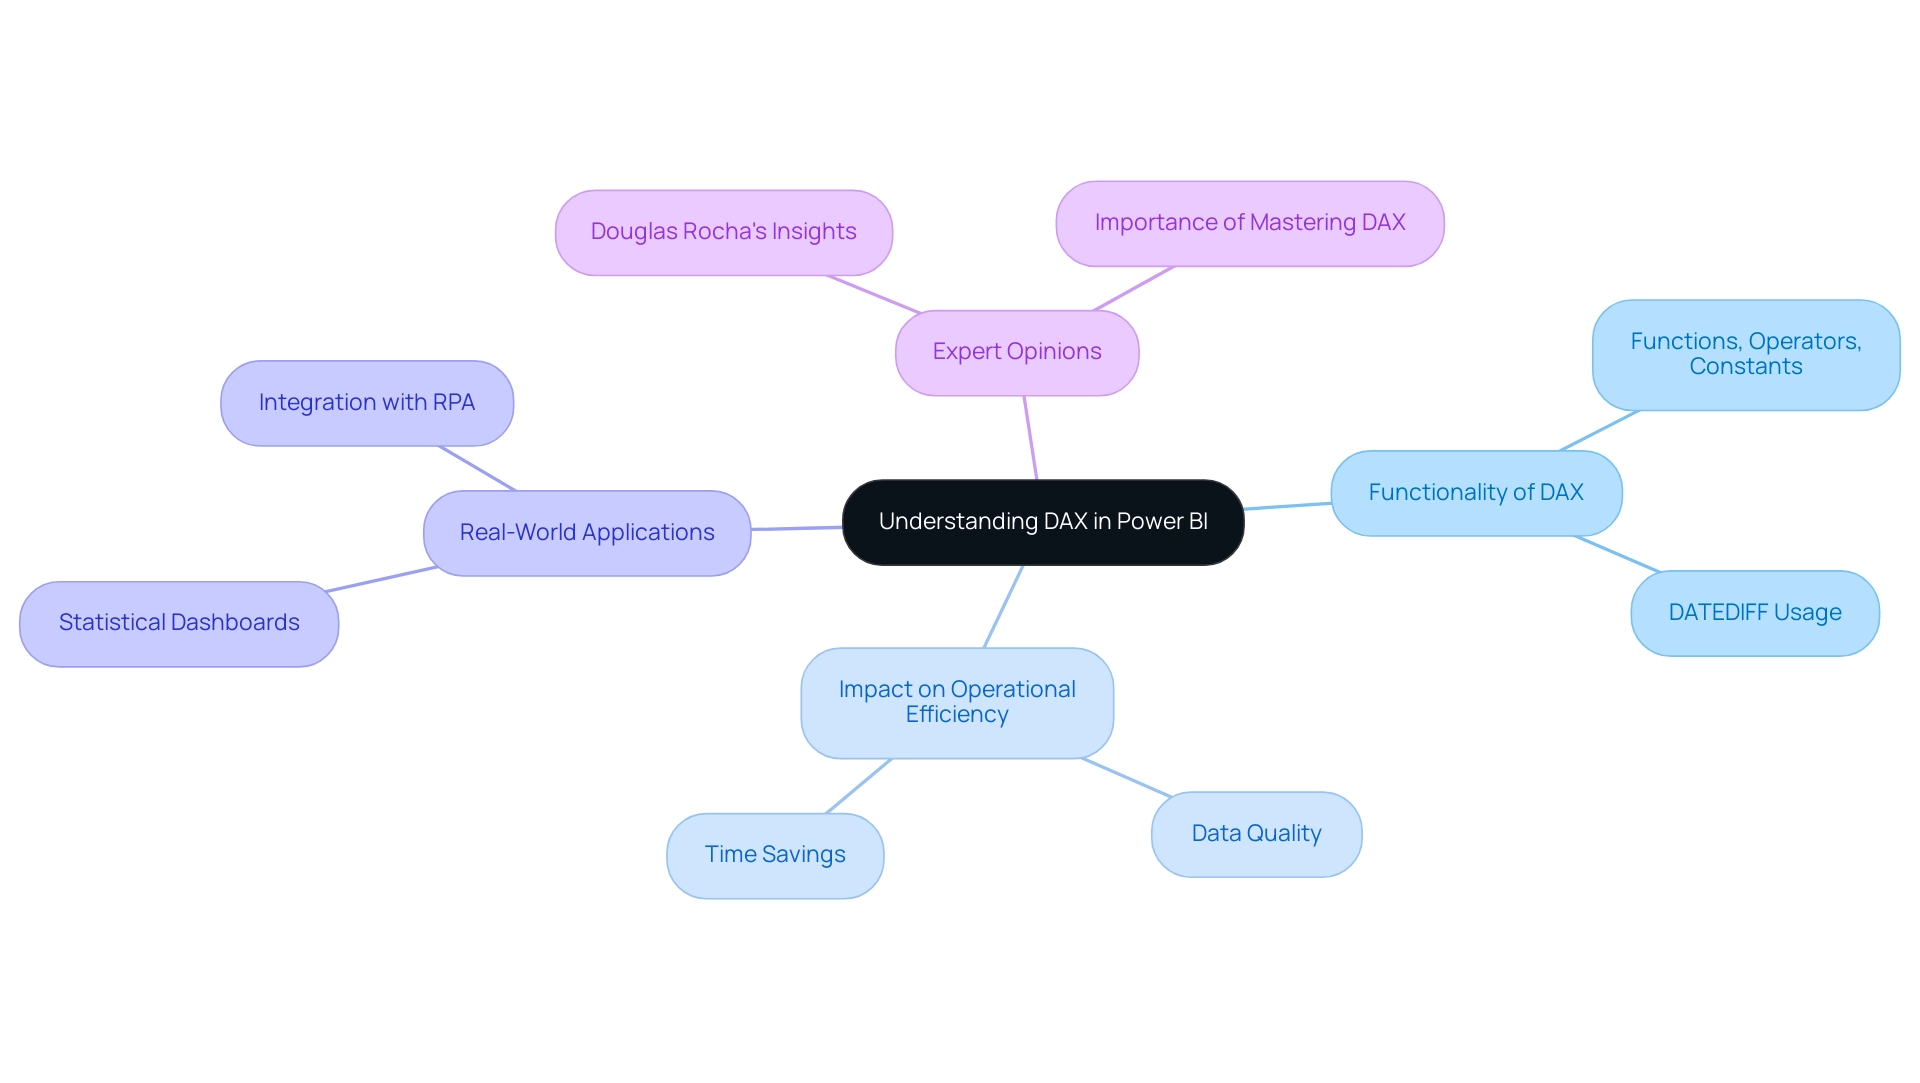
What is the DATEDIFF Function in DAX?
The DAX DATEDIFF function is a powerful tool for calculating the date difference between two dates, offering results in various time intervals such as days, months, or years. The syntax for calculating the date difference with DAX DATEDIFF is straightforward: DATEDIFF(<Start_Date>, <End_Date>, <Interval>). This tool is invaluable for analyzing time periods with DAX DATEDIFF, enabling users to effectively assess project durations, employee tenures, and sales cycles.
In 2025, a significant number of Power BI users utilize the time difference function for time analysis, recognizing its ability to provide deeper insights into temporal data. For example, to calculate the years between a specific date and today, one can use the formula: Years between End date and today = Difference in years between (2020,4,1) and TODAY(). By mastering date differences, professionals can enhance their reports, leading to more accurate analyses and informed decision-making.
A recent case study titled “Power of Date Functions in Power BI” highlighted the transformative impact of these functions, showcasing how they facilitate advanced date-related calculations essential for unlocking valuable insights from dynamic datasets. The outcome demonstrated that by mastering date differences and DATEADD, users could enhance the quality of their reports, providing deeper insights and more accurate analyses of temporal data.
Furthermore, insights from Power BI specialists highlight the significance of using DAX DATEDIFF calculations in project management. By employing this feature, teams can enhance their project timelines and resource allocation, ultimately driving growth and innovation. As Zach Bobbitt, the creator of Statology, states, “My goal with this site is to help you learn statistics through using simple terms, plenty of real-world examples, and helpful illustrations.”
This philosophy aligns with the practical uses of date difference calculations in Power BI, especially in tackling issues like time-consuming report creation and inconsistencies in information.
The most recent updates in 2025 further improve the DAX DATEDIFF tool, enhancing its capabilities and ensuring it remains a vital element of effective information analysis in Power BI. In summary, comprehending and utilizing the date difference calculation not only enriches reports but also empowers organizations, including those using Creatum GmbH’s RPA solutions like EMMA RPA and Power Automate, to extract meaningful insights from their data, fostering a culture of informed decision-making and strategic planning, which is essential for leveraging Business Intelligence and RPA to drive operational efficiency.
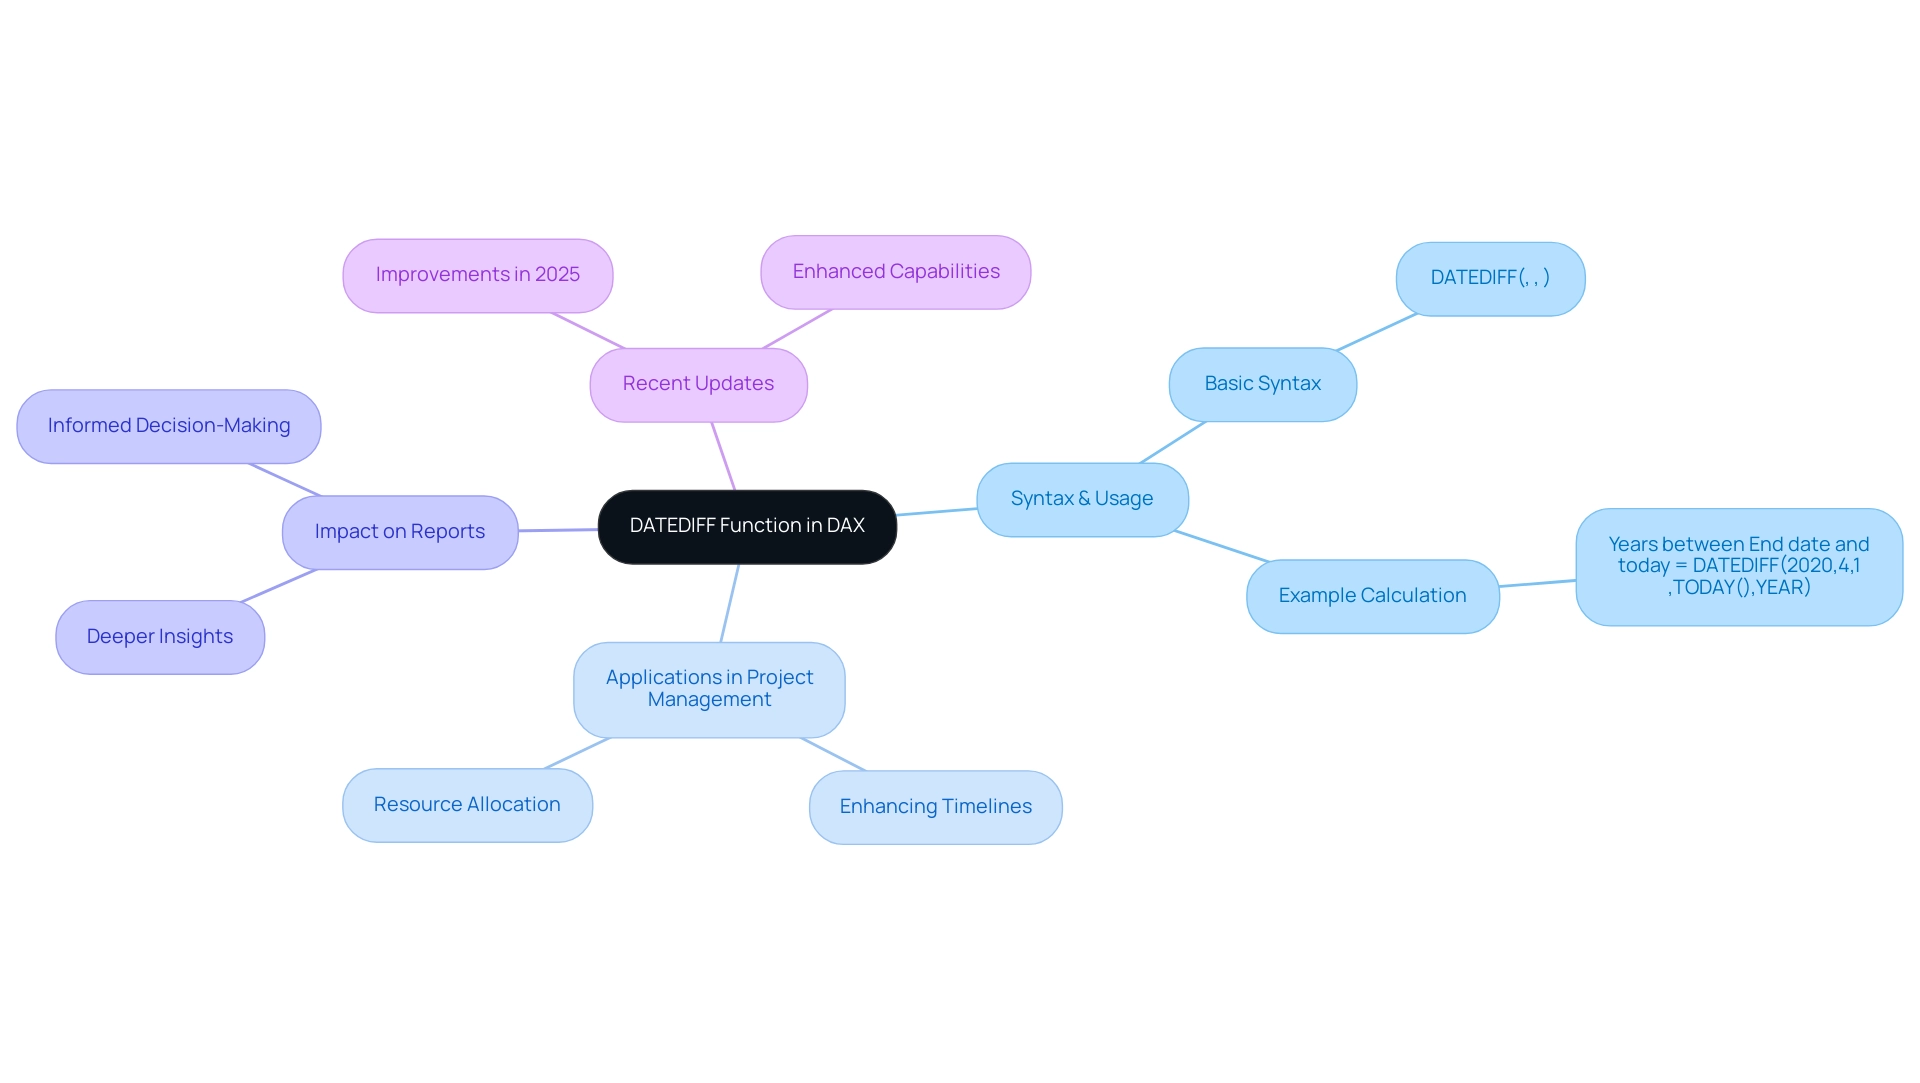
Syntax and Parameters of DATEDIFF
The calculation of the date difference using DAX DATEDIFF is structured as follows: DATEDIFF(<Start_Date>, <End_Date>, <Interval>). Each parameter is crucial in determining the output of the function:
- Start_Date: This parameter represents the initial date from which the difference is calculated. Ensuring correct formatting is essential to avoid errors in calculations.
- End_Date: This is the concluding date for the calculation. Like Start_Date, it must be accurately defined to yield precise results.
- Interval: This parameter indicates the unit of time for the difference, which can be specified as
DAY,MONTH, orYEAR. For instance, to calculate the number of days between two dates, the syntax would beDATEDIFF(Start_Date, End_Date, DAY).
Understanding the syntax and parameters of the DAX DATEDIFF function is vital for efficient DAX calculations. In 2025, common errors in date difference calculation often arise from incorrect date formats or misinterpretation of the interval parameter, leading to inaccurate results.
Consider a scenario where a business analyst assesses employee performance over time. For example, on 22/01/2021, Employee ID 2 was benched for 14 days since the status change on 08/01/2021. By employing the date difference tool, they can easily determine the duration of employment or the interval between project milestones, providing valuable insights into operational efficiency.
This approach aligns with the broader goal of leveraging Robotic Process Automation (RPA) to automate manual workflows, thereby enhancing operational efficiency and driving data-driven insights crucial for business growth.
RPA can significantly mitigate the challenges posed by manual, repetitive tasks, enabling organizations to streamline operations and minimize errors. By incorporating DAX functions such as time difference within RPA frameworks, businesses can automate calculations and enhance their analytical capabilities. As mentioned by v-yiruan-MSFT, “You can also create a measure as below based on @Vera_33’s provided calculated column: Measurea = VAR _curemp = SELECTEDVALUE ( ‘Table'[Employee ID] ) …” This highlights the practical use of time difference in creating measures that improve analysis.
Best practices for utilizing DAX DATEDIFF in Power BI include ensuring that both dates are within the same context and validating the types to prevent errors. Additionally, leveraging the latest updates in DAX syntax can enhance the accuracy and efficiency of your calculations, making it easier to derive actionable insights from your information. The organization’s distinct value lies in offering tailored solutions that improve information quality and streamline AI implementation, ultimately fostering growth and innovation for the businesses they support.
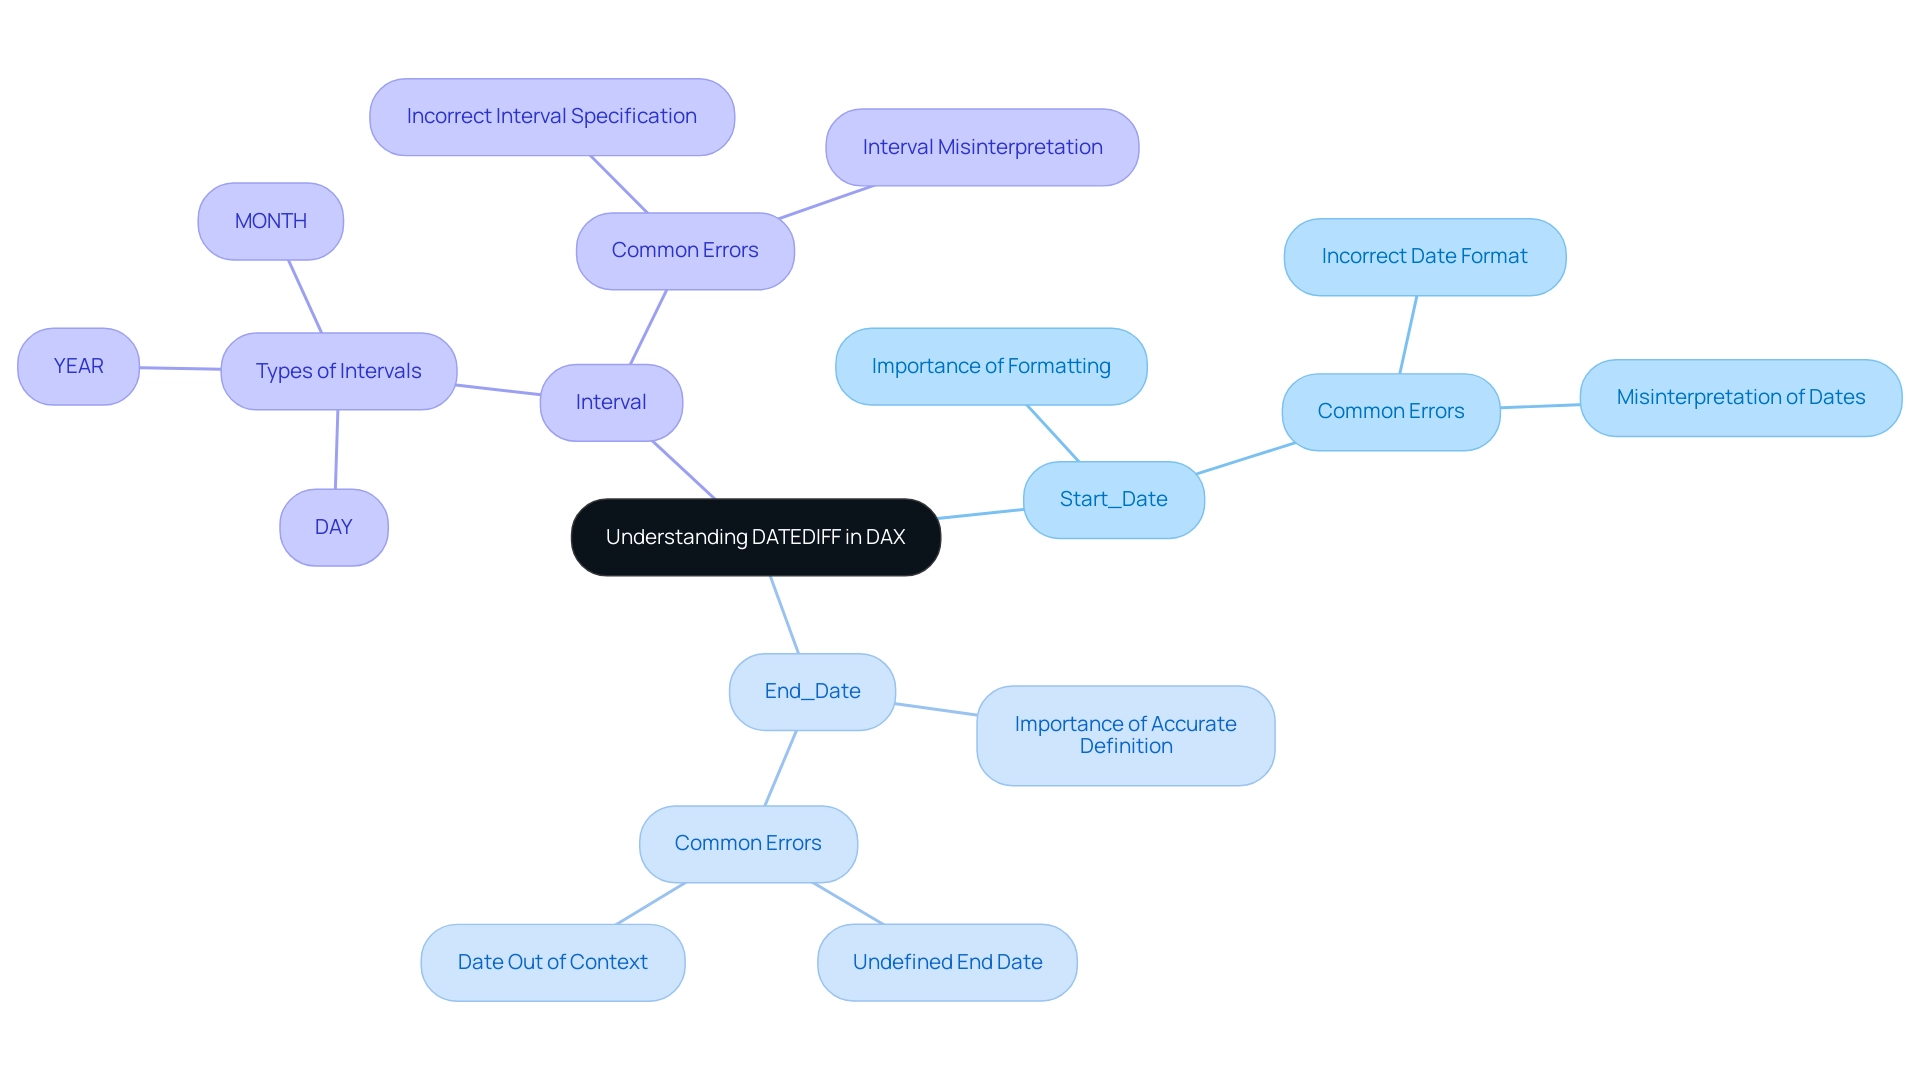
Practical Use Cases for DATEDIFF in Power BI
The time difference function in Power BI serves as a powerful tool across various business scenarios, enabling organizations to extract valuable insights from time-related data while enhancing operational efficiency through automation. Here are some key applications:
-
Project Management: Utilizing DAX DATEDIFF to calculate project duration by determining the difference between start and end dates allows teams to effectively monitor timelines and manage resources. This method is particularly advantageous in construction project management, where key performance indicators (KPIs) such as budget variance and safety incidents are essential for evaluating project efficiency. Recent discussions have highlighted that effective data management is crucial for project success. Tricia, our Associate Director of CS, underscores the necessity of implementing robust data solutions alongside RPA to optimize workflows. Creatum GmbH’s 3-Day Power BI Sprint equips teams to swiftly generate professionally designed reports to track these metrics.
-
Sales Analysis: The function employs DAX DATEDIFF to ascertain the duration required to close sales, calculated by the difference between the sale date and the payment date. This analysis not only elucidates sales cycles but also facilitates revenue forecasting and optimization of sales strategies. Recent studies indicate that businesses leveraging DAX DATEDIFF for date difference calculations in sales analysis have experienced a notable enhancement in their average time to close sales, thereby boosting overall operational efficiency. The return on investment (ROI) from these enhancements can be significant, calculated as (Net Profit / Cost of Investment) * 100, highlighting the financial advantages of utilizing date difference functions in tandem with RPA solutions.
-
Employee Tenure: Organizations can evaluate employee retention by employing DAX DATEDIFF to determine the difference between the hire date and the current date. This metric is vital for human resources to identify trends in employee turnover and devise strategies to enhance retention rates, further supported by data-driven insights from Power BI.
-
Customer Engagement: Measuring the intervals between customer interactions through time difference calculations enables businesses to effectively assess engagement levels. Understanding these intervals can lead to improved customer relationship management and targeted marketing strategies, ultimately fostering business growth.
These use cases underscore the versatility of the time difference calculation, demonstrating its capacity to provide valuable insights into time-related metrics across diverse business contexts. Furthermore, the Central Limit Theorem in project management illustrates how statistical principles apply to project duration estimates, aiding in variance calculations for project timelines. By harnessing date difference calculations in Power BI, organizations can enhance their decision-making processes and propel strategic initiatives, fully leveraging the potential of RPA and BI solutions from Creatum GmbH.
To discover how our services can help streamline your workflows, book a free consultation today.
Common Pitfalls and Performance Considerations
When utilizing the DATEDIFF function in DAX, it is crucial to navigate several common pitfalls to ensure optimal performance and accuracy, especially in the context of Business Intelligence and RPA, which are vital for driving data-driven insights and operational efficiency.
-
Incorrect Date Formats: One of the most frequent issues arises from improper date formats. If the dates provided to the date difference function are not formatted correctly, it may yield errors or unexpected results. Always verify that your date inputs conform to the required format to avoid complications; inconsistencies can hinder actionable insights from your Power BI dashboards.
-
Performance Issues: The application of date difference calculations on large datasets can significantly impact report performance. Research indicates that relying on date differences in calculated columns can lead to slower processing times. Instead, it is advisable to utilize measures wherever possible, as they tend to be more efficient and can enhance overall report responsiveness, addressing the challenge of time-consuming report creation.
-
Negative Results: Users must be vigilant regarding the order of dates when applying DATEDIFF. If the start date is later than the end date, the process will return a negative result, leading to confusion in analysis. Always validate your date inputs to prevent such discrepancies, ensuring that your reports provide clear and actionable guidance.
As Bruno, a data consultant, aptly puts it, “Well there you have it, 5 years later and even more reasons to deep dive into DAX.” This emphasizes the significance of mastering DAX operations, including DATEDIFF. By being mindful of these considerations, users can not only optimize their DAX calculations but also improve the performance of their reports, ultimately driving business growth and innovation.
The difficulties related to mastering DAX, as highlighted in the case study titled ‘Challenges of Learning DAX,’ emphasize the importance of dedicating time to thoroughly understand these operations. With only 6,000 views on Alberto Ferrari’s DAX Studio course, it is evident that fewer professionals are willing to undertake this deep dive, positioning those who do advantageously in the job market.
For those seeking a deeper understanding of DAX, ‘The Definitive Guide to DAX’ by Marco Russo and Alberto Ferrari is highly recommended. Furthermore, implementing source control in Power BI models is essential, especially with the introduction of Power BI Project Format and TMDL Language, which facilitate better management of model files. This timely context reinforces the importance of mastering DAX capabilities and best practices.
At Creatum GmbH, we offer innovative RPA solutions like EMMA RPA and Power Automate to help streamline your operations. Book a free consultation today to discover how we can assist you in transforming your information into actionable insights.
Exploring Related DAX Functions
In addition to DATEDIFF, several related DAX functions can significantly enhance your data analysis capabilities in Power BI, playing a crucial role in driving data-driven insights and operational efficiency:
- DATEDIFF: This function calculates the difference between two dates, providing a straightforward way to measure time intervals.
- DATEADD: This operation shifts dates by a specified number of intervals, making it invaluable for creating time-based comparisons and analyzing trends over time.
- YEARFRAC: This method returns the year fraction representing the number of whole days between two dates, particularly useful for financial calculations where precision is key.
- EOMONTH: This operation returns the last day of the month that is a specified number of months before or after a given date, aiding in month-end reporting and analysis.
These functions can be effectively combined with DATEDIFF to create comprehensive time-based analysis in Power BI. For instance, using DATEADD alongside DATEDIFF allows analysts to evaluate changes over specific periods, while YEARFRAC can provide insights into financial metrics that require a more nuanced understanding of time.
However, leveraging insights from Power BI dashboards can present challenges, such as time-consuming report creation and inconsistencies. Addressing these issues is essential for maximizing the potential of information analysis.
As the DAX environment continues to develop, with over 250 features available for use in DAX formulas, new features introduced in 2025 further enhance analytical capabilities, allowing professionals to extract deeper insights from their information. Praveen, a Digital Marketing Specialist, highlights the significance of these operations in information analysis, stating, ‘Working with DAX operations has transformed how we approach insights, allowing for more strategic decision-making.’
Moreover, integrating RPA solutions from Creatum GmbH can streamline repetitive tasks related to reporting, enhancing operational efficiency. Comprehending how these functions collaborate not only improves analytical accuracy but also enables teams to make informed choices based on strong modeling practices. The integration of custom visuals can further enhance insights by improving interactivity and handling complex representations, making it essential for effective analysis.
Additionally, effective data modeling is critical, as illustrated in a case study where structured data led to better insights and decision-making through well-organized data.
Key Takeaways and Next Steps in DAX Mastery
Mastering the DAX DATEDIFF function is essential for Power BI professionals, significantly enhancing analytical capabilities. Understanding the syntax and parameters is crucial for effective implementation.
Practical use cases reveal the power of DATEDIFF in real-world situations, leading to insightful analysis and reporting. For instance, the case study titled “Building Visualizations and Reports” illustrates how effective use of DAX can create understandable and visually appealing reports and dashboards, essential for effective communication. Leveraging Business Intelligence tools like Power BI transforms raw information into actionable insights, fostering growth and innovation.
Awareness of common pitfalls is vital for optimizing DAX code, particularly when utilizing DATEDIFF to ensure efficient processing. Challenges such as time-consuming report creation and inconsistencies can hinder the effectiveness of insights derived from Power BI dashboards.
Exploring related DAX operations can further enhance analytical capabilities, allowing for more complex calculations and insights.
Notably, Digital Marketing Specialists with over three years of experience leverage Power BI to analyze customer data, underscoring the relevance of DAX skills in the digital marketing field. To advance your DAX skills, engage with real datasets, delve into additional DAX functions, and actively participate in the Power BI community. As Simplilearn states, “You can improve your Power BI skills by practicing regularly, exploring different features and functionalities of the tool… and seeking feedback from peers or mentors.”
This engagement fosters shared learning experiences and keeps you updated on the latest trends and techniques in DAX mastery for 2025. Additionally, DAX integrates seamlessly with other Microsoft tools like Excel and Azure Analysis Services, further emphasizing the importance of mastering DAX for Power BI professionals.
Conclusion
The exploration of Data Analysis Expressions (DAX) and its integral role in Power BI highlights the significant impact this formula language has on data analysis and operational efficiency. Mastering DAX, particularly the DATEDIFF function, empowers professionals to execute complex calculations and extract actionable insights that facilitate informed decision-making across diverse sectors. The real-world applications of DAX, from project management to sales analysis, demonstrate its versatility and the value it offers organizations aiming for data-driven success.
Understanding the syntax and parameters of DATEDIFF is crucial for unlocking its full potential. By identifying common pitfalls and performance considerations, users can optimize their DAX implementations, ensuring accurate results while enhancing report responsiveness. Moreover, integrating related DAX functions enables deeper analytical capabilities, allowing teams to evaluate time-related metrics with greater precision.
As the landscape of data analysis evolves, the necessity of mastering DAX is paramount. Engaging with practical use cases, staying abreast of best practices, and participating in the Power BI community will equip professionals to refine their skills and adapt to emerging trends in data analysis. Ultimately, embracing DAX and its functionalities not only fosters growth and innovation but also positions organizations to excel in an increasingly data-centric world.
Frequently Asked Questions
What is DAX and why is it important?
DAX (Data Analysis Expressions) is a formula language used for advanced data manipulation in Power BI, Excel, and SQL Server Analysis Services. It includes various functions, operators, and constants that enable complex calculations and insights, making it crucial for enhancing operational efficiency in organizations.
How does DAX DATEDIFF function work?
The DAX DATEDIFF function calculates the difference between two dates and can return results in various intervals such as days, months, or years. Its syntax is DATEDIFF(<Start_Date>, <End_Date>,
What are the benefits of using DAX in organizations?
Organizations using DAX can improve their analysis processes, turning raw data into actionable insights. DAX has been shown to enhance information quality and speed up analysis, reducing time spent on manual data processing tasks.
How does DAX DATEDIFF contribute to data analysis?
DAX DATEDIFF is essential for analyzing project durations, employee tenures, and sales cycles. By mastering this function, professionals can enhance their reports, leading to more accurate analyses and better-informed decision-making.
Can you provide an example of DAX DATEDIFF in practice?
A case study demonstrated the use of DAX DATEDIFF to create statistical dashboards in Power BI, allowing users to derive complex statistical measures and simplifying the analysis process compared to more basic methods.
What are the limitations of simpler approaches compared to DAX?
Simpler methods may lack the comprehensive analysis capabilities that DAX DATEDIFF offers, which can result in less accurate insights and a more cumbersome analysis process, as highlighted in the case study titled ‘Statistical Dashboards Without DAX.’
How does Robotic Process Automation (RPA) complement DAX?
RPA enhances DAX and Power BI services by automating manual workflows, which boosts efficiency and reduces errors, allowing teams to focus on strategic tasks. Together, RPA and DAX DATEDIFF improve operational efficiency by addressing issues related to data quality.
What expert opinions highlight the significance of DAX?
Experts emphasize that mastering DAX DATEDIFF is crucial for professionals in data-rich environments, as it enables them to extract meaningful insights and enhances overall analytical capabilities.
What opportunities exist for professionals to learn more about DAX DATEDIFF?
Events such as FabCon Vegas, scheduled for March 31 to April 2, provide valuable opportunities for professionals to deepen their understanding of DAX DATEDIFF and its applications in the industry.
How does DAX DATEDIFF contribute to project management?
DAX DATEDIFF aids project management by improving project timelines and resource allocation, which can drive growth and innovation within organizations.
Overview
This article serves as a comprehensive guide for mastering the creation and interpretation of histograms in Power BI, underscoring their critical role in data analysis and decision-making. By outlining essential requirements and advanced techniques, it provides key insights for effectively visualizing data distributions. Such capabilities are vital for organizations aiming to elevate their business intelligence efforts.
Introduction
In the realm of data analysis, histograms emerge as essential tools that convert raw numerical data into insightful visualizations. As organizations increasingly depend on Business Intelligence (BI) to steer their strategic decisions, mastering the creation and interpretation of histograms in Power BI is vital. This article explores the mechanics of histograms, emphasizing their significance in visualizing data distributions, identifying trends, and enabling informed decision-making.
By integrating advanced techniques and underscoring the importance of data cleanliness, readers will learn to harness the full potential of histograms in their analytical pursuits, ensuring they remain competitive in today’s data-driven landscape.
Understanding Histograms in Power BI
A bar chart serves as a powerful visual tool, organizing numerical values into defined intervals to effectively demonstrate the frequency distribution of quantitative information. In Power BI, the powerbi histogram enables users to visualize how information is spread across different intervals, simplifying the recognition of trends, outliers, and the overall distribution shape. This capability is essential for informed decision-making and strategic planning in any information-driven organization, particularly as businesses strive to harness the power of Business Intelligence (BI) to enhance operational efficiency and growth.
In contrast to bar charts, which depict categorical information, frequency distributions focus on continuous data, making them particularly valuable for statistical analysis. The ability to generate and analyze graphical data representations is crucial for professionals aiming to leverage BI and AI solutions effectively, especially in a landscape where the multitude of AI options can complicate decision-making. However, challenges such as poor master information quality can impede the effectiveness of these tools, underscoring the necessity for organizations to address information quality issues to fully capitalize on their BI initiatives.
Recent trends in information visualization underscore the growing significance of bar charts in 2025, as organizations seek to extract actionable insights from their data. For instance, a case study involving Colorado’s public libraries demonstrated how cleaning and analyzing operating hours information led to the creation of a chart that displayed the average weekly hours each library is open. This visualization not only revealed trends in library usage but also highlighted the need for improved information grouping for clarity, as the initial chart required modifications to enhance readability.
Experts emphasize that bar charts are indispensable in business intelligence, providing a clear depiction of information distributions that empower analysts to make informed decisions. As Sarah Lee noted, it is vital to equip analysts and researchers with the knowledge and resources to experiment with and integrate these techniques into their projects. Furthermore, customized AI solutions can assist organizations in navigating the complexities of information examination, ensuring they can effectively utilize tools such as charts to enhance operational effectiveness.
Moreover, programming languages like R and Python play a crucial role in information evaluation, offering robust tools for statistical computing and automation that enhance BI capabilities. As organizations increasingly adopt advanced data analysis techniques, the importance of graphical representations in identifying trends and informing strategies will continue to grow, reinforcing the need for high-quality master data to support effective AI adoption.
Essential Requirements for Creating Histograms
To successfully create a histogram in BI, it is essential to meet the following requirements:
-
Latest Version of Power BI Desktop: Ensure that you have the most recent version of Power BI Desktop installed. The 2025 update introduces enhanced features that improve user experience and functionality, making it easier to create visualizations.
-
Prepared Dataset: A dataset containing numerical values for analysis is necessary. This dataset can be sourced from various platforms, including Excel spreadsheets, SQL databases, or cloud-based services. Proper dataset preparation is crucial; as Annika Baumhecker notes, fostering a culture of data usage is vital for effective analytics, particularly in ensuring data cleanliness.
-
Familiarity with Power BI Interface: A basic understanding of the Power BI interface is necessary. Navigating the report view and accessing the visualization pane will simplify the chart creation process. Information Cleanliness: Ensure your information is clean and well-formatted. Errors or discrepancies in your dataset can significantly affect the reliability of your graphical representation. Organizations that prioritize information cleanliness often see improved outcomes in their analysis. For instance, in the insurance industry, the transition from outdated systems to modern analytics solutions has enabled companies to enhance service delivery and focus on data-driven decision-making.
-
Understanding of Chart Requirements: Familiarize yourself with the specific criteria for creating effective charts in BI. This includes knowing how to define bins and ranges for your information, which is essential for accurate representation. Expert Insights: Seek advice from BI specialists regarding dataset preparation for histograms. Their insights can guide you in organizing your information effectively to achieve the best results. Adoption Trends: As of 2025, a significant percentage of organizations are utilizing Power BI for information examination, reflecting its growing importance in the business intelligence landscape. This trend is driven by the increasing demand for self-service BI and real-time analytics, underscoring the need for robust information governance and security measures. Investing in information examination abilities is essential, particularly given that the average yearly salary for a business intelligence analyst in 2023 was $74,071, emphasizing the worth of skilled professionals in this area. Robotic Process Automation (RPA): Consider integrating RPA solutions to automate repetitive tasks related to information preparation and report generation. This can improve operational efficiency and enable your team to concentrate on interpreting insights instead of being hindered by manual processes.
By ensuring these requirements are fulfilled, you will be well-prepared to create informative Power BI histograms, ultimately boosting your information examination capabilities. The integration of AI-driven analytics and automation further emphasizes the importance of effective analysis techniques in today’s business environment. Additionally, consider utilizing our 3-Day BI Sprint at Creatum GmbH, designed to help you create professional reports and focus on actionable insights, thereby overcoming common challenges in report creation and data inconsistencies.
Choosing the Right Dataset for Your Histogram
When selecting a dataset for your histogram in Power BI, it is crucial to consider several key criteria to ensure effective analysis:
-
Relevance: The dataset should directly align with the analysis objectives. For instance, if the goal is to analyze sales performance, the dataset must include pertinent sales figures, ensuring that the insights drawn are actionable and relevant to business strategies. This relevance is crucial in an information-rich environment where leveraging Business Intelligence can transform raw information into insights that drive growth and innovation.
-
Numerical information is essential for creating a Power BI histogram, as histograms are designed to visualize frequency distributions. Ensure that your dataset comprises continuous numerical values, as this will facilitate accurate representation of the distribution. The quality of this numerical information is critical, as it directly influences the effectiveness of your evaluation.
-
Sufficient data points enhance the effectiveness of a Power BI histogram as the size of the dataset increases. A minimum of 30 information points is recommended to achieve a meaningful analysis. Larger datasets provide a clearer picture of trends and variations, enhancing the reliability of the insights derived. This is especially significant in overcoming challenges such as inconsistencies that can arise from smaller datasets.
-
Data Segmentation: If your dataset contains categorical variables, consider dividing the information to create bar graphs for different categories. This method enables comparative examination, uncovering insights that might not be obvious when considering the information as a whole. By utilizing RPA solutions from Creatum GmbH, businesses can automate the segmentation process, improving efficiency and reducing the time spent on report creation.
In 2025, the significance of choosing the appropriate dataset for Power BI histogram evaluation cannot be overstated. Businesses utilizing numerical information effectively can create insightful visualizations that drive informed decision-making. For example, a study examining the correlation between parental income and college GPA demonstrated how relevant datasets can yield statistically significant insights, highlighting the relationship between income levels and academic performance.
This case study emphasizes the necessity of careful dataset selection in achieving meaningful results, as statistical tests can determine the significance of correlation coefficients, reinforcing the importance of dataset relevance.
Specialists in data analysis stress that the quality of numerical information is essential in graph creation. As Abhinav Kumar observes, “Inferential statistics allow us to make predictions and test hypotheses about entire populations based on sample information,” which directly pertains to the importance of choosing suitable datasets for graphical representation. Additionally, integrating time series evaluation can improve forecasting abilities, enabling companies to make informed choices based on historical trend information.
By following these standards, you can enhance the efficiency of your chart evaluation in BI, ultimately promoting operational effectiveness and strategic decision-making. Unlock the power of Business Intelligence with Creatum GmbH’s solutions to navigate these challenges effectively.
Step-by-Step Guide to Creating a Histogram in Power BI
Generating a Power BI histogram is a straightforward process that can significantly enhance your analytical capabilities, especially when leveraging Business Intelligence and RPA for operational efficiency. Follow these steps to effectively visualize your data distribution:
-
Open Power BI Desktop: Begin by launching Power BI Desktop. Load your dataset by clicking on ‘Get Data’ and selecting the relevant source, such as a CSV file containing your fiscal year information, which includes columns like Rep Name, FY-Q (fiscal year and quarter), Quota, and Attainment.
-
Select the Report View: Navigate to the report view by clicking on the report icon in the left sidebar. This view enables you to create and customize your visualizations, addressing the common challenge of time-consuming report creation.
-
Create Bins for Your Information: To analyze your numerical data, right-click on the relevant field in the Fields pane. Select ‘New Group’ to create bins, defining the bin size that best categorizes your information. This step is crucial for effective distribution analysis, allowing you to group values meaningfully and mitigate inconsistencies.
-
Add a Clustered Column Chart: From the Visualizations pane, select the ‘Clustered Column Chart’ visual. Drag your newly created bins into the Axis area and the count of values into the Values area. This configuration lays the foundation of your chart, enabling you to visualize the occurrence of points across the defined bins.
-
Format Your Chart: Customize your chart to enhance readability and presentation. Adjust colors, labels, and titles to ensure that the visualization clearly communicates the data insights. A well-formatted chart not only improves the user experience but also aids in identifying trends and outliers effectively, which is essential for data-driven decision-making.
-
Analyze Your Histogram: After creating your histogram, take time to analyze it. Look for patterns, trends, and outliers that can provide valuable insights into your data. Power BI histograms are particularly beneficial for statistical evaluation, assisting you in making informed choices based on the distribution of visualized information.
Integrating frequency charts into your BI reports can greatly enhance your analytical skills. As highlighted in the case study titled ‘Use Cases for Histograms,’ the use of Power BI histogram visual representations is advantageous for distribution examination and outlier identification, offering statistical insights that can bolster decision-making. Organizations that have effectively integrated graphical representations in Business Intelligence, alongside RPA solutions from Creatum GmbH, have reported improved data-driven decision-making processes and operational efficiency.
As you master these techniques, consider the user satisfaction rates linked to BI’s chart features, which continue to evolve and enhance in 2025, ensuring a robust tool for data examination. As Jingwei Li, a Graduate Research Assistant at Stony Brook University, remarked, “ProjectPro is an awesome platform that helps me gain extensive hands-on industrial experience with a step-by-step walkthrough of projects,” underscoring the importance of practical learning in mastering BI techniques.
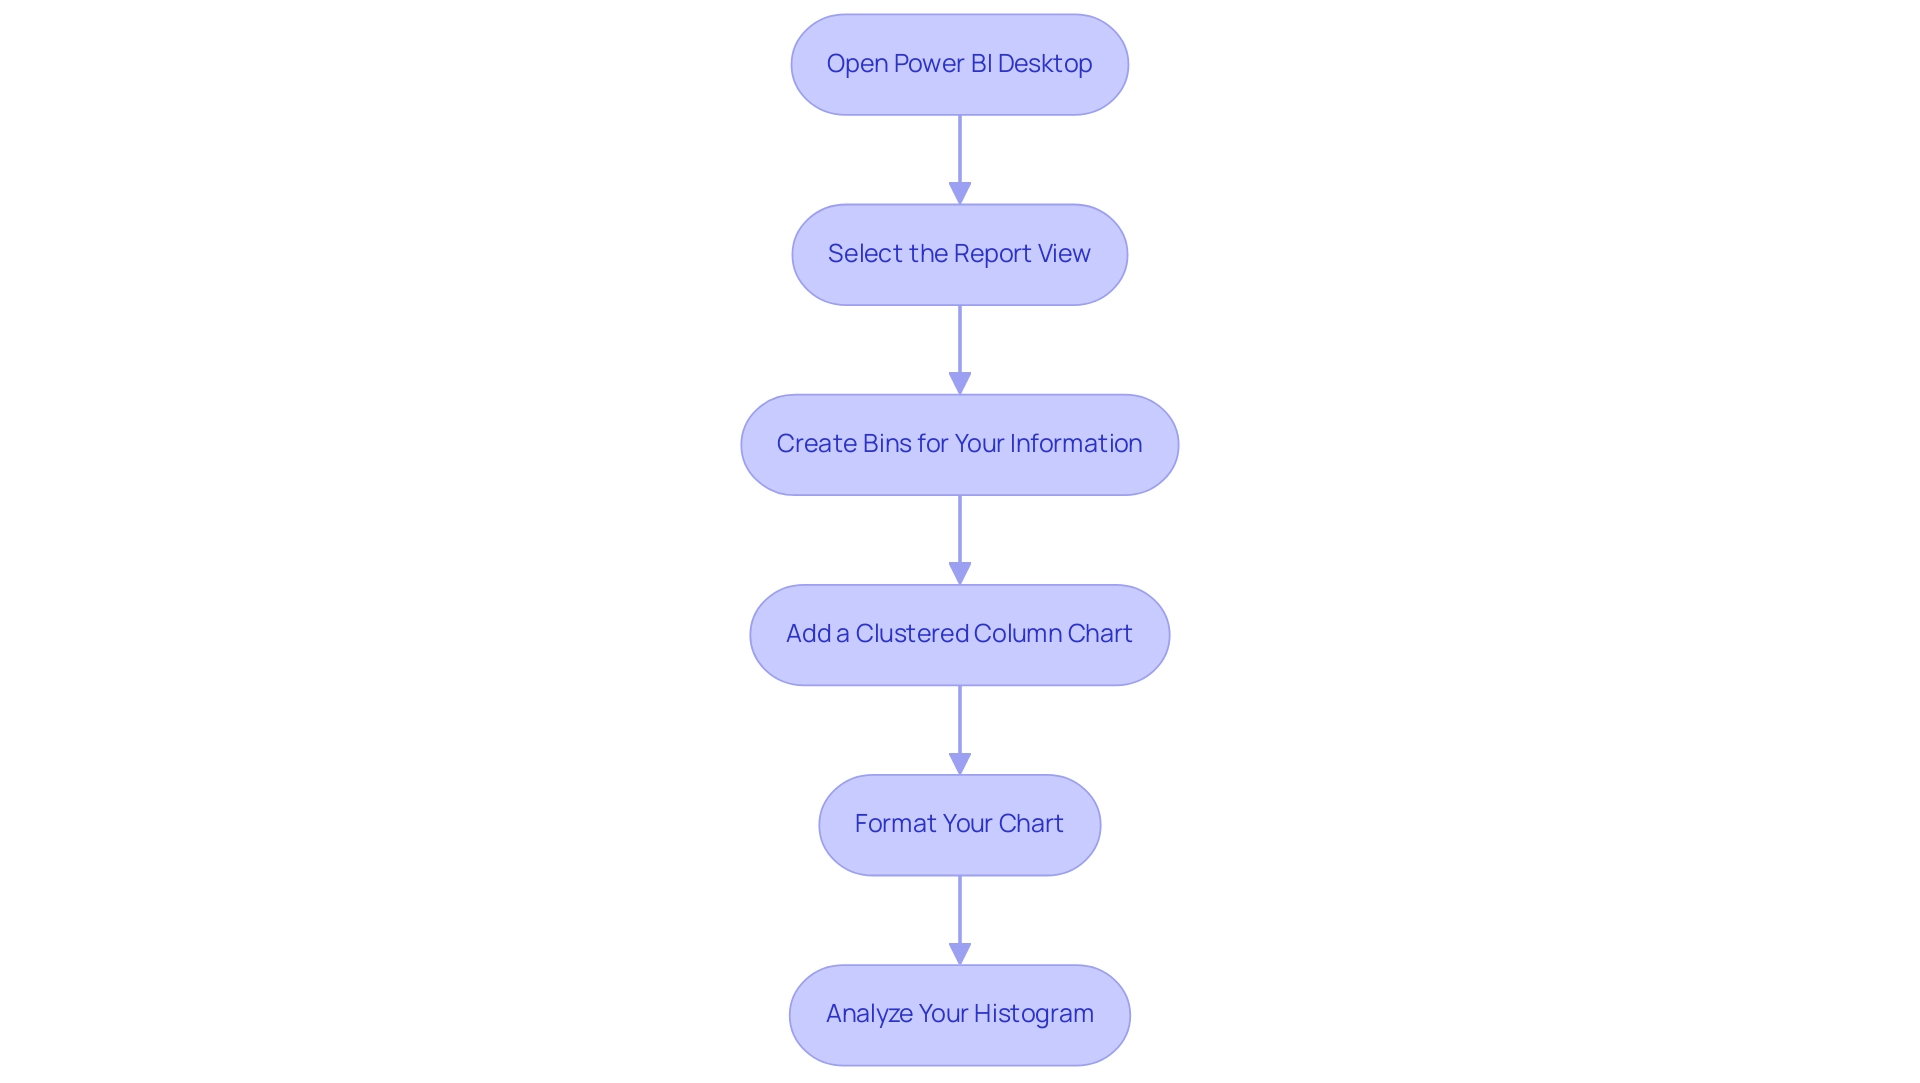
Advanced Techniques: Overlapping Histograms and More
To elevate your histogram analysis in Power BI, consider implementing the following advanced techniques:
-
Overlapping Charts: Utilize overlapping charts to effectively compare distributions across various categories. By employing distinct colors for each Power BI histogram and adjusting transparency settings, you can create a visually compelling representation that highlights differences in distributions, addressing challenges posed by poor master quality.
-
Dynamic Binning: Implement dynamic bin sizes that automatically modify based on the range of values. This approach ensures a more precise depiction of data distributions, allowing for better insights and interpretations, which is crucial for overcoming barriers to AI adoption in your organization.
-
Incorporating Reference Lines: Enhance your charts by adding reference lines for key metrics such as mean, median, or other significant values. These lines provide essential context, enabling viewers to quickly grasp the distribution’s characteristics and make informed decisions, thus leveraging insights from the Power BI histogram effectively.
-
Leveraging DAX Measures: Employ DAX measures to create calculated fields that enrich your Power BI histogram’s analytical capabilities. For instance, cumulative frequency distributions can be generated to provide deeper insights into trends and patterns, which is vital for driving insight-driven conclusions and operational efficiency.
-
Understanding Skewness: Acknowledging the skewness of your information is essential for effective evaluation. For example, a project for an environmental agency revealed that daily air quality readings often produced a left-skewed distribution, underscoring the importance of understanding distribution shapes in decision-making processes. This corresponds with the results from the case study titled “Importance of Understanding Skewness for Professionals,” which highlights that mastering skewness prepares individuals to confront challenges in interpreting information.
-
Current Trends: In 2025, the use of overlapping histograms is gaining traction in business analytics, as they allow for nuanced comparisons that traditional histograms may overlook. Statistical tests for skewness, such as D’Agostino’s K-squared test and the Jarque-Bera test, are increasingly employed to validate visual observations and guide the selection of appropriate statistical methods. For example, the median response time for customer service inquiries was 6 minutes, whereas the average response time was 8 minutes, highlighting the importance of evaluation in improving operational efficiency.
By mastering these advanced techniques, you can significantly improve your information evaluation skills using a Power BI histogram, driving growth and innovation within your organization. Furthermore, integrating Business Intelligence and Robotic Process Automation can help address the challenges of inconsistent, incomplete, or inaccurate data, ultimately leading to improved decision-making and a competitive advantage.
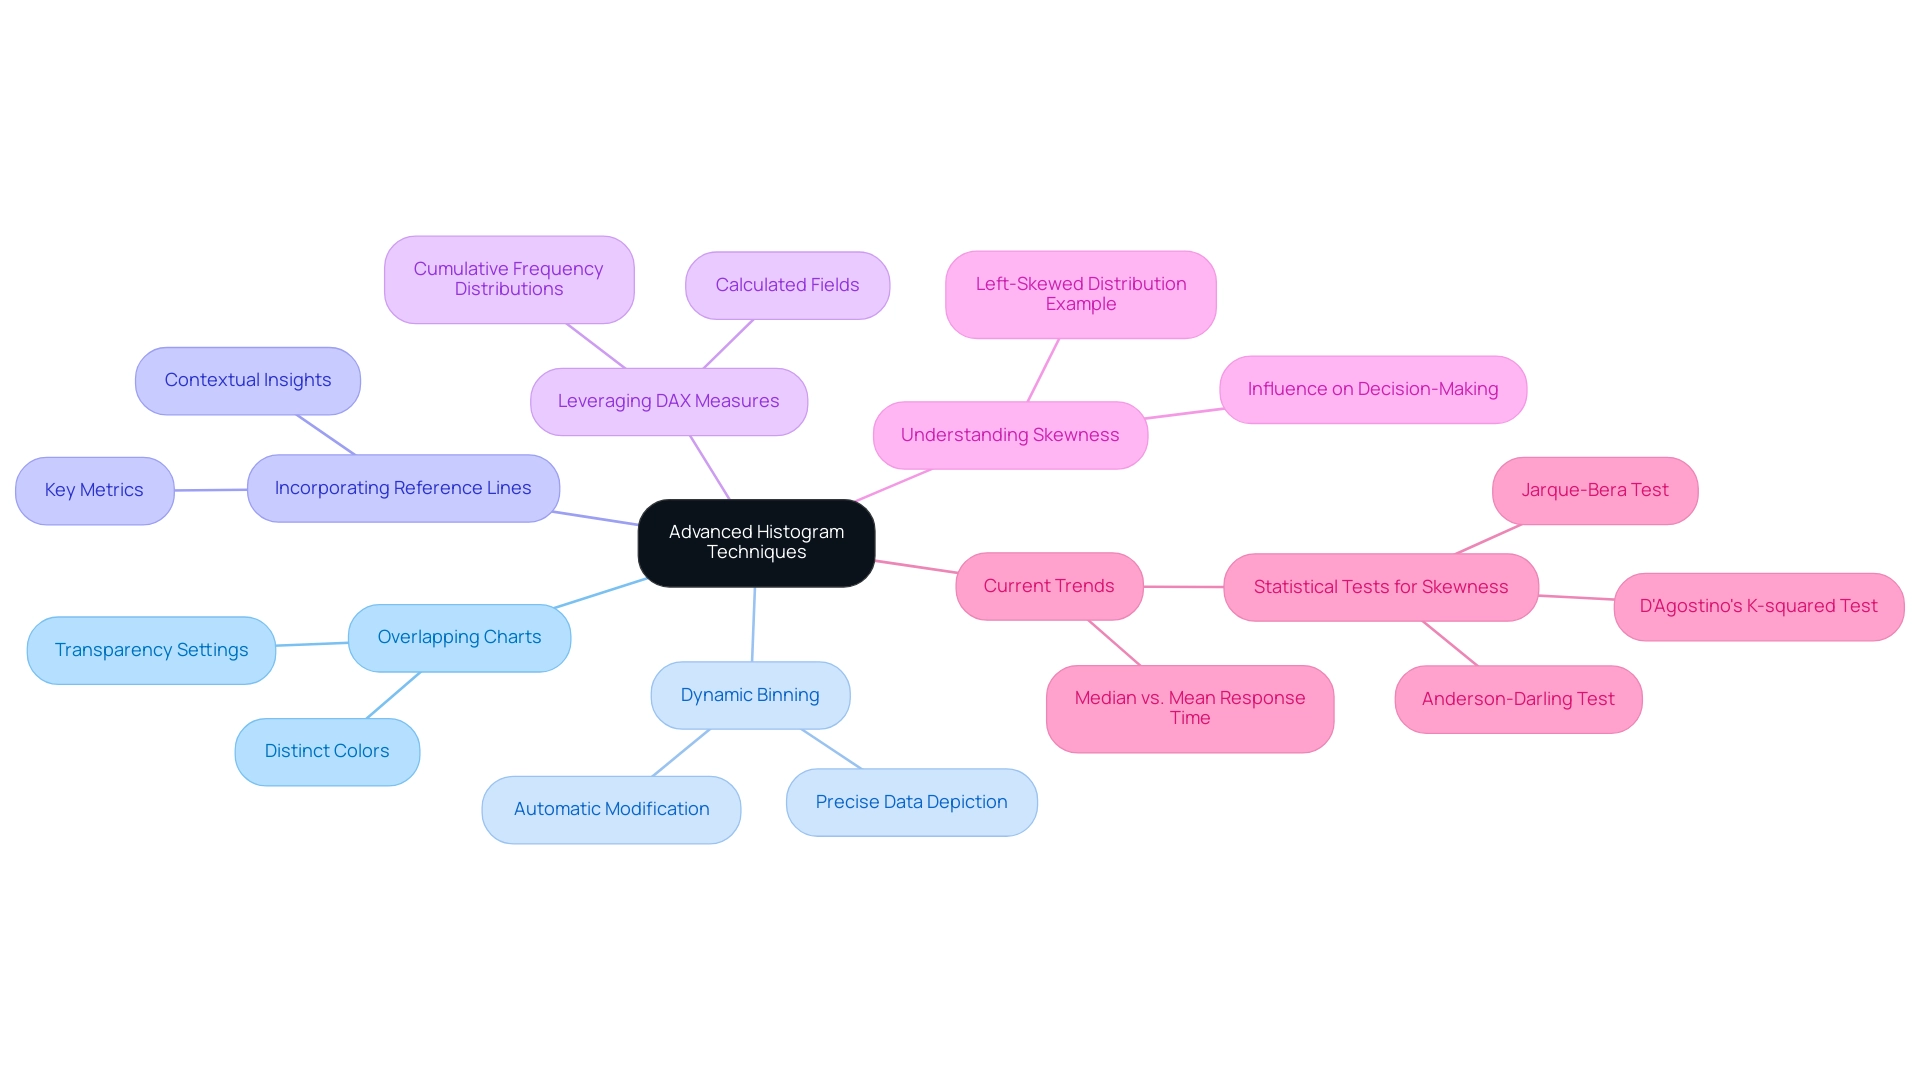
Interpreting Your Histogram: Key Insights and Analysis
Interpreting a histogram effectively necessitates a thorough analysis of its shape, spread, and central tendency, particularly in the context of leveraging Robotic Process Automation (RPA) and Business Intelligence for operational efficiency.
Shape of the Distribution: Begin by examining the shape of the data representation. Is it symmetrical, skewed to the left or right, or does it exhibit multiple peaks (bimodal or multimodal)? Comprehending the shape can uncover significant patterns within the information, such as the presence of subgroups or trends that may not be immediately apparent. This insight is crucial for organizations aiming to automate manual workflows and enhance decision-making processes.
Spread of Information: Evaluate the width of the chart to assess the information’s spread. A wider histogram suggests greater variability, indicating that the points are more dispersed. This variability can provide insights into the consistency of the dataset and highlight areas that may require further examination, especially when utilizing RPA to streamline information collection and reporting.
Central Tendency: Identify where the majority of values cluster. This is typically represented by the tallest bars in the histogram, which indicate the most frequently occurring values. Grasping central tendency is vital for making informed choices based on the information, particularly when using tools like the Power BI histogram to convert raw information into actionable insights.
Outliers: Pay attention to any bars that stand apart from the rest or are significantly lower than their neighbors. These outliers can skew your analysis and may require additional investigation to understand their impact on the overall dataset. RPA can assist in identifying and addressing these anomalies efficiently.
In 2025, organizations are increasingly utilizing Power BI histogram to examine information distribution and central tendency. A recent study highlighted that nine sources reported frequent misinterpretations concerning the use of bar charts for presenting information from two variables, underscoring the importance of selecting the suitable visualization technique. As noted by Pastore, Lionetti, & Altoè, “For researchers using statistics, graphing is a logical first step in analyzing quantitative data—for instance when looking at the distribution of univariate data—and is often advised to do before calculating a measure.”
This emphasizes the importance of utilizing bar charts in information analysis. Furthermore, it is essential to acknowledge the limitations of histograms; they are not appropriate for categorical variables or when the variable of interest is not continuous. By mastering these techniques in BI, businesses can convert raw information into actionable insights, driving operational efficiency and informed decision-making, particularly through the integration of RPA solutions.
Moreover, organizations that fail to leverage insights driven by information risk falling behind their competitors, making it essential to automate manual workflows and address challenges such as time-consuming report creation and inconsistencies.
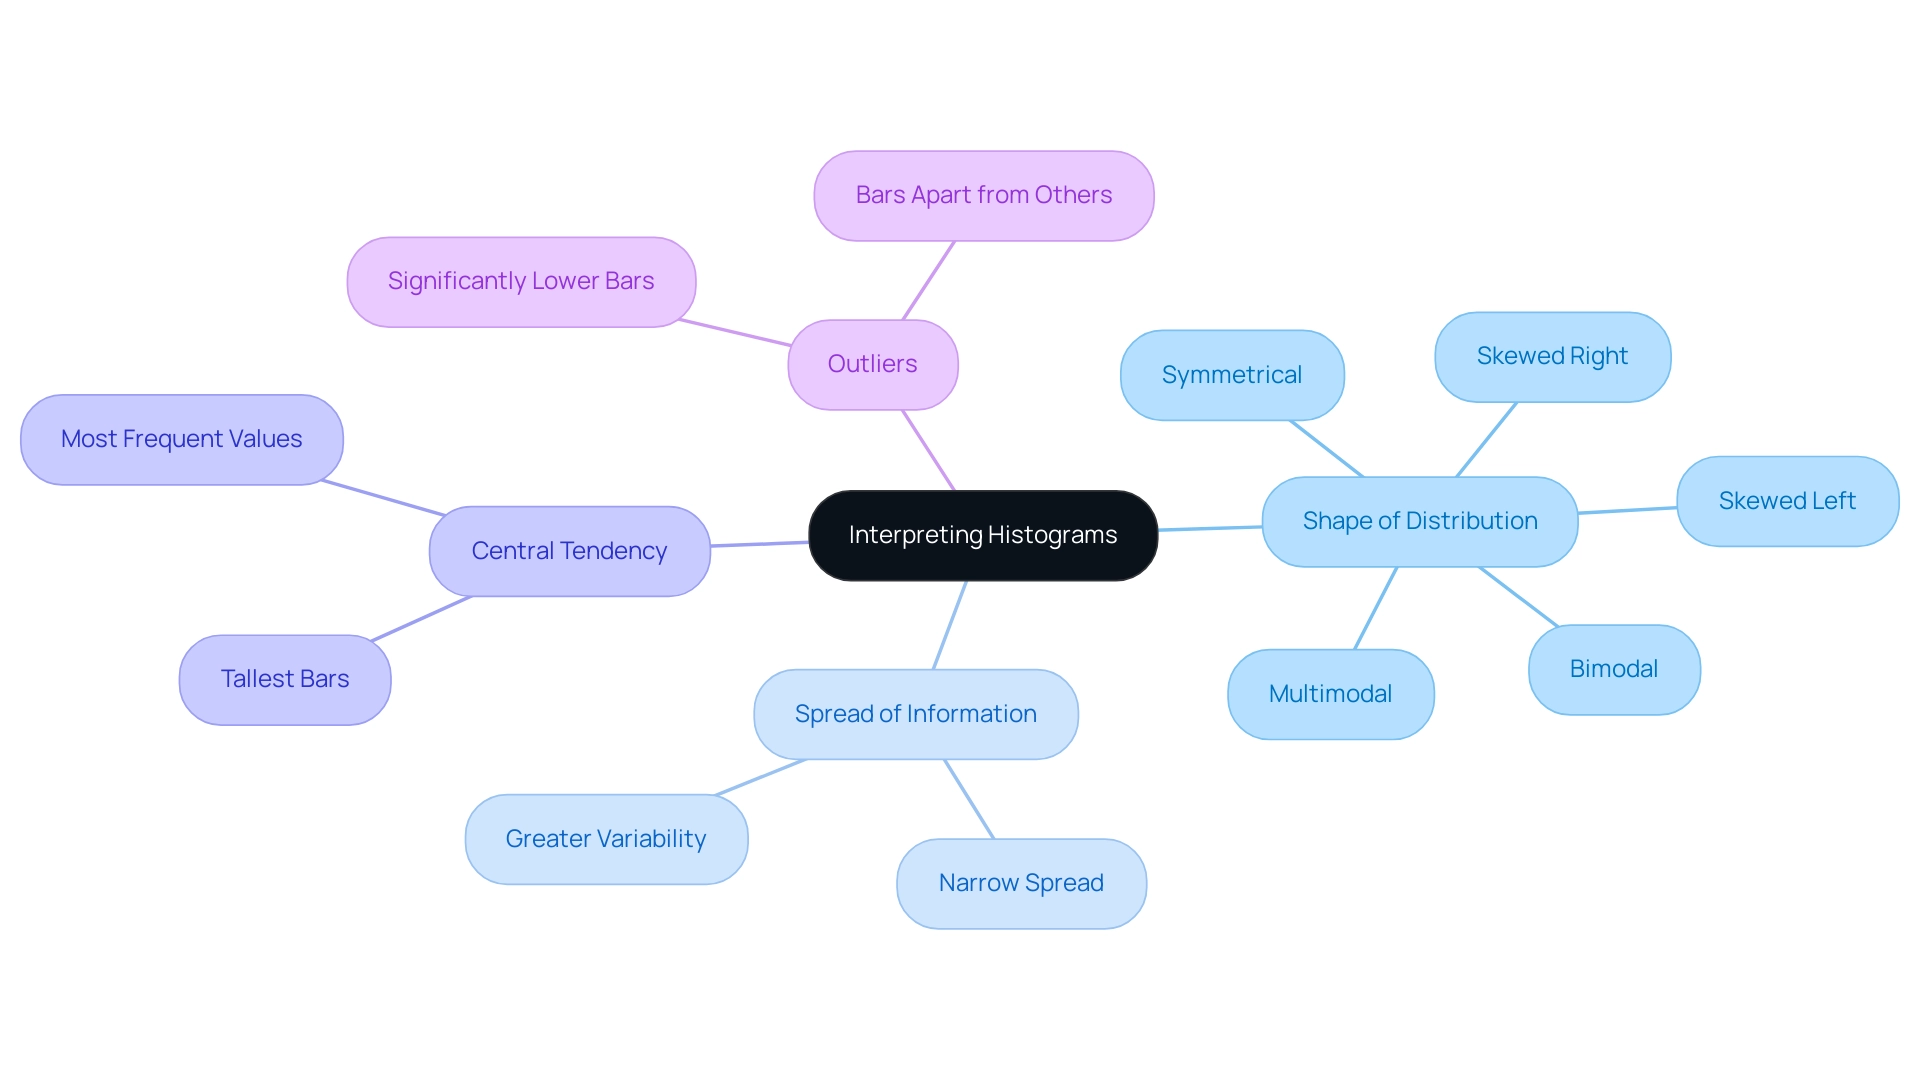
Key Takeaways and Next Steps in Power BI Histogram Mastery
Mastering Power BI histograms is essential for effective analysis, serving as powerful instruments for visualizing distributions and revealing trends. In today’s information-rich environment, leveraging Business Intelligence and RPA solutions like EMMA RPA and Power Automate is crucial for transforming raw information into actionable insights that drive growth and innovation. Here are the key takeaways for 2025:
- Histograms are vital for visualizing data distributions, enabling analysts to swiftly identify patterns and anomalies—critical for informed decision-making.
- Selecting and preparing the right dataset is essential for effective analysis, ensuring that insights drawn are accurate and actionable. However, challenges such as time-consuming report creation and inconsistencies can hinder this process.
- Utilizing advanced methods can significantly enhance the analytical capabilities of your charts, fostering a deeper understanding of the information and addressing the absence of actionable direction often encountered in BI dashboards.
- Analyzing the outcomes of bar charts is crucial for informed decision-making, as it provides a clear view of underlying trends, ultimately enhancing operational efficiency.
Next steps for improving your Power BI data analysis skills include:
- Practicing chart creation with diverse datasets to gain hands-on experience.
- Exploring advanced techniques such as overlaying multiple Power BI histograms or integrating them with other visualization tools to enrich your analysis.
- Continuously refining your skills through training and staying updated on current trends in BI, as the landscape evolves rapidly.
Statistics reveal that effective information visualization is paramount; the human brain processes visual stimuli in just 13 milliseconds and manages 400 billion bits of information per second. This underscores the need for clear and impactful visual representations in decision-making. Furthermore, organizations that have mastered visualization tools, such as Power BI, report significant improvements in operational efficiency. For instance, a case study involving a CRM tool demonstrated a remarkable 998% ROI and a 44% increase in sales productivity through effective data visualization.
As noted by the Mercedes-Benz team, “This has become a game-changer for the automotive industry, making real-time tracking possible and easy to manage.” By focusing on mastering data distributions and leveraging RPA solutions, businesses can unlock similar efficiencies and drive growth. Additionally, incorporating inferential analysis techniques, such as hypothesis testing and regression analysis, can further enhance the analysis of Power BI histograms.
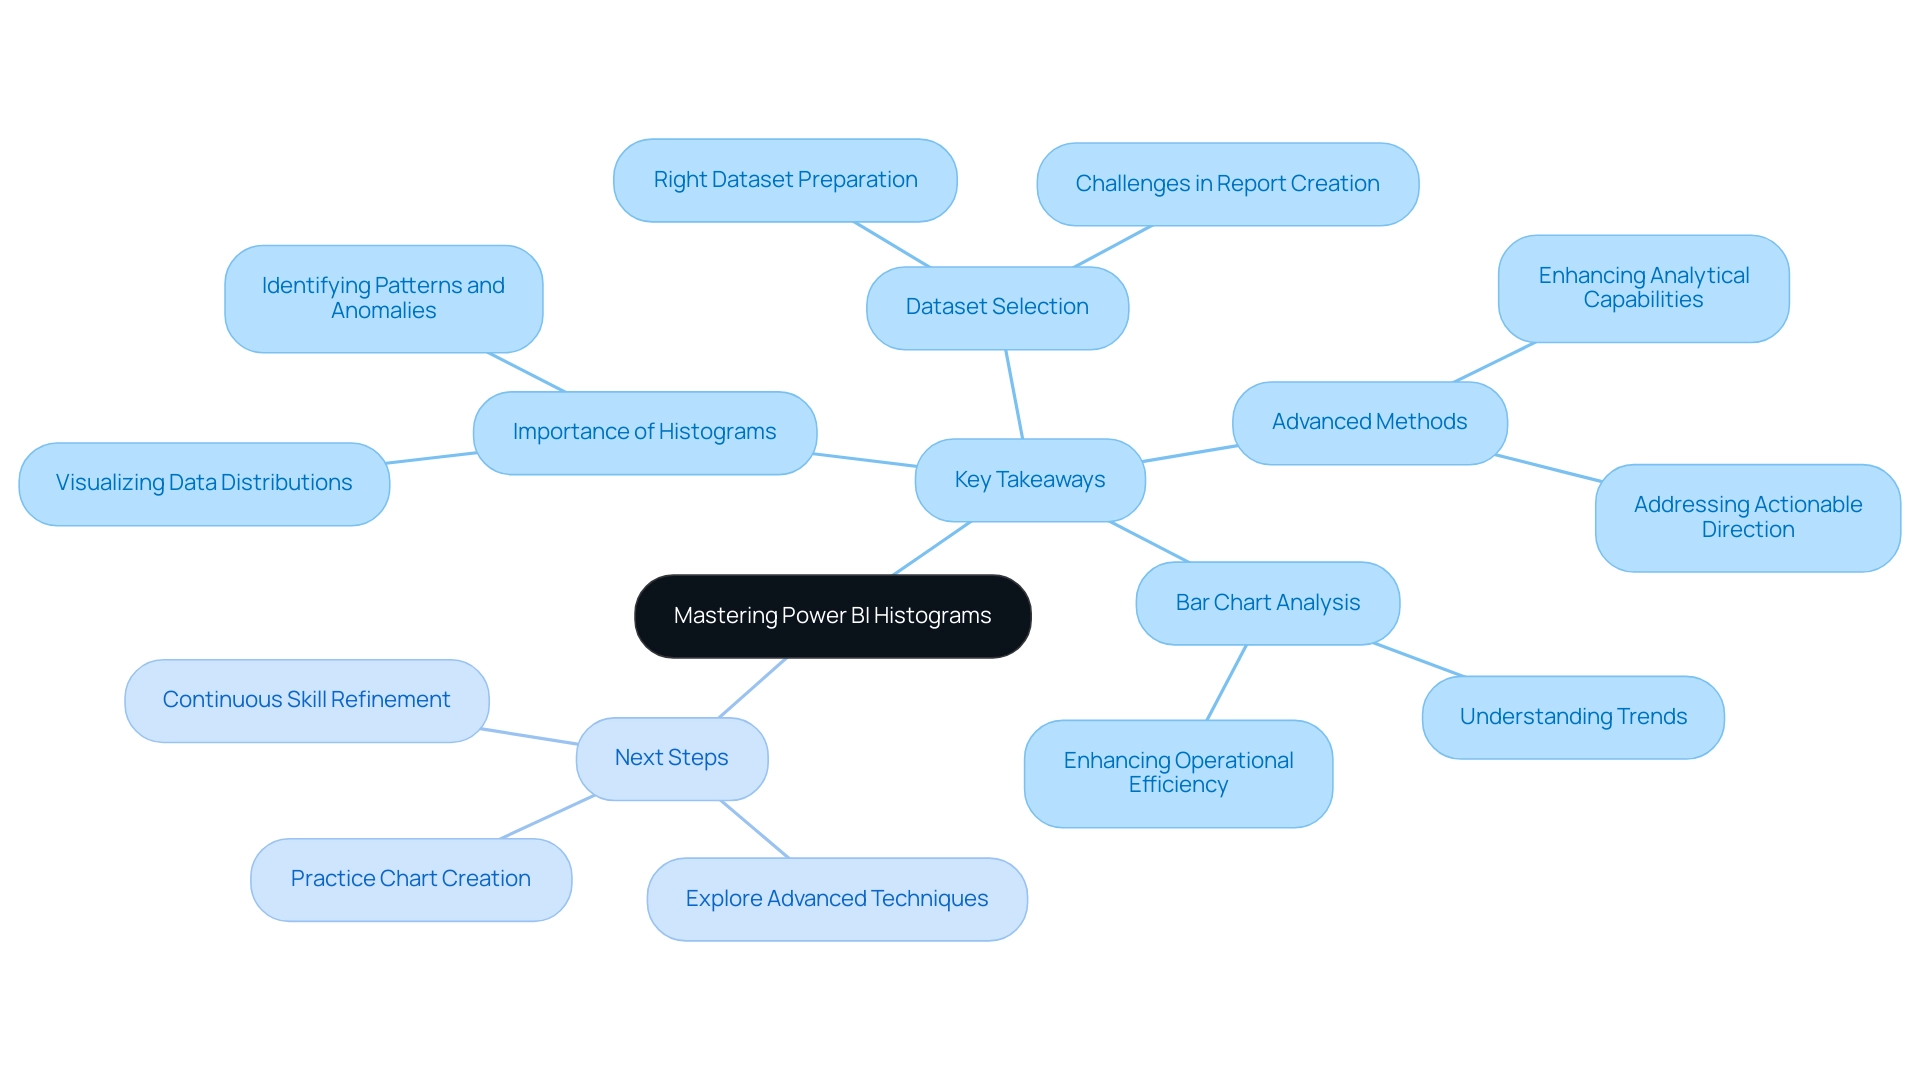
Conclusion
Histograms serve as indispensable tools in the realm of data analysis, particularly within Power BI, where they transform numerical data into clear visual representations of frequency distributions. This article underscores the importance of mastering histogram creation and interpretation, especially as organizations increasingly depend on Business Intelligence to inform their strategic decisions. By grasping the mechanics of histograms—including the significance of data cleanliness and the necessity for relevant datasets—analysts can extract valuable insights that drive informed decision-making.
Furthermore, advanced techniques such as overlapping histograms, dynamic binning, and the incorporation of reference lines significantly enhance the analytical capabilities of histograms, enabling deeper insights into data trends. The ability to effectively interpret these visualizations—by examining shape, spread, and central tendency—reinforces their critical role in identifying patterns and anomalies vital for operational efficiency.
As organizations navigate the complexities of data analysis in 2025, integrating histograms into their BI strategies becomes essential for sustaining a competitive edge. By prioritizing data quality, embracing advanced analytical techniques, and continuously refining their skills, professionals can unlock the full potential of histograms in Power BI. Ultimately, mastering these visual tools not only facilitates improved decision-making but also cultivates a culture of data-driven insights that can propel businesses toward growth and innovation.
Frequently Asked Questions
What is a bar chart and how is it used in Power BI?
A bar chart is a visual tool that organizes numerical values into defined intervals to demonstrate the frequency distribution of quantitative information. In Power BI, it helps users visualize how information is spread across different intervals, aiding in the recognition of trends, outliers, and the overall distribution shape.
How do bar charts differ from histograms?
Bar charts depict categorical information, while histograms focus on continuous data and frequency distributions. This makes histograms particularly valuable for statistical analysis.
Why is it important for organizations to focus on information quality when using BI tools?
Poor master information quality can impede the effectiveness of BI tools. Organizations need to address information quality issues to fully capitalize on their BI initiatives and enhance operational efficiency.
What recent trends have been observed in information visualization for 2025?
There is a growing significance of bar charts as organizations seek to extract actionable insights from their data. For example, a case study involving Colorado’s public libraries showed how cleaning and analyzing operating hours information led to valuable visualizations.
What are the essential requirements for creating a histogram in Power BI?
The requirements include having the latest version of Power BI Desktop, a prepared dataset with numerical values, familiarity with the Power BI interface, understanding chart requirements, and ensuring information cleanliness.
How can organizations improve their data analysis capabilities?
Organizations can enhance their data analysis capabilities by fostering a culture of data usage, ensuring information cleanliness, seeking expert insights, and considering the integration of Robotic Process Automation (RPA) for automating repetitive tasks.
What is the significance of programming languages like R and Python in BI?
R and Python provide robust tools for statistical computing and automation, enhancing BI capabilities and helping organizations adopt advanced data analysis techniques.
What are the implications of the increasing demand for self-service BI and real-time analytics?
The trend reflects the necessity for robust information governance and security measures, as organizations increasingly rely on tools like Power BI for effective information examination.
Overview
The article “Mastering the Error in Content Enumeration: A Comprehensive Guide” addresses a critical aspect of information retrieval systems: the understanding and resolution of errors that arise during content enumeration. By identifying common causes—such as corrupted files and software issues—it highlights the necessity of recognizing these challenges. Furthermore, it advocates for the implementation of automation and AI-driven solutions, which can significantly enhance operational efficiency and user satisfaction.
Evidence of these improvements is found in various case studies, showcasing substantial reductions in error rates and enhancements in user experience. Are you aware of the potential impact that automated solutions can have on your systems? This guide not only presents a thorough analysis of the issues but also offers actionable insights for professionals seeking to elevate their operational standards. By embracing these strategies, organizations can foster a more reliable and user-friendly information retrieval process.
Introduction
In today’s digital landscape, the effectiveness of data retrieval systems is crucial for organizations striving to maintain user engagement and operational efficiency.
Content enumeration errors—instances when systems fail to accurately identify or access required data—present significant challenges across diverse sectors, from gaming to software applications. These errors not only frustrate users but can also lead to substantial declines in productivity and satisfaction, as recent statistics demonstrate.
As organizations navigate the complexities of modern data management, understanding the causes and implications of these errors becomes essential.
This article examines the common pitfalls that contribute to content enumeration errors, explores their operational impacts, and highlights best practices and innovative technologies, such as automation and AI, that can mitigate these challenges and enhance overall performance.
Understanding Content Enumeration Errors
Issues in listing emerge when a system fails to accurately recognize or access the necessary material during information retrieval processes. Such mistakes can manifest across various settings, including gaming, software applications, and information management systems. For instance, in gaming, a listing error may prevent a player from accessing saved game information, revealing a shortcoming in the system’s ability to accurately list available items.
The impact of these issues on user experience can be significant. In 2025, statistics indicate that nearly 30% of users reported frustration due to retrieval failures, which can lead to decreased engagement and satisfaction. This underscores the importance of addressing these errors swiftly to maintain a favorable user experience.
Recent case studies illustrate the prevalence of errors in content enumeration within retrieval systems. A notable case involved a major gaming platform that experienced extensive loading problems, resulting in a 25% decline in active users during peak times. This incident prompted a comprehensive review of their information retrieval processes, leading to the adoption of more robust error-handling mechanisms.
Moreover, the rise in DDoS attacks, which increased by 15% in 2023, highlights the urgent need for enhanced security protocols to protect connected devices and mitigate such cyber threats, complicating the information retrieval landscape.
Understanding material listing issues is crucial for effective troubleshooting. These errors often stem from misconfigured information sources, insufficient permissions, or outdated software versions. To resolve these issues, it is essential to conduct a thorough analysis of the retrieval pathways and ensure that all components are functioning correctly.
Expert opinions stress the necessity for proactive measures in managing errors in content enumeration. Industry leaders advocate for the integration of automated monitoring tools, such as Robotic Process Automation (RPA), which can detect and alert teams to potential issues before they escalate. For example, Uber faced challenges with defective information pipelines that led to erroneous fare calculations.
By implementing machine learning-driven information observability solutions, Uber reduced outages by 92% and improved pricing accuracy, thereby enhancing user trust and operational efficiency. This approach not only boosts operational efficiency but also mitigates the risk of user dissatisfaction.
Given recent developments, organizations are increasingly investing in AI and automation to enhance their information management capabilities. By leveraging these technologies, companies can optimize their information retrieval processes, reducing the likelihood of counting mistakes and improving overall performance. The concept of Big Ops transforming static information management into a flexible system further emphasizes the benefits of addressing item counting issues, enhancing agility and competitive advantage.
Practical examples of effective problem-solving further underscore the importance of tackling item counting issues. One prominent case involved a leading software company that encountered significant challenges with data retrieval. By adopting a machine learning-based solution, they successfully reduced errors in content enumeration by 85%, significantly improving user experience and operational effectiveness.
This case serves as a testament to the efficacy of targeted troubleshooting strategies, including the use of tailored AI solutions and RPA, in overcoming retrieval challenges.
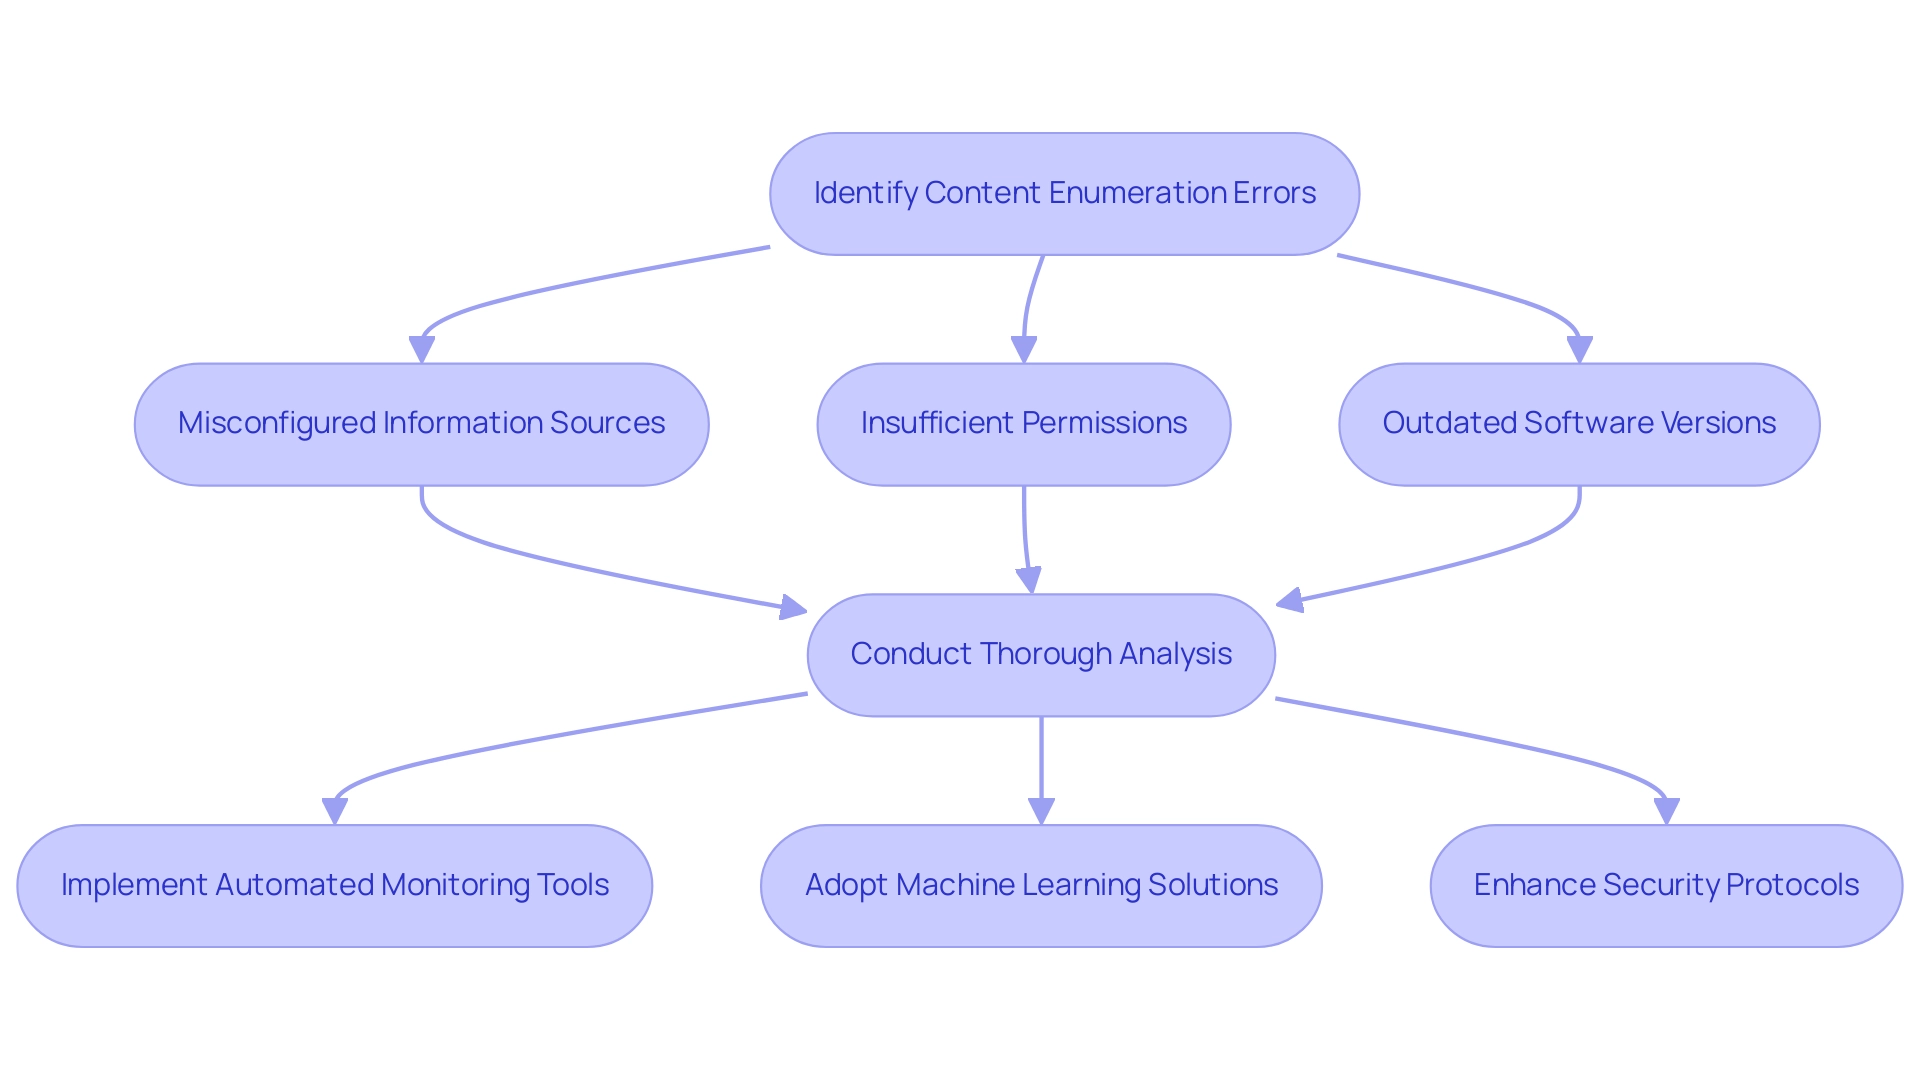
Common Causes of Content Enumeration Errors
Content enumeration errors can arise from several common causes, each contributing to failures in retrieving and processing data effectively:
-
Corrupted Files: Damaged or missing files are significant culprits in content retrieval failures. Recent research suggests that a substantial proportion of listing errors—estimated at around 30%—are directly linked to corrupted files. These disruptions can lead to incomplete or erroneous outputs, severely impacting data integrity.
-
Software Issues: Programming mistakes within the software can significantly obstruct the accurate listing of material. Such bugs may manifest in various forms, from minor glitches to major functional breakdowns, impacting the overall performance of the system. Notably, 74% of companies report that insider threats are becoming more frequent, underscoring the relevance of software bugs and user errors in the context of operational efficiency.
-
Configuration Issues: An error in content enumeration can result from incorrect settings in either software or hardware, creating barriers to successful enumeration. For instance, the case study titled ‘Reconstructing Cause-Specific Mortality Series’ illustrates how periodic changes in disease classifications disrupt consistency, emphasizing the importance of maintaining accurate configurations for smooth operation and information retrieval.
-
Network Problems: Connectivity issues can significantly impede access to remote materials. Network disruptions or slow connections can lead to timeouts and hinder successful data listing.
-
User Mistakes: Errors made by users, such as incorrect inputs or misconfigured settings, can also lead to enumeration errors. Awareness and training on proper usage can mitigate these risks.
To address these challenges, leveraging Robotic Process Automation (RPA) solutions like EMMA RPA and Microsoft Power Automate can streamline workflows, enhance efficiency, and improve employee morale. By automating repetitive tasks and ensuring precise settings, organizations can greatly decrease the occurrence of document listing mistakes. As Bryan Philips from In Motion Marketing states, ‘We transform B2B marketing challenges into growth opportunities,’ highlighting the necessity for organizations to tackle these prevalent concerns to enhance operational efficiency and reduce content listing mistakes.
By implementing strategies that focus on these areas, businesses can improve their data handling processes and drive better outcomes.
Implications of Content Enumeration Errors on Operations
Content counting mistakes can profoundly affect operations in several crucial ways:
-
Decreased Productivity: These mistakes disrupt workflows, causing significant delays and leading to wasted time and resources. In 2025, it is projected that almost two-thirds of companies will still face challenges with integrating AI solutions, which could assist in reducing such issues. An analysis of a mid-sized firm demonstrated that applying GUI automation decreased entry mistakes by 70% and sped up testing procedures by 50%. This highlights the capability of AI and automation to greatly minimize productivity loss related to information counting inaccuracies. The company encountered challenges like manual data entry inaccuracies and slow software testing, which were effectively resolved through automation.
-
User Frustration: Frequent errors in content enumeration can severely diminish user experience, leading to dissatisfaction and disengagement. Operations managers have reported that these issues often frustrate users, affecting their overall productivity and morale. This aligns with the principles of Salesforce’s ‘Ohana’ initiative, which emphasizes the importance of employee well-being and inclusion in fostering a positive work environment. By leveraging Robotic Process Automation (RPA) to streamline manual workflows, organizations can enhance user experience and reduce frustration.
-
Increased Costs: The financial implications of resolving these errors can be considerable. Organizations may need to allocate additional resources to troubleshoot and fix issues, thereby increasing operational costs. This is particularly concerning in an environment where effective resource management is paramount. The case study demonstrated that the ROI from implementing GUI automation was achieved within 6 months, highlighting the cost-saving potential of automation solutions.
-
Integrity Issues: An error in content enumeration can compromise the accuracy of information, which is crucial for informed decision-making. Poor information integrity can lead to misguided strategies and lost opportunities, further exacerbating operational inefficiencies. The integration of tailored AI solutions can help organizations unlock the power of Business Intelligence, transforming raw data into actionable insights that drive growth and innovation.
Addressing these implications is essential for maintaining operational efficiency and ensuring that teams can focus on strategic, value-adding activities. For instance, a case study on the influence of work environment on productivity highlights how environmental factors, such as noise levels, can affect employee performance. Likewise, handling data listing mistakes through automation can result in enhanced employee well-being and productivity, as reduced mistake rates are associated with improved performance results.
In conclusion, the consequences of data listing mistakes reach beyond immediate operational interruptions; they can influence overall productivity, user satisfaction, and financial stability. Therefore, it is essential for organizations to prioritize effective solutions like GUI automation and RPA.
Best Practices for Resolving Content Enumeration Errors
To effectively resolve content enumeration errors, adopting a comprehensive approach is essential, incorporating the following best practices:
-
Regular Maintenance: Routine checks and updates on both software and hardware are crucial in preventing errors. Regular maintenance not only enhances system performance but also significantly decreases the likelihood of encountering enumeration issues. Statistics indicate that organizations prioritizing regular maintenance experience a marked decrease in operational disruptions, with 41% of maintenance challenges stemming from insufficient resources or staff. This highlights the critical need for adequate staffing and resource allocation to support maintenance efforts. Leveraging Robotic Process Automation (RPA) solutions, such as EMMA RPA, can streamline these tasks, allowing teams to focus on more strategic initiatives.
-
Information Backup: Regular information backups are vital to safeguard against data loss during troubleshooting procedures. A robust backup strategy ensures that critical information is preserved, facilitating quick recovery and minimizing downtime. Implementing AI-driven solutions can enhance data management practices, ensuring efficient and effective backup processes.
-
User Training: Educating users on proper system usage is fundamental in minimizing errors. Effective training programs can significantly decrease the occurrence of mistakes in content enumeration, as informed users are less likely to make errors that lead to system failures. In 2025, organizations investing in user training reported a 30% decrease in such mistakes. This underscores the importance of user engagement in the maintenance process. GenAI Workshops can provide tailored training to enhance user understanding and proficiency.
-
Error Logging: Establishing comprehensive logging mechanisms is essential for tracking issues and identifying patterns that can inform future prevention strategies. By examining recorded information, organizations can identify recurring issues and implement targeted solutions. Incorporating AI technologies can further improve flaw detection and analysis, leading to more proactive maintenance strategies.
-
Testing and Validation: Regular testing of systems for vulnerabilities and validating data integrity are critical practices that ensure smooth operations. Conducting these tests helps recognize potential vulnerabilities before they escalate into major issues, thus preserving system reliability. RPA can automate testing processes, ensuring thorough and consistent evaluations of system performance.
Incorporating these best practices not only reduces the risk of errors in content enumeration but also fosters a culture of proactive maintenance and continuous improvement within organizations. Real-world instances illustrate that companies with organized maintenance protocols encounter fewer mistakes and improved operational efficiency, emphasizing the significance of regular maintenance in software management. For instance, a case study on Computerized Maintenance Management Systems (CMMS) revealed that many implementations fail due to poor user engagement and unclear objectives, underscoring the need for effective training and management support.
Additionally, as Adrian Ababei noted, “A slow website frustrates users and increases bounce rates,” further reinforcing the necessity of regular maintenance and user training to ensure optimal system performance. Moreover, website security essentials, including regular updates and security audits, play a crucial role in preventing issues and maintaining system integrity.
Leveraging Automation and AI to Prevent Enumeration Errors
Automation and AI play a pivotal role in preventing content enumeration errors through several key mechanisms:
-
Automating Routine Tasks: Minimizing manual input significantly reduces the risk of human error. This shift allows teams to focus on strategic initiatives rather than repetitive tasks, ultimately enhancing operational efficiency. Our Robotic Process Automation (RPA) solutions, such as EMMA RPA and Microsoft Power Automate, exemplify this shift by streamlining workflows and improving employee morale. Notably, a recent survey revealed that 45% of German respondents prioritize efficiency gains as the primary driver of automation, underscoring the importance of reducing administrative burdens.
-
Predictive Analytics: Leveraging AI to analyze usage patterns enables organizations to anticipate and mitigate potential issues before they arise. This proactive approach enhances accuracy and streamlines workflows. Significantly, 41% of participants in Germany express satisfaction with their current automation levels, indicating a growing acceptance of automation tools that help prevent mistakes.
-
Real-time Monitoring: Automated systems equipped with real-time monitoring capabilities can detect anomalies in information retrieval processes. This prompt oversight allows for rapid corrective measures, preventing counting mistakes from escalating into larger problems. The integration of AI in monitoring systems has proven effective across various sectors, including finance, where AI solutions enhance invoice approval processes by automatically validating invoices and identifying discrepancies. As Salesforce notes, “Ninety-three percent of CFOs have experienced shorter invoice processing times thanks to digital technologies and automation,” highlighting the tangible benefits of these technologies.
-
Enhanced Information Management: AI-driven tools significantly improve organization and accessibility, which are crucial in reducing the likelihood of errors in content enumeration. By ensuring that information is organized and easily retrievable, organizations can maintain high quality, vital for informed decision-making. A global survey indicated that 68% of respondents desire AI to streamline invoice approval and payment authorization, illustrating the demand for improved data management solutions. This directly addresses traditional bottlenecks in financial workflows, showcasing how AI can enhance operational efficiency.
Incorporating these technologies not only addresses current challenges but also positions organizations to thrive in a data-rich environment, where the ability to extract meaningful insights is paramount. As automation progresses, its significance in preventing errors in content enumeration will only grow, leading to improved operational efficiency and innovation.
To explore how our RPA solutions can specifically address your organization’s challenges, book a free consultation with us today.
Measuring the Effectiveness of Solutions to Enumeration Errors
To effectively measure the success of solutions implemented for content enumeration errors, organizations must adopt a structured approach that encompasses key strategies:
-
Define Key Performance Indicators (KPIs): Establishing clear metrics is crucial. Organizations should focus on KPIs such as mistake frequency, tracking how often mistakes occur; resolution time, measuring the speed at which issues are addressed; and user satisfaction, gauging the overall experience of users interacting with the system. These metrics provide a quantifiable basis for assessing performance and guiding improvements. Notably, studies indicate that businesses employing robust measurement strategies report higher retention rates and customer loyalty, with user satisfaction scores significantly improving.
-
Conduct Regular Reviews: Periodic assessments of system performance and the effectiveness of implemented solutions are essential. By reviewing KPIs regularly, organizations can identify trends and make informed decisions about necessary adjustments. This practice not only helps maintain operational efficiency but also ensures that solutions remain aligned with evolving business needs, particularly in a rapidly evolving AI landscape, to avoid any errors in content enumeration.
-
Gather User Feedback: Actively collecting input from users is vital for understanding their experiences with the system. Surveys and feedback forms can reveal insights into user satisfaction and highlight areas needing improvement. Engaging users in this way fosters a culture of continuous improvement and ensures that solutions are user-centric, which is essential for leveraging Business Intelligence effectively.
-
Analyze Mistake Trends: Monitoring mistake patterns over time allows organizations to evaluate the impact of changes made to the system. By examining these trends, companies can pinpoint recurring problems and assess whether applied solutions, such as Robotic Process Automation (RPA), are successfully addressing the error in content enumeration. This data-driven approach supports informed decision-making and enhances overall operational efficiency.
In 2025, organizations that effectively track these KPIs can anticipate notable enhancements in user satisfaction regarding issue resolution. For example, a recent case study emphasized how a mid-sized company that adopted GUI automation to enhance operations experienced a 30% decrease in mistake frequency and a significant rise in user satisfaction scores. Furthermore, monitoring backlinks and PR mentions offers insights into brand authority and relevance, which can guide strategy and improve operational efficiency.
As Dr. Abdur Rahman states, “Measuring effectiveness is not just about numbers; it’s about understanding the impact of those numbers on user experience and operational success.” By utilizing these best practices, organizations can not only address counting issues more effectively but also promote growth and innovation in their operations.
Fostering a Culture of Change to Combat Enumeration Errors
Fostering a culture of change is vital for effectively addressing issues related to error in content enumeration. Organizations can take several strategic steps to cultivate this environment:
-
Encourage Open Communication: Establishing a culture that promotes dialogue about errors and potential solutions is essential. Creating a safe space for employees to share their experiences not only helps in identifying issues but also fosters a collaborative atmosphere where solutions can be developed collectively. Leveraging Robotic Process Automation (RPA) can streamline communication processes, ensuring that feedback loops are efficient and effective.
-
Recognize and Reward Innovation: Acknowledging employees who actively contribute to problem resolution and process improvement can significantly enhance morale and motivation. Recognition can take various forms, from formal awards to simple shout-outs in team meetings, reinforcing the value of proactive problem-solving. Unresolved workplace conflicts can lead to employee turnover, with studies indicating that 30% of employees have left a company due to such issues. Thus, acknowledging contributions to issue resolution is essential for sustaining morale and retention, particularly in a swiftly changing AI environment where innovation is vital.
-
Provide Continuous Training: Ongoing education is crucial in keeping staff informed about best practices and emerging technologies. Regular training sessions can prepare employees with the skills necessary to navigate complex systems and decrease the chances of mistakes happening initially. Incorporating training on RPA and Business Intelligence tools can empower employees to leverage these technologies for enhanced operational efficiency.
-
Lead by Example: Management plays a pivotal role in fostering a culture of change. By showing a dedication to enhancement and openness, leaders can motivate their teams to adopt change and actively engage in issue resolution efforts. Organizations that align their leadership actions with their stated values and strategic priorities are more likely to foster high-performing cultures. The integration of tailored AI solutions can further support leaders in making informed decisions that drive growth and innovation.
Statistics reveal that organizations with a thriving culture experience employee satisfaction levels that are 102% higher than those without. This underscores the importance of cultivating an environment where open communication is prioritized. Furthermore, the quote from Chantel Sheaks emphasizes the need for supportive measures, stating that “emergency savings funds were one low-cost way to provide employees with a valuable safety net.”
By prioritizing open communication and a culture of change, businesses can significantly improve their processes for addressing the error in content enumeration, ultimately leading to enhanced operational efficiency and employee satisfaction.
Conclusion
Content enumeration errors present substantial challenges for organizations across various sectors, adversely affecting user experience, productivity, and operational efficiency. By understanding the root causes of these errors—ranging from corrupted files and software bugs to network issues and user errors—businesses can implement targeted strategies to mitigate their effects. Adopting best practices such as:
- Regular maintenance
- Robust data backup protocols
- Comprehensive user training
enables organizations to significantly reduce the occurrence of these errors.
The implications of content enumeration errors extend beyond immediate disruptions; they can lead to decreased user satisfaction and increased operational costs. Case studies demonstrate that integrating automation and AI technologies not only streamlines data management processes but also enhances overall performance, providing organizations with a competitive edge. The successful application of these technologies, coupled with a proactive approach to error resolution, can transform data retrieval systems into resilient and efficient operations.
Ultimately, fostering a culture of change and continuous improvement is essential for effectively combating content enumeration errors. By encouraging open communication, recognizing innovation, and providing ongoing training, organizations can empower their teams to proactively address challenges. As businesses navigate the complexities of modern data management, prioritizing these strategies will ensure they not only overcome current obstacles but also thrive in an increasingly data-driven landscape. Embracing these changes is not just an operational necessity; it is a pathway to sustained success and user satisfaction.
Frequently Asked Questions
What are content enumeration errors?
Content enumeration errors occur when a system fails to accurately recognize or access necessary material during information retrieval processes, leading to issues such as missing data or incorrect listings.
In what contexts can these errors occur?
These errors can manifest in various settings, including gaming, software applications, and information management systems.
How do content enumeration errors impact user experience?
Content enumeration errors can significantly frustrate users, with statistics indicating that nearly 30% of users reported retrieval failures in 2025, leading to decreased engagement and satisfaction.
Can you provide an example of a case study involving content enumeration errors?
A notable case involved a major gaming platform that faced extensive loading problems, resulting in a 25% decline in active users during peak times. This prompted a review of their information retrieval processes and the implementation of better error-handling mechanisms.
What are some common causes of content enumeration errors?
Common causes include: Corrupted files, Software issues, Configuration problems, Network problems, User mistakes.
How can organizations address these content enumeration issues?
Organizations can resolve these issues by conducting thorough analyses of retrieval pathways, ensuring correct configurations, and implementing automated monitoring tools, such as Robotic Process Automation (RPA).
What role does technology play in improving information retrieval processes?
Technology, particularly AI and automation, helps organizations optimize information retrieval, reducing counting mistakes and improving overall performance.
What are the benefits of using machine learning and RPA in addressing content enumeration errors?
Implementing machine learning and RPA can lead to significant reductions in errors, as demonstrated by a leading software company that reduced errors by 85%, enhancing user experience and operational effectiveness.
How has the increase in cyber threats affected information retrieval systems?
The rise in DDoS attacks, which increased by 15% in 2023, underscores the need for enhanced security protocols to protect connected devices and improve the information retrieval landscape.
What proactive measures do industry leaders recommend for managing content enumeration errors?
Industry leaders advocate for integrating automated monitoring tools to detect potential issues early, thus preventing escalation and maintaining user trust and operational efficiency.
Overview
This article delves into mastering the DAX CROSSFILTER function in Power BI, underscoring its critical role in enhancing data analysis and reporting capabilities. By illustrating the function’s flexibility in modifying filter directions, it captures attention and builds interest. Practical applications in sales and customer insights are discussed, generating desire for deeper understanding. Furthermore, it highlights best practices and troubleshooting strategies that empower users to leverage DAX effectively, prompting action for improved decision-making and operational efficiency.
Introduction
In the realm of data analysis, the ability to manipulate and derive insights from complex datasets is paramount. Organizations are increasingly turning to tools like Power BI for their reporting needs, making it essential to understand the intricacies of DAX (Data Analysis Expressions). DAX serves as the backbone for custom calculations within Power BI, Excel, and SQL Server Analysis Services, empowering users to unlock the full potential of their data.
Among its many functions, CROSSFILTER stands out as a key player, enabling dynamic filtering across relationships in a data model. As the demand for data-driven insights intensifies, mastering DAX functions like CROSSFILTER not only enhances analytical capabilities but also positions professionals for success in an ever-evolving digital landscape.
This article delves into the significance of DAX and CROSSFILTER, exploring:
- Practical applications
- Performance considerations
- Best practices to elevate data analysis strategies in 2025 and beyond.
Understanding DAX: The Foundation of Power BI
DAX, or Data Analysis Expressions, is an essential formula language utilized in Power BI, Excel, and SQL Server Analysis Services, empowering users to execute custom calculations and aggregations on models. Mastering DAX crossfilter is vital for effectively leveraging Power BI, as it underpins the calculations that drive reports and dashboards. With a diverse array of functions, operators, and constants, DAX enables users to perform complex calculations that yield valuable insights.
As we look to 2025, the importance of DAX in analysis continues to grow, with recent statistics revealing that a significant percentage of Power BI users rely on DAX for advanced manipulation. This dependence underscores the necessity for users to become proficient in DAX crossfilter to unlock the full potential of their data, particularly in addressing common challenges such as time-consuming report creation, inconsistencies, and the absence of actionable guidance that can impede effective decision-making.
Real-world examples vividly demonstrate the transformative power of DAX in analytics. Organizations that have implemented DAX report enhanced reporting capabilities and improved decision-making processes, effectively tackling the prevalent issues of confusion and mistrust in information stemming from inconsistent reporting. However, the learning curve associated with DAX can be steep, often serving as a barrier to entry for many users.
A recent case study highlighted the low engagement with comprehensive DAX courses, suggesting that while the learning curve is challenging, those who persist can significantly differentiate themselves in the job market. This challenge also presents an opportunity for professionals to stand out, reinforcing the notion that mastering difficult skills can lead to greater career success.
Moreover, the landscape of DAX is continuously evolving, with features like DAX crossfilter being regularly updated by Microsoft to enhance usability based on user feedback. This commitment to improvement ensures that users have access to the latest features and best practices, facilitating the adoption of DAX crossfilter in their workflows. As Aaron Parry, Lead Power BI instructor at Maven Analytics, states, “Trust me; you won’t want to miss it!”
This emphasizes the importance of engaging with DAX as part of professional development.
As the demand for data-driven insights escalates, mastering DAX crossfilter becomes a valuable asset for professionals in the field. Expert opinions stress that proficiency in DAX crossfilter not only enhances reporting effectiveness but also positions individuals for greater success in their careers. By investing time in learning DAX crossfilter, users can transform their analytical approach and achieve meaningful outcomes for their organizations.
Additionally, numerous free resources are available online, including community forums and official documentation, which can assist users in overcoming the challenges of learning DAX crossfilter and encourage deeper engagement with the material.
At Creatum GmbH, we also offer the General Management App, which integrates seamlessly with Microsoft Copilot to provide custom dashboards and predictive analytics, further enhancing your ability to leverage insights from Power BI. We invite you to explore these tools and schedule a complimentary consultation to discover how they can help you overcome the challenges of analysis.
What is the CROSSFILTER Function? An Overview
The tool in DAX serves as a pivotal mechanism for modifying the filter direction between two columns within a relationship. This capability empowers users to dictate the flow of filters through relationships, fostering a more dynamic and adaptable analytical approach. Unlike traditional filtering methods, this tool offers the unique advantage of altering the direction of filtering, accommodating both one-way and bidirectional filtering.
This flexibility proves particularly beneficial in situations where the default filter direction does not yield the desired analytical outcomes. As we look towards 2025, the significance of this filtering technique is increasingly recognized, with information specialists acknowledging its potential to enhance analysis efficiency. The DAX crossfilter function, which defines the cross-filtering direction for calculations between two columns, was introduced in Excel 2016, broadening its accessibility and enabling a wider audience to leverage its power in analytics. For instance, integrating Power BI with tools like Roll stack and SQL has demonstrated how this feature can optimize reporting processes, ultimately leading to more informed decision-making.
Statistics reveal that the mode of ratings for the effectiveness of this tool across various applications is notably high, with a mode rating of 3 for Feature 5, underscoring its value in the analytical landscape. Experts in the field have highlighted the benefits of utilizing this tool, noting that it significantly enhances the precision of insights. As one Microsoft employee, mahoneypat, aptly stated, “the ability to control filter direction is crucial for achieving precise analytical results.” This perspective is echoed by numerous analytics professionals who advocate for mastering DAX techniques to fully exploit the capabilities of Power BI, especially in relation to the 3-Day Power BI Sprint and the General Management App offered by Creatum GmbH, which enhance reporting and deliver actionable insights.
Furthermore, as organizations continue to navigate complex information environments, the DAX crossfilter capability stands out as an essential component for improving analytical effectiveness and facilitating well-informed business decisions. Coupled with Robotic Process Automation (RPA), businesses can automate manual workflows, thereby enhancing operational efficiency and ensuring that data-driven insights are readily available for strategic decision-making.
CROSSFILTER Syntax: A Step-by-Step Breakdown
The syntax for the operation is structured as follows:
CROSSFILTER(<LeftColumnName>, <RightColumnName>, <CrossFilterType>)
- LeftColumnName: This parameter represents the name of the column on one side of the relationship, serving as the primary reference for filtering.
- RightColumnName: This denotes the name of the column on the opposite side of the relationship, which interacts with the left column during filtering operations.
- CrossFilterType: This crucial parameter defines the direction of the filter. It can be configured as follows:
1: Enables one-way filtering from the left column to the right column.-1: Activates one-way filtering from the right column to the left column.0: Disables filtering entirely, allowing for a broader data view without directional constraints.
Grasping this syntax is vital for leveraging the CROSSFILTER function effectively in your DAX calculations, particularly in complex data models where precise filtering can significantly impact the accuracy of insights derived from your data.
In the context of enhancing operational efficiency through Robotic Process Automation (RPA), understanding how to adjust relationships using DAX techniques can streamline workflows, minimize errors, and bolster decision-making processes. Notably, the DAX filter capability was introduced in Excel 2016, underscoring its importance in recent software updates.
Moreover, considering the highest level of parallelism for SQL Server operations, which is 64 processors, can improve performance when utilizing DAX expressions like CROSSFILTER in complex models. A practical application of effective filtering can be observed in the organization’s Auto Drop Statistics Feature, which manages and optimizes existing statistics on the DimCustomer table. This feature ensures that outdated statistics are automatically removed, thereby maintaining the relevance and accuracy of insights.
This approach not only supports data-driven decision-making but also aligns with the broader goals of leveraging Business Intelligence to drive growth and innovation. Furthermore, as businesses navigate the overwhelming AI landscape, tailored solutions that incorporate DAX functions can empower organizations to automate workflows effectively, ensuring they remain competitive and responsive to market demands.
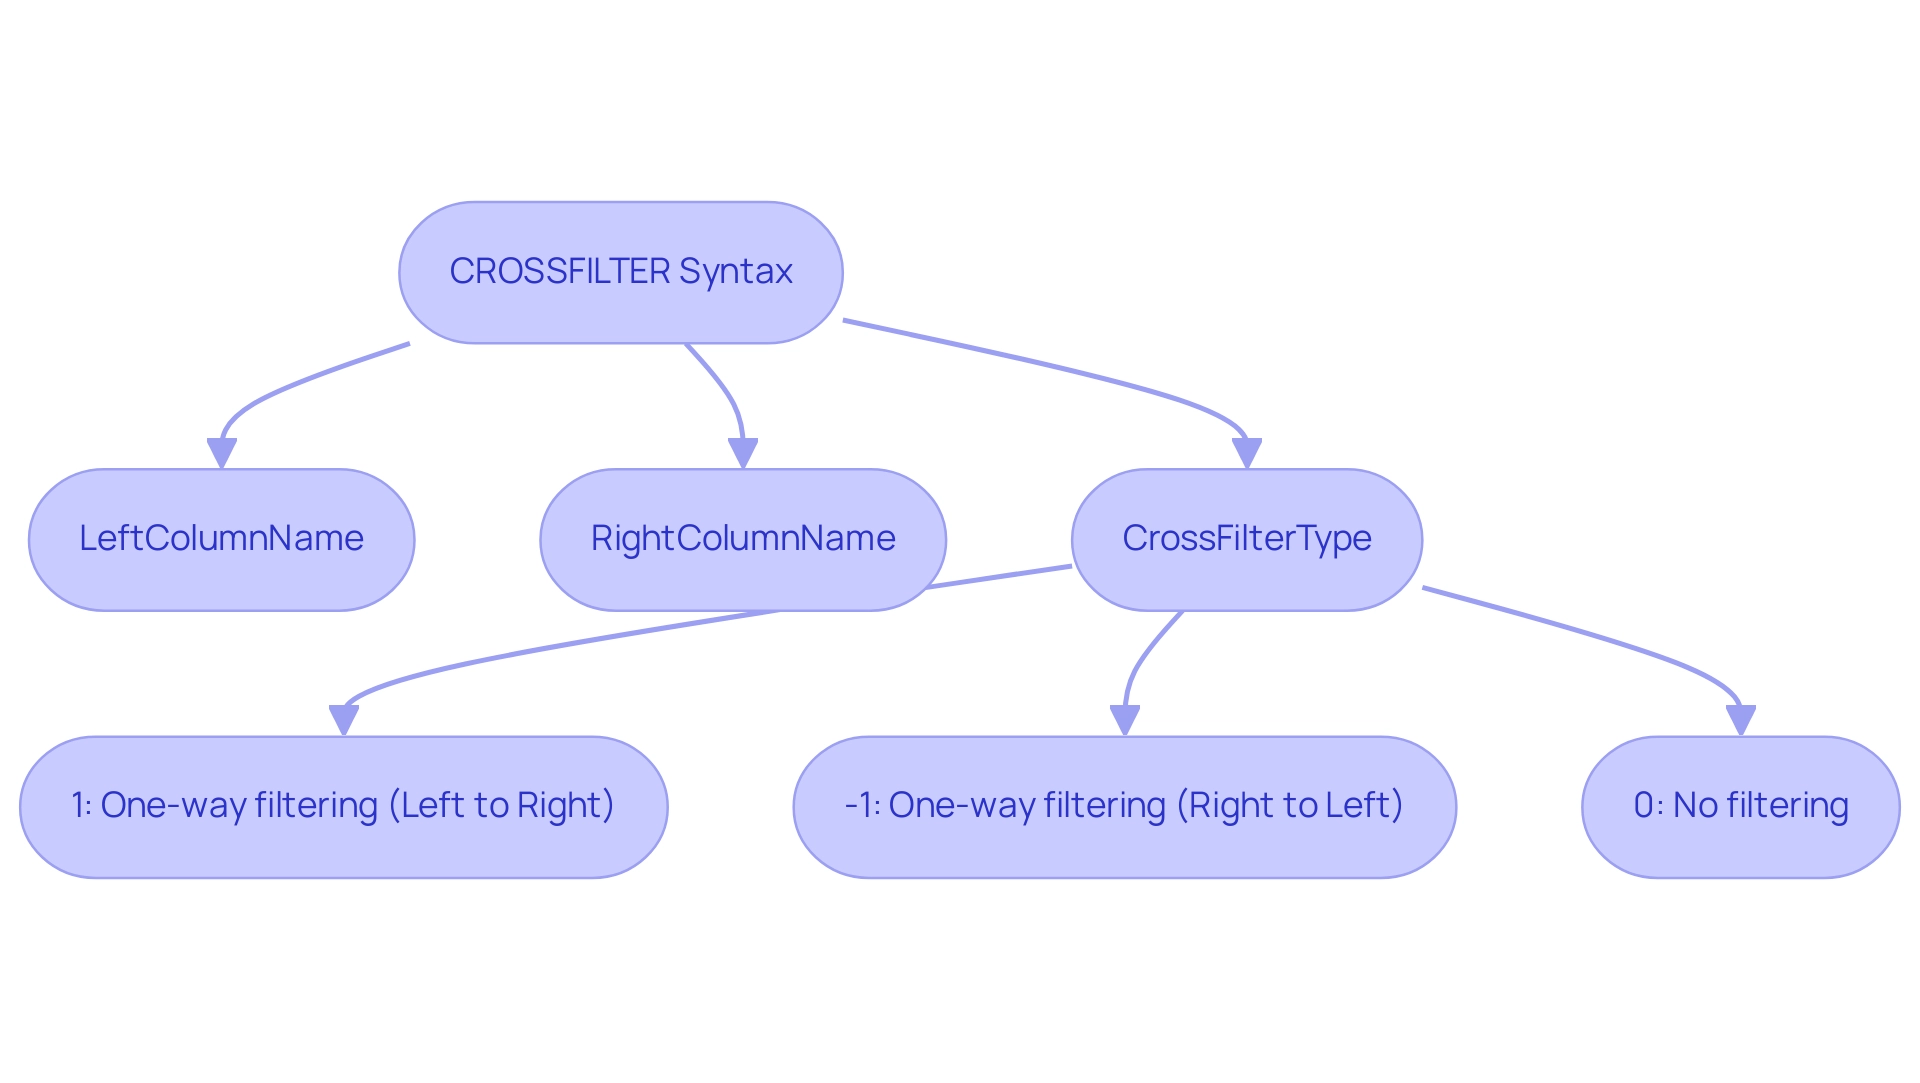
Practical Applications of CROSSFILTER in Data Analysis
This tool serves as a powerful resource in various analytical contexts, significantly enhancing analysis capabilities, especially when paired with Robotic Process Automation (RPA) from Creatum GmbH to automate manual workflows. Consider the following key applications:
-
Sales Analysis: In a typical sales environment, integrating a sales table with a product table through DAX crossfilter enables a detailed examination of how variations in product categories impact sales figures. By manipulating the filter direction, analysts can uncover how specific product attributes drive sales performance, leading to more informed decision-making. Automating this process with RPA further streamlines information handling, reducing errors and freeing up resources for strategic initiatives. The benefit of RPA lies in its capacity to manage repetitive information entry tasks, ensuring accuracy and efficiency.
-
Customer Insights: Within a customer relationship management (CRM) framework, this tool facilitates a deeper understanding of customer behavior. By filtering customer information according to their purchase history, businesses can gain valuable insights into customer preferences and emerging trends. This, in turn, supports personalized marketing strategies that resonate with target audiences. As noted, “Synthetic information is to collected information what synthetic threads were to cotton – a game-changer in how we produce and utilize insights,” highlighting the transformative potential of analytical tools like RPA to enhance operational efficiency. RPA can automate the collection and analysis of customer information, providing timely insights that drive marketing effectiveness.
-
Financial Reporting: In the realm of financial analysis, DAX crossfilter can be instrumental in assessing the interplay between various financial metrics and overall performance. This capability allows for a nuanced approach to financial reporting, enabling organizations to identify key drivers of financial success and areas needing improvement. Utilizing RPA in this context can automate information collection and reporting processes, ensuring timely and precise insights. The specific advantage of RPA here is its ability to reduce the time spent on manual reconciliation, allowing finance teams to focus on strategic analysis.
These practical applications illustrate how this tool can transform information analysis, fostering dynamic and insightful reporting that empowers organizations to thrive in an analytics-driven landscape. As the demand for real-time insights increases, effectively utilizing the tool alongside RPA from Creatum GmbH will be essential for businesses striving to remain competitive in 2025 and beyond. Furthermore, with the anticipated surge of generative AI tools expected to reach new heights in 2025, the significance of this tool in the context of advancing analytical technologies cannot be overstated.
Regular security audits will also be crucial for ensuring the integrity of data used in these analyses, particularly in compliance with privacy laws like GDPR and HIPAA. Additionally, understanding customer sentiment and behavior is becoming increasingly vital, as illustrated by the case study titled “Behavioral Data Becomes The New Gold,” which emphasizes the importance of personalized experiences while addressing privacy and consent issues. It is also important to consider potential challenges when implementing RPA, such as the need for proper training and change management to ensure successful adoption.
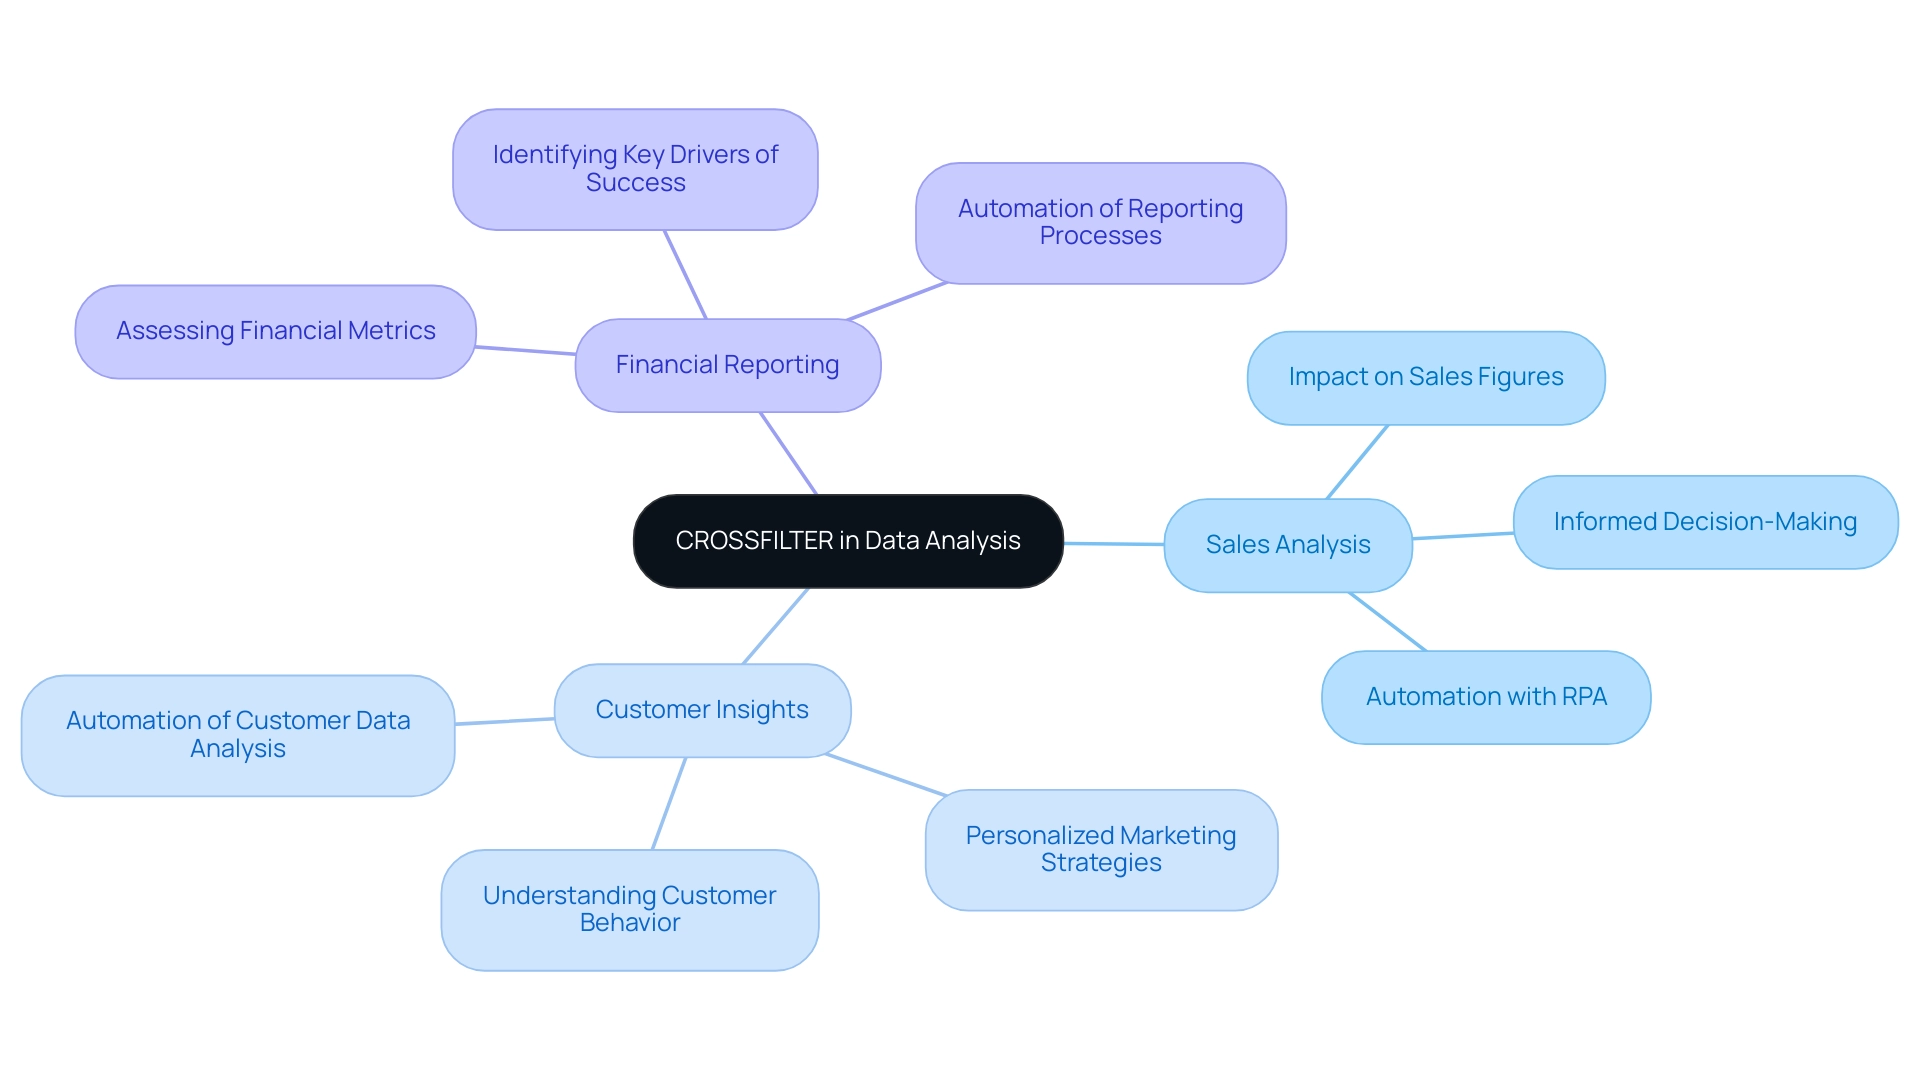
Performance Considerations: Optimizing CROSSFILTER Usage
When utilizing the filtering function in DAX, grasping its performance implications is essential, especially when dealing with large datasets. Here are several strategies to optimize its usage effectively:
-
Limit the Scope: Employ the DAX crossfilter judiciously. Overuse can lead to significant performance degradation, particularly in complex models. Aim to apply it only in scenarios where its benefits clearly outweigh the costs.
-
Monitor Relationships: Pay close attention to the relationships within your data model. The interaction of the filter function with many-to-many relationships can complicate calculations and adversely affect performance. Simplifying these relationships where possible can enhance efficiency.
-
Test Performance: Regular performance testing of your DAX calculations is essential. Utilize tools such as DAX Studio to analyze query performance and pinpoint bottlenecks. This proactive approach allows for timely adjustments that can significantly improve overall performance.
-
Leverage Performance Metrics: In 2025, understanding the performance metrics related to the filtering technique in large datasets is vital. Metrics such as query execution time and resource consumption can provide insights into how effectively the filtering mechanism is being utilized.
-
Incorporate AI Insights: Recent developments highlight that Power BI’s integration of AI enables analysts to perform sophisticated analyses, uncover deeper insights, and make better-informed decisions. This underscores the significance of AI in enhancing DAX functions, particularly DAX crossfilter, as 75% of content marketers are already utilizing generative AI tools for activities like brainstorming and proofreading, illustrating the growing trend of AI application in analysis.
-
Leverage RPA for Efficiency: Consider how Robotic Process Automation (RPA) can streamline the manual aspects of information preparation and reporting. By automating repetitive tasks, RPA not only reduces errors but also frees up your team to focus on strategic analysis, ultimately enhancing operational efficiency and driving data-driven insights.
-
Expert Advice: Praveen, a Digital Marketing Specialist with over three years of experience, emphasizes the importance of best practices in using the tool efficiently. His insights can guide users in applying these strategies effectively.
-
Real-World Examples: Consider case studies like DigitalOcean’s GPU Droplets, which illustrate how high-performance computing resources can facilitate the scaling of AI projects. By utilizing such resources, users can enhance their analysis tasks involving DAX operations like the DAX crossfilter function, ensuring optimal performance even in complex and resource-rich environments.
By adhering to these best practices and leveraging RPA, users can maintain the efficiency and effectiveness of the filter function, ensuring optimal performance even in complex and resource-rich environments while addressing the challenges posed by manual, repetitive tasks.
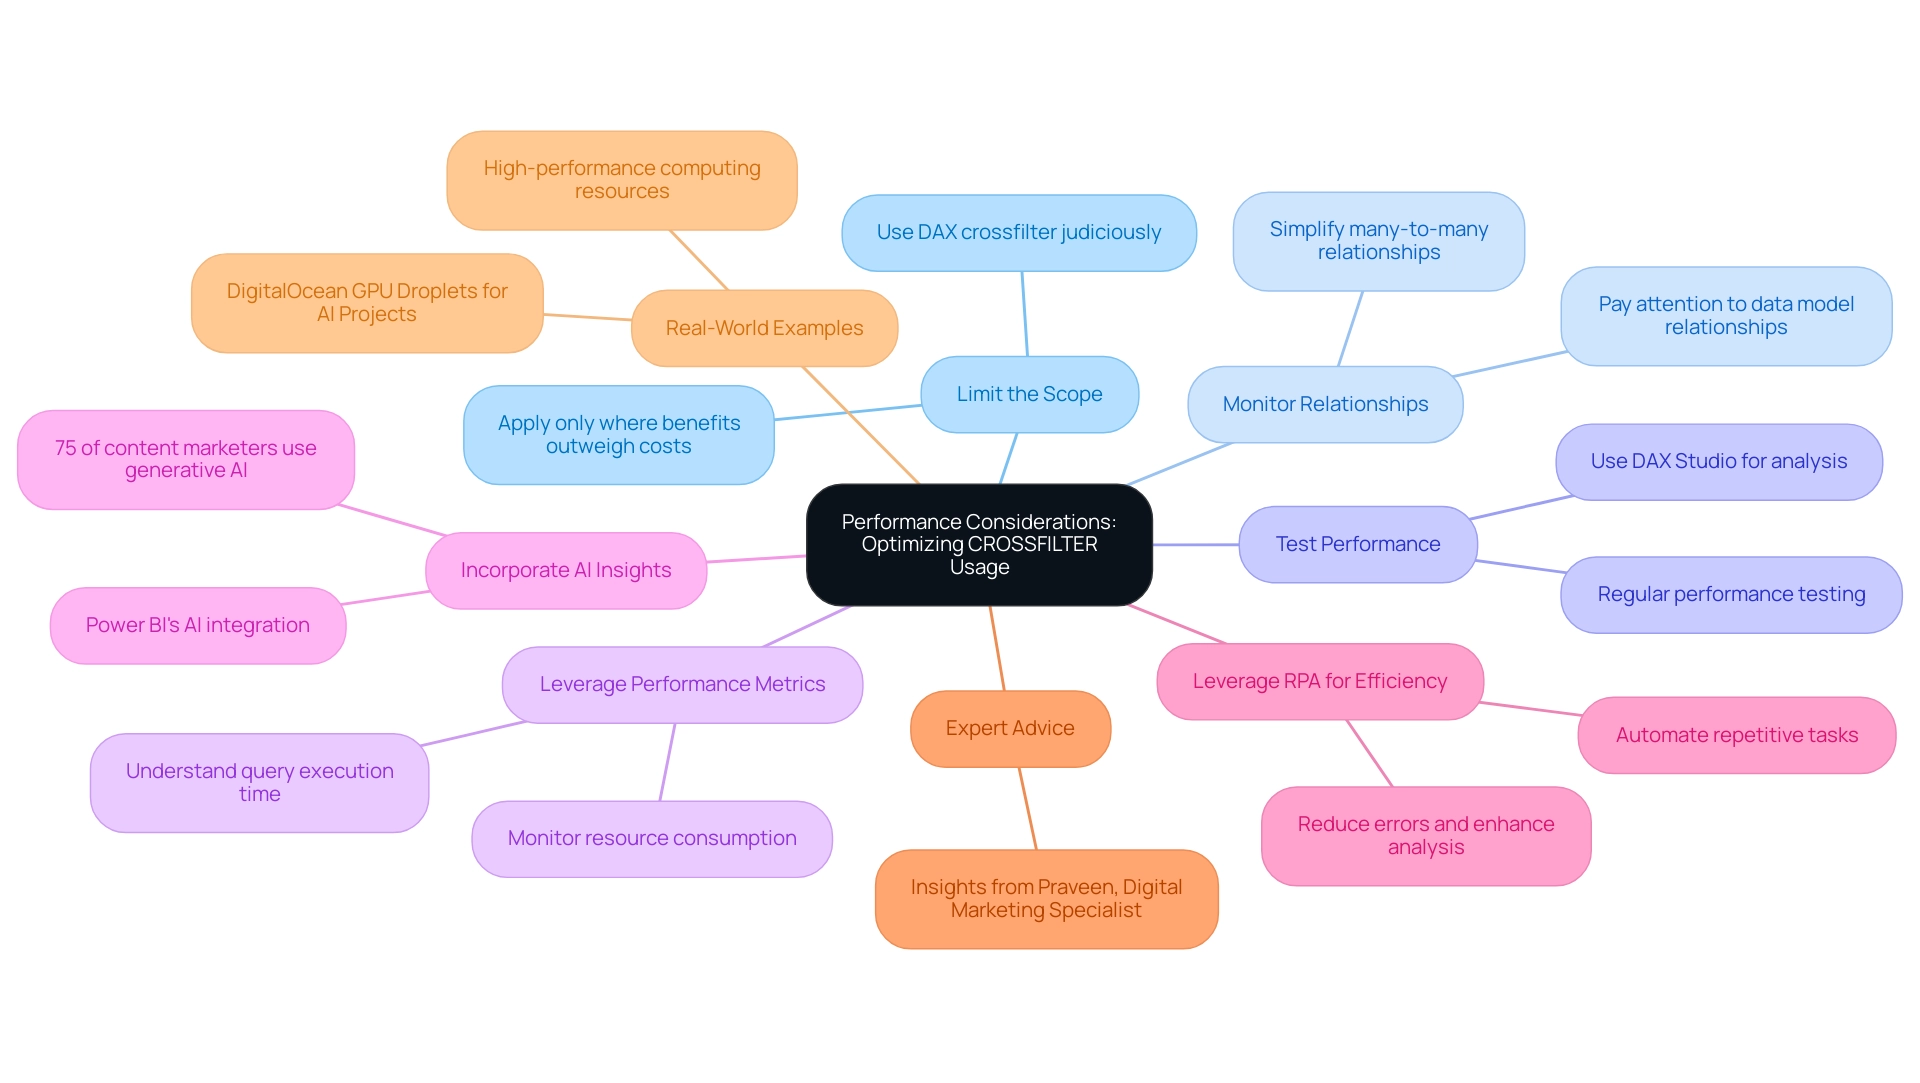
CROSSFILTER vs. Other DAX Functions: A Comparative Analysis
In Power BI, effective analysis hinges on the strategic application of DAX formulas for filtering, particularly FILTER and CALCULATE. A comprehensive understanding of these functions is essential for enhancing insights, especially in a landscape where Business Intelligence (BI) and Robotic Process Automation (RPA) are crucial for driving operational effectiveness and informed decision-making.
-
FILTER: The FILTER function empowers users to establish specific criteria for a table, allowing for precise information retrieval. This function is designed to adjust the filter direction between two columns within a relationship, a distinction that is vital. Employ the filtering method to control how filters operate through relationships, thereby enriching the detail of your analysis and addressing challenges such as information inconsistencies.
-
FILTER vs. CALCULATE: The CALCULATE function modifies the context in which information is evaluated, rendering it a powerful tool for complex calculations. In contrast, the data filtering tool is focused on altering the filter direction. For intricate filtering scenarios, integrating CALCULATE with DAX CROSSFILTER can yield more nuanced results, facilitating deeper insights into your data and transforming raw information into actionable insights.
As of 2025, comparative usage statistics indicate that organizations are increasingly harnessing these DAX functions to bolster their analytical capabilities. For example, loading 20 million fact rows from CSV files versus a Fabric lakehouse using Power Query illustrates significant efficiency gains achievable through effective information analysis. A recent case study titled ‘Business Intelligence Empowerment’ highlighted how businesses, strengthened by robust BI frameworks, transformed raw data into actionable insights, propelling growth and innovation.
Paul Turley, a Microsoft Data Platform MVP, underscores that while the term ‘architecture’ is frequently employed in data engineering, it equally pertains to BI and analytic reporting projects of all sizes. Understanding these distinctions not only aids in selecting the appropriate role for specific analytical needs but also aligns with the overarching goal of maximizing operational efficiency and strategic decision-making in a data-rich environment.
Moreover, with SQLBI developing new resources for 2025, including forthcoming free tools, the landscape of DAX capabilities and their applications in Power BI continues to evolve. It is imperative for professionals to stay informed and adapt their strategies accordingly.
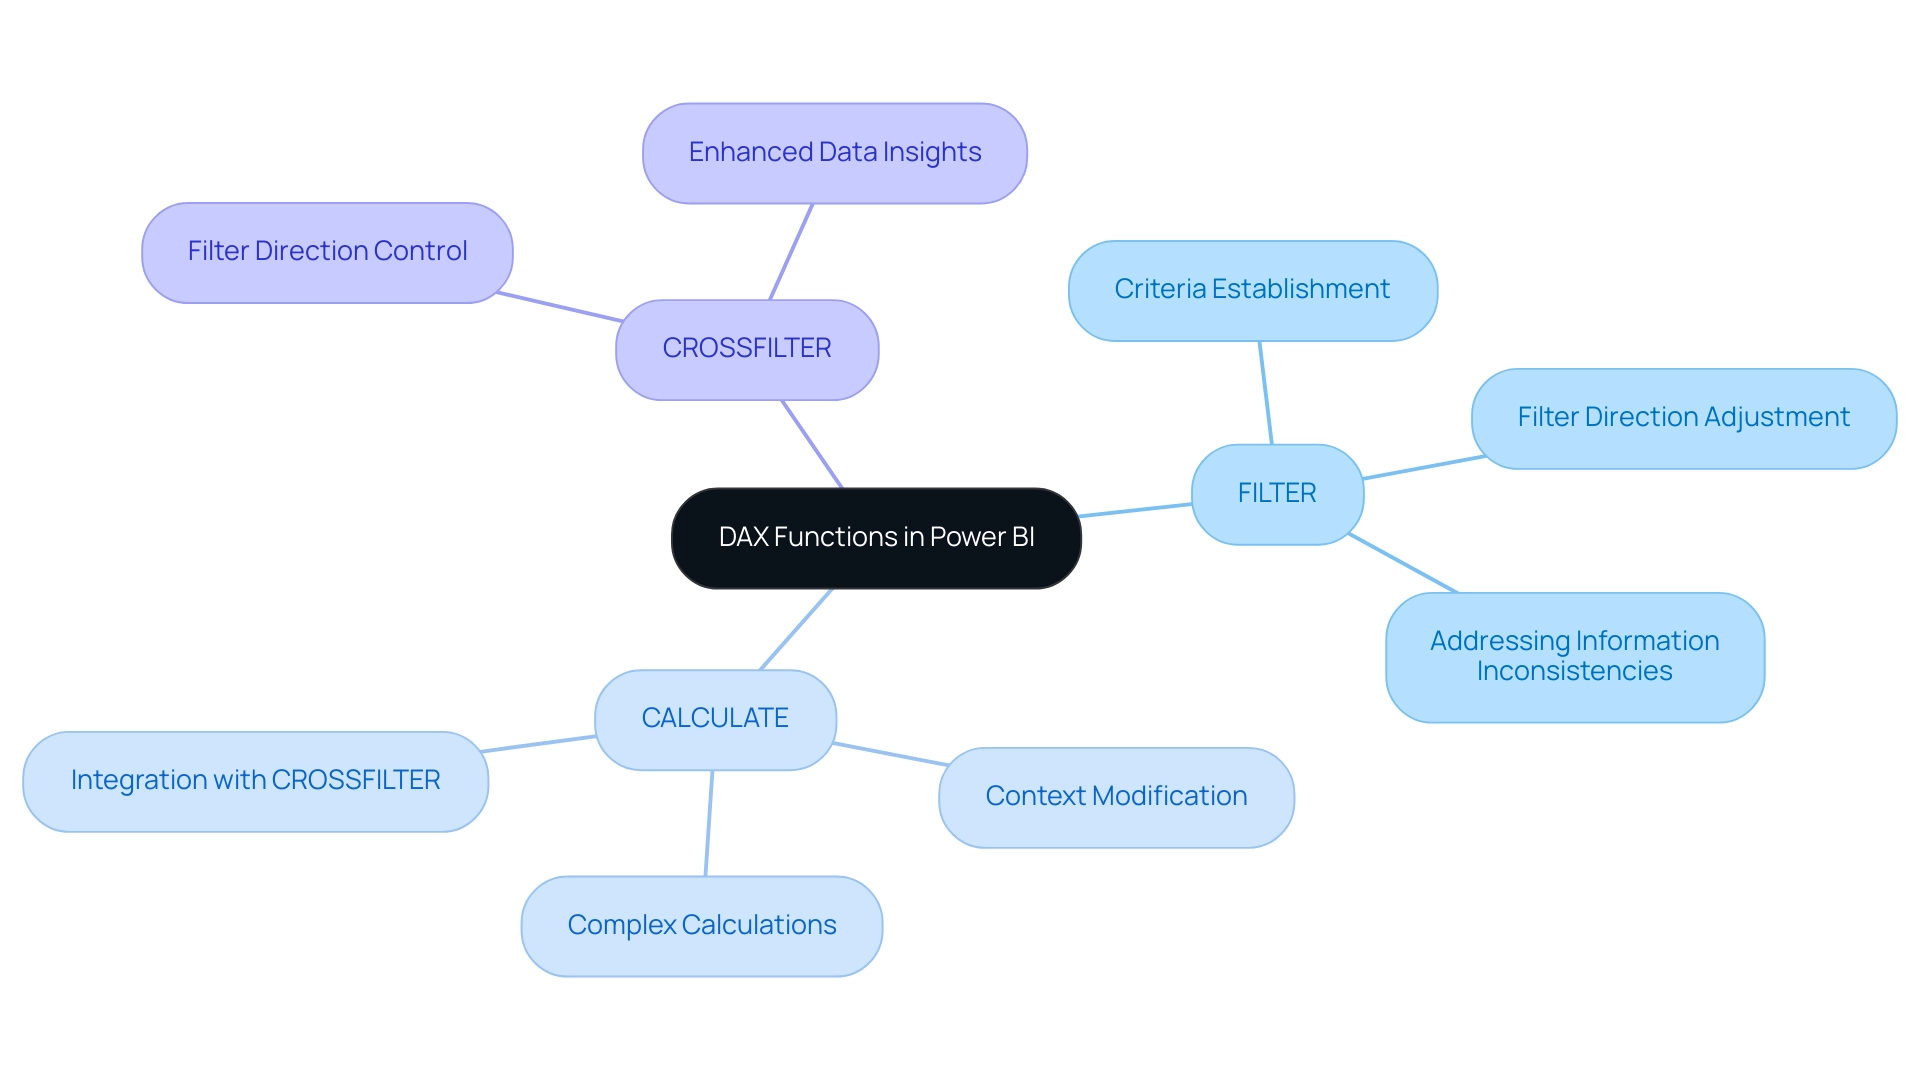
Troubleshooting Common Issues with CROSSFILTER
When utilizing the filtering technique in DAX, individuals may encounter various common challenges that can hinder both performance and precision. Here are some effective troubleshooting strategies:
-
Check Relationship Status: Confirm that the relationship between the columns involved is active. The DAX CROSSFILTER capability functions exclusively with active relationships, making it essential to maintain this status for precise outcomes.
-
Verify Syntax: Carefully review the syntax of your CROSSFILTER formula. Ensuring that both the column names and the filter direction are correctly specified is crucial to avoid errors that could lead to unexpected results.
-
Test with Sample Data: If the results do not align with expectations, consider testing the function using a smaller dataset. This method allows for isolating the issue, helping to determine whether the problem originates from the data itself or the DAX expression being utilized.
-
Monitor Performance Metrics: In scenarios involving large datasets, such as a model with approximately 40 million rows in the fact table, performance can be significantly impacted. For instance, a case study demonstrated that optimizing the calculation of active customers based on sales over the last 12 months required careful consideration of how filters were applied. Initially, the measure was slow due to the need to iterate through the entire customer table. However, implementing a variable to pre-filter improved performance. It was crucial to ensure that all relevant customers were included in the calculations, particularly when filtering for specific months. This underscores the importance of preserving quality information, as dimension tables should possess unique keys, descriptive attributes, hierarchies, and consistent granularity with fact tables. Such attention to detail is essential for leveraging Business Intelligence effectively, ensuring that insights derived from Power BI dashboards are actionable and drive operational efficiency.
-
Utilize Auto-Refresh Features: To ensure that your information is always up-to-date while troubleshooting the CROSSFILTER function, consider setting up auto-refresh in Power BI. This can be configured through the Power BI Service by adjusting the refresh schedule in dataset settings, allowing for more efficient information management.
As Leila Gharani aptly stated, “With Power Query, you can quickly transform chaotic information into intelligent decisions – fast!” By following these troubleshooting steps, users can effectively address common issues related to the DAX CROSSFILTER functionality, thereby enhancing their proficiency and ensuring more precise analysis in Power BI. This approach not only improves individual performance but also contributes to overall business growth by enabling informed decision-making.
Furthermore, Creatum GmbH’s RPA solutions can aid in automating some of these troubleshooting procedures, further improving operational efficiency and addressing challenges such as labor-intensive report creation and inconsistencies.
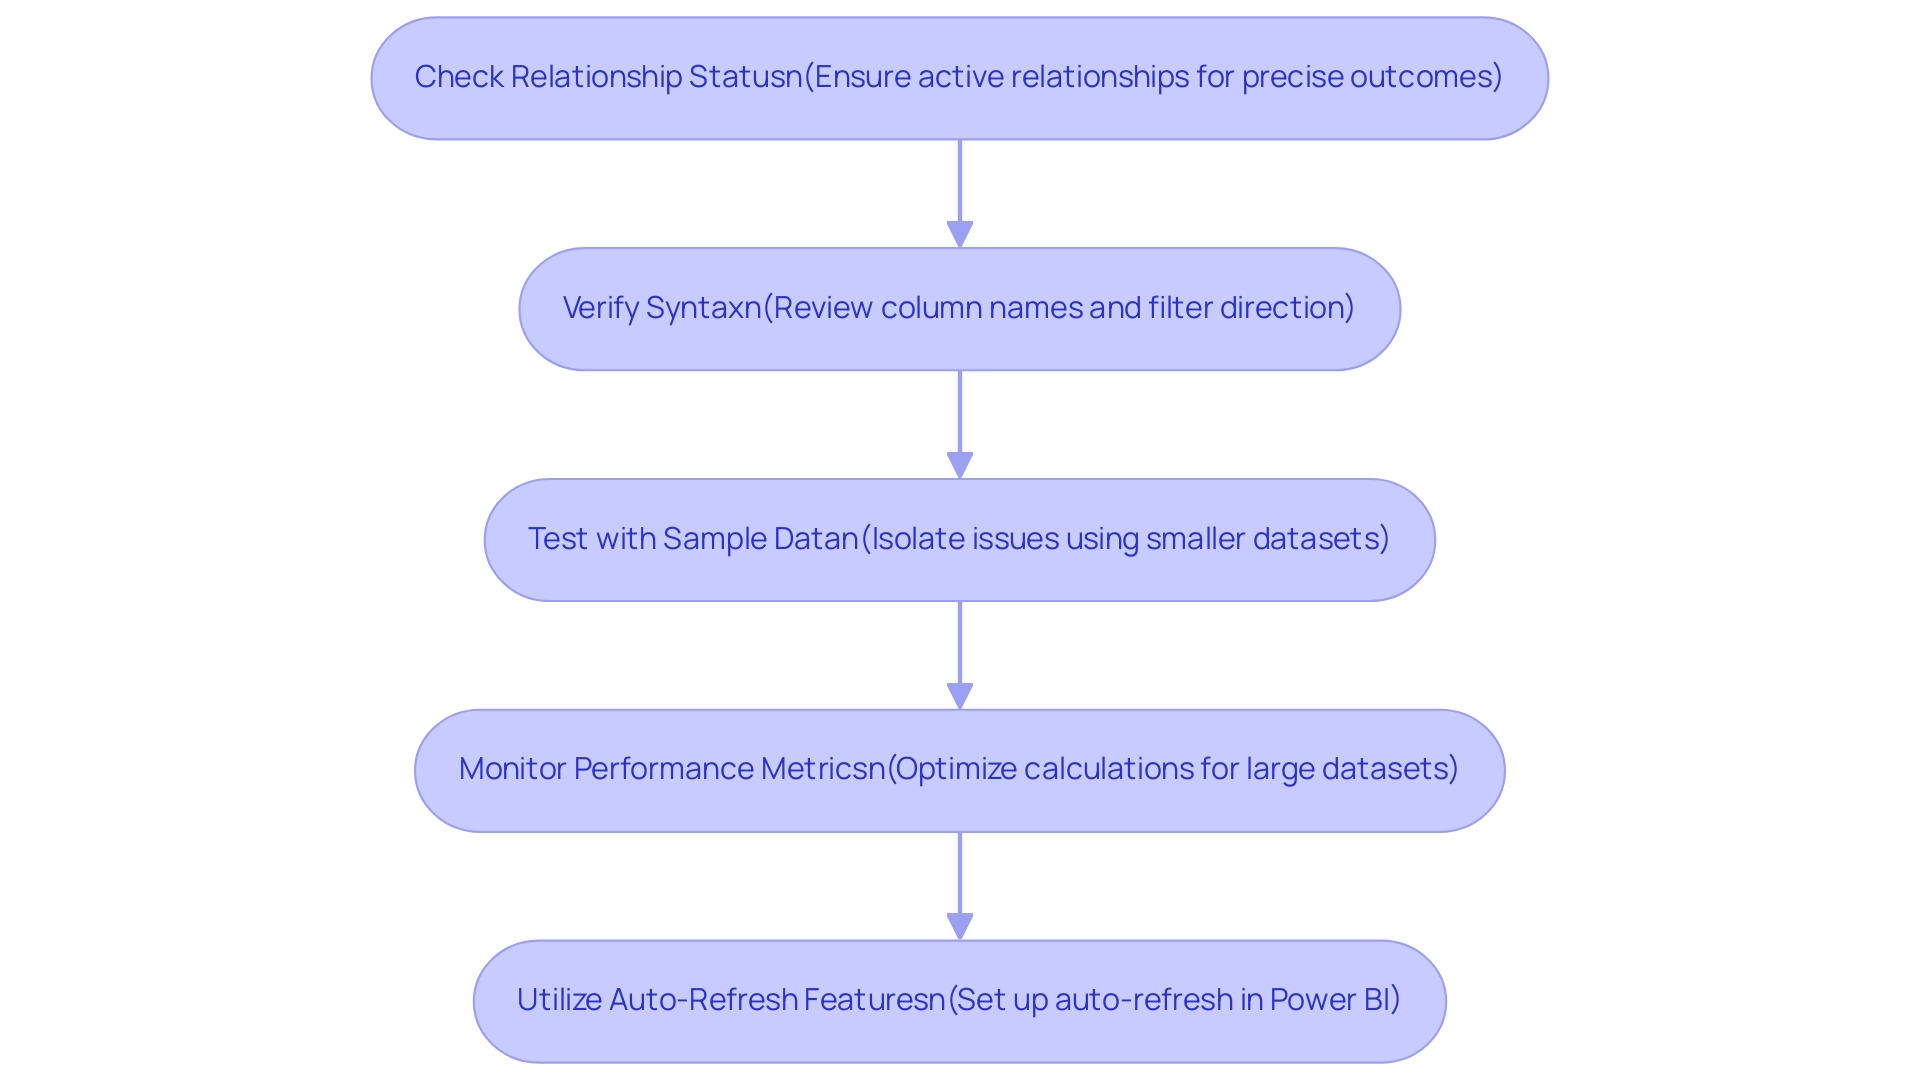
Best Practices for Mastering CROSSFILTER in Power BI
To effectively master the CROSSFILTER function in Power BI, implementing the following best practices is essential:
-
Understand Your Information Model: Gain a comprehensive understanding of the relationships within your information model. Understanding how tables interconnect is crucial for using DAX CROSSFILTER efficiently, enabling more precise information manipulation and analysis.
-
Use Sparingly: Employ the filtering function judiciously to prevent performance degradation. Excessive use can complicate DAX calculations and lead to slower report performance, hindering user experience and decision-making processes. Remember, a maximum of 99,999 rows are returned per query, underscoring the importance of efficient information management when utilizing the filtering technique.
-
Enhance with Other Functions: Amplify the power of DAX CROSSFILTER by combining it with other functions such as CALCULATE and FILTER. This combination facilitates the creation of more sophisticated and adaptable calculations, allowing for deeper insights and nuanced analysis.
-
Regularly Review Performance: Continuously assess the performance of your DAX calculations. Utilize tools like DAX Studio to analyze query performance and identify areas for optimization. Regular performance evaluations are vital for maintaining efficient information processing and ensuring that your reports remain responsive and informative.
-
Leverage Customization Capabilities: Take advantage of Power BI’s customization features to create tailored visual representations that enhance your use of filtering. Custom visuals can improve the clarity and impact of your analysis, making it easier to communicate insights effectively.
By adhering to these best practices, users can significantly enhance their proficiency with the DAX CROSSFILTER feature, leading to improved analytical capabilities in Power BI. This mastery streamlines workflows and empowers organizations to transform raw data into actionable insights, as illustrated in the case study titled “Business Intelligence Empowerment,” which highlights how organizations successfully extracted meaningful insights from vast amounts of data. Furthermore, the integration of Robotic Process Automation (RPA) from Creatum GmbH can automate repetitive tasks, improving efficiency, reducing errors, and allowing teams to focus on strategic decision-making.
Additionally, tailored AI solutions can complement the use of DAX functions, enhancing overall business productivity. As Paul Turley, a Microsoft Data Platform MVP, emphasizes, the concept of architecture is crucial in BI and analytic reporting projects of all sizes. This understanding facilitates informed decision-making and drives operational efficiency, ultimately enhancing business productivity.
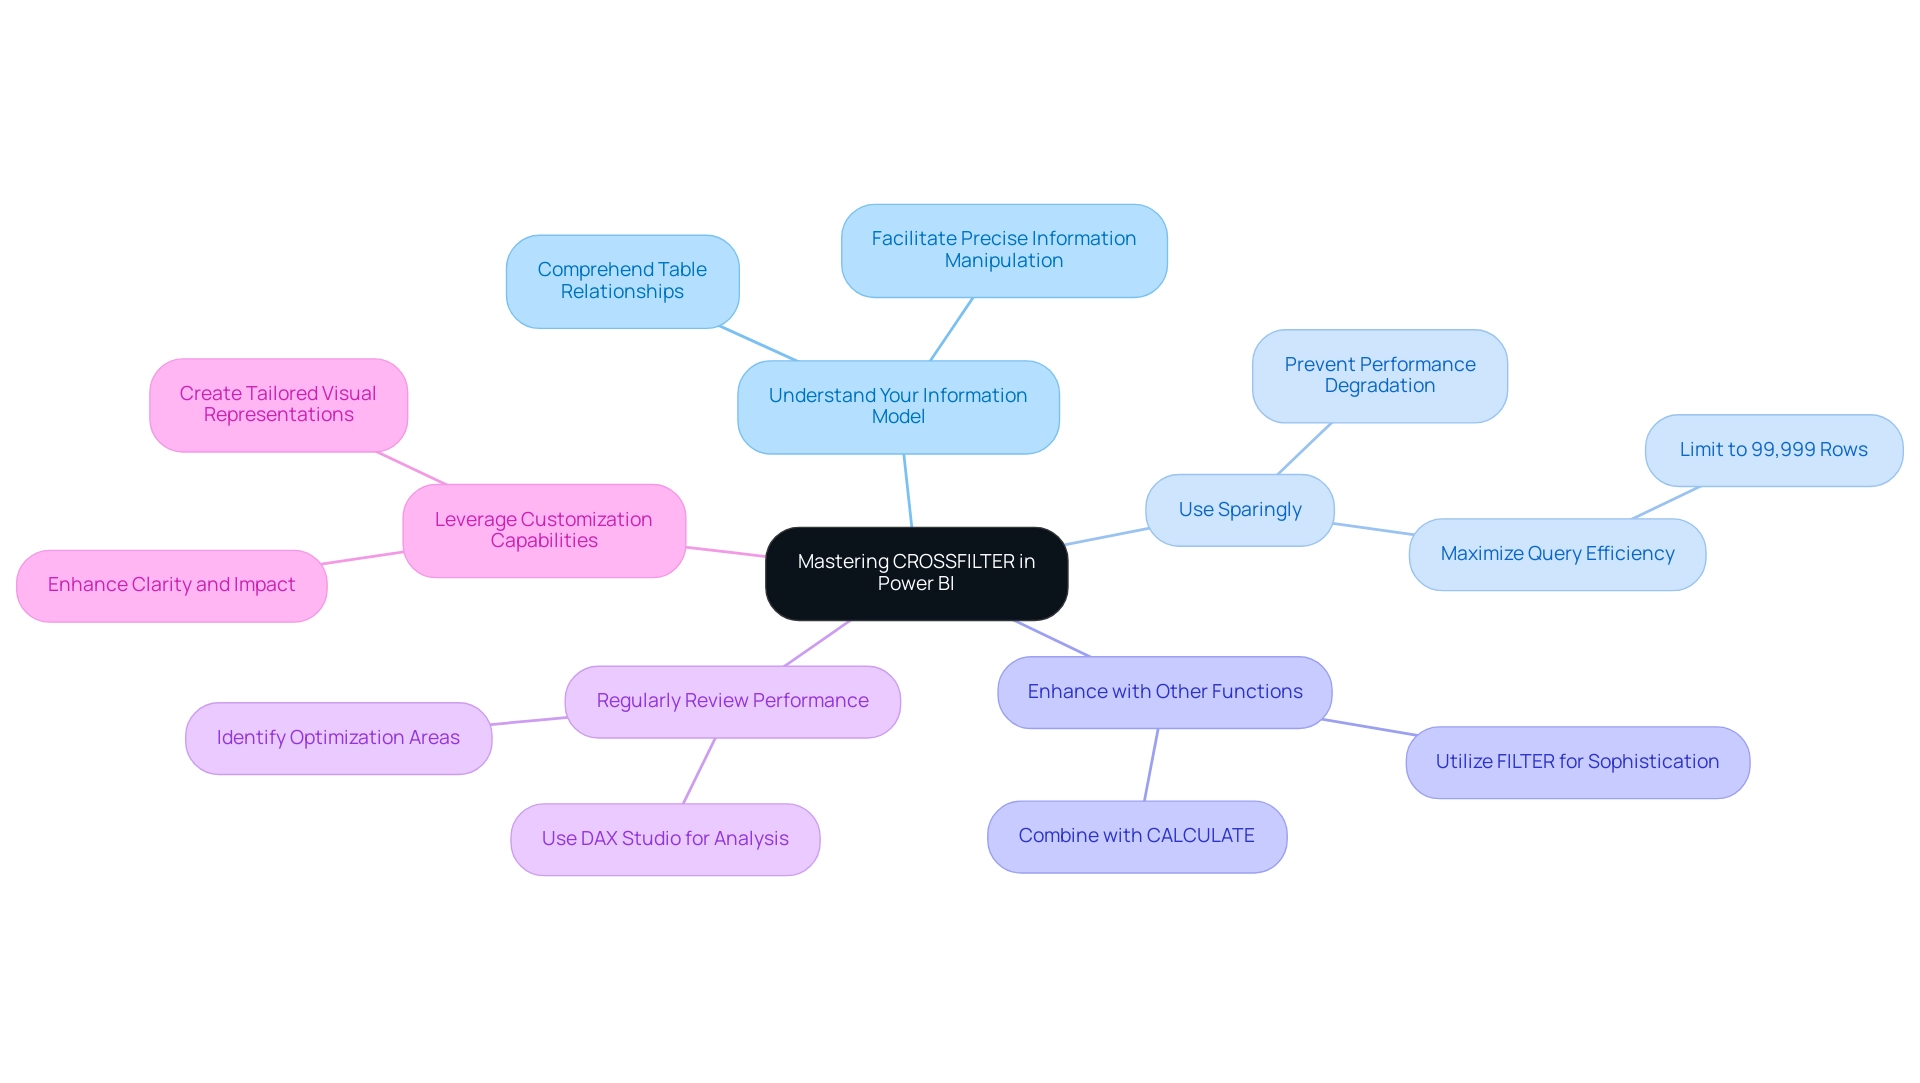
Conclusion
Mastering DAX and its functions, particularly CROSSFILTER, is essential for anyone aspiring to excel in data analysis using Power BI. This article underscores DAX as a foundational tool, empowering users to perform complex calculations and extract actionable insights from their data. In an era where data-driven decision-making is paramount, the ability to understand and effectively utilize DAX functions has never been more critical.
CROSSFILTER emerges as a versatile function, enabling analysts to control the direction of filters between related columns, thereby enhancing the granularity and accuracy of data insights. Its practical applications in sales analysis, customer insights, and financial reporting exemplify its transformative potential, especially when integrated with Robotic Process Automation (RPA). By automating workflows, organizations can liberate valuable resources, allowing teams to concentrate on strategic initiatives rather than mundane tasks.
As the landscape of data analysis evolves, professionals must remain vigilant about best practices and performance considerations when utilizing CROSSFILTER. Strategies such as judicious use, regular performance reviews, and leveraging the capabilities of other DAX functions can significantly boost analytical efficiency. By committing to mastering these tools, users position themselves to adeptly navigate the complexities of data analysis and drive meaningful outcomes for their organizations.
In conclusion, integrating DAX functions like CROSSFILTER into data analysis workflows not only empowers individuals but also enables organizations to thrive in an increasingly data-centric world. Embracing these practices will be crucial for professionals aiming to stay competitive and deliver valuable insights in 2025 and beyond.
Frequently Asked Questions
What is DAX and where is it used?
DAX, or Data Analysis Expressions, is a formula language used in Power BI, Excel, and SQL Server Analysis Services that allows users to perform custom calculations and aggregations on data models.
Why is mastering DAX crossfilter important?
Mastering DAX crossfilter is crucial for effectively utilizing Power BI, as it underpins the calculations that drive reports and dashboards, enabling users to unlock the full potential of their data.
What challenges do users face when learning DAX?
Users often encounter a steep learning curve with DAX, which can serve as a barrier to entry. Low engagement with comprehensive DAX courses indicates that while challenging, persistence in learning can lead to significant career differentiation.
How does DAX contribute to better decision-making in organizations?
Organizations that implement DAX report enhanced reporting capabilities and improved decision-making processes, addressing issues of confusion and mistrust stemming from inconsistent reporting.
What resources are available for learning DAX?
Numerous free resources are available online, including community forums and official documentation, to assist users in overcoming learning challenges and encourage deeper engagement with DAX.
What is the DAX crossfilter function and its significance?
The DAX crossfilter function defines the cross-filtering direction for calculations between two columns, allowing users to control the flow of filters and improve analysis efficiency, particularly when default filter directions do not yield desired results.
How does the DAX crossfilter function enhance reporting processes?
By integrating Power BI with tools like Roll stack and SQL, the DAX crossfilter function can optimize reporting processes, leading to more informed decision-making.
What is the role of filter direction in DAX?
The ability to modify filter direction between two columns within a relationship allows for more dynamic and adaptable analysis, accommodating both one-way and bidirectional filtering.
What future trends are anticipated regarding DAX and its features?
The significance of DAX and its filtering techniques is expected to grow, with continuous updates from Microsoft to enhance usability based on user feedback, ensuring access to the latest features and best practices.
How can mastering DAX crossfilter impact career success?
Proficiency in DAX crossfilter not only enhances reporting effectiveness but also positions individuals for greater success in their careers, making it a valuable asset in the data-driven job market.
Overview
Maximizing operational efficiency in Azure Synapse Pipelines is crucial for organizations seeking to enhance their productivity. Implementing best practices such as:
- Automation through Robotic Process Automation (RPA)
- Optimizing resource management
- Leveraging advanced features for data integration
are essential strategies. These approaches not only lead to reduced errors but also significantly improve processing speeds and decision-making capabilities. Ultimately, these enhancements drive productivity and growth within organizations.
Consider how these strategies can transform your operations. By adopting automation and optimizing resource management, you can streamline processes and reduce the likelihood of errors. The advanced features of Azure Synapse Pipelines provide powerful tools for data integration, enabling smarter decision-making.
In conclusion, embracing these best practices is not just beneficial; it is imperative for organizations aiming to thrive in today’s competitive landscape. Take action now to leverage these strategies and propel your organization toward greater efficiency and success.
Introduction
In the quest for operational excellence, organizations are increasingly turning to Azure Synapse Pipelines—an advanced tool engineered to optimize data integration and analytics processes. By minimizing resource wastage and enhancing productivity through automation, businesses can streamline workflows and achieve quicker insights.
Furthermore, the integration of Robotic Process Automation (RPA) amplifies these benefits, enabling companies to automate repetitive tasks, reduce errors, and redirect human resources toward strategic initiatives.
This article delves into the intricacies of maximizing operational efficiency within Azure Synapse, exploring:
- Common challenges
- Best practices
- Real-world success stories that illustrate the transformative potential of this platform in a data-driven landscape.
Understanding Operational Efficiency in Azure Synapse Pipelines
Operational effectiveness in synapse pipelines hinges on the ability to execute integration and analytics processes while minimizing resource and time waste. This effectiveness emerges from the strategic application of tools and methodologies, which are designed to streamline workflows, reduce manual interventions, and enhance overall productivity. By leveraging Azure Synapse alongside Robotic Process Automation (RPA) solutions like EMMA RPA and Microsoft Power Automate, organizations can automate critical tasks, including data ingestion, transformation, and analysis. The result? Quicker insights and more informed decision-making.
Key metrics for evaluating performance encompass processing speed, resource utilization, and error rates. These metrics are essential, as they collectively contribute to a robust functional framework. For instance, manufacturing firms have effectively utilized Synapse to improve supply chain visibility and streamline production processes, demonstrating the platform’s capacity to foster effectiveness.
Recent statistics reveal that these firms have experienced substantial enhancements in their work processes since implementing Synapse, particularly through the integration of RPA. This not only boosts productivity but also elevates employee morale by alleviating the burden of repetitive tasks.
Moreover, recent updates to the Synapse Machine Learning library simplify the creation of scalable machine learning pipelines, empowering organizations to maximize performance in data integration processes. The introduction of the Mssparkutils runtime context for Python and Scala enhances Synapse’s versatility, enabling teams to streamline workflows effectively.
As Devendra Goyal emphasizes, ‘Microsoft Fabric for Data Science: Advanced ML Model capabilities are vital for organizations aiming to improve their performance.’ This insight underscores the importance of leveraging advanced features within Synapse, alongside customized AI solutions, to achieve optimal results.
Real-world examples illustrate the transformative impact of Synapse on operational efficiency. Organizations adopting Synapse Analytics Services are not only staying ahead in data analytics but are also reaping the benefits of a unified platform that fosters growth and innovation. As highlighted in the case study titled ‘Future of Synapse Analytics Services,’ the outlook is promising, with continuous improvements expected as Microsoft invests in enhancing its capabilities.
In summary, boosting productivity in synapse pipelines is crucial for organizations striving to excel in a data-driven environment. By focusing on automation through RPA, efficient resource management, and the utilization of advanced features, businesses can achieve significant enhancements in their information integration and analytics processes.
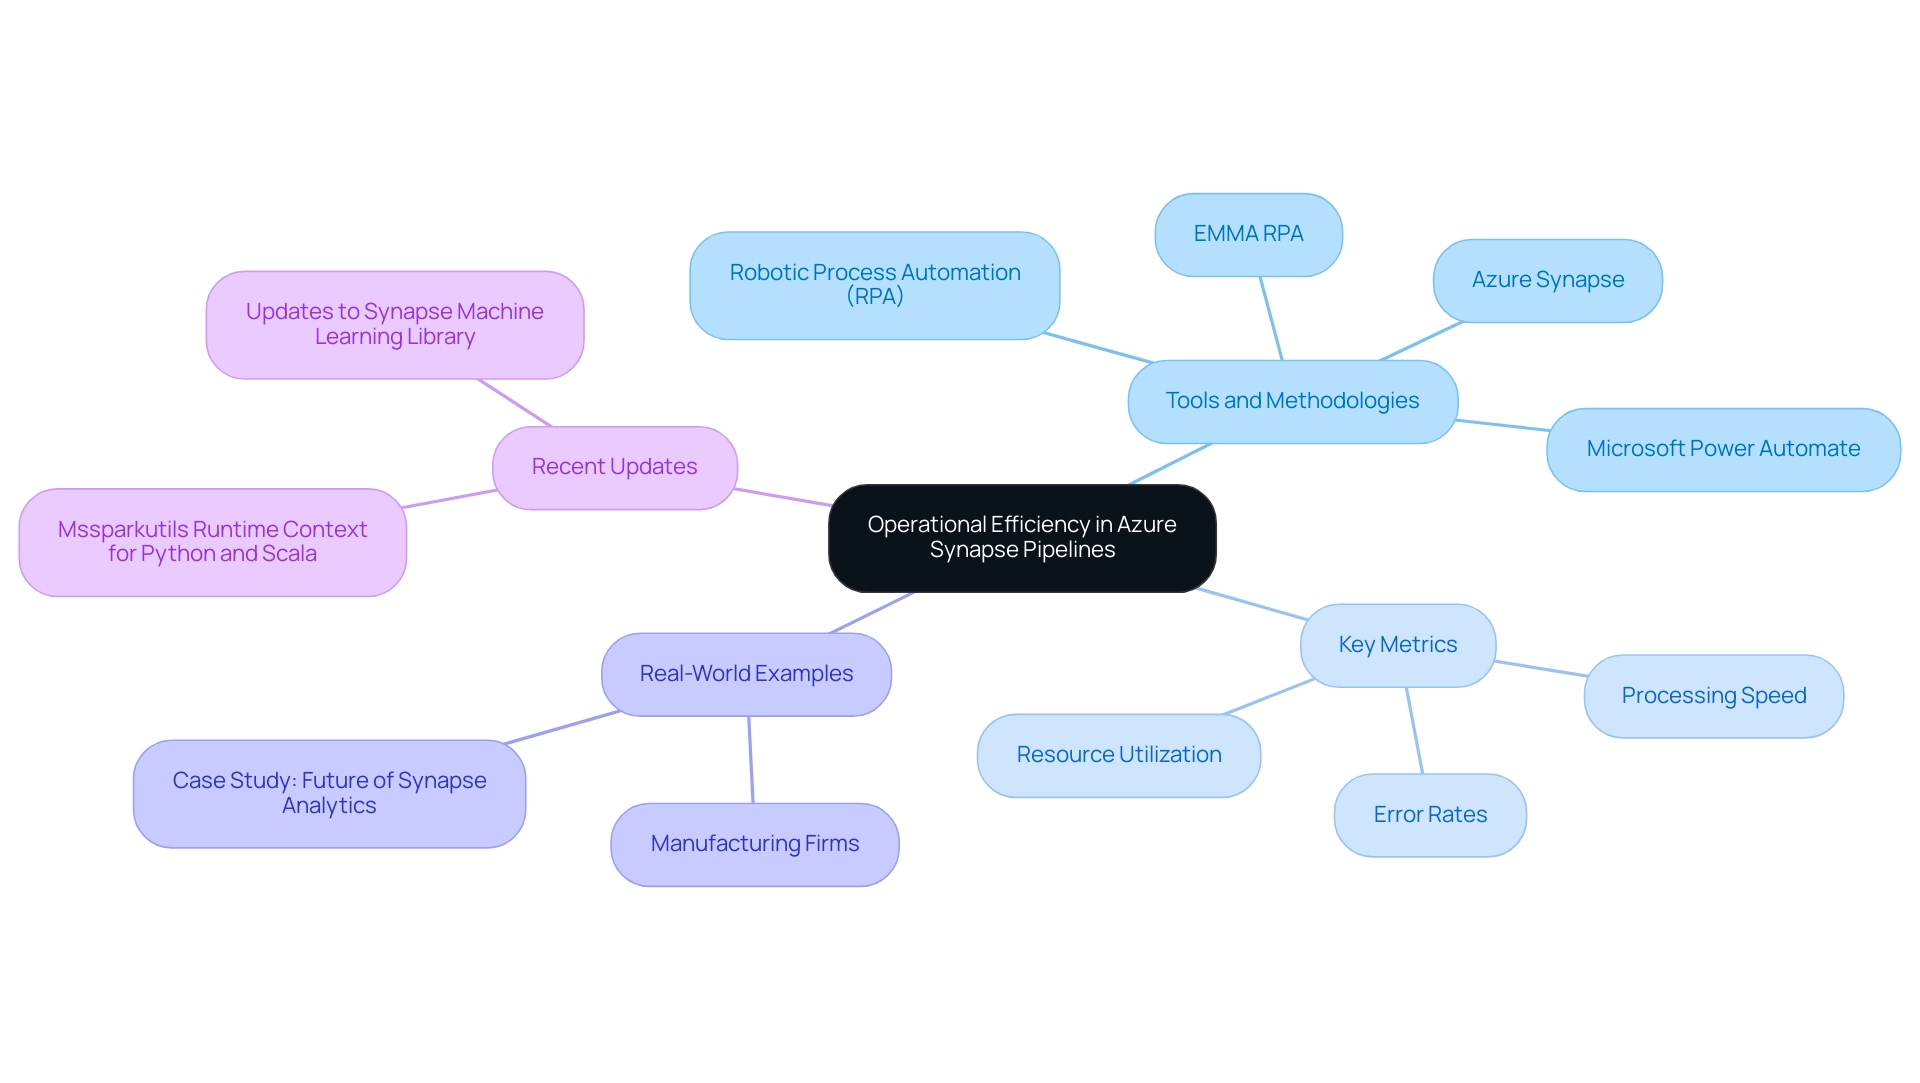
Identifying Common Challenges in Achieving Efficiency
Organizations frequently grapple with numerous challenges when striving for operational efficiency in synapse pipelines. A significant hurdle is manual information entry, which is not only time-consuming but also highly susceptible to errors. Studies indicate that mistakes in manual information entry can account for up to 30% of inaccuracies in organizations. This inefficiency is compounded by employee resistance to adopting new technologies, often stemming from a lack of familiarity and comfort with innovative tools.
Inadequate training further exacerbates these issues, as employees may struggle to leverage the full potential of Azure Synapse without proper guidance. Furthermore, information silos present a formidable barrier, preventing seamless sharing across departments and stifling collaboration. The complexity of integrating diverse information sources into a cohesive system adds another layer of difficulty, making it challenging for organizations to achieve a unified view of their information landscape.
Recognizing these challenges is crucial for developing effective strategies to overcome them. For instance, fostering a culture of transparency regarding information can significantly enhance collaboration and trust, enabling teams to access and utilize insights more effectively. This approach is essential for effective observability, as it fosters collaboration and trust through accessible insights.
Moreover, the adoption of Robotic Process Automation (RPA) can streamline manual workflows, significantly reducing errors and freeing up employees for more strategic tasks. By automating repetitive processes, organizations can enhance operational effectiveness and drive data-driven insights critical for business growth. A case study on a mid-sized company demonstrates this: by implementing GUI automation, they reduced entry errors by 70%, accelerated testing processes by 50%, and enhanced workflow productivity by 80%, achieving ROI within six months.
Furthermore, customized AI solutions can assist organizations in navigating the rapidly evolving AI landscape, ensuring they identify the appropriate technologies that align with their specific business requirements. The adoption of Business Intelligence is equally important, as it transforms raw information into actionable insights, enabling informed decision-making that drives growth and innovation.
Additionally, the adoption of versioning—a practice projected to be embraced by 60% of organizations by 2027—can facilitate better tracking of lineage and enable error rollbacks, thereby improving overall management practices. This emphasizes the significance of mastering tools and techniques for effective version control in data environments.
Fivetran’s Hybrid Deployment enables organizations to select whether their pipelines are processed within Fivetran’s secure network or their own environment, offering a practical example of how businesses can secure their data pipelines while enhancing productivity. By tackling these typical challenges, organizations can improve their productivity and fully utilize the features of synapse pipelines. As noted by the International Energy Agency, effective energy management is crucial, as natural gas provides dispatchable energy that can balance intermittent renewable sources like wind and solar.
Creatum GmbH is dedicated to assisting organizations in overcoming these challenges and attaining excellence in their operations.
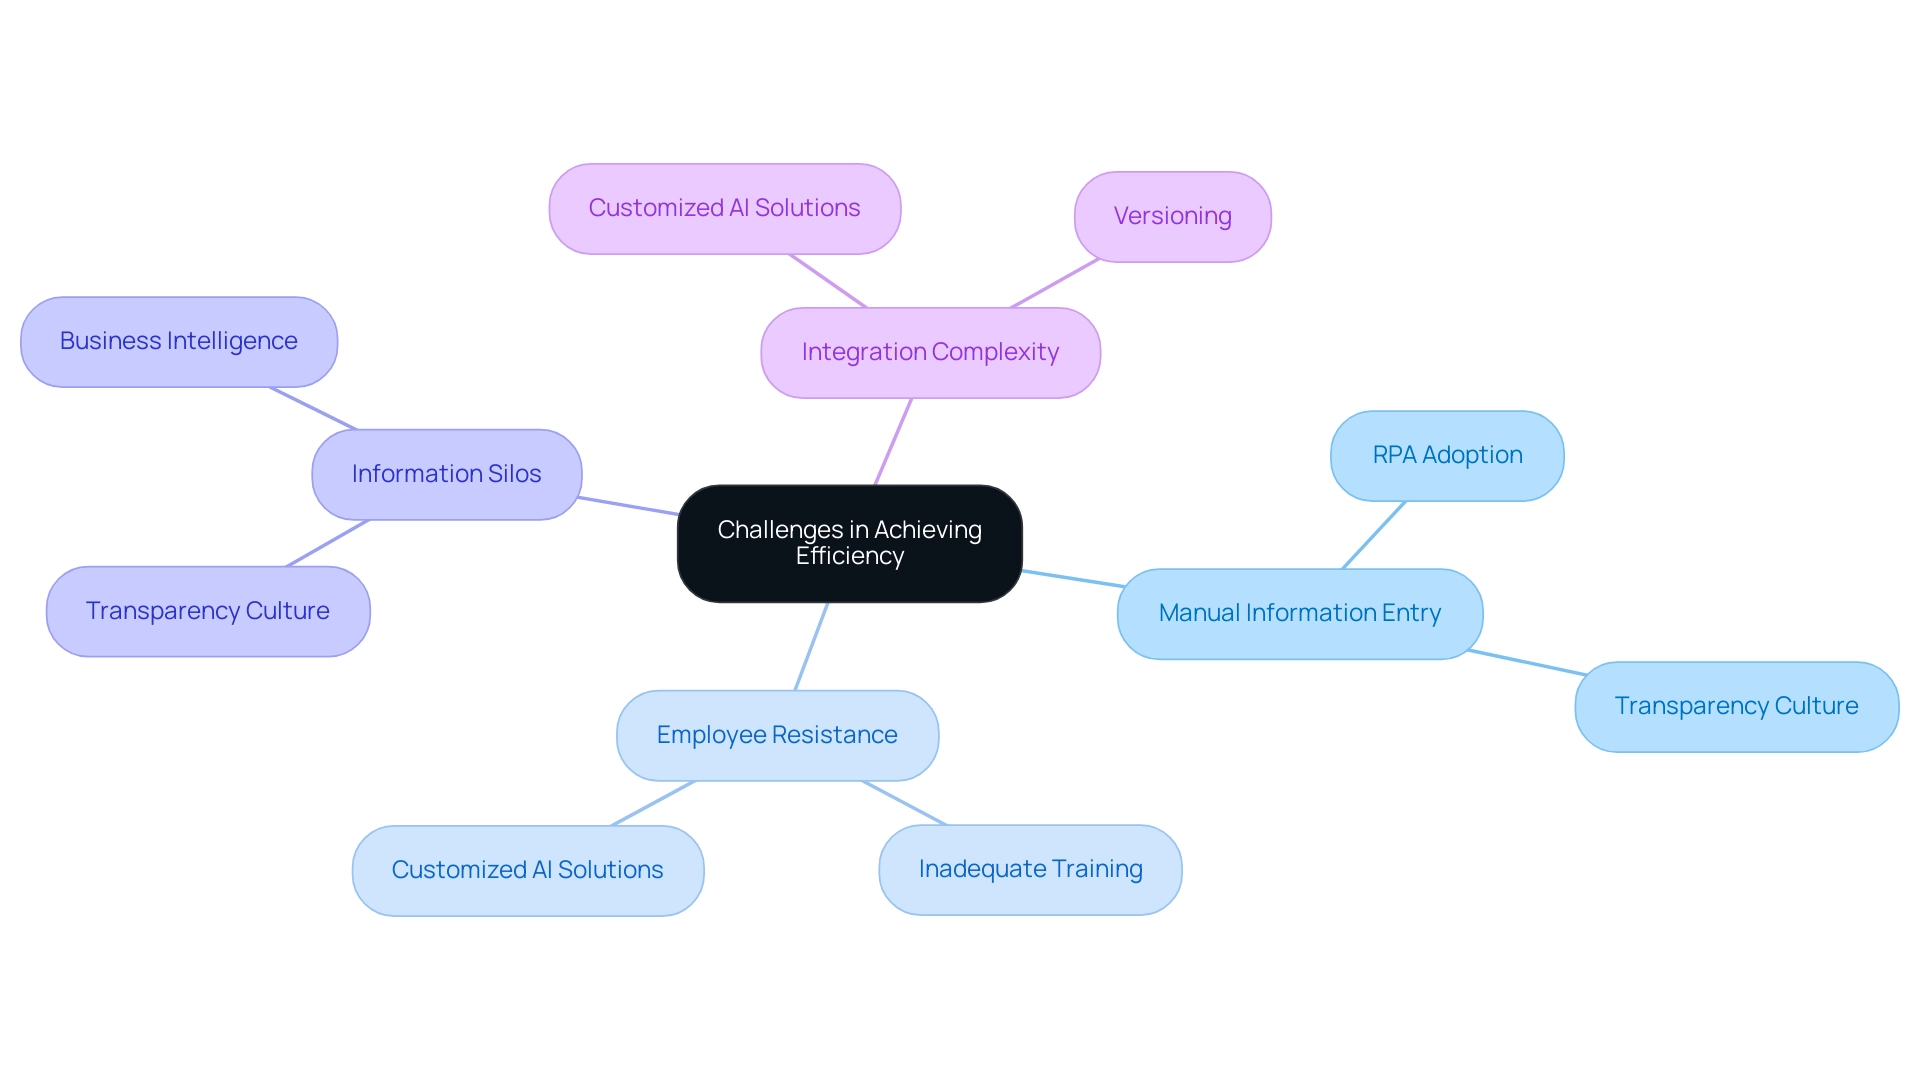
Leveraging Azure Synapse Pipelines for Enhanced Efficiency
Synapse pipelines in Azure present a robust framework for automating workflows, significantly enhancing operational efficiency. One of the standout features is the orchestration of complex information integration tasks, streamlining ETL processes and enabling real-time performance monitoring. By leveraging built-in connectors, organizations can effortlessly integrate diverse information sources, minimizing the time and effort required for manual handling.
The platform’s support for parallel processing is particularly noteworthy, allowing multiple tasks to execute simultaneously. This capability accelerates processing times and optimizes resource utilization, crucial for effective cost management. Organizations that have implemented these strategies report improved performance while maintaining budgetary control, showcasing the dual benefits of efficiency and cost management.
Furthermore, the automation of information workflows utilizing Synapse has been linked to considerable enhancements in operational excellence. As highlighted by industry experts, adopting automated workflows is essential for thriving in data-driven environments. A recent case study demonstrated how a company successfully scaled its operations and managed costs through dynamic resource scaling and effective use of cost management tools within Azure Synapse.
These strategies included optimizing resource allocation based on workload demands, allowing for better financial oversight. In 2025, statistics indicate that organizations utilizing automation in their workflows have experienced a marked increase in efficiency, with many reporting reduced error rates and improved accuracy. Notably, the SELECT statement will trigger automatic creation of statistics in serverless SQL pools, further enhancing management capabilities. The platform’s tools for information cleansing and standardization ensure that the content being processed is both accurate and consistent, supporting both ETL and ELT processing paradigms.
By implementing Synapse pipelines, businesses can create a more agile and responsive information environment, ultimately driving growth and innovation while allowing teams to focus on strategic, value-adding activities. Utilizing AI via Small Language Models and engaging in GenAI Workshops can further improve information quality and efficiency. As Sangeet Vashishtha aptly stated, “The findings suggest that adopting automated workflows is a vital step toward operational excellence in data-driven environments.”
Additionally, using DBCC SHOW_STATISTICS provides summary and detailed information about the distribution of values in a statistics object, offering further insights into information management within Synapse.
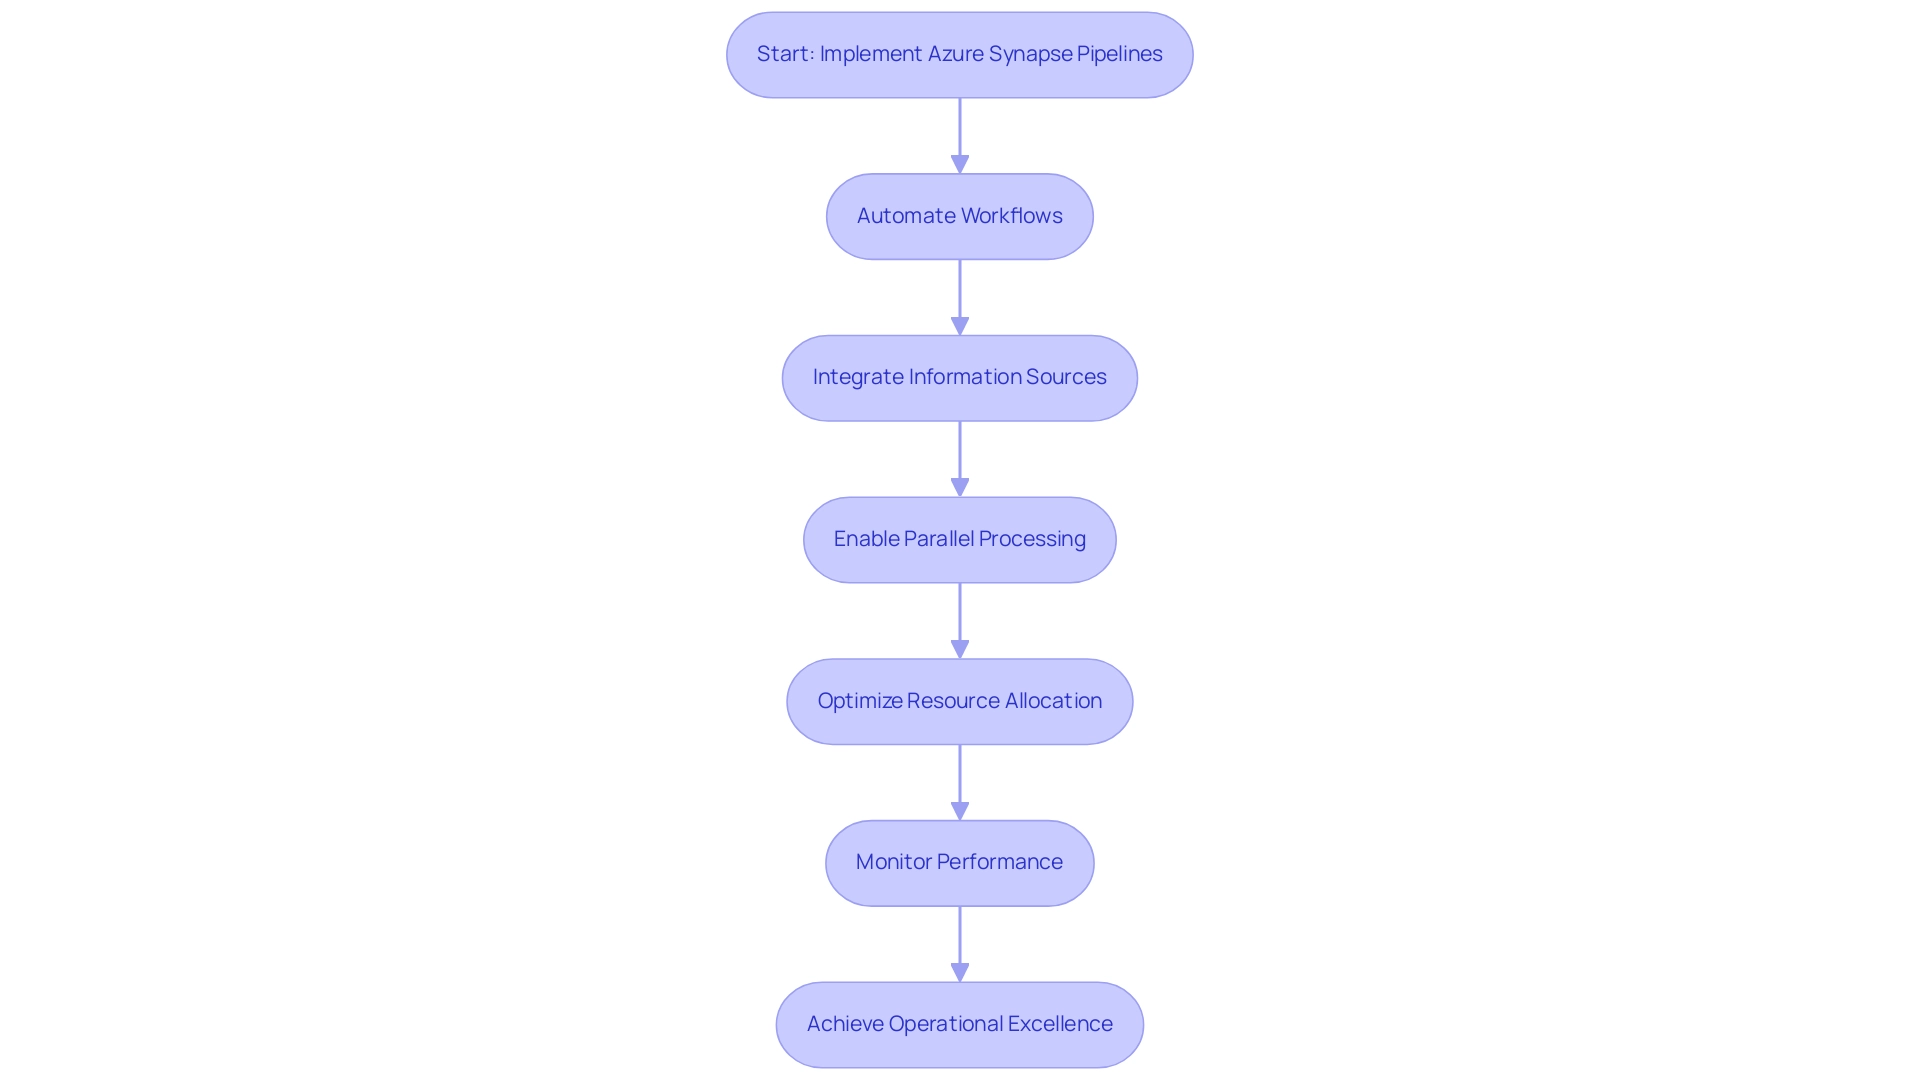
Best Practices for Implementing Azure Synapse Pipelines
To implement Azure Synapse Pipelines effectively, organizations must adhere to several best practices:
-
Define Clear Objectives: Establish specific, measurable goals for your information pipelines. This clarity will guide the design and execution of your workflows, ensuring alignment with broader business outcomes.
-
Utilize Modular Design: Embrace a modular approach by breaking down complex workflows into smaller, reusable components. This not only enhances maintainability but also facilitates easier updates and scalability, ultimately improving workflow efficiency in Synapse Pipelines.
-
Optimize Information Loading: Implement efficient information loading techniques, such as batching and incremental loads. These strategies significantly reduce processing time and resource consumption, leading to quicker information availability and enhanced performance. Additionally, utilizing the smallest types possible can further optimize loading processes by enhancing performance and concurrency in queries.
-
Monitor Performance: Regularly track key performance metrics of your Synapse Pipelines. Recognizing bottlenecks early allows for proactive enhancement of resource distribution, ensuring consistent performance and reliability in information access. Understanding and controlling storage throttling, as illustrated in the Azure Storage Throttling case study, can improve query execution and sustain performance when accessing information through serverless SQL pools.
-
Leverage RPA and Business Intelligence: Integrate Robotic Process Automation (RPA) to automate manual workflows, thereby enhancing operational efficiency and reducing errors. RPA can streamline repetitive tasks, freeing your team to focus on strategic initiatives that add value. Furthermore, harnessing Business Intelligence tools enables the transformation of raw data into actionable insights, driving informed decision-making that supports business growth.
-
Train Your Team: Invest in comprehensive training for your team members on Azure Synapse tools. A well-informed team can leverage the full potential of Synapse Pipelines to drive operational efficiency and innovation.
In 2025, it is anticipated that 80% of analytics governance efforts will concentrate on achieving concrete business outcomes, underscoring the significance of these best practices. As Punitkumar Harsur, a Data Engineer, observed, ‘Information warehouses are an optimal choice to store historical information in a more cost-effective manner.’ By implementing these approaches, organizations can enhance their information management capabilities and achieve significant advancements in productivity.
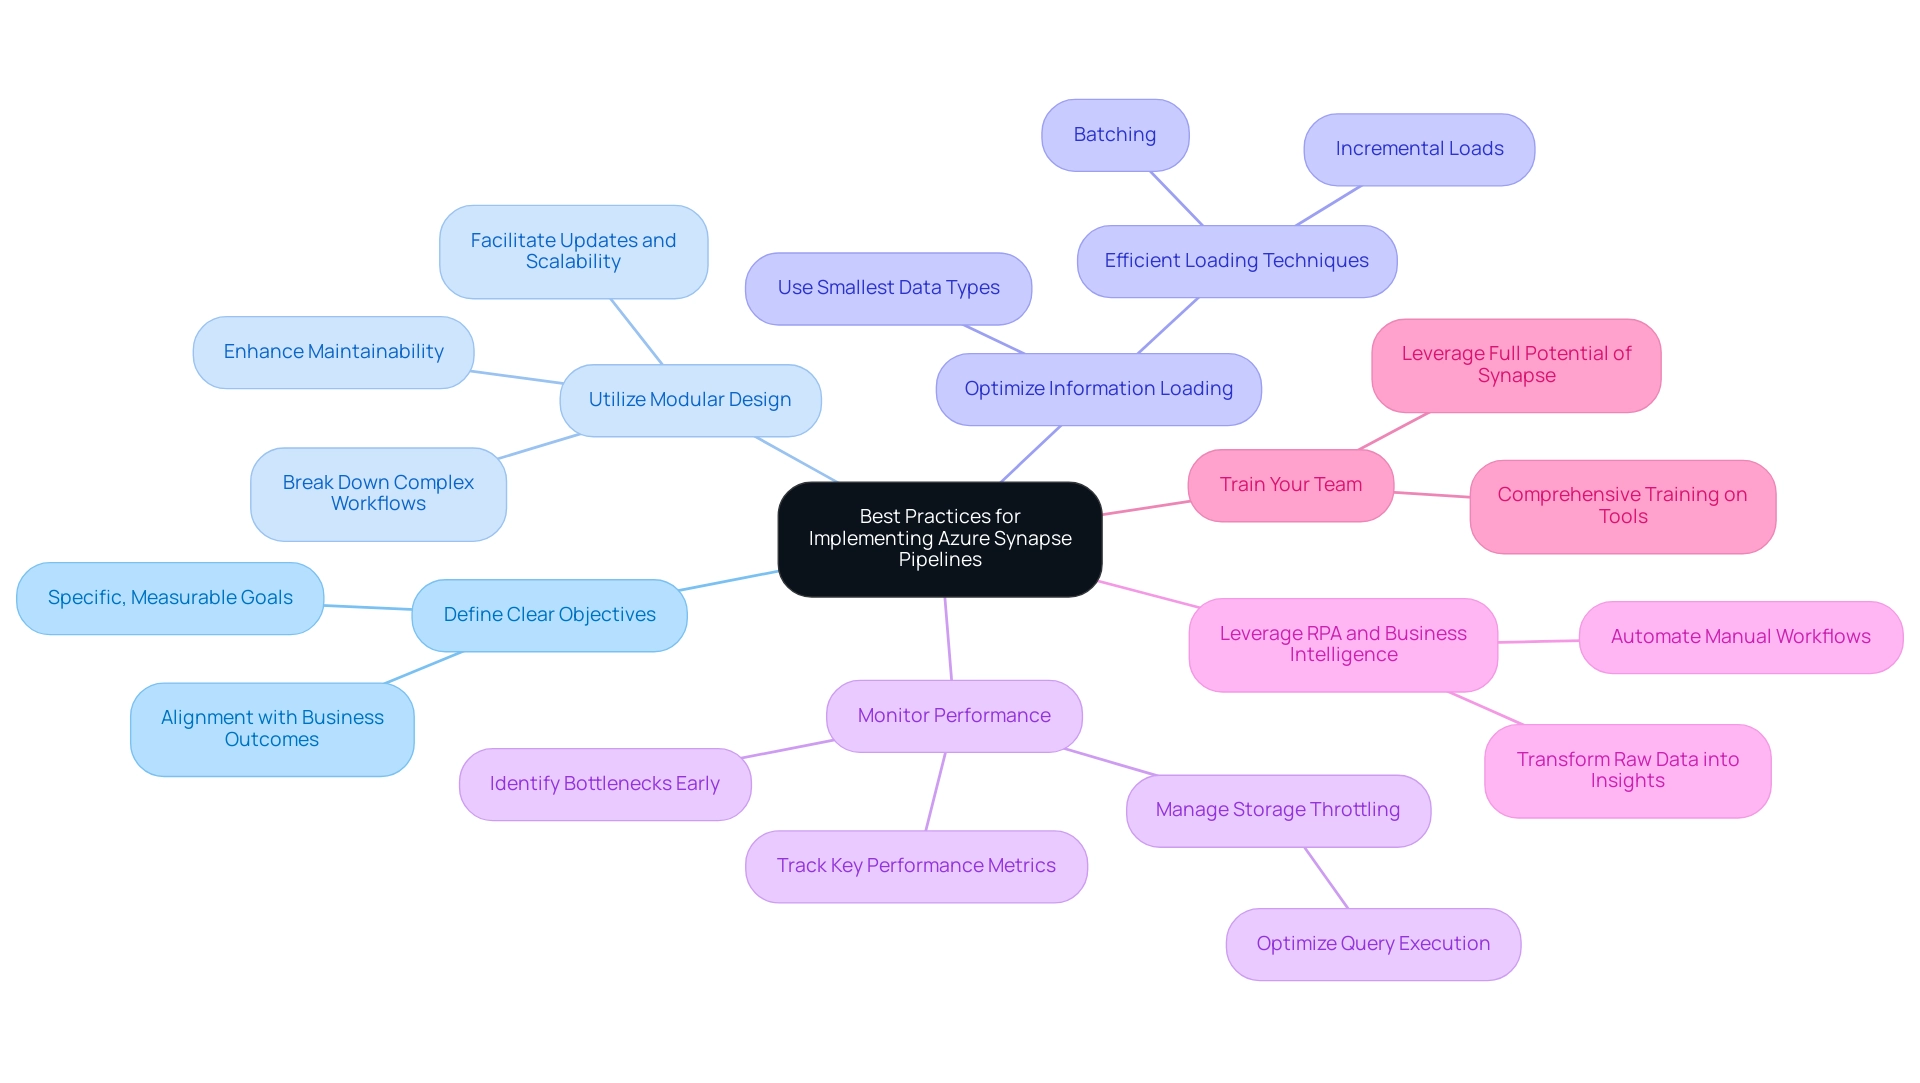
Integrating Robotic Process Automation with Synapse Pipelines
Incorporating Robotic Process Automation (RPA) with synapse pipelines significantly enhances operational productivity by automating repetitive tasks that typically consume valuable time and resources. A compelling case study from Creatum GmbH exemplifies this, showcasing how a mid-sized company improved efficiency by automating data entry, software testing, and legacy system integration through GUI automation. This strategy effectively addressed challenges like manual input errors and sluggish software testing, culminating in an impressive 70% reduction in entry mistakes and a 50% acceleration in testing processes.
RPA excels in streamlining input, validation, and reporting processes, empowering human resources to concentrate on strategic initiatives that propel business growth. By automating these workflows, organizations can achieve a significant reduction in errors, enhancing accuracy and reliability. The case study further highlighted that the execution of GUI automation involved meticulous mapping of current workflows, followed by the deployment of automation scripts, resulting in an 80% improvement in workflow performance, with a return on investment realized within just six months.
Moreover, RPA can initiate synapse pipelines in response to specific events, enabling a seamless transfer of information throughout the system without manual intervention. This functionality not only expedites processes but also bolsters overall productivity, allowing teams to swiftly adapt to changing business requirements.
As organizations increasingly recognize the benefits of RPA, expert insights suggest that the integration of RPA with synapse pipelines will be crucial for maximizing performance in 2025 and beyond. This synergy not only simplifies information management but also equips businesses to thrive in a rapidly evolving digital landscape. Notably, over 90% of C-level executives utilizing intelligent automation believe their organizations excel at managing change in response to shifting business trends, underscoring the strategic significance of RPA in today’s business environment.
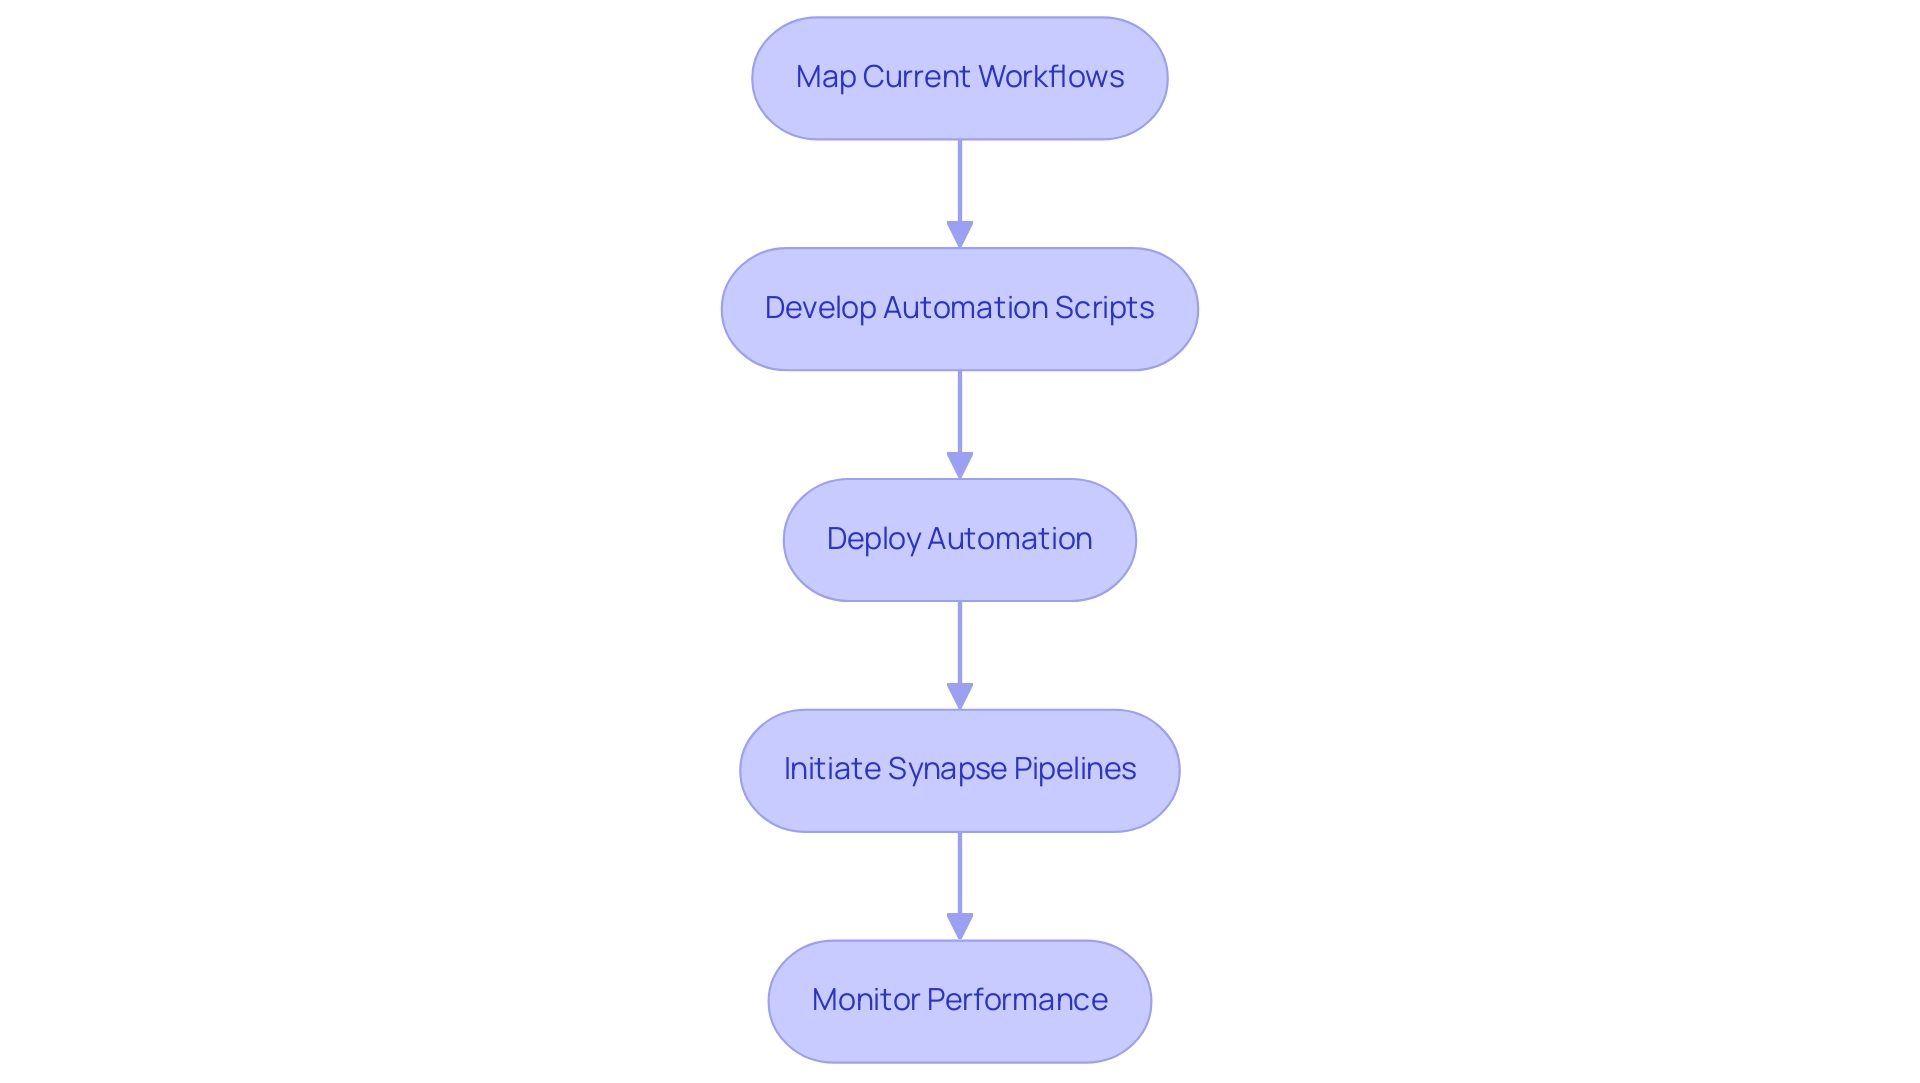
Enhancing Data Quality and Insights for Operational Success
To achieve maximum operational efficiency, organizations must prioritize information quality. By 2025, the emphasis on this quality is anticipated to evolve towards creating resilient systems that guarantee consistent, trusted, and AI-ready information flows, thereby transforming insights into a competitive advantage. Inadequate information quality poses significant compliance risks, including hefty penalties and potential legal actions. Thus, it is essential to implement robust validation checks and cleansing procedures within synapse pipelines to ensure that only accurate and reliable information is processed.
This approach not only mitigates compliance risks but also bolsters the overall integrity of information-driven decision-making.
Leveraging advanced business intelligence tools within Azure Synapse can greatly enhance insights, empowering organizations to extract actionable intelligence that propels strategic initiatives. For example, conducting regular audits of information quality metrics can uncover critical areas for improvement, ensuring consistency and trustworthiness. A case study on information time-to-value reveals that a high volume of errors in transformations or excessive manual cleanup underscores the need for a solid quality framework.
Moreover, expert insights highlight the significance of validation and cleansing processes. Antonio Cotroneo from Data Integrity states, ‘New AI-powered innovations in the Precisely Data Integrity Suite help you enhance productivity, maximize the ROI of data investments, and make confident, data-driven decisions.’ By prioritizing these practices, organizations can refine their processes, leading to improved outcomes and increased productivity.
Additionally, employing Robotic Process Automation (RPA) can streamline manual workflows, further enhancing performance in a swiftly evolving AI landscape. As this landscape progresses, integrating AI-powered innovations from Creatum GmbH, such as Small Language Models and GenAI Workshops, will further elevate data quality, maximizing returns on data investments and empowering teams to make confident, data-driven decisions. Book a free consultation.
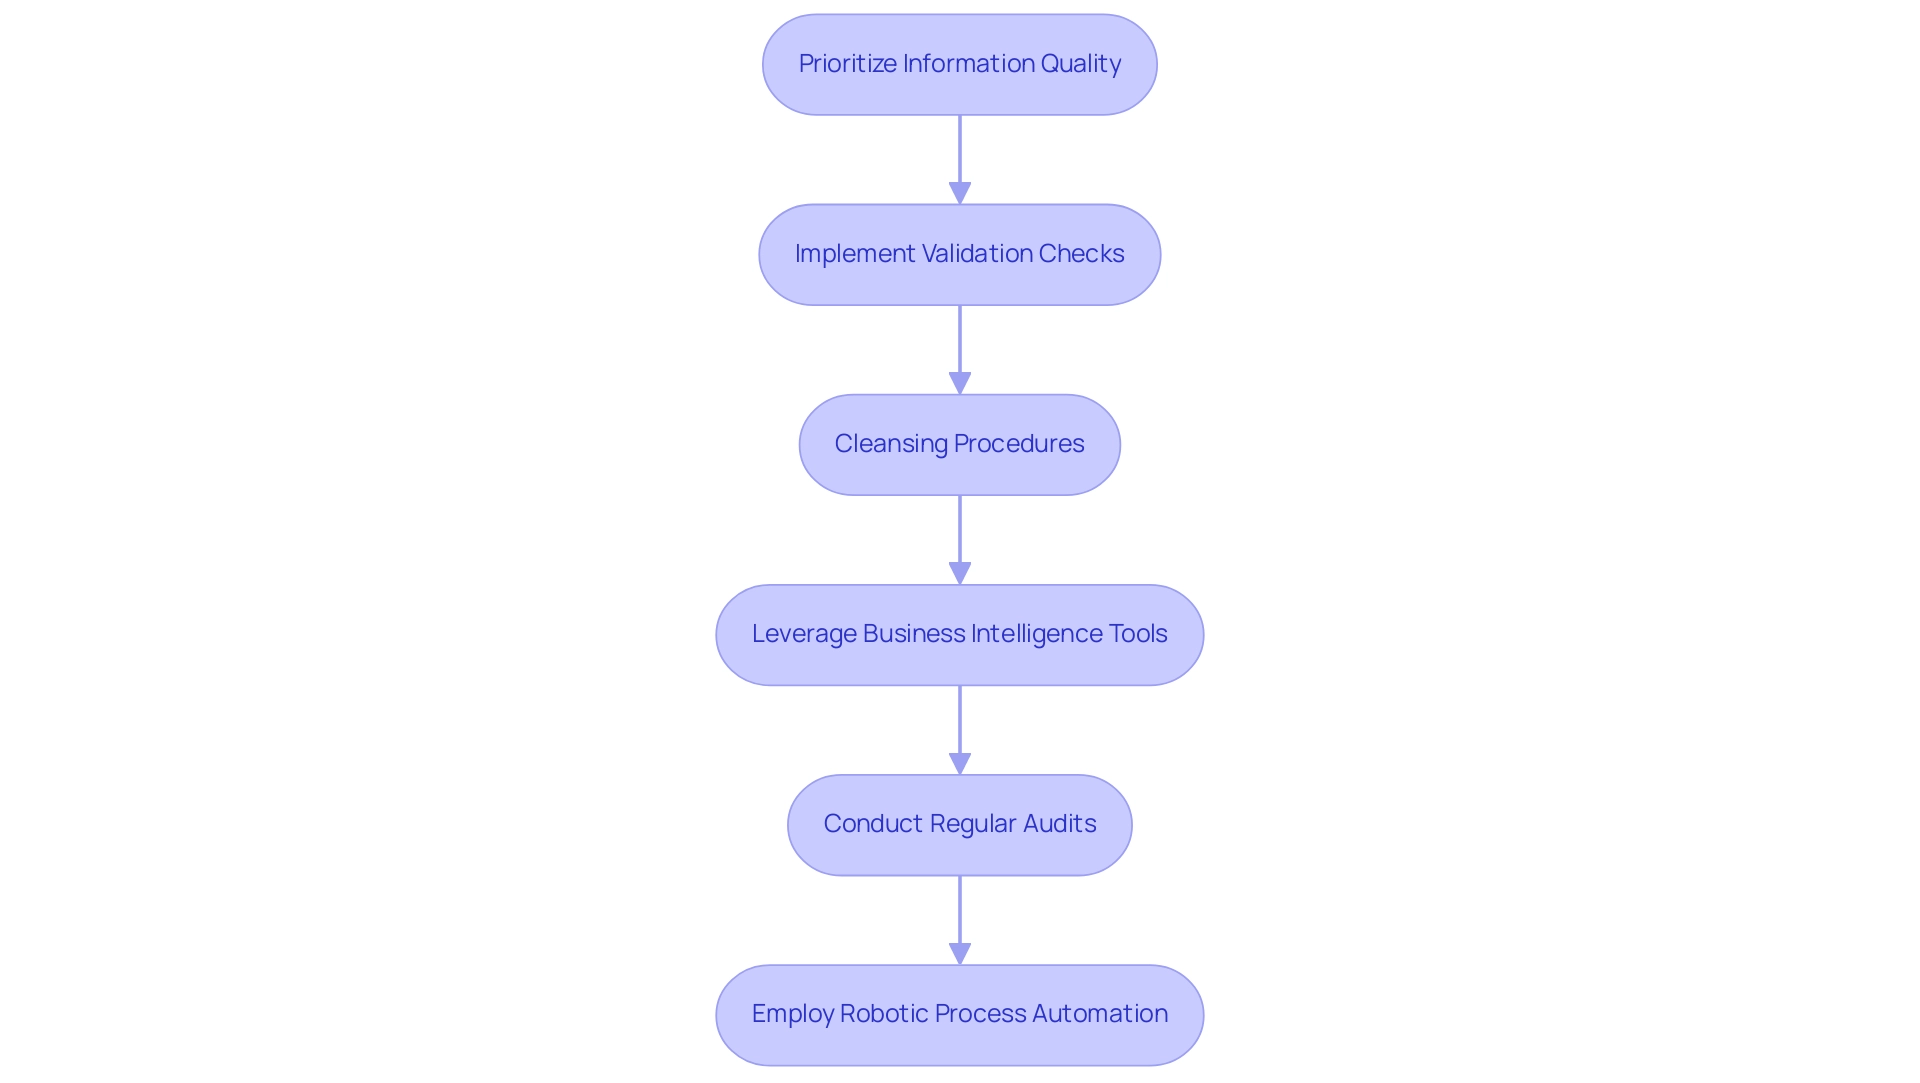
Continuous Improvement: Monitoring and Adapting for Long-Term Efficiency
Continuous enhancement is crucial for maintaining and improving efficiency within synapse pipelines. Organizations must implement a structured framework that includes regular reviews of performance metrics and actively solicits user feedback. This can be achieved by establishing dashboards that visualize key performance indicators (KPIs) and conducting periodic evaluations of pipeline effectiveness.
By fostering a culture of continuous improvement, organizations can swiftly adapt to emerging challenges, optimize their processes, and secure long-term success.
Adopting agile methodologies further supports rapid adjustments to evolving business needs, ensuring teams can respond effectively to changes in the business landscape. Notably, companies utilizing analytics in their performance processes are 1.5 times more likely to surpass their competitors across key metrics, highlighting the essential role of information-driven strategies in achieving operational excellence. Moreover, organizations implementing data-driven strategies demonstrate 23% higher profitability, reinforcing the importance of these approaches.
To illustrate the impact of continuous improvement practices, consider the case of a mid-sized healthcare company, Creatum GmbH. This organization successfully integrated GUI automation to streamline operations. Before this implementation, the company faced challenges such as manual information entry errors, slow software testing, and difficulty integrating outdated systems without APIs. By automating information entry, software evaluation, and legacy system integration, the company reduced entry mistakes by 70%, accelerated testing procedures by 50%, and enhanced workflow productivity by 80%.
This case exemplifies how leveraging Robotic Process Automation (RPA) can enhance efficiency, particularly in a rapidly evolving AI landscape. The return on investment (ROI) was achieved within six months, demonstrating the effectiveness of the implemented solutions.
The digital transformation in performance management is accelerating, with cloud-based enterprise performance management (EPM) solutions projected to capture a 65% market share by 2025. This shift not only enhances data management capabilities but also empowers organizations to effectively monitor performance metrics within synapse pipelines. The relevance of this trend is further underscored by the case study titled “Projections for Performance Management Software Adoption,” which highlights the growing adoption rates of cloud-based solutions.
In 2025, businesses using AI for task management are expected to report a 40% reduction in administrative workload and a 20% improvement in employee satisfaction, as noted by writer Trudi Saul. This illustrates the tangible advantages of integrating advanced technologies into functional frameworks. By focusing on performance metrics and continuous improvement strategies, organizations can maximize their operational efficiency and drive sustainable growth.
Conclusion
Maximizing operational efficiency through Azure Synapse Pipelines represents a transformative approach for organizations aiming to thrive in a data-driven landscape. By understanding and addressing common challenges—such as manual data entry and data silos—businesses can implement strategies that enhance collaboration and streamline workflows. The integration of Robotic Process Automation (RPA) has proven particularly effective, enabling organizations to automate repetitive tasks, reduce errors, and reallocate human resources to more strategic initiatives.
Best practices for implementing Azure Synapse Pipelines further underscore the importance of defining clear objectives, utilizing modular designs, and optimizing data loading techniques. These strategies not only improve efficiency but also foster a culture of continuous improvement, ensuring that organizations can adapt to changing demands and maintain a competitive edge. By leveraging advanced features within Azure Synapse and integrating RPA, companies can enhance data quality and insights, driving informed decision-making that fuels growth and innovation.
As industries evolve, the focus on operational excellence will become increasingly critical. Organizations that embrace these methodologies and technologies will not only see immediate improvements in their data integration and analytics processes but will also position themselves for long-term success in an ever-changing digital landscape. The future of operational efficiency lies in the hands of those willing to invest in automation, continuous improvement, and data-driven strategies—ultimately transforming challenges into opportunities for growth.
Frequently Asked Questions
What is the main focus of operational effectiveness in synapse pipelines?
The main focus is on executing integration and analytics processes while minimizing resource and time waste through the strategic application of tools and methodologies.
How can organizations enhance operational effectiveness in synapse pipelines?
Organizations can enhance effectiveness by leveraging Azure Synapse alongside Robotic Process Automation (RPA) solutions, automating tasks such as data ingestion, transformation, and analysis.
What key metrics are used to evaluate performance in synapse pipelines?
Key metrics include processing speed, resource utilization, and error rates, which collectively contribute to a robust functional framework.
What benefits have manufacturing firms experienced by implementing Synapse?
Manufacturing firms have improved supply chain visibility, streamlined production processes, and experienced substantial enhancements in work processes, particularly through RPA integration.
What recent updates have been made to the Synapse Machine Learning library?
Recent updates simplify the creation of scalable machine learning pipelines and introduce the Mssparkutils runtime context for Python and Scala, enhancing Synapse’s versatility.
What challenges do organizations face in achieving operational efficiency in synapse pipelines?
Challenges include manual information entry, employee resistance to new technologies, inadequate training, information silos, and the complexity of integrating diverse information sources.
How can Robotic Process Automation (RPA) help organizations?
RPA can streamline manual workflows, reduce errors, and free up employees for more strategic tasks, enhancing operational effectiveness and driving data-driven insights.
What is the significance of adopting Business Intelligence in organizations?
Business Intelligence transforms raw information into actionable insights, enabling informed decision-making that drives growth and innovation.
What role does versioning play in managing data environments?
Versioning facilitates better tracking of lineage, enables error rollbacks, and improves overall management practices, with a projected adoption rate of 60% by 2027.
How does Fivetran’s Hybrid Deployment benefit organizations?
It allows organizations to choose whether their pipelines are processed within Fivetran’s secure network or their own environment, enhancing data security and productivity.
Overview
Creating a Power BI KPI scorecard requires a structured approach that is essential for success. Begin by preparing your data meticulously. This foundational step ensures that the information you work with is both accurate and relevant. Next, select appropriate visuals that not only represent the data effectively but also resonate with your audience’s needs.
Aligning performance indicators with business goals is crucial. This alignment not only enhances the relevance of your KPIs but also drives strategic decision-making. Consider customizing visuals for clarity, as this will improve comprehension and engagement among stakeholders.
Avoiding common pitfalls is vital to ensure effective KPI reporting. By being aware of these challenges, you can enhance operational efficiency and facilitate better outcomes. In conclusion, a well-structured KPI scorecard can serve as a powerful tool for driving performance and achieving business objectives.
Introduction
In the dynamic landscape of business analytics, Key Performance Indicators (KPIs) have become indispensable tools for organizations aiming to measure success and drive informed decision-making. Within the realm of Power BI, these quantifiable metrics not only provide a visual representation of progress but also serve as a compass guiding companies toward their strategic objectives. As the significance of data-driven insights continues to escalate, mastering the effective use of KPIs in Power BI is essential for enhancing operational efficiency and cultivating a culture of accountability.
This article explores the intricacies of KPI implementation, encompassing:
- Preparation
- Visualization techniques
- Best practices
- Real-world applications
By equipping organizations with the knowledge to transform their data into actionable insights, we empower them to drive growth and innovation. Are you ready to leverage KPIs to propel your organization forward?
Understanding Key Performance Indicators (KPIs) in Power BI
Key Performance Metrics are essential quantifiable measures that enable organizations to assess their outcomes against specific objectives. Within the realm of Power BI, the Power BI KPI scorecard functions as a visual marker, effectively conveying progress toward these goals. For instance, a sales KPI may track actual revenue against set targets, providing immediate insights into performance levels.
In 2025, the importance of key performance indicators in enhancing operational efficiency cannot be overstated. More than half of surveyed leaders prioritize improving the quality of these indicators. This emphasis reflects a broader trend in which organizations increasingly rely on performance indicators for informed decision-making, with a significant percentage of businesses integrating these metrics into their strategic frameworks. As Lorea Lastiri states, “Monitoring this KPI provides the necessary information required to determine what is happening so that you can take the essential steps.”
Understanding the categories of key performance indicators relevant to your organization is crucial for maximizing the capabilities of the Power BI KPI scorecard. Common examples include sales growth, customer satisfaction scores, and operational efficiency metrics. By establishing clear and relevant performance indicators, organizations can focus their efforts on what truly matters, ensuring that data-driven decisions align with overarching strategic goals.
Real-world applications of KPIs showcase their impact on business performance. For example, Sanofi’s implementation of the Play app has granted approximately 10,000 executives enhanced visibility into KPI information. This AI-driven tool connects internal information with personalized insights, fostering improved dialogue and productivity within teams.
The result has been a proactive approach to managing potential issues, such as out-of-stock situations and ambitious sales forecasts.
Industry leaders emphasize that effective KPI measurement is vital for operational success. Senior management must lead by example to cultivate cultural change and demonstrate the value of smart metrics in decision-making. Monitoring key performance indicators not only provides essential information for decision-making but also nurtures a culture of accountability and performance within organizations.
By leveraging Power BI to visualize and track KPIs, businesses can create a comprehensive Power BI KPI scorecard alongside innovative tools like EMMA RPA and Microsoft Power Automate from Creatum GmbH. This transforms raw information into actionable insights, driving growth and innovation while enhancing operational efficiency through automation. Furthermore, RPA solutions address task repetition fatigue and staffing shortages, allowing teams to focus on strategic initiatives rather than mundane tasks. Integrating AI solutions complements these efforts, providing advanced analytics and insights that further enhance operational efficiency.
Preparing Your Data for Effective KPI Visualization
To effectively prepare your information for KPI visualization in Power BI, adhere to these critical steps:
-
Information Cleaning: Begin by eliminating duplicates, addressing missing values, and ensuring uniformity in formats. Utilizing Power Query can significantly streamline this process, making it more efficient and less prone to errors. By automating these manual tasks through Robotic Process Automation (RPA), you can further enhance efficiency and reduce the likelihood of errors.
-
Information Structuring: Organize your information into well-defined tables that accurately represent the relationships among various metrics. This frequently entails the creation of fact and dimension tables, which are crucial for effective analysis. RPA can assist in structuring information by automating the organization of these tables, ensuring consistency and accuracy.
-
Information Transformation: Implement necessary transformations to your information, such as aggregating sales figures on a monthly basis or calculating year-over-year growth rates. These transformations are vital for deriving meaningful insights from your information. RPA can automate repetitive transformation tasks, allowing your team to focus on strategic analysis.
-
Information Validation: It is crucial to verify that your information accurately reflects the metrics you aim to track. Cross-referencing with source information ensures the integrity and reliability of your details, which is essential for effective reporting on the Power BI KPI scorecard. Automating validation processes with RPA can save time and enhance accuracy.
-
Information Loading: Finally, load the cleaned and structured information into Power BI, ensuring it is primed for analysis and visualization. This step is critical as it sets the foundation for generating accurate and actionable insights. RPA can facilitate the loading process, ensuring that information is consistently updated and ready for analysis.
By diligently following these steps and leveraging RPA, you can ensure that your KPIs are effectively tracked using a Power BI KPI scorecard, ultimately leading to more precise insights and enhanced operational efficiency. The challenges posed by manual workflows can significantly hinder your preparation efforts, making the integration of RPA even more essential. In fact, statistics indicate that a significant percentage of organizations are now utilizing Power Query for information preparation, underscoring its importance in modern practices.
As the AI market continues to expand, with projections reaching $738.80 billion by 2030, the emphasis on high-quality information becomes even more paramount for informed decision-making and strategic growth. At Creatum GmbH, we understand these challenges and are committed to providing solutions that enhance your operational efficiency.
Step-by-Step Guide to Creating KPI Visuals in Power BI
Creating KPI visuals in Power BI, particularly a Power BI KPI scorecard, is a straightforward process that can significantly enhance your analysis capabilities and drive operational efficiency. Follow these steps to develop effective KPI visuals that deliver immediate insights into your business performance:
- Open Power BI Desktop: Start by launching the application and opening your existing report or creating a new one.
- Load Your Information: Ensure that your prepared information is loaded into Power BI. Quality and consistency are critical for reliable KPI dashboards, especially when utilizing a Power BI KPI scorecard. Acceldata’s Observability Platform highlights the importance of precise information in powering your dashboards. This is crucial for overcoming challenges such as inconsistencies that can lead to confusion and mistrust in the insights presented. Implementing a governance strategy can help maintain data integrity and consistency across reports.
- Select the KPI Visual: In the Visualizations pane, choose the KPI visual icon to begin creating your visualization.
- Add Data Fields: Drag and drop the relevant fields into the KPI visual. You will need to include:
- Value: This represents the actual performance measure (e.g., total sales).
- Target: Define the goal or target value (e.g., sales target).
- Trend: Incorporate a measure that illustrates the trend over time (e.g., sales growth).
- Customize the Visual: Tailor the formatting options to enhance readability. For instance, use color coding to indicate performance levels—green for on-target results and red for those falling below expectations. This customization aligns with current best practices for KPI visualization in 2025, ensuring clarity and impact. Additionally, integrating RPA solutions can automate repetitive tasks in report generation, allowing your team to focus on analysis rather than time-consuming report creation. It’s also essential to ensure that your reports provide actionable guidance to stakeholders, helping them understand the next steps based on the information presented.
- Save Your Report: After finalizing your visual, save your report to secure your work.
By adhering to these steps, you can create a Power BI KPI scorecard that delivers immediate insights and supports strategic decision-making. A significant 70% of businesses acknowledge the importance of visualization in shaping their strategies, as noted in the case study titled “Visualization and Strategic Business Decisions.” This underscores the value of effective Power BI KPI scorecard dashboards in driving growth and success. Furthermore, employing visualization tools has been demonstrated to boost client engagement and comprehension, with 65% of companies indicating enhanced results in their presentations.
As Walmart demonstrates, using drill-downs to analyze regional sales helps identify underperforming areas for targeted interventions. Highlighting the personalization of KPI visuals will further enable your organization to utilize information effectively. Creatum GmbH is committed to helping businesses navigate these challenges and maximize their data-driven insights.
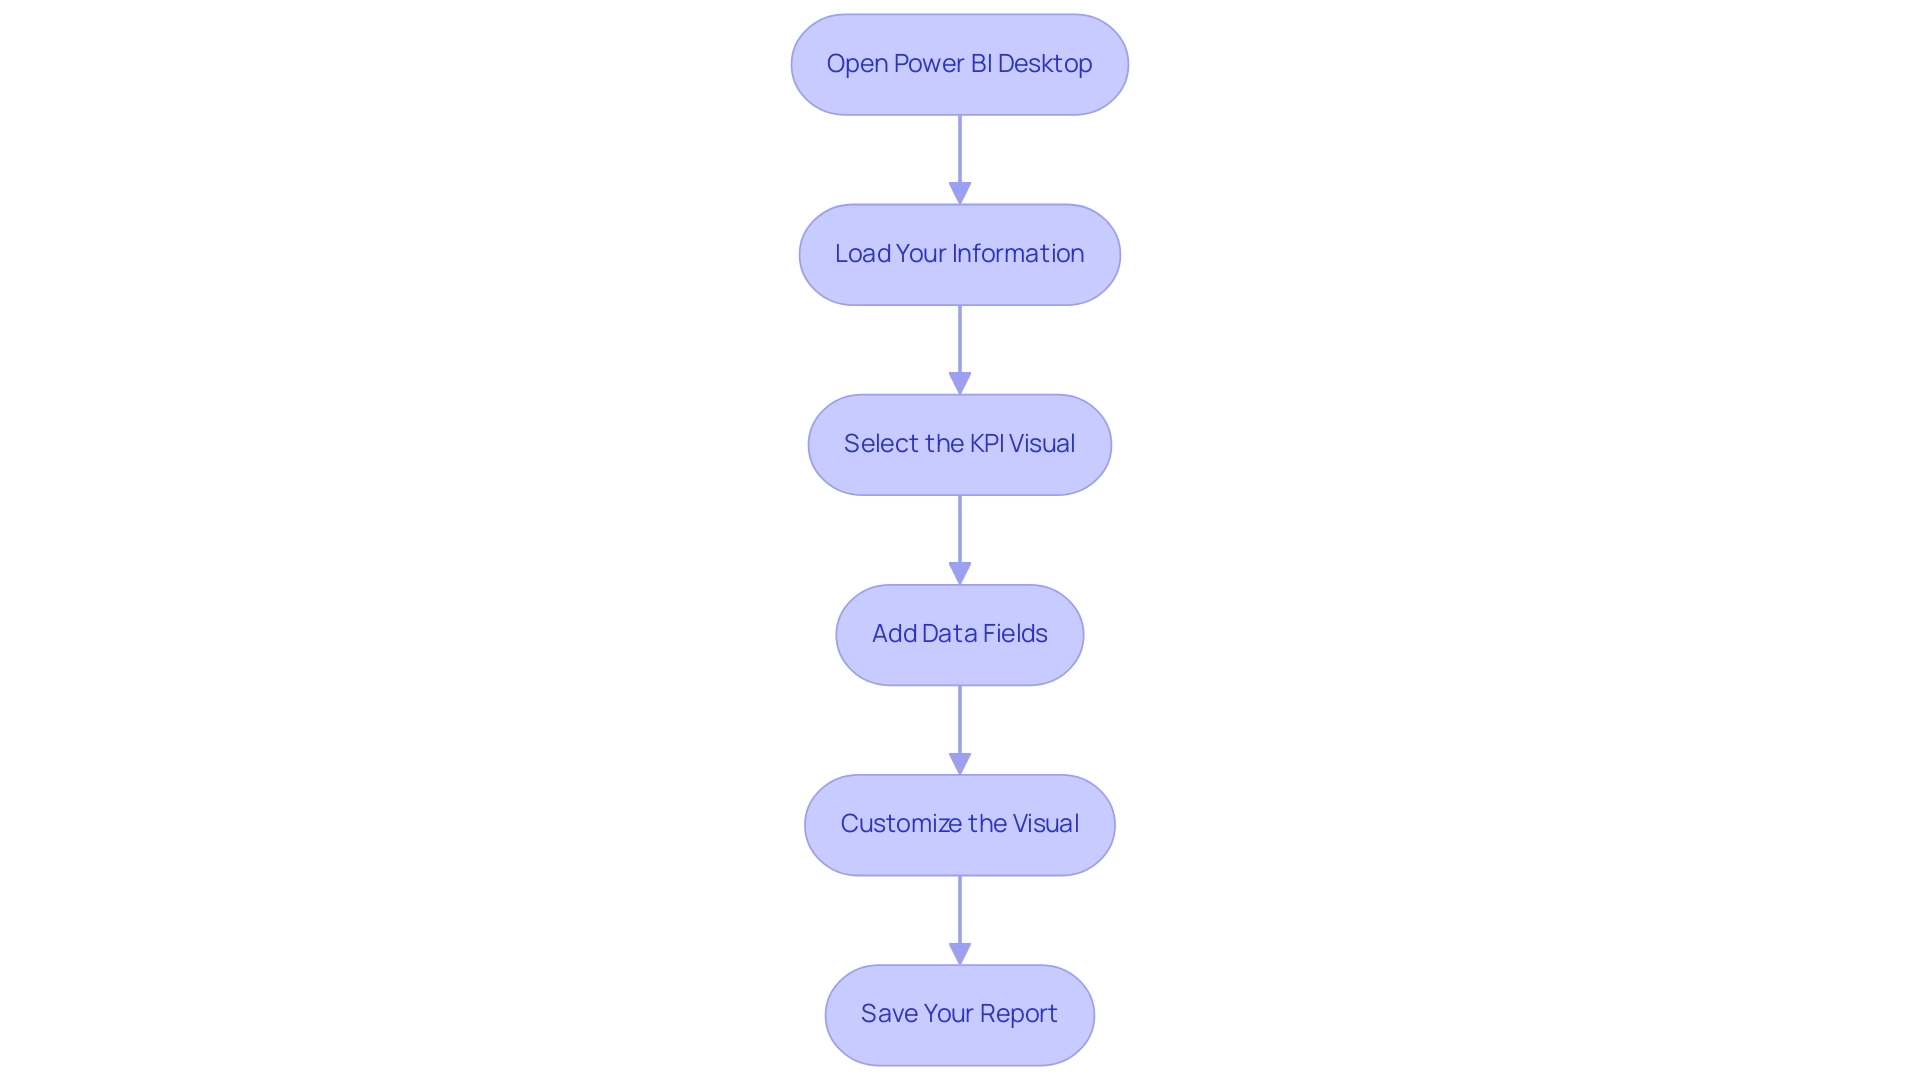
Exploring Different Types of KPI Visuals in Power BI
The Power BI KPI scorecard offers a diverse array of KPI visuals, each tailored to meet specific data presentation requirements, thereby enhancing the analytical capabilities of organizations. Let’s explore the various types of KPI visuals available:
-
KPI Visual: This visual displays a single measure against a predefined target, often accompanied by a trend indicator. It is particularly effective for high-level tracking of results, allowing stakeholders to quickly assess whether objectives are being met.
-
Gauge Visual: Representing progress toward a goal as a dial, the gauge visual provides a dynamic way to visualize performance against targets. This format is particularly useful for illustrating how close an organization is to achieving its objectives, making it easier to identify areas needing attention.
-
Card Visual: The card visual prominently showcases a single value, such as total sales or customer count. This simplicity makes it an excellent choice for highlighting key metrics that require immediate attention, ensuring that critical information points stand out in reports.
-
Table and Matrix Visuals: These visuals facilitate a more detailed presentation of data, allowing users to display multiple KPIs across various categories or time periods. This capability is essential for comprehensive analysis, enabling users to compare metrics side by side.
-
Line and Bar Charts: Although not conventional KPI visuals, line and bar charts can effectively illustrate trends over time, providing essential context to KPI outcomes. By visualizing historical information, organizations can better comprehend trends and make informed forecasts.
Current statistics reveal that daily metrics are calculated for 25%, 50%, and 75% of open report actions, underscoring the significance of choosing the appropriate visual for effective analysis. As organizations increasingly rely on data-driven decision-making, understanding when to use gauge, card, or Power BI KPI scorecard visuals becomes crucial. For instance, gauge visuals are ideal for real-time performance tracking, while card visuals excel in presenting key figures at a glance.
In 2025, the trend in KPI visualization techniques continues to evolve, with a growing emphasis on clarity and user engagement. Organizations are now concentrating on visuals that not only display information but also enhance user interaction and comprehension. The enhanced usage metrics report now encompasses only the last 30 days, reflecting a shift towards more relevant and timely analysis. Organizations that have successfully implemented the Power BI KPI scorecard report enhanced information quality and improved decision-making processes.
A notable case study highlights how businesses overwhelmed by information transformed raw details into actionable insights through effective KPI visualization, driving growth and innovation. By integrating RPA solutions like EMMA RPA and Power Automate from Creatum GmbH, organizations can further streamline their reporting processes, addressing challenges such as time-consuming report creation and data inconsistencies. By carefully exploring these options, users can choose the most effective visual representation for their key performance indicators, ensuring that their reports are not only clear but also impactful.
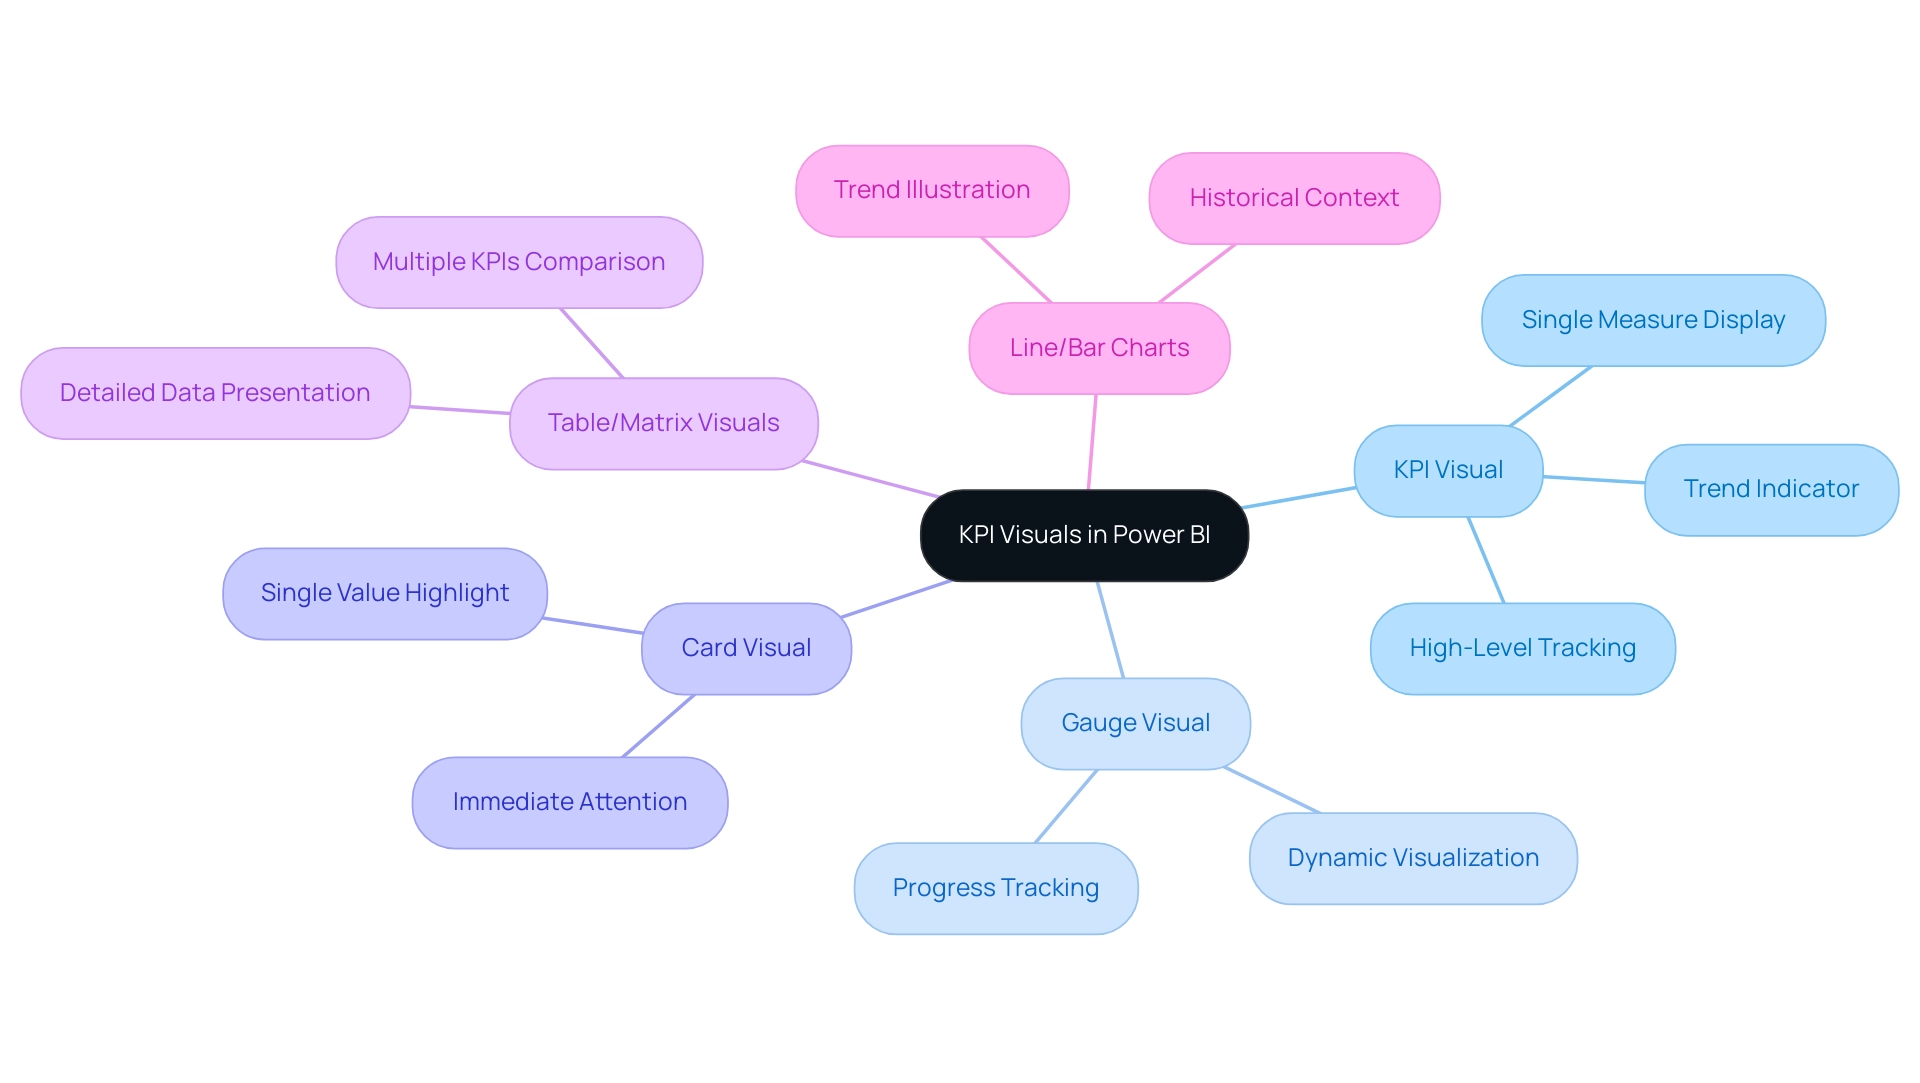
Best Practices for KPI Reporting in Power BI
Achieving effective KPI reporting in Power BI necessitates the implementation of several best practices:
-
Align Performance Indicators with Business Goals: Ensure the metrics tracked are directly linked to your organization’s strategic objectives. This alignment enhances relevance and drives accountability across teams. As My aptly noted, “Remember, when performance indicators and goals move in unison, success isn’t just a target; it becomes a journey we’re all part of.”
-
Simplify Dashboards: Limit the number of KPIs displayed to maintain clarity. Research shows that organizations simplifying their dashboards for Power BI KPI scorecard reporting experience a significant increase in user engagement and comprehension, allowing stakeholders to focus on critical metrics. Efficient monitoring dashboards enhance KPI understanding and expedite decision-making by presenting information clearly.
-
Utilize Color Intelligently: Employ color coding to represent achievement levels effectively—green for on-target, red for below target. This visual cue facilitates quick understanding and immediate action when necessary.
-
Incorporate Historical Data: Pair historical data or benchmarks with current metrics. This context enables stakeholders to grasp trends and make informed decisions based on past performance.
-
Regularly Review and Update Performance Indicators: As business goals evolve, so should your metrics. Regular assessments of their relevance ensure reporting remains aligned with organizational objectives and responsive to changing conditions. Regular training sessions keep staff informed and skilled in data-driven decision-making, crucial for effective KPI reporting.
By adhering to these best practices, organizations can create KPI reports using a Power BI KPI scorecard that are not only informative but also actionable, ultimately driving better decision-making and operational efficiency. For example, in a case study on Project Management indicators, tracking metrics such as Project Completion Rate and Budget Adherence enabled IT departments to ensure projects were completed on time and within budget, directly supporting business objectives. This illustrates the power of effective KPI alignment in achieving strategic success.
Furthermore, consider leveraging Creatum GmbH’s 3-Day Power BI Sprint to produce professional reports that enhance your analysis capabilities. This service promises to deliver a polished report on a topic of your choice in just three days, allowing your organization to concentrate on growth and innovation. Additionally, this report can serve as a template for future projects, ensuring a professional design from the outset.
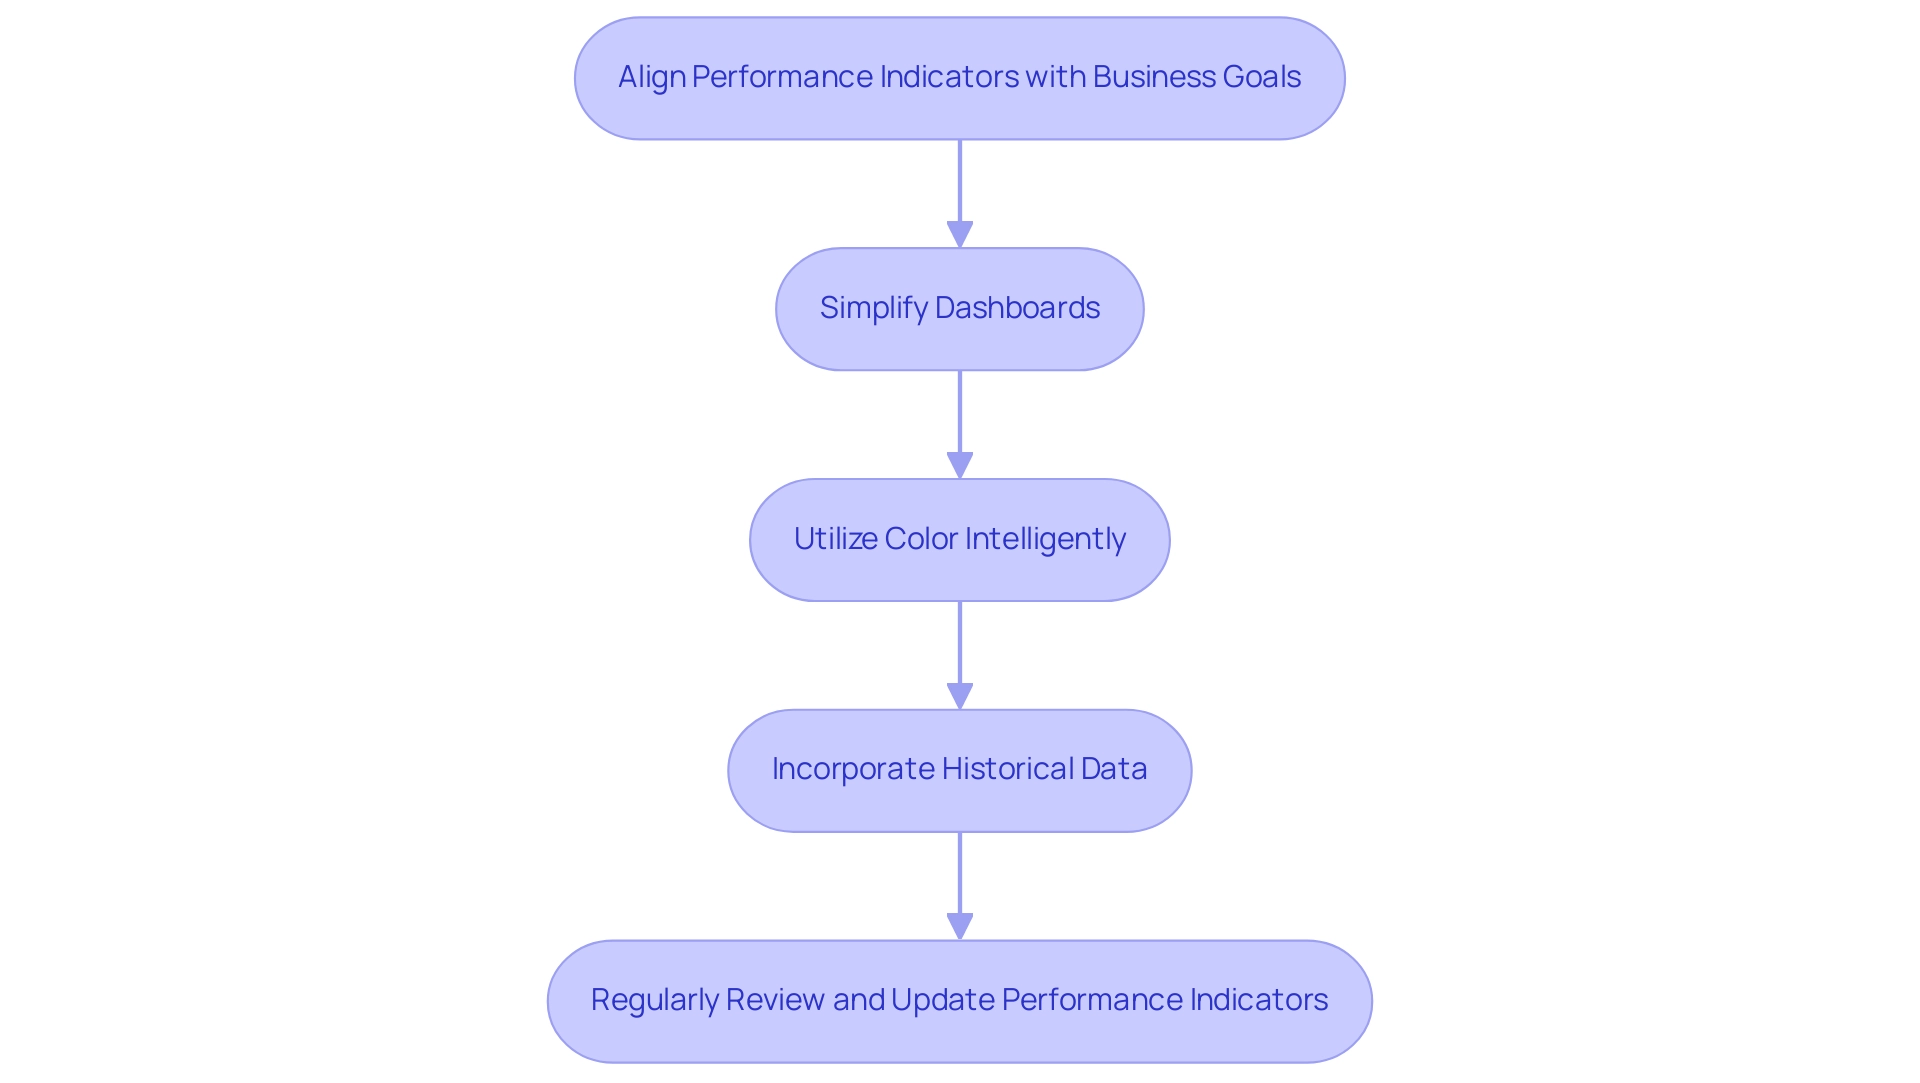
Common Pitfalls to Avoid in KPI Scorecard Creation
When developing KPI scorecards in Power BI, it is crucial to be aware of several common pitfalls that can undermine their effectiveness:
-
Overloading with Information: Resist the temptation to include an excessive number of key performance indicators in a single scorecard. Concentrating on the most pertinent metrics not only maintains clarity but also enhances decision-making.
-
Neglecting Information Quality: The accuracy and timeliness of the information feeding into your KPIs are paramount. Poor master information quality can lead to misleading insights, negatively impacting morale and productivity, and potentially increasing turnover rates. Organizations often struggle with inconsistent, incomplete, or inaccurate data, leading to inefficient operations and flawed decision-making. Statistics indicate that unaddressed mistakes in KPI management can result in reduced morale, decreased productivity, and high turnover rates.
-
Ignoring Stakeholder Needs: It is essential to tailor your performance indicators to align with the specific needs of your audience. The metrics that resonate with executives may differ significantly from those valued by operational teams, making stakeholder engagement critical. As management expert Peter Drucker famously stated, ‘What gets measured gets done,’ emphasizing the significance of assessing the appropriate performance indicators that align with organizational goals.
-
Failing to Provide Context: Key performance indicators devoid of context can easily be misinterpreted. Always include historical data or benchmarks to provide clarity on performance, ensuring that stakeholders can make informed decisions based on comprehensive insights.
-
Not Regularly Updating Performance Indicators: As business priorities evolve, so too should your performance indicators. Regular reviews and adjustments are necessary to keep them relevant and aligned with organizational goals. Statistics indicate that a significant percentage of organizations fail to update their KPIs regularly, leading to outdated metrics that no longer reflect current business realities. The case study titled “Takeaways on KPI Management” emphasizes the importance of keeping metric logic simple and focusing on tailored metrics that fit the unique context of the product.
-
Overcoming Barriers to AI Adoption: Organizations often view AI projects as time-intensive, costly, and challenging to implement. Poor master information quality can hinder effective AI integration in KPI management, making it essential to address these barriers. By enhancing information quality and understanding the integration process, organizations can leverage AI to improve their Power BI KPI scorecard.
By steering clear of these pitfalls, you can significantly enhance the effectiveness of your KPI scorecards, ensuring they fulfill their intended purpose and drive strategic decision-making. For instance, finance dashboards that monitor metrics such as monthly recurring revenue and churn rates provide actionable insights for adjusting revenue-related KPIs, further illustrating the importance of selecting the right metrics. At Creatum GmbH, we emphasize the need for high-quality data and effective AI integration to optimize your KPI management.
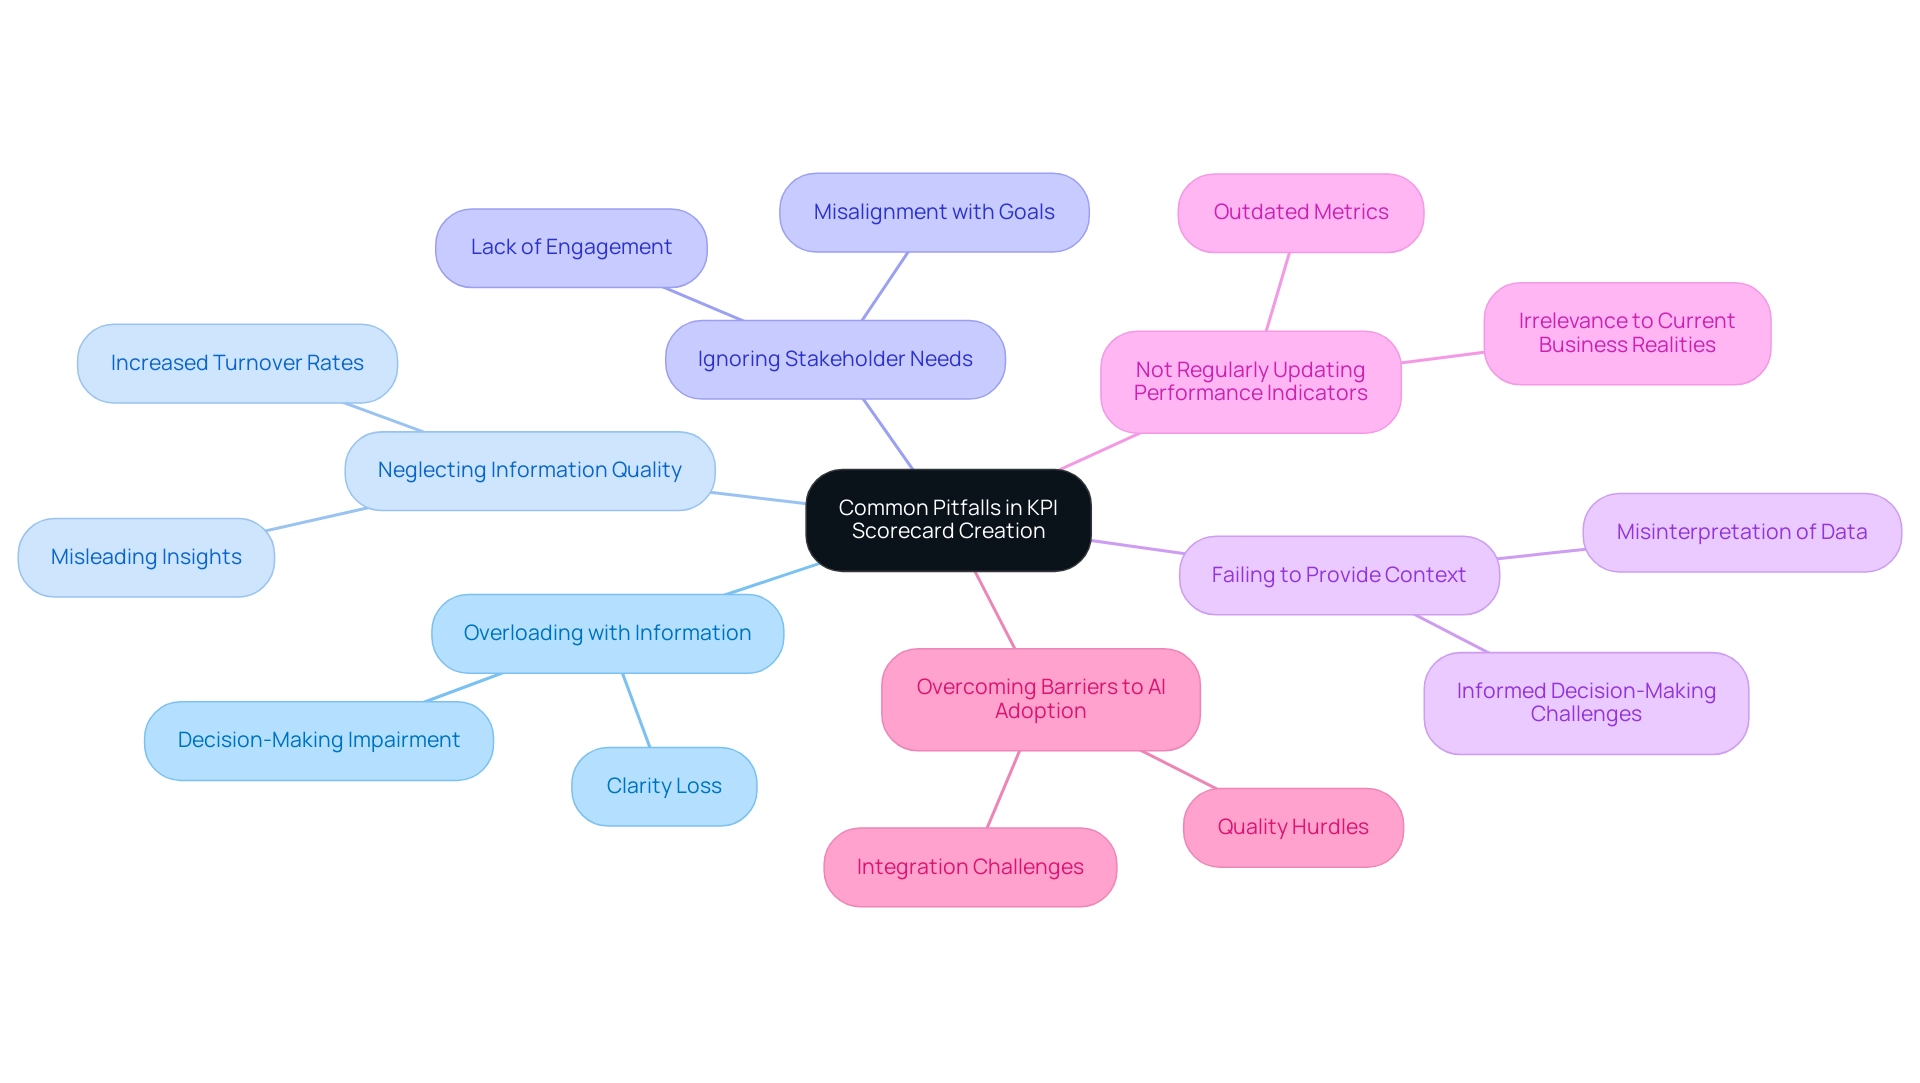
Real-World Applications of KPI Scorecards in Business
KPI scorecards, particularly the Power BI KPI scorecard, are essential tools across various business sectors, enhancing performance monitoring and strategic decision-making. Their applications are manifold:
-
Sales Performance Tracking: Organizations leverage KPI scorecards to assess critical sales metrics, including revenue growth, conversion rates, and customer acquisition costs. This real-time monitoring empowers businesses to swiftly adapt their strategies, optimizing sales outcomes. Notably, integrating application performance indicators into development and marketing plans is crucial for effective strategy execution, as emphasized by industry experts.
-
Operational Efficiency: In manufacturing, companies monitor KPIs related to production efficiency, such as cycle time and defect rates. Identifying inefficiencies allows for targeted improvements that boost overall productivity. A case study of Creatum GmbH illustrates this, where challenges like manual data entry errors, slow software testing, and outdated system integration were resolved through GUI automation. This initiative led to a 70% reduction in data entry errors and a 50% acceleration in software testing, significantly enhancing workflow efficiency by 80%. Remarkably, the ROI was realized within six months, underscoring the solution’s effectiveness.
-
Customer Satisfaction: Service-oriented businesses often rely on metrics like Net Promoter Score (NPS) and customer retention rates to gauge satisfaction and loyalty. These metrics provide valuable insights, enabling organizations to refine their customer engagement strategies.
-
Financial Health Monitoring: Financial institutions track KPIs such as return on equity (ROE) and cost-to-income ratios to evaluate their financial performance and stability. This data-driven approach facilitates informed decisions that support long-term growth.
-
Project Management: KPI scorecards are vital for monitoring project progress against established timelines and budgets. By keeping projects on track, organizations ensure efficient resource utilization and the achievement of objectives.
In 2025, statistics reveal that a significant percentage of businesses utilize KPI scorecards for sales tracking, highlighting their role in driving operational efficiency. For instance, the average number of views to installs serves as a quantitative measure of KPI tracking success, illustrating the effectiveness of app listings. Case studies indicate that organizations employing customized technology solutions for KPI tracking can automate data gathering and obtain real-time insights, ultimately enhancing their ability to evaluate results against strategic objectives.
As Jonas Kurzweg, Growth Lead, states, “Tracking app KPIs should be integrated into your development and marketing plans, including which success metrics and mobile efficiency metrics are deemed the most valuable or important.” By effectively leveraging Power BI KPI scorecards, businesses can transform their monitoring processes and make data-driven decisions that foster growth and innovation, particularly in the context of rapidly evolving AI landscapes where Robotic Process Automation (RPA) can further streamline workflows.
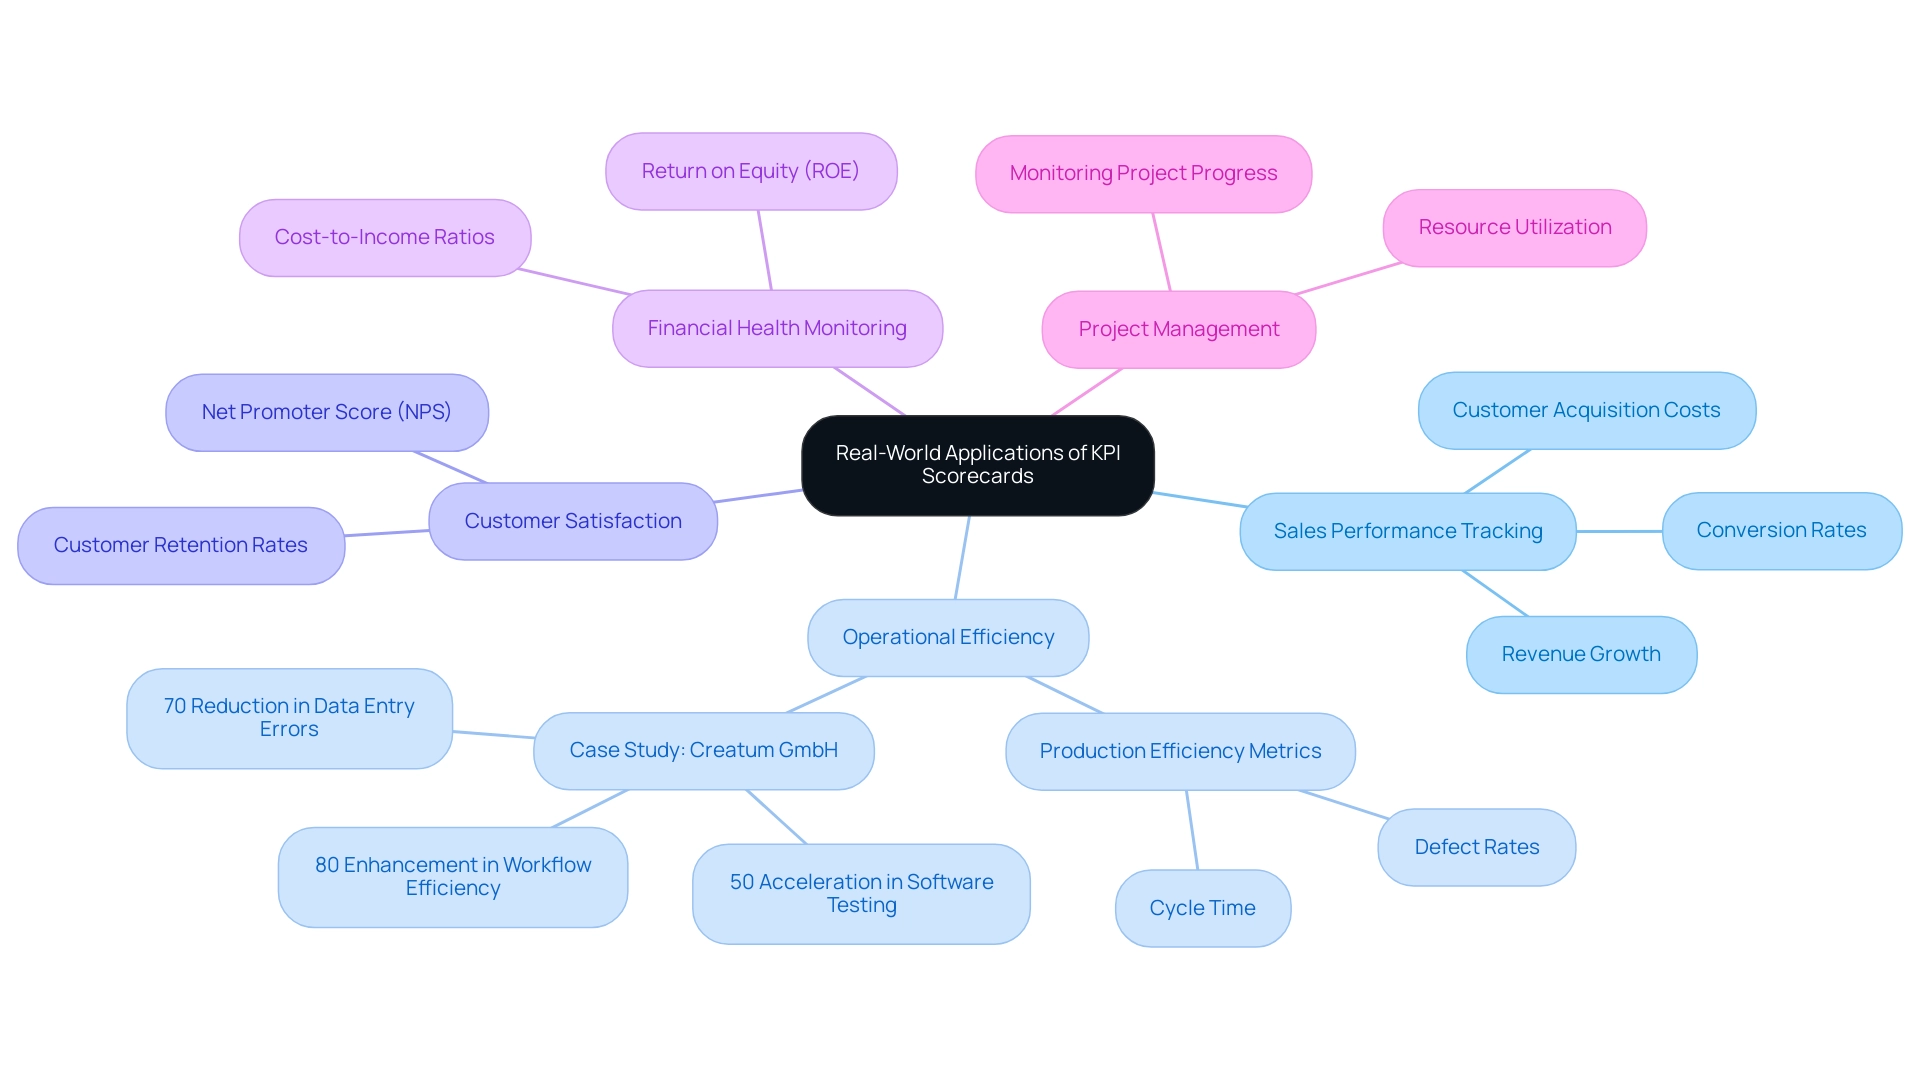
Advanced Customization Techniques for Power BI KPIs
To effectively customize your KPI visuals in Power BI, consider implementing the following advanced techniques:
-
Conditional Formatting: Leverage conditional formatting to dynamically alter the appearance of KPI visuals based on performance thresholds. This technique allows for quick identification of areas that require immediate attention, enhancing the decision-making process and aligning with the principles of Business Intelligence.
-
Dynamic Titles and Labels: Implement dynamic titles that adjust according to the selected filters or slicers. This feature offers essential context to the displayed KPIs, ensuring that users can easily interpret the information in relation to their specific queries, thus addressing challenges in leveraging insights from Power BI dashboards.
-
Custom Tooltips: Improve user engagement by incorporating custom tooltips that reveal additional information when users hover over KPI visuals. This not only enhances the user experience but also enables deeper insights without cluttering the visual space, making the information more actionable.
-
Integration with Other Visuals: Combine KPI visuals with complementary visual types, such as bar charts or line graphs. This integration provides a holistic perspective of performance metrics, enabling a more thorough analysis and comprehension of trends, which is essential for effective reporting.
-
Utilizing DAX for Advanced Calculations: Harness the power of DAX (Data Analysis Expressions) to create sophisticated measures that enhance the insights derived from your KPIs. With the average time to complete a DAX course being approximately 32.7 hours, investing in this knowledge can significantly elevate your analytical capabilities. As Joleen Bothma, a Data Science Consultant, notes, “Additionally, you could configure the settings for import-mode datasets in the Power BI Service to refresh more frequently,” which can further improve the efficiency of your KPI visuals.
By applying these advanced customization techniques, you can develop visuals for the Power BI KPI scorecard that are not only informative but also engaging and tailored to meet the specific needs of your organization. For instance, case studies have shown that organizations utilizing Power BI’s automated refresh and scheduled reporting features have significantly improved their efficiency, ensuring that teams have access to real-time insights for evidence-based decision-making. Adopting these strategies will enable your team to utilize information effectively, driving operational excellence.
Additionally, advanced analytics in Power BI uses AI and machine learning to identify patterns and forecast trends, further enhancing decision-making capabilities. Furthermore, integrating Power Automate can streamline workflow automation, providing a risk-free ROI assessment and professional execution, ultimately supporting your operational efficiency goals.
Moreover, consider leveraging the ‘3-Day Power BI Sprint’ for rapid report creation and the ‘General Management App’ for comprehensive management and smart reviews, which can further enhance your data reporting capabilities.
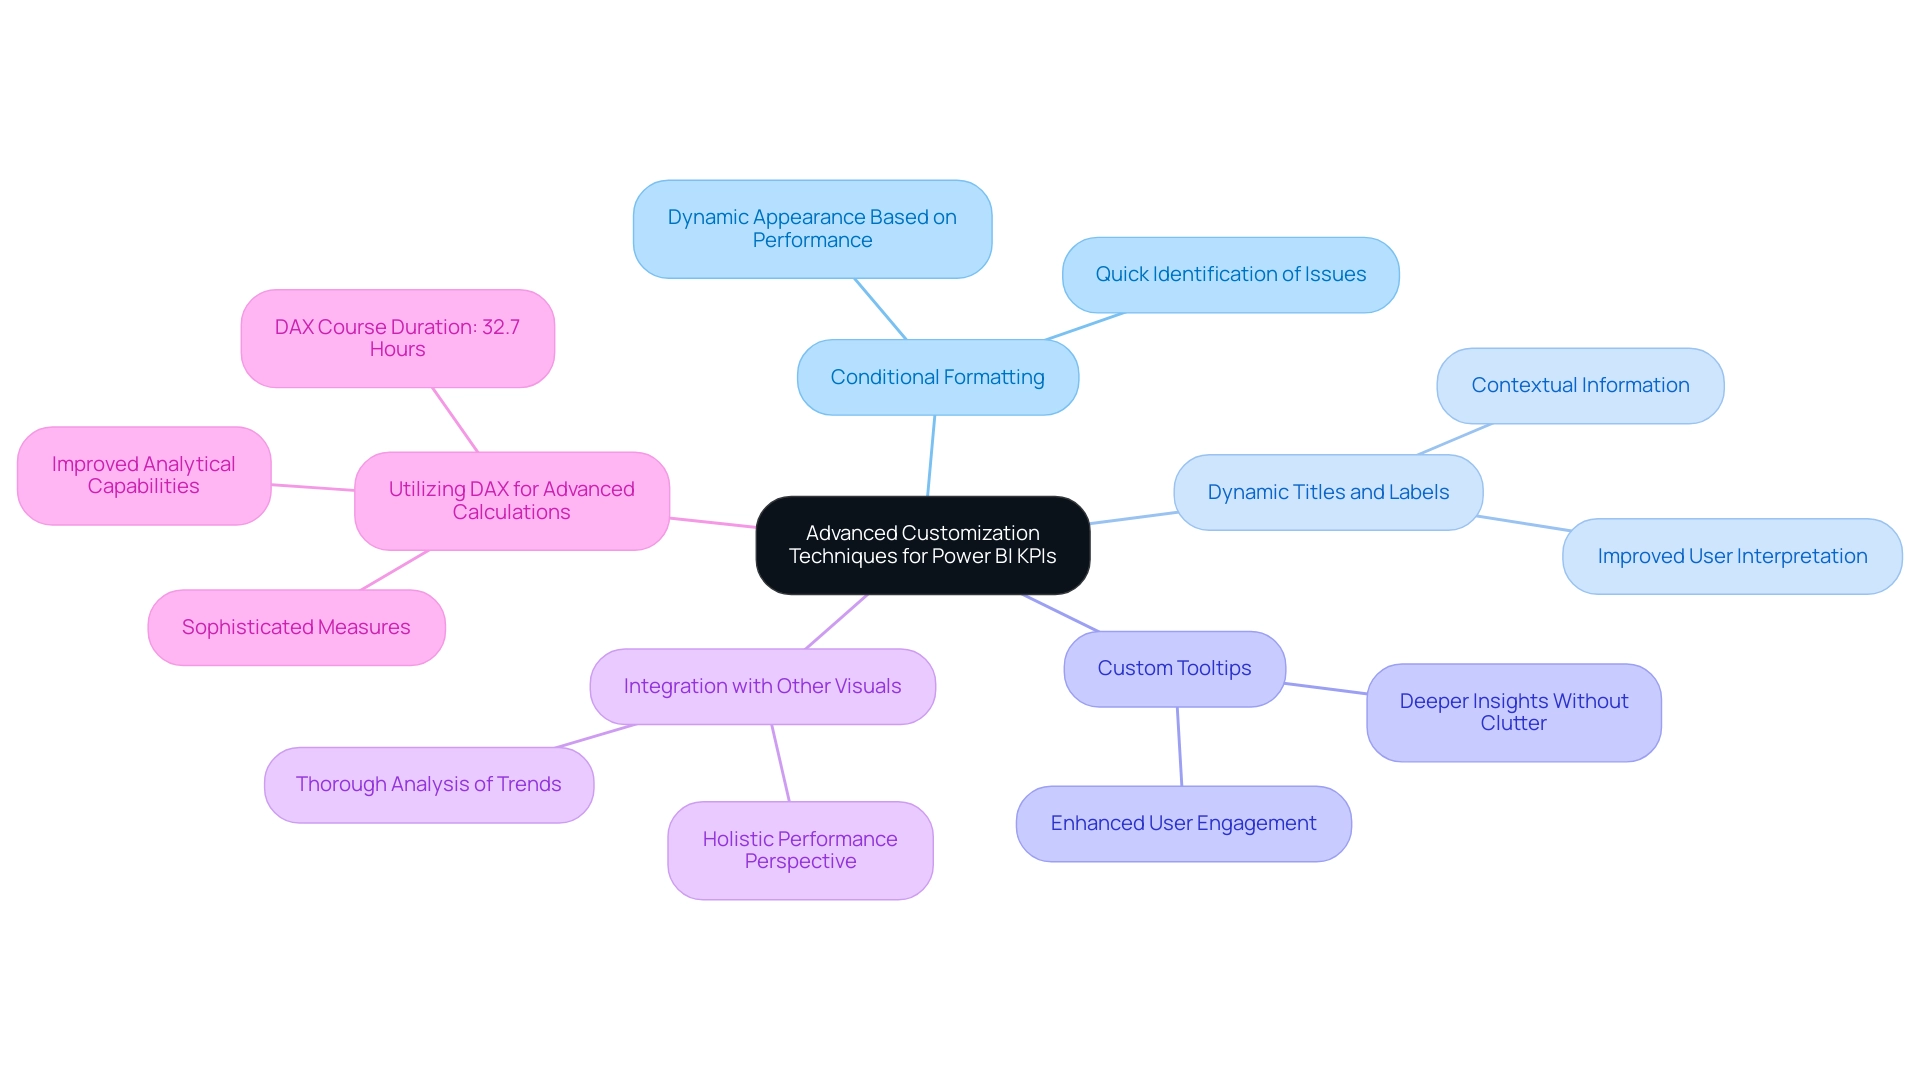
Conclusion
Mastering Key Performance Indicators (KPIs) in Power BI is essential for organizations aiming to enhance operational efficiency and make informed, data-driven decisions. This article has illuminated the critical aspects of KPI implementation, starting with the vital preparation and cleaning of data, and progressing to effective visualization techniques that convert raw data into valuable insights. By emphasizing best practices, organizations can align their KPIs with strategic objectives, fostering a culture of accountability and performance.
Furthermore, exploring various types of KPI visuals underscores the significance of selecting the appropriate format for impactful data analysis. From straightforward card visuals to dynamic gauge displays, each type fulfills a distinct role in presenting performance metrics. Moreover, understanding common pitfalls in KPI scorecard creation empowers organizations to avoid mistakes that could compromise their reporting efforts, ensuring that the insights gained are both accurate and actionable.
Real-world applications of KPI scorecards demonstrate their versatility across a range of sectors, from tracking sales performance to enhancing operational efficiency and customer satisfaction. As organizations increasingly depend on these metrics, integrating advanced customization techniques in Power BI will elevate analytical capabilities, enabling deeper insights and improved decision-making.
In conclusion, the effective use of KPIs in Power BI transcends mere performance tracking; it establishes a robust framework that supports strategic growth and innovation. By leveraging these insights, organizations can adeptly navigate the complexities of the modern business landscape and drive sustained success. Now is the time to harness the power of KPIs and transform data into a strategic asset that propels organizations toward their goals.
Frequently Asked Questions
What are Key Performance Metrics and their importance in organizations?
Key Performance Metrics are quantifiable measures that enable organizations to assess their outcomes against specific objectives. They are essential for enhancing operational efficiency and informed decision-making.
How does Power BI facilitate the tracking of Key Performance Indicators (KPIs)?
Power BI uses a KPI scorecard as a visual tool to convey progress toward goals, such as tracking actual revenue against set sales targets, providing immediate insights into performance levels.
Why is there a growing emphasis on improving the quality of Key Performance Indicators?
More than half of surveyed leaders prioritize improving the quality of KPIs, reflecting a trend where organizations increasingly rely on these metrics for informed decision-making, integrating them into their strategic frameworks.
What are some common categories of Key Performance Indicators?
Common examples of KPIs include sales growth, customer satisfaction scores, and operational efficiency metrics.
Can you provide an example of a real-world application of KPIs?
Sanofi’s implementation of the Play app has provided approximately 10,000 executives with enhanced visibility into KPI information, improving dialogue and productivity within teams and proactively managing potential issues.
What role does senior management play in effective KPI measurement?
Senior management must lead by example to cultivate a culture of accountability and demonstrate the value of smart metrics in decision-making.
How can organizations leverage Power BI and other tools to enhance operational efficiency?
By using Power BI to visualize KPIs alongside tools like EMMA RPA and Microsoft Power Automate, businesses can transform raw information into actionable insights, driving growth and addressing task repetition fatigue.
What are the critical steps to prepare information for KPI visualization in Power BI?
The steps include Information Cleaning, Information Structuring, Information Transformation, Information Validation, and Information Loading.
How can Robotic Process Automation (RPA) enhance the preparation of KPI information?
RPA can automate manual tasks involved in cleaning, structuring, transforming, validating, and loading information, leading to increased efficiency and reduced errors.
What is the significance of high-quality information in the context of AI and business growth?
As the AI market expands, high-quality information is crucial for informed decision-making and strategic growth, underscoring the need for effective KPI tracking and management.
