Overview
Publishing Power BI to SharePoint significantly enhances organizational collaboration and data accessibility, driving operational efficiency. This article outlines various methods for this integration, including:
- Embedding reports
- Managing permissions
It emphasizes the importance of user training and feedback to optimize the experience, ensuring secure access to insights. By adopting these strategies, organizations can unlock the full potential of their data, fostering a culture of informed decision-making.
Introduction
In the dynamic realm of business analytics, the integration of Power BI and SharePoint is transforming how organizations visualize and share data. As companies increasingly seek to make informed decisions in real-time, this potent combination not only enhances data accessibility but also cultivates collaboration among teams.
With projections suggesting that 70% of organizations will depend on real-time analytics by 2025, grasping the best practices for effectively embedding Power BI reports into SharePoint becomes essential.
This article explores the diverse strategies businesses can employ to optimize this integration, addressing:
- Technical considerations
- Permission management
- User experience enhancements
The goal is to convert raw data into actionable insights that drive growth and innovation.
Understanding Power BI and SharePoint Integration
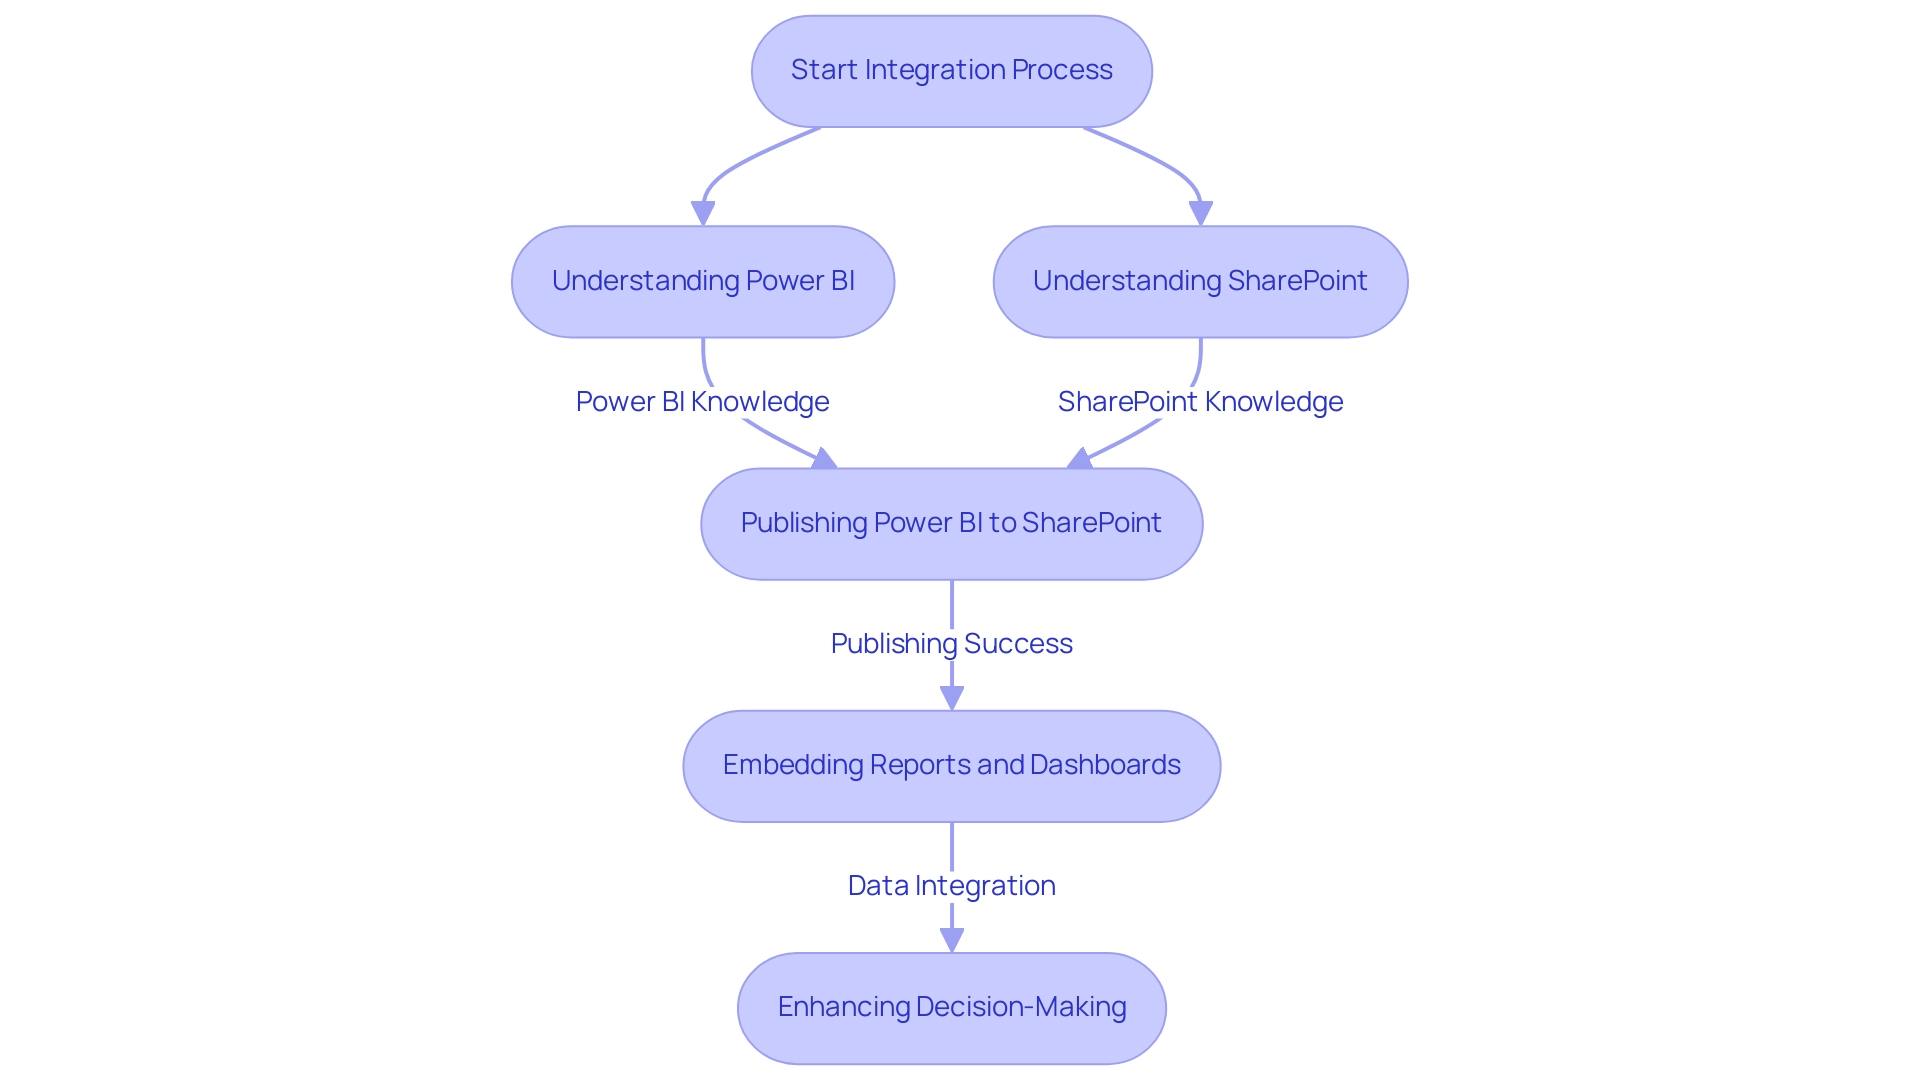
This tool stands out as a powerful business analytics instrument, enabling users to visualize information and share insights across their organizations. In contrast, SharePoint operates as a collaborative platform seamlessly integrated with Microsoft Office. Organizations are increasingly learning how to publish Power BI to SharePoint, allowing for the integration of interactive reports and dashboards directly into SharePoint pages, significantly enhancing data-driven decision-making processes.
This integration streamlines access to critical insights and fosters collaboration by embedding data within existing workflows, making it easier for teams to leverage information effectively.
As we approach 2025, the landscape of business analytics is evolving rapidly. Statistics indicate that by this year, 70% of organizations will utilize real-time analytics for informed decision-making, a substantial increase from 40% in 2020. This trend underscores the growing reliance on tools like BI, which facilitate prompt access to actionable insights.
Furthermore, organizations are increasingly recognizing how to publish Power BI to SharePoint as a valuable integration that enhances their analytical capabilities.
Successful case studies illustrate the transformative impact of this integration. For instance, organizations that have learned how to publish Power BI to SharePoint report better information quality and improved decision-making processes, ultimately fostering growth and innovation. The case study titled ‘Business Intelligence Empowerment‘ exemplifies this, showcasing how organizations have successfully transformed raw information into actionable insights through this integration.
The ability to visualize data in a collaborative environment not only simplifies analysis but also encourages a culture of data-driven decision-making across teams.
In 2025, the collaboration between BI and SharePoint is expected to yield significant benefits, including improved accessibility to insights, streamlined workflows, and enhanced team collaboration. As businesses continue to navigate a data-rich environment, leveraging these tools will be crucial for extracting meaningful insights and making informed decisions. The latest trends indicate that organizations are increasingly prioritizing this integration, recognizing its potential to empower teams and drive strategic initiatives.
Moreover, with the introduction of Automate and the EMMA RPA tool, organizations can streamline workflow automation with risk-free ROI assessments and professional execution, further enhancing operational efficiency. Automating repetitive tasks alleviates staff fatigue and boosts employee morale, making it a key consideration for operational strategies. The evolving landscape of business analytics highlights the increasing importance of tools like BI and SharePoint in this context.
As noted by an Analyst, ‘Erste Schritte sind einfach, ein sauberes Modell allerdings herausfordernd,’ emphasizing the complexities of creating clean models in the integration process. To explore how these tools can benefit your organization, book a free consultation with us today.
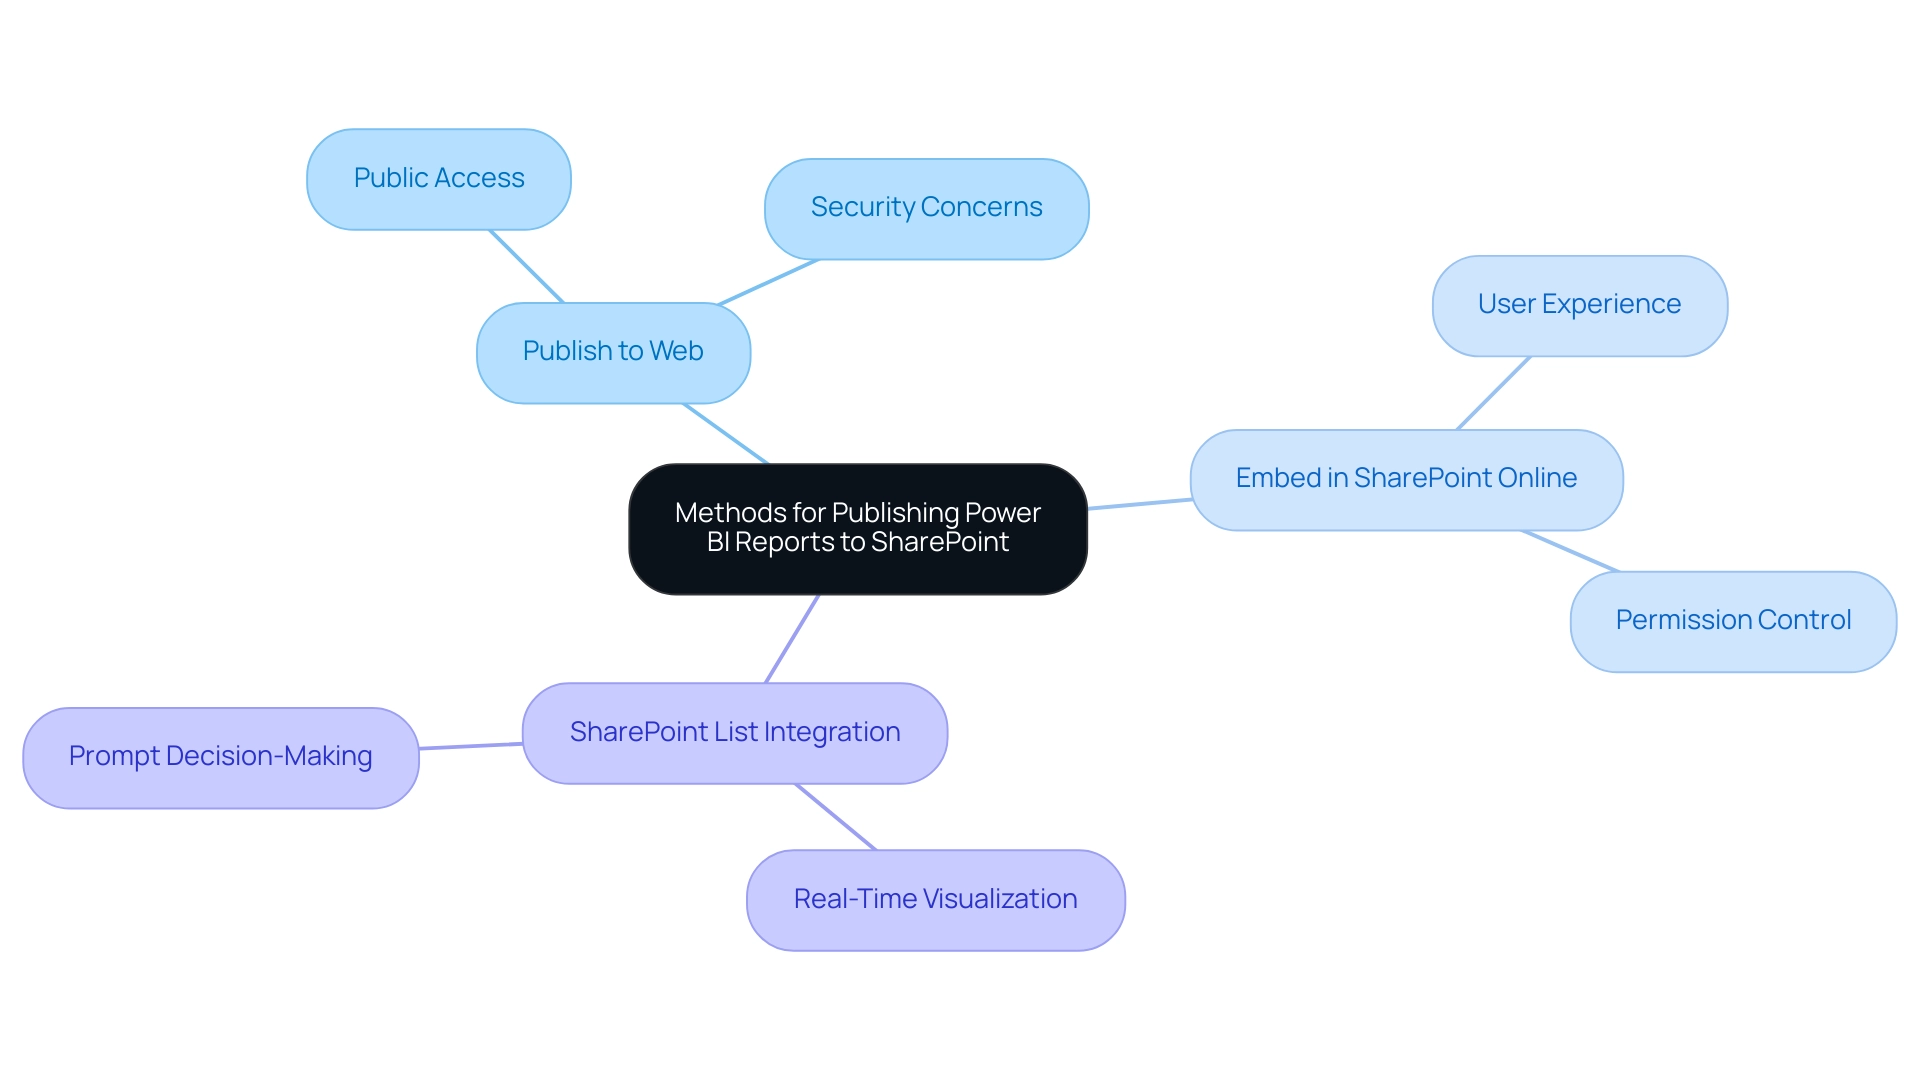
Methods for Publishing Power BI Reports to SharePoint
Understanding how to publish Power BI to SharePoint significantly enhances collaboration and data accessibility within organizations, driving operational efficiency through data-driven insights. Here are several effective methods to achieve this:
-
Publish to Web: This method allows users to generate a public link for their document, which can be easily embedded in SharePoint. While this approach facilitates broad access, caution is essential; anyone with the link can view the document, potentially exposing sensitive information.
-
Embed in SharePoint Online: Using the BI web part is an efficient way to incorporate analytics directly into SharePoint pages. This method not only improves user experience but also ensures that only individuals with the appropriate permissions can access the report, preserving security and integrity.
-
SharePoint List Integration: Linking BI directly to SharePoint lists allows for real-time information visualization, making it an ideal solution for organizations relying on SharePoint for information management. This integration enables teams to visualize and examine information as it evolves, promoting prompt decision-making.
In 2025, usage statistics for the BI web part in SharePoint indicate a growing trend, with organizations increasingly utilizing this feature to enhance their reporting capabilities. Optimal methods for sharing BI visuals on SharePoint involve confirming that all individuals possess the required permissions, frequently refreshing visuals to showcase the most current information, and employing the semantic model version history function to restore from any errors during the editing phase. This feature enables individuals to recover earlier iterations of their semantic models, boosting trust in self-service information management.
As Patrick LeBlanc, Principal Program Manager, emphasizes, ‘We highly value your feedback, so please share your thoughts using the feedback forum,’ highlighting the importance of user input in optimizing these tools.
Additionally, leveraging the ‘3-Day Enhanced BI Sprint’ can expedite the report creation process, ensuring that teams can quickly adapt to evolving data needs. The ‘General Management App’ provides comprehensive management tools that facilitate smart reviews and actionable insights. By adopting these methods and best practices, organizations can effectively learn how to publish Power BI to SharePoint, integrating BI with SharePoint to drive operational efficiency and informed decision-making.
The incorporation of automation solutions further streamlines workflow automation, ensuring a risk-free ROI assessment and professional execution. With BI enabling efficient document distribution and collaboration through various sharing methods and workspace features, teams can work together seamlessly, exemplifying the practical application of these technologies.
Managing Permissions and Access for Power BI Reports
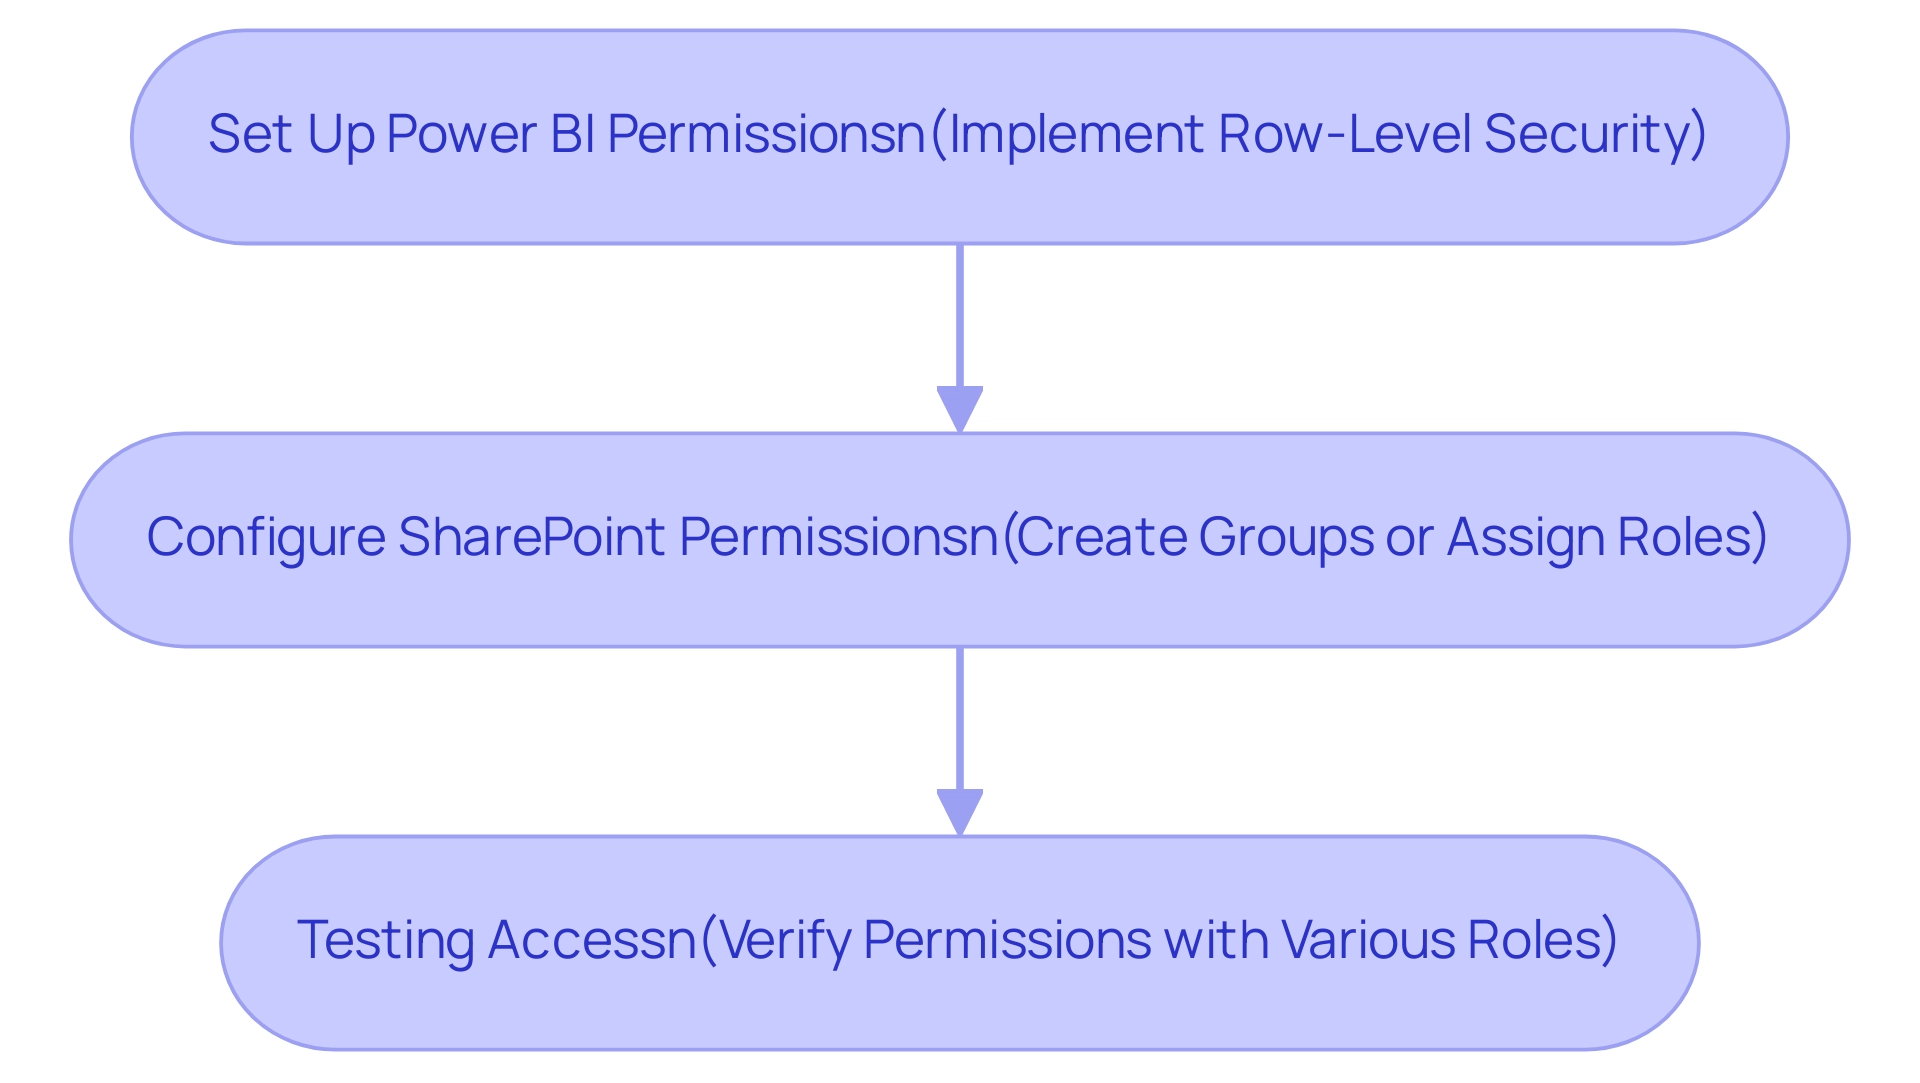
To effectively manage permissions for Power BI reports in SharePoint, follow this structured approach:
-
Set Up Power BI Permissions: Start by accessing the Power BI service and navigating to the document settings. Here, you can specify who has the ability to view or edit the report. Implementing Row-Level Security (RLS) is crucial, as it restricts access at the row level for different users, ensuring that sensitive information is available only to authorized personnel. This capability is essential for maintaining information integrity and security, particularly in an information-driven environment where insights dictate operational strategies. However, challenges such as time-consuming document creation and data inconsistencies can hinder effective decision-making, making proper permission management even more critical.
-
Configure SharePoint Permissions: Next, ensure that individuals possess the necessary permissions within SharePoint to access the page where the report is embedded. This may involve creating specific groups or assigning roles that align with your organizational structure. Current trends indicate that effective permission management in SharePoint is vital for maintaining data integrity and security in 2025, as organizations increasingly rely on data-driven decision-making. Moreover, integrating RPA solutions can streamline these processes, reducing the burden on employees and enhancing operational efficiency.
-
Testing Access: After establishing permissions, conduct thorough testing by logging in as individuals with various roles. This step is essential to confirm that permissions are applied correctly and that users can access the reports as intended. A case study on managing permissions for Business Intelligence in SharePoint highlighted the importance of isolating gateways for different query types, which can enhance performance and prevent overload issues, particularly for startups requiring low latency. This practice not only improves efficiency but also ensures that permission management is streamlined and effective.
As lbendlin aptly stated, “Pivot your thought process from BI structure to business needs.” By following these steps on how to publish Power BI to SharePoint, organizations can ensure that their BI analyses are securely managed within SharePoint, facilitating efficient data access while safeguarding sensitive information. Furthermore, utilizing BI insights through our 3-Day BI Sprint will empower your team to generate professional documents that not only inform choices but also foster growth and innovation.
This sprint is designed to help you overcome the challenges of document creation and ensure that your insights are actionable and impactful.
Technical Considerations and Limitations of Embedding Power BI
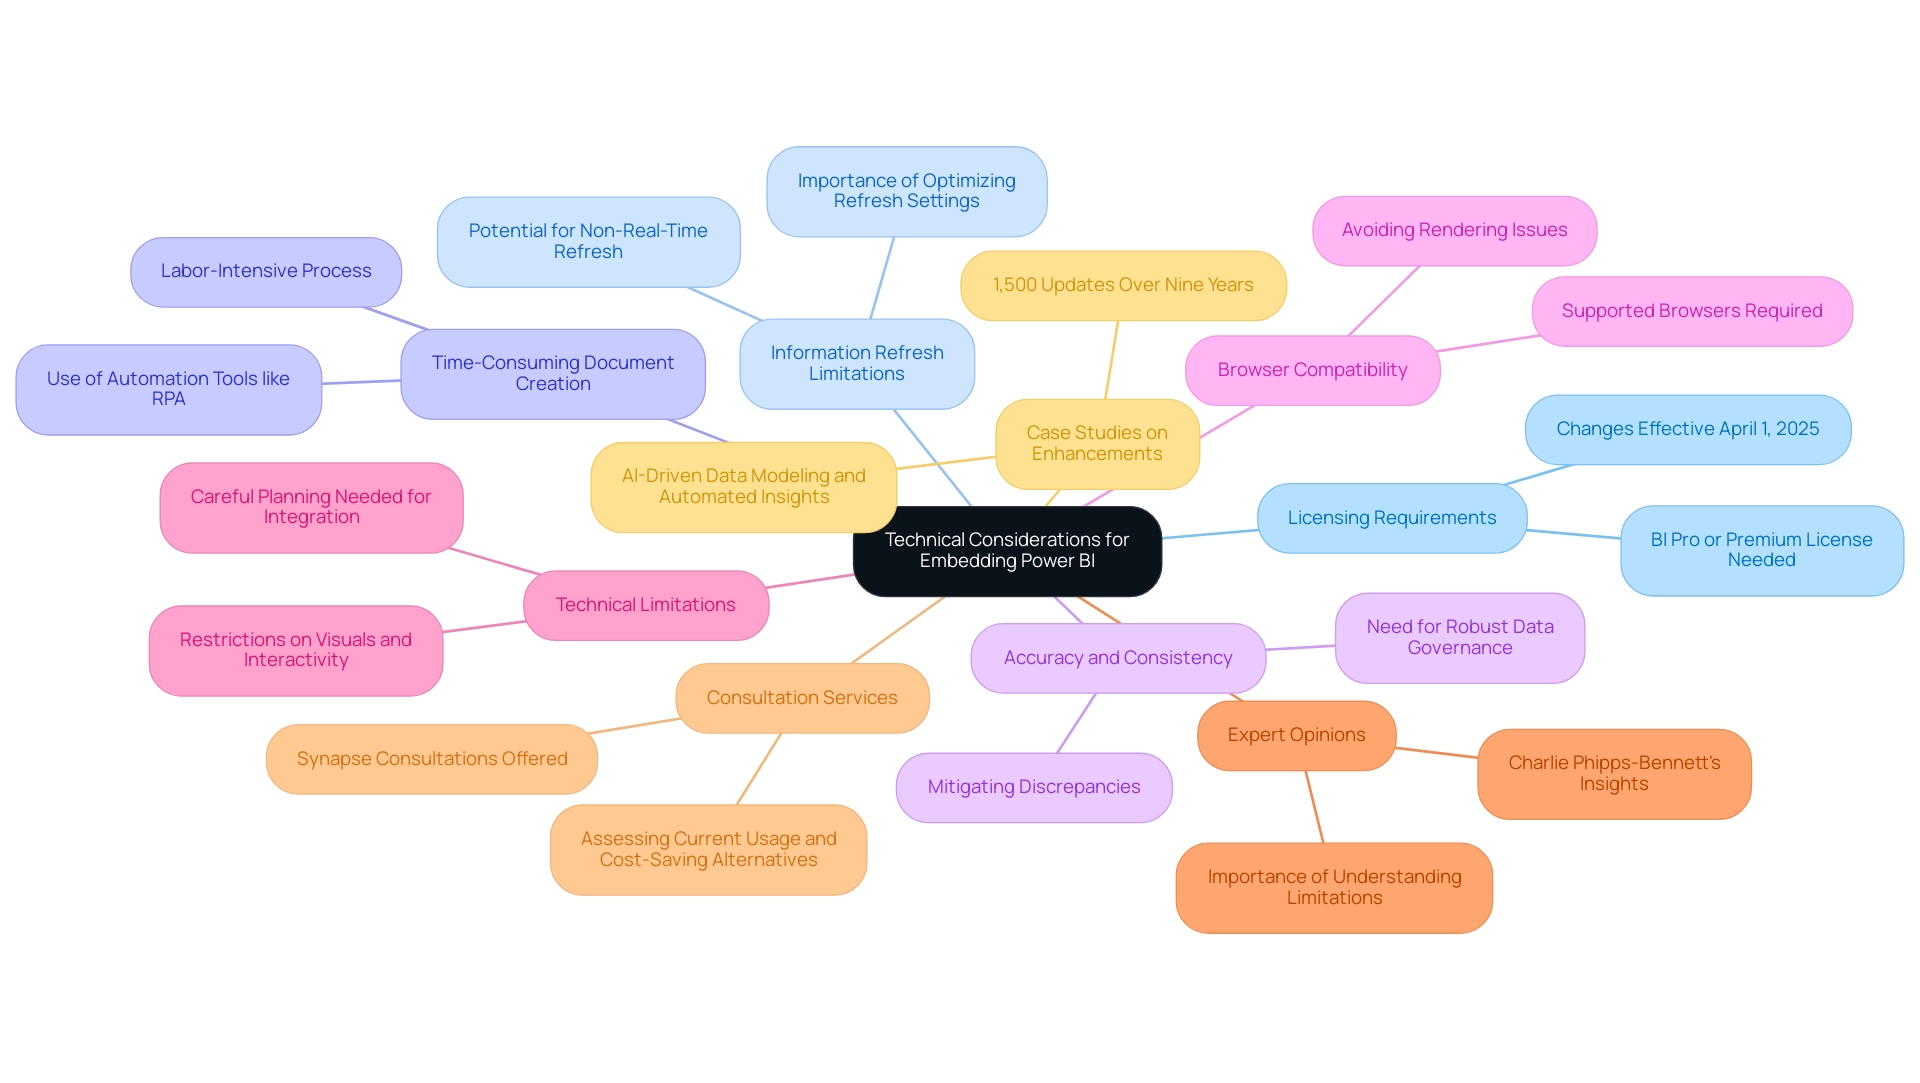
When embedding Power BI reports in SharePoint, several critical technical aspects must be considered to ensure a seamless integration. This is particularly important for enhancing operational efficiency and leveraging business intelligence for data-driven insights:
-
Licensing Requirements: To view embedded reports, users must possess either a BI Pro or Premium license. This requirement is essential for accessing the full capabilities of Power BI within SharePoint, especially as Microsoft continues to enhance its analytics offerings. As of April 1, 2025, these licensing adjustments reflect Microsoft’s commitment to innovation in the analytics space. As Charlie Phipps-Bennett states, ‘Microsoft is betting big on the future of analytics,’ underscoring the importance of remaining aware of these changes.
-
Information Refresh Limitations: One significant challenge is the potential for reports not to refresh in real-time, which can vary based on the source and configuration settings. It is crucial to optimize your data refresh settings to ensure that individuals are viewing the most current information. In 2025, understanding these limitations is vital, as they can significantly impact decision-making processes and hinder the extraction of actionable insights. With approximately 18,918 users actively engaging in community forums, there is a robust interest in overcoming these technical challenges and optimizing the use of the platform.
-
Time-Consuming Document Creation: The process of generating documents can be labor-intensive, often requiring significant manual effort. This can lead to delays in accessing critical insights, making it essential to streamline documentation generation through automation tools like RPA, which can help reduce the time spent on repetitive tasks.
-
Accuracy and Consistency: Ensuring accuracy and consistency across documents is a common challenge. Organizations must implement robust data governance practices to mitigate discrepancies, which can undermine the reliability of insights derived from Power BI dashboards.
-
Browser Compatibility: Users must access SharePoint through compatible browsers to avoid rendering issues with embedded documents. Ensuring that all team members are using supported browsers can mitigate technical difficulties and enhance the user experience, leading to improved operational efficiency.
-
Technical Limitations: Embedding BI in SharePoint may present certain technical limitations, such as restrictions on the types of visuals that can be displayed or the interactivity of reports. These limitations can influence how to publish Power BI to SharePoint, requiring careful planning during the integration process to maximize the effectiveness of business intelligence tools.
-
Expert Opinions: Industry experts emphasize the importance of understanding these technical limitations to maximize the effectiveness of BI within SharePoint. As Charlie Phipps-Bennett noted, “Microsoft is betting big on the future of data analytics,” highlighting the need for organizations to stay informed about evolving capabilities and requirements to drive growth through informed decision-making.
-
Consultation Services: Organizations looking to optimize their BI usage can benefit from consultations offered by Synapse, which help assess current usage and explore cost-saving alternatives regarding licensing. This tailored approach can address specific business challenges while enhancing efficiency through RPA solutions.
-
Case Studies on Enhancements: Over the past nine years, Microsoft has implemented over 1,500 updates to BI, focusing on enhancing experience and functionality. These improvements, featuring AI-driven information modeling and automated insights, seek to offer individuals smarter analytics tools and a more cohesive experience through deeper integration with Microsoft Fabric, positioning BI as a leading solution in analytics.
By addressing these aspects, including the challenges of time-consuming documentation creation and data inconsistencies, organizations can better navigate the complexities of embedding BI in SharePoint. This approach enables them to leverage the full potential of their data analytics capabilities, ultimately driving business growth and operational efficiency.
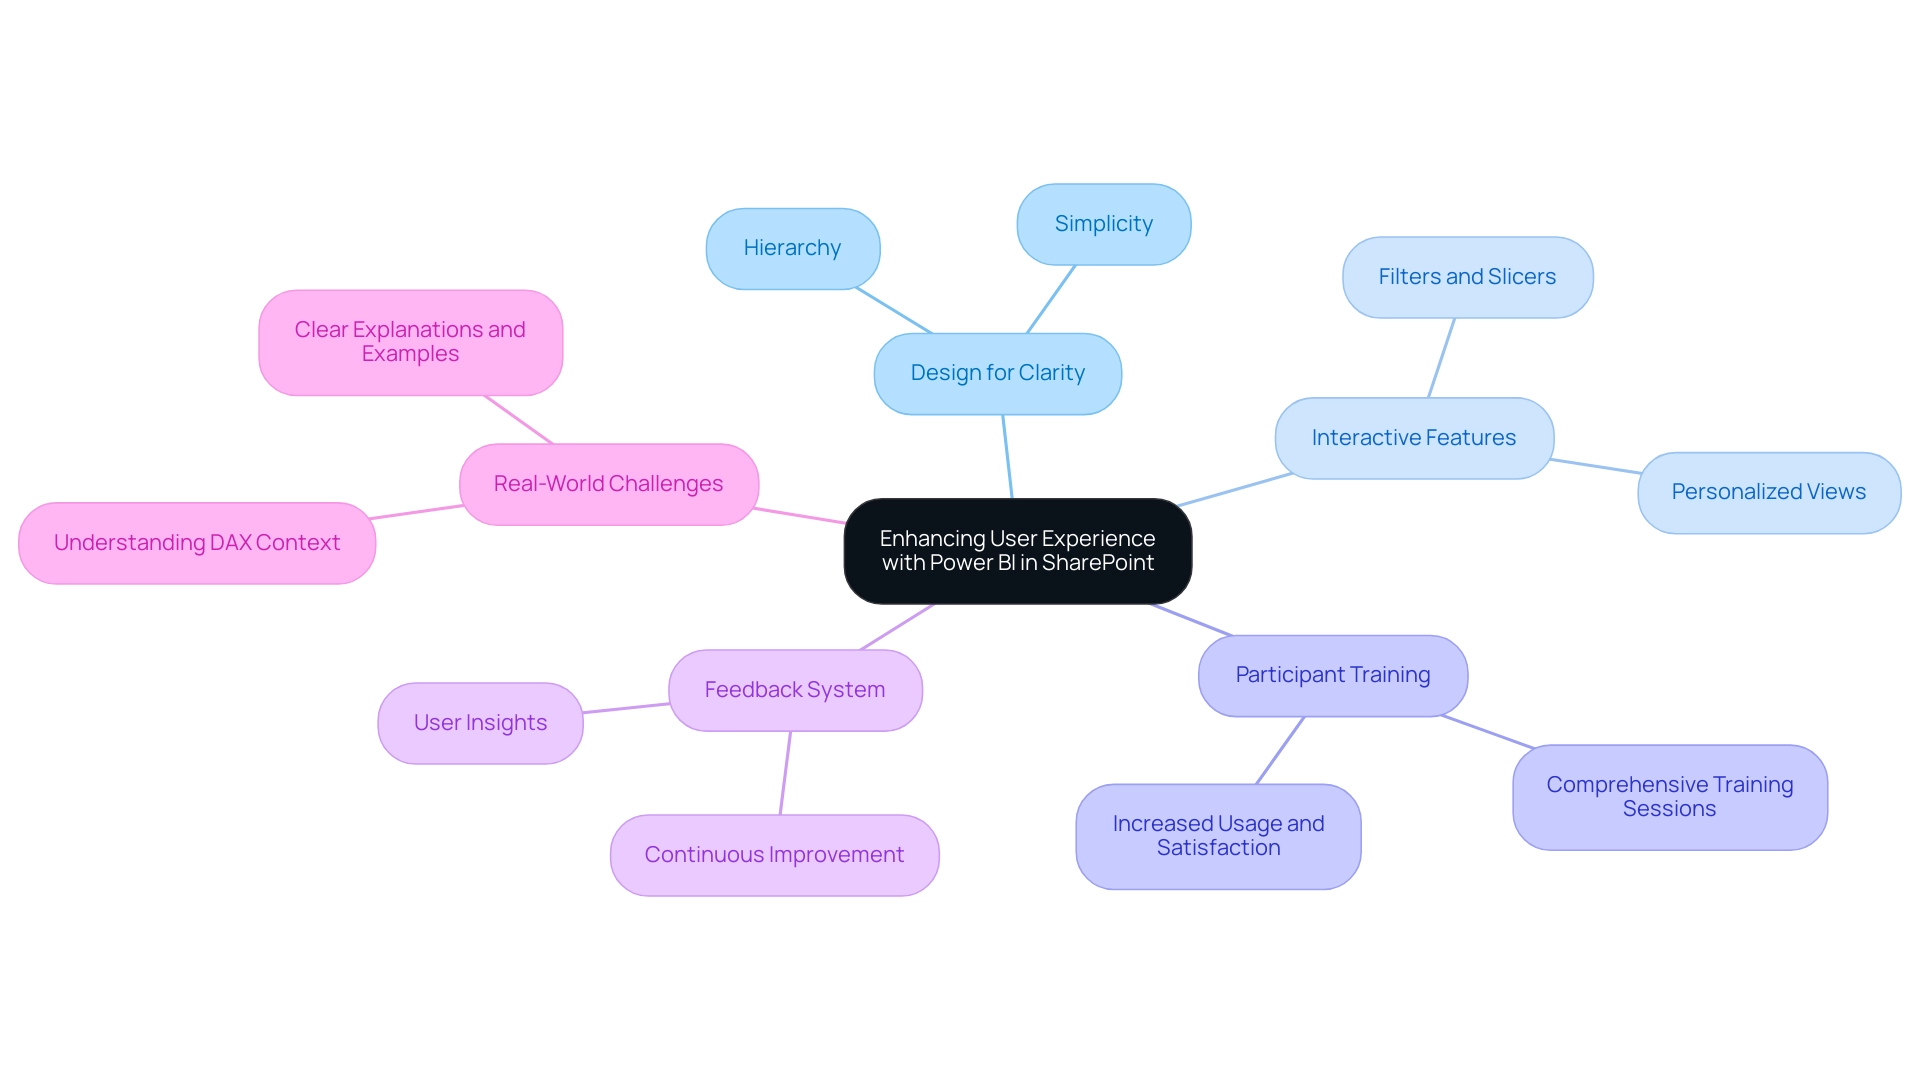
Best Practices for Enhancing User Experience with Power BI in SharePoint
To optimize user experience with Power BI reports in SharePoint, adopting best practices is essential.
-
Design for Clarity: Prioritize clear and concise visuals that facilitate easy interpretation. Overwhelming individuals with excessive information can hinder comprehension; thus, simplicity is key to enhancing engagement. Establishing hierarchies further streamlines exploration and analysis within Power BI, allowing for effective navigation through intricate datasets while avoiding common pitfalls like inconsistencies. Clear visuals not only aid in understanding but also provide actionable guidance, empowering stakeholders to make informed decisions based on the information presented.
-
Interactive Features: Utilize filters and slicers to enable individuals to personalize their views. This interactivity enhances user experience and promotes deeper exploration of the information, addressing the lack of actionable advice often found in documents. By allowing individuals to engage with the data, they can derive insights tailored to their specific needs.
-
Participant Training: Conduct comprehensive training sessions to equip individuals with the necessary skills to navigate and utilize BI analysis effectively. Research shows that organizations investing in user training experience significant increases in usage and overall satisfaction. The interest in best practices for Power BI is evident; a recent LinkedIn post on the topic garnered over 110,000 impressions. Such training alleviates the common issue of excessive time spent on document creation instead of leveraging insights, ultimately leading to more actionable outcomes.
-
Feedback System: Establish a robust feedback system to gather insights from users regarding document usability. As Patrick LeBlanc, Principal Program Manager, stated, “We highly value your feedback, so please share your thoughts using the feedback forum.” This continuous feedback loop allows for timely adjustments and enhancements, ensuring that documents remain relevant and user-friendly, thereby enhancing operational efficiency. Integrating user feedback can result in clearer actionable guidance in future documents.
-
Real-World Challenges: Address common difficulties users face, such as understanding row, query, and filter context in DAX. Clear explanations and straightforward examples can assist users in grasping how context influences their information, ultimately improving their experience with BI presentations and fostering organizational growth. By clarifying these concepts, users can better understand how to derive actionable insights from their data.
By implementing these strategies, organizations can significantly enhance their understanding of how to publish Power BI to SharePoint, leading to improved decision-making and operational efficiency. Furthermore, these practices align with RPA solutions by streamlining processes and ensuring that data-driven insights are readily accessible.
Troubleshooting Common Issues in Power BI and SharePoint Integration
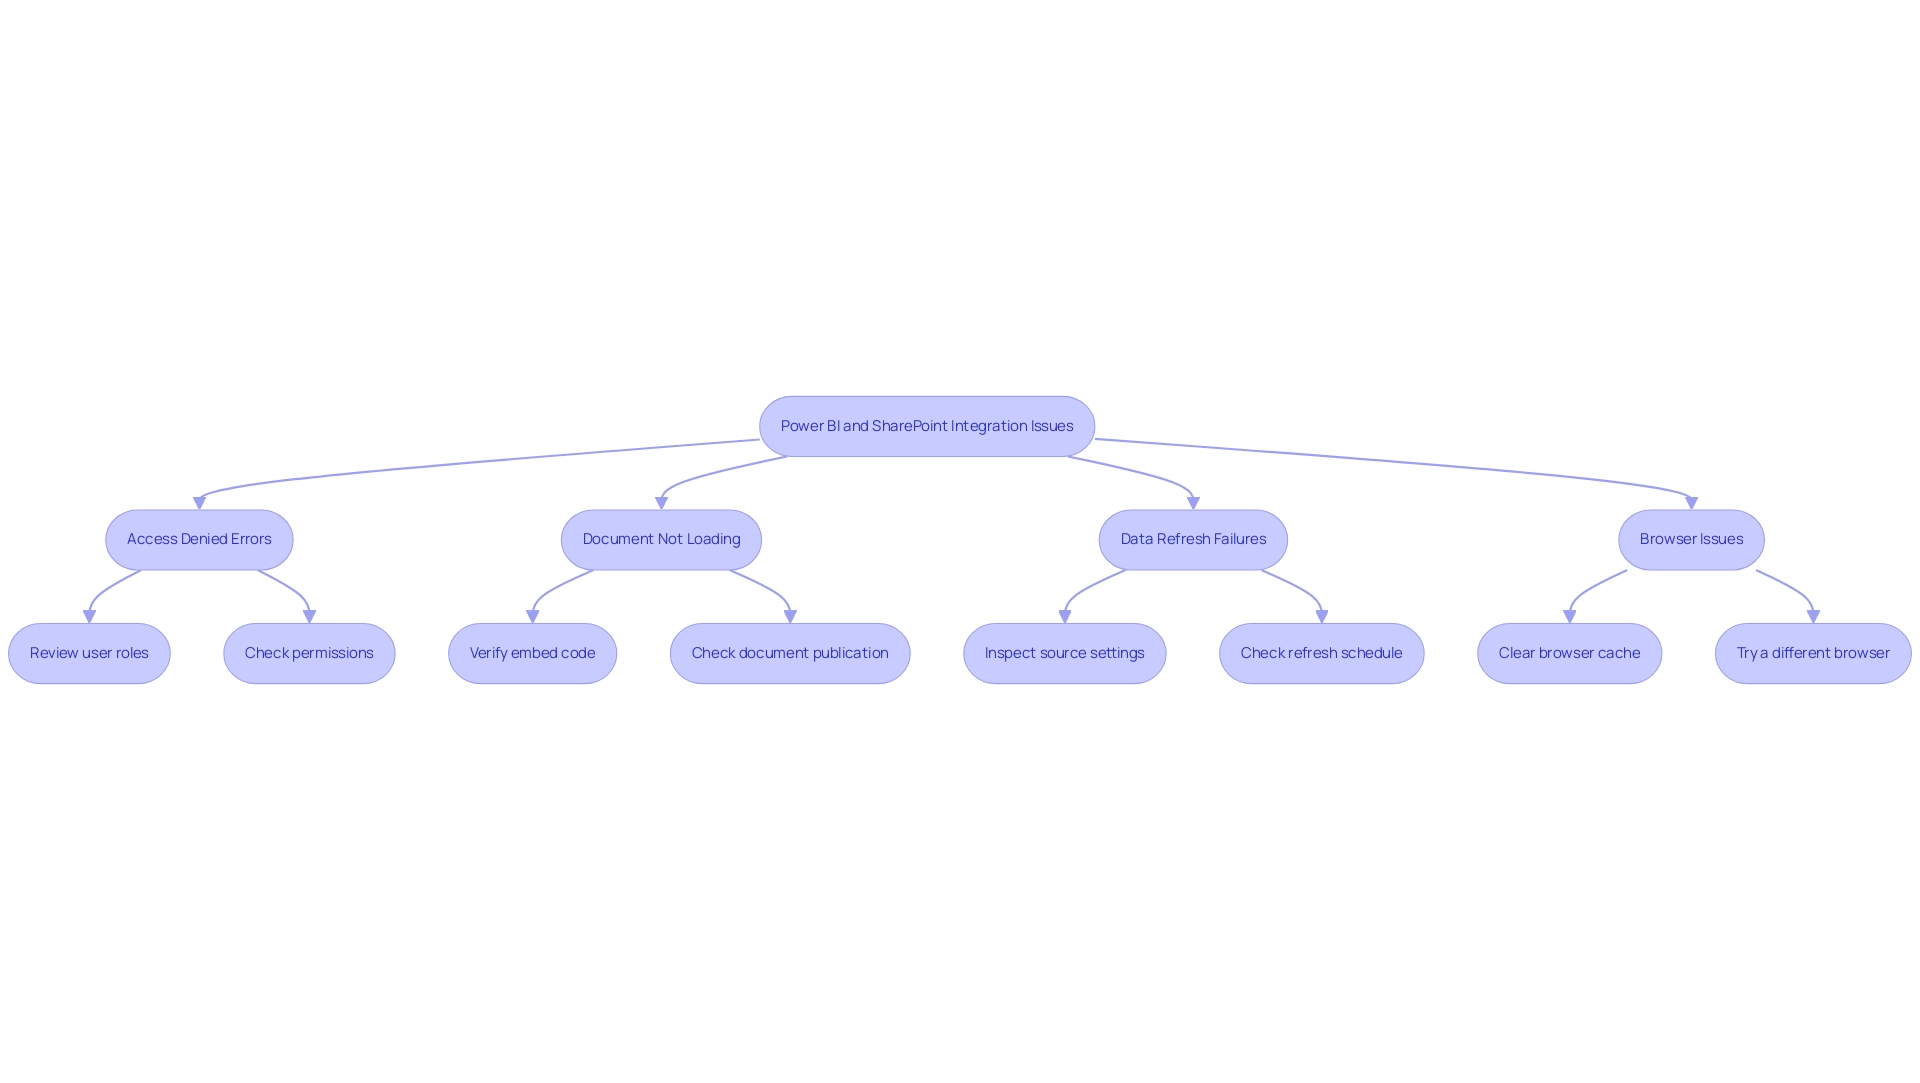
Integrating BI with SharePoint presents several challenges that can hinder effective data visualization and reporting, particularly when it comes to publishing Power BI to SharePoint. Understanding these challenges is crucial for overcoming them.
-
Access Denied Errors: Approximately 25% of users encounter access denied errors when attempting to view reports. To resolve this, ensure that users have the appropriate permissions in both BI and SharePoint. It is essential to meticulously review user roles and access settings to prevent these errors from occurring.
-
Document Not Loading: If documents fail to load, verify that the embed code is accurate and that the document has been successfully published in the BI service. Double-checking these elements can often resolve loading issues.
-
Data Refresh Failures: Data refresh failures can disrupt the flow of information. If updates are not occurring as expected, inspect the source settings and refresh schedule within Power BI. Ensuring that connections are properly set up is vital for maintaining current summaries.
-
Browser Issues: Users may experience loading problems due to browser-related issues. Clearing the browser cache or trying a different browser can often alleviate these problems.
A recent case study highlighted how businesses in information-rich environments struggled to extract meaningful insights from their raw data. They faced time-consuming report creation and inconsistencies, which often led to a lack of actionable guidance. By implementing effective troubleshooting strategies, they transformed their information into actionable insights, facilitating informed decision-making and driving operational efficiency.
This underscores the importance of addressing integration issues promptly to leverage the full potential of BI and SharePoint.
Moreover, integrating Robotic Process Automation (RPA) solutions can enhance operational efficiency by automating repetitive tasks related to information management. Tools like EMMA RPA and Automation streamline processes, reduce task repetition fatigue, and mitigate staffing shortages. As of 2025, BI is noted to efficiently process up to 30,000 rows of data without performance issues, establishing it as a robust tool for data analysis.
However, executing R and Python scripts in BI is limited to users with personal gateways, which can affect overall performance. Understanding these limitations and common problems is essential for optimizing how to publish Power BI to SharePoint. As Mr. Pullen, a Microsoft Employee, stated, “The data you want is available from Graph API – here https://graph.microsoft.com/v1.0/sites/{site-id}/lists/{list-id}/items/{item-id}/getActivitiesByInte...” This resource can be invaluable for troubleshooting data access issues.
Conclusion
The integration of Power BI and SharePoint is transforming how organizations approach data visualization and collaboration. By embedding interactive Power BI reports directly into SharePoint, businesses enhance accessibility to insights and cultivate a culture of data-driven decision-making. Exploring effective publishing methods, such as utilizing the Power BI web part and integrating SharePoint lists, underscores the importance of enabling real-time data visualization for timely decision-making.
Managing permissions and ensuring secure access to reports is crucial for maintaining data integrity. Implementing structured permission management practices, alongside robust testing protocols, guarantees that sensitive information is accessible only to authorized personnel. As organizations increasingly rely on real-time analytics, addressing technical considerations—such as licensing requirements, data refresh limitations, and browser compatibility—becomes essential for optimizing the user experience.
Best practices for enhancing user experience—including clear design, interactive features, and user training—play a vital role in maximizing the effectiveness of Power BI reports within SharePoint. Establishing a feedback mechanism allows organizations to continuously refine their reporting tools, ensuring relevance and usability.
As businesses prepare for the future, the integration of Power BI and SharePoint stands as a beacon for enhancing operational efficiency and driving growth. By embracing these tools and following best practices, organizations can transform raw data into actionable insights, paving the way for informed decision-making and innovation in an increasingly data-rich landscape. The time to harness the power of this integration is now, as it holds the potential to revolutionize how teams collaborate and derive insights from their data.
Overview
The key differences between diagnostic and descriptive analytics are rooted in their focus and methodologies. Descriptive analytics summarizes past data to answer the question, “What occurred?” In contrast, diagnostic analytics delves into the underlying reasons behind trends, addressing the inquiry, “Why did it happen?” This distinction is crucial for organizations seeking to leverage data effectively.
Descriptive analytics identifies patterns in historical data, such as sales trends, providing a clear snapshot of past performance. On the other hand, diagnostic analytics employs advanced techniques like regression analysis to uncover the root causes of performance changes. This deeper investigation enables organizations to make informed decisions and strategic adjustments, ultimately enhancing their operational effectiveness.
By understanding these differences, professionals can better utilize analytics to drive business success. Are you leveraging the right analytical approach to uncover insights and inform your strategies?
Introduction
In a world where data drives decision-making, understanding the nuances between diagnostic and descriptive analytics is essential for organizations aiming to enhance operational efficiency. Descriptive analytics provides a retrospective view, summarizing historical data to reveal trends and performance metrics. In contrast, diagnostic analytics delves deeper, uncovering the reasons behind those trends.
As automation technologies like Robotic Process Automation (RPA) become increasingly integrated into business processes, leveraging both analytics types empowers organizations to transform raw data into actionable insights.
This article explores the distinct roles of these analytics, their methodologies, and real-world applications, illustrating how businesses can harness their power to foster innovation and drive growth in an ever-evolving landscape.
Understanding the Basics of Diagnostic and Descriptive Analytics
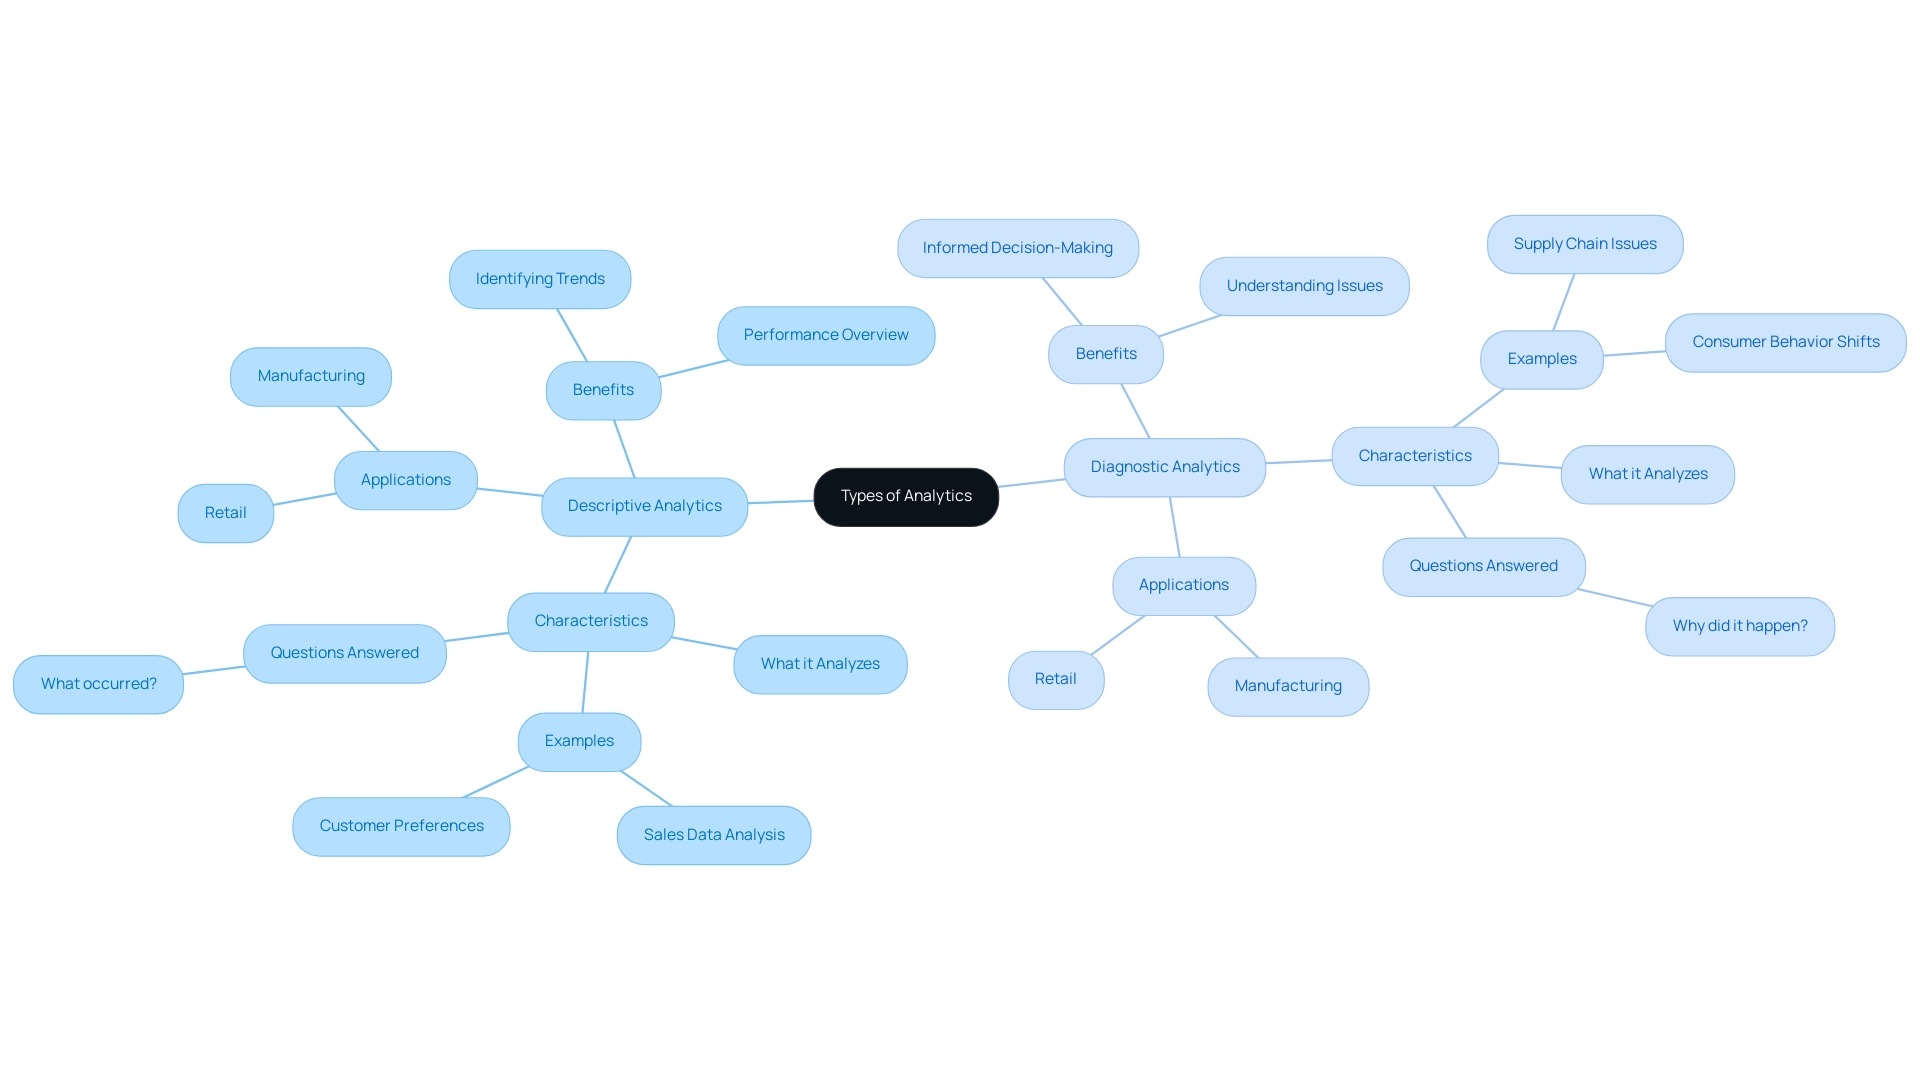
In the realm of automation technologies such as Robotic Process Automation (RPA), diagnostic and descriptive analytics fulfill distinct yet complementary roles in analysis. Descriptive analysis provides an overview of past information, answering the essential question: ‘What occurred?’ It focuses on identifying trends and patterns from historical data, enabling organizations to understand their performance over time.
For instance, a retail firm may employ descriptive analysis to scrutinize sales data from the previous quarter, revealing peak sales periods and customer preferences.
Conversely, diagnostic analysis delves deeper to uncover the reasons behind these trends, addressing the question: ‘Why did it happen?’ This analysis identifies causal relationships and sequences within the data, which is vital for comprehending trends. For example, if sales drop in a specific month, diagnostic analysis can reveal underlying issues such as supply chain disruptions or shifts in consumer behavior.
As Eric Wilson, Director of Thought Leadership at The Institute of Business Forecasting (IBF), emphasizes, “Companies that utilize experienced demand planners opt for diagnostic analysis as it provides comprehensive insights into an issue and additional information to aid business decisions.”
Understanding the distinctions between diagnostic and descriptive analytics is essential for effective decision-making. By 2025, organizations employing both types of data analysis, supported by innovative tools like EMMA RPA and Microsoft Power Automate, can significantly enhance operational efficiency and strategic planning. These RPA solutions not only minimize errors but also liberate teams to concentrate on more strategic, value-adding tasks, addressing the challenges posed by manual, repetitive workflows.
Recent findings indicate that companies utilizing diagnostic analysis gain a detailed understanding of issues, offering more thorough information to support organizational decisions. This is especially critical in a data-rich environment where informed decision-making is paramount.
Real-world applications vividly illustrate these distinctions. For example, a manufacturing firm might use descriptive analytics to monitor production output while employing diagnostic analytics to investigate the causes of production delays. By integrating both approaches and leveraging RPA solutions, businesses can summarize their historical performance and derive actionable insights that drive future improvements.
Tools like Adobe Analytics facilitate the transformation of data into actionable insights, further enhancing analytical capabilities.
In summary, while diagnostic and descriptive analytics provide a snapshot of past events, diagnostic evaluation offers the context necessary to understand why those events occurred. This dual approach, empowered by RPA and AI-driven enhancements, enables organizations to make data-driven decisions that enhance operational efficiency and capitalize on market opportunities. By addressing task repetition fatigue and improving employee morale, RPA tools play a crucial role in supporting organizations on their journey toward operational excellence.
The Role of Descriptive Analytics: What Happened?
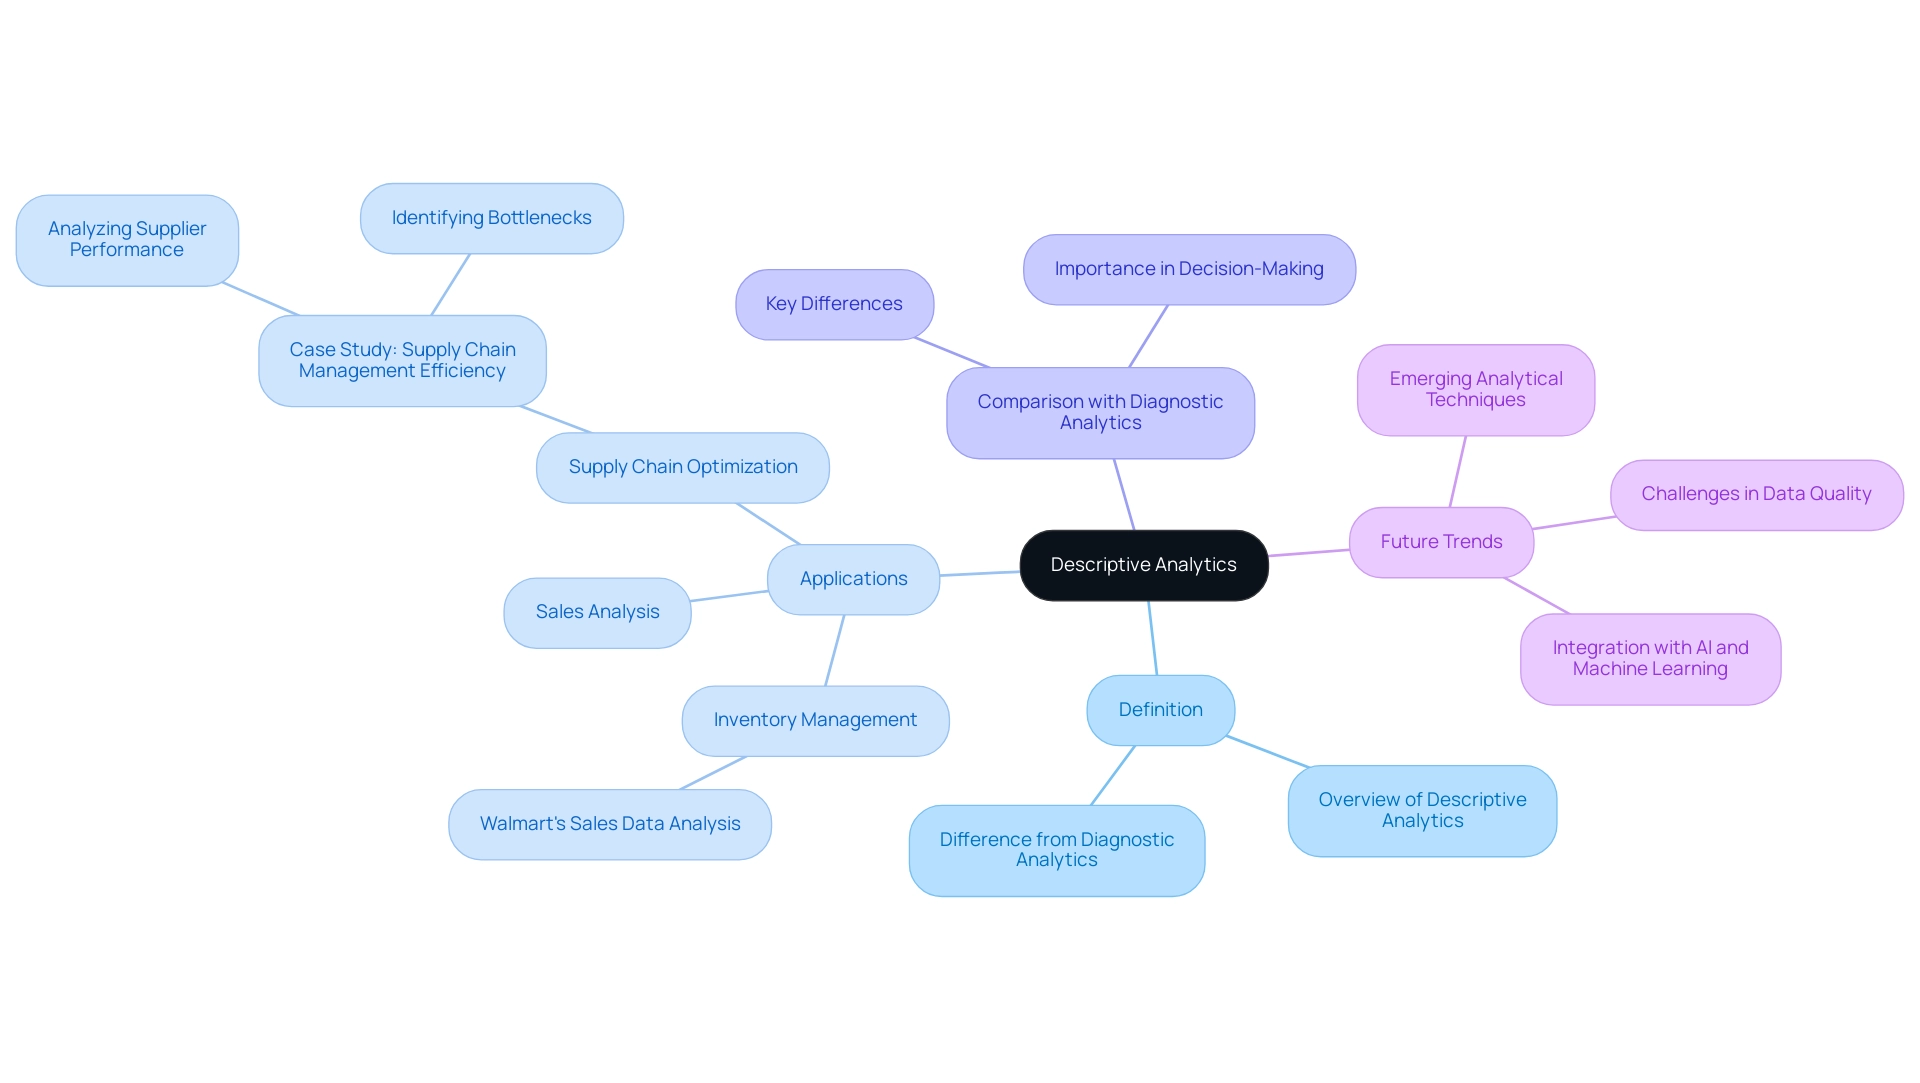
Descriptive analysis is essential in examining information, particularly when distinguishing between diagnostic and descriptive analytics. It serves as the foundational step that provides a comprehensive overview of historical performance. By employing statistical techniques, this analysis summarizes information through calculations of averages, totals, and trends over time, emphasizing the differences between diagnostic and descriptive analytics. For instance, Walmart efficiently utilizes detailed analysis to evaluate past sales data, enabling improvements in inventory requirements and enhancing store operations.
This method not only identifies peak sales periods but also reveals overall growth trends, which are crucial for businesses aiming to understand their current market position through diagnostic and descriptive analytics while strategizing for the future.
As we approach 2025, the significance of detailed analysis continues to grow, particularly as companies increasingly integrate artificial intelligence and machine learning into their evaluation processes. This integration fosters more sophisticated predictive capabilities, enhancing decision-making and operational efficiency. As industry expert Andy Morris asserts, “Diagnostic vs descriptive analytics provides vital information about a company’s performance,” facilitating effective communication of performance metrics both internally and externally, which is essential for attracting potential investors and lenders.
Present optimal methods in explanatory analysis underscore the importance of prompt information gathering and examination. Companies are encouraged to streamline their processes, as research indicates that organizations spend an average of 30% of their analytics time on tasks related to diagnostic and descriptive analytics. By optimizing these processes, organizations can focus more on strategic initiatives that drive growth, such as utilizing Power BI services for improved information reporting and actionable insights, or deploying Robotic Process Automation (RPA) to automate manual workflows and enhance operational efficiency, thereby underscoring the importance of understanding diagnostic and descriptive analytics.
RPA can significantly streamline workflows by automating repetitive tasks, reducing errors, and allowing team members to concentrate on more strategic work. Furthermore, leveraging Small Language Models and GenAI Workshops can enhance analytical capabilities by providing tailored AI solutions that improve quality and training processes.
Case studies illustrate the practical applications of diagnostic and descriptive analytics in enhancing organizational performance. For example, in supply chain management, businesses analyze information related to supplier performance, inventory levels, and transportation to identify bottlenecks and inefficiencies. This proactive approach enables timely improvements, ultimately leading to enhanced overall supply chain performance through the utilization of diagnostic and descriptive analytics.
By employing detailed analysis alongside AI-powered solutions, organizations can grasp the distinctions between diagnostic and descriptive analytics to pinpoint specific areas for improvement, ensuring efficient resource allocation.
As organizations navigate the complexities of a knowledge-rich environment, the capacity to summarize past information effectively through diagnostic and descriptive analytics becomes increasingly vital. By leveraging these insights, organizations can transform raw data into actionable intelligence, fostering informed decision-making and promoting innovation. Moreover, the evolving trends in data analysis, particularly the integration with AI and machine learning, alongside customized solutions that leverage Business Intelligence, are set to revolutionize how companies utilize diagnostic and descriptive analytics, making it an even more effective tool for operational efficiency.
Additionally, addressing the challenges of inadequate master data quality is crucial to ensuring that descriptive analysis yields accurate and reliable insights.
The Purpose of Diagnostic Analytics: Why Did It Happen?
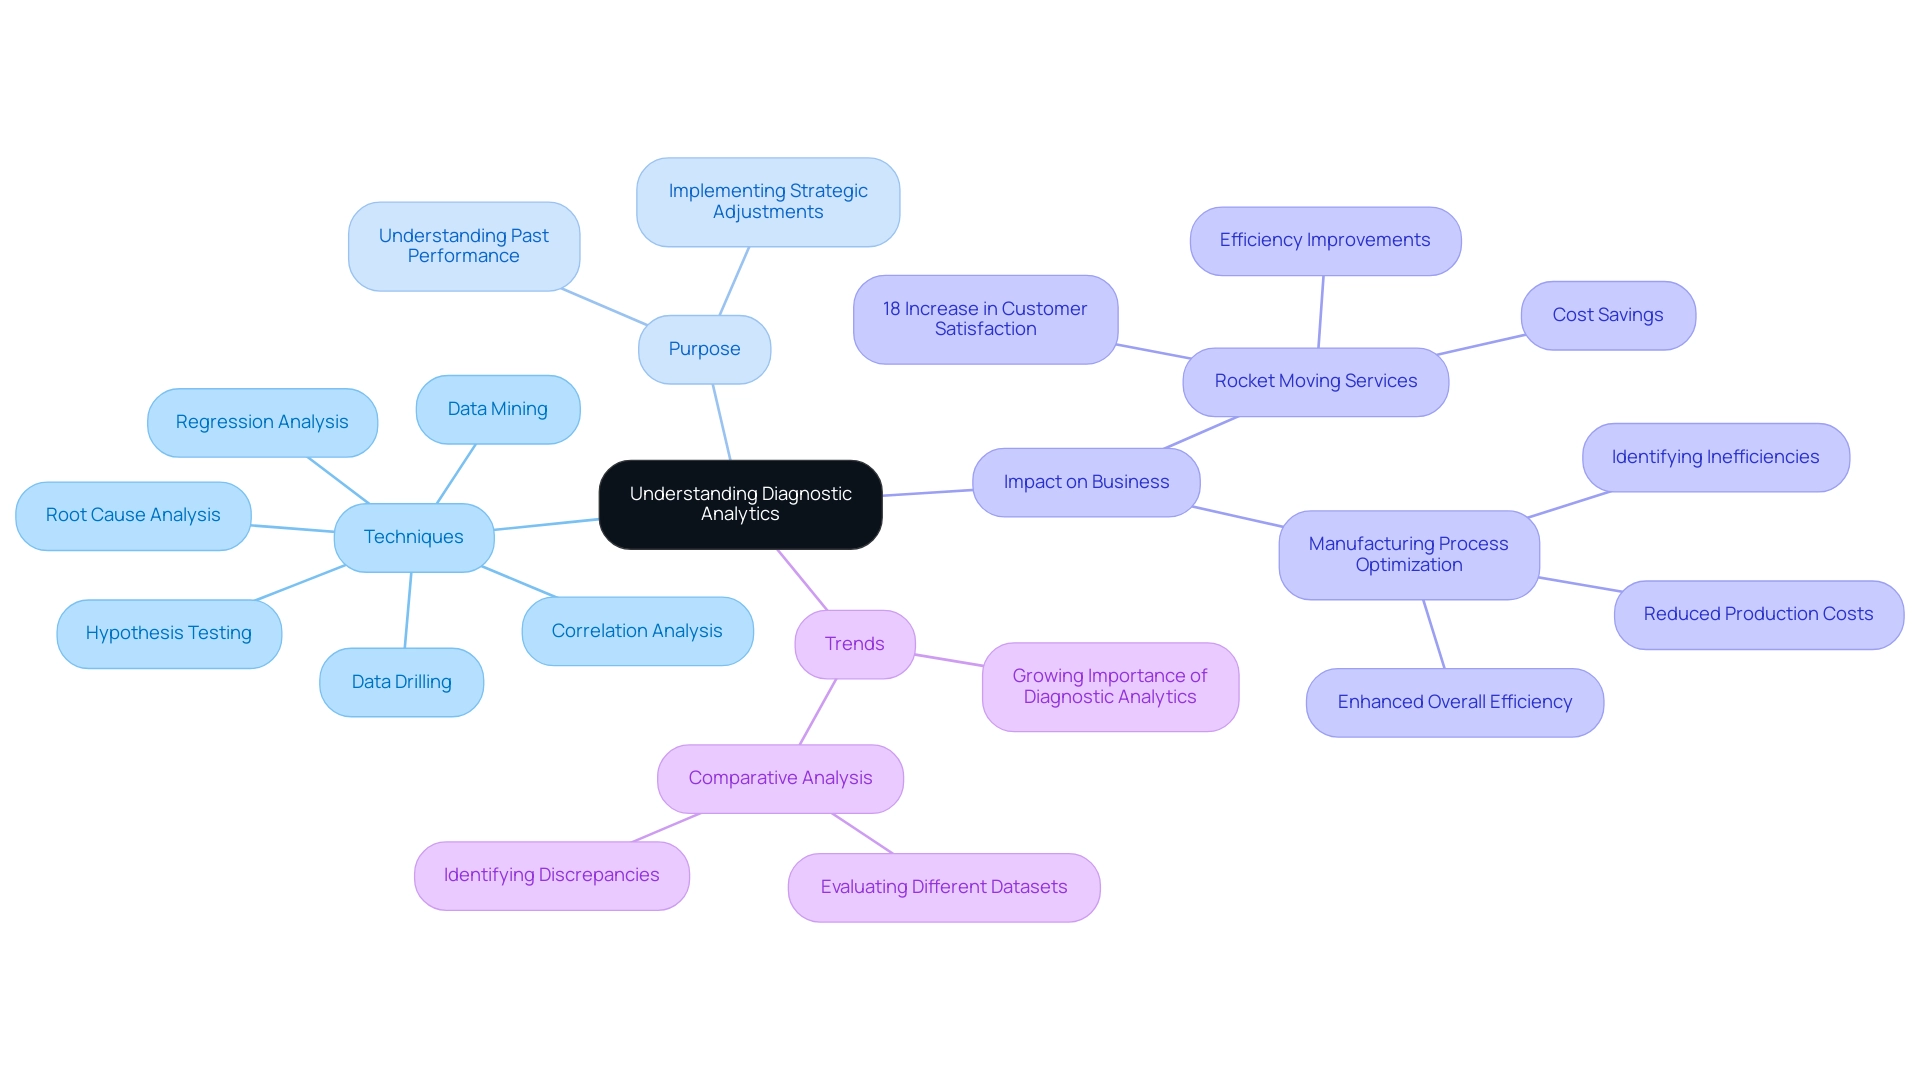
The concept of diagnostic versus descriptive analytics underscores the distinction between merely reporting past information and delving deeper to uncover the root causes of performance variations. By leveraging advanced techniques such as:
- data mining
- correlation analysis
- regression analysis
- data drilling
- root cause analysis
organizations can reveal patterns and anomalies that clarify past performance. For instance, when a company faces a sudden decline in sales, diagnostic analysis can identify critical factors, such as shifts in customer preferences or adverse market conditions, that may have contributed to this downturn.
This analytical approach not only aids in pinpointing root causes but also empowers organizations to implement strategic adjustments effectively.
In the realm of operational efficiency, adopting technologies like Robotic Process Automation (RPA) can significantly enhance processes. RPA solutions, such as EMMA RPA, which offers intelligent automation capabilities, and Microsoft Power Automate, designed for seamless workflow automation, are tailored to automate manual workflows. This automation liberates teams to focus on more strategic, value-adding work. Such integration not only boosts employee morale by alleviating repetitive task fatigue but also fosters a streamlined workflow, enabling organizations to swiftly adapt to market changes.
The purpose of diagnostic analysis in business is multifaceted. It serves as a crucial tool for comprehending past events, allowing organizations to learn from experiences and refine operational strategies. A notable example is Rocket Moving Services, where implementing diagnostic analysis resulted in an 18% increase in customer satisfaction.
As Christopher Vardanyan, co-founder of Rocket Moving Services, stated, “diagnostic analysis has played a key role in improving our local moving services.” By examining customer feedback and operational data, we identified that utilizing larger trucks allowed us to accommodate more items in one trip, thus reducing the need for multiple trips. This adjustment led to shorter overall moving times and lower fuel and labor costs for both our company and our clients.
This optimization not only enhanced efficiency but also yielded substantial cost savings for both the company and its clients.
Current trends in information extraction and correlation analysis highlight the growing importance of diagnostic versus descriptive analytics in identifying performance issues. Techniques such as hypothesis testing are increasingly employed to uncover the reasons behind observed trends. For example, manufacturing firms utilize diagnostic analysis to identify inefficiencies in their production processes by analyzing data to uncover root causes of delays.
This leads to optimized processes, reduced production costs, and improved overall efficiency.
In 2025, experts emphasize the significance of diagnostic versus descriptive analytics in understanding business performance. By employing comparative analysis, organizations can evaluate different datasets or periods to identify discrepancies and potential causes of performance changes. Furthermore, by addressing the challenges of technology implementation, organizations can leverage RPA to streamline operations and overcome barriers to efficiency.
This comprehensive approach not only enhances operational efficiency but also cultivates a culture of continuous improvement, ultimately driving growth and innovation.
Methodologies: How Descriptive and Diagnostic Analytics Differ
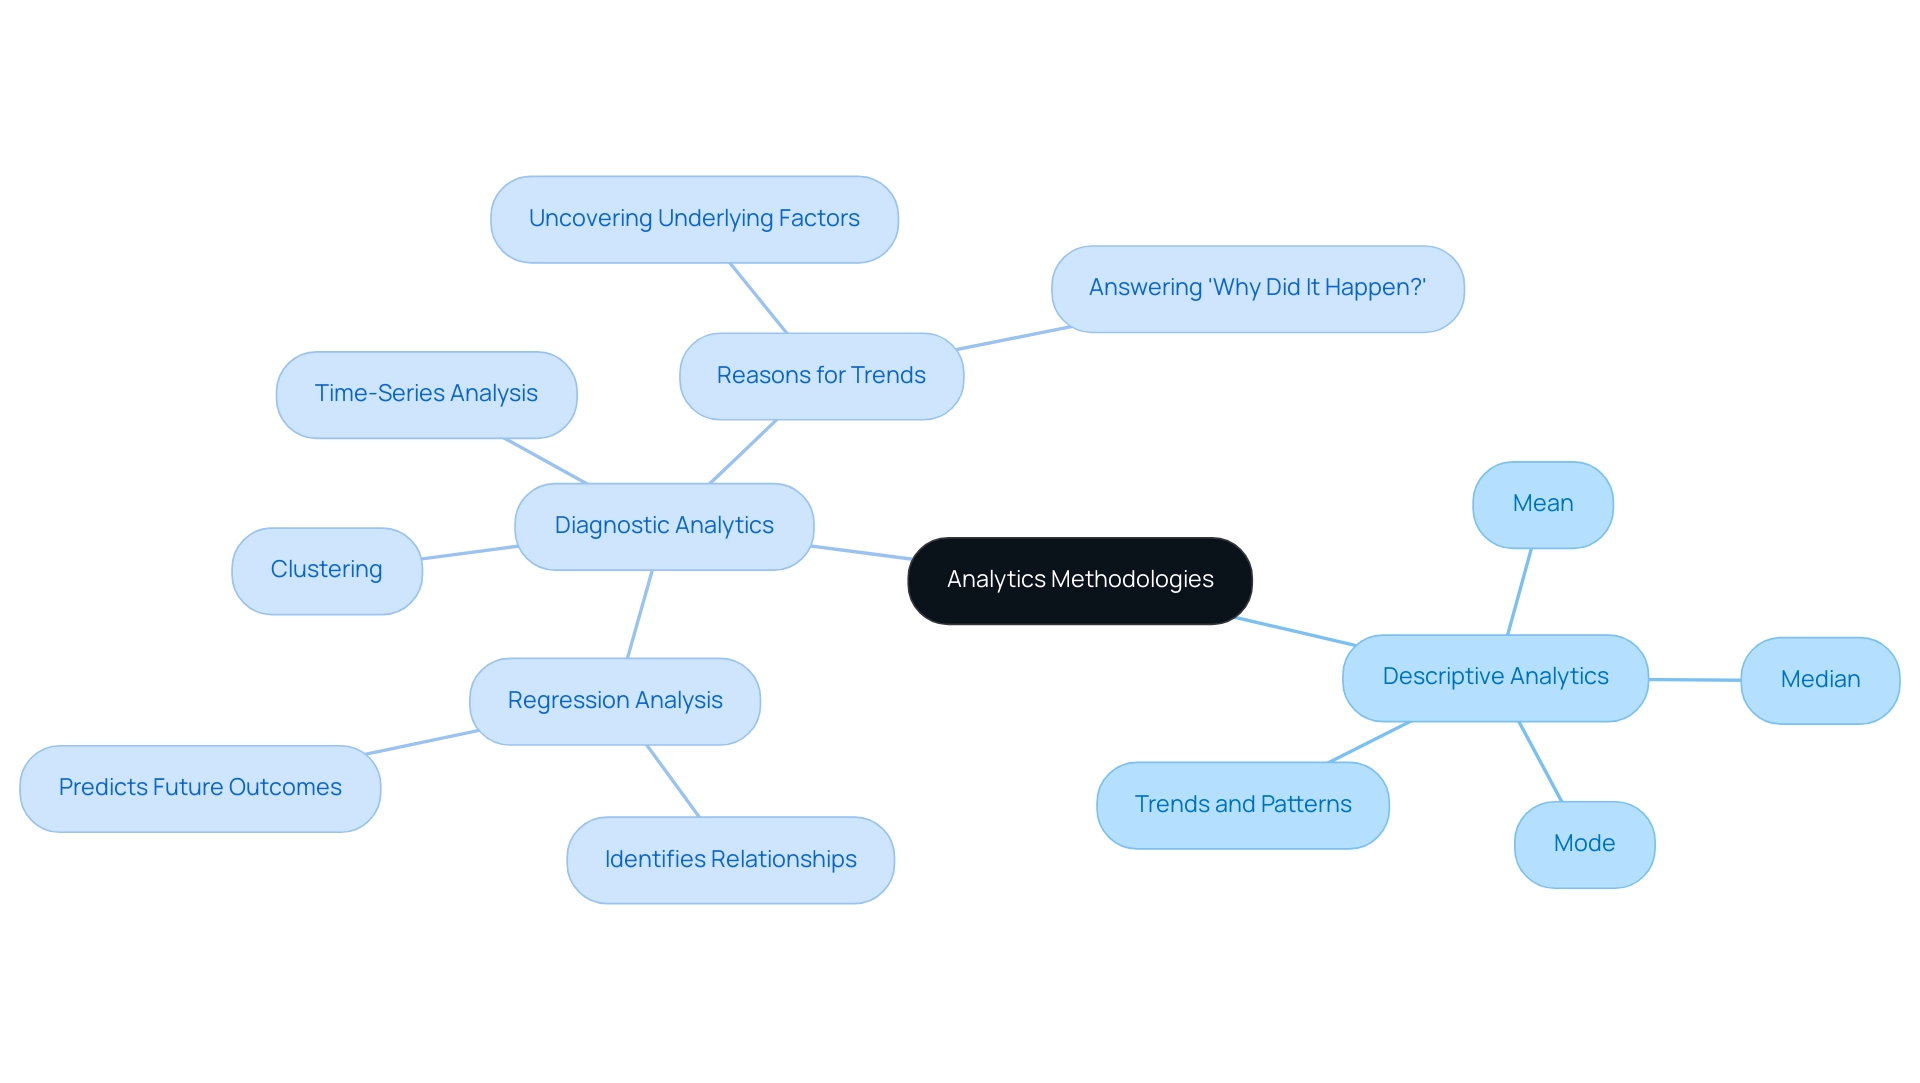
Descriptive analysis primarily relies on fundamental statistical techniques such as mean, median, and mode to provide a clear summary of information. These techniques are essential for presenting a snapshot of performance metrics, enabling organizations to swiftly recognize trends and patterns. For instance, a company might observe that sales figures peaked in a particular quarter.
However, the true value of analytics becomes apparent when we transition to diagnostic analytics, which employs more sophisticated methodologies like regression analysis, clustering, and time-series analysis. These techniques delve deeper into the data, uncovering the underlying reasons for observed trends and answering critical questions such as ‘why did it happen?’ In today’s overwhelming AI landscape, businesses often struggle to pinpoint suitable analytical tools tailored to their unique needs, making it crucial to have solutions that cut through the noise.
A practical illustration of this distinction can be seen in the case of Canadian Tire, which achieved nearly a 20% increase in sales by leveraging AI-powered insights to examine purchasing behavior. This diagnostic approach enabled them to identify key factors driving customer purchases, such as effective marketing strategies and seasonal demand shifts. As we approach 2025, the methodologies employed in both descriptive and diagnostic analytics continue to evolve, with organizations increasingly adopting advanced statistical techniques to enhance their analytical capabilities.
For instance, regression analysis not only identifies relationships between variables but also aids in predicting future outcomes based on historical information. As Anik Sengupta, a Staff Engineer, notes, ‘Regression analysis identifies the relationship between a dependent variable and one or more independent variables.’ This predictive power is invaluable for organizations aiming to make informed decisions in a rapidly changing environment.
Moreover, the current landscape underscores the importance of understanding these methodologies. Experts in the field emphasize that a robust analytical framework is crucial for organizations seeking to optimize their operations and drive growth. By distinguishing between diagnostic and descriptive analytics, organizations can better utilize their information, transforming raw details into actionable insights that guide strategic initiatives.
Furthermore, advancements in technology are facilitating real-time prescriptive analysis, further enhancing organizations’ abilities to examine and react to trends. Harnessing Business Intelligence alongside RPA solutions stands at the forefront of this evolution, as RPA can automate data collection and processing, driving data-driven insights and operational efficiency for sustained business growth.
Real-World Applications: Leveraging Descriptive and Diagnostic Analytics
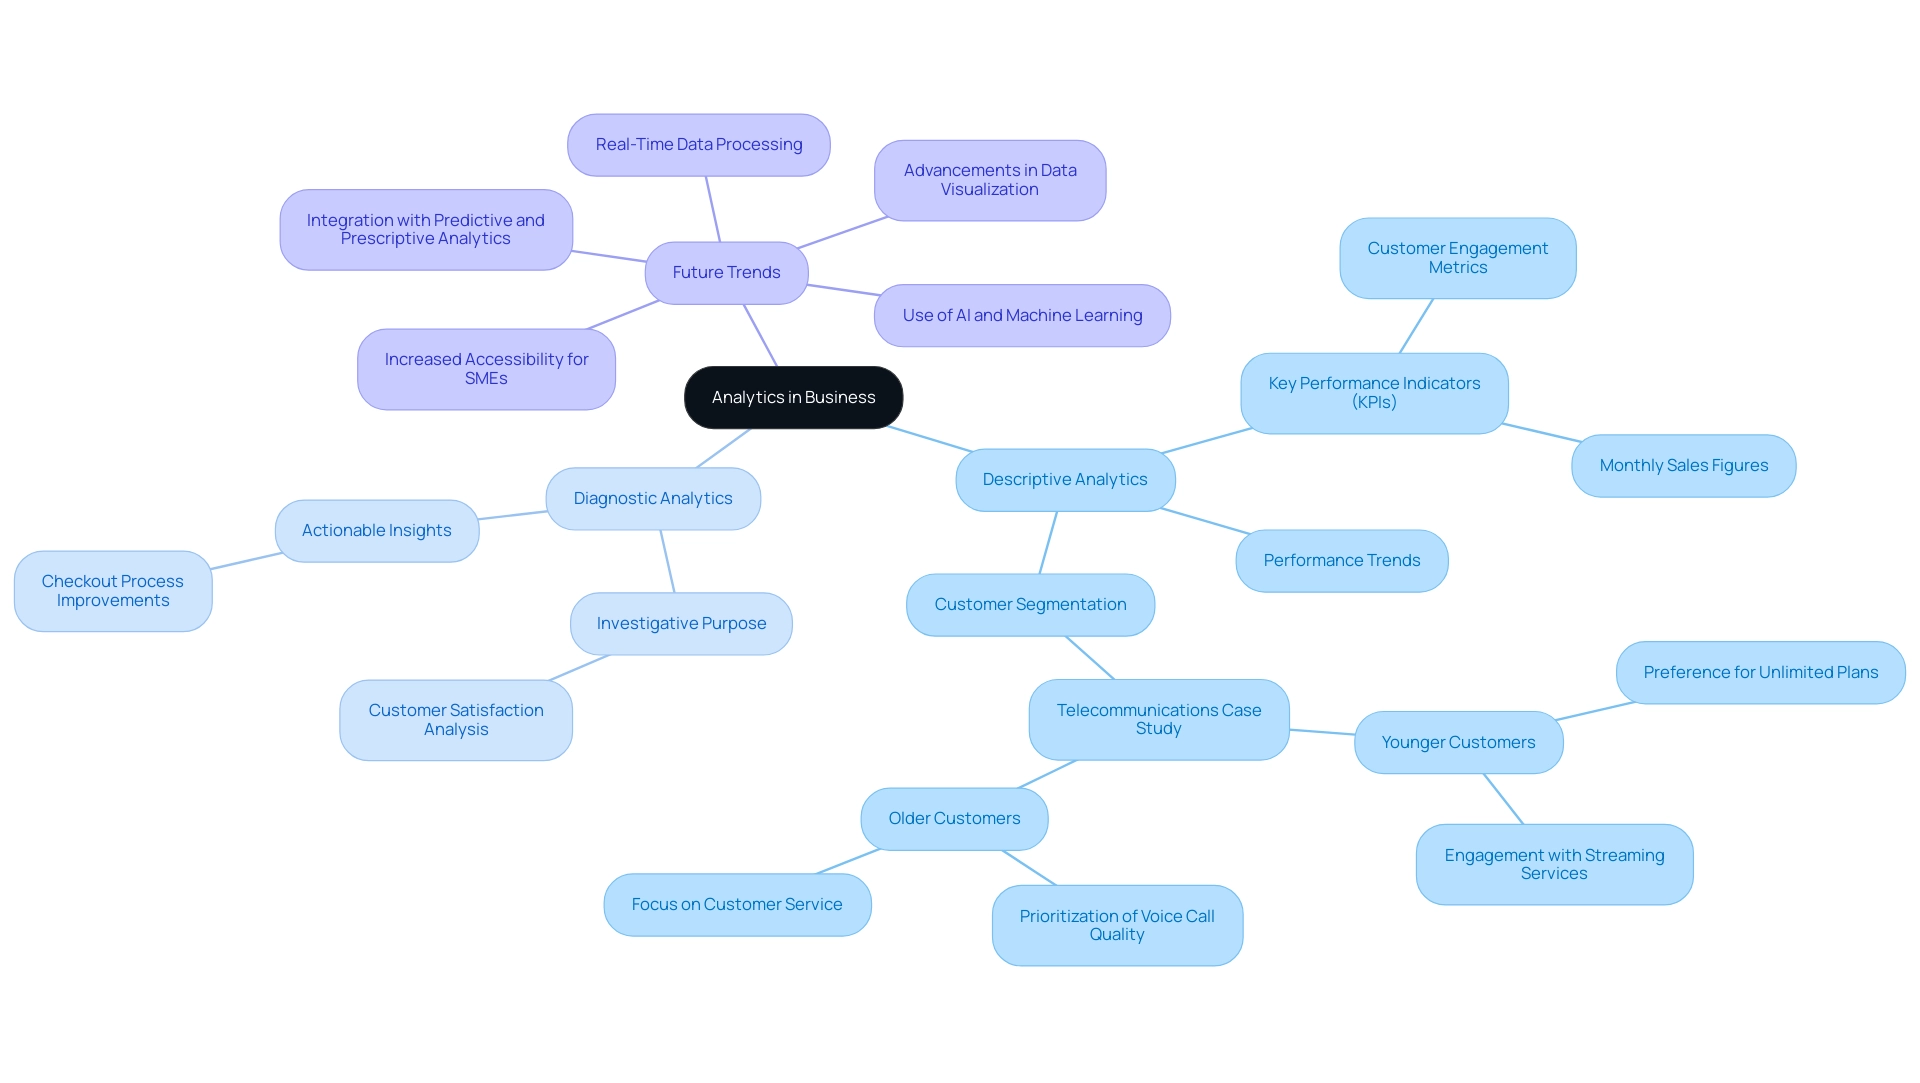
Businesses effectively utilize descriptive data analysis to create comprehensive reports encapsulating key performance indicators (KPIs), such as monthly sales figures and customer engagement metrics. This approach enables organizations to monitor performance trends over time, providing a clear picture of operational health. In contrast, the distinction between diagnostic and descriptive analytics reveals that diagnostic analysis serves a more investigative purpose, allowing companies to delve into specific challenges, such as pinpointing the causes behind a dip in customer satisfaction scores.
By meticulously analyzing feedback information and correlating it with operational changes, businesses can identify actionable insights for targeted improvements.
In today’s overwhelming AI landscape, businesses often struggle to identify the right solutions that meet their specific needs. Tailored solutions can help cut through the noise to harness the power of Business Intelligence. For example, a telecommunications firm utilized descriptive analysis to segment its customer base, revealing distinct usage patterns and preferences across various demographic groups.
This analysis indicated that younger customers favored unlimited plans and heavily engaged with streaming services, while older customers prioritized voice call quality and customer service. Such insights can guide focused marketing approaches and service improvements, ultimately boosting operational efficiency and company growth. Moreover, the distinction between diagnostic and descriptive analytics can lead to substantial enhancements in customer satisfaction.
A retail company, for example, might uncover that extended checkout times correlate with decreased customer satisfaction. By streamlining their checkout processes based on these findings, they can enhance the overall customer experience. This proactive approach not only addresses urgent issues but also nurtures long-term loyalty and satisfaction among clients.
As companies continue to adopt these analytical methods, the integration of real-time data processing and improvements in data visualization will further enable informed decision-making. Future trends in descriptive analysis include integration with predictive and prescriptive approaches, which will enhance the depth of insights available. Significantly, Narellan Pools experienced a sales rise while utilizing just 70% of its media budget, demonstrating the impact of data analysis in enhancing sales performance.
Andy Morris, a Principal Product Marketing Specialist, emphasizes that ‘descriptive analysis provides vital information about a company’s performance.’ The future of descriptive analytics is poised to include greater accessibility for small and medium-sized enterprises, enabling them to leverage data-driven insights to enhance operational efficiency and customer satisfaction. To learn more about how tailored AI solutions can align with your business goals and challenges, reach out to us today, reinforcing the significance of BI and RPA in today’s data-rich environment.
Conclusion
Understanding the distinct yet complementary roles of descriptive and diagnostic analytics is crucial for organizations aiming to enhance operational efficiency and drive growth. Descriptive analytics offers a foundational overview of historical performance, enabling businesses to identify trends and metrics that inform current strategies. By employing techniques that summarize past data, organizations can gain a clearer understanding of their market position and operational health.
In contrast, diagnostic analytics delves deeper to uncover the reasons behind observed trends. This analytical approach allows businesses to identify root causes of performance fluctuations, facilitating informed decision-making and strategic adjustments. The integration of automation technologies, such as Robotic Process Automation (RPA), further enhances these analytical capabilities by streamlining workflows and reducing manual errors. This empowers teams to concentrate on more strategic initiatives.
Real-world applications of both analytics types underscore their significance in driving operational improvements and customer satisfaction. By leveraging data-driven insights, companies can not only address immediate challenges but also cultivate a culture of continuous improvement and innovation. As the analytics landscape evolves, organizations that effectively harness both descriptive and diagnostic analytics will be better equipped to navigate the complexities of a data-rich environment. This ultimately leads to sustained business growth and enhanced competitive advantage.
Overview
This article delves into mastering the decomposition tree in Power BI, highlighting its pivotal role as a powerful tool for interactive data analysis and root cause exploration. It illustrates how the decomposition tree elevates the understanding of complex datasets through structured visualizations and effective data segmentation. Ultimately, this capability aids organizations in making informed decisions and enhancing operational efficiency.
Introduction
In the realm of data analytics, the Decomposition Tree in Power BI emerges as a revolutionary tool that enables users to dissect complex datasets with unprecedented ease. This interactive visual not only simplifies the exploration of data hierarchies but also enhances the understanding of intricate relationships and trends that often elude traditional visualization methods. As organizations increasingly pivot towards data-driven decision-making, the Decomposition Tree stands out by facilitating root cause analysis and illuminating the performance drivers that shape business outcomes.
With its growing significance in the landscape of data visualization, this article delves into the myriad ways the Decomposition Tree can transform raw data into actionable insights. By driving operational efficiency and fostering innovation, it becomes essential for any organization aiming to thrive in an increasingly data-centric world. Whether through effective setup, strategic use of AI, or best practices for reporting, unlocking the full potential of this powerful tool is crucial. How is your organization leveraging data visualization to enhance decision-making?
Understanding the Decomposition Tree: An Overview
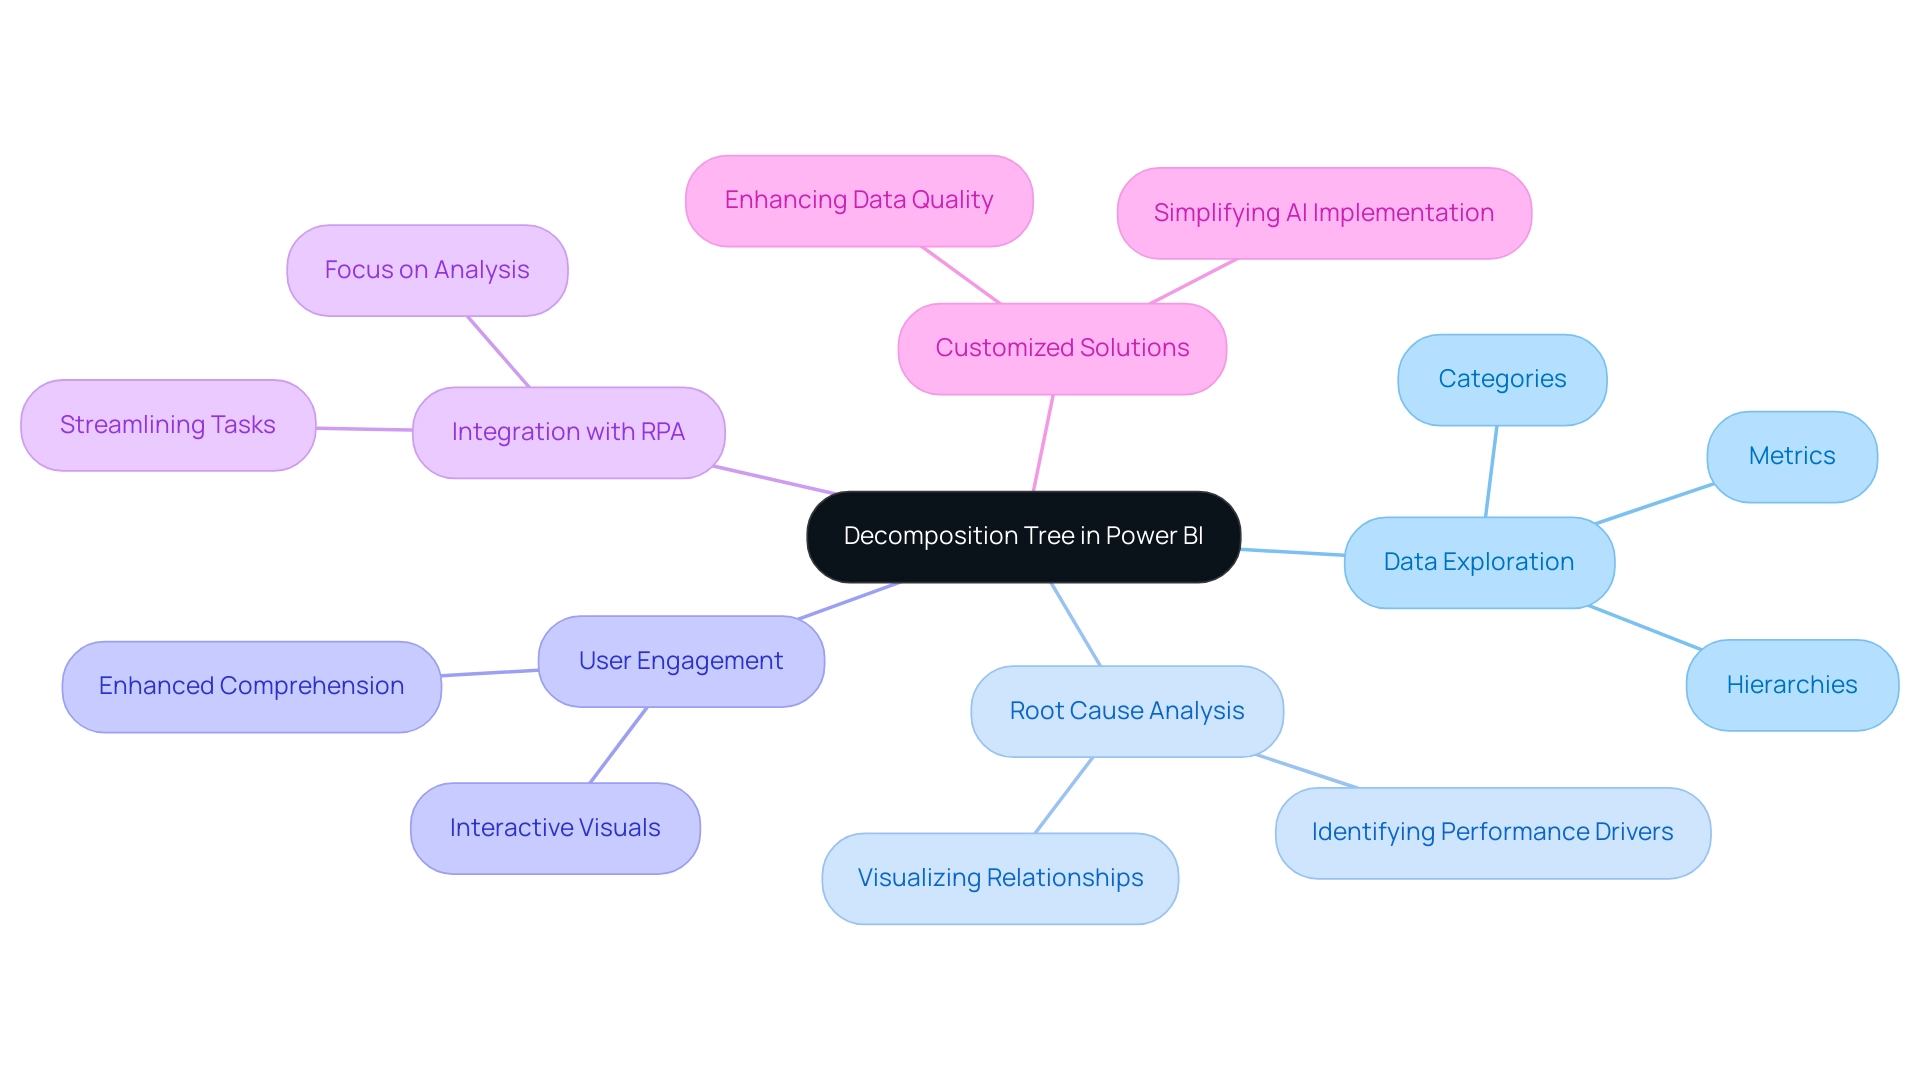
The analysis structure in Power BI stands out as a revolutionary visual instrument that empowers users to examine information across multiple dimensions. This interactive feature facilitates an in-depth exploration of information hierarchies, enabling users to drill down into specific categories and uncover the underlying factors influencing their metrics. Particularly beneficial for root cause analysis, the breakdown structure allows for the visualization of intricate datasets, revealing relationships and trends often obscured in conventional charts or tables.
In 2025, the latest trends in visualization tools underscore the increasing importance of interactive visuals such as the Breakdown Chart. These tools not only enhance user involvement but also improve information comprehension. The ability to segment data into manageable parts fosters a deeper understanding of performance drivers, ultimately leading to more informed decision-making.
Consider the case of Samoukale Enterprises Limited, which utilizes the analysis framework to scrutinize user profiles and IP addresses while maintaining a cookie duration of 3000 days. This strategy has markedly improved their advertising effectiveness, allowing them to respect user privacy while still gathering valuable insights.
The benefits of employing the decomposition tree in Power BI extend beyond mere visualization; they encompass enhanced information quality and streamlined AI implementation—both critical for fostering growth and innovation. By addressing the challenges of extracting meaningful insights from data, the decomposition tree in Power BI assists organizations in making informed decisions that bolster operational efficiency.
Moreover, integrating RPA solutions alongside Power BI can streamline repetitive tasks, enabling teams to focus on analysis rather than preparation. Tailored solutions, including Small Language Models and GenAI Workshops, further enhance information quality and simplify AI implementation, aligning with the organization’s mission to empower businesses. Expert opinions underscore its relevance in contemporary analysis, with many professionals, including Jaap, endorsing its application in uncovering root causes of performance issues: ‘I’ll still accept your solution, because it does work for the example I provided you.’
As organizations increasingly rely on data-driven strategies, the analytical framework emerges as an essential tool in their analytics arsenal, facilitating navigation through the complexities of their datasets with clarity and precision. However, it is important to acknowledge that support within Q&A is also limited, which may impact user experience. With the right application, it can transform raw data into actionable insights, paving the way for strategic advancements in operational efficiency while leveraging the power of Business Intelligence and RPA.
Setting Up the Decomposition Tree Visual in Power BI
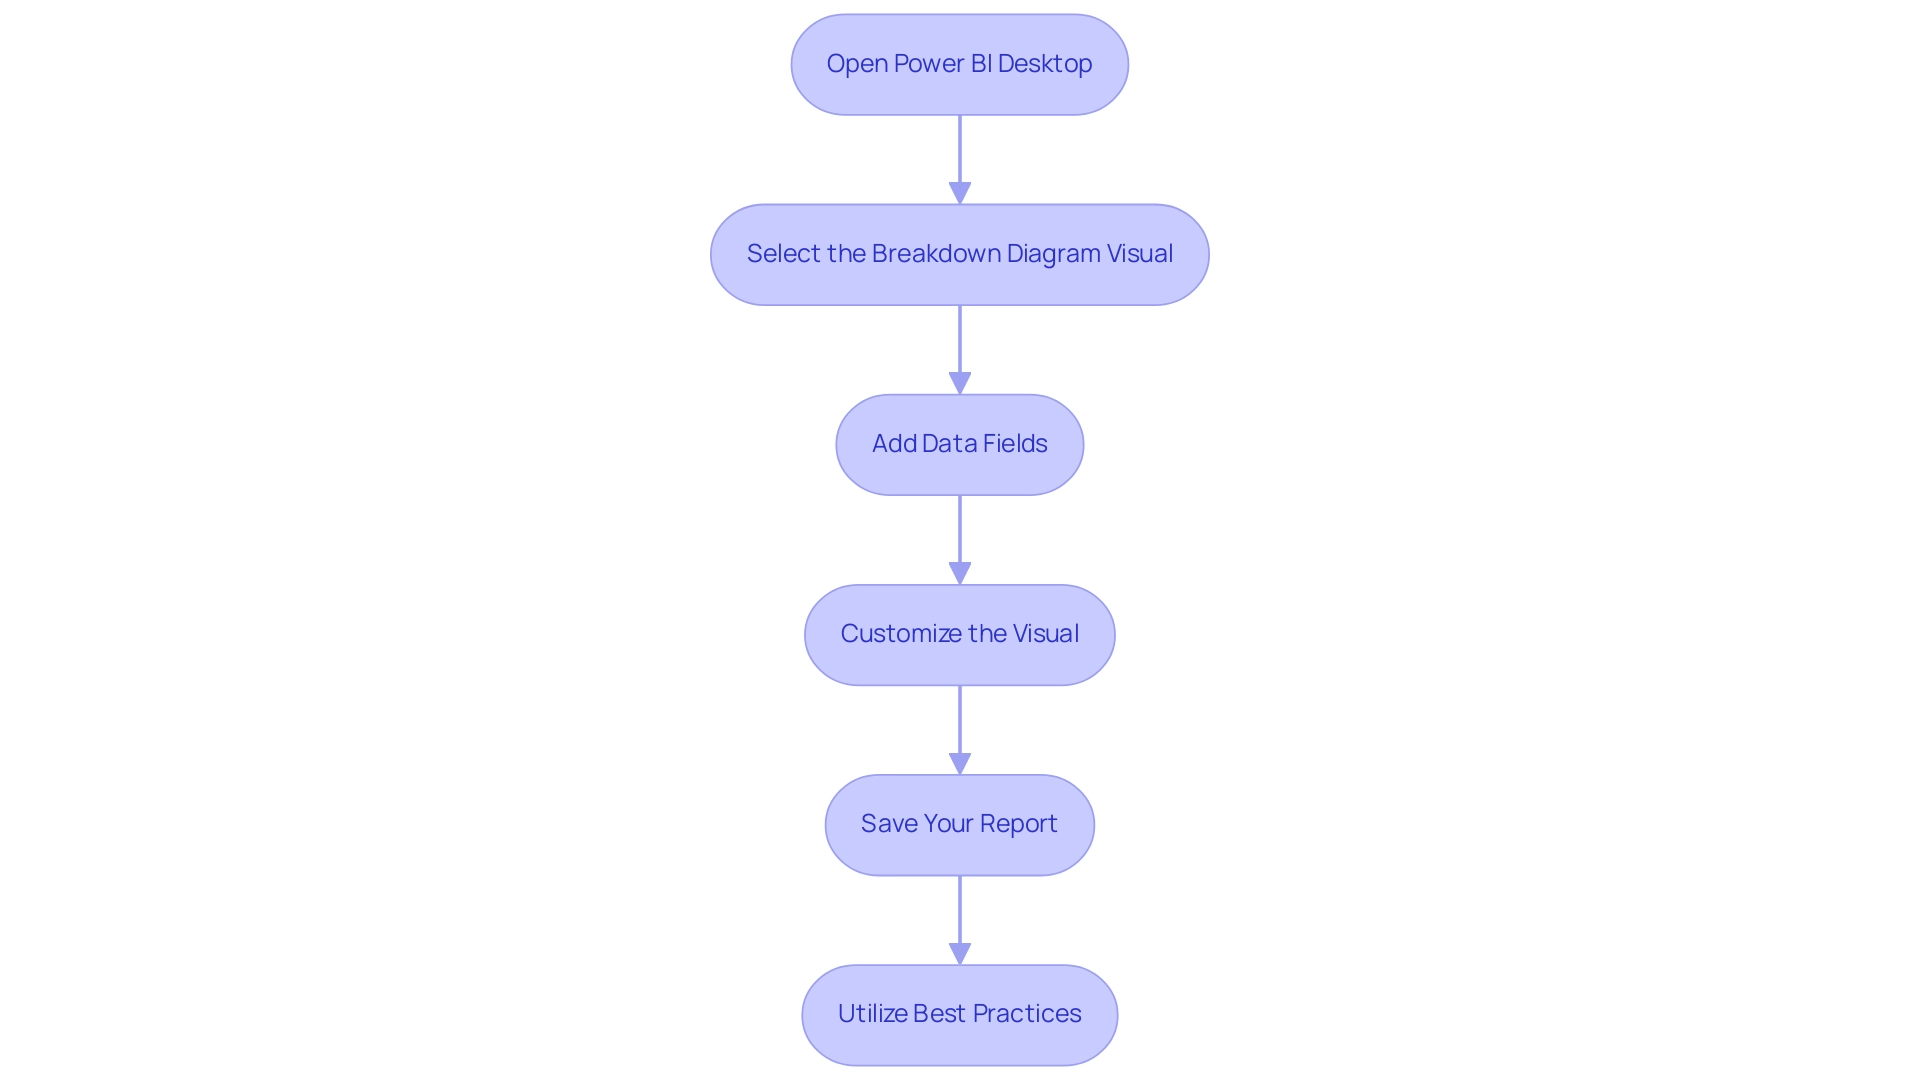
Establishing the decomposition tree in Power BI for data breakdown is a straightforward task that can significantly enhance your data analysis capabilities. In an environment where leveraging Business Intelligence is crucial for operational effectiveness, this tool becomes essential. Follow these steps to implement it effectively:
- Open Power BI Desktop: Launch Power BI Desktop and access the report where you want to add the breakdown chart.
- Select the Breakdown Diagram Visual: In the Visualizations pane, locate and click on the Breakdown Diagram icon to add it to your report canvas.
- Add Data Fields: Drag the measure you wish to analyze into the ‘Analyze’ field well. Incorporate dimensions into the ‘Explain by’ field to specify how you want to dissect the information.
- Customize the Visual: Tailor the visual settings for clarity and presentation. Adjust colors, labels, and other formatting options to ensure the visual is both informative and visually appealing.
- Save Your Report: After finalizing your setup, save your report to secure your modifications.
By adhering to these steps, you can utilize the analytical structure to gain a deeper understanding of your relationships, ultimately promoting informed decision-making and encouraging innovation within your organization.
In 2025, user adoption rates for Power BI visuals have shown a significant increase, reflecting the growing recognition of the platform’s capabilities. Successful applications of the decomposition tree in Power BI have demonstrated its efficiency in providing detailed ad hoc analysis, enabling users to investigate information across various categories. A case study titled “Using Analysis Trees in Power BI” showcased how users could examine a single value through multiple dimensions, resulting in improved comprehension and practical insights.
This method has been measured, with an anticipated value calculation of 4.25x, demonstrating the efficiency of the decomposition tree in Power BI in enhancing analysis capabilities.
To maximize the benefits of the decomposition tree in Power BI and overcome challenges such as time-consuming report creation and inconsistencies, consider these best practices:
- Ensure your information is well-structured.
- Utilize clear labeling for ease of interpretation.
- Regularly update your visuals to reflect current trends.
Additionally, integrating RPA solutions like EMMA RPA and Power Automate can further streamline your processes, enhancing operational efficiency. Professional guidance underscores the significance of personalization in visual arrangements, as customized visuals can greatly enhance user involvement and understanding.
As noted by Super User amitchandak, “I doubt, Just check arrow keys can help,” highlighting the importance of utilizing all features available in Power BI for comprehensive analysis.
To learn more about how RPA can enhance your analytics efforts, consider scheduling a free consultation.
Exploring and Analyzing Data with the Decomposition Tree
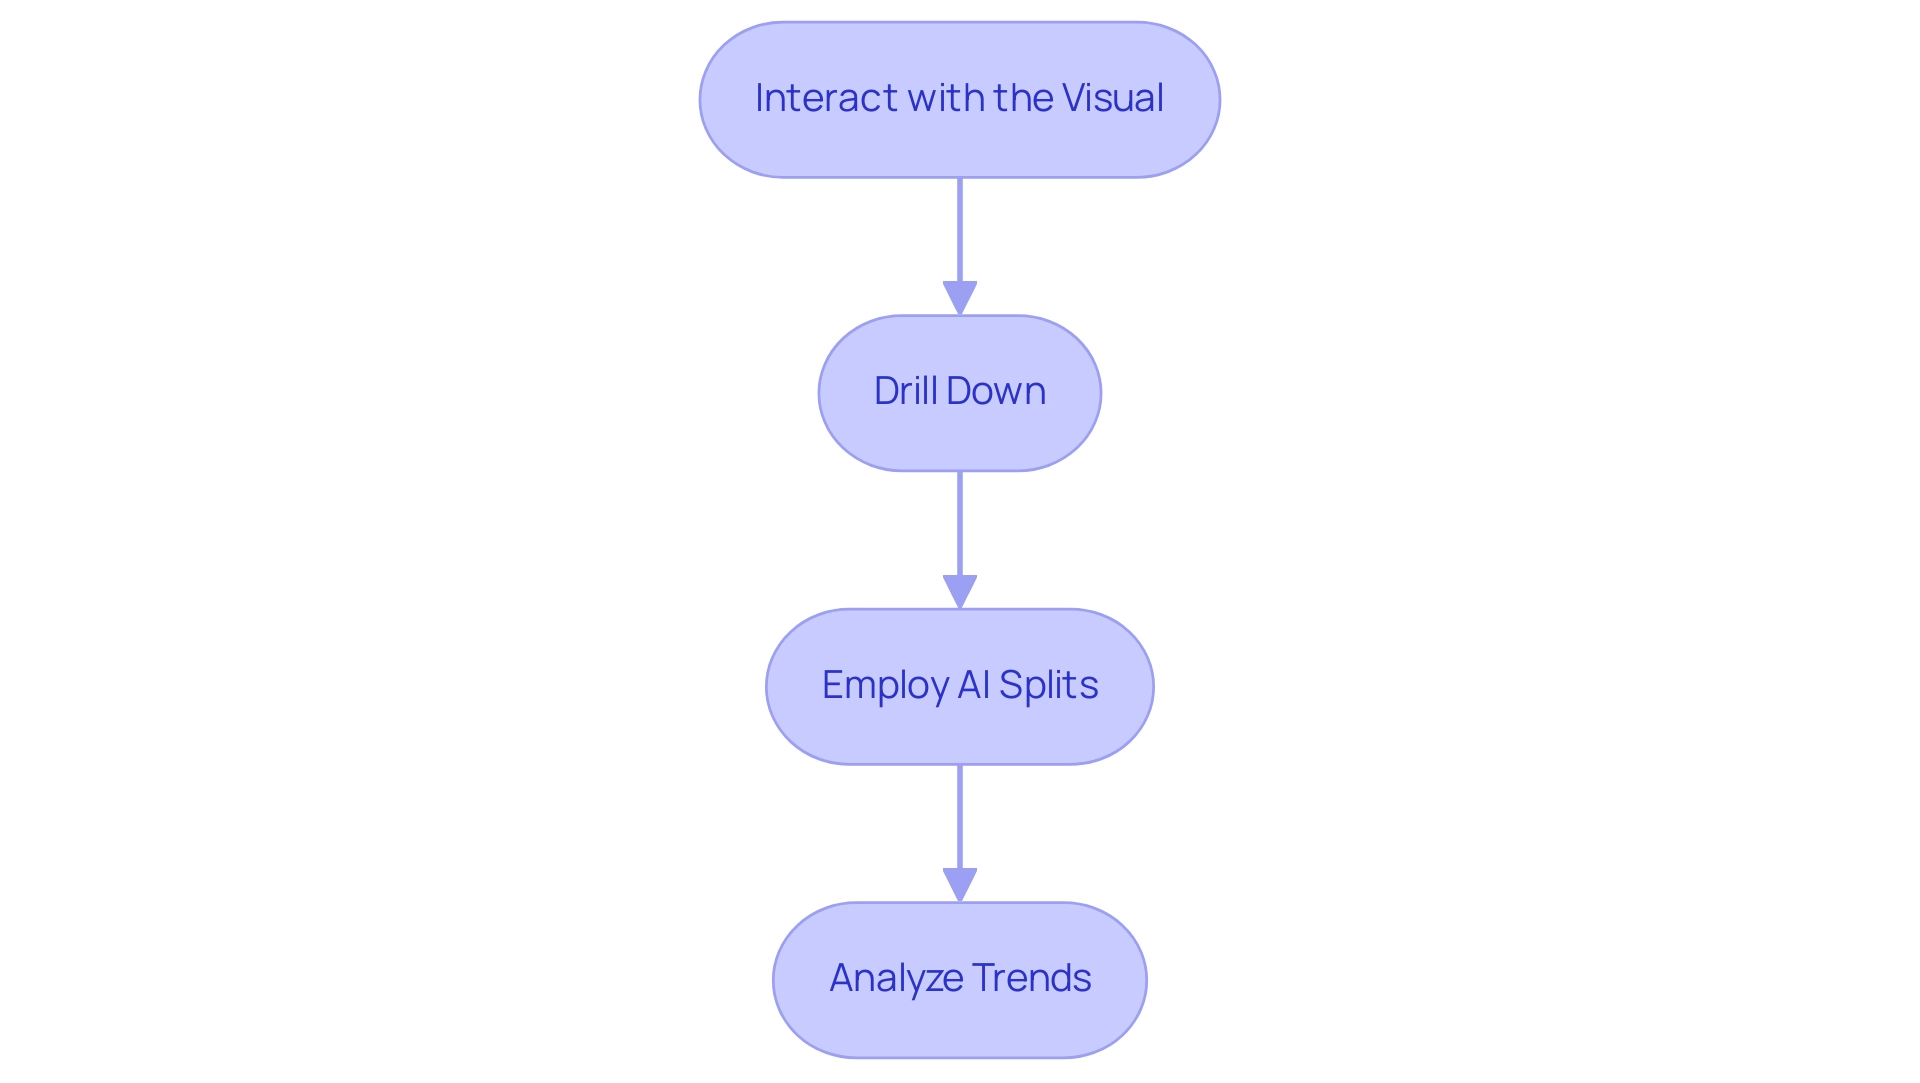
Once the Decomposition Tree is established, you can effectively explore and analyze your data through the following steps:
- Interact with the Visual: Engage with the decomposition tree in Power BI by clicking on its nodes to expand or collapse them. This interaction uncovers deeper layers of information, allowing for a more detailed analysis and clarity in visual representation. This is essential for overcoming challenges related to poor master information quality.
- Drill Down: Utilize the drill-down feature to delve into specific dimensions. This capability enables you to understand how various factors influence your overall metrics, providing insights into the underlying drivers of performance. This supports data-driven decision-making, a critical aspect of leveraging insights from Power BI dashboards.
- Employ AI Splits: Take advantage of AI splits to automatically identify significant contributors to your information. These intelligent splits, part of our Small Language Models and GenAI workshops, streamline your analysis and highlight critical areas that merit further exploration. This enhances your decision-making process and addresses barriers to effective AI adoption.
- Analyze Trends: As you navigate through the information, actively look for patterns and trends. The visual depiction of the breakdown structure aids in detecting anomalies or unforeseen outcomes, necessitating prompt attention. This trend analysis is crucial for making informed, data-driven decisions in a rapidly evolving business landscape, further supported by our Business Intelligence solutions.
Furthermore, the analysis structure can examine sales from various product lines, regions, or customer segments, offering a thorough perspective of your data landscape. By mastering these techniques, you can unlock the complete potential of the analytical structure in Power BI. This transforms intricate datasets into practical understanding that enhances operational efficiency. Additionally, incorporating Power Automate can streamline your workflows, ensuring that information derived from the decomposition tree in Power BI is actionable without delay.
As Hans Levenbach aptly stated, “How Bad Data Will Beat a Good Forecast Every Time!!” This underscores the importance of ensuring data quality in your analyses. Moreover, utilizing dynamic formatting in your DAX measures can improve the clarity and usability of your visualizations. This ensures that users can easily interpret complex datasets and maximize their understanding.
Leveraging AI for Enhanced Insights in the Decomposition Tree
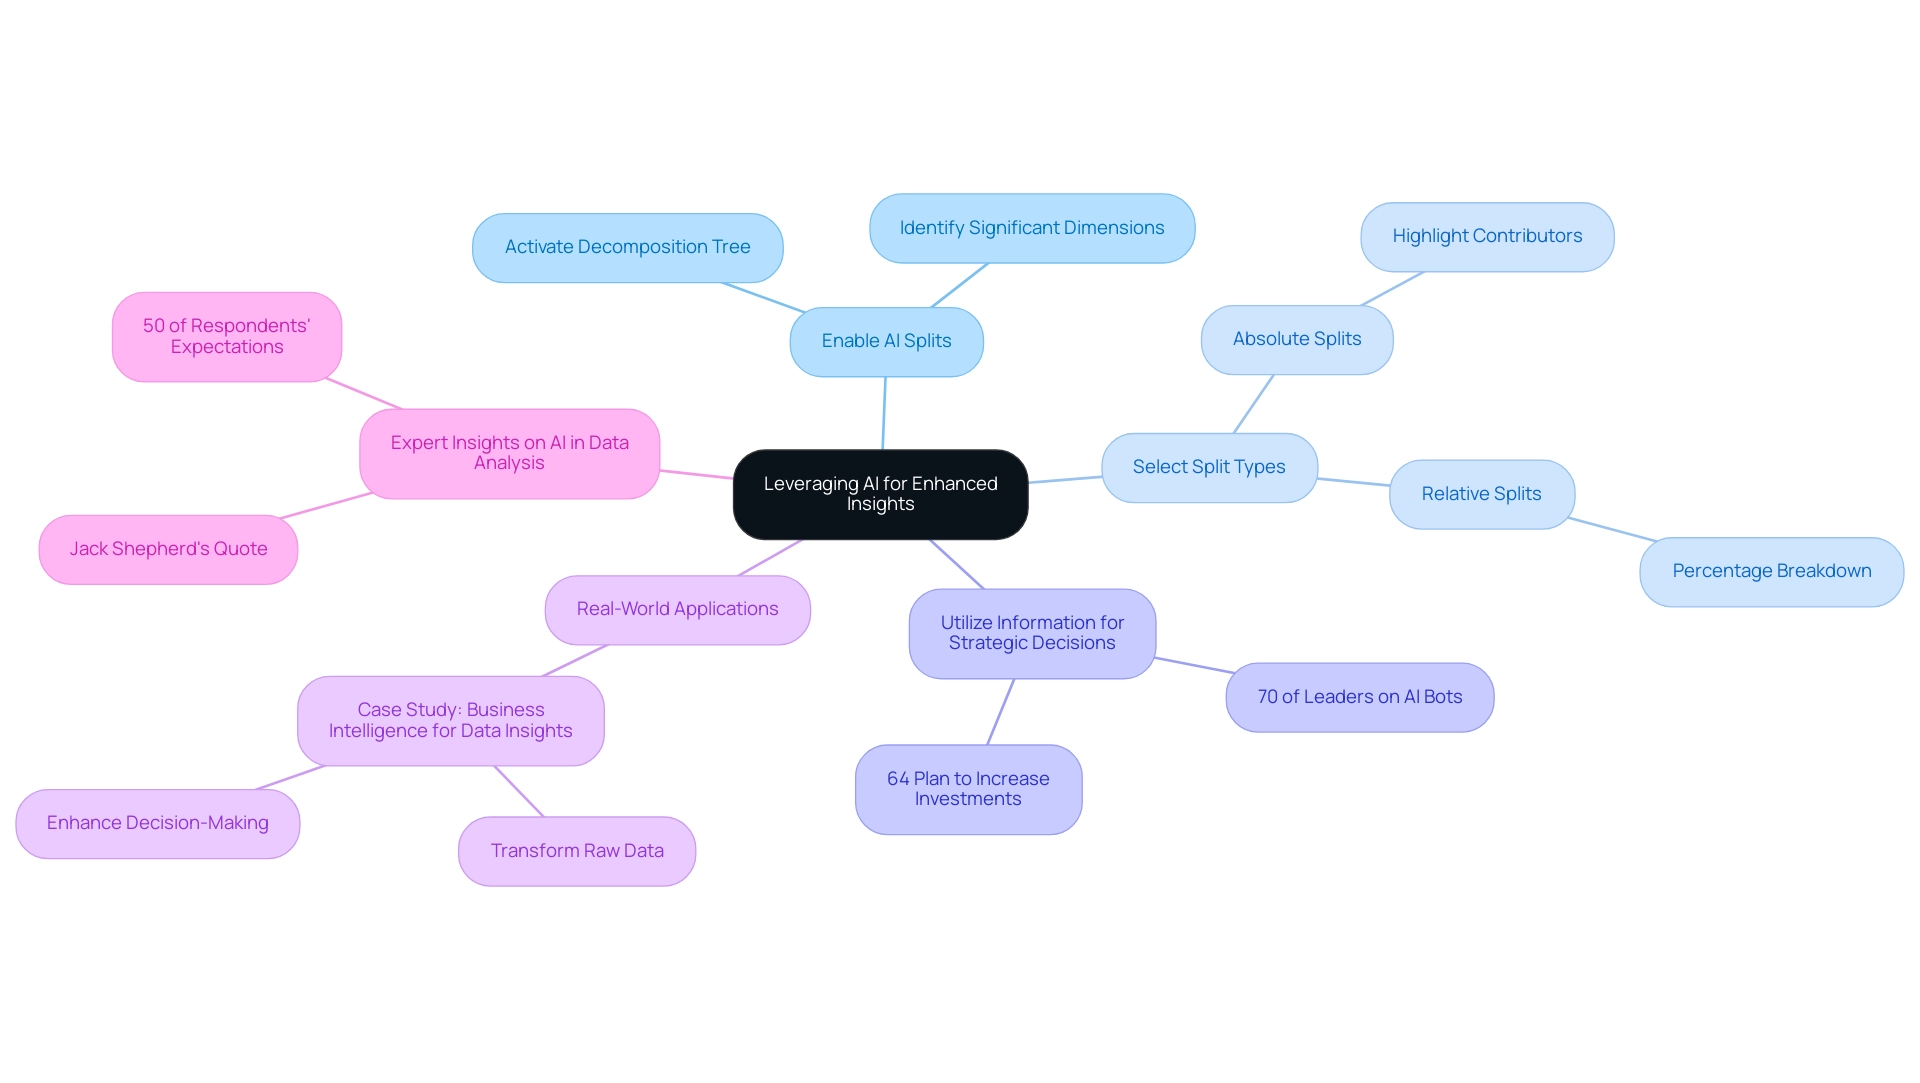
To efficiently utilize AI for improved understanding within the analysis framework in Power BI, consider these key strategies:
-
Enable AI Splits: Ensure that AI splits are activated when configuring the decomposition tree in Power BI. This powerful feature automatically identifies and suggests the most significant dimensions for analysis based on your dataset, streamlining the decision-making process.
-
Select Split Types: Tailor your analysis by choosing between absolute and relative splits. Absolute splits emphasize the highest or lowest contributors, offering a clear understanding of performance extremes. In contrast, relative splits provide a percentage breakdown, allowing for a nuanced understanding of how different factors compare against one another.
-
Utilize Information for Strategic Decisions: The insights obtained from AI splits can significantly inform your business strategies. By identifying areas for improvement or uncovering new growth opportunities, organizations can make data-driven decisions that enhance operational efficiency. Notably, 70% of customer experience leaders recognize that AI bots are becoming adept at crafting highly personalized customer journeys, underscoring the importance of integrating AI into analytics. Furthermore, 64% of customer experience leaders plan to increase investments in evolving AI chatbots within the next year, highlighting the growing trend of investment in AI technologies.
-
Real-World Applications: Consider the case study of a business that utilized AI-driven insights to transform raw information into actionable intelligence. This approach not only enhanced information quality but also enabled the organization to make informed decisions that drove growth and innovation. Leveraging AI can lead to significant enhancements in analytical capabilities, as evidenced by the increasing adoption of tailored AI solutions in the industry. Utilize Power BI Services: Take advantage of our 3-Day Power BI Sprint to quickly create professionally designed reports that improve your reporting and gain actionable insights. The General Management App offers comprehensive management and smart reviews, further supporting your operational efficiency.
-
Expert Insights on AI in Data Analysis: As we move through 2025, understanding the role of AI splits in Power BI is crucial. Experts note that while UK AI adoption is gradually increasing, with Jack Shepherd, Co-Founder of Social Shepherd, stating that ‘UK AI adoption is not as high as in other regions, but the country is seeing a steady increase in adoption,’ the insights derived from the decomposition tree in Power BI reveal that 50% of respondents feel that AI meets their expectations. This indicates a growing confidence in these technologies. By harnessing AI splits effectively alongside Business Intelligence tools and Robotic Process Automation (RPA), businesses can enhance their analysis capabilities and achieve a competitive edge in their respective markets. Additionally, consider participating in our GenAI Workshops to gain hands-on training and explore Small Language Models for efficient data analysis tailored to your specific needs.
Best Practices for Utilizing the Decomposition Tree in Reports
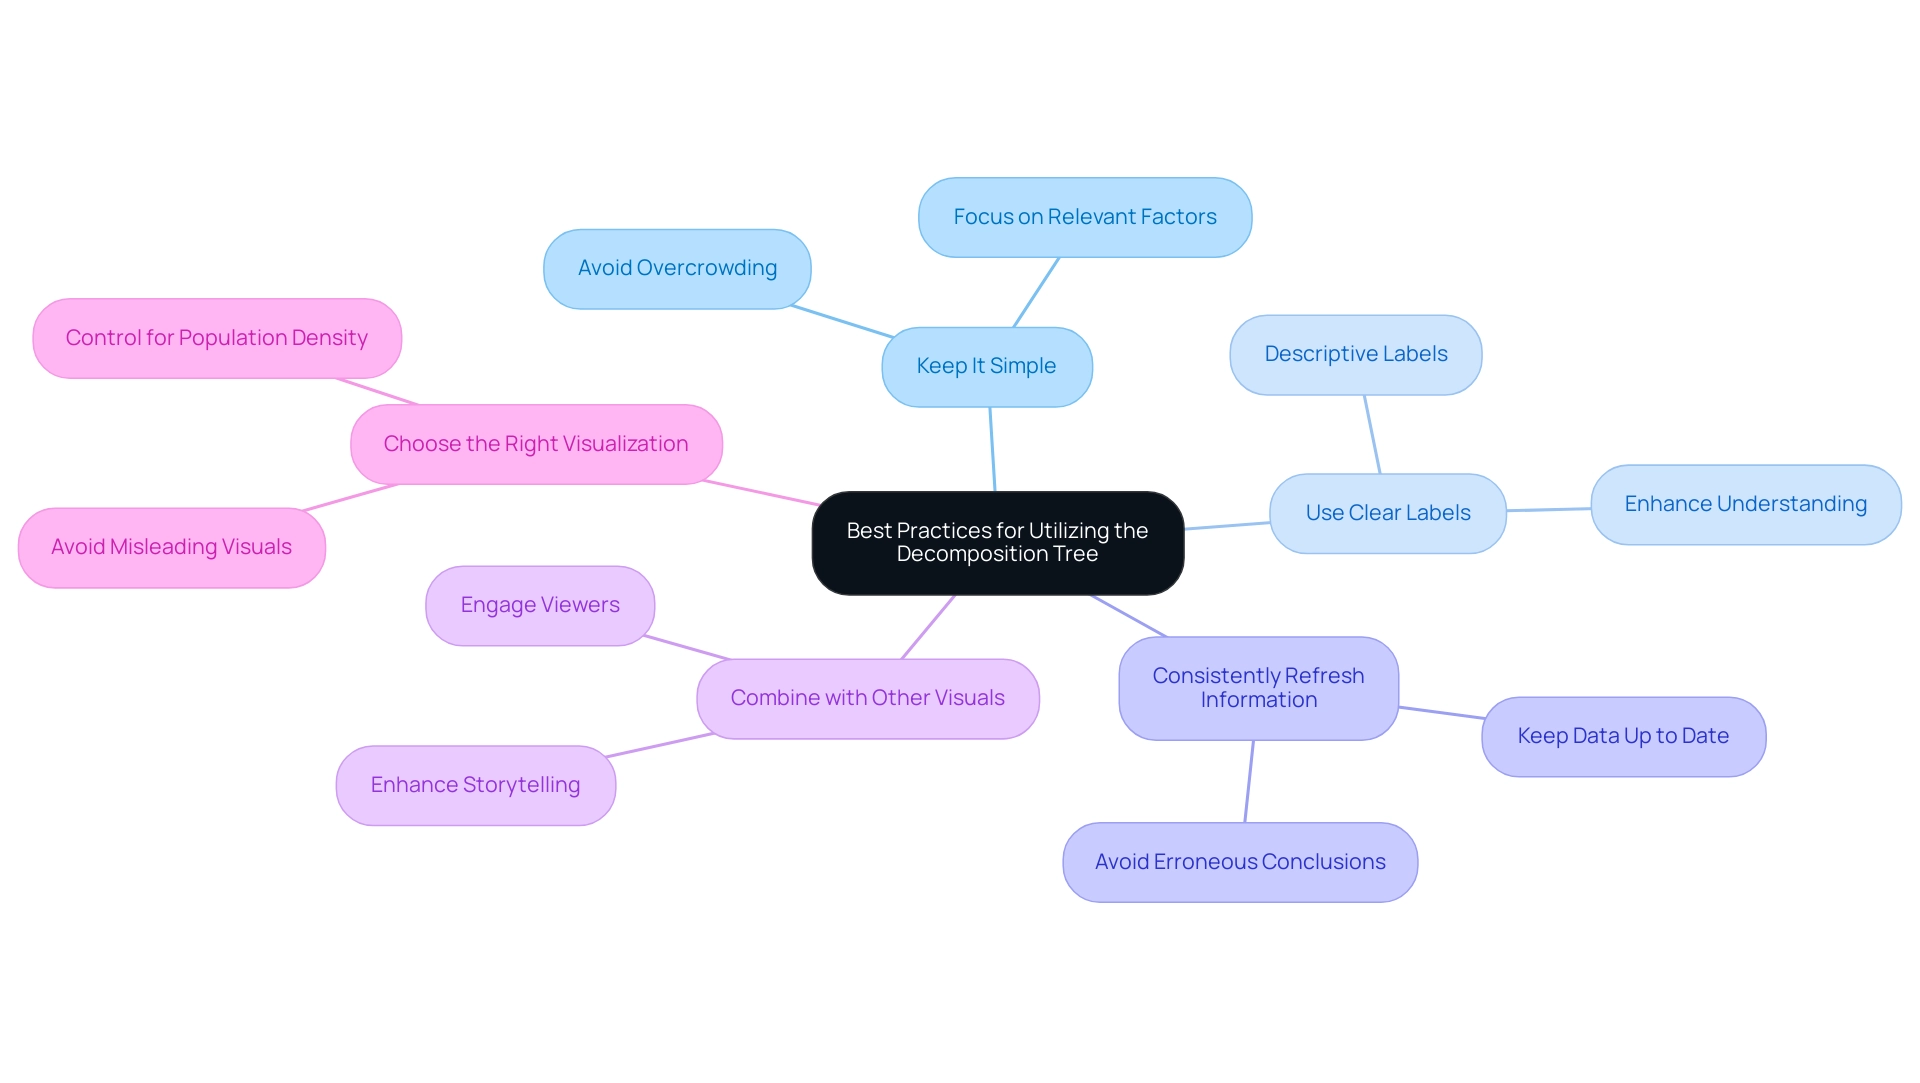
To maximize the effectiveness of the Decomposition Tree in your reports, adhere to the following best practices:
-
Keep It Simple: Avoid overcrowding the visual with excessive dimensions. Focus on the most relevant factors to sustain clarity and promote understanding—vital in a data-rich setting where valuable knowledge is essential for competitive advantage.
-
Use Clear Labels: Descriptive and straightforward labels are crucial. As Edward R. Tufte stated, “the essential test of design is how well it assists the understanding of the content, not how stylish it is.” Clear labeling allows viewers to swiftly grasp the information being presented, greatly improving understanding and ensuring actionable direction from your Power BI dashboards.
-
Consistently Refresh Information: Ensure your information is up to date to uphold the significance and usability of the conclusions drawn from the structure. Obsolete information can lead to erroneous conclusions, complicating the retrieval of significant insights that promote growth and innovation.
-
The decomposition tree in Power BI is a valuable tool for data analysis. Combine the decomposition tree with other visuals to provide a comprehensive view of your information. This approach not only enhances storytelling but also makes your reports more engaging and informative, aligning with the goal of improving operational efficiency through data-driven insights.
-
Choose the Right Visualization: Be mindful of the visualization methods you select. For instance, while Choropleth maps can be useful, they may mislead if not controlled for population density or other factors. Choosing suitable visuals is crucial for precise information representation, further highlighting the significance of utilizing BI tools effectively.
The decomposition tree in Power BI is a useful tool for visualizing data. Consider integrating RPA solutions to automate the preparation and report generation processes, which can be enhanced by utilizing the decomposition tree. This can significantly reduce the time spent on manual tasks, address inconsistencies, and enhance the overall efficiency of utilizing the decomposition tree in Power BI and other BI tools.
By applying these strategies, you can significantly enhance the clarity and impact of your visualizations, ultimately driving better decision-making and operational efficiency. Additionally, consider that 157 partners can utilize these practices to deliver and present advertising and content effectively, showcasing the collaborative potential of data visualization tools. The case study titled “Business Intelligence Empowerment” illustrates how organizations can extract meaningful insights through business intelligence, supporting informed decision-making and driving growth and innovation.
Conclusion
The Decomposition Tree in Power BI signifies a transformative leap in data visualization, enabling organizations to unravel complex datasets with unparalleled clarity and precision. Its interactive features facilitate root cause analysis, allowing users to identify the underlying factors influencing performance metrics. This tool not only enriches the exploration of data hierarchies but also fosters a deeper comprehension of trends and relationships often missed by traditional methods.
Setting up the Decomposition Tree is a seamless process, empowering users to tailor their data analysis effectively. By integrating AI splits and adhering to best practices—such as employing clear labels and maintaining simplicity in visuals—organizations can unlock the maximum insights from their data. The strategic deployment of this tool, in conjunction with complementary solutions like Robotic Process Automation, streamlines workflows and enhances operational efficiency.
Ultimately, the Decomposition Tree transcends the role of a mere visual tool; it stands as a crucial asset within an organization’s analytics arsenal. As the importance of data-driven decision-making escalates, harnessing the full potential of the Decomposition Tree can convert raw data into actionable insights, propelling innovation and strategic progress. Embracing this powerful visualization technique positions organizations for success in the dynamic landscape of data analytics, ensuring they remain competitive and well-informed.
Overview
This article delves into the effective summation of multiple columns in Power BI using DAX, spotlighting the critical roles of both the SUM and SUMX functions in achieving precise data analysis. By presenting clear examples and relevant use cases, it illustrates how these functions can significantly boost operational efficiency and enhance reporting accuracy. Ultimately, this leads to more informed decision-making, empowering professionals to leverage data effectively.
Introduction
In the realm of data analysis, DAX (Data Analysis Expressions) stands as a cornerstone for maximizing the potential of Power BI. This powerful formula language empowers users to perform intricate calculations and derive actionable insights from their data. As organizations increasingly embrace data-driven decision-making, understanding DAX becomes essential—not merely for mastering its syntax, but for applying it effectively in real-world business contexts.
Consider the capabilities of DAX:
- Creating calculated columns
- Dynamic measures
- Summing multiple columns with precision
Mastery of DAX not only enhances reporting capabilities but also streamlines operational efficiency. As the landscape of business intelligence evolves, the necessity for professionals to harness the full power of DAX becomes clear. It is crucial for ensuring competitiveness in an increasingly data-centric world. Are you ready to elevate your data analysis skills and drive impactful decisions?
Understanding DAX: The Foundation for Power BI Calculations
DAX, or Data Analysis Expressions, stands as a powerful formula language integral to Power BI, enabling users to execute sophisticated calculations and analyses. Comprising a variety of functions, operators, and constants, DAX facilitates the creation of complex formulas tailored to specific information scenarios. Mastery of DAX is essential for maximizing the capabilities of Power BI, particularly when effectively utilizing DAX to sum multiple columns. Understanding DAX transcends mere syntax; it encompasses grasping its application in real-world business intelligence contexts.
Organizations leveraging DAX have reported significant improvements in operational efficiency, especially when paired with our Power BI services. For instance, the 3-Day Power BI Sprint empowers teams to quickly create professionally designed reports, enhancing reporting and providing actionable insights. Furthermore, our General Management App supports comprehensive management and smart reviews, further augmenting DAX’s capabilities in delivering clear, actionable guidance.
A recent case study highlighted the launch of a Semantic Model Refresh Detail Page, which provided extensive insights into refresh metrics, assisting in troubleshooting and enhancing updates. This illustrates how DAX can bolster the reliability of analysis processes, particularly when integrated with tools like Power Automate to streamline workflows and assess ROI risk-free.
The significance of DAX in analysis cannot be overstated. As of 2025, statistics indicate that a substantial percentage of Power BI users depend on DAX for their calculations, underscoring its critical role in effective management. Industry leaders assert that a solid understanding of DAX not only enhances reporting capabilities but also empowers teams to focus on strategic decision-making rather than manual information manipulation.
Moreover, leveraging Robotic Process Automation (RPA) alongside DAX can further enhance operational efficiency in a rapidly evolving AI landscape. By mastering these DAX concepts, you will establish a strong foundation for effectively using DAX to sum multiple columns in Power BI, ultimately driving better insights and operational efficiency. Furthermore, comprehending the distinctions between usage metrics and audit logs can offer greater insights into how DAX operates within the broader context of analysis and reporting.
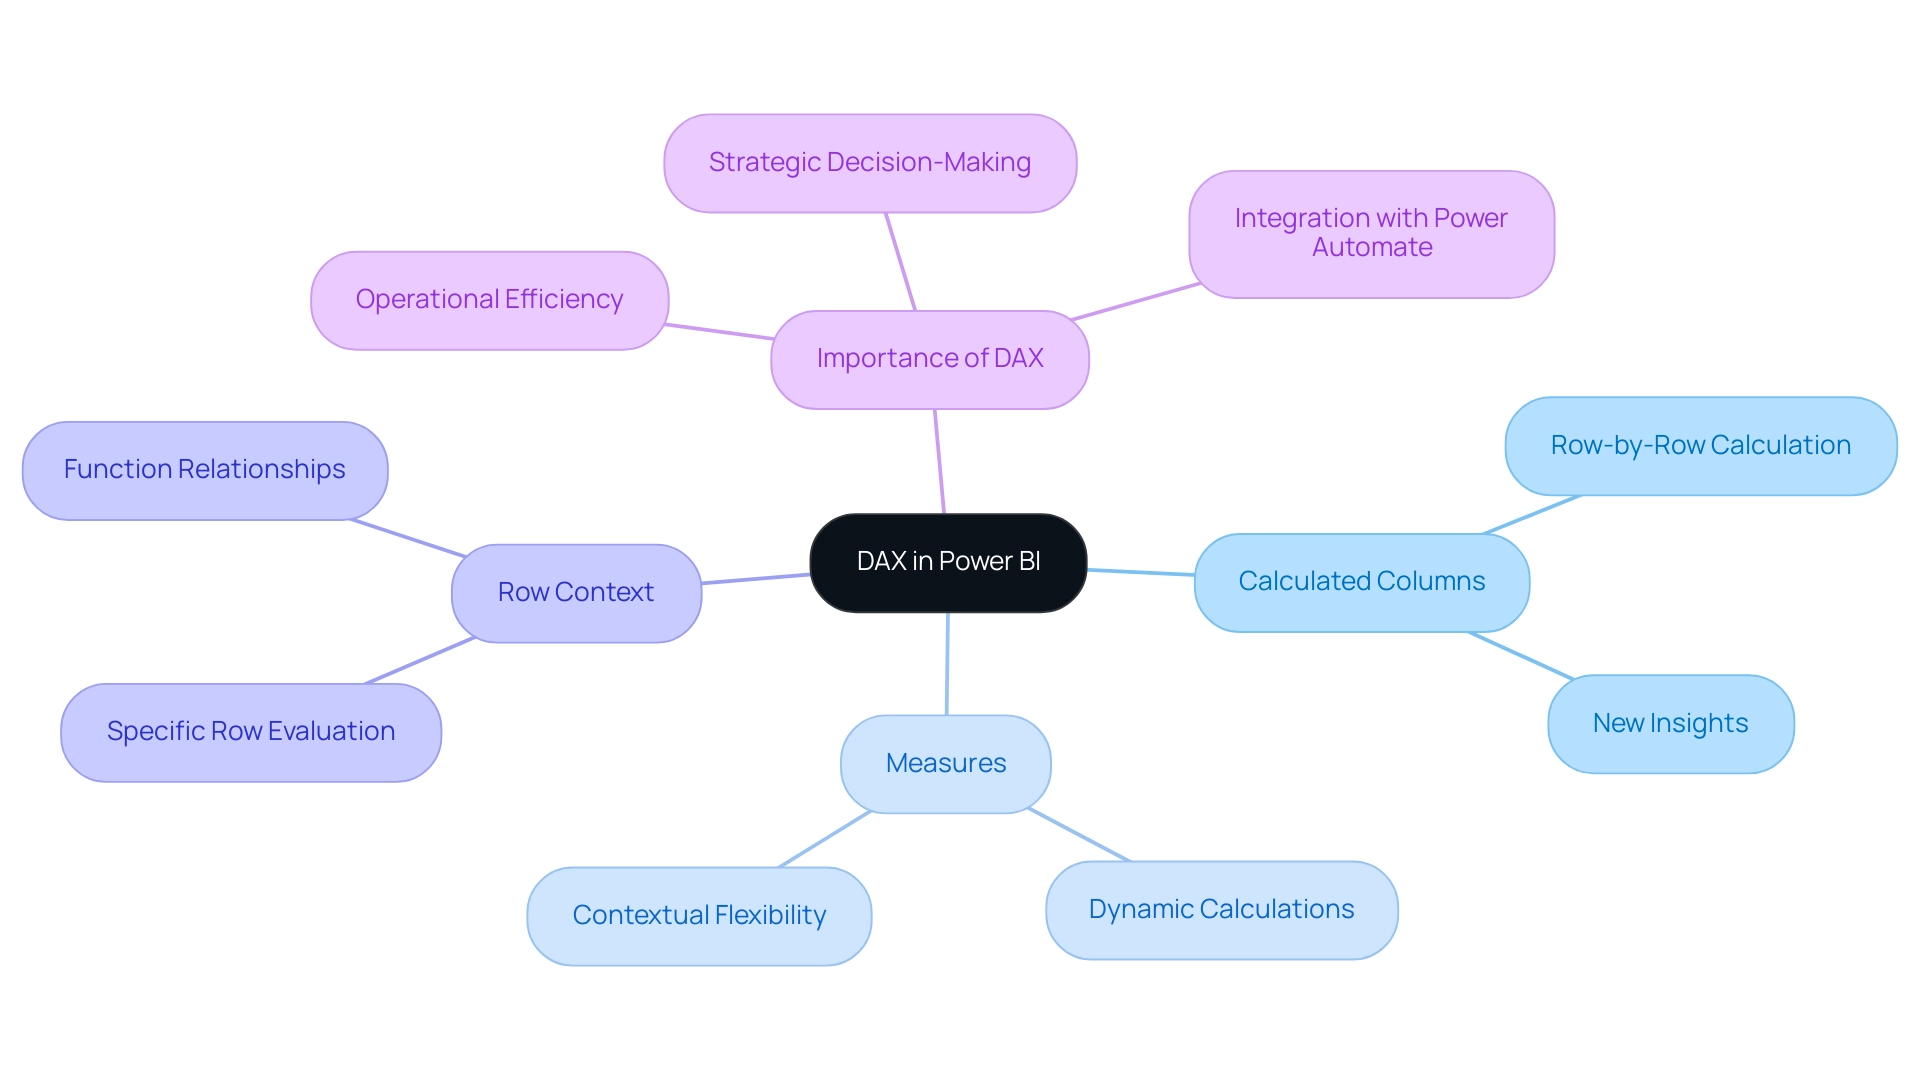
Key Concepts of DAX:
- Calculated Columns: These are additional columns created in your model using DAX formulas, calculated on a row-by-row basis. They permit the incorporation of new insights directly into your model.
- Measures: In contrast to calculated columns, measures are dynamic calculations performed on the fly, depending on the context of the report. This flexibility is crucial for real-time information analysis.
- Row Context: Understanding row context is vital, as it refers to the specific row being evaluated in a table. This concept is essential for understanding how DAX functions work and relate to your information.
Key DAX Functions for Summing Columns: SUM vs. SUMX
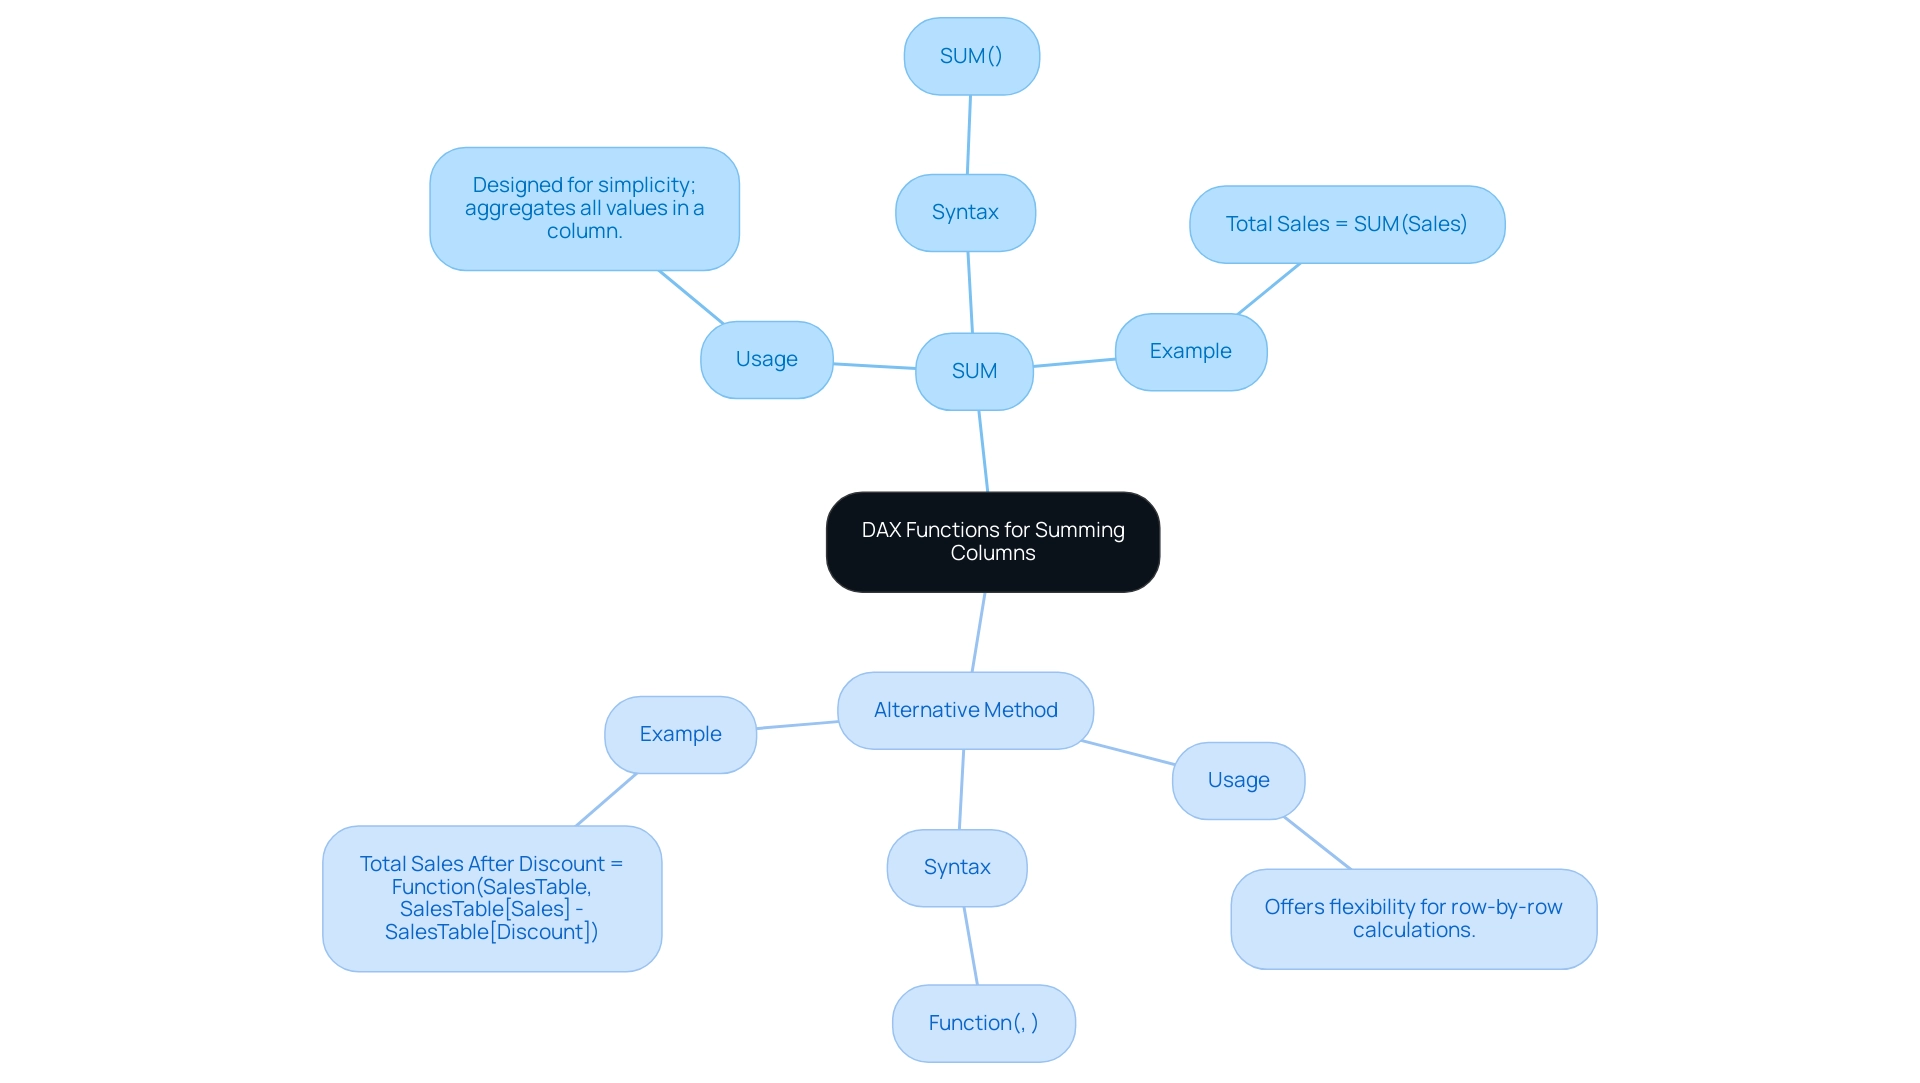
In DAX, two essential operations for adding values are SUM and an alternative method. Understanding the distinctions between these operations is crucial for effective data analysis in Power BI, particularly as organizations increasingly depend on data-driven insights to enhance operational efficiency and tackle challenges such as time-consuming report generation and data inconsistencies.
SUM Operation:
- Usage: The SUM operation is designed for simplicity; it aggregates all values within a single column.
- Syntax:
SUM(<ColumnName>) - Example: For instance, to calculate total sales from a column named ‘Sales’, you would use
Total Sales = SUM(Sales). This operation is particularly effective for straightforward summation tasks, making it a preferred choice for fundamental analytical requirements.
This Calculation Method:
- Usage: In contrast, this calculation method offers enhanced flexibility by allowing row-by-row calculations. It evaluates an expression for each row in a designated table and then sums the resulting values.
- Syntax:
Function(<Table>, <Expression>) - Example: To calculate total sales after applying a discount, you might write
Total Sales After Discount = Function(SalesTable, SalesTable[Sales] - SalesTable[Discount]). This method is ideal for more complex calculations that involve a DAX sum across multiple columns or require a detailed row context.
The choice between using DAX sum across multiple columns and the traditional SUM hinges on the complexity of the calculation at hand. For simple aggregations, SUM suffices, while the alternative is more suitable for complex assessments that demand a thorough examination of the data.
Understanding the differences between these operations not only simplifies analysis but also enhances dashboard efficiency in Power BI. As organizations strive to transform raw data into actionable insights, mastering these functions becomes imperative. The efficient application of SUM and its alternatives can significantly mitigate issues such as data inconsistencies and prolonged report generation times, facilitating quicker and more informed decision-making.
As evidenced by the experiences of over 200 clients, individuals who adeptly differentiate between SUM and its alternatives are better equipped to select the appropriate option for their analytical needs, leading to more accurate and insightful outcomes. Case studies, such as the ‘Comparison of SUM and SUM in Power BI,’ illustrate that users who excel at these operations can navigate the complexities of data analysis more effectively. As Zach Bobbitt, creator of Statology, emphasizes, ‘My goal with this site is to help you learn statistics through using simple terms, plenty of real-world examples, and helpful illustrations,’ underscoring the importance of mastering these concepts in practical applications within the realms of Business Intelligence and Robotic Process Automation.
Exploring the Syntax and Parameters of SUMX in Power BI
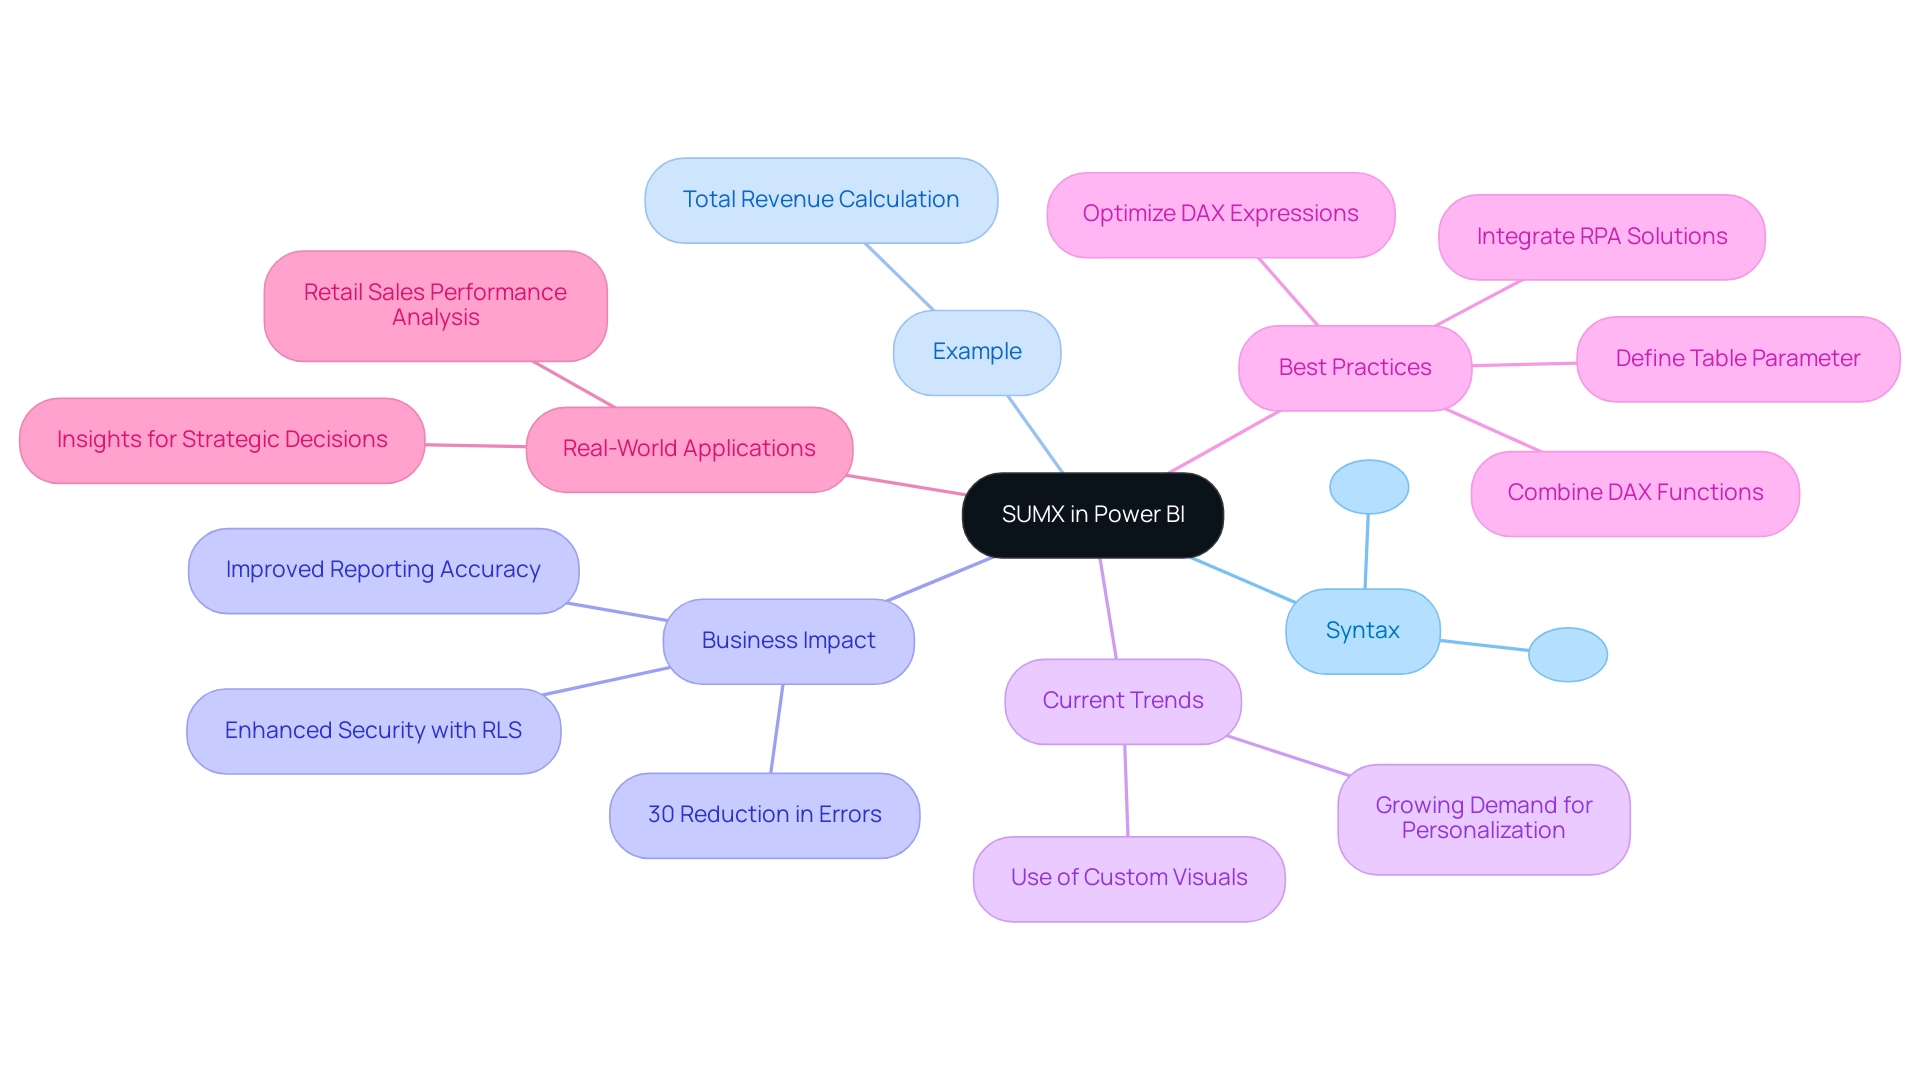
The SUMX formula is a pivotal component in DAX, particularly for executing complex calculations within Power BI that drive business intelligence initiatives. Mastery of its syntax and parameters is essential for harnessing its full potential in data analysis and reporting. This is especially true in addressing challenges such as time-consuming report creation and data inconsistencies that many organizations encounter.
Syntax of SUMX:
SUMX(<Table>, <Expression>)
: This parameter signifies the table or expression that yields a table, which the function will iterate over.
: This expression is evaluated for each row in the specified table, facilitating dynamic calculations based on row context. Example of SUMX:
Consider a scenario where you have a table named ‘SalesData’ containing ‘Quantity’ and ‘Price’ columns. To compute the total revenue, the formula would be:
Total Revenue = SUMX(SalesData, SalesData[Quantity] * SalesData[Price])This calculation multiplies the quantity by the price for each row, subsequently summing the results to yield a comprehensive total revenue figure.
Business Impact of SUMX in Financial Reporting:
Utilizing the SUMX function can significantly enhance financial reporting accuracy and operational efficiency. Recent statistics reveal that organizations employing SUMX for complex calculations have experienced a notable improvement in information integrity and reporting efficiency, with a reported 30% reduction in errors compared to traditional methods. Furthermore, the implementation of Row-Level Security (RLS) restricts access for specific users, ensuring that only authorized personnel can view sensitive financial information, thereby bolstering the overall security and integrity of reports. This is particularly advantageous in addressing inconsistencies that can arise in reporting.
Current Trends in SUMX Usage:
In 2025, the trend towards utilizing SUMX for complex calculations in Power BI continues to grow, driven by the increasing demand for personalized data insights. Analysts are increasingly leveraging custom visuals in Power BI, allowing for tailored representations of data that enhance the interpretability of complex calculations. A case study on personalization and customization illustrates how custom visuals can significantly enhance the use of specific functions, enabling analysts to create bespoke visual representations that cater to specific business needs.
Best Practices for Using SUMX:
Industry experts recommend several best practices when employing SUMX:
- Ensure that the table parameter is well-defined to avoid performance issues.
- Utilize a DAX function in conjunction with other DAX functions to develop more comprehensive calculations.
- Regularly review and optimize your DAX expressions to maintain efficiency.
- Consider integrating RPA solutions to automate repetitive data processing tasks, further enhancing the efficiency of your data analysis and reporting processes.
Real-World Applications of SUMX:
Case studies demonstrate the effectiveness of SUMX in various business contexts. For instance, a retail company utilized a specific analytical tool to analyze sales performance across different regions, leading to actionable insights that informed strategic decisions and improved overall profitability. As Praveen, a Digital Marketing Specialist, observes, ‘Mastering DAX expressions is crucial for enhancing operational efficiency and attaining significant outcomes in analysis.’
By comprehending the syntax and practical applications of the SUMX capability, users can unlock advanced analytical skills in Power BI, transforming raw information into valuable insights that drive business growth. For those seeking to advance their skills further, the Power BI Certification Training by PwC Academy is highly recommended.
Practical Use Cases: Summing Multiple Columns in Power BI
Utilizing DAX functions to sum multiple columns can significantly elevate your analytical capabilities in Power BI, particularly in harnessing Business Intelligence for actionable insights. Here are several practical use cases that illustrate this functionality:
-
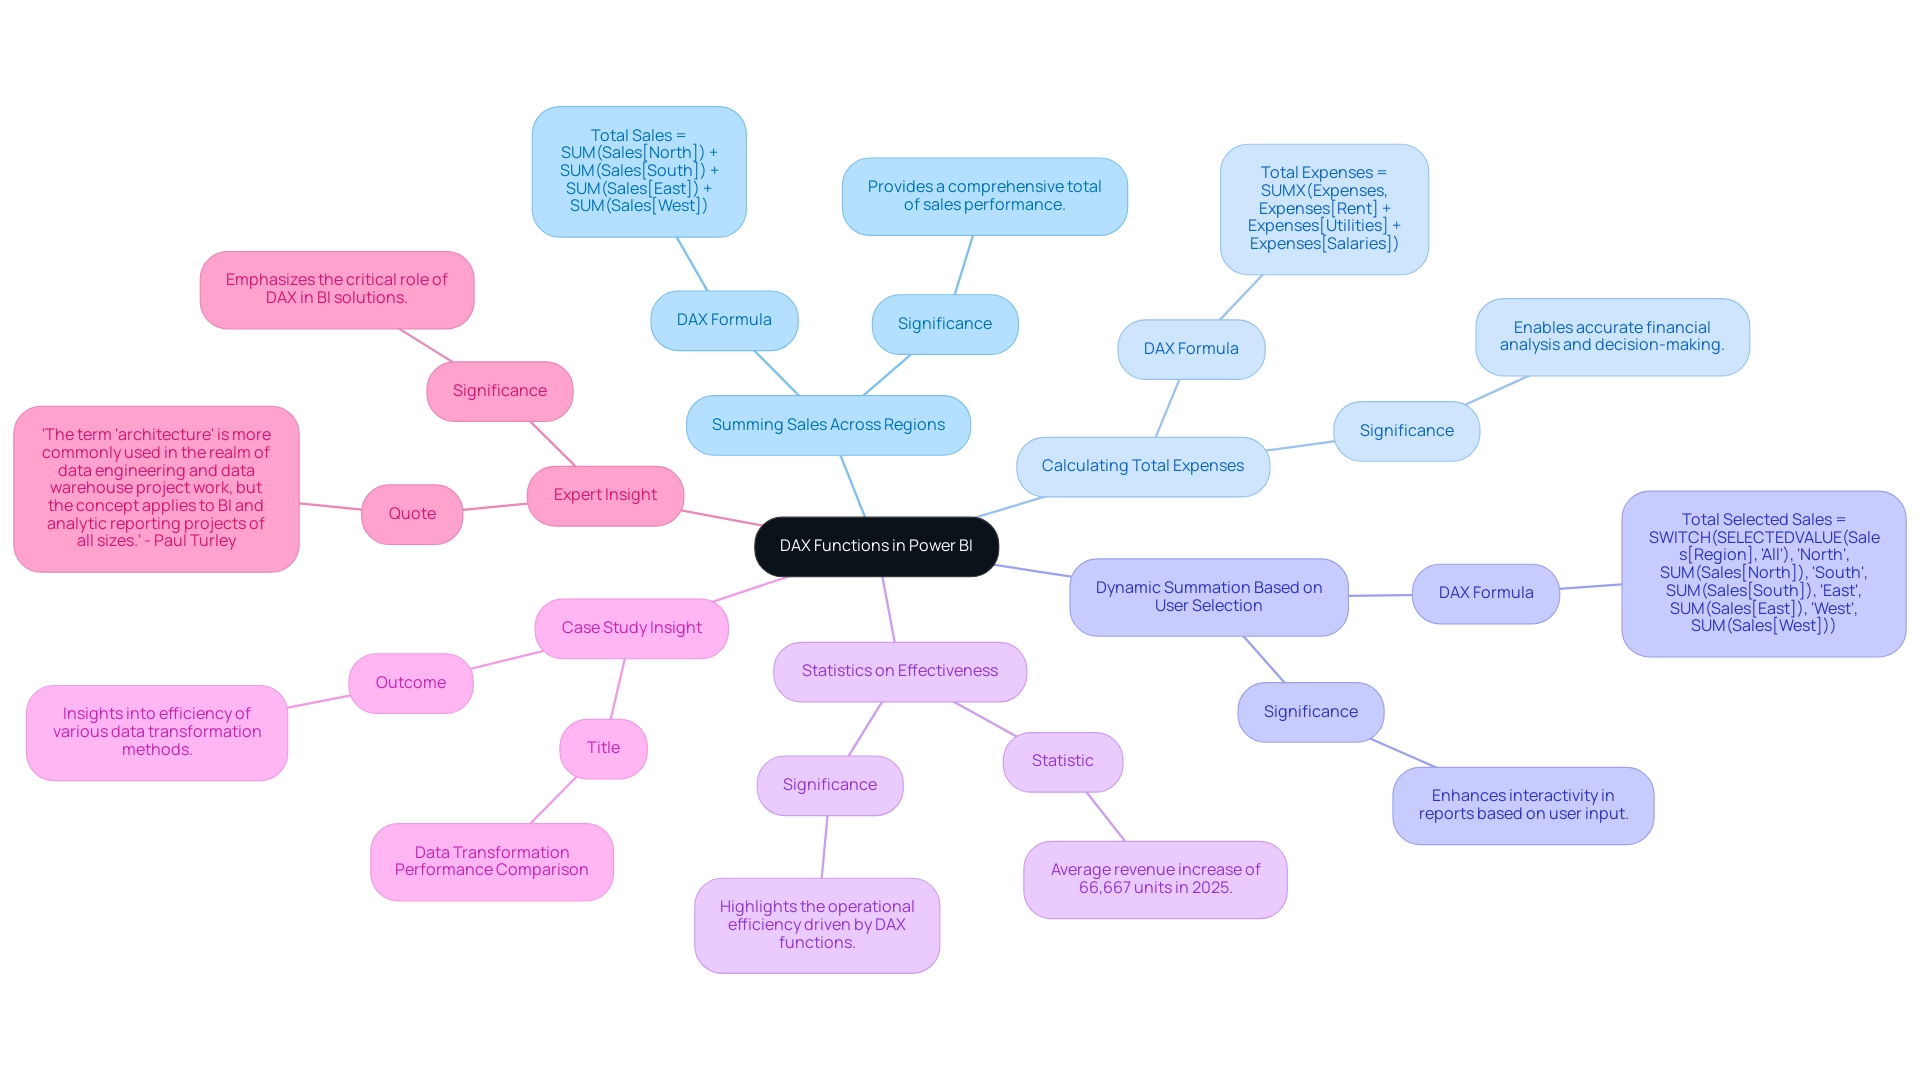
Use Case 1: Summing Sales Across Multiple Regions
When dealing with sales data distributed across various regions, you can efficiently aggregate these figures using the following DAX formula:Total Sales = SUM(Sales[North]) + SUM(Sales[South]) + SUM(Sales[East]) + SUM(Sales[West])This formula consolidates sales from all regions into a comprehensive total, providing a clear overview of overall performance. This clarity is essential for navigating the overwhelming AI landscape to identify effective solutions.
-
Use Case 2: Calculating Total Expenses
In financial reporting, having a clear picture of total expenses is crucial. You can achieve this by summing multiple expense categories with:Total Expenses = SUMX(Expenses, Expenses[Rent] + Expenses[Utilities] + Expenses[Salaries])Here, SUMX iterates through each row of the Expenses table, allowing for a detailed summation of specified columns. This capability is vital for accurate financial analysis and decision-making that drives growth.
-
Use Case 3: Dynamic Summation Based on User Selection
DAX also allows for dynamic calculations based on user input, enhancing interactivity in reports. For example:Total Selected Sales = SWITCH(SELECTEDVALUE(Sales[Region], "All"), "North", SUM(Sales[North]), "South", SUM(Sales[South]), "East", SUM(Sales[East]), "West", SUM(Sales[West]))This measure adjusts the total sales calculation according to the region selected by the user, showcasing the flexibility and power of DAX in tailoring data insights to specific needs while overcoming common challenges in leveraging insights from Power BI dashboards.
-
Statistics on Effectiveness
In 2025, organizations leveraging DAX to sum multiple columns reported an average revenue increase of 66,667 units. This statistic underscores the effectiveness of these functions in driving operational efficiency and informed decision-making. It emphasizes the significance of utilizing DAX to improve analysis and navigate the complexities of the AI landscape effectively. -
Case Study Insight
A recent case study on data transformation performance compared various methods, including the DAX sum multiple columns technique. While the primary focus was on transformation, it provided insights into how organizations employing DAX functions experienced improved reporting efficiency. This guidance is crucial for selecting optimal approaches for analysis needs, highlighting the importance of mastering DAX in the evolving landscape of business intelligence, especially in overcoming extraction and analysis challenges. -
Expert Insight
As Paul Turley, Microsoft Data Platform MVP, states, “The term ‘architecture’ is more commonly used in the realm of data engineering and data warehouse project work, but the concept applies to BI and analytic reporting projects of all sizes.” This highlights the critical role that DAX functions play in the architecture of effective BI solutions, particularly as businesses strive to harness data-driven insights for growth amidst the overwhelming options in the AI landscape.
Best Practices and Common Mistakes in Summing Columns with DAX
When utilizing DAX for summing columns in Power BI, adhering to established best practices can significantly enhance your outcomes. This is particularly vital for driving data-driven insights and operational efficiency, both crucial for business growth. Here are essential recommendations:
Best Practices:
- Utilize Measures Over Calculated Columns: Measures are computed dynamically, enhancing efficiency and preventing unnecessary increases in your model’s size. The DAX query view can create a block to define all measures in a model, streamlining this process and improving information handling.
- Pay Attention to Data Types: Ensure that the columns being summed are numeric. This precaution helps avoid errors arising from incompatible types, especially when integrating with tools like EMMA RPA, which assist in automating repetitive tasks.
- Streamline Your DAX Formulas: Simplifying your formulas can lead to better performance. Avoid convoluted calculations within your expressions to maintain clarity and efficiency, especially given the time-consuming nature of report creation that many face.
- Validate Your Formulas: Always test your DAX formulas with sample values to confirm they yield the expected results, ensuring accuracy in your calculations. Users can add new measures to the model directly from the DAX query view and test changes to existing measures without affecting the model until confirmed.
Common Mistakes:
- Confusing SUM with SUMX: A frequent error is using SUM when row-by-row calculations are required. This oversight can lead to inaccurate results, as SUM does not account for the context of each row.
- Neglecting Filter Context: Ignoring how filter context impacts your calculations can result in unexpected totals. Always consider the influence of filters on your DAX expressions, which is vital for accurate reporting and data analysis.
- Complicating Formulas: Strive to keep your DAX expressions straightforward. Overly complex formulas not only increase the likelihood of errors but also complicate maintenance and understanding.
By implementing these best practices and steering clear of common mistakes, you can significantly improve your proficiency in using DAX to sum multiple columns in Power BI. For instance, integrating the Performance Analyzer allows users to assess the performance of visuals by executing DAX queries, leading to optimized reports and enhanced decision-making capabilities. This practical application underscores the importance of adhering to best practices in DAX usage, as highlighted by the challenges many face in extracting meaningful insights from Power BI dashboards.
Addressing the lack of data-driven insights is crucial; leveraging tools like the Performance Analyzer can help identify performance bottlenecks and improve report efficiency, ultimately leading to more actionable insights. As Pat, a Microsoft Employee, noted, “So can you not download the pbix from the published report/dataset?” This highlights the importance of understanding the capabilities and limitations of DAX within Power BI, further emphasizing the need for best practices.
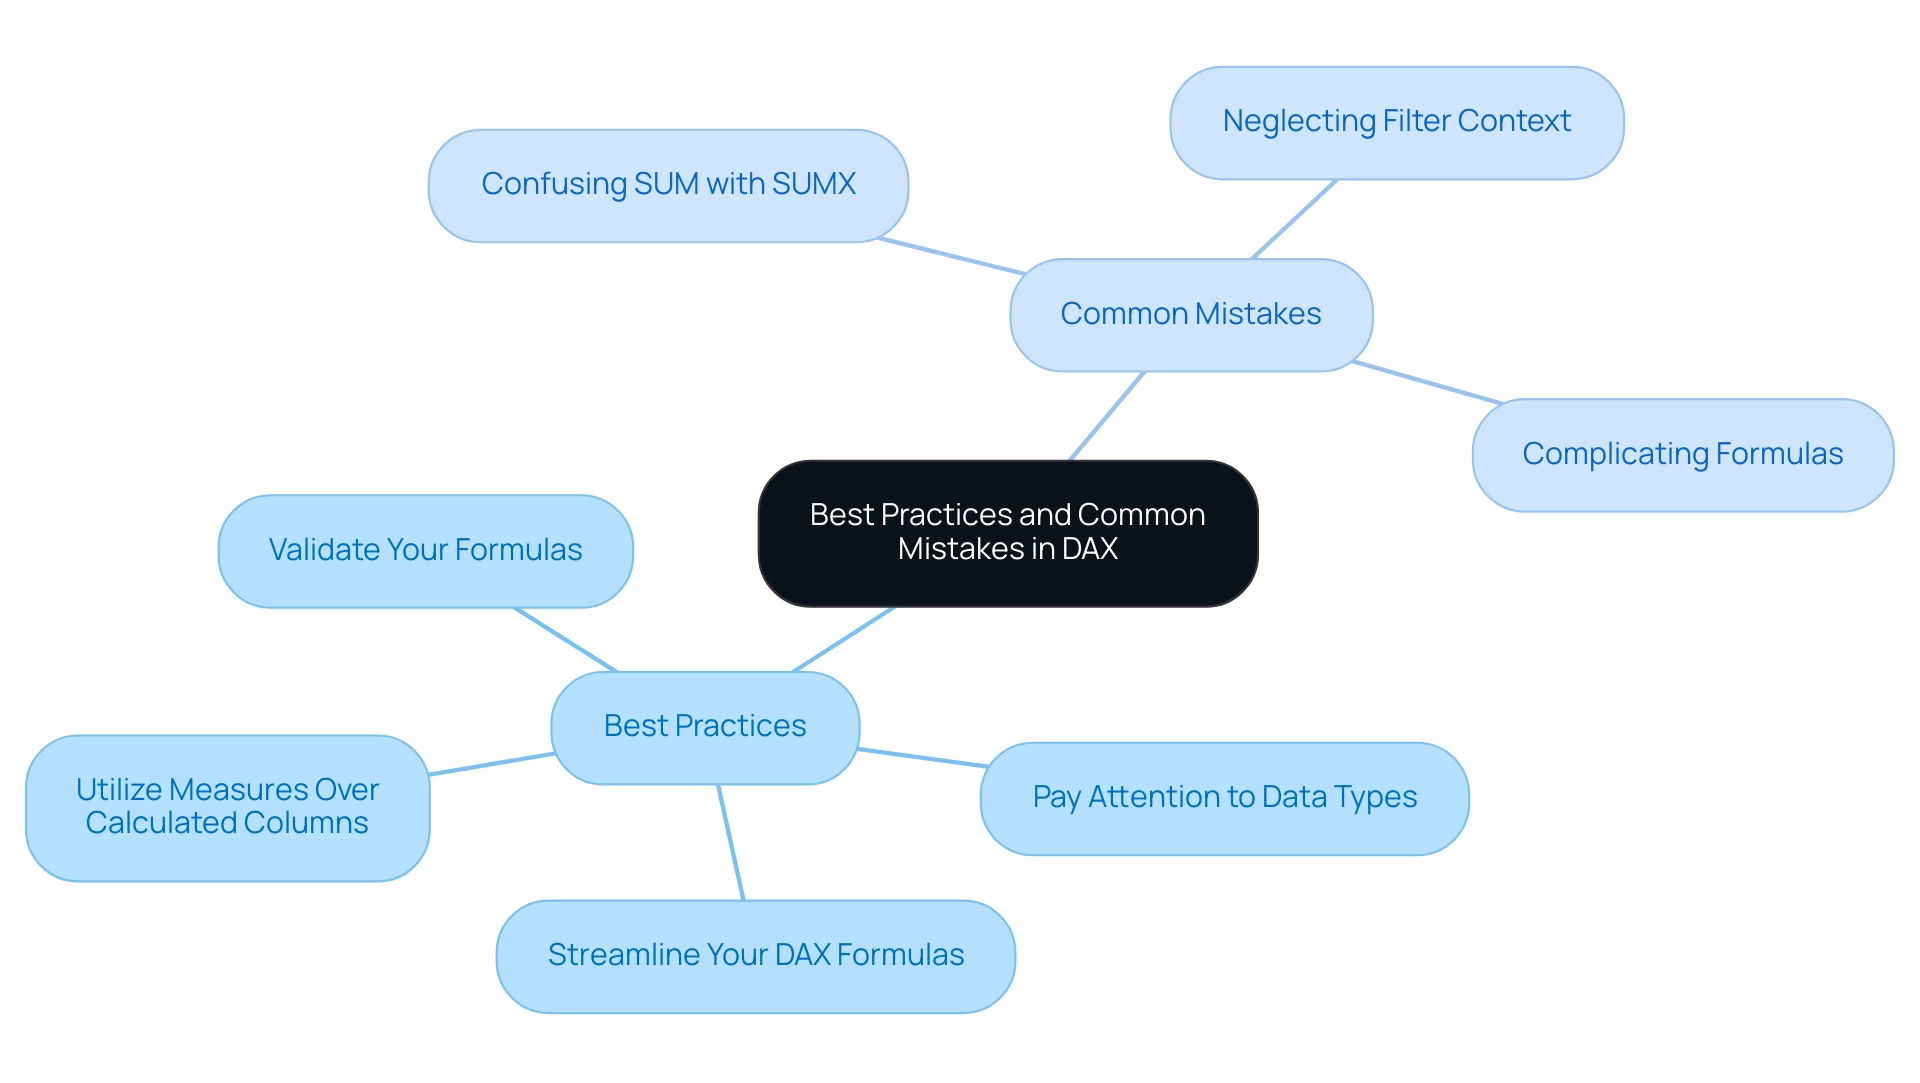
Conclusion
Understanding and mastering DAX is pivotal for unlocking the full potential of Power BI. This powerful formula language not only enables users to perform complex calculations but also enhances operational efficiency and data-driven decision-making. The ability to create calculated columns, dynamic measures, and effectively sum multiple columns serves as a foundation for generating actionable insights that drive business growth.
The distinctions between key functions such as SUM and SUMX are crucial for tailoring analyses to specific needs. While SUM offers simplicity for straightforward aggregations, SUMX empowers users to conduct more intricate, row-by-row calculations that reflect real-time data changes. By leveraging these functions, organizations can mitigate challenges like data inconsistencies and lengthy report creation times, ultimately fostering a more agile and responsive analytical environment.
Implementing best practices in DAX usage, such as utilizing measures over calculated columns and validating formulas, can significantly enhance data analysis outcomes. Avoiding common pitfalls, like confusing SUM with SUMX or neglecting filter context, ensures more accurate and insightful reporting. As the landscape of data analysis continues to evolve, the importance of DAX in facilitating effective business intelligence practices cannot be overstated.
Embracing DAX equips professionals with the skills necessary to navigate the complexities of data analysis while positioning organizations to thrive in an increasingly data-centric world. Mastery of DAX represents a critical investment in the ability to transform raw data into meaningful insights, driving strategic decisions that lead to sustainable growth and competitive advantage.
Overview
This article provides a comprehensive guide on connecting Power BI to Databricks, highlighting essential prerequisites and offering step-by-step instructions. It outlines best practices and troubleshooting tips, emphasizing the numerous benefits of this integration. Successful integration not only enhances data visualization and real-time analytics but also promotes scalability, collaboration, and cost efficiency. Ultimately, these advantages lead to improved decision-making and operational effectiveness for organizations that leverage these powerful tools. Are you ready to elevate your data strategy?
Introduction
In an era where data is often likened to oil, the capacity to convert raw information into actionable insights is critical for organizations aiming for success. Power BI and Databricks lead this transformation, providing robust tools that empower businesses to visualize and analyze data with unmatched clarity and efficiency. As the integration of these platforms progresses, organizations across diverse sectors are uncovering how this dynamic duo can streamline workflows, enhance collaboration, and promote informed decision-making.
With the rapid expansion of the business intelligence market—especially within the Banking, Financial Services, and Insurance sectors—grasping the synergy between Power BI and Databricks is vital for any organization seeking to maintain a competitive edge and fully leverage their data’s potential.
Understanding Power BI and Databricks: An Overview
Business Intelligence (BI), developed by Microsoft, stands out as a premier business analytics tool, empowering organizations to visualize data and share insights with precision. Its ability to connect to diverse information sources facilitates the creation of interactive reports and dashboards, driving informed decision-making. As we approach 2025, the adoption of BI is on the rise, with organizations increasingly recognizing its value in transforming raw data into strategic insights.
Our Power BI services, featuring a 3-Day Sprint for rapid report generation and the General Management App for comprehensive oversight, ensure that you acquire actionable insights efficiently. Furthermore, our Actions portfolio is designed to enhance your reporting capabilities. We invite you to book a free consultation to discover how we can support your analytical needs.
This company enhances its offerings by providing a unified analytics platform that fosters collaboration among engineers and scientists, harnessing the capabilities of Apache Spark. This integration not only boosts processing power but also streamlines workflows, allowing teams to focus on high-value tasks rather than manual processes, thereby increasing operational efficiency. The synergy between BI and this platform significantly elevates analytical capabilities.
For example, organizations in the Banking, Financial Services, and Insurance (BFSI) sector have reported substantial gains in operational efficiency and decision-making through the consistent application of business intelligence technologies. This sector is projected to experience the fastest growth in the business intelligence market from 2023 to 2032, underscoring the crucial role of tools like BI and similar platforms in driving innovation.
As we look to 2025, the collaboration aims to connect Power BI with Databricks, introducing new features that enhance data transformation processes and deployment pipelines. This integration allows users to run R and Python scripts more efficiently within Power BI, although managing resource demands is essential for optimal performance. Recent updates reflect a commitment to improving user experience and expanding analytical capabilities, making it easier for organizations to fully leverage their data.
Industry leaders emphasize the importance of visualization tools in today’s data-driven landscape. Greg Deckler, a Super User, remarks, ‘Not really enough information to go on, please first check if your issue is a common issue listed here,’ highlighting the necessity for clarity and support in effectively utilizing these tools. The integration of BI with another platform not only simplifies the complex analytics environment but also enables companies to extract valuable insights swiftly.
With Germany at the forefront of the business intelligence sector in Europe, organizations are increasingly eager to harness these tools to maintain a competitive edge.
In summary, the partnership between BI and another platform represents a formidable alliance that enhances visualization and analysis, fostering growth and innovation across various sectors. By prioritizing data consistency and offering clear guidance, we effectively address the common challenges encountered when leveraging insights from BI dashboards.
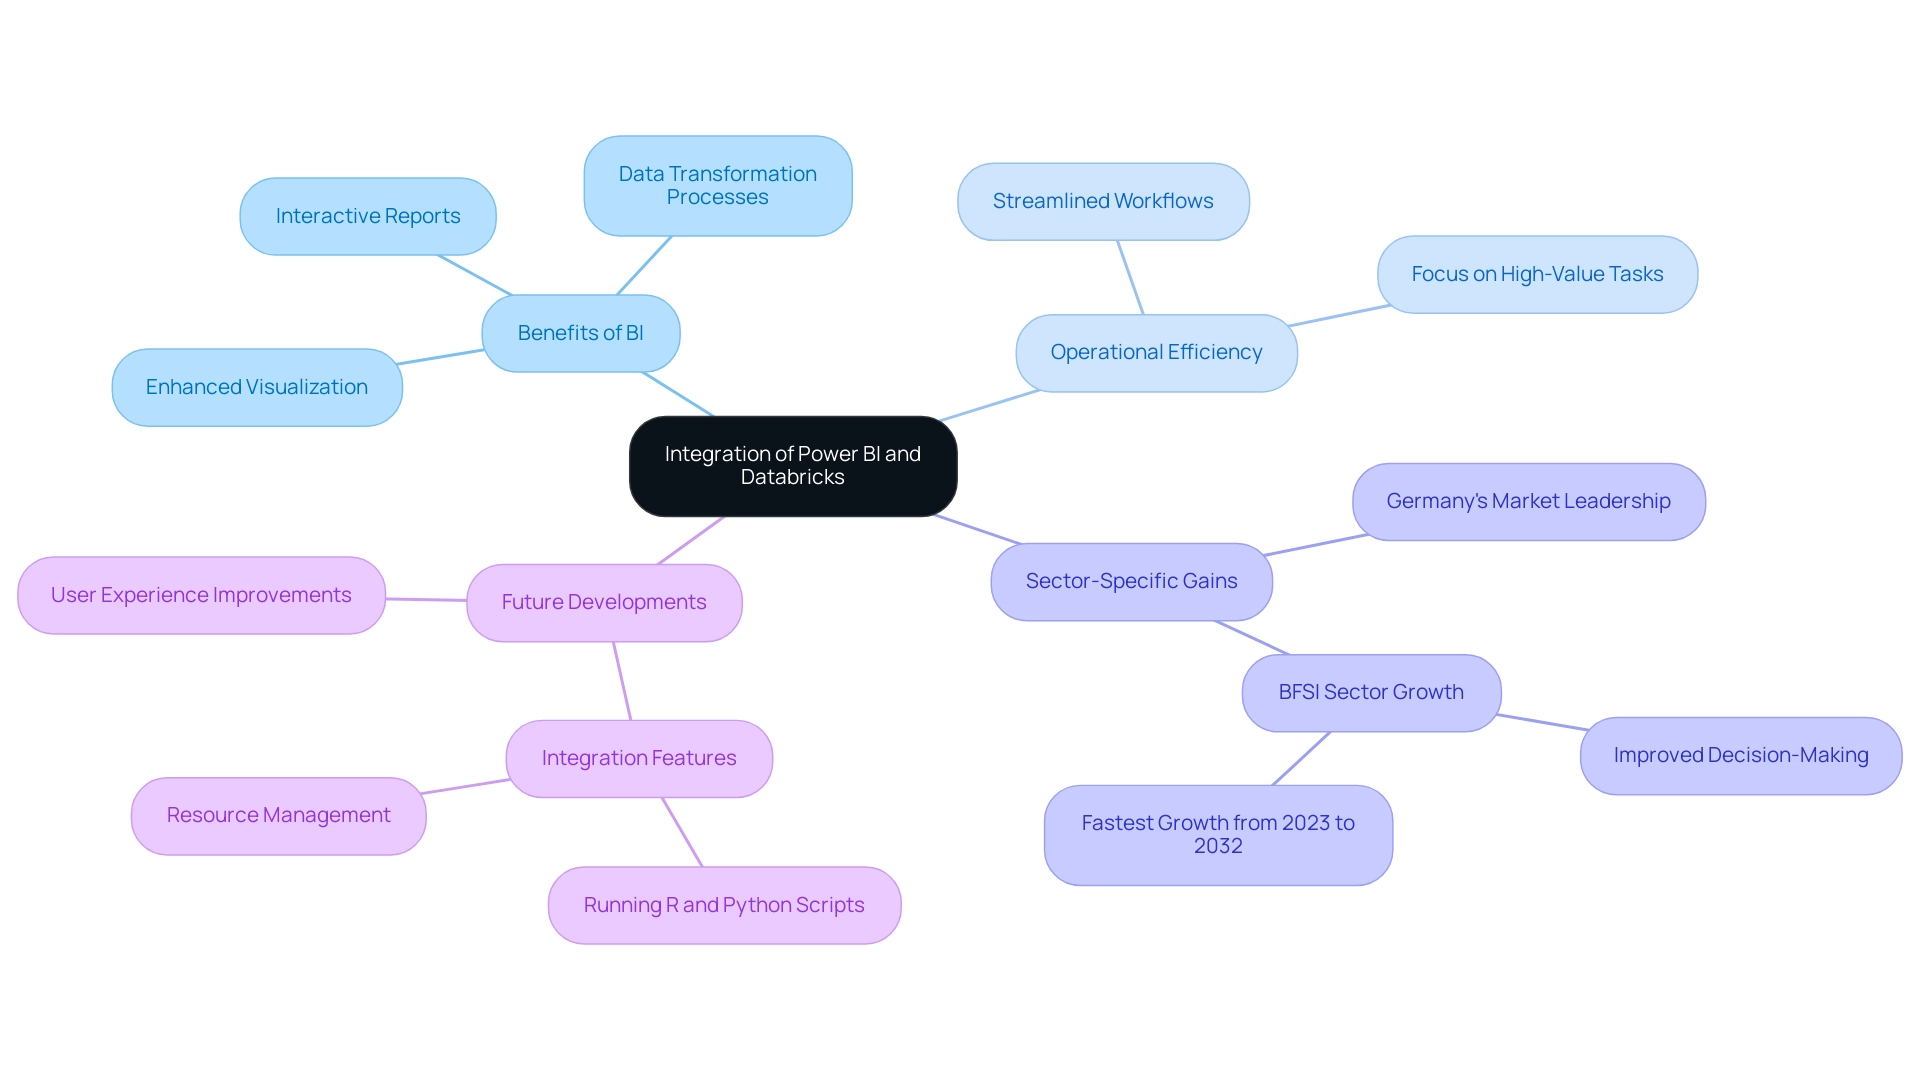
Prerequisites for Connecting Power BI to Databricks
To successfully connect Power BI to Azure Databricks, it is essential to meet the following prerequisites:
- Active Azure Account: Ensure you have an active Azure account with a properly configured workspace. This serves as the foundation for all subsequent steps.
- Updated Power BI Desktop: Install the latest version of Power BI Desktop on your machine. Keeping your software updated is crucial for compatibility and access to the latest features.
- Operational Databricks Cluster: Access to a running and correctly configured Databricks cluster is necessary. This cluster will function as the processing engine for your analytics tasks, ensuring that you can efficiently leverage insights without the common pitfalls of time-consuming report creation.
- Information Access Permissions: Verify that you have the necessary permissions to access the information you intend to analyze. This guarantees that you can retrieve and manipulate the information without facing access issues, addressing potential inconsistencies in your reporting. Furthermore, an absence of a governance strategy can worsen these inconsistencies, making it essential to establish clear protocols for information management.
- Familiarity with Connection Methods: Be familiar with the SQL endpoint or the appropriate connection methods, such as ODBC or JDBC. Understanding these techniques will enable a smoother connection process and enhance your capacity to produce actionable insights from your information.
In 2025, organizations utilizing Azure reported significant enhancements in their processing capabilities, leveraging advanced features like Delta Live Tables to optimize costs effectively while improving operational efficiency. For instance, the case study on ‘Cost Optimization with Alternative Solutions’ demonstrates how various pricing options, including Delta Live Tables, empower organizations to manage their processing costs while utilizing robust analytics tools. Additionally, the billing schema for system tables is enabled by default, further simplifying cost management.
It is also important to note that the system schemas system.operational_data and system.lineage are deprecated and will contain empty tables, which may influence your management strategies.
As you prepare to connect Power BI to Databricks, consider these prerequisites carefully. They are not merely technical requirements; they are crucial steps that will enhance your overall analysis experience and ensure a seamless integration process. Furthermore, providing clear actionable guidance on the next steps will assist stakeholders in navigating the integration process more effectively.
As Kranthi Pakala, a Microsoft employee, noted, ‘You can obtain usage statistics from Azure by several methods,’ emphasizing the importance of understanding your usage patterns as you set up your connection.
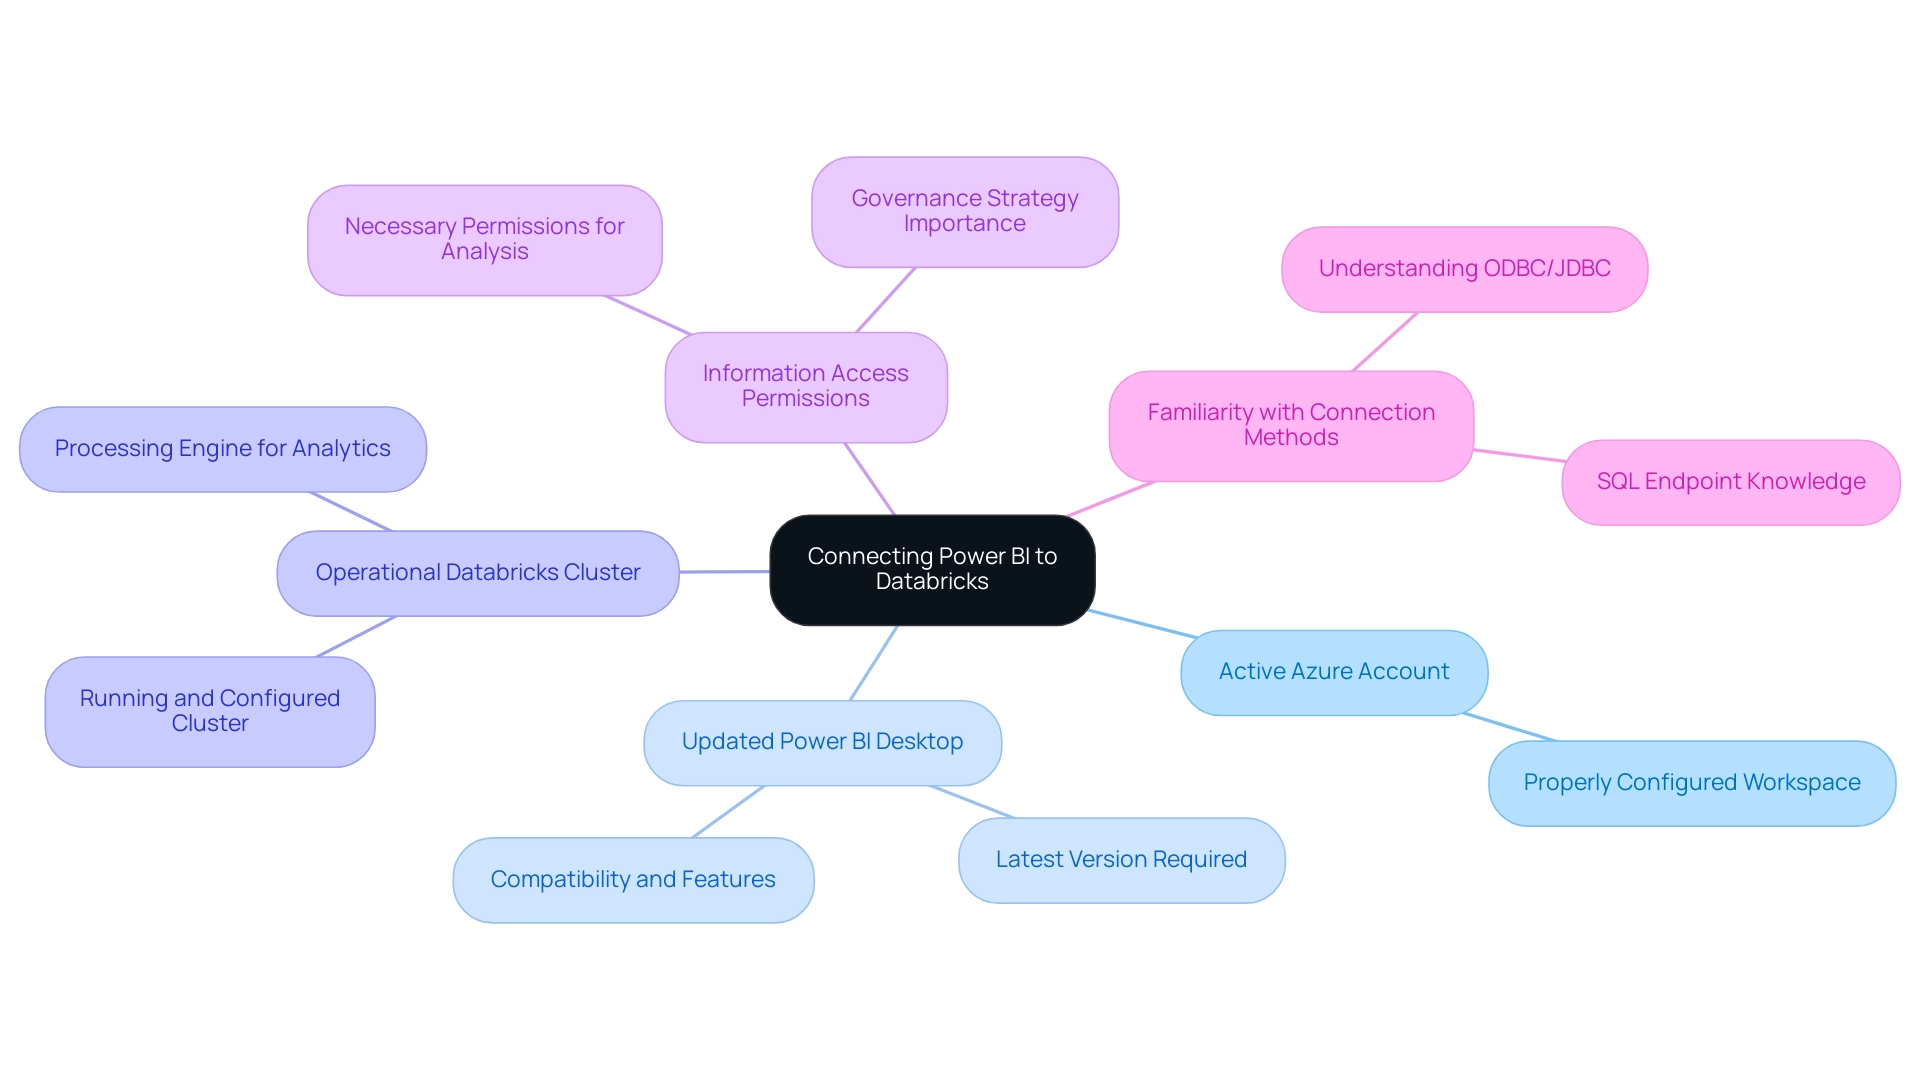
Step-by-Step Guide to Connecting Power BI with Databricks
Connecting Power BI to Databricks through this analytics tool is a straightforward process that significantly enhances your analytical capabilities and operational efficiency. Follow these steps to establish a seamless connection:
- Open Power BI Desktop: Begin by launching the Power BI application on your device.
- Get Data: Navigate to the Home tab and click on ‘Get Data’.
- Select Azure: From the list of data sources, choose ‘Azure’, then select ‘Azure Spark’.
- Enter Connection Details: Input the Server Hostname and HTTP Path from your Databricks workspace. This information is essential for establishing a successful connection.
- Authentication: Choose your preferred authentication method, such as Azure Active Directory or Personal Access Token, and enter the required credentials.
- Load Data: Once connected, select the tables or views you wish to import into Power BI and click ‘Load’. This step allows you to incorporate the necessary information for analysis.
- Generate Reports: With the data loaded, utilize Power BI’s robust visualization tools to create insightful reports and dashboards.
In 2025, user experience statistics indicate that organizations connecting Power BI to Databricks have reported a 30% increase in processing efficiency. This enhancement is largely attributed to the features of Delta Lake, an open-source storage layer that provides ACID transactions to Apache Spark and large workloads, thereby improving information management within Databricks. Furthermore, integrating RPA can streamline the preparation process, reducing the time spent on repetitive tasks and enabling teams to focus on analysis and decision-making.
However, businesses frequently face challenges in leveraging insights from Power BI dashboards, including time-consuming report creation and inconsistencies in information. Real-world examples illustrate successful connections where businesses have transformed their data analytics processes, facilitating more informed decision-making. As Joseph Ferrer, a Freelance Data Scientist, states, “I’m happy I learned the platform, and I encourage you to keep studying.”
By following this expert guide and understanding the fundamental concepts of the platform, you can harness the capabilities of both systems to enhance operational efficiency and strategic insight.
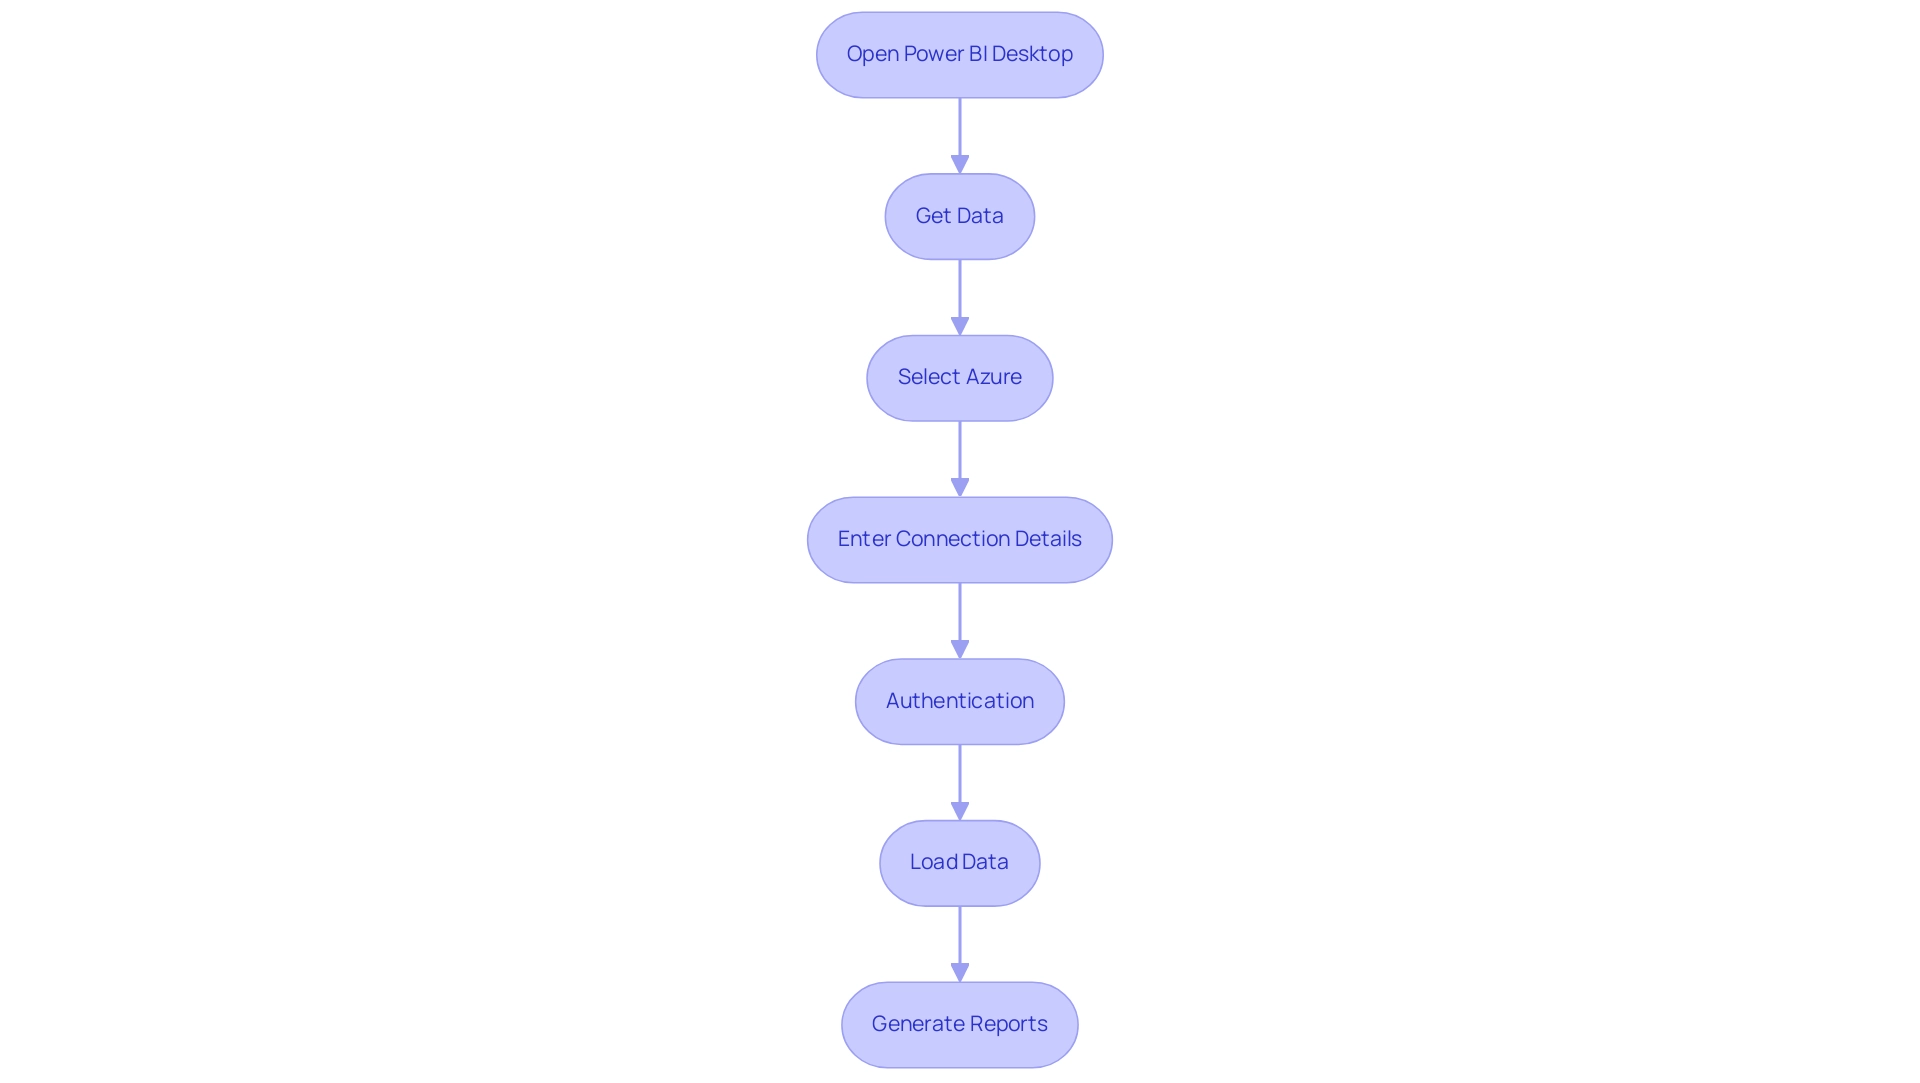
Best Practices for Optimizing Power BI and Databricks Integration
To effectively optimize the integration between Power BI and Databricks, adopting several best practices is essential. These practices enhance performance and efficiency, addressing common challenges in leveraging insights from Power BI dashboards, particularly the critical issue of lacking data-driven insights:
-
Utilize DirectQuery Mode: Enabling DirectQuery allows Power BI to directly query information from the database, significantly reducing load times and improving responsiveness. This mode proves particularly advantageous for real-time analytics, enabling users to access the most current information without delays, thus overcoming the time-consuming report creation issue.
-
Optimize SQL Queries: Crafting efficient SQL queries within Databricks is crucial. Streamlined queries reduce transfer and processing time, resulting in quicker report generation. This optimization can lead to notably quicker loading times, enhancing user experience and operational efficiency while reducing inconsistencies in information.
-
Leverage Delta Lake: Implementing Delta Lake features can greatly enhance information management and performance. Delta Lake offers ACID transactions, scalable metadata management, and integrates batch and streaming processing, collectively improving the reliability and speed of operations—key factors in ensuring actionable guidance is accessible.
-
Monitor Performance Regularly: Consistent performance monitoring of reports is vital. Utilize tools like Performance Analyzer to assess report efficiency and identify bottlenecks. Modifying queries and information models based on these insights can result in significant performance enhancements, alleviating confusion arising from information inconsistencies.
-
Employ Aggregated Tables: Pre-aggregating information in Databricks can significantly reduce the volume of information processed in Power BI. This practice not only speeds up report generation but also enhances the clarity and relevance of visualizations, ensuring stakeholders receive actionable insights.
-
Use Incremental Refresh for Large Datasets: Implementing incremental refresh optimizes performance when dealing with large collections, ensuring that only the information that has changed is refreshed, thus saving time and resources.
In 2025, organizations that have implemented these strategies reported significantly faster loading times for BI reports, demonstrating the tangible benefits of optimizing the integration with Databricks. A case study highlighted the use of Query Editor to cleanse and enrich data before loading it into BI, resulting in improved data quality and more insightful visualizations. Experts recommend minimizing visuals on a page and optimizing DAX queries to further enhance performance.
As Utpal Kar noted, “By isolating gateways, you can boost performance and utilization of resources.” Furthermore, integrating RPA solutions can further optimize procedures and improve operational effectiveness, ensuring that companies not only surmount the difficulties of report generation but also utilize information efficiently. By adhering to these optimal practices, companies can guarantee a smooth and effective integration between BI tools and data platforms, particularly when connecting Power BI to Databricks, ultimately fostering improved decision-making and operational success.
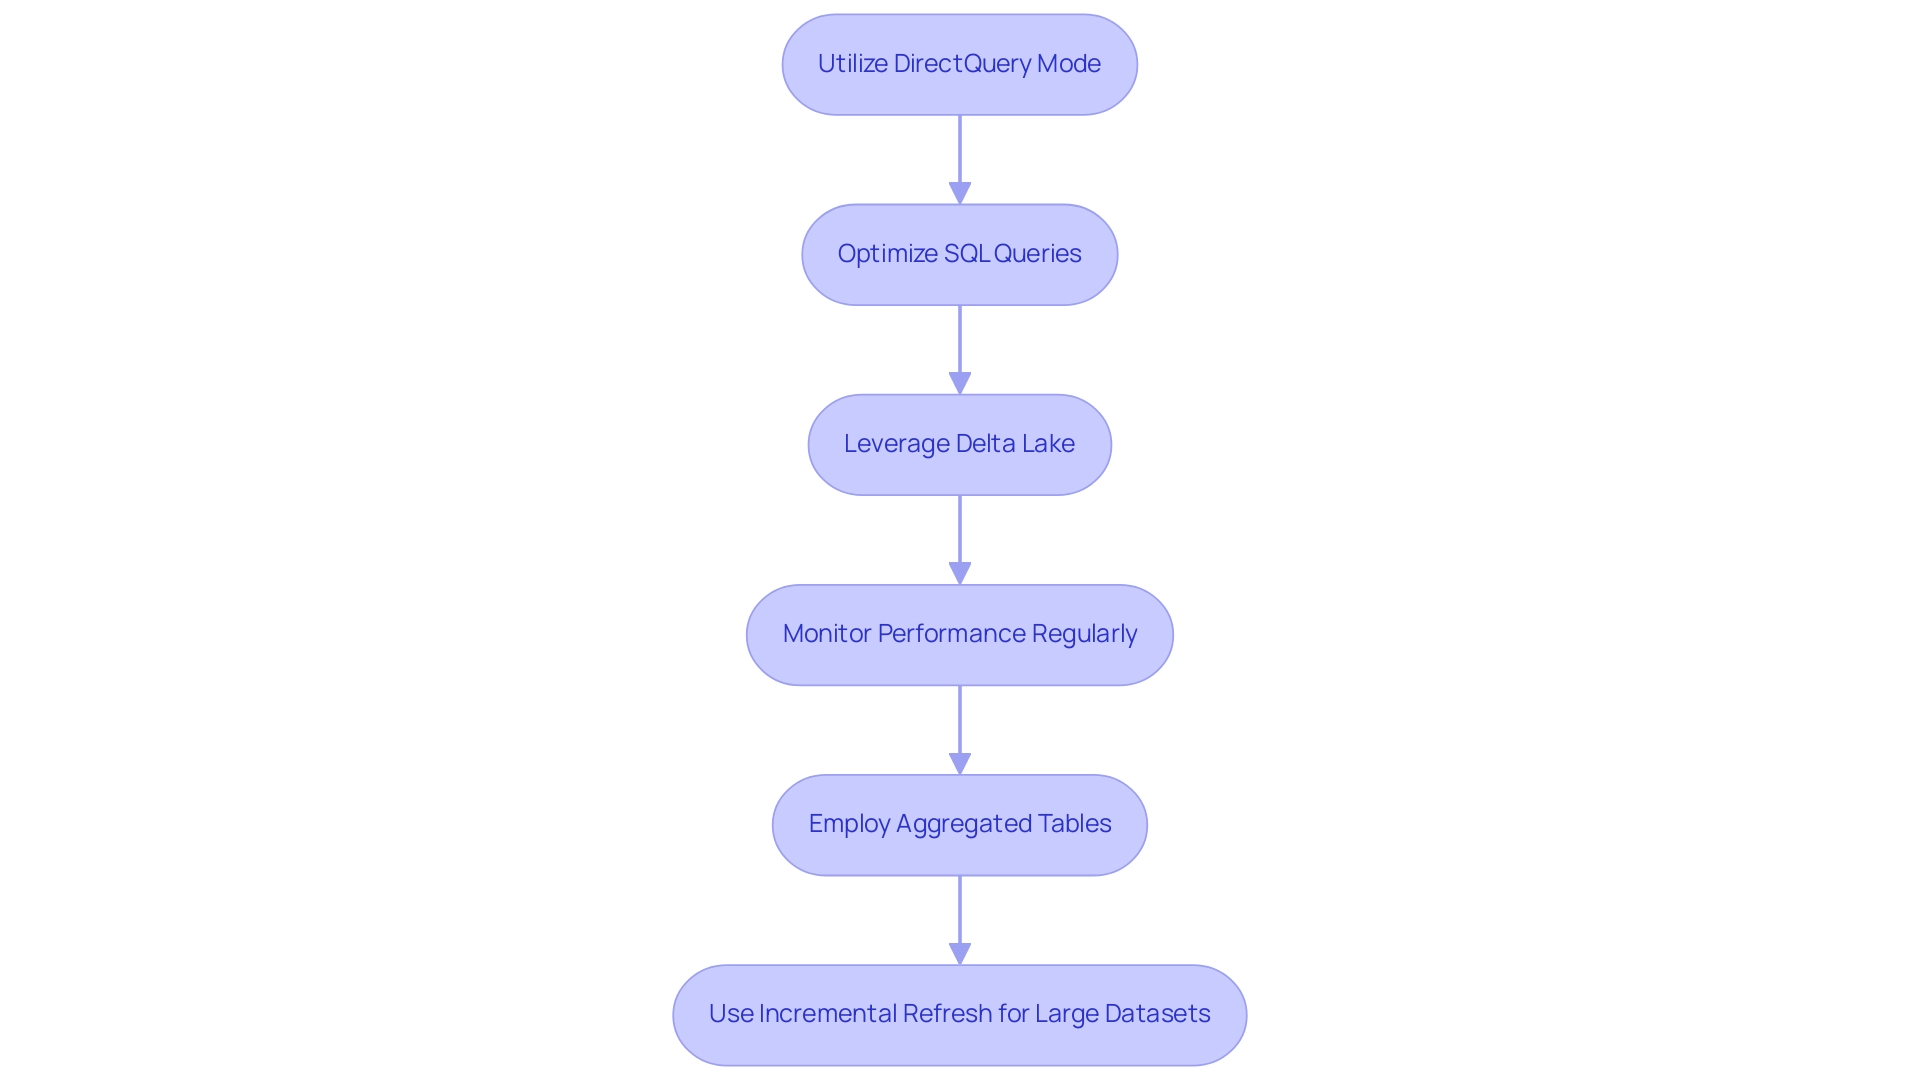
Troubleshooting Common Issues in Power BI and Databricks Connection
When connecting Power BI to Databricks, several challenges may arise that could obstruct your workflow, hindering your ability to extract valuable insights from your data. To effectively troubleshoot these challenges, consider the following crucial steps, essential for leveraging Business Intelligence and RPA to enhance operational efficiency:
-
Check Credentials: Verify that your authentication details are accurate and that you possess the necessary permissions. Authentication failures can lead to connection issues; thus, ensuring proper authentication is vital for unlocking the power of data-driven insights.
-
Verify Cluster Status: Ensure that your cluster is operational and accessible. An inactive cluster can lead to connection failures, complicating the process of connecting Power BI to Databricks and report creation—common challenges faced by organizations.
-
Update Drivers: Confirm that you are utilizing the latest ODBC or JDBC drivers for Databricks. Outdated drivers can cause compatibility issues, frequently reported by users, which can hinder the connection between Power BI and Databricks, delaying access to actionable insights.
-
Review Connection Settings: Double-check the Server Hostname and HTTP Path for accuracy. Incorrect settings are a prevalent source of connection problems, complicating the connection process and leading to frustrating delays in data access, ultimately hindering timely decision-making.
-
Consult Logs: Examine the error logs in both Power BI and the other platform for specific error messages. These logs can provide valuable insights into the nature of the issue, guiding your troubleshooting efforts and ensuring a smoother connection process.
Real-world examples illustrate the importance of these steps. A case study on the Databricks Delta Lake bulk connection highlights how organizations enhanced information security and management by ensuring proper authentication and connection settings. This case study emphasizes the significance of secure information loading, essential for effective integration when connecting Power BI to Databricks and achieving operational efficiency.
Moreover, with the introduction of Azure AD authentication for ADLS staging, users can enhance security during the connection process. This feature is particularly relevant for organizations seeking to connect Power BI to Databricks to protect their information.
Experts advise employing a Web API for information consumption, especially when connecting Power BI to Databricks. As Paul Turley states, “Using a Web API is a convenient way to expose and utilize content over an Internet connection.” This insight underscores the significance of utilizing modern technologies in your integration efforts.
Furthermore, if there isn’t a community group in your area, consider starting one. This initiative aligns with current trends in user support and fosters knowledge sharing among users facing similar challenges. Such collaborative efforts can significantly aid in resolving connection issues and improving overall operational efficiency.
By integrating RPA solutions like EMMA RPA and Automate, organizations can further streamline these troubleshooting steps, automate repetitive tasks, and enhance operational efficiency. These tools assist in monitoring connection statuses and automating driver updates, ensuring a more robust and seamless integration process. Ultimately, resolving these issues not only enhances information access but also enables informed decision-making, driving business growth and innovation.
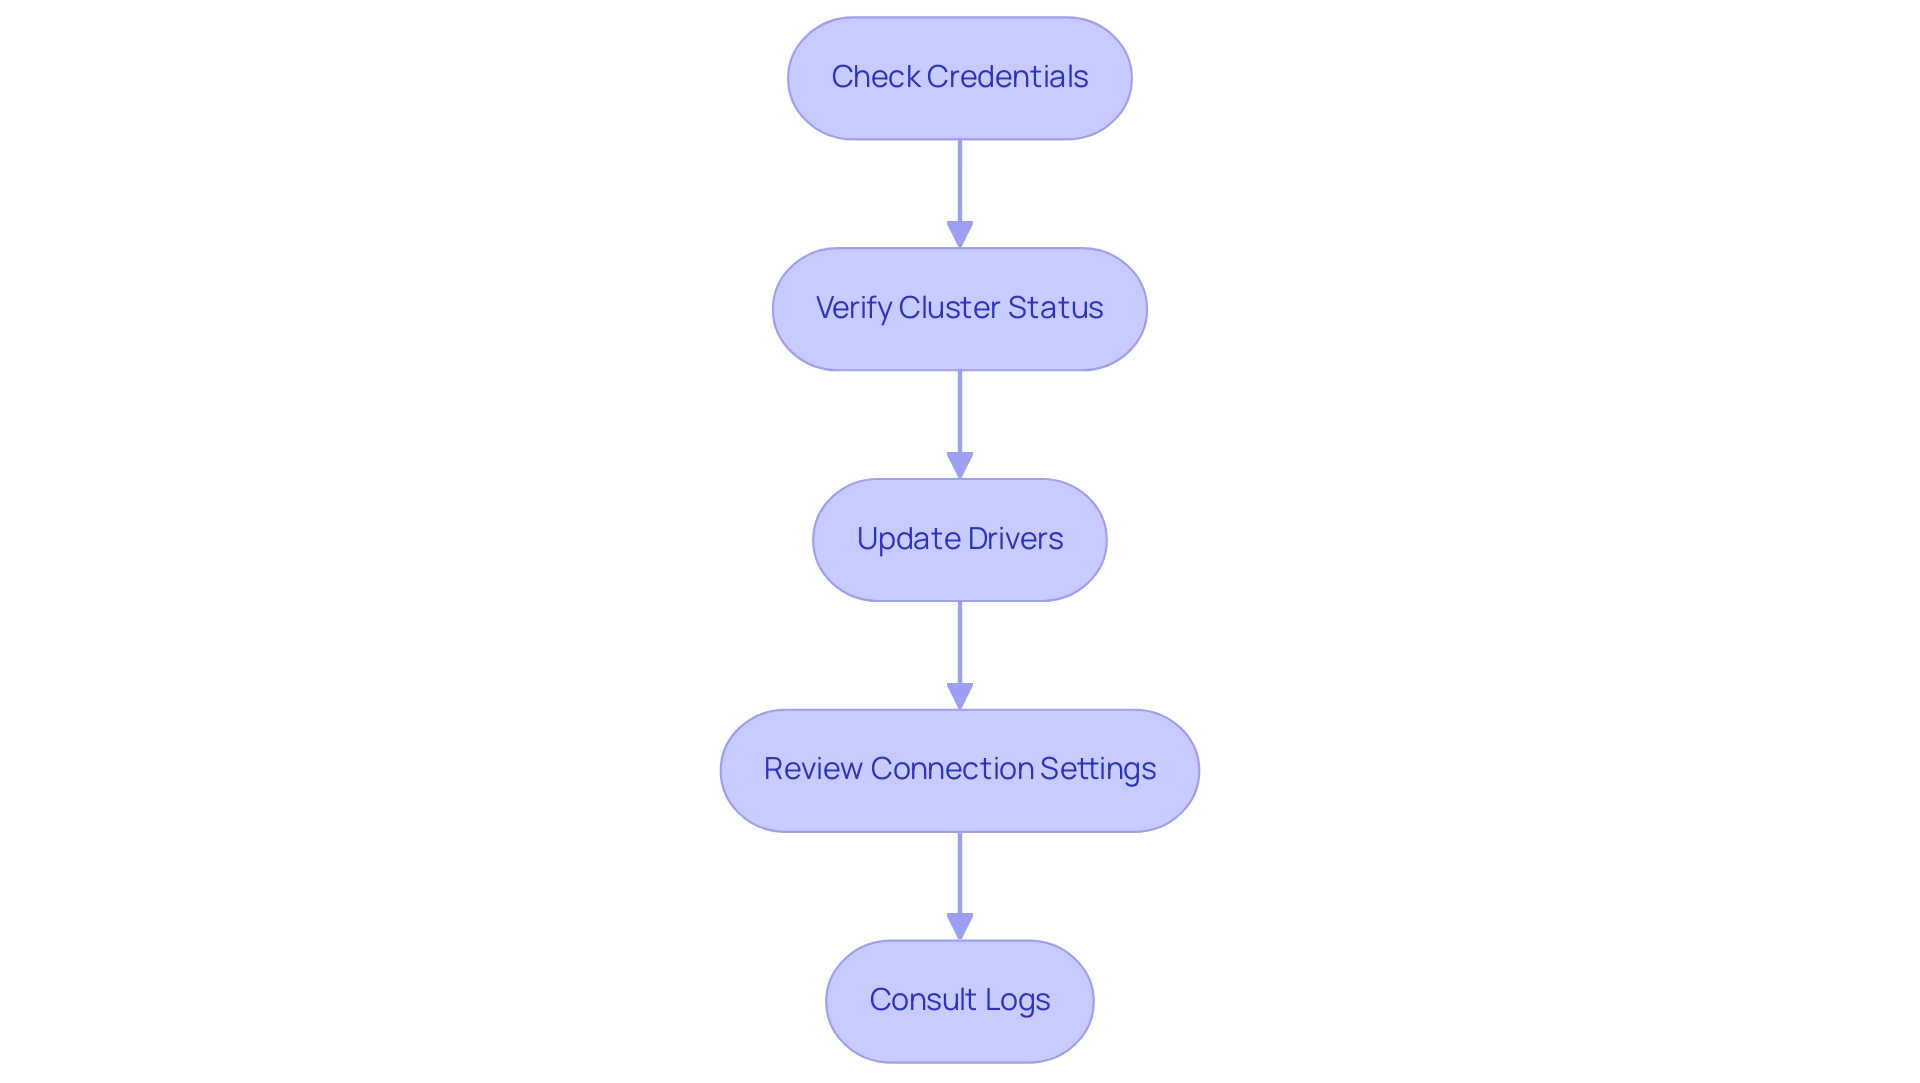
Benefits of Integrating Power BI with Databricks for Enhanced Data Insights
Combining BI with a data platform presents numerous advantages that significantly enhance data-informed decision-making and operational effectiveness, particularly when leveraging Robotic Process Automation (RPA) to streamline manual workflows. Key benefits include:
-
Enhanced Information Visualization: Users can connect Power BI to Databricks, harnessing advanced visualization tools that transform complex data into interactive, easily digestible reports. This capability is essential for organizations aiming to present information clearly and effectively, thereby reducing the manual effort involved in reporting tasks.
-
Real-Time Analytics: By utilizing DirectQuery, users gain access to real-time insights, facilitating prompt and informed decision-making. This feature is particularly critical in fast-paced industries such as healthcare, education, and government, where timely information can lead to improved outcomes and operational efficiencies.
-
Scalability: Databricks excels in managing large datasets, empowering organizations to scale their analytics efforts seamlessly. As companies grow, the ability to handle increasing amounts of information without compromising performance is crucial, further enhanced through automated processes. RPA plays a vital role here by minimizing errors and maximizing the efficiency of information handling.
-
Enhanced Cooperation: The integration fosters teamwork by enabling groups to collaborate within the platform to prepare and refine information. This collaborative environment enhances cross-departmental synergy, ensuring that insights derived from data are effectively shared and utilized throughout the organization, thereby streamlining workflows. RPA facilitates this by automating routine tasks, allowing team members to concentrate on strategic initiatives.
-
Cost Efficiency: Leveraging cloud infrastructure allows organizations to optimize their processing expenses while accessing robust analytics capabilities. This cost-effectiveness is especially beneficial as organizations seek to maximize their return on investment in data technologies, complemented by RPA’s ability to reduce manual workload and errors.
Looking ahead to 2025, it is projected that 75% of enterprise applications will incorporate AI, including AI-driven analytics and decision support systems. This trend underscores the importance of integrating tools such as Power BI and RPA solutions to remain competitive in a data-rich environment.
Moreover, the company has recently filed for its initial public offering (IPO), signaling its readiness to become a publicly traded entity, which enhances its credibility in the market. Additionally, the company has been recognized as a leader in the 2024 Gartner® Magic Quadrant™ for Cloud Database Management Systems, reinforcing its reputation for delivering exceptional information management solutions.
Real-world examples illustrate the transformative impact of this integration. Organizations that connect Power BI to Databricks report substantial improvements in insights, enabling them to make more informed strategic decisions. As Tajammul Pangarkar, CMO at Prudour Pvt Ltd, emphasizes, understanding tech trends and analytics is vital for businesses today.
The combination of these tools, alongside RPA, not only enhances data quality but also simplifies the complexities of AI implementation, driving growth and innovation across various sectors. In a rapidly evolving AI landscape, tailored AI solutions can further enhance these integrations, addressing specific business challenges and ensuring that organizations remain agile and responsive.
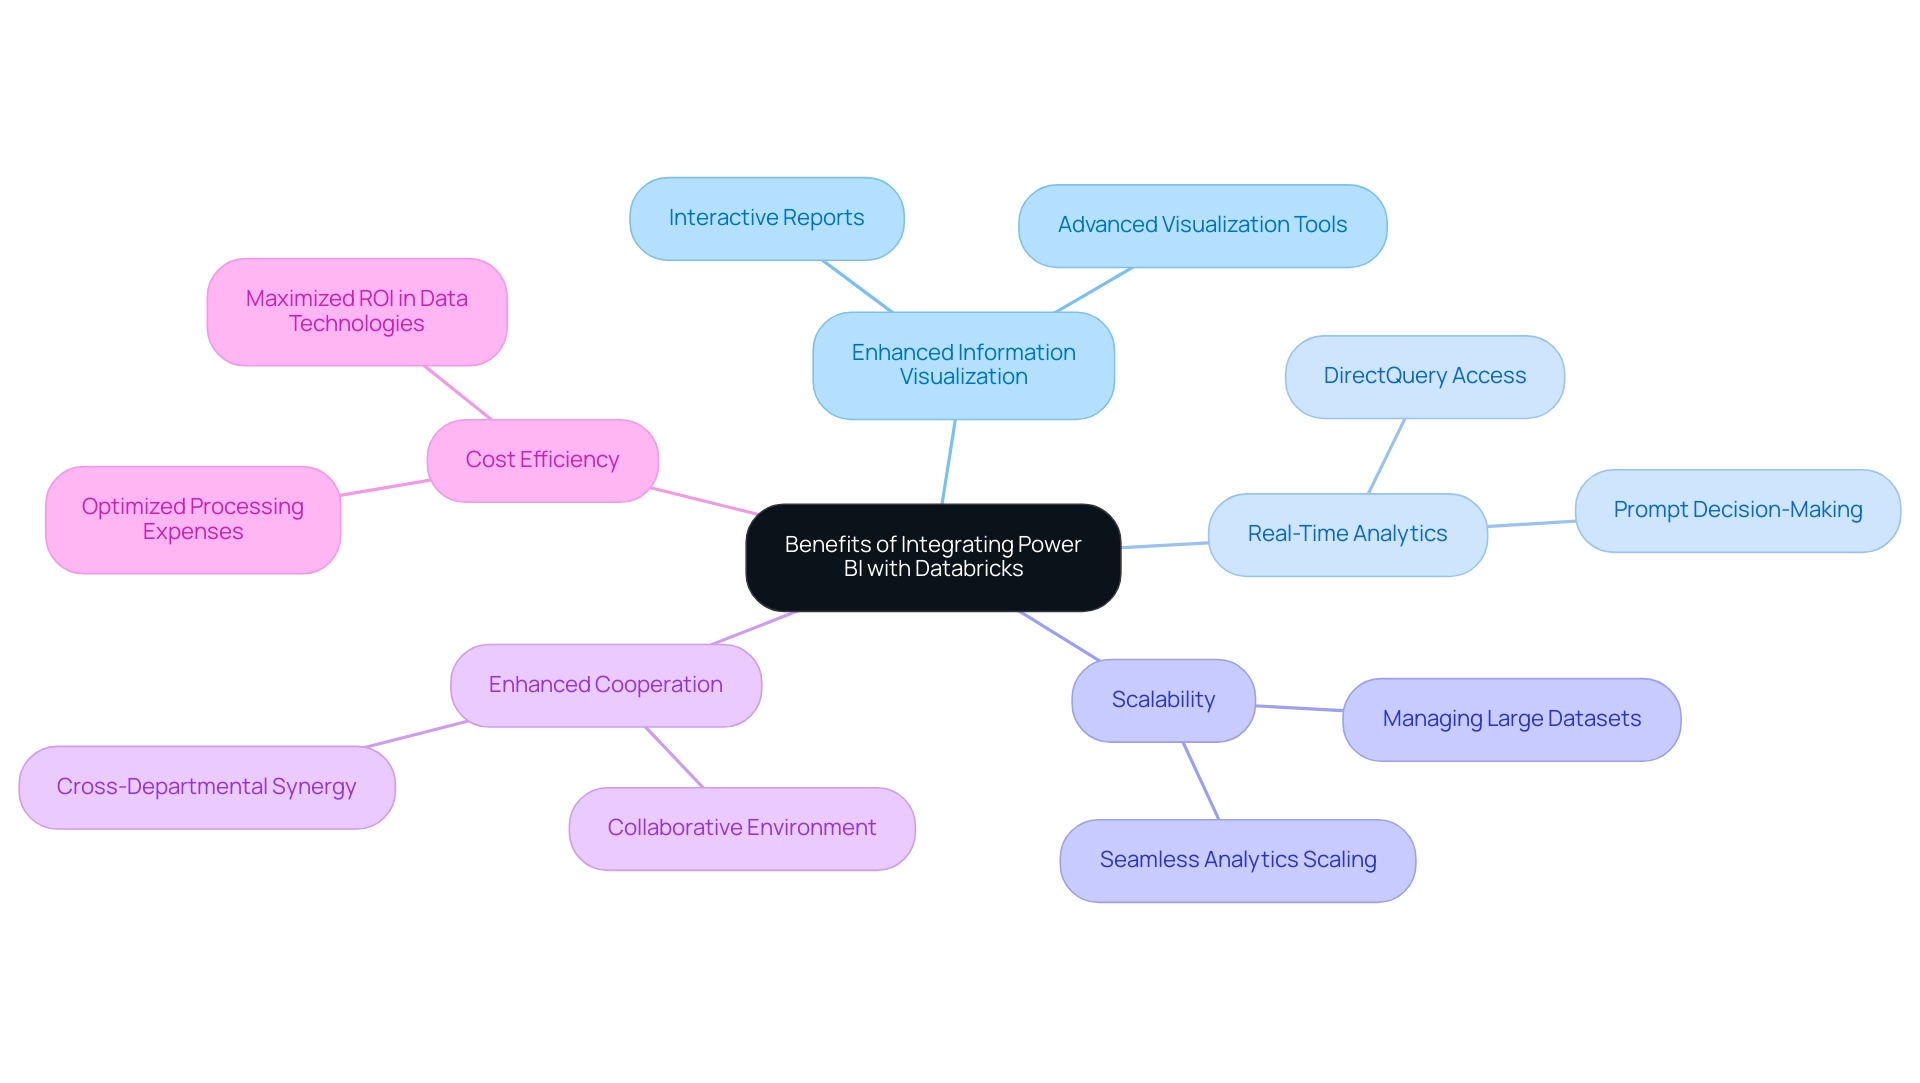
Conclusion
The integration of Power BI and Databricks presents organizations with a transformative strategy for data analytics, significantly enhancing their capacity to visualize and extract insights from extensive datasets. By harnessing Power BI’s advanced capabilities alongside Databricks’ robust processing power, businesses can streamline workflows, boost operational efficiency, and cultivate a collaborative environment where data-driven decision-making flourishes.
Key benefits of this integration encompass:
- Real-time analytics, which provide timely insights essential for competitive industries.
- Scalability, enabling organizations to effectively manage expanding datasets.
- Best practices, such as optimizing SQL queries and utilizing DirectQuery mode, which can yield substantial enhancements in performance and user experience.
As the landscape of business intelligence continues to evolve, the strategic employment of these tools, in conjunction with automation technologies like RPA, positions organizations to not only elevate their data management capabilities but also to inspire innovation and drive growth. In an era where data is increasingly vital, embracing the synergy between Power BI and Databricks is not merely advantageous—it’s imperative for sustaining a competitive edge.
Overview
This article aims to provide a comprehensive understanding of the DAX DISTINCTCOUNT function and its applications within Power BI for data analysis. Mastering DISTINCTCOUNT is essential for professionals, as it empowers them to extract meaningful insights from data. Through practical applications and performance considerations, the article highlights the function’s significance in enhancing operational efficiency and driving informed decision-making within organizations.
Introduction
In the rapidly evolving realm of data analytics, mastering the intricacies of DAX (Data Analysis Expressions) functions is essential for professionals eager to unlock the full potential of Power BI. Among these functions, DISTINCTCOUNT emerges as a pivotal tool for analyzing unique values and deriving actionable insights from complex datasets. As organizations increasingly lean on data-driven decision-making, understanding how to effectively implement and optimize DISTINCTCOUNT can significantly enhance operational efficiency and inform strategic initiatives.
This article explores the foundational aspects of DAX functions, practical applications of DISTINCTCOUNT, and performance considerations, equipping analysts with the knowledge to navigate the challenges of data analysis in today’s competitive landscape.
Understanding the Basics of DAX Functions
DAX (Data Analysis Expressions) serves as a powerful formula language within Power BI, empowering users to execute complex calculations and develop custom measures crucial for effective analysis. A robust understanding of essential DAX operations is imperative for professionals aiming to leverage insights efficiently, especially when tackling challenges in report generation and data inconsistencies. Furthermore, the integration of Robotic Process Automation (RPA) can significantly boost operational efficiency by automating repetitive tasks, enabling analysts to concentrate on deriving insights rather than preparation.
- COUNTROWS: This function plays a vital role in counting the total number of rows within a table or table expression. It offers a direct method to evaluate the overall volume of entries in a dataset, which is essential for grasping data scope and completeness, thus facilitating informed decision-making.
- UNIQUE COUNT: Conversely, UNIQUE COUNT assesses the distinct values present in a specified column, disregarding duplicates. This capability is particularly useful for analyzing entries using DAX’s DISTINCTCOUNT, such as the total number of unique customers or products sold, thereby providing insights into market reach and customer diversity, ultimately enhancing operational efficiency.
To illustrate the application of these functions, consider the following DAX formulas:
TotalRows = COUNTROWS(Sales)
UniqueCustomers = DISTINCTCOUNT(Sales[CustomerID])
Mastering these fundamental functions establishes a foundation for addressing more advanced DAX calculations, which are increasingly vital in the evolving landscape of data analysis in 2025. As organizations continue to harness the power of information and Business Intelligence, understanding DAX expressions becomes a defining factor for experts in the field. Notably, SQLBI has announced that new content and tools will be available in the first half of 2025, further enriching the resources for mastering DAX.
The significance of DAX operations is underscored by the challenges many face when learning them. Recent reflections on the complexities of DAX reveal that, although the learning curve may be steep, those who dedicate the necessary time and effort can distinguish themselves in the analytics domain. This is evidenced by the relatively low engagement with advanced DAX learning resources, indicating a niche opportunity for skilled professionals.
Additionally, SQLBI’s YouTube channel has surpassed 110,000 subscribers, highlighting the increasing interest in DAX learning resources.
In conclusion, as the demand for data-driven decision-making escalates, the importance of DAX tools like COUNTROWS and DAX DISTINCTCOUNT cannot be overstated. These foundational tools empower analysts to extract meaningful insights from data, driving growth and innovation within their organizations. As Michael Mays, Power BI Lead at NielsenIQ, remarked, “Is there an article regarding the UDF announcement or was it made at a conference?”
This statement emphasizes the ongoing significance and evolution of DAX capabilities in the current landscape. Moreover, organizations that struggle to extract actionable insights may find themselves at a competitive disadvantage, highlighting the critical necessity of mastering these tools.
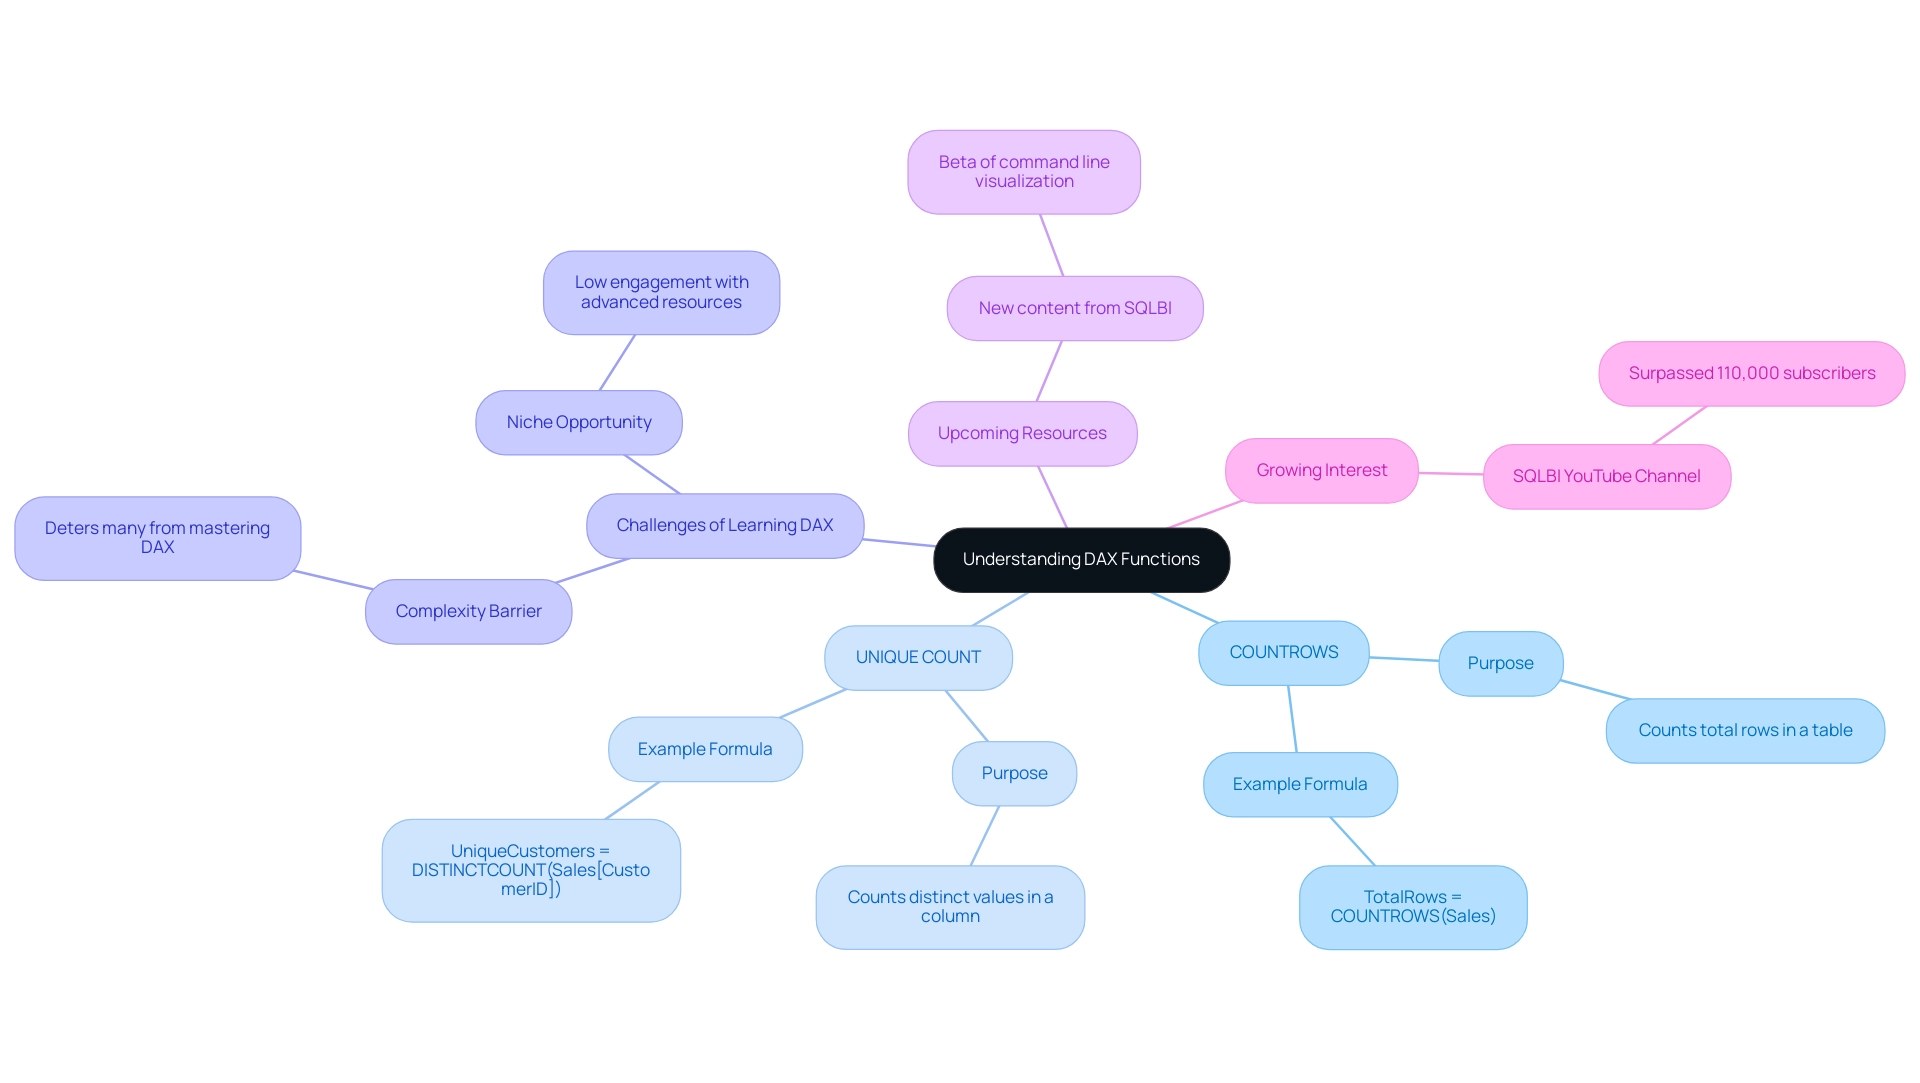
Syntax Breakdown of DISTINCTCOUNT in DAX
The syntax for the DISTINCTCOUNT function is designed for simplicity and effectiveness:
DISTINCTCOUNT(<column>)
In this syntax, <column> refers to the specific column from which you wish to count distinct values. It is essential that this parameter is a single column sourced from a table within your information model.
For instance, to count the distinct product IDs in a sales table, you would implement the following formula:
DistinctProducts = DISTINCTCOUNT(Sales[ProductID])
This formula effectively returns the number of unique product IDs present in the Sales table, enabling a thorough analysis of product diversity.
Grasping the subtleties of the unique count operation is essential for analysts, especially within the realm of Power BI. In 2025, the importance of this capability has been emphasized by numerous data professionals who acknowledge its role in improving data quality and accuracy, crucial for facilitating informed decision-making in today’s competitive environment. Consider a case study involving the groupBy() method in LogScale; it illustrated how obtaining a list of status codes, like 200 for successful requests and 404 for not found errors, can be optimized using a unique count.
This capability not only assists in monitoring web application performance but also emphasizes its versatility in various analytical scenarios.
Moreover, the COUNT operation is particularly useful when handling null values, as it considers them in distinct situations but not in unique totals. This distinction is vital for accurate data representation and analysis, ensuring that insights drawn from data models are both reliable and actionable.
As organizations increasingly depend on data-driven decision-making, mastering the DAX DISTINCTCOUNT calculation becomes a crucial skill for professionals seeking to utilize Power BI effectively. However, users have reported difficulties with the counting feature. One user noted, “Tried but it doesn’t work. The results are not showing anything. Seems the distinct_count works but when I apply the ‘where’ it doesn’t display the filtered results.” This feedback emphasizes the significance of comprehending the limitations and nuances of this role.
Furthermore, for those looking to enhance their Power BI skills, a $150 discount is available using code MSCUST, which could be beneficial for training resources or tools related to Power BI.
Ultimately, the unique count operation not only contributes to information quality but also aligns with the organization’s mission to simplify AI implementation and enhance insight-driven understanding, driving growth and innovation in today’s information-rich environment. Incorporating RPA solutions such as EMMA RPA and Power Automate can optimize information processes, augmenting the application of unique count in improving operational efficiency. As companies encounter obstacles in utilizing insights from their Power BI dashboards—such as time-consuming report creation and inconsistencies—mastering these tools enables Directors of Operations Efficiency to make informed decisions quickly and effectively, turning raw information into actionable insights.
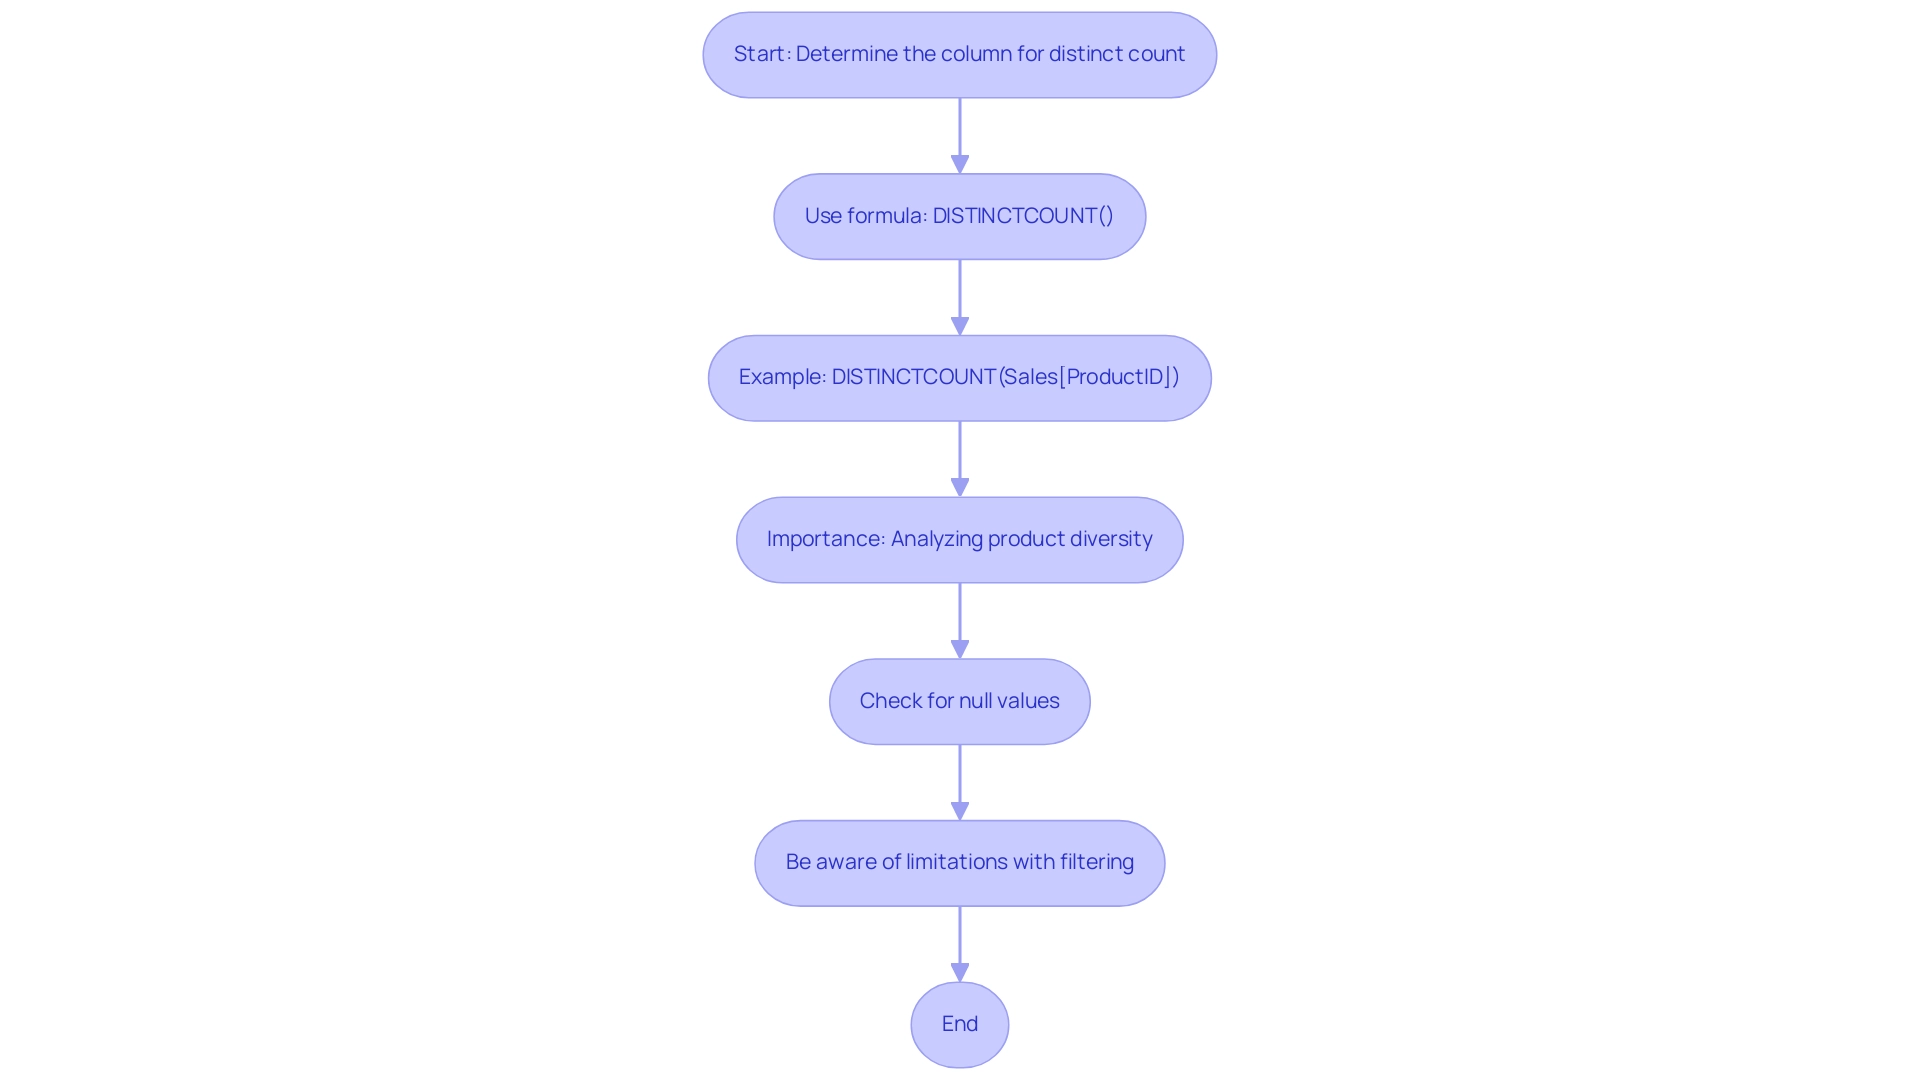
Practical Applications of DISTINCTCOUNT in Power BI
The COUNT function in Power BI is a powerful tool that enables organizations to derive meaningful insights from their data, particularly in the realms of operational efficiency and data-driven decision-making. Here are some practical applications:
-
Customer Analysis: To determine the number of unique customers who made purchases within a specified timeframe, the following DAX formula can be utilized:
UniqueCustomers = DISTINCTCOUNT(Sales[CustomerID])This application is crucial for understanding customer engagement and retention, allowing businesses to tailor their marketing strategies effectively.
-
Product Diversity: Analyzing the diversity of products sold can be achieved with:
UniqueProducts = DISTINCTCOUNT(Sales[ProductID])This insight helps organizations assess their product range and identify opportunities for expansion or optimization based on customer preferences.
-
Event Participation: To count the number of unique participants at an event, the following DAX expression is effective:
UniqueParticipants = DISTINCTCOUNT(Event[ParticipantID])Understanding event engagement is vital for evaluating the success of marketing initiatives and planning future events.
These examples illustrate how a unique count can illuminate customer behavior, product offerings, and event engagement, ultimately driving growth and innovation. As we approach 2025, the relevance of utilizing unique counts for customer analysis has surged, with statistics indicating that businesses employing this function can significantly enhance their decision-making processes. Organizations striving to overcome challenges like time-consuming report creation and inconsistencies may find that integrating RPA solutions can streamline these processes by automating data collection and report generation.
For instance, a recent case study titled “DAX Optimization for Order Counting” involved a client who sought to optimize order counting within a dataset of 63 million rows. The initial application of COUNT() faced performance challenges; however, exploring alternative methods led to more efficient information handling. As Rita Fainshtein, a Microsoft MVP, aptly noted, “Again how do you want area 2 to be 1, if there are 2 companies in this area? A and B.” This highlights the complexities of information analysis and the significance of comprehending unique values in datasets. Such real-world applications underscore the necessity of mastering DAX functions like DISTINCTCOUNT to fully unlock the potential of Power BI in enhancing operational efficiency and driving business growth.
To learn more about how RPA solutions can enhance your analysis efforts, consider booking a free consultation.
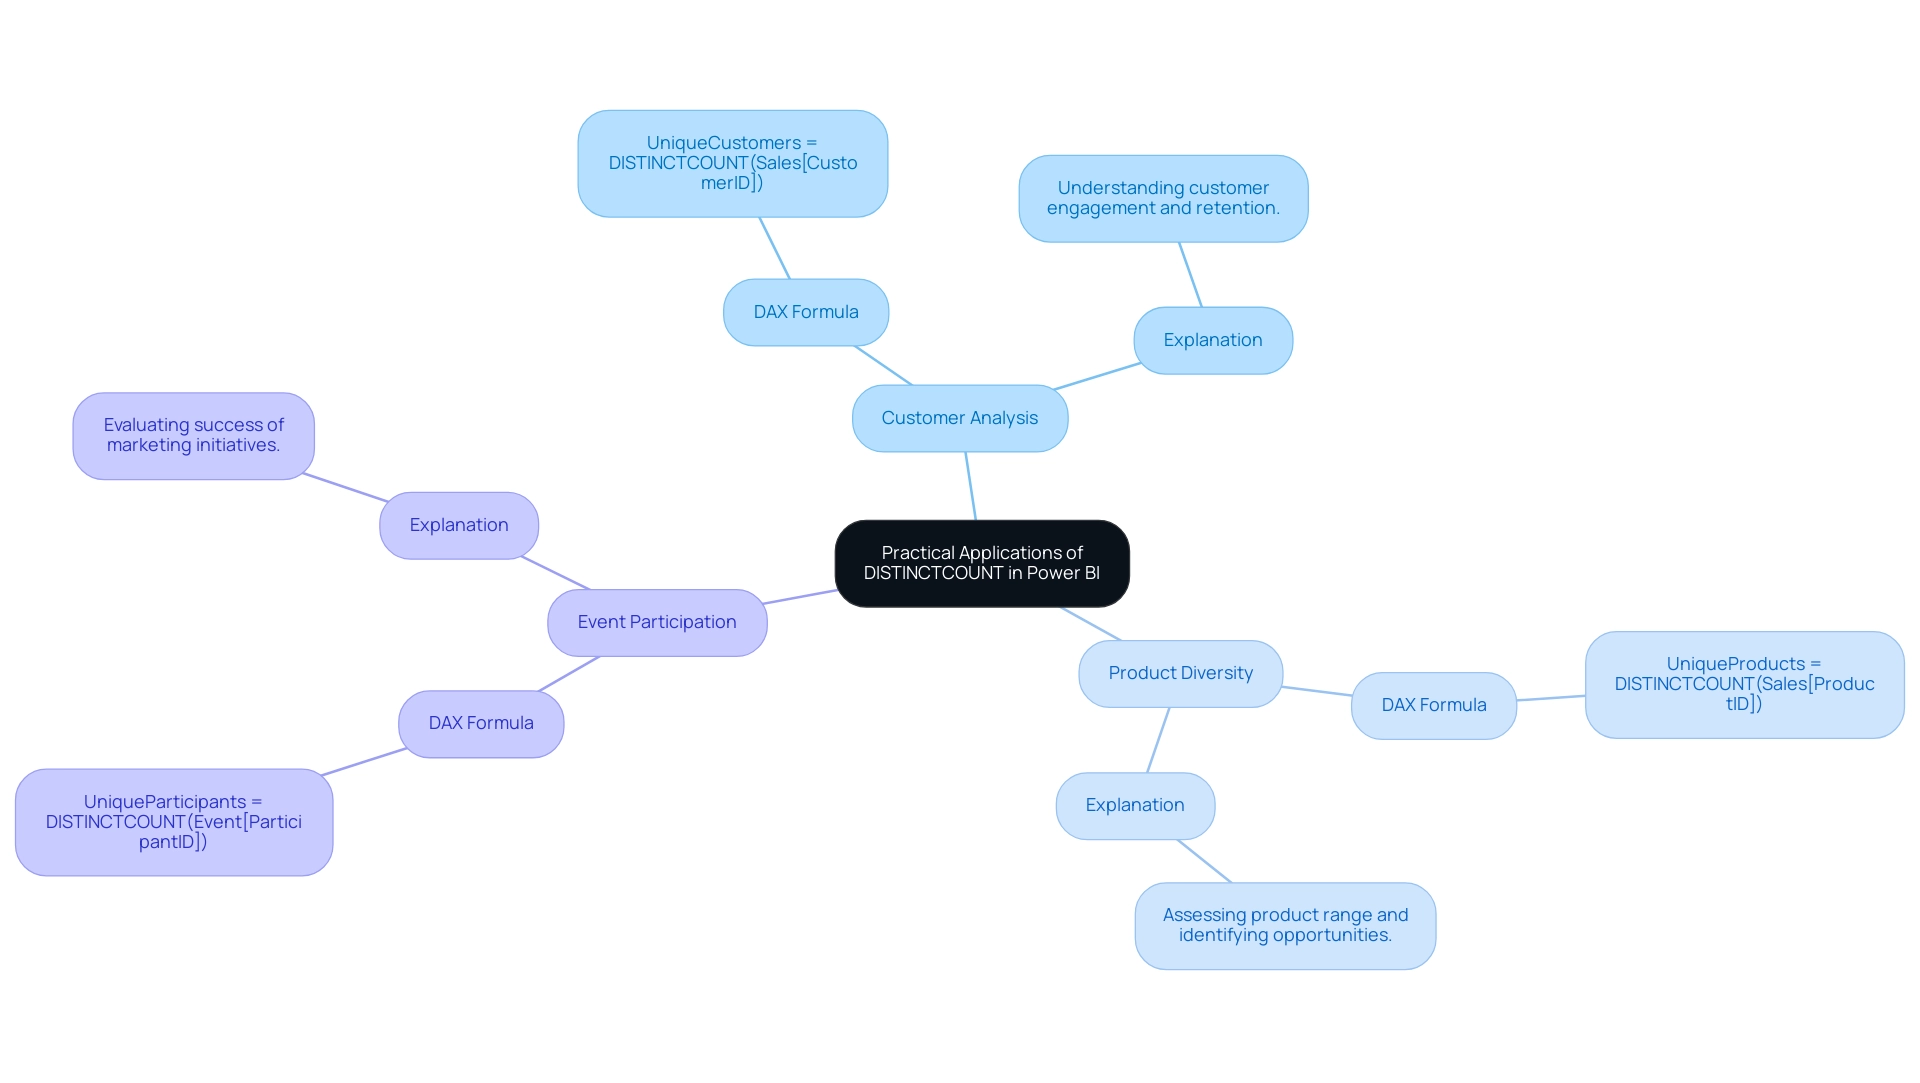
Applying Filters to Enhance DISTINCTCOUNT Functionality
Using filters with UNIQUECOUNT is an effective method that can greatly enhance your analysis capabilities, particularly in the realm of utilizing Business Intelligence for actionable insights. In an overwhelming AI landscape, where identifying the right solutions can be daunting, our tailored AI solutions can help you navigate these complexities. By employing the CALCULATE operation, you can effectively adjust the filter context to concentrate on particular subsets that align with your business objectives.
For instance, consider the following DAX formula:
unique active customers = CALCULATE(DISTINCTCOUNT(Sales[CustomerID]), Sales[Status] = "Active")
In this example, the DISTINCTCOUNT function counts only the unique customers whose status is ‘Active’. This targeted approach allows for more relevant insights, enabling analysts to concentrate on key segments of their data, thereby supporting informed decision-making crucial for operational efficiency.
Furthermore, applying multiple filters enhances the depth of your analysis:
UniqueSalesIn2025 = CALCULATE(DISTINCTCOUNT(Sales[CustomerID]), Sales[Year] = 2025, Sales[Region] = "North")
This formula counts the unique customers from the North region who made purchases in 2025, illustrating how filters can refine your analysis to yield actionable insights. Notably, if a user selects a third date in the slicer, the measure would dynamically update to include that day’s count, showcasing the flexibility of DAX in uncovering trends.
Data professionals emphasize that using filters with DAX DISTINCTCOUNT not only improves the precision of your results but also enhances overall performance. As Zach Bobbitt, the creator of Statology, states, “My goal with this site is to help you learn statistics through using simple terms, plenty of real-world examples, and helpful illustrations.” This perspective resonates in 2025, as businesses increasingly seek to extract meaningful insights from their data-rich environments.
Case studies show that organizations applying these techniques have effectively converted raw information into actionable insights, driving growth and innovation. For instance, the case study titled ‘Business Intelligence for Insights’ demonstrates how the organization assisted companies in improving quality while streamlining AI implementation, ultimately resulting in informed decision-making. Moreover, our Small Language Models and GenAI Workshops are designed to further enhance analytical capabilities, equipping professionals with the skills to leverage AI effectively.
With Power BI services, such as the 3-Day Sprint for report creation, professionals can quickly generate comprehensive reports that offer clear and actionable guidance. Remember, Excel Pivot Tables can refresh automatically when the source information is modified, and you can also manually refresh the Pivot Table by clicking on the Refresh button in the Analyze tab. This feature enhances the use of DAX functions, making them even more pertinent for analysis.
By mastering the use of filters with DAX DISTINCTCOUNT, you can unlock the full potential of your analysis efforts, driving operational efficiency and leveraging AI for industry-specific solutions.
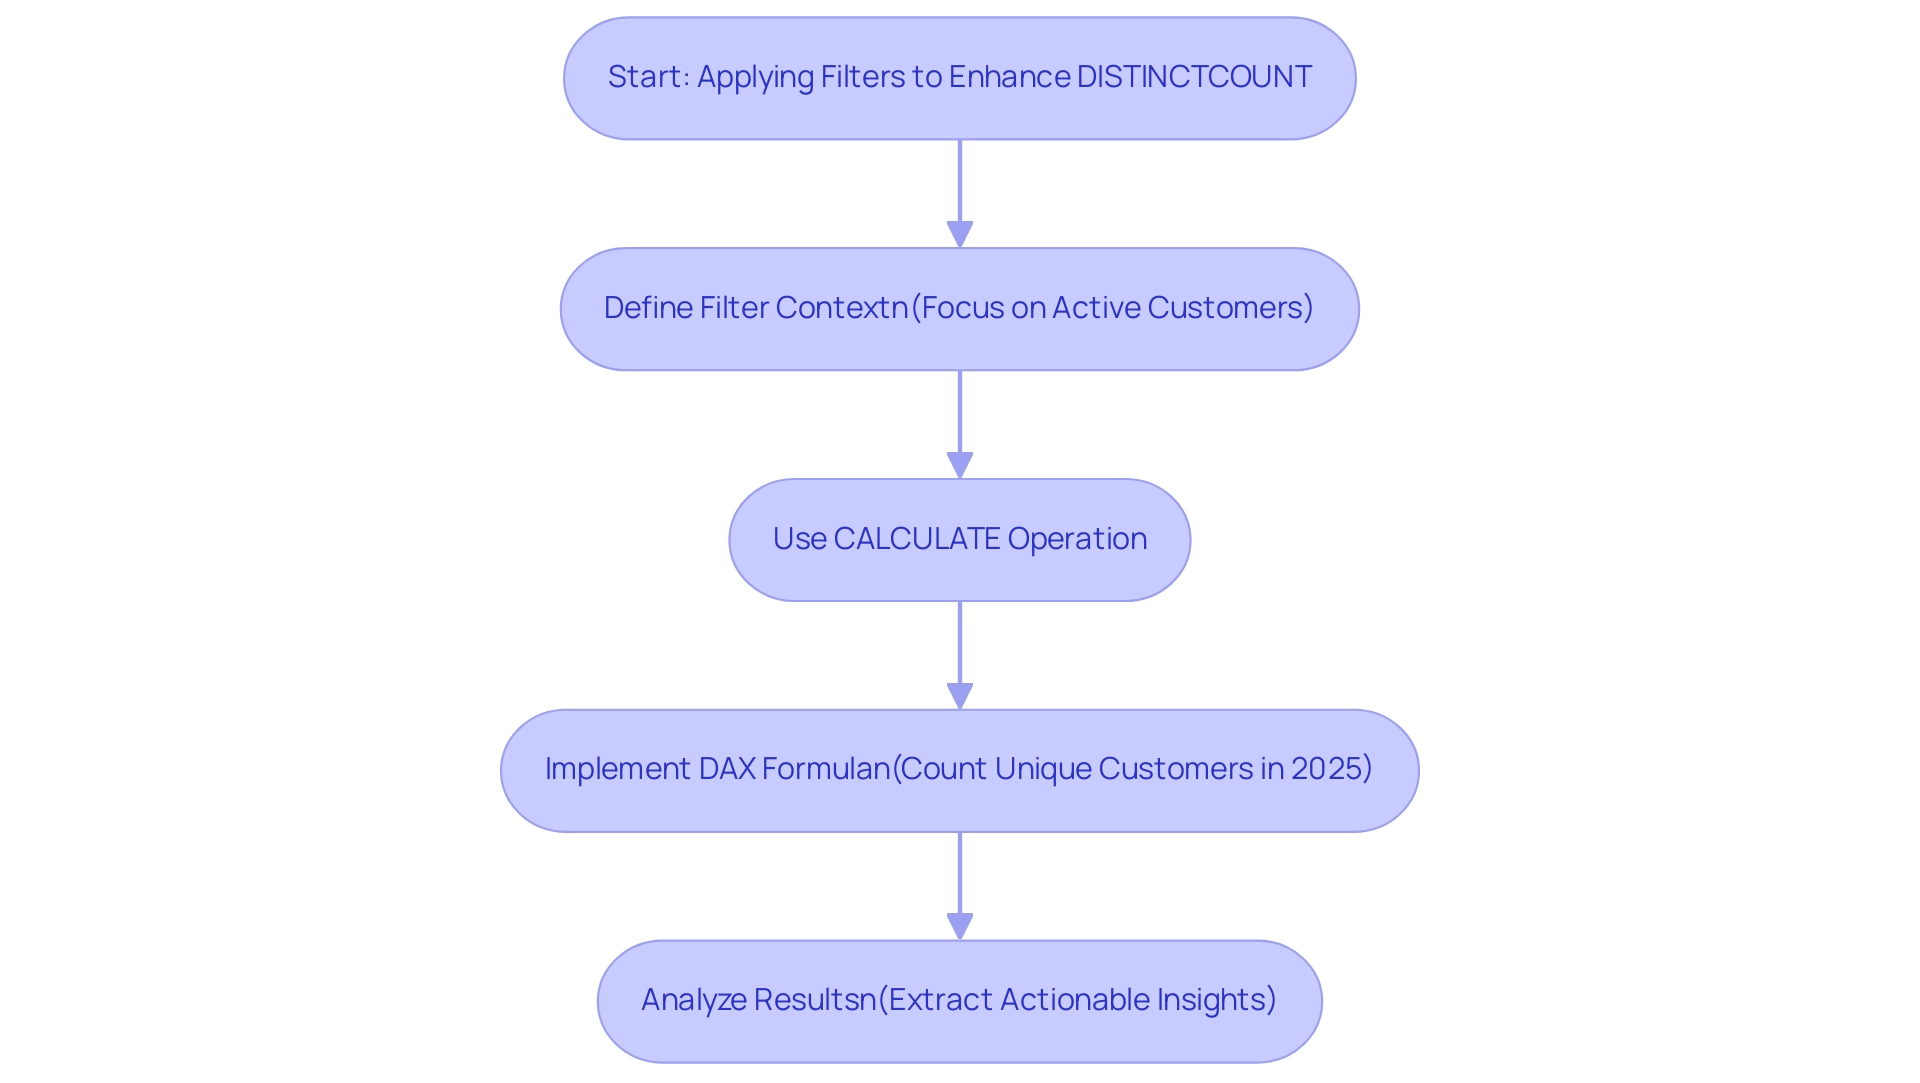
Performance Considerations for Using DISTINCTCOUNT
In the realm of Power BI, especially when managing extensive datasets, optimizing performance is paramount for operational efficiency amid the expansive AI landscape. Tailored solutions are essential for navigating this complexity. Here are several strategies to enhance efficiency:
-
Utilize Aggregated Tables: Rather than performing a unique count on detailed tables, create aggregated tables that summarize information at a higher level. This approach reduces the volume of data processed, leading to quicker calculations and more actionable insights.
-
Limit Data Scope: Implement filters to narrow down the dataset before executing a unique count. This practice can dramatically enhance performance by minimizing the data evaluated, facilitating quicker decision-making.
-
Monitor Performance: Utilize tools like DAX Studio to analyze query performance and identify bottlenecks in your calculations. Regular performance monitoring can uncover areas for improvement, ensuring your reports remain efficient.
-
Explore Alternatives: In certain scenarios, employing COUNTROWS on a summarized table may yield better performance than a unique count. Evaluating various methods can lead to more efficient outcomes, aligning with the objective of maximizing operational efficiency.
-
Understand the Impact of Large Datasets: As datasets grow, the efficiency of unique count operations can diminish. For example, a recent analysis indicated that a query on a slim model required 11 seconds of CPU time, while the same query on a fat model took only 6.5 seconds, underscoring the importance of effective dataset management in a data-rich environment.
-
Leverage Role-Playing Dimensions: Role-playing dimensions can filter multiple columns or tables of data, allowing the same dimension to be utilized in various contexts. This flexibility can enhance the efficiency of calculations involving DAX DISTINCTCOUNT, yielding better insights from your BI tools.
-
Handle Division by Zero: When managing unique counts, consider using the DIVIDE function in DAX to effectively address division by zero cases, especially when employing DAX DISTINCTCOUNT, ensuring robust calculations.
Moreover, integrating RPA can further streamline processes and enhance data handling efficiency. By automating repetitive tasks, RPA can bolster strategies for optimizing unique counts, enabling teams to concentrate on more strategic initiatives.
By adopting these best practices, you can significantly improve the performance of your reports, ensuring they function efficiently even when tackling complex calculations. Furthermore, case studies have demonstrated that introducing variables in DAX can enhance both performance and readability, making your code more maintainable. As CC Chen aptly states, “Distraction-free reading. No ads. Organize your knowledge with lists and highlights.” By refining your approach to unique counting and leveraging the power of Business Intelligence and RPA, you can achieve superior performance outcomes in your Power BI projects.
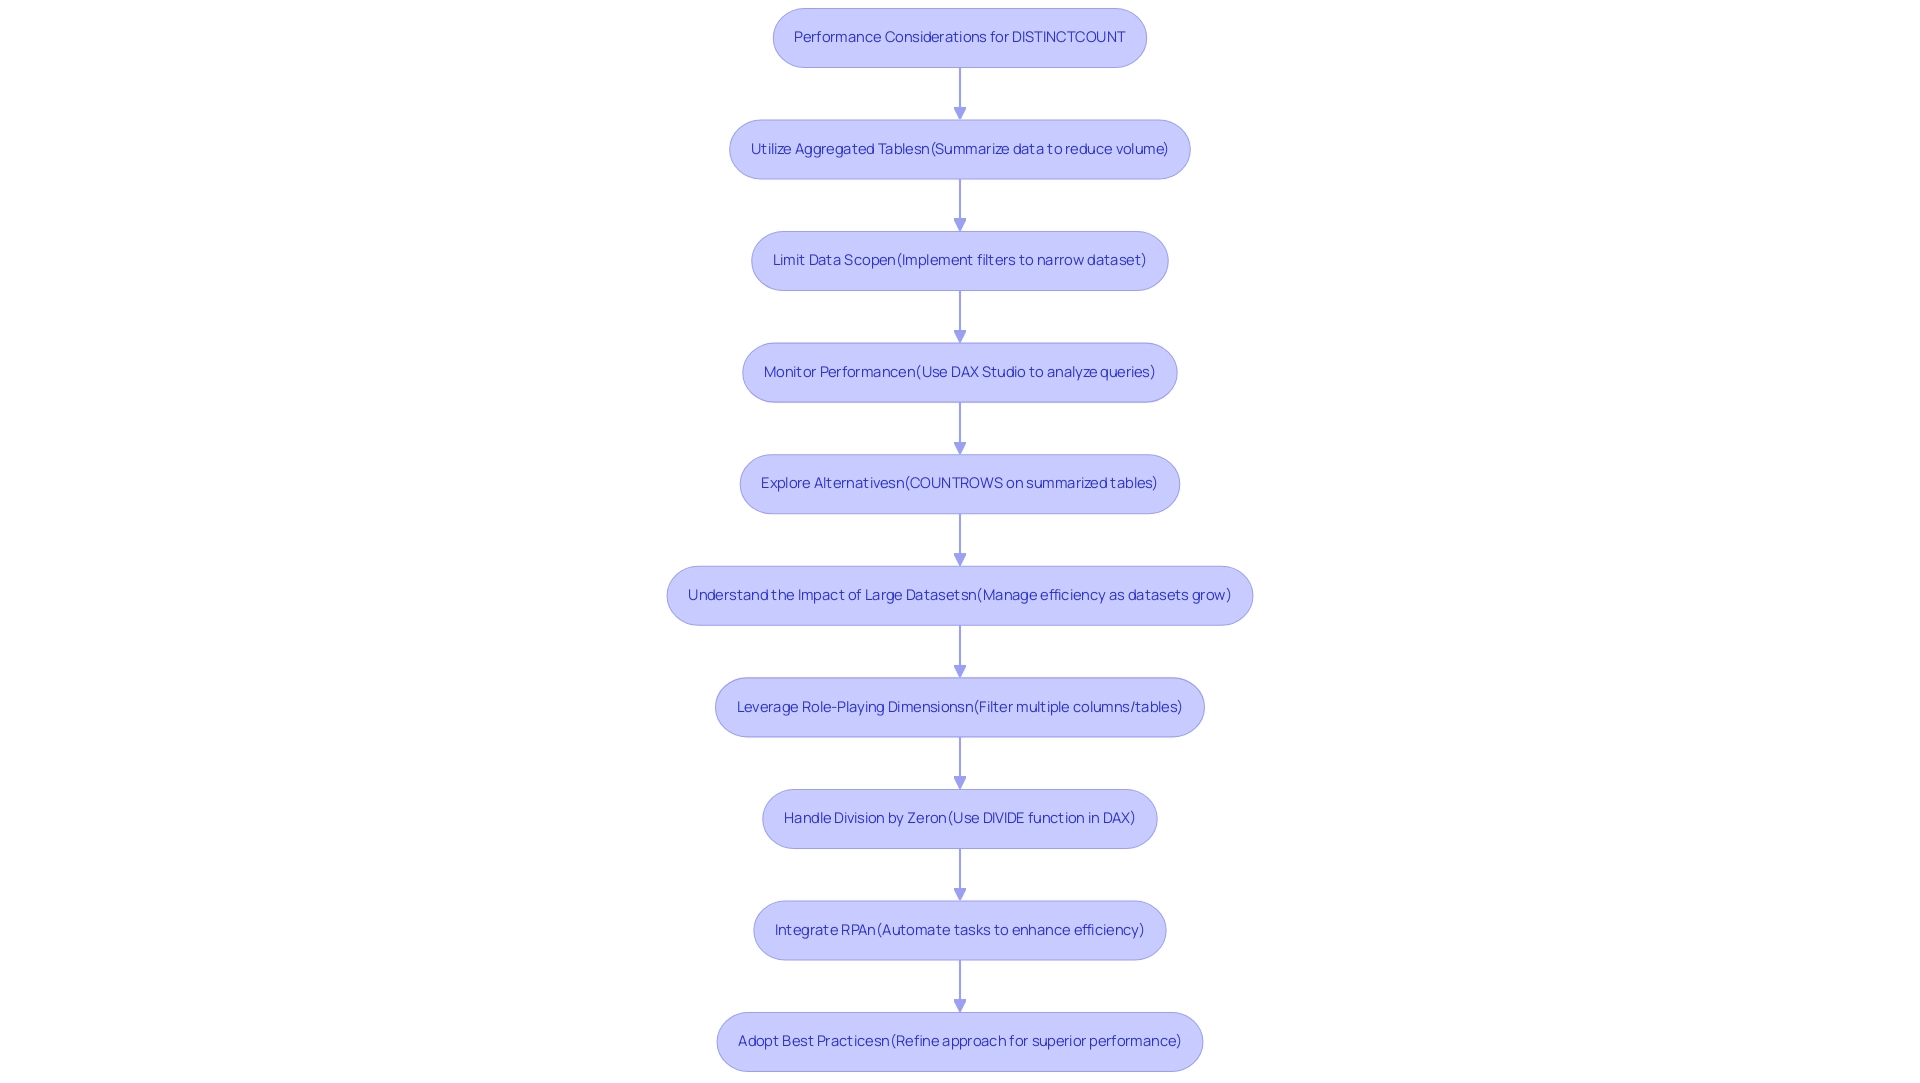
Understanding the Difference Between COUNT and DISTINCTCOUNT
In DAX, both COUNT and UNIQUECOUNT serve as essential tools for tallying values, yet they fulfill distinct roles in analysis. This distinction is crucial in today’s information-driven landscape, influenced by Business Intelligence and RPA solutions like EMMA RPA and Power Automate.
- COUNT: This tool tallies all non-blank entries in a column, including duplicates. For instance, with a column containing the values [1, 1, 2, 3], the COUNT operation yields a total of 4, representing every occurrence of each value.
- UNIQUECOUNT: Conversely, UNIQUECOUNT focuses solely on distinct values, disregarding any repetitions. In the same example, the unique count would return 3, as it counts only the distinct entries.
Recognizing when to apply each method is vital for accurate information interpretation, especially as businesses strive to leverage insights effectively amid challenges like time-consuming report creation and inconsistencies. COUNT is ideal for scenarios where the total number of entries is required, while COUNT of unique values is preferable for analyzing unique entries.
A practical case study illustrates this difference: a user encountered a DAX DISTINCTCOUNT issue in Power BI, where inherited DAX code counted distinct applicants for the previous year but failed to accurately reflect distinct totals. The existing implementation used DAX DISTINCTCOUNT to count distinct applicants within groups but summed all values additively, leading to incorrect total distinct counts. The user sought a solution to adjust the DAX measure to achieve a non-additive unique count for the total using DAX DISTINCTCOUNT, aligning with the unique counts within groups.
As we look ahead to 2025, grasping the differences between COUNT and UNIQUECOUNT is more critical than ever. Information professionals increasingly rely on these functions to derive insights from complex datasets. Usage statistics indicate that COUNT remains widely used, but the DAX DISTINCTCOUNT function is gaining traction as analysts refine their analysis techniques. Furthermore, certification as a Microsoft Certified: Power BI Data Analyst Associate emphasizes best practices for modeling, visualizing, and analyzing information, which is essential for mastering these functions.
Additionally, the filter by value feature enhances user interaction with information, allowing users to select bars and display available transformations for that value—significantly improving the analysis process. As Richie Cotton, a recognized information specialist, highlights, the selection between these roles can greatly influence the clarity and precision of narratives. Thus, mastering their application is essential for effective data-driven decision-making.
Notably, wrapping up analysis lasts approximately 47 seconds, underscoring the efficiency achievable with proper use of these DAX functions. This further emphasizes the importance of leveraging BI tools like EMMA RPA and Power Automate for operational success. For more insights on how to enhance your data analysis capabilities, consider booking a consultation with Creatum GmbH.
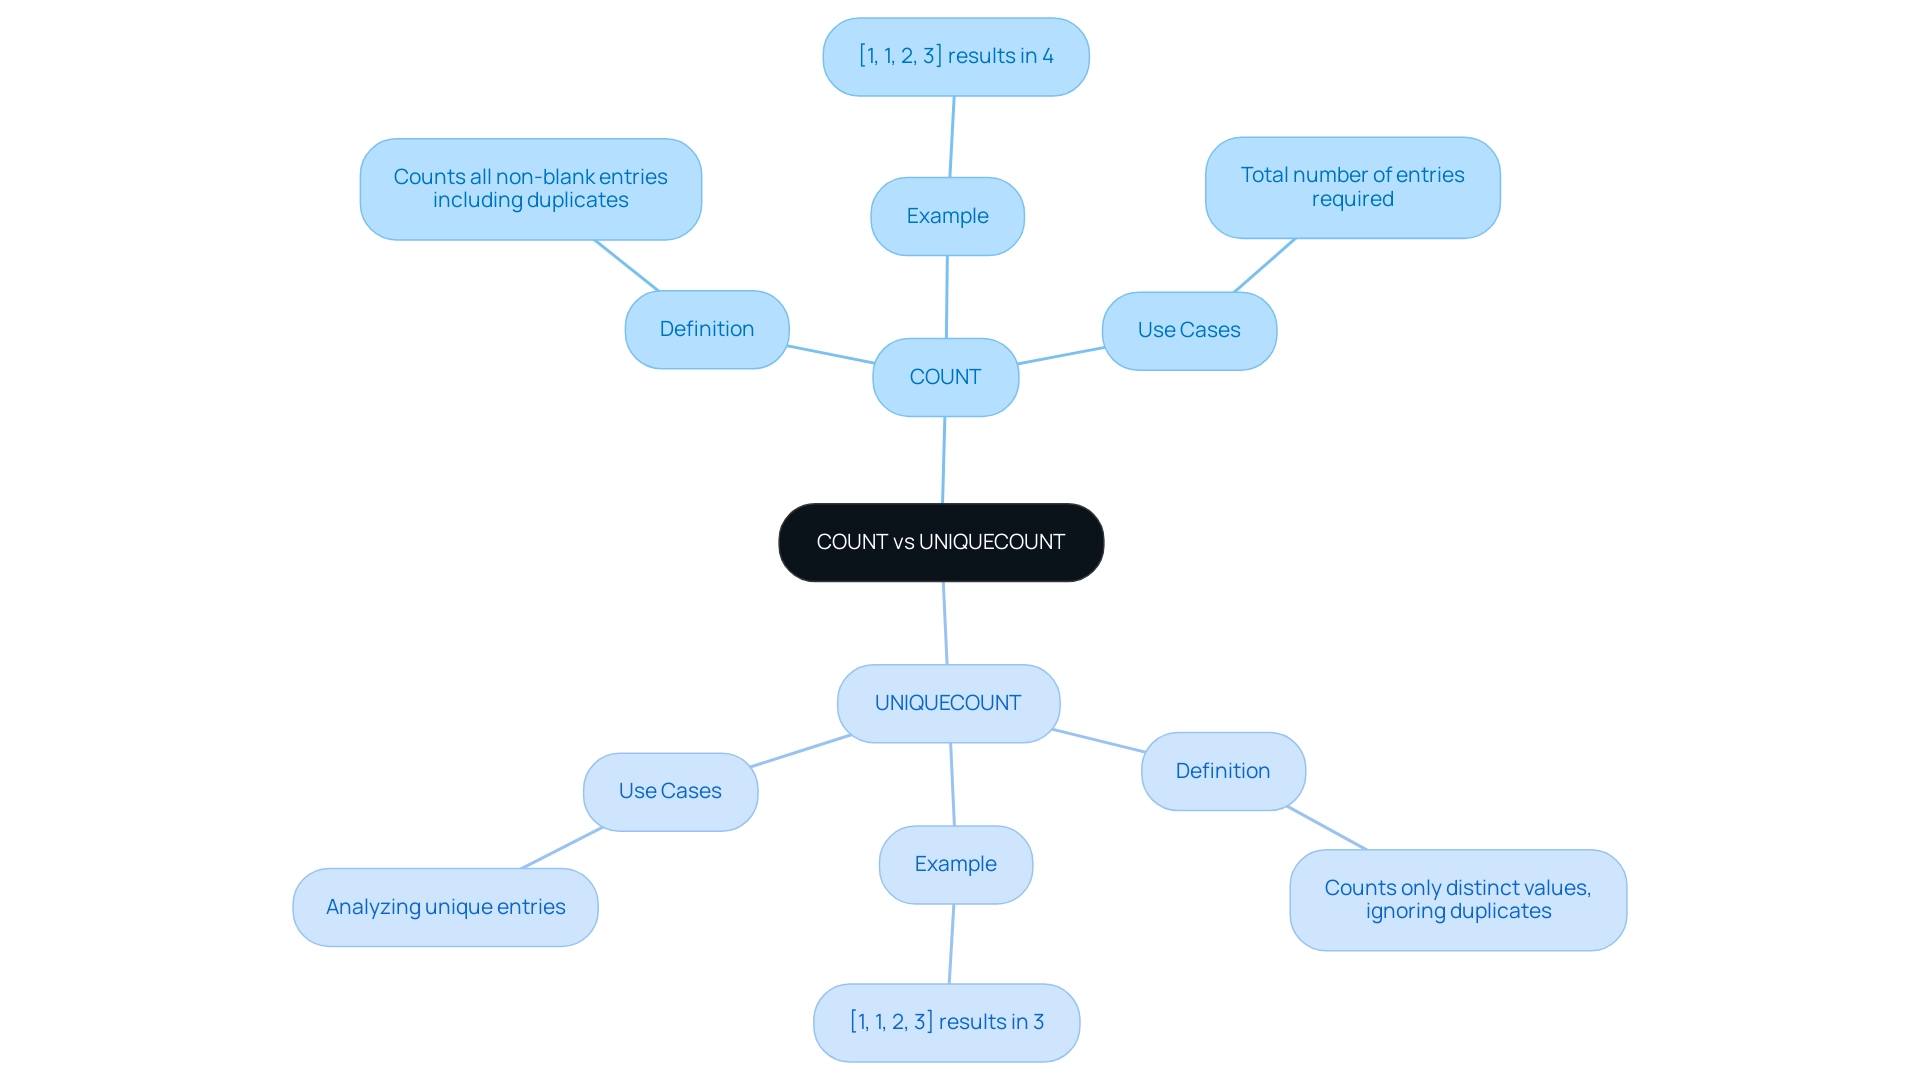
Conclusion
Mastering the DISTINCTCOUNT function within DAX is essential for data analysts seeking to extract actionable insights from Power BI. This article has explored the foundational aspects of DAX functions, emphasizing the pivotal role of DISTINCTCOUNT in analyzing unique values and enhancing operational efficiency. Practical applications, such as customer analysis and product diversity, demonstrate how this function can illuminate key business metrics, empowering organizations to make informed decisions.
Furthermore, understanding performance considerations and best practices for utilizing DISTINCTCOUNT is crucial for optimizing data processing, especially with extensive datasets. By implementing strategies like using aggregated tables and applying targeted filters, organizations can significantly enhance the efficiency of their data analysis efforts.
As businesses navigate an increasingly data-driven landscape, the ability to leverage DISTINCTCOUNT effectively will distinguish skilled professionals in the field. This mastery not only enhances data quality but also supports organizations in achieving their strategic goals through informed decision-making. Embracing these DAX functions transcends technical proficiency; it empowers teams to drive innovation and operational excellence in a competitive environment.
Overview
This article delves into the DAX COUNTAX function, underscoring its critical role for Power BI users in counting non-blank results derived from expressions across tables. By illuminating COUNTAX’s capabilities, it enhances the accuracy of data analysis. Practical examples illustrate its application, while best practices are highlighted to boost operational efficiency and decision-making within business intelligence contexts.
Why is COUNTAX essential? It empowers users to derive meaningful insights from their data, ensuring that every non-blank result is accounted for. This function not only streamlines analysis but also fosters informed decision-making in a competitive landscape.
With COUNTAX, professionals can transform their approach to data analysis, leading to improved outcomes and strategic advantages. Embrace these insights to elevate your business intelligence practices and drive success.
Introduction
In the realm of data analysis, the COUNTAX function in DAX stands out as a powerful tool for organizations aiming to make sense of their information. As businesses increasingly depend on data-driven insights to guide decision-making, mastering the effective utilization of COUNTAX becomes essential. This function not only counts non-blank results but also evaluates expressions across specified tables. This capability enables analysts to derive meaningful insights that enhance operational efficiency.
In today’s data-rich environment, where the integration of Business Intelligence (BI) and Robotic Process Automation (RPA) is transforming data management approaches, COUNTAX proves particularly valuable. By exploring its features, practical applications, and best practices, organizations can uncover how mastering COUNTAX can elevate reporting capabilities. Ultimately, this mastery leads to more informed business strategies, driving success in a competitive landscape.
Introduction to the COUNTAX Function in DAX
The operation in DAX, specifically the DAX COUNTAX, serves as an essential tool for tallying non-blank outcomes derived from evaluating an expression across a specified table. This capability proves particularly advantageous in scenarios that require conditional counting based on specific calculations or criteria, especially within today’s data-rich environment where the significance of Business Intelligence (BI) and Robotic Process Automation (RPA) is paramount. By iterating through each row of the table and applying the defined expression, the calculation counts only those results that are not blank, thereby enhancing the accuracy and relevance of analysis in Power BI.
Key Features of the Calculation:
- Counts non-blank results, ensuring that only meaningful information contributes to analysis, which is crucial for driving actionable insights.
- Evaluates expressions for each row in a table, allowing for complex calculations tailored to specific needs, addressing challenges such as time-consuming report creation and information inconsistencies.
- Ideal for conditional counting, making it suitable for diverse analytical scenarios.
- Integrates seamlessly with RPA solutions, enabling automated processing that enhances operational efficiency.
Example Usage:
COUNTAX(Sales, Sales[Amount])
In this example, the calculation counts all non-blank sales amounts in the Sales table, offering a clear picture of sales performance.
The importance of the DAX COUNTAX calculation cannot be overstated, particularly in 2025, as organizations increasingly depend on insight-driven approaches to maintain competitiveness. Recent statistics indicate that a notable percentage of Power BI users utilize DAX expressions, with a preference for its effectiveness in managing complex scenarios. Connections in Power BI can be one-to-one, one-to-many, or many-to-many, and understanding these connections is essential for effectively employing specific DAX functions in various analytical contexts.
Real-world applications of the DAX COUNTAX function have demonstrated its effectiveness in transforming raw information into actionable insights. This is highlighted in the case study titled ‘Business Intelligence Empowerment,’ where organizations overcame information overload to make informed decisions. Experts emphasize that mastering this tool can lead to significant advancements in information analysis skills, enabling teams to focus on strategic initiatives rather than becoming overwhelmed by manual information processing.
As Power BI evolves, staying informed about the latest enhancements to the tool will be vital for optimizing its effectiveness in information analysis. Additionally, users must recognize that the 32-bit version of Power BI Desktop will cease to receive support after 6/30/2025, underscoring the importance of mastering DAX expressions in the dynamic landscape of Power BI. Furthermore, addressing errors with operations involving multiple parameters can yield valuable insights for individuals facing similar challenges while utilizing this function in their evaluations.
Call to Action: Discover how integrating this tool with RPA solutions can optimize your analytical processes and enhance your operational efficiency today.
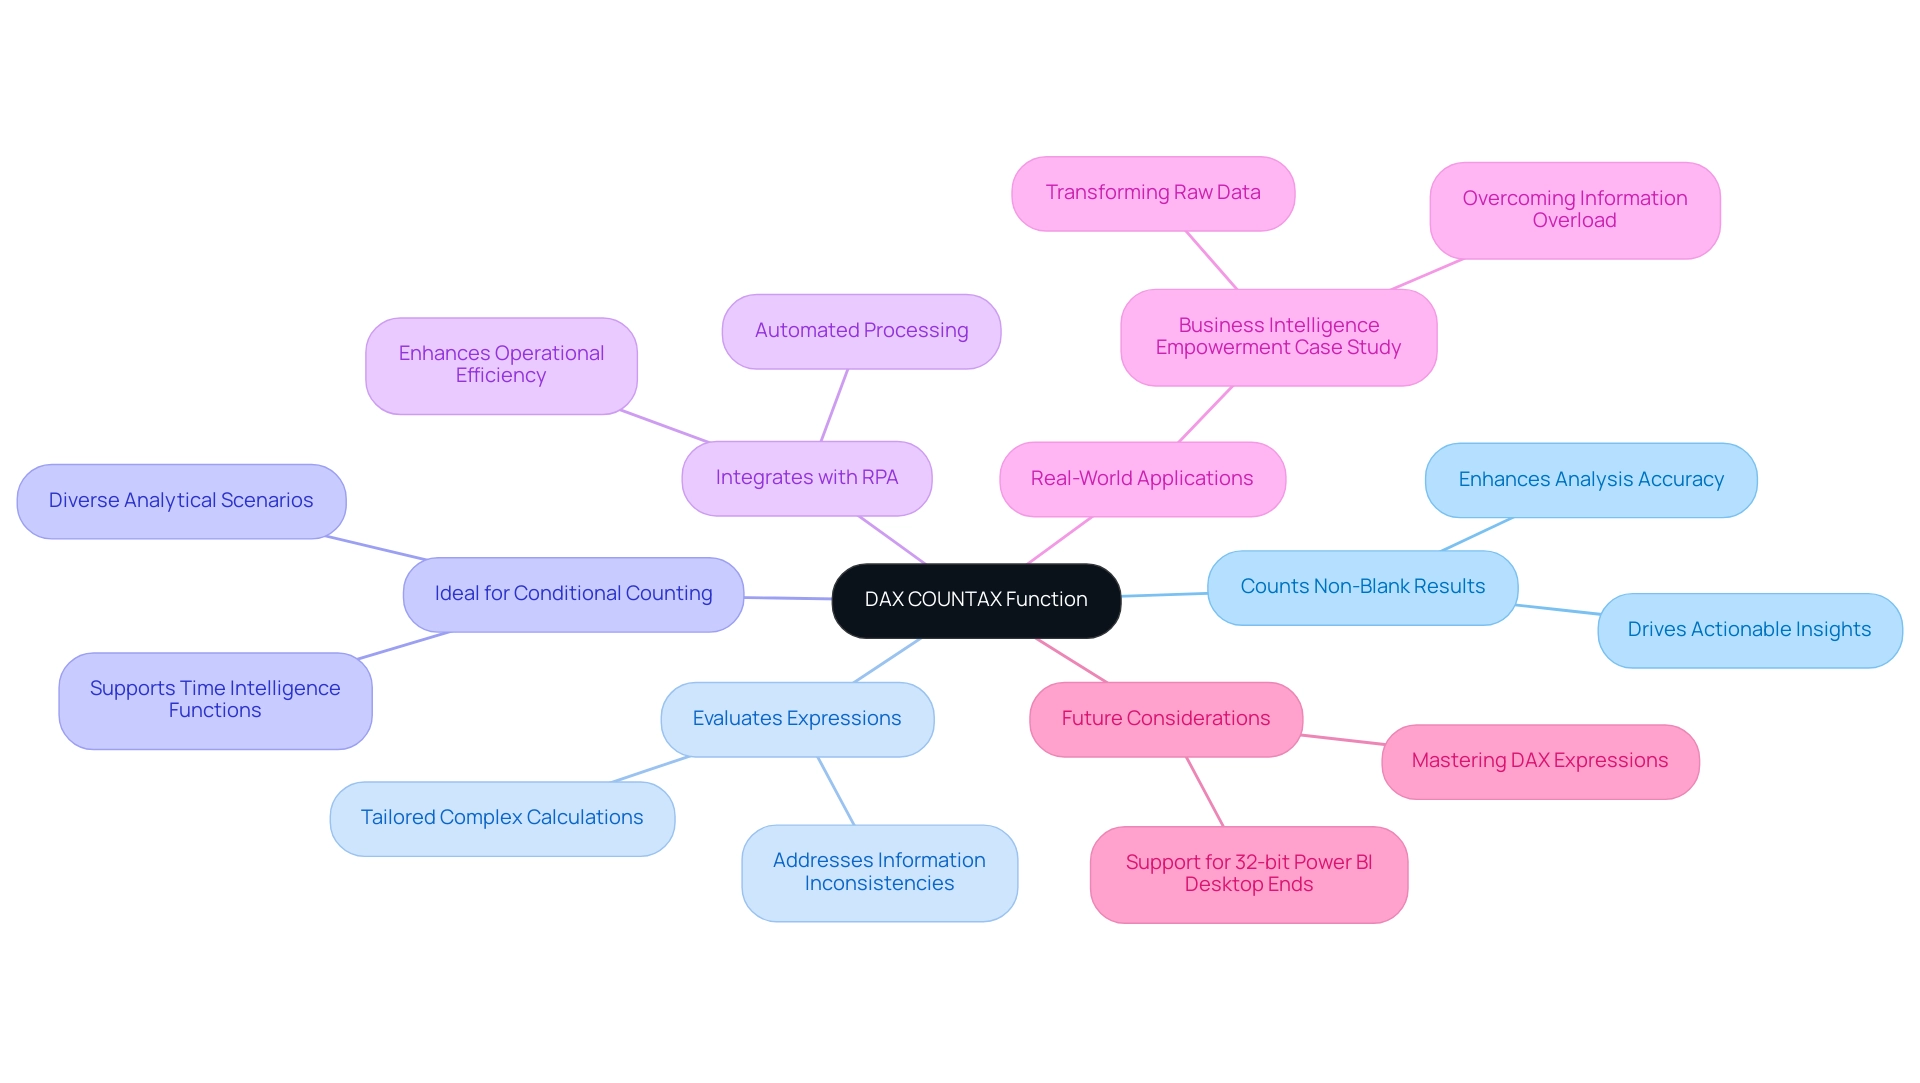
Understanding the Syntax of COUNTAX
The syntax for the COUNTAX function in DAX is structured as follows:
COUNTAX(<Table>, <Expression>)
: This parameter specifies the table containing the data you wish to evaluate.
: This represents the expression evaluated for each row within the specified table. It can be a direct column reference or a more intricate calculation. Example Usage:
COUNTAX(Products, Products[Price] * Products[Quantity])In this example, the COUNTAX function counts the non-blank results derived from multiplying the Price and Quantity for each entry in the Products table. This functionality is particularly valuable in business intelligence, as it empowers analysts to derive meaningful insights from data by focusing on specific calculations that reflect business performance.
As of 2025, grasping the subtleties of certain calculations is vital for Power BI users, especially in light of the evolving landscape of DAX expressions. With the increasing integration of BI solutions and RPA, organizations face challenges such as time-consuming report creation and inconsistencies in information. This tool can assist in optimizing reporting procedures by enabling more effective calculations, thereby reducing the time spent on report generation and enhancing consistency.
Recent statistics indicate that the function has seen heightened usage among Power BI professionals, underscoring its significance in analysis workflows, particularly in addressing these challenges. Experts emphasize that mastering this software not only enhances evaluation but also streamlines reporting processes, making it an essential tool for any analyst. As Ishwarya M., a Technical Content Writer, observes, ‘DAX is based on a system of various nested filtering contexts where performance is important, which alters the way you consider filtering tables and information.’
This understanding highlights the importance of comprehending the function of COUNTAX within DAX’s broader structure and its capacity to enhance operational efficiency through effective information management.
Additionally, the resemblance of DAX syntax to Excel formulas can aid users in leveraging their existing knowledge when working with this function. For instance, the Hevo Data Pipeline case study illustrates how organizations can employ DAX operations to streamline information management processes. This aligns with the organization’s unique value in providing tailored solutions that enhance information quality, ultimately supporting business growth and innovation.
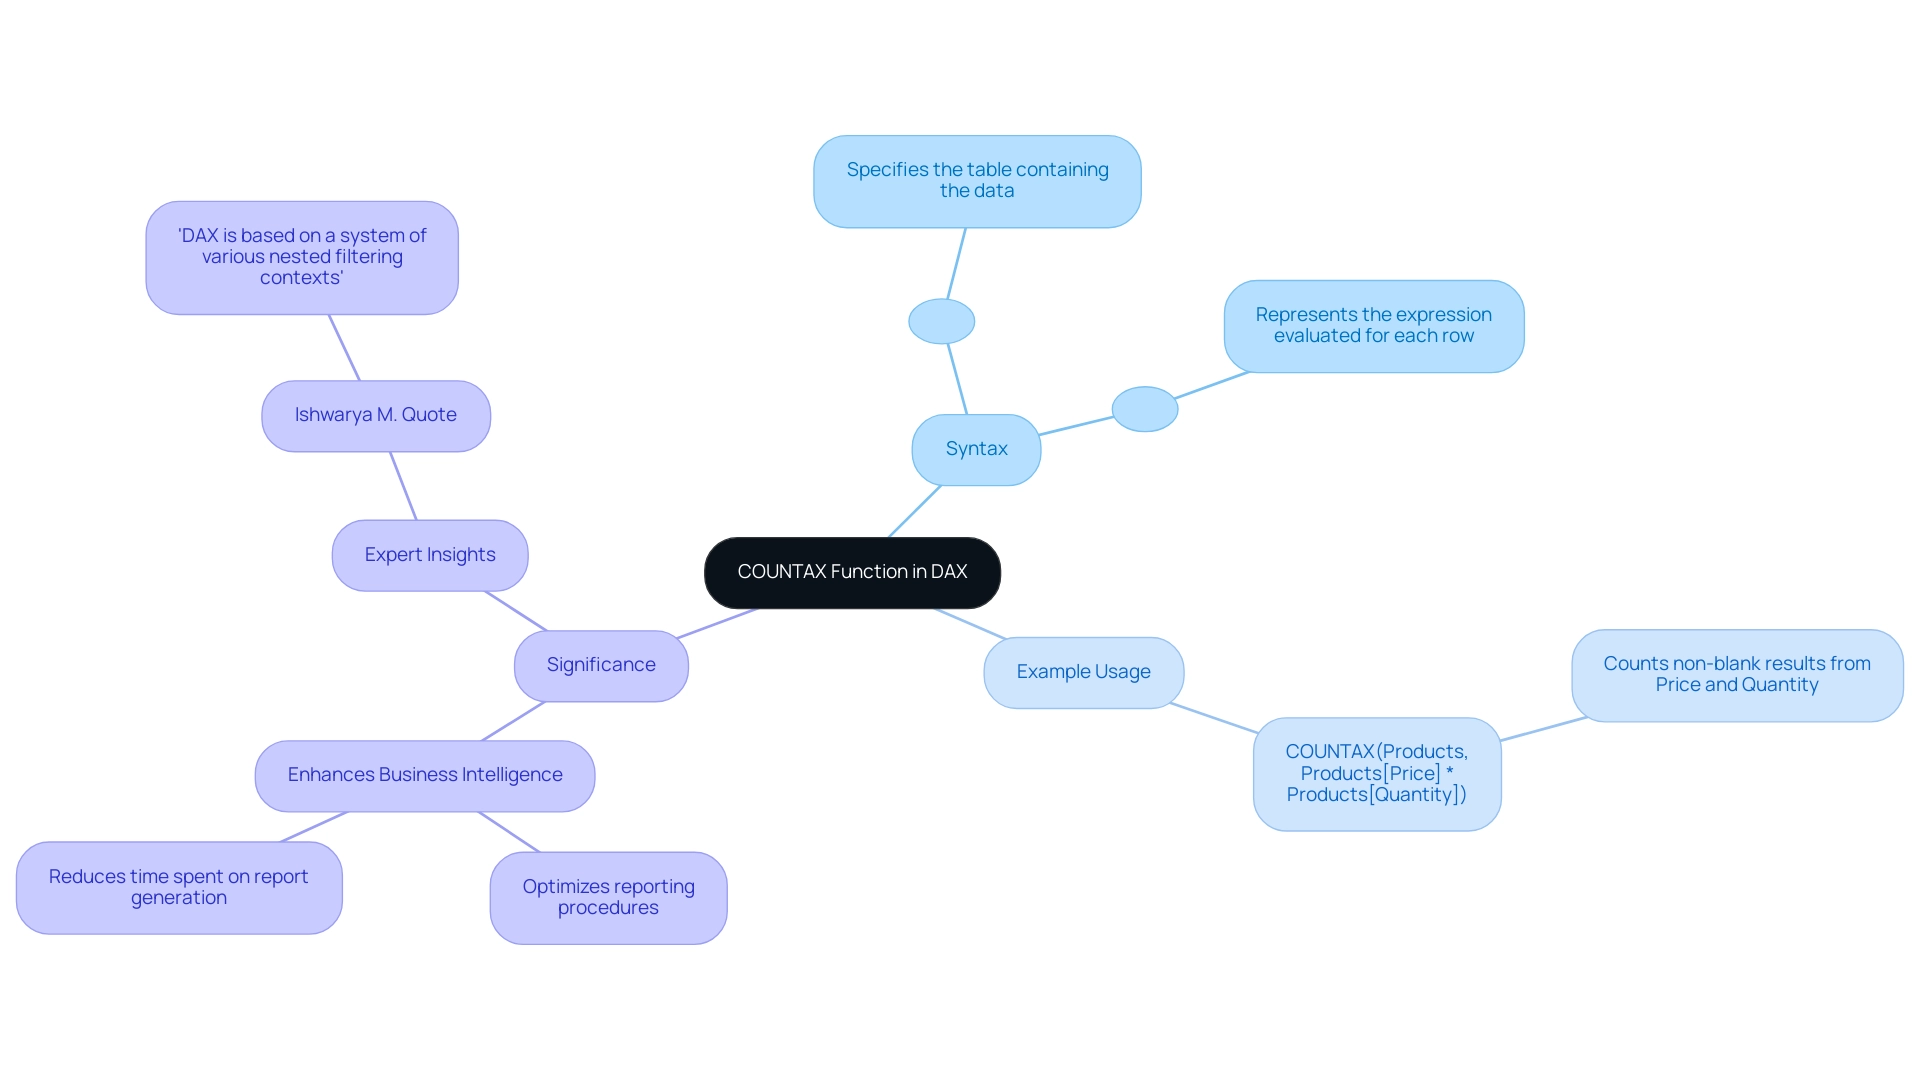
Practical Examples of COUNTAX in Action
Practical applications of the counting function in Power BI significantly enhance data analysis capabilities, serving as a vital tool for Directors of Operations Efficiency to unlock actionable insights. Consider the following compelling examples:
-
Counting Sales Amounts:
Total Sales Count = COUNTAX(Sales, Sales[Amount])This formula effectively counts all non-blank sales amounts in the Sales table, providing a clear overview of total sales activity—crucial in a data-rich environment.
-
Counting Products Sold:
Products Sold = COUNTAX(Products, IF(Products[Quantity] > 0, Products[ProductID]))This example counts the number of products sold, focusing specifically on instances where the quantity exceeds zero, ensuring only relevant sales are considered and mitigating time-consuming report creation.
-
Conditional Counting:
High Value Sales = COUNTAX(Sales, IF(Sales[Amount] > 1000, Sales[Amount]))This function counts the number of sales transactions where the amount exceeds 1000, allowing businesses to identify high-value sales and tailor their strategies accordingly.
These examples demonstrate the adaptability of the tool in various situations, enabling organizations to gain valuable insights from their information, thereby enhancing operational efficiency. For instance, Metro Bank utilized Power BI to improve their information collection and reporting processes, resulting in increased accuracy and reduced reporting time. By employing the counting method, they could further enhance their sales data analysis, ensuring that only pertinent sales figures were included, thus boosting their reporting efficiency.
Similarly, the Red Cross leveraged Power BI to gain deeper insights into donor behavior, optimizing their fundraising strategies and improving campaign performance. This tool was essential in examining donor contributions by tallying non-empty donation amounts, offering clearer insights into fundraising effectiveness. As Amazon noted, “To overcome this challenge, Amazon implemented Power BI to visualize and analyze sales and customer insights,” highlighting the critical role of such functions in driving data-driven decision-making.
Furthermore, combining RPA solutions with DAX COUNTAX can further automate analysis processes, decreasing task repetition and improving overall efficiency. Failing to leverage such tools hampers the ability to extract actionable insights and places organizations at a competitive disadvantage in today’s data-driven landscape. Mastering DAX formulas such as COUNTAX is crucial for efficient analysis and sustaining a competitive advantage in 2025.
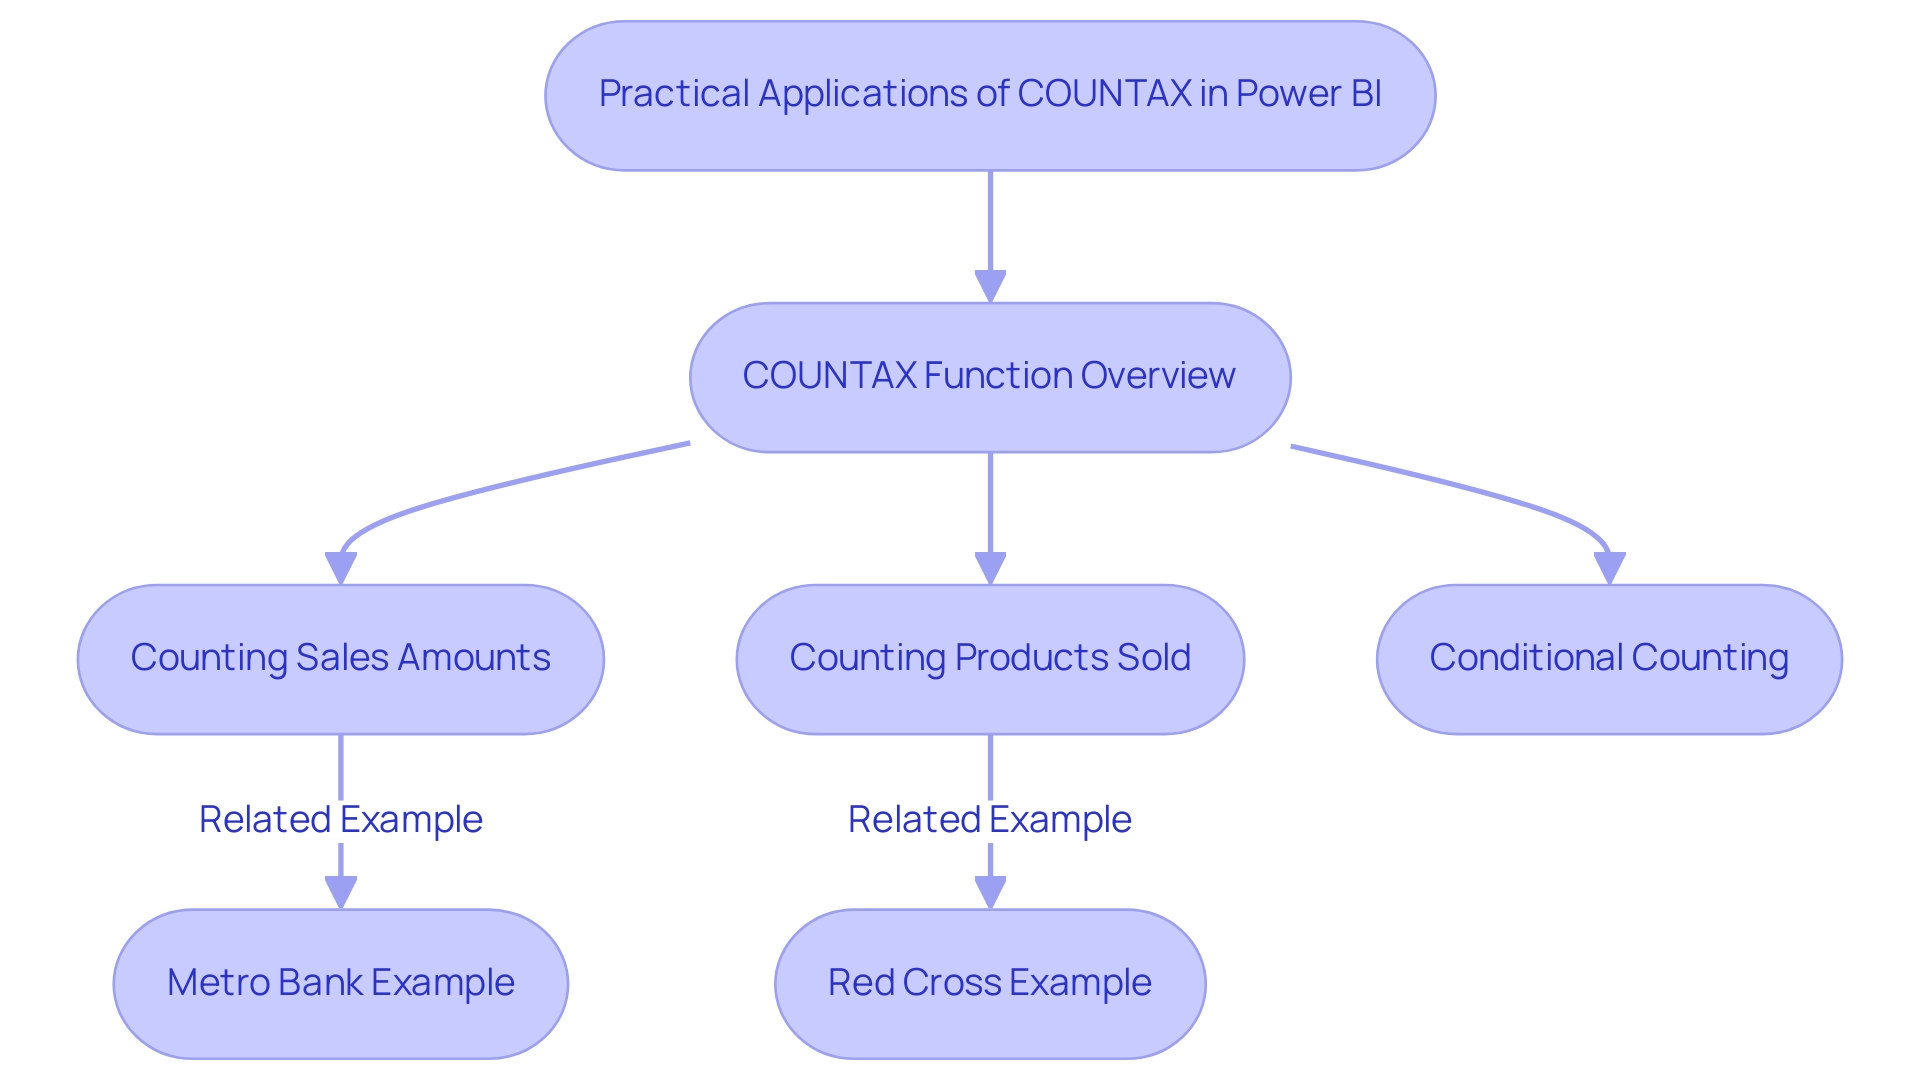
Comparing COUNTAX with Other DAX Functions
Grasping the subtleties of DAX operations is essential for efficient analysis in Power BI, particularly in an environment where insights derived from information are vital for operational effectiveness. Here’s a detailed comparison of the primary counting functions:
-
COUNT: This function counts the number of rows in a specified column that contain numeric values. It is straightforward and does not evaluate any expressions, making it ideal for scenarios where only numeric information is relevant.
-
COUNTA: COUNTA counts all non-blank values in a column, regardless of their type. However, like COUNT, it does not evaluate expressions. This method is useful when you need a comprehensive count of entries, including text and other non-numeric data.
-
COUNTX: COUNTX functions similarly to other counting methods but emphasizes tallying the number of rows that arise from assessing an expression for a specified table. It treats blank results as zero, which can be beneficial in certain analytical contexts.
-
COUNTAX: This function is particularly powerful when you need to evaluate an expression and count only the non-blank results. It allows for more complex calculations and is essential when working with derived metrics.
When to Use Each Function:
- COUNTAX is best utilized when evaluating expressions is necessary, and you want to count only non-blank results. This is especially beneficial in situations where derived metrics are involved, tackling challenges in report creation and consistency.
- COUNTA should be your go-to when you need to count all non-blank entries in a column without the need for expression evaluation, providing a broad overview of presence and enhancing overall insights.
- COUNT is appropriate when your focus is solely on counting numeric entries in a column, ensuring that your analysis remains precise and relevant.
Practical Insights:
In 2025, data professionals emphasize the importance of choosing the right counting function based on the specific requirements of the analysis. For instance, when comparing DAX COUNTAX with COUNTA and COUNT, experts note that DAX COUNTAX offers greater flexibility in scenarios requiring expression evaluation. This distinction is crucial for optimizing models and ensuring accurate reporting.Significantly, Power BI can manage up to 20,000 or 30,000 rows of information without encountering problems, emphasizing the effectiveness of utilizing DAX capabilities in processing large datasets and the benefits of incorporating RPA solutions for automating repetitive tasks, thus enhancing overall operational efficiency.
Case Study:
Consider a scenario where a business needs to analyze customer churn rates. By employing the RELATED tool alongside a counting method, analysts can seamlessly gather and tally associated data, enriching the thoroughness of their analysis. This approach not only streamlines the process but also provides richer insights into customer behavior.As noted by Sam Zha from the Community Support Team, “You may try the measure below:
Measure = AVERAGEX ( ALLSELECTED ( 'Table'[WeekId] ), [ChurnCalc] ) - [ChurnCalc]“
which illustrates practical application of DAX calculations in real-world scenarios.Recent surveys indicate a growing preference for DAX COUNTAX among Power BI users, particularly due to its ability to handle complex calculations. As organizations increasingly depend on data-driven decision-making, understanding the strengths of each DAX capability becomes essential for maximizing operational efficiency. Moreover, an extensive course on Microsoft Excel instructs on analysis utilizing key formulas, tools, and Lookup resources, emphasizing the significance of mastering DAX expressions within the framework of wider analytical skills, especially in addressing obstacles in report generation and consistency.
Additionally, RPA solutions can significantly alleviate the burden of repetitive tasks in preparation, allowing analysts to focus on deriving insights rather than getting bogged down by manual processes.
Key Point:
To process data for the usage metrics report, content must be viewed from the workspace at least once, which is relevant for users analyzing data with DAX functions.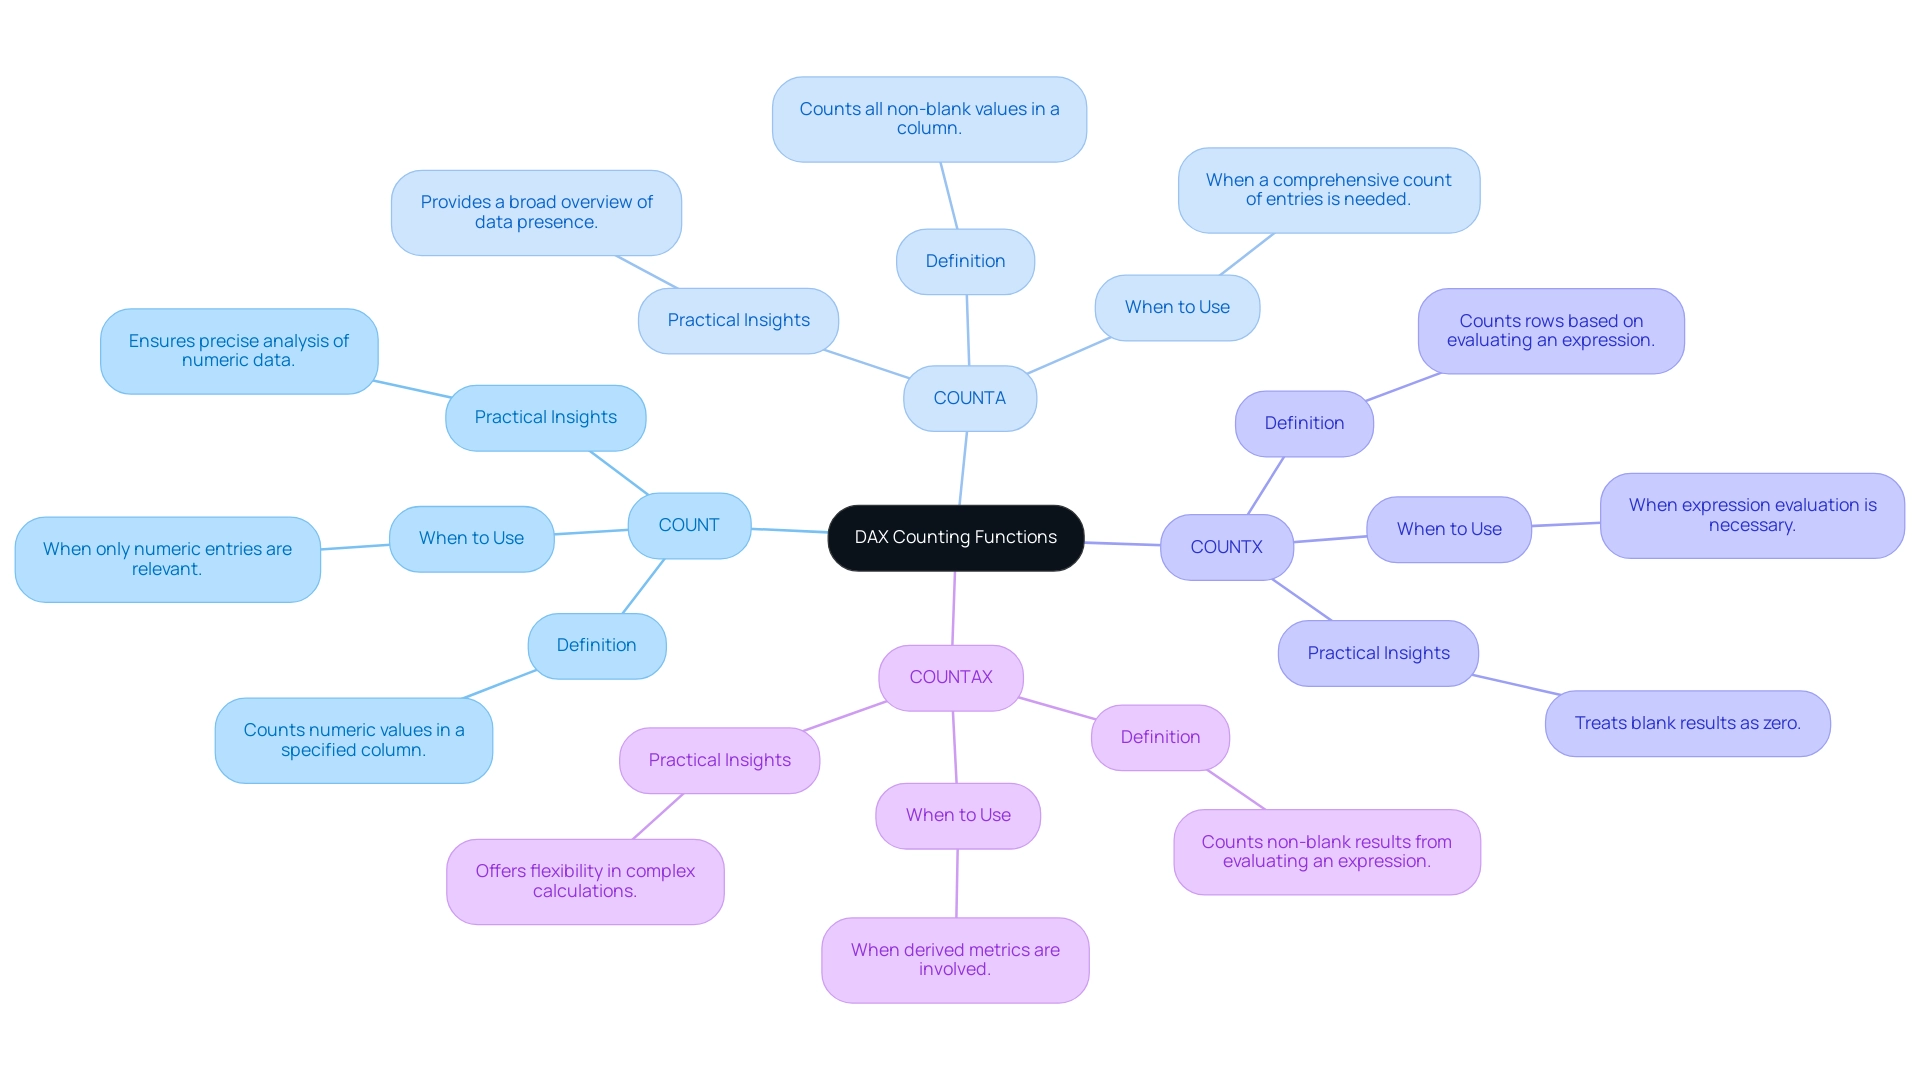
Best Practices for Implementing COUNTAX in Power BI
To maximize the effectiveness of the COUNTAX function in Power BI, it is essential to adopt several best practices that enhance performance and usability, particularly in ensuring actionable insights and operational efficiency.
-
Utilize Efficient Expressions: Craft streamlined and optimized expressions for aggregation functions. Avoid overly complex calculations that may hinder report performance; efficiency is key in analysis.
-
Limit Scope: Before applying the function, filter your information to reduce the number of rows assessed. This practice improves performance and ensures that your analysis is focused and relevant, addressing the common challenge of time-consuming report creation.
-
Integrate with Other Functions: Enhance the power of DAX COUNTAX by combining it with other DAX functions, such as CALCULATE. This approach permits the creation of more dynamic and flexible measures, enabling deeper insights and mitigating issues with inconsistencies. Implementing a robust governance strategy can further ensure consistency across reports, fostering trust in the insights generated.
-
Test and Validate: Thoroughly evaluate your expressions using example information. This step ensures that the expressions yield expected results, preventing potential issues when deployed in production reports, which can lead to a lack of actionable guidance for stakeholders.
-
Document Your Measures: Maintain comprehensive documentation of your DAX measures, particularly those employing COUNT functions. Clear documentation facilitates easier maintenance and updates, ensuring that your reporting remains accurate and efficient, thus enhancing overall business intelligence efforts.
By implementing these best practices, users can significantly enhance the performance of DAX COUNTAX expressions in Power BI, leading to more effective analysis and decision-making. For example, utilizing the RELATED feature can improve information retrieval from associated tables, enhancing the depth of analysis in Power BI. As Paul Turley, a Microsoft Data Platform MVP, states, “Same best practice guidelines… different scale, and different focus,” emphasizing the need to adapt practices to fit the unique context of your organization.
Furthermore, comprehending information limitations, such as the DoubleClick cookie expiry of 1 year, is crucial for optimizing expressions. For those looking to deepen their knowledge, a comprehensive course on Microsoft Excel offers valuable insights into data analysis using key formulas and functions, supporting the overall goal of driving growth and innovation through data-driven insights.
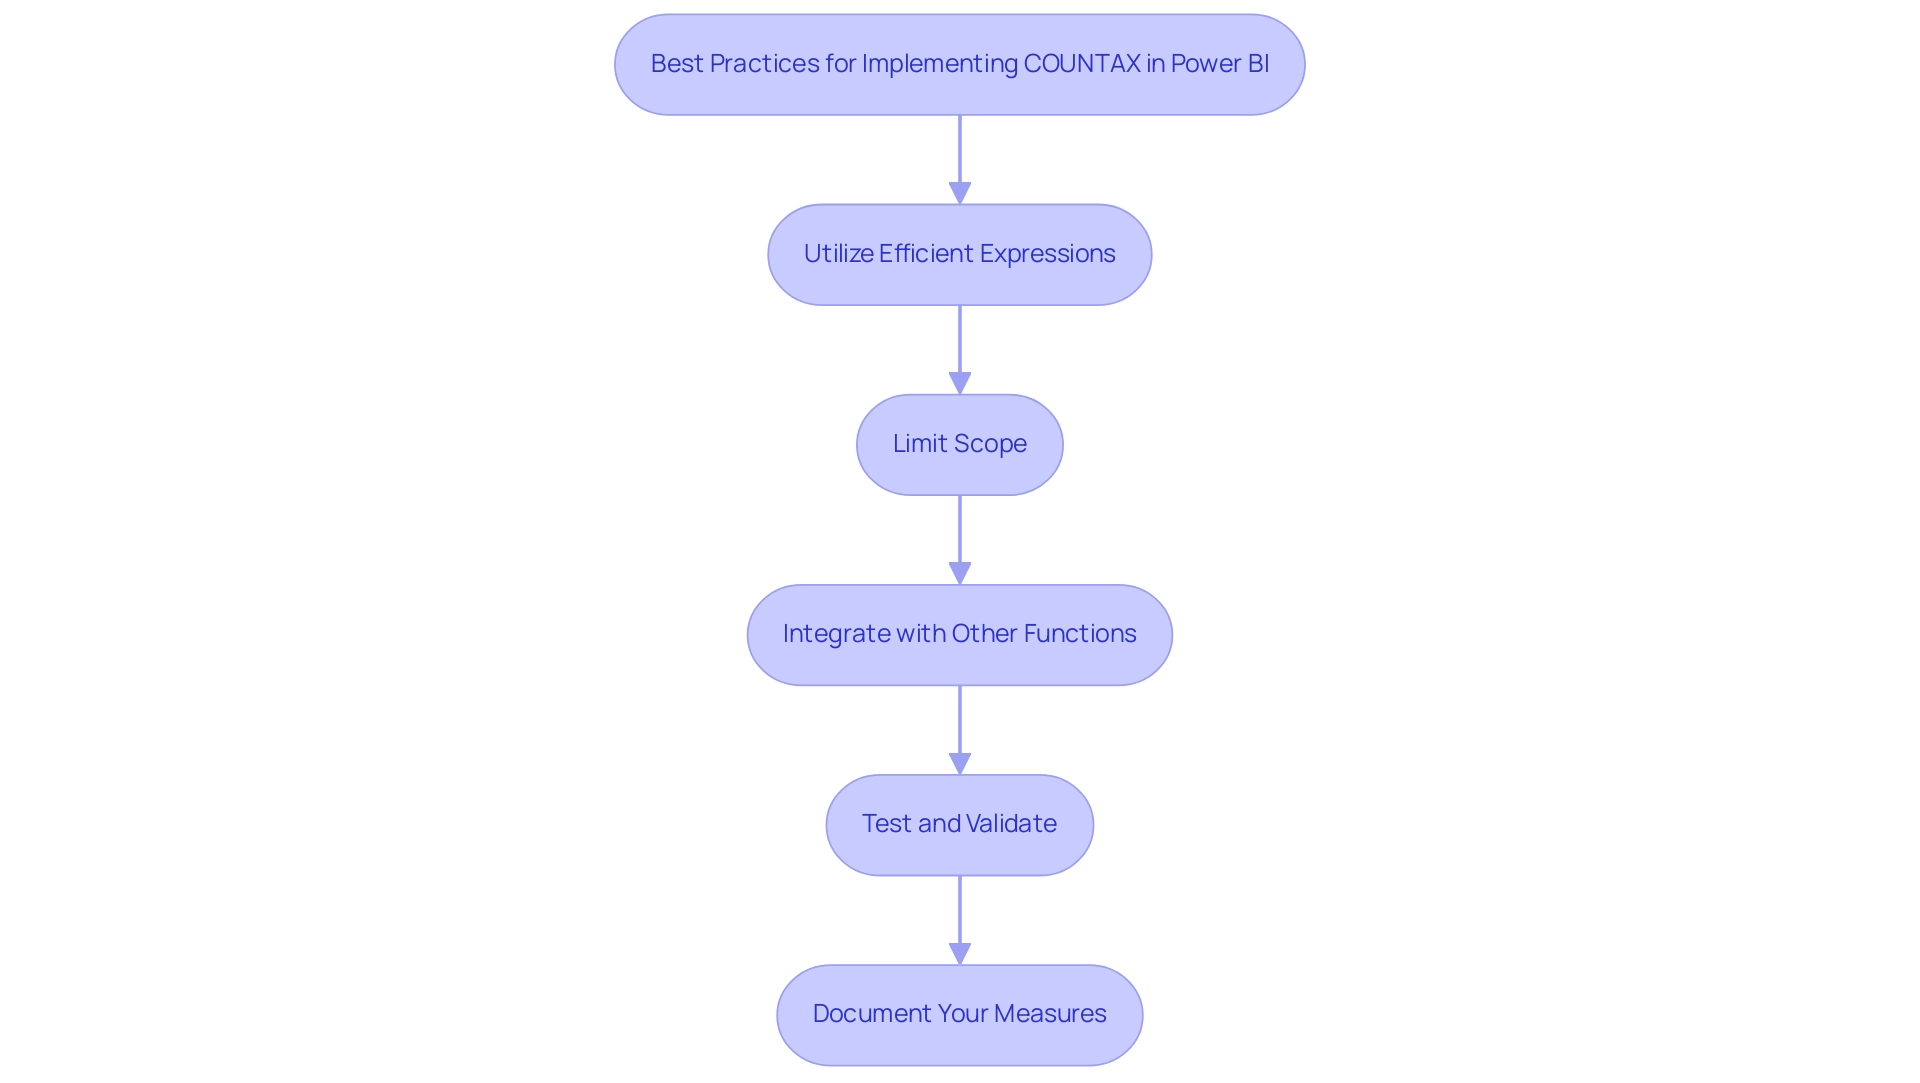
Conclusion
Mastering the COUNTAX function in DAX is essential for organizations striving to enhance their data analysis capabilities. This powerful function not only counts non-blank results but also evaluates expressions across specified tables, allowing analysts to derive meaningful insights that directly impact operational efficiency. By understanding its syntax and practical applications, users can implement COUNTAX effectively to address common challenges such as time-consuming report creation and data inconsistencies.
The versatility of COUNTAX shines through in various real-world scenarios, from counting sales amounts to conducting conditional counting for high-value transactions. These practical examples illustrate how organizations can leverage the function to transform raw data into actionable insights, ultimately driving informed decision-making. Furthermore, comparing COUNTAX with other DAX functions highlights its unique strengths, particularly in contexts requiring expression evaluation and complex calculations.
To fully harness the potential of COUNTAX, adopting best practices is crucial. Streamlining expressions, limiting data scope, and integrating COUNTAX with other functions can significantly enhance performance and ensure the reliability of insights generated. As businesses increasingly rely on data-driven strategies, mastering COUNTAX will be a pivotal component in maintaining a competitive edge.
In conclusion, as the landscape of data analysis continues to evolve, the importance of COUNTAX cannot be overstated. Organizations that invest time and resources into understanding and implementing this function will find themselves better equipped to navigate the complexities of data management, ultimately fostering a culture of informed decision-making and operational excellence.
Overview
Descriptive analysis addresses fundamental ‘what’ questions related to data, such as identifying trends in sales or understanding customer demographics. This analysis is crucial for organizations seeking to summarize historical data effectively. By gaining insights from this data, organizations can guide strategic decisions, thereby laying the groundwork for more advanced analytical methods. Embracing descriptive analysis not only enhances understanding but also empowers organizations to make informed choices that drive success.
Introduction
In a world inundated with data, the ability to distill meaningful insights from vast amounts of information is more crucial than ever. Descriptive analysis stands as a foundational pillar in data analytics, offering organizations a clear lens to view their historical performance and customer behaviors. By addressing essential questions about trends, patterns, and anomalies, businesses can harness this analytical approach to inform strategic decision-making and drive operational efficiency.
As the landscape of connected devices expands and the volume of data surges, integrating descriptive analysis with advanced technologies like Robotic Process Automation (RPA) becomes paramount. This article delves into the significance of descriptive analysis, its real-world applications across various industries, and the challenges organizations face in leveraging this powerful tool effectively.
Understanding Descriptive Analysis: Definition and Importance
Descriptive examination is a pivotal statistical method that empowers organizations to summarize, interpret, and understand their data effectively. By addressing the fundamental ‘what’ questions, it clarifies the characteristics of the dataset, enabling businesses to identify trends, patterns, and anomalies. This foundational examination is critical, as it lays the groundwork for more advanced methodologies, such as predictive and prescriptive analytics.
As we look ahead to 2025, the number of connected IoT devices is projected to reach 20.3 billion, leading to an exponential increase in available information for examination. Organizations that leverage this information through detailed analysis can optimize their operations and enhance decision-making processes, particularly when integrated with Robotic Process Automation (RPA). RPA not only minimizes errors but also liberates teams to focus on more strategic, value-adding work.
Statistics reveal that data-driven companies are 19 times more likely to be profitable, underscoring the importance of descriptive analysis in enhancing operational efficiency. Moreover, leveraging RPA addresses challenges related to poor master data quality, a common obstacle to AI adoption. Tailored AI solutions can assist organizations in identifying the right technologies to navigate these challenges.
The Sonata platform exemplifies how small enterprises can utilize descriptive evaluation and RPA to boost efficiency and secure a competitive edge. As illustrated in a case study on overcoming analytics implementation challenges, small enterprises that prioritize data quality and consistency have achieved significant results, including improved resource management and enhanced decision-making outcomes. Expert insights highlight the critical role of descriptive evaluation in business decision-making, with Chris Farr noting that data-driven companies are 23 times more likely to acquire customers and 6 times more likely to retain them.
By harnessing descriptive evaluation and RPA, along with customized AI solutions, enterprises can make informed decisions that ultimately foster growth and innovation.
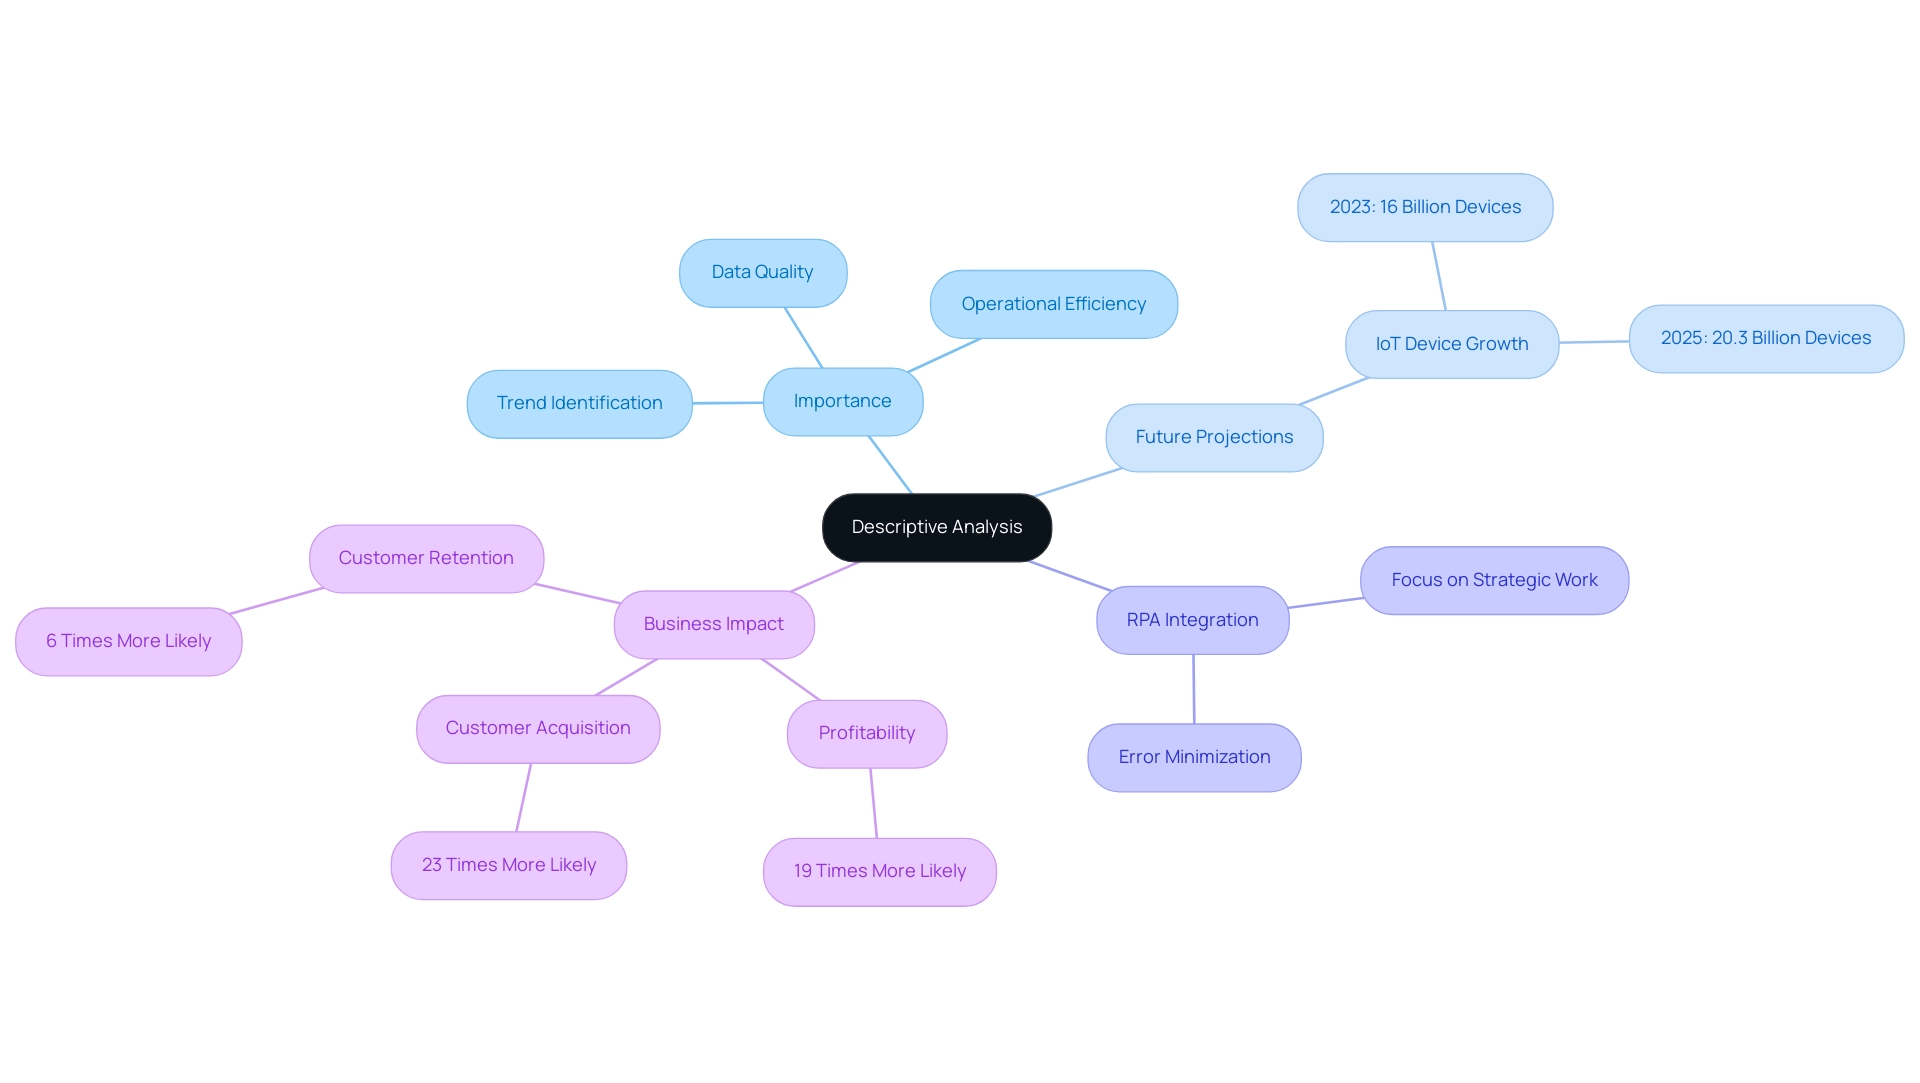
Key Questions Addressed by Descriptive Analysis
Descriptive analysis plays a pivotal role in addressing essential questions that help entities measure performance and gain insights into their customers. Key inquiries include:
- What are the trends in sales over the past year?
- How many customers visited our website last month?
- What is the average age of our customers?
These fundamental questions enable organizations to identify performance trends and customer preferences, ultimately guiding strategic decisions.
With 16 billion connected IoT devices reported in 2023, companies are increasingly utilizing information to monitor metrics and improve operational efficiency. By integrating Robotic Process Automation (RPA), organizations can automate manual workflows, significantly reducing errors and freeing up teams for strategic tasks such as innovation and customer engagement. A notable case study titled ‘Business Intelligence Empowerment’ highlights how our organization assists businesses in transforming raw information into actionable insights, aiding informed decision-making and driving growth and innovation.
Furthermore, Netflix exemplifies the strength of information evaluation; each year, they leverage extensive datasets, realizing savings of $1 billion. Insights obtained from descriptive examination assist companies in pinpointing areas for improvement and monitoring their progress over time. As companies navigate the complexities of today’s information environment, an essential aspect of informed decision-making is the measurement of performance through descriptive examination, enhanced by customized AI solutions that help firms identify the most relevant technologies for their unique needs amidst the evolving technology landscape.
This is supported by roles in data science focusing on essential tasks such as information preprocessing and A/B testing, demonstrating how descriptive assessment fits within the broader structure of analytics in business.
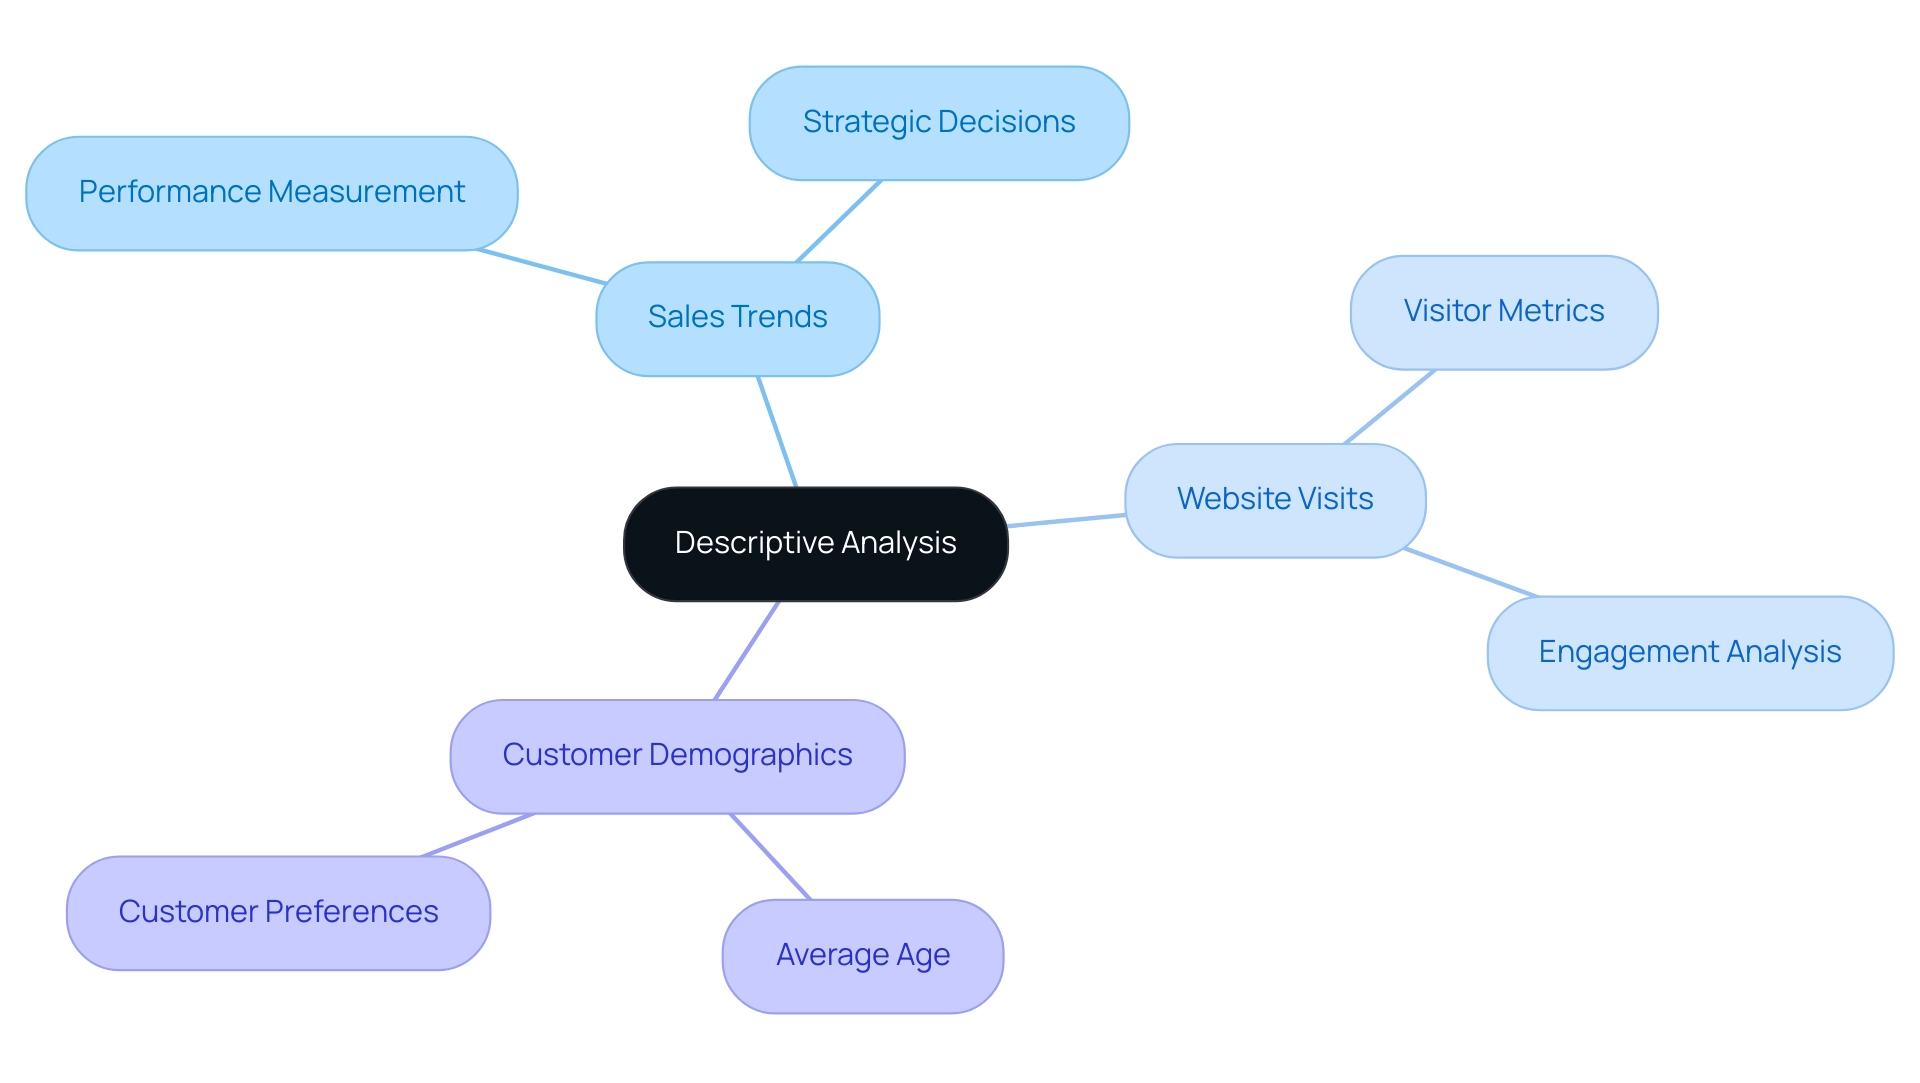
Types of Data Analysis: Contextualizing Descriptive Analysis
Data examination is crucial for entities aiming to make educated choices, and it can be classified into four primary forms: descriptive, diagnostic, predictive, and prescriptive. Descriptive examination serves as the foundation, focusing on summarizing historical data to provide insights into what has transpired. This prompts the inquiry: which type of question does descriptive analysis address? For instance, organizations frequently employ descriptive statistics to track sales performance or customer behavior, seeking to understand the underlying trends.
A significant example is Lotte, a South Korean conglomerate, which boosted their sales by $10 million through effective Business Intelligence strategies. This case illustrates the tangible results of descriptive evaluation. Notably, roughly 50% of enterprises indicate that they employ descriptive evaluation as their primary method of information assessment, reinforcing the question: which type of question does descriptive analysis address?
Building upon this, diagnostic evaluation explores the reasons behind specific occurrences, enabling businesses to comprehend causality. Predictive evaluation utilizes historical information to forecast future results, facilitating proactive decision-making and strategic planning. Finally, prescriptive examination advances by suggesting practical strategies based on insights, directing entities toward optimal outcomes.
As the need for information-driven decision-making increases, the global Big Data analytics market is projected to reach an impressive $549.73 billion by 2028, according to insights from Fortune Business Insights. This underscores the significance of comprehending the various forms of analysis and their applications.
Furthermore, while the vast AI landscape can be intimidating, our customized AI solutions—including Small Language Models for effective information analysis and privacy enhancement, as well as GenAI Workshops for practical training and custom GPT development—can penetrate the clutter. These focused technologies align with your specific business objectives and challenges. By harnessing Business Intelligence, organizations can unlock the power of information to transform raw content into actionable insights, driving growth and innovation. Moreover, our Power BI services, including the 3-Day Sprint for rapid report creation and the General Management App for thorough management, guarantee efficient reporting and consistency.
With roughly 30% of the Global DataSphere anticipated to consist of real-time information by 2025, companies must select suitable evaluation techniques that align with their strategic goals. The significance of web scraping in this context cannot be disregarded, as it enables organizations to leverage large information sets for strategic decision-making, further enhancing their analytical capabilities. This dialogue between human curiosity and artificial intelligence emphasizes the role of AI in problem-solving and innovation.
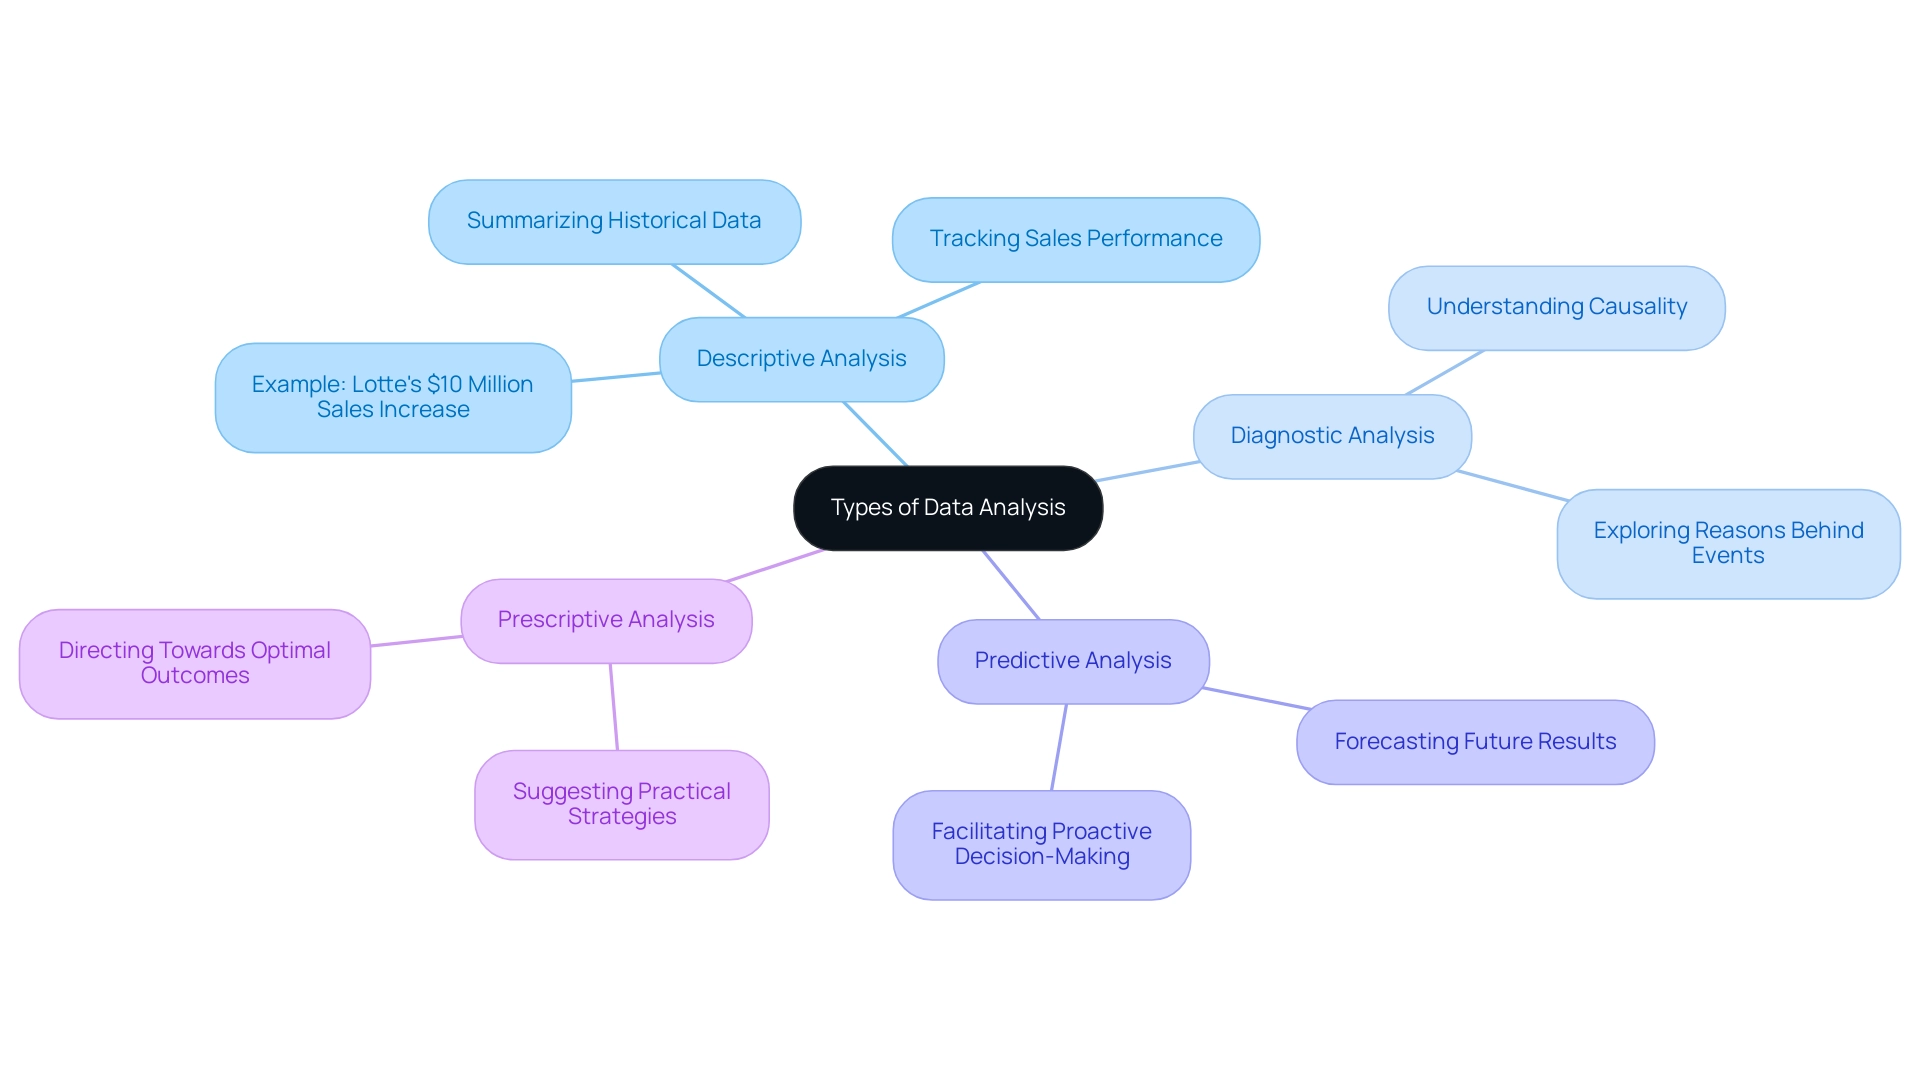
Real-World Applications of Descriptive Analysis
Descriptive evaluation serves as a vital tool across a multitude of industries, unlocking valuable insights that drive strategic decision-making. This is particularly relevant in understanding which type of question descriptive analysis addresses in an era marked by overwhelming AI options. In the retail sector, businesses utilize this examination to explore sales information and customer demographics, enabling the personalization of marketing strategies that resonate with target audiences. For instance, understanding customer lifetime value (CLV) predictions allows retailers to gauge potential revenue streams and refine their outreach efforts accordingly.
However, it is noteworthy that only 37% of enterprises manage to utilize information efficiently, despite it being a top priority. This statistic highlights the challenges organizations face in leveraging information effectively.
In healthcare, descriptive analysis plays a crucial role in summarizing patient information, specifically in addressing which type of question descriptive analysis addresses regarding treatment outcome trends. By closely examining patterns in patient records, healthcare providers can enhance the quality of care and tailor interventions for better health outcomes. Furthermore, unlocking the power of Business Intelligence (BI) can transform raw information into actionable insights, enabling informed decision-making that drives growth and innovation.
Financial institutions are also leveraging descriptive analytics to scrutinize transaction patterns, raising the question of which type of question descriptive analysis addresses in facilitating the detection of anomalies and potential fraud. This proactive approach not only safeguards assets but also enhances operational efficiency. The integration of Robotic Process Automation (RPA) alongside BI further amplifies the ability to derive insight-driven conclusions, streamlining operations and fostering business growth.
To navigate the overwhelming AI landscape, tailored AI solutions such as predictive analytics and machine learning algorithms can assist businesses in identifying the most relevant information and insights for their specific needs. Dmytro Tymofiiev, Delivery Manager at SPD Technology, emphasizes the necessity of analytics in retail, stating, ‘The reality is that analytics in retail is no longer an option for those who want to stay competitive—it’s a necessity.’ This sentiment reflects a broader industry shift, as organizations recognize that even small, incremental steps toward evidence-based strategies can lead to significant improvements over time.
Furthermore, recent developments in the industry, such as SoundCommerce raising $15 million in early 2024 to expand its analytics solutions for retail insights, underscore the growing investment in analytics capabilities. Additionally, case studies reveal that data mining techniques employed in descriptive analytics—such as clustering and anomaly detection—can uncover hidden insights, thereby addressing the question of which type of question descriptive analysis addresses, amplifying the effectiveness of these analytical processes. As we progress through 2025, the ongoing development of descriptive examination highlights its essential role in enhancing decision-making across various sectors, driving both growth and innovation while assisting businesses in navigating the complexities of AI.
The failure to extract meaningful insights can leave organizations at a competitive disadvantage, underscoring the urgency of leveraging BI effectively.
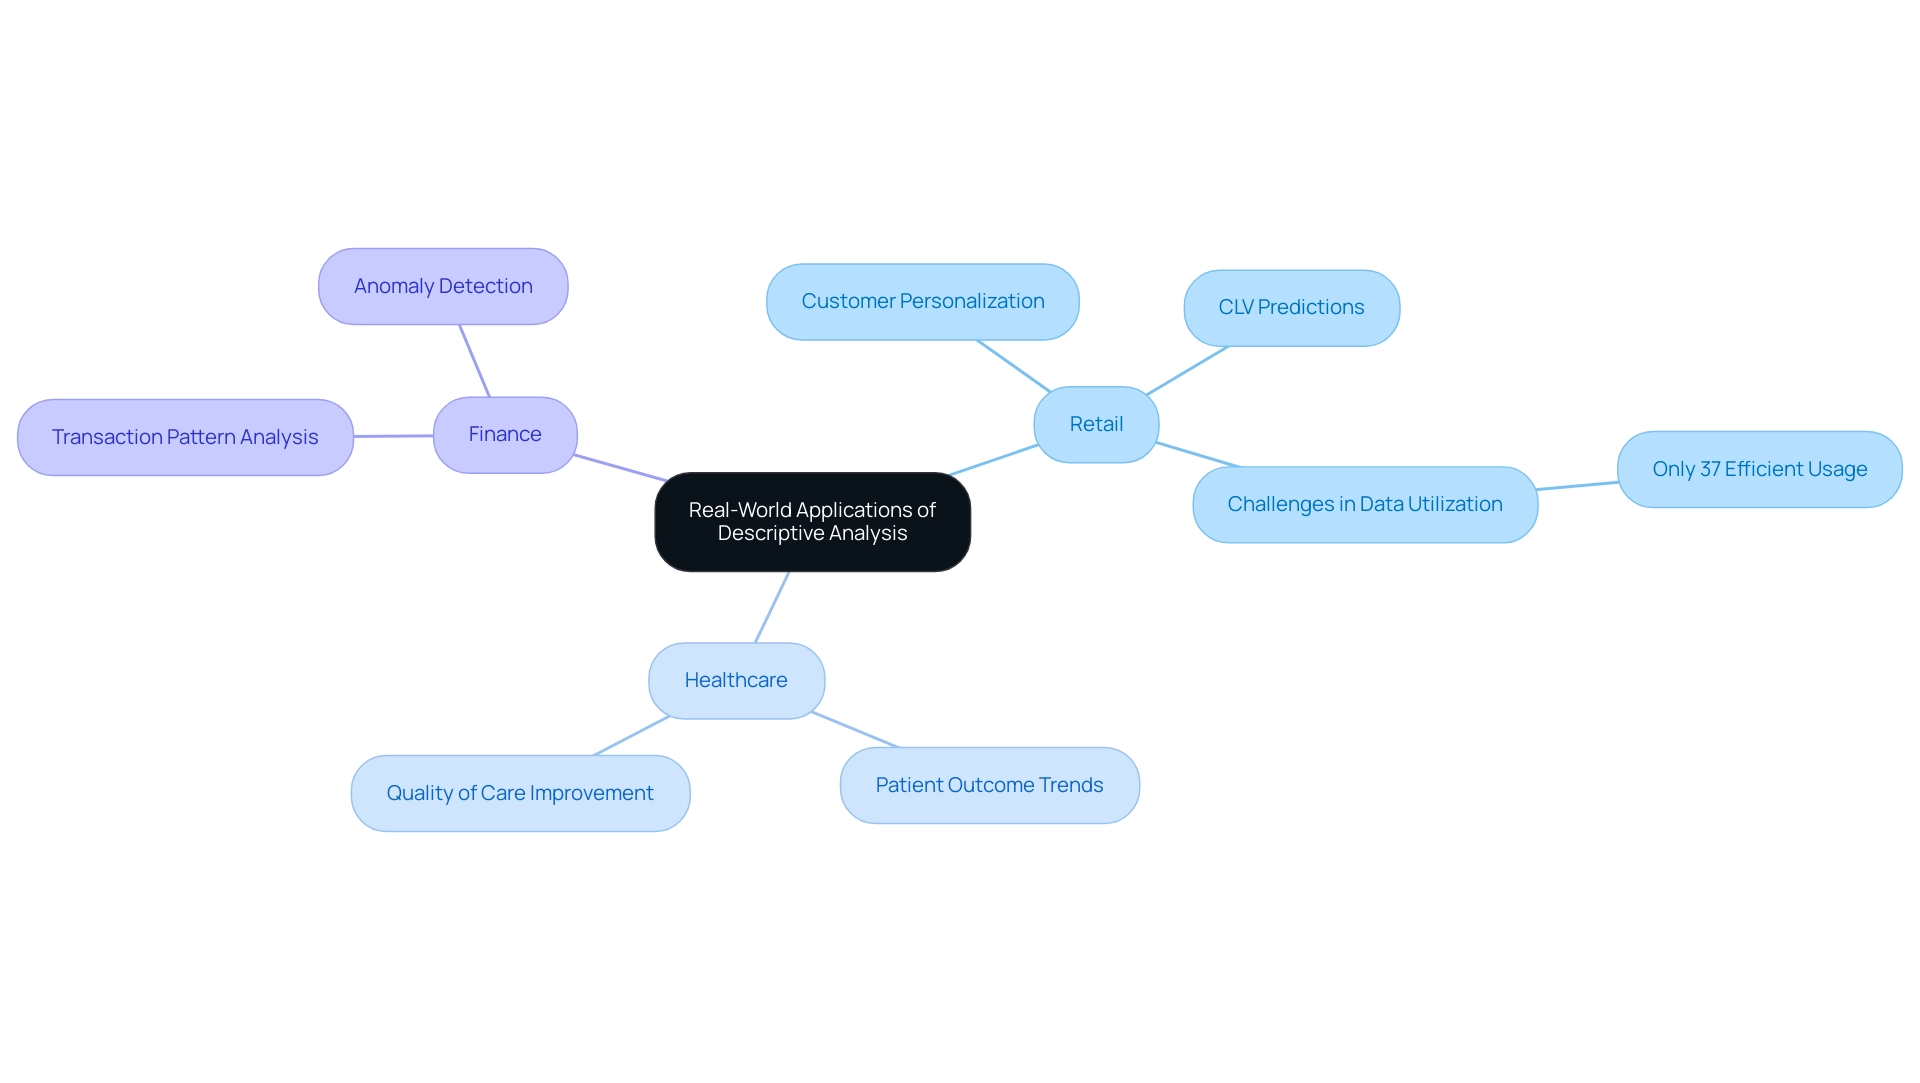
Challenges and Limitations of Descriptive Analysis
Descriptive analysis, while offering valuable insights into historical data, presents notable limitations. Most significantly, this method is incapable of predicting future trends or establishing causal relationships between variables. As Tom Bzik, a statistical consulting expert, asserts, ‘One major limitation of descriptive statistics is that they can’t determine causality.’ Although they summarize critical information, such as averages and standard deviations, they fail to indicate whether one variable influences another. This gap in understanding can lead organizations to draw erroneous conclusions from their data.
Moreover, the effectiveness of descriptive evaluation is heavily dependent on the quality of the data collected. In 2025, organizations increasingly face challenges such as data overload, incomplete datasets, and inherent biases that can skew results. These issues underscore the importance of acknowledging the limitations of descriptive analysis and complementing it with more robust analytical methods, such as:
- Robotic Process Automation (RPA)
- Tailored AI solutions
- Business Intelligence
RPA can streamline workflows, enhancing efficiency and reducing errors, while tailored AI solutions aid organizations in navigating the complex landscape of available technologies, aligning with specific organizational objectives. Notably, data-driven companies are 19 times more likely to achieve profitability, emphasizing the critical role of effective analytics in fostering success.
Furthermore, the case study titled ‘Shift from Big Information to Small and Wide Information’ exemplifies the practical implications of evolving management strategies. As the industry transitions towards leveraging small and wide data approaches, organizations must adeptly navigate these challenges to enhance data quality and extract actionable insights, ensuring their analytical practices evolve in tandem with changing business needs.
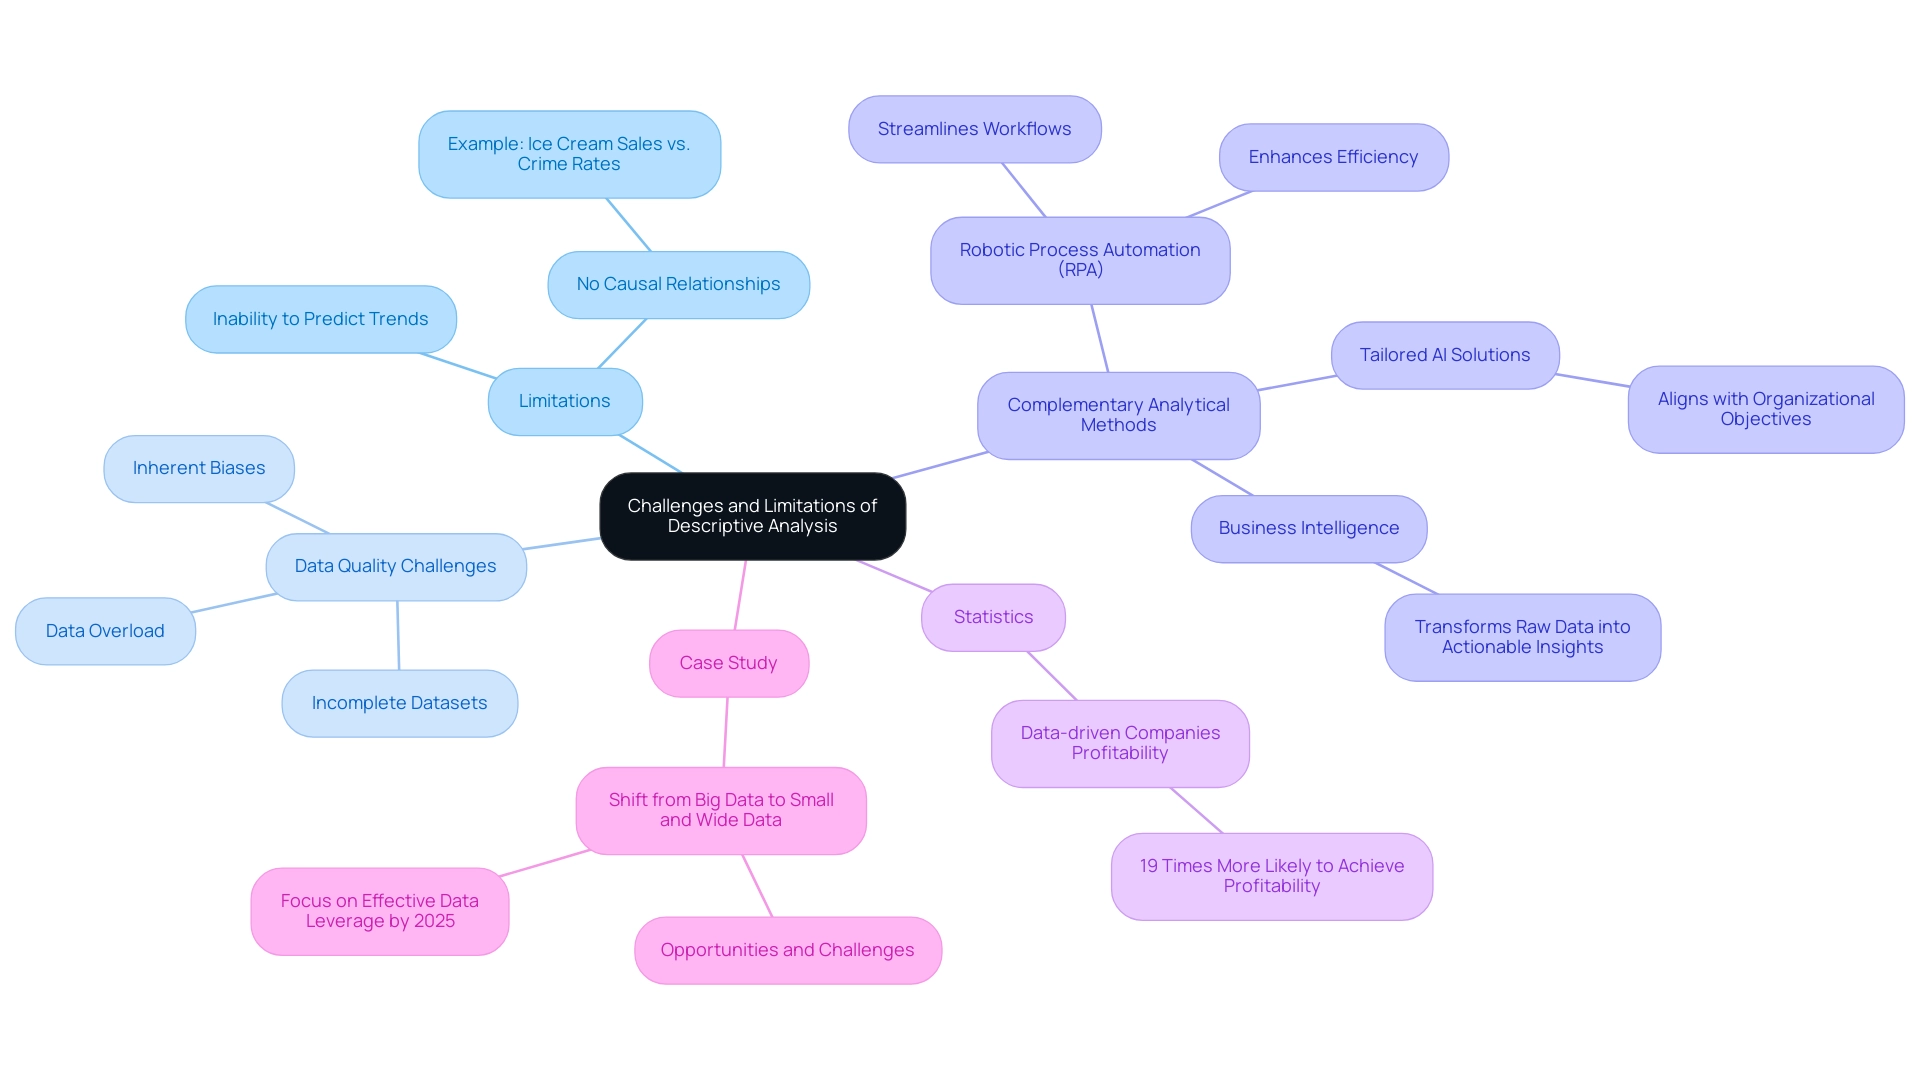
Conclusion
Descriptive analysis stands as a cornerstone of data analytics, empowering organizations to make informed decisions through the summarization of historical data and the identification of trends, patterns, and anomalies. As data volume continues to surge—especially with the proliferation of connected devices—the integration of descriptive analysis with advanced technologies like Robotic Process Automation (RPA) becomes increasingly vital. This strategic combination not only enhances operational efficiency but also addresses challenges related to data quality, which can impede effective decision-making.
The real-world applications of descriptive analysis span various industries, including retail, healthcare, and finance. Each sector leverages this analytical approach to derive actionable insights that inform strategic decisions, improve customer engagement, and drive growth. However, despite its many benefits, organizations must remain cognizant of the limitations inherent in descriptive analysis, particularly its inability to predict future outcomes or establish causality. This limitation underscores the necessity of complementing descriptive analysis with more advanced methodologies to ensure comprehensive insights.
In conclusion, as businesses navigate an increasingly complex data landscape, the ability to harness descriptive analysis effectively is paramount for success. Organizations that prioritize data-driven decision-making are not only more likely to achieve profitability but are also better positioned to adapt to the challenges and opportunities that lie ahead. By embracing descriptive analysis alongside tailored AI solutions and RPA, companies can unlock the full potential of their data, fostering innovation and maintaining a competitive edge in their respective markets.
Overview
The article confronts the critical issue of duplicate values in datasets, which obstruct the establishment of relationships between tables. This challenge can result in significant operational inefficiencies and erroneous reporting. It underscores the necessity of implementing unique identifiers and conducting regular data maintenance.
Automation tools, such as Robotic Process Automation (RPA), play a pivotal role in managing duplicates effectively. By enhancing data integrity, organizations can facilitate improved decision-making processes, ultimately driving better outcomes.
Introduction
In the intricate realm of data management, duplicate values present a formidable challenge that can undermine the very foundation of effective data relationships. As organizations increasingly depend on data-driven insights to steer strategic decisions, the importance of maintaining data integrity cannot be overstated. Duplicate entries not only lead to operational inefficiencies but also threaten the accuracy of reporting, ultimately skewing outcomes and hindering growth.
This article explores the complexities of managing duplicate values, examining their causes, impacts, and effective strategies for identification and removal. By grasping these dynamics, organizations can implement best practices that enhance data quality, streamline operations, and foster informed decision-making in an ever-evolving digital landscape.
Understanding the Duplicate Values Dilemma in Data Relationships
Duplicate values in information sets pose significant challenges when establishing relationships between tables. For instance, when both a Sales Data Table and a Price Data Table contain non-unique product IDs, the system may generate an error indicating that the relationship cannot be created due to these duplicates. This issue is particularly common in various information handling systems, including Excel and Power BI, where unique identifiers are crucial for accurate linkage.
As Subha Airan-Javia, MD, emphasizes, effective information management is essential for operational efficiency, underscoring the need for organizations to proactively address these challenges.
In the pursuit of enhancing operational efficiency in healthcare through GUI automation, organizations can automate the identification of repeated values, significantly reducing manual efforts and errors. This automation is vital for organizations aiming for improved data integrity, allowing them to extract meaningful insights without the impediment of inconsistencies. For example, a medium-sized firm that implemented GUI automation achieved a remarkable 70% reduction in entry errors and accelerated testing processes by 50%.
Consider a scenario where repeated product IDs exist in both tables. Without unique identifiers, the system lacks the necessary information to accurately relate the two tables, resulting in an inability to create the relationship due to duplicate values. This inefficiency can severely impede decision-making processes. The overall record count for Saccharomyces cerevisiae stands at 68,236, highlighting the prevalence of repeated values in information handling systems and their potential impact on data integrity.
Moreover, a case study titled ‘Systemic Hazards of Information Overload in EMRs’ identifies information overload and dispersion as significant risks in electronic medical records (EMRs), obstructing clinicians’ ability to locate relevant information effectively. This study advocates for the reengineering of documentation systems to mitigate these hazards, suggesting collaborative documentation models and adaptable systems to enhance information management.
To tackle the issue of repeated values, it is imperative first to acknowledge their presence in your information sets. This foundational step lays the groundwork for implementing effective strategies to eliminate duplicates, ultimately facilitating the successful establishment of relationships and improving the overall quality of your management systems. Leveraging AI, such as Small Language Models designed for efficient information analysis and GenAI workshops for practical training, can further enhance quality and training, providing a comprehensive strategy for operational efficiency.
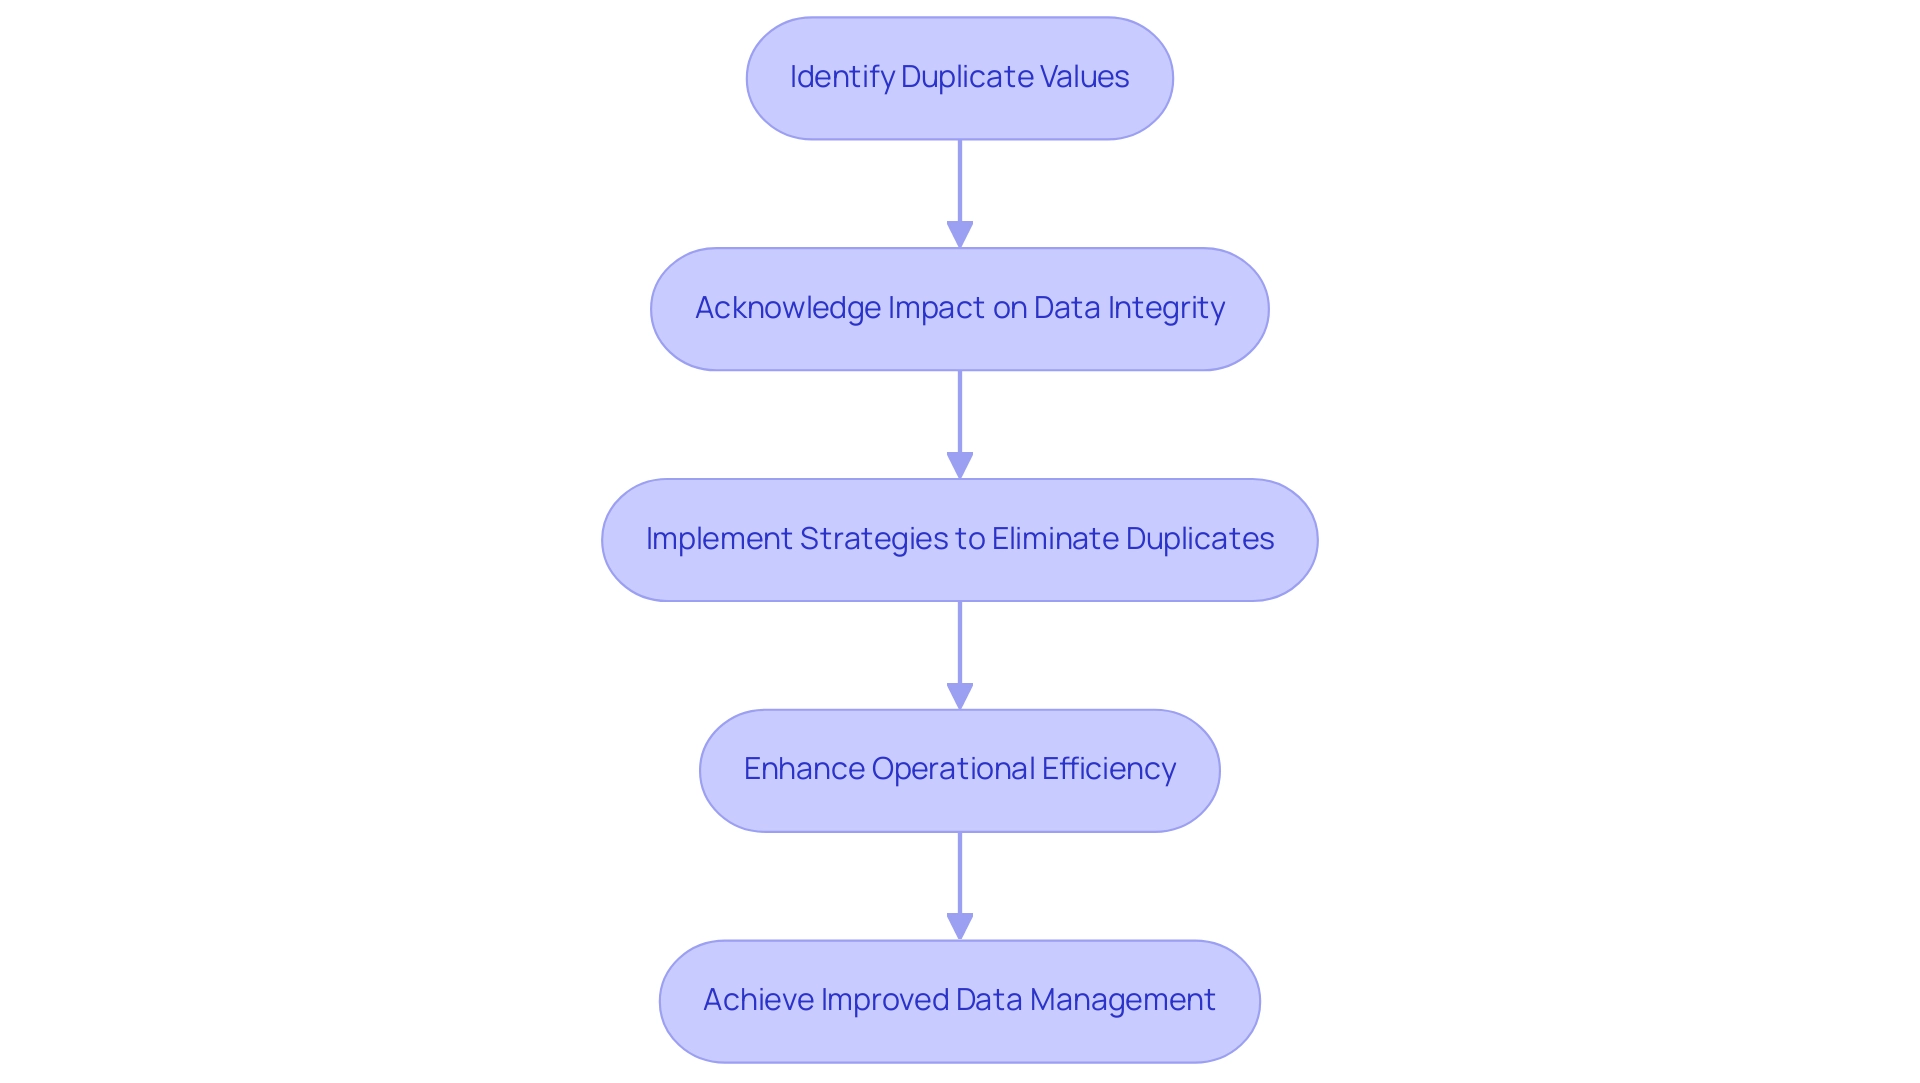
Causes of Duplicate Values in Data Sets
Duplicate values in databases can arise from numerous sources, each contributing to a decline in quality. Key causes include:
-
Manual Input Errors: Human mistakes during the entry process significantly contribute to duplicates. Common errors, such as typographical mistakes or inconsistent naming conventions, can inadvertently create multiple entries for the same entity. Recent studies indicate that manual information entry errors can cost organizations up to $3 trillion annually in the U.S. alone. As Kin-Sang Lam, a Managed Care Pharmacist, emphasizes, “In my experience, it is essential to clean and standardize information to ensure it is reliable for use.”
-
System Integration Issues: Integrating information from disparate systems often reveals discrepancies in formats or identifiers, leading to duplicated records. When systems do not align, the complexities of information integration can result in significant quality issues. A case study on industry employment trends highlights that improper integration can cause a 20% increase in operational costs due to inefficiencies stemming from duplicate records. Utilizing RPA can automate these integration processes, ensuring consistent formats and minimizing errors, thereby enhancing overall quality.
-
Absence of Unique Identifiers: Without designated unique identifiers, distinguishing between different entries becomes problematic. This lack of clarity often results in duplicate values, indicating that relationships cannot be established, thereby undermining the integrity of the information set. The absence of unique identifiers has been linked to a 15% rise in management costs, underscoring the necessity for clear governance. RPA can assist in identifying and enforcing unique identifiers across systems, ensuring that integrity is maintained.
-
Information Migration Procedures: During information transfer between systems, duplicates may unintentionally be created if comprehensive checks and validation measures are not established. A lack of oversight during these migrations can compromise quality, leading to an estimated 30% of quality issues stemming from migration errors. RPA tools can simplify these migration processes by automating checks and validations, thereby improving information integrity and minimizing the chances of duplicates.
Understanding these causes is essential for developing robust information handling strategies. By proactively addressing these challenges and ensuring executive focus on information quality initiatives, organizations can significantly minimize redundancies, thus enhancing the overall quality and usability of their information. Moreover, in a rapidly evolving AI environment, incorporating RPA as a strategic element in operations can assist in managing complexities, enhance efficiency, and support business objectives.
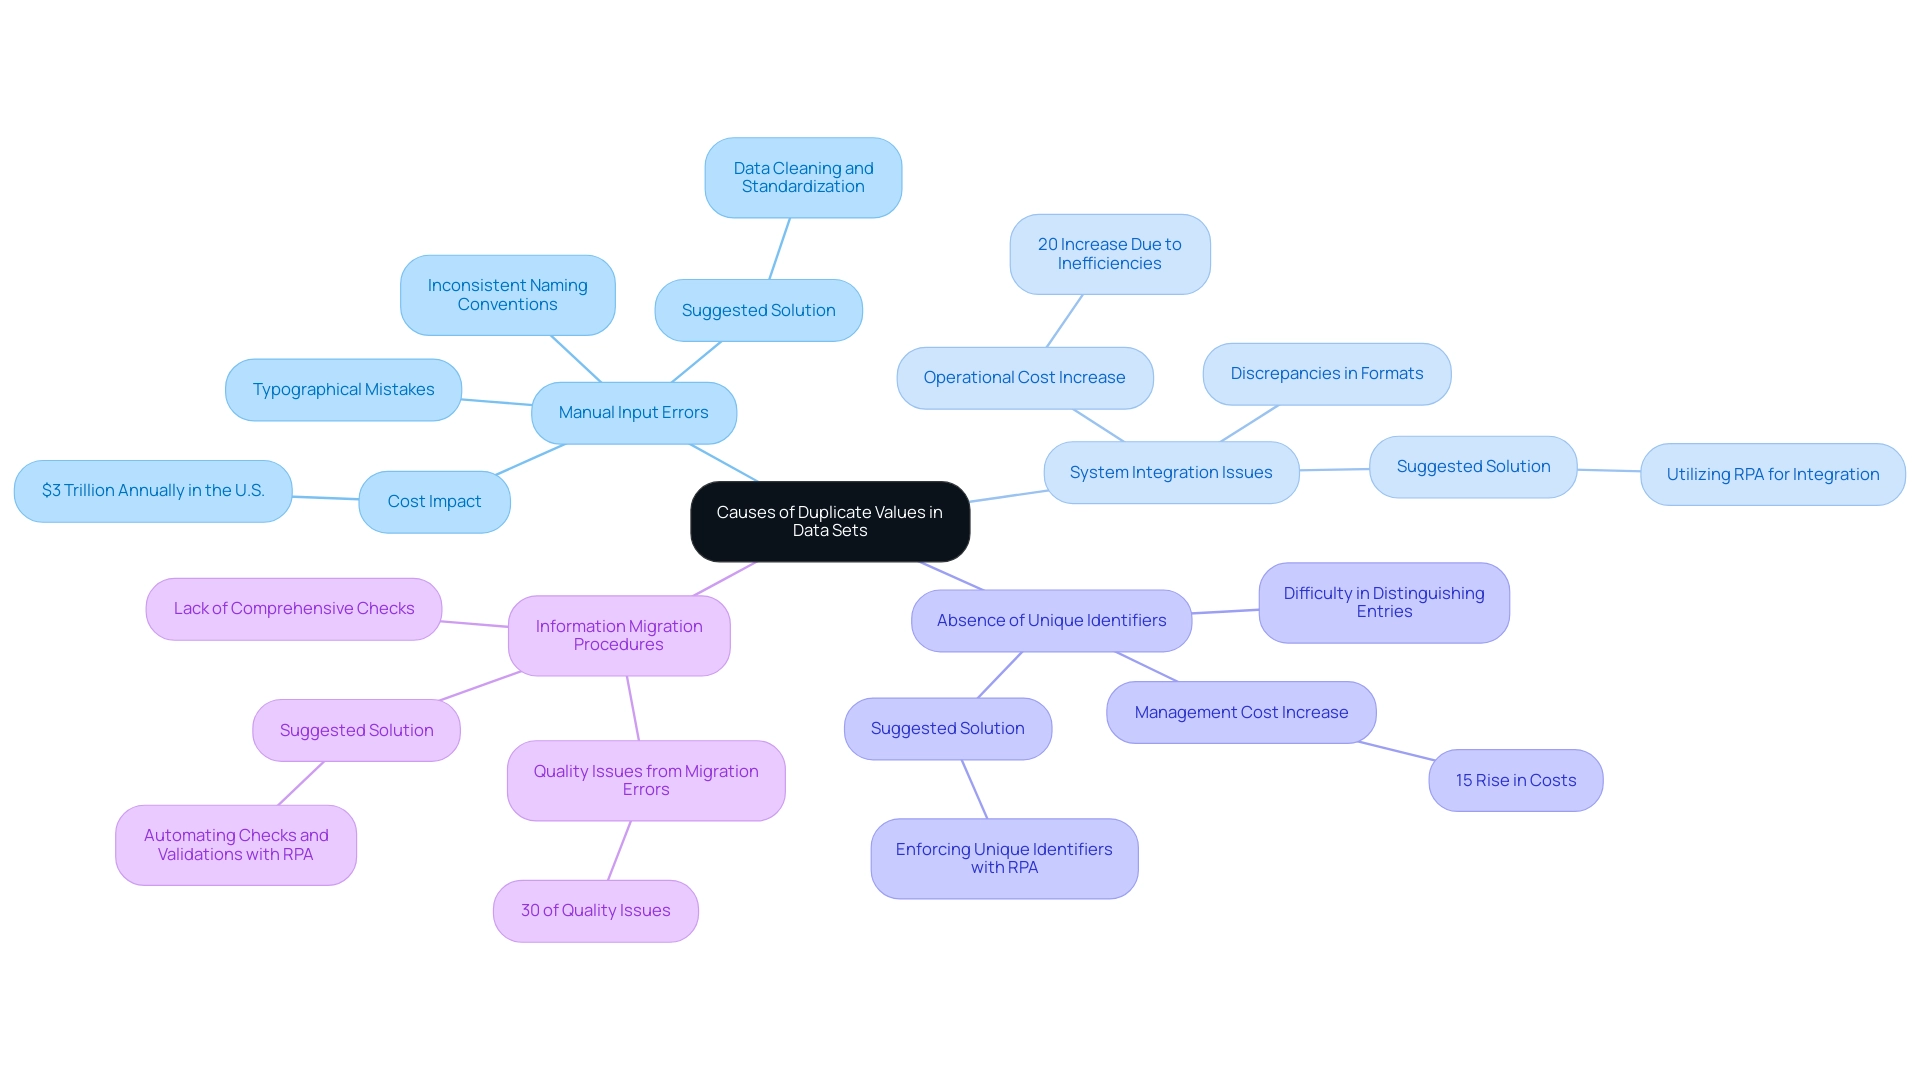
Effective Strategies for Identifying and Removing Duplicates
To effectively identify and remove repetitions from your datasets, consider implementing the following strategies:
-
Utilize Cleaning Tools: Employ specialized software for cleansing, such as OpenRefine or Excel’s built-in ‘Remove Duplicates’ feature. These tools automate the identification and elimination of repetitions, significantly enhancing operational efficiency. As Rui Gao, a data analyst, points out,
[Cleaning technology can enhance information quality](https://pmc.ncbi.nlm.nih.gov/articles/PMC10557005) and offers more precise and realistic target information than the original content.Furthermore, integrating Robotic Process Automation (RPA) solutions like EMMA RPA can streamline these processes by automating routine tasks. This allows teams to concentrate on more strategic initiatives, thereby improving employee morale by reducing repetitive workloads. -
Implement Conditional Formatting: In Excel, leverage conditional formatting to emphasize repeated values. This visual aid streamlines the identification and management of repetitions manually, ensuring that no unnecessary information goes unnoticed.
-
SQL Queries for Database Management: For those working within database environments, SQL queries serve as a powerful means to identify repetitions. For instance, the query
SELECT column_name, COUNT(*) FROM table_name GROUP BY column_name HAVING COUNT(*) > 1;effectively highlights any duplicate entries, enabling prompt action to clean your information. Moreover, utilizing Microsoft Power Automate can automate SQL queries, enhancing management efficiency and freeing up resources for higher-value tasks. -
Regular Information Audits: Conducting periodic reviews of your information is crucial. These audits assist in recognizing and correcting duplicates before they develop into major problems, ensuring ongoing integrity and usability. Utilizing AI-driven insights can further enhance the audit procedure and improve information quality.
-
Understand the Distinction Between Information Cleaning and Information Transformation: Recognizing that information cleaning focuses on improving dataset quality while information transformation manipulates clean datasets for analysis is essential in the overall management process. This understanding can lead to more effective strategies for maintaining information integrity.
-
Address Security Risks: It is important to note that 41 contributions from team members compromising security for speed can lead to significant risks. Effective cleaning strategies, potentially supported by RPA, can mitigate these risks by ensuring that only accurate and reliable information is utilized.
By adopting these strategies and leveraging RPA tools, organizations can maintain cleaner datasets, ensuring smoother relationships since the relationship cannot be created with duplicate values. This leads to improved overall governance. Furthermore, the case study titled ‘Recommendations for Effective Information Governance’ emphasizes the importance of establishing a unified governance platform, which can enhance the quality of real-world information and foster better collaboration among stakeholders.
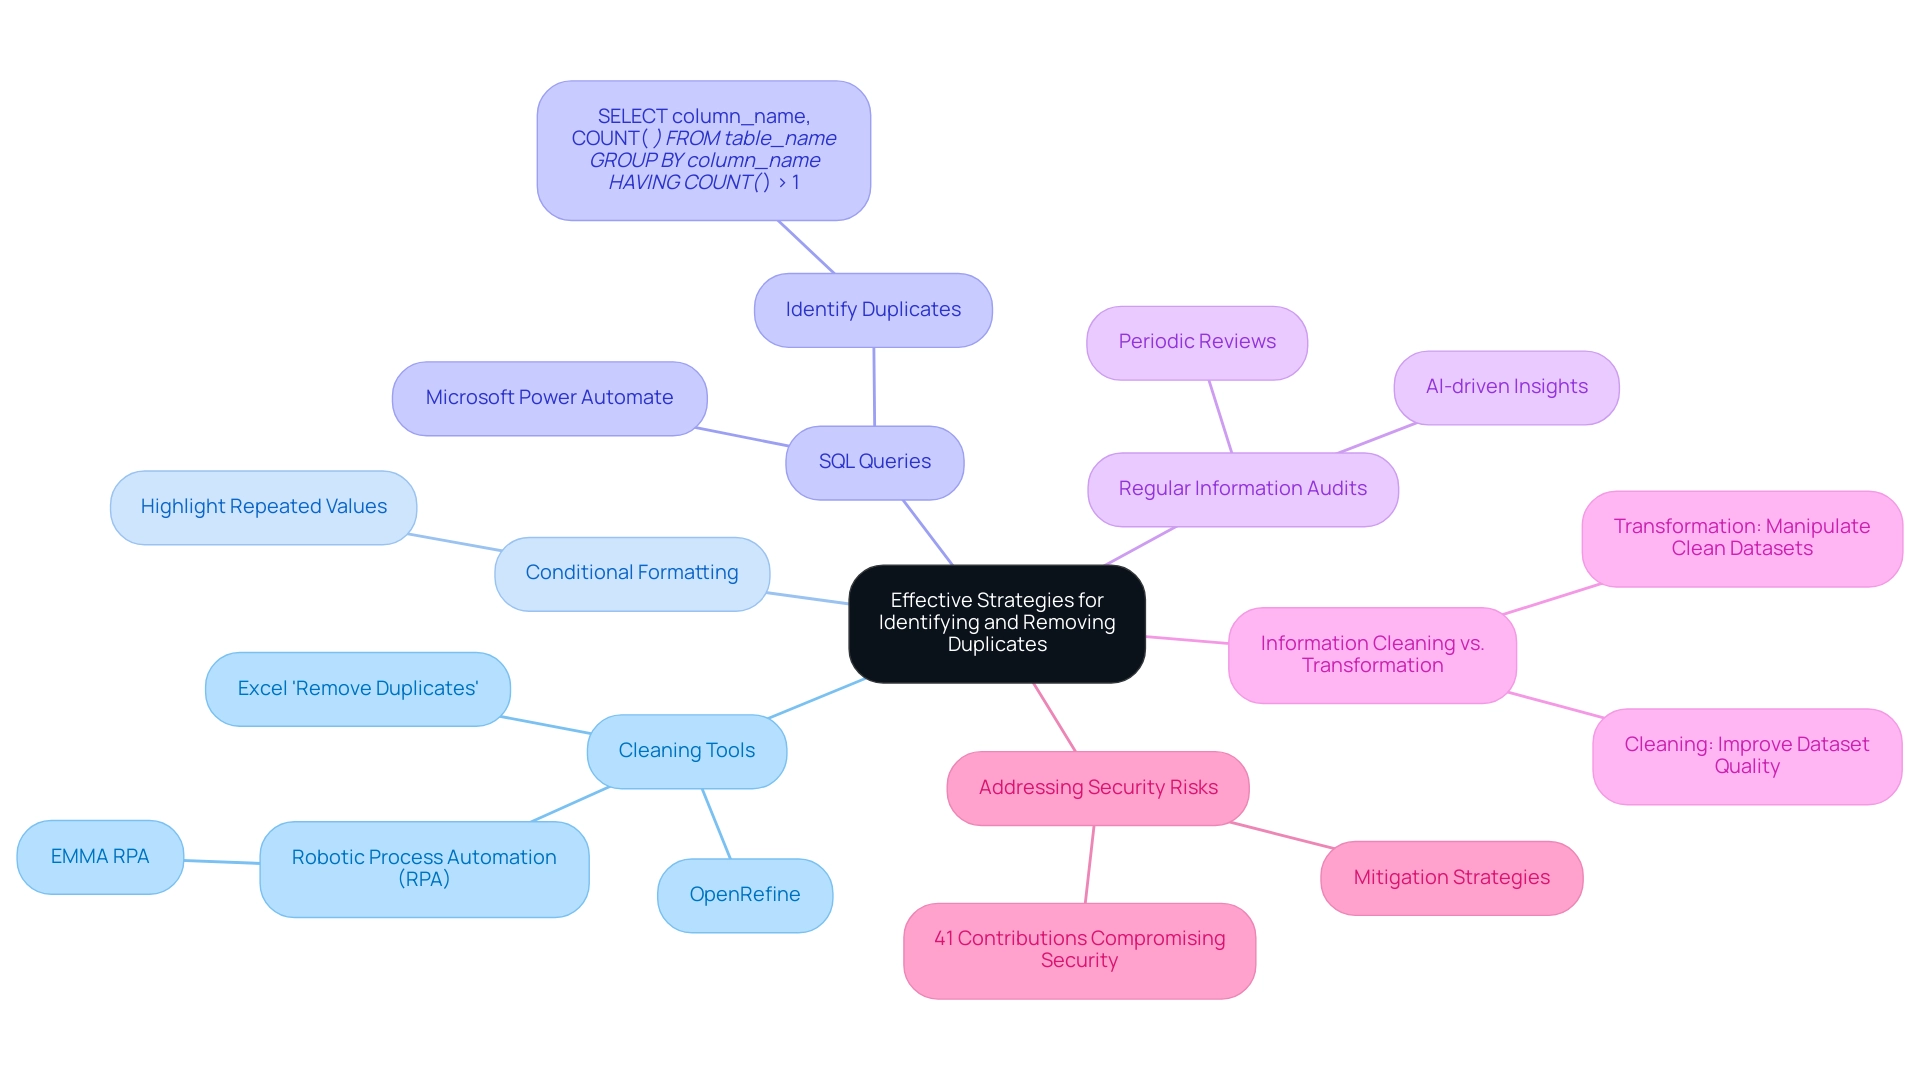
Impact of Duplicate Values on Data Relationships and Operational Efficiency
Unresolved repeated values signal that a relationship cannot be established due to duplicate entries, which can significantly undermine information relationships and overall operational effectiveness across organizations. A critical consequence is erroneous reporting, where repeated data inflates metrics and produces misleading reports, ultimately distorting decision-making processes. As industry experts emphasize, the ramifications of inaccurate reporting extend beyond misguided strategies to missed opportunities, adversely affecting the organization’s bottom line.
A striking example of the necessity for information integrity is the €1.2 billion fine levied against Meta Ireland for privacy violations, highlighting the severe repercussions of inadequate management. Additionally, the presence of duplicate records can lead to increased operational costs; many firms overlook these inefficiencies, often facing unnecessary record reconciliation efforts that waste time and resources. Implementing Robotic Process Automation (RPA) can streamline these tasks, enhancing efficiency, minimizing errors, and freeing up resources for more strategic initiatives.
Moreover, compromised information integrity emerges as a pressing concern; since relationships cannot be formed with duplicate values, trust in the data diminishes, leading to hesitance in utilizing insights derived from this information. As Kyra O’Reilly aptly states,
Duplicate invoices in some cases can be potentially fraudulent, so this contributes towards your duties to fraud prevention.
Recognizing the various sources of duplication, such as human error or automated processes, enables organizations to devise effective strategies to ensure that relationships cannot be formed with duplicate values, thereby managing their information more efficiently.
For instance, information duplication may occur from saving multiple versions of files or unforeseen incidents like power outages during backup operations. By leveraging Business Intelligence tools alongside RPA, organizations can prioritize data cleaning and oversight practices, ensuring the uniqueness of entries and ultimately safeguarding the integrity and reliability of operational insights. Furthermore, customized AI solutions can enhance these processes by providing targeted technologies that address specific business challenges, thereby improving overall operational efficiency.
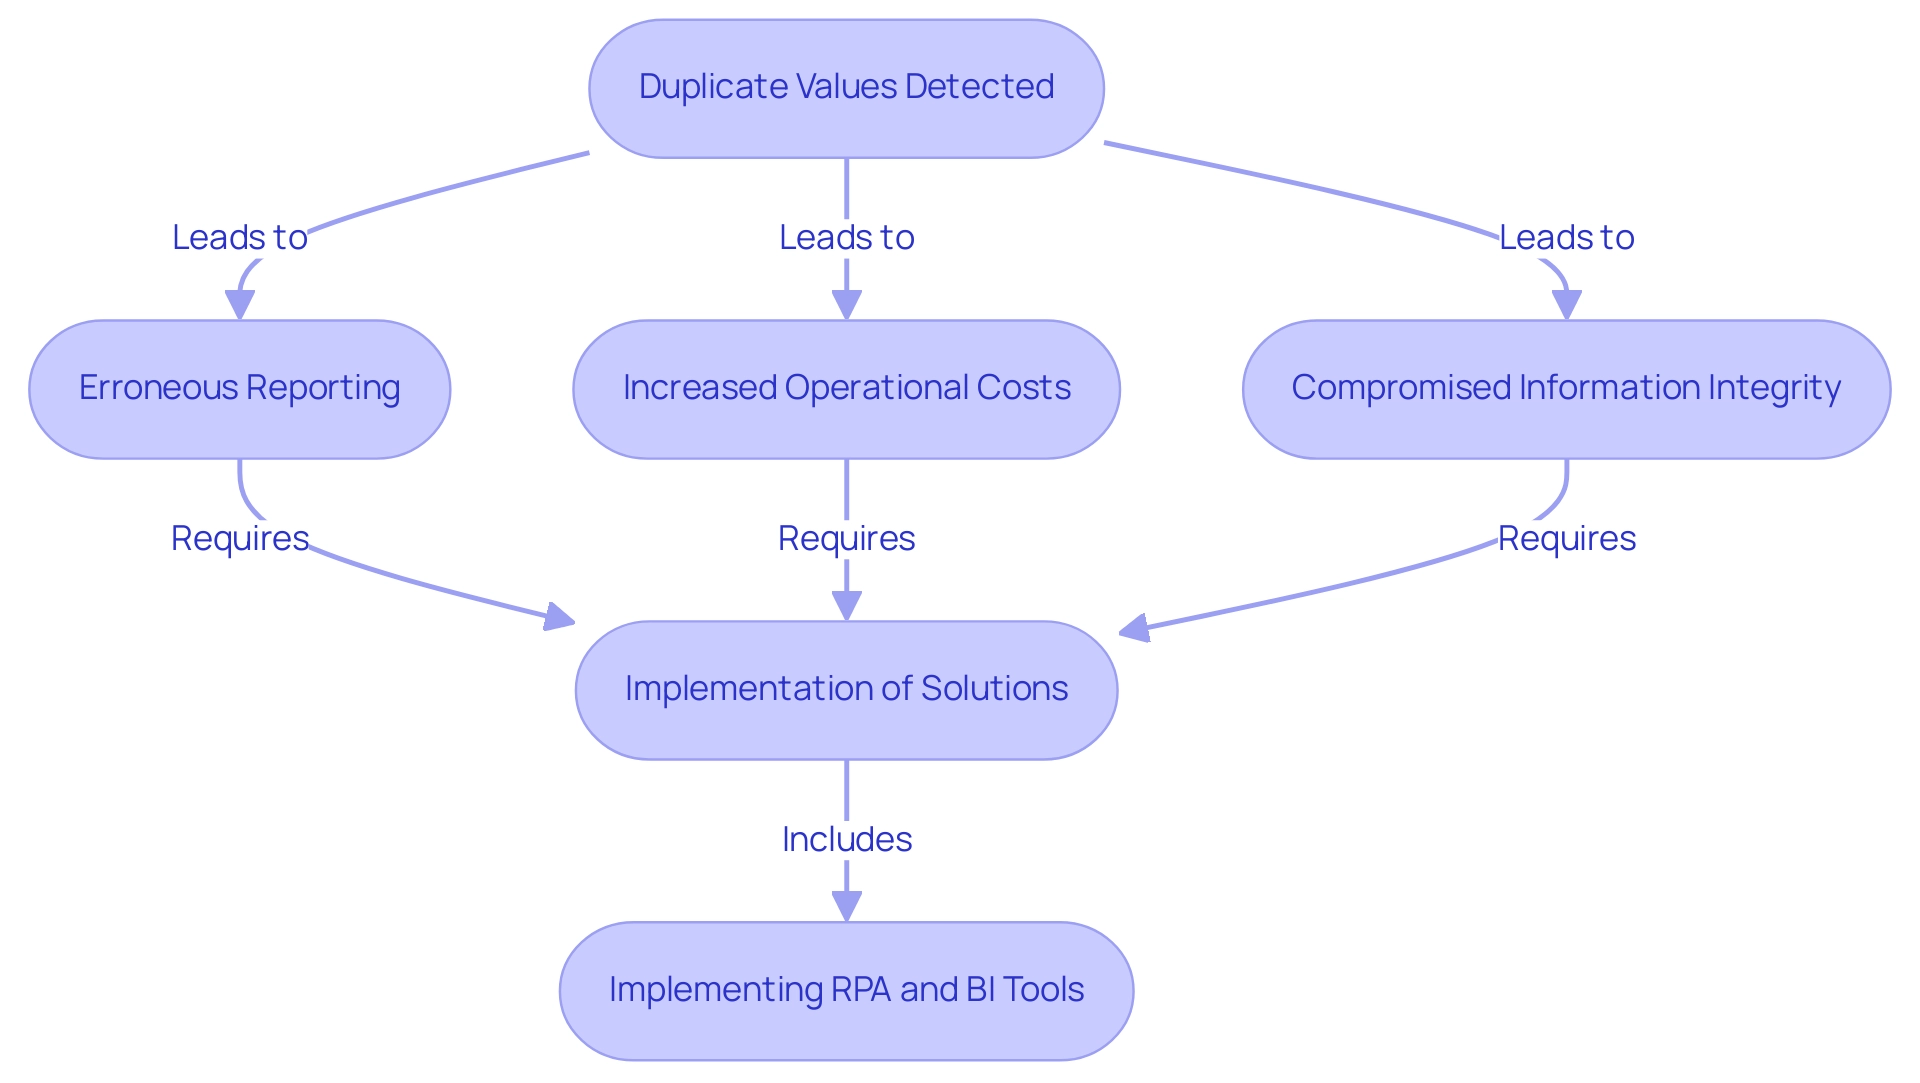
Best Practices for Creating Relationships in Data Management
To establish robust relationships within information management systems, organizations should implement the following best practices:
-
Establish Unique Identifiers: Each table must have a unique identifier to prevent the creation of duplicate values. This is vital, as one URI should correspond to no more than one entity globally, facilitating seamless integration. Universally unique identifiers (UUIDs) are a common method for generating these unique dataset identifiers, although they can be cumbersome to use.
-
Regular Data Maintenance: Routine checks and maintenance are essential to prevent the creation of duplicate values before they disrupt relational integrity. Statistics indicate that organizations prioritizing regular information maintenance reduce issues related to information by up to 30%. By implementing a proactive information maintenance strategy, organizations can avoid costly disruptions and enhance operational efficiency, aided by Robotic Process Automation (RPA) to automate these routine tasks.
-
Information Standardization: Standardizing entry processes minimizes variations that can result in redundancies. Consistent naming conventions and formats across datasets are vital in maintaining quality. Leveraging Business Intelligence tools can aid in monitoring these standards and ensuring compliance across the board.
-
Utilize Information Validation Rules: Implementing validation rules in entry systems is an effective measure to ensure that the creation of duplicate values is avoided. As pointed out by Simson Garfinkel, > It’s easy to create a unique identifier, but it’s challenging to choose one that individuals appreciate using, emphasizing the significance of careful identifier selection.
Alongside these practices, organizations can benefit from customized AI solutions that examine patterns and automate intricate decision-making activities. These solutions can enhance information handling by offering insights that promote operational efficiency and informed decisions.
A notable example of effective information oversight practices can be observed in the case study of UXCam, which offers tools for session replay, heatmaps, and user journey analysis. By leveraging these insights through Business Intelligence, product teams can identify user frustrations and optimize their onboarding methods, ultimately enhancing user experience and improving feature adoption. Moreover, UXCam’s integration of RPA in their data management workflows demonstrates how automation can streamline processes, further mitigating technology implementation challenges.
By adhering to these best practices and incorporating tailored AI solutions, organizations can significantly enhance their data management capabilities and ensure the integrity of their data relationships, ultimately driving efficiency and informed decision-making in a rapidly evolving AI landscape.
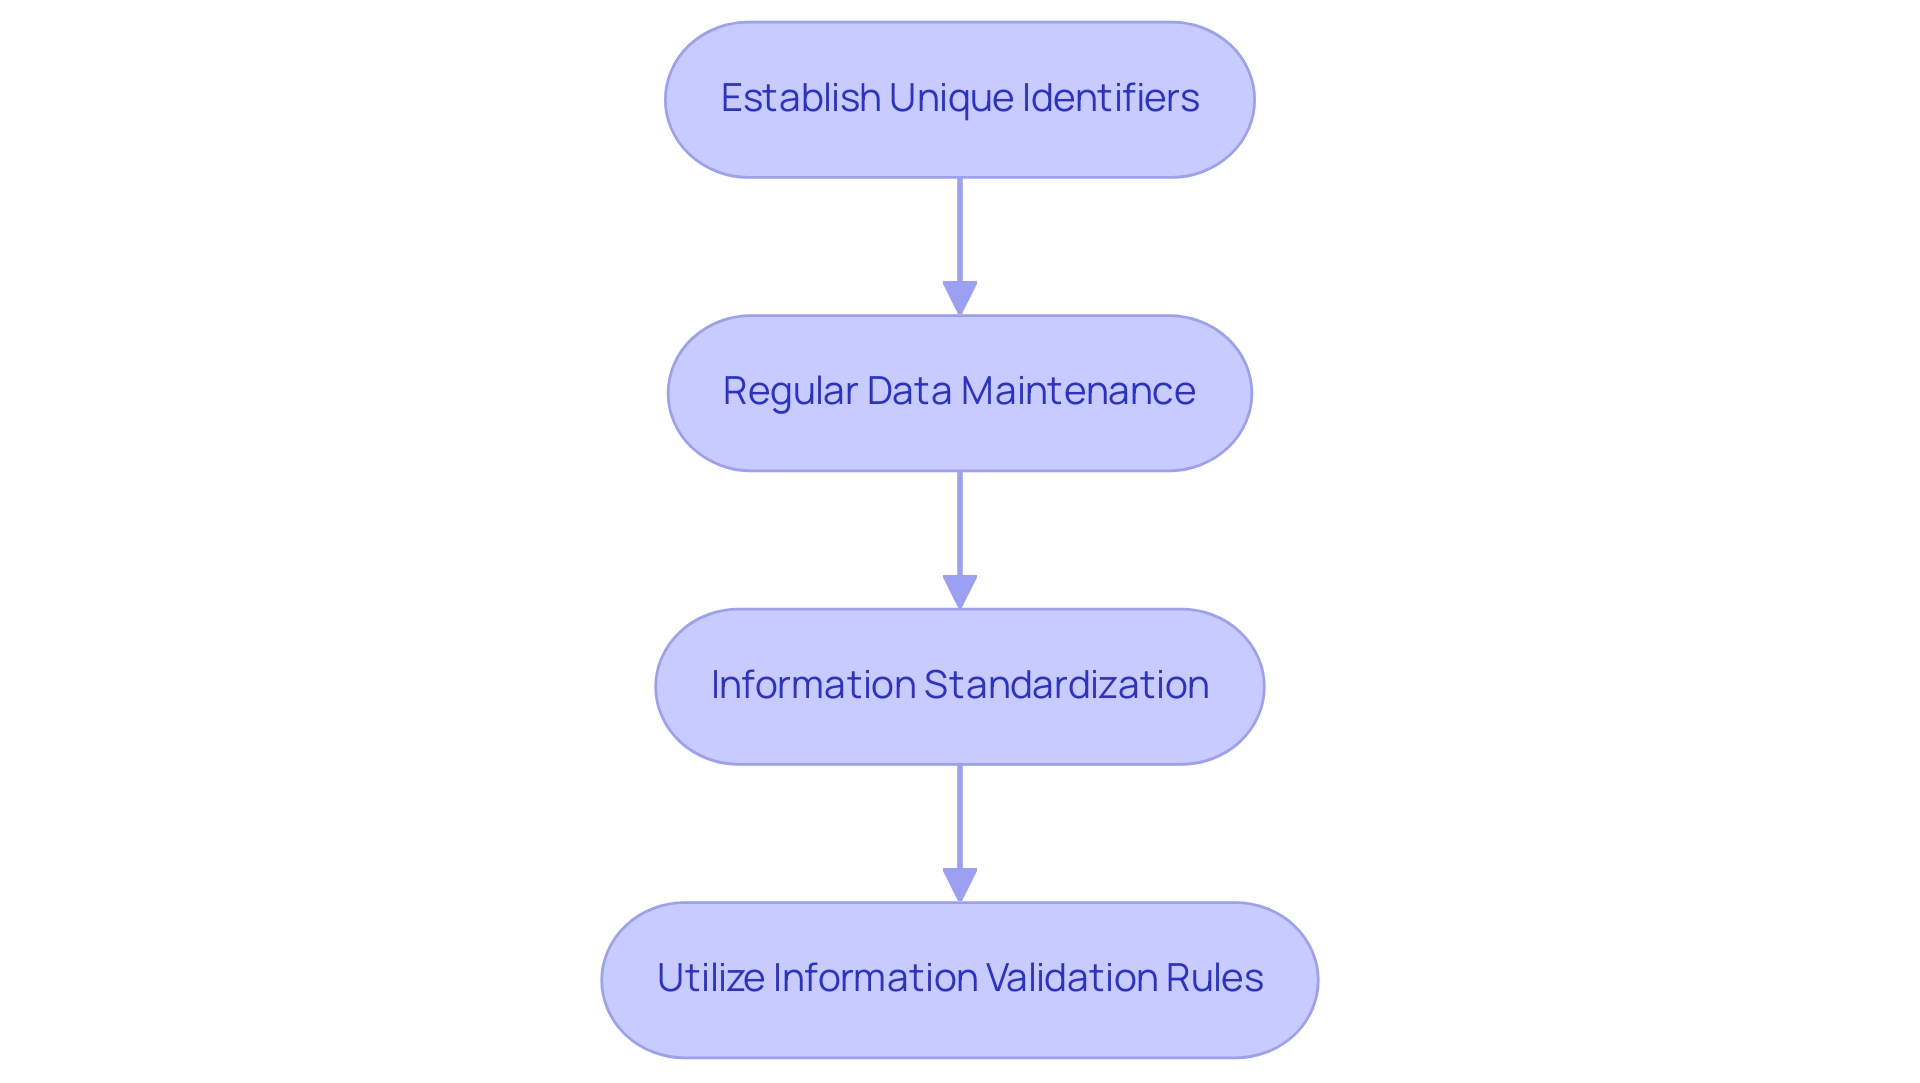
Conclusion
Duplicate values in data management pose a significant challenge that organizations cannot afford to ignore. The complexities surrounding these duplicates—stemming from causes such as manual entry errors and system integration issues—underscore the necessity for proactive measures. Implementing effective strategies for identifying and removing duplicates enhances data integrity, streamlines operations, and prevents costly inaccuracies in reporting.
Establishing best practices like maintaining unique identifiers, conducting regular data audits, and leveraging data cleaning tools are essential steps toward achieving a reliable data management system. Furthermore, integrating Robotic Process Automation (RPA) and tailored AI solutions can bolster these efforts, automating routine tasks and improving the overall quality of data handling.
Ultimately, the commitment to addressing duplicate values safeguards the integrity of data relationships and empowers organizations to harness the full potential of their data-driven insights. By prioritizing data quality and adopting a structured approach to data management, organizations can effectively navigate the complexities of the digital landscape, paving the way for informed decision-making and sustainable growth.
Overview
Effective report design in Power BI is crucial for enhancing clarity and facilitating user engagement. Well-structured visual headers play a pivotal role by providing context and guiding interactions with the data. By incorporating clear titles, interactive icons, and tooltips, organizations can significantly improve information comprehension. This approach not only supports actionable decision-making but also fosters a more insightful and efficient reporting experience.
Are you maximizing the potential of your reports? Consider these strategies to elevate your data presentation.
Introduction
In the realm of data visualization, the significance of visual headers in Power BI reports is paramount. These headers act as navigational beacons that enhance clarity and comprehension, guiding users through a sea of information while addressing common challenges such as time-consuming report creation and data inconsistencies. As organizations strive to make data-driven decisions, effective visual headers play a crucial role in facilitating user engagement and ensuring critical insights are readily accessible.
With the right design elements—titles, interactive icons, and tooltips—users can seamlessly interact with the data, leading to a more insightful reporting experience. This article delves into the essential components of visual headers, identifies common pitfalls to avoid, and presents strategies for continuous improvement. Ultimately, it empowers organizations to leverage Power BI for enhanced operational efficiency and informed decision-making.
1. The Significance of Visual Headers in Power BI Reports
Visual titles are essential for enhancing clarity in Power BI reports, particularly in addressing common challenges such as prolonged report creation and inconsistencies due to a lack of governance strategy. By providing context and organizing information, they help stakeholders grasp key insights, effectively resolving the issue of accessing information without clear guidance on subsequent actions. This clarity is crucial in data-rich environments, significantly influencing decision-making, such as identifying outliers, including vehicles sold for over 180 thousand Reais.
Furthermore, visual titles facilitate interaction by indicating how to engage with the visuals, whether through filtering information or drilling down for deeper analysis, thereby enhancing actionable guidance. Douglas Rocha, a data science enthusiast, underscores the platform’s versatility, stating, “You can perform statistics in Power BI without DAX,” which emphasizes the importance of well-structured titles in fostering interaction. An appealing title not only clarifies information but also enhances the overall aesthetics of the reports.
For example, the case study titled ‘Dynamic Visuals Based on Slicer Selections‘ demonstrates how dynamic visuals in Power BI can adapt to user input, thereby improving report interactivity. As a result, effective visual headers in Power BI boost user engagement and contribute to a more interactive and insightful reporting experience, ultimately enabling better evidence-based decisions while leveraging the advantages of comprehensive management and seamless information integration. By implementing a robust governance strategy, organizations can further reduce inconsistencies, ensuring that insights derived from Power BI dashboards are both reliable and actionable.
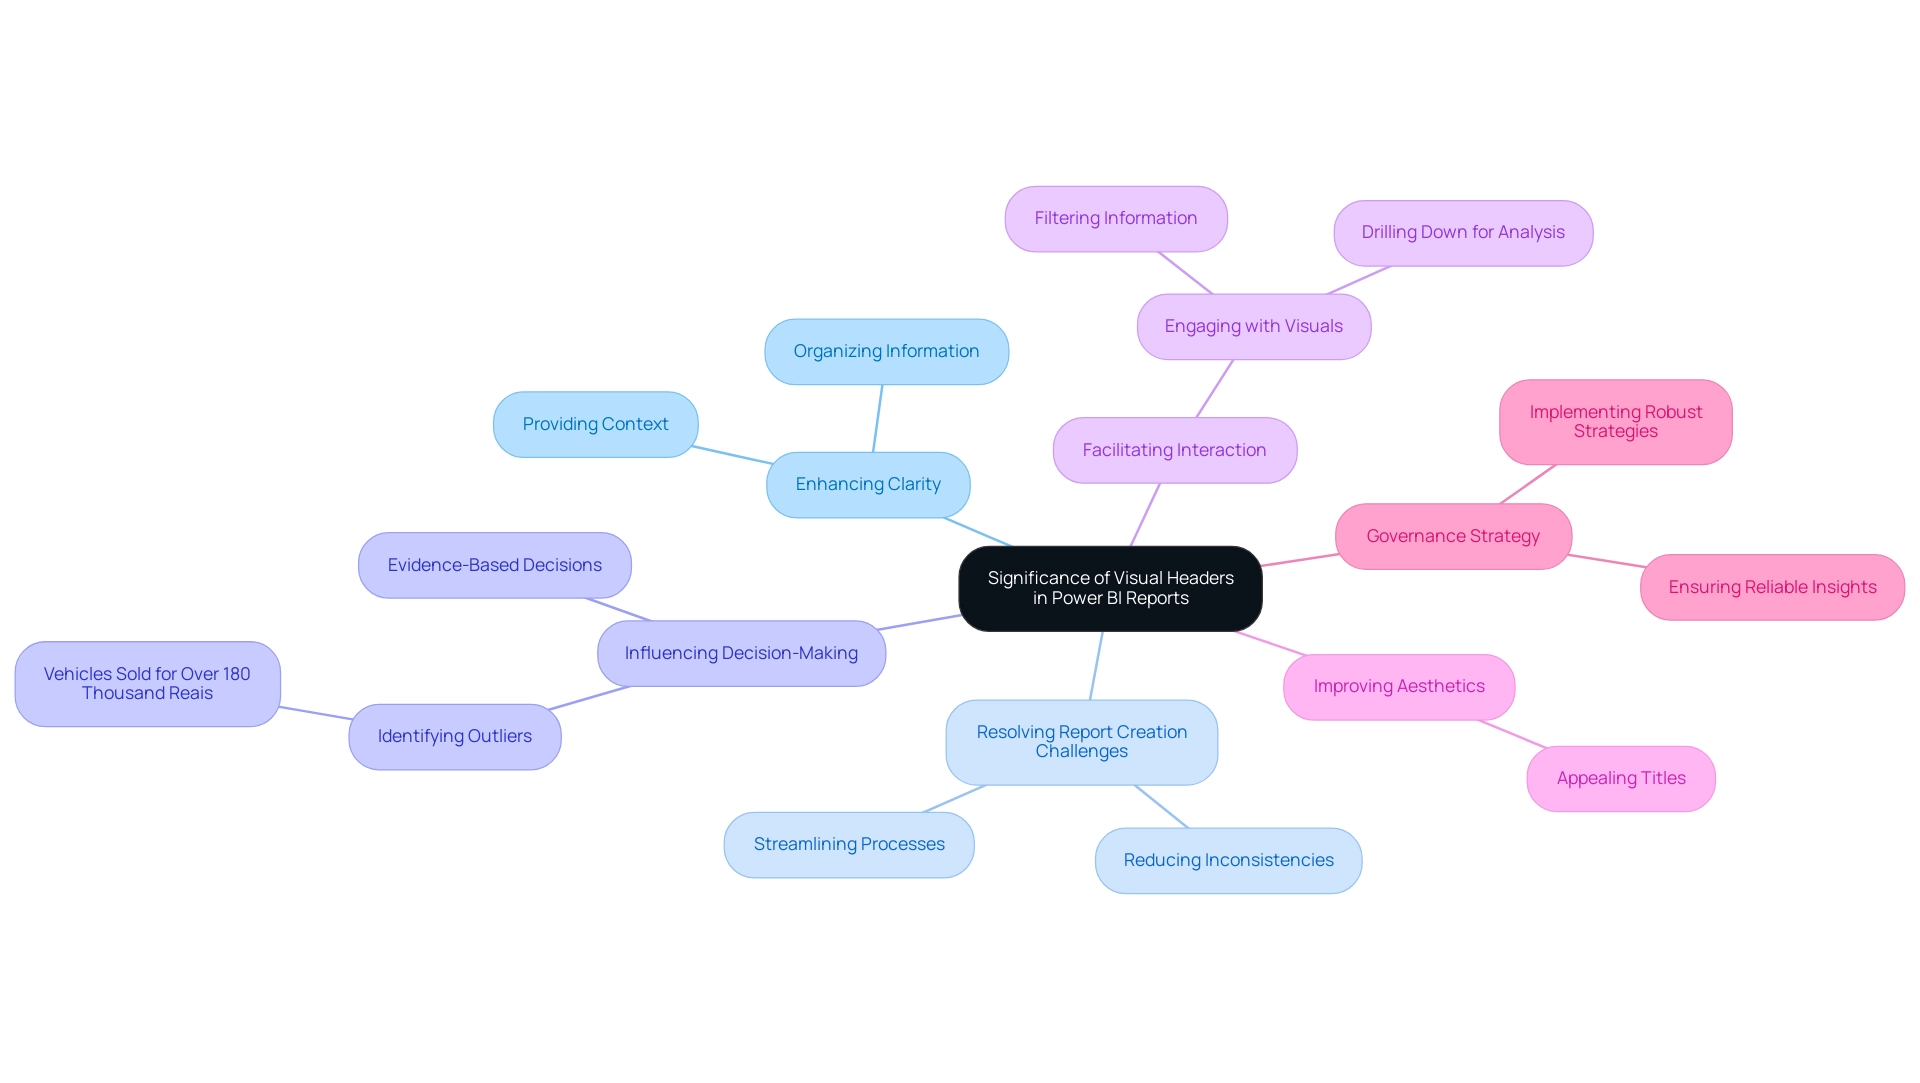
2. Key Components of Effective Visual Headers
-
Title: Clearly articulating what the visual represents is essential. A well-defined title in the visual header of Power BI sets the context and guides the viewer’s understanding, ensuring they grasp the purpose of the visual at a glance. As Kelsey Miller states, “Information is playing an increasingly important role in the marketplace today, and information literacy is the first step in understanding how analytics can be utilized in business.” This highlights the effectiveness of the visual header in enhancing information literacy.
-
Interactive Icons: Incorporating icons that facilitate actions such as filtering, exporting, or drilling down enriches the report’s interactivity. These icons empower individuals to engage directly with the data, making navigation intuitive and seamless. Considering that 91% of consumers prefer visuals over plain text, these interactive components are crucial for improving experience and operational efficiency, especially when combined with Power BI’s streamlined reporting features.
-
Tooltips: Effective tooltips provide valuable context by offering additional information when users hover over specific elements. This feature enhances the overall experience, allowing for deeper insights without cluttering the visual. The case study titled ‘The Essential Nature of Visual Content’ illustrates that frequent use of visual content is vital for effective marketing strategies, underscoring the significance of tooltips in design, particularly in addressing inconsistencies in dashboards.
-
Formatting Options: Allowing users to customize their view—such as altering colors or layouts—fosters a more personalized interaction with the report. Flexibility in formatting, including the incorporation of a visual header in Power BI, caters to individual preferences and enhances overall comprehension, aligning with the increasing demand for literacy in today’s marketplace. This adaptability is key to maximizing the utility of Power BI’s reporting tools, ensuring informed decision-making that drives growth and innovation.
-
General Management App: The General Management App plays a pivotal role in enhancing information management and reporting. It provides extensive management tools and intelligent reviews, enabling users to make informed choices based on consistent analysis.
-
RPA Solutions: Integrating RPA solutions can significantly boost operational efficiency by automating repetitive tasks and addressing challenges related to data extraction and reporting. This synergy between RPA and Power BI enhances the ability to leverage insights effectively, driving business growth.
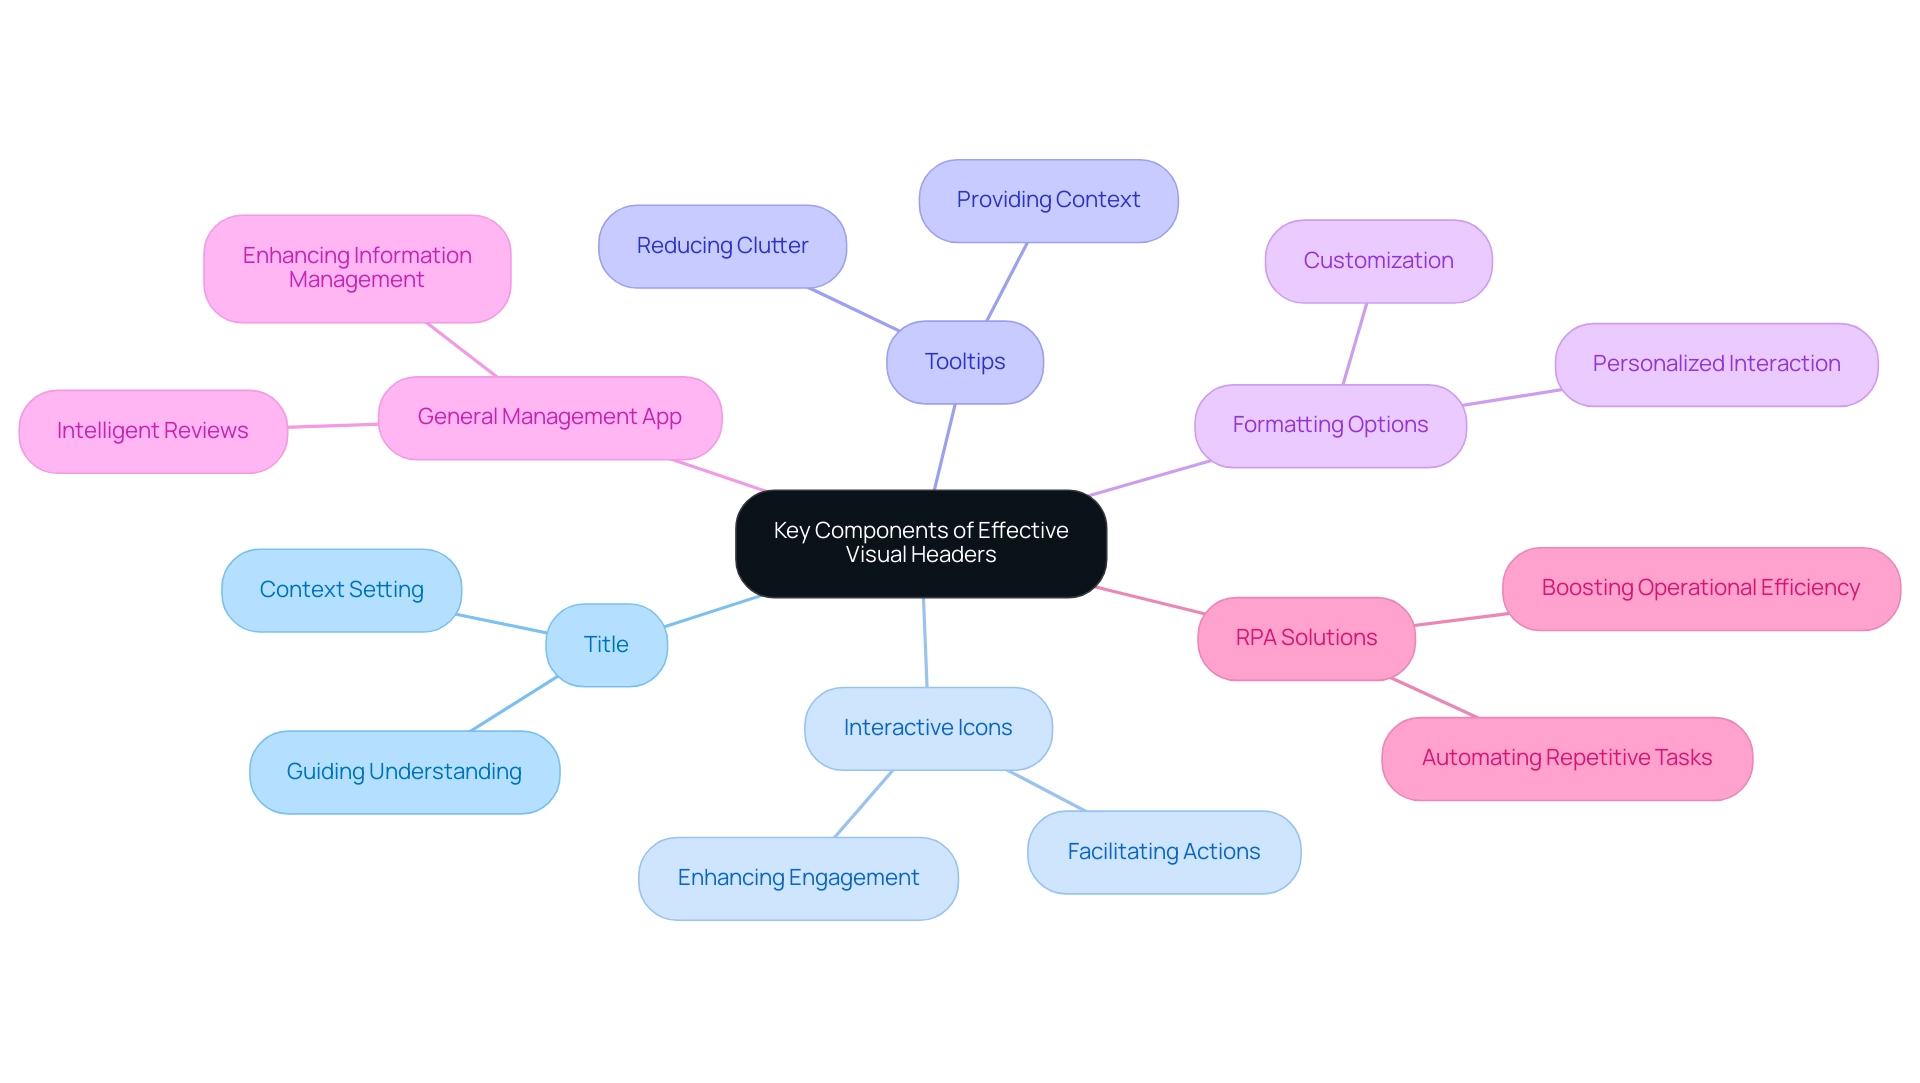
3. Step-by-Step Guide to Designing Visual Headers
-
Define the Purpose: Begin by clarifying the information your visual title must convey, ensuring alignment with your operational efficiency goals. A well-defined purpose serves as a guiding element, directing attention to key insights that can drive data-driven decisions. With 39% of Americans regularly forgetting basic details in their daily lives, clarity in the visual header of Power BI becomes crucial for aiding memory and comprehension, ultimately supporting your operational strategies powered by Robotic Process Automation (RPA). RPA not only streamlines these processes but also significantly reduces errors, allowing your team to focus on more strategic, value-adding work.
-
Choose the Right Components: Select titles, icons, and tooltips that effectively cater to needs. Components should be intuitive and relevant, facilitating a seamless experience that enhances information interpretation and operational efficiency. Consider the context in which the data will be viewed to enrich comprehension and engagement, particularly in a landscape where leveraging RPA can lead to significant improvements in productivity and resource management. By automating repetitive tasks, RPA alleviates the burden on your team, enabling them to concentrate on high-impact initiatives.
-
Design for Clarity: Utilize clear fonts and color schemes that enhance readability. A clean design not only improves visual appeal but also aids in quick information retrieval, which is critical when managing automated workflows. Strive for a balance between aesthetic elements and functional clarity in the visual header of Power BI to ensure individuals can easily navigate the content. As Adrian G. states, ‘If you’re looking for improvements to your CRO campaigns, this tool is for you,’ underscoring the importance of effective tools in operational efficiency, particularly when powered by Business Intelligence and RPA.
-
Test with Users: Solicit feedback from users regarding the title’s effectiveness. Conduct usability testing to gather insights on how well the top section communicates its intended message. Be prepared to make adjustments based on this feedback to refine the design further, ensuring it effectively meets your audience’s needs. Additionally, consider the case study on cleaning and validating data; ensuring data precision is essential for deriving correct conclusions in documents, highlighting the necessity for effective visual labels that aid strategic decision-making and operational growth. Addressing the challenges posed by manual, repetitive tasks is vital for maximizing the benefits of RPA in your organization.
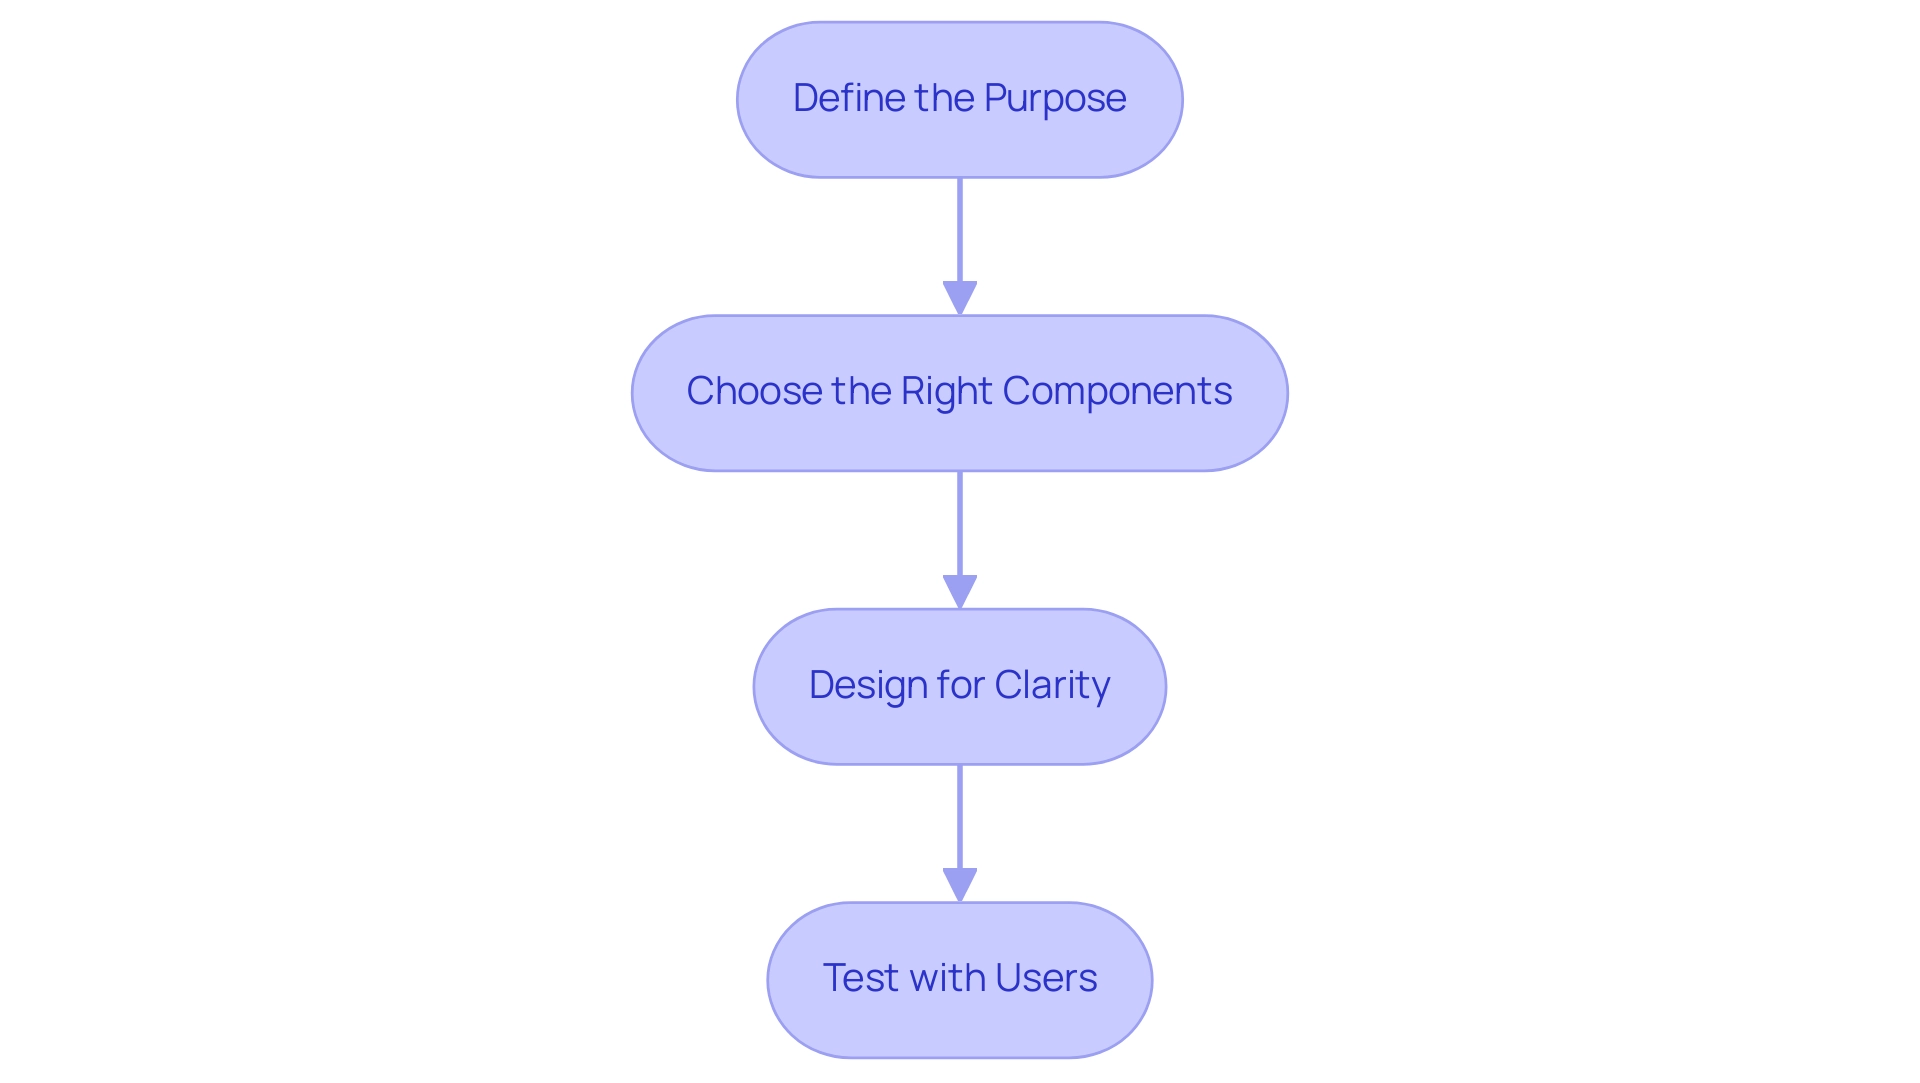
4. Common Mistakes in Visual Header Design and How to Avoid Them
-
Overcrowding: Avoid cramming excessive information into the visual header of your Power BI reports. Overcrowding can significantly hinder user comprehension; studies indicate that users may overlook up to 70% of critical information in cluttered interfaces. A streamlined approach enhances readability and fosters effective data interpretation. This is particularly vital in the context of time-consuming document creation, where clarity is essential for facilitating actionable insights. As Bojan Janjanin, a recognized authority in design, asserts,
A healthy principle is to use colors sparingly—this principle applies equally to written content in titles. Employing relatable language instead of jargon can further enhance audience engagement and understanding, making it easier for Directors of Operations Efficiency to grasp the insights presented. -
Inconsistent Design: Consistency in design is paramount across all visuals within a document. Inconsistent headers can lead to misunderstandings and disrupt the flow of information, especially in documents where inconsistencies arise from a lack of governance strategy. By maintaining a cohesive appearance throughout your Power BI presentations, including a strong visual header, and emphasizing governance strategies, you enhance the experience for individuals and facilitate easier navigation. This principle supports a more intuitive understanding of the data presented and helps mitigate the mistrust that can stem from poorly governed data. Moreover, ensuring that documents provide clear, actionable guidance is crucial for empowering individuals to make informed decisions based on the data.
-
Neglecting Feedback: Regularly soliciting feedback from individuals is vital for identifying areas needing enhancement. Engaging with individuals reveals shared challenges, such as frustrations with ambiguous instructions in documents, and lays the groundwork for continuous improvements. By integrating feedback, you can refine your report titles to better align with their requirements and preferences, ultimately resulting in a more impactful presentation of your data. Furthermore, consider the case study titled
Not Considering the Sticky Navigation UX Issue on Mobile, which illustrates how responsive design can enhance user experience by employing different solutions for varying screen sizes, such as a smaller fixed navigation or a hamburger menu.
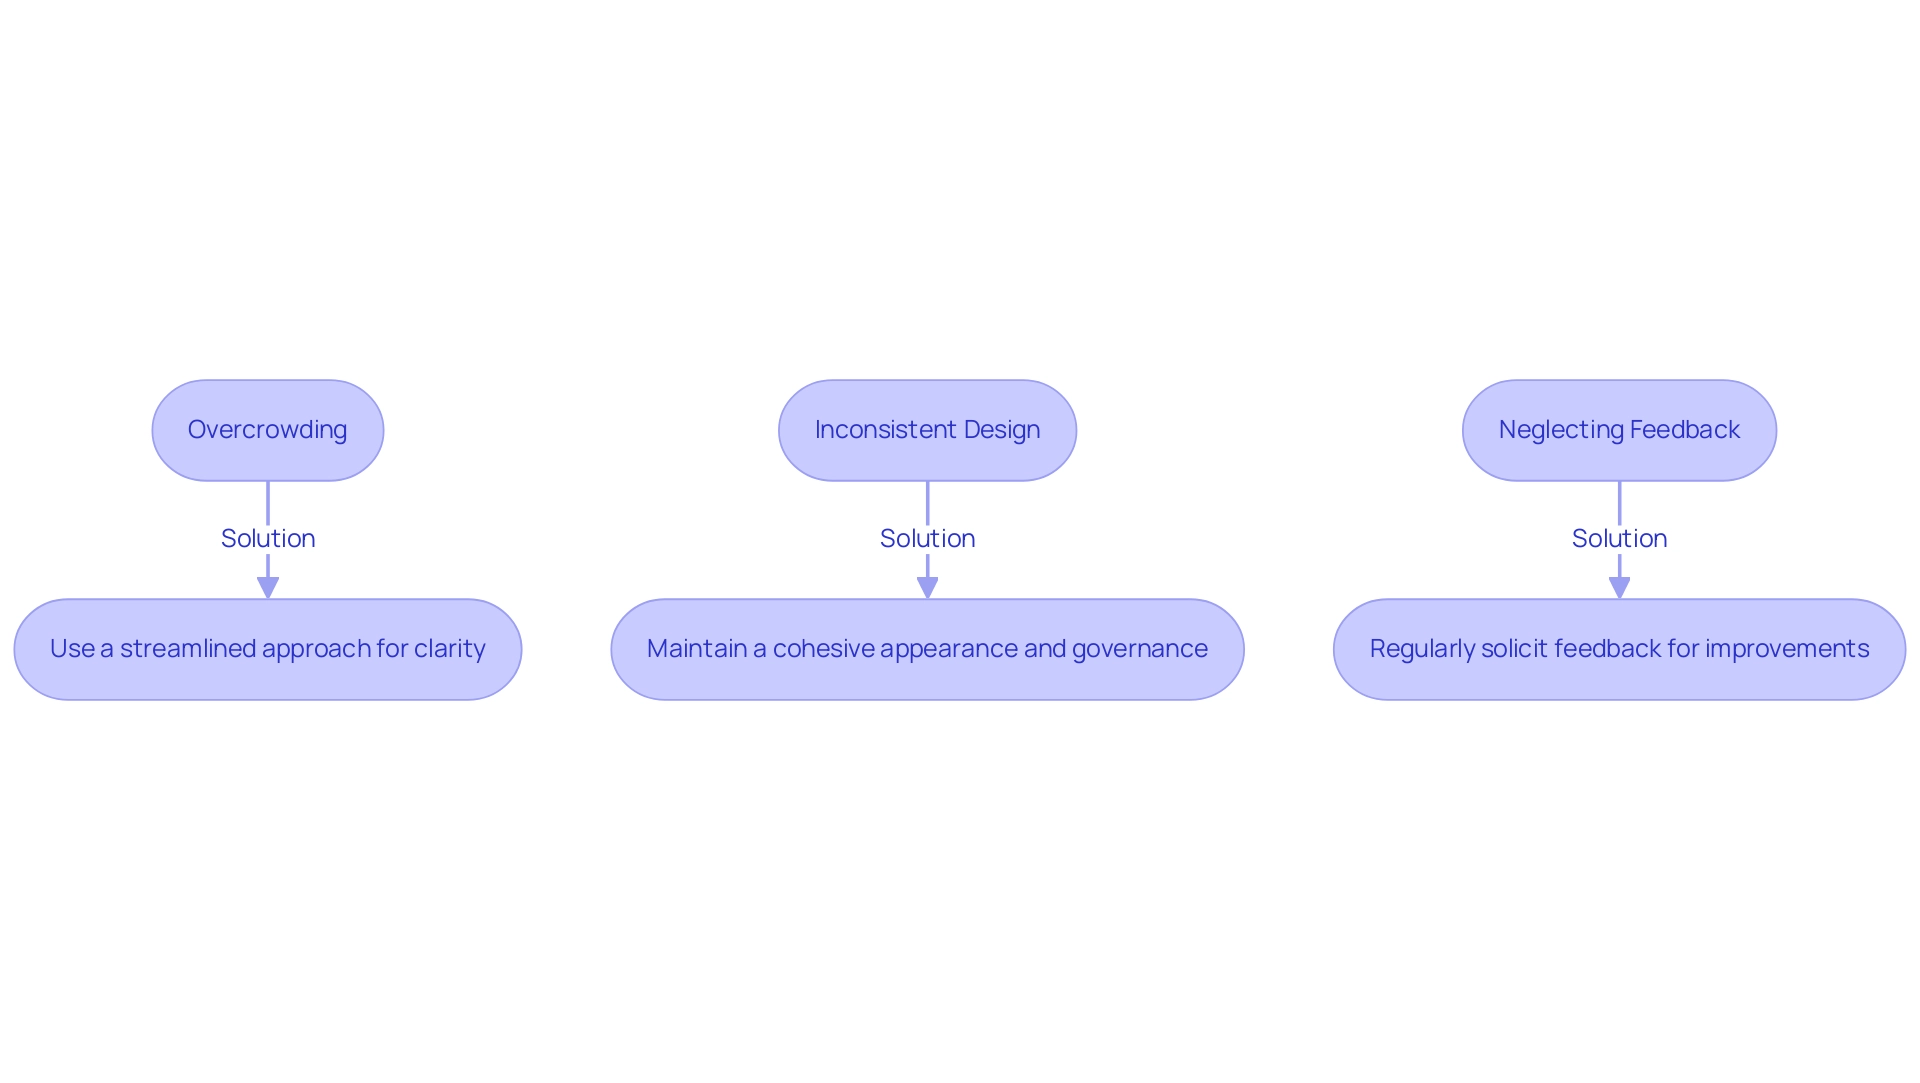
5. Incorporating User Feedback for Continuous Improvement in Header Design
-
Conduct Surveys: Regular surveys are crucial for understanding user experiences and gathering insights on the usability of the visual header in Power BI. Personalized feedback requests significantly enhance engagement and relevance, leading to more thoughtful responses. By customizing these requests, organizations can identify specific enhancements that resonate with users. Moreover, sharing updates about changes made based on client feedback fosters trust and encourages ongoing engagement. This method not only addresses individual needs but also supports the broader objective of leveraging actionable insights from Power BI dashboards to drive operational efficiency. Additionally, implementing a governance strategy ensures data consistency across reports, thereby fostering greater trust in the insights derived, particularly when utilizing visual headers in Power BI.
-
Implement A/B Testing: A/B testing serves as an effective method for evaluating different header designs. By comparing performance metrics, teams can ascertain which styles resonate more with users, ensuring the chosen design maximizes engagement. For example, Spotify reported a 23% increase in active engagement after refining its algorithm based on user suggestions, highlighting the power of audience-driven design. This principle can be effectively applied to the visual headers in Power BI titles, enhancing user engagement while ensuring analyses deliver clear, actionable insights to stakeholders. Integrating RPA solutions can further streamline this process, automating repetitive tasks associated with report generation and allowing teams to concentrate on analysis.
-
Iterate Based on Feedback: Continuous improvement is vital in report design. Utilize the insights gathered from surveys and A/B testing to make informed adjustments to header designs. Sharing updates about changes made based on feedback builds trust and encourages ongoing engagement from users, akin to how Starbucks incorporated customer ideas into their product development, resulting in significant revenue growth. By integrating feedback into the design process, organizations can create more effective and accessible Power BI reports that feature visual headers, ultimately enhancing the ability to derive meaningful insights and address challenges related to data inconsistencies and time-consuming report creation. The combination of user feedback, iterative design, and RPA solutions can significantly elevate the operational efficiency of business intelligence efforts.
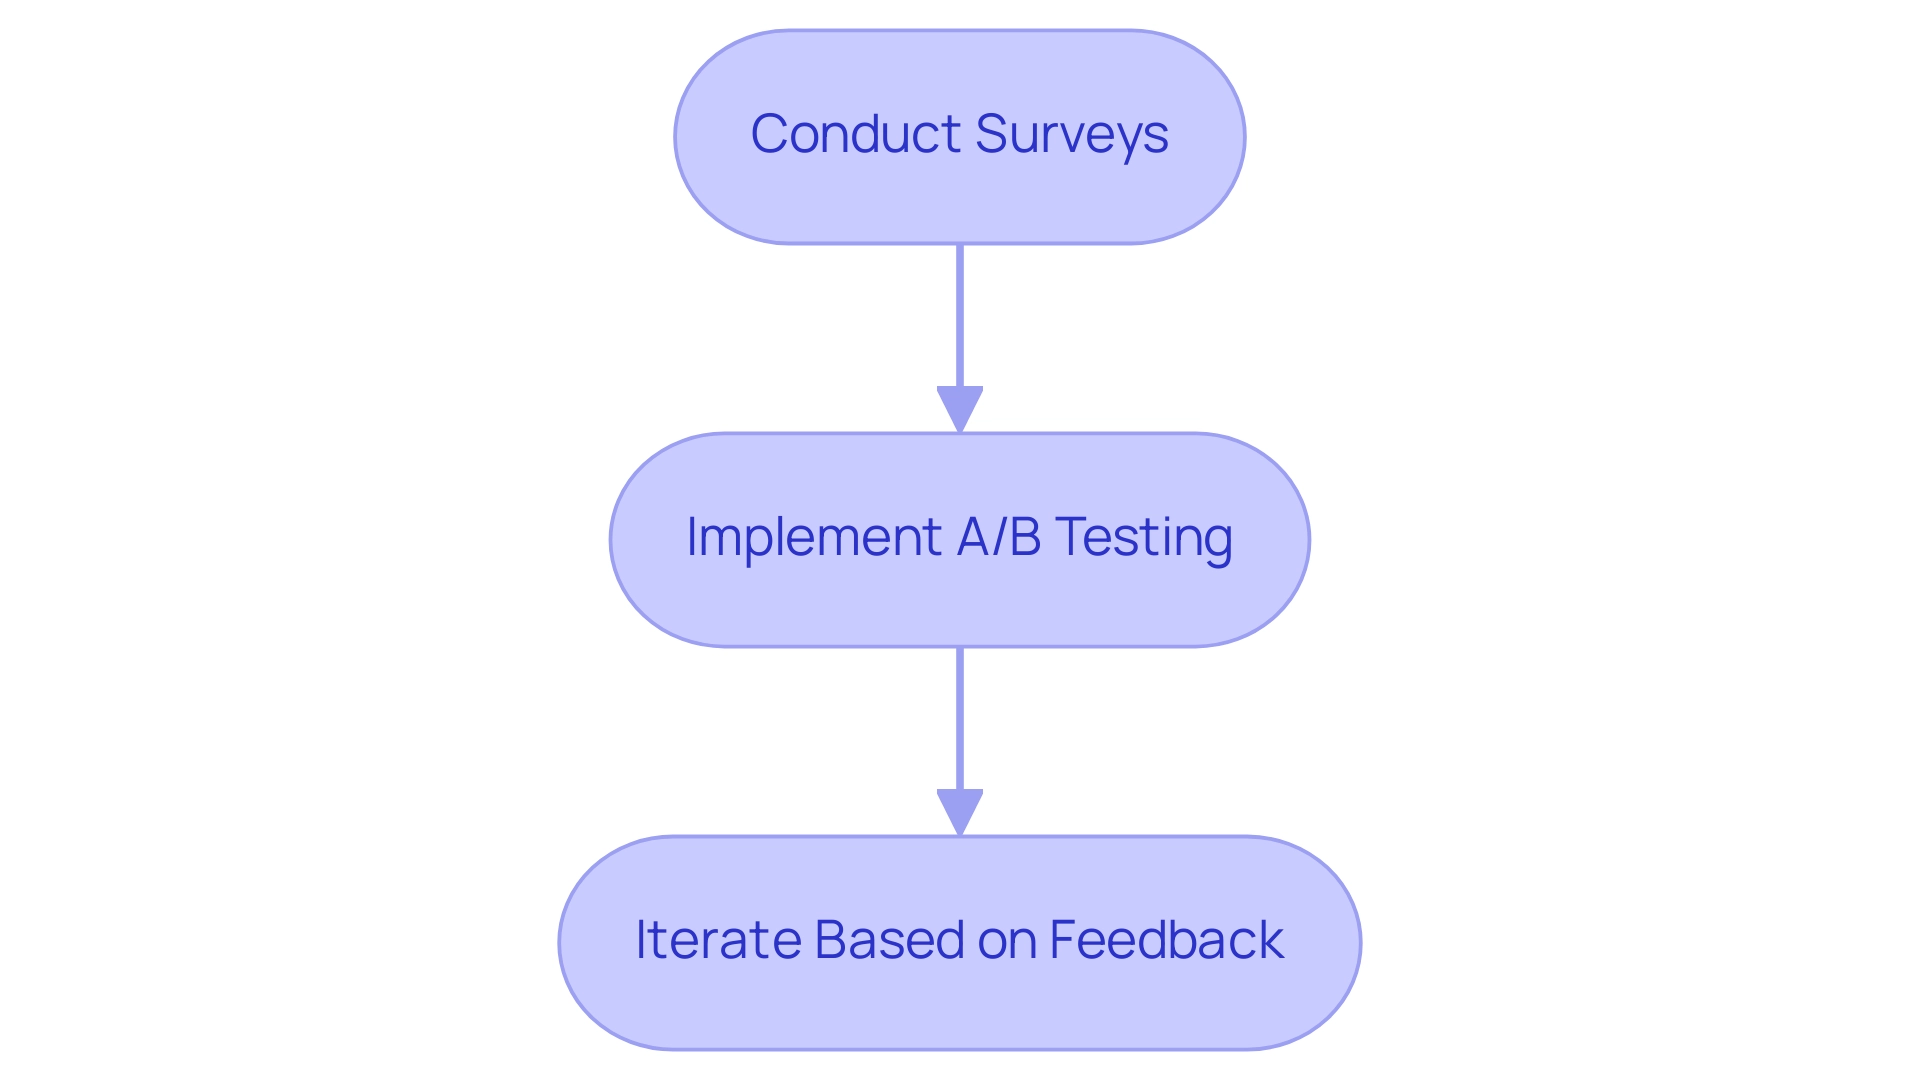
Conclusion
Effective visual headers are integral to optimizing Power BI reports, significantly enhancing user engagement and clarity. By addressing the common challenges of report creation and data inconsistencies, these headers serve as essential navigational tools that guide users toward critical insights. The article outlines the key components of effective visual headers, including:
- Clear titles
- Interactive icons
- Tooltips
- Customizable formatting options
All of these contribute to a more intuitive and informative reporting experience.
Designing visual headers with purpose and clarity is vital for fostering data literacy and ensuring that users can easily interpret and interact with the information presented. Common pitfalls such as overcrowding, inconsistent design, and neglecting user feedback can detract from the effectiveness of these headers. By avoiding these mistakes and focusing on user-centered design, organizations can create reports that not only convey information but also empower users to make informed decisions.
Incorporating user feedback through surveys and A/B testing is crucial for continuous improvement in header design. This iterative approach not only enhances usability but also strengthens the trust users place in the data presented. Ultimately, leveraging effective visual headers in Power BI is a strategic move that can lead to enhanced operational efficiency and more informed decision-making, driving businesses toward greater success in a data-driven world.
