Overview
To connect Azure Databricks to Power BI, it is essential to meet specific prerequisites, such as having an active cloud subscription, configured workspace, and proper access permissions, followed by a step-by-step configuration process. The article outlines these requirements and steps, emphasizing the importance of accurate server settings and authentication methods to ensure a seamless integration that enhances operational efficiency and data reporting capabilities.
Introduction
Establishing a robust connection between Azure Databricks and Power BI is more than just a technical endeavor; it’s a strategic move that can transform data into actionable insights. As organizations increasingly rely on data analytics to drive decision-making, understanding the prerequisites and steps for seamless integration has never been more critical. From setting up the right environment to troubleshooting common issues, this guide provides practical solutions that empower users to navigate the complexities of this integration confidently. By leveraging best practices and exploring tailored approaches, businesses can enhance their operational efficiency and unlock the full potential of their data assets.
Prerequisites for Connecting Azure Databricks to Power BI
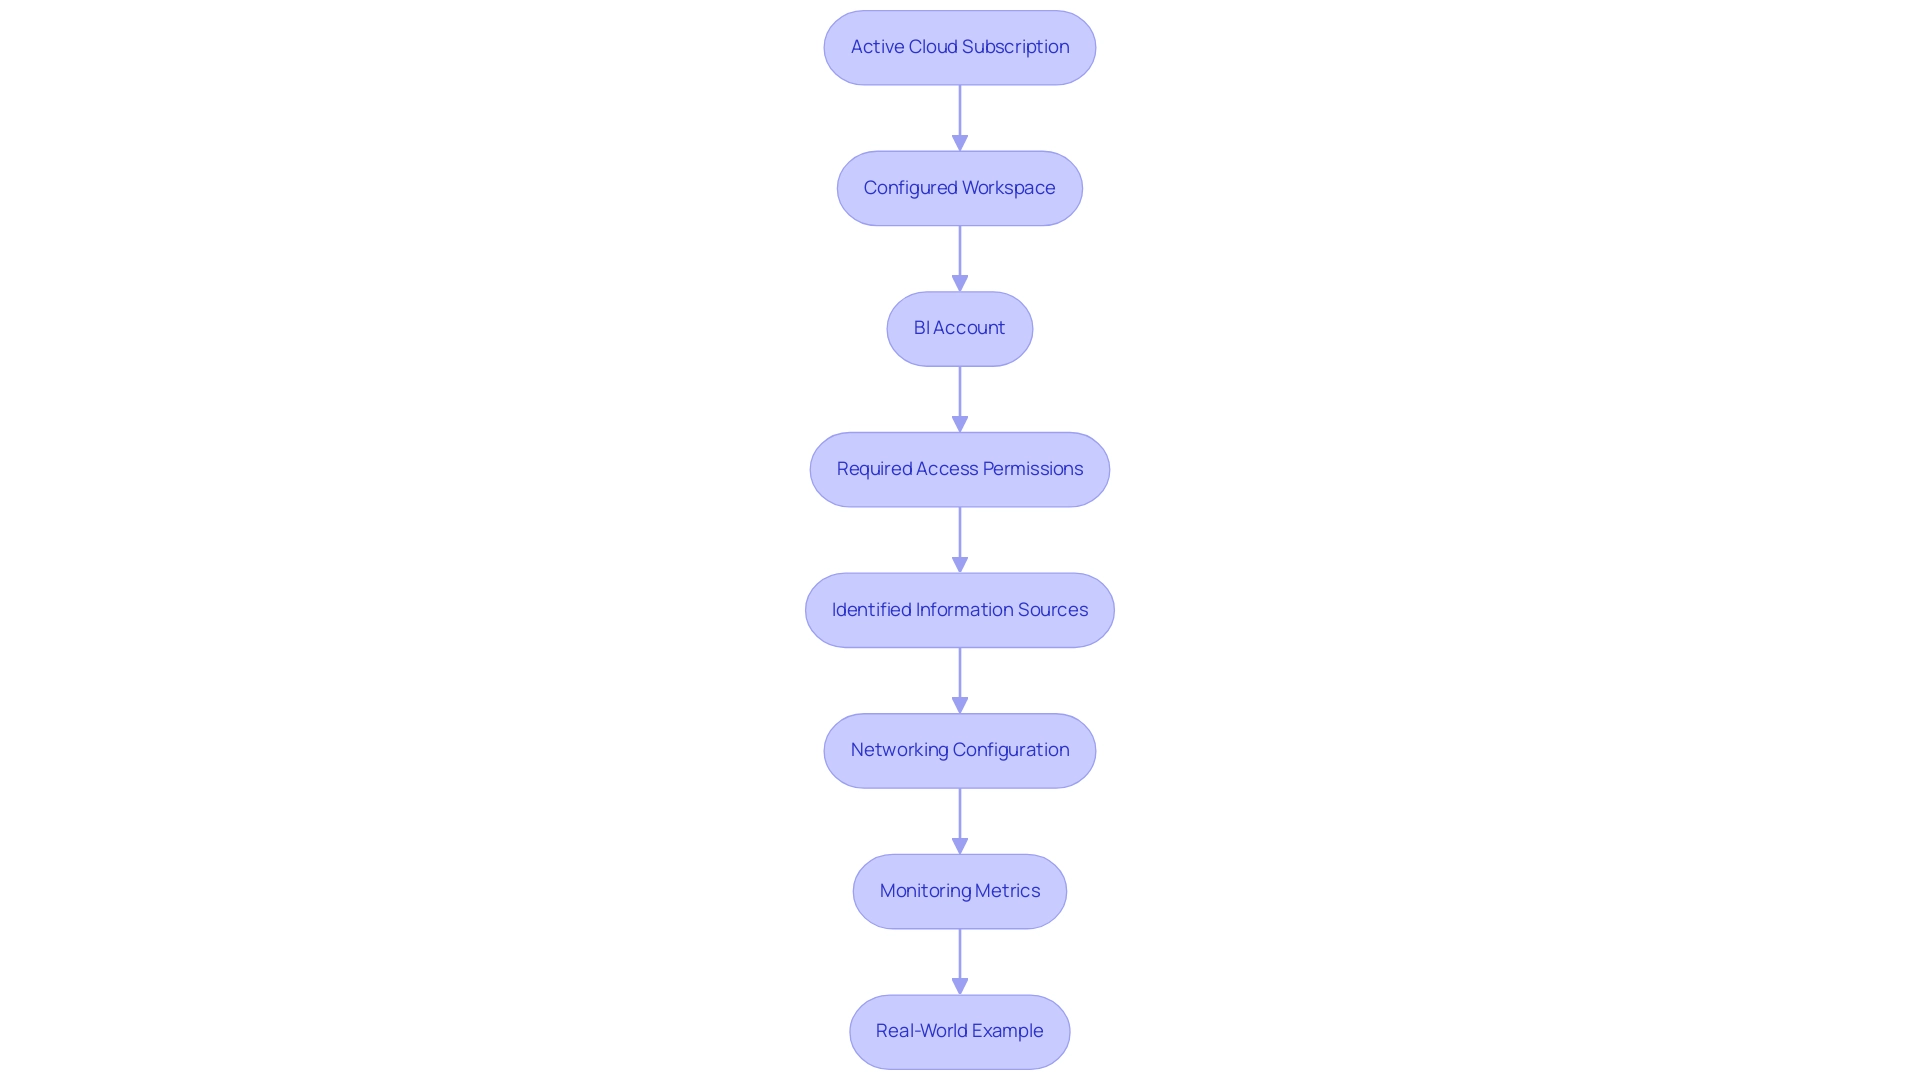
To successfully link the cloud data platform to business intelligence, it is essential to establish the following prerequisites:
- Active Cloud Subscription: A valid account is essential to access both analytics services and BI tools, as this provides the necessary infrastructure for integration.
- Configured Workspace: Establishing a workspace within your cloud environment is essential for efficient information processing and analytics, enabling you to optimize workflows and minimize manual tasks. Implementing Robotic Process Automation (RPA) can further enhance this by automating repetitive tasks, thus increasing efficiency.
- BI Account: A BI account, whether free or Pro, is necessary to create reports and dashboards that illustrate your information, converting it into actionable insights.
- Required Access Permissions: Ensure that you have the necessary permissions in both Power BI and the cloud analytics platform to establish connections and retrieve information without any hindrances.
- Identified Information Sources: Clearly define the information sources you wish to connect to Azure Databricks Power BI, as this determination will guide your configuration settings and integration approach, thereby minimizing inconsistencies across reports. Addressing potential data inconsistencies early on is crucial for maintaining trust in your reports.
-
Networking Configuration: If your workspace is located within a virtual network, confirm that Azure Databricks Power BI can access it. This may necessitate specific networking settings to facilitate seamless connectivity.
-
Monitoring Metrics: According to Kranthi Pakala, tracking usage statistics from the cloud analytics platform is essential. The compute may be or have been in an unhealthy state, affecting metrics availability. Therefore, ensuring that your system is healthy before integration with Azure Databricks Power BI is crucial, as this can help prevent confusion and mistrust in the information presented.
- Real-World Example: A case study on cloud analytics platform Cluster Usage Metrics illustrates the importance of tracking CPU, Memory, Network, and Throughput usage. This tracking can help identify potential issues and ensure that the integration process runs smoothly, leading to enhanced operational efficiency. Additionally, integrating RPA can streamline this monitoring process, further alleviating the burden of manual oversight.
By validating these prerequisites, you will pave the way for a more efficient and effective integration process, minimizing potential disruptions and maximizing your operational efficiency.
Step-by-Step Guide to Configure Azure Databricks Connection in Power BI
Setting up the link between Azure Databricks Power BI and BI can significantly improve your analytics capabilities, especially in engineering and streaming information. By following these steps, you can establish a seamless link that not only streamlines your reporting processes but also empowers you to harness actionable insights for operational efficiency:
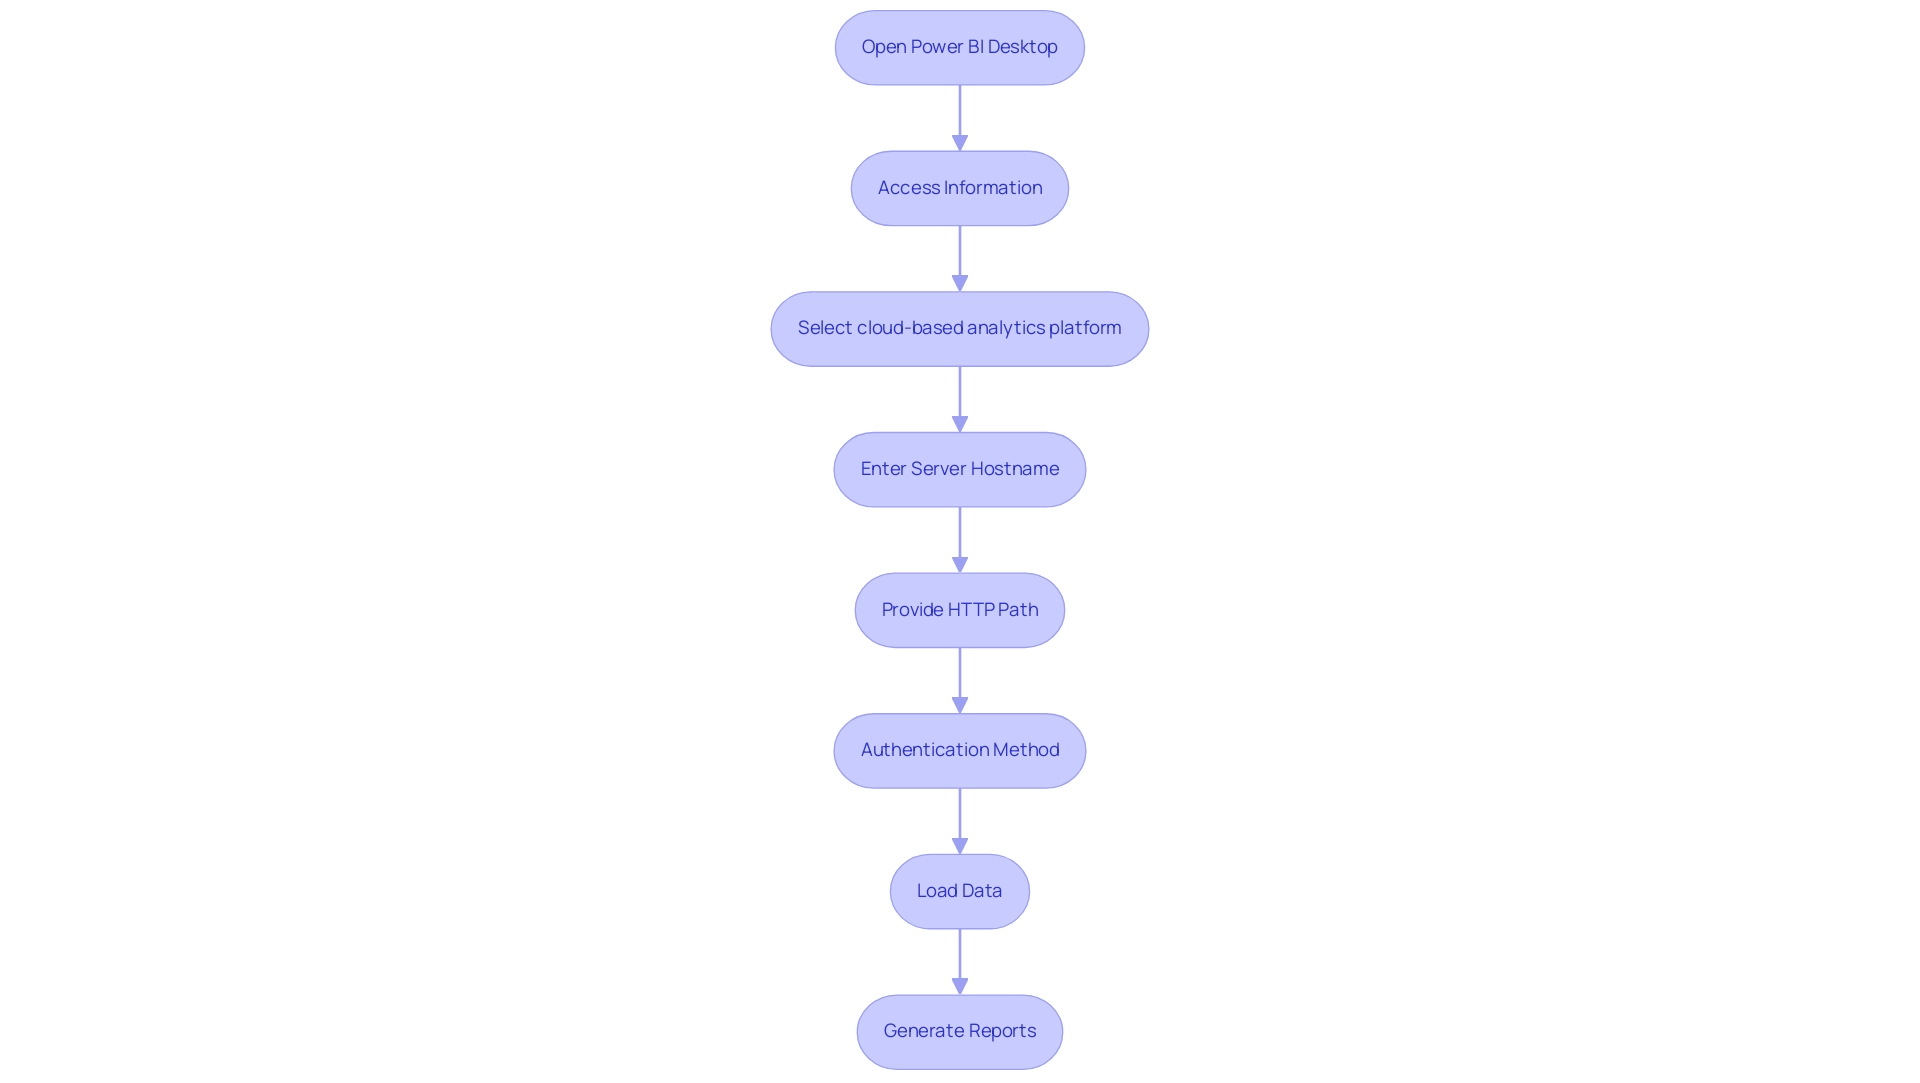
- Open Power BI Desktop: Launch the Power BI application on your computer.
- Access Information: Click on the ‘Home’ tab, then select ‘Get Information’ to access various source options.
- Select cloud-based analytics platform: In the ‘Get Data’ window, navigate to ‘cloud’ and choose ‘cloud-based analytics platform’ from the list of available data sources.
- Enter Server Hostname: Input the server hostname, found in your cloud workspace under ‘Compute’ settings.
- Provide HTTP Path: Enter the HTTP path for your cluster, also accessible in the cluster settings.
- Authentication Method: Select the appropriate authentication method—typically, ‘Access Token’ is recommended. To generate an access token, go to ‘User Settings’ in Azure and select ‘Generate New Token’.
- Load Data: After entering your credentials, click ‘OK’. You will see a list of available tables and views from your workspace. Select the information you wish to import into BI and click ‘Load’.
- Generate Reports: With the information now loaded, you can produce insightful reports and visualizations in Power BI using the integrated information from a cloud-based analytics platform.
It’s important to note that when you publish a dataset, the process typically takes between 10 to 20 seconds to complete. Furthermore, remain updated on connection modifications; for example, the cloud analytics connector supports web proxy but does not support automatic proxy settings specified in .pac files, and the query source is incompatible with DirectQuery mode.
Comprehending these limitations is essential, as they can affect your integration process and overall information strategy.
In the context of the overwhelming AI landscape, navigating through various solutions can be challenging. However, by utilizing customized solutions, you can streamline the process of merging information from a cloud platform into Business Intelligence, ensuring you make informed choices without getting lost in the noise.
To further improve your reporting and gain actionable insights, consider utilizing our BI services, which include a 3-Day Sprint for quick report creation and a General Management App, complemented by Azure Databricks Power BI for comprehensive management and smart reviews. A practical example of this integration’s advantages can be observed in the case study titled ‘Connecting Business Intelligence Desktop to Cloud Data Services.’ This case study demonstrates how linking business intelligence tools to cloud-based analytics clusters and SQL warehouses improved user access to cloud analytics information through reports, boosting operational efficiency with single sign-on features.
By adhering to these steps and using our customized BI services, you will successfully establish a connection, enabling you to utilize your data in BI effectively while overcoming common challenges such as time-consuming report creation and data inconsistencies.
Troubleshooting and Best Practices for Azure Databricks and Power BI Integration
Integrating Azure with BI can present challenges, but with the right approach, these can be effectively managed to enhance operational efficiency. Here are essential troubleshooting tips and best practices to facilitate a seamless integration experience:
-
Connection Errors: When encountering connection issues, confirm that your server hostname and HTTP path are accurate. Additionally, ensure your access token is valid and has not expired, as basic authentication using a username and password will no longer be supported after July 10, 2024. This transition emphasizes the importance of adopting OAuth for authentication, as noted by Youssef Mrini, an employee: ‘You can now use OAuth to authenticate to Power BI and Tableau.’
-
Information Loading Issues: If you encounter problems with information loading, verify that you have the required permissions to access the desired content in Azure. This foundational step is critical for ensuring successful integration and overcoming common implementation challenges.
-
Performance Enhancement: To maximize efficiency, prioritize optimizing your queries within the platform before importing them into Business Intelligence. This proactive measure can significantly reduce loading times and enhance overall responsiveness, aligning with industry best practices for performance. Such optimizations are essential for harnessing Business Intelligence, turning raw data into actionable insights.
-
Regular Updates: Maintain the integrity of your integration by consistently updating both BI and cloud analytics to their latest versions. Staying current with updates allows you to leverage new features and security enhancements that can further streamline your processes.
-
Documentation Reference: Utilize Microsoft’s official documentation for Azure Databricks and Power BI as a comprehensive resource for detailed guidance and troubleshooting steps. This will help you navigate potential hurdles with confidence.
-
Community Support: Don’t hesitate to engage with community forums and support channels. These platforms can provide valuable insights and solutions from users who have faced similar challenges, enriching your troubleshooting toolkit.
-
Robotic Process Automation (RPA): Consider integrating RPA solutions to automate repetitive tasks related to information preparation and reporting. This can significantly enhance operational efficiency by reducing manual intervention and minimizing errors in the integration process.
-
Tailored AI Solutions: Explore tailored AI solutions that can assist in identifying and resolving integration challenges, allowing for a more streamlined approach to data analysis and reporting.
-
Case Study Reference: Consider the case study titled “Merging Cluster Delta Tables with Business Intelligence,” where a user faced challenges connecting cloud-based analytics clusters with business intelligence tools for analytics, despite successfully linking the cluster. The user received suggestions, including the use of partner connect to simplify the connection process, illustrating practical solutions to common integration issues.
By adhering to these best practices and troubleshooting strategies, you can foster a successful integration process that utilizes Azure Databricks Power BI, ultimately driving operational efficiency and leveraging Business Intelligence for informed decision-making.

Conclusion
Establishing a connection between Azure Databricks and Power BI is a strategic initiative that can significantly elevate an organization’s data analytics capabilities. By addressing the essential prerequisites—such as ensuring an active Azure subscription, configuring your Databricks workspace, and securing the right permissions—you lay the groundwork for a seamless integration process. This foundational setup not only streamlines workflows but also enhances the reliability of your data insights.
Following a structured step-by-step guide to configure the integration allows users to effectively harness the full potential of both platforms. The process of connecting Databricks to Power BI empowers organizations to create insightful reports and visualizations, transforming raw data into actionable intelligence that drives operational efficiency. Furthermore, being aware of potential challenges and implementing best practices, such as optimizing queries and utilizing community support, can mitigate issues and enhance performance.
Ultimately, the integration of Azure Databricks and Power BI is more than a technical task; it is an opportunity to enhance decision-making and operational efficiency. By leveraging tailored solutions and embracing automation, organizations can navigate the complexities of data analytics with confidence, ensuring they remain competitive in an increasingly data-driven world. Now is the time to take action and unlock the true value of your data assets.
Overview
To add a title to a Power BI report, users should follow a step-by-step process that includes selecting a text box in the Visualizations pane, inputting the desired title, and customizing its format for optimal visibility. The article emphasizes that well-crafted titles not only enhance user engagement and clarity but also improve the overall professionalism of reports, as evidenced by positive feedback from users regarding dynamic headings that update based on data selections.
Introduction
In the realm of data visualization, the significance of titles in Power BI reports cannot be overstated. They serve as the guiding light, illuminating the path for users as they navigate complex datasets. A well-crafted title not only encapsulates the essence of the report but also enhances user engagement by providing immediate context and clarity.
As organizations strive to harness actionable insights from their data, the effective use of titles becomes a critical component of successful reporting. This article delves into the importance of titles, offering practical strategies for creating dynamic and impactful headings that resonate with audiences, streamline report creation, and ultimately empower decision-making.
With the right approach, titles can transform a standard report into a powerful tool for communication and insight, paving the way for enhanced operational efficiency and informed business strategies.
Understanding the Importance of Titles in Power BI Reports
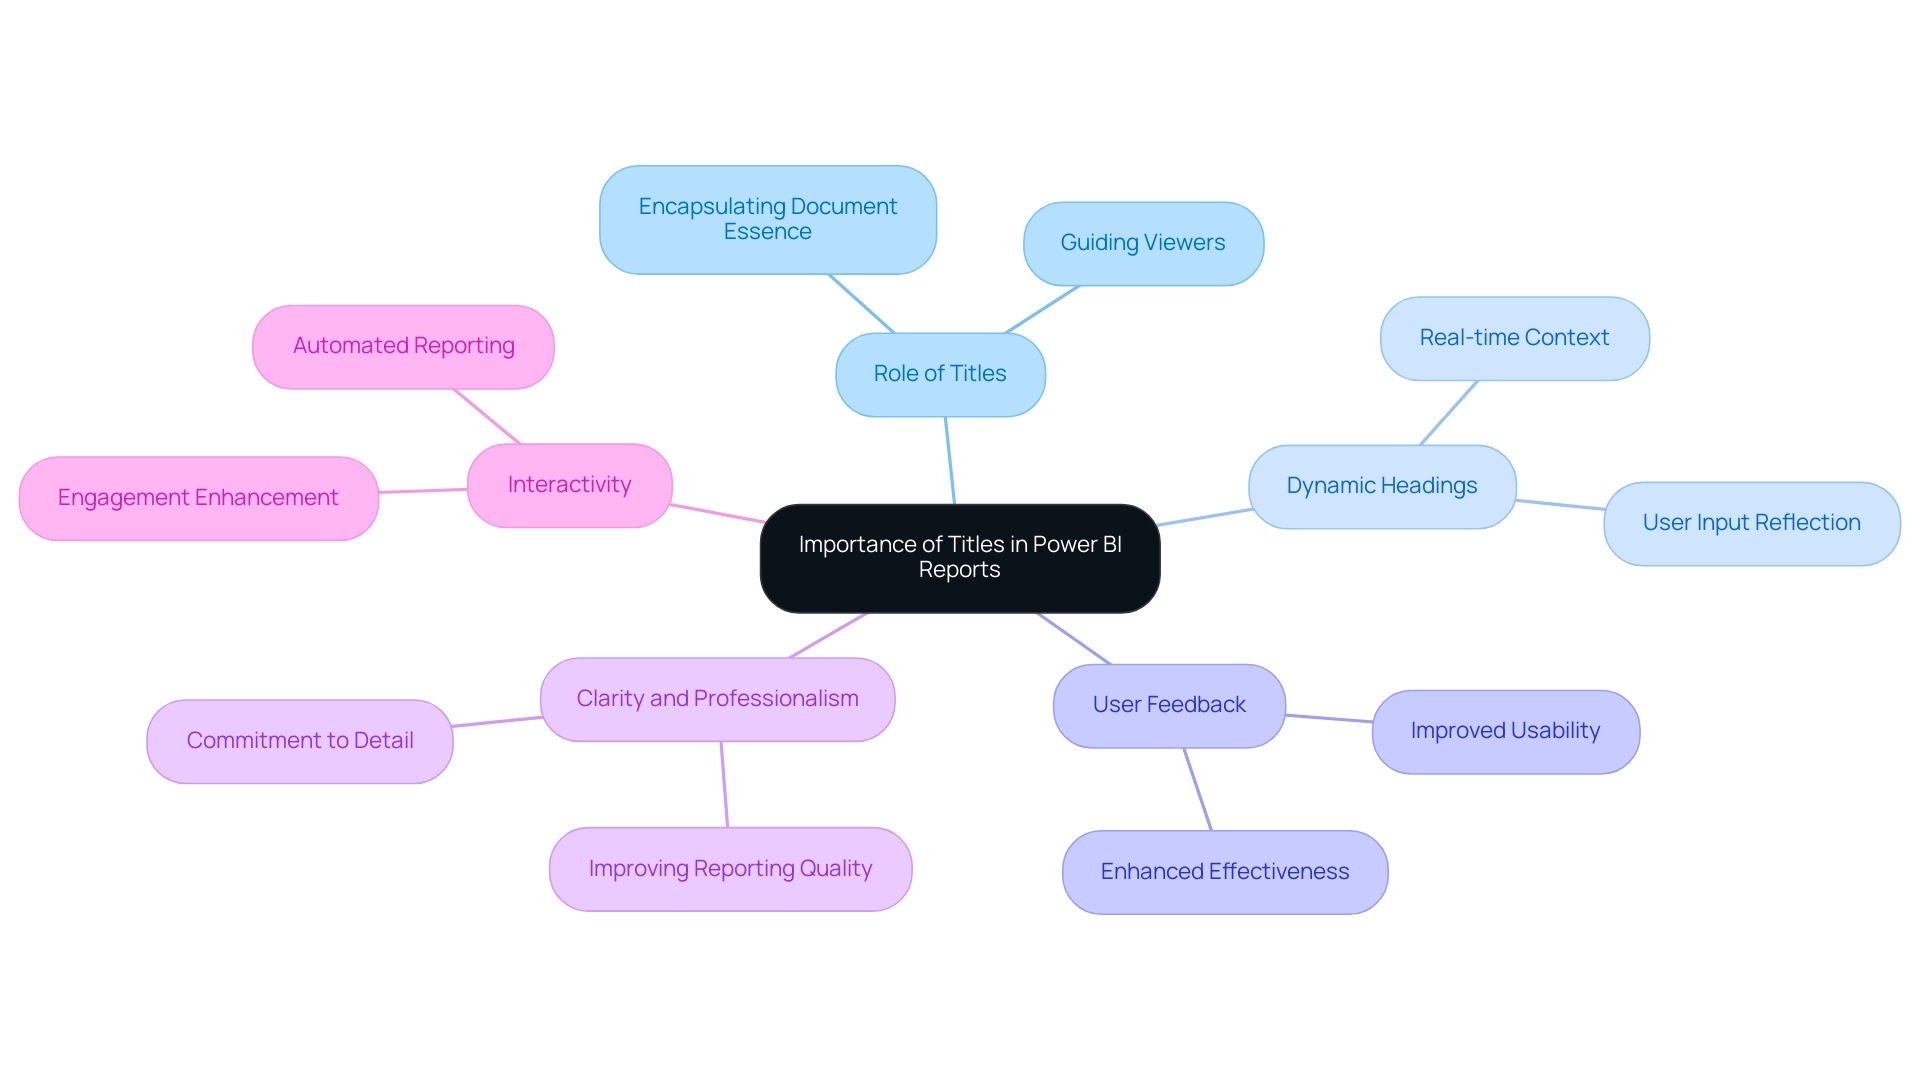
Titles in Power BI are not just ornamental; they function as crucial navigational aids that help you add title to Power BI report and guide viewers through your presentations. A carefully crafted heading encapsulates the document’s essence, facilitating a quick understanding of its context and purpose. This clarity is vital for enabling users to extract meaningful insights from the data presented, particularly in a landscape where leveraging actionable intelligence can be a challenge.
Moreover, impactful headings improve the overall professionalism of your documents, highlighting your commitment to detail and clarity. Recent feedback from managers suggests that the implementation of dynamic headings has significantly enhanced user experience during monthly meetings, improving both the effectiveness and usability of documents. For example, when a manager chooses ‘South Australia’ and ‘April 2024,’ the label dynamically updates to ‘Sales: South Australia – April 2024,’ providing real-time context.
This interactivity not only elevates the reporting experience but also fosters greater user engagement. Furthermore, RPA solutions can enhance the use of BI by automating information collection and report generation, thereby improving efficiency and tackling issues such as time-consuming report creation and inconsistencies. The case study ‘Creating Dynamic Headings in BI‘ highlights how implementing these headings allows for a more interactive reporting experience, where headings change based on user input, thereby enhancing overall data visualization.
It is essential to recognize that conditional formatting in Business Intelligence can exclusively employ measures established in the underlying model, which is a constraint to contemplate when creating headings. Thus, dedicating time to add title to power bi report is crucial for enhancing the effectiveness of your BI analysis, ensuring that titles connect with your audience and communicate the intended message with clarity. As Muhammad H. aptly stated, ‘Appreciate your commitment to learning; keep exploring and growing!’
This reinforces the importance of continuously improving clarity and professionalism in reporting, especially as businesses seek to harness the full potential of their data-driven insights.
Step-by-Step Guide to Adding Titles in Power BI
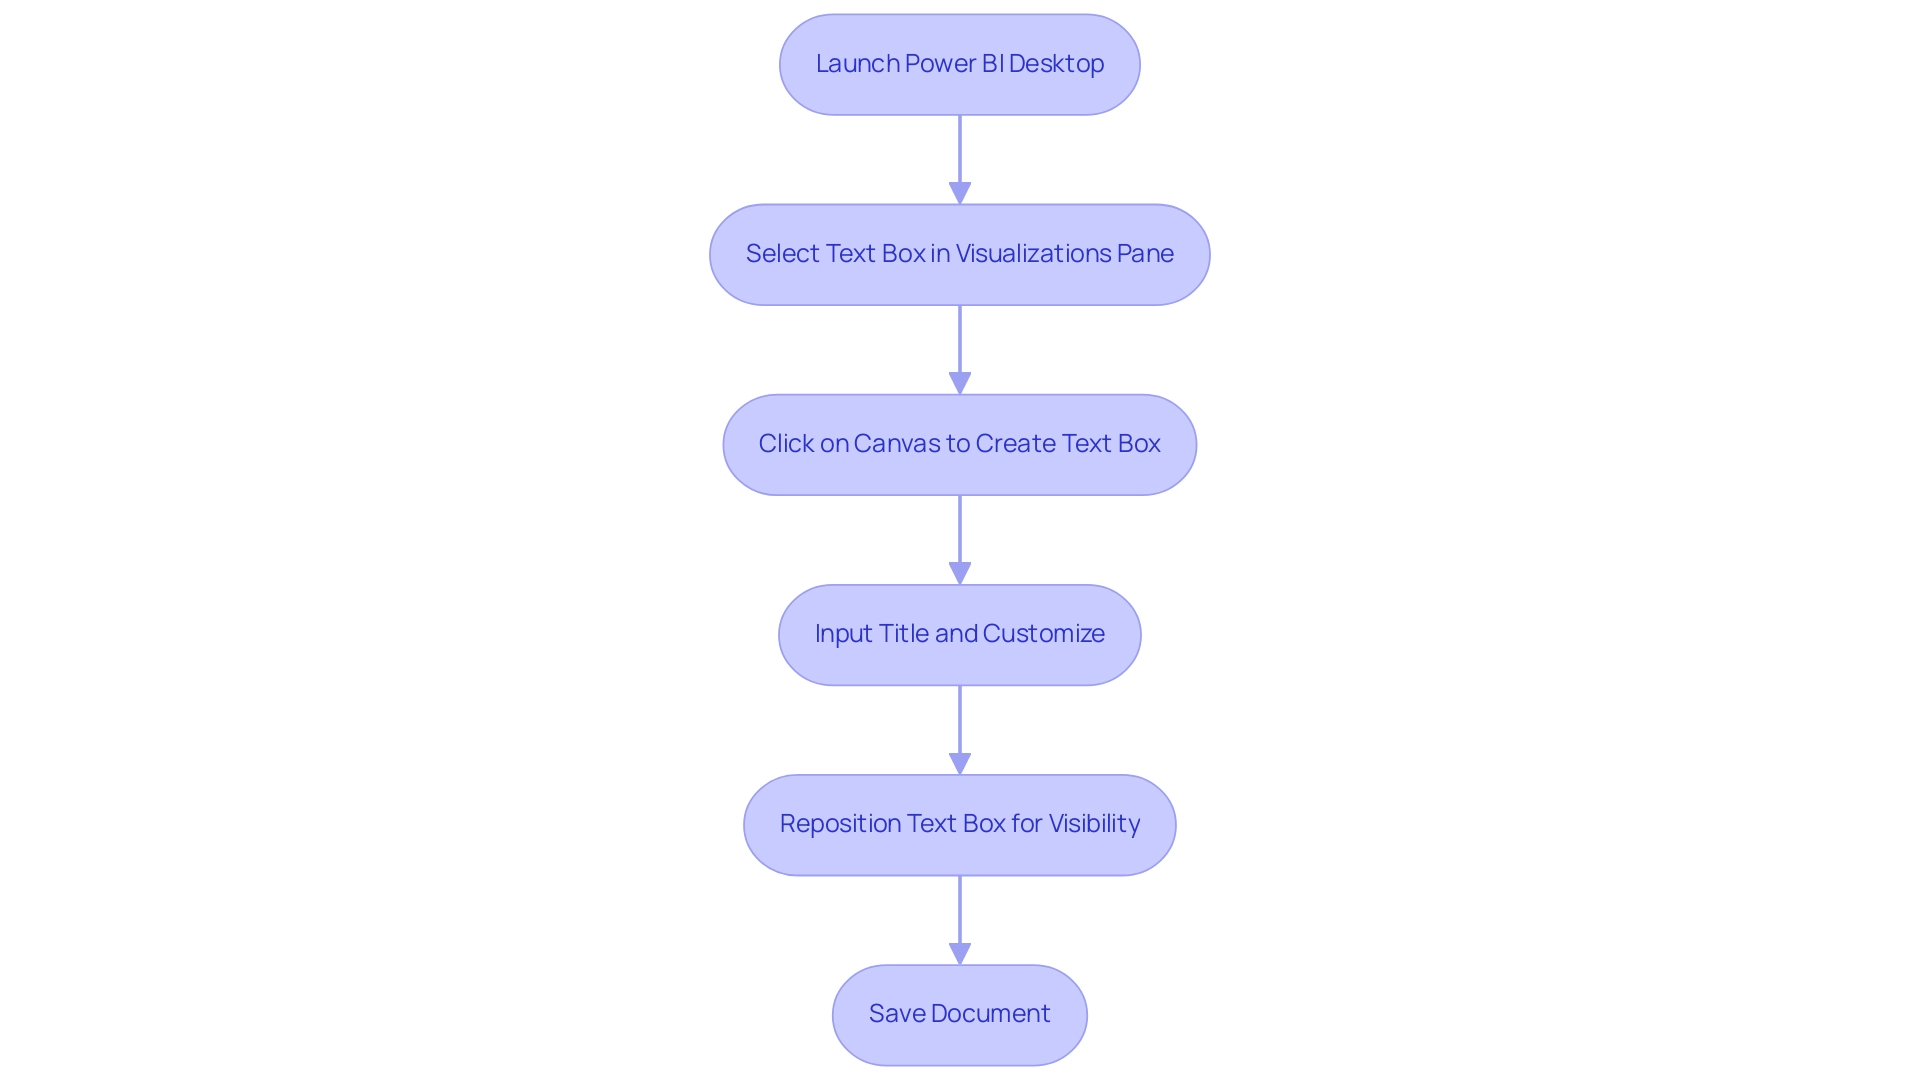
- Launch your Power BI Desktop application and open the document you wish to modify. Click on the report canvas to activate it.
- In the Visualizations pane, locate and select the ‘Text box’ option.
- Click on the canvas at your preferred text location to create a text box.
- Input your chosen title to add title to power bi report into the text box. Utilize the formatting options available in the toolbar to customize the font size, color, and alignment according to your preferences.
- Drag the text box to reposition it within your layout for optimal visibility. Save your document to ensure all modifications are preserved.
By following these steps, you will enhance the clarity and effectiveness of your BI analysis, ultimately driving better data-driven insights for your organization. Proper title formatting can greatly enhance user experience by ensuring rapid access to pertinent information, especially when users need to add title to Power BI report, thus tackling frequent issues like time-consuming document creation and information inconsistencies. As dbuchter, an Advocate II, aptly states,
My responsibility is to elevate the user experience among all of the tools our group interacts with, BI being just one part of that mix.
Moreover, incorporating RPA solutions such as EMMA RPA can simplify the information preparation process, decreasing the time invested in document creation and lessening discrepancies. Moreover, employing Automate can streamline data flows into BI, guaranteeing that your documents are consistently current and dependable. The significance of carefully constructed headings is highlighted by Bi’s usage metrics in national/regional clouds, which illustrate how effective document formatting can assist in ensuring compliance and security.
Remember, well-crafted headings not only guide your audience but also significantly enhance the overall user experience, especially when you add title to power bi report, aligning with the growing trend of customization in user interfaces and empowering your organization towards operational excellence.
Leveraging Dynamic Titles for Enhanced Reporting
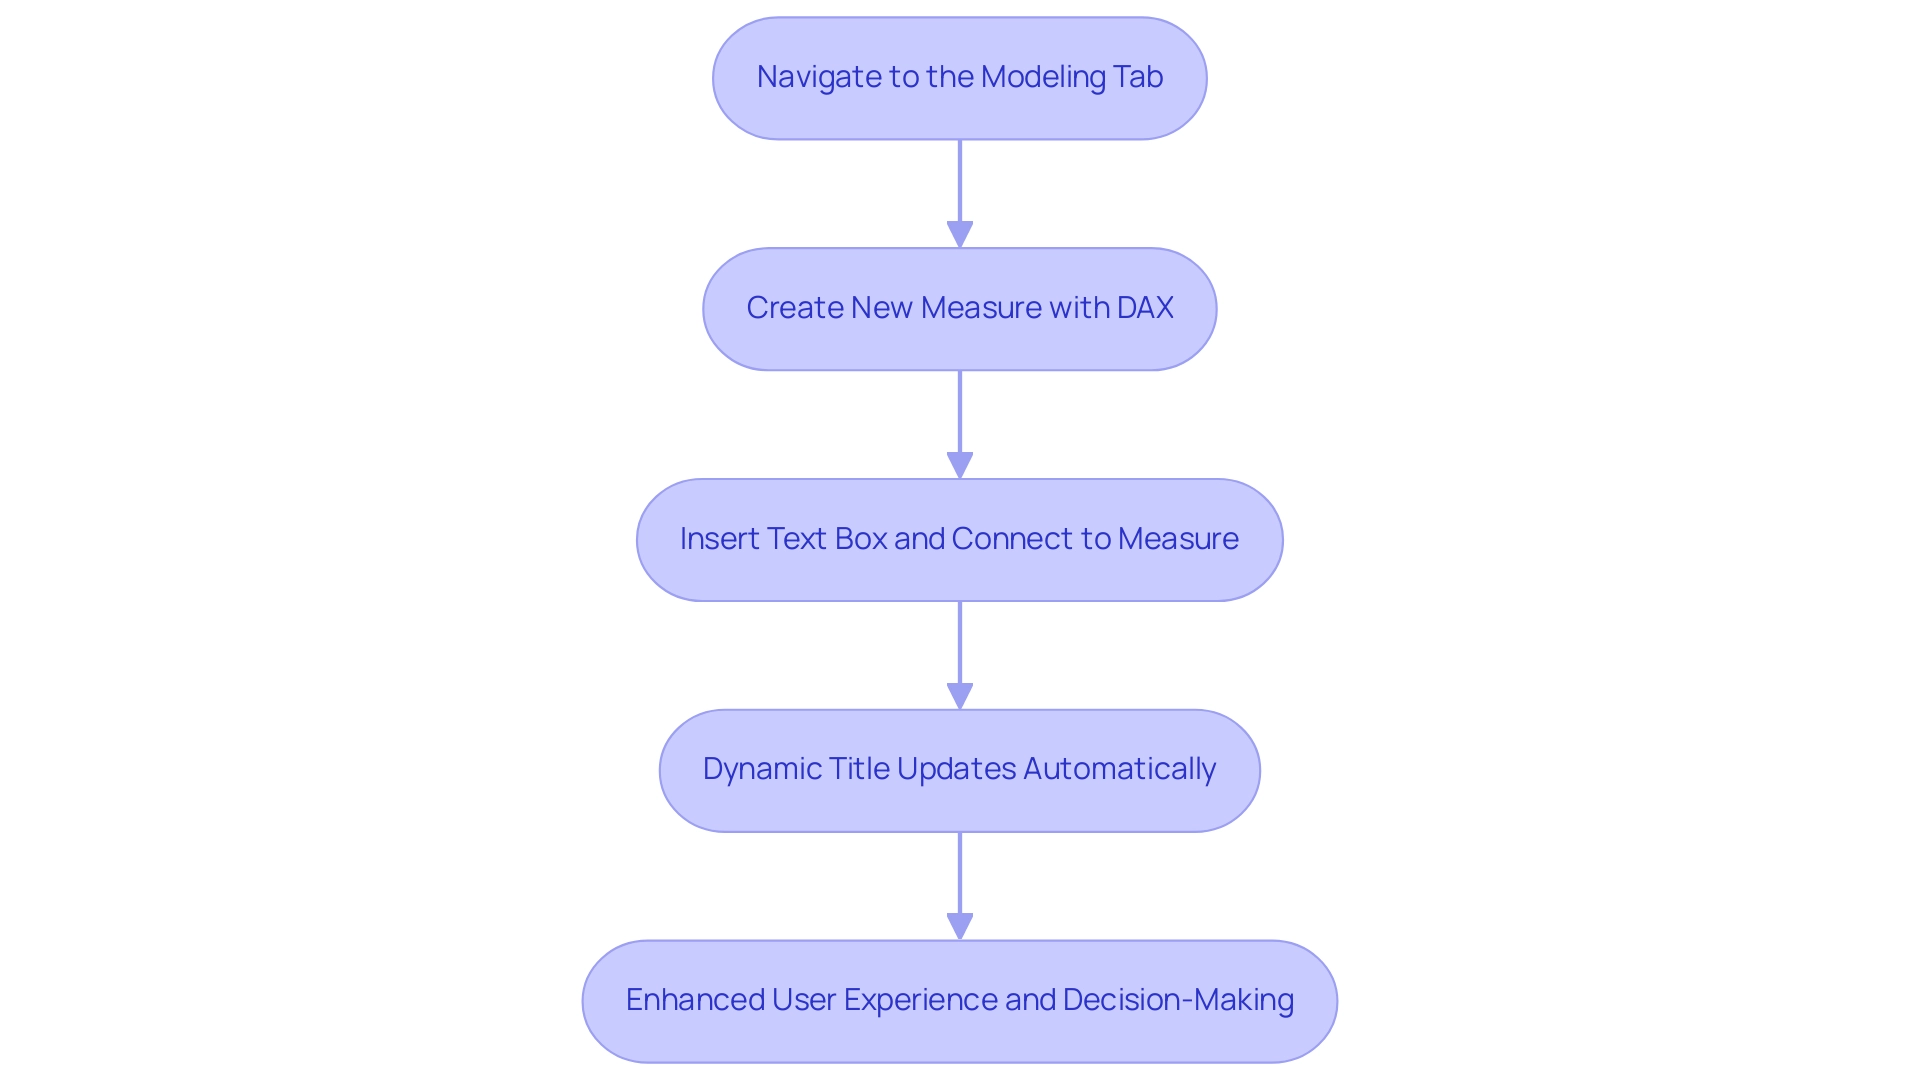
An effective way to add title to Power BI report is by creating dynamic headings, which ensures your reports provide relevant, real-time insights that enhance usability and drive informed decision-making. By utilizing DAX (Data Analysis Expressions), you can add title to Power BI report that adjusts according to the data selections made by users. Follow these straightforward steps to implement dynamic titles:
- Navigate to the ‘Modeling’ tab and click on ‘New Measure’ to create a new measure within your document.
- You can use a DAX formula to add title to Power BI report by defining your dynamic heading. For instance, you might write:
Title = "Sales Report for " & SELECTEDVALUE('Date'[Month])to add title to Power BI report. - You can easily add title to Power BI report in just a few steps. To add title to Power BI report, insert a text box into your document and connect it to your newly created measure by typing
=Titlein the text box field. - Now, the heading will update automatically in response to user interactions, allowing you to add title to Power BI report with context-sensitive information that enhances the report’s clarity and relevance.
The inclusion of dynamic headings not only enhances the user experience but also promotes more informed decision-making, especially when users add title to Power BI report, allowing them to immediately observe how their choices influence the information presented. With a Pro license, users can set up to 8 daily information refreshes, while Premium license holders can benefit from 48 automatic updates, ensuring that the content behind these dynamic labels is always current.
Along with dynamic headings, our Power BI services feature a Day Power BI Sprint, which enables the quick development of professionally crafted documents customized to your requirements. We also provide a General Management App that offers comprehensive management and intelligent reviews, further improving reporting capabilities.
As emphasized by industry specialists, utilizing DAX formulas for headings can greatly enhance stakeholder involvement with the information, particularly when you add title to Power BI report, facilitating the extraction of actionable insights. For instance, Dev4Side Software focuses on generating tailored summaries using Power BI, emphasizing the transformation of intricate information into user-friendly dashboards that improve operational efficiency. Their expertise demonstrates how dynamic titles can support informed business decisions when you add title to Power BI report.
Moreover, as Rico Zhou observes, enhancing performance of the document is essential: “Incremental refresh is an effective method to load information in a dynamic date range…” However, web information sources don’t support query folding, so incremental refresh may show poor performance due to large sizes. This insight emphasizes the significance of ensuring that dynamic labels not only enhance usability but also align with best practices for report performance, addressing challenges like data inconsistencies and lack of actionable guidance. By integrating RPA solutions, businesses can further streamline their reporting processes, ensuring that automation complements the insights derived from BI.
Common Challenges and Solutions in Title Creation
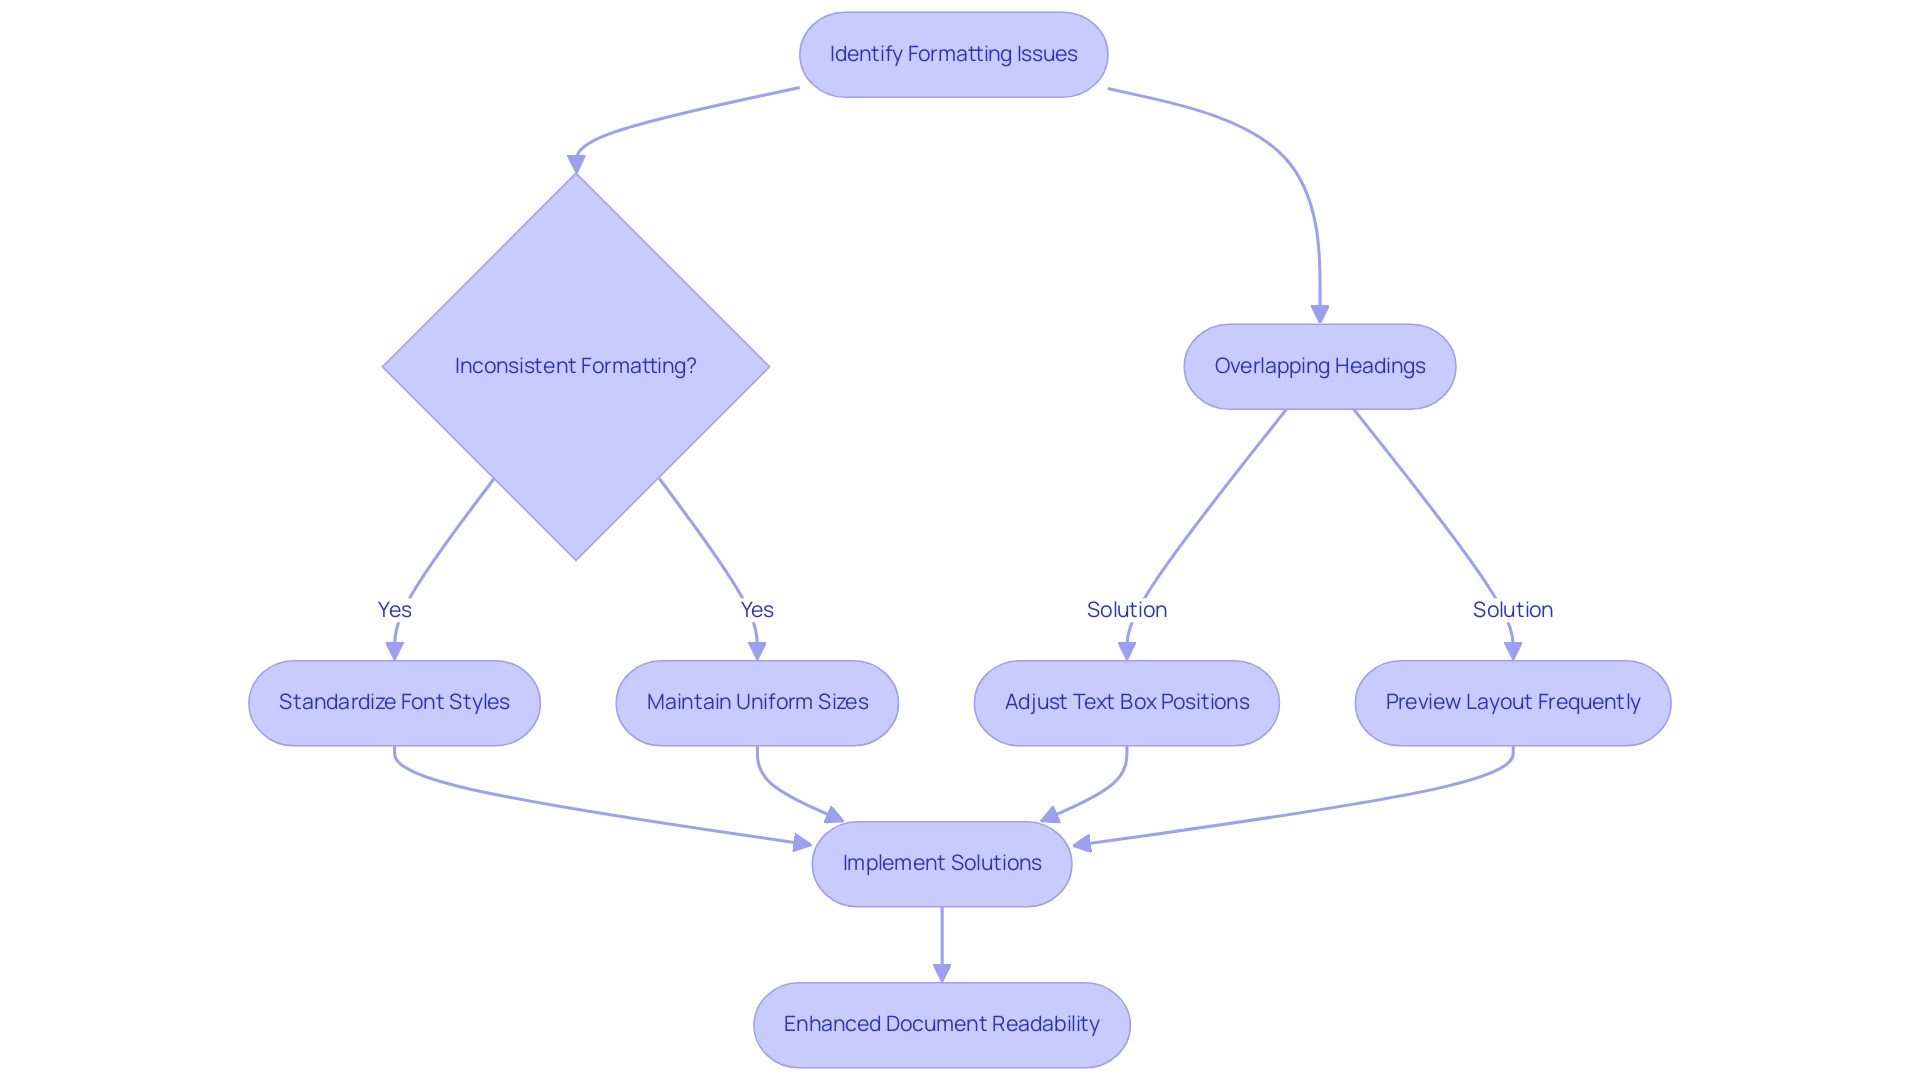
When using BI, individuals frequently face various obstacles associated with how to add title to Power BI report. One prevalent issue is inconsistent formatting; maintaining uniformity in font style and size across all headings is crucial for enhancing visual cohesion. Statistics indicate that almost 60% of users experience challenges with formatting in Power BI, emphasizing the necessity for effective solutions.
Another frequent issue is overlapping headings, which reduces the clarity of your document. Adjusting the positioning and size of text boxes is essential to prevent overlap with other visuals. Additionally, the limited character space can lead to names that lack detail.
To address this, keep your headings brief; think about using subtitles or tooltips for extra context when needed.
Frequently previewing your layout can greatly assist in recognizing these problems, enabling real-time modifications. The formatting panel within Business Intelligence is an invaluable resource that helps you add title to Power BI report standardization across different documents. For those seeking additional support, our 3-Day Power BI Sprint provides a structured approach to data visualization design, including:
1. Initial consultations to define your analytical needs
2. Iterative design sessions for feedback
3. Final adjustments to ensure professional quality
This guarantees you spend less time on document creation and more on utilizing insights for significant decisions. As Brahmareddy notes, ‘By simplifying these measures and doing more of the heavy lifting in Databricks, I was able to accelerate my documents.’ Moreover, findings from the case study titled ‘Top 9 Benefits of Power BI‘ emphasize that to improve user engagement and understanding, it is essential to add a title to Power BI report, ultimately increasing the overall impact of your documents.
Implementing these strategies streamlines your design, enhances readability, and maximizes the value of your business intelligence efforts. Our former clients have indicated a 30% decrease in document creation time and a significant rise in user satisfaction, showcasing the tangible advantages of our services.
Best Practices and Resources for Power BI Title Management
Effectively managing titles in Power BI is crucial for enhancing user understanding and engagement, so it is important to add title to Power BI report, especially as many professionals face challenges such as time-consuming document creation and data inconsistencies stemming from a lack of governance strategy. Here are some best practices to consider:
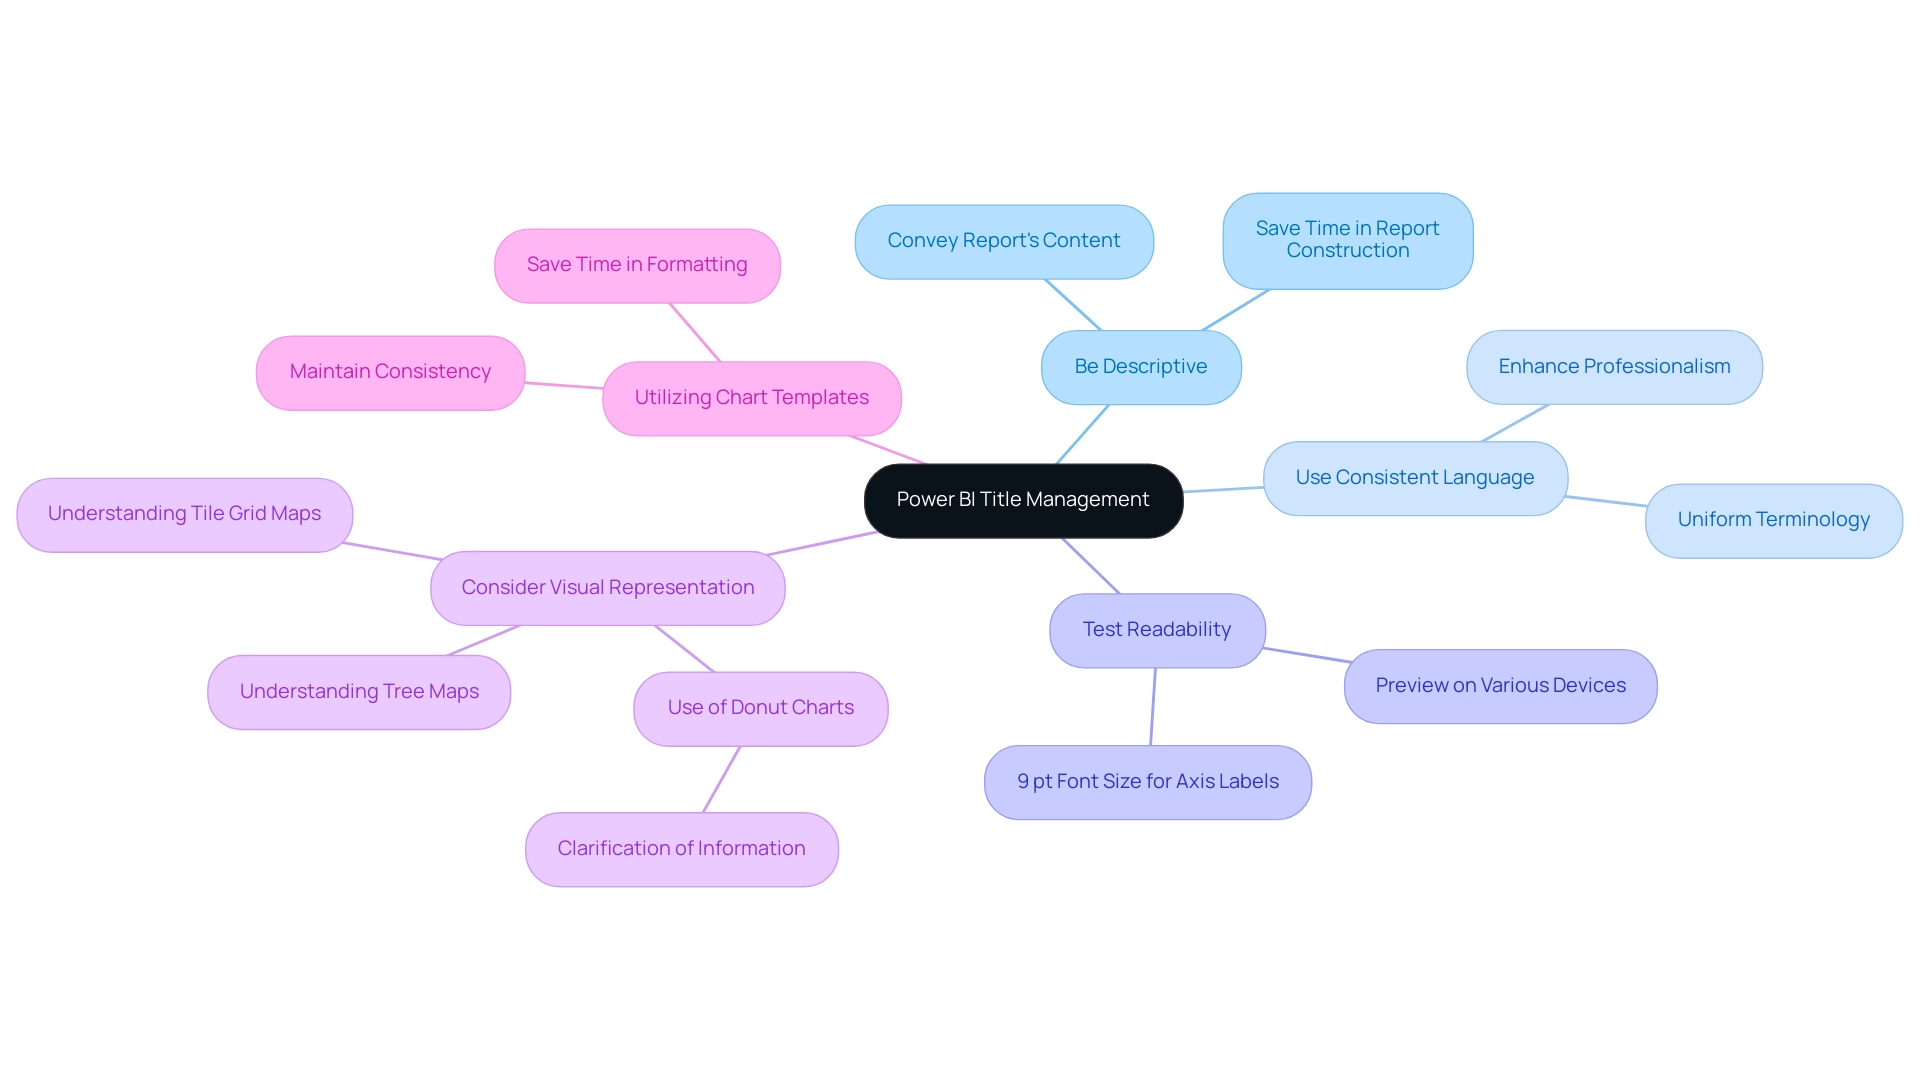
- Be Descriptive: Titles should succinctly convey the report’s content, allowing users to grasp the purpose at a glance, thereby saving time in report construction.
- Use Consistent Language: To maintain clarity and avoid confusion, it’s essential to use uniform terminology throughout your documents. This consistency enhances the overall professionalism of your visuals and builds trust in the information presented.
- Test Readability: It’s vital to preview reports on various devices to ensure that headings remain legible across formats. For instance, a 9 pt font size is commonly recommended for axis labels in visualizations, and applying this standard can significantly impact readability.
- Consider Visual Representation: When using visual elements like donut charts, which are similar to pie charts but have a hole in the center, consider how to add title to power bi report for better clarification of the information being presented. This can assist users in estimating relative sizes more effectively, offering actionable guidance from the information.
For those seeking additional resources, engaging with the Microsoft Power BI documentation and community forums can provide actionable insights and techniques for effective reporting. These resources can assist in tackling the challenges outlined, especially in overcoming information inconsistencies and enhancing clarity of findings. Leveraging custom chart templates can further streamline your formatting process, allowing for quick adaptation and uniformity across visuals. As illustrated in the case study on utilizing chart templates, maintaining consistency can save time in formatting and ensure uniformity across visuals.
Additionally, understanding the use of tree maps, which utilize rectangles proportional to category sizes, and tile grid maps, which employ uniform shapes to eliminate size bias, can enhance your data visualization techniques. As one expert puts it,
I usually default to a 9 pt font for axis labels,
underscoring the importance of consistency in design. By implementing these strategies, you can elevate the effectiveness of your Power BI reports and dashboards, especially when you learn how to add title to Power BI report, turning potential challenges into opportunities for enhanced insight and decision-making.
Conclusion
Crafting impactful titles in Power BI reports is a pivotal step towards enhancing user engagement and fostering better decision-making. The significance of titles extends beyond mere aesthetics; they serve as essential navigational tools that encapsulate the essence of the data presented, guiding users through complex datasets with clarity and purpose. By implementing strategies such as:
- dynamic titles
- consistent formatting
- concise language
organizations can transform their reporting processes, making them more interactive and user-friendly.
Moreover, the integration of automation solutions, like RPA and Power Automate, can streamline report generation, addressing common challenges such as time-consuming data preparation and inconsistencies. As highlighted throughout the article, effective title management not only elevates the professionalism of reports but also significantly enhances the overall user experience. Regularly previewing layouts and utilizing best practices can mitigate common formatting issues, ensuring that titles resonate with audiences while providing immediate context.
Ultimately, the journey towards effective data visualization begins with a commitment to clarity and professionalism in title creation. By embracing these principles, organizations can unlock the full potential of their data, empowering stakeholders to derive actionable insights and make informed decisions that drive operational excellence. The time to prioritize impactful titles is now—doing so will pave the way for enhanced communication, deeper understanding, and ultimately, greater success in leveraging data-driven insights.
Overview
Microsoft’s new AI model, GPT-4, is positioned as a leader in human-like reasoning capabilities compared to other AI systems, showcasing its potential to enhance operational efficiency and decision-making across various industries. The article supports this by highlighting GPT-4’s performance in critical assessments, its ability to generate contextually relevant responses, and the significant advancements it brings to Robotic Process Automation (RPA) and Business Intelligence (BI), indicating a transformative impact on business applications.
Introduction
In the rapidly evolving landscape of artificial intelligence, Microsoft’s GPT-4 stands out as a groundbreaking advancement that promises to redefine operational efficiency across various industries. With its purported human-like reasoning capabilities and an impressive architecture of up to 220 billion parameters, GPT-4 is not merely a technological marvel; it is a potential game changer for businesses seeking to harness the power of Robotic Process Automation (RPA) and Business Intelligence (BI).
This article delves into the transformative implications of GPT-4, comparing it to existing AI systems, and exploring the practical applications that can enhance decision-making and streamline workflows. As organizations grapple with the complexities of AI integration, understanding the strengths and limitations of these technologies becomes crucial for fostering innovation and achieving sustainable growth in an increasingly competitive environment.
Microsoft’s Claims: GPT-4 and Human-Like Reasoning
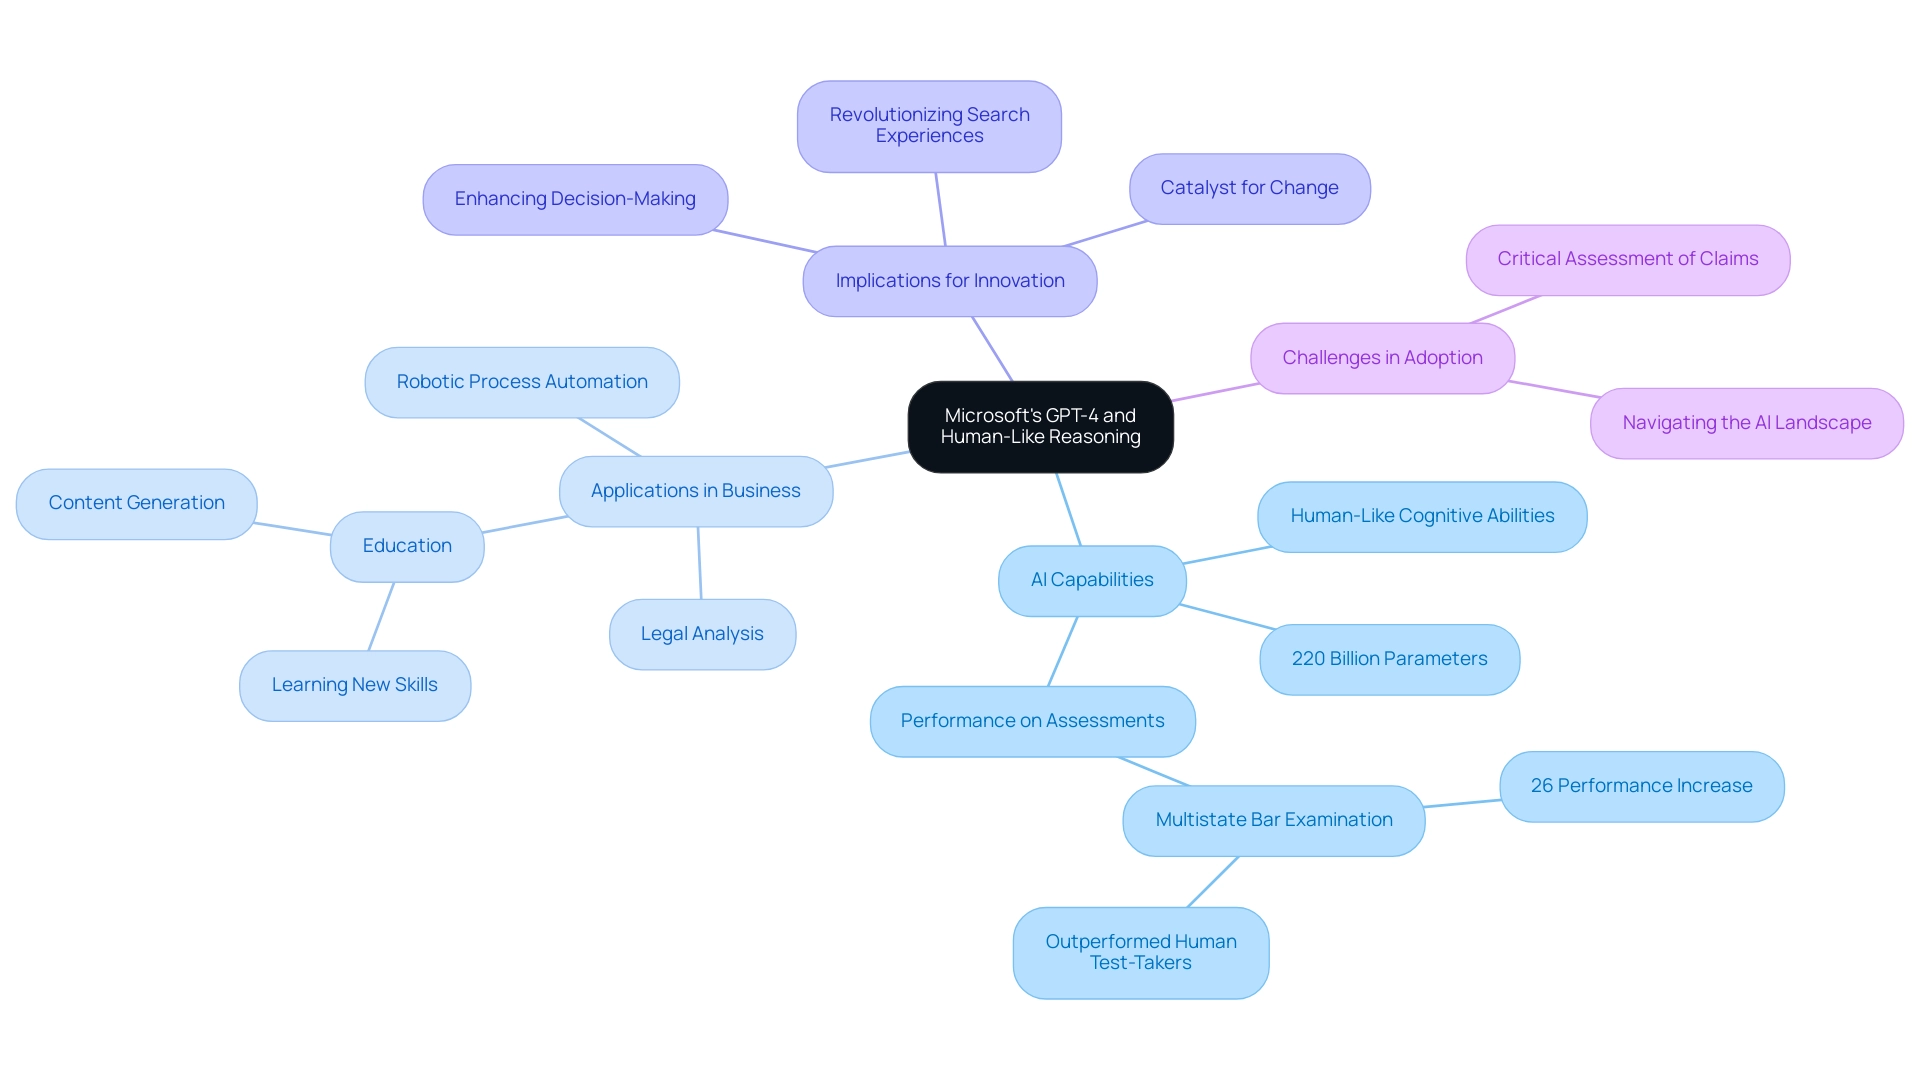
Microsoft’s advanced AI model is not just a transformative leap in technology; it represents a potential cornerstone for businesses looking to leverage Robotic Process Automation (RPA) and Business Intelligence to enhance operational efficiency and reduce costs. With assertions of human-like cognitive abilities and potentially 220 billion parameters, this model is crafted to understand context and produce nuanced replies, rendering it essential for automating manual processes and enhancing productivity. The model’s ability to outperform human test-takers in critical assessments, such as the Multistate Bar Examination, showcases its potential as a catalyst for innovation across sectors like legal analysis and technical support.
As Stripe Product Lead Eugene Mann noted, ‘When we started hand-checking the results, we realized, ‘Wait a minute, the humans were wrong and the model was right.’’ This highlights the increasing confidence in AI’s reasoning capabilities. Furthermore, this technology can facilitate education, research, and business processes by enabling users to learn new skills, discover information, and generate high-quality content. The case study titled ‘Final Thoughts on the latest model’ illustrates its significant advancements in natural language understanding and generation, with potential applications that could revolutionize search experiences and content generation, thereby enhancing decision-making.
However, the discussions ignited by Microsoft’s new model regarding the analytical capabilities of its model in relation to human cognition and other AI systems highlight the significance of critically assessing these claims. Businesses must navigate the rapidly evolving AI landscape and the challenges it presents to effectively harness advanced language models, improving operational efficiency and fostering innovation in 2024 and beyond. To explore how tailored AI solutions can meet your specific business needs, we invite you to learn more about our offerings.
Comparative Analysis: GPT-4 vs. Other AI Systems in Reasoning
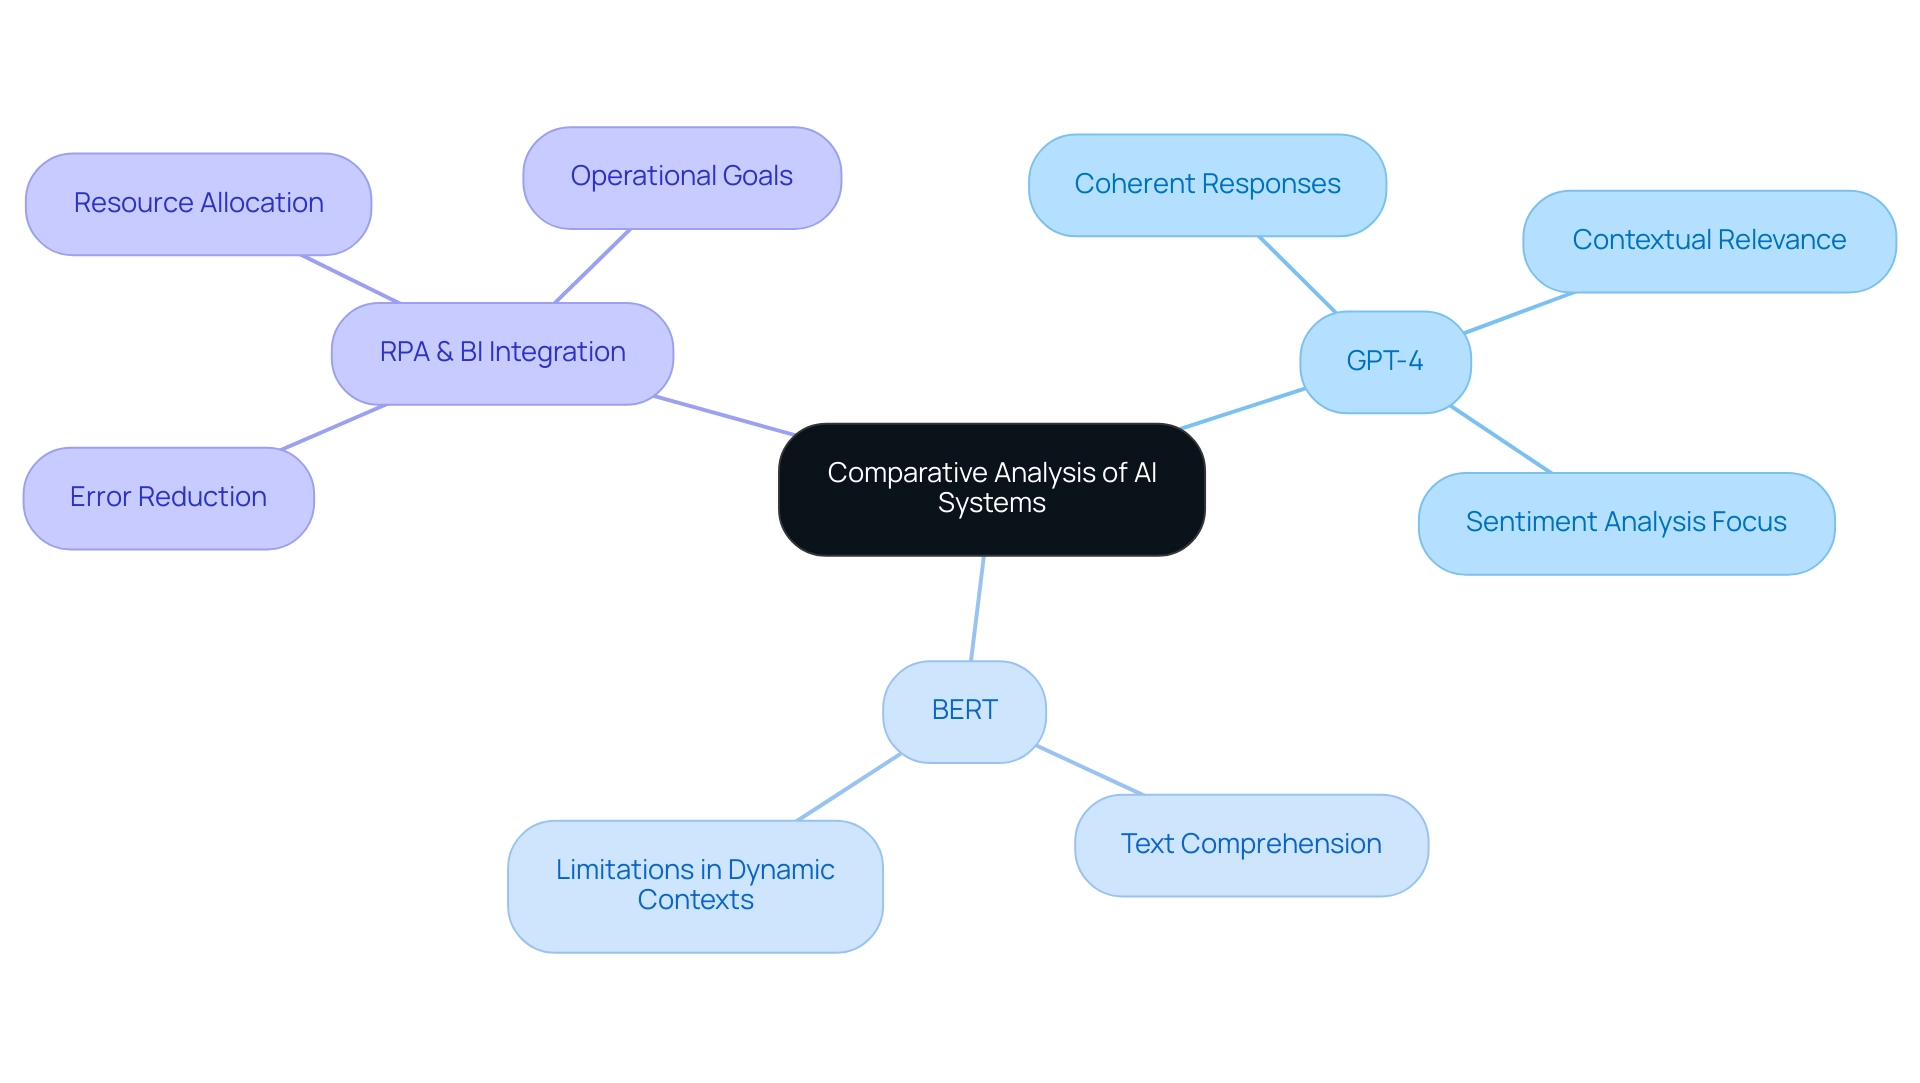
A comparative examination of advanced AI systems, especially Google’s BERT, uncovers notable differences in their cognitive abilities, which can be utilized along with Robotic Process Automation (RPA) for operational efficiency. The model stands out for its ability to generate coherent and contextually relevant responses, making it exceptionally suitable for conversational AI applications. In contrast, BERT is designed with a focus on text comprehension, which can restrict its utility in dynamic conversational contexts.
Recent evaluations have shown that base models of LLMs outperform the BERT model by 5.6% and 2.6%, respectively, and Microsoft says new shows human reasoning in the latest version.
While this new model exhibits marked improvements in reasoning tasks, it is essential to recognize the role of RPA in automating manual workflows, thereby allowing teams to focus on strategic decision-making. RPA not only reduces errors but also frees up valuable team resources, enhancing overall productivity. Other AI systems may still excel in specific domains, such as structured data analysis, which can complement RPA technologies.
The recent case study titled ‘Top Influential Words Analysis‘ illustrates this point effectively. This analysis was conducted on the test set to identify impactful words contributing to sentiment ratings, revealing that GPT-4 emphasizes adjectives that convey sentiment, while BERT focuses on contextual nouns and verbs. This distinction underscores the importance of integrating the right AI system with RPA and BI to achieve data-driven insights that drive growth.
Moreover, the transformative potential of LLMs in sectors like tourism can automate sentiment analysis and generate actionable insights, aligning with operational goals across various industries, including hospitality.
According to Junguk Hur, who oversees AI conceptualization and analysis, ‘We plan to investigate how the ontology can be used together with existing literature mining tools to enhance our mining performance further.’ This perspective exemplifies the ongoing evolution of AI cognitive abilities and underscores the significance of Microsoft says new shows human reasoning in tailoring AI solutions to meet organizational needs. Furthermore, it is vital to tackle the challenges businesses encounter in implementing these innovations, ensuring a smooth transition and maximizing the benefits of RPA and AI integration.
By understanding these key differences and developments, organizations can optimize their processes, enhance decision-making, and foster innovation through the strategic integration of RPA, AI, and BI.
Human-Like Reasoning: Implications for Business Applications
The transformative implications of human-like thought processes in AI for business applications are highlighted by Microsoft, which says new shows human reasoning, particularly with advanced systems like GPT-4. Introducing Hayley, our AI-based junior consultant, we empower organizations to navigate the complexities of AI integration with personalized guidance tailored to their unique challenges. Let Hayley consult you on where to start.
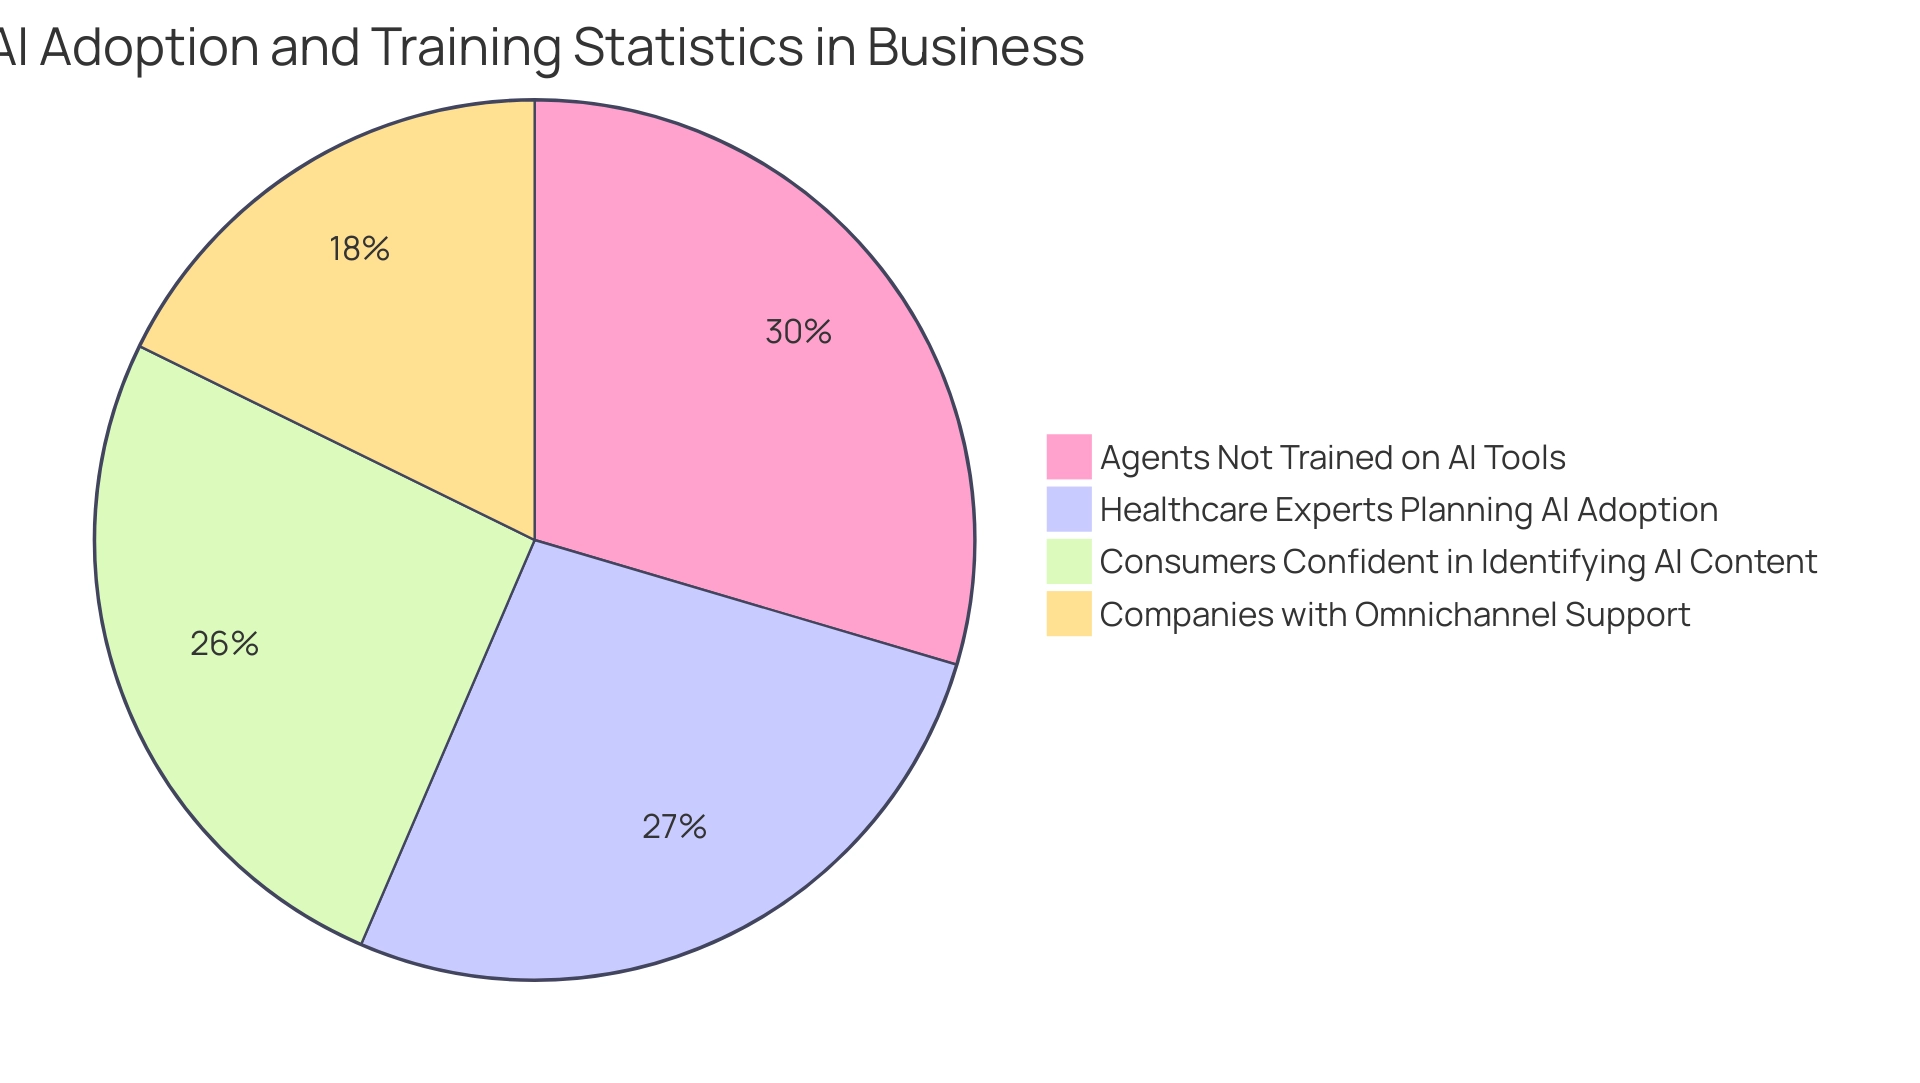
In customer service, AI’s capacity to manage complex inquiries streamlines operations and enhances customer satisfaction through precise, timely responses. Currently, only about 33% of companies have adopted omnichannel support across various platforms, presenting a significant opportunity for growth that AI could address. Moreover, a staggering 55% of agents report not receiving any training on AI tools, underscoring the critical need for organizations to invest in training to fully utilize these resources.
As noted by Colette Des Georges, less than half (48%) of consumers feel confident identifying AI-generated content, emphasizing the importance of building consumer trust through education. In the realm of data analysis, Microsoft says new shows human reasoning capabilities that enable organizations to sift through extensive datasets, uncovering valuable insights that inform strategic decision-making. Almost 50% of healthcare experts are intending to incorporate AI innovations, acknowledging its potential in diagnostics and treatment suggestions.
As businesses increasingly acknowledge the benefits of AI, with 90% investing in these technologies to enhance customer relationships—illustrated by the case study ‘Trust in AI Investments’—the role of AI in improving operational efficiency and driving innovation has never been more critical. By embracing AI’s analytical capabilities and leveraging tools such as Robotic Process Automation (RPA) and Business Intelligence, organizations can significantly elevate customer service and overall satisfaction. Hayley can provide tailored solutions that directly address your operational challenges, ensuring you make the most of your AI investments.
Limitations of Current AI Reasoning Capabilities
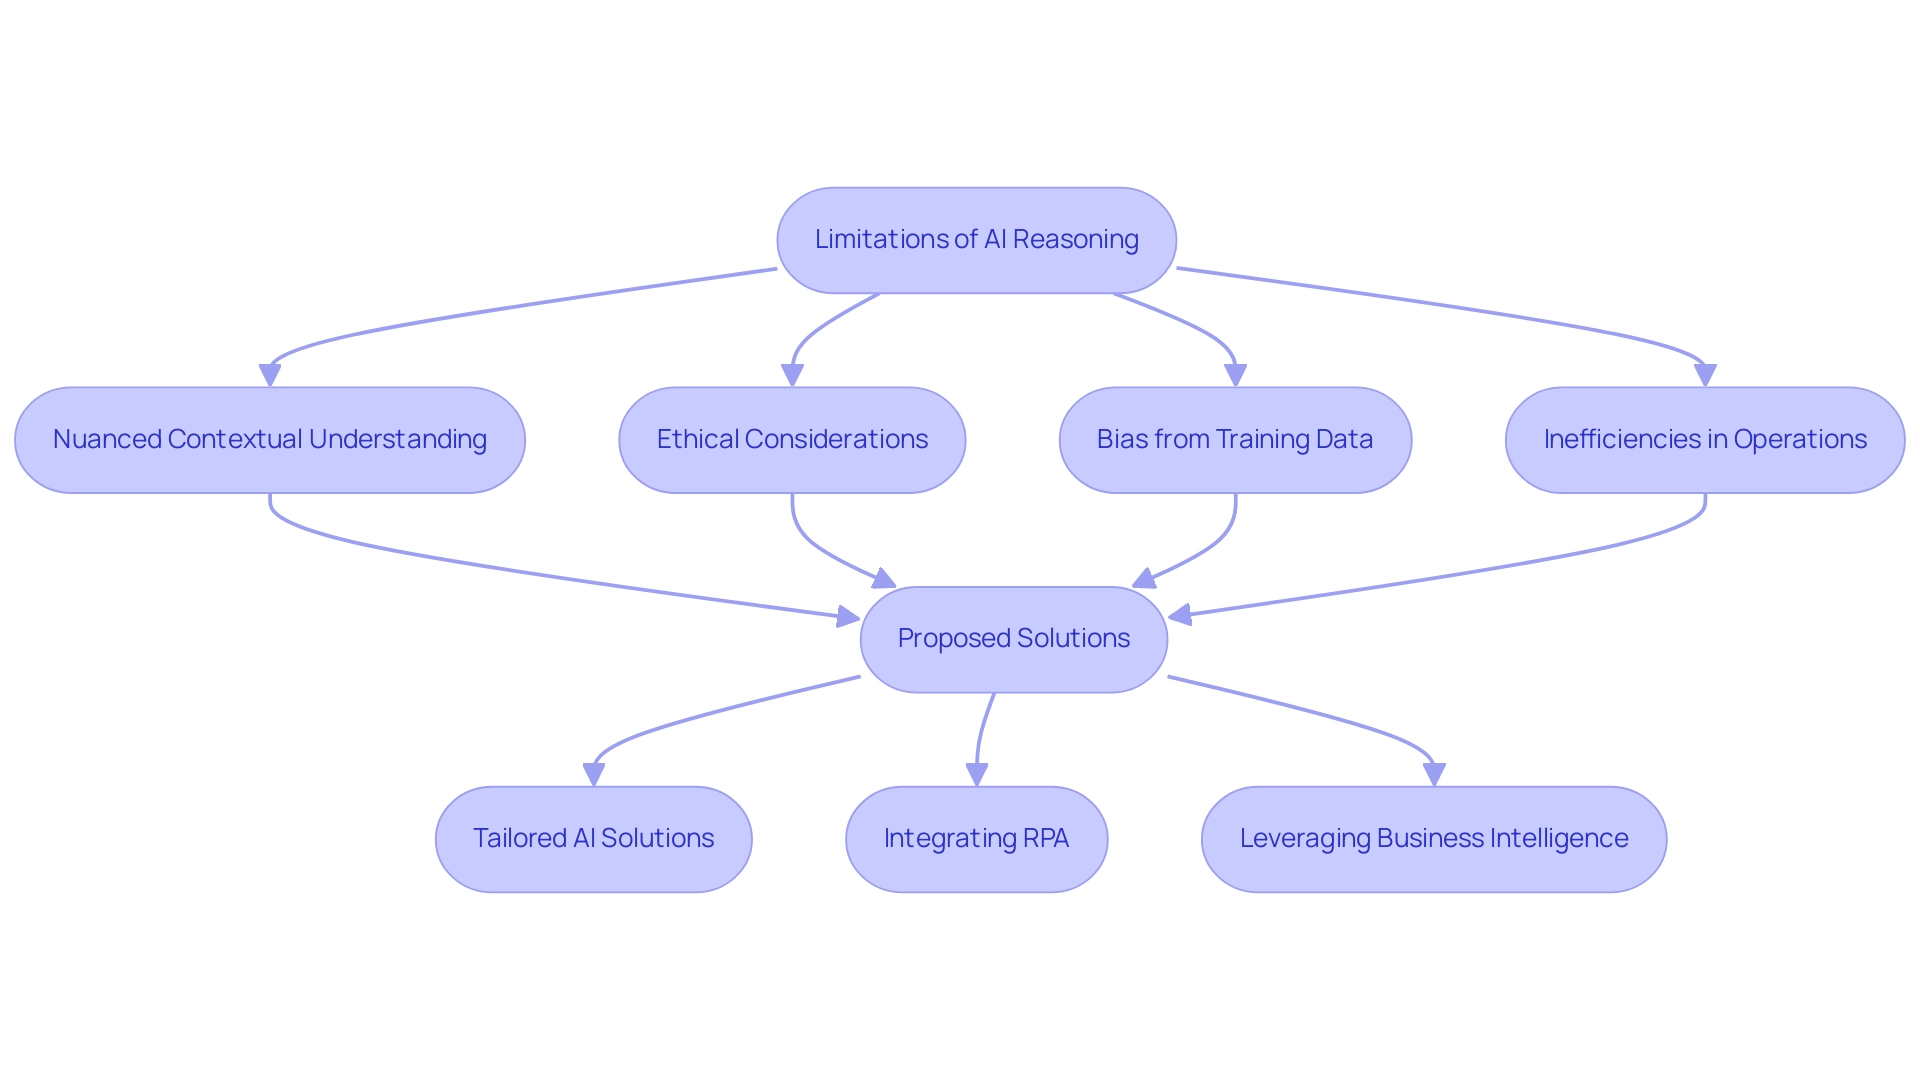
Despite significant advancements, AI cognitive abilities still encounter critical limitations that can hinder operational efficiency. For instance, while models such as GPT-4 excel at producing human-like replies, they frequently encounter difficulties with nuanced contextual understanding and strong ethical considerations. A study by Apple shows that AI’s analytical abilities are not yet comparable to human cognition, highlighting the complexity of applying these innovations effectively.
Such gaps are concerning, especially since AI systems are vulnerable to biases from their training data, which can lead to flawed conclusions impacting decision-making processes.
Moreover, manual, repetitive tasks can significantly slow down operations, leading to wasted time and resources. To overcome these challenges, organizations must harness tailored AI solutions that align with their specific business goals.
By integrating Robotic Process Automation (RPA), businesses can streamline workflows, enhancing efficiency and reducing errors, allowing teams to focus on strategic, value-adding work. Organizations can identify the right AI solutions by assessing their unique challenges and aligning tools that specifically address these needs. Furthermore, the interpretability of AI decisions is paramount; understanding how AI arrives at its conclusions fosters trust and accountability.
As noted in discussions about misconceptions surrounding AI capabilities, many current systems primarily function as sophisticated pattern matchers rather than entities capable of authentic thought. This has led experts like Nick Bostrom to label such limitations as ‘artificial ignorance.’
Recognizing and addressing these challenges is crucial for organizations aiming to seamlessly integrate AI solutions into their operations.
Additionally, leveraging Business Intelligence can transform raw data into actionable insights, empowering informed decision-making that drives growth and innovation. Understanding these complexities and utilizing tailored solutions will enable organizations to navigate the rapidly evolving AI landscape more effectively.
Future Trends in AI Reasoning Technologies
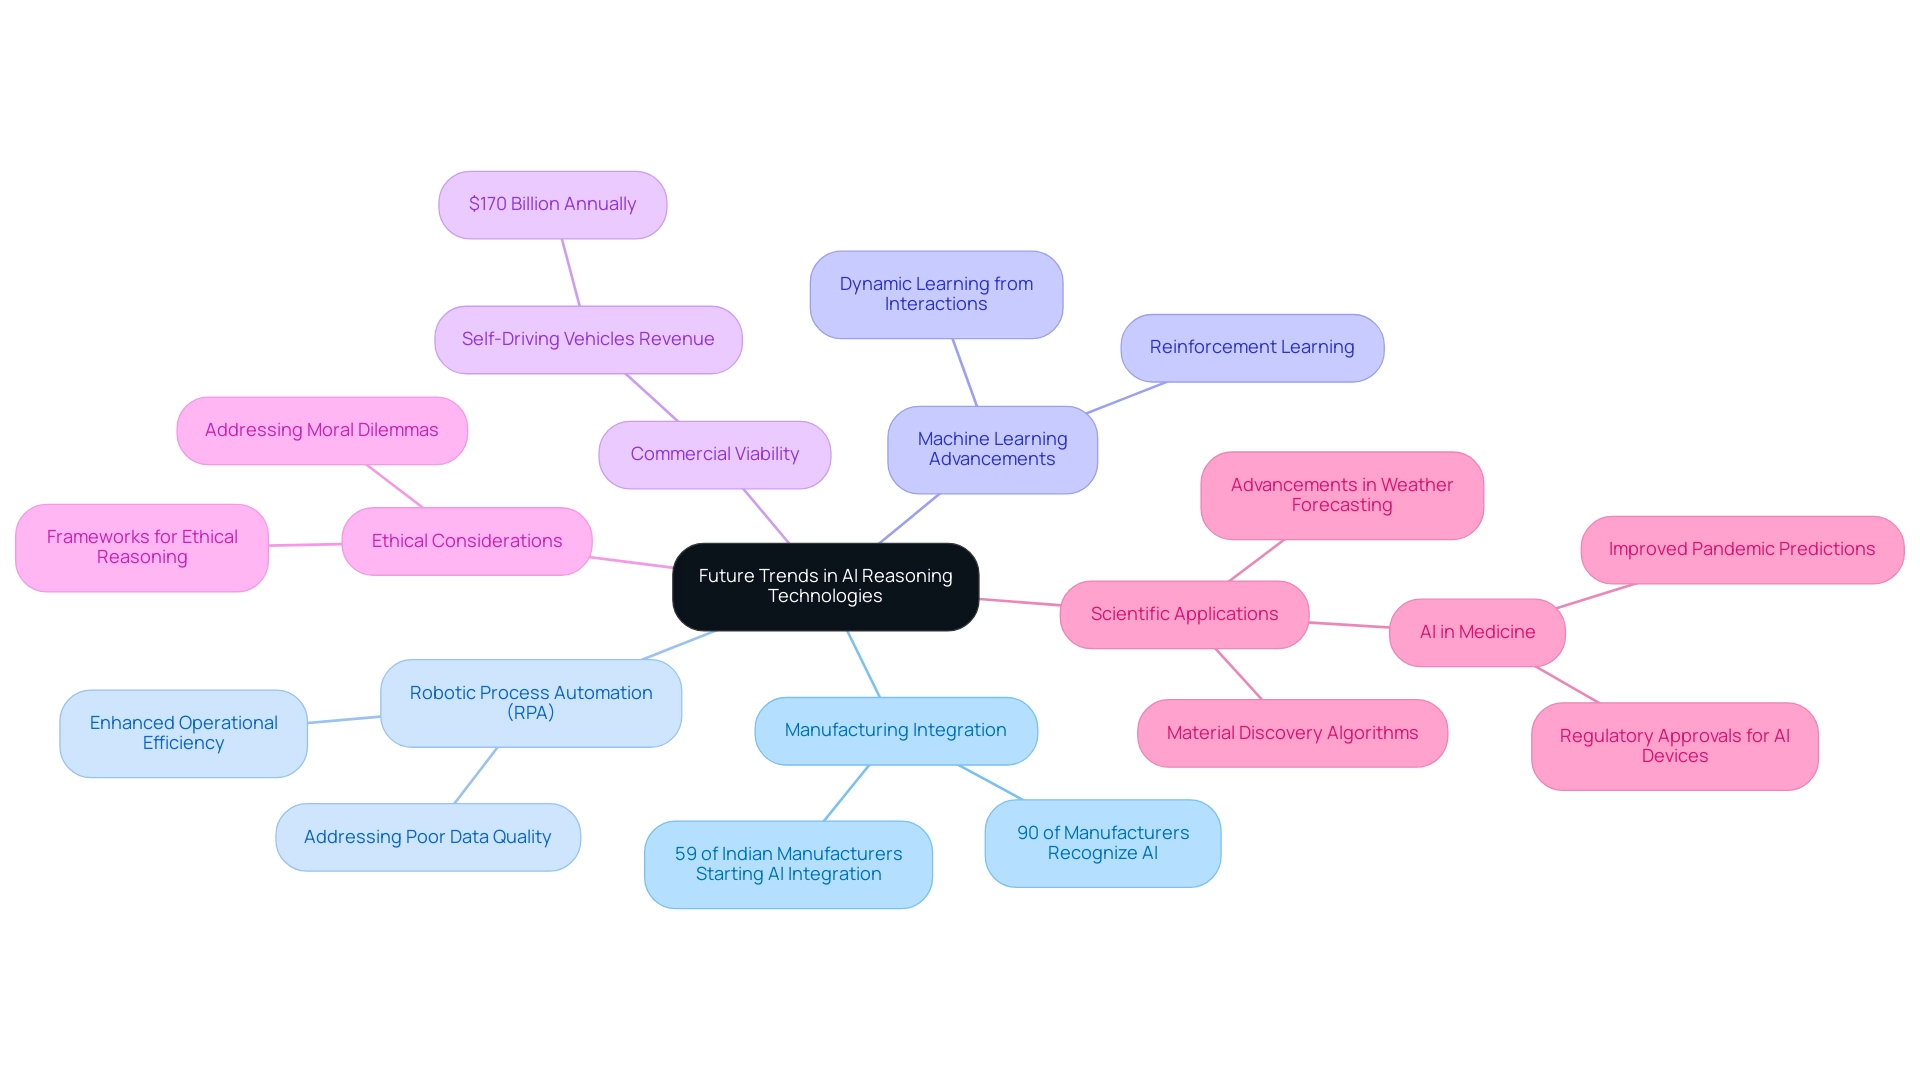
The advancement of AI cognitive systems is introducing numerous crucial trends that organizations need to observe carefully. Currently, over 90% of manufacturing companies recognize AI as integral to their operational strategies, reflecting a significant shift in industry perspectives. Moreover, 59% of manufacturing companies in India are beginning to integrate AI into their processes, showcasing a global trend in AI adoption.
As businesses navigate this landscape, leveraging Robotic Process Automation (RPA) can significantly enhance operational efficiency by automating manual workflows and addressing issues related to poor master data quality, which often leads to inefficient operations and flawed decision-making. This automation allows teams to focus on strategic initiatives. Advances in machine learning, particularly in reinforcement learning, are expected to further empower AI’s capacity to navigate complex scenarios and learn dynamically from interactions.
For instance, AI-powered self-driving vehicles have generated over $170 billion in annual revenue worldwide (MarketWatch), demonstrating the commercial viability of these innovations. Furthermore, incorporating customized AI solutions with new technologies such as the Internet of Things (IoT) and blockchain is poised to develop more advanced cognitive abilities, thus speeding up innovation across different sectors. As ethical considerations gain prominence, future AI systems are likely to incorporate frameworks for ethical reasoning, equipping businesses to tackle complex moral dilemmas effectively.
In the realm of science and medicine, AI is already yielding remarkable outcomes, such as improved pandemic prediction systems and regulatory approvals for AI-enhanced medical devices. Notably, advancements in weather forecasting and material discovery algorithms exemplify AI’s growing role in scientific and medical discovery. By embracing RPA and tailored AI solutions, organizations can not only overcome common adoption hesitations related to complexity and cost but also achieve measurable outcomes such as improved data accuracy, faster decision-making, and enhanced operational productivity, strategically positioning themselves to leverage AI innovations and gain a substantial competitive edge in the rapidly evolving marketplace.
Conclusion
The potential of GPT-4 to revolutionize operational efficiency across industries cannot be overstated. With its advanced human-like reasoning capabilities and vast architecture, this AI system is uniquely positioned to enhance Robotic Process Automation (RPA) and Business Intelligence (BI). Businesses can leverage GPT-4 to streamline workflows, automate manual tasks, and improve decision-making processes, thus fostering innovation and driving sustainable growth.
As organizations navigate the complexities of AI integration, acknowledging both the strengths and limitations of these technologies is imperative. While GPT-4 and similar AI systems can significantly enhance productivity, it is essential to remain vigilant about the ethical implications and biases that may arise from their deployment. By strategically aligning AI solutions with specific business needs, companies can overcome operational challenges and harness the full potential of these transformative tools.
Looking to the future, the integration of AI with emerging technologies presents a wealth of opportunities for enhancing operational capabilities. As industries increasingly recognize the value of AI, those who embrace tailored solutions alongside RPA will find themselves at the forefront of innovation. The journey towards operational excellence is not just about adopting new technologies; it is about fostering a culture of continuous improvement and adaptability. By prioritizing these initiatives, organizations can ensure they remain competitive and responsive to the ever-evolving market landscape.
Overview
Microsoft’s new AI demonstrates human-like reasoning abilities, marking a significant advancement in artificial intelligence that enhances decision-making and operational efficiency across various sectors. The article supports this by detailing how the AI utilizes sophisticated machine learning techniques to interpret context and generate responses, while also discussing the economic implications and practical applications that underscore its transformative potential in business environments.
Introduction
In the rapidly evolving landscape of artificial intelligence, Microsoft’s latest models are setting a new standard by incorporating human-like reasoning capabilities that redefine how organizations interact with technology. These advanced systems move beyond traditional AI limitations, allowing for a nuanced understanding of context and the ability to generate responses that closely mimic human thought.
As businesses increasingly recognize the transformative potential of AI, evidenced by significant investments and a surge in adoption across various sectors, the focus shifts to practical implementation strategies. From enhancing customer service to streamlining operations, the integration of AI presents both opportunities and challenges.
Organizations must navigate data quality issues and employee resistance while leveraging innovative tools to maximize efficiency and drive sustainable growth. This article delves into the multifaceted impact of Microsoft’s AI advancements, offering actionable insights for leaders aiming to harness this technology for operational excellence.
Exploring Microsoft’s New AI: An Overview of Human-Like Reasoning
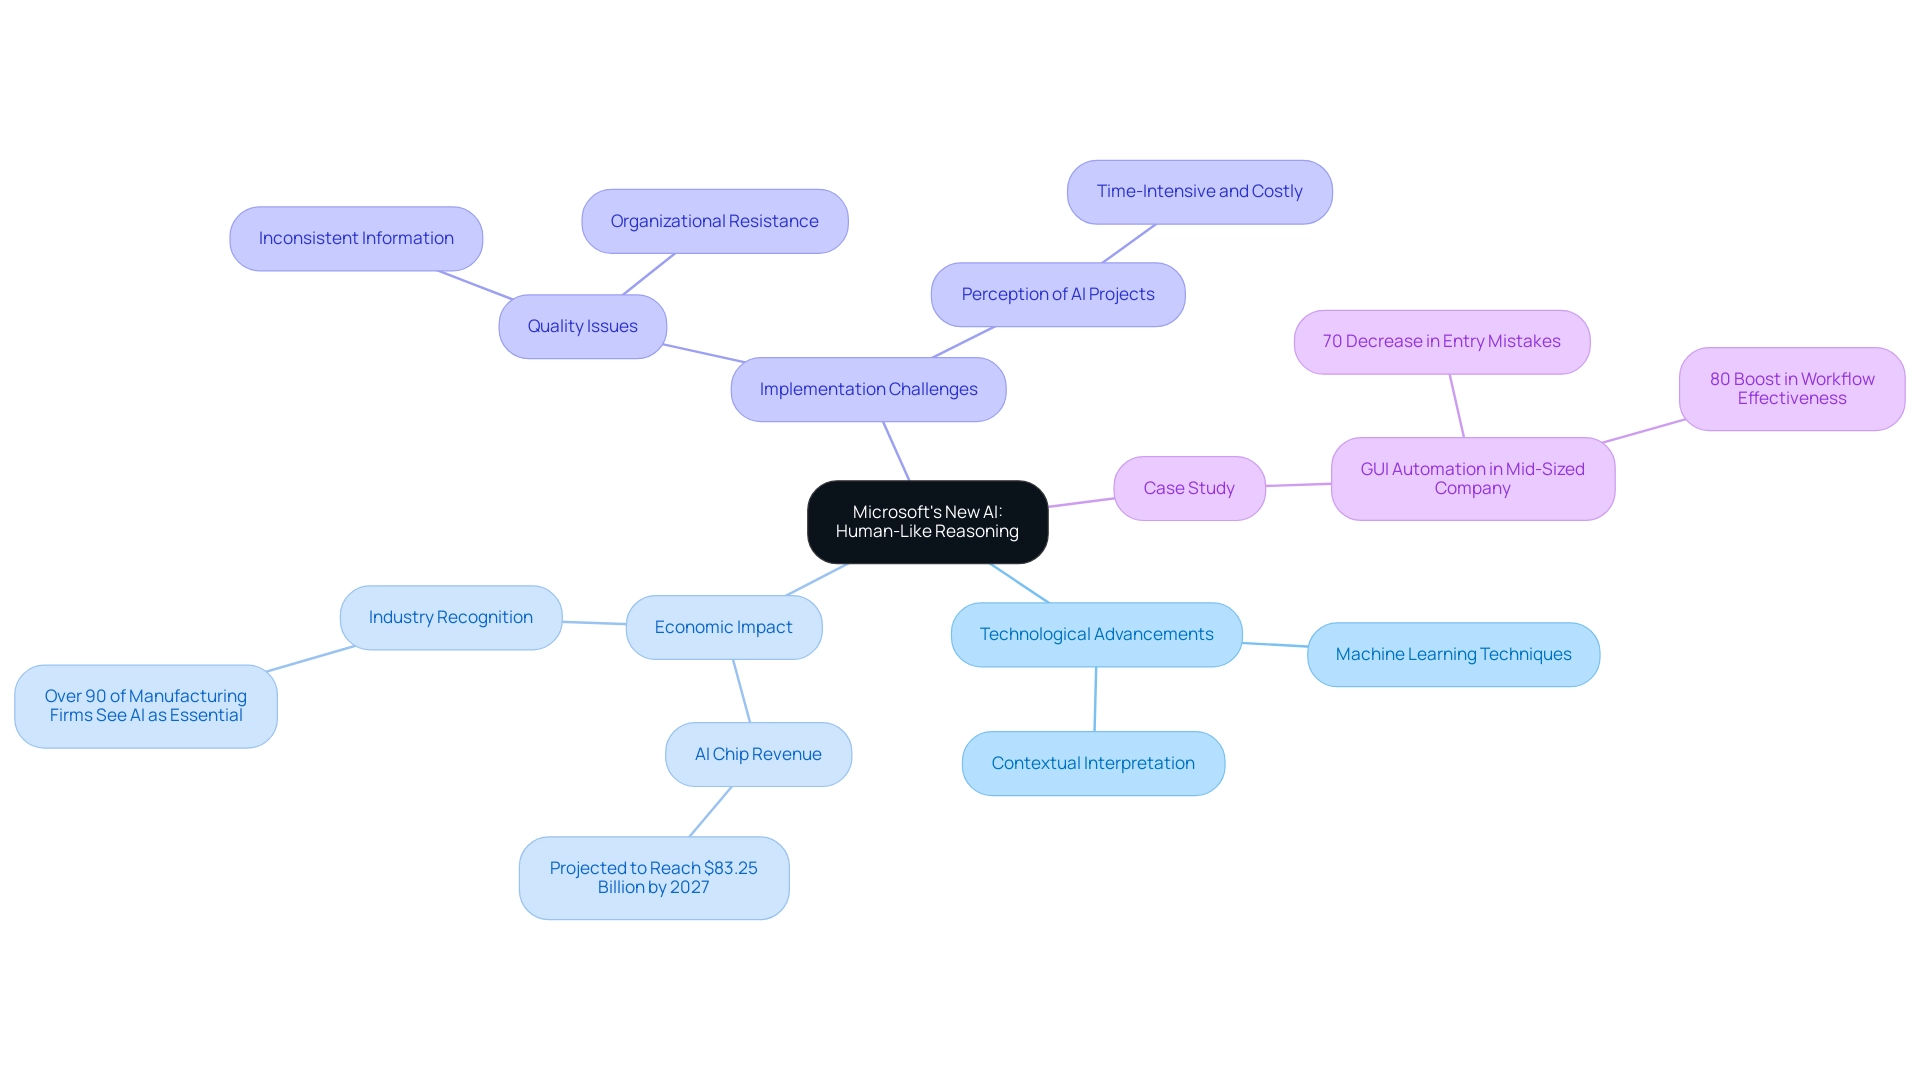
Microsoft’s new AI shows signs of reasoning, signifying a pivotal advancement in artificial intelligence, particularly through their integration of human-like capabilities. These models surpass conventional AI systems, which often rely on inflexible algorithms and unchanging information sets. Instead, they utilize sophisticated machine learning techniques, enabling them to interpret context, draw inferences, and generate responses that mirror human thought processes.
This innovative method enables entities to examine extensive information points, foresee possible results, and adjust reactions in real-time—acting as a crucial resource for improving decision-making and efficiency.
A recent study reveals that over 90% of manufacturing firms regard AI as essential to their strategic objectives, emphasizing the growing recognition of AI’s transformative potential. The projected growth in global AI chip revenue, expected to reach $83.25 billion by 2027, further underscores the economic implications of these advancements. Moreover, the rapid rise in FDA-approved AI-related medical devices—surging more than 45-fold since 2012—demonstrates AI’s extensive impact across diverse sectors.
A key challenge in AI implementation is overcoming quality issues, as many organizations grapple with inconsistent, incomplete, or flawed information, which can hinder effective integration. Additionally, the perception that AI projects are time-intensive, costly, and challenging to implement often leads to organizational resistance. The case study of a mid-sized company illustrates how GUI automation greatly enhanced performance by automating information entry and improving software testing, leading to a 70% decrease in entry mistakes and an 80% boost in workflow effectiveness.
This case study not only addresses common worries about the challenges of AI projects but also demonstrates how Generative AI and Small Language Models (SLMs) can enhance information analysis, offering a secure and cost-effective solution for strategic management and competitive edge.
As awareness and use of AI tools like ChatGPT increase, particularly among younger generations, it is essential for leaders in operational effectiveness to adopt these advancements. By grasping the foundational elements of this technology—its architecture and guiding principles—organizations can utilize Microsoft’s new AI, which shows signs of reasoning, to unlock improved capabilities across various sectors.
The Impact of Human-Like Reasoning on Business and Technology
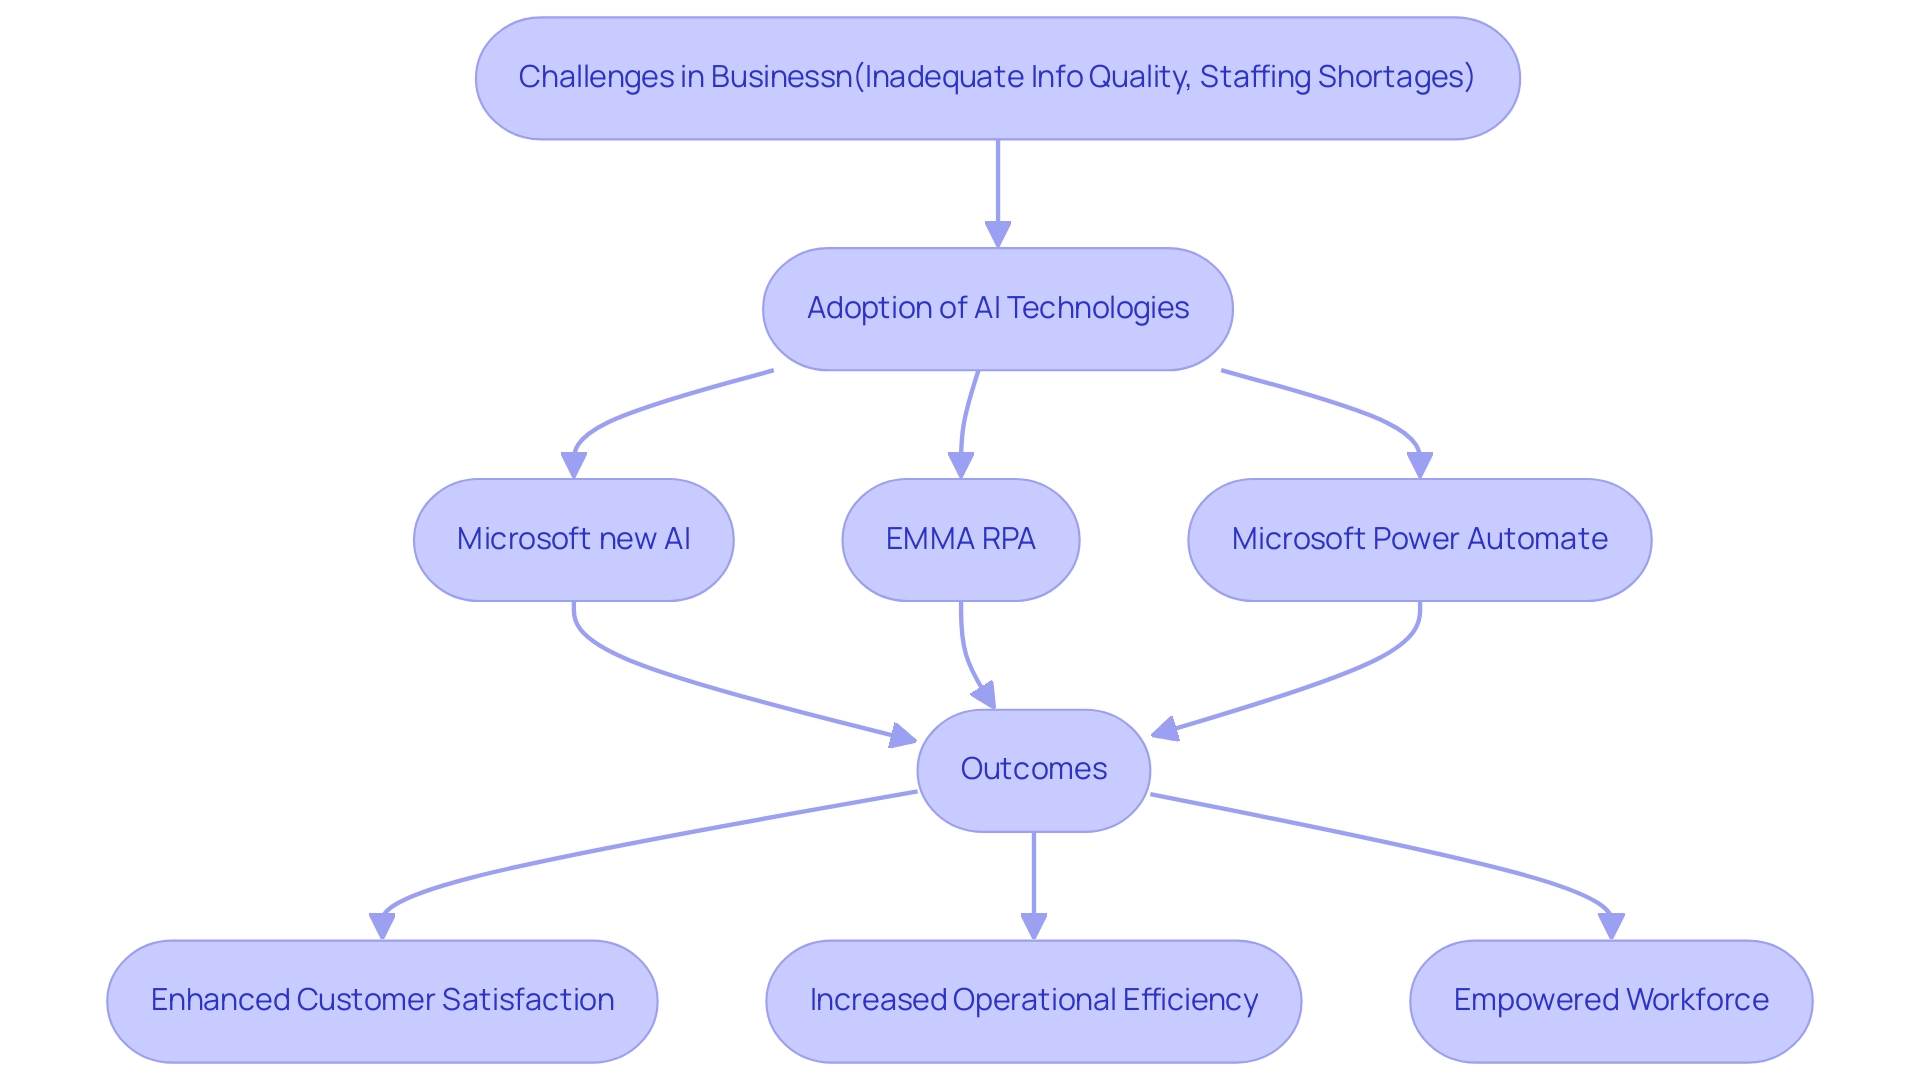
The advent of Microsoft’s new AI shows signs of reasoning and is catalyzing transformative changes across various sectors, particularly in customer service. This advanced technology enables Microsoft new AI, which shows signs of reasoning, to understand and respond to complex inquiries with empathy and context, significantly enhancing customer satisfaction. As organizations encounter challenges such as inadequate information quality and staffing shortages, utilizing tools like EMMA RPA and Microsoft Power Automate becomes essential for automating repetitive tasks, enhancing operational efficiency, and boosting employee morale.
EMMA RPA offers a revolutionary approach to streamline workflows, reduce errors, and enhance productivity by automating routine processes. Meanwhile, Microsoft Power Automate enables businesses to create automated workflows between applications and services, facilitating seamless integration and task management. Notably, 90% of consumers still prefer interacting with a human for customer service, underscoring the necessity for AI to bridge that gap effectively.
The AI customer service sector is projected to reach $4.1 billion by 2027, reflecting a growing reliance on AI solutions. Moreover, AI excels in information analysis, sifting through extensive collections to extract actionable insights that inform strategic decisions. For instance, Plivo CX customizes AI agents to ensure consistent brand messaging and adherence to policies, showcasing practical applications of AI in enhancing customer service experiences.
By adopting these technologies, businesses can automate routine tasks, empowering their workforce to concentrate on higher-level strategic initiatives, thereby enhancing overall productivity. With its machine learning capabilities, AI facilitates continuous refinement of business processes, enabling companies to adapt swiftly to market changes and foster innovation. Consequently, companies are not just enhancing their immediate operational efficiency but also laying the groundwork for sustainable growth and long-term success.
As a testament to AI’s capabilities, it is worth noting that only Zendesk AI is trained on the world’s largest CX dataset, allowing it to understand the intricacies of customer interactions. Furthermore, addressing poor data quality through these solutions ensures that businesses can leverage accurate information for informed decision-making.
Implementing Microsoft’s AI: Practical Steps for Organizations
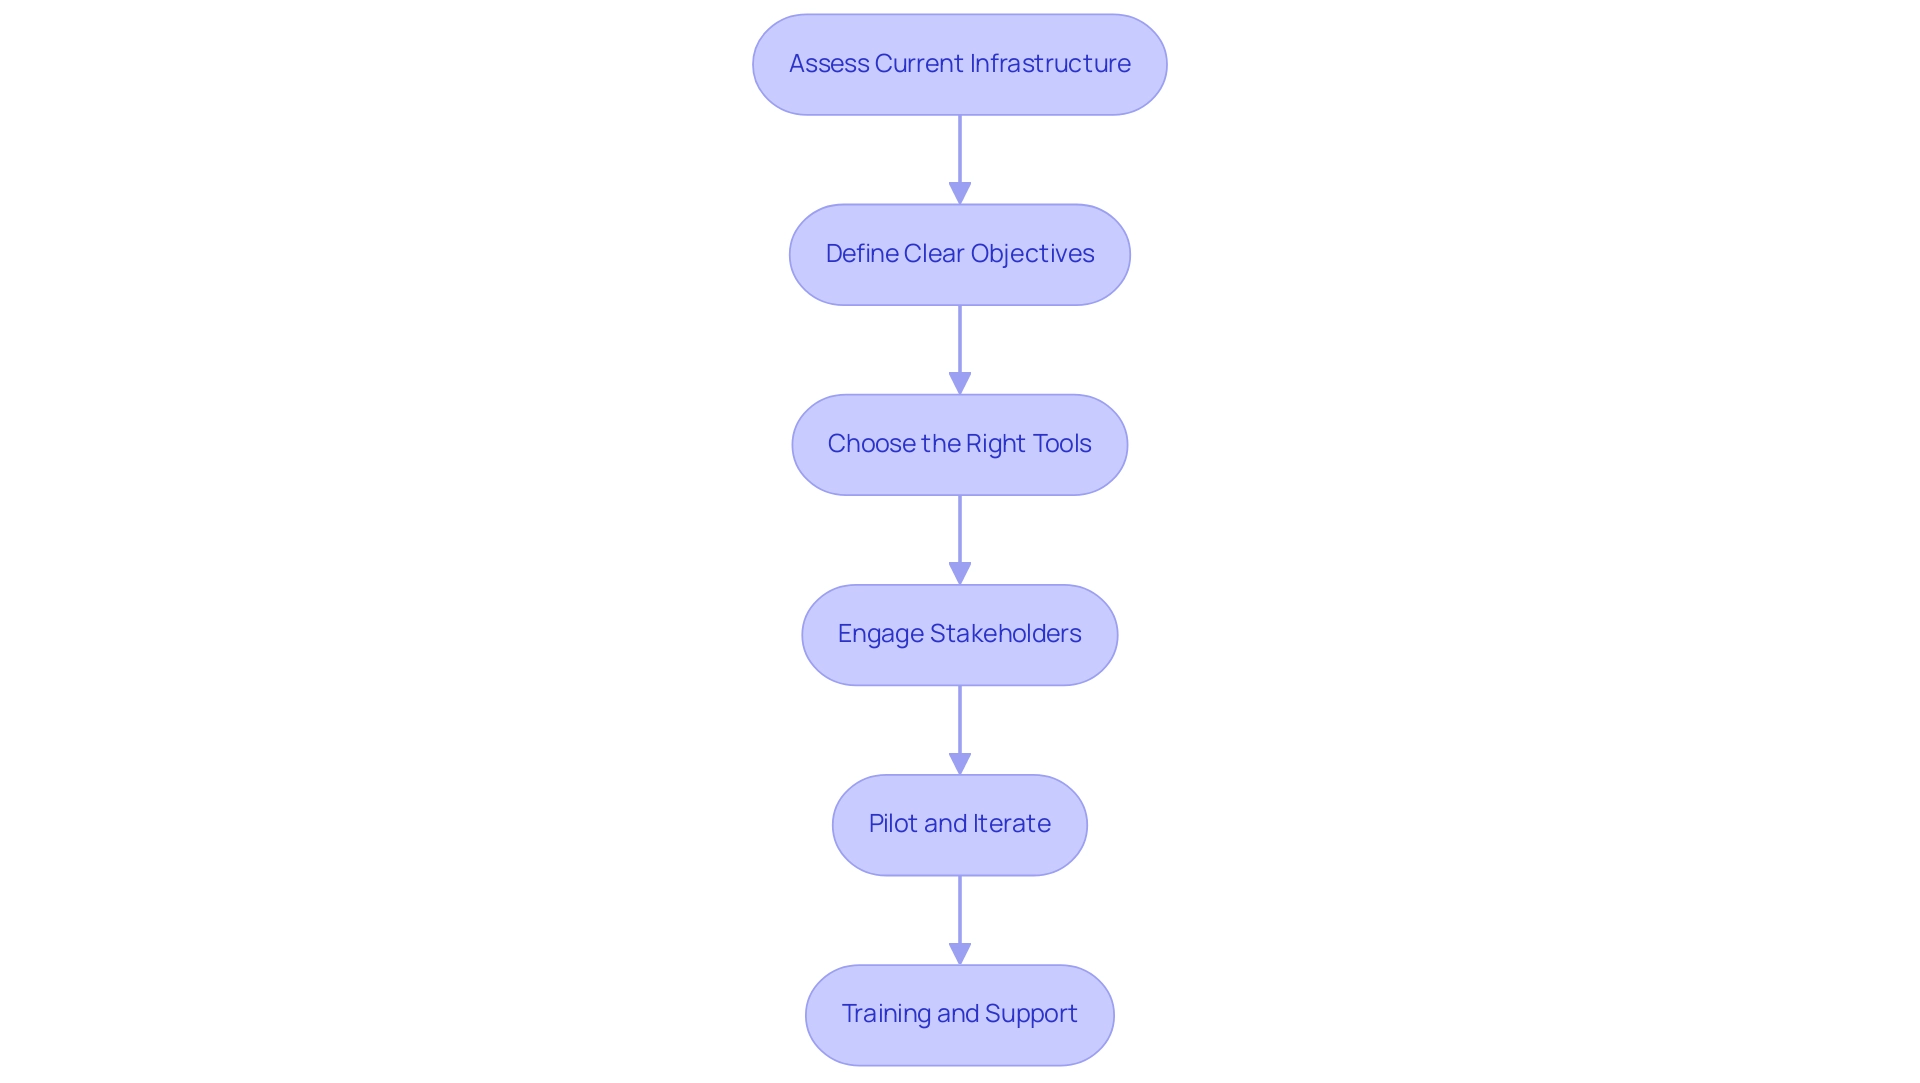
Successfully implementing Microsoft’s groundbreaking AI models requires a strategic approach that addresses both organizational needs and technological capabilities, particularly in overcoming workplace challenges such as repetitive tasks, staffing shortages, and outdated systems. Here are essential steps for effective integration:
-
Assess Current Infrastructure: Begin by evaluating existing technological frameworks and processes to identify how they align with potential AI solutions.
This step ensures that the entity is prepared for a seamless integration of RPA solutions, streamlining operations and enhancing productivity. -
Define Clear Objectives: Establish specific, measurable goals for AI adoption. Whether the aim is to enhance customer service through personalized experiences or automate repetitive tasks that hinder efficiency, clarity in objectives is crucial for guiding the implementation process.
-
Choose the Right Tools: Select AI tools and platforms that align with the entity’s strategic goals and technical capabilities. A thoughtful selection process can significantly impact the effectiveness of AI initiatives in achieving desired outcomes, particularly in integrating generative AI capabilities to foster innovation.
-
Engage Stakeholders: Involve key stakeholders—such as IT and departmental leaders—early in the planning process.
Their insights and support can foster a more collaborative environment, ensuring alignment with broader business objectives and enhancing talent retention through active participation. -
Pilot and Iterate: Launch a pilot project to test the AI solution in a controlled setting. This approach enables companies to gather feedback, identify challenges, and fine-tune the implementation before scaling it across the enterprise, mitigating risks associated with new technologies.
-
Training and Support: Invest in comprehensive training programs for employees, similar to our GenAI workshops, to maximize the benefits of AI tools. These workshops concentrate on practical skills and real-world applications, ensuring that staff members are well-equipped to leverage AI effectively, driving continuous improvement in operations.
Embracing AI and machine learning technologies not only elevates operational efficiency but also positions entities advantageously in a competitive landscape. As noted by McKinsey, operationalizing responsible AI, focusing on end-to-end processes from use case assessment to performance monitoring, will better align with forthcoming regulations and societal expectations, ultimately enhancing their ROI. The case study ‘Advancing Responsible AI Efforts’ illustrates how entities can establish clear ownership and integrate AI across all business aspects, which is vital for addressing various risk domains holistically.
This generational moment for technology, especially with generative AI, underscores the strategic importance of AI integration in entities. For further insights and personalized support, book a free consultation with our team today.
Measuring Success: Metrics for AI Implementation
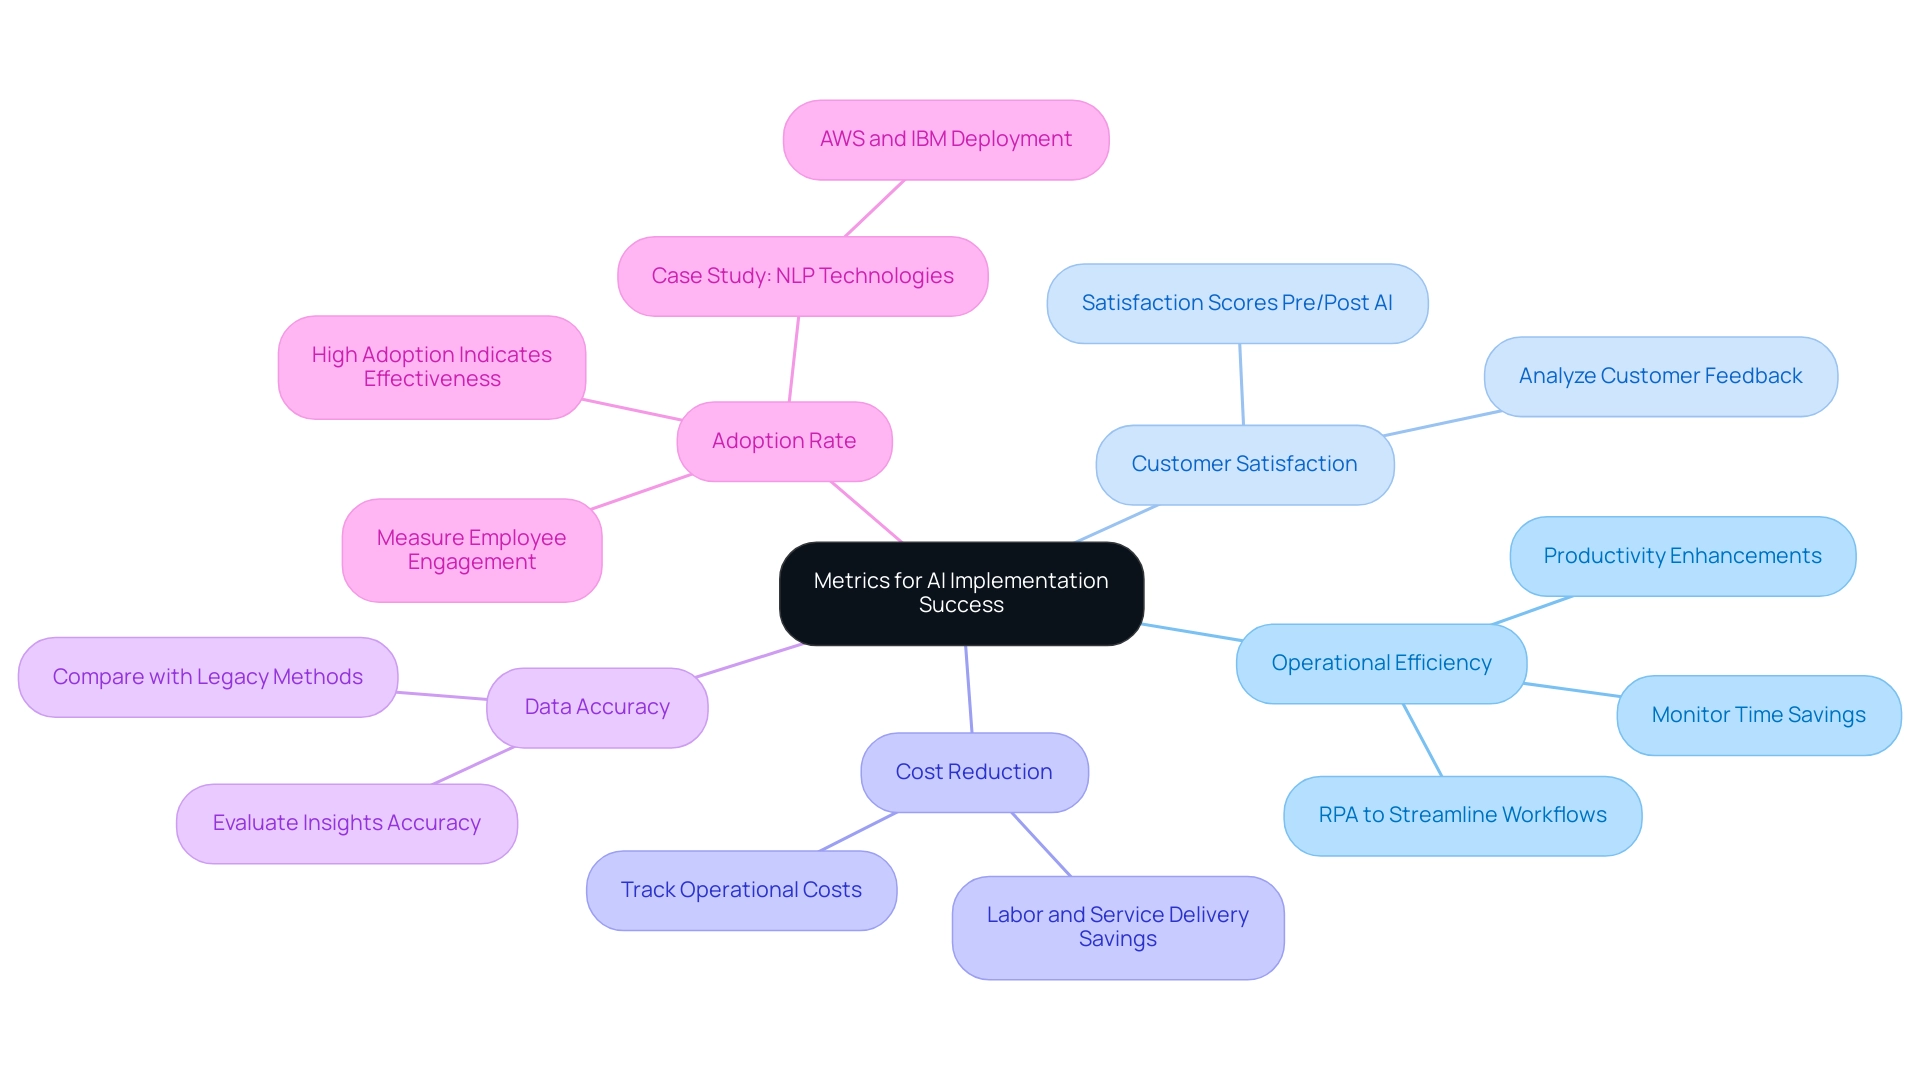
To effectively measure the success of AI implementation, organizations must adopt a comprehensive set of metrics that reflect both performance gains and user experiences. Here are key metrics to consider:
-
Operational Efficiency: Monitor time savings and productivity enhancements driven by AI automation.
Leverage Robotic Process Automation (RPA) to streamline manual workflows, enabling substantial improvements in workflow efficiency that lead to better resource allocation. This is particularly relevant given that 85% of the general public believes a nationwide effort is necessary to make AI safe and secure, highlighting the importance of responsible AI deployment. -
Customer Satisfaction: Conduct an analysis of customer feedback and satisfaction scores both before and after AI deployment.
This will provide valuable insights into how tailored AI solutions enhance service quality and customer interactions. -
Cost Reduction: Track operational costs post-AI integration, particularly in labor and service delivery.
Understanding these financial impacts can reveal significant savings and justify further investment in AI technologies and RPA, promoting enhanced business productivity. This aligns with the context’s emphasis on lowering costs through effective AI solutions. -
Data Accuracy: Evaluate the accuracy of insights generated by the AI system compared to legacy methods.
Reliable data is crucial for informed decision-making, and improvements in data accuracy through Business Intelligence can lead to better business strategies. -
Adoption Rate: Measure how actively employees engage with AI tools.
High adoption rates can indicate that the technology is being embraced and utilized effectively within the organization.
A pertinent case study is the deployment of Natural Language Processing (NLP) technologies by companies like Amazon Web Services (AWS) and IBM, which has significantly enhanced user experiences. By establishing these metrics, organizations can gain a clear picture of AI’s impact on their operations.
According to industry expert Robert Kugel,
Simple applications [of AI] are likely to produce an underappreciated boost to productivity,
which underscores the potential of AI and RPA to transform business processes. Additionally, as the demand for AI skills escalates, aligning these metrics with broader capabilities will ensure a robust evaluation framework for ongoing AI initiatives. For more insights and to explore tailored AI solutions that fit your business needs, read our latest publication.
Overcoming Challenges in AI Adoption: Strategies for Success
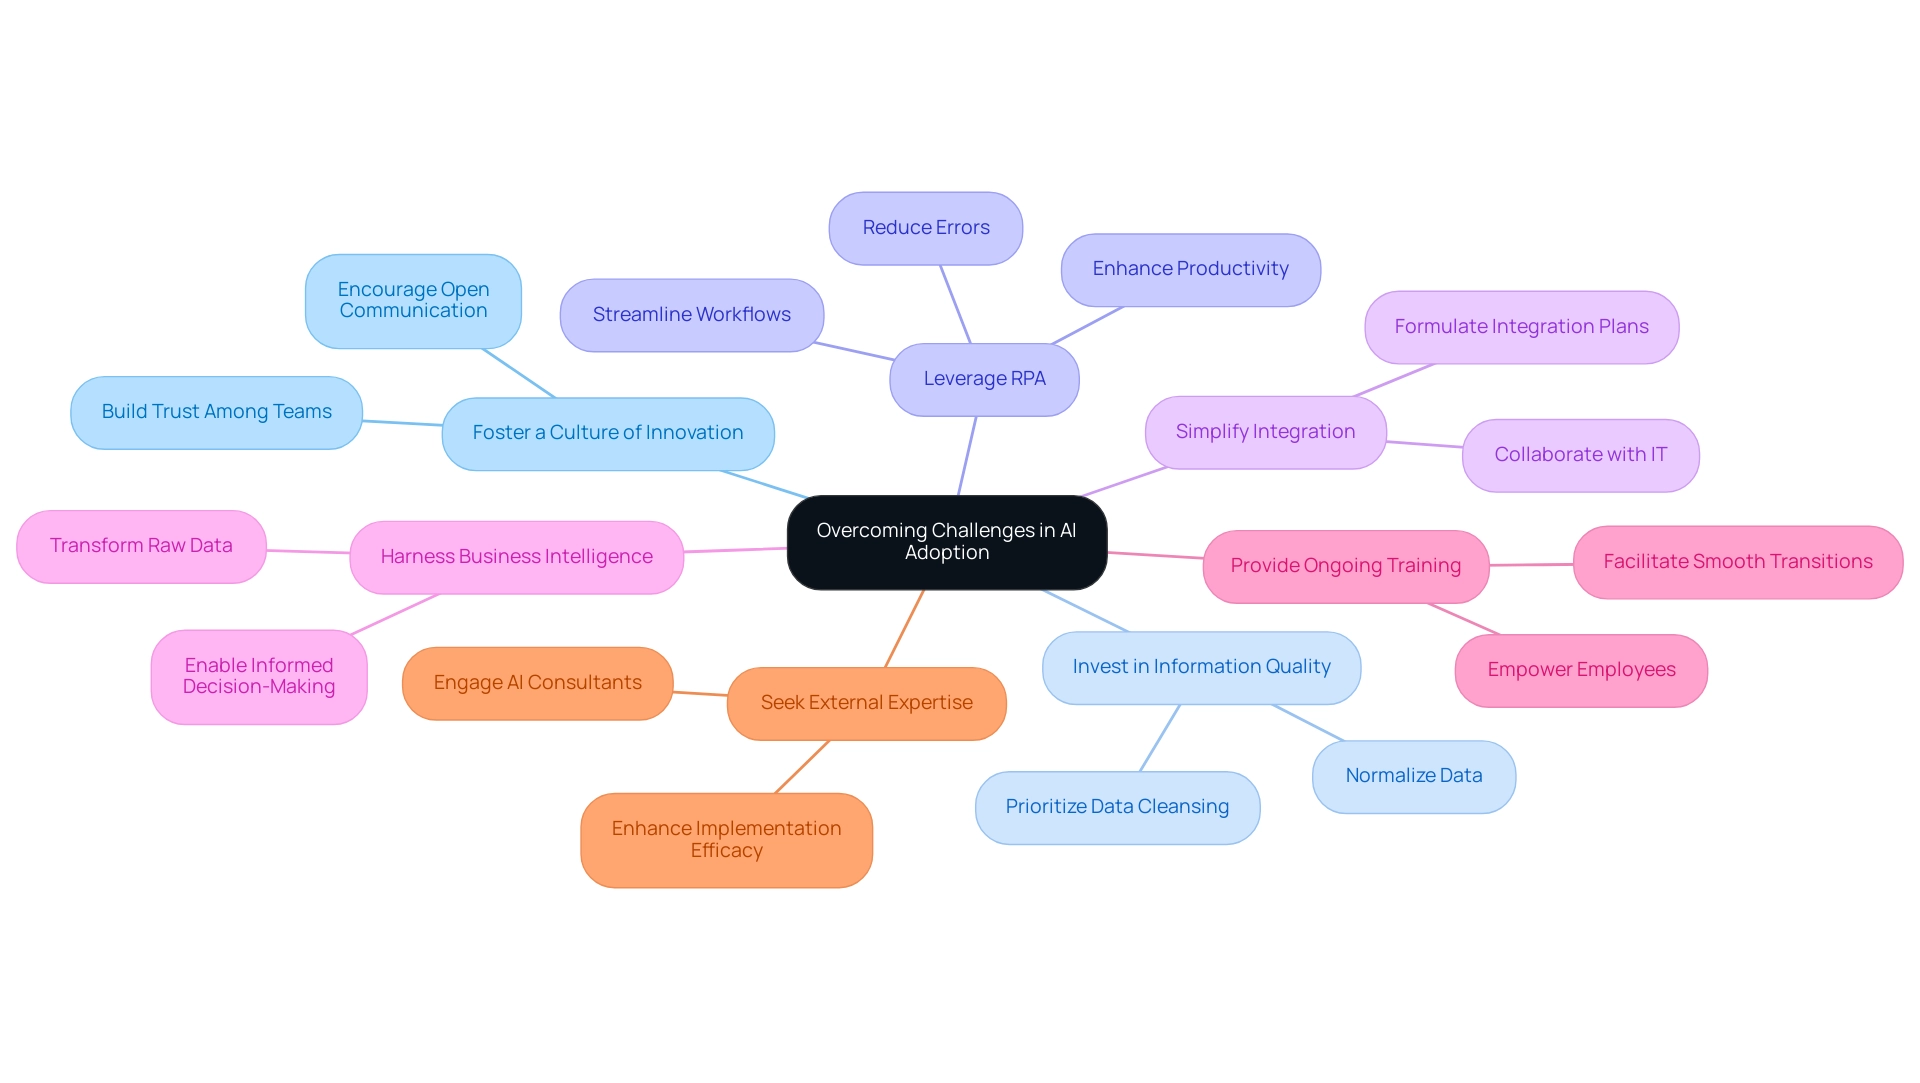
Organizations today encounter a myriad of challenges when implementing AI, with research indicating that approximately 70% of these issues are rooted in people- and process-related obstacles. Significantly, tackling resistance from employees, ensuring information quality, and navigating integration complexities are crucial for success. To effectively overcome these hurdles and improve operational performance, consider the following strategies:
- Foster a Culture of Innovation: Cultivating an environment that encourages open communication and collaboration can significantly reduce resistance to change while building trust among teams.
- Invest in Information Quality: Prioritizing cleansing and normalization is crucial, as AI systems rely on high-quality information to generate accurate insights.
- Leverage RPA: Implementing Robotic Process Automation can streamline workflows, enhance productivity, and reduce errors, freeing up your team to focus on more strategic, value-adding work.
- Simplify Integration: Collaborating with IT to formulate a seamless integration plan helps minimize disruptions and guarantees compatibility with existing systems.
- Harness Business Intelligence: Unlock the power of Business Intelligence to transform raw data into actionable insights, enabling informed decision-making that drives growth and innovation.
Not utilizing RPA and BI can leave your entity at a competitive disadvantage, as these technologies are essential for operational efficiency.
- Provide Ongoing Training: Continuous learning opportunities empower employees to adapt to new technologies and recognize their benefits, facilitating smoother transitions.
- Seek External Expertise: Engaging AI consultants or vendors can provide valuable support and guidance throughout the implementation process, enhancing the overall efficacy of your initiatives.
By proactively tackling these challenges and leveraging RPA and BI, organizations can significantly increase their chances of successful AI adoption, unlocking transformative benefits and potentially achieving an impressive average ROI of 10.3 times the initial investment, as seen in top-performing generative AI implementations.
Furthermore, the case study titled ‘Generative AI Returns’ illustrates that generative AI companies report an average ROI of 3.7x from their initial investment, with top performers achieving 10.3 times return, demonstrating the potential of generative AI to drive business growth through content creation and process automation.
Conclusion
Microsoft’s advancements in AI, particularly those featuring human-like reasoning, are not just reshaping technology but redefining operational landscapes across industries. These sophisticated models allow organizations to interpret complex data, enhance decision-making, and significantly improve customer interactions. As demonstrated, the integration of AI tools like EMMA RPA and Microsoft Power Automate can streamline workflows, reduce errors, and elevate productivity, addressing critical challenges such as staffing shortages and outdated systems.
To successfully implement these technologies, organizations must adopt a strategic approach that includes:
1. Assessing current infrastructure
2. Defining clear objectives
3. Engaging stakeholders
Additionally, measuring success through relevant metrics—such as operational efficiency, customer satisfaction, and data accuracy—will provide insights into the effectiveness of AI initiatives. Organizations that prioritize these steps can effectively harness AI to drive sustainable growth and innovation.
Overcoming the challenges associated with AI adoption is crucial. By fostering a culture of innovation, investing in data quality, and providing ongoing training, organizations can facilitate smoother transitions and enhance operational efficiency. The potential for significant ROI further underscores the importance of embracing AI technologies. As businesses navigate this transformative era, the strategic integration of AI will be pivotal in achieving operational excellence and maintaining a competitive edge in an increasingly digital landscape.
Overview
To create a bell curve in Power BI, one must prepare the data, calculate the mean and standard deviation using DAX functions, and then visualize the distribution through a line chart. The article outlines these steps while emphasizing the importance of statistical accuracy and data integrity to ensure meaningful insights and effective decision-making in business intelligence applications.
Introduction
In the realm of data analysis, the bell curve emerges as a vital instrument that not only simplifies complex information but also enhances strategic decision-making. As organizations grapple with the intricacies of data distribution in an increasingly automated landscape, understanding the significance of the normal distribution becomes paramount.
This article delves into the mechanics of creating a bell curve in Power BI, illustrating step-by-step how to leverage this powerful visualization tool to transform raw data into actionable insights. From identifying key statistical functions to troubleshooting common pitfalls, readers will discover practical strategies to harness the bell curve’s full potential, driving operational efficiency and informed decision-making in their organizations.
With the integration of Robotic Process Automation (RPA), the journey towards data mastery becomes even more achievable, empowering teams to focus on analysis rather than mundane data handling.
Understanding the Bell Curve: Definition and Importance
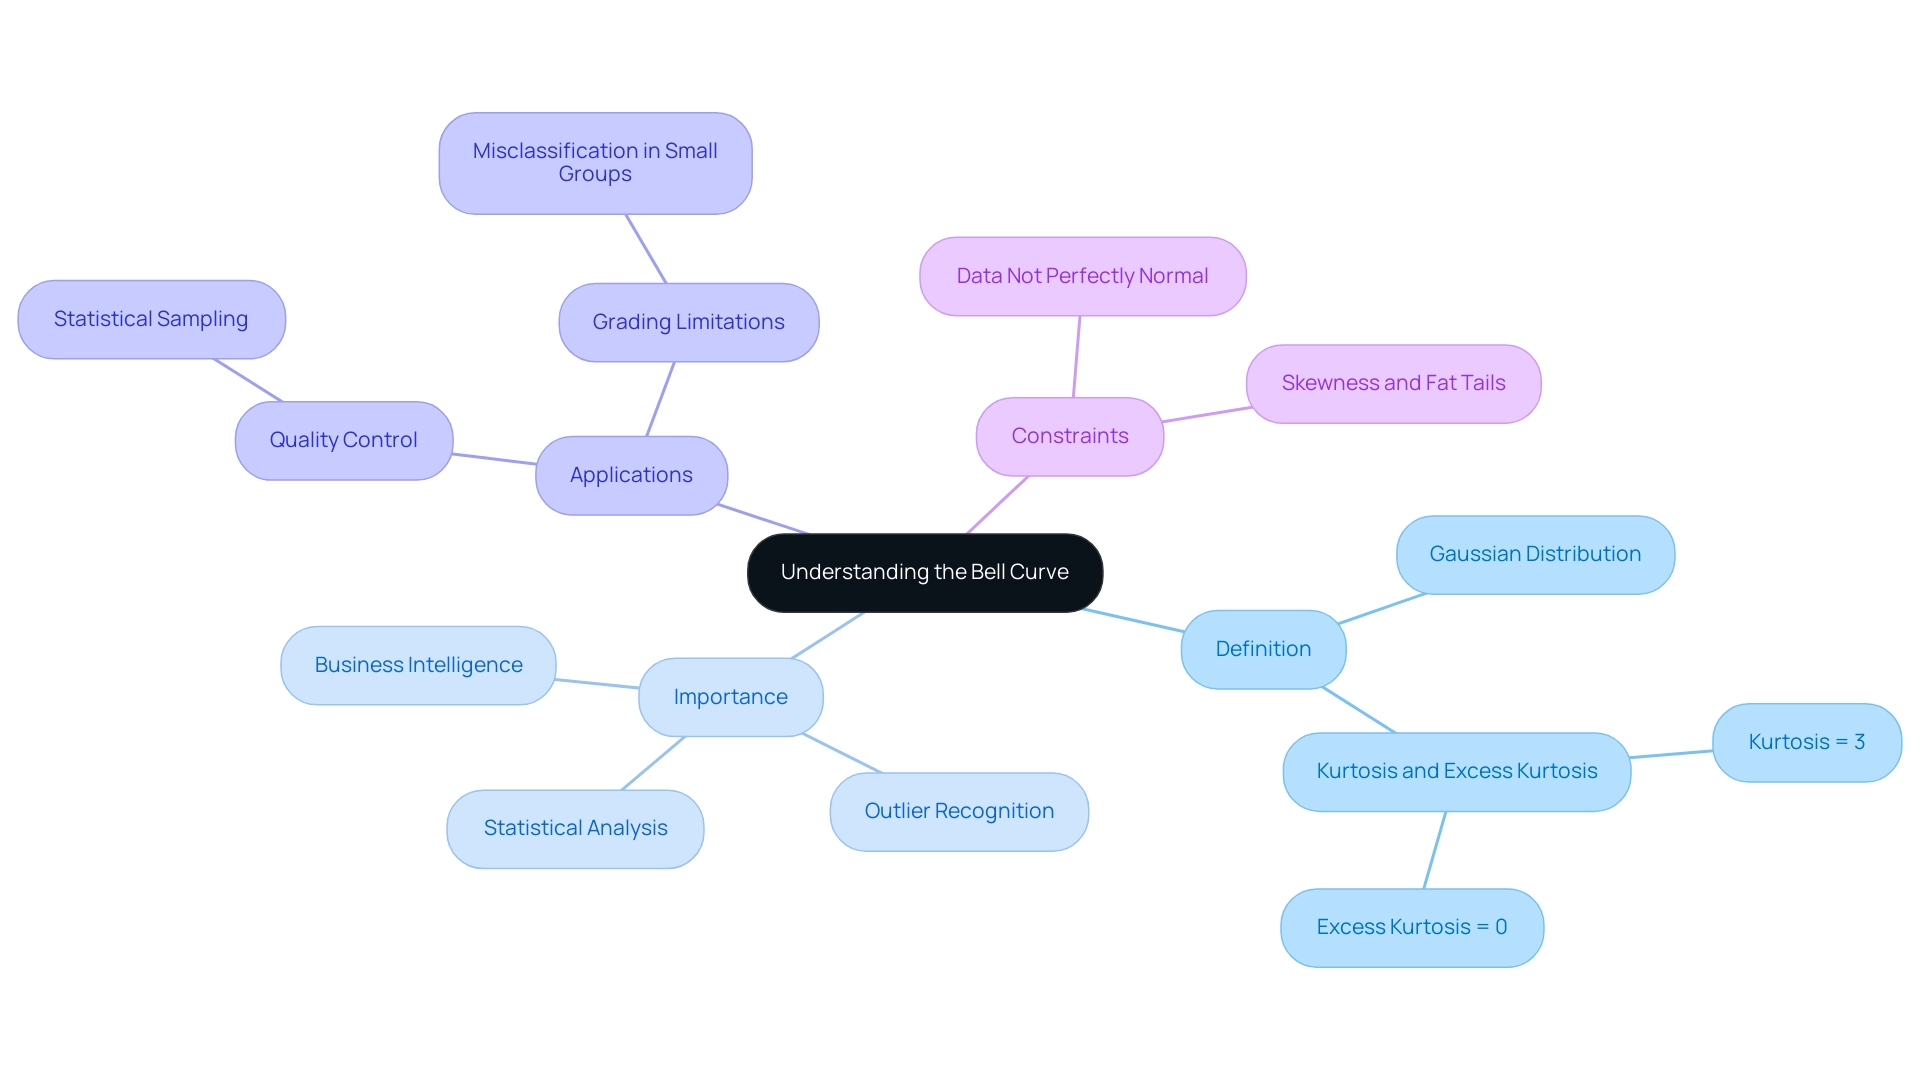
The Gaussian distribution, or normal distribution, acts as an essential tool in statistical analysis, visually demonstrating how values group around a central average. Its characteristic shape peaks at the mean, median, and mode, providing valuable insights into trends and enhancing Business Intelligence efforts. In the setting of a dominant AI environment, comprehending the distribution pattern can assist companies in maneuvering through different choices by offering insight on information allocation.
Notably, a normal distribution has a kurtosis of 3, with an excess kurtosis of 0, essential for understanding the distribution’s shape and behavior. One of the most persuasive reasons to comprehend the distribution is its function in recognizing outliers and enabling informed decision-making grounded in solid statistical analysis. In fact, approximately 99.7% of points fall within three standard deviations of the mean, underscoring its relevance in various applications, especially when addressing challenges like time-consuming report creation and inconsistencies often encountered in Power BI dashboards.
Unlocking the power of Business Intelligence to transform raw data into actionable insights is vital, and creating a distribution visualization within Power BI enables analysts to clearly see the spread of data points, empowering them to extract improved insights for strategic planning. As noted by industry expert Julie Bang, ‘The high performers and the lowest performers are represented on either side with the dropping slope,’ emphasizing how this statistical tool can highlight performance variations. Additionally, recent research shows that the distribution remains crucial in quality control processes, such as in metal fabrication, where statistical sampling aids in estimating population traits from smaller subsets, enhancing operations’ feasibility and cost-effectiveness.
Comprehending the constraints of utilizing a normal distribution is similarly important. For instance, using the bell curve power bi for grading can misclassify individuals, particularly in smaller groups where information often isn’t perfectly normal. This can push all individuals into average categories despite varying performance levels, as highlighted in the case study titled ‘Limitations of a Bell Curve Power BI Analysis.’
This insight underscores the necessity of integrating normal distribution principles into data-driven decision-making in business, particularly in leveraging BI and RPA to enhance operational efficiency and drive growth.
Step-by-Step Guide to Creating a Bell Curve in Power BI
-
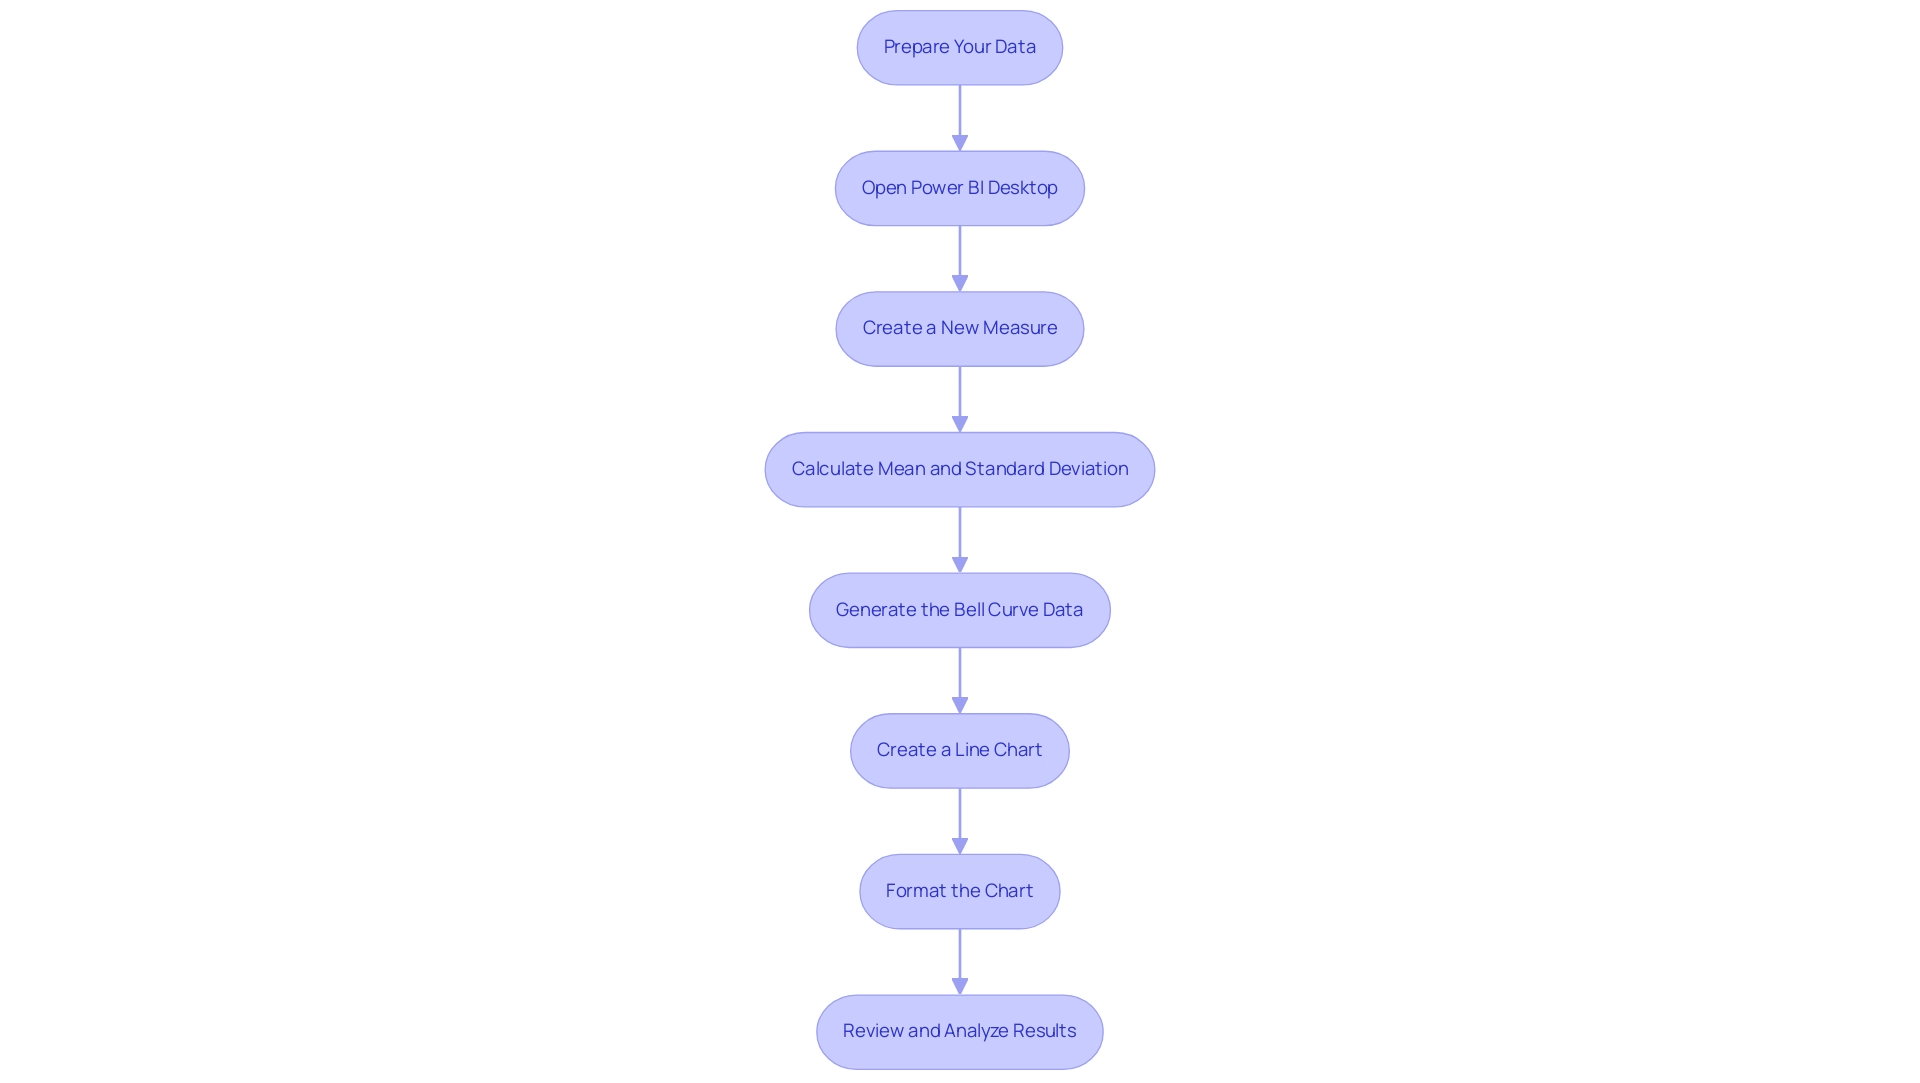
Prepare Your Data: Begin by ensuring your dataset is clean and organized. A numerical column is essential for analysis, so check for any inconsistencies or missing values. This foundational step is crucial to avoid the common challenge of inconsistencies that can undermine your insights.
-
Open Power BI Desktop: Launch Power BI Desktop and import your cleaned dataset to set the stage for your analysis. This is where Business Intelligence tools can convert your raw information into actionable insights.
-
Create a New Measure: Navigate to the ‘Modeling’ tab and select ‘New Measure’. This step is crucial as it allows you to calculate the mean and standard deviation for your dataset, empowering you to derive significant statistics.
-
Calculate Mean and Standard Deviation: Use DAX formulas to derive these statistical measures. For instance:
- Mean:
Mean = AVERAGE(YourTable[YourColumn]) -
Standard Deviation:
StdDev = STDEV.P(YourTable[YourColumn]) -
Generate the Bell Curve Power BI Data: Formulate another table that captures a range of values surrounding the mean. Employ the NORM.DIST function to calculate the distribution values related to these points, which is essential in illustrating the information distribution and providing clarity within intricate datasets.
-
Create a Line Chart: Select the line chart visualization option and plot your data against the established range of values, effectively transforming your statistical measures into a visual representation. This visual clarity is essential to combat the issue of reports filled with numbers but lacking actionable guidance.
-
Format the Chart: Enhance your chart’s clarity by customizing it with appropriate labels, titles, and color schemes. A well-organized chart not only enhances readability but also facilitates effective communication of findings, countering the prevalent confusion arising from poorly presented data.
After constructing your bell curve power bi, it is important to take the time to review and analyze the results. This step is essential for extracting meaningful insights from your information distribution, enabling you to recognize trends and outliers. As you analyze, consider how Robotic Process Automation (RPA) can streamline information collection and reporting processes, enhancing operational efficiency and decreasing the time spent on report creation. Pay special attention to outliers, such as the statistic regarding cars sold for over 180 thousand Reais, as these can significantly affect your interpretation and the overall distribution visualization. By addressing these steps and challenges, you empower your organization to leverage insights effectively, driving growth and operational efficiency.
Utilizing DAX and Statistical Functions for Bell Curve Creation
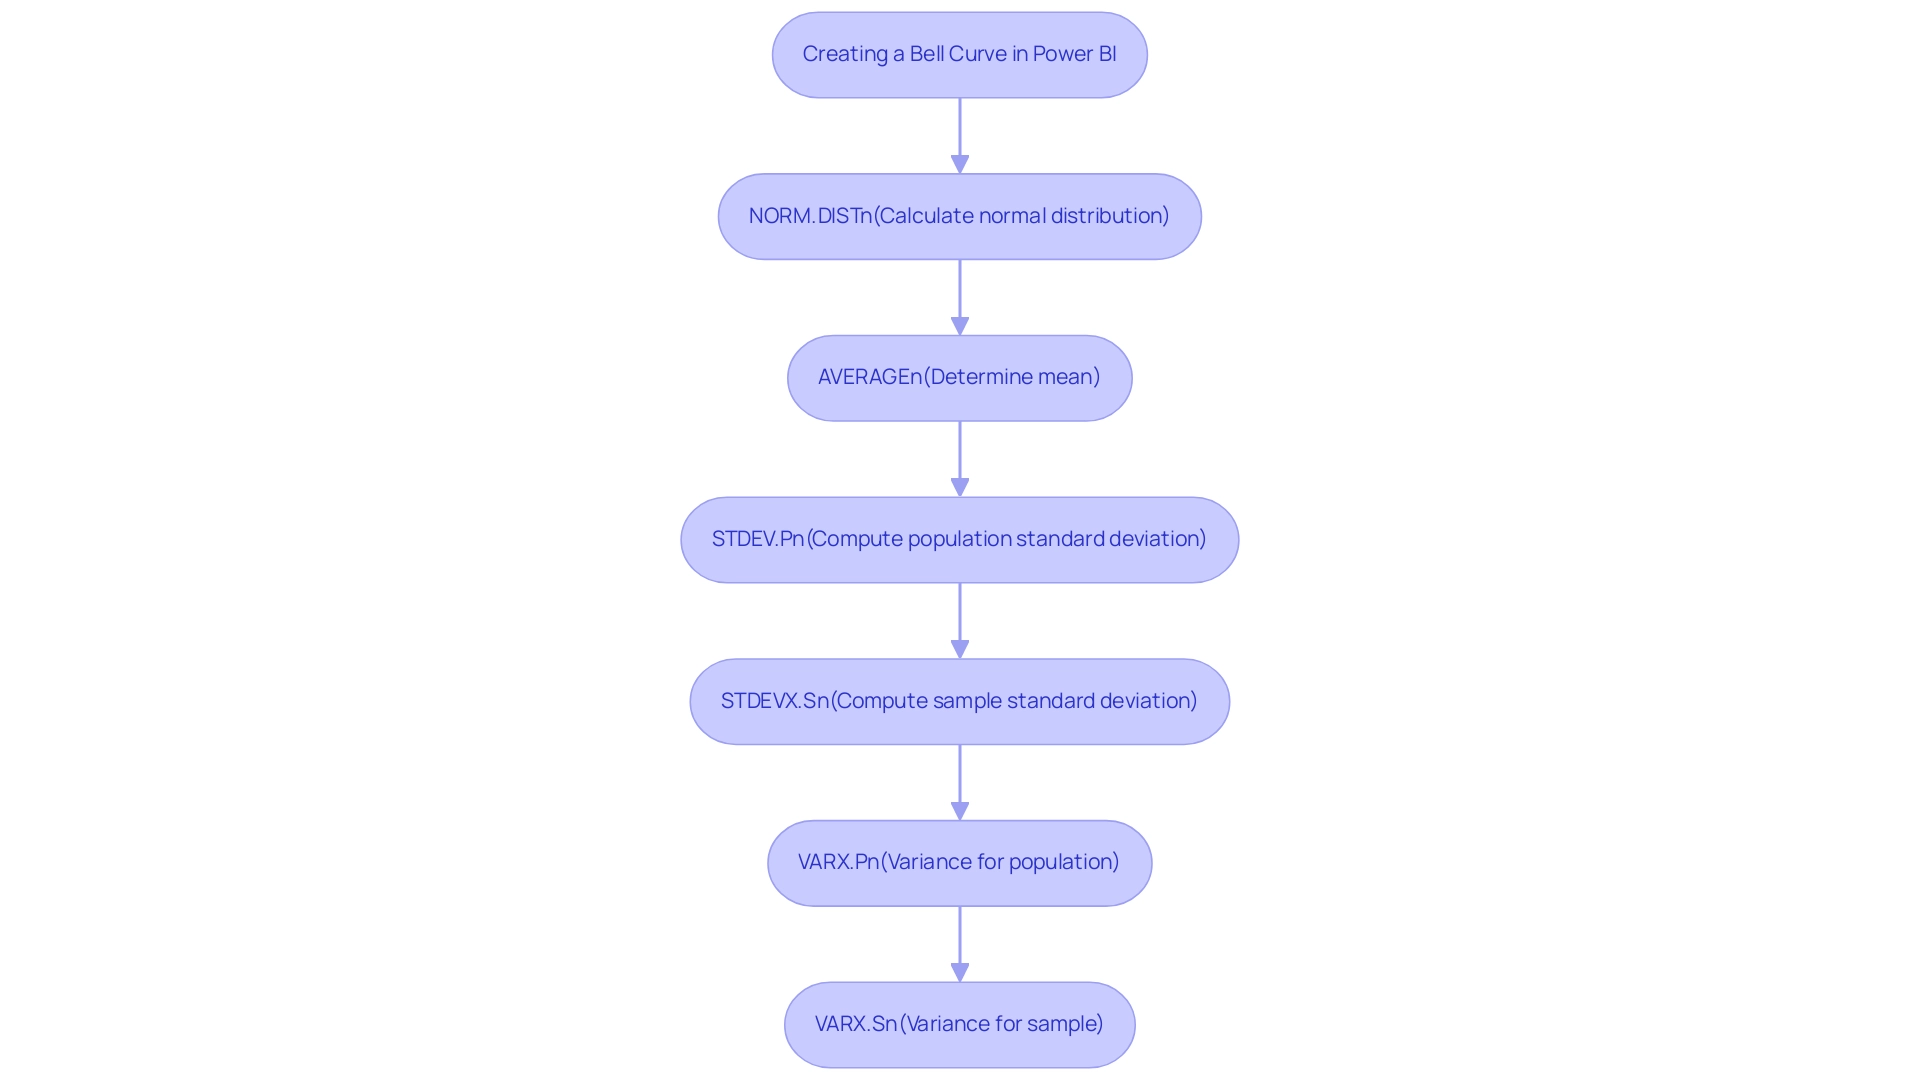
To effectively create a bell curve in Power BI, several DAX functions are essential for accurate data representation, which directly support your goals of enhancing operational efficiency and leveraging Business Intelligence:
- NORM.DIST: This crucial function calculates the normal distribution for a specified mean and standard deviation, utilizing the syntax:
NORM.DIST(x, mean, standard_dev, cumulative). Mastering this function allows you to visualize the probability of a dataset falling within a specific range, a key aspect of statistical analysis that empowers informed decision-making. - AVERAGE: Employ this function to determine the mean of your dataset. The average serves as the focal point of the distribution, offering a basis for your analysis.
- STDEV.P: This function computes the population standard deviation, a vital component that influences the width of your bell curve. Understanding population variance is critical for accurate visualizations.
Additionally, consider using STDEVX.S for sample standard deviation and VARX.P and VARX.S for variance calculations, which can further enhance your statistical analysis. However, many businesses encounter challenges in leveraging insights from Power BI dashboards, such as time-consuming report creation and inconsistencies in information. This is where Robotic Process Automation (RPA) solutions can play a pivotal role.
By automating repetitive tasks and streamlining information processes, RPA enhances operational efficiency, allowing teams to focus on analysis rather than entry. When merged, these functions produce the essential points for your bell curve Power BI visualization, which facilitates precise statistical analysis and enables improved decision-making. The recent advancements in DAX for information visualization in 2024 have further refined these tools, making it more straightforward to implement complex statistical measures.
As noted by Walter Shields, an expert in analytics, ‘the integration of these functions opens new avenues for interpretation and visualization, empowering users to leverage analytics effectively.’ Furthermore, a case study titled ‘Visualizing Statistical Measures‘ illustrates the challenges of visualizing percentiles and quartiles in Power BI, highlighting the importance of using DAX functions to overcome limitations in built-in summaries. This practical insight emphasizes the importance of mastering these statistical tools for effective visualization, ultimately driving business growth.
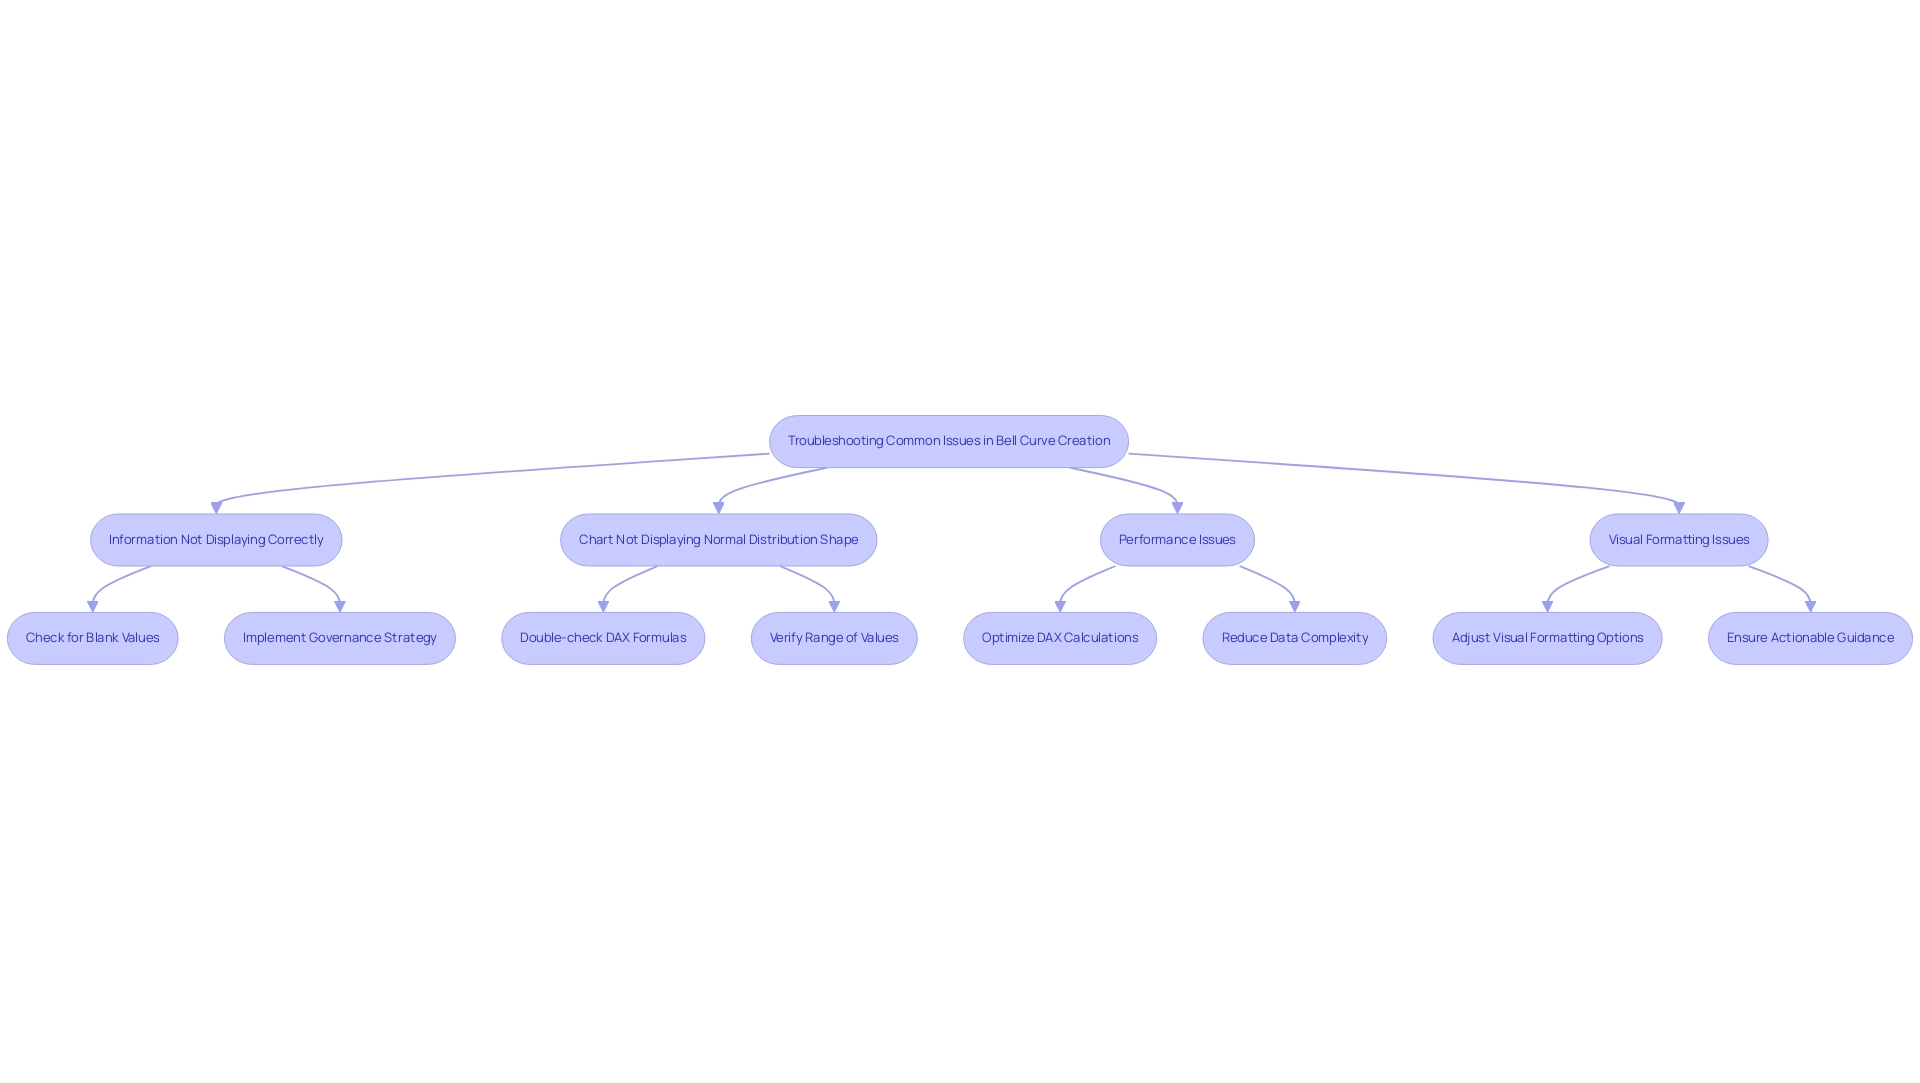
Troubleshooting Common Issues in Bell Curve Creation
-
Information Not Displaying Correctly: The basis of effective visualization lies in integrity. Begin by ensuring that your numerical columns are free from blank or erroneous values, as these can significantly impact your visual outputs. Poor master information quality can lead to inconsistent results, making it vital to address this issue upfront. Additionally, implementing a governance strategy can help maintain data consistency across reports. Remember that statistics can also be performed in Power BI without DAX or measures, which can be beneficial for users unfamiliar with DAX.
-
Chart Not Displaying Normal Distribution Shape: A normal distribution relies on accurate statistical computations. Double-check your DAX formulas, particularly those related to the mean and standard deviation. Moreover, verify that you are using the appropriate range of values to accurately represent the shape of the distribution. Referencing the case study on Excel’s matrix format, ensure your information is in a columnar format to minimize transformation steps and reduce the risk of errors in your visualizations using bell curve power bi.
-
Performance Issues: When Power BI demonstrates slow or unresponsive behavior, it’s essential to evaluate the volume of information being processed. Consider optimizing your DAX calculations to enhance performance. Reducing data complexity not only improves speed but also aids in maintaining a smooth user experience. Addressing these performance challenges can empower your organization to better utilize knowledge without the common barriers associated with AI integration, such as the perception of AI projects being time-intensive and costly. Remember that the Clear button for original slicer visuals becomes visible only when the user hovers over it, which can help streamline your interactions with the data.
-
Visual Formatting Issues: A cluttered chart can hinder information extraction. Take time to adjust the visual formatting options in Power BI. Enhancements such as modifying line thickness or color can significantly improve clarity and make your visualizations more impactful. Additionally, ensure that your reports offer actionable guidance instead of merely figures and graphs, as this can assist stakeholders in making informed decisions.
By proactively tackling these common challenges, including those arising from poor master information quality and the complexities of report creation, you can enhance your Power BI experience. This will enable you to concentrate on deriving valuable information from your visualizations, ultimately enhancing efficiency and informed decision-making in your organization.
Applications of Bell Curves in Data Analysis and Visualization
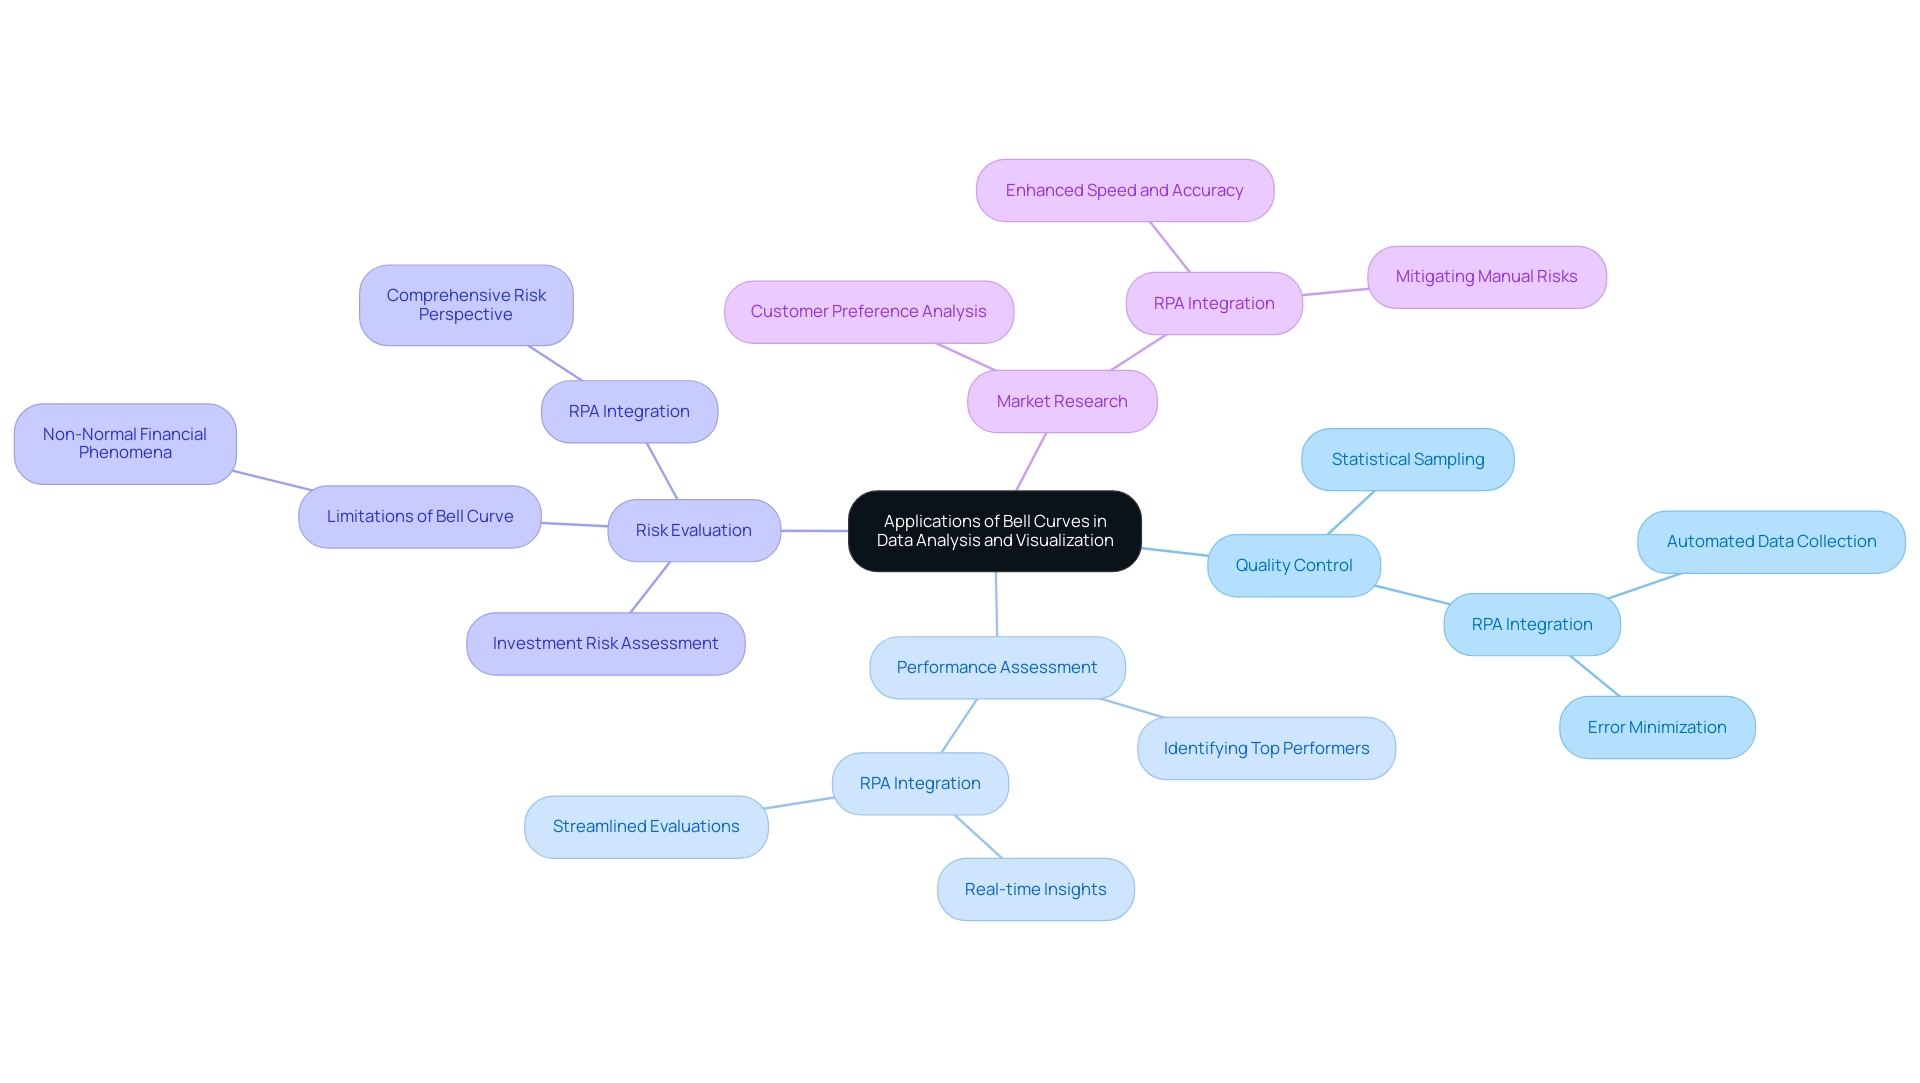
Bell shapes play an essential role in analysis and visualization, providing insights that can greatly improve operational efficiency, particularly when integrated with Robotic Process Automation (RPA). Key applications include:
-
Quality Control: In the manufacturing sector, bell curves are instrumental in assessing product quality by analyzing variations within measurements. This method allows organizations to uphold consistent quality and performance, as demonstrated by the fact that 99.7% of points typically fall within three standard deviations of the mean. Grasping statistical sampling and the normal distribution is essential for maintaining this consistency, especially when RPA is employed to automate information collection and analysis processes, thus minimizing errors and liberating team resources for more strategic activities.
-
Performance Assessment: Organizations utilize statistical distributions to systematically evaluate employee performance. By identifying top performers and those in need of improvement, leaders can make informed decisions that foster team development and enhance overall productivity. Integrating RPA in performance metrics tracking can further streamline these evaluations, allowing for real-time insights while addressing the challenges of manual data entry and analysis.
-
Risk Evaluation: Financial analysts employ probability distributions to assess investment risks, which guides their decision-making processes. However, it is important to acknowledge the constraints of depending exclusively on statistical distributions in finance. As highlighted in the case study, financial phenomena often do not conform to a normal distribution, which can lead to unreliable predictions if analysts do not consider alternative statistical distributions. RPA can assist in gathering various information points that offer a more comprehensive risk perspective, enabling better-informed decisions.
-
Market Research: Marketers utilize statistical distributions to analyze customer preferences and behaviors. This data-driven approach enables them to tailor marketing strategies effectively, ensuring they resonate with target audiences. By automating the analysis process through RPA, organizations enhance the speed and accuracy of their market research efforts, mitigating the risks associated with manual handling.
By grasping these applications and integrating RPA into your workflows, you can harness the bell curve power bi to elevate your data analysis and visualization practices. As Rich Marker, co-founder of All Metals Fabrication, states, “embracing effective planning and continuous improvement is key to achieving success.” This philosophy underscores the importance of integrating statistical insights with automation into your operations, positioning your organization for enhanced performance and quality control.
Furthermore, exploring tailored AI solutions alongside RPA can further optimize your operational efficiency, ensuring that your business is well-equipped to navigate the complexities of the evolving AI landscape.
Conclusion
Understanding the bell curve and its applications in data analysis is crucial for any organization aiming to enhance operational efficiency and make informed decisions. By mastering the creation of bell curves in Power BI, teams can transform complex datasets into clear visual representations, allowing for better insights into performance evaluation, quality control, and risk assessment. Each step, from preparing data to troubleshooting common issues, underscores the importance of accuracy and clarity in data visualization.
The integration of Robotic Process Automation (RPA) further amplifies these efforts by streamlining data collection and reporting processes. By automating repetitive tasks, RPA frees teams to focus on strategic analysis rather than mundane data handling, ultimately driving growth and operational efficiency. As organizations embrace these techniques, they position themselves to leverage data-driven insights effectively, ensuring that every decision is backed by robust statistical analysis.
In a rapidly evolving data landscape, the bell curve remains an indispensable tool. By understanding its mechanics and applying it thoughtfully within Power BI, organizations can unlock the full potential of their data, paving the way for smarter strategies and improved outcomes. Embracing these methodologies not only enhances individual performance but also cultivates a culture of data-driven decision-making across the organization, setting the stage for sustained success.
Overview
Power BI datasets are essential components for creating impactful reports and dashboards, enabling users to connect to various data sources and transform raw information into actionable insights. The article emphasizes that understanding these datasets—comprising data sources, models, and relationships—is crucial for enhancing operational efficiency and informed decision-making, particularly in organizations that rely on Business Intelligence for strategic growth.
Introduction
In a world increasingly driven by data, mastering Power BI datasets is essential for organizations aiming to enhance their operational efficiency and decision-making capabilities. These datasets serve as the backbone for creating insightful reports and dashboards, connecting seamlessly to various data sources to facilitate comprehensive analysis.
As businesses navigate the complexities of data management, understanding the key components of Power BI—from data sources to modeling—can unlock powerful insights that drive strategic growth. Furthermore, the ability to share and collaborate on these datasets fosters a unified approach to data analysis, empowering teams to work together more effectively.
By addressing common challenges such as time-consuming report creation and data inconsistencies, organizations can leverage Power BI to not only visualize their data but also transform it into actionable strategies that propel them forward in a competitive landscape.
Defining Power BI Datasets: An Overview
In Microsoft Power BI, what is a Power BI dataset? It is the vital structure for developing influential documents and dashboards, enabling smooth connections to various data sources, such as databases, Excel files, and cloud services. This versatility is crucial for data-driven decision-making, especially for Directors of Operations Efficiency aiming to enhance operational workflows. Our BI services, including the 3-Day BI Sprint and the General Management App, allow organizations to quickly design professionally tailored reports that drive actionable insights and facilitate comprehensive management reviews.
Furthermore, as part of streamlining workflow automation, integrating Automation can significantly enhance operational efficiency with a focus on risk-free ROI assessment and professional execution. As organizations increasingly depend on BI for visualization, it is essential to understand what is a Power BI dataset. They enable comprehensive information transformation and modeling, ensuring that insights are not only enlightening but also actionable.
A practical example is the Usage Metrics Report, which delivers a pre-built overview of content usage over the last 90 days, providing ongoing insights into user engagement and dashboard performance. While navigating the BI tool can present challenges, such as time-consuming document creation and inconsistencies, specific solutions like utilizing the General Management App for better oversight and addressing document accessibility for admins are vital steps in leveraging the platform effectively for strategic growth.
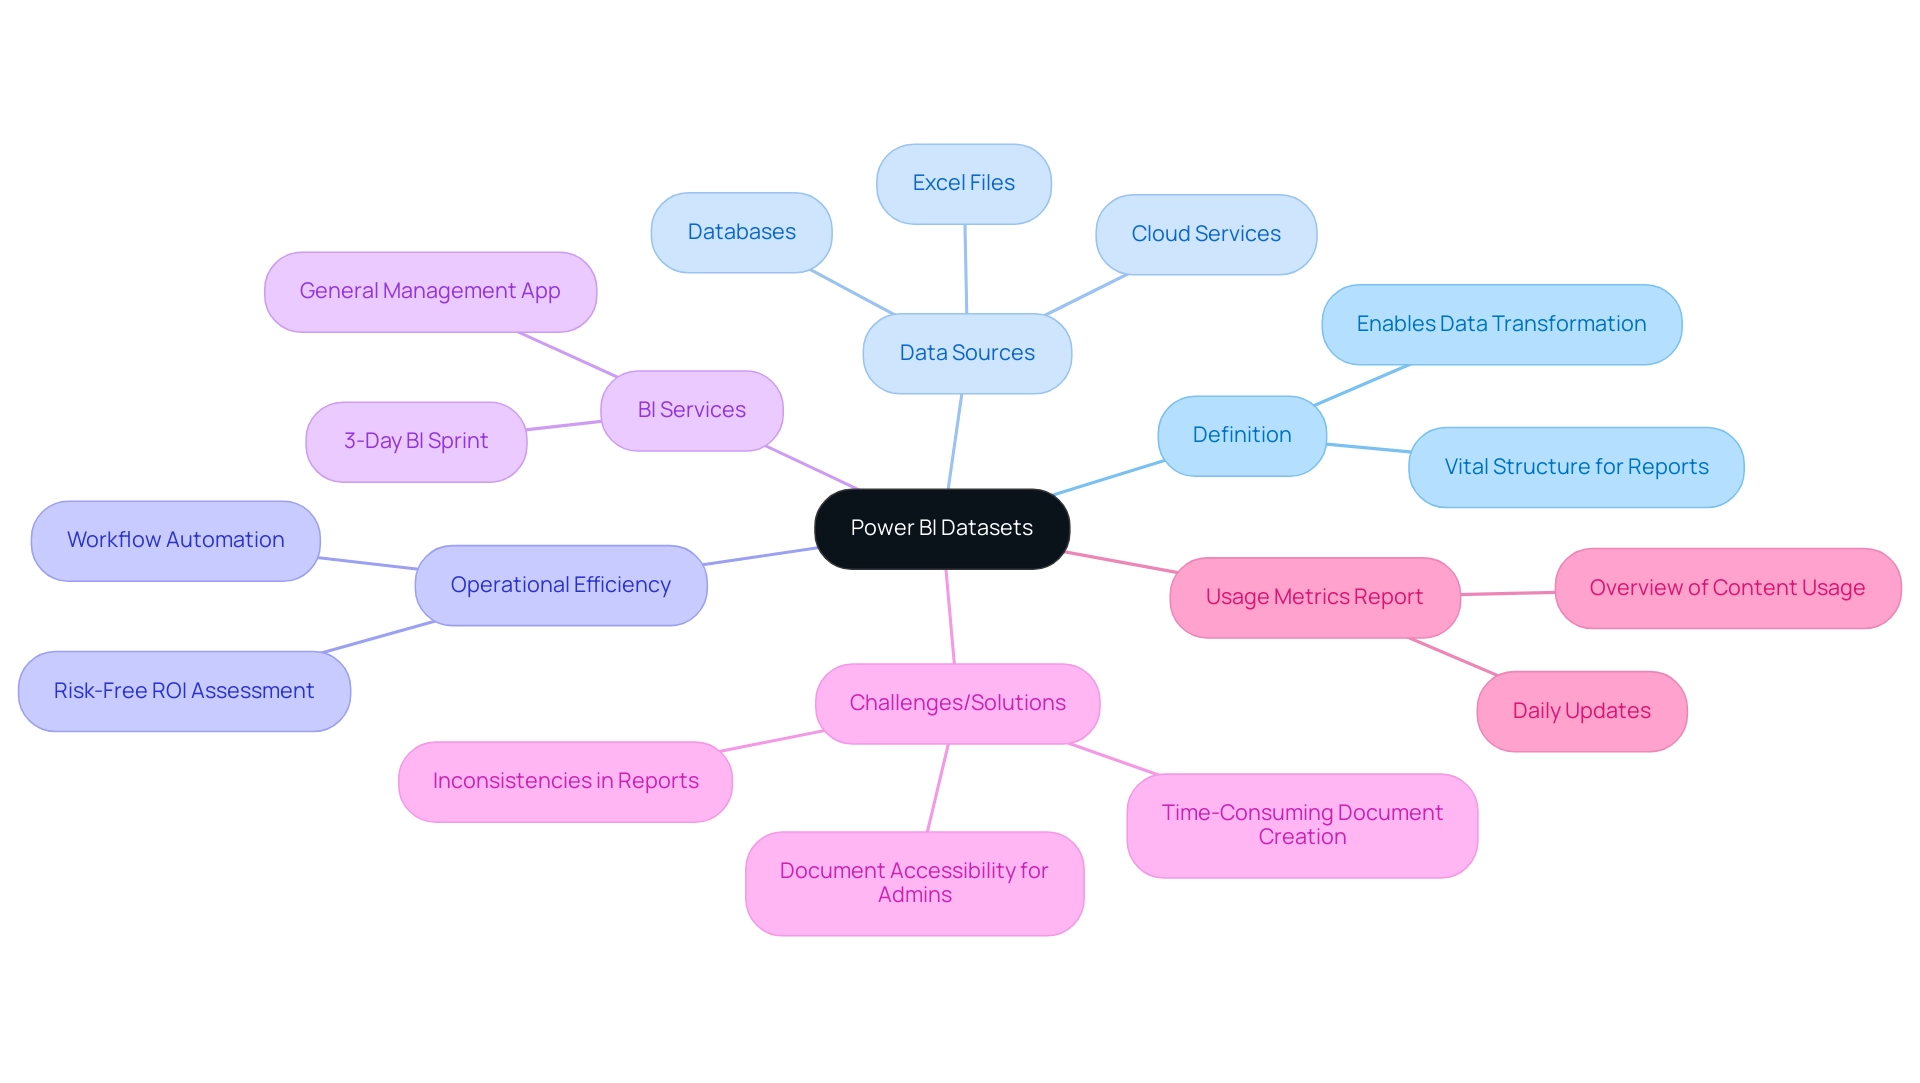
Key Components of Power BI Datasets: Understanding Data Sources and Models
To understand what is a Power BI dataset, it’s important to know that BI datasets are fundamentally composed of essential components: sources, models, and relationships. Data sources can range from SQL databases and Excel files to cloud services such as Azure, enabling diverse ways to gather information. However, many businesses face challenges in leveraging insights from Power BI dashboards, such as time-consuming report creation and inconsistencies.
Once information is collected, it undergoes transformation into a structured model. This model arranges information into tables and establishes relationships that allow for meaningful connections between different points. Grasping these elements is essential for understanding what is a Power BI dataset, as they directly affect users’ capability to analyze and visualize information effectively.
A well-organized information model, complemented by RPA solutions such as EMMA RPA and Automate, facilitates sophisticated analysis and reporting capabilities, thereby enhancing decision-making processes. For instance, Netflix exemplifies the power of information management; by leveraging large-scale analytics, the company achieves annual savings of $1 billion. As large enterprises progressively emphasize information governance, location intelligence, and enterprise planning, optimizing these foundational elements in BI becomes essential for improving operational efficiency and fostering informed decisions.
Users can enhance their BI experience by subscribing to updates and accessing features through the BI blog and community. Furthermore, the case study named ‘Présentation de Power BI‘ demonstrates how business intelligence tools aid in monitoring information and improve decision-making processes. Furthermore, interested users can earn a 50% exam discount by participating in the Fabric 30 Days to Learn It Challenge, providing an excellent incentive to deepen their understanding of BI resources.
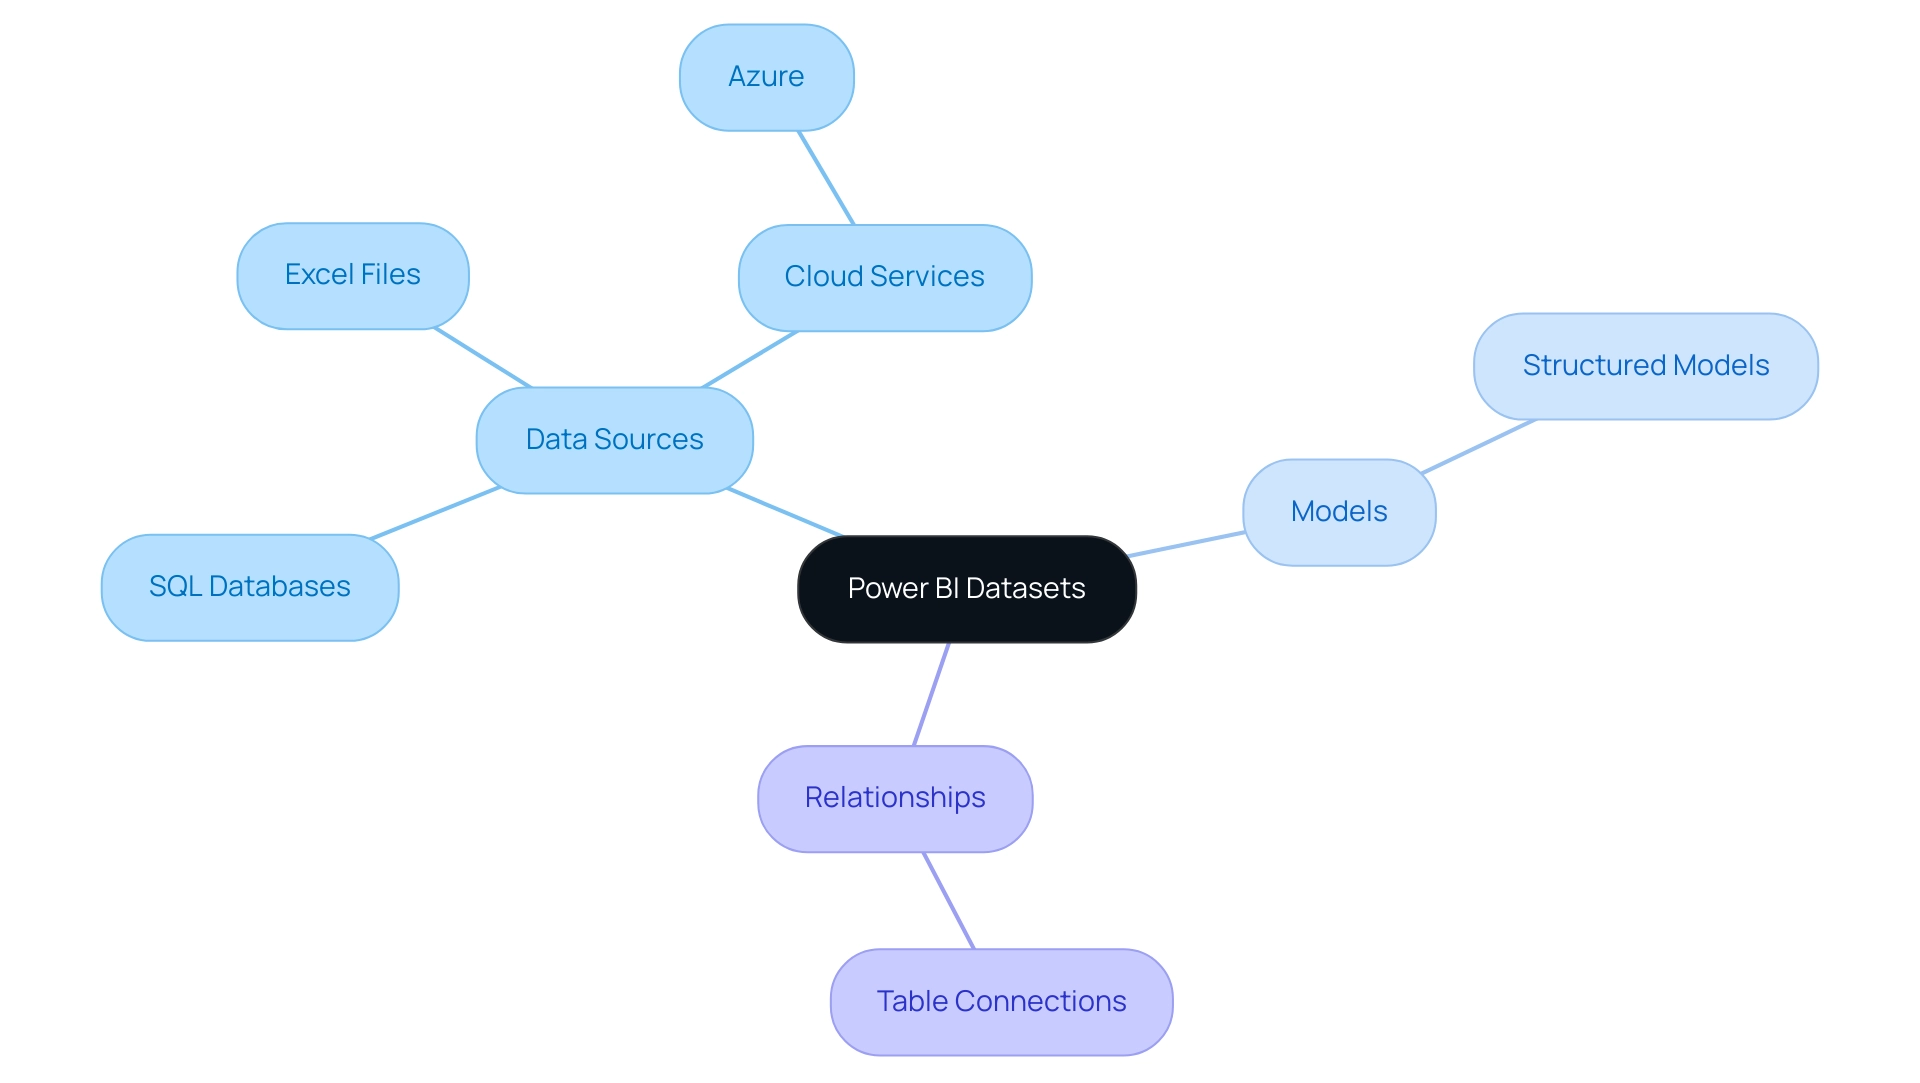
Utilizing Power BI Datasets: Applications in Reporting and Visualization
To understand what is a power bi dataset, it’s important to recognize that these datasets act as a foundation for creating dynamic presentations and dashboards that convert raw information into clear, actionable insights. In today’s competitive environment, harnessing the power of Business Intelligence is crucial for overcoming challenges such as time-consuming report creation, inconsistencies, and a lack of actionable guidance. Users can leverage a diverse array of visualizations, including charts, graphs, and tables, to effectively represent their information.
This capability not only assists stakeholders in swiftly understanding insights and trends but also enhances informed decision-making processes. For example, in the education field, BI enables a deeper comprehension of student performance and operational effectiveness, permitting schools and universities to visualize information regarding attendance, grades, and resource distribution. This helps administrators make data-driven decisions that benefit both students and staff.
Additionally, a notable application can be observed within sales teams: by utilizing what is a power bi dataset to visualize sales performance over time, they can easily identify trends and adjust strategies in real time. The capacity to create engaging visual stories from information is among this tool’s most notable features, allowing organizations to enhance operational efficiency and strategic growth. Moreover, the incorporation of RPA solutions can additionally streamline processes by automating repetitive tasks, thereby enhancing the efficiency of report creation and management.
Statistics indicate that user adoption rates of BI for data visualization have been steadily increasing, reflecting its growing significance in the market. The seamless integration of BI with Microsoft tools such as Dynamics 365 and Excel allows for a smoother user experience, particularly for companies already embedded in the Microsoft ecosystem. Embracing these innovations not only empowers teams but also positions your organization for sustainable growth in a data-driven world.
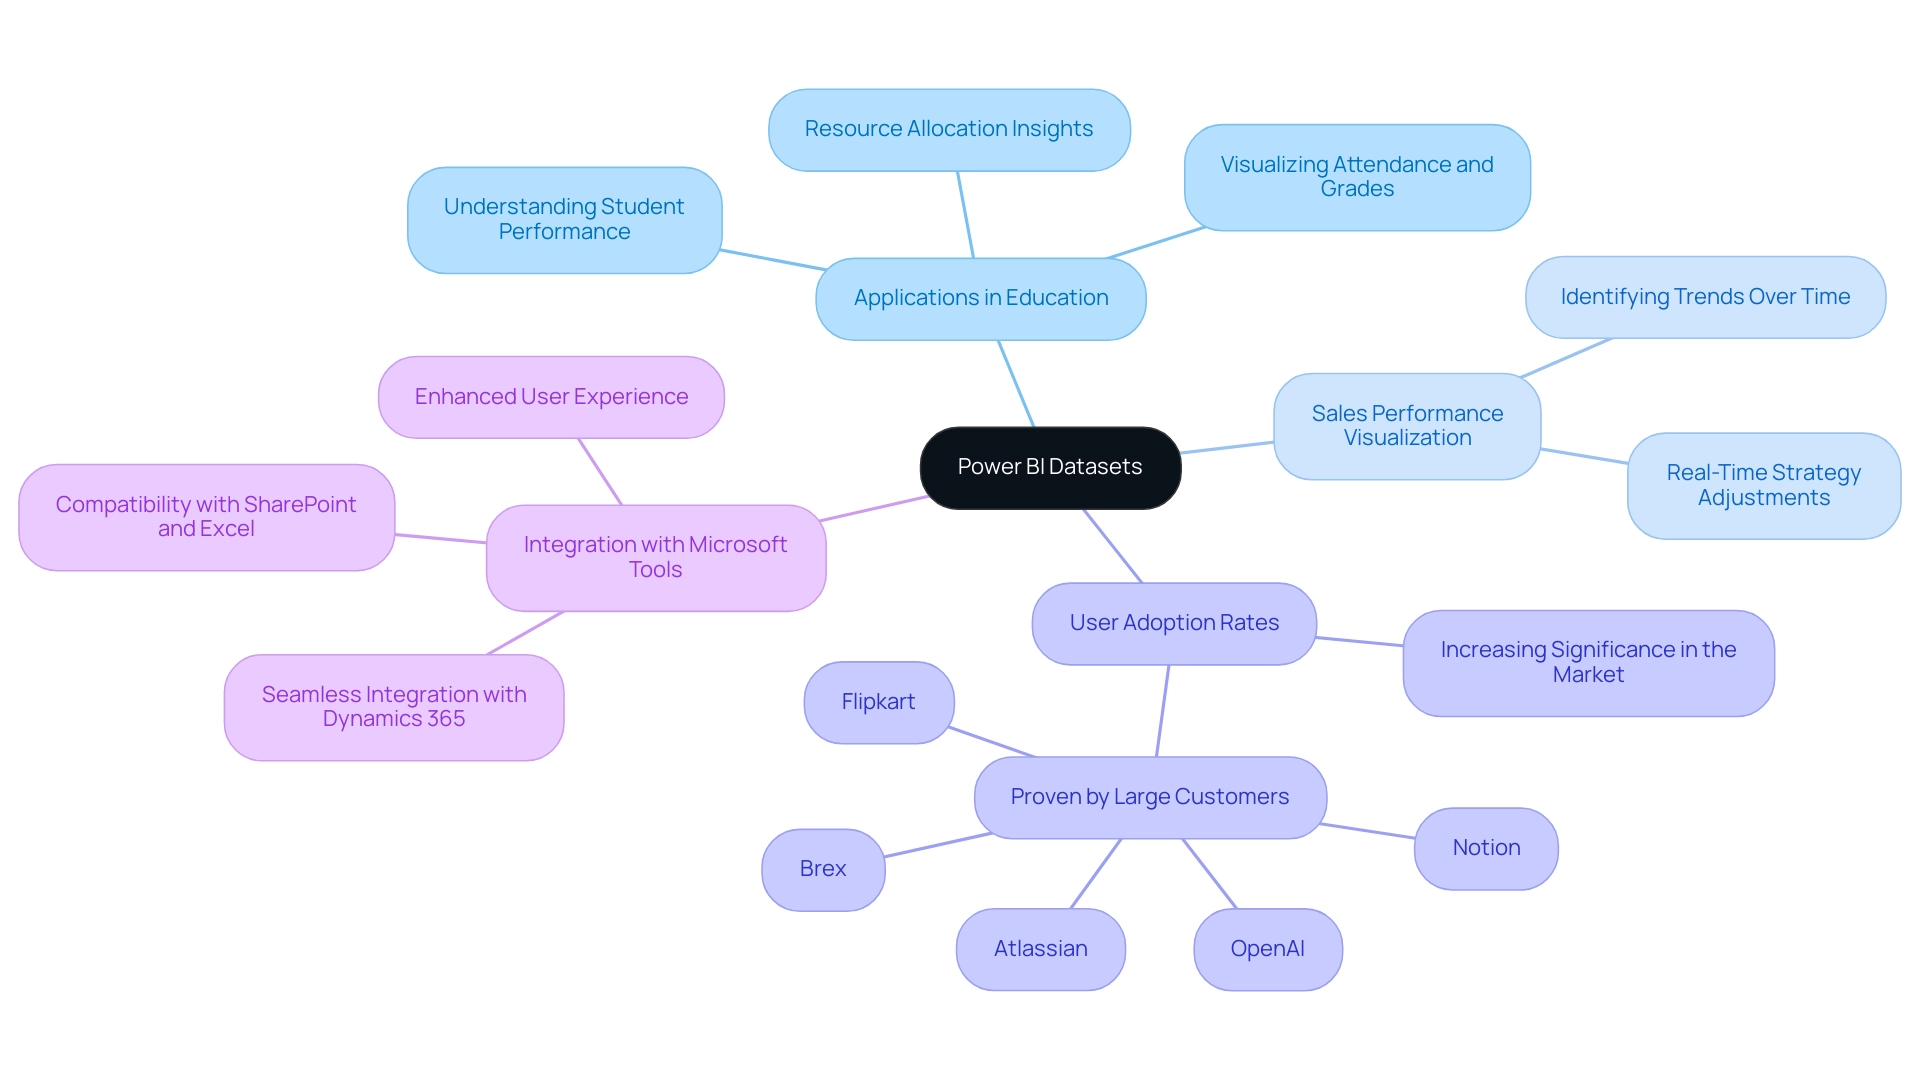
Sharing Power BI Datasets: Enhancing Collaboration and Accessibility
Exchanging data collections in Business Intelligence is a transformative practice that significantly improves collaboration within organizations, especially important for Directors of Operations Efficiency. By permitting team members to access and examine the same information sets, BI ensures that all users are operating from a uniform foundation, reducing discrepancies and encouraging a unified approach to analysis. The ability to publish datasets to the BI service enables users to share insights effortlessly with colleagues and stakeholders, tackling frequent challenges such as time-consuming document creation and information inconsistencies.
Recent improvements, including the updated Snowflake connector, have enhanced performance and minimized unnecessary metadata queries, further simplifying this process. Furthermore, with the most recent update to Azure Maps, users can dynamically connect reference layers to customer business information, improving interactivity and visualization capabilities, which is vital for fostering insights based on evidence.
Power BI’s improved format (PBIR) also plays a significant role in collaboration, allowing users to publish and download documents effortlessly, resulting in heightened efficiency in information sharing. Organizations utilizing PBIR features have reported substantial enhancements in collaborative efforts, ultimately aiding more informed decision-making.
Furthermore, the commenting capability encourages meaningful discussions directly on reports, facilitating targeted feedback on specific information points. A case study titled ‘Commenting and Discussing Insights within BI’ illustrates how this functionality nurtures deeper understanding and collective problem-solving through focused communication.
To complement these capabilities, our RPA solutions can automate repetitive tasks associated with information management, reducing task repetition fatigue and enhancing operational efficiency. By combining RPA with BI, organizations can enhance workflows and boost overall productivity.
As Ketul Sheth aptly puts it,
Ready to elevate your information strategy? Reach out to Techcronus today to find out how our BI solutions can convert your information into a strategic asset. With BI’s robust features and the added efficiency of RPA, organizations can significantly enhance their collaborative efforts and operational efficiency, leading to more informed and effective decisions.
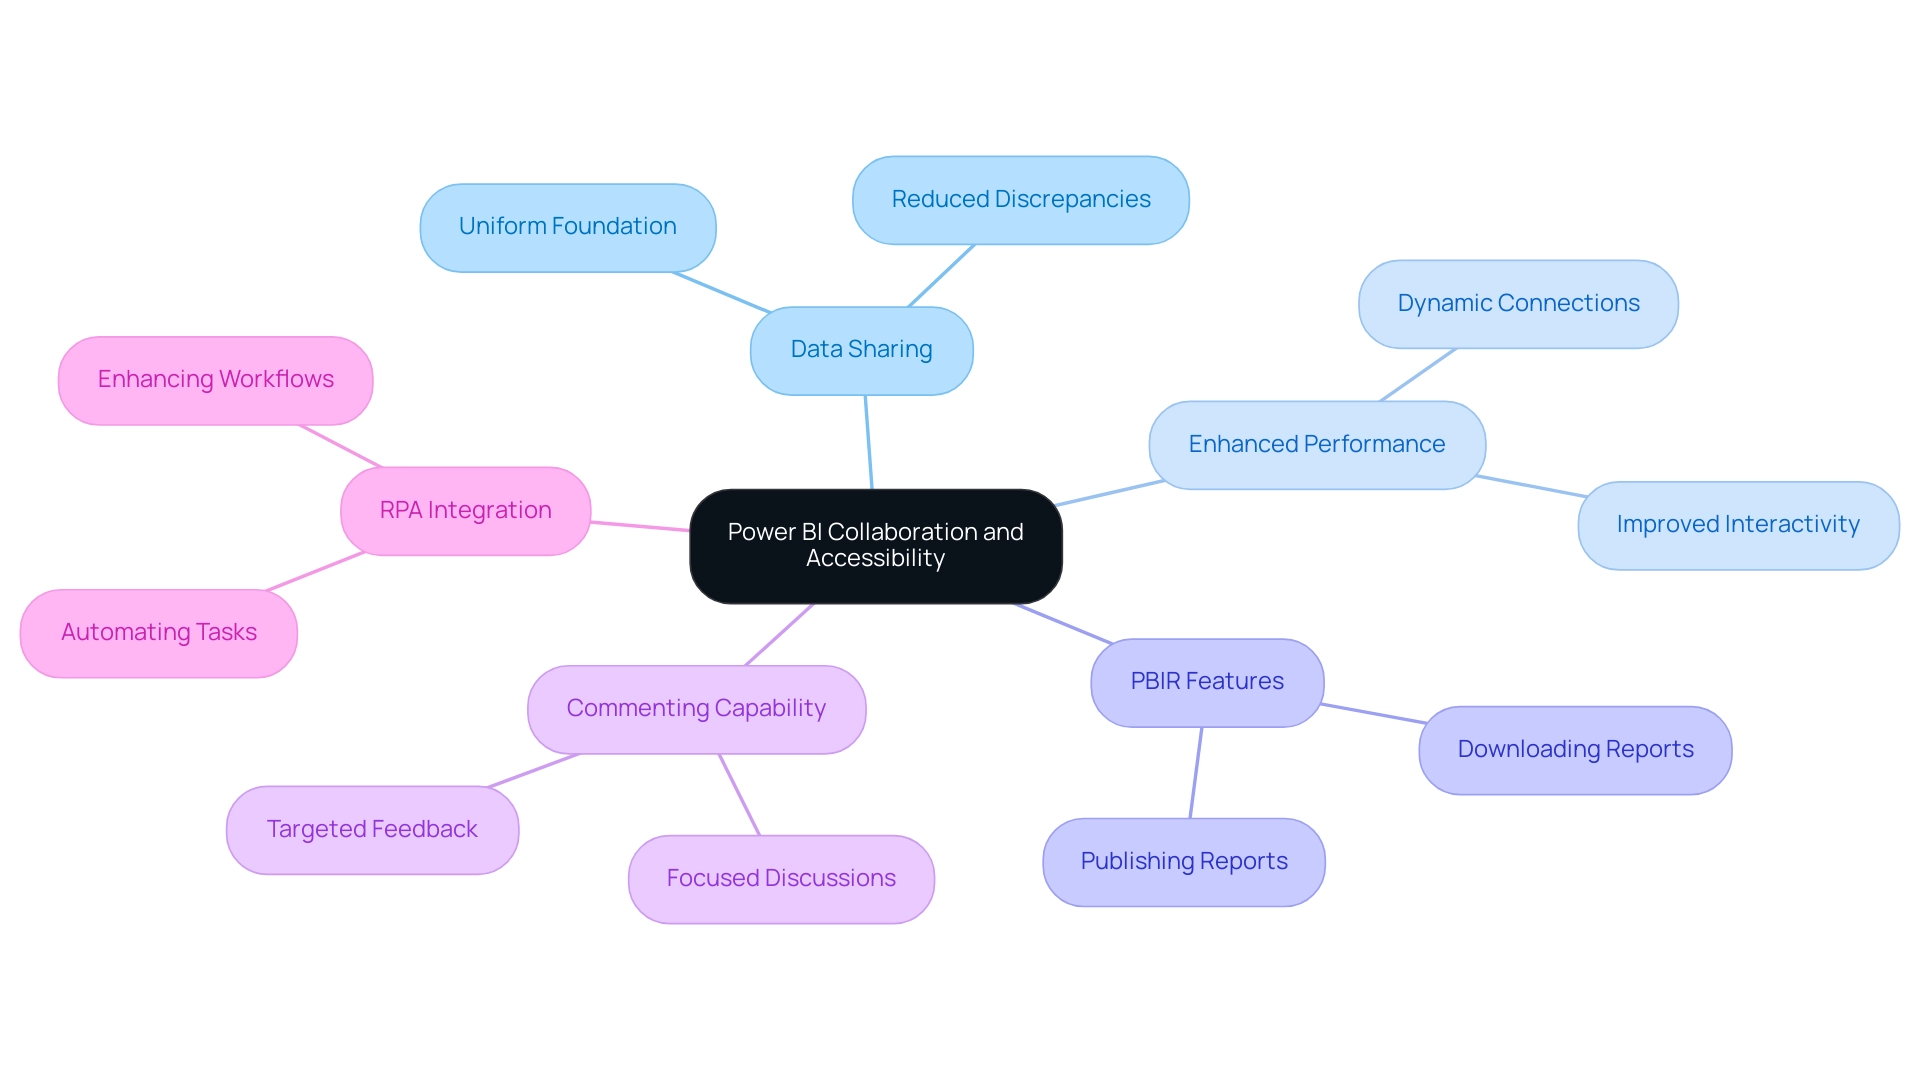
Managing Power BI Datasets: Refreshing and Troubleshooting
Effectively managing BI collections is crucial for ensuring accuracy and reliability, especially when considering what is a power BI dataset in relation to common challenges like time-consuming report creation and inconsistencies due to a lack of governance strategy. Premium BI users can schedule up to 48 refreshes within a 24-hour timeframe, which allows organizations to maintain updated sets that reflect the most recent information, thus enabling timely decision-making. However, to uphold dataset integrity, it is essential to tackle typical troubleshooting issues related to what is a power BI dataset, such as connectivity challenges or refresh failures.
A recent community suggestion highlights this need:
‘I figured this would be the only way. We can do something like that; I was just hoping for a more report-like solution.’
This underscores the value of establishing a shared email for notifications regarding failures in what is a power BI dataset refresh, enhancing responsiveness to issues.
Furthermore, the case study on configuring scheduled refresh illustrates what is a power BI dataset and its importance in ensuring connectivity between BI and sources, setting refresh schedules, and enabling notifications to monitor refresh history. By adopting these management practices, including the integration of RPA solutions to automate repetitive tasks, and considering expert guidance from Power BI Consultants, organizations can not only safeguard their data’s accuracy but also empower their teams with reliable insights, fostering informed decision-making and driving operational efficiency.
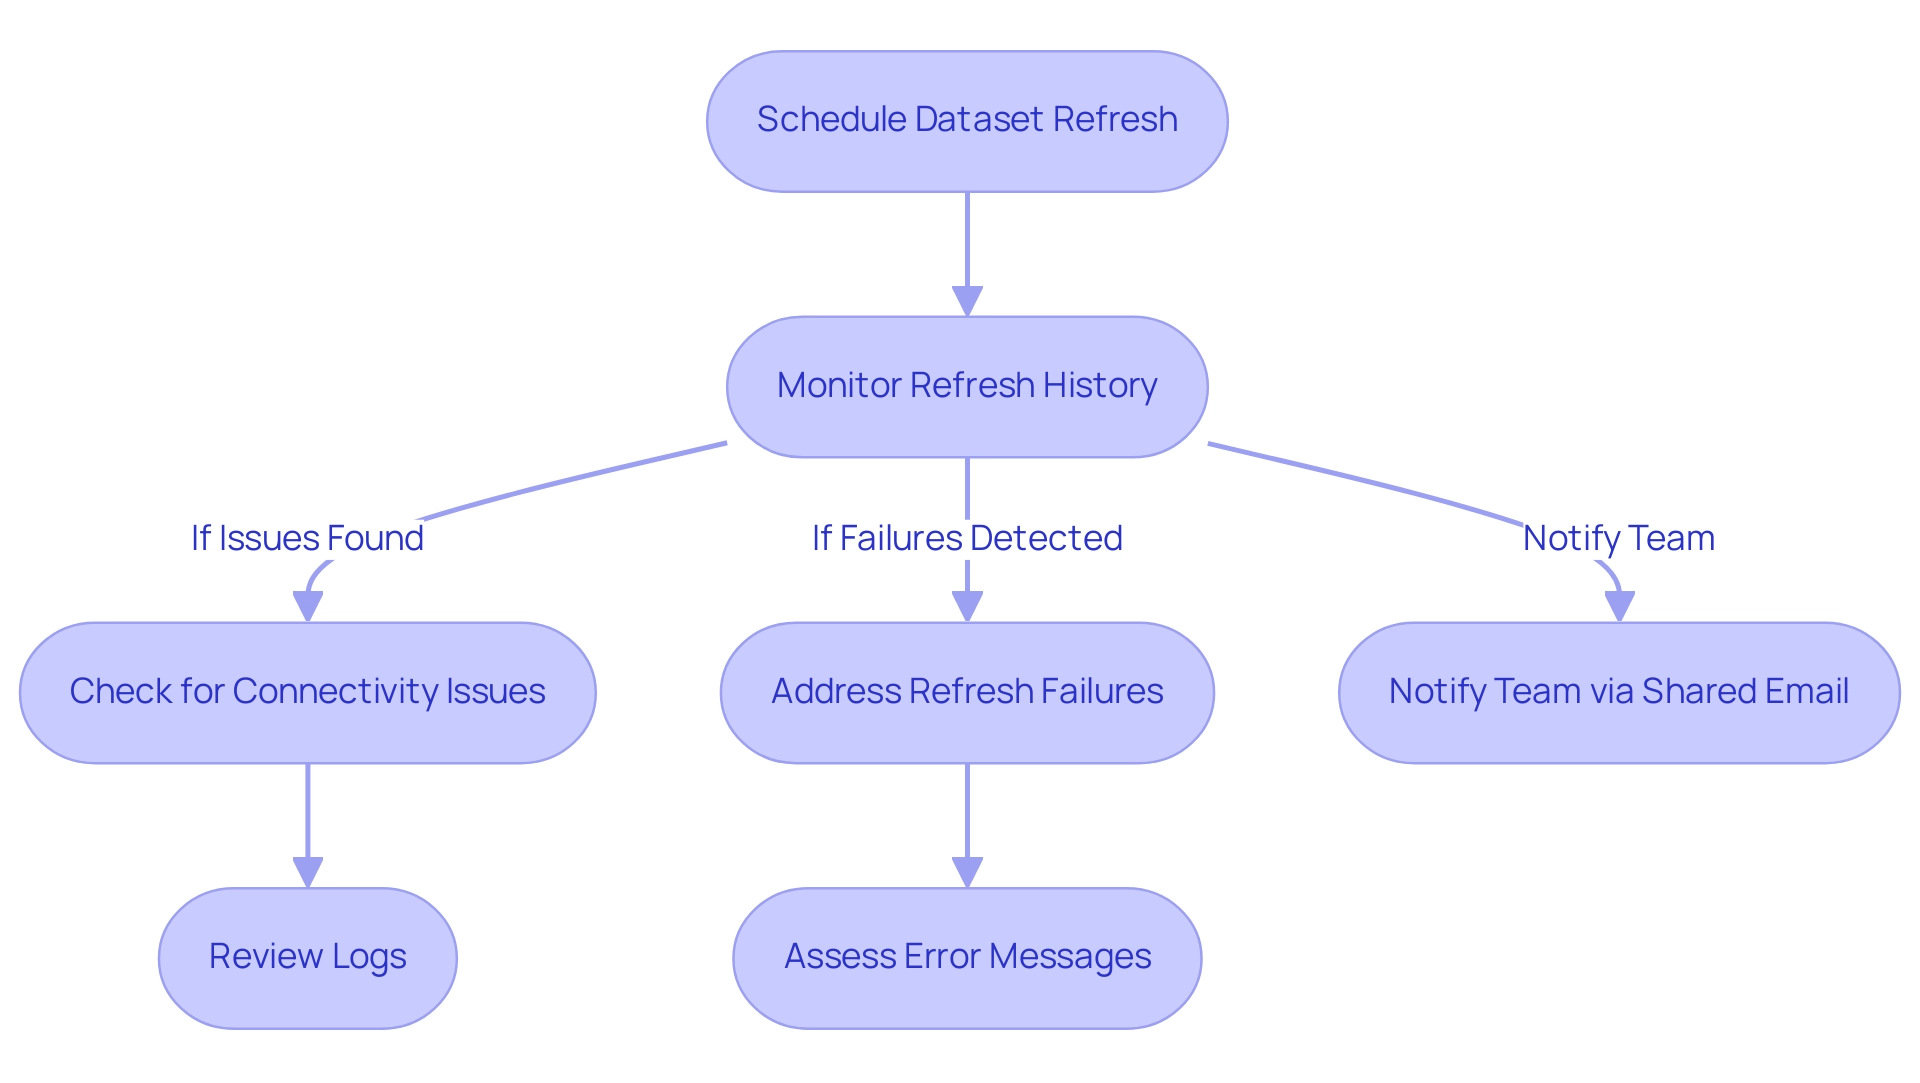
Conclusion
Power BI datasets are a vital asset for organizations seeking to enhance data management and decision-making. By mastering the essential components—data sources, data models, and relationships—businesses can effectively address challenges like time-consuming report creation and data inconsistencies, ultimately improving operational efficiency.
The flexibility of Power BI enables dynamic visualizations that facilitate strategic growth. Whether analyzing sales trends or educational performance, clear data presentation empowers informed decisions. Additionally, integrating RPA solutions streamlines workflows, ensuring efficient data management that maximizes ROI.
Collaboration is significantly enhanced through sharing Power BI datasets, fostering a unified approach to data analysis. When teams operate from a consistent data foundation, discrepancies are reduced, leading to better decision-making. Features like real-time commenting and interactive visualizations further enrich collaboration, allowing for deeper engagement with the data.
In summary, mastering Power BI datasets is essential for organizations aiming to thrive in a data-driven world. By leveraging these tools and strategies, businesses can turn data into actionable insights, boost operational efficiency, and drive strategic growth. The journey towards effective data management starts with Power BI, offering endless opportunities for innovation and improvement.
Overview
Power BI stores data using various methods, including Import Mode, Direct Query Mode, and Composite Model, each designed to meet different analytical needs and performance requirements. The article emphasizes that understanding these storage options is crucial for optimizing reporting and insights, as each method impacts data refresh rates, query performance, and overall user experience in business intelligence applications.
Introduction
In the realm of data analytics, Power BI stands out as a powerful tool that offers a myriad of storage options designed to cater to the unique needs of organizations. With the right understanding of these alternatives, businesses can unlock the full potential of their data, transforming complex information into actionable insights. From the rapid performance of Import Mode to the real-time capabilities of Direct Query, each method presents distinct advantages and considerations.
As organizations navigate the intricacies of data management, embracing best practices and innovative solutions becomes essential for optimizing performance and enhancing decision-making. This article delves into the various data storage options available in Power BI, their impact on operational efficiency, and the critical role of data governance in achieving reliable and effective analytics.
Understanding Power BI Data Storage Options
Understanding where does Power BI store data is essential, as BI offers a range of storage alternatives, each designed to address various business needs and situations, making it crucial for organizations seeking to enhance their analytics capabilities. Comprehending these options can greatly improve reporting and actionable insights, particularly when utilizing our BI services, which feature a 3-Day Sprint for swift report creation and a General Management App to ensure consistency and clarity.
Import Mode: This approach brings information into BI’s in-memory storage, which raises the question of where does Power BI store data, enabling rapid query performance due to the highly optimized format of stored content.
However, it necessitates periodic refreshes to maintain current information accuracy, which can be a consideration for dynamic business environments.
Direct Query Mode: In this mode, Power BI retrieves the information directly from its source, leading to the question of where does Power BI store data. This method is especially advantageous for real-time information retrieval, but it might result in reduced efficiency as it relies on the responsiveness of the underlying information source.
Composite Model: This innovative model merges both Import and Direct Query methods, allowing users to import specific datasets while querying others. This flexibility optimizes performance based on particular analytical needs, making it a versatile choice for varying workloads, especially in contexts like where does Power BI store data. Power BI Dataflows enable the creation of reusable information transformation processes within the cloud, raising the question of where does Power BI store data.
This feature streamlines information preparation and storage, enhancing efficiency in managing pipelines, particularly in understanding where does Power BI store data.
In addition to these storage methods, the integration of AI features such as Small Language Models can improve analysis by providing tailored insights and enhancing quality. Our GenAI Workshops further empower teams to create custom GPT solutions that address specific reporting challenges, making information management more efficient.
Moreover, the Control Chart XmR allows users to download calculated values such as LCL, CL, UCL, sigmas, and signals, which can significantly enhance information management and analytics capabilities. This tool, when combined with AI-driven insights, supports organizations in making informed decisions and unlocking the true potential of their data.
By addressing common challenges in leveraging insights from BI dashboards, such as the time-consuming nature of report creation and ensuring data consistency, organizations can better harness their data for strategic decision-making. Recent developments suggest that these storage options will keep evolving, especially with the expected advancements in 2024, which aim to enhance functionality and user experience. Organizations must weigh the benefits and limitations of each method, as the choice of storage solution can profoundly influence performance metrics, refresh intervals, and overall user satisfaction in Business Intelligence.
As Stacey Barr once remarked,
Years ago, Stacey Barr introduced us to the magic of Control Charts, highlighting the significance of making informed choices in information management to unlock the true potential of analytics.
![]()
The Impact of Data Connection Methods on Storage
The choice of a connection method in BI profoundly influences where Power BI stores data and how information is accessed, directly affecting operational efficiency. The two primary connection methods are:
- Import Mode: This method loads information into Power BI’s in-memory storage, facilitating rapid access and analysis.
While Import Mode provides high-performance analytics, it requires regular refreshes that can be resource-intensive, especially with larger datasets. Integrating Robotic Process Automation (RPA) can further streamline this process by automating the refresh operations, reducing manual effort and minimizing errors. This is especially advantageous in tackling the challenge of time-consuming report creation, enabling teams to concentrate on analysis instead of preparation.
- Direct Query Mode: This alternative allows Power BI to obtain information in real-time from the source, ensuring users access the most current details. This method minimizes memory usage by querying information directly from the source, which is advantageous for managing large datasets, particularly in understanding where Power BI stores data. However, this immediacy can come at the cost of processing speed, particularly if the underlying source is not optimized for efficient querying.
To enhance this mode, organizations can utilize RPA to automate validation and cleansing processes, ensuring that the information queried is accurate and reliable, thus mitigating issues of inconsistencies.
Choosing between these methods should align with organizational objectives and specific information requirements. For instance, businesses that prioritize real-time insights may gravitate towards Direct Query, whereas those focused on high-performance analytics often prefer Import Mode. Significantly, usage metrics reports refresh each day, highlighting the importance of real-time information access for operational efficiency.
Moreover, organizations using BI Premium can utilize improved performance features for large datasets. This option offers dedicated cloud resources, larger dataset sizes, and more frequent refreshes, making it suitable for intensive big-data analytics. As highlighted by Dr. Andrew Renda, Associate Vice President of Population Health Strategy at Humana, the ability to quickly build dashboards that visualize information and update in real-time is critical for effective strategy formation and execution.
Moreover, in the context of the swiftly changing AI environment, comprehending these dynamics and integrating RPA can assist organizations in optimizing their BI implementation, boosting both efficiency and effectiveness in analysis.
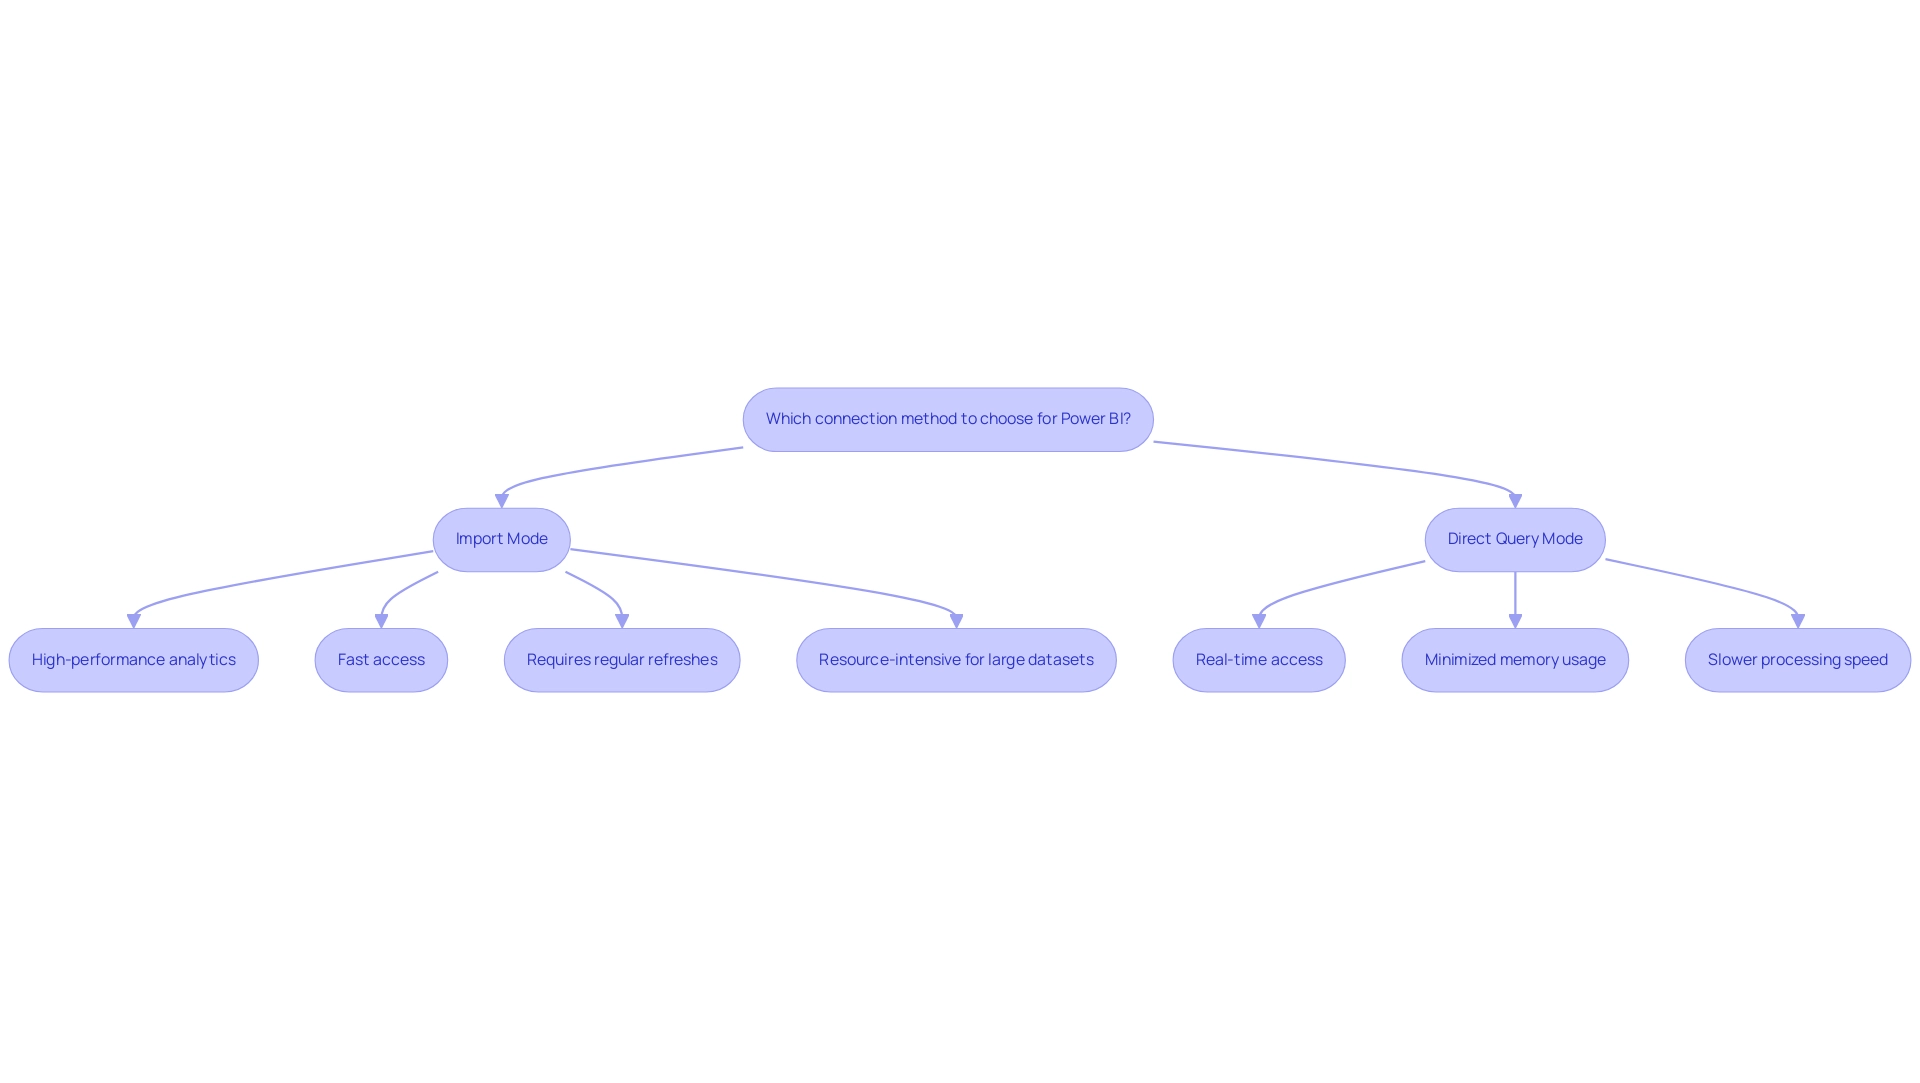
Best Practices for Managing Power BI Data Storage
To effectively manage Power BI information storage and harness the full potential of Business Intelligence, organizations should consider implementing the following best practices:
-
Optimize Information Models: Streamlining information models is crucial; removing unnecessary columns and tables not only improves efficiency but also decreases storage expenses. This practice ensures that the information model is efficient and easy to navigate, leading to quicker insights and enhanced operational efficiency, crucial in today’s information-rich environment.
Plan for Refreshes: Scheduling refreshes during off-peak hours is crucial for minimizing performance impact. Power BI’s capability for parallel loading allows multiple tables or partitions to load concurrently, reducing overall refresh times. This strategy guarantees that users have access to the most current information while maintaining operational efficiency. As lbendlin emphasizes,Anything above 5 seconds leads to bad user experience.
Thus, timing your refreshes wisely can significantly contribute to a smoother user experience and help overcome challenges in document creation. -
Use Aggregations: Implementing aggregations can drastically reduce the volume of information that Power BI needs to process, which raises the question of where does Power BI store data. This not only improves query efficiency but also results in quicker document creation, enhancing overall user satisfaction and tackling information inconsistency issues.
Monitor Performance: Regular performance assessments of reports and dashboards are vital. Recognizing bottlenecks or inefficiencies in information retrieval and storage, including where does Power BI store data, can help preempt issues before they impact users. Utilizing tools like DAX Studio can further optimize measures and queries, as noted in SQLBI.com’s extensive training resources, enhancing the actionable guidance from your BI dashboards.
Leverage Dataflows and RPA: Utilizing Power BI Dataflows for information preparation and transformation tasks allows for standardization across reports, which enhances quality and consistency. Combining this with RPA can automate repetitive information tasks, further enhancing operational efficiency. This practice is especially effective in ensuring that information, including where does Power BI store data, is reliable and readily available for analysis, thereby empowering informed decision-making that drives growth and innovation.
Categorize Report Data: Categorizing report data by business impact using sensitivity labels raises awareness about data security and manages data sharing effectively. This timely consideration is essential for maintaining compliance and protecting sensitive information.
By adhering to these best practices, organizations can maximize the efficiency of their Power BI implementations, leading to enhanced analytics and more informed decision-making capabilities. In situations where DirectQuery sources enforce primary keys, verifying the Assume Referential Integrity setting can significantly enhance query efficiency, as demonstrated in recent case studies. This adjustment not only speeds up query execution but also ensures efficient joins, further enhancing overall performance. Furthermore, applying these strategies can assist in tackling the challenges of time-consuming report creation and information inconsistencies, ultimately resulting in more actionable insights from business intelligence dashboards.
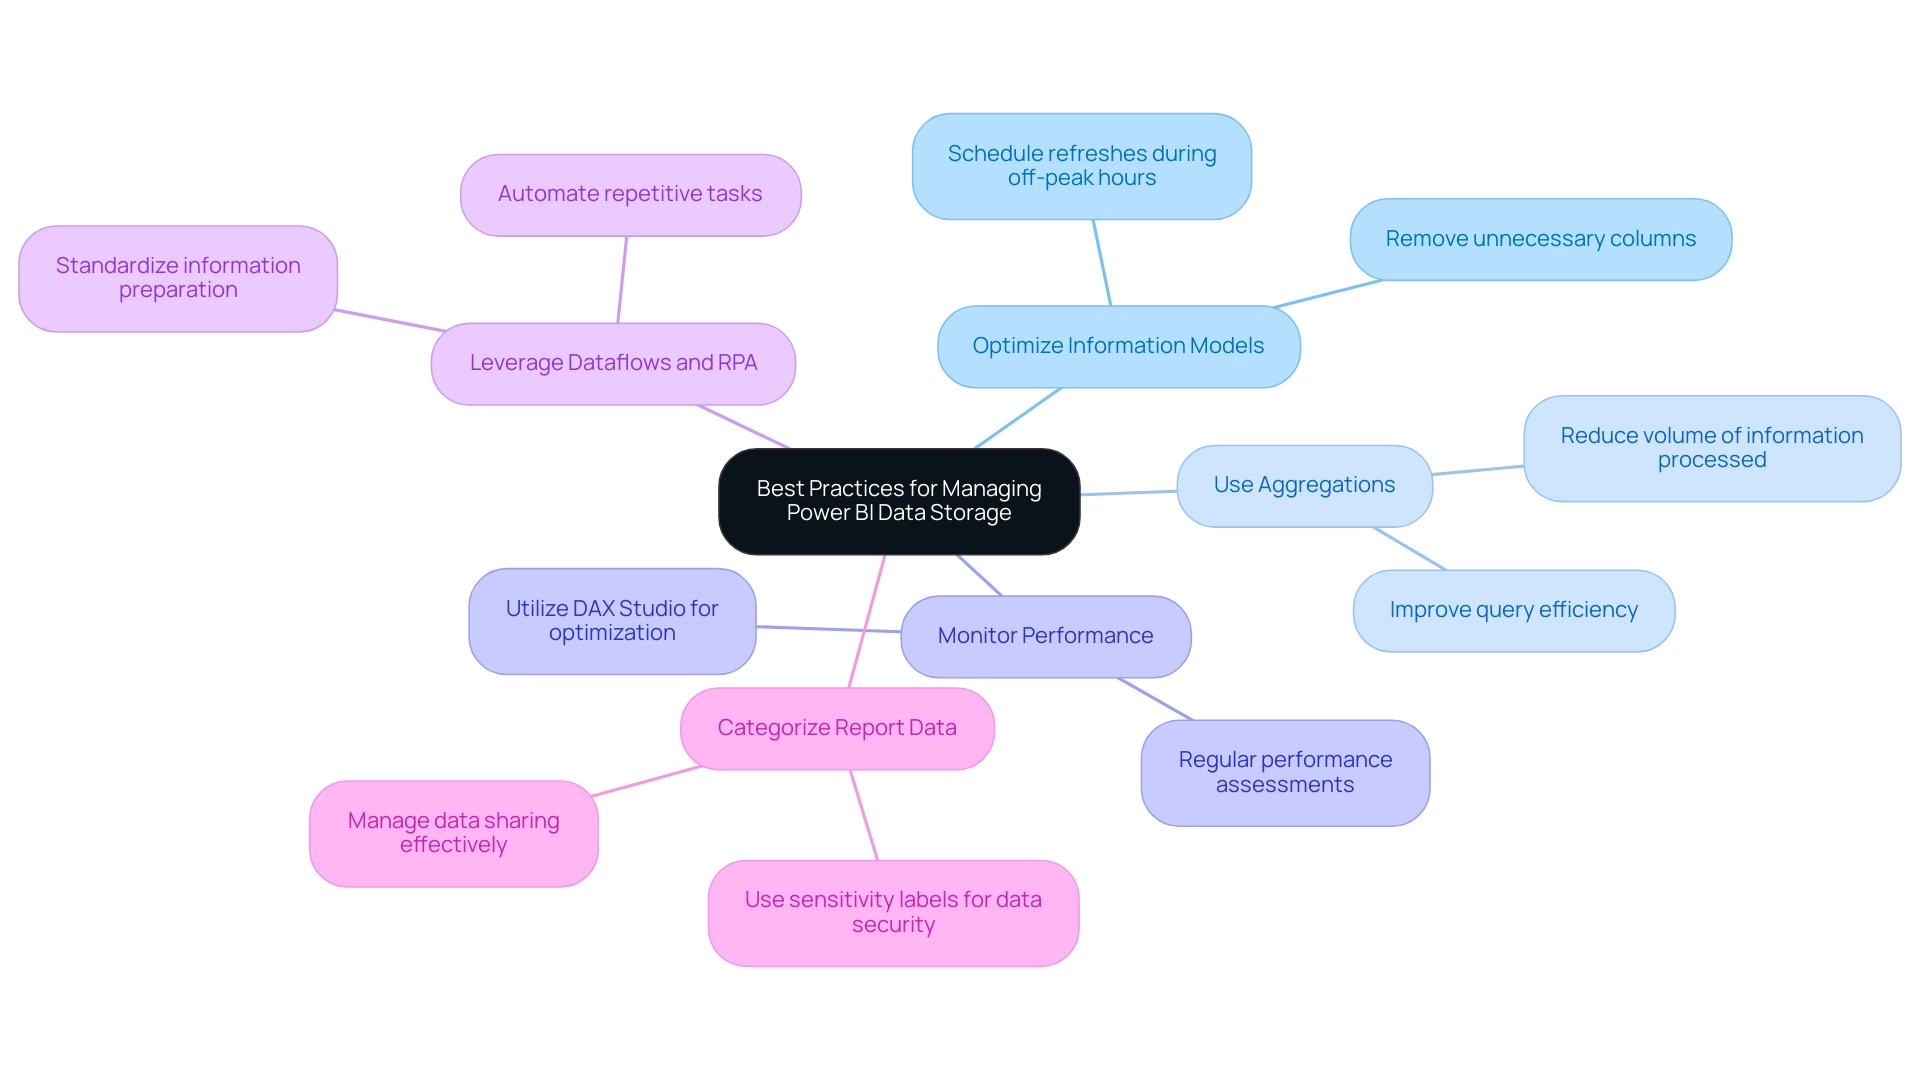
Understanding Data Governance in Power BI
Information governance stands as a cornerstone in the effective management of information within Power BI, particularly in relation to where does Power BI store data, ensuring that details remain accurate, accessible, and secure. Recent statistics reveal that approximately 47% of new information collected by companies contains one or more critical errors, underscoring the urgent need for robust governance practices. These errors can lead to misguided decisions and inefficiencies, highlighting the importance of effective information governance strategies.
Key elements of effective information governance include:
- Quality Management: Establishing systematic processes to routinely assess and enhance the quality of information utilized in Power BI involves understanding where does Power BI store data, which is essential. With recent advancements in information quality management, organizations can harness tools and methodologies, such as automated profiling and cleansing techniques, that significantly boost accuracy and reliability, enabling teams to focus on insights rather than the tedious task of report creation.
- Access Control: Implementing role-based access controls ensures that sensitive information is only accessible to authorized personnel, mitigating risks related to breaches and safeguarding confidentiality.
- Information Lineage Tracking: Maintaining comprehensive visibility into sources and transformations is vital. This enables organizations to comprehend how information flows through the system, enhancing trust and clarity in decision-making based on insights.
- Compliance Monitoring: Adhering to relevant regulations and standards, such as GDPR or HIPAA, is crucial for safeguarding information integrity and promoting accountability.
- Iterative Governance with Rollouts: This approach balances agility with governance, allowing for initial governance planning while iteratively improving governance alongside Fabric development. It enhances user productivity and governance efficiency, but necessitates effective communication and discipline to keep documentation and training current.
By prioritizing these governance strategies, organizations can greatly improve their management practices, leading to more trustworthy and actionable insights from their BI analyses, including understanding where does Power BI store data. As emphasized in our 3-Day BI Sprint, effective information governance not only simplifies creation but also enables teams to utilize insights for significant decision-making. Our 3-Day Power BI Sprint specifically addresses the challenges of poor master information quality by implementing best practices in governance, while also clarifying where does Power BI store data and providing tailored methodologies for AI integration.
Additionally, the documents generated during the sprint can be utilized as templates for future projects, ensuring a professional design from the start. As Grant Gamble of G Com Solutions emphasizes,
Mastering data analytics is fundamental for businesses, and effective data governance paves the way for that mastery.
The recent enhancements in Power BI, including the support for publishing and downloading enhanced report formats (PBIR), further facilitate collaboration and source control, driving better governance and user engagement.
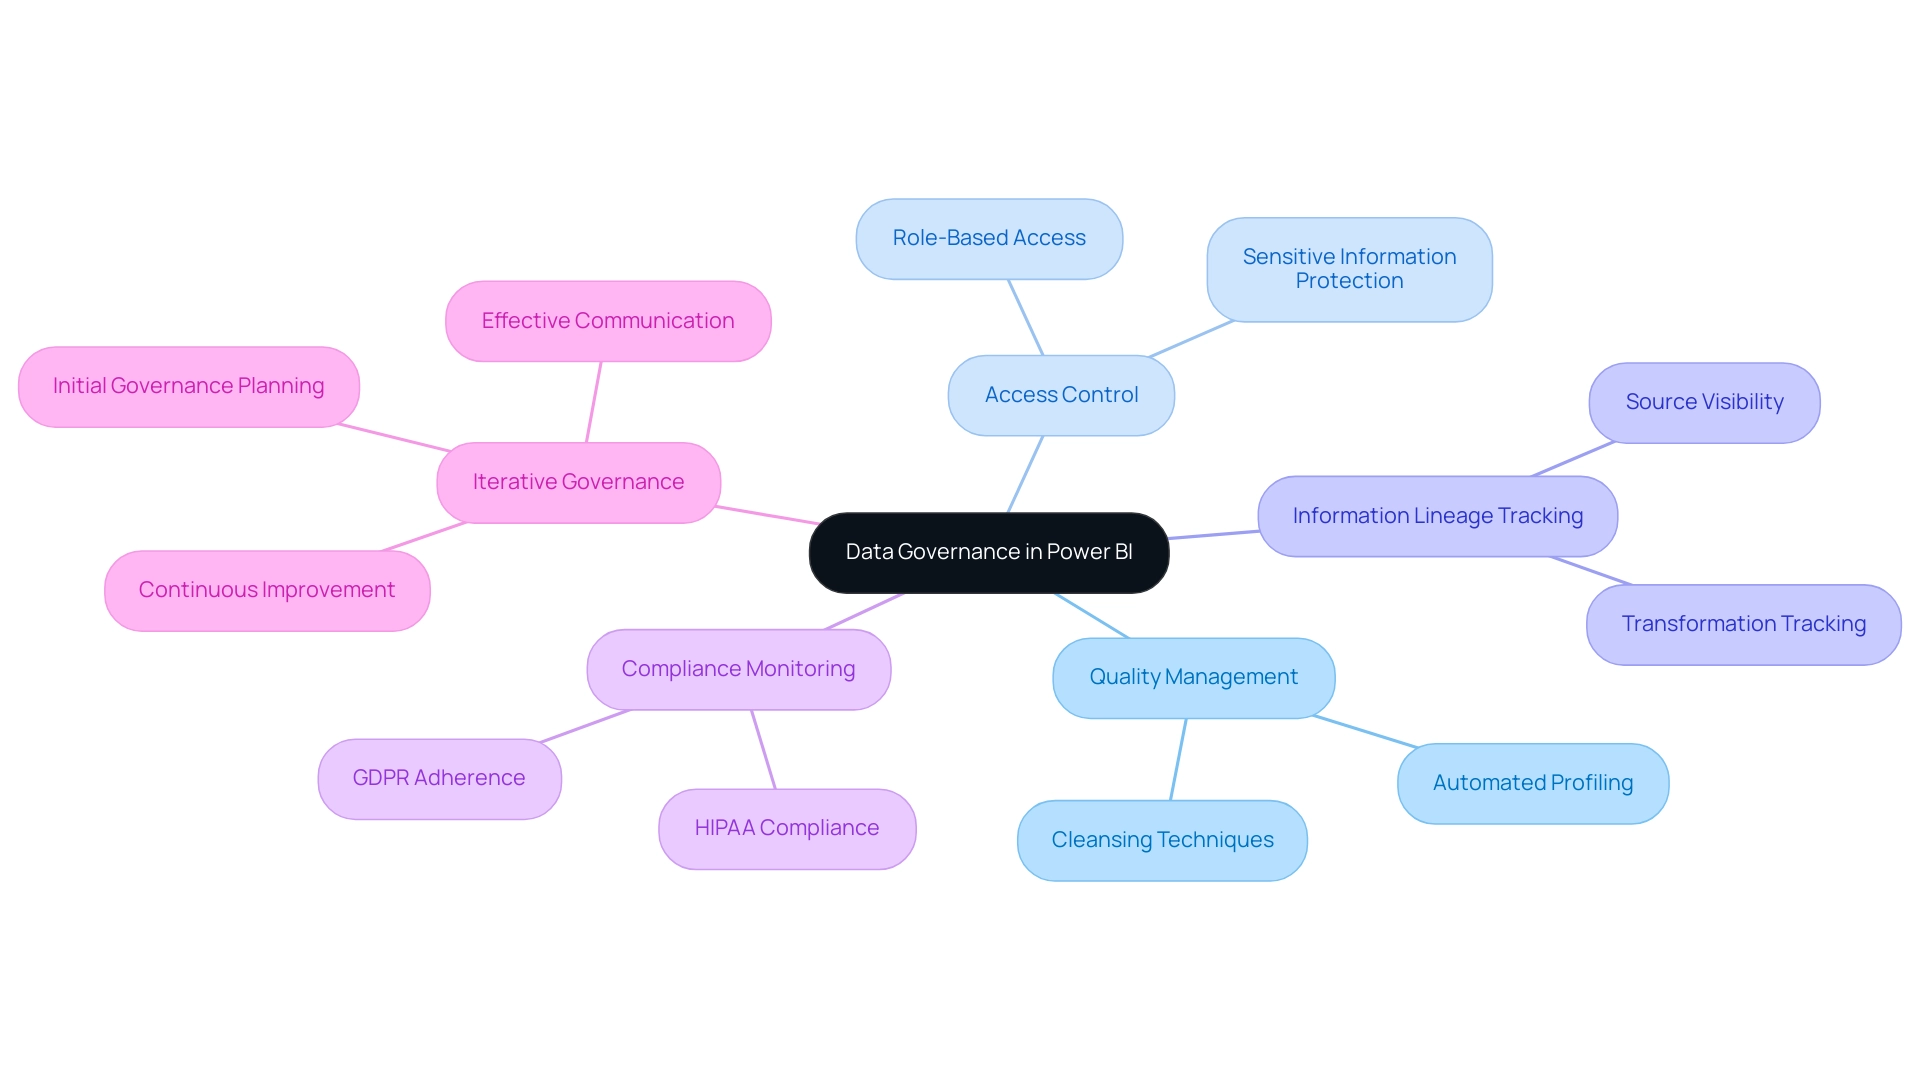
Conclusion
Understanding the diverse data storage options available in Power BI is crucial for organizations striving to optimize their data analytics capabilities. Each method—Import Mode, Direct Query, Composite Model, and Dataflows—offers unique advantages tailored to various business scenarios, enabling rapid performance, real-time access, and efficient data management. By leveraging these options effectively, organizations can enhance reporting accuracy and generate actionable insights that drive strategic decision-making.
Implementing best practices for data storage management, such as:
- Optimizing data models
- Planning refresh schedules
- Utilizing aggregations
further elevates the efficiency of Power BI. Additionally, integrating data governance strategies ensures that the data remains accurate, secure, and compliant, ultimately leading to more reliable analytics. The combination of these approaches empowers organizations to harness the full potential of their data, addressing common challenges such as report creation delays and data inconsistencies.
As the landscape of data analytics continues to evolve, staying informed about the latest advancements and adopting innovative solutions remains essential. By embracing the right data storage and governance practices, organizations can transform their data into a powerful asset, enabling informed decision-making and fostering operational excellence. The journey to mastering data analytics begins with a commitment to understanding and optimizing the tools at one’s disposal, paving the way for sustainable growth and success.
Overview
Updating data in Power BI involves several methods, including manual and automatic updates, which are essential for maintaining the accuracy and relevance of reports. The article outlines best practices for these updates, emphasizing the importance of regular refreshes to avoid the semantic model becoming inactive and to enhance operational efficiency through automated processes and effective troubleshooting strategies.
Introduction
In the dynamic world of data analytics, ensuring that reports and dashboards reflect the most accurate information is paramount for organizational success. Power BI stands at the forefront of this challenge, offering a robust suite of tools designed to streamline data refresh processes. As businesses grapple with the complexities of data management, understanding the intricacies of Power BI’s refresh options—from manual updates to automated solutions—becomes essential.
This article delves into the various methods for updating data, best practices for maintaining data integrity, and effective troubleshooting strategies, all aimed at empowering organizations to harness the full potential of their data while driving operational efficiency.
Whether navigating the nuances of network latency or leveraging Robotic Process Automation (RPA), the insights shared will equip decision-makers with the knowledge necessary to optimize their data workflows and enhance overall productivity.
Understanding Data Refresh in Power BI
In this business intelligence tool, updating data in Power BI is a crucial process that refreshes your datasets with the latest details from the source, ensuring that your analyses and dashboards reflect precise information. This is especially crucial in a setting where companies frequently face challenges with lengthy documentation preparation and information discrepancies. Significantly, BI’s semantic model becomes inactive after two months of inactivity, underscoring the urgency of maintaining regular updates to ensure ongoing report relevance and actionable insights.
To assist in dataset management, Power BI enables users to receive update failure notifications via email, which is essential for quickly addressing any issues that may occur. Furthermore, implementing RPA solutions can simplify the data update process, decreasing the manual effort involved and improving operational efficiency. The platform offers various options for updating data in Power BI:
- Manual update
- Scheduled update
- Incremental update
Each option caters to different requirements and assists in easing the difficulties of data generation.
For instance, a user noted the limitations of update triggers, stating,
Yes, I was that documentation but I could only update and set update-triggers up to 8 times a day every hour or half an hour, not 15 minutes as the guide shows.
Comprehending these update types is crucial, as they directly influence the precision of findings and the trustworthiness of insights obtained from your information. Moreover, practical advice should be incorporated in documents to offer stakeholders clear next steps based on the information presented.
A case study titled ‘Power BI Update Types’ outlines various update types, including:
- Data update
- OneDrive update
- Query caches
- Tile update
- Visual updates
Each type influences the complexity and duration of the update operation. By selecting the suitable update method and incorporating RPA solutions, you can enhance your dataset management through updating data in Power BI, ensuring that your reports consistently deliver the latest information while driving operational efficiency and supporting business growth.
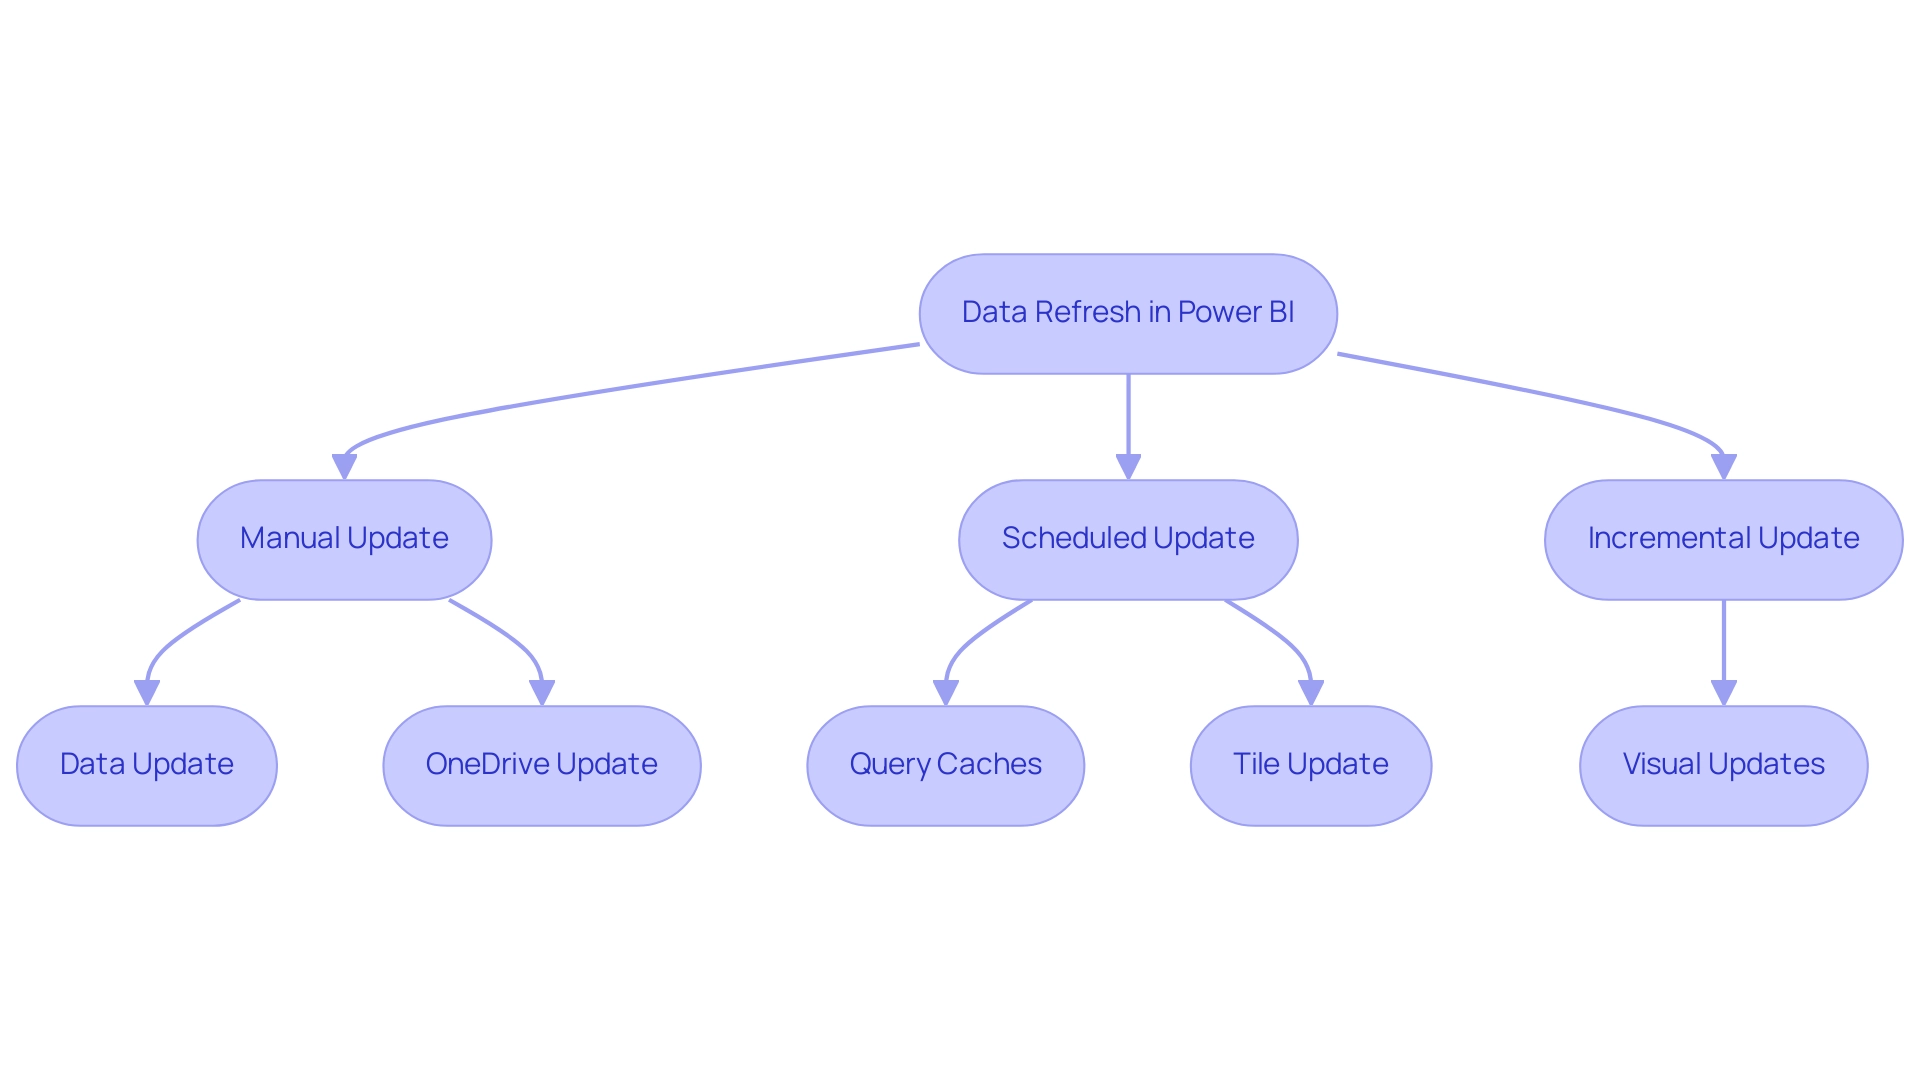
Methods for Updating Data in Power BI: Manual vs. Automatic
This tool provides two main approaches for updating data in Power BI: manual and automatic update. Manual updating data in Power BI requires users to actively click the ‘Refresh’ button within the interface. Although this method is straightforward, it can become labor-intensive, especially when managing large datasets that need frequent updates.
On the other hand, updating data in Power BI through automatic updates enables users to set schedules for modifications at consistent intervals, guaranteeing real-time information availability without manual input. This approach not only saves time but also enhances data reliability, making it a compelling option for organizations focused on operational efficiency.
However, it’s essential to recognize that the default limitation for a Premium license regarding updating data in Power BI is 48 updates per day, with a maximum update frequency of 30 minutes. Entities pursuing enhanced update flexibility must employ an XMLA Endpoint, highlighting the importance of understanding the constraints and functionalities involved in updating data in Power BI. Moreover, updating data in Power BI is crucial, as the semantic model becomes inactive after two months of inactivity, highlighting the necessity of regular refreshes to maintain model efficacy.
Implementing automatic refresh while updating data in Power BI has proven to deliver significant time savings and enhanced accuracy, showcasing its effectiveness in bolstering operational efficiency. Furthermore, using tools such as VertiPaq Analyzer can offer insights into model performance, assisting in optimizing management strategies. For those unable to leverage an enterprise information gateway, deploying a personal information gateway can serve as a viable alternative, despite certain limitations.
Ultimately, choosing the suitable update approach for updating data in Power BI is essential and should align with the organization’s workflow requirements and information management objectives, thereby enhancing productivity and supporting informed decision-making in the rapidly evolving AI landscape. Furthermore, integrating tailored AI solutions can further enhance operational efficiency by providing customized approaches to information management and analysis.
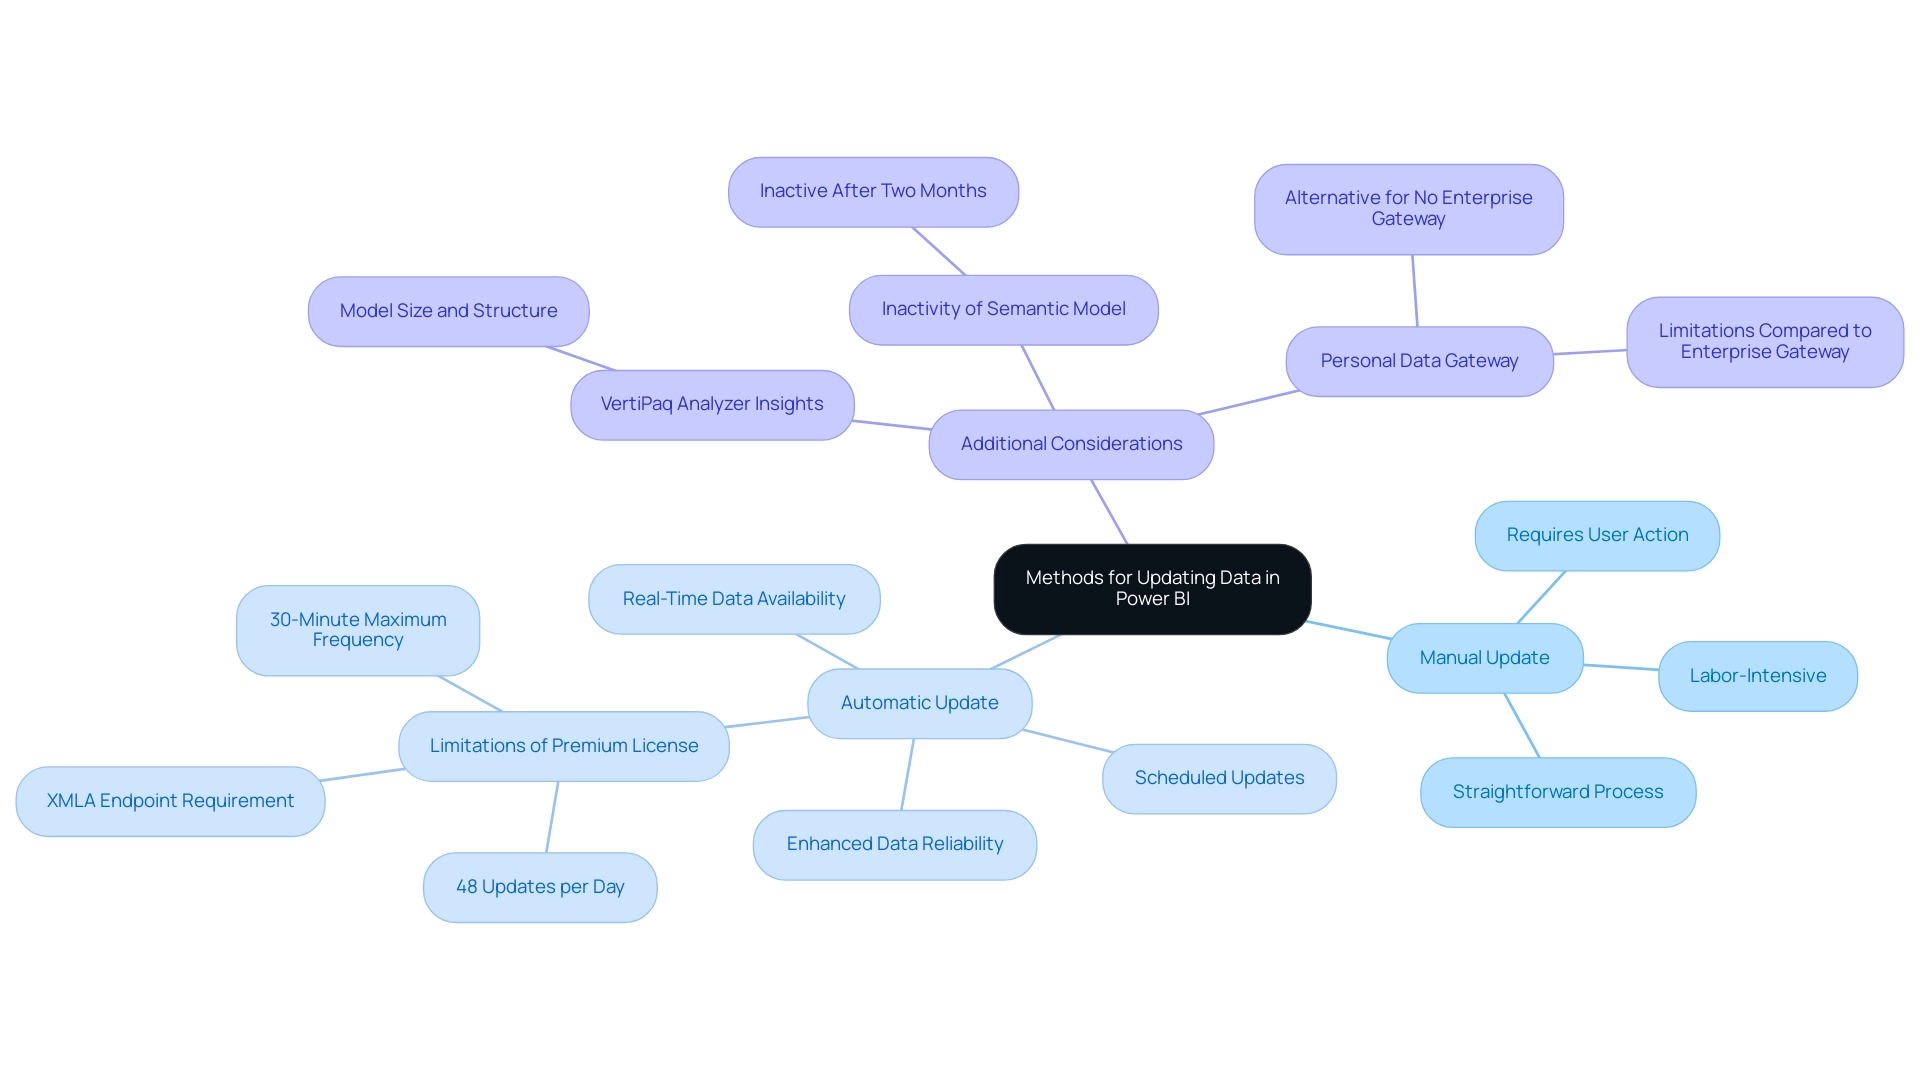
Setting Up Automatic Data Refresh in Power BI
To establish automatic data refresh in Business Intelligence, adhere to these detailed steps:
- Launch your BI Desktop file and publish your report to the BI Service.
- Access the Power BI Service and locate your dataset.
- Choose the ‘Schedule update’ option located under the dataset settings.
- Activate the ‘Keep data updated’ switch by toggling it to ‘On’.
- Specify your desired update frequency—whether daily, weekly, or other—and ensure you select the correct time zone.
- Save your settings to finalize the process.
By following these steps, updating data in Power BI will happen automatically according to the schedule you set, ensuring that your reports remain current. It’s essential to consider network latency when establishing update schedules for updating data in Power BI, as it can significantly influence performance. Maintaining data sources, gateways, and BI clusters within the same region can reduce latency, which is essential for updating data in Power BI, resulting in improved update times and overall dataflow performance.
As highlighted in the case study titled ‘Network Latency and Dataflow Performance’, minimizing network latency can lead to improved refresh times and overall performance of dataflows. Moreover, adopting Robotic Process Automation (RPA) and tools such as Automate can enhance your operations by streamlining workflows and liberating resources for strategic initiatives. For example, Automate enables you to develop automated workflows that can initiate refreshes in BI based on particular events, ensuring that your information is consistently current without manual intervention.
BI sends refresh failure notifications to the semantic model owner via email by default, which is a crucial aspect of monitoring refresh performance. As one BI user, mwolfc, noted, ‘The complexity of information integration requires not just familiarity with BI but also a deeper understanding of the underlying technology.’ By implementing these steps and leveraging RPA and Automation, you can navigate these challenges and optimize your operational efficiency.
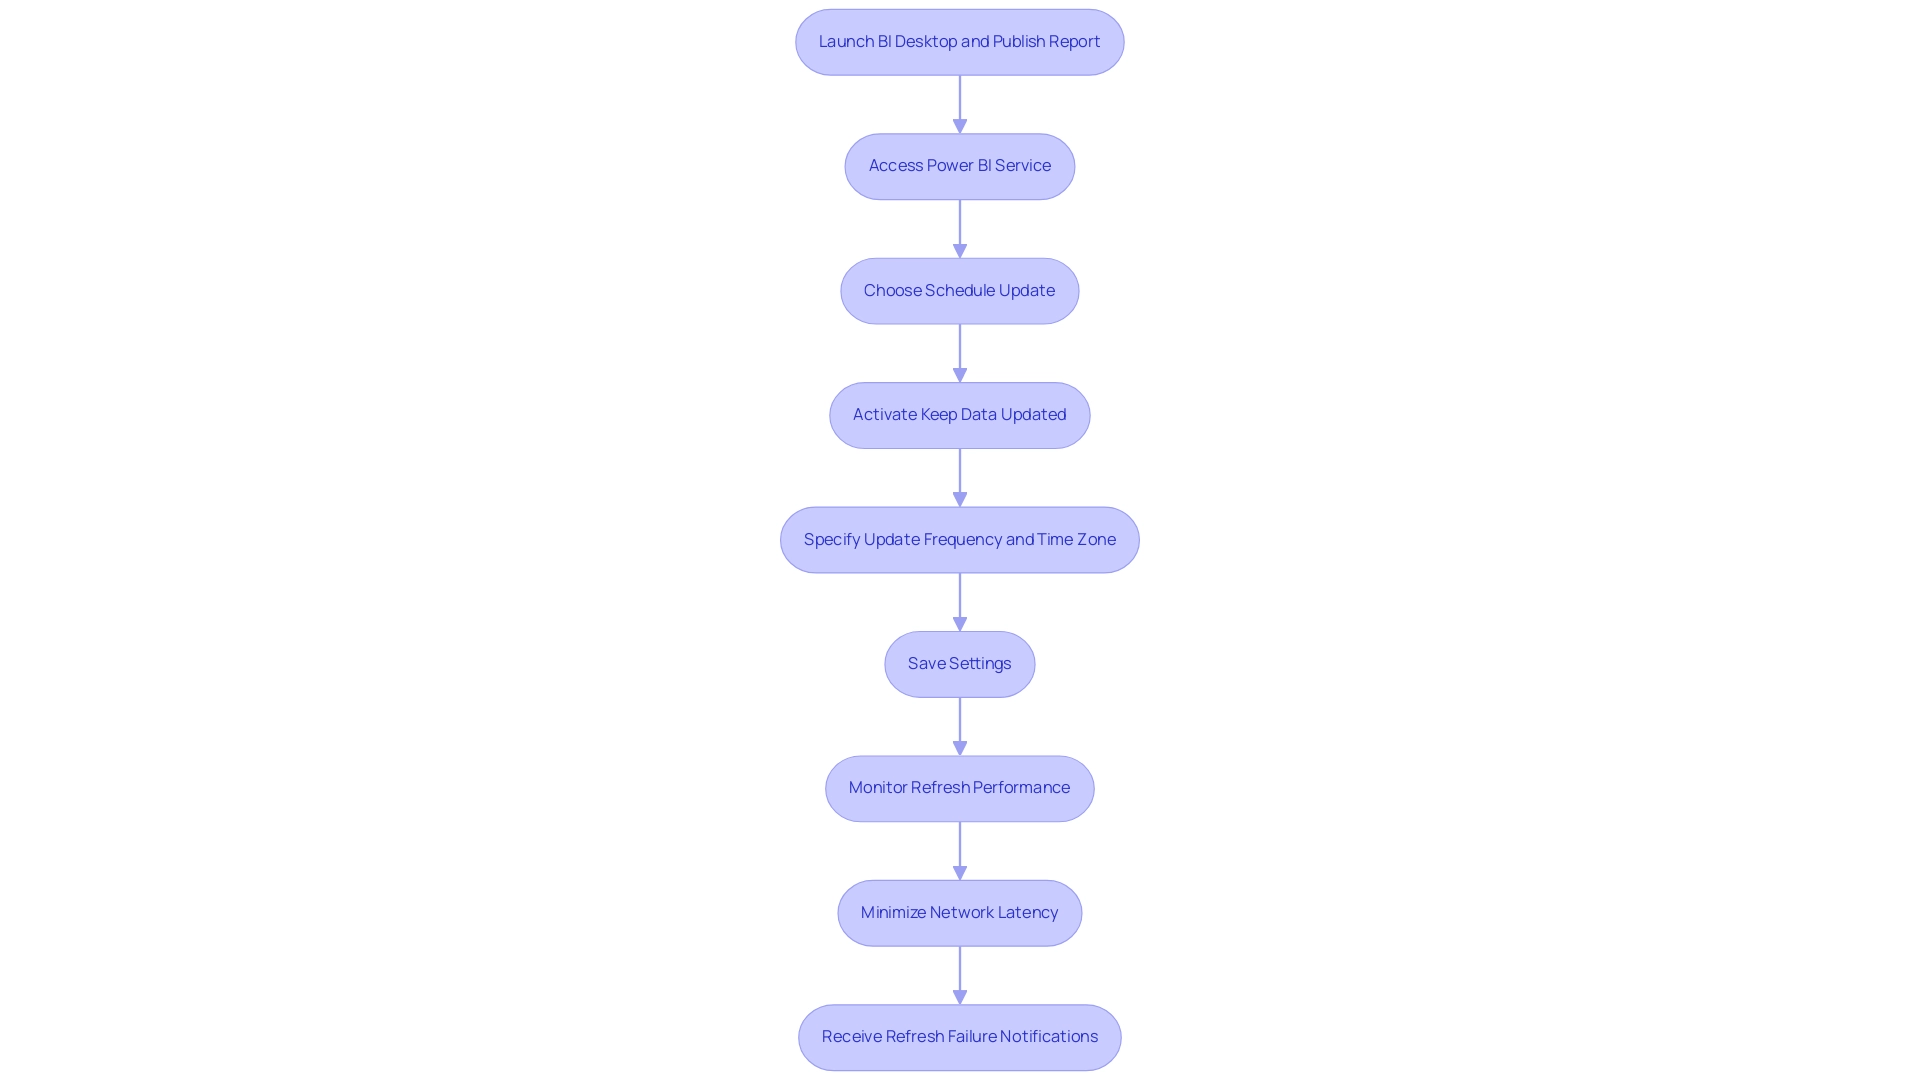
Best Practices for Data Updates in Power BI
To ensure information integrity and achieve successful updates in BI, implementing the following best practices is essential:
- Regularly review and clean your data sources to eliminate inconsistencies and enhance accuracy. This proactive approach minimizes potential errors during updating data in Power BI operations, which addresses one of the common challenges in leveraging insights from Power BI dashboards. Utilize incremental updates for large datasets, which significantly enhances performance and reduces update times while updating data in Power BI. As highlighted in recent recommendations, this method is crucial for managing extensive data volumes efficiently, ultimately driving operational efficiency.
- Track your update history diligently and establish notifications for any unsuccessful updates while updating data in Power BI. Addressing issues promptly is vital for maintaining the integrity of your documents, ensuring that actionable guidance is always available to inform decision-making. Document your information refresh processes thoroughly to ensure consistency and facilitate seamless troubleshooting. This practice is invaluable for streamlining operations and enhancing collaboration within your team.
By following these best practices for updating data in Power BI, you can significantly improve the reliability and accuracy of your BI analyses. Moreover, utilizing features such as the 3-Day Business Intelligence Sprint can accelerate document creation, while the General Management App can offer extensive oversight and intelligent evaluations, further improving your analytics capabilities. The case study on Power BI Refresh Types illustrates various refresh operations, including information refresh, OneDrive refresh, and tile refresh, each impacting the complexity and duration of updates.
As Brahmareddy insightfully stated,
By simplifying these measures and doing more of the heavy lifting in Databricks, I was able to speed up my reports.
This highlights the significance of optimizing processes for improved results in management and integration. Moreover, consider insights from industry experts to further emphasize the importance of preserving information integrity and utilizing RPA solutions like EMMA to enhance productivity and operational efficiency.
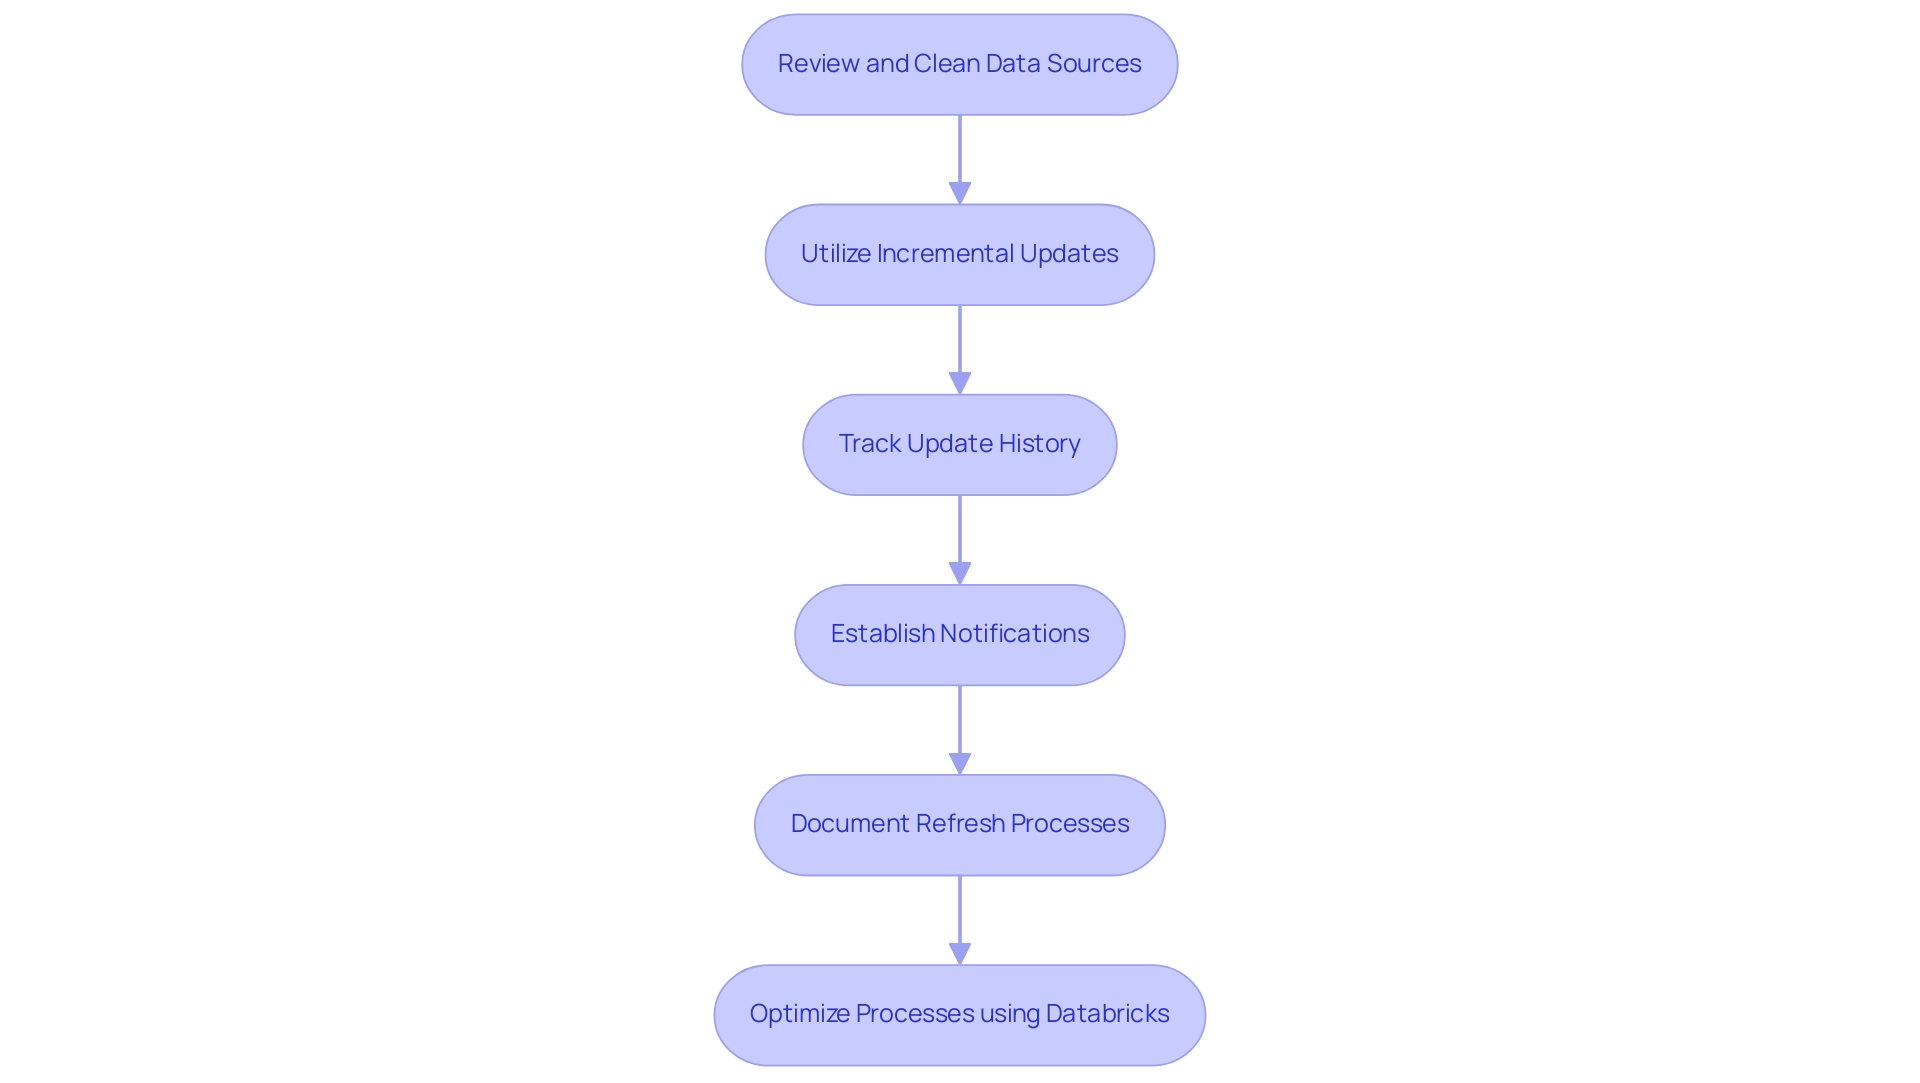
Troubleshooting Data Update Issues in Power BI
Updates in Power BI can present several challenges, including connectivity problems, changes to sources, and refresh timeouts. These issues often lead to time-consuming report creation and inconsistencies in information, undermining trust in the insights derived from your dashboards. To effectively troubleshoot these challenges, begin by verifying your internet connection and ensuring that your information source is accessible.
If modifications have occurred within the information source, promptly update the connection settings in Power BI to reflect these changes. In instances of timeout issues, consider optimizing your queries for better performance or adjusting the timeout settings. Notably, for imported semantic models, scheduled refreshes timeout after two hours; however, this limit extends to five hours in Premium workspaces—an important detail to keep in mind.
Additionally, when making changes to multiple calculated tables, remember to submit these modifications together in a single transaction using Tabular Editor to ensure proper updates and prevent errors.
Poor master information quality can also exacerbate these issues, leading to flawed decision-making. To gain deeper insights into your update process, leverage the update history feature to identify any error messages that may inform your troubleshooting efforts. For instance, encountering the error ‘Container Exited Unexpectedly with Code 0x0000DEAD’ suggests that the container has unexpectedly terminated.
In this case, disabling the scheduled refresh and republishing the semantic model may effectively resolve the issue, as indicated in the case study context, where similar troubleshooting steps led to improved reliability.
Moreover, industry expert Jeff Shields suggests,
I wonder if you could ZIP them and read them into a flow from a OneDrive/SharePoint folder,
highlighting an innovative approach to managing flow. By staying proactive and methodical in your troubleshooting, you can efficiently navigate the complexities of updates in Power BI, tackle the challenges of poor governance, and ensure a smoother operational process. Furthermore, adopting AI technologies can enhance data management by providing advanced analytics capabilities that transform raw data into actionable insights, addressing the common hesitance organizations face when integrating AI into their processes.
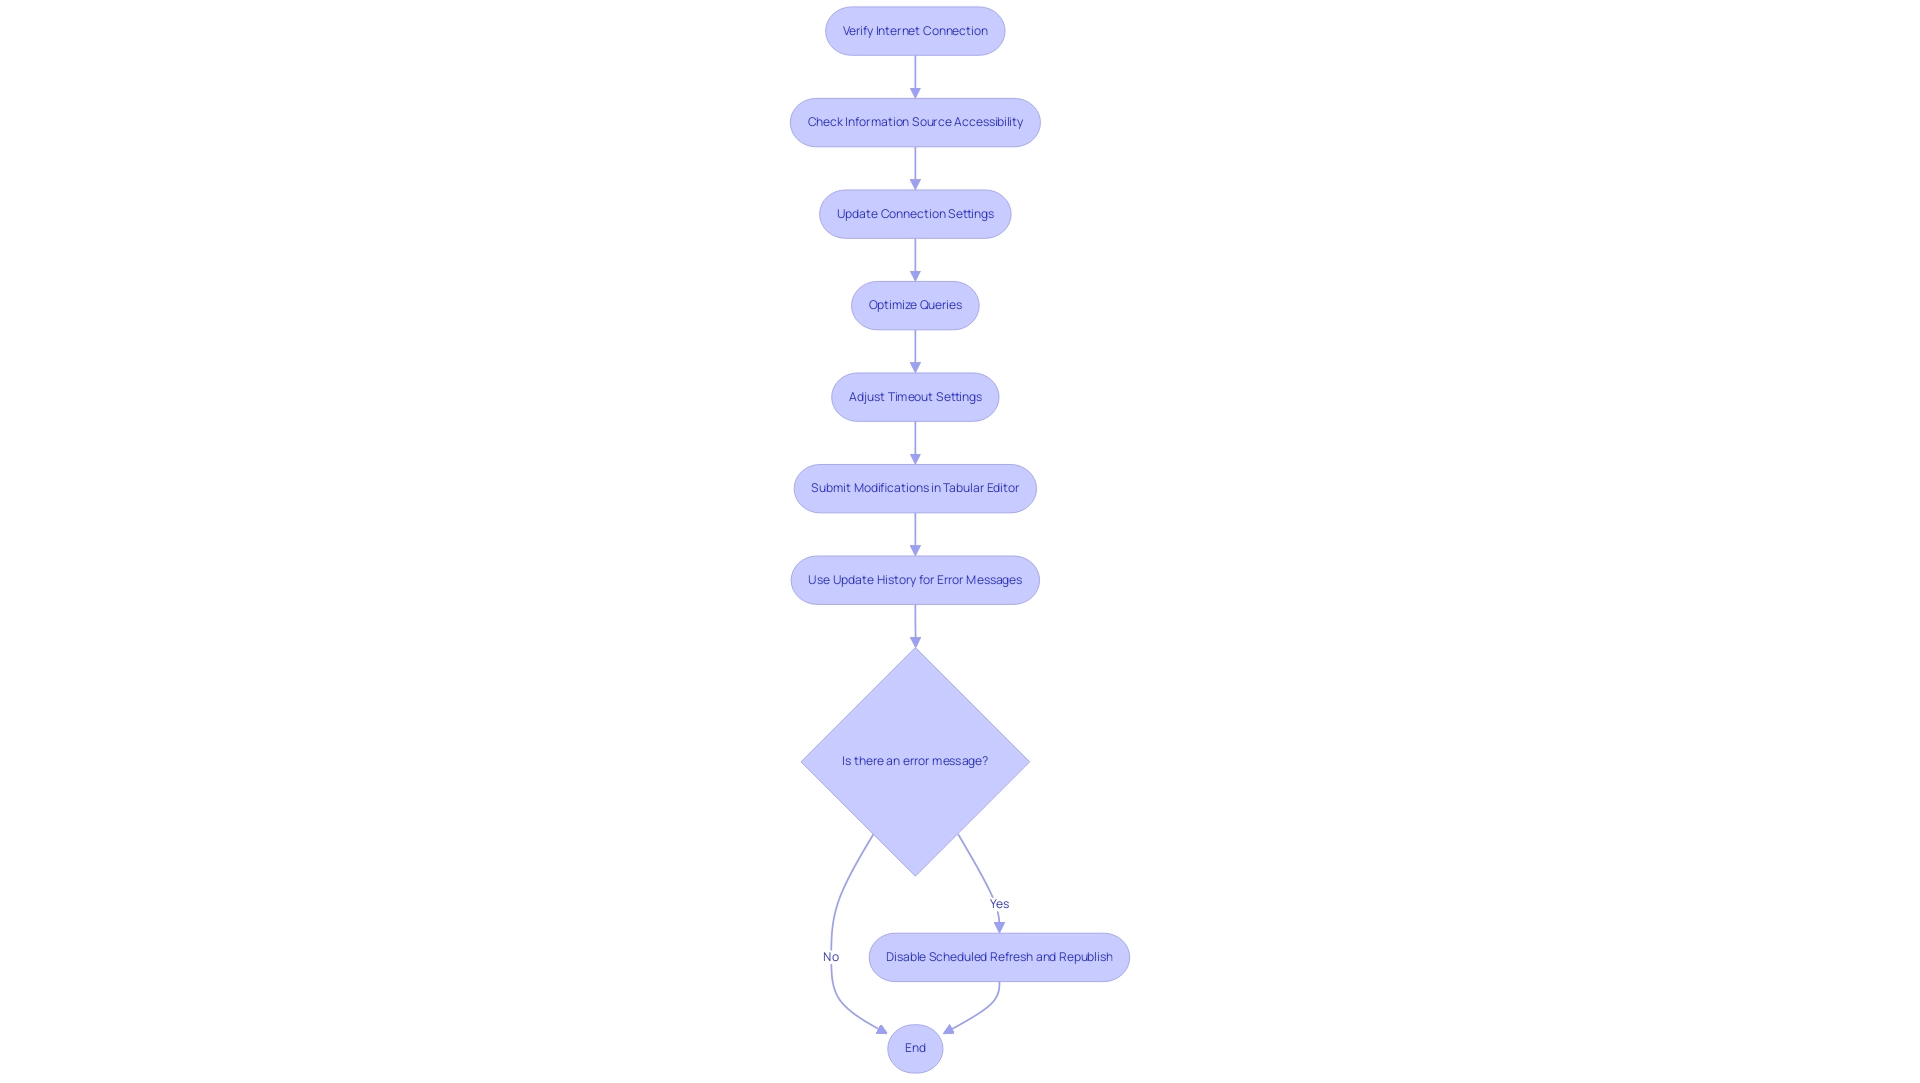
Conclusion
Ensuring that Power BI reports and dashboards are consistently updated with the most accurate data is critical for driving informed decision-making and operational efficiency. By understanding the various methods for data refresh—manual and automatic—organizations can choose the approach that best aligns with their operational needs. Automatic refresh not only saves time but also enhances the reliability of the data, making it a preferred choice for many businesses seeking to streamline their data workflows.
Implementing best practices such as:
- Regular data reviews
- Utilizing incremental refresh for large datasets
- Setting up alerts for refresh failures
can significantly improve data integrity. Moreover, troubleshooting strategies are essential for addressing common issues that can disrupt data updates. By proactively managing these challenges, organizations can maintain the trustworthiness of their insights and ultimately enhance their overall productivity.
In the rapidly evolving landscape of data analytics, leveraging tools like Robotic Process Automation (RPA) and Power Automate can further optimize data management processes. By adopting these solutions and adhering to established best practices, organizations can empower their teams to make data-driven decisions with confidence. The journey towards operational excellence in data analytics begins with a commitment to maintaining accurate, timely data—an investment that pays dividends in efficiency and insight.
Overview
The article provides a comprehensive step-by-step guide on how to schedule data refreshes in Power BI, emphasizing the importance of keeping datasets up-to-date for accurate reporting. It details prerequisites, troubleshooting tips, and best practices, such as configuring updates during off-peak hours and implementing incremental updates to enhance operational efficiency and ensure reliable insights for decision-making.
Introduction
In the dynamic landscape of data management, ensuring that insights are timely and accurate is paramount for organizations striving for operational excellence. Power BI stands out as a powerful tool to facilitate this, but the effectiveness of its reporting hinges on a well-executed data refresh strategy.
By automating data updates and implementing best practices for scheduled refreshes, businesses can not only enhance their reporting capabilities but also free up valuable resources for more strategic initiatives.
This article delves into the essentials of configuring scheduled refreshes, troubleshooting common issues, and optimizing processes to ensure that organizations can harness the full potential of their data, driving informed decision-making and fostering growth.
Understanding Data Refresh in Power BI
Updating in Business Intelligence is a vital procedure that allows the renewal of datasets with the most recent information from primary sources, guaranteeing that reports and dashboards display the latest information crucial for informed decision-making. As organizations aim for information precision, the capability to schedule data refresh power bi automatically or manually at determined intervals improves the dependability of insights. Under a Premium license, BI supports a maximum of 48 schedule data refresh power bi per day, with the potential for even more frequent updates by enabling an XMLA Endpoint.
Comprehending the intricacies of the schedule data refresh power bi process is vital for maintaining the integrity of reports. Businesses using Coupler. Io have reported significant enhancements in flow automation, enabling users—regardless of technical background—to effectively link sources to BI.
This case study illustrates how automating information updates through RPA solutions, such as EMMA RPA and Microsoft Automation, results in near-real-time monitoring, enabling organizations to make timely, insight-driven decisions while minimizing errors and allowing team members to focus on more strategic, value-enhancing tasks. Recent advancements in BI information management, including the integration of RPA tools for diagnosing refresh failures, further underscore the importance of scheduling data refresh power bi processes to ensure they remain robust and dependable for accurate reporting. EMMA RPA’s capability to simplify repetitive tasks and Microsoft Automate’s functions for scheduling and managing updates can greatly improve operational efficiency.
Furthermore, when administrators turn off usage metrics for their whole organization, they can employ the Delete all existing usage metrics content option to guarantee a clean slate in their management practices.
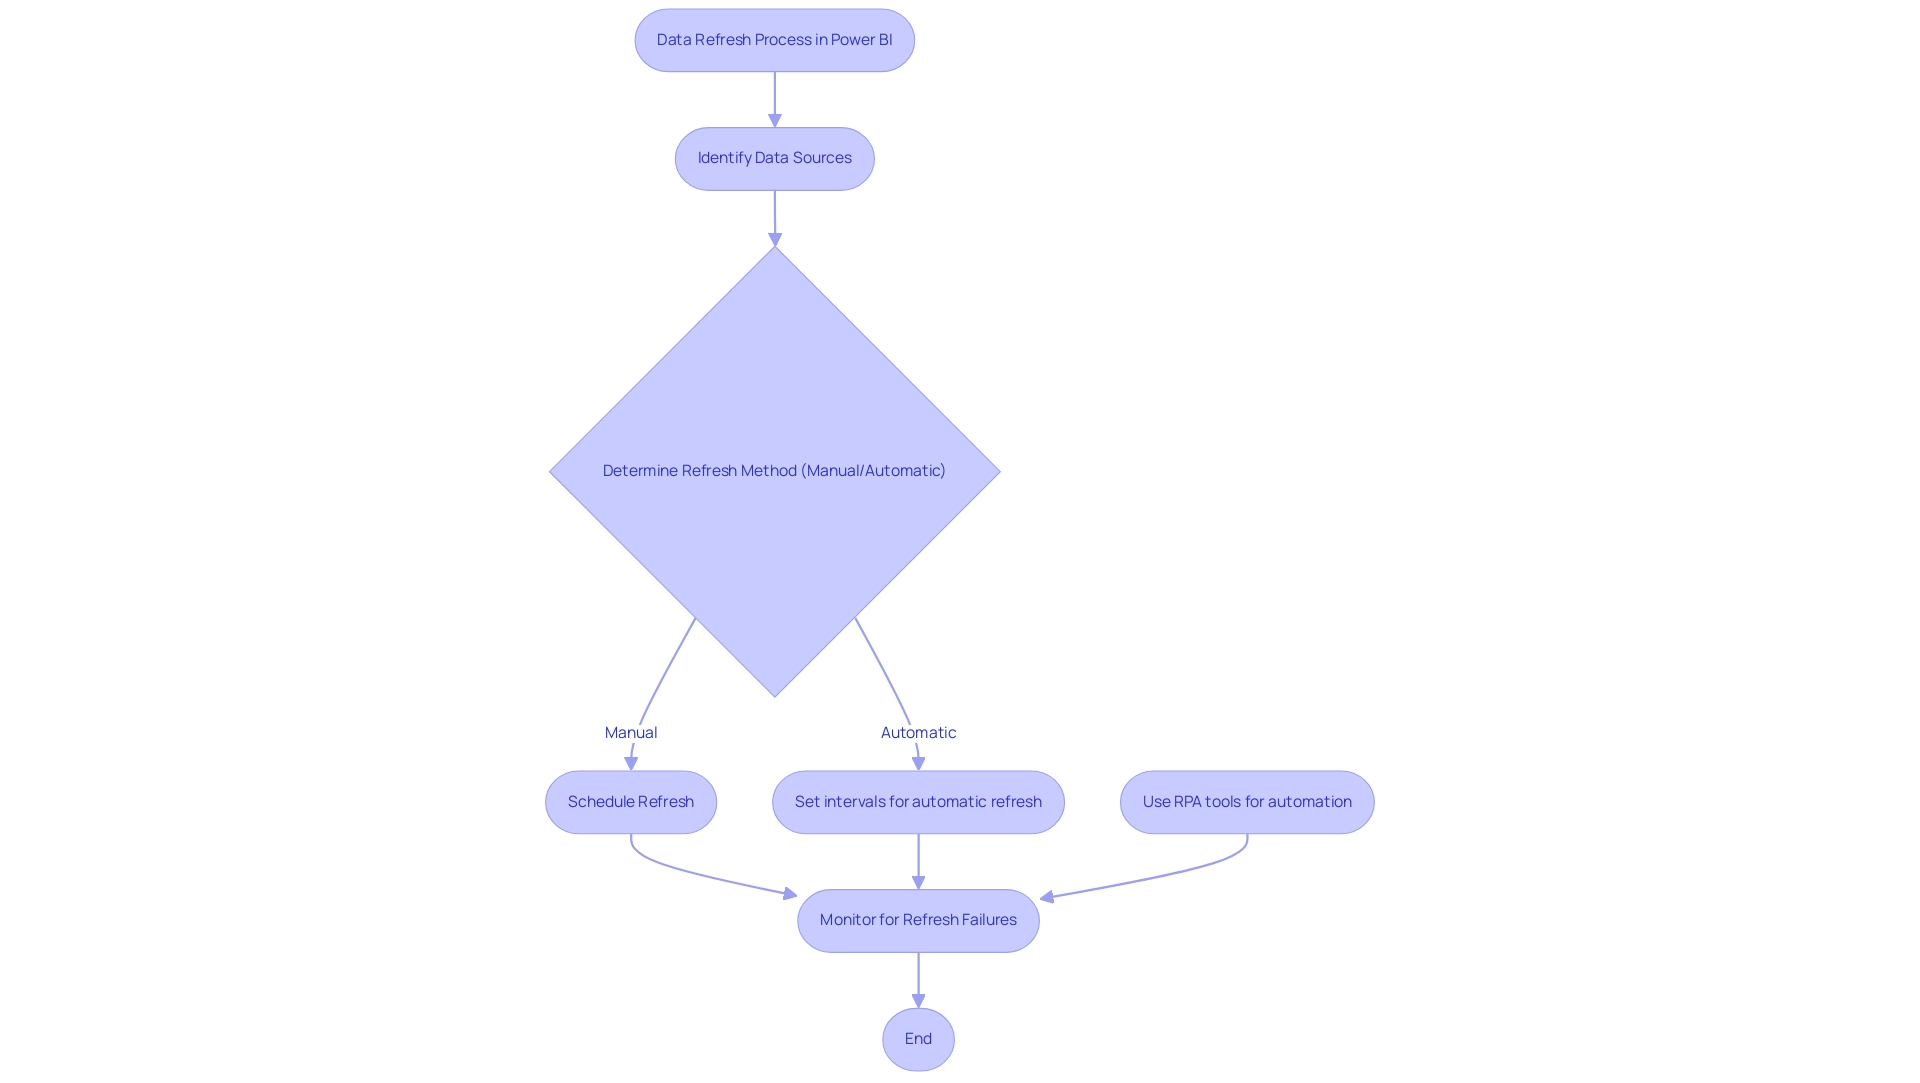
Prerequisites for Setting Up Scheduled Refreshes
Before starting scheduled updates in Power BI, it’s essential to ensure that your dataset aligns with specific prerequisites to optimize the process while overcoming common challenges in leveraging insights:
- Information Source Compatibility: Verify that your information sources support scheduled updates. Commonly compatible sources include SQL databases, Azure services, and various online platforms such as Salesforce and Google Analytics. Grasping compatibility is essential, particularly as numerous organizations are progressively employing on-premises information gateways in 2024, which can influence update capabilities and lead to information inconsistencies.
-
Gateway Configuration: For on-premises data sources, installing and configuring the on-premises data gateway is necessary to enable smooth data updates. Utilizing separate gateways for Import and DirectQuery models can significantly enhance performance and minimize refresh conflicts. Best practices suggest scheduling refreshes during less busy times while also optimizing semantic models to include only necessary tables and columns to maintain reliability and ensure actionable insights.
-
Power BI Service Account: Ensure that you have a Power BI service account with the appropriate permissions to configure and manage datasets effectively. This access is vital for executing refresh operations without interruptions, thus alleviating the burden of time-consuming report creation.
-
Scheduled Refresh Settings: Familiarize yourself with the various settings related to the schedule data refresh in Power BI, including frequency (daily or weekly) and applicable time zones. For instance, best practices suggest scheduling updates during off-peak hours to maintain system efficiency. Moreover, it’s crucial to observe that the default limitation for a Premium license is 48 refreshes per day, which can affect your scheduling strategy.
By incorporating these prerequisites, you not only streamline the scheduling process but also enhance the governance strategy that supports your management efforts. This governance is crucial in ensuring that the information remains consistent and trustworthy, which in turn leads to more actionable insights for stakeholders. As noted by ninMonkey, to optimize data retrieval,
Web.
Contents needs to use options[Relative Path] and options[Query] (or Content for HTTP POST). Additionally, a case study emphasized concerns regarding BI Premium per-user licenses, indicating that while users could assign up to 48 updates in a 24-hour period, updates were still restricted to 30-minute intervals. By following these guidelines and highlighting the significance of governance, you can guarantee a dependable and effective update strategy for your BI datasets, ultimately fostering data-driven insights and operational efficiency for business growth.
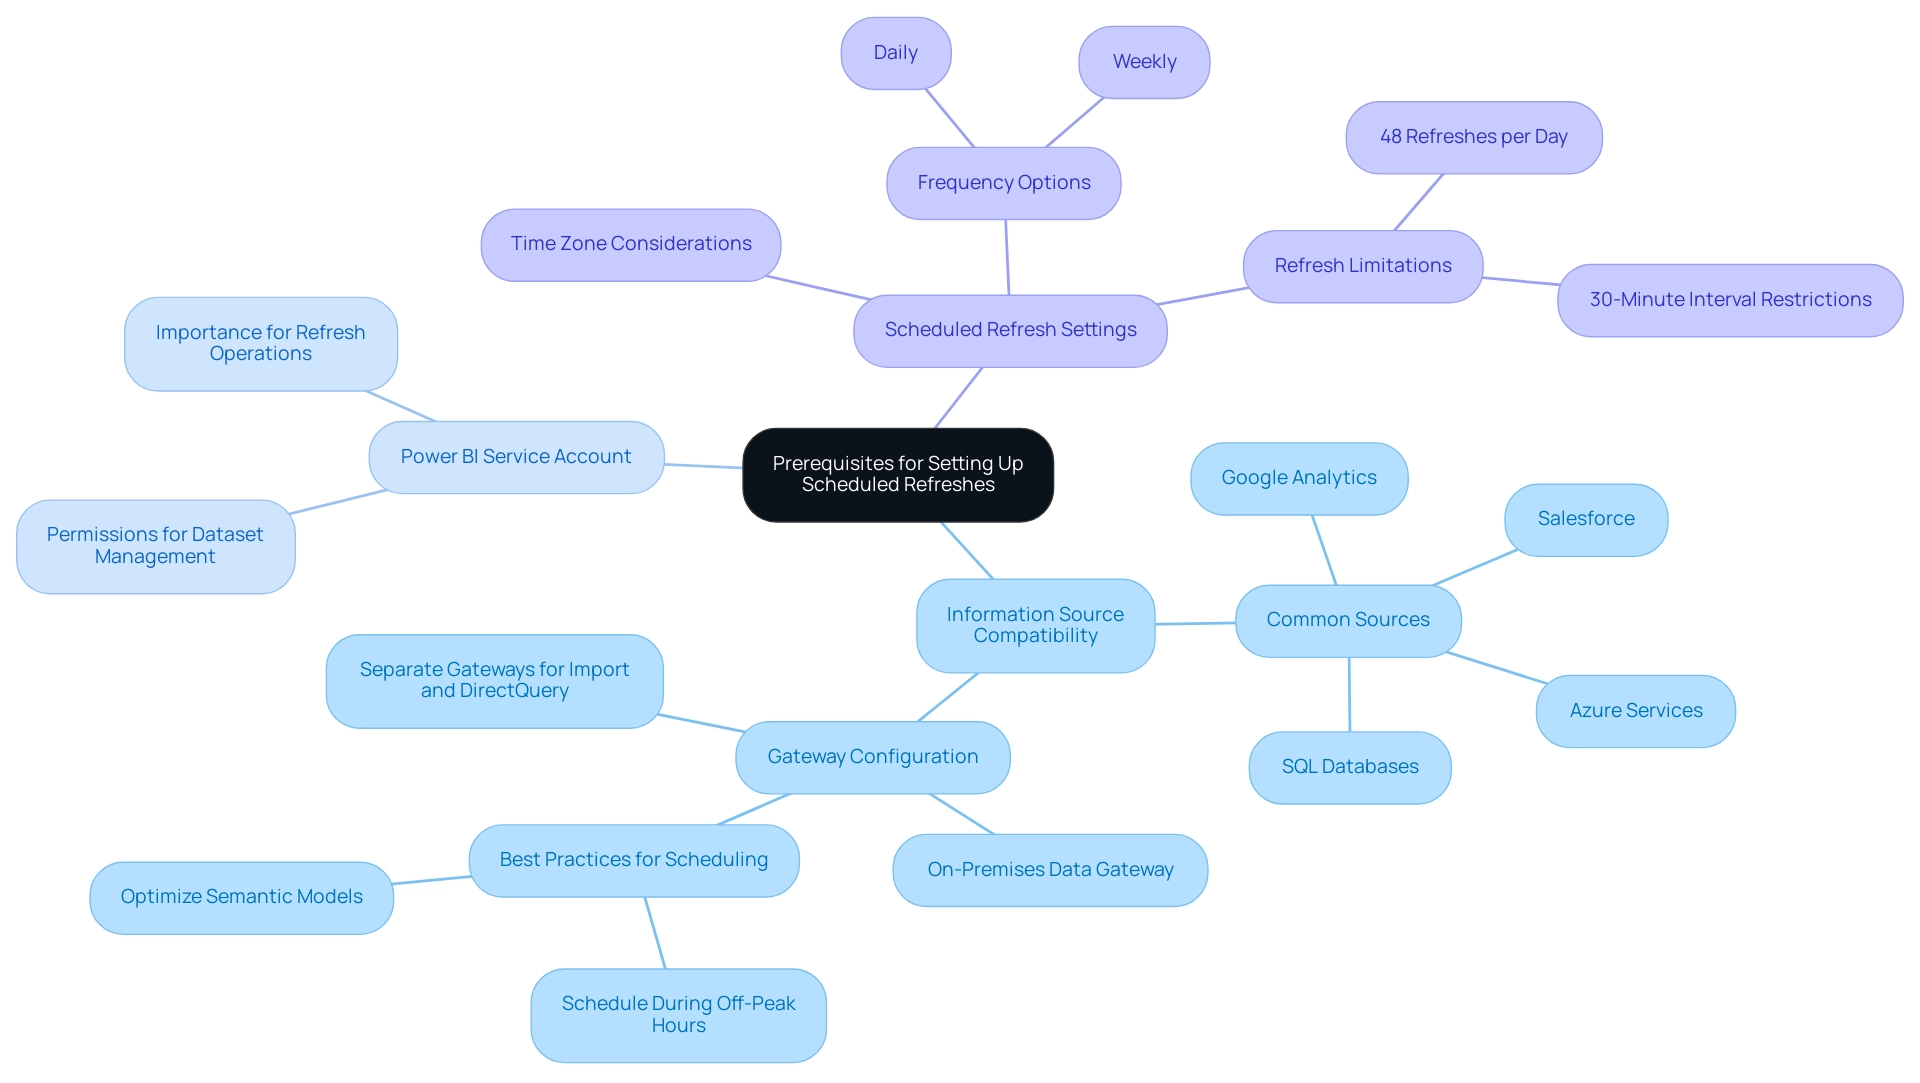
Step-by-Step Guide to Configuring Scheduled Refreshes
Setting up a schedule data refresh in Power BI is essential for maintaining up-to-date reports and dashboards, particularly in enhancing operational efficiency through automation. By following this step-by-step guide, you can effectively automate your data update process, leveraging Robotic Process Automation (RPA) to minimize manual tasks, reduce errors, and free up your team for more strategic work:
- Open Power BI Service: Start by logging into your Power BI account and navigating to the workspace where your dataset is located.
- Select Dataset: Identify the dataset you wish to configure for scheduled updates. Click on the ‘More options’ (three dots) next to the dataset name.
- Settings: From the dropdown menu, select ‘Settings’ to access the configuration options.
- Scheduled Update: In the settings menu, scroll to the ‘Schedule data refresh in Power BI’ section and toggle the switch to ‘On’ to activate the scheduled update.
- Set Frequency and Time: Determine the update frequency for the scheduled data refresh in Power BI—either daily or weekly—and specify the exact time for the update to occur.
- Apply Changes: Click ‘Apply’ to save your settings and ensure that the configuration is active.
- Test Update: It’s advisable to manually initiate an update initially to verify that everything is functioning properly. Review the update history to verify completion without mistakes.
Integrating these steps into your routine will not only enhance your operations but also guarantee that your reports represent the most recent information accessible, tackling issues like inconsistencies in information. For semantic models larger than 1 GB or those that require several hours to update, using incremental updating is recommended. Furthermore, all online and on-premises information sources displayed in Power BI Desktop and Excel are supported, ensuring wide compatibility for your datasets.
Regularly monitoring update history and the status of your gateway is essential. As emphasized by Mussarat Nosheen, who stated,
For on-premises information sources, setting up a gateway is crucial.
This practice reduces the risk of downtime and improves the dependability of your update strategy.
Ensuring that the BI Data Gateway is operational and regularly monitored can prevent refresh failures, maintaining the integrity of your reporting and driving data-driven insights vital for business growth. By actively overseeing these aspects, you can significantly improve your operational efficiency and make informed decisions based on trustworthy information.
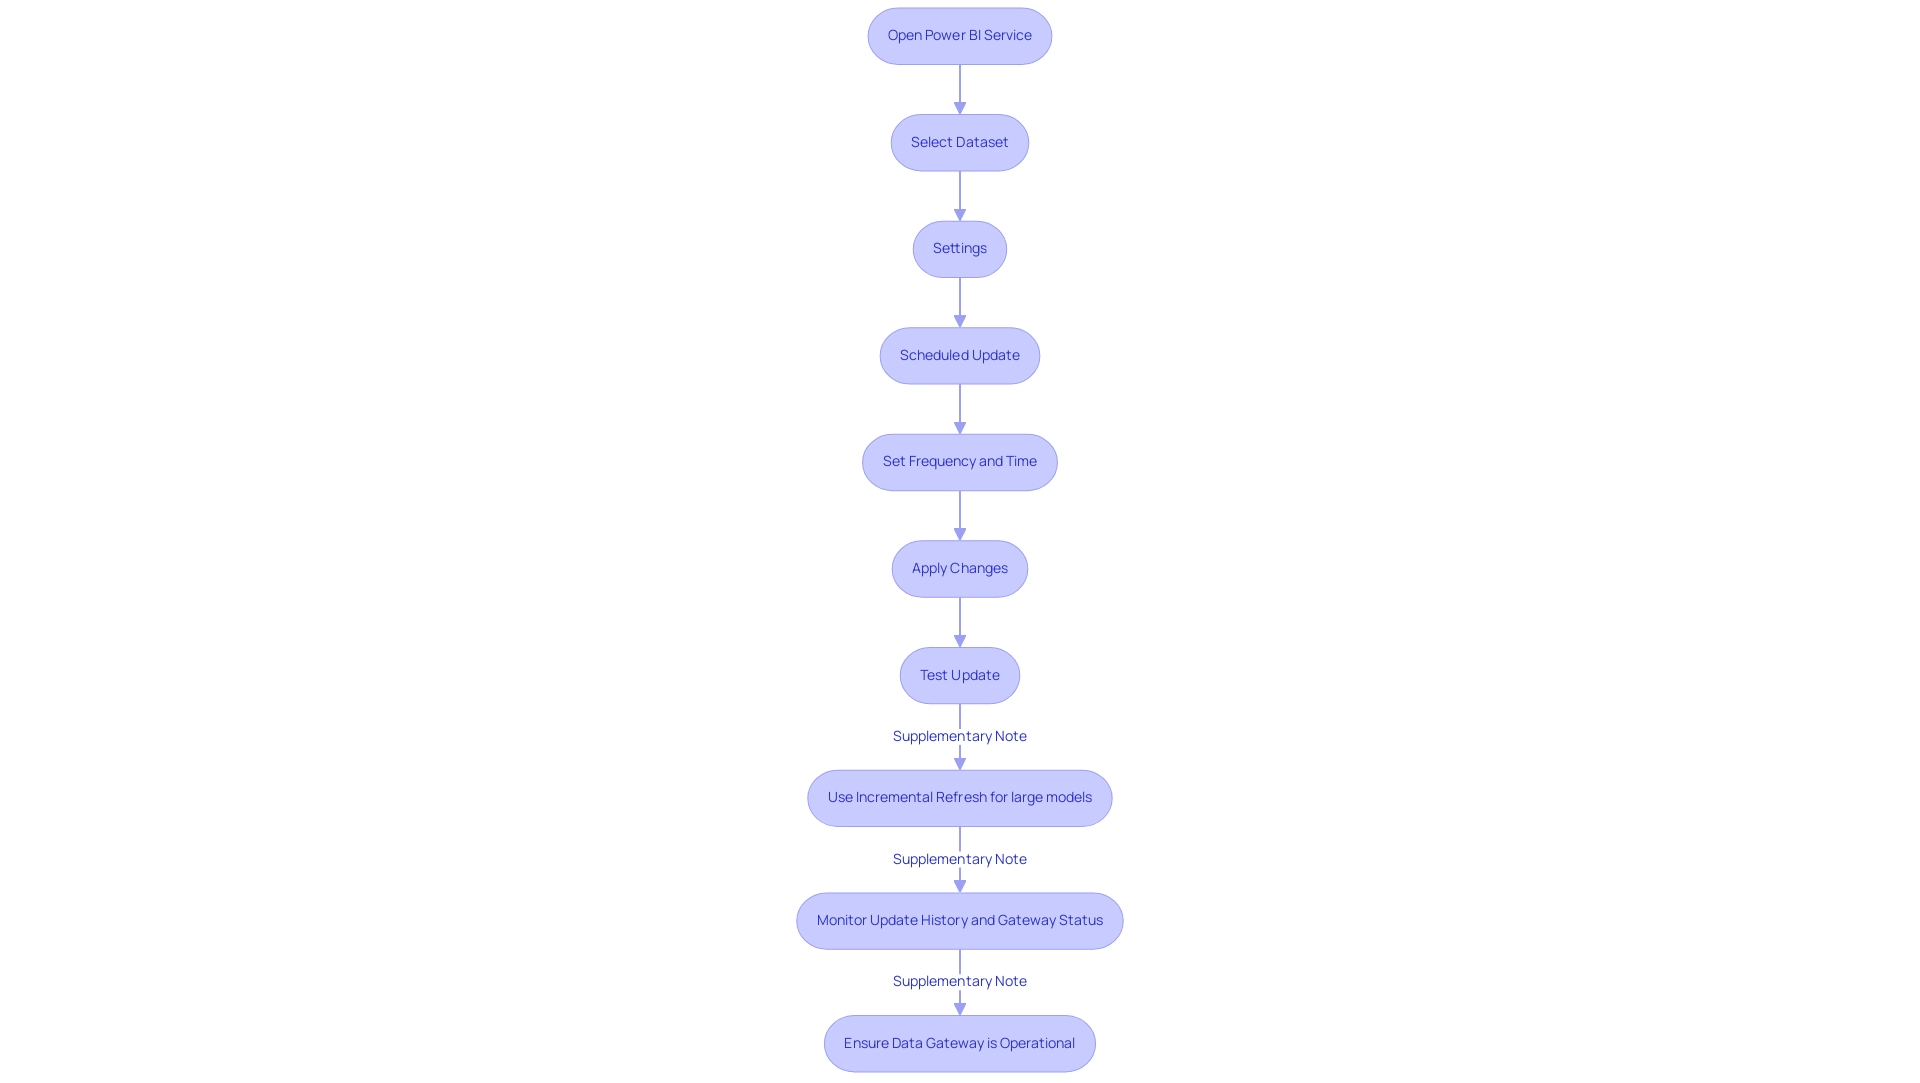
Troubleshooting Scheduled Refresh Issues
Encountering issues with schedule data refresh in Power BI can be frustrating, especially when you’re already investing more time in constructing reports than leveraging the insights they can provide. A lack of a governance strategy often contributes to inconsistencies, making it essential to address these issues effectively. Here are several troubleshooting steps that can help you resolve these problems and enhance your overall information governance strategy:
- Check Source Credentials: Begin by ensuring that the credentials for your sources are valid and up-to-date. Expired credentials can result in update failures, adding to the time you spend on report creation.
- Review Gateway Configuration: For on-premises data sources, confirm that your data gateway is online and configured correctly. This is crucial for maintaining a successful connection and preventing inconsistencies in your reports.
- Inspect Update History: Access the update history for your dataset. This valuable resource can highlight specific errors or warnings, providing insights into what might have gone wrong during the update process, which can help reduce confusion and mistrust in your data.
- Monitor Data Volume: Large datasets can significantly prolong update times. If you experience timeouts, consider optimizing your data model or adjusting the timeout settings to accommodate larger volumes of data, ensuring you can derive actionable insights without delay.
- Check for Service Outages: Occasionally, BI services may experience outages that can affect refresh operations. Regularly check the BI support page for any reported issues that could affect your schedule data refresh in Power BI.
- Be Aware of Refresh Frequency Limits: Keep in mind that a Power BI Premium license allows a maximum update frequency of 30 minutes, which can influence your ability to schedule data refresh in Power BI and present timely insights.
- Address Circular Dependency Errors: If you encounter circular dependency errors, modify CalculateTables to include necessary filters and submit changes in a single transaction using Tabular Editor.
By implementing these troubleshooting tips, you can proactively address and resolve common refresh issues, ensuring your information remains current and reliable. Real-world examples, such as a recent case where a user faced notification failures due to an offline gateway, highlight the importance of these steps. As Anuj Sikand noted, ‘Thank you for that, completely missed that message.
I’ll keep an eye on the post for resolution.’ Despite the challenges of time-consuming report creation and inconsistencies, focusing on these practices will empower you to maintain seamless operations and provide clear, actionable guidance to your stakeholders.
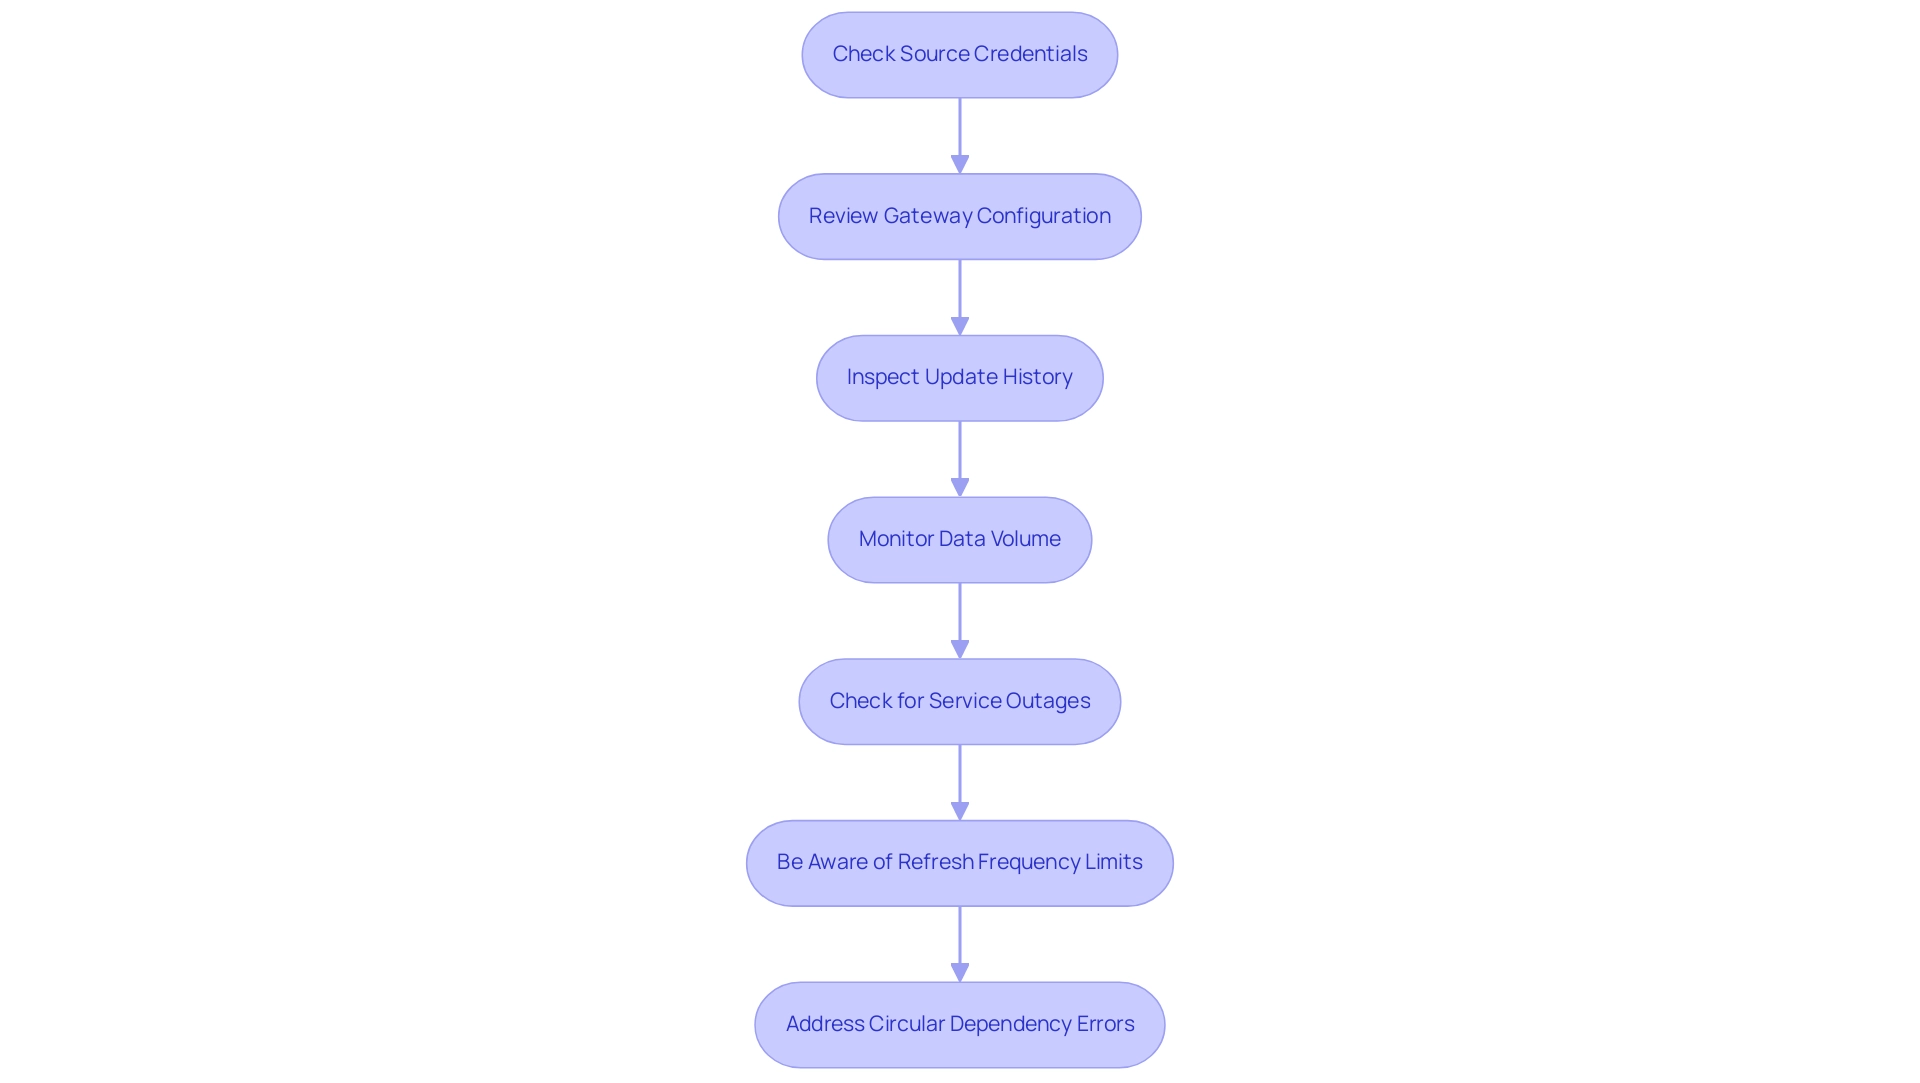
Best Practices for Optimizing Scheduled Refreshes
To optimize your scheduled updates in Power BI and leverage the full power of Business Intelligence, consider these essential best practices:
-
Limit Information Volume: Focus on including only the necessary details in your datasets. Utilizing filters efficiently can significantly decrease the amount of information processed during refreshes, improving report performance. Aggregating information into summary tables can further accelerate report generation.
-
Implement Incremental Update: For extensive datasets, leveraging incremental update allows you to modify only the data that has changed since the last update. This strategy not only speeds up processing time but also minimizes the computational load, making reporting more efficient and manageable.
-
Schedule During Off-Peak Hours: Configure update operations during times of low user activity. This approach minimizes the impact on system performance and enhances user experience, ensuring that reports are readily available when needed most.
-
Monitor Refresh Performance: Regularly review refresh performance metrics. Examining these metrics allows informed modifications to your settings, promoting ongoing enhancements in efficiency and tackling issues such as inconsistencies and report creation delays.
-
Educate Users: Cultivate a culture of information-driven decision-making by educating users on the significance of refreshes. Comprehending how update frequency and timing influence reporting enables users to interact more effectively with the information, ultimately fostering growth and innovation.
-
Ensure Notification of Refresh Failures: It’s crucial to ensure that refresh failure notifications reach the appropriate recipients. Timely notifications allow for quick issue resolution, maintaining seamless data availability and operational efficiency.
By implementing these best practices, you enhance the efficiency of the scheduled data refresh in Power BI and ensure that your data remains timely and relevant. Additionally, managing relationships wisely within BI—aiming for one-to-many relationships instead of many-to-many—can facilitate faster querying and overall performance improvements. As noted by Aniya Zhang, connecting to existing dataflows as linked tables optimizes your report development process for a more streamlined experience.
Furthermore, best practices for managing calculations in BI suggest preferring calculated columns over measures only when necessary, while optimizing DAX queries by using simpler functions and avoiding nested iterators can significantly enhance performance and reduce computational load. Incorporating RPA solutions like EMMA RPA and Power Automate can further streamline operations, addressing task repetition fatigue and enhancing overall efficiency. Businesses that fail to leverage these insights risk facing a competitive disadvantage, making it crucial to adopt robust Business Intelligence practices.
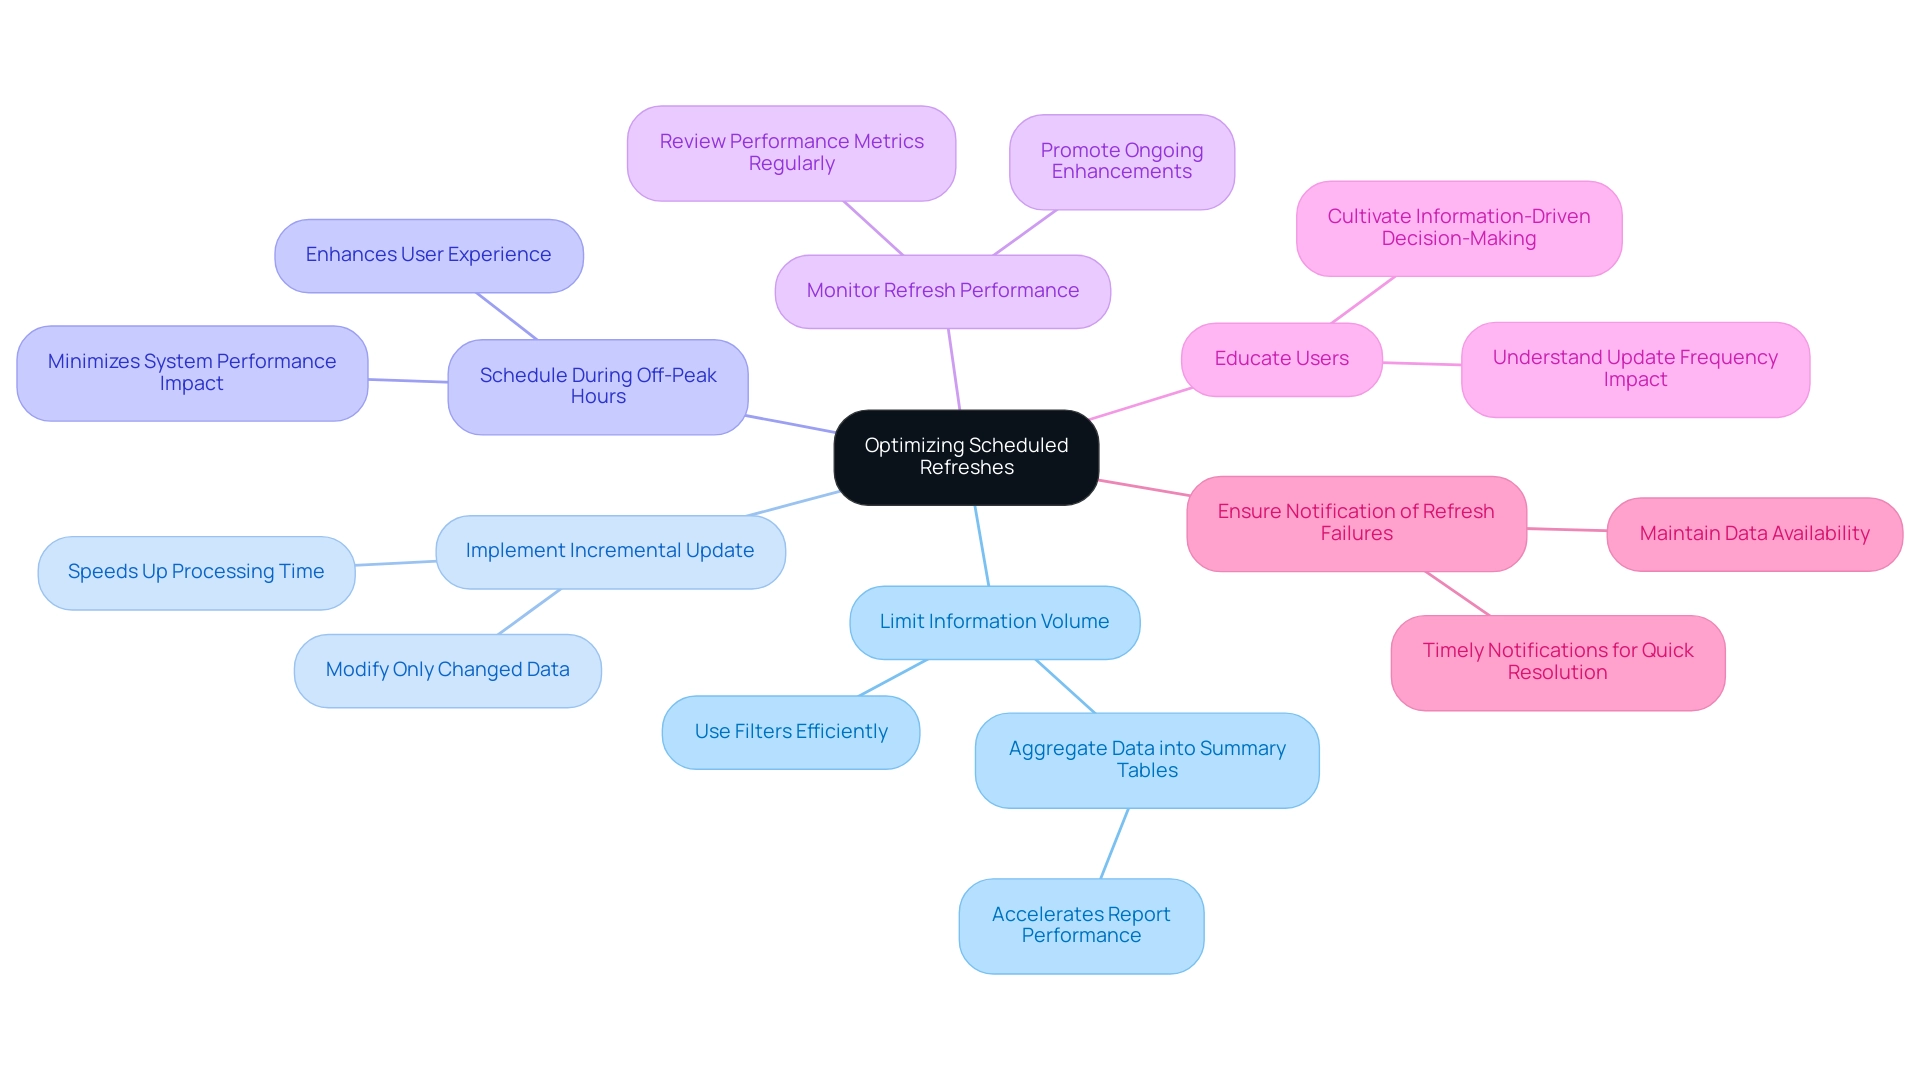
Conclusion
Ensuring timely and accurate data refreshes in Power BI is not just a technical necessity; it is a strategic advantage that empowers organizations to make informed decisions. By understanding the intricacies of data refresh processes, setting up prerequisites, and effectively troubleshooting common issues, businesses can enhance their reporting capabilities and operational efficiency. Automating data updates through tools like Robotic Process Automation (RPA) and adhering to best practices can significantly streamline operations and reduce manual errors.
Implementing scheduled refreshes with a keen focus on governance and performance optimization lays a solid foundation for reliable data management. By limiting data volume, leveraging incremental refreshes, and scheduling operations during off-peak hours, organizations can ensure that their insights are not only timely but also actionable. Regularly monitoring refresh performance and educating users on the importance of data availability fosters a culture of data-driven decision-making that can drive growth and innovation.
In an era where data is a critical asset, embracing a robust data refresh strategy in Power BI is essential for maintaining a competitive edge. Organizations that prioritize these practices will not only enhance their reporting accuracy but also free up valuable resources for more strategic initiatives. By harnessing the full potential of their data, businesses can confidently navigate the complexities of the market, making decisions that foster sustainable growth and success.
Overview
Synapse notebooks are interactive documents within Azure Synapse Analytics that enable users to combine code, visualizations, and narrative text, supporting multiple programming languages like Python, SQL, and Scala. The article highlights their versatility and collaborative features, emphasizing how they enhance data analysis efficiency and facilitate seamless integration with various Azure services, ultimately driving data-driven decision-making and operational effectiveness.
Introduction
In the ever-evolving landscape of data analytics, Azure Synapse Notebooks emerge as a transformative tool for organizations seeking to enhance their data management and operational efficiency. These notebooks empower data scientists and analysts to create interactive documents that seamlessly integrate code, visualizations, and narrative text, allowing for a richer understanding of data insights.
With support for multiple programming languages and robust integration with the Azure ecosystem, Synapse Notebooks facilitate the automation of complex workflows and the application of advanced analytical techniques. As organizations navigate the complexities of modern data challenges, the ability to harness these features can unlock significant opportunities for growth and innovation.
This article delves into the functionalities, practical applications, and strategic advantages of Synapse Notebooks, providing a roadmap for businesses looking to leverage data-driven insights in their decision-making processes.
Understanding Synapse Notebooks: An Overview
Synapse notebooks play a crucial role within Azure Synapse Analytics for scientists and analysts, allowing the creation and sharing of interactive documents that combine code, visualizations, and narrative text. This innovative feature supports a range of programming languages, including Python, SQL, and Scala, ensuring versatility for numerous analysis tasks. Furthermore, utilizing Power BI services enables organizations to improve their reporting capabilities and obtain actionable insights effectively.
The 3-Day Power BI Sprint rapidly produces professionally designed reports, while the General Management App facilitates comprehensive management and smart reviews, driving operational efficiency.
The incorporation of collaborative notebooks with the wider cloud ecosystem enhances their capabilities, enabling smooth information management and analysis across various cloud services. A pivotal case study, titled Activity Log Operations, illustrates how recorded operations in the activity log, including Database Name, State, and Duration, enhance visibility and accountability in resource management. Furthermore, organizations can streamline their manual workflows through Robotic Process Automation (RPA), reducing errors and freeing up teams for more strategic tasks.
As the rapidly evolving AI landscape can be daunting, our tailored AI solutions cut through the noise, providing targeted technologies that align with specific business goals and challenges. This encompasses the use of Small Language Models and involvement in GenAI Workshops, which improve analysis capabilities and operational efficiency. The combination of AI, Business Intelligence, and RPA not only drives data-driven insights but also enhances operational efficiency, positioning organizations for growth.
As Subhendu Nayak notes, “Among these advancements, the introduction of GPU-powered instances by AWS has significantly transformed how machine learning (ML), artificial intelligence (AI), and high-performance computing (HPC) workloads are managed in the cloud.” Looking ahead to 2024, continued advancements in the platform, including cost management tools that assist in tracking and optimizing spending, further underline the impact of synapse notebooks on enhancing data analysis efficiency. The visual metaphor of a human figure contemplating a question mark alongside a robot holding a light bulb symbolizes the dialogue between human curiosity and artificial intelligence, emphasizing the collaborative potential of these technologies in problem-solving and innovation.
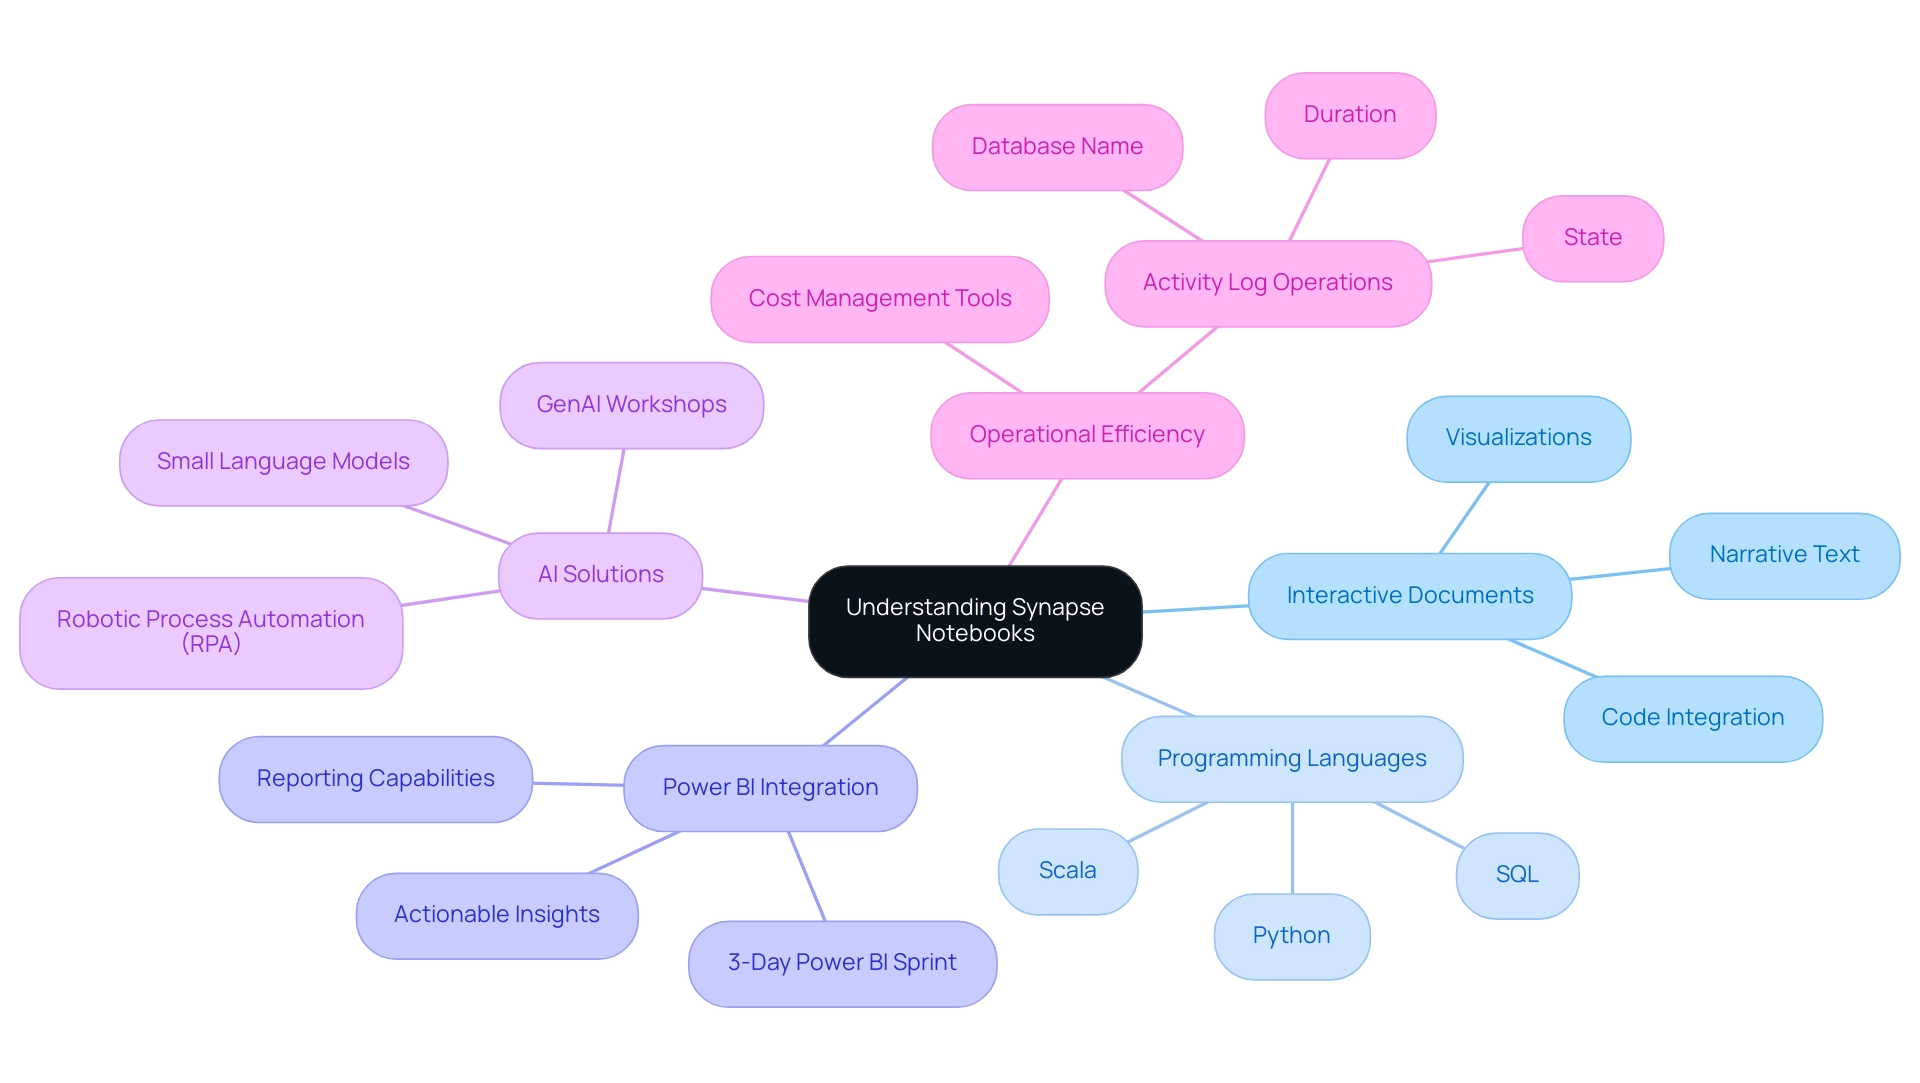
Practical Guide to Creating and Managing Synapse Notebooks
Creating a synapse notebook is a streamlined process designed for efficiency. To get started, simply navigate to Azure Studio, select the ‘synapse notebooks’ tab, and click ‘New Notebook’. Here, you can choose your preferred programming language, allowing you to leverage existing skills and libraries effectively, especially with the native support for .NET for Spark, which empowers .NET developers to utilize their existing knowledge. Once your synapse notebooks are set up, managing them becomes equally intuitive.
You can save your work in synapse notebooks within a designated workspace, facilitating easy access for collaboration with colleagues. Utilizing version control features in synapse notebooks is essential; it enables you to track changes and revert to previous versions when necessary, ensuring that your team remains aligned and informed throughout the development process. Furthermore, the platform supports rich text formatting.
This feature empowers users to document their thought processes and insights in synapse notebooks alongside the code, significantly enhancing collaboration and knowledge sharing within teams. As noted by James Broome, the key to testing synapse notebooks is to treat each cell as a logical step in the end-to-end process, wrapping the code in each cell in a function so that it can be tested. This approach not only fosters a deeper understanding of the data management workflow but also encourages the use of synapse notebooks, which are vital for effective teamwork.
Additionally, metrics concerning Apache Spark pools, like allocated vCores and memory, can be monitored through specific REST APIs, offering real-world insights into resource allocation and performance within the analytics platform. Lastly, supported resource logs for Microsoft.Synapse/workspaces include logs for built-in SQL pool requests and SQL security audit events, thereby enhancing your ability to effectively monitor and manage synapse notebooks.
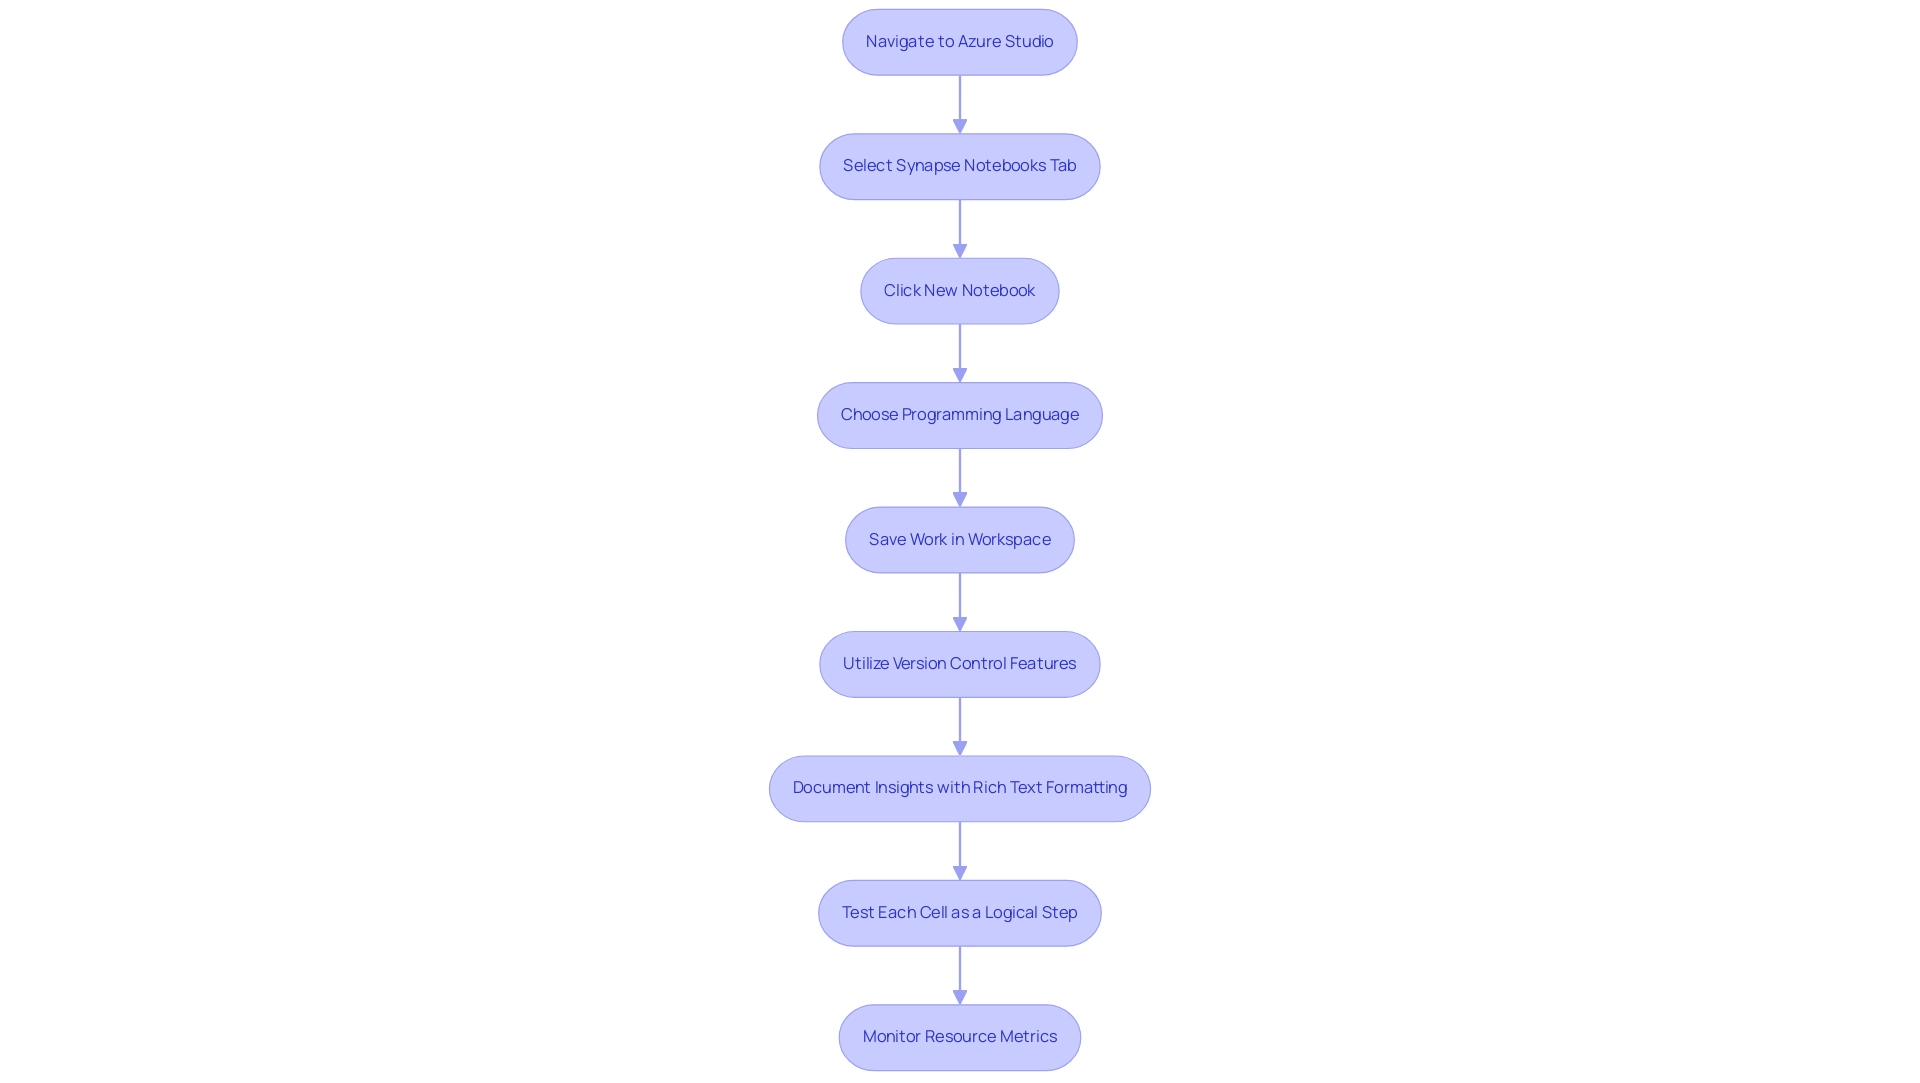
Integrating Synapse Notebooks with Azure Services
The platform provides a robust integration with various cloud services, including Data Lake Storage, Machine Learning, and Data Factory, greatly improving operational efficiency. This synergy enables users to efficiently extract information from storage solutions, apply advanced machine learning models, and automate complex workflows, thereby leveraging Robotic Process Automation (RPA) to streamline manual tasks and reduce operational expenses. Notably, the ingestion process might take about 1 minute to complete, showcasing the efficiency of these tools.
For example, users can employ synapse notebooks to write code that processes information stored within a Data Lake and visualize the results through built-in tools, thereby enhancing productivity. Adi Polak emphasizes the collaborative effort involved, stating, ‘Thanks to Manoj Raheja for their review and feedback!’ Furthermore, incorporating version control via Azure DevOps facilitates collaborative notebook development, ensuring code integrity and fostering teamwork.
To optimize performance and enhance decision-making, it is advisable to consult best practices for serverless SQL pools, further improving the effectiveness of queries. Such integrations not only streamline operations but also position synapse notebooks as a critical asset in driving data-informed decision-making. The recent case study on information exploration with Apache Spark reinforces this, revealing how users can analyze storm event information to visualize critical insights such as fatalities per event type and average property damage.
By harnessing these capabilities, organizations can significantly enhance their analysis proficiency and operational efficiency in today’s rapidly evolving AI landscape. Additionally, implementing RPA can lead to substantial cost savings by minimizing manual errors and increasing process speed, which is crucial for maintaining a competitive edge.
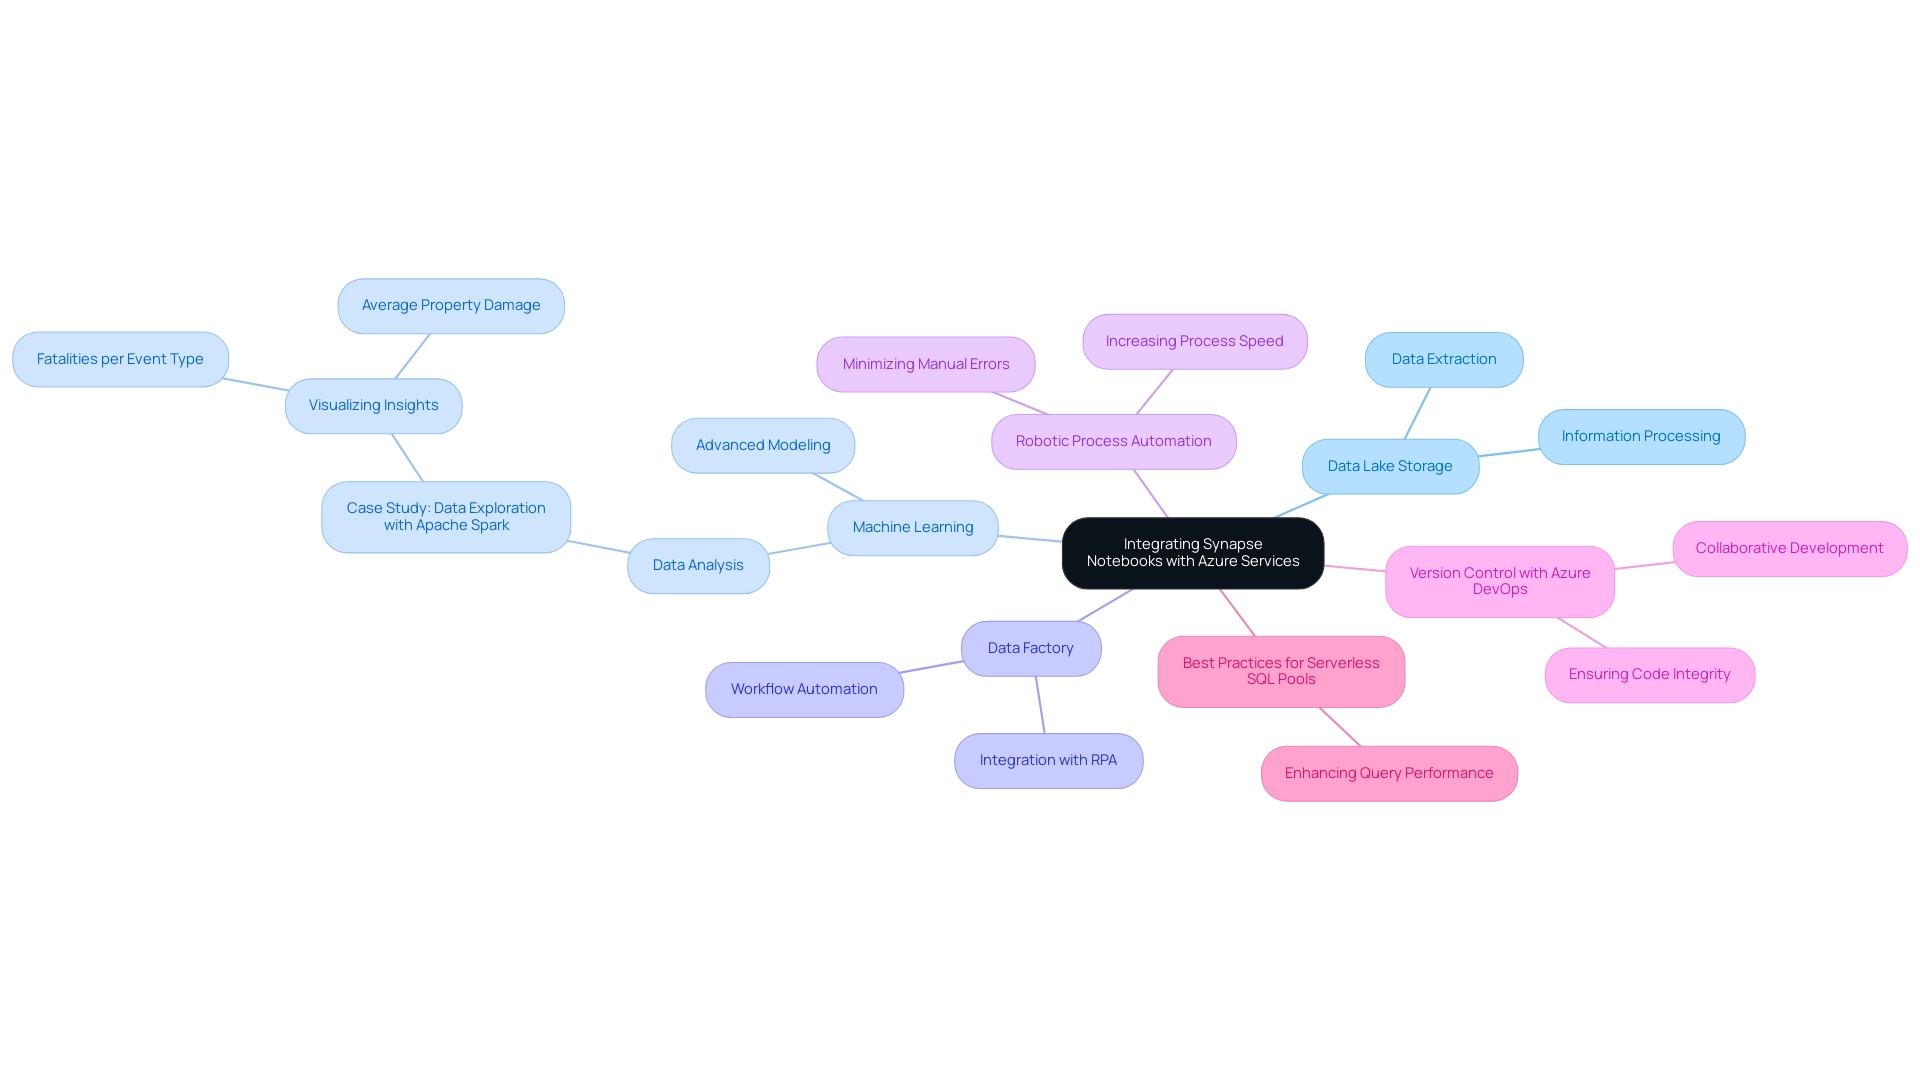
Evaluating the Pros and Cons of Synapse Notebooks
Synapse notebooks offer a myriad of benefits, particularly their user-friendly interface and robust support for multiple programming languages, seamlessly aligning with the Azure ecosystem. Notably, the native support for .NET for Spark enables .NET developers to leverage their existing skills and libraries, enhancing the overall user experience. This versatility encourages collaboration among teams, promoting a shared understanding of projects through interactive documentation. As Jonathan Bogerd notes,
this platform can therefore be utilized as a serving layer, highlighting its usefulness in integrating information workflows.
In tandem with Robotic Process Automation (RPA), the synapse notebooks can significantly streamline manual workflows, boosting efficiency and allowing your team to concentrate on more strategic tasks. However, it is crucial to recognize the limitations inherent in its use. For instance, performance may be compromised when handling large datasets, and users unfamiliar with coding may encounter a steep learning curve.
Additionally, while collaboration is a notable strength, it can introduce version control challenges that require careful management. Organizations often face challenges such as resistance to change, inadequate training, and integration issues that can hinder the successful implementation of new technologies. Tailored AI solutions can specifically address these challenges by providing customized training and integration support, ensuring a smoother transition.
As highlighted in case studies, despite certain disadvantages, this analytics platform, when paired with tailored AI solutions, is positioned as a valuable tool for data scientists utilizing synapse notebooks for model creation and insights, ultimately central to data-driven environments. Currently, only SQL pools in Azure are generally available, while other features remain in preview, which adds context to the limitations of the platform. By understanding these pros and cons, along with the significance of Business Intelligence, organizations can effectively utilize RPA and analytical tools, maximizing their benefits while proactively addressing potential drawbacks.
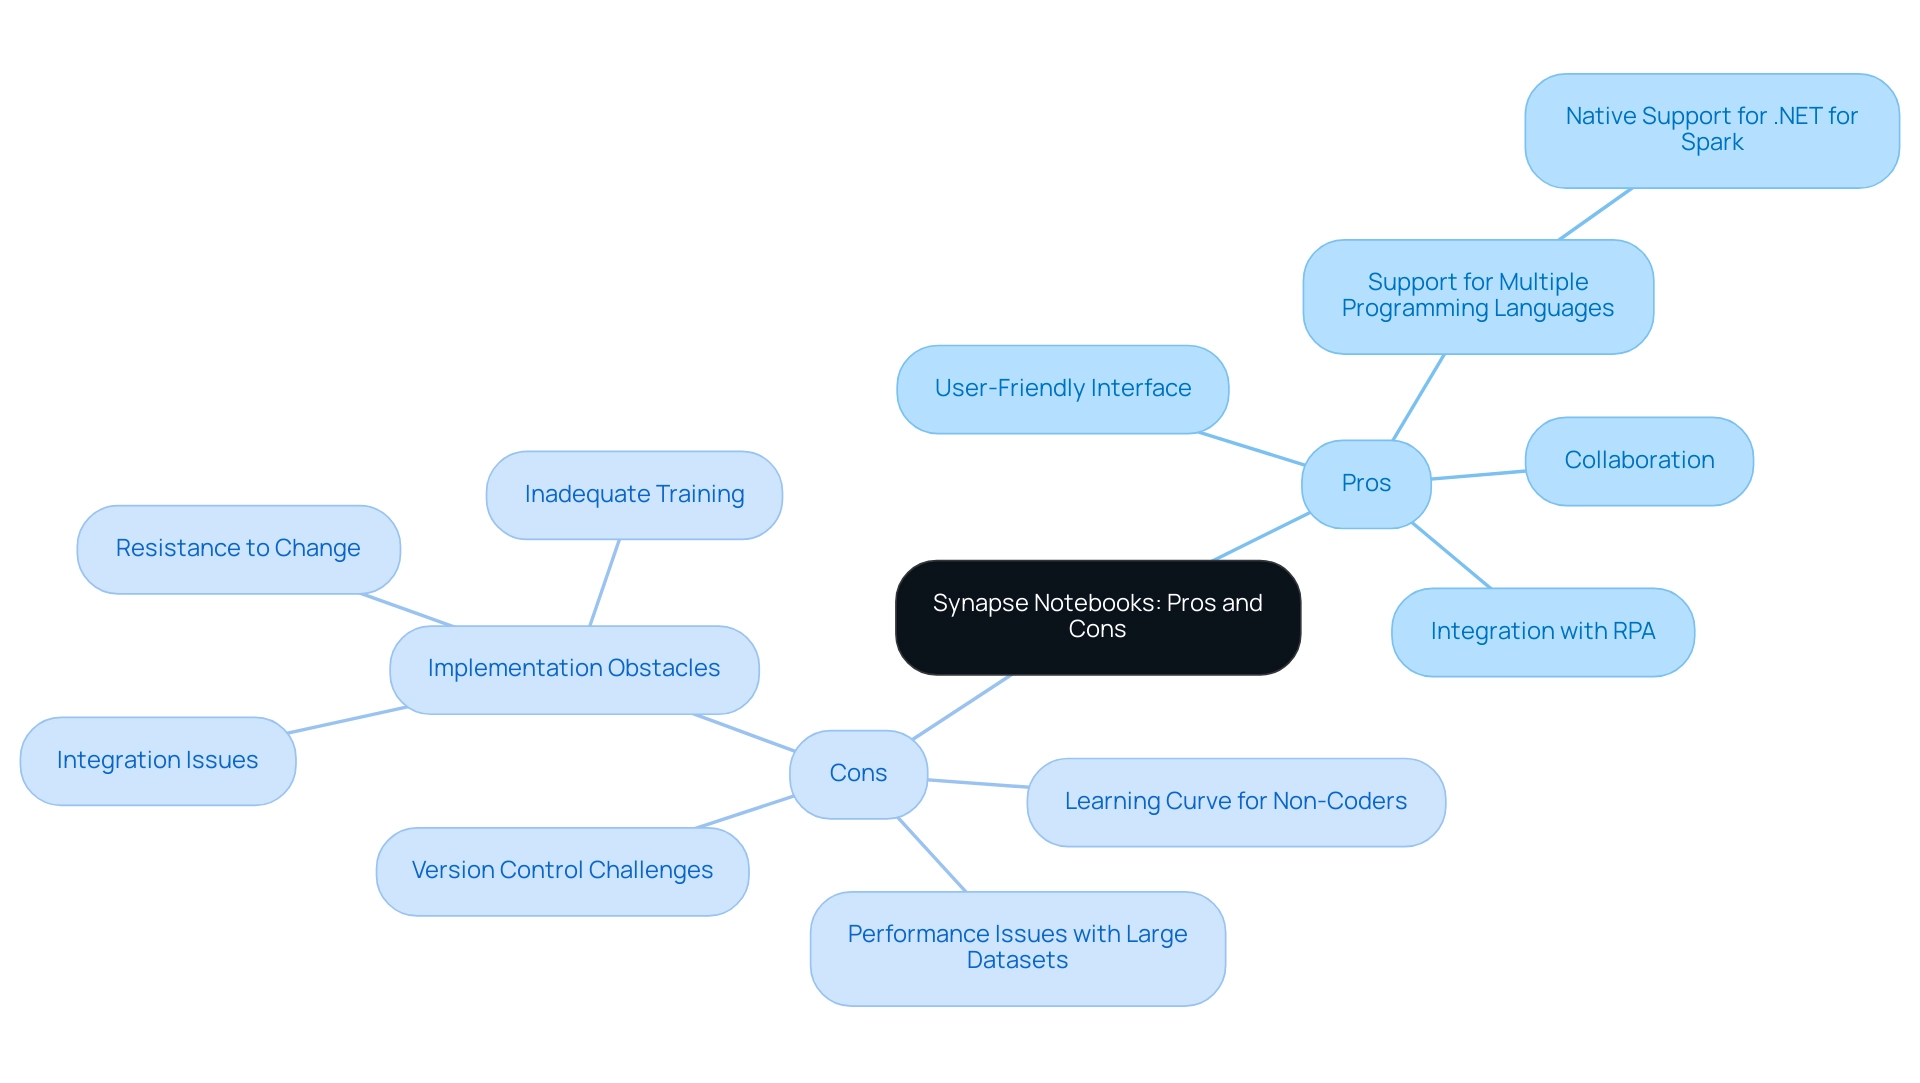
Advanced Features and Use Cases of Synapse Notebooks
The platform provides a range of advanced functionalities intended to enhance information management and analysis, especially via strong visualization capabilities. Users can craft compelling narratives by integrating libraries such as Matplotlib and Seaborn for Python, enabling the creation of high-quality graphs and charts that effectively convey insights. Ensuring the accuracy of code is paramount; thus, implementing unit tests within the platform is essential for validating functionality before deployment.
Significantly, manual statistics are never labeled outdated, whereas automatic statistics are regenerated when the extent of changes surpasses a particular limit, highlighting the significance of information precision and oversight in related platforms. Additionally, leveraging Robotic Process Automation (RPA) can significantly enhance operational efficiency by reducing errors and freeing up your team to focus on more strategic, value-adding tasks in this rapidly evolving AI landscape. RPA optimizes workflows within collaborative environments by automating repetitive tasks, enabling users to allocate more time to analysis and decision-making.
The versatility of these synapse notebooks is evident in their numerous use cases, ranging from exploratory analysis and machine learning model development to collaborative reporting and dashboard creation. As Subhendu Nayak observes, ‘The cloud computing environment has been advancing swiftly, with improvements in hardware that enable enterprises to scale more effectively and manage increasingly intricate workloads,’ which is especially pertinent to the functionalities of the platform. Moreover, creating single-column statistics aids in optimizing query performance by supplying the optimizer with relevant characteristics.
By harnessing the power of synapse notebooks alongside RPA, organizations can streamline their data workflows, enhance reporting capabilities, and cultivate a culture of data-driven decision-making, ultimately driving business growth.
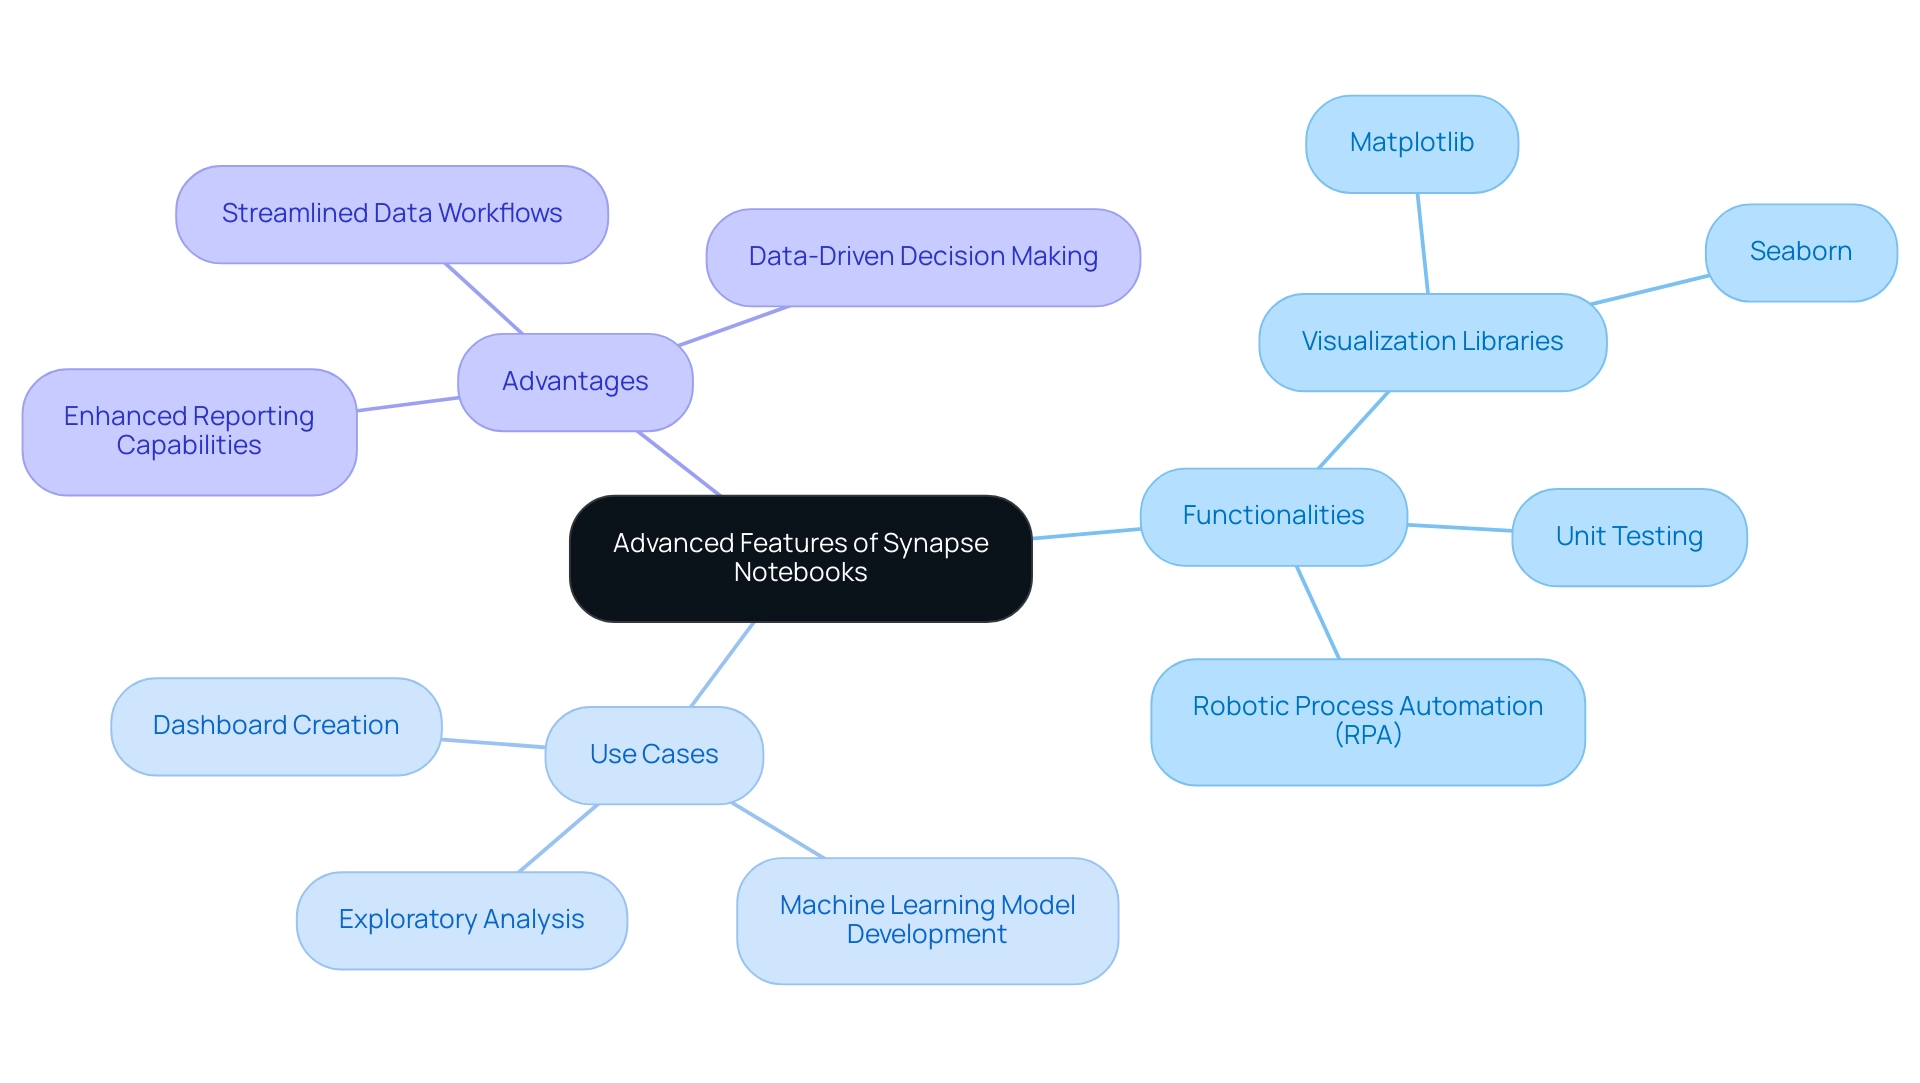
Conclusion
The exploration of Azure Synapse Notebooks reveals their transformative potential for enhancing data management and operational efficiency. As a powerful tool within the Azure ecosystem, these notebooks empower data professionals to create interactive documents that combine code, visualizations, and narrative text, fostering a deeper understanding of data insights. The compatibility with multiple programming languages and integration with services like Power BI and Azure Machine Learning significantly augment their capabilities, allowing organizations to automate workflows and apply advanced analytical techniques.
By streamlining the process of creating and managing notebooks, businesses can optimize collaboration and knowledge sharing among teams. The intuitive design, coupled with version control features, ensures that all team members remain aligned and informed, enhancing productivity. The ability to integrate RPA further amplifies the efficiency of operations, enabling organizations to reduce manual errors and focus on strategic initiatives.
While there are challenges associated with using Synapse Notebooks, such as performance limitations with large datasets and the need for user training, the benefits far outweigh these hurdles. The key lies in understanding both the strengths and potential drawbacks of the platform, allowing businesses to implement tailored solutions that promote a smoother transition and maximize the advantages of data-driven decision-making.
In an era where data is paramount, leveraging the capabilities of Synapse Notebooks can position organizations for significant growth and innovation. By embracing these advanced features, businesses can cultivate a culture of efficiency and insight, ultimately driving operational success and staying ahead in a competitive landscape. The future is bright for those who harness the power of Azure Synapse Notebooks in their data strategies.
